UNITED STATES
SECURITIES AND EXCHANGE COMMISSION
WASHINGTON, D.C. 20549
FORM N-CSR
CERTIFIED SHAREHOLDER REPORT OF REGISTERED
MANAGEMENT INVESTMENT COMPANIES
Investment Company Act file number 811-22208
Valued Advisers Trust
(Exact name of registrant as specified in charter)
| | |
| Ultimus Asset Services, LLC 225 Pictoria Drive, Suite 450 | | Cincinnati, OH 45246 |
| (Address of principal executive offices) | | (Zip code) |
Capitol Services, Inc.
615 S. Dupont Hwy.
Dover, DE 19901
(Name and address of agent for service)
With a copy to:
John H. Lively, Esq.
The Law Offices of John H. Lively & Associates, Inc.
A member firm of The 1940 Act Law GroupTM
11300 Tomahawk Creek Parkway,
Suite 310
Leawood, KS 66221
Registrant’s telephone number, including area code: 513-587-3400
Date of fiscal year end: 5/31
Date of reporting period: 5/31/16
Item 1. Reports to Stockholders.
ANNUAL REPORT
May 31, 2016
BFS Equity Fund

185 Asylum Street ● City Place II ● Hartford, CT 06103 ● (855) 575-2430
Letter to Shareholders
Dear Fellow Shareholders,
This annual report covers the period June 1, 2015 through May 31, 2016 – the BFS Equity Fund’s second full fiscal year.
The BFS Equity Fund (the “Fund”) was launched on November 8, 2013, with initial funds from investors of $1.1 million. On June 1, 2015, the Fund had net assets of $20.2 million. During the course of the last fiscal year, the net assets of the Fund increased 18% to $23.9 million as of May 31, 2016. This growth was driven totally by inflows from investors into the Fund, the Fund’s investment return having been slightly negative over the past fiscal year. As of May 31, 2016, there were approximately 540 investors in the Fund.
The BFS Equity Fund achieved a total return of -0.91% for the fiscal year commencing June 1, 2015 and ending May 31, 2016. This was less than the 1.72% total return of the S&P 500® Index and the 1.39% total return of the Dow Jones Industrial Average.
This report includes a commentary from the Lead Portfolio Manager, Tim Foster, and Co-Portfolio Managers, Tom Sargent and Keith LaRose. You will also find a listing of the portfolio holdings as of May 31, 2016, as well as financial statements and detailed information about the performance and positioning of the BFS Equity Fund.
Numerous global economic and geo-political challenges continued to face U.S. stock markets during the period under review. A slowdown in the Chinese economy and devaluations in the yuan, steeply declining energy and commodity prices, and a slowdown in the manufacturing and industrial sectors of the U.S. economy have contributed to investor anxiety. Worrisome tensions continue in many parts of the globe. Continued instability in the middle east, the expanding terrorist activities of ISIS, and the re-emergence of Al-Qaeda, and China’s aggressive actions in the South China Sea are additional causes of investor anxiety. Also contributing to market uncertainty is the yet to be determined impact of the U.K. vote to exit the European Union and the results of the upcoming U.S. presidential election, both of which will play out after the period covered by this report. Despite the aforementioned risks, the economy continues its modest growth. The Fed remains accommodative. Inflation and interest rates remain low and there is abundant liquidity we expect to find its way into the U.S. stock market.
1
In closing, it is important to reiterate our belief that our investment strategy of investing in quality growth stocks purchased with a risk-mitigating approach and positioned to provide a margin of safety in the case of economic or market weakness is effective over the longer term. We believe the Fund’s ownership of shares in quality companies with strong brands, good balance sheets, professional management, and robust cash flow should be able to withstand market corrections, even bear markets, and perform well over the longer term.
The Portfolio Managers of the BFS Equity Fund and I are shareholders together with you. We thank you for the trust that you have placed in us to manage your assets.
Sincerely,
Stephen L. Willcox
President and CEO
Bradley, Foster & Sargent, Inc.
2
Portfolio Managers’ Letter
TO OUR SHAREHOLDERS
May 31, 2016 marked the end of the second full fiscal year for the BFS Equity Fund (the “Fund”). During the year, the Fund experienced periods of both positive and negative returns as the market gained as much as +5.0% and on two occasions lost approximately -10.0%. For the twelve month period ended May 31, 2016 the Fund returned -0.91%. During the year, we narrowed down the number of names in the portfolio to 39 to concentrate on our highest confidence ideas. Some of these attractive growth stocks that we like for the long term, like Apple (-21.8%), took a breather over this period and contributed negatively to our total return. Our strategic decision to avoid the highly regulated, slow growth and richly valued Utilities sector backfired as a continued decline in interest rates drove the Utilities sector to new highs that led market sector performance. The S&P 500® Index (“S&P 500”), over the same twelve month period, returned +1.72% while the Dow Jones Industrial Average returned +1.39%. Relative to the two benchmarks, the Fund trailed the S&P 500 by 2.63% and the Dow Jones Industrial Average by 2.30%. These relatively flat market returns reflect the stalling out of corporate earnings over the twelve month period.
MARKET COMMENTARY
The strong U.S. Dollar and weak commodity prices were the primary culprits for the lack of earnings growth over the past year. Earnings drive stock prices and without growth in earnings, stock prices are likely to remain stagnant as well. However, the rising dollar/falling commodity trend reversed sharply in February of this year. The abatement of currency headwinds enabled the market to reverse the January/February 10.0% decline, thereby bringing the market averages back to near all-time highs and ultimately to breakeven for the first five months of 2016 and for the trailing twelve months of the Fund’s fiscal year as well. Where do we go from here? If interest rates remain close to today’s low levels over the next year, we believe there is little fundamental reason for the P/E of the market to vary much from the current multiple of 17 times. This P/E is very close to the 30 year mean multiple as well. With the doubling of oil prices since the February bottom and the reversal of the dollar’s strength, we expect positive earnings comparisons within the Energy sector and improved results from U.S. multinational companies. This could lead to approximately 5.0% earnings growth over the next fiscal year and hopefully stock prices that may mirror that growth as well. Election years can bring many surprises and the 2016 election appears as polarized as any in recent history. Election zeal may bring heightened volatility to the market, but we believe the
3
fundamental case for positive equity returns remains valid, including: positive real GDP growth, an accommodative Federal Reserve, low inflation and low interest rates.
INVESTMENT STRATEGY
In structuring the composition of the Fund, we strive to be proactive, building our exposure to those sectors and companies we view as potential beneficiaries of change. It can be the halo effect of new product innovation, the enhancement of an economic moat or improved pricing power. On the flip side, the absence of malice can be equally beneficial, whether it be the release from regulatory constraints, diminished competition, diminishing currency headwinds or a shifting of the yield curve. These investment themes often take time to play out; thus, when evaluating the attractiveness of a particular holding, we often have a three to five-year time horizon. Our stock selection process is to choose among the many high-quality businesses we have identified through our bottom-up research process and to use a longer investment time horizon as a competitive advantage in our favor. Two opportunities emerge from the time-is-in-our-favor camp. The first opportunity presents itself as we attempt to identify changes the market has not yet priced in. The second opportunity presents itself when investors overreact to a short term negative event. Top down macro-economic views do play a role with respect to both our sector and security selection, but our purchase and sale decisions are driven to a greater extent by our analysis of the absolute and relative attractiveness of each company. For instance, best-of-breed or industry leaders are highly sought after candidates for inclusion in the Fund, ideally if valuations provide a margin of safety in terms of a discount to intrinsic value or, at a minimum, a discount relative to comparable companies. Investment risks and opportunities are analyzed company-by-company and, for each holding, we seek to judge whether all the key factors are incorporated into the company’s stock price. As such, we endeavor to deliver attractive risk-adjusted results over a full market cycle by utilizing a disciplined approach targeting results which should compare favorably to benchmarks, as well as peer managers. We eschew the high risk purchases reaching for that elusive top decile performance that can invite bottom decile rankings as well.
INVESTMENT COMMENTARY
For the past seven years, the trend has been your friend in the equity markets, but over the past several quarters the duration and the magnitude of the stock market recovery extended into a loftier zone and seemed to run out of oxygen. While the net decline in the benchmark indices has been modest, in the interim the market experienced two nearly 10.0% corrections. Among the many market concerns, the slowdown in global
4
growth was first and foremost. In the U.S., Real GDP growth declined from 3.9% in the second quarter of 2015 to 1.4% in the fourth quarter of 2015 and a lethargic 0.8% in the first quarter of 2016. In China, growth slowed to about 6.0% as of the first quarter of 2016 (down from almost twice that a few years ago), prompting China’s policy makers to devalue the Yuan versus the dollar. Through mid-February, the dollar strengthened versus almost every global currency with the biggest impact stemming from the Yuan, the Euro and the Yen. For commodities priced in dollars, like oil, this meant a sharp drop in price and the slashing of capital spending budgets. For U.S. manufacturers of everything from jet engines to tractors and bulldozers, the dollar’s strength means a competitive disadvantage for global pricing. For U.S. companies doing business across the globe, translating foreign profits back to stronger U.S. dollars means fewer dollars – hence lower profits. Estimates for corporate profits, which at the start of 2015 were optimistic at high single digit or low double digit comparisons, collapsed to -3.5% for the fourth quarter of 2015 and remained in negative territory through the first quarter of 2016. A peak in merger and acquisition activity was an important component of individual stock returns.
Technology
The Technology sector was our heaviest weighted sector at 21.2% and slightly higher than the S&P 500 Technology sector at 20.4%. Our Tech selections returned +5.1% over the past year, better than the S&P 500 Technology sector return of +3.1%. Our top performing stocks were Alphabet (Google) (+37.3%), Adobe (+25.8%), and Microsoft (+16.3%). Our biggest disappointment was Apple (-21.8%). Apple’s heady growth stalled out between generations of iPhones, but we believe the breadth of Apple’s ecosystem will continue to power attractive returns going forward.
Healthcare
At a 17.0% weighting, Healthcare was our second largest sector exposure. Uncertainties about the future of pharmaceutical pricing pressured the sector to negative returns for the year. The Fund returned -2.5% versus the S&P 500 Healthcare sector return of -3.3%. Novartis was our worst performer (-19.7%). Biotech was particularly hard hit with losses for Celgene of -14.8% and Gilead Sciences of -13.0%. With less drug exposure, Thermo Fisher Scientific (+17.6%) and Johnson & Johnson (+15.9%) were our best performers.
Industrials
Compared to the S&P 500 Industrial sector weighting of 10.0%, the Industrial sector was our largest relative sector bet at 14.6%. Our return lagged the S&P 500 Industrial sector at +0.4% versus +3.3%. Nielsen Holdings was our best performing industrial
5
(+22.4%), but the data collection and mining company could hardly be considered a traditional manufacturer. Danaher (+14.7%) and GE (+14.5%) also performed well. United Technologies was a disappointment (-11.8%), but will remain a long-term holding with a major new growth platform – the geared turbofan aircraft engine. Union Pacific and Transdigm both lost ground and were sold.
Consumer Discretionary
The Consumer Discretionary sector was another sizeable overweight in the Fund with a position of 16.0% versus the S&P 500 Consumer Discretionary sector at 12.6%. We believe the overweighting is appropriate due to superior growth prospects for many companies in the sector, as well as improving consumer balance sheets. The Fund’s return of +3.3% lagged the S&P 500 Consumer Discretionary sector return of +5.7%. Unfortunately, a company and management team we like, Polaris Industries, suffered a perfect storm of currency headwinds, the warmest December on record and some manufacturing growing pains in their new line of Indian motorcycles – and the stock took a real beating (-36.9%). It was our worst performing stock in the portfolio. Similarly, another company whose management team we like, Under Armour, also pulled back -12.4%. After a fairly sharp correction in early 2016, we initiated a new position in Amazon which jumped +23.1%. The continued strength in the housing sector pushed Home Depot’s return up +21.6%. Jarden returned +11.1%, helped by its merger with Newell Rubbermaid to form Newell Brands.
Financials
The Fund’s holdings in the Financials sector totaled 11.2% of the portfolio; well under the S&P 500 Financials sector weight of 16.3%. The underweight was to our advantage as our Financials sector return was -5.9% versus -1.3% for the S&P 500 Financials sector. The flattening yield curve left little optimism for improvement in net interest margins and we chose to reduce our bank exposure. Our timing to reduce our bank weighting was ill timed, having been executed during the mid-February market sell-off. We initiated a position in Chubb, the former ACE Insurance, which purchased Chubb and changed its corporate moniker. Chubb has made steady progress since our purchase and returned +10.1%. We repurchased American Express after the shares fell in response to the loss of the Costco branded card partnership and the stock regained +8.1%. Our strategy to reduce bank exposure in the midst of the market correction in February led to losses of -29.4% in East West Bancorp and -11.9% in M&T Bank.
6
Consumer Staples
At 9.4% the Fund’s Consumer Staples sector weighting was very close to the S&P 500 Consumer Staples sector weighting at 10.1%. The Fund’s Consumer Staples sector return was +12.3%, better than the S&P 500 Consumer Staples sector return at +10.8%. We like the dividend yields and defensive characteristics of this sector; however, with current P/E multiples at a significant premium to the S&P multiple, we believe the defensive characteristics will be limited. We are hanging on to our Constellation Brands (+31.2%), but consider the stock richly priced. We sold Church & Dwight (+17.3%), whose modest but consistent growth is now just too richly priced. Mondelez (+11.8%) and Costco (+12.6%) were also positive contributors. CVS Health (-4.4%) was our weakest link among the Consumer Staples sector stocks, but we believe the pharmacy benefit management aspect brings this leading pharmacy retailer significant competitive advantages to others.
Energy
The Energy sector weighting of the Fund and the S&P 500 Energy sector weighting were similar at 7.5% and 7.1%, respectively. With oil prices in free fall for most of the year there were few places to hide. EOG Resources lost -27.9% and Core Laboratories lost -19.4%. Owning the industry leader, Exxon (+10.3%), helped cushion the -10.1% blow the S&P 500 Energy sector experienced. The Fund’s Energy sector return of -3.4% beat the S&P 500 Energy sector return by 6.7 percentage points. Pipeline company, Spectra Energy, was our best performer (+35.8%), primarily because the timing of our purchase just about caught the bottom in the steep energy correction.
Materials, Telecommunication Services and Utilities
On May 31, 2016, the Fund had no exposure to these three sectors which represent a combined 8.8% weighting in the S&P 500. The primary rationale for this is the general lack of good growth prospects in each industry. The lack of exposure to the Utilities and Telecom Services sectors was particularly painful on a relative basis as the S&P 500 Utilities sector led all S&P 500 sector returns with a +14.6% gain and the S&P 500 Telecommunications Services sector returned +11.8%. These are interest rate sensitive sectors. While the modest decline in interest rates over the past year helped these sectors, our view on interest rates is that rates are much closer to a bottom than a top making the bet on these high yield stocks very risky.
CLOSING COMMENTS
When the market sells at a reasonable multiple relative to history and to prevailing interest rates, as the market currently does at about 16 times forward twelve month expected earnings, then further price appreciation is most likely to be driven by
7
earnings. The flattening of earnings expectations seems fairly reflected by the flattening out in the market’s advance. With little pricing power to be had in this near zero inflation environment, revenue growth has been nearly nonexistent. Growth comes at the price of higher multiples, but we believe some higher growth names will be essential for good performance. The Fund recently initiated positions in Facebook, Amazon and Under Armour, all of which are growing revenues at better than a 20.0% clip. We paid a higher P/E multiple than we would like, but we believe we will need this revenue growth to grow faster than the market. For the bulk of the market participants who can’t drive revenue growth much above low single digits, then earnings growth will have to come from margins and/or financial engineering. But pretax margins are already at record highs of about 10.0%—what will drive margins higher from here? The substitution of capital for labor has historically been a primary driver of productivity, but as labor markets tighten (unemployment has declined from 10.0% at the start of this cycle to now 4.7%) the cost of labor will inevitably go up thereby putting downward pressure on margins. Witness the public and private employees who have recently benefited from higher mandated minimum wages. Lean manufacturing practices have come a long way and further improvements can always be found, but the impact of tighter labor will likely pressure margins lower. In addition to high revenue growth opportunities, companies focused on lean manufacturing are an important theme in the Fund’s stock selection. Companies like United Technologies, Danaher and Polaris are prime examples.
We, at Bradley, Foster & Sargent, Inc., look forward to serving you through our management of the BFS Equity Fund. Thank you for placing your capital under our care.
| | | | |
| Timothy Foster | | Keith LaRose | | Thomas Sargent |
| Lead Portfolio Manager | | Co-Portfolio Manager | | Co-Portfolio Manager |
8
ANNUAL PERFORMANCE REVIEW
(UNAUDITED)
The Fund performed behind the S&P 500 and the Dow Jones Industrial Average for the twelve month period ended May 31, 2016, returning -0.9% versus +1.7% for the S&P 500 and +1.4% for the Dow Jones Industrial Average.
Key Detractors from Relative Results
| | • | | The lack of exposure to the positively performing Utilities (+14.6%) and Telecommunication Services (+11.8%) sectors of the S&P 500 was a missed opportunity and a key detractor for the Fund over the past twelve months. Strategically, however, we view these sectors as likely lagging performers over the long-term. |
| | • | | Financials proved vexing for our stock selections. While we were underweight the S&P 500 Financials sector at 11.2% versus 16.3%, our returns trailed at -5.9% versus -1.3% for the index. Our decision to reduce exposure to banking by selling East West (-29.4%) and M&T (-11.9%) occurred very near the interim bottom for the sector, detracting from our relative performance. |
Key Contributors to Relative Results
| | • | | The Fund made very timely purchases of high growth names, each contributing positively to portfolio returns: Amazon (+23.1%), Alphabet (Google) (+37.3%) and Facebook (+5.9%) as all three firms continue to dominate and monetize their respective Internet-based networks. Spectra Energy (+35.8%) was our single largest contributor. |
| | • | | The Fund’s long term preference for companies with high free cash flow, growing dividends and sustainable brand values, like the Fund’s holdings in the Consumer Staples sector, offered a rewarding contribution to performance over the past twelve months; however, going forward, we are viewing last year’s winners more cautiously due to valuation concerns. |
FUND INFORMATION
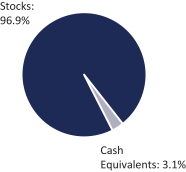
ASSET ALLOCATION
(as a percentage of total investments)
| | | | |
TEN LARGEST HOLDINGS (%) | | FUND | |
Apple, Inc. | | | 3.3 | |
Chubb Ltd. | | | 3.2 | |
Alphabet, Inc. — Class A | | | 3.1 | |
Danaher Corp. | | | 3.1 | |
American Express Co. | | | 3.0 | |
Amazon.com, Inc. | | | 3.0 | |
Facebook, Inc. | | | 3.0 | |
Exxon Mobil Corp. | | | 3.0 | |
Walt Disney Co./The | | | 2.9 | |
Thermo Fisher Scientific, Inc. | | | 2.9 | |
| | | | | | | | |
SECTOR DIVERSIFICATION (%) | | FUND | | | S&P 500 | |
Information Technology | | | 21.2 | | | | 20.4 | |
Healthcare | | | 17.0 | | | | 14.7 | |
Consumer Discretionary | | | 16.0 | | | | 12.6 | |
Industrial | | | 14.6 | | | | 10.0 | |
Financials | | | 11.2 | | | | 16.3 | |
Consumer Staples | | | 9.4 | | | | 10.1 | |
Energy | | | 7.5 | | | | 7.1 | |
Cash Equivalents | | | 3.1 | | | | 0.0 | |
Materials | | | 0.0 | | | | 2.8 | |
Telecommunication Services | | | 0.0 | | | | 2.7 | |
Utilities | | | 0.0 | | | | 3.3 | |
9
Investment Results (Unaudited)
Average Annual Total Returns(a) (For the periods ended May 31, 2016)
| | | | | | | | |
| | | One Year | | | Since Inception
(November 8, 2013) | |
BFS Equity Fund | | | -0.91% | | | | 6.05% | |
S&P 500® Index(b) | | | 1.72% | | | | 9.68% | |
Dow Jones Industrial Average®(c) | | | 1.39% | | | | 7.92% | |
Total annual operating expenses, as disclosed in the BFS Equity Fund’s (the “Fund”) prospectus dated September 28, 2015, were 2.26% of average daily net assets (1.25% after fee waivers/expense reimbursements by Bradley, Foster & Sargent, Inc. (the “Adviser”)). The Adviser has contractually agreed to waive or limit its fees and assume other expenses of the Fund until September 30, 2016, so that total annual fund operating expenses do not exceed 1.00%. This operating expense limitation does not apply to: interest, taxes, brokerage commissions, other expenditures which are capitalized in accordance with generally accepted accounting principles, other extraordinary expenses not incurred in the ordinary course of the Fund’s business, dividend expense on short sales, expenses incurred under a plan of distribution under Rule 12b-1, and expenses that the Fund has incurred but did not actually pay because of an expense offset arrangement, if applicable, in any fiscal year. The operating expense limitation also excludes any “Fees and Expenses of Acquired Funds,” which are the expenses indirectly incurred by the Fund as a result of investing in money market funds or other investment companies, including ETFs, that have their own expenses. Each waiver or reimbursement of an expense by the Adviser is subject to repayment by the Fund within the three fiscal years following the fiscal year in which the expense was incurred, provided that the Fund is able to make the repayment without exceeding the expense limitation in place at the time of the waiver or reimbursement. This agreement may only be terminated by mutual consent of the Adviser and the Board of Trustees.
The performance quoted represents past performance, which does not guarantee future results. The investment return and principal value of an investment will fluctuate so that an investor’s shares, when redeemed, may be worth more or less than their original cost. The returns shown do not reflect deduction of taxes that a shareholder would pay on Fund distributions or the redemption of Fund shares. The Fund’s investment objectives, risks, charges and expenses must be considered carefully before investing. Current performance of a Fund may be lower or higher than the performance quoted. Performance data current to the most recent month end may be obtained by calling (855) 575-2430.
| (a) | | Average annual total returns reflect any change in price per share and assume the reinvestment of all distributions. The Fund’s returns reflect any fee reductions during the applicable periods. If such fee reductions had not occurred, the quoted performance would have been lower. |
| (b) | | The S&P 500® Index (“S&P 500”) is a widely recognized unmanaged index of equity prices and is representative of a broader market and range of securities than is found in the Fund’s portfolio. The Index is an unmanaged benchmark that assumes reinvestment of all distributions and excludes the effect of taxes and fees. Individuals cannot invest directly in this Index; however, an individual can invest in exchange traded funds or other investment vehicles that attempt to track the performance of a benchmark index. |
| (c) | | The Dow Jones Industrial Average® is a widely recognized unmanaged index of equity prices and is representative of a narrower market and range of securities than is found in the Fund’s portfolio. The Index is an unmanaged benchmark that assumes reinvestment of all distributions and excludes the effect of taxes and fees. Individuals cannot invest directly in this Index; however, an individual can invest in exchange traded funds or other investment vehicles that attempt to track the performance of a benchmark index. |
The Fund’s investment objectives, strategies, risks, charges and expenses must be considered carefully before investing. The prospectus contains this and other important information about the Fund and may be obtained by calling the same number as above. Please read it carefully before investing.
The Fund is distributed by Unified Financial Securities, LLC, member FINRA/SIPC.
10
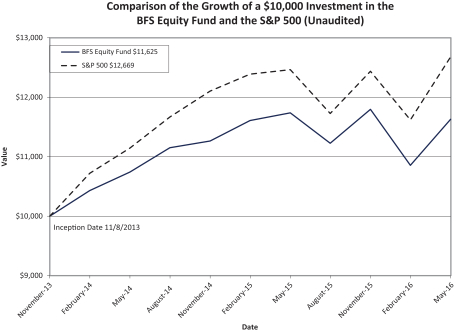
The chart above assumes an initial investment of $10,000 made on November 8, 2013 (commencement of operations) held through May 31, 2016. THE FUND’S RETURN REPRESENTS PAST PERFORMANCE AND DOES NOT GUARANTEE FUTURE RESULTS. The returns shown do not reflect deduction of taxes that a shareholder would pay on Fund distributions or the redemption of Fund shares. Investment returns and principal values will fluctuate so that your shares, when redeemed, may be worth more or less than their original purchase price.
Current performance may be lower or higher than the performance data quoted. For more information on the Fund, and to obtain performance data current to the most recent month end or to request a prospectus, please call (855) 575-2430. You should carefully consider the investment objectives, potential risks, management fees, and charges and expenses of the Fund before investing. The Fund’s prospectus contains this and other information about the Fund, and should be read carefully before investing.
The Fund is distributed by Unified Financial Securities, LLC, member FINRA/SIPC.
Availability of Portfolio Schedule (Unaudited)
The Fund files its complete schedule of portfolio holdings with the Securities and Exchange Commission (“SEC”) for the first and third quarters of each fiscal year on Form N-Q. The Fund’s Forms N-Q will be available at the SEC’s website at www.sec.gov. The Fund’s Form N-Q may be reviewed and copied at the Public Reference Room in Washington, DC. Information on the operation of the Public Reference Room may be obtained by calling (800) SEC-0330.
11
Schedule of Investments
May 31, 2016
| | | | | | | | |
| Shares | | | | | Fair Value | |
| | COMMON STOCKS — 96.84% | |
| | |
| | | | Aerospace & Defense — 4.82% | | | | |
| | 5,000 | | | Raytheon Co. | | $ | 648,350 | |
| | 5,000 | | | United Technologies Corp. | | | 502,900 | |
| | | | | | | | |
| | | | | | | 1,151,250 | |
| | | | | | | | |
| | | | Airlines — 2.18% | | | | |
| | 12,000 | | | Delta Air Lines, Inc. | | | 521,520 | |
| | | | | | | | |
| | | | Beverages — 4.04% | | | | |
| | 3,000 | | | Constellation Brands, Inc.—Class A | | | 459,450 | |
| | 5,000 | | | PepsiCo, Inc. | | | 505,850 | |
| | | | | | | | |
| | | | | | | 965,300 | |
| | | | | | | | |
| | | | Biotechnology — 2.43% | | | | |
| | 2,000 | | | Biogen, Inc. * | | | 579,460 | |
| | | | | | | | |
| | | | Commercial Banks — 2.55% | | | | |
| | 12,000 | | | Wells Fargo & Co. | | | 608,640 | |
| | | | | | | | |
| | | | Computers & Peripherals — 3.34% | | | | |
| | 8,000 | | | Apple, Inc. | | | 798,880 | |
| | | | | | | | |
| | | | Consumer Finance — 3.03% | | | | |
| | 11,000 | | | American Express Co. | | | 723,360 | |
| | | | | | | | |
| | | | Diversified Financial Services — 2.46% | | | | |
| | 9,000 | | | JPMorgan Chase & Co. | | | 587,430 | |
| | | | | | | | |
| | | | Electronic Equipment, Instruments & Components — 2.21% | | | | |
| | 9,000 | | | Amphenol Corp. — Class A | | | 528,480 | |
| | | | | | | | |
| | | | Energy Equipment & Services — 2.08% | | | | |
| | 6,500 | | | Schlumberger Ltd. | | | 495,950 | |
| | | | | | | | |
| | | | Food & Staples Retailing — 2.83% | | | | |
| | 7,000 | | | CVS Health Corp. | | | 675,150 | |
| | | | | | | | |
| | | | Food Products — 2.51% | | | | |
| | 13,500 | | | Mondelez International, Inc. — Class A | | | 600,615 | |
| | | | | | | | |
| | | | Health Care Equipment & Supplies — 2.49% | | | | |
| | 15,000 | | | Abbott Laboratories | | | 594,450 | |
| | | | | | | | |
| | | | Hotels, Restaurants & Leisure — 1.84% | | | | |
| | 8,000 | | | Starbucks Corp. | | | 439,120 | |
| | | | | | | | |
| | | | Industrial Conglomerates — 5.37% | | | | |
| | 7,500 | | | Danaher Corp. | | | 737,700 | |
| | 18,000 | | | General Electric Co. | | | 544,140 | |
| | | | | | | | |
| | | | | | | 1,281,840 | |
| | | | | | | | |
| | | | Insurance — 3.18% | | | | |
| | 6,000 | | | Chubb Ltd. | | | 759,660 | |
| | | | | | | | |
| | | | Internet & Catalog Retail — 3.03% | | | | |
| | 1,000 | | | Amazon.com, Inc. * | | | 722,790 | |
| | | | | | | | |
See accompanying notes which are an integral part of these financial statements.
12
Schedule of Investments (continued)
May 31, 2016
| | | | | | | | |
| Shares | | | | | Fair Value | |
| | COMMON STOCKS — (continued) | |
| | |
| | | | Internet Software & Services — 6.12% | | | | |
| | 1,000 | | | Alphabet, Inc. — Class A * | | $ | 748,850 | |
| | 6,000 | | | Facebook, Inc. — Class A * | | | 712,860 | |
| | | | | | | | |
| | | | | | | 1,461,710 | |
| | | | | | | | |
| | | | IT Services — 4.72% | | | | |
| | 9,000 | | | Cognizant Technology Solutions Corp. — Class A * | | | 552,960 | |
| | 6,000 | | | MasterCard, Inc. — Class A | | | 575,400 | |
| | | | | | | | |
| | | | | | | 1,128,360 | |
| | | | | | | | |
| | | | Leisure Equipment & Products — 2.49% | | | | |
| | 7,000 | | | Polaris Industries, Inc. | | | 595,140 | |
| | | | | | | | |
| | | | Life Sciences Tools & Services — 2.86% | | | | |
| | 4,500 | | | Thermo Fisher Scientific, Inc. | | | 682,965 | |
| | | | | | | | |
| | | | Media — 2.91% | | | | |
| | 7,000 | | | Walt Disney Co./The | | | 694,540 | |
| | | | | | | | |
| | | | Oil, Gas & Consumable Fuels — 5.38% | | | | |
| | 8,000 | | | Exxon Mobil Corp. | | | 712,160 | |
| | 18,000 | | | Spectra Energy Corp. | | | 573,480 | |
| | | | | | | | |
| | | | | | | 1,285,640 | |
| | | | | | | | |
| | | | Pharmaceuticals — 9.22% | | | | |
| | 4,000 | | | Johnson & Johnson | | | 450,760 | |
| | 9,000 | | | Merck & Co., Inc. | | | 506,340 | |
| | 8,500 | | | Novartis AG ADR | | | 675,835 | |
| | 12,000 | | | Zoetis, Inc. | | | 569,040 | |
| | | | | | | | |
| | | | | | | 2,201,975 | |
| | | | | | | | |
| | | | Professional Services — 2.24% | | | | |
| | 10,000 | | | Nielsen Holdings PLC | | | 533,900 | |
| | | | | | | | |
| | | | Software — 4.74% | | | | |
| | 5,000 | | | Adobe Systems, Inc. * | | | 497,350 | |
| | 12,000 | | | Microsoft Corp. | | | 636,000 | |
| | | | | | | | |
| | | | | | | 1,133,350 | |
| | | | | | | | |
| | | | Specialty Retail — 1.94% | | | | |
| | 3,500 | | | Home Depot, Inc./The | | | 462,420 | |
| | | | | | | | |
| | | | Textiles, Apparel & Luxury Goods — 3.83% | | | | |
| | 7,000 | | | NIKE, Inc. | | | 386,540 | |
| | 14,000 | | | Under Armour, Inc. — Class A * | | | 528,220 | |
| | | | | | | | |
| | | | | | | 914,760 | |
| | | | | | | | |
| | | | Total Common Stocks (Cost $20,456,504) | | | 23,128,655 | |
| | | | | | | | |
See accompanying notes which are an integral part of these financial statements.
13
Schedule of Investments (continued)
May 31, 2016
| | | | | | | | |
| Shares | | | | | Fair Value | |
|
| | MONEY MARKET FUNDS — 3.06% | |
| | 731,734 | | | Fidelity Prime Money Market Portfolio, Institutional Class, 0.44% (a) | | $ | 731,734 | |
| | | | | | | | |
| | | | Total Money Market Funds (Cost $731,734) | | | 731,734 | |
| | | | | | | | |
| | | | | | | | |
| | | | Total Investments (Cost $21,188,238) 99.90% | | | 23,860,389 | |
| | | | | | | | |
| | | | | | | | |
| | | | Other Assets in Excess of Liabilities – 0.10% | | | 23,758 | |
| | | | | | | | |
| | | | | | | | |
| | | | NET ASSETS – 100.00% | | $ | 23,884,147 | |
| | | | | | | | |
| (a) | | Rate disclosed is the seven day effective yield as of May 31, 2016. |
| * | | Non-income producing security. |
| ADR | | – American Depositary Receipt |
The industries shown on the schedule of investments are based on the Global Industry Classification Standard, or GICS® (“GICS”). The GICS was developed by and/or is the exclusive property of MSCI, Inc. and Standard & Poor Financial Services LLC (“S&P”). GICS is a service mark of MSCI, Inc. and S&P and has been licensed for use by Ultimus Asset Services, LLC.
See accompanying notes which are an integral part of these financial statements.
14
Statement of Assets and Liabilities
May 31, 2016
| | | | |
Assets | | | | |
Investments in securities at fair value (cost $21,188,238) | | $ | 23,860,389 | |
Receivable for fund shares sold | | | 8,000 | |
Dividends receivable | | | 45,321 | |
Prepaid expenses | | | 9,350 | |
Total Assets | | | 23,923,060 | |
Liabilities | | | | |
Payable to Adviser | | | 4,234 | |
Payable to administrator, fund accountant, and transfer agent | | | 6,748 | |
Distribution fees accrued | | | 4,995 | |
Other accrued expenses | | | 22,936 | |
Total Liabilities | | | 38,913 | |
Net Assets | | $ | 23,884,147 | |
Net Assets consist of: | | | | |
Paid-in capital | | $ | 21,971,803 | |
Accumulated undistributed net investment income/(loss) | | | 53,020 | |
Accumulated undistributed net realized gain/(loss) from investment transactions | | | (812,827 | ) |
Net unrealized appreciation (depreciation) on investments | | | 2,672,151 | |
Net Assets | | $ | 23,884,147 | |
Shares outstanding (unlimited number of shares authorized, no par value) | | | 2,068,093 | |
Net asset value, offering and redemption price per share | | $ | 11.55 | |
15
See accompanying notes which are an integral part of these financial statements.
Statement of Operations
For the year ended May 31, 2016
| | | | |
Investment Income | | | | |
Dividend income (net of foreign taxes withheld of $6,113) | | $ | 372,540 | |
Total investment income | | | 372,540 | |
Expenses | | | | |
Investment Adviser | | | 166,747 | |
Distribution (12b-1) | | | 55,582 | |
Administration | | | 38,000 | |
Fund accounting | | | 25,000 | |
Transfer agent | | | 18,074 | |
Legal | | | 14,505 | |
Registration | | | 24,667 | |
Custodian | | | 4,200 | |
Audit | | | 16,000 | |
Trustee | | | 5,546 | |
Printing | | | 12,175 | |
Miscellaneous | | | 32,738 | |
Total expenses | | | 413,234 | |
Fees waived and reimbursed by Adviser | | | (135,629 | ) |
Net operating expenses | | | 277,605 | |
Net investment income/(loss) | | | 94,935 | |
Net Realized and Unrealized Gain/(Loss) on Investments | |
Net realized gain/(loss) on investment securities transactions | | | (458,394 | ) |
Net change in unrealized appreciation (depreciation) of investment securities | | | 217,958 | |
Net realized and unrealized gain/(loss) on investments | | | (240,436 | ) |
Net increase (decrease) in net assets resulting from operations | | $ | (145,501 | ) |
16
See accompanying notes which are an integral part of these financial statements.
Statements of Changes in Net Assets
| | | | | | | | |
| Increase (Decrease) in Net Assets due to: | | For the Year Ended May 31, 2016 | | | For the Year Ended
May 31, 2015 | |
Operations | | | | | | | | |
Net investment income/(loss) | | $ | 94,935 | | | $ | 49,326 | |
Net realized gain/(loss) on investment securities transactions | | | (458,394 | ) | | | (179,137 | ) |
Net change in unrealized appreciation (depreciation) of investment securities | | | 217,958 | | | | 1,676,273 | |
Net increase (decrease) in net assets resulting from operations | | | (145,501 | ) | | | 1,546,462 | |
Distributions | | | | | | | | |
From net investment income | | | (69,881 | ) | | | (50,367 | ) |
Total distributions | | | (69,881 | ) | | | (50,367 | ) |
Capital Transactions | | | | | | | | |
Proceeds from shares sold | | | 5,178,205 | | | | 6,774,960 | |
Reinvestment of distributions | | | 62,385 | | | | 31,188 | |
Amount paid for shares redeemed | | | (1,308,552 | ) | | | (879,815 | ) |
Net increase (decrease) in net assets resulting from capital transactions | | | 3,932,038 | | | | 5,926,333 | |
Total Increase (Decrease) in Net Assets | | | 3,716,656 | | | | 7,422,428 | |
Net Assets | | | | | | | | |
Beginning of year | | | 20,167,491 | | | | 12,745,063 | |
End of year | | $ | 23,884,147 | | | $ | 20,167,491 | |
Accumulated undistributed net investment income/(loss) included in net assets at end of year | | $ | 53,020 | | | $ | 29,496 | |
Share Transactions | | | | | | | | |
Shares sold | | | 455,719 | | | | 613,346 | |
Shares issued in reinvestment of distributions | | | 5,364 | | | | 2,772 | |
Shares redeemed | | | (118,087 | ) | | | (79,058 | ) |
Net increase (decrease) in shares outstanding | | | 342,996 | | | | 537,060 | |
17
See accompanying notes which are an integral part of these financial statements.
Financial Highlights
(For a share outstanding during each period)
| | | | | | | | | | | | |
| | | For the Year Ended
May 31, 2016 | | | For the Year Ended
May 31, 2015 | | | For the Period Ended
May 31, 2014(a) | |
Selected Per Share Data: | |
Net asset value, beginning of period | | | $11.69 | | | | $10.73 | | | | $10.00 | |
| | | | | | | | | | | | |
| | | |
Income from investment operations: | | | | | | | | | | | | |
| | | |
Net investment income/(loss) | | | 0.04 | | | | 0.02 | | | | 0.04 | |
| | | |
Net realized and unrealized gain/(loss) on investments | | | (0.15 | ) | | | 0.97 | | | | 0.70 | |
| | | | | | | | | | | | |
| | | |
Total from investment operations | | | (0.11 | ) | | | 0.99 | | | | 0.74 | |
| | | | | | | | | | | | |
| | | |
Less distributions to shareholders from: | | | | | | | | | | | | |
| | | |
Net investment income | | | (0.03 | ) | | | (0.03 | ) | | | (0.01 | ) |
| | | | | | | | | | | | |
| | | |
Total distributions | | | (0.03 | ) | | | (0.03 | ) | | | (0.01 | ) |
| | | | | | | | | | | | |
Net asset value, end of period | | | $11.55 | | | | $11.69 | | | | $10.73 | |
| | | | | | | | | | | | |
| | | |
Total Return(b) | | | (0.91 | )% | | | 9.27 | % | | | 7.36 | %(c) |
| | | | | | | | | | | | |
Ratios and Supplemental Data: | |
Net assets, end of period (000) | | | $23,884 | | | | $20,167 | | | | $12,745 | |
Ratio of net expenses to average net assets | | | 1.25 | % | | | 1.25 | % | | | 1.25 | %(d) |
Ratio of expenses to average net assets before waiver and reimbursement | | | 1.86 | % | | | 2.26 | % | | | 3.93 | %(d) |
Ratio of net investment income/(loss) to average net assets | | | 0.43 | % | | | 0.30 | % | | | 0.68 | %(d) |
Ratio of net investment income/(loss) to average net assets before waiver and reimbursement | | | (0.18 | )% | | | (0.71 | )% | | | (2.00 | )%(d) |
| | | |
Portfolio turnover rate | | | 49.38 | % | | | 51.17 | % | | | 46.50 | %(c) |
| (a) | | For the period November 8, 2013 (commencement of operations) to May 31, 2014. |
| (b) | | Total return in the above table represents the rate that the investor would have earned or lost on an investment in the Fund, assuming reinvestment of dividends, if any. |
18
See accompanying notes which are an integral part of these financial statements.
Notes to Financial Statements
May 31, 2016
NOTE 1 – ORGANIZATION
The BFS Equity Fund (the “Fund”) was organized as an open-end diversified series of the Valued Advisers Trust (the “Trust”) on July 23, 2013 and commenced operations on November 8, 2013. The Trust is a management investment company established under the laws of Delaware by an Agreement and Declaration of Trust dated June 13, 2008 (the “Trust Agreement”). The Trust Agreement permits the Trustees to issue an unlimited number of shares of beneficial interest of separate series without par value. The Fund is one of a series of funds authorized by the Board of Trustees (the “Board”). The Fund’s investment adviser is Bradley, Foster & Sargent, Inc. (the “Adviser”). The investment objective of the Fund is long-term appreciation through growth of principal and income.
NOTE 2 – SIGNIFICANT ACCOUNTING POLICIES
The Fund is an investment company and follows accounting and reporting guidance under Financial Accounting Standards Board (“FASB”) Accounting Standards Codification (“ASC”) Topic 946, “Financial Services-Investment Companies”. The following is a summary of significant accounting policies followed by the Fund in the preparation of its financial statements. These policies are in conformity with generally accepted accounting principles in the United States of America (“GAAP”).
Securities Valuation – All investments in securities are recorded at their estimated fair value as described in Note 3.
Federal Income Taxes – The Fund makes no provision for federal income or excise tax. The Fund has qualified and intends to qualify each year as a regulated investment company (“RIC”) under subchapter M of the Internal Revenue Code of 1986, as amended, by complying with the requirements applicable to RICs and by distributing substantially all of its taxable income. The Fund also intends to distribute sufficient net investment income and net capital gains, if any, so that it will not be subject to excise tax on undistributed income and gains. If the required amount of net investment income or gains is not distributed, the Fund could incur a tax expense.
As of, and during the fiscal year ended May 31, 2016, the Fund did not have a liability for any unrecognized tax benefits. The Fund recognizes interest and penalties, if any, related to unrecognized tax benefits as income tax expense in the statement of operations. During the fiscal year, the Fund did not incur any interest or penalties. The Fund is subject to examination by U.S. federal tax authorities for all tax years since inception.
Expenses – Expenses incurred by the Trust that do not relate to a specific fund of the Trust are allocated to the individual funds based on each fund’s relative net assets or another appropriate basis.
Security Transactions and Related Income – The Fund follows industry practice and records security transactions on the trade date for financial reporting purposes. The Fund has chosen specific identification as its tax lot identification method for all securities transactions. Interest income is recorded on an accrual basis and dividend income is recorded on the ex-dividend date except in the case of foreign securities, in which case dividends are generally recorded as soon as
19
Notes to Financial Statements (continued)
May 31, 2016
such information becomes available. Discounts and premiums on securities purchased are accreted or amortized using the effective interest method. The ability of issuers of debt securities held by the Fund to meet their obligations may be affected by economic and political developments in a specific country or region. Withholding taxes on foreign dividends have been provided for in accordance with the Fund’s understanding of the applicable country’s tax rules and rates.
Dividends and Distributions – The Fund intends to distribute its net investment income and net realized long-term and short-term capital gains, if any, at least annually. Dividends and distributions to shareholders, which are determined in accordance with income tax regulations, are recorded on the ex-dividend date. The treatment for financial reporting purposes of distributions made to shareholders during the period from net investment income or net realized capital gains may differ from their ultimate treatment for federal income tax purposes. These differences are caused primarily by differences in the timing of the recognition of certain components of income, expense or realized capital gain for federal income tax purposes. Where such differences are permanent in nature, they are reclassified in the components of the net assets based on their ultimate characterization for federal income tax purposes. Any such reclassifications will have no effect on net assets, results of operations or net asset values per share of the Fund. For the fiscal year ended May 31, 2016, the Fund made the following reclassifications of net assets:
| | | | | | | | |
| Paid-in Capital | | Accumulated Undistributed Net Investment Income/(loss) | | | Accumulated Net Realized Gain/(Loss) on Investments | |
$ – | | $ | (1,530 | ) | | $ | 1,530 | |
NOTE 3 – SECURITIES VALUATION AND FAIR VALUE MEASUREMENTS
Fair value is defined as the price that a Fund would receive upon selling an investment in an orderly transaction to an independent buyer in the principal or most advantageous market of the investment. GAAP establishes a three-tier hierarchy to maximize the use of observable market data and minimize the use of unobservable inputs and establish classification of fair value measurements for disclosure purposes.
Inputs refer broadly to the assumptions that market participants would use in pricing the asset or liability, including assumptions about risk, for example, the risk inherent in a particular valuation technique used to measure fair value including a pricing model and/or the risk inherent in the inputs to the valuation technique. Inputs may be observable or unobservable. Observable inputs are inputs that reflect the assumptions market participants would use in pricing the asset or liability developed based on market data obtained from sources independent of the reporting entity. Unobservable inputs are inputs that reflect the reporting entity’s own assumptions about the assumptions market participants would use in pricing the asset or liability developed based on the best information available in the circumstances.
Various inputs are used in determining the value of the Fund’s investments. These inputs are summarized in the three broad levels listed below.
| | • | | Level 1 – unadjusted quoted prices in active markets for identical investments and/or registered investment companies where the value per share is determined and published |
20
Notes to Financial Statements (continued)
May 31, 2016
| | and is the basis for current transactions for identical assets or liabilities at the valuation date. |
| | • | | Level 2 – other significant observable inputs (including, but not limited to, quoted prices for an identical security in an inactive market, quoted prices for similar securities, interest rates, prepayment speeds, credit risk, etc.) |
| | • | | Level 3 – significant unobservable inputs (including the Fund’s own assumptions in determining fair value of investments based on the best information available) |
The inputs used to measure fair value may fall into different levels of the fair value hierarchy. In such cases, for disclosure purposes, the level in the fair value hierarchy which is reported is determined based on the lowest level input that is significant to the fair value measurement in its entirety.
Equity securities, including common stocks, are generally valued by using market quotations, but may be valued on the basis of prices furnished by a pricing agent when the Adviser believes such prices more accurately reflect the fair value of such securities. Securities that are traded on any stock exchange are generally valued by the pricing agent at the last quoted sale price. Lacking a last sale price, an exchange traded security is generally valued by the pricing agent at its last bid price. Securities traded in the NASDAQ over-the-counter market are generally valued by the pricing agent at the NASDAQ Official Closing Price.
When using the market quotations or close prices provided by the pricing agent and when the market is considered active, the security will be classified as a Level 1 security. Sometimes, an equity security owned by the Fund will be valued by the pricing agent with factors other than market quotations or when the market is considered inactive. When this happens, the security will be classified as a Level 2 security. When market quotations are not readily available, when the Adviser determines that the market quotation or the price provided by the pricing agent does not accurately reflect the current fair value, or when restricted or illiquid securities are being valued, such securities are valued as determined in good faith by the Adviser, in conformity with guidelines adopted by and subject to review by the Board. These securities are generally categorized as Level 3 securities.
Investments in mutual funds, including money market mutual funds, are generally priced at the ending net asset value (“NAV”) provided by the pricing agent of the funds. These securities are categorized as Level 1 securities.
In accordance with the Trust’s good faith pricing guidelines, the Adviser is required to consider all appropriate factors relevant to the value of securities for which it has determined other pricing sources are not available or reliable as described above. No single standard exists for determining fair value, because fair value depends upon the circumstances of each individual case. As a general principle, the current fair value of an issue of securities being valued would appear to be the amount which the owner might reasonably expect to receive for them upon their current sale. Methods which are in accordance with this principle may, for example, be based on (i) a multiple of earnings; (ii) a discount from market of a similar freely traded security (including a derivative security or a basket of securities traded on other markets, exchanges or among dealers); or (iii) yield to maturity with respect to debt issues, or a combination of these and other methods. Good faith
21
Notes to Financial Statements (continued)
May 31, 2016
pricing is permitted if, in the Adviser’s opinion, the validity of market quotations appears to be questionable based on factors such as evidence of a thin market in the security based on a small number of quotations, a significant event occurs after the close of a market but before a Fund’s NAV calculation that may affect a security’s value, or the Adviser is aware of any other data that calls into question the reliability of market quotations.
The following is a summary of the inputs used to value the Fund’s investments as of May 31, 2016:
| | | | | | | | | | | | | | | | |
| | | Valuation Inputs | | | | |
| Assets | | Level 1 | | | Level 2 | | | Level 3 | | | Total | |
Common Stocks* | | $ | 23,128,655 | | | $ | – | | | $ | – | | | $ | 23,128,655 | |
Money Market Funds | | | 731,734 | | | | – | | | | – | | | | 731,734 | |
Total | | $ | 23,860,389 | | | $ | – | | | $ | – | | | $ | 23,860,389 | |
| * | | Refer to Schedule of Investments for industry classifications. |
The Fund did not hold any investments during the reporting period in which other significant observable inputs (Level 2) were used in determining fair value. The Fund did not hold any assets during the reporting period in which significant unobservable inputs (Level 3) were used in determining fair value; therefore, no reconciliation of Level 3 securities is included for this reporting period. The Fund did not hold any derivative instruments during the reporting period.
The Trust recognizes transfers between fair value hierarchy levels at the end of the reporting period. There were no transfers between any levels during the fiscal year ended May 31, 2016.
NOTE 4 – FEES AND OTHER TRANSACTIONS WITH AFFILIATES AND OTHER SERVICE PROVIDERS
Under the terms of the investment advisory agreement, on behalf of the Fund (the “Agreement”), the Adviser manages the Fund’s investments subject to oversight of the Board. As compensation for its services, the Fund is obligated to pay the Adviser a fee computed and accrued daily and paid monthly at an annual rate of 0.75% of the average daily net assets of the Fund. For the fiscal year ended May 31, 2016, the Adviser earned a fee of $166,747 from the Fund before the waivers described below. At May 31, 2016, the Fund owed the Adviser $4,234.
The Adviser has contractually agreed to waive or limit its fee and assume other expenses of the Fund, until September 30, 2016, so that the ratio of total annual operating expenses do not exceed 1.00%. This operating expense limitation does not apply to interest, taxes, brokerage commissions, other expenditures which are capitalized in accordance with GAAP, other extraordinary expenses not incurred in the ordinary course of the Fund’s business, dividend expense on short sales, expenses incurred under a plan of distribution under Rule 12b-1, and expenses that the Fund has incurred but did not actually pay because of an expense offset arrangement, if applicable, incurred by the Fund in any fiscal year. The operating expense limitation also excludes any “Fees and Expenses of Acquired Funds” which are the expenses indirectly incurred by the Fund as a result of investing in money market funds or other investment companies, including ETFs, that have their own expenses. The Adviser may be entitled to recoup the sum of all fees previously waived or expenses reimbursed during any of the previous three years, less any reimbursement previously paid, provided total expenses do not exceed the limitation set forth above. For the fiscal year ended
22
Notes to Financial Statements (continued)
May 31, 2016
May 31, 2016, expenses totaling $135,629 were waived or reimbursed by the Adviser. The amounts subject to repayment by the Fund, pursuant to the aforementioned conditions are as follows:
| | | | |
| Amount | | Recoverable through
May 31, | |
| $146,030 | | | 2017 | |
| 163,520 | | | 2018 | |
| 135,629 | | | 2019 | |
The Trust retains Ultimus Asset Services, LLC (“Ultimus”), formerly Huntington Asset Services, Inc. (“HASI”), to manage the Fund’s business affairs and provide the Fund with administrative and compliance services, including all regulatory reporting. For the fiscal year ended May 31, 2016, Ultimus earned fees of $38,000 for administrative and compliance services provided to the Fund. At May 31, 2016, Ultimus was owed $3,167 from the Fund for administrative and compliance services. The officers and one Trustee of the Trust are members of management and/or employees of Ultimus. Unified Financial Securities, LLC (the “Distributor”) acts as the principal distributor of the Fund’s shares. Huntington National Bank is the custodian of the Fund’s investments (the “Custodian”). Effective at the close of business on December 31, 2015, Ultimus Fund Solutions, LLC acquired HASI and the Distributor from Huntington Bancshares, Inc. (HBI”). Prior to January 1, 2016, the Custodian, HASI and the Distributor were under common control by HBI.
The Trust also retains Ultimus to act as the Fund’s transfer agent and to provide fund accounting services. For the fiscal year ended May 31, 2016, Ultimus earned fees of $18,074 for providing transfer agent services to the Fund. At May 31, 2016, the Fund owed Ultimus $1,498 for transfer agent services. For the fiscal year ended May 31, 2016, Ultimus earned fees of $25,000 from the Fund for fund accounting services. At May 31, 2016, Ultimus was owed $2,083 from the Fund for fund accounting services.
The Fund has adopted a Distribution Plan pursuant to Rule 12b-1 under the Investment Company Act of 1940 (the “Plan”). The Plan provides that the Fund will pay the Distributor and/or any registered securities dealer, financial institution or any other person (the “Recipient”) a shareholder servicing fee of 0.25% of the average daily net assets of the Fund in connection with the promotion and distribution of the Fund’s shares or the provision of personal services to shareholders, including, but not necessarily limited to, advertising, compensation to underwriters, dealers and selling personnel, the printing and mailing of prospectuses to other than current Fund shareholders, the printing and mailing of sales literature and servicing shareholder accounts (“12b-1 Expenses”). The Fund or Distributor may pay all or a portion of these fees to any recipient who renders assistance in distributing or promoting the sale of shares, or who provides certain shareholder services, pursuant to a written agreement. For the fiscal year ended May 31, 2016, 12b-1 expenses incurred by the Fund were $55,582. The Fund owed $4,995 for 12b-1 expenses as of May 31, 2016.
A trustee and certain officers of the Trust are officers of the Distributor and each such person may be deemed to be an affiliate of the Distributor.
23
Notes to Financial Statements (continued)
May 31, 2016
NOTE 5 – PURCHASES AND SALES OF SECURITIES
For the fiscal year ended May 31, 2016, purchases and sales of investment securities, other than short-term investments and short-term U.S. government obligations, were as follows:
| | | | | | |
Purchases | | | Sales | |
| $ | 14,464,600 | | | $ | 10,725,836 | |
There were no purchases or sales of long-term U.S. government obligations during the fiscal year ended May 31, 2016.
NOTE 6 – ESTIMATES
The preparation of financial statements in conformity with GAAP requires management to make estimates and assumptions that affect the reported amounts of assets and liabilities and disclosure of contingent assets and liabilities at the date of the financial statements and the reported amounts of increases and decreases in net assets from operations during the reporting period. Actual results could differ from those estimates.
NOTE 7 – BENEFICIAL OWNERSHIP
The beneficial ownership, either directly or indirectly, of 25% or more of the voting securities of a fund creates a presumption of control of a fund, under Section 2(a) (9) of the Investment Company Act of 1940. At May 31, 2016, Charles Schwab & Co. (“Schwab”) owned, as record shareholder, 57% of the outstanding shares of the Fund. It is not known whether Schwab or any of the underlying beneficial owners owned or controlled 25% or more of the voting securities of the Fund.
NOTE 8 – FEDERAL TAX INFORMATION
At May 31, 2016, the net unrealized appreciation (depreciation) of investments for tax purposes was as follows:
| | | | |
Gross Unrealized Appreciation | | $ | 3,141,824 | |
Gross Unrealized (Depreciation) | | | (488,204 | ) |
Net Unrealized Appreciation on Investments | | $ | 2,653,620 | |
At May 31, 2016, the aggregate cost of securities for federal income tax purposes was $21,206,769 for the Fund.
At May 31, 2016, the Fund’s most recent fiscal year end, the components of distributable earnings (accumulated losses) on a tax basis were as follows:
| | | | |
Undistributed ordinary income | | $ | 53,020 | |
Accumulated capital and other losses | | | (794,296 | ) |
Unrealized appreciation | | | 2,653,620 | |
Total | | $ | 1,912,344 | |
The difference between book and tax basis appreciation was attributable primarily to the tax deferral of losses on wash sale.
24
Notes to Financial Statements (continued)
May 31, 2016
The tax character of distributions paid for the fiscal year ended May 31, 2016 was as follows:
| | | | | | | | |
| | | 2016 | | | 2015 | |
Distributions paid from: | | | | | | | | |
Ordinary Income | | $ | 69,881 | | | $ | 50,367 | |
As of May 31, 2016, the Fund has available for federal tax purposes an unused capital loss carryforward of $31,655 and $400,253 of long-term and short-term capital losses, respectively, with no expiration, which is available to offset against future taxable net capital gains. To the extent that these carryforwards are used to offset future gains, it is probable that the amount offset will not be distributed to shareholders.
Certain capital losses incurred after October 31, and within the current taxable year, are deemed to arise on the first business day of the Fund’s following taxable year. For the tax year ended May 31, 2016, the Fund deferred post October capital losses in the amount of $362,388.
NOTE 9 – COMMITMENTS AND CONTINGENCIES
The Fund indemnifies its officers and trustees for certain liabilities that may arise from performance of their duties to the Fund. Additionally, in the normal course of business, the Fund enters into contracts that contain a variety of representations and warranties which provide general indemnifications. The Fund’s maximum exposure under these arrangements is unknown, as this would involve future claims that may be made against the Fund that have not yet occurred.
NOTE 10 – SUBSEQUENT EVENTS
Management of the Fund has evaluated the need for disclosure and/or adjustments resulting from subsequent events through the date these financials were issued. Based upon this evaluation, management has determined there were no items requiring adjustment of the financial statements or additional disclosure.
25
Report of Independent Registered Public Accounting Firm
To the Shareholders of BFS Equity Fund and
Board of Trustees of Valued Advisers Trust
We have audited the accompanying statement of assets and liabilities, including the schedule of investments, of BFS Equity Fund (the “Fund”), a series of Valued Advisers Trust, as of May 31, 2016, and the related statement of operations for the year then ended, the statements of changes in net assets for each of the two years in the period then ended, and financial highlights for each of the three periods in the period then ended. These financial statements and financial highlights are the responsibility of the Fund’s management. Our responsibility is to express an opinion on these financial statements and financial highlights based on our audits.
We conducted our audits in accordance with the standards of the Public Company Accounting Oversight Board (United States). Those standards require that we plan and perform the audit to obtain reasonable assurance about whether the financial statements and financial highlights are free of material misstatement. An audit includes examining, on a test basis, evidence supporting the amounts and disclosures in the financial statements. Our procedures included confirmation of securities owned as of May 31, 2016, by correspondence with the custodian. An audit also includes assessing the accounting principles used and significant estimates made by management, as well as evaluating the overall financial statement presentation. We believe that our audits provide a reasonable basis for our opinion.
In our opinion, the financial statements and financial highlights referred to above present fairly, in all material respects, the financial position of BFS Equity Fund as of May 31, 2016, the results of its operations for the year then ended, the changes in its net assets for each of the two years in the period then ended, and the financial highlights for each of the three periods in the period then ended, in conformity with accounting principles generally accepted in the United States of America.

COHEN FUND AUDIT SERVICES, LTD.
Cleveland, Ohio
August 1, 2016
26
Summary of Fund Expenses (Unaudited)
As a shareholder of the Fund, you incur two types of costs: (1) transaction costs; and (2) ongoing costs, including management fees; and other Fund expenses. This Example is intended to help you understand your ongoing costs (in dollars) of investing in the Fund and to compare these costs with the ongoing costs of investing in other mutual funds. The Example is based on an investment of $1,000 invested at the beginning of the period, and held for the six month period, December 1, 2015 to May 31, 2016.
Actual Expenses
The first line of the table below provides information about actual account values and actual expenses. You may use the information in this line, together with the amount you invested, to estimate the expenses that you paid over the period. Simply divide your account value by $1,000 (for example, an $8,600 account value divided by $1,000 = 8.60), then multiply the result by the number in the first line under the heading “Expenses Paid During the Period” to estimate the expenses you paid on your account during this period.
Hypothetical Example for Comparison Purposes
The second line of the table below provides information about hypothetical account values and hypothetical expenses based on the Fund’s actual expense ratio and an assumed rate of return of 5% per year before expenses, which is not the Fund’s actual return. The hypothetical account values and expenses may not be used to estimate the actual ending account balance or expenses you paid for the period. You may use this information to compare the ongoing costs of investing in the Fund and other funds. To do so, compare this 5% hypothetical example with the 5% hypothetical examples that appear in the shareholder reports of other funds.
Expenses shown in the table are meant to highlight your ongoing costs only and do not reflect any transactional costs, such as sales charges (loads), or redemption fees. Therefore, the second line of the table is useful in comparing ongoing costs only, and will not help you determine the relative total costs of owning different funds.
| | | | | | | | | | | | |
| | | Beginning
Account Value
December 1, 2015 | | | Ending
Account Value
May 31, 2016 | | | Expenses Paid During
the Period(a) | |
Actual expenses | | $ | 1,000.00 | | | $ | 985.90 | | | $ | 6.20 | |
Hypothetical expenses(b) | | $ | 1,000.00 | | | $ | 1,018.76 | | | $ | 6.30 | |
| (a) | | Expenses are equal to the Fund’s annualized expense ratio of 1.25%, multiplied by the average account value over the period, multiplied by 183/366. |
| (b) | | Assumes a 5% return before expenses. |
27
Additional Federal Income Tax Information (Unaudited):
The Form 1099-DIV you receive in January 2017 will show the tax status of all distributions paid to your account in calendar year 2016. Shareholders are advised to consult their own tax adviser with respect to the tax consequences of their investment in the Fund. As required by the Internal Revenue Code and/or regulations, shareholders must be notified regarding the status of qualified dividend income for individuals and the dividends received deduction for corporations.
Qualified Dividend Income: The Fund designates approximately 100%, or up to the maximum amount of such dividends allowable pursuant to the Internal Revenue Code, as qualified dividend income eligible for the reduced tax rate of 15%.
Dividends Received Deduction: Corporate shareholders are generally entitled to take the dividends received deduction on the portion of the Fund’s dividend distribution that qualifies under tax law. For the Fund’s fiscal year 2016 ordinary income dividends, 100% qualifies for the corporate dividends received deduction.
28
Trustees and Officers (Unaudited)
The Board of Trustees supervises the business activities of the Trust. Each Trustee serves as a trustee until termination of the Trust unless the Trustee dies, resigns, retires or is removed.
The following table provides information regarding each of the Independent Trustees.
| | | | |
Name, Address*, (Age),
Position with Trust**, Term
of Position with Trust | | Principal Occupation During Past 5 Years | | Other Directorships |
| | |
| Ira P. Cohen, 57, Independent Trustee, June 2010 to present. | | Current: Independent financial services consultant since February 2005; Executive Vice President of Asset Management Services, Recognos Financial, since August 2015. | | Trustee and Audit Committee Chairman, Griffin Institutional Real Estate Access Fund, since May 2014. Trustee, Angel Oak Funds Trust, since October 2014. |
| | |
| Andrea N. Mullins, 49, Independent Trustee, December 2013 to present. | | Current: Private investor; Independent Contractor, Seabridge Wealth Management, LLC, since April 2014. | | None. |
| * | | The address for each trustee and officer is 225 Pictoria Drive, Suite 450, Cincinnati, OH 45246. |
| ** | | As of the date of this report, the Trust consists of 15 series. |
The following table provides information regarding the Trustee who is considered an “interested person” of the Trust, as that term is defined under the 1940 Act. Based on the experience of the Trustee, the Trust concluded that the individual described below is qualified to serve as a Trustee.
| | | | |
Name, Address*, (Age),
Position with Trust**, Term
of Position with Trust | | Principal Occupation During Past 5 Years | | Other Directorships |
| | |
| R. Jeffrey Young, 51, Trustee and Chairman, June 2010 to present; Principal Executive Officer and President since February 2010 to present. | | Current: Vice President and Director of Relationship Management, Ultimus Fund Solutions, LLC (since December 2015); President, Unified Financial Securities, LLC (since July 2015). Previous: President, Huntington Asset Services, Inc. (n/k/a Ultimus Asset Services, LLC) (April 2015 to December 2015), Director (May 2014 to December 2015), Senior Vice President (January 2010 to April 2015); Director, Unified Financial Securities, Inc. (n/k/a Unified Financial Securities, LLC) (May 2014 to December 2015); Chief Executive Officer, Huntington Funds (February 2010 to March 2015); Chief Executive Officer, Huntington Strategy Shares (November 2010 to March 2015); President and Chief Executive Officer, Dreman Contrarian Funds (March 2011 to February 2013). | | Trustee and Chairman, Capitol Series Trust, since September 2013. |
| * | | The address for each trustee and officer is 225 Pictoria Drive, Suite 450, Cincinnati, OH 45246. |
| ** | | As of the date of this report, the Trust consists of 15 series. |
29
The following table provides information regarding the Officers of the Trust:
| | |
Name, Address*, (Age),
Position with Trust, Term
of Position with Trust | | Principal Occupation During Past 5 Years |
| |
| John C. Swhear, 55, Chief Compliance Officer, AML Officer and Vice President, August 2008 to present. | | Current: Assistant Vice President and Associate Director of Compliance, Ultimus Fund Solutions, LLC (since December 2015); Chief Compliance Officer, Unified Financial Securities, LLC (since May 2007); Chief Compliance Officer and AML Officer, Capitol Series Trust (since September 2013). Previous: Vice President of Legal Administration and Compliance, Huntington Asset Services, Inc. (n/k/a Ultimus Asset Services, LLC) (April 2007 to December 2015), Director (May 2014 to December 2015); Director, Unified Financial Securities, Inc. (n/k/a Unified Financial Securities, LLC) (May 2014 to December 2015); President, Unified Series Trust (March 2012 to January 2016), Senior Vice President (May 2007 to March 2012); Secretary, Huntington Funds (April 2010 to February 2012). |
| |
| Carol J. Highsmith, 51, Vice President, August 2008 to present; Secretary, March 2014 to present | | Current: Assistant Vice President, Ultimus Fund Solutions, LLC (since December 2015). Previous: Secretary, Cross Shore Discovery Fund (May 2014 to February 2016); Employed in various positions with Huntington Asset Services, Inc. (n/k/a Ultimus Asset Services, LLC) (November 1994 to December 2015), most recently Vice President of Legal Administration (2005 to December 2015). |
| |
| Matthew J. Miller, 40, Vice President, December 2011 to present. | | Current: Assistant Vice President, Relationship Management, Ultimus Fund Solutions, LLC (since December 2015); President and Chief Executive Officer, Capitol Series Trust (since September 2013). Previous: Employed in various positions with Huntington Asset Services, Inc. (n/k/a Ultimus Asset Services, LLC) (since July 1998), most recently Vice President of Relationship Management (2005 to December 2015); Vice President, Huntington Funds (February 2010 to April 2015). |
| |
| Bryan W. Ashmus, 43, Principal Financial Officer and Treasurer, December 2013 to present. | | Current: Vice President and Director of Financial Administration, Ultimus Fund Solutions, LLC (since December 2015); Chief Financial Officer and Treasurer, Cross Shore Discovery Fund (since June 2016). Previous: Vice President and Manager of Financial Administration, Huntington Asset Services, Inc. (n/k/a Ultimus Asset Services, LLC) (September 2013 to December 2015); Chief Financial Officer and Treasurer, Huntington Strategy Shares and Huntington Funds Trust (November 2013 to April 2016); Vice President, Fund Administration, Citi Fund Services Ohio, Inc. (from May 2005 to September 2013). |
| * | | The address for each trustee and officer is 225 Pictoria Drive, Suite 450, Cincinnati, OH 45246. |
OTHER INFORMATION
The Fund’s Statement of Additional Information (“SAI”) includes additional information about the Trustees and officers of the Trust and is available without charge, upon request. You may call toll-free at (855) 575-2430 to request a copy of the SAI or to make shareholder inquiries.
30
VALUED ADVISERS TRUST
PRIVACY POLICY
The following is a description of the policies of the Valued Advisers Trust (the “Trust”) regarding disclosure of nonpublic personal information that shareholders provide to a series of the Trust (each, a “Fund”) or that the Fund collects from other sources. In the event that a shareholder holds shares of a Fund through a broker-dealer or other financial intermediary, the privacy policy of the financial intermediary would govern how shareholder nonpublic personal information would be shared with nonaffiliated third parties.
Categories of Information a Fund May Collect. A Fund may collect the following nonpublic personal information about its shareholders:
| | • | | Information the Fund receives from a shareholder on applications or other forms, correspondence, or conversations (such as the shareholder’s name, address, phone number, social security number, and date of birth); and |
| | • | | Information about the shareholder’s transactions with the Fund, its affiliates, or others (such as the shareholder’s account number and balance, payment history, cost basis information, and other financial information). |
Categories of Information a Fund May Disclose. A Fund may not disclose any nonpublic personal information about its current or former shareholders to unaffiliated third parties, except as required or permitted by law. A Fund is permitted by law to disclose all of the information it collects, as described above, to its service providers (such as the Fund’s custodian, administrator, transfer agent, accountant and legal counsel) to process shareholder transactions and otherwise provide services to the shareholder.
Confidentiality and Security. Each Fund shall restrict access to shareholder nonpublic personal information to those persons who require such information to provide products or services to the shareholder. Each Fund shall maintain physical, electronic, and procedural safeguards that comply with federal standards to guard shareholder nonpublic personal information.
Disposal of Information. The Funds, through their transfer agent, have taken steps to reasonably ensure that the privacy of a shareholder’s nonpublic personal information is maintained at all times, including in connection with the disposal of information that is no longer required to be maintained by the Funds. Such steps shall include, whenever possible, shredding paper documents and records prior to disposal, requiring off-site storage vendors to shred documents maintained in such locations prior to disposal, and erasing and/or obliterating any data contained on electronic media in such a manner that the information can no longer be read or reconstructed.
31
Proxy Voting
A description of the policies and procedures that the Fund uses to determine how to vote proxies relating to portfolio securities and information regarding how the Fund voted those proxies during the most recent twelve month period ended June 30, will be available without charge upon request by (1) calling the Fund at (855) 575-2430 and (2) from Fund documents filed with the Securities and Exchange Commission (“SEC”) on the SEC’s website at www.sec.gov.
TRUSTEES
R. Jeffrey Young, Chairman
Ira P. Cohen
Andrea N. Mullins
OFFICERS
R. Jeffrey Young, Principal Executive Officer and President
Bryan W. Ashmus, Principal Financial Officer and Treasurer
John C. Swhear, Chief Compliance Officer, AML Officer and Vice-President
Carol J. Highsmith, Vice President and Secretary
Matthew J. Miller, Vice President
INVESTMENT ADVISER
Bradley, Foster & Sargent
185 Asylum Street, City Place II
Hartford, Connecticut 06103
DISTRIBUTOR
Unified Financial Securities, LLC
9465 Counselors Row, Suite 200
Indianapolis, IN 46240
INDEPENDENT REGISTERED PUBLIC ACCOUNTING FIRM
Cohen Fund Audit Services, Ltd.
1350 Euclid Avenue, Suite 800
Cleveland, OH 44115
LEGAL COUNSEL
The Law Offices of John H. Lively & Associates, Inc.
A member firm of The 1940 Act Law Group TM
11300 Tomahawk Creek Parkway, Suite 310
Leawood, KS 66211
CUSTODIAN
Huntington National Bank
41 South High Street
Columbus, OH 43215
ADMINISTRATOR, TRANSFER AGENT AND FUND ACCOUNTANT
Ultimus Asset Services, LLC
225 Pictoria Drive, Suite 450
Cincinnati, OH 45246
This report is intended only for the information of shareholders or those who have received the Fund’s prospectus which contains information about the Fund’s management fee and expenses. Please read the prospectus carefully before investing.
Distributed by Unified Financial Securities, LLC
Member FINRA/SIPC
ANNUAL REPORT
May 31, 2016

CLOUD CAPITAL FUNDS
Cloud Capital Strategic All Cap Fund
Fund Adviser:
Cloud Capital LLC
P.O. Box 451179
Grove, OK 74345
Toll Free (877) 670-2227
| | |
Management’s Discussion of Fund Performance |
We welcome and thank all new and existing shareholders for your investment in the Cloud Capital mutual funds.
During the fiscal year ended May 31, 2016, the Cloud Capital Strategic All Cap Fund (the “All Cap Fund” or the “Fund”) gained 1.5% during the trailing twelve months, outperforming the Russell 3000® Index, the Fund’s benchmark, by 1.3% and outperforming the Russell 1000® Equal Weight Index by 2.7% and the Russell 2000® Equal Weight Index by 9.8%. As of May 31, 3016, The All Cap Fund total return ranked in the 5th percentile of the Morningstar Mid-Cap Blend peer group average over the trailing year, and in the 13th percentile over the trailing three years (the Morningstar Mid-Cap Blend peer group consists of 432 investments for the trailing year’s calculations, and 405 investments for the trailing three year’s calculations)(a). Risk-adjusted return measures are even higher. The All Cap Fund’s Sortino ratio(b) ranks in the 5th percentile of the peer group for the past year, and in the 3rd percentile over the trailing three years. The Fund’s sector allocation strategy was a strong factor in its strength against the benchmark and peer group over the past year, overweighting the top performer, Utilities, while underweighting the Energy sector, which has been the primary source of negative performance in the market.
The U.S. stock market has climbed modestly over the past year, with greater volatility. Cloud Capital’s sector neutrality and increased diversification relative to its peers left the All Cap Fund well prepared to minimize downside risk during this period. In addition, timely decisions by management to modify the strategy benefited the Fund’s performance.
The All Cap Fund operates with the management fee waived through, at least, September 30, 2016, which should continue to bolster performance going forward.
Although the market appears to be resuming historical cyclical growth, the truth is the aftereffects of continued stimulus that has flowed into the market over the past several years are still unclear. However, we are vigilant for unforeseen consequences as the Federal Reserve slowly starts to implement rate increases, as well as the global marketplace and the effects it will have on the Fund.
Again, we thank our shareholders for their continued confidence in the Fund, and with another fiscal year behind us, we look forward to many more years of serving you.
Sincerely,
Randy Cloud
Cloud Capital LLC, President
Past performance is not a guarantee of future results. Both the Morningstar total return ranking and the Sortino ranking use total return in their calculations. The Fund’s total returns reflect any fee reductions during the applicable periods, which has a material effect on the total return for the periods indicated.
(a) As of June 30, 3016, The All Cap Fund total return ranked in the 4th percentile of the Morningstar Mid-Cap Blend peer group average over the trailing year, and in the 12th percentile over the trailing three years (the Morningstar Mid-Cap Blend peer group consists of 432 investments for the trailing year’s calculations, and 405 investments for the trailing three year’s calculations).
(b) Sortino ratio is a measure of the fund’s total return in relation to its downside deviation; higher Sortino indicates greater return for the amount of downside deviation in the portfolio.
Annual Report
1
| | |
Investment Results – (Unaudited) | | |
| | | | | | | | | | | | |
Average Annual Total Returns (a) (For the periods ended May 31, 2016) | |
| | | | |
| | | One Year | | | Three Year | | | Since Inception
(June 29, 2011) | |
Cloud Capital Strategic All Cap Fund | | | 1.49 | % | | | 9.81 | % | | | 10.33 | % |
Russell 3000® Index (b) | | | 0.22 | % | | | 10.57 | % | | | 12.14 | % |
Russell 1000® Equal Weight Index (b) | | | (1.20 | )% | | | 10.04 | % | | | 11.26 | % |
Russell 2000® Equal Weight Index (b) | | | (8.32 | )% | | | 4.36 | % | | | 6.41 | % |
Total annual operating expenses, as disclosed in the Cloud Capital Strategic All Cap Fund’s (the “Fund”) prospectus dated September 28, 2015, were 1.91% of average daily net assets. (1.41% after fee waivers/expense reimbursements by Cloud Capital LLC (the “Adviser”)). The Adviser has contractually agreed to waive its management fee in its entirety. This waiver is not subject to recoupment and will continue through September 30, 2016. Additionally, the Adviser has contractually agreed to waive or limit its fees and to assume other expenses of the Fund through September 30, 2016, so that Total Annual Fund Operating Expenses do not exceed 1.40%. This operating expense limitation does not apply to brokerage fees and commissions, borrowing costs (such as interest and dividend expenses on securities sold short), taxes, extraordinary expenses, fees and expenses paid under a distribution plan adopted pursuant to Rule 12b-1, and indirect expenses (such as “Acquired Fund Fees and Expenses”). The Adviser was entitled to reimbursement of any fees waived or expenses reimbursed prior to February 1, 2014, pursuant to the agreement provided overall expenses fell below the limitations set forth above. The Adviser recouped amounts as disclosed on the Statement of Operations during the year ended May 31, 2016. This agreement may only be terminated by mutual consent of the Adviser and the Board of Trustees.
The performance quoted represents past performance, which does not guarantee future results. The investment return and principal value of an investment will fluctuate so that an investor’s shares, when redeemed, may be worth more or less than their original cost. The returns shown do not reflect deduction of taxes that a shareholder would pay on Fund distributions or the redemption of Fund shares. The Fund’s investment objectives, risks, charges and expenses must be considered carefully before investing. Current performance may be lower or higher than the performance quoted. Performance data current to the most recent month end may be obtained by calling (877) 670-2227.
| (a) | Average annual total returns reflect any change in price per share and assume the reinvestment of all distributions. The Fund’s returns reflect any fee reductions during the applicable periods. If such fee reductions had not occurred, the quoted performance would have been lower. |
| (b) | Russell 1000® Equal Weight Index, Russell 2000® Equal Weight Index and the Russell 3000® Index are unmanaged indices that assume reinvestment of all distributions and exclude the effect of taxes and fees. These indices are widely recognized unmanaged indices of equity prices and are representative of a broader market and range of securities than are found in the Fund’s portfolio. Individuals cannot invest directly in these indices; however, an individual can invest in exchange-traded funds or other investment vehicles that attempt to track the performance of a benchmark index. |
The Fund’s investment objectives, risks, charges and expenses must be considered carefully before investing. The prospectus contains this and other important information about the investment company and may be obtained by calling (877) 670-2227. Please read it carefully before investing.
The Fund is distributed by Unified Financial Securities, LLC, Member FINRA/SIPC.
Annual Report
2
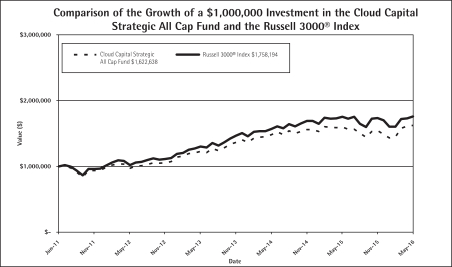
The chart above assumes an initial investment of $1,000,000 made on June 29, 2011 (commencement of Fund operations) and held through May 31, 2016. THE FUND’S RETURNS REPRESENT PAST PERFORMANCE AND DO NOT GUARANTEE FUTURE RESULTS. The returns shown do not reflect deduction of taxes that a shareholder would pay on the Fund’s distributions or the redemption of the Fund’s shares. Investment returns and principal values will fluctuate so that your shares, when redeemed, may be worth more or less than their original purchase price.
Current performance may be lower or higher than the performance data quoted. For more information on the Fund, and to obtain performance data current to the most recent month-end, or to request a prospectus, please call (877) 670-2227. You should carefully consider the investment objectives, potential risks, management fees, and charges and expenses of the Fund before investing. The Fund’s prospectus contains this and other information about the Fund, and should be read carefully before investing.
The Fund is distributed by Unified Financial Securities, LLC, member FINRA/SIPC.
Annual Report
3
| | |
Fund Holdings – (Unaudited) | | |
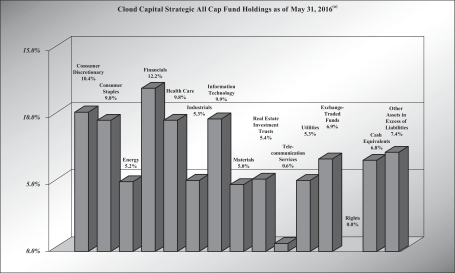
| (a) | As a percent of net assets. |
The investment objective of the Cloud Capital Strategic All Cap Fund is long-term capital appreciation.
Availability of Portfolio Schedule – (Unaudited)
The Fund files its complete schedule of portfolio holdings with the Securities and Exchange Commission (“SEC”) for the first and third quarters of each fiscal year on Form N-Q, which is available on the SEC’s web site at www.sec.gov. The Fund’s Form N-Q may be reviewed and copied at the SEC’s Public Reference Room in Washington, DC. Information on the operation of the Public Reference Room may be obtained by calling 1-800-SEC-0330.
Annual Report
4
| | |
| | |
| Cloud Capital Strategic All Cap Fund | | May 31, 2016 |
| | | | | | | | | | |
| Shares | | | | | Fair Value | | | |
| | | | | | | | | | |
| Common Stocks — 78.9% | | | | | | |
| Consumer Discretionary — 10.4% | | | | | | |
| | 804 | | | Aaron’s, Inc. | | $ | 20,191 | | | |
| | 699 | | | Abercrombie & Fitch Co., Class A | | | 13,896 | | | |
| | 88 | | | Advance Auto Parts, Inc. | | | 13,480 | | | |
| | 25 | | | Amazon.com, Inc. * | | | 18,359 | | | |
| | 263 | | | AMC Networks, Inc., Class A * | | | 16,829 | | | |
| | 1,286 | | | American Eagle Outfitters, Inc. | | | 20,110 | | | |
| | 1 | | | Apollo Education Group, Inc., Class A * | | | 8 | | | |
| | 2,564 | | | Ascena Retail Group, Inc. * | | | 18,510 | | | |
| | 276 | | | AutoNation, Inc. * | | | 13,937 | | | |
| | 18 | | | AutoZone, Inc. * | | | 13,566 | | | |
| | 1 | | | Barnes & Noble, Inc. | | | 6 | | | |
| | 281 | | | Bed Bath & Beyond, Inc. * | | | 12,595 | | | |
| | 447 | | | Best Buy Co., Inc. | | | 14,369 | | | |
| | 465 | | | Big Lots, Inc. | | | 24,345 | | | |
| | (a) | | | Bob Evans Farms, Inc. | | | 17 | | | |
| | 430 | | | BorgWarner, Inc. | | | 14,644 | | | |
| | 370 | | | Brinker International, Inc. | | | 16,649 | | | |
| | 441 | | | Brunswick Corp. | | | 21,113 | | | |
| | 123 | | | Buffalo Wild Wings, Inc. * | | | 17,833 | | | |
| | 431 | | | Cabela’s, Inc., Class A * | | | 20,934 | | | |
| | 41 | | | Cable One, Inc. | | | 19,930 | | | |
| | 387 | | | Cablevision Systems Corp. | | | 13,437 | | | |
| | 594 | | | CalAtlantic Group, Inc. | | | 21,957 | | | |
| | 292 | | | CarMax, Inc. * | | | 15,661 | | | |
| | 301 | | | Carnival Corp. | | | 14,355 | | | |
| | 195 | | | Carter’s, Inc. | | | 19,586 | | | |
| | 285 | | | CBS Corp., Class B | | | 15,712 | | | |
| | 175 | | | CEB, Inc. | | | 11,170 | | | |
| | 32 | | | Charter Communications, Inc., Class A * | | | 7,065 | | | |
| | 366 | | | Cheesecake Factory, Inc./The | | | 18,263 | | | |
| | 1,731 | | | Chico’s FAS, Inc. | | | 18,783 | | | |
| | 28 | | | Chipotle Mexican Grill, Inc. * | | | 12,405 | | | |
| | 638 | | | Cinemark Holdings, Inc. | | | 23,093 | | | |
| | 368 | | | Coach, Inc. | | | 14,507 | | | |
| | 211 | | | Comcast Corp., Class A | | | 13,362 | | | |
| | 131 | | | Cracker Barrel Old Country Store, Inc. | | | 19,891 | | | |
| | 516 | | | CST Brands, Inc. | | | 19,568 | | | |
| | 538 | | | D.R. Horton, Inc. | | | 16,432 | | | |
| | 1,462 | | | Dana Holding Corp. | | | 17,575 | | | |
| | 213 | | | Darden Restaurants, Inc. | | | 14,431 | | | |
| | 458 | | | Deckers Outdoor Corp. * | | | 24,073 | | | |
| | 222 | | | Delphi Automotive PLC | | | 15,090 | | | |
| | 951 | | | DeVry Education Group, Inc. | | | 17,212 | | | |
| | 450 | | | Dick’s Sporting Goods, Inc. | | | 19,303 | | | |
| | 3 | | | Dillard’s, Inc., Class A | | | 177 | | | |
| | | | | | | | | | |
| Shares | | | | | Fair Value | | | |
| | | | | | | | | | |
| Common Stocks — (Continued) | | | | | | |
| Consumer Discretionary — (Continued) | | | | | | |
| | 478 | | | Discovery Communications, Inc., Class A * | | $ | 13,315 | | | |
| | 487 | | | Discovery Communications, Inc., Class C * | | | 13,046 | | | |
| | 180 | | | Dollar General Corp. | | | 16,173 | | | |
| | 165 | | | Dollar Tree, Inc. * | | | 14,972 | | | |
| | 163 | | | Domino’s Pizza, Inc. | | | 19,753 | | | |
| | 777 | | | DreamWorks Animation SKG, Inc., Class A * | | | 31,283 | | | |
| | 413 | | | Dunkin’ Brands Group, Inc. | | | 17,889 | | | |
| | 137 | | | Expedia, Inc. | | | 15,277 | | | |
| | 266 | | | Foot Locker, Inc. | | | 14,899 | | | |
| | 1,105 | | | Ford Motor Co. | | | 14,900 | | | |
| | 501 | | | Fossil Group, Inc. * | | | 13,952 | | | |
| | 451 | | | GameStop Corp., Class A | | | 13,119 | | | |
| | 569 | | | Gannett Co., Inc. | | | 13,063 | | | |
| | 524 | | | Gap, Inc./The | | | 9,427 | | | |
| | 370 | | | Garmin Ltd. | | | 15,744 | | | |
| | 438 | | | General Motors Co. | | | 13,690 | | | |
| | 1,292 | | | Gentex Corp. | | | 21,419 | | | |
| | 148 | | | Genuine Parts Co. | | | 14,339 | | | |
| | 474 | | | Goodyear Tire & Rubber Co./The | | | 13,260 | | | |
| | 36 | | | Graham Holdings Co. | | | 18,046 | | | |
| | 964 | | | Guess?, Inc. | | | 15,206 | | | |
| | 364 | | | H&R Block, Inc. | | | 7,768 | | | |
| | 526 | | | Hanesbrands, Inc. | | | 14,229 | | | |
| | 321 | | | Harley-Davidson, Inc. | | | 14,896 | | | |
| | 186 | | | Harman International Industries, Inc. | | | 14,578 | | | |
| | 169 | | | Hasbro, Inc. | | | 14,756 | | | |
| | 112 | | | Home Depot, Inc./The | | | 14,856 | | | |
| | 406 | | | HSN, Inc. | | | 21,266 | | | |
| | (a) | | | International Game Technology PLC | | | 1 | | | |
| | 523 | | | International Speedway Corp., Class A | | | 17,311 | | | |
| | 617 | | | Interpublic Group of Cos., Inc. | | | 14,744 | | | |
| | 85 | | | Interval Leisure Group, Inc. | | | 1,214 | | | |
| | 2,310 | | | J.C. Penney Co., Inc. * | | | 17,998 | | | |
| | 236 | | | Jack in the Box, Inc. | | | 20,100 | | | |
| | 423 | | | John Wiley & Sons, Inc., Class A | | | 22,812 | | | |
| | 354 | | | Johnson Controls, Inc. | | | 15,635 | | | |
| | 1,054 | | | Kate Spade & Co. * | | | 23,050 | | | |
| | 1,708 | | | KB Home | | | 23,811 | | | |
| | 295 | | | Kohl’s Corp. | | | 10,633 | | | |
| | 158 | | | L Brands, Inc. | | | 10,827 | | | |
| | 310 | | | Leggett & Platt, Inc. | | | 15,575 | | | |
| | 324 | | | Lennar Corp., Class A | | | 14,764 | | | |
See accompanying notes which are an integral part of these financial statements.
Annual Report
5
| | |
| | |
| Cloud Capital Strategic All Cap Fund | | May 31, 2016 |
| | |
| Schedule of Investments (Continued) |
| | | | | | | | | | |
| Shares | | | | | Fair Value | | | |
| | | | | | | | | | |
| Common Stocks — (Continued) | | | | | | |
| Consumer Discretionary — (Continued) | | | | | | |
| | 882 | | | Live Nation Entertainment, Inc. * | | $ | 21,298 | | | |
| | 686 | | | LKQ Corp. * | | | 22,678 | | | |
| | 196 | | | Lowe’s Companies, Inc. | | | 15,736 | | | |
| | 316 | | | Macy’s, Inc. | | | 10,494 | | | |
| | 210 | | | Marriott International, Inc., Class A | | | 13,900 | | | |
| | 390 | | | Mattel, Inc. | | | 12,447 | | | |
| | (a) | | | Matthews International Corp., Class A | | | 12 | | | |
| | 107 | | | McDonald’s Corp. | | | 13,084 | | | |
| | 860 | | | MDC Holdings, Inc. | | | 19,989 | | | |
| | 443 | | | Meredith Corp. | | | 21,919 | | | |
| | 246 | | | Michael Kors Holdings Ltd. * | | | 10,511 | | | |
| | 82 | | | Mohawk Industries, Inc. * | | | 16,086 | | | |
| | 293 | | | Murphy USA, Inc. | | | 19,940 | | | |
| | 148 | | | Netflix, Inc. * | | | 15,148 | | | |
| | 1,377 | | | New York Times Co./The, Class A | | | 16,645 | | | |
| | 664 | | | Newell Rubbermaid, Inc. | | | 31,688 | | | |
| | 1,186 | | | News Corp., Class A | | | 14,187 | | | |
| | 1,104 | | | News Corp., Class B | | | 13,623 | | | |
| | 226 | | | NIKE, Inc., Class B | | | 12,477 | | | |
| | 245 | | | Nordstrom, Inc. | | | 9,294 | | | |
| | 11 | | | NVR, Inc. * | | | 18,993 | | | |
| | 3,457 | | | Office Depot, Inc. * | | | 12,375 | | | |
| | 179 | | | Omnicom Group, Inc. | | | 14,907 | | | |
| | 53 | | | O’Reilly Automotive, Inc. * | | | 13,920 | | | |
| | 91 | | | Panera Bread Co., Class A * | | | 20,032 | | | |
| | 217 | | | Polaris Industries, Inc. | | | 18,461 | | | |
| | 223 | | | Pool Corp. | | | 20,397 | | | |
| | 13 | | | Priceline Group, Inc./The * | | | 16,086 | | | |
| | 793 | | | PulteGroup, Inc. | | | 14,881 | | | |
| | 173 | | | PVH Corp. | | | 16,265 | | | |
| | 146 | | | Ralph Lauren Corp. | | | 13,740 | | | |
| | 1 | | | Regis Corp. * | | | 10 | | | |
| | 1,603 | | | Rent-A-Center, Inc. | | | 21,107 | | | |
| | 232 | | | Ross Stores, Inc. | | | 12,383 | | | |
| | 188 | | | Royal Caribbean Cruises Ltd. | | | 14,548 | | | |
| | (a) | | | Scholastic Corp. | | | 19 | | | |
| | (a) | | | Scientific Games Corp., Class A * | | | 1 | | | |
| | 208 | | | Scripps Networks Interactive, Inc., Class A | | | 13,403 | | | |
| | 770 | | | Service Corp. International | | | 21,111 | | | |
| | 123 | | | Signet Jewelers Ltd. | | | 12,159 | | | |
| | | | | | | | | | |
| Shares | | | | | Fair Value | | | |
| | | | | | | | | | |
| Common Stocks — (Continued) | | | | | | |
| Consumer Discretionary — (Continued) | | | | | | |
| | 635 | | | Skechers U.S.A., Inc., Class A * | | $ | 19,781 | | | |
| | 5,000 | | | Smith & Wesson Holding Corp. * | | | 121,850 | | | |
| | 726 | | | Sotheby’s | | | 21,695 | | | |
| | 1,465 | | | Staples, Inc. | | | 12,888 | | | |
| | 230 | | | Starbucks Corp. | | | 12,645 | | | |
| | 207 | | | Starwood Hotels & Resorts Worldwide, Inc. | | | 15,206 | | | |
| | 1 | | | Strayer Education, Inc. * | | | 25 | | | |
| | 178 | | | Target Corp. | | | 12,234 | | | |
| | 324 | | | Tempur Sealy International, Inc. * | | | 18,885 | | | |
| | 351 | | | Thor Industries, Inc. | | | 22,829 | | | |
| | 198 | | | Tiffany & Co. | | | 12,267 | | | |
| | 184 | | | Time Warner, Inc. | | | 13,930 | | | |
| | 1,203 | | | Time, Inc. | | | 19,095 | | | |
| | 184 | | | TJX Cos., Inc./The | | | 13,983 | | | |
| | 678 | | | Toll Brothers, Inc. * | | | 19,750 | | | |
| | 157 | | | Tractor Supply Co. | | | 15,092 | | | |
| | 1,858 | | | TRI Pointe Group, Inc. * | | | 21,668 | | | |
| | 222 | | | TripAdvisor, Inc. * | | | 15,066 | | | |
| | 351 | | | Tupperware Brands Corp. | | | 19,839 | | | |
| | 509 | | | Twenty-First Century Fox, Inc., Class A | | | 14,702 | | | |
| | 507 | | | Twenty-First Century Fox, Inc., Class B | | | 14,836 | | | |
| | 164 | | | Under Armour, Inc. * | | | 5,745 | | | |
| | 172 | | | Under Armour, Inc., Class A * | | | 6,500 | | | |
| | 523 | | | Urban Outfitters, Inc. * | | | 14,923 | | | |
| | 218 | | | VF Corp. | | | 13,595 | | | |
| | 298 | | | Viacom, Inc., Class B | | | 13,203 | | | |
| | 392 | | | Vista Outdoor, Inc. * | | | 19,647 | | | |
| | 135 | | | Walt Disney Co./The | | | 13,379 | | | |
| | 1,696 | | | Wendy’s Co./The | | | 17,438 | | | |
| | 92 | | | Whirlpool Corp. | | | 16,138 | | | |
| | 328 | | | Williams-Sonoma, Inc. | | | 17,374 | | | |
| | 201 | | | Wyndham Worldwide Corp. | | | 13,559 | | | |
| | 213 | | | Wynn Resorts Ltd. | | | 20,523 | | | |
| | 185 | | | Yum! Brands, Inc. | | | 15,208 | | | |
| | | | | | | | 2,549,477 | | | |
| Consumer Staples — 9.8% | | | | | | |
| | 489 | | | Altria Group, Inc. | | | 31,093 | | | |
| | 879 | | | Archer-Daniels-Midland Co. | | | 37,598 | | | |
| | 19,843 | | | Avon Products, Inc. | | | 77,386 | | | |
| | 355 | | | Boston Beer Co, Inc./The, Class A * | | | 55,176 | | | |
| | 309 | | | Brown-Forman Corp., Class B | | | 30,265 | | | |
See accompanying notes which are an integral part of these financial statements.
Annual Report
6
| | |
| | |
| Cloud Capital Strategic All Cap Fund | | May 31, 2016 |
| | |
| Schedule of Investments (Continued) |
| | | | | | | | | | |
| Shares | | | | | Fair Value | | | |
| | | | | | | | | | |
| Common Stocks — (Continued) | | | | | | |
| Consumer Staples — (Continued) | | | | | | |
| | 522 | | | Campbell Soup Co. | | $ | 31,589 | | | |
| | 586 | | | Casey’s General Stores, Inc. | | | 70,384 | | | |
| | 334 | | | Church & Dwight Co., Inc. | | | 32,915 | | | |
| | 232 | | | Clorox Co./The | | | 29,854 | | | |
| | 689 | | | Coca-Cola Co./The | | | 30,748 | | | |
| | 633 | | | Coca-Cola European Partners PLC | | | 24,562 | | | |
| | 447 | | | Colgate-Palmolive Co. | | | 31,471 | | | |
| | 750 | | | ConAgra Foods, Inc. | | | 34,272 | | | |
| | 216 | | | Constellation Brands, Inc., Class A | | | 33,080 | | | |
| | 199 | | | Costco Wholesale Corp. | | | 29,611 | | | |
| | 325 | | | CVS Health Corp. | | | 31,388 | | | |
| | 3,487 | | | Dean Foods Co. | | | 63,734 | | | |
| | 329 | | | Dr. Pepper Snapple Group, Inc. | | | 30,046 | | | |
| | 889 | | | Edgwell Personal Care Co. | | | 70,632 | | | |
| | 1,792 | | | Energizer Holdings, Inc. | | | 84,795 | | | |
| | 326 | | | Estee Lauder Cos., Inc./The, Class A | | | 29,908 | | | |
| | 3,303 | | | Flowers Foods, Inc. | | | 61,938 | | | |
| | 525 | | | General Mills, Inc. | | | 32,950 | | | |
| | 1,922 | | | Hain Celestial Group, Inc./The * | | | 95,029 | | | |
| | 325 | | | Hershey Co./The | | | 30,155 | | | |
| | 718 | | | Hormel Foods Corp. | | | 24,706 | | | |
| | 646 | | | Ingredion, Inc. | | | 75,881 | | | |
| | 233 | | | JM Smucker Co./The | | | 30,031 | | | |
| | 410 | | | Kellogg Co. | | | 30,486 | | | |
| | 226 | | | Kimberly-Clark Corp. | | | 28,687 | | | |
| | 409 | | | Kraft Heinz Co./The | | | 34,025 | | | |
| | 791 | | | Kroger Co. | | | 28,289 | | | |
| | 668 | | | Lancaster Colony Corp. | | | 81,022 | | | |
| | 332 | | | McCormick & Co., Inc. | | | 32,229 | | | |
| | 428 | | | Mead Johnson Nutrition Co. | | | 35,195 | | | |
| | 347 | | | Molson Coors Brewing Co., Class B | | | 34,439 | | | |
| | 804 | | | Mondelez International, Inc., Class A | | | 35,765 | | | |
| | 247 | | | Monster Beverage Corp. * | | | 37,025 | | | |
| | 300 | | | PepsiCo, Inc. | | | 30,382 | | | |
| | 327 | | | Philip Morris International, Inc. | | | 32,263 | | | |
| | 1,020 | | | Post Holdings, Inc. * | | | 77,560 | | | |
| | 358 | | | Procter & Gamble Co./The | | | 29,010 | | | |
| | 623 | | | Reynolds American, Inc. | | | 30,953 | | | |
| | 15,780 | | | SUPERVALU, Inc. * | | | 73,060 | | | |
| | 679 | | | Sysco Corp. | | | 32,681 | | | |
| | 2,134 | | | Tootsie Roll Industries, Inc. | | | 76,368 | | | |
| | 854 | | | TreeHouse Foods, Inc. * | | | 80,870 | | | |
| | 484 | | | Tyson Foods, Inc., Class A | | | 30,851 | | | |
| | | | | | | | | | |
| Shares | | | | | Fair Value | | | |
| | | | | | | | | | |
| Common Stocks — (Continued) | | | | | | |
| Consumer Staples — (Continued) | | | | | | |
| | 1,890 | | | United Natural Foods, Inc. * | | $ | 70,438 | | | |
| | (a) | | | Universal Corp. | | | 26 | | | |
| | 400 | | | Walgreens Boots Alliance, Inc. | | | 30,984 | | | |
| | 438 | | | Wal-Mart Stores, Inc. | | | 30,998 | | | |
| | 610 | | | WestRock Co. | | | 24,157 | | | |
| | 2,453 | | | WhiteWave Foods Co./The * | | | 109,544 | | | |
| | 995 | | | Whole Foods Market, Inc. | | | 32,175 | | | |
| | | | | | | | 2,410,679 | | | |
| Energy — 5.2% | | | | | | |
| | 321 | | | Anadarko Petroleum Corp. | | | 16,657 | | | |
| | 308 | | | Apache Corp. | | | 17,593 | | | |
| | 297 | | | Baker Hughes, Inc. | | | 13,786 | | | |
| | 622 | | | Cabot Oil & Gas Corp. | | | 14,905 | | | |
| | 23,657 | | | California Resources Corp. | | | 35,958 | | | |
| | 3,220 | | | Chesapeake Energy Corp. * | | | 13,816 | | | |
| | 159 | | | Chevron Corp. | | | 16,035 | | | |
| | 157 | | | Cimarex Energy Co. | | | 18,242 | | | |
| | 708 | | | Columbia Pipeline Group, Inc. | | | 18,077 | | | |
| | 357 | | | ConocoPhillips | | | 15,631 | | | |
| | 1,343 | | | Consol Energy, Inc. | | | 20,633 | | | |
| | 13,235 | | | Denbury Resources, Inc. | | | 53,073 | | | |
| | 631 | | | Devon Energy Corp. | | | 22,788 | | | |
| | 610 | | | Diamond Offshore Drilling, Inc. | | | 15,744 | | | |
| | 499 | | | Dril-Quip, Inc. * | | | 30,440 | | | |
| | 937 | | | Energen Corp. | | | 44,643 | | | |
| | 1,268 | | | Ensco PLC, Class A | | | 12,540 | | | |
| | 201 | | | EOG Resources, Inc. | | | 16,317 | | | |
| | 232 | | | EQT Corp. | | | 16,962 | | | |
| | 170 | | | Exxon Mobil Corp. | | | 15,091 | | | |
| | 525 | | | FMC Technologies, Inc. * | | | 14,284 | | | |
| | 1,116 | | | Gulfport Energy Corp. * | | | 34,307 | | | |
| | 408 | | | Halliburton Co. | | | 17,191 | | | |
| | 235 | | | Helmerich & Payne, Inc. | | | 14,371 | | | |
| | 290 | | | Hess Corp. | | | 17,377 | | | |
| | 804 | | | HollyFrontier Corp. | | | 21,514 | | | |
| | 736 | | | Kinder Morgan, Inc. | | | 13,301 | | | |
| | 1,397 | | | Marathon Oil Corp. | | | 18,255 | | | |
| | 374 | | | Marathon Petroleum Corp. | | | 13,027 | | | |
| | 650 | | | Murphy Oil Corp. | | | 20,105 | | | |
| | 3,402 | | | Nabors Industries Ltd. | | | 31,976 | | | |
| | 441 | | | National Oilwell Varco, Inc. | | | 14,538 | | | |
| | 475 | | | Newfield Exploration Co. * | | | 19,347 | | | |
| | 2,634 | | | Noble Corp. PLC | | | 21,964 | | | |
| | 437 | | | Noble Energy, Inc. | | | 15,612 | | | |
See accompanying notes which are an integral part of these financial statements.
Annual Report
7
| | |
| | |
| Cloud Capital Strategic All Cap Fund | | May 31, 2016 |
| | |
| Schedule of Investments (Continued) |
| | | | | | | | | | |
| Shares | | | | | Fair Value | | | |
| | | | | | | | | | |
| Common Stocks — (Continued) | | | | | | |
| Energy — (Continued) | | | | | | |
| | 199 | | | Occidental Petroleum Corp. | | $ | 14,979 | | | |
| | 969 | | | Oceaneering International, Inc. | | | 32,038 | | | |
| | 985 | | | Oil States International, Inc. * | | | 32,361 | | | |
| | 1,676 | | | Patterson-UTI Energy, Inc. | | | 31,193 | | | |
| | 161 | | | Phillips 66 | | | 12,901 | | | |
| | 108 | | | Pioneer Natural Resources Co. | | | 17,317 | | | |
| | 2,670 | | | QEP Resources, Inc. | | | 49,738 | | | |
| | 451 | | | Range Resources Corp. | | | 19,206 | | | |
| | 1,700 | | | Rowan Cos. PLC | | | 28,783 | | | |
| | 331 | | | Schlumberger Ltd. | | | 25,271 | | | |
| | 2,150 | | | SM Energy Co. | | | 67,776 | | | |
| | 1,887 | | | Southwestern Energy Co. * | | | 25,796 | | | |
| | 465 | | | Spectra Energy Corp. | | | 14,823 | | | |
| | 2,187 | | | Superior Energy Services, Inc. | | | 37,702 | | | |
| | 162 | | | Tesoro Corp. | | | 12,625 | | | |
| | 1,279 | | | Transocean Ltd. | | | 12,520 | | | |
| | 219 | | | Valero Energy Corp. | | | 11,968 | | | |
| | 996 | | | Western Refining, Inc. | | | 21,158 | | | |
| | 797 | | | Williams Cos., Inc./The | | | 17,661 | | | |
| | 584 | | | World Fuel Services Corp. | | | 26,835 | | | |
| | 5,459 | | | WPX Energy, Inc. * | | | 56,173 | | | |
| | | | | | | | 1,284,924 | | | |
| Financials — 12.2% | | | | | | |
| | 169 | | | Affiliated Managers Group, Inc. * | | | 29,277 | | | |
| | 348 | | | Aflac, Inc. | | | 24,205 | | | |
| | 655 | | | Alexander & Baldwin, Inc. | | | 24,681 | | | |
| | 43 | | | Alleghany Corp. * | | | 23,246 | | | |
| | 319 | | | Allstate Corp. | | | 21,514 | | | |
| | 387 | | | American Express Co. | | | 25,429 | | | |
| | 296 | | | American Financial Group, Inc. | | | 21,716 | | | |
| | 386 | | | American International Group, Inc. | | | 22,364 | | | |
| | 253 | | | Ameriprise Financial, Inc. | | | 25,674 | | | |
| | 218 | | | Aon PLC | | | 23,802 | | | |
| | 1 | | | Apollo Investment Corp. (b) | | | 3 | | | |
| | 511 | | | Arthur J Gallagher & Co. | | | 24,679 | | | |
| | 478 | | | Aspen Insurance Holdings Ltd. | | | 22,871 | | | |
| | 1,180 | | | Associated Banc-Corp. | | | 22,046 | | | |
| | 265 | | | Assurant, Inc. | | | 23,158 | | | |
| | 1 | | | Astoria Financial Corp. | | | 13 | | | |
| | 1,002 | | | BancorpSouth, Inc. | | | 23,932 | | | |
| | 1,644 | | | Bank of America Corp. | | | 24,313 | | | |
| | 322 | | | Bank of Hawaii Corp. | | | 23,134 | | | |
| | | | | | | | | | |
| Shares | | | | | Fair Value | | | |
| | | | | | | | | | |
| Common Stocks — (Continued) | | | | | | |
| Financials — (Continued) | | | | | | |
| | 606 | | | Bank of New York Mellon Corp./The | | $ | 25,468 | | | |
| | 482 | | | Bank of the Ozarks, Inc. | | | 18,768 | | | |
| | 648 | | | BB&T Corp. | | | 23,582 | | | |
| | 158 | | | Berkshire Hathaway, Inc., Class B * | | | 22,218 | | | |
| | 69 | | | BlackRock, Inc. | | | 25,103 | | | |
| | 620 | | | Brown & Brown, Inc. | | | 22,343 | | | |
| | 334 | | | Capital One Financial Corp. | | | 24,448 | | | |
| | 729 | | | Cathay General Bancorp | | | 22,474 | | | |
| | 328 | | | CBOE Holdings, Inc. | | | 20,895 | | | |
| | 860 | | | CBRE Group, Inc. * | | | 25,677 | | | |
| | 862 | | | Charles Schwab Corp./The | | | 26,345 | | | |
| | 184 | | | Chubb Ltd. | | | 23,344 | | | |
| | 331 | | | Cincinnati Financial Corp. | | | 22,894 | | | |
| | 530 | | | Citigroup, Inc. | | | 24,702 | | | |
| | 1,061 | | | Citizens Financial Group, Inc. | | | 24,992 | | | |
| | 224 | | | CME Group, Inc. | | | 21,893 | | | |
| | 1,214 | | | CNO Financial Group, Inc. | | | 24,634 | | | |
| | 617 | | | Comerica, Inc. | | | 29,059 | | | |
| | 480 | | | Commerce Bancshares, Inc. | | | 23,506 | | | |
| | 253 | | | Crown Castle International Corp. | | | 22,944 | | | |
| | 416 | | | Cullen/Frost Bankers, Inc. | | | 27,843 | | | |
| | 448 | | | Discover Financial Services | | | 25,434 | | | |
| | 943 | | | E*TRADE Financial Corp. * | | | 26,310 | | | |
| | 668 | | | East West Bancorp, Inc. | | | 25,800 | | | |
| | 712 | | | Eaton Vance Corp. | | | 25,888 | | | |
| | 322 | | | Endurance Specialty Holdings Ltd. | | | 21,864 | | | |
| | 105 | | | Everest Re Group Ltd. | | | 18,856 | | | |
| | 854 | | | Federated Investors, Inc., Class B | | | 27,596 | | | |
| | 1,358 | | | Fifth Third Bancorp | | | 25,622 | | | |
| | 600 | | | First American Financial Corp. | | | 22,952 | | | |
| | 1,652 | | | First Horizon National Corp. | | | 24,056 | | | |
| | 2,148 | | | First Niagara Financial Group, Inc. | | | 23,461 | | | |
| | 1,027 | | | FirstMerit Corp. | | | 23,288 | | | |
| | 1 | | | FNF Group, Class A | | | 24 | | | |
| | 621 | | | Franklin Resources, Inc. | | | 23,213 | | | |
| | 1,587 | | | Fulton Financial Corp. | | | 22,614 | | | |
| | 10,423 | | | Genworth Financial, Inc., Class A * | | | 38,564 | | | |
| | 136 | | | Goldman Sachs Group, Inc./The | | | 21,687 | | | |
| | 1 | | | Greenhill & Co., Inc. | | | 16 | | | |
See accompanying notes which are an integral part of these financial statements.
Annual Report
8
| | |
| | |
| Cloud Capital Strategic All Cap Fund | | May 31, 2016 |
| | |
| Schedule of Investments (Continued) |
| | | | | | | | | | |
| Shares | | | | | Fair Value | | | |
| | | | | | | | | | |
| Common Stocks — (Continued) | | | | | | |
| Financials — (Continued) | | | | | | |
| | 849 | | | Hancock Holding Co. | | $ | 23,336 | | | |
| | 239 | | | Hanover Insurance Group, Inc. | | | 20,699 | | | |
| | 509 | | | Hartford Financial Services Group, Inc./The | | | 23,000 | | | |
| | 85 | | | Intercontinental Exchange Group, Inc. | | | 22,914 | | | |
| | 896 | | | International Bancshares Corp. | | | 25,132 | | | |
| | 789 | | | Invesco Ltd. | | | 24,788 | | | |
| | 1,697 | | | Janus Capital Group, Inc. | | | 25,755 | | | |
| | 186 | | | Jones Lang LaSalle, Inc. | | | 21,932 | | | |
| | 360 | | | JPMorgan Chase & Co. | | | 23,469 | | | |
| | 769 | | | Kemper Corp. | | | 24,834 | | | |
| | 1,923 | | | KeyCorp | | | 24,648 | | | |
| | 767 | | | Legg Mason, Inc. | | | 26,445 | | | |
| | 1,320 | | | Leucadia National Corp. | | | 23,895 | | | |
| | 603 | | | Lincoln National Corp. | | | 27,664 | | | |
| | 559 | | | Loews Corp. | | | 22,632 | | | |
| | 195 | | | M&T Bank Corp. | | | 23,286 | | | |
| | 185 | | | MarketAxess Holdings, Inc. | | | 25,844 | | | |
| | 375 | | | Marsh & McLennan Cos., Inc. | | | 24,780 | | | |
| | 395 | | | Mercury General Corp. | | | 20,740 | | | |
| | 555 | | | MetLife, Inc. | | | 25,259 | | | |
| | 259 | | | Moody’s Corp. | | | 25,566 | | | |
| | 911 | | | Morgan Stanley | | | 24,947 | | | |
| | 309 | | | MSCI, Inc., Class A | | | 24,664 | | | |
| | 343 | | | NASDAQ OMX Group, Inc. | | | 22,623 | | | |
| | 2,290 | | | Navient Corp. | | | 31,399 | | | |
| | 1,284 | | | New York Community Bancorp, Inc. | | | 20,207 | | | |
| | 353 | | | Northern Trust Corp. | | | 26,184 | | | |
| | 1,128 | | | Old Republic International Corp. | | | 21,605 | | | |
| | 603 | | | PacWest Bancorp | | | 25,123 | | | |
| | 1,466 | | | People’s United Financial, Inc. | | | 23,274 | | | |
| | 252 | | | PNC Financial Services Group, Inc. | | | 22,650 | | | |
| | 468 | | | Primerica, Inc. | | | 26,264 | | | |
| | 578 | | | Principal Financial Group, Inc. | | | 25,772 | | | |
| | 692 | | | Progressive Corp./The | | | 23,047 | | | |
| | 483 | | | Prosperity Bancshares, Inc. | | | 26,034 | | | |
| | 323 | | | Prudential Financial, Inc. | | | 25,606 | | | |
| | 464 | | | Raymond James Financial, Inc. | | | 26,011 | | | |
| | 2,710 | | | Regions Financial Corp. | | | 26,639 | | | |
| | 231 | | | Reinsurance Group of America, Inc. | | | 22,951 | | | |
| | | | | | | | | | |
| Shares | | | | | Fair Value | | | |
| | | | | | | | | | |
| Common Stocks — (Continued) | | | | | | |
| Financials — (Continued) | | | | | | |
| | 173 | | | RenaissanceRe Holdings Ltd. | | $ | 19,946 | | | |
| | 898 | | | RMR Group, Inc./The, Class A | | | 26,628 | | | |
| | 1 | | | Royal Bank of Canada | | | 32 | | | |
| | 243 | | | S&P Global, Inc. | | | 27,188 | | | |
| | 561 | | | SEI Investments Co. | | | 28,834 | | | |
| | 149 | | | Signature Bank * | | | 20,133 | | | |
| | 3,340 | | | SLM Corp. * | | | 22,948 | | | |
| | 384 | | | State Street Corp. | | | 24,189 | | | |
| | 640 | | | Stifel Financial Corp. * | | | 24,172 | | | |
| | 623 | | | SunTrust Banks, Inc. | | | 27,304 | | | |
| | 230 | | | SVB Financial Group * | | | 25,336 | | | |
| | 824 | | | Synchrony Financial * | | | 25,703 | | | |
| | 176 | | | SYNNEX Corp. | | | 16,065 | | | |
| | 714 | | | Synovus Financial Corp. | | | 22,967 | | | |
| | 312 | | | T. Rowe Price Group, Inc. | | | 24,055 | | | |
| | 1,792 | | | TCF Financial Corp. | | | 25,756 | | | |
| | 400 | | | Torchmark Corp. | | | 24,683 | | | |
| | 195 | | | Travelers Cos., Inc./The | | | 22,294 | | | |
| | 916 | | | Trustmark Corp. | | | 22,697 | | | |
| | 521 | | | U.S. Bancorp | | | 22,310 | | | |
| | 1,338 | | | Umpqua Holdings Corp. | | | 21,397 | | | |
| | 776 | | | Unum Group | | | 28,666 | | | |
| | 2,239 | | | Valley National Bancorp | | | 21,339 | | | |
| | 384 | | | W.R. Berkley Corp. | | | 21,919 | | | |
| | 954 | | | Waddell & Reed Financial, Inc., Class A | | | 20,395 | | | |
| | 953 | | | Washington Federal, Inc. | | | 23,828 | | | |
| | 593 | | | Webster Financial Corp. | | | 23,213 | | | |
| | 445 | | | Wells Fargo & Co. | | | 22,559 | | | |
| | 1 | | | Westamerica Bancorp | | | 29 | | | |
| | 183 | | | Willis Towers Watson PLC | | | 23,433 | | | |
| | 1,925 | | | WisdomTree Investments, Inc. | | | 23,875 | | | |
| | 590 | | | XL Group PLC | | | 20,276 | | | |
| | 980 | | | Zions Bancorp | | | 27,455 | | | |
| | | | | | | | 2,989,676 | | | |
| Health Care — 9.8% | | | | | | |
| | 510 | | | Abbott Laboratories | | | 20,209 | | | |
| | 361 | | | AbbVie, Inc. | | | 22,686 | | | |
| | 199 | | | Aetna, Inc. | | | 22,572 | | | |
| | 542 | | | Agilent Technologies, Inc. | | | 24,851 | | | |
| | 1,408 | | | Akorn, Inc. * | | | 42,081 | | | |
| | 135 | | | Alexion Pharmaceuticals, Inc. * | | | 20,412 | | | |
| | 578 | | | Align Technology, Inc. * | | | 45,542 | | | |
| | 70 | | | Allergan PLC * | | | 16,584 | | | |
| | 2,770 | | | Allscripts Healthcare Solutions, Inc. * | | | 37,363 | | | |
| | 227 | | | AmerisourceBergen Corp. | | | 17,024 | | | |
| | 132 | | | Amgen, Inc. | | | 20,829 | | | |
| | 552 | | | AmSurg Corp. * | | | 41,264 | | | |
See accompanying notes which are an integral part of these financial statements.
Annual Report
9
| | |
| | |
| Cloud Capital Strategic All Cap Fund | | May 31, 2016 |
| | |
| Schedule of Investments (Continued) |
| | | | | | | | | | |
| Shares | | | | | Fair Value | | | |
| | | | | | | | | | |
| Common Stocks — (Continued) | | | | | | |
| Health Care — (Continued) | | | | | | |
| | 160 | | | Anthem, Inc. | | $ | 21,174 | | | |
| | 517 | | | Baxalta, Inc. | | | 23,383 | | | |
| | 522 | | | Baxter International, Inc. | | | 22,511 | | | |
| | 142 | | | Becton Dickinson and Co. | | | 23,560 | | | |
| | 75 | | | Biogen, Inc. * | | | 21,645 | | | |
| | 273 | | | Bio-Rad Laboratories, Inc., Class A * | | | 40,614 | | | |
| | 403 | | | Bio-Techne Corp. | | | 44,243 | | | |
| | 1,165 | | | Boston Scientific Corp. * | | | 26,468 | | | |
| | 310 | | | Bristol-Myers Squibb Co. | | | 22,237 | | | |
| | 104 | | | C.R. Bard, Inc. | | | 22,851 | | | |
| | 246 | | | Cardinal Health, Inc. | | | 19,459 | | | |
| | 1,598 | | | Catalent, Inc. * | | | 44,933 | | | |
| | 189 | | | Celgene Corp. | | | 19,952 | | | |
| | 979 | | | Centene Corp. * | | | 61,031 | | | |
| | 345 | | | Cerner Corp. * | | | 19,192 | | | |
| | 507 | | | Charles River Laboratories International, Inc. * | | | 43,577 | | | |
| | 150 | | | Cigna Corp. | | | 19,268 | | | |
| | 1,830 | | | Community Health Systems, Inc. * | | | 24,599 | | | |
| | 271 | | | Cooper Cos., Inc./The | | | 44,134 | | | |
| | 302 | | | DaVita HealthCare Partners, Inc. * | | | 23,320 | | | |
| | 924 | | | Dentsply Sirona, Inc. | | | 57,413 | | | |
| | 244 | | | Edwards LifeSciences Corp. * | | | 24,002 | | | |
| | 256 | | | Eli Lilly & Co. | | | 19,229 | | | |
| | 374 | | | Endo International PLC * | | | 5,911 | | | |
| | 281 | | | Express Scripts Holding Co. * | | | 21,199 | | | |
| | 221 | | | Gilead Sciences, Inc. | | | 19,248 | | | |
| | 1,385 | | | Halyard Health, Inc. * | | | 43,062 | | | |
| | 283 | | | HCA Holdings, Inc. * | | | 22,065 | | | |
| | 129 | | | Henry Schein, Inc. * | | | 22,362 | | | |
| | 776 | | | Hill-Rom Holdings, Inc. | | | 38,136 | | | |
| | (a) | | | HMS Holdings Corp. * | | | 4 | | | |
| | 1,038 | | | Hologic, Inc. | | | 35,724 | | | |
| | 120 | | | Humana, Inc. | | | 20,687 | | | |
| | 488 | | | IDEXX Laboratories, Inc. * | | | 42,733 | | | |
| | 139 | | | Illumina, Inc. * | | | 20,182 | | | |
| | 37 | | | Intuitive Surgical, Inc. * | | | 23,541 | | | |
| | 186 | | | Johnson & Johnson | | | 20,914 | | | |
| | 187 | | | Laboratory Corp. of America Holdings * | | | 23,866 | | | |
| | 512 | | | LifePoint Health, Inc. * | | | 33,968 | | | |
| | 616 | | | LivaNova PLC * | | | 30,057 | | | |
| | 289 | | | Mallinckrodt PLC * | | | 18,312 | | | |
| | 1 | | | Masimo Corp. * | | | 45 | | | |
| | 124 | | | McKesson Corp. | | | 22,778 | | | |
| | 524 | | | Mednax, Inc. * | | | 35,836 | | | |
| | 261 | | | Medtronic PLC | | | 21,036 | | | |
| | | | | | | | | | |
| Shares | | | | | Fair Value | | | |
| | | | | | | | | | |
| Common Stocks — (Continued) | | | | | | |
| Health Care — (Continued) | | | | | | |
| | 389 | | | Merck & Co., Inc. | | $ | 21,861 | | | |
| | 114 | | | Mettler-Toledo International, Inc. * | | | 42,639 | | | |
| | 664 | | | Molina Healthcare, Inc. * | | | 32,148 | | | |
| | 372 | | | Mylan NV * | | | 16,135 | | | |
| | 991 | | | Owens & Minor, Inc. | | | 36,947 | | | |
| | 590 | | | PAREXEL International Corp. * | | | 37,080 | | | |
| | 463 | | | Patterson Companies, Inc. | | | 22,610 | | | |
| | 456 | | | PerkinElmer, Inc. | | | 24,942 | | | |
| | 136 | | | Perrigo Co. PLC (Ireland) | | | 13,080 | | | |
| | 666 | | | Pfizer, Inc. | | | 23,125 | | | |
| | 312 | | | Quest Diagnostics, Inc. | | | 24,114 | | | |
| | 464 | | | Quorum Health Corp. * | | | 6,150 | | | |
| | 48 | | | Regeneron Pharmaceuticals, Inc. * | | | 19,202 | | | |
| | 598 | | | ResMed, Inc. | | | 35,330 | | | |
| | 377 | | | St. Jude Medical, Inc. | | | 29,508 | | | |
| | 520 | | | STERIS PLC | | | 36,072 | | | |
| | 196 | | | Stryker Corp. | | | 21,836 | | | |
| | 255 | | | Teleflex, Inc. | | | 41,093 | | | |
| | 781 | | | Tenet Healthcare Corp. * | | | 22,596 | | | |
| | 155 | | | Thermo Fisher Scientific, Inc. | | | 23,466 | | | |
| | 293 | | | United Therapeutics Corp. * | | | 34,891 | | | |
| | 172 | | | UnitedHealth Group, Inc. | | | 23,021 | | | |
| | 181 | | | Universal Health Services, Inc., Class B | | | 24,397 | | | |
| | 254 | | | Varian Medical Systems, Inc. * | | | 21,021 | | | |
| | 733 | | | VCA, Inc. * | | | 47,625 | | | |
| | 241 | | | Vertex Pharmaceuticals, Inc. * | | | 22,415 | | | |
| | 166 | | | Waters Corp. * | | | 22,811 | | | |
| | 474 | | | WellCare Health Plans, Inc. * | | | 48,103 | | | |
| | 622 | | | West Pharmaceutical Services, Inc. | | | 46,673 | | | |
| | 205 | | | Zimmer Holdings, Inc. | | | 25,032 | | | |
| | 469 | | | Zoetis, Inc. | | | 22,254 | | | |
| | | | | | | | 2,410,055 | | | |
| Industrials — 5.3% | | | | | | |
| | 57 | | | 3M Co. | | | 9,525 | | | |
| | 145 | | | A.O. Smith Corp. | | | 11,956 | | | |
| | 51 | | | Acuity Brands, Inc. | | | 13,319 | | | |
| | 375 | | | AECOM * | | | 12,056 | | | |
| | 195 | | | AGCO Corp. | | | 10,126 | | | |
| | 145 | | | Alaska Air Group, Inc. | | | 9,657 | | | |
| | 161 | | | Allegion PLC | | | 10,908 | | | |
| | 239 | | | American Airlines Group, Inc. | | | 7,632 | | | |
| | 194 | | | AMETEK, Inc. | | | 9,283 | | | |
See accompanying notes which are an integral part of these financial statements.
Annual Report
10
| | |
| | |
| Cloud Capital Strategic All Cap Fund | | May 31, 2016 |
| | |
| Schedule of Investments (Continued) |
| | | | | | | | | | |
| Shares | | | | | Fair Value | | | |
| | | | | | | | | | |
| Common Stocks — (Continued) | | | | | | |
| Industrials — (Continued) | | | | | | |
| | 216 | | | B/E Aerospace, Inc. | | $ | 10,312 | | | |
| | 73 | | | Boeing Co./The | | | 9,212 | | | |
| | 1 | | | Brink’s Co./The | | | 15 | | | |
| | 105 | | | Carlisle Cos., Inc. | | | 10,936 | | | |
| | 138 | | | Caterpillar, Inc. | | | 10,021 | | | |
| | 125 | | | CH Robinson Worldwide, Inc. | | | 9,402 | | | |
| | 104 | | | Cintas Corp. | | | 9,893 | | | |
| | 195 | | | CLARCOR, Inc. | | | 11,581 | | | |
| | 209 | | | Clean Harbors, Inc. * | | | 10,740 | | | |
| | 271 | | | Copart, Inc. * | | | 13,431 | | | |
| | 190 | | | Crane Co. | | | 10,910 | | | |
| | 379 | | | CSX Corp. | | | 10,027 | | | |
| | 89 | | | Cummins, Inc. | | | 10,189 | | | |
| | 140 | | | Curtiss-Wright Corp. | | | 11,654 | | | |
| | 103 | | | Danaher Corp. | | | 10,141 | | | |
| | 113 | | | Deere & Co. | | | 9,274 | | | |
| | 213 | | | Delta Air Lines, Inc. | | | 9,238 | | | |
| | 177 | | | Deluxe Corp. | | | 11,537 | | | |
| | 307 | | | Donaldson Co., Inc. | | | 10,299 | | | |
| | 146 | | | Dover Corp. | | | 9,742 | | | |
| | 99 | | | Dun & Bradstreet Corp./The | | | 12,548 | | | |
| | 161 | | | Eaton Corp. PLC | | | 9,918 | | | |
| | 186 | | | Emerson Electric Co. | | | 9,682 | | | |
| | 93 | | | Equifax, Inc. | | | 11,657 | | | |
| | 175 | | | Esterline Technologies Corp. * | | | 11,814 | | | |
| | 187 | | | Expeditors International of Washington, Inc. | | | 9,076 | | | |
| | 200 | | | Fastenal Co. | | | 9,217 | | | |
| | 66 | | | FedEx Corp. | | | 10,899 | | | |
| | 214 | | | Flowserve Corp. | | | 10,318 | | | |
| | 202 | | | Fluor Corp. | | | 10,676 | | | |
| | 202 | | | Fortune Brands Home & Security, Inc. | | | 11,846 | | | |
| | 269 | | | FTI Consulting, Inc. * | | | 11,267 | | | |
| | 219 | | | GATX Corp. | | | 10,053 | | | |
| | 1 | | | General Cable Corp. | | | 10 | | | |
| | 66 | | | General Dynamics Corp. | | | 9,313 | | | |
| | 308 | | | General Electric Co. | | | 9,324 | | | |
| | 172 | | | Genesee & Wyoming, Inc., Class A * | | | 10,349 | | | |
| | 128 | | | Graco, Inc. | | | 10,240 | | | |
| | 248 | | | Granite Construction, Inc. | | | 10,663 | | | |
| | (a) | | | Harsco Corp. | | | 2 | | | |
| | 388 | | | Herman Miller, Inc. | | | 12,295 | | | |
| | 291 | | | HNI Corp. | | | 13,399 | | | |
| | 86 | | | Honeywell International, Inc. | | | 9,789 | | | |
| | 103 | | | Hubbell, Inc., Class B | | | 10,934 | | | |
| | 73 | | | Huntington Ingalls Industries, Inc. | | | 11,263 | | | |
| | 127 | | | IDEX Corp. | | | 10,612 | | | |
| | | | | | | | | | |
| Shares | | | | | Fair Value | | | |
| | | | | | | | | | |
| Common Stocks — (Continued) | | | | | | |
| Industrials — (Continued) | | | | | | |
| | 96 | | | Illinois Tool Works, Inc. | | $ | 10,222 | | | |
| | 176 | | | Ingersoll-Rand PLC | | | 11,771 | | | |
| | 285 | | | ITT, Inc. | | | 10,117 | | | |
| | 243 | | | Jacobs Engineering Group, Inc. * | | | 12,312 | | | |
| | 116 | | | JB Hunt Transport Services, Inc. | | | 9,621 | | | |
| | 830 | | | Joy Global, Inc. | | | 14,139 | | | |
| | 113 | | | Kansas City Southern | | | 10,504 | | | |
| | 751 | | | KBR, Inc. | | | 10,931 | | | |
| | 518 | | | Kennametal, Inc. | | | 12,668 | | | |
| | 177 | | | Kirby Corp. * | | | 12,422 | | | |
| | 329 | | | KLX, Inc. * | | | 10,830 | | | |
| | 74 | | | L-3 Communications Holdings, Inc. | | | 10,182 | | | |
| | 152 | | | Landstar System, Inc. | | | 10,317 | | | |
| | 80 | | | Lennox International, Inc. | | | 11,009 | | | |
| | 166 | | | Lincoln Electric Holdings, Inc. | | | 9,979 | | | |
| | 41 | | | Lockheed Martin Corp. | | | 9,619 | | | |
| | 127 | | | ManpowerGroup | | | 10,130 | | | |
| | 371 | | | Masco Corp. | | | 12,109 | | | |
| | (a) | | | Matson, Inc. | | | 5 | | | |
| | 225 | | | MSA Safety, Inc. | | | 11,308 | | | |
| | 140 | | | MSC Industrial Direct Co., Inc., Class A | | | 10,501 | | | |
| | 158 | | | Nordson Corp. | | | 13,711 | | | |
| | 124 | | | Norfolk Southern Corp. | | | 10,405 | | | |
| | 47 | | | Northrop Grumman Corp. | | | 9,947 | | | |
| | 666 | | | NOW, Inc. * | | | 11,548 | | | |
| | 153 | | | Old Dominion Freight Line, Inc. * | | | 9,837 | | | |
| | 109 | | | Orbital ATK, Inc. | | | 9,480 | | | |
| | 291 | | | Oshkosh Corp. | | | 13,363 | | | |
| | 174 | | | PACCAR, Inc. | | | 9,727 | | | |
| | 86 | | | Parker-Hannifin Corp. | | | 9,892 | | | |
| | 192 | | | Pentair PLC | | | 11,560 | | | |
| | 520 | | | Pitney Bowes, Inc. | | | 9,690 | | | |
| | 491 | | | Quanta Services, Inc. * | | | 11,789 | | | |
| | 706 | | | R.R. Donnelley & Sons Co. | | | 11,495 | | | |
| | 69 | | | Raytheon Co. | | | 8,986 | | | |
| | 169 | | | Regal-Beloit Corp. | | | 9,664 | | | |
| | 200 | | | Republic Services, Inc. | | | 9,680 | | | |
| | 223 | | | Robert Half International, Inc. | | | 9,278 | | | |
| | 89 | | | Rockwell Automation, Inc. | | | 10,384 | | | |
| | 107 | | | Rockwell Collins, Inc. | | | 9,454 | | | |
| | 360 | | | Rollins, Inc. | | | 10,232 | | | |
| | 53 | | | Roper Technologies, Inc. | | | 9,151 | | | |
| | 156 | | | Ryder System, Inc. | | | 10,845 | | | |
| | 64 | | | Snap-on, Inc. | | | 10,402 | | | |
| | 250 | | | Southwest Airlines Co. | | | 10,636 | | | |
| | 1 | | | SPX Corp. | | | 11 | | | |
| | 1 | | | SPX FLOW, Inc. * | | | 20 | | | |
See accompanying notes which are an integral part of these financial statements.
Annual Report
11
| | |
| | |
| Cloud Capital Strategic All Cap Fund | | May 31, 2016 |
| | |
| Schedule of Investments (Continued) |
| | | | | | | | | | |
| Shares | | | | | Fair Value | | | |
| | | | | | | | | | |
| Common Stocks — (Continued) | | | | | | |
| Industrials — (Continued) | | | | | | |
| | 96 | | | Stanley Black & Decker, Inc. | | $ | 10,914 | | | |
| | 82 | | | Stericycle, Inc. * | | | 7,996 | | | |
| | 117 | | | Teledyne Technologies, Inc. * | | | 11,481 | | | |
| | 441 | | | Terex Corp. | | | 9,330 | | | |
| | 266 | | | Textron, Inc. | | | 10,136 | | | |
| | 317 | | | Timken Co./The | | | 10,532 | | | |
| | 122 | | | Toro Co./The | | | 10,898 | | | |
| | 430 | | | Trinity Industries, Inc. | | | 7,758 | | | |
| | 359 | | | Triumph Group, Inc. | | | 13,534 | | | |
| | 252 | | | Tyco International PLC | | | 10,754 | | | |
| | 115 | | | Union Pacific Corp. | | | 9,664 | | | |
| | 189 | | | United Continental Holdings, Inc. * | | | 8,523 | | | |
| | 90 | | | United Parcel Service, Inc., Class B | | | 9,245 | | | |
| | 186 | | | United Rentals, Inc. * | | | 12,946 | | | |
| | 101 | | | United Technologies Corp. | | | 10,127 | | | |
| | 85 | | | Valmont Industries, Inc. | | | 11,742 | | | |
| | 130 | | | Verisk Analytics, Inc. * | | | 10,302 | | | |
| | 41 | | | W.W. Grainger, Inc. | | | 9,379 | | | |
| | 148 | | | Wabtec Corp. | | | 11,454 | | | |
| | 170 | | | Waste Connections, Inc. | | | 11,106 | | | |
| | 166 | | | Waste Management, Inc. | | | 10,088 | | | |
| | 83 | | | Watsco, Inc. | | | 11,087 | | | |
| | 355 | | | Werner Enterprises, Inc. | | | 8,826 | | | |
| | 206 | | | Woodward, Inc. | | | 11,738 | | | |
| | 599 | | | Worthington Industries, Inc. | | | 22,385 | | | |
| | 240 | | | Xylem, Inc. | | | 10,734 | | | |
| | | | | | | | 1,304,742 | | | |
| Information Technology — 9.9% | | | | | | |
| | 1,744 | | | 3D Systems Corp. | | | 23,350 | | | |
| | 146 | | | Accenture PLC, Class A | | | 17,392 | | | |
| | 916 | | | ACI Worldwide, Inc. * | | | 18,927 | | | |
| | 486 | | | Activision Blizzard, Inc. | | | 19,074 | | | |
| | 754 | | | Acxiom Corp. * | | | 15,967 | | | |
| | 184 | | | Adobe Systems, Inc. * | | | 18,280 | | | |
| | 1 | | | ADTRAN, Inc. | | | 17 | | | |
| | 7,715 | | | Advanced Micro Devices, Inc. * | | | 35,256 | | | |
| | 334 | | | Akamai Technologies, Inc. * | | | 18,242 | | | |
| | 75 | | | Alliance Data Systems Corp. * | | | 16,585 | | | |
| | 19 | | | Alphabet, Inc., Class A * | | | 14,595 | | | |
| | 20 | | | Alphabet, Inc., Class C * | | | 14,906 | | | |
| | 282 | | | Amphenol Corp., Class A | | | 16,562 | | | |
| | 281 | | | Analog Devices, Inc. | | | 16,462 | | | |
| | 181 | | | ANSYS, Inc. * | | | 16,158 | | | |
| | 146 | | | Apple, Inc. | | | 14,564 | | | |
| | 851 | | | Applied Materials, Inc. | | | 20,779 | | | |
| | | | | | | | | | |
| Shares | | | | | Fair Value | | | |
| | | | | | | | | | |
| Common Stocks — (Continued) | | | | | | |
| Information Technology — (Continued) | | | | | | |
| | 648 | | | ARRIS International PLC * | | $ | 15,622 | | | |
| | 273 | | | Arrow Electronics, Inc. * | | | 17,638 | | | |
| | 317 | | | Autodesk, Inc. * | | | 18,465 | | | |
| | 170 | | | Automatic Data Processing, Inc. | | | 14,959 | | | |
| | 381 | | | Avnet, Inc. | | | 15,628 | | | |
| | 401 | | | Belden, Inc. | | | 25,962 | | | |
| | 113 | | | Broadcom Ltd. | | | 17,480 | | | |
| | 287 | | | Broadridge Financial Solutions, Inc. | | | 18,408 | | | |
| | 506 | | | CA, Inc. | | | 16,339 | | | |
| | 760 | | | Cadence Design Systems, Inc. * | | | 18,790 | | | |
| | 342 | | | CDK Global, Inc. | | | 18,917 | | | |
| | 841 | | | Ciena Corp. * | | | 14,686 | | | |
| | 605 | | | Cisco Systems, Inc. | | | 17,574 | | | |
| | 218 | | | Citrix Systems, Inc. * | | | 18,502 | | | |
| | 494 | | | Cognex Corp. | | | 21,275 | | | |
| | 255 | | | Cognizant Technology Solutions Corp., Class A * | | | 15,664 | | | |
| | 406 | | | CommVault Systems, Inc. * | | | 18,370 | | | |
| | 487 | | | Computer Sciences Corp. | | | 23,945 | | | |
| | 431 | | | comScore, Inc. * | | | 13,951 | | | |
| | 619 | | | Convergys Corp. | | | 17,450 | | | |
| | 462 | | | CoreLogic, Inc. * | | | 17,208 | | | |
| | 771 | | | Corning, Inc. | | | 16,105 | | | |
| | 515 | | | Cree, Inc. * | | | 12,409 | | | |
| | 590 | | | CSRA, Inc. | | | 14,616 | | | |
| | 2,218 | | | Cypress Semiconductor Corp. | | | 23,577 | | | |
| | 577 | | | Diebold, Inc. | | | 14,907 | | | |
| | 147 | | | DST Systems, Inc. | | | 17,785 | | | |
| | 611 | | | eBay, Inc. * | | | 14,938 | | | |
| | 244 | | | Electronic Arts, Inc. * | | | 18,717 | | | |
| | 572 | | | EMC Corp. | | | 15,978 | | | |
| | 76 | | | Equinix, Inc. | | | 27,453 | | | |
| | 156 | | | F5 Networks, Inc. * | | | 17,163 | | | |
| | 138 | | | Facebook, Inc., Class A * | | | 16,350 | | | |
| | 140 | | | FactSet Research Systems, Inc. | | | 22,220 | | | |
| | 161 | | | Fair Isaac Corp. | | | 17,905 | | | |
| | 728 | | | Fairchild Semiconductor International, Inc. * | | | 14,475 | | | |
| | 214 | | | FEI Co. | | | 22,996 | | | |
| | 246 | | | Fidelity National Information Services, Inc. | | | 18,294 | | | |
| | 215 | | | First Solar, Inc. * | | | 10,673 | | | |
| | 150 | | | Fiserv, Inc. * | | | 15,809 | | | |
| | 498 | | | FLIR Systems, Inc. | | | 15,514 | | | |
| | 615 | | | Fortinet, Inc. * | | | 21,044 | | | |
| | 186 | | | Gartner, Inc. * | | | 18,911 | | | |
See accompanying notes which are an integral part of these financial statements.
Annual Report
12
| | |
| | |
| Cloud Capital Strategic All Cap Fund | | May 31, 2016 |
| | |
| Schedule of Investments (Continued) |
| | | | | | | | | | |
| Shares | | | | | Fair Value | | | |
| | | | | | | | | | |
| Common Stocks — (Continued) | | | | | | |
| Information Technology — (Continued) | | | | | | |
| | 283 | | | Global Payments, Inc. | | $ | 21,956 | | | |
| | 189 | | | Harris Corp. | | | 14,878 | | | |
| | 1,109 | | | Hewlett Packard Enterprise Co. | | | 20,479 | | | |
| | 1,497 | | | HP, Inc. | | | 20,027 | | | |
| | 543 | | | Ingram Micro, Inc., Class A | | | 18,794 | | | |
| | 838 | | | Integrated Device Technology, Inc. * | | | 19,558 | | | |
| | 486 | | | Intel Corp. | | | 15,351 | | | |
| | 351 | | | InterDigital, Inc. | | | 20,438 | | | |
| | 110 | | | International Business Machines Corp. | | | 16,907 | | | |
| | 1,260 | | | Intersil Corp., Class A | | | 17,041 | | | |
| | 153 | | | Intuit, Inc. | | | 16,281 | | | |
| | 183 | | | IPG Photonics Corp. * | | | 15,807 | | | |
| | (a) | | | Itron, Inc. * | | | 3 | | | |
| | 230 | | | j2 Global, Inc. | | | 15,371 | | | |
| | 763 | | | Jabil Circuit, Inc. | | | 14,561 | | | |
| | 195 | | | Jack Henry & Associates, Inc. | | | 16,466 | | | |
| | 631 | | | Juniper Networks, Inc. | | | 14,762 | | | |
| | 683 | | | Keysight Technologies, Inc. * | | | 20,910 | | | |
| | 217 | | | KLA-Tencor Corp. | | | 15,855 | | | |
| | 1,242 | | | Knowles Corp. * | | | 18,159 | | | |
| | 211 | | | Lam Research Corp. | | | 17,459 | | | |
| | 359 | | | Leidos Holdings, Inc. | | | 17,714 | | | |
| | 571 | | | Lexmark International, Inc., Class A | | | 21,611 | | | |
| | 343 | | | Linear Technology Corp. | | | 16,240 | | | |
| | 324 | | | Manhattan Associates, Inc. * | | | 21,365 | | | |
| | 1 | | | ManTech International Corp., Class A | | | 34 | | | |
| | 172 | | | MasterCard, Inc., Class A | | | 16,537 | | | |
| | 323 | | | MAXIMUS, Inc. | | | 18,594 | | | |
| | 899 | | | Mentor Graphics Corp. | | | 19,273 | | | |
| | 382 | | | Microchip Technology, Inc. | | | 19,764 | | | |
| | 1,357 | | | Micron Technology, Inc. * | | | 17,260 | | | |
| | 483 | | | Microsemi Corp. * | | | 16,343 | | | |
| | 283 | | | Microsoft Corp. | | | 14,988 | | | |
| | (a) | | | Monster Worldwide, Inc. * | | | 1 | | | |
| | 224 | | | Motorola Solutions, Inc. | | | 15,490 | | | |
| | 543 | | | National Instruments Corp. | | | 15,524 | | | |
| | 749 | | | NCR Corp. * | | | 23,124 | | | |
| | 623 | | | NetApp, Inc. | | | 15,902 | | | |
| | 780 | | | NetScout Systems, Inc. * | | | 18,923 | | | |
| | 675 | | | NeuStar, Inc., Class A * | | | 15,893 | | | |
| | 195 | | | Nielsen Holdings PLC | | | 10,415 | | | |
| | 551 | | | NVIDIA Corp. | | | 25,736 | | | |
| | 391 | | | Oracle Corp. | | | 15,725 | | | |
| | 301 | | | Paychex, Inc. | | | 16,338 | | | |
| | 411 | | | PayPal Holdings, Inc. * | | | 15,541 | | | |
| | 431 | | | Plantronics, Inc. | | | 19,200 | | | |
| | | | | | | | | | |
| Shares | | | | | Fair Value | | | |
| | | | | | | | | | |
| Common Stocks — (Continued) | | | | | | |
| Information Technology — (Continued) | | | | | | |
| | 1,630 | | | Polycom, Inc. * | | $ | 19,557 | | | |
| | 538 | | | PTC, Inc. * | | | 19,228 | | | |
| | 500 | | | Q2 Holdings, Inc. * | | | 12,490 | | | |
| | 380 | | | Qorvo, Inc. * | | | 19,343 | | | |
| | 319 | | | QUALCOMM, Inc. | | | 17,541 | | | |
| | 805 | | | Rackspace Hosting, Inc. * | | | 20,123 | | | |
| | 227 | | | Red Hat, Inc. * | | | 17,596 | | | |
| | (a) | | | Rovi Corp. * | | | 6 | | | |
| | 256 | | | Salesforce.com, Inc. * | | | 21,447 | | | |
| | 369 | | | Science Applications International Corp. | | | 20,145 | | | |
| | 478 | | | Seagate Technology PLC | | | 10,787 | | | |
| | 1 | | | Semtech Corp. * | | | 21 | | | |
| | 378 | | | Silicon Laboratories, Inc. * | | | 18,794 | | | |
| | 184 | | | Skyworks Solutions, Inc. | | | 12,306 | | | |
| | 5,152 | | | SunEdison, Inc. * | | | 800 | | | |
| | 876 | | | Symantec Corp. | | | 15,207 | | | |
| | 212 | | | Synaptics, Inc. * | | | 14,407 | | | |
| | 360 | | | Synopsys, Inc. * | | | 18,601 | | | |
| | 266 | | | TE Connectivity Ltd. | | | 15,932 | | | |
| | 233 | | | Tech Data Corp. * | | | 17,634 | | | |
| | 598 | | | Teradata Corp. * | | | 16,937 | | | |
| | 832 | | | Teradyne, Inc. | | | 16,481 | | | |
| | 276 | | | Texas Instruments, Inc. | | | 16,698 | | | |
| | 362 | | | Total System Services, Inc. | | | 19,414 | | | |
| | 783 | | | Trimble Navigation Ltd. * | | | 20,017 | | | |
| | 112 | | | Tyler Technologies, Inc. * | | | 17,167 | | | |
| | 86 | | | Ultimate Software Group, Inc./The * | | | 17,532 | | | |
| | 686 | | | VeriFone Systems, Inc. * | | | 18,117 | | | |
| | 192 | | | VeriSign, Inc. * | | | 16,447 | | | |
| | 205 | | | Visa, Inc., Class A | | | 16,183 | | | |
| | 1,406 | | | Vishay Intertechnology, Inc. | | | 18,225 | | | |
| | 383 | | | Western Digital Corp. | | | 17,809 | | | |
| | 803 | | | Western Union Co./The | | | 15,609 | | | |
| | 247 | | | WEX, Inc. * | | | 22,808 | | | |
| | 1,544 | | | Xerox Corp. | | | 15,394 | | | |
| | 294 | | | Xilinx, Inc. | | | 13,956 | | | |
| | 512 | | | Yahoo!, Inc. * | | | 19,428 | | | |
| | 273 | | | Zebra Technologies Corp., Class A * | | | 14,518 | | | |
| | | | | | | | 2,425,091 | | | |
| Materials — 5.0% | | | | | | |
| | 148 | | | Air Products & Chemicals, Inc. | | | 21,178 | | | |
| | 353 | | | Albemarle Corp. | | | 27,723 | | | |
| | 2,443 | | | Alcoa, Inc. | | | 22,643 | | | |
| | 1,748 | | | Allegheny Technologies, Inc. | | | 21,641 | | | |
| | 237 | | | AptarGroup, Inc. | | | 18,312 | | | |
| | 187 | | | Ashland, Inc. | | | 21,235 | | | |
| | 314 | | | Avery Dennison Corp. | | | 23,344 | | | |
See accompanying notes which are an integral part of these financial statements.
Annual Report
13
| | |
| | |
| Cloud Capital Strategic All Cap Fund | | May 31, 2016 |
| | |
| Schedule of Investments (Continued) |
| | | | | | | | | | |
| Shares | | | | | Fair Value | | | |
| | | | | | | | | | |
| Common Stocks — (Continued) | | | | | | |
| Materials — (Continued) | | | | | | |
| | 300 | | | Ball Corp. | | $ | 21,714 | | | |
| | 368 | | | Bemis Co., Inc. | | | 18,501 | | | |
| | 425 | | | Cabot Corp. | | | 19,421 | | | |
| | 642 | | | Carpenter Technology Corp. | | | 20,561 | | | |
| | 689 | | | CF Industries Holdings, Inc. | | | 19,067 | | | |
| | (a) | | | Cliffs Natural Resources, Inc. * | | | 2 | | | |
| | 1,276 | | | Commercial Metals Co. | | | 21,909 | | | |
| | 241 | | | Compass Minerals International, Inc. | | | 18,814 | | | |
| | 558 | | | Domtar Corp. | | | 21,544 | | | |
| | 418 | | | Dow Chemical Co./The | | | 21,487 | | | |
| | 332 | | | Eagle Materials, Inc. | | | 25,964 | | | |
| | 328 | | | Eastman Chemical Co. | | | 24,066 | | | |
| | 185 | | | Ecolab, Inc. | | | 21,699 | | | |
| | 331 | | | EI du Pont de Nemours & Co. | | | 21,660 | | | |
| | 551 | | | FMC Corp. | | | 26,166 | | | |
| | 3,650 | | | Freeport-McMoRan, Inc., Class B | | | 40,444 | | | |
| | 683 | | | Greif, Inc., Class A | | | 24,496 | | | |
| | 179 | | | Ingevity Corp. * | | | 5,210 | | | |
| | 165 | | | International Flavors & Fragrances, Inc. | | | 21,336 | | | |
| | 566 | | | International Paper Co. | | | 23,854 | | | |
| | (a) | | | Intrepid Potash, Inc. * | | | 1 | | | |
| | 1,195 | | | Louisiana-Pacific Corp. * | | | 21,852 | | | |
| | 256 | | | Lyondellbasell Industries NV, Class A | | | 20,806 | | | |
| | 160 | | | Martin Marietta Materials, Inc. | | | 30,295 | | | |
| | 410 | | | Minerals Technologies, Inc. | | | 23,635 | | | |
| | 211 | | | Monsanto Co. | | | 23,756 | | | |
| | 823 | | | Mosaic Co./The | | | 20,773 | | | |
| | 51 | | | NewMarket Corp. | | | 20,801 | | | |
| | 763 | | | Newmont Mining Corp. | | | 24,734 | | | |
| | 496 | | | Nucor Corp. | | | 24,042 | | | |
| | 1,340 | | | Olin Corp. | | | 30,840 | | | |
| | 1,559 | | | Owens-Illinois, Inc. * | | | 29,469 | | | |
| | 349 | | | Packaging Corp. of America | | | 23,833 | | | |
| | 710 | | | PolyOne Corp. | | | 26,616 | | | |
| | 215 | | | PPG Industries, Inc. | | | 23,163 | | | |
| | 189 | | | Praxair, Inc. | | | 20,813 | | | |
| | 299 | | | Reliance Steel & Aluminum Co. | | | 22,228 | | | |
| | 422 | | | Royal Gold, Inc. | | | 23,687 | | | |
| | 457 | | | RPM International, Inc. | | | 22,960 | | | |
| | 271 | | | Scotts Miracle-Gro Co./The, Class A | | | 18,836 | | | |
| | 489 | | | Sealed Air Corp. | | | 22,699 | | | |
| | 315 | | | Sensient Technologies Corp. | | | 21,521 | | | |
| | | | | | | | | | |
| Shares | | | | | Fair Value | | | |
| | | | | | | | | | |
| Common Stocks — (Continued) | | | | | | |
| Materials — (Continued) | | | | | | |
| | 78 | | | Sherwin-Williams Co./The | | $ | 22,695 | | | |
| | 338 | | | Silgan Holdings, Inc. | | | 17,292 | | | |
| | 433 | | | Sonoco Products Co. | | | 20,618 | | | |
| | 974 | | | Steel Dynamics, Inc. | | | 24,037 | | | |
| | 2,281 | | | United States Steel Corp. | | | 33,001 | | | |
| | 216 | | | Valspar Corp./The | | | 23,387 | | | |
| | 215 | | | Vulcan Materials Co. | | | 25,158 | | | |
| | | | | | | | 1,237,539 | | | |
| Real Estate Investment Trusts — 5.4% | | | | | | |
| | 265 | | | Alexandria Real Estate Equities, Inc. | | | 25,702 | | | |
| | 462 | | | American Campus Communities, Inc. | | | 21,710 | | | |
| | 236 | | | American Tower Corp., Class A | | | 24,941 | | | |
| | 568 | | | Apartment Investment & Management Co., Class A | | | 24,245 | | | |
| | 124 | | | AvalonBay Communities, Inc. | | | 22,225 | | | |
| | 182 | | | Boston Properties, Inc. | | | 22,896 | | | |
| | 272 | | | Camden Property Trust | | | 23,193 | | | |
| | 713 | | | Care Capital Properties, Inc. | | | 18,533 | | | |
| | 1,168 | | | Communications Sales & Leasing, Inc. | | | 29,173 | | | |
| | 898 | | | Corporate Office Properties Trust | | | 24,279 | | | |
| | 682 | | | Corrections Corp. of America | | | 22,931 | | | |
| | 717 | | | Douglas Emmett, Inc. | | | 24,284 | | | |
| | 1,017 | | | Duke Realty Corp. | | | 24,073 | | | |
| | 330 | | | EPR Properties | | | 23,508 | | | |
| | 731 | | | Equity One, Inc. | | | 21,543 | | | |
| | 309 | | | Equity Residential | | | 21,399 | | | |
| | 105 | | | Essex Property Trust, Inc. | | | 23,753 | | | |
| | 264 | | | Extra Space Storage, Inc. | | | 24,502 | | | |
| | 141 | | | Federal Realty Investment Trust | | | 21,592 | | | |
| | 36 | | | Four Corners Property Trust, Inc. | | | 706 | | | |
| | 781 | | | General Growth Properties, Inc. | | | 20,978 | | | |
| | 603 | | | HCP, Inc. | | | 19,832 | | | |
| | 462 | | | Highwoods Properties, Inc. | | | 22,495 | | | |
| | 888 | | | Hospitality Properties Trust | | | 22,733 | | | |
| | 1,475 | | | Host Hotels & Resorts, Inc. | | | 22,720 | | | |
| | 772 | | | Iron Mountain, Inc. | | | 28,369 | | | |
| | 390 | | | Kilroy Realty Corp. | | | 24,647 | | | |
| | 758 | | | Kimco Realty Corp. | | | 21,362 | | | |
| | 384 | | | Lamar Advertising Co., Class A | | | 24,971 | | | |
| | 895 | | | LaSalle Hotel Properties | | | 20,693 | | | |
See accompanying notes which are an integral part of these financial statements.
Annual Report
14
| | |
| | |
| Cloud Capital Strategic All Cap Fund | | May 31, 2016 |
| | |
| Schedule of Investments (Continued) |
| | | | | | | | | | |
| Shares | | | | | Fair Value | | | |
| | | | | | | | | | |
| Common Stocks — (Continued) | | | | | | |
| Real Estate Investment Trusts —
(Continued) | | | | | | |
| | 701 | | | Liberty Property Trust | | $ | 26,148 | | | |
| | 273 | | | Macerich Co./The | | | 20,861 | | | |
| | 1,069 | | | Mack-Cali Realty Corp. | | | 28,046 | | | |
| | 231 | | | Mid-America Apartment Communities, Inc. | | | 23,745 | | | |
| | 449 | | | National Retail Properties, Inc. | | | 20,373 | | | |
| | 666 | | | Omega Healthcare Investors, Inc. | | | 21,252 | | | |
| | 362 | | | Post Properties, Inc. | | | 21,897 | | | |
| | 701 | | | Potlatch Corp. | | | 23,950 | | | |
| | 544 | | | Prologis, Inc. | | | 25,860 | | | |
| | 90 | | | Public Storage | | | 22,766 | | | |
| | 989 | | | Rayonier, Inc. | | | 25,646 | | | |
| | 369 | | | Realty Income Corp. | | | 22,177 | | | |
| | 276 | | | Regency Centers Corp. | | | 21,132 | | | |
| | 1,329 | | | Senior Housing Properties Trust | | | 24,833 | | | |
| | 113 | | | Simon Property Group, Inc. | | | 22,326 | | | |
| | 246 | | | SL Green Realty Corp. | | | 24,937 | | | |
| | 194 | | | Sovran Self Storage, Inc. | | | 20,968 | | | |
| | 630 | | | Tanger Factory Outlet Centers, Inc. | | | 22,190 | | | |
| | 283 | | | Taubman Centers, Inc. | | | 19,426 | | | |
| | 576 | | | UDR, Inc. | | | 20,758 | | | |
| | 824 | | | Urban Edge Properties | | | 22,122 | | | |
| | 381 | | | Ventas, Inc. | | | 25,249 | | | |
| | 256 | | | Vornado Realty Trust | | | 24,474 | | | |
| | 566 | | | Weingarten Realty Investors | | | 21,308 | | | |
| | 344 | | | Welltower, Inc. | | | 23,715 | | | |
| | 1,749 | | | Weyerhaeuser Co. | | | 55,109 | | | |
| | 2,653 | | | WP Glimcher, Inc. | | | 27,114 | | | |
| | | | | | | | 1,332,370 | | | |
| Telecommunication Services — 0.6% | | | | | | |
| | 533 | | | AT&T, Inc. | | | 20,880 | | | |
| | 776 | | | CenturyLink, Inc. | | | 21,049 | | | |
| | 4,604 | | | Frontier Communications Corp. | | | 23,800 | | | |
| | 456 | | | Level 3 Communications, Inc. * | | | 24,604 | | | |
| | (a) | | | Sprint Corp. * | | | 1 | | | |
| | 986 | | | Telephone & Data Systems, Inc. | | | 28,385 | | | |
| | (a) | | | T-Mobile US, Inc. * | | | 6 | | | |
| | 389 | | | Verizon Communications, Inc. | | | 19,818 | | | |
| | (a) | | | Windstream Holdings, Inc. | | | 2 | | | |
| | | | | | | | 138,545 | | | |
| | | | | | | | | | |
| Shares | | | | | Fair Value | | | |
| | | | | | | | | | |
| Common Stocks — (Continued) | | | | | | |
| Utilities — 5.3% | | | | | | |
| | 2,283 | | | AES Corp. | | $ | 25,319 | | | |
| | 330 | | | AGL Resources, Inc. | | | 21,727 | | | |
| | 926 | | | Alliant Energy Corp. | | | 34,304 | | | |
| | 462 | | | Ameren Corp. | | | 22,871 | | | |
| | 341 | | | American Electric Power Co., Inc. | | | 22,105 | | | |
| | 976 | | | Aqua America, Inc. | | | 31,546 | | | |
| | 445 | | | Atmos Energy Corp. | | | 32,443 | | | |
| | 606 | | | Black Hills Corp. | | | 36,659 | | | |
| | 1,162 | | | CenterPoint Energy, Inc. | | | 26,189 | | | |
| | 536 | | | CMS Energy Corp. | | | 22,401 | | | |
| | 292 | | | Consolidated Edison, Inc. | | | 21,413 | | | |
| | 307 | | | Dominion Resources, Inc., Class A | | | 22,208 | | | |
| | 247 | | | DTE Energy Co. | | | 22,403 | | | |
| | 270 | | | Duke Energy Corp. | | | 21,139 | | | |
| | 337 | | | Edison International | | | 24,105 | | | |
| | 298 | | | Entergy Corp. | | | 22,633 | | | |
| | 391 | | | Eversource Energy | | | 21,609 | | | |
| | 656 | | | Exelon Corp. | | | 22,489 | | | |
| | 640 | | | FirstEnergy Corp. | | | 20,989 | | | |
| | 1,083 | | | Great Plains Energy, Inc. | | | 31,601 | | | |
| | 1,046 | | | Hawaiian Electric Industries, Inc. | | | 34,331 | | | |
| | 446 | | | IDACORP, Inc. | | | 32,660 | | | |
| | 1,913 | | | MDU Resources Group, Inc. | | | 43,757 | | | |
| | 679 | | | National Fuel Gas Co. | | | 37,329 | | | |
| | 186 | | | NextEra Energy, Inc. | | | 22,325 | | | |
| | 1,021 | | | NiSource, Inc. | | | 24,351 | | | |
| | 1,905 | | | NRG Energy, Inc. | | | 31,210 | | | |
| | 1,172 | | | OGE Energy Corp. | | | 35,392 | | | |
| | 538 | | | ONE Gas, Inc. | | | 31,574 | | | |
| | 560 | | | ONEOK, Inc. | | | 24,213 | | | |
| | 376 | | | PG&E Corp. | | | 22,620 | | | |
| | 310 | | | Pinnacle West Capital Corp. | | | 22,826 | | | |
| | 972 | | | PNM Resources, Inc. | | | 31,907 | | | |
| | 590 | | | PPL Corp. | | | 22,748 | | | |
| | 505 | | | Public Service Enterprise Group, Inc. | | | 22,584 | | | |
| | 1,244 | | | Questar Corp. | | | 31,355 | | | |
| | 329 | | | SCANA Corp. | | | 22,980 | | | |
| | 223 | | | Sempra Energy | | | 23,875 | | | |
| | 435 | | | Southern Co./The | | | 21,507 | | | |
| | 4,467 | | | Talen Energy Corp. * | | | 51,372 | | | |
| | 791 | | | TECO Energy, Inc. | | | 21,797 | | | |
| | 866 | | | UGI Corp. | | | 37,155 | | | |
| | 700 | | | Vectren Corp. | | | 34,763 | | | |
| | 369 | | | WEC Energy Group, Inc. | | | 22,197 | | | |
| | 694 | | | Westar Energy, Inc. | | | 39,074 | | | |
| | 464 | | | WGL Holdings, Inc. | | | 30,273 | | | |
| | 546 | | | Xcel Energy, Inc. | | | 22,607 | | | |
| | | | | 1,304,935 | | | |
| Total Common Stocks
(Cost $17,527,223) | | | 19,388,033 | | | |
See accompanying notes which are an integral part of these financial statements.
Annual Report
15
| | |
| | |
| Cloud Capital Strategic All Cap Fund | | May 31, 2016 |
| | |
| Schedule of Investments (Continued) |
| | | | | | | | | | |
| Shares | | | | | Fair Value | | | |
| | | | | | | | | | |
| Exchange-Traded Funds — 6.9% | | | | | | |
| | 100 | | | Consumer Discretionary Select Sector SPDR Fund | | $ | 7,924 | | | |
| | 14,500 | | | iShares Russell 2000 ETF | | | 1,667,210 | | | |
| | 100 | | | ProShares UltraPro S&P 500 | | | 6,681 | | | |
| | 100 | | | Technology Select Sector SPDR Fund | | | 4,421 | | | |
| Total Exchange-Traded Funds
(Cost $1,685,658) | | | 1,686,236 | | | |
| Rights — 0.0% | | | | | | |
| Consumer Staples — 0.0% | | | | | | |
| | 1,104 | | | Safeway, Inc. (Casa Ley) * (c) | | | 1,121 | | | |
| | 1,104 | | | Safeway, Inc. (Property Development Centers) * (c) | | | 54 | | | |
| Total Rights
(Cost $0) | | | 1,175 | | | |
| Cash Equivalents — 6.8% | | | | | | |
| | 9 | | | FOLIOfn Investment Cash Account, 0.01% (d) | | | 9 | | | |
| | 1,663,116 | | | FOLIOfn Investment Sweep Account, 0.01% (d) | | | 1,663,116 | | | |
| Total Cash Equivalents
(Cost $1,663,125) | | | 1,663,125 | | | |
| Total Investments
(Cost $20,876,006) — 92.6% | | | 22,738,569 | | | |
| Other Assets in Excess of
Liabilities — 7.4% | | | 1,826,307 | | | |
| Net Assets — 100.0% | | $ | 24,564,876 | | | |
| (a) | Share amount is less than half a share. |
| (b) | Business Development Company |
| (c) | Securities have been deemed illiquid and represent 0.00% of the Fund’s net assets. |
| (d) | Rate disclosed is the seven day effective yield as of May 31, 2016. |
| * | Non-income producing security. |
The sectors shown on the schedule of investments are based on the Global Industry Classification Standard, or GICS® (“GICS”). The GICS was developed by and/or is the exclusive property of MSCI, Inc. and Standard & Poor Financial Services LLC (“S&P”). GICS is a service mark of MSCI, Inc. and S&P and has been licensed for use by Ultimus Asset Services, LLC.
See accompanying notes which are an integral part of these financial statements.
Annual Report
16
Statement of Assets and Liabilities
May 31, 2016
| | | | |
| Assets: | | | | |
Investments in securities | | | | |
At cost | | $ | 20,876,006 | |
| | | | | |
At fair value | | $ | 22,738,569 | |
Cash | | | 13,541 | |
Receivable for investments sold | | | 3,542,125 | |
Receivable for fund shares sold | | | 12 | |
Interest and dividends receivable | | | 31,114 | |
Tax reclaims receivable | | | 127 | |
Prepaid expenses | | | 16,933 | |
Total assets | | | 26,342,421 | |
| Liabilities: | | | | |
Payable to Adviser | | | 5,155 | |
Payable for investments purchased | | | 1,649,788 | |
Payable for fund shares redeemed | | | 75,988 | |
Payable to administrator, fund accountant and transfer agent | | | 7,129 | |
Payable for administrative servicing fees | | | 2,778 | |
Other accrued expenses | | | 36,707 | |
Total Liabilities | | | 1,777,545 | |
Net Assets | | $ | 24,564,876 | |
| | | | | |
| Net Assets consist of: | | | | |
Paid in capital | | $ | 24,039,420 | |
Accumulated undistributed net investment income/(loss) | | | 9,497 | |
Accumulated net realized gain/(loss) from investment transactions | | | (1,346,604 | ) |
Net unrealized appreciation (depreciation) on investments | | | 1,862,563 | |
Net Assets | | $ | 24,564,876 | |
| | | | | |
Shares Outstanding (unlimited number of shares authorized, no par value) | | | 3,090,566 | |
Net Asset Value, Offering and Redemption Price Per Share: | | $ | 7.95 | |
| | | | | |
See accompanying notes which are an integral part of these financial statements.
Annual Report
17
Statement of Operations
For the year ended May 31, 2016
| | | | |
| Investment Income | | | | |
Dividend income (net of foreign taxes withheld of $63) | | $ | 407,324 | |
Interest income | | | 239 | |
Total investment income | | | 407,563 | |
| Expenses | | | | |
Investment Adviser | | | 118,261 | |
Administrative servicing | | | 38,334 | |
Administration | | | 40,500 | |
Fund accounting | | | 25,000 | |
Transfer agent | | | 20,040 | |
Custodian | | | 12,722 | |
Legal | | | 17,088 | |
Registration | | | 31,356 | |
Audit | | | 47,081 | |
Pricing | | | 21,899 | |
Trustee | | | 5,899 | |
Printing | | | 17,601 | |
Miscellaneous | | | 33,792 | |
Line of credit | | | 10,340 | |
Total expenses | | | 439,913 | |
Recoupment of prior expenses waived/reimbursed by Adviser | | | 19,248 | |
Fees contractually waived by Adviser | | | (118,261 | ) |
Net operating expenses | | | 340,900 | |
Net investment income/(loss) | | | 66,663 | |
| Net Realized and Unrealized Gain/(Loss) on Investments | | | | |
Net realized gain/(loss) on investment securities transactions | | | 1,102,791 | |
Net change in unrealized appreciation (depreciation) of investment securities | | | (969,145 | ) |
Net realized and unrealized gain/(loss) on investments | | | 133,646 | |
Net increase (decrease) in net assets resulting from operations | | $ | 200,309 | |
| | | | | |
See accompanying notes which are an integral part of these financial statements.
Annual Report
18
Statements of Changes in Net Assets
| | | | | | | | |
| | | Year
Ended
May 31,
2016 | | | Year
Ended
May 31,
2015 | |
| Increase (Decrease) in Net Assets due to: | | | | | | | | |
| Operations: | | | | | | | | |
Net investment income/(loss) | | $ | 66,663 | | | $ | 113,402 | |
Net realized gain/(loss) on investment transactions | | | 1,102,791 | | | | 2,550,662 | |
Net change in unrealized appreciation (depreciation) of investments | | | (969,145 | ) | | | (953,519 | ) |
Net increase (decrease) in net assets resulting from operations | | | 200,309 | | | | 1,710,545 | |
| Distributions: | | | | | | | | |
From net investment income: | | | (49,771 | ) | | | (193,052 | ) |
From net realized gain: | | | (2,277,631 | ) | | | (9,091,051 | ) |
Total distributions | | | (2,327,402 | ) | | | (9,284,103 | ) |
| Capital Transactions: | | | | | | | | |
Proceeds from shares sold | | | 6,728,812 | | | | 11,015,838 | |
Shares issued in connection with merger (a) | | | — | | | | 10,333,009 | |
Reinvestment of distributions | | | 1,924,067 | | | | 6,464,866 | |
Amount paid for shares redeemed | | | (7,359,258 | ) | | | (19,229,951 | ) |
Net change resulting from capital transactions | | | 1,293,621 | | | | 8,583,762 | |
Total Increase (Decrease) in Net Assets | | | (833,472 | ) | | | 1,010,204 | |
| Net Assets: | | | | | | | | |
Beginning of year | | | 25,398,348 | | | | 24,388,144 | |
End of year | | $ | 24,564,876 | | | $ | 25,398,348 | |
| | | | | | | | | |
Accumulated undistributed net investment income/(loss) included in net assets at end of year | | $ | 9,497 | | | $ | 7,235 | |
| Share Transactions: | | | | | | | | |
Shares sold | | | 872,747 | | | | 935,892 | |
Shares issued in connection with merger (a) | | | — | | | | 1,239,011 | |
Shares issued in reinvestment of distributions | | | 266,861 | | | | 789,361 | |
Shares redeemed | | | (971,490 | ) | | | (1,356,593 | ) |
Total | | | 168,118 | | | | 1,607,671 | |
| (a) | See Note 1 to the Notes to Financial Statements. |
See accompanying notes which are an integral part of these financial statements.
Annual Report
19
(For a share outstanding during each period)
| | | | | | | | | | | | | | | | | | | | |
| | | For the
Year Ended
May 31,
2016 | | | For the
Year Ended
May 31,
2015 | | | For the
Year Ended
May 31,
2014 | | | For the
Year Ended
May 31,
2013 | | | For the
Period Ended
May 31,
2012 (a) | |
| Selected Per Share Data: | | | | | | | | | | | | | | | | | | | | |
Net asset value, beginning of period | | $ | 8.69 | | | $ | 18.55 | | | $ | 17.00 | | | $ | 14.46 | | | $ | 15.00 | |
Income from investment operations: | | | | | | | | | | | | | | | | | | | | |
Net investment income/(loss) | | | 0.03 | | | | 0.06 | (b) | | | 0.13 | | | | 0.13 | | | | 0.07 | |
Net realized and unrealized gain (loss) on investments | | | 0.02 | | | | 0.77 | | | | 3.22 | | | | 3.54 | | | | (0.54 | ) |
Total from investment operations | | | 0.05 | | | | 0.83 | | | | 3.35 | | | | 3.67 | | | | (0.47 | ) |
Less distributions to shareholders: | | | | | | | | | | | | | | | | | | | | |
From net investment income | | | (0.02 | ) | | | (0.22 | ) | | | (0.08 | ) | | | (0.14 | ) | | | (0.04 | ) |
From net realized gains | | | (0.77 | ) | | | (10.47 | ) | | | (1.72 | ) | | | (0.99 | ) | | | (0.03 | ) |
Total distributions | | | (0.79 | ) | | | (10.69 | ) | | | (1.80 | ) | | | (1.13 | ) | | | (0.07 | ) |
Net asset value, end of period | | $ | 7.95 | | | $ | 8.69 | | | $ | 18.55 | | | $ | 17.00 | | | $ | 14.46 | |
| | | | | | | | | | | | | | | | | | | | | |
| Total Return(c) | | | 1.49 | % | | | 7.99 | % | | | 20.81 | % | | | 26.51 | % | | | (3.12 | )%(d) |
| | | | | |
Ratios and Supplemental
Data: | | | | | | | | | | | | | | | | | | | | |
Net assets, end of period (000) | | $ | 24,565 | | | $ | 25,398 | | | $ | 24,388 | | | $ | 46,746 | | | $ | 38,550 | |
Ratio of expenses to average net assets(i) | | | 1.44 | %(e)(f) | | | 1.26 | %(g) | | | 1.23 | % | | | 1.40 | % | | | 1.40 | %(h) |
Ratio of net expenses to average net assets before waiver and recoupment(i) | | | 1.86 | % | | | 1.74 | % | | | 1.15 | % | | | 1.27 | % | | | 1.90 | %(h) |
Ratio of net investment income/(loss) to average net assets(j) | | | 0.28 | % | | | 0.51 | % | | | 0.57 | % | | | 0.78 | % | | | 0.53 | %(h) |
Ratio of net investment income/(loss) to average net assets before waiver and recoupment(j) | | | (0.14 | )% | | | 0.03 | % | | | 0.65 | % | | | 0.91 | % | | | 0.03 | %(h) |
Portfolio turnover rate | | | 288.93 | % | | | 61.71 | % | | | 90.14 | % | | | 72.66 | % | | | 163.38 | %(d) |
| (a) | For the period June 29, 2011 (commencement of operations) to May 31, 2012. |
| (b) | Net investment income per share is based on average shares outstanding during the year. |
| (c) | Total return in the above table represents the rate that the investor would have earned or lost on an investment in the Fund, assuming reinvestment of distributions. |
| (e) | Includes recoupment of previously waived fees of 0.08%. |
| (f) | Includes 0.04% for line of credit fees. |
| (g) | Includes recoupment of previously waived fees of 0.04%. |
| (i) | These ratios exclude the impact of expenses of the underlying funds in which the Fund may invest, as represented in the Schedule of Investments. |
| (j) | Recognition of net investment income by the Fund is affected by the timing of the declaration of dividends by the underlying investment companies in which the Fund invests. |
See accompanying notes which are an integral part of these financial statements.
Annual Report
20
Notes to the Financial Statements
May 31, 2016
Note 1. Organization
The Cloud Capital Strategic All Cap Fund (the “Fund”) was organized as an open-end diversified series of the Valued Advisers Trust (the “Trust”). The Trust is a management investment company established under the laws of Delaware by an Agreement and Declaration of Trust dated June 13, 2008 (the “Trust Agreement”). The Trust Agreement permits the Trustees to issue an unlimited number of shares of beneficial interest of separate series without par value. The Fund is one of a series of funds authorized by the Board of Trustees (the “Board”). The Fund only offers Institutional Class Shares. The Fund’s Institutional Class Shares commenced operations on June 29, 2011. The Fund’s investment adviser is Cloud Capital LLC (the “Adviser”). The investment objective of the Fund is long-term capital appreciation.
As of the close of business on January 16, 2015, the Fund acquired all the assets and assumed all of the liabilities of the Cloud Capital Strategic Mid Cap Fund (the “Mid Cap Fund”) pursuant to an agreement and plan of reorganization approved by the Board on November 19, 2014. The reorganization qualified as a tax-free reorganization for federal income tax purposes with no gain or loss recognized to the funds or their shareholders.
The acquisition was accomplished by a tax-free exchange of 899,233 Institutional Class shares of the Mid Cap Fund (valued at $10,333,009) for 1,239,011 Institutional Class shares of the Fund outstanding on January 16, 2015. For financial reporting purposes, assets received and shares issued by the Fund were recorded at fair value; however, the identified cost of the investments received from the Mid Cap Fund was carried forward to align ongoing reporting of the Fund’s realized and unrealized gains and losses with amounts distributable to shareholders for tax purposes. The aggregate net assets of the Fund immediately before the acquisition were $13,682,729. The aggregate net assets of the Mid Cap Fund at January 16, 2015 of $10,333,009, including $555,302 of unrealized appreciation, were combined with those of the Fund, resulting in combined aggregate net assets of $24,015,738.
Assuming the acquisition had been completed on June 1, 2014, the beginning of the annual reporting period of the Fund, the Fund’s pro forma results of operation for the year ended May 31, 2015, are as follows:
| | | | |
Net investment income | | $ | 85,147 | |
Net realized and unrealized gains on investment | | | 2,558,259 | |
Net increase in net assets resulting from operations | | $ | 2,643,406 | |
Because the combined investment portfolios have been managed as a single integrated portfolio since the acquisition was completed, it is not practicable to separate the amounts of revenue and earnings of the Mid Cap Fund that have been included in the Fund’s statement of operations since January 16, 2015.
Annual Report
21
Notes to the Financial Statements (continued)
The Fund’s prospectus provides a description of the investment objective, policies and strategies, along with information on the class of shares currently being offered.
Note 2. Significant Accounting Policies
The Fund is an investment company and follows accounting and reporting guidance under Financial Accounting Standards Board (“FASB”) Accounting Standards Codification (“ASC”) Topic 946, “Financial Services-Investment Companies”. The following is a summary of significant accounting policies followed by the Fund in the preparation of its financial statements. These policies are in conformity with generally accepted accounting principles in the United States of America (“GAAP”).
Securities Valuation—All investments in securities are recorded at their estimated fair value as described in Note 3.
Federal Income Taxes—The Fund makes no provision for federal income or excise tax. The Fund has qualified and intends to qualify each year as a regulated investment company (“RIC”) under subchapter M of the Internal Revenue Code of 1986, as amended, by complying with the requirements applicable to RICs and by distributing substantially all of its taxable income. The Fund also intends to distribute sufficient net investment income and net capital gains, if any, so that it will not be subject to excise tax on undistributed income and gains. If the required amount of net investment income or gains is not distributed, the Fund could incur a tax expense.
For the fiscal year ended May 31, 2016, the Fund did not have a liability for any unrecognized tax benefits. The Fund recognizes interest and penalties, if any, related to unrecognized tax benefits as income tax expense in the statement of operations. During the fiscal year ended May 31, 2016, the Fund did not incur any interest or penalties. The Fund is subject to examination by U.S. federal tax authorities for the last three tax year ends and the interim tax period since then.
Expenses—Expenses incurred by the Trust that do not relate to a specific fund of the Trust are allocated to the individual funds based on each Fund’s relative net assets or another appropriate basis.
Security Transactions and Related Income—The Fund follows industry practice and records security transactions on the trade date for financial reporting purposes. The specific identification method is used for determining gains or losses for financial statement and income tax purposes. Dividend income is recorded on the ex-dividend date and interest income is recorded on an accrual basis. Discounts and premiums on securities purchased are accreted or amortized using the effective interest method. Withholding taxes on foreign dividends have been provided for in accordance with the Fund’s understanding of the applicable country’s tax rules and rates. The ability of issuers of debt securities held by the Fund to meet their obligations may be affected by economic and political developments in a specific country or region.
Dividends and Distributions—The Fund intends to distribute substantially all of its net investment income, if any, as dividends to its shareholders on at least an annual basis. The Fund also intends to distribute its net realized long-term and short-term capital gains, if any, at least
Annual Report
22
once a year. Dividends to shareholders, which are determined in accordance with income tax regulations, are recorded on the ex-dividend date. The treatment for financial reporting purposes of distributions made to shareholders during the period from net investment income or net realized capital gains may differ from their ultimate treatment for federal income tax purposes. These differences are caused primarily by differences in the timing of the recognition of certain components of income, expense or realized capital gains for federal income tax purposes. Where such differences are permanent in nature, they are reclassified among the components of the net assets based on their ultimate characterization for federal income tax purposes. Any such reclassifications will have no effects on net assets, results of operations or net asset values per share of the Fund.
For the fiscal year ended May 31, 2016, the Fund made the following reclassifications to increase (decrease) the components of net assets:
| | | | |
| Paid in Capital | | Accumulated Net
Investment Income
Gain/(Loss) | | Accumulated Net
Realized
Gain/(Loss) |
$— | | $(14,630) | | $14,630 |
Note 3. Securities Valuation and Fair Value Measurements
Fair value is defined as the price that the Fund would receive upon selling an investment in an orderly transaction to an independent buyer in the principal or most advantageous market of the investment. GAAP establish a three-tier hierarchy to maximize the use of observable market data and minimize the use of unobservable inputs and to establish classification of fair value measurements for disclosure purposes.
Inputs refer broadly to the assumptions that market participants would use in pricing the asset or liability, including assumptions about risk (the risk inherent in a particular valuation technique used to measure fair value such as pricing model and/or the risk inherent in the inputs to the valuation technique). Inputs may be observable or unobservable. Observable inputs are inputs that reflect the assumptions market participants would use in pricing the asset or liability developed based on market data obtained from sources independent of the reporting entity. Unobservable inputs are inputs that reflect the reporting entity’s own assumptions about the assumptions market participants would use in pricing the asset or liability developed based on the best information available in the circumstances.
Various inputs are used in determining the value of the Fund’s investments. These inputs are summarized in the three broad levels listed below.
| • | | Level 1—unadjusted quoted prices in active markets for identical investments and/or registered investment companies where the value per share is determined and published and is the basis for current transactions for identical assets or liabilities at the valuation date. |
| • | | Level 2—other significant observable inputs (including, but not limited to, quoted prices for an identical security in an inactive market, quoted prices for similar securities, interest rates, prepayment speeds, credit risk, etc.) |
Annual Report
23
Notes to the Financial Statements (continued)
| • | | Level 3—significant unobservable inputs (including the Fund’s own assumptions in determining fair value of investments based on the best information available) |
The inputs used to measure fair value may fall into different levels of the fair value hierarchy. In such cases, for disclosure purposes, the level in the fair value hierarchy which is reported is determined based on the lowest level input that is significant to the fair value measurement in its entirety.
Equity securities, including common stocks, exchanged-traded funds and real estate investment trusts, are generally valued by using market quotations, but may be valued on the basis of prices furnished by a pricing agent when the Adviser believes such prices more accurately reflect the fair value of such securities. Securities that are traded on any stock exchange are generally valued by the pricing agent at the last quoted sale price. Lacking a last sale price, an exchange traded security is generally valued by the pricing agent at its last bid price. Securities traded in the NASDAQ over-the-counter market are generally valued by the pricing agent at the NASDAQ Official Closing Price.
When using the market quotations or close prices provided by the pricing agent and when the market is considered active, the security will be classified as a Level 1 security. Sometimes, an equity security owned by the Fund will be valued by the pricing agent with factors other than market quotations or when the market is considered inactive. When this happens, the security will be classified as a Level 2 security. When market quotations are not readily available, when the Adviser determines that the market quotation or the price provided by the pricing agent does not accurately reflect the current fair value, or when certain restricted or illiquid securities are being valued, such securities are valued as determined in good faith by the Adviser, in conformity with policies adopted by and subject to review by the Board. These securities will generally be categorized as Level 3 securities.
In accordance with the Trust’s valuation policies, the Adviser is required to consider all appropriate factors relevant to the value of securities for which it has determined other pricing sources are not available or reliable as described above. No single standard exists for determining fair value, because fair value depends upon the circumstances of each individual case. As a general principle, the current fair value of an issue of securities being valued by the Adviser would appear to be the amount that the owner might reasonably expect to receive for them upon their current sale. Methods that are in accordance with this principle may, for example, be based on (i) a multiple of earnings; (ii) a discount from market prices of a similar freely traded security (including a derivative security or a basket of securities traded on other markets, exchanges or among dealers); or (iii) yield to maturity with respect to debt issues, or a combination of these and other methods. Fair-value pricing is permitted if, in the Adviser’s opinion, the validity of market quotations appears to be questionable based on factors such as evidence of a thin market in the security based on a small number of quotations, a significant event occurs after the close of a market but before the Fund’s NAV calculation that may affect a security’s value, or the Adviser is aware of any other data that calls into question the reliability of market quotations. Fair-value pricing may also be used in instances when the bonds the Fund may invest in default or otherwise cease to have market quotations readily available.
Annual Report
24
The following is a summary of the inputs used to value the Fund’s investments as of May 31, 2016:
| | | | | | | | | | | | | | | | |
| | | Valuation Inputs | | | | |
| | | Level 1 | | | Level 2 | | | Level 3 | | | Total | |
Common Stocks * | | $ | 19,388,033 | | | $ | — | | | $ | — | | | $ | 19,388,033 | |
Exchange-Traded Funds | | | 1,686,236 | | | | — | | | | — | | | | 1,686,236 | |
Cash Equivalents | | | 1,663,125 | | | | — | | | | — | | | | 1,663,125 | |
Rights * | | | — | | | | — | | | | 1,175 | | | | 1,175 | |
| | | | | | | | | | | | | | | | |
Total | | $ | 22,737,394 | | | $ | — | | | $ | 1,175 | | | $ | 22,738,569 | |
| * | Please refer to Schedule of Investments for industry classifications. |
The Fund did not hold any investments during the reporting period for which other significant observable inputs (Level 2) were used in determining fair value. The Fund did not hold any derivative instruments during the reporting period. The following is a summary of the Level 3 reconciliation as of May 31, 2016:
| | | | |
| | | Rights | |
Balance as of May 31, 2015 | | $ | — | |
Realized gain/(loss) | | | — | |
Change in unrealized appreciation | | | | |
(depreciation) | | | 1,175 | |
Purchases | | | — | |
Sales | | | — | |
Transfers in to Level 3 | | | — | |
Transfers out of Level 3 | | | — | |
Balance as of May 31, 2016 | | $ | 1,175 | |
The Trust recognizes transfers between fair value hierarchy levels at the end of the reporting period. There were no transfers between any levels as of May 31, 2016.
Note 4. Risks
The Fund may invest in leveraged and inverse Exchange-Traded Funds (“ETFs”). Leveraged ETFs are riskier than traditional ETFs as they use borrowings and derivative instruments to generate a return in multiples of a benchmark index. Investments in inverse and leveraged ETFs may magnify and compound changes in the Fund’s share price and result in increased volatility and potential loss. Inverse ETFs seek to negatively correlate to the performance of the particular index that they track by using various forms of derivative transactions, including by short-selling the underlying index. Certain ETFs, such as ultra-short ETFs, seek to multiply the negative return of the tracked index by a magnitude of two or three times the inverse return. As a result, investments in an inverse ETF will decrease in value when the value of the underlying index rises. By investing in ultra-short ETFs and gaining magnified short exposure to a particular index, the Fund can commit less assets to the investment in the securities represented on the index than would otherwise be required. ETFs that seek to multiply the negative return on the
Annual Report
25
Notes to the Financial Statements (continued)
tracked index are subject to a special form of correlation risk which is the risk that for periods greater than one day, the use of leverage tends to cause the performance of the ETF to be either greater than or less than the index performance times the stated multiple in the ETF’s investment objective.
The Fund maintains cash and cash equivalent balances with a financial institution which, at times, may exceed federally insured limits. Cash equivalents include short-term highly liquid investments that are readily convertible to known amounts of cash and have original maturities of three months or less. Management deems the risk of loss related to cash and cash equivalents to be remote.
Note 5. Fees and Other Transactions with Affiliates and Other Service Providers
Under the terms of the investment advisory agreement for the Fund (the “Agreement”), the Adviser manages the Fund’s investments subject to oversight of the Board. As compensation for its management services, the Fund is obligated to pay the Adviser a fee computed and accrued daily and paid monthly at an annual rate of 0.50% of the average daily net assets of the Fund. For the fiscal year ended May 31, 2016, the Adviser earned fees of $118,261 from the Fund before the waivers and recoupment described below. At May 31, 2016, the Fund owed the Adviser $5,155.
The Adviser has contractually agreed to waive its management fee and/or reimburse certain Fund operating expenses, but only to the extent necessary so that the Fund’s net expenses, excluding brokerage fees and commissions, borrowing costs (such as interest and dividend expenses on securities sold short), taxes, distribution and service (12b-1) fees, extraordinary expenses and indirect expenses (such as fees and expenses of acquired funds) does not exceed 1.40% of the net assets of the Fund. On February 1, 2014, the Adviser contractually agreed to waive, in its entirety, its advisory fees effective February 1, 2014, through September 30, 2016. This contractual arrangement may only be terminated by mutual consent of the Adviser and the Board, and it will automatically terminate upon the termination of the investment advisory agreement between the Fund and the Adviser. The Adviser shall not be entitled to reimbursement for any advisory fees waived for the Fund for the period February 1, 2014 through September 30, 2016. Each waiver or reimbursement of an expense by the Adviser prior to February 1, 2014, is subject to repayment by the Fund within the three fiscal years following the fiscal year in which the particular expense was incurred, provided that the Fund is able to make the repayment without exceeding the applicable expense limitation. For the fiscal year ended May 31, 2016, expenses totaling $118,261 were waived or reimbursed by the Adviser. This amount is not subject to potential recoupment by the Adviser. At a special meeting of the shareholders held on January 19, 2015, shareholders of the Fund approved a proposal to allow the Advisor to recoup reimbursements provided to the Mid Cap Fund prior to the merger. The Adviser recouped $19,248 during the period June 1, 2015, through May 31, 2016, which had previously been waived in the Mid Cap Fund. As of May 31, 2016, there were no further waived or reimbursed expense that the Adviser could recoup.
Annual Report
26
The Trust retains Ultimus Asset Services, LLC (“Ultimus”), formerly Huntington Asset Services, Inc. (“HASI”), to provide the Fund with administrative and compliance services, including all regulatory reporting. For the fiscal year ended May 31, 2016, Ultimus earned fees of $40,500 for administrative and compliance services provided to the Fund. At May 31, 2016, Ultimus was owed $3,375 from the Fund for administrative and compliance services.
The Trust also retains Ultimus to act as the Fund’s transfer agent and to provide fund accounting services. For the fiscal year ended May 31, 2016, Ultimus earned fees of $20,040 for providing transfer agent services. At May 31, 2016, Ultimus was owed $1,671 from the Fund for transfer agent services. For the fiscal year ended May 31, 2016, Ultimus earned fees of $25,000 from the Fund for fund accounting services. At May 31, 2016, Ultimus was owed $2,083 from the Fund for fund accounting services.
The officers and one trustee of the Trust are members of management and/or employees of Ultimus. Unified Financial Securities, LLC (the “Distributor” or “Unified”) acts as the principal distributor of the Fund’s shares. Effective at the close of business on December 31, 2015, Ultimus Fund Solutions, LLC acquired HASI and the Distributor from Huntington Bancshares, Inc. (“HBI”). Prior to January 1, 2016, HASI and the Distributor were under common control by HBI.
The Fund may pay certain financial intermediaries that provide certain administrative services to shareholders who invest in the Fund, including record keeping and sub-accounting shareholder accounts. The Fund is authorized to pay up to 0.25% of the average daily net assets of the Fund’s shares. The payments may also be made to certain financial intermediaries in connection with client account maintenance support, statement preparation and transaction processing. The types of payments under this category include, among others, payment of ticket charges per purchase or exchange order placed by a financial intermediary, payment of networking or other recordkeeping fees, or one-time payments for ancillary services such as setting up the Fund on a financial intermediary’s trading systems. For the fiscal year ended May 31, 2016, the Fund incurred administrative servicing expenses of $38,334. At May 31, 2016, the Fund owed $2,778 in administrative servicing expenses.
A trustee and certain officers of the Trust are officers of the Distributor and each such person may be deemed to be an affiliate of the Distributor.
Note 6. Purchases and Sales of Securities
For the fiscal year ended May 31, 2016, purchases and sales of investment securities, other than short-term investments and short-term U.S. government obligations, were as follows:
| | | | |
| Purchases | | Sales | |
$61,553,119 | | $ | 64,672,909 | |
There were no purchases or sales of long-term U.S. Government obligations during the fiscal year ended May 31, 2016.
Annual Report
27
Notes to the Financial Statements (continued)
Note 7. Line of Credit
On December 3, 2015, the Trust, on behalf of the Fund, renewed its short-term credit agreement (“Line of Credit”) with Huntington National Bank (“Huntington”), formerly an affiliate of HASI and the Distributor, expiring on December 3, 2016. Under the terms of the agreement, the Funds may borrow up to $3 million at an interest rate of LIBOR plus 150 basis points. Any borrowings under the Line of Credit are collateralized by securities in the Fund’s portfolio. The purpose of the agreement is to meet temporary or emergency cash needs, including redemption requests that might otherwise require the untimely disposition of securities. Huntington receives an annual facility fee of 0.125% on $3 million as well as an additional annual fee of 0.125% on any unused portion of the credit facility, invoiced quarterly, for providing the Line of Credit. The Fund will not borrow money, except (a) from a bank, provided that immediately after such borrowing there is an asset coverage of 300% for all borrowings of the Fund; or (b) from a bank or other persons for temporary purposes only, provided that such temporary borrowings are in an amount not exceeding 10% of the Fund’s total assets at the time when the borrowing is made. This limitation does not preclude the Fund from entering into reverse repurchase transactions, provided that the Fund has asset coverage of 300% for all borrowings and repurchase commitments of the Fund pursuant to reverse repurchase transactions. For the fiscal year ended May 31, 2016, the Fund had no borrowings under this Line of Credit.
Note 8. Estimates
The preparation of financial statements in conformity with GAAP requires management to make estimates and assumptions that affect the reported amounts of assets and liabilities and disclosure of contingent assets and liabilities at the date of the financial statements and the reported amounts of increases and decreases in net assets from operations during the reporting period. Actual results could differ from those estimates.
Note 9. Beneficial Ownership
The beneficial ownership, either directly or indirectly, of 25% or more of the voting securities of a fund creates a presumption of control of a fund, under Section 2(a)(9) of the Investment Company Act of 1940. At May 31, 2016, Orthofix (401k Plan) owned, as record shareholder 70% of the outstanding shares of the Fund.
Note 10. Federal Tax Information
At May 31, 2016, the net unrealized appreciation (depreciation) of investments for tax purposes was as follows:
| | | | | | |
Tax Cost of
Securities | | Unrealized
Appreciation | | Unrealized
Depreciation | | Net Unrealized
Appreciation
(Depreciation) |
$22,140,312 | | $806,939 | | ($208,682) | | $598,257 |
The difference between book basis and tax basis unrealized appreciation was attributable primarily to the tax deferral of losses on wash sales.
Annual Report
28
The tax characterization of distributions paid for the fiscal years ended May 31, 2016 and May 31, 2015 were as follows:
| | | | | | | | |
| | | 2016 | | | 2015 | |
Ordinary Income* | | $ | 246,054 | | | $ | 1,065,158 | |
Long-Term Capital Gain | | | 2,081,348 | | | | 8,218,945 | |
Total Distributions | | $ | 2,327,402 | | | $ | 9,284,103 | |
| * | Short-term capital gains distributions are treated as ordinary income for tax purposes. |
At May 31, 2016, the components of distributable earnings (accumulated losses) on a tax basis were as follows:
| | | | | | | | |
Undistributed
Ordinary
Income | | Undistributed
Long-Term
Capital Gains | | Accumulated
Capital and
Other Losses | | Unrealized
Appreciation
(Depreciation) | | Total
Accumulated
Earnings (Loss) |
$18,845 | | $— | | $(91,646) | | $598,257 | | $525,456 |
Certain capital losses incurred after October 31, and within the current taxable year, are deemed to arise on the first business day of the Fund’s following taxable year. For the tax year ended May 31, 2016, the Fund deferred post October capital losses in the amount of $80,978.
Note 11. Commitments and Contingencies
The Fund indemnifies its officers and trustees for certain liabilities that may arise from performance of their duties to the Fund. Additionally, in the normal course of business, the Fund enters into contracts that contain a variety of representations and warranties which provide general indemnifications. The Fund’s maximum exposure under these arrangements is unknown, as this would involve future claims that may be made against the Fund that have not yet occurred.
Note 12. Subsequent Events
Management of the Fund has evaluated the need for disclosure and/or adjustments resulting from subsequent events through the date these financials were issued. Management has determined that there were no items requiring additional disclosure.
Annual Report
29
| | |
Report of Independent Registered Public Accounting Firm |
To the Shareholders of Cloud Capital Strategic All Cap Fund and
Board of Trustees of Valued Advisers Trust
We have audited the accompanying statement of assets and liabilities, including the schedule of investments, of Cloud Capital Strategic All Cap Fund (the “Fund”), a series of Valued Advisers Trust, as of May 31, 2016, and the related statement of operations for the year then ended, the statements of changes in net assets for each of the two years in the period then ended, and the financial highlights for each of the five periods in the period then ended. These financial statements and financial highlights are the responsibility of the Fund’s management. Our responsibility is to express an opinion on these financial statements and financial highlights based on our audits.
We conducted our audits in accordance with the standards of the Public Company Accounting Oversight Board (United States). Those standards require that we plan and perform the audit to obtain reasonable assurance about whether the financial statements and financial highlights are free of material misstatement. An audit includes examining, on a test basis, evidence supporting the amounts and disclosures in the financial statements. Our procedures included confirmation of securities owned as of May 31, 2016, by correspondence with the custodian and brokers. An audit also includes assessing the accounting principles used and significant estimates made by management, as well as evaluating the overall financial statement presentation. We believe that our audits provide a reasonable basis for our opinion.
In our opinion, the financial statements and financial highlights referred to above present fairly, in all material respects, the financial position of Cloud Capital Strategic All Cap Fund as of May 31, 2016, the results of its operations for the year then ended, the changes in its net assets for each of the two years in the period then ended, and the financial highlights for each of the five periods in the period then ended, in conformity with accounting principles generally accepted in the United States of America.

COHEN FUND AUDIT SERVICES, LTD.
Cleveland, Ohio
August 1, 2016
Annual Report
30
| | |
Summary of Fund Expenses – (Unaudited) |
As a shareholder of the Fund, you incur two types of costs: (1) transaction costs (such as short-term redemption fees); and (2) ongoing costs, including management fees and other Fund expenses. This Example is intended to help you understand your ongoing costs (in dollars) of investing in the Fund and to compare these costs with the ongoing costs of investing in other mutual funds. The Example is based on an investment of $1,000 invested at the beginning of the period, and held for the entire period from December 1, 2015 to May 31, 2016.
Actual Expenses
The first line of the table provides information about actual account values and actual expenses. You may use the information in this line, together with the amount you invested, to estimate the expenses that you paid over the period. Simply divide your account value by $1,000 (for example, an $8,600 account value divided by $1,000 = 8.60), then multiply the result by the number in the first line under the heading “Expenses Paid During the Period” to estimate the expenses you paid on your account during this period.
Hypothetical Example for Comparison Purposes
The second line of the table provides information about hypothetical account values and hypothetical expenses based on the Fund’s actual expense ratio and an assumed rate of return of 5% per year before expenses, which is not the Fund’s actual return. The hypothetical account values and expenses may not be used to estimate the actual ending account balance or expenses you paid for the period. You may use this information to compare the ongoing costs of investing in the Fund and other funds. To do so, compare this 5% hypothetical example with the 5% hypothetical examples that appear in the shareholder reports of the other funds.
Expenses shown in the table are meant to highlight your ongoing costs only and do not reflect any transactional costs, such as sales charges (loads), redemption fees, or exchange fees. Therefore, the second line of the table is useful in comparing ongoing costs only, and will not help you determine the relative total costs of owning different funds.
| | | | | | | | | | |
| | | Beginning
Account
Value
December 1, 2015 | | Ending Account Value May 31, 2016 | | | Expenses
Paid
During
the Period (a) | |
| |
Cloud Capital Strategic All Cap Fund | | | | | |
Actual expenses | | $1,000.00 | | $ | 1,052.40 | | | $ | 7.43 | |
Hypothetical expenses (b) | | $1,000.00 | | $ | 1,017.76 | | | $ | 7.30 | |
| (a) | Expenses are equal to the Fund’s annualized expense ratio of 1.45%, multiplied by the average account value over the period, multiplied by 183/366. |
| (b) | Assumes a 5% return before expenses. |
Annual Report
31
Additional Federal Income Tax Information (Unaudited):
The Form 1099-DIV you receive in January 2017 will show the tax status of all distributions paid to your account in calendar year 2016. Shareholders are advised to consult their own tax adviser with respect to the tax consequences of their investment in the Fund. As required by the Internal Revenue Code and/or regulations, shareholders must be notified regarding the status of qualified dividend income for individuals and the dividends received deduction for corporations.
Qualified Dividend Income: The Fund designates approximately 83%, or up to the maximum amount of such dividends allowable pursuant to the Internal Revenue Code, as qualified dividend income eligible for the reduced tax rate of 15%.
Dividends Received Deduction: Corporate shareholders are generally entitled to take the dividends received deduction on the portion of the Fund’s dividend distribution that qualifies under tax law. For the Fund’s fiscal year 2016 ordinary income dividends, 82% qualifies for the corporate dividends received deduction.
For the fiscal year ended May 31, 2016, the Fund designated $2,081,348 as long-term capital gain distributions.
For the fiscal year ended March 31, 2016, the Fund designated $0 as long-term capital gain distributions.
Annual Report
32
| | |
Trustees and Officers (Unaudited) | | |
The Board of Trustees supervises the business activities of the Trust. Each Trustee serves as a trustee until termination of the Trust unless the Trustee dies, resigns, retires or is removed.
The following table provides information regarding each of the Independent Trustees.
| | | | |
Name, Address*, (Age),
Position with Trust**,
Term of Position with Trust | | Principal Occupation During Past 5 Years | | Other Directorships |
Ira P. Cohen, 57,
Independent Trustee, June 2010 to present. | | Current: Independent financial services consultant since February 2005; Executive Vice President of Asset Management Services, Recognos Financial, since August 2015. | | Trustee and Audit Committee Chairman, Griffin Institutional Real Estate Access Fund, since May 2014. Trustee, Angel Oak Funds Trust, since October 2014. |
Andrea N. Mullins, 49, Independent Trustee, December 2013 to present. | | Current: Private investor; Independent Contractor, Seabridge Wealth Management, LLC, since April 2014. | | None. |
The following table provides information regarding the Trustee who is considered an “interested person” of the Trust, as that term is defined under the 1940 Act. Based on the experience of the Trustee, the Trust concluded that the individual described below is qualified to serve as a Trustee.
| | | | |
Name, Address*, (Age), Position with Trust**,
Term of Position with Trust | | Principal Occupation During Past 5 Years | | Other Directorships |
R. Jeffrey Young, 51,
Trustee and Chairman, June 2010 to present; Principal Executive Officer and President since February 2010 to present. | | Current: Vice President and Director of Relationship Management, Ultimus Fund Solutions, LLC (since December 2015); President, Unified Financial Securities, LLC (since July 2015). Previous: President, Huntington Asset Services, Inc. (n/k/a Ultimus Asset Services, LLC) (April 2015 to December 2015), Director (May 2014 to December 2015), Senior Vice President (January 2010 to April 2015); Director, Unified Financial Securities, Inc. (n/k/a Unified Financial Securities, LLC) (May 2014 to December 2015); Chief Executive Officer, Huntington Funds (February 2010 to March 2015); Chief Executive Officer, Huntington Strategy Shares (November 2010 to March 2015); President and Chief Executive Officer, Dreman Contrarian Funds (March 2011 to February 2013). | | Trustee and Chairman, Capitol Series Trust, since September 2013. |
| * | The address for each trustee and officer is 225 Pictoria Drive, Suite 450, Cincinnati, OH 45246. |
| ** | As of the date of this report, the Trust consists of 15 series. |
Annual Report
33
| | |
Trustees and Officers (Unaudited) (continued) | | |
The following table provides information regarding the Officers of the Trust:
| | |
Name, Address*, (Age),
Position with Trust,
Term of Position with Trust | | Principal Occupation During Past 5 Years |
John C. Swhear, 55,
Chief Compliance Officer, AML Officer and Vice President, August 2008 to present. | | Current: Assistant Vice President and Associate Director of Compliance, Ultimus Fund Solutions, LLC (since December 2015); Chief Compliance Officer, Unified Financial Securities, LLC (since May 2007); Chief Compliance Officer and AML Officer, Capitol Series Trust (since September 2013). Previous: Vice President of Legal Administration and Compliance, Huntington Asset Services, Inc. (n/k/a Ultimus Asset Services, LLC) (April 2007 to December 2015), Director (May 2014 to December 2015); Director, Unified Financial Securities, Inc. (n/k/a Unified Financial Securities, LLC) (May 2014 to December 2015); President, Unified Series Trust (March 2012 to January 2016), Senior Vice President (May 2007 to March 2012); Secretary, Huntington Funds (April 2010 to February 2012). |
Carol J. Highsmith, 51,
Vice President, August 2008 to present; Secretary, March 2014 to present | | Current: Assistant Vice President, Ultimus Fund Solutions, LLC (since December 2015). Previous: Secretary, Cross Shore Discovery Fund (May 2014 to February 2016); Employed in various positions with Huntington Asset Services, Inc. (n/k/a Ultimus Asset Services, LLC) (November 1994 to December 2015), most recently Vice President of Legal Administration (2005 to December 2015). |
Matthew J. Miller, 40,
Vice President, December 2011 to present. | | Current: Assistant Vice President, Relationship Management, Ultimus Fund Solutions, LLC (since December 2015); President and Chief Executive Officer, Capitol Series Trust (since September 2013). Previous: Employed in various positions with Huntington Asset Services, Inc. (n/k/a Ultimus Asset Services, LLC) (since July 1998), most recently Vice President of Relationship Management (2005 to December 2015); Vice President, Huntington Funds (February 2010 to April 2015). |
Bryan W. Ashmus, 43,
Principal Financial Officer and Treasurer, December 2013 to
present. | | Current: Vice President and Director of Financial Administration, Ultimus Fund Solutions, LLC (since December 2015); Chief Financial Officer and Treasurer, Cross Shore Discovery Fund (since June 2016). Previous: Vice President and Manager of Financial Administration, Huntington Asset Services, Inc. (n/k/a Ultimus Asset Services, LLC) (September 2013 to December 2015); Chief Financial Officer and Treasurer, Huntington Strategy Shares and Huntington Funds Trust (November 2013 to April 2016); Vice President, Fund Administration, Citi Fund Services Ohio, Inc. (from May 2005 to September 2013). |
| * | The address for each trustee and officer is 225 Pictoria Drive, Suite 450, Cincinnati, OH 45246. |
Annual Report
34
OTHER INFORMATION
The Fund’s Statement of Additional Information (“SAI”) includes additional information about the Trustees and officers of the Trust and is available without charge, upon request. You may call toll-free at (877) 670-2227 to request a copy of the SAI or to make shareholder inquiries.
Annual Report
35
| | |
Management Renewal Agreement (Unaudited) | | |
At a meeting held on March 30-31, 2016, the Board of Trustees (the “Board”) considered the renewal of the Investment Advisory Agreement (the “Agreement”) between the Valued Advisers Trust (the “Trust”) and Cloud Capital LLC (the “Adviser” or “Cloud Capital”) with respect to the Cloud Capital Strategic All Cap Fund (the “Fund”). Cloud Capital provided written information to the Board to assist the Board in its considerations.
The Board discussed the contractual arrangements between Cloud Capital and the Trust with respect to the Fund. Trust counsel reminded the Trustees of their fiduciary duties and responsibilities as summarized in the memorandum from his firm, including the factors to be considered, and the application of those factors to Cloud Capital. In assessing these factors and reaching its decision, the Board took into consideration information furnished by Cloud Capital and Trust Management for the Board’s review and consideration throughout the year, as well as information specifically prepared or presented in connection with the annual renewal process, including: (i) reports regarding the services and support provided to the Fund and its shareholders by Cloud Capital; (ii) quarterly assessments of the investment performance of the Fund by personnel of Cloud Capital; (iii) commentary on the reasons for the performance; (iv) presentations by Cloud Capital addressing Cloud Capital’s investment philosophy, investment strategy, personnel and operations; (v) compliance and audit reports concerning the Fund and Cloud Capital; (vi) disclosure information contained in the registration statement of the Trust and the Form ADV of Cloud Capital; and (vii) a memorandum from counsel, that summarized the fiduciary duties and responsibilities of the Board in reviewing and approving the Agreement. The Board also requested and received various informational materials including, without limitation: (i) documents containing information about Cloud Capital, including financial information, a description of personnel and the services provided to the Fund, information on investment advice, performance, summaries of Fund expenses, compliance program, current legal matters, and other general information; (ii) comparative expense and performance information for other mutual funds with strategies similar to the Fund; and (iii) benefits to be realized by Cloud Capital from its relationship with the Fund. The Board did not identify any particular information that was most relevant to its consideration to approve the Agreement and each Trustee may have afforded different weight to the various factors.
| 1. | The nature, extent, and quality of the services to be provided by Cloud Capital. In this regard, the Board considered Cloud Capital’s responsibilities under the Agreement. The Trustees considered the services being provided by Cloud Capital to the Fund including, without limitation: the quality of its investment advisory services (including research and recommendations with respect to portfolio securities), its process for formulating investment recommendations and assuring compliance with the Fund’s investment objectives and limitations, its coordination of services for the Fund among the Fund’s service providers, and its efforts to promote the Fund and grow its assets. The Trustees considered Cloud Capital’s continuity of, and commitment to retain, qualified personnel and Cloud Capital’s commitment to maintain and enhance its resources and systems, the commitment of Cloud Capital’s personnel to finding alternatives and options that allow the Fund to maintain its |
Annual Report
36
| | goals, and Cloud Capital’s continued cooperation with the Independent Trustees and counsel for the Fund. The Trustees considered Cloud Capital’s personnel, including the education and experience of Cloud Capital’s personnel. After considering the foregoing information and further information in the meeting materials provided by Cloud Capital (including Cloud Capital’s Form ADV), the Board concluded that, in light of all the facts and circumstances, the nature, extent, and quality of the services provided by Cloud Capital were satisfactory and adequate for the Fund. |
| 2. | Investment Performance of the Fund and Cloud Capital. In considering the investment performance of the Fund and Cloud Capital, the Trustees compared the performance of the Fund with the performance of funds with similar objectives managed by other investment advisers, with aggregated peer group data, as well as with the performance of the Fund’s benchmark for periods as of December 31, 2015 and as of January 31, 2016. The Trustees also considered the consistency of Cloud Capital’s management of the Fund with its investment objectives, strategies, and limitations. The Trustees noted that the Fund’s performance was slightly below that of the peer group average for the one year and three year periods as of December 31, 2015. They also noted that the Fund’s performance generally trailed the benchmark for all periods except the short-term (less than one year) and one year periods as of December 31, 2015. The Trustees noted that the Fund outperformed both the benchmark and the Morningstar category average for the one-year period and for periods less than one year. However, as of January 31, 2016, they noted that the performance had improved notably – it was significantly outpacing the peer group for all periods considered, and it was outpacing the benchmark for all short term periods and performing comparably for the three-year and since inception periods. After reviewing and discussing the investment performance of the Fund further, Cloud Capital’s experience managing the Fund, the Fund’s historical performance, and other relevant factors, the Board concluded, in light of all the facts and circumstances, that the investment performance of the Fund and Cloud Capital was satisfactory. |
| 3. | The costs of the services to be provided and profits to be realized by Cloud Capital from its relationship with the Fund. In considering the costs of services to be provided and the profits to be realized by Cloud Capital from the relationship with the Fund, the Trustees considered: (1) Cloud Capital’s financial condition; (2) the asset level of the Fund; (3) the overall expenses of the Fund; and (4) the nature and frequency of advisory fee payments. The Trustees reviewed information provided by Cloud Capital regarding its profits associated with managing the Fund. The Trustees also considered potential benefits for Cloud Capital in managing the Fund. The Trustees then compared the fees and expenses of the Fund (including the management fee) to other comparable mutual funds. The Trustees recalled that, due to a previous management fee reduction and revisions to the expense limitation arrangements for the Fund, Cloud Capital receives no management fee from the Fund. The Trustees noted that the Fund’s management fee was well below the average and median fees of peers in its category and one of the lowest in its category. The Trustees also noted |
Annual Report
37
Management Renewal Agreement (Unaudited) (continued)
| | that the Fund’s net expense ratio was somewhat higher than that of the peer average and median expense ratio. With regard to the Fund’s fees, the Trustees considered the fact that the Fund is compared to many index funds, which traditionally have lower expense ratios. Based on the foregoing, the Board concluded that the fees to be paid to Cloud Capital by the Fund and the profits to be realized by Cloud Capital, in light of all the facts and circumstances, were fair and reasonable in relation to the nature and quality of the services provided by Cloud Capital. |
| 4. | The extent to which economies of scale would be realized as the Fund grows and whether advisory fee levels reflect these economies of scale for the benefit of the Fund’s investors. In this regard, the Board considered the Fund’s fee arrangements with Cloud Capital. The Board considered that while the management fee remained the same at all asset levels, the shareholders had experienced benefits from the Fund’s expense limitation arrangement and from a previous reduction in the management fee. They also noted Cloud Capital’s agreement to revise the expense limitation arrangements, which effectively eliminated the management fee. The Trustees noted that once the Fund’s expenses fell below the cap set by the arrangement, the shareholders would continue to benefit from the economies of scale under the Trust’s agreement with service providers other than Cloud Capital. In light of its ongoing consideration of the Fund’s asset levels, expectations for growth in the Fund, and fee levels, the Board determined that the Fund’s fee arrangements, in light of all the facts and circumstances, were fair and reasonable in relation to the nature and quality of the services provided by Cloud Capital. |
| 5. | Possible conflicts of interest and benefits to Cloud Capital. In considering Cloud Capital’s practices regarding conflicts of interest, the Trustees evaluated the potential for conflicts of interest and considered such matters as the experience and ability of the advisory personnel assigned to the Fund; the basis of decisions to buy or sell securities for the Fund and/or Cloud Capital’s other accounts; and the substance and administration of Cloud Capital’s code of ethics. The Trustees also considered disclosure in the registration statement of the Trust relating to Cloud Capital’s potential conflicts of interest. The Trustees noted that Cloud Capital does not utilize soft dollars. The Trustees noted other potential benefits to Cloud Capital, such as the ability to market their services in new channels (other than direct separate accounts) and some benefit from press exposure. Based on the foregoing, the Board determined that the standards and practices of Cloud Capital relating to the identification and mitigation of potential conflicts of interest and the benefits to be realized by Cloud Capital in managing the Fund were satisfactory. |
After additional consideration of the factors delineated in the memorandum provided by counsel and further discussion among the Board members, the Board determined to approve the continuation of the Agreement between the Trust and the Adviser.
Annual Report
38
PRIVACY POLICY
The following is a description of the policies of the Valued Advisers Trust (the “Trust”) regarding disclosure of nonpublic personal information that shareholders provide to a series of the Trust (each, a “Fund”) or that the Fund collects from other sources. In the event that a shareholder holds shares of a Fund through a broker-dealer or other financial intermediary, the privacy policy of the financial intermediary would govern how shareholder nonpublic personal information would be shared with nonaffiliated third parties.
Categories of Information a Fund May Collect.
A Fund may collect the following nonpublic personal information about its shareholders:
| • | | Information the Fund receives from a shareholder on applications or other forms, correspondence, or conversations (such as the shareholder’s name, address, phone number, social security number, and date of birth); and |
| • | | Information about the shareholder’s transactions with the Fund, its affiliates, or others (such as the shareholder’s account number and balance, payment history, cost basis information, and other financial information). |
Categories of Information a Fund May Disclose.
A Fund may not disclose any nonpublic personal information about its current or former shareholders to unaffiliated third parties, except as required or permitted by law. A Fund is permitted by law to disclose all of the information it collects, as described above, to its service providers (such as the Fund’s custodian, administrator, transfer agent, accountant and legal counsel) to process shareholder transactions and otherwise provide services to the shareholder.
Confidentiality and Security.
Each Fund shall restrict access to shareholder nonpublic personal information to those persons who require such information to provide products or services to the shareholder. Each Fund shall maintain physical, electronic, and procedural safeguards that comply with federal standards to guard shareholder nonpublic personal information.
Disposal of Information.
The Funds, through their transfer agent, have taken steps to reasonably ensure that the privacy of a shareholder’s nonpublic personal information is maintained at all times, including in connection with the disposal of information that is no longer required to be maintained by the Funds. Such steps shall include, whenever possible, shredding paper documents and records prior to disposal, requiring off-site storage vendors to shred documents maintained in such locations prior to disposal, and erasing and/or obliterating any data contained on electronic media in such a manner that the information can no longer be read or reconstructed.
Annual Report
39
PROXY VOTING
A description of the policies and procedures that the Fund uses to determine how to vote proxies relating to portfolio securities and information regarding how the Fund voted those proxies during the most recent twelve month period ended June 30, is available without charge upon request by (1) calling the Fund at (877) 670-2227 and (2) from Fund documents filed with the Securities and Exchange Commission (“SEC”) on the SEC’s website at www.sec.gov.
TRUSTEES
R. Jeffrey Young, Chairman
Ira P. Cohen
Andrea N. Mullins
OFFICERS
R. Jeffrey Young, Principal Executive Officer and President
Bryan W. Ashmus, Principal Financial Officer and Treasurer
John C. Swhear, Chief Compliance Officer, AML Officer and Vice-President
Carol J. Highsmith, Vice President and Secretary
Matthew J. Miller, Vice President
INVESTMENT ADVISER
Cloud Capital LLC
P.O. Box 451179
Grove, OK 74345
DISTRIBUTOR
Unified Financial Securities, LLC
9465 Counselors Row, Suite 200
Indianapolis, IN 46240
INDEPENDENT REGISTERED PUBLIC ACCOUNTING FIRM
Cohen Fund Audit Services, Ltd.
1350 Euclid Avenue, Suite 800
Cleveland, OH 44115
LEGAL COUNSEL
The Law Offices of John H. Lively & Associates, Inc.
A member firm of The 1940 Act Law Group TM
11300 Tomahawk Creek Parkway, Suite 310
Leawood, KS 66211
CUSTODIAN
FOLIOfn Investments, Inc.
8180 Greensboro Drive
8th Floor
McLean, VA 22102
ADMINISTRATOR, TRANSFER AGENT
AND FUND ACCOUNTANT
Ultimus Asset Services, LLC
225 Pictoria Drive, Suite 450
Cincinnati, OH 45246
This report is intended only for the information of shareholders or those who have received the Fund’s prospectus which contains information about the Fund’s management fee and expenses. Please read the prospectus carefully before investing.
Distributed by Unified Financial Securities, LLC
Member FINRA/SIPC
To Shareholders of the LS Opportunity Fund,
Prospector Partners, LLC (“Prospector”), based in Guilford, CT is the sub-adviser of the LS Opportunity Fund (“LSOFX” or the “Fund”). Prospector has a long/short hedge fund track record that spans 19 years with a substantially similar investment objective to LSOFX and brings its experience to our Fund in a daily liquid mutual fund format with a goal of downside protection and a consistency of returns.
The Fund aims to generate long-term capital appreciation by investing in both long and short positions within a portfolio consisting of primarily publicly-traded common stock, with less net exposure than that of the stock market in general. Through extensive research, risk management, and no leverage in the long book, the Fund strives to preserve capital while delivering solid risk adjusted returns and managing volatility. For additional information, please visit our website at www.longshortadvisors.com.
Market Review
Will 60/40 continue to work anymore? We are at all-time highs in the stock market while simultaneously making new interest rate lows in bonds. At some point, the traditional stock/bond asset allocation strategy is not going to produce the results of the past. Fixed income is flawed precisely because the inverse relationship of eventual rising bond yields will force bond prices lower and create the exact portfolio volatility that bond allocations are supposed to mitigate. In equities, it’s always difficult to make the fiduciary decision to significantly reduce stock exposure. Financial professionals worry the market might run away from us if we don’t participate on one hand or create unsustainable drawdowns if we are fully exposed on the other hand. The long/short strategy employed by Prospector Partners can potentially fit as a solution to take advantage of an eventual rising interest rate environment while also providing net exposure to equities.
Interest and mortgage rates continue near historically low levels. Our best guess (at the risk of looking like a stopped clock) is that longer term rates will be materially higher in five years, although they are unlikely to move much this year. Ultimately, higher rates will likely accompany better economic performance and some inflation, both of which are relative positives for equities compared to bonds. Much depends on the path and pace of interest rates’ return to normalcy.
Equity valuations remain near extended levels, in the ninth decile on trailing operating earnings. We feel we are in the late stages of a bull market, although nothing is certain in the investment world. Equities look reasonable when comparing earnings yields to Treasury or even corporate bond yields. In any case, the values inherent in your portfolio could attract acquirers and other investors over time. Meanwhile, we believe equities are a superior asset allocation alternative to bonds over the longer term.
1
Insurance
The property-casualty insurance industry experienced a great deal of M&A activity through year-end 2015. The Fund benefited meaningfully from several of these transactions during the past fiscal year. In the aggregate, much of the rationale behind the transactions was perfectly sound and could represent the reasoning behind additional deals in the sector, prospectively.
That being said, insurance industry market conditions are becoming more challenging, which would appear to increase the risk that the near-term expected synergies and benefits promised upon deal announcement may not be fully realized. Additionally, investor sentiment towards these deals ranges from constructive to very positive, illustrated by sell-side ratings, earnings estimates, and a relative absence of short interest. In this era of increased M&A activity, we feel that the risk/reward proposition offered by owning potential targets and shorting large integrations (which are often valued as if hitting management targets is a virtual certainty) is favorable. The Fund is also short insurance companies most impaired by low interest rates such as traditional life and annuity businesses, which Prospector believes will continue to face challenges.
Banks
Overall, Prospector believes banks are currently cheap. Having said that, endeavoring to earn profits investing in the financial sector has been an uphill battle since the financial crisis. The S&P Financials index is down approximately 10% since the end of August 2006 when the subprime markets started to buckle (the advent of the great financial crisis), while the overall S&P 500® Index (“S&P 500”) has almost doubled.
The main reasons are declining returns on equity (ROE) for financial companies, which are the result of historic low interest rates and spreads squeezing margins, rising capital requirements and regulatory burdens, and tepid overall economic growth. The silver lining is that the ROE erosion has slowed. Valuations are reasonable and consistent with the low ROE’s that are currently reported. Capital levels have been built to new standards, so managements will have more freedom to allocate future capital generation to more shareholder-friendly options such as share repurchase and dividend hikes. Bankers are adjusting their business models to reduce dependence on interest rates and spread income in favor of higher fees and commissions. Having said this, at some point in the intermediate term, interest rates and the yield curve could be determined by market forces, the traditional mechanism, rather than central bankers who have pegged short rates near zero for the last decade. This could help repair some of the ROE degradation of the last six years. Finally, the game changing effects of new technologies are showing potential to accelerate market share shifts in many sub-sectors of financial services, creating opportunities for existing players as well as disruptive entrants. The goal on the
2
long side is to find well run banks with controlled growth and good capital management. Banks can achieve high single digit returns compounded over time.
Consumer
During the fiscal year ended May 31, 2016 (the “Period”), the Fund covered its short position in Brinker International (EAT) and subsequently went long the stock. Brinker, which operates the Chili’s and Maggiano’s restaurant chains, is a company that Prospector has followed for many years.
Relative to other casual dining companies, Brinker is overly exposed to the “oil markets,” including the company’s home state of Texas. In the company’s current fiscal year (ending June 2016; the fourth quarter will be reported in August), the downturn in the energy patch has resulted in a substantial headwind to same-store restaurant sales. Notably, comps in the “oil markets” declined by 9.1% in Q1, 6.6% in Q2, and 7.6% in Q3. With EPS estimates for fiscal year 2017 down to $3.56 from $4.03, and the prospect for this specific headwind to be “less bad” going forward, Prospector saw an opportunity to cover the Fund’s short position.
Moreover, during the time the Fund was short the stock, Prospector continued to appreciate Brinker’s ability to generate consistent free cash flow and use it in a shareholder-friendly manner. Prospector’s disciplined process of regular site visits, both at Chili’s and other restaurant concepts, left them favorably impressed by the company’s execution of remodel programs and use of technology, both of which enabled the company to deliver better food and service. In addition, these forward-thinking initiatives drove a significant increase in operating margins (from 6.4% in Fiscal 2010 to 10.5% in Fiscal 2015). Ultimately, both the field observations and financial analysis led Prospector to favorably reappraise Brinker’s franchise value and future free cash flow generation. At a free cash flow yield of approximately 6.7%, and a price to earnings ratio of 13x (both on calendar year 2016 numbers), Prospector felt the opportunity was once again compelling to own shares.
3
Performance
The twelve month Period was characterized by continued concern regarding the economic weakness in China, a selloff in oil and other commodities, and historically low interest rates. Overall, LSOFX performed better than the benchmarks, returning 3.8% for the Period while the S&P 500 finished the Period with a return of 1.7%. The HFRX Equity Hedge Index (HFRX) returned -7.7%.
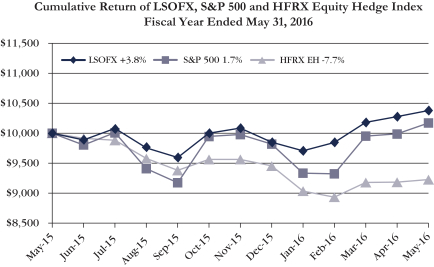
Management Discussion of Fund Performance
Long Book
Top Positions
At Period’s end, the Fund contained 71 long positions in the portfolio representing companies with what management believes represents long-term value and favorable characteristics such as a discount to private market value, attractive free cash flow yields, and strong balance sheets. The Fund’s top 10 long positions represented approximately 26% of the portfolio and included Berkshire Hathaway (BRK.B), T. Rowe Price (TROW), Microsoft (MSFT), Primerica (PRI), PNC Financial (PNC), Johnson & Johnson (JNJ), YUM! Brands (YUM), Patterson (PDCO), Church & Dwight (CHD), and US Bancorp (USB).
Contributors
The five stocks in the long book that contributed the largest returns during the Period, from largest to smallest were: Chubb (CB), StanCorp (SFG), McDonald’s (MCD), Arch Capital (ACGL), and Home Depot (HD). The Fund’s top two securities,
4
Chubb and StanCorp, were acquired during the Period as the insurance industry saw heightened M&A activity.
Detractors
Over the entire twelve month Period, the three stocks in the long book that detracted from returns the most during the Period, from largest to smallest were: Newmont Mining (NEM), Franklin Resources (BEN), and Legg Mason (LM).
Largest Purchases
The top purchases by dollar value in the long book for the Period were: White Mountains (WTM), Beneficial (BNCL), Primerica (PRI), Eaton (ETN), and Berkshire Hathaway (BRK.B).
Largest Sales
The top sales by dollar value in the long book for the Period were: Chubb (CHB), Berkshire Hathaway (BRK.B), McDonald’s (MCD), Arch Capital (ACGL), and Home Depot (HD).
Short Book
Top Positions
The Fund’s short book at Period’s end contained 30 individual companies that Prospector believes have business model challenges, excessive valuations, and/or potential balance sheet issues. The Fund’s top 10 short positions represented approximately 16% of the portfolio.
Risk Management
Risk management strategy is thoroughly embedded throughout our investment process, and it shows. Our top consideration is always, “What can go wrong?” Downside protection is the basis of the LSOFX investment discipline. In addition, LSOFX does not employ leverage on the long side.
Prospector employs the following risk management principles. The portfolio typically operates within a long established net exposure range of between 50%-70% of capital. Prospector “underwrites” each position independently while assessing downside risk as well as upside potential, looking for less financially leveraged companies with strong underlying franchise and asset values as well as owner-oriented management behavior. Prospector often views equities through a credit lens and approaches risk management from a credit analyst’s perspective. Prospector utilizes multiple valuation methods to avoid overreliance on any one metric
5
or investment rationale. In addition there is careful monitoring of position size, liquidity, geography, market cap, beta, and gross and net exposures. Finally, Prospector maintains an alignment of interest with our clients, having significant assets invested alongside clients in all their fund strategies.
Winning by Not Losing
Using strategies designed to protect capital during bear markets, LSOFX strives to compound returns from a higher base during bull markets, thus creating the opportunity to outperform competitive offerings over a complete market cycle.
“The Secret of Wealth Creation is to Avoid Large Losses”
-John Gillespie, portfolio manager
Thank you for your continued support and we look forward to reporting to you again following our semi-annual date of November 30, 2016.
Steadfast, we remain committed to our goal of making you money while protecting your wealth.
Long Short Advisors
The views and opinions expressed in Management’s Discussion of Fund Performance are those of the adviser and sub-adviser as of the end of the period. These views and opinions are subject to change at any time based on factors such as market and economic conditions. These views and opinions may not be relied upon as investment advice or recommendations, or as an offer for a particular security. The information is not a complete analysis of every aspect of any market, country, industry, security or the Fund. Statements of fact are from sources considered reliable, but neither the adviser nor the sub-adviser makes any representation or warranty as to their completeness or accuracy. Although historical performance is no guarantee of future results, these insights may help you understand our investment management philosophy.
The S&P 500® Index is a widely recognized, unmanaged index of equity prices and is representative of a broader market and range of securities than is found in the Fund’s portfolio. The index is an unmanaged benchmark that assumes reinvestment of all distributions and excludes the effect of taxes and fees. Individuals cannot invest directly in this index; however, an individual can invest in exchange traded funds or other investment vehicles that attempt to track the performance of a benchmark index.
HFRX Equity Hedge Index is compiled by Hedge Fund Research, Inc. It is comprised solely of hedge funds, and is designed to be representative of the overall composition of the hedge fund universe implementing a long/short equity strategy. The Fund’s performance is not intended to reflect the performance of the index, which is provided for comparison purposes only. The index is not available for direct investment.
6
Investment Results – (Unaudited)
| | | | | | | | | | | | | | | | |
Average Annual Total Returns(a) | |
(For the periods ended May 31, 2016) | |
| | | | | |
| | | One Year | | | Three Year | | | Five Year | | | Since Inception
(September 30, 2010) | |
LS Opportunity Fund | | | 3.80 | % | | | 4.60 | % | | | 3.82 | % | | | 5.86 | % |
S&P 500® Index(b) | | | 1.72 | % | | | 11.06 | % | | | 11.67 | % | | | 13.67 | % |
Total annual operating expenses, as disclosed in the LS Opportunity Fund’s (the “Fund”) prospectus dated September 25, 2015, were 2.96% of average daily net assets (2.51% after fee waivers and expense reimbursements by Long Short Advisors, LLC (the “Adviser”)). The Adviser has entered into an amended expense limitation agreement, pursuant to which it will waive its fees and/or reimburse other expenses of the Fund until September 30, 2016, so that Total Annual Fund Operating Expenses does not exceed 1.95%. This operating expense limitation does not apply to interest, taxes, brokerage commissions, other expenditures which are capitalized in accordance with generally accepted accounting principles, other extraordinary expenses not incurred in the ordinary course of the Fund’s business, dividend expense on short sales, expenses incurred under a Rule 12b-1 plan of distribution, “acquired fund fees and expenses,” and expenses that the Fund has incurred but did not actually pay because of an expense offset arrangement. Each waiver or reimbursement of an expense by the Adviser is subject to repayment by the Fund within the three fiscal years following the fiscal year in which the expense was incurred, provided that the Fund is able to make the repayment without exceeding the expense limitation in place at the time of the waiver or reimbursement. This agreement may only be terminated by mutual consent of the Adviser and the Board of Trustees.
The performance quoted represents past performance, which does not guarantee future results. The investment return and principal value of an investment will fluctuate so that an investor’s shares, when redeemed, may be worth more or less than their original cost. The returns shown do not reflect deduction of taxes that a shareholder would pay on Fund distributions or the redemption of Fund shares. Prior to May 28, 2015, the Fund’s performance was attributable to a previous sub-adviser. The Fund’s investment objectives, risks, charges and expenses must be considered carefully before investing. Current performance of the Fund may be lower or higher than the performance quoted. Performance data current to the most recent month end may be obtained by calling 1-877-336-6763.
(a) Average annual total returns reflect any change in price per share and assume the reinvestment of all distributions, if any. The Fund’s returns reflect any fee reductions during the applicable periods. If such fee reductions had not occurred, the quoted performance would have been lower.
(b) The S&P 500® Index (“Index”) is a widely recognized unmanaged index of equity prices and is representative of a broader market and range of securities than is found in the Fund’s portfolio. The Index is an unmanaged benchmark
7
that assumes reinvestment of all distributions and excludes the effect of taxes and fees. Individuals cannot invest directly in this Index; however, an individual can invest in exchange traded funds or other investment vehicles that attempt to track the performance of a benchmark index.
The Fund’s investment objectives, risks, charges and expenses must be considered carefully before investing. The prospectus contains this and other important information about the investment company and may be obtained by calling 1-877-336-6763. Please read it carefully before investing.
The Fund is distributed by Unified Financial Securities, LLC, Member FINRA/SIPC.
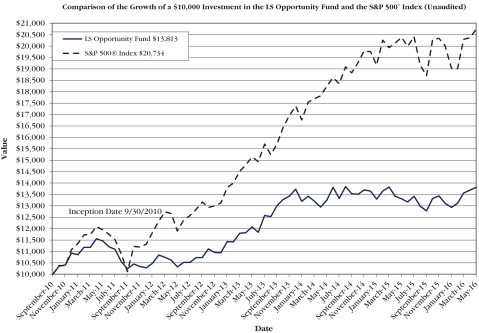
The chart above assumes an initial investment of $10,000 made on September 30, 2010 (commencement of Fund operations) and held through May 31, 2016. THE FUND’S RETURNS REPRESENT PAST PERFORMANCE AND DO NOT GUARANTEE FUTURE RESULTS. The returns shown do not reflect deduction of taxes that a shareholder would pay on the Fund’s distributions or the redemption of the Fund’s shares. Investment returns and principal values will fluctuate so that your shares, when redeemed, may be worth more or less than their original purchase price.
Current performance may be lower or higher than the performance data quoted. For more information on the Fund, and to obtain performance data current to the most recent month-end, or to request a prospectus, please call (877) 336-6763. You should carefully consider the investment objectives, potential risks, management fees, and charges and expenses of the Fund before investing. The Fund’s prospectus contains this and other information about the Fund, and should be read carefully before investing.
The Fund is distributed by Unified Financial Securities, LLC, member FINRA/SIPC.
8
Fund Holdings – (Unaudited)
Sector Exposure (5/31/2016)
(Based on Net Assets)
| | | | | | | | | | | | | | | | |
| | | Long | | | Short | | | Gross | | | Net | |
Consumer Discretionary | | | 6.85 | % | | | 0.00 | % | | | 6.85 | % | | | 6.85 | % |
Consumer Staples | | | 10.64 | % | | | -3.32 | % | | | 13.96 | % | | | 7.32 | % |
Energy | | | 3.28 | % | | | -0.64 | % | | | 3.92 | % | | | 2.64 | % |
Financials | | | 43.39 | % | | | -21.75 | % | | | 65.14 | % | | | 21.64 | % |
Health Care | | | 6.76 | % | | | 0.00 | % | | | 6.76 | % | | | 6.76 | % |
Industrials | | | 5.99 | % | | | -1.57 | % | | | 7.56 | % | | | 4.42 | % |
Information Technology | | | 11.34 | % | | | -0.44 | % | | | 11.78 | % | | | 10.90 | % |
Materials | | | 1.02 | % | | | 0.00 | % | | | 1.02 | % | | | 1.02 | % |
Real Estate Investment Trusts | | | 0.64 | % | | | 0.00 | % | | | 0.64 | % | | | 0.64 | % |
Unclassified | | | 0.23 | % | | | 0.00 | % | | | 0.23 | % | | | 0.23 | % |
| | | | | | | | | | | | | | | | |
Total | | | 90.14 | % | | | -27.72 | % | | | 117.86 | % | | | 62.42 | % |
| | | | | | | | | | | | | | | | |
The LS Opportunity Fund seeks to generate long term capital appreciation by investing in both long and short positions within a portfolio consisting of primarily publicly-traded common stock, with less risk than that of the stock market in general.
Availability of Portfolio Schedule – (Unaudited)
The Fund files its complete schedule of portfolio holdings with the Securities and Exchange Commission (“SEC”) for the first and third quarters of each fiscal year on Form N-Q. The Fund’s Forms N-Q are available at the SEC’s website at www.sec.gov. The Forms N-Q may be reviewed and copied at the Public Reference Room in Washington DC. Information on the operation of the Public Reference Room may be obtained by calling (800) SEC-0330.
9
LS Opportunity Fund
Schedule of Investments
May 31, 2016
| | | | | | | | |
| Common Stocks — Long — Domestic – 79.31% | | Shares | | | Fair Value | |
Consumer Discretionary – 6.85% | | | | | | | | |
Brinker International, Inc. | | | 3,000 | | | $ | 134,910 | |
Darden Restaurants, Inc.(a) | | | 2,600 | | | | 176,358 | |
Home Depot, Inc./The(a) | | | 1,800 | | | | 237,816 | |
Hyatt Hotels Corp. – Class A* | | | 2,200 | | | | 101,002 | |
Lowe’s Companies, Inc. | | | 4,300 | | | | 344,559 | |
McDonald’s Corp.(a) | | | 1,900 | | | | 231,914 | |
Yum! Brands, Inc.(a) | | | 6,050 | | | | 496,644 | |
| | | | | | | | |
| | | | | | | 1,723,203 | |
| | | | | | | | |
Consumer Staples – 9.08% | | | | | | | | |
Church & Dwight Co., Inc.(a) | | | 4,800 | | | | 472,704 | |
Coca-Cola Co./The(a) | | | 5,900 | | | | 263,140 | |
Colgate-Palmolive Co.(a) | | | 4,300 | | | | 302,763 | |
Mondelez International, Inc. – Class A(a) | | | 9,000 | | | | 400,410 | |
PepsiCo, Inc.(a) | | | 2,200 | | | | 222,574 | |
Procter & Gamble Co./The(a) | | | 5,500 | | | | 445,720 | |
Wal-Mart Stores, Inc.(a) | | | 2,500 | | | | 176,950 | |
| | | | | | | | |
| | | | | | | 2,284,261 | |
| | | | | | | | |
Energy – 2.02% | | | | | | | | |
Hess Corp. | | | 2,500 | | | | 149,825 | |
Noble Energy, Inc. | | | 10,000 | | | | 357,500 | |
| | | | | | | | |
| | | | | | | 507,325 | |
| | | | | | | | |
Financials – 37.74% | | | | | | | | |
Aflac, Inc.(a) | | | 5,100 | | | | 354,246 | |
Beneficial Bancorp, Inc.(a)* | | | 18,300 | | | | 251,991 | |
Berkshire Hathaway, Inc. – Class B(a)* | | | 12,200 | | | | 1,714,588 | |
Central Pacific Financial Corp.(a) | | | 9,200 | | | | 220,524 | |
Citigroup, Inc.(a) | | | 9,700 | | | | 451,729 | |
Federated Investors, Inc. – Class B | | | 13,600 | | | | 439,552 | |
Franklin Resources, Inc.(a) | | | 3,500 | | | | 130,725 | |
Hartford Financial Services Group, Inc./The | | | 7,900 | | | | 356,843 | |
Investors Bancorp, Inc. | | | 20,100 | | | | 240,597 | |
KeyCorp | | | 24,700 | | | | 316,654 | |
Legg Mason, Inc.(a) | | | 8,100 | | | | 279,450 | |
Leucadia National Corp.(a) | | | 20,600 | | | | 372,860 | |
Marsh & McLennan Cos., Inc.(a) | | | 3,900 | | | | 257,673 | |
See accompanying notes which are an integral part of these financial statements.
10
LS Opportunity Fund
Schedule of Investments – continued
May 31, 2016
| | | | | | | | |
| Common Stocks — Long — Domestic – 79.31% – continued | | Shares | | | Fair Value | |
Financials – 37.74% – continued | | | | | | | | |
MetLife, Inc. | | | 7,000 | | | $ | 318,850 | |
Oritani Financial Corp.(a) | | | 12,000 | | | | 201,000 | |
PJT Partners, Inc. – Class A | | | 6,900 | | | | 179,124 | |
PNC Financial Services Group, Inc.(a) | | | 5,900 | | | | 529,466 | |
Primerica, Inc.(a) | | | 9,500 | | | | 533,045 | |
ProAssurance Corp.(a) | | | 5,400 | | | | 283,446 | |
Progressive Corp./The(a) | | | 11,600 | | | | 386,280 | |
Selective Insurance Group, Inc. | | | 4,200 | | | | 156,030 | |
T. Rowe Price Group, Inc.(a) | | | 9,300 | | | | 716,658 | |
Torchmark Corp. | | | 5,600 | | | | 345,128 | |
U.S. Bancorp(a) | | | 10,600 | | | | 453,892 | |
| | | | | | | | |
| | | | | | | 9,490,351 | |
| | | | | | | | |
Health Care – 5.65% | | | | | | | | |
Abbott Laboratories(a) | | | 5,300 | | | | 210,039 | |
Invacare Corp.(a) | | | 5,200 | | | | 55,640 | |
Johnson & Johnson(a) | | | 4,500 | | | | 507,105 | |
Merck & Co., Inc.(a) | | | 3,100 | | | | 174,406 | |
Patterson Companies, Inc.(a) | | | 9,700 | | | | 473,457 | |
| | | | | | | | |
| | | | | | | 1,420,647 | |
| | | | | | | | |
Industrials – 5.99% | | | | | | | | |
Celadon Group, Inc. | | | 16,800 | | | | 165,984 | |
CIRCOR International, Inc. | | | 4,900 | | | | 274,596 | |
Eaton Corp. PLC(a) | | | 6,200 | | | | 382,106 | |
General Dynamics Corp. | | | 1,800 | | | | 255,366 | |
Kirby Corp.* | | | 2,100 | | | | 147,168 | |
United Technologies Corp. | | | 2,800 | | | | 281,624 | |
| | | | | | | | |
| | | | | | | 1,506,844 | |
| | | | | | | | |
Information Technology – 11.34% | | | | | | | | |
Automatic Data Processing, Inc.(a) | | | 4,700 | | | | 412,848 | |
eBay, Inc.(a)* | | | 4,100 | | | | 100,286 | |
FLIR Systems, Inc.(a) | | | 11,300 | | | | 351,995 | |
Microsoft Corp.(a) | | | 13,500 | | | | 715,500 | |
Paychex, Inc.(a) | | | 4,100 | | | | 222,302 | |
PayPal Holdings, Inc.(a)* | | | 8,100 | | | | 306,099 | |
Science Applications International Corp.(a) | | | 6,700 | | | | 365,619 | |
See accompanying notes which are an integral part of these financial statements.
11
LS Opportunity Fund
Schedule of Investments – continued
May 31, 2016
| | | | | | | | |
| Common Stocks — Long — Domestic – 79.31% – continued | | Shares | | | Fair Value | |
Information Technology – continued | | | | | | | | |
VeriSign, Inc.(a)* | | | 1,700 | | | $ | 145,282 | |
Xilinx, Inc.(a) | | | 4,900 | | | | 232,211 | |
| | | | | | | | |
| | | | | | | 2,852,142 | |
| | | | | | | | |
Real Estate Investment Trusts – 0.64% | | | | | | | | |
Four Corners Property Trust, Inc.(a) | | | 1,298 | | | | 25,233 | |
Parkway Properties, Inc.(a) | | | 7,700 | | | | 134,365 | |
| | | | | | | | |
| | | | | | | 159,598 | |
| | | | | | | | |
TOTAL COMMON STOCKS – LONG – DOMESTIC (Cost $19,191,503) | | | | | | | 19,944,371 | |
| | | | | | | | |
Common Stocks – Long — International – 10.60% | | | | | | | | |
Consumer Staples – 1.56% | | | | | | | | |
Diageo PLC ADR(a) | | | 3,600 | | | | 392,868 | |
| | | | | | | | |
Energy – 1.26% | | | | | | | | |
Suncor Energy, Inc. | | | 11,500 | | | | 317,975 | |
| | | | | | | | |
Financials – 5.65% | | | | | | | | |
Arch Capital Group Ltd.(a)* | | | 4,900 | | | | 356,034 | |
Endurance Specialty Holdings Ltd.(a) | | | 6,150 | | | | 417,708 | |
RenaissanceRe Holdings Ltd.(a) | | | 2,770 | | | | 319,963 | |
Validus Holdings Ltd. | | | 6,700 | | | | 326,223 | |
| | | | | | | | |
| | | | | | | 1,419,928 | |
| | | | | | | | |
Health Care – 1.11% | | | | | | | | |
AstraZeneca PLC ADR | | | 4,100 | | | | 121,770 | |
Roche Holding AG | | | 600 | | | | 157,453 | |
| | | | | | | | |
| | | | | | | 279,223 | |
| | | | | | | | |
Materials – 1.02% | | | | | | | | |
Agnico Eagle Mines Ltd. | | | 5,700 | | | | 256,044 | |
| | | | | | | | |
TOTAL COMMON STOCKS – LONG – INTERNATIONAL (Cost $2,446,388) | | | | | | | 2,666,038 | |
| | | | | | | | |
See accompanying notes which are an integral part of these financial statements.
12
LS Opportunity Fund
Schedule of Investments – continued
May 31, 2016
| | | | | | | | |
| Options Purchased – Long* – 0.23% | | Contracts | | | Fair Value | |
Brinker International, Inc., Call @ $50, Expiring October 2016 | | | 41 | | | $ | 3,895 | |
Chubb Ltd., Put @ $110, Expiring August 2016 | | | 34 | | | | 2,040 | |
Chubb Ltd., Put @ $110, Expiring November 2016 | | | 25 | | | | 5,375 | |
Cincinnati Financial Corp., Put @ $60, Expiring September 2016 | | | 34 | | | | 1,360 | |
Citigroup, Inc., Call @ $50, Expiring December 2016 | | | 29 | | | | 5,945 | |
Lowe’s Companies, Inc., Call @ $80, Expiring January 2017 | | | 16 | | | | 8,480 | |
Lowes Companies, Inc., Call @ $80, Expiring October 2016 | | | 6 | | | | 2,340 | |
Everest Re Group Ltd., Put @ $175, Expiring October 2016 | | | 3 | | | | 1,905 | |
Lockheed Martin Corp., Put @ $225, Expiring September 2016 | | | 10 | | | | 4,600 | |
MetLife, Inc., Call @ $50, Expiring January 2017 | | | 29 | | | | 4,031 | |
MetLife, Inc., Call @ $52.50, Expiring January 2017 | | | 50 | | | | 3,800 | |
MetLife, Inc., Call @ $52.50, Expiring January 2018 | | | 10 | | | | 2,380 | |
MetLife, Inc., Call @ $55, Expiring January 2018 | | | 10 | | | | 1,750 | |
Mondelez International, Inc., Call @ $50, Expiring January 2017 | | | 46 | | | | 6,026 | |
Willis Towers Watson PLC, Put @ $110, Expiring October 2016 | | | 17 | | | | 2,720 | |
| | | | | | | | |
TOTAL OPTIONS PURCHASED – LONG (Cost $69,126) | | | | | | | 56,647 | |
| | | | | | | | |
TOTAL INVESTMENTS – 90.14% (Cost $21,707,017) | | | | | | | 22,667,056 | |
| | | | | | | | |
TOTAL SECURITIES SOLD SHORT – (27.72)% (Proceeds Received $6,832,859) | | | | | | | (6,971,168 | ) |
| | | | | | | | |
Other Assets in Excess of Liabilities – 37.58% | | | | | | | 9,452,588 | |
| | | | | | | | |
NET ASSETS – 100.00% | | | | | | $ | 25,148,476 | |
| | | | | | | | |
| (a) | All or a portion of the security is held as collateral for securities sold short. The fair value of this collateral on May 31, 2016 was $15,006,212. |
| * | Non-income producing security. |
ADR – American Depositary Receipt
The sectors shown on the schedule of investments are based on the Global Industry Classification Standard, or GICS® (“GICS”). The GICS was developed by and/or is the exclusive property of MSCI, Inc. and Standard & Poor Financial Services LLC (“S&P”). GICS is a service mark of MSCI, Inc. and S&P and has been licensed for use by Ultimus Asset Services, LLC.
See accompanying notes which are an integral part of these financial statements.
13
LS Opportunity Fund
Schedule of Securities Sold Short
May 31, 2016
| | | | | | | | |
| Common Stocks – Short — Domestic – (15.52)% | | Shares | | | Fair Value | |
Consumer Staples – (3.32)% | | | | | | | | |
Constellation Brands, Inc. – Class A | | | (800 | ) | | $ | (122,520 | ) |
Kellogg Co. | | | (3,300 | ) | | | (245,421 | ) |
Molson Coors Brewing Co.– Class B | | | (4,700 | ) | | | (466,146 | ) |
| | | | | | | | |
| | | | | | | (834,087 | ) |
| | | | | | | | |
Energy – (0.64)% | | | | | | | | |
Chevron Corp. | | | (1,600 | ) | | | (161,600 | ) |
| | | | | | | | |
Financials – (9.55)% | | | | | | | | |
Allstate Corp. | | | (1,900 | ) | | | (128,269 | ) |
American Financial Group, Inc. | | | (1,800 | ) | | | (131,904 | ) |
Ameriprise Financial, Inc. | | | (3,300 | ) | | | (335,511 | ) |
AmTrust Financial Services, Inc. | | | (8,300 | ) | | | (220,116 | ) |
Arthur J Gallagher & Co. | | | (7,100 | ) | | | (343,143 | ) |
Cincinnati Financial Corp. | | | (4,900 | ) | | | (338,590 | ) |
CVB Financial Corp. | | | (2,100 | ) | | | (36,855 | ) |
Eaton Vance Corp. | | | (1,400 | ) | | | (50,904 | ) |
Employers Holdings, Inc. | | | (1,300 | ) | | | (38,805 | ) |
Horace Mann Educators Corp. | | | (5,800 | ) | | | (197,548 | ) |
Markel Corp.* | | | (265 | ) | | | (252,545 | ) |
Trustmark Corp. | | | (5,800 | ) | | | (143,724 | ) |
Unum Group | | | (5,000 | ) | | | (184,600 | ) |
| | | | | | | | |
| | | | | | | (2,402,514 | ) |
| | | | | | | | |
Industrials – (1.57)% | | | | | | | | |
Lockheed Martin Corp. | | | (1,100 | ) | | | (259,853 | ) |
Union Pacific Corp. | | | (1,600 | ) | | | (134,704 | ) |
| | | | | | | | |
| | | | | | | (394,557 | ) |
| | | | | | | | |
Information Technology – (0.44)% | | | | | | | | |
Apple, Inc. | | | (1,100 | ) | | | (109,846 | ) |
| | | | | | | | |
TOTAL COMMON STOCKS – SHORT – DOMESTIC (Proceeds Received $3,716,122) | | | | | | | (3,902,604 | ) |
| | | | | | | | |
See accompanying notes which are an integral part of these financial statements.
14
LS Opportunity Fund
Schedule of Securities Sold Short – continued
May 31, 2016
| | | | | | | | |
| Common Stocks – Short – International – (12.20)% | | Shares | | | Fair Value | |
Financials – (12.20)% | | | | | | | | |
Chubb Ltd. | | | (3,558 | ) | | $ | (450,478 | ) |
Comdirect Bank AG | | | (1,700 | ) | | | (18,793 | ) |
Commonwealth Bank of Australia | | | (9,300 | ) | | | (521,675 | ) |
Everest Re Group Ltd. | | | (2,100 | ) | | | (376,131 | ) |
HSBC Holdings PLC ADR | | | (3,500 | ) | | | (113,540 | ) |
Third Point Reinsurance Ltd.* | | | (9,100 | ) | | | (106,470 | ) |
UBS Group AG* | | | (14,600 | ) | | | (224,694 | ) |
Westpac Banking Corp. | | | (11,869 | ) | | | (263,973 | ) |
Willis Towers Watson PLC | | | (4,106 | ) | | | (525,650 | ) |
XL Group PLC | | | (13,600 | ) | | | (467,160 | ) |
| | | | | | | | |
TOTAL COMMON STOCKS – SHORT – INTERNATIONAL (Proceeds Received $3,116,737) | | | | | | | (3,068,564 | ) |
| | | | | | | | |
TOTAL SECURITIES SOLD SHORT – (27.72)% (Proceeds Received $6,832,859) | | | | | | $ | (6,971,168 | ) |
| | | | | | | | |
| * | Non-dividend expense producing security. |
ADR – American Depositary Receipt
The sectors shown on the schedule of securities sold short are based on the Global Industry Classification Standard, or GICS® (“GICS”). The GICS was developed by and/or is the exclusive property of MSCI, Inc. and Standard & Poor Financial Services LLC (“S&P”). GICS is a service mark of MSCI, Inc. and S&P and has been licensed for use by Ultimus Asset Services, LLC.
See accompanying notes which are an integral part of these financial statements.
15
LS Opportunity Fund
Statement of Assets and Liabilities
May 31, 2016
| | | | |
Assets | | | | |
Investments in securities at fair value (cost $21,707,017) | | $ | 22,667,056 | |
Cash(a) | | | 9,498,997 | |
Foreign currencies, at value (Cost $5,710) | | | 5,567 | |
Receivable for fund shares sold | | | 30,100 | |
Dividends receivable | | | 30,337 | |
Tax reclaims receivable | | | 1,141 | |
Prepaid expenses | | | 19,537 | |
| | | | |
Total Assets | | | 32,252,735 | |
| | | | |
Liabilities | | | | |
Investment securities sold short, at fair value (proceeds $6,832,859) | | | 6,971,168 | |
Payable for fund shares redeemed | | | 50,461 | |
Payable for investments purchased | | | 1,062 | |
Dividend expense payable on short positions | | | 23,103 | |
Payable to Adviser | | | 12,525 | |
Payable to administrator, fund accountant, and transfer agent | | | 9,131 | |
Other accrued expenses | | | 36,809 | |
| | | | |
Total Liabilities | | | 7,104,259 | |
| | | | |
| |
Net Assets | | $ | 25,148,476 | |
| | | | |
| |
Net Assets consist of: | | | | |
Paid-in capital | | $ | 24,917,553 | |
Accumulated undistributed net investment income/(loss) | | | (117,395 | ) |
Accumulated undistributed net realized gain/(loss) from investments | | | (473,432 | ) |
Net unrealized appreciation/(depreciation) on: | | | | |
Investment securities and securities sold short | | | 821,730 | |
Foreign currency | | | 20 | |
| | | | |
Net Assets | | $ | 25,148,476 | |
| | | | |
Shares outstanding (unlimited number of shares authorized, no par value) | | | 2,058,434 | |
| | | | |
Net asset value ("NAV") and offering price per share | | $ | 12.22 | |
| | | | |
Redemption price per share (NAV * 98%)(b) | | $ | 11.98 | |
| | | | |
| (a) | See Note 2 in the Notes to Financial Statements regarding restricted cash. |
| (b) | The Fund charges a 2.00% redemption fee on shares redeemed in 60 days or less of purchase. Shares are redeemed at the NAV if held longer than 60 calendar days. |
See accompanying notes which are an integral part of these financial statements.
16
LS Opportunity Fund
Statement of Operations
For the year ended May 31, 2016
| | | | |
Investment Income | | | | |
Dividend income (net of foreign taxes withheld of $1,103) | | $ | 700,324 | |
| | | | |
Total investment income | | | 700,324 | |
| | | | |
Expenses | | | | |
Investment Adviser | | | 673,809 | |
Administration | | | 42,267 | |
Fund accounting | | | 38,794 | |
Transfer agent | | | 36,533 | |
Legal | | | 123,625 | |
Audit | | | 19,500 | |
Trustee | | | 19,972 | |
Compliance services | | | 3,000 | |
Miscellaneous | | | 170,359 | |
Other – short sale interest & overdraft expense | | | 101,229 | |
Dividend expense on securities sold short | | | 277,410 | |
| | | | |
Total expenses | | | 1,506,498 | |
Fees waived by Adviser | | | (380,899 | ) |
| | | | |
Net operating expenses | | | 1,125,599 | |
| | | | |
Net investment income/(loss) | | | (425,275 | ) |
| | | | |
Net Realized and Unrealized Gain/(Loss) | | | | |
Net realized gain/(loss) on: | | | | |
Investment securities | | | (254,277 | ) |
Securities sold short | | | (28,769 | ) |
Foreign currency | | | 11,533 | |
Change in unrealized appreciation/(depreciation) on: | | | | |
Investment securities | | | 1,362,187 | |
Securities sold short | | | (192,991 | ) |
Foreign currency | | | 700 | |
| | | | |
Net realized and unrealized gain/(loss) on investment securities, securities sold short and foreign currency | | | 898,383 | |
| | | | |
Net increase (decrease) in net assets resulting from operations | | $ | 473,108 | |
| | | | |
See accompanying notes which are an integral part of these financial statements.
17
LS Opportunity Fund
Statement of Cash Flows
For the year ended May 31, 2016
| | | | |
Increase/(Decrease) in Cash | | | | |
Cash flows from operating activities: | | | | |
Net increase in net assets resulting from operations | | $ | 473,108 | |
| |
Adjustments to reconcile net increase in net assets from operations to net cash used in operating activities: | | | | |
Purchases and sales of short-term securities, net | | | (9,865 | ) |
Purchases of long-term securities | | | (42,132,922 | ) |
Sales of long-term securities | | | 83,089,749 | |
Proceeds from return of capital | | | 57,919 | |
Decrease in dividends and interest receivable | | | 23,358 | |
Increase in expense payable on short positions | | | 19,552 | |
Decrease in receivable for investments sold | | | 97,338,450 | |
Decrease in payable for investments purchased | | | (108,273,187 | ) |
Decrease in payable to Adviser | | | (153,429 | ) |
Increase in receivable for tax reclaims | | | (1,141 | ) |
Increase in prepaid expenses | | | (2,110 | ) |
Decrease in accrued expenses and expenses payable | | | (14,519 | ) |
Net realized loss on investment transactions | | | 283,046 | |
Change in unrealized appreciation/(depreciation) on investments | | | (1,169,196 | ) |
| | | | |
Net cash provided from operating activities | | | 29,528,813 | |
| | | | |
| |
Cash flows from financing activities: | | | | |
Proceeds from shares sold | | | 3,762,213 | |
Payment from redemption of shares | | | (76,526,638 | ) |
Cash distributions paid | | | (72,457 | ) |
| | | | |
Net cash used in financing activities | | | (72,836,882 | ) |
| | | | |
| |
Net change in cash | | $ | (43,308,069 | ) |
| |
Cash and foreign currencies balance beginning of year | | $ | 52,812,633 | |
| | | | |
Cash and foreign currencies balance end of year | | $ | 9,504,564 | |
| | | | |
Supplemental disclosure of cash flow information:
Short sale interest & overdraft expense paid: $101,229.
See accompanying notes which are an integral part of these financial statements.
18
LS Opportunity Fund
Statements of Changes in Net Assets
| | | | | | | | |
| | | For the Year
Ended
May 31, 2016 | | | For the Year
Ended
May 31, 2015 | |
Increase (Decrease) in Net Assets due to: | | | | | | | | |
Operations | | | | | | | | |
Net investment income/(loss) | | $ | (425,275 | ) | | $ | (2,963,413 | ) |
Net realized gain/(loss) on investment transactions | | | (271,513 | ) | | | 13,997,559 | |
Net change in unrealized appreciation (depreciation) of investments | | | 1,169,896 | | | | (9,488,654 | ) |
| | | | | | | | |
Net increase (decrease) in net assets resulting from operations | | | 473,108 | | | | 1,545,492 | |
| | | | | | | | |
Distributions | | | | | | | | |
From net realized gains | | | (4,087,143 | ) | | | (3,344,132 | ) |
| | | | | | | | |
Total distributions | | | (4,087,143 | ) | | | (3,344,132 | ) |
| | | | | | | | |
Capital Transactions | | | | | | | | |
Proceeds from shares sold | | | 3,781,205 | | | | 100,954,218 | |
Reinvestment of distributions | | | 4,014,686 | | | | 3,259,260 | |
Amount paid for shares redeemed | | | (75,311,472 | ) | | | (156,003,469 | ) |
Proceeds from redemption fees (a) | | | 9,374 | | | | — | |
| | | | | | | | |
Net increase (decrease) in net assets resulting from capital transactions | | | (67,506,207 | ) | | | (51,789,991 | ) |
| | | | | | | | |
Total Increase (Decrease) in Net Assets | | | (71,120,242 | ) | | | (53,588,631 | ) |
| | | | | | | | |
Net Assets | | | | | | | | |
Beginning of year | | | 96,268,718 | | | | 149,857,349 | |
| | | | | | | | |
End of year | | $ | 25,148,476 | | | $ | 96,268,718 | |
| | | | | | | | |
Accumulated undistributed net investment income/(loss) included in net assets at end of year | | $ | (117,395 | ) | | $ | (9,702 | ) |
| | | | | | | | |
Share Transactions | | | | | | | | |
Shares sold | | | 320,085 | | | | 7,821,644 | |
Shares issued in reinvestment of distributions | | | 338,581 | | | | 253,639 | |
Shares redeemed | | | (6,270,268 | ) | | | (12,187,993 | ) |
| | | | | | | | |
Net increase (decrease) in share transactions | | | (5,611,602 | ) | | | (4,112,710 | ) |
| | | | | | | | |
| (a) | The Fund charges a 2% redemption fee on shares redeemed in 60 days or less of purchase. Share are redeemed at the NAV if held longer than 60 calendar days. |
See accompanying notes which are an integral part of these financial statements.
19
LS Opportunity Fund
Financial Highlights
(For a share outstanding during each year)
| | | | | | | | | | | | | | | | | | | | |
| | | For the Fiscal
Year Ended
May 31, 2016 | | | For the Fiscal
Year Ended
May 31, 2015 | | | For the Fiscal
Year Ended
May 31, 2014 | | | For the Fiscal
Year Ended
May 31, 2013 | | | For the Fiscal
Year Ended
May 31, 2012 | |
Selected Per Share Data: | | | | | | | | | | | | | | | | | | | | |
Net asset value, beginning of year | | $ | 12.55 | | | $ | 12.72 | | | $ | 12.04 | | | $ | 10.29 | | | $ | 11.45 | |
| | | | | | | | | | | | | | | | | | | | |
Income from investment operations: | | | | | | | | | | | | | | | | | | | | |
Net investment income/(loss) | | | (0.21 | ) | | | (0.42 | ) | | | (0.26 | )(a) | | | (0.24 | )(a) | | | (0.23 | )(a) |
Net realized and unrealized gain/(loss) on investments | | | 0.66 | | | | 0.49 | | | | 1.44 | | | | 1.99 | | | | (0.91 | ) |
| | | | | | | | | | | | | | | | | | | | |
Total from investment operations | | | 0.45 | | | | 0.07 | | | | 1.18 | | | | 1.75 | | | | (1.14 | ) |
| | | | | | | | | | | | | | | | | | | | |
Less Distributions to Shareholders: | | | | | | | | | | | | | | | | | | | | |
From net realized gains | | | (0.78 | ) | | | (0.24 | ) | | | (0.50 | ) | | | — | | | | (0.02 | ) |
| | | | | | | | | | | | | | | | | | | | |
Redemption fees | | | — | (b) | | | — | | | | — | (b) | | | — | (b) | | | — | (b) |
| | | | | | | | | | | | | | | | | | | | |
Net asset value, end of year | | $ | 12.22 | | | $ | 12.55 | | | $ | 12.72 | | | $ | 12.04 | | | $ | 10.29 | |
| | | | | | | | | | | | | | | | | | | | |
Total Return(c)(d) | | | 3.80 | % | | | 0.50 | % | | | 9.72 | % | | | 17.01 | % | | | (9.92 | )% |
Ratios and Supplemental Data: | | | | | | | | | | | | | | | | | | | | |
Net assets, end of year (000) | | $ | 25,148 | | | $ | 96,269 | | | $ | 149,857 | | | $ | 37,750 | | | $ | 48,864 | |
Ratio of expenses to average net assets(e) | | | 2.93 | % | | | 2.51 | % | | | 2.49 | % | | | 3.12 | %(f) | | | 3.16 | % |
Ratio of net expenses to average net assets before waiver and reimbursement/recoupment by Adviser(e) | | | 3.92 | % | | | 2.60 | % | | | 2.71 | % | | | 3.12 | % | | | 3.06 | % |
Ratio of net investment income/(loss) to average net assets | | | (1.11 | )% | | | (1.72 | )% | | | (2.04 | )% | | | (2.22 | )% | | | (2.19 | )% |
Portfolio turnover rate | | | 89.54 | % | | | 551.53 | % | | | 312.34 | % | | | 310.57 | % | | | 444.62 | % |
| (a) | Per share net investment income/(loss) has been calculated using the average shares method. |
| (b) | Amount represents less than $0.005 per share. |
| (c) | Total return in the above table represents the rate that the investor would have earned or lost on an investment in the Fund, assuming reinvestment of dividends. |
| (d) | Excludes redemption fee. |
| (e) | Includes dividend and interest expense of 0.98%, 0.56%, 0.54%, 0.77%, and 0.66% for the fiscal years ended May 31, 2016, 2015, 2014, 2013 and 2012, respectively. |
| (f) | Effective February 4, 2013, the Adviser agreed to waive fees to maintain Fund expenses at 1.95%. Prior to that date, the expense cap was 2.50%. (See Note 4. Fees and Other Transactions with Affiliates and Other Service Providers) |
See accompanying notes which are an integral part of these financial statements.
20
LS Opportunity Fund
Notes to the Financial Statements
May 31, 2016
NOTE 1. ORGANIZATION
The LS Opportunity Fund (the “Fund”) is an open-end, diversified series of the Valued Advisers Trust (the “Trust”). The Trust is a management investment company established under the laws of Delaware by an Agreement and Declaration of Trust dated June 13, 2008 (the “Trust Agreement”). The Trust Agreement permits the Trustees to issue an unlimited number of shares of beneficial interest of separate series without par value. The Fund is one of a series of funds authorized by the Board of Trustees (the “Board”). The Fund’s investment adviser is Long Short Advisors, LLC (the “Adviser”). The Adviser has retained Prospector Partners, LLC (the “Sub-Adviser”) to serve as the sub-adviser to provide portfolio management and related services to the Fund. The Sub-Adviser receives a fee from the Adviser (not the Fund) for these services. The investment objective of the Fund is to generate long term capital appreciation by investing in both long and short positions within a portfolio consisting of primarily publicly-traded common stock, with less net exposure than that of the stock market in general.
NOTE 2. SIGNIFICANT ACCOUNTING POLICIES
The Fund is an investment company and follows accounting and reporting guidance under Financial Accounting Standards Board (“FASB”) Accounting Standards Codification (“ASC”) Topic 946, “Financial Services-Investment Companies”. The following is a summary of significant accounting policies followed by the Fund in the preparation of its financial statements. These policies are in conformity with the generally accepted accounting principles in the United States of America (“GAAP”).
Securities Valuation – All investments in securities are recorded at their estimated fair value as described in Note 3.
Federal Income Taxes – The Fund makes no provision for federal income or excise tax. The Fund has qualified and intends to qualify each year as a “regulated investment company” (“RIC”) under subchapter M of the Internal Revenue Code of 1986, as amended, by complying with the requirements applicable to RICs and by distributing substantially all of its taxable income. The Fund also intends to distribute sufficient net investment income and net capital gains, if any, so that it will not be subject to excise tax on undistributed income and gains. If the required amount of net investment income or gains is not distributed, the Fund could incur a tax expense.
As of and during the fiscal year ended May 31, 2016, the Fund did not have a liability for any unrecognized tax benefits. The Fund recognizes interest and penalties, if
21
LS Opportunity Fund
Notes to the Financial Statements – continued
May 31, 2016
NOTE 2. SIGNIFICANT ACCOUNTING POLICIES – continued
any, related to unrecognized tax benefits as income tax expense in the Statement of Operations. During the fiscal year ended May 31, 2016, the Fund did not incur any interest or penalties. The Fund is subject to examination by U.S. federal tax authorities for the last three tax years and the interim tax period since then.
Expenses – Expenses incurred by the Trust that do not relate to a specific fund of the Trust are allocated to the individual funds based on each fund’s relative net assets or other appropriate basis.
Security Transactions and Related Income – The Fund follows industry practice and records security transactions on the trade date for financial reporting purposes. The specific identification method is used for determining gains or losses for financial statements and income tax purposes. Dividend income and dividend expense are recorded on the ex-dividend date and interest income is recorded on an accrual basis. Dividend income from Real Estate Investment Trusts (REITs) and distributions from Limited Partnerships are recognized on the ex-date. The calendar year-end classification of distributions received from REITs during the fiscal year are reported subsequent to year end; accordingly, the Fund estimates the character of REIT distributions based on the most recent information available. Income or loss from Limited Partnerships is reclassified among the components of net assets upon receipt of Schedules K-1 (Form 1065). Discounts and premiums on securities purchased are amortized or accreted using the effective interest method. Withholding taxes on foreign dividends have been provided for in accordance with the Fund’s understanding of the applicable country’s tax rules and rates.
Redemption Fees – The Fund charges a 2.00% redemption fee for shares redeemed within 60 days of purchase. These fees are deducted from the redemption proceeds otherwise payable to the shareholder. The Fund will retain the fee charged as an increase in paid-in capital and such fees become part of the Fund’s daily NAV calculation.
Foreign Currency Translations – Foreign currency amounts are translated into U.S. dollars as follows: (i) assets and liabilities at the rate of exchange at the end of the respective period; and (ii) purchases and sales of securities and income and expenses at the rate of exchange prevailing on the dates of such transactions. The portion of the results of operations arising from changes in the exchange rates and the portion due to fluctuations arising from changes in the market prices of securities are not isolated. Such fluctuations are included with the net realized and unrealized gain or loss on investments.
22
LS Opportunity Fund
Notes to the Financial Statements – continued
May 31, 2016
NOTE 2. SIGNIFICANT ACCOUNTING POLICIES – continued
The Fund may enter into transactions to purchase or sell foreign currencies to protect the U.S. dollar value of its underlying portfolio securities against the effect of possible adverse movements in foreign exchange rates. Principal risks associated with such transactions include the movement in value of the foreign currency relative to the U.S. dollar and the ability of the counterparty to perform. Fluctuations in the value of such forward currency transactions are recorded daily as unrealized gain or loss; realized gain or loss includes net gain or loss on transactions that have terminated by settlement or by the Fund entering into offsetting commitments. Reported net realized foreign exchange gains or losses arise from sales of foreign currencies, currency gains or losses realized between the trade and settlement dates on securities transactions, and the difference between the amounts of dividends, interest, and foreign withholding taxes recorded on the company’s books and the U.S. dollar equivalent of the amounts actually received or paid. These instruments involve market risk, credit risk, or both kinds of risks, in excess of the amount that would be recognized in the Statement of Assets and Liabilities. Risks arise from the possible inability of counterparties to meet the terms of their contracts and from movement in currency and securities values and interest rates.
Dividends and Distributions – The Fund intends to distribute its net investment income and net realized long-term and short-term capital gains, if any, at least annually. Dividends and distributions to shareholders, which are determined in accordance with income tax regulations, are recorded on the ex-dividend date. The treatment for financial reporting purposes of distributions made to shareholders during the year from net investment income or net realized capital gains may differ from their ultimate treatment for federal income tax purposes. These differences are caused primarily by differences in the timing of the recognition of certain components of income, expense or realized capital gain for federal income tax purposes. Where such differences are permanent in nature, they are reclassified among the components of net assets based on their ultimate characterization for federal income tax purposes. Any such reclassifications will have no effect on net assets, results of operations or net asset value per share of the Fund. For the fiscal year ended May 31, 2016, the Fund made the following reclassifications to increase (decrease) the components of net assets:
| | | | | | | | | | |
| Paid-in Capital | | | Accumulated Undistributed
Net Investment Income/(loss) | | | Accumulated Net Realized
Gain/(Loss) on Investments | |
| $ | (227,728 | ) | | $ | 317,582 | | | $ | (89,854 | ) |
Short Sales – The Fund may make short sales as part of its overall portfolio management strategies or to offset a potential decline in value of a security. The
23
LS Opportunity Fund
Notes to the Financial Statements – continued
May 31, 2016
NOTE 2. SIGNIFICANT ACCOUNTING POLICIES – continued
Fund may engage in short sales with respect to various types of securities, including Exchange Traded Funds (ETFs). A short sale involves the sale of a security that is borrowed from a broker or other institution to complete the sale. The Fund may engage in short sales with respect to securities it owns, as well as securities that it does not own. Short sales expose the Fund to the risk that it will be required to acquire, convert or exchange securities to replace the borrowed securities (also known as “covering” the short position) at a time when the securities sold short have appreciated in value, thus resulting in a loss to the Fund. The amount of loss may exceed the proceeds received in a short sale. The Fund’s investment performance may also suffer if the Fund is required to close out a short position earlier than it had intended. The Fund must segregate assets determined to be liquid in accordance with procedures established by the Board, or otherwise cover its position in a permissible manner. The Fund will be required to pledge its liquid assets to the broker in order to secure its performance on short sales. As a result, the assets pledged may not be available to meet the Fund’s needs for immediate cash or other liquidity. In addition, the Fund may be subject to expenses related to short sales that are not typically associated with investing in securities directly, such as costs of borrowing and margin account maintenance costs associated with the Fund’s open short positions. These types of short sales expenses are sometimes referred to as the “negative cost of carry,” and will tend to cause the Fund to lose money on a short sale even in instances where the price of the underlying security sold short does not change over the duration of the short sale.
Dividend expenses on securities sold short and borrowing costs are not covered under the Adviser’s expense limitation agreement with the Fund and, therefore, these expenses will be borne by the shareholders of the Fund. The amount of restricted cash held at the broker as collateral for securities sold short was $7,186,153 as of May 31, 2016.
Purchasing Call Options – The Fund may purchase call options. As the holder of a call option, the Fund has the right to purchase the underlying security at the exercise price at any time during the option period. The Fund may enter into closing sale transactions with respect to such options, exercise them or permit them to expire. The Fund may also purchase call options on relevant stock indexes. Call options may also be purchased by the Fund for the purpose of acquiring the underlying securities for its portfolio. Utilized in this fashion, the purchase of call options enables the Fund to acquire the securities at the exercise price of the call option plus the premium paid. At times the net cost of acquiring securities in this manner may be less than the cost of acquiring the securities directly. This technique may also be useful to the Fund in purchasing a large block of securities that would be
24
LS Opportunity Fund
Notes to the Financial Statements – continued
May 31, 2016
NOTE 2. SIGNIFICANT ACCOUNTING POLICIES – continued
more difficult to acquire by direct market purchases. So long as it holds such a call option rather than the underlying security itself, the Fund is partially protected from any unexpected decline in the market price of the underlying security and in such event could allow the call option to expire, incurring a loss only to the extent of the premium paid for the option.
Purchasing Put Options – The Fund may purchase put options. As the holder of a put option, the Fund has the right to sell the underlying security at the exercise price at any time during the option period. The Fund may enter into closing sale transactions with respect to such options, exercise them or permit them to expire. The Fund may purchase a put option on an owned underlying security (a “protective put”) as a defensive technique to protect against an anticipated decline in the value of the security. Such hedge protection is provided only during the life of the put option when the Fund, as the holder of the put option, is able to sell the underlying security at the put exercise price regardless of any decline in the underlying security’s market price. The Fund may also purchase put options at a time when it does not own the underlying security. By purchasing put options on a security it does not own, the Fund seeks to benefit from a decline in the market price of the underlying security. If the put option is not sold when it has remaining value, and if the market price of the underlying security remains equal to or greater than the exercise price during the life of the put option, the Fund will lose its entire investment in the put option. In order for the purchase of a put option to be profitable, the market price of the underlying security must decline sufficiently below the exercise price to cover the premium and transaction costs.
Writing Options – The Fund may write covered call options on equity securities or futures contracts that the Fund is eligible to purchase to extend a holding period to obtain long-term capital gain treatment, to earn premium income, to assure a definite price for a security it has considered selling, or to close out options previously purchased. The Fund may write covered call options if, immediately thereafter, not more than 30% of its net assets would be committed to such transactions. A call option gives the holder (buyer) the right to purchase a security or futures contract at a specified price (the exercise price) at any time until a certain date (the expiration date). A call option is “covered” if the Fund owns the underlying security subject to the call option at all times during the option period. When the Fund writes a covered call option, it maintains a segregated account with its Custodian, cash or liquid portfolio securities in an amount not less than the exercise price at all times while the option is outstanding.
25
LS Opportunity Fund
Notes to the Financial Statements – continued
May 31, 2016
NOTE 2. SIGNIFICANT ACCOUNTING POLICIES – continued
Forward Currency Exchange Contracts – The Fund may engage in foreign currency exchange transactions. The value of the Fund’s portfolio securities that are invested in non-U.S. dollar denominated instruments as measured in U.S. dollars may be affected favorably or unfavorably by changes in foreign currency exchange rates, and the Fund may incur costs in connection with conversions between various currencies. The Fund will conduct its foreign currency exchange transactions either on a spot (i.e., cash) basis at the spot rate prevailing in the foreign currency exchange market, or through forward contracts to purchase or sell foreign currencies. A forward foreign currency exchange contract involves an obligation to purchase or sell a specific currency at a future date, which may be any fixed number of days from the date of the contract agreed upon by the parties, at a price set at the time of the contract. These contracts are traded directly between currency traders (usually large commercial banks) and their customers. The Fund will not, however, hold foreign currency except in connection with the purchase and sale of foreign portfolio securities.
Derivative Transactions – The following table identifies the effect of derivative instruments on the Statement of Operations for the fiscal year ended May 31, 2016.
| | | | | | | | | | | | | | | | | | | | | | |
| Derivatives | | Location of Gain/(Loss) on
Derivatives on Statement
of Operations | | Contracts
Opened | | | Contracts
Expired | | | Contracts
Closed | | | Realized
Gain/
(Loss) on
Derivatives | | | Change in
Unrealized
Appreciation
(Depreciation) on
Derivatives | |
Equity Risk: | | | | | | | | | | | | | | | | | | | | | | |
Call Options Purchased | | Net realized and unrealized gain/(loss) on investment securities | | | 953 | | | | 237 | | | | 479 | | | $ | 45,869 | | | $ | 5,684 | |
Equity Risk: | | | | | | | | | | | | | | | | | | | | | | |
Put Options Purchased | | Net realized and unrealized gain/(loss) on investment securities | | | 342 | | | | 54 | | | | 165 | | | | (2,142 | ) | | | (18,163 | ) |
The Fund is not subject to a master netting arrangement and its policy is to not offset assets and liabilities related to its investment in derivatives.
NOTE 3. SECURITIES VALUATION AND FAIR VALUE MEASUREMENTS
Fair value is defined as the price that the Fund would receive upon selling an investment in an orderly transaction to an independent buyer in the principal or most advantageous market of the investment. GAAP establishes a three-tier hierarchy to maximize the use of observable market data and minimize the use of unobservable
26
LS Opportunity Fund
Notes to the Financial Statements – continued
May 31, 2016
NOTE 3. SECURITIES VALUATION AND FAIR VALUE MEASUREMENTS – continued
inputs and to establish classification of fair value measurements for disclosure purposes.
Inputs refer broadly to the assumptions that market participants would use in pricing the asset or liability, including assumptions about risk (the risk inherent in a particular valuation technique used to measure fair value such as pricing model and/or the risk inherent in the inputs to the valuation technique). Inputs may be observable or unobservable. Observable inputs are inputs that reflect the assumptions market participants would use in pricing the asset or liability developed based on market data obtained from sources independent of the reporting entity. Unobservable inputs are inputs that reflect the reporting entity’s own assumptions about the assumptions market participants would use in pricing the asset or liability developed based on the best information available in the circumstances.
Various inputs are used in determining the value of the Fund’s investments. These inputs are summarized in the three broad levels listed below.
| | • | | Level 1 – unadjusted quoted prices in active markets for identical investments and/or registered investment companies where the value per share is determined and published and is the basis for current transactions for identical assets or liabilities at the valuation date |
| | • | | Level 2 – other significant observable inputs (including, but not limited to, quoted prices for an identical security in an inactive market, quoted prices for similar securities, interest rates, prepayment speeds, credit risk, etc.) |
| | • | | Level 3 – significant unobservable inputs (including the Fund’s own assumptions in determining fair value of investments based on the best information available) |
The inputs used to measure fair value may fall into different levels of the fair value hierarchy. In such cases, for disclosure purposes, the level in the fair value hierarchy which is reported is determined based on the lowest level input that is significant to the fair value measurement in its entirety.
Equity securities, including common stock, exchange traded funds, real estate investment trusts, and American depositary receipts, are generally valued by using market quotations, furnished by a pricing agent. Securities that are traded on any stock exchange are generally valued at the last quoted sale price. Lacking a last sale price, an exchange traded security is generally valued at its last bid price. Securities
27
LS Opportunity Fund
Notes to the Financial Statements – continued
May 31, 2016
NOTE 3. SECURITIES VALUATION AND FAIR VALUE MEASUREMENTS – continued
traded in the NASDAQ over-the-counter market are generally valued at the NASDAQ Official Closing Price.
When using the market quotations or close prices provided by the pricing agent and when the market is considered active, the security is classified as a Level 1 security. Sometimes, an equity security owned by the Fund will be valued by the pricing agent with factors other than market quotations or when the market is considered inactive. When this happens, the security is classified as a Level 2 security. When market quotations are not readily available, when the Adviser determines that the market quotation or the price provided by the pricing agent does not accurately reflect the current fair value, or when restricted or illiquid securities are being valued, such securities are valued as determined in good faith, in conformity with policies adopted by and subject to review by the Board. These securities will generally be categorized as Level 3 securities.
Investments in mutual funds, including money market mutual funds, are generally priced at the ending net asset value (“NAV”) provided by the pricing agent of the Fund. These securities are categorized as Level 1 securities.
Call and put options that the Fund invests in are generally traded on an exchange and are generally valued at the last trade price as provided by a pricing agent. If the last sale price is not available, the options will be valued using the last bid price. The options will generally be categorized as Level 1 securities unless the market is considered inactive, in which case, they will generally be categorized as Level 2 securities.
Derivative instruments the Fund invests in, such as forward currency exchange contracts, are valued by a pricing agent at the interpolated rates based on the prevailing banking rates and are generally categorized as Level 2 securities.
In accordance with the Trust’s valuation policies, the Adviser is required to consider all appropriate factors relevant to the value of securities for which it has determined other pricing sources are not available or reliable as described above. No single standard exists for determining fair value, because fair value depends upon the circumstances of each individual case. As a general principle, the current fair value of an issue of securities being valued by the Adviser would appear to be the amount that the owner might reasonably expect to receive for them upon their current sale. Methods that are in accordance with this principle may, for example, be based on (i) a multiple of earnings; (ii) a discount from market prices of a similar freely traded security (including a derivative security or a basket of securities traded on other markets, exchanges or among dealers); or (iii) yield to maturity with respect to debt issues, or a combination of these and other methods. Fair-value pricing is permitted
28
LS Opportunity Fund
Notes to the Financial Statements – continued
May 31, 2016
NOTE 3. SECURITIES VALUATION AND FAIR VALUE MEASUREMENTS – continued
if, in the Adviser’s opinion, the validity of market quotations appears to be questionable based on factors such as evidence of a thin market in the security based on a small number of quotations, a significant event occurs after the close of a market but before the Fund’s NAV calculation that may affect a security’s value, or the Adviser is aware of any other data that calls into question the reliability of market quotations. Fair-value pricing may also be used in instances when the bonds the Fund invests in may default or otherwise cease to have market quotations readily available.
The following is a summary of the inputs used to value the Fund’s investments as of May 31, 2016:
| | | | | | | | | | | | | | | | |
| | | Valuation Inputs | |
| Assets | | Level 1 | | | Level 2 | | | Level 3 | | | Total | |
Common Stocks* | | $ | 22,610,409 | | | $ | — | | | $ | — | | | $ | 22,610,409 | |
Options Purchased | | | 42,441 | | | | 14,206 | | | | — | | | | 56,647 | |
Total | | $ | 22,652,850 | | | $ | 14,206 | | | $ | — | | | $ | 22,667,056 | |
| * | Please refer to Schedule of Investments for industry classifications. |
| | | | | | | | | | | | | | | | |
| | | Valuation Inputs | |
| Liabilities | | Level 1 | | | Level 2 | | | Level 3 | | | Total | |
Common Stocks* | | $ | (6,971,168 | ) | | $ | — | | | $ | — | | | $ | (6,971,168 | ) |
Total | | $ | (6,971,168 | ) | | $ | — | | | $ | — | | | $ | (6,971,168 | ) |
| * | Please refer to Schedule of Securities Sold Short for industry classifications. |
The Fund did not hold any investments during the reporting period for which significant unobservable inputs (Level 3) were used in determining fair value; therefore, no reconciliation of Level 3 securities is included for this reporting period. The Trust recognizes transfers between fair value hierarchy levels at the reporting period end. There were no transfers between any levels as of May 31, 2016.
NOTE 4. FEES AND OTHER TRANSACTIONS WITH AFFILIATES AND OTHER SERVICE PROVIDERS
The Adviser, under the terms of the management agreement (the “Agreement”), manages the Fund’s investments. As compensation for its management services, the Fund is obligated to pay the Adviser a fee computed and accrued daily and paid monthly at an annual rate of 1.75% of the Fund’s average net assets. For the fiscal
29
LS Opportunity Fund
Notes to the Financial Statements – continued
May 31, 2016
NOTE 4. FEES AND OTHER TRANSACTIONS WITH AFFILIATES AND OTHER SERVICE PROVIDERS – continued
year ended May 31, 2016, the Adviser earned a fee of $673,809 from the Fund before the waivers described below.
The Adviser had contractually agreed to waive its management fee and reimburse certain Fund operating expenses, but only to the extent necessary so that the Fund’s net expenses (excluding interest, taxes, brokerage commissions, other expenditures which are capitalized in accordance with generally accepted accounting principles, other extraordinary expenses not incurred in the ordinary course of the Fund’s business, dividend expense on short sales, expenses incurred under a Rule 12b-1 plan of distribution, “acquired fund fees and expenses” (i.e., investment companies in which the Fund may invest), and expenses that the Fund has incurred but did not actually pay because of an expense offset arrangement) do not exceed 1.95% of net assets. The contractual agreement is effective through September 30, 2016. For the fiscal year ended May 31, 2016, the Adviser waived fees of $380,899. At May 31, 2016, the Adviser was owed $12,525 from the Fund for advisory services.
The fee waiver or expense reimbursement by the Adviser with respect to the Fund is subject to recoupment by the Fund within the three fiscal years following the fiscal year in which that particular waiver or expense incurred, provided that the Fund is able to make the recoupment without exceeding the expense limitations that is in effect at the time of the recoupment or at the time of the waiver or reimbursement.
The amount subject to recoupment by the Fund pursuant to the aforementioned conditions at May 31, 2016 was:
| | |
Amount | | Recoverable through
May 31, |
$159,710 | | 2017 |
148,331 | | 2018 |
380,899 | | 2019 |
The Adviser has retained the Sub-Adviser to provide portfolio management and related services to the Fund. The Sub-Adviser receives a fee from the Adviser (not the Fund) for these services. The Trust retains Ultimus Asset Services, LLC (“Ultimus”), formerly Huntington Asset Services, Inc. (“HASI”), to provide the Fund with administrative and compliance services, including all regulatory reporting. For the fiscal year ended May 31, 2016, Ultimus earned fees of $42,267 for administrative services provided to the Fund. At May 31, 2016, the Fund owed Ultimus
30
LS Opportunity Fund
Notes to the Financial Statements – continued
May 31, 2016
NOTE 4. FEES AND OTHER TRANSACTIONS WITH AFFILIATES AND OTHER SERVICE PROVIDERS – continued
$2,917 for administrative services. The officers and one Trustee of the Trust are members of management and/or employees of Ultimus. Unified Financial Securities, LLC (the “Distributor”) acts as the principal distributor of the Fund’s shares. Effective at the close of business on December 31, 2015, Ultimus Fund Solutions, LLC acquired HASI and the Distributor from Huntington Bancshares, Inc. (“HBI”). Prior to January 1, 2016, HASI and the Distributor were under common control by HBI.
The Trust also retains Ultimus to act as the Fund’s transfer agent and to provide fund accounting services. For the fiscal year ended May 31, 2016, Ultimus earned fees of $36,533 from the Fund for transfer agent services and $38,794 from the Fund for fund accounting services. At May 31, 2016, the Fund owed Ultimus $3,131 for transfer agent services and $3,083 for fund accounting services.
There were no payments made to the Distributor by the Fund for the fiscal year ended May 31, 2016. Certain officers of the Trust are officers of the Distributor and each such person may be deemed to be an affiliate of the Distributor.
NOTE 5. INVESTMENT TRANSACTIONS
For the fiscal year ended May 31, 2016, purchases and sales of investment securities, other than short-term investments, were as follows:
| | | | |
Purchases | | | | |
U.S. Government Obligations | | $ | — | |
Other | | | 42,132,922 | |
Sales | | | | |
U.S. Government Obligations | | $ | — | |
Other | | | 83,089,749 | |
NOTE 6. ESTIMATES
The preparation of financial statements in conformity with GAAP requires management to make estimates and assumptions that affect the reported amounts of assets and liabilities and disclosure of contingent assets and liabilities at the date of the financial statements and the reported amounts of increases and decreases in net assets from operations during the reporting period. Actual results could differ from those estimates.
31
LS Opportunity Fund
Notes to the Financial Statements – continued
May 31, 2016
NOTE 7. BENEFICIAL OWNERSHIP
The beneficial ownership, either directly or indirectly, of 25% or more of the voting securities of a fund creates a presumption of control of a fund, under Section 2(a)(9) of the Investment Company Act of 1940. At May 31, 2016, National Financial Services, Inc. (“NFS”) owned, as record shareholder, 68% of the outstanding shares of the Fund. It is not known whether NFS or any of the underlying beneficial owners owned or controlled 25% or more of the voting securities of the Fund.
NOTE 8. FEDERAL TAX INFORMATION
At May 31, 2016, the appreciation (depreciation) of investments, net of proceeds for investment securities sold short, for tax purposes was as follows:
| | | | |
| | | Amount | |
Gross Unrealized Appreciation | | $ | 1,914,683 | |
Gross Unrealized Depreciation | | | (1,367,658 | ) |
| | | | |
Net Unrealized Depreciation | | $ | 547,025 | |
| | | | |
At May 31, 2016, the aggregate cost of securities, net of proceeds for investment securities sold short, for federal income tax purposes, was $15,148,863.
The tax characterization of distributions for the fiscal years ended May 31, 2016 and May 31, 2015, were as follows:
| | | | | | | | |
| | | 2016 | | | 2015 | |
Distributions paid from: | | | | | | | | |
Ordinary Income | | $ | 2,624,587 | | | $ | — | |
Long-Term Capital Gains | | | 1,462,556 | | | | 3,344,132 | |
| | | | | | | | |
Total Distributions Paid | | $ | 4,087,143 | | | $ | 3,344,132 | |
| | | | | | | | |
At May 31, 2016, the components of distributable earnings (accumulated losses) on a tax basis were as follows:
| | | | |
Undistributed Long-Term Capital Gains | | $ | 24,417 | |
Accumulated Capital and Other Losses | | | (340,539 | ) |
Unrealized Appreciation/(Depreciation) | | | 547,045 | |
| | | | |
| | $ | 230,923 | |
| | | | |
32
LS Opportunity Fund
Notes to the Financial Statements – continued
May 31, 2016
NOTE 8. FEDERAL TAX INFORMATION – continued
The difference between book basis and tax basis unrealized appreciation is attributable primarily to the tax deferral of wash losses.
Certain capital losses incurred after October 31, and within the current taxable year, are deemed to arise on the first business day of the Fund’s following taxable year. For the tax year ended May 31, 2016, the Fund deferred post October capital losses in the amount of $221,670 and $108,640 in Qualified Late Year Ordinary Losses.
NOTE 9. COMMITMENTS AND CONTINGENCIES
The Fund indemnifies its officers and trustees for certain liabilities that may arise from their performance of their duties to the Fund. Additionally, in the normal course of business, the Fund enters into contracts that contain a variety of representations and warranties which provide general indemnifications. The Fund’s maximum exposure under these arrangements is unknown, as this would involve future claims that may be made against the Fund that have not yet occurred.
NOTE 10. SUBSEQUENT EVENTS
Management of the Fund has evaluated the need for disclosures and/or adjustments resulting from subsequent events through the date these financial statements were issued. There were no items requiring adjustment of financial statements or additional disclosure.
33
REPORT OF INDEPENDENT REGISTERED PUBLIC ACCOUNTING FIRM
To the Shareholders of LS Opportunity Fund and
Board of Trustees of Valued Advisers Trust
We have audited the accompanying statement of assets and liabilities, including the schedules of investments and securities sold short, of LS Opportunity Fund (the “Fund”), a series of Valued Advisers Trust, as of May 31, 2016, and the related statements of operations and cash flows for the year then ended, the statements of changes in net assets for each of the two years in the period then ended, and the financial highlights for each of the five years in the period then ended. These financial statements and financial highlights are the responsibility of the Fund’s management. Our responsibility is to express an opinion on these financial statements and financial highlights based on our audits.
We conducted our audits in accordance with the standards of the Public Company Accounting Oversight Board (United States). Those standards require that we plan and perform the audit to obtain reasonable assurance about whether the financial statements and financial highlights are free of material misstatement. An audit includes examining, on a test basis, evidence supporting the amounts and disclosures in the financial statements. Our procedures included confirmation of securities owned as of May 31, 2016, by correspondence with the custodian and brokers or by other appropriate auditing procedures where replies from brokers or counterparties were not received. An audit also includes assessing the accounting principles used and significant estimates made by management, as well as evaluating the overall financial statement presentation. We believe that our audits provide a reasonable basis for our opinion.
In our opinion, the financial statements and financial highlights referred to above present fairly, in all material respects, the financial position of LS Opportunity Fund as of May 31, 2016, the results of its operations and cash flows for the year then ended, the changes in its net assets for each of the two years in the period then ended, and the financial highlights for each of the five years in the period then ended, in conformity with accounting principles generally accepted in the United States of America.

COHEN FUND AUDIT SERVICES, LTD.
Cleveland, Ohio
August 1, 2016
34
Summary of Fund Expenses – (Unaudited)
As a shareholder of the Fund, you incur two types of costs: (1) transaction costs (such as short-term redemption fees); and (2) ongoing costs, including management fees and other Fund expenses. This Example is intended to help you understand your ongoing costs (in dollars) of investing in the Fund and to compare these costs with the ongoing costs of investing in other mutual funds. The Example is based on an investment of $1,000 invested at the beginning of the period, and held for the six month period from December 1, 2015 to May 31, 2016.
Actual Expenses
The first line of the table provides information about actual account values and actual expenses. You may use the information in this line, together with the amount you invested, to estimate the expenses that you paid over the period. Simply divide your account value by $1,000 (for example, an $8,600 account value divided by $1,000 = 8.60), then multiply the result by the number in the first line under the heading “Expenses Paid During the Period” to estimate the expenses you paid on your account during this period.
Hypothetical Example for Comparison Purposes
The second line of the table provides information about hypothetical account values and hypothetical expenses based on the Fund’s actual expense ratio and an assumed rate of return of 5% per year before expenses, which is not the Fund’s actual return. The hypothetical account values and expenses may not be used to estimate the actual ending account balance or expenses you paid for the period. You may use this information to compare the ongoing costs of investing in the Fund and other funds. To do so, compare this 5% hypothetical example with the 5% hypothetical examples that appear in the shareholder reports of the other funds.
Expenses shown in the table are meant to highlight your ongoing costs only and do not reflect any transactional costs, such as sales charges (loads), or redemption fees. Therefore, the second line of the table is useful in comparing ongoing costs only, and will not help you determine the relative total costs of owning different funds. In addition, if these transactional costs were included, your costs would have been higher.
| | | | | | | | | | | | |
| | | Beginning
Account Value December 1, 2015 | | | Ending Account Value May 31, 2016 | | | Expenses Paid During the Period(a) | |
Actual expenses | | $ | 1,000.00 | | | $ | 1,028.90 | | | $ | 14.82 | |
Hypothetical expenses(b) | | $ | 1,000.00 | | | $ | 1,010.39 | | | $ | 14.69 | |
| (a) | Expenses are equal to the Fund’s annualized expense ratio of 2.92%, multiplied by the average account value over the period, multiplied by 183/366. |
| (b) | Assumes a 5% return before expenses. |
35
ADDITIONAL FEDERAL INCOME TAX INFORMATION (Unaudited):
The Form 1099-DIV you receive in January 2017 will show the tax status of all distributions paid to your account in calendar year 2016. Shareholders are advised to consult their own tax adviser with respect to the tax consequences of their investment in the Fund. As required by the Internal Revenue Code and/or regulations, shareholders must be notified regarding the status of qualified dividend income for individuals and the dividends received deduction for corporations.
Qualified Dividend Income: For the fiscal year ended May 31, 2016, the Fund designates 19%, or up to the maximum amount of such dividends allowable pursuant to the Internal Revenue Code, as qualified dividend income eligible for the reduced tax rate of 15%.
Dividends Received Deduction: Corporate shareholders are generally entitled to take the dividends received deduction on the portion of the Fund’s dividend distribution that qualifies under tax law. For the Fund’s fiscal year 2016 ordinary income dividends, 19% qualifies for the corporate dividends received deduction.
For the fiscal year ended May 31, 2016, the Fund designated $1,462,556 as long-term capital gain distributions.
36
TRUSTEES AND OFFICERS (Unaudited)
The Board of Trustees supervises the business activities of the Trust. Each Trustee serves as a trustee until termination of the Trust unless the Trustee dies, resigns, retires or is removed.
The following table provides information regarding each of the Independent Trustees.
| | | | |
Name, Address*, (Age), Position with Trust**, Term of Position with Trust | | Principal Occupation During Past 5 Years | | Other Directorships |
Ira P. Cohen, 57, Independent Trustee, June 2010 to present. | | Current: Independent financial services consultant since February 2005; Executive Vice President of Asset Management Services, Recognos Financial, since August 2015. | | Trustee and Audit Committee Chairman, Griffin Institutional Real Estate Access Fund, since May 2014. Trustee, Angel Oak Funds Trust, since October 2014. |
Andrea N. Mullins, 49, Independent Trustee, December 2013 to present. | | Current: Private investor; Independent Contractor, Seabridge Wealth Management, LLC, since April 2014. | | None. |
The following table provides information regarding the Trustee who is considered an “interested person” of the Trust, as that term is defined under the 1940 Act. Based on the experience of the Trustee, the Trust concluded that the individual described below is qualified to serve as a Trustee.
| | | | |
Name, Address*, (Age), Position with Trust**, Term of Position with Trust | | Principal Occupation During Past 5 Years | | Other Directorships |
R. Jeffrey Young, 51, Trustee and Chairman, June 2010 to present; Principal Executive Officer and President since February 2010 to present. | | Current: Vice President and Director of Relationship Management, Ultimus Fund Solutions, LLC (since December 2015); President, Unified Financial Securities, LLC (since July 2015). Previous: President, Huntington Asset Services, Inc. (n/k/a Ultimus Asset Services, LLC) (April 2015 to December 2015), Director (May 2014 to December 2015), Senior Vice President (January 2010 to April 2015); Director, Unified Financial Securities, Inc. (n/k/a Unified Financial Securities, LLC) (May 2014 to December 2015); Chief Executive Officer, Huntington Funds (February 2010 to March 2015); Chief Executive Officer, Huntington Strategy Shares (November 2010 to March 2015); President and Chief Executive Officer, Dreman Contrarian Funds (March 2011 to February 2013). | | Trustee and Chairman, Capitol Series Trust, since September 2013. |
| * | The address for each trustee and officer is 225 Pictoria Drive, Suite 450, Cincinnati, OH 45246. |
| ** | As of the date of this report, the Trust consists of 15 series. |
37
The following table provides information regarding the Officers of the Trust:
| | |
Name, Address*, (Age),
Position with Trust, Term
of Position with Trust | | Principal Occupation During Past 5 Years |
John C. Swhear, 55, Chief Compliance Officer, AML Officer and Vice President, August 2008 to present. | | Current: Assistant Vice President and Associate Director of Compliance, Ultimus Fund Solutions, LLC (since December 2015); Chief Compliance Officer, Unified Financial Securities, LLC (since May 2007); Chief Compliance Officer and AML Officer, Capitol Series Trust (since September 2013). Previous: Vice President of Legal Administration and Compliance, Huntington Asset Services, Inc. (n/k/a Ultimus Asset Services, LLC) (April 2007 to December 2015), Director (May 2014 to December 2015); Director, Unified Financial Securities, Inc. (n/k/a Unified Financial Securities, LLC) (May 2014 to December 2015); President , Unified Series Trust (March 2012 to January 2016), Senior Vice President (May 2007 to March 2012); Secretary , Huntington Funds (April 2010 to February 2012). |
Carol J. Highsmith, 51, Vice President, August 2008 to present; Secretary, March 2014 to present | | Current: Assistant Vice President, Ultimus Fund Solutions, LLC (since December 2015). Previous: Secretary, Cross Shore Discovery Fund (May 2014 to February 2016); Employed in various positions with Huntington Asset Services, Inc. (n/k/a Ultimus Asset Services, LLC) (November 1994 to December 2015), most recently Vice President of Legal Administration (2005 to December 2015). |
Matthew J. Miller, 40, Vice President, December 2011 to present. | | Current: Assistant Vice President, Relationship Management, Ultimus Fund Solutions, LLC (since December 2015); President and Chief Executive Officer, Capitol Series Trust (since September 2013). Previous: Employed in various positions with Huntington Asset Services, Inc. (n/k/a Ultimus Asset Services, LLC) (since July 1998), most recently Vice President of Relationship Management (2005 to December 2015); Vice President, Huntington Funds (February 2010 to April 2015). |
Bryan W. Ashmus, 43, Principal Financial Officer and Treasurer, December 2013 to present. | | Current: Vice President and Director of Financial Administration, Ultimus Fund Solutions, LLC (since December 2015); Chief Financial Officer and Treasurer, Cross Shore Discovery Fund (since June 2016). Previous: Vice President and Manager of Financial Administration, Huntington Asset Services, Inc. (n/k/a Ultimus Asset Services, LLC) (September 2013 to December 2015); Chief Financial Officer and Treasurer, Huntington Strategy Shares and Huntington Funds Trust (November 2013 to April 2016); Vice President, Fund Administration, Citi Fund Services Ohio, Inc. (from May 2005 to September 2013). |
| * | The address for each trustee and officer is 225 Pictoria Drive, Suite 450, Cincinnati, OH 45246. |
OTHER INFORMATION
The Fund’s Statement of Additional Information (“SAI”) includes additional information about the Trustees and officers of the Trust and is available without charge, upon request. You may call toll-free at (877) 336-6763 to request a copy of the SAI or to make shareholder inquiries.
38
Continuation of Investment Advisory Agreement and Sub-Advisory Agreement Relating to the LS Opportunity Fund (Unaudited)
At a meeting held on March 30-31, 2016, the Board of Trustees (the “Board”) considered the renewal of the Investment Advisory Agreement (the “Agreement”) between the Valued Advisers Trust (the “Trust”) and Long Short Advisors, LLC (the “Adviser” or “LSA”) with respect to the LS Opportunity Fund (the “Fund”). LSA provided written information to the Board to assist the Board in its considerations.
The Board discussed the contractual arrangements between LSA and the Trust with respect to the Fund. Trust counsel reminded the Trustees of their fiduciary duties and responsibilities as summarized in the memorandum from his firm, including the factors to be considered, and the application of those factors to LSA. In assessing these factors and reaching its decision, the Board took into consideration information furnished by LSA and Trust Management for the Board’s review and consideration throughout the year, as well as information specifically prepared or presented in connection with the annual renewal process, including (i) reports regarding the services and support provided to the Fund and its shareholders by LSA; (ii) quarterly assessments of the investment performance of the Fund by personnel of LSA; (iii) commentary on the reasons for the performance; (iv) presentations by LSA addressing investment philosophy, investment strategy, personnel and operations of LSA and of the sub-adviser; (v) compliance and audit reports concerning the Fund and LSA and the oversight by LSA of similar reports concerning the sub-adviser; (vi) disclosure information contained in the registration statement of the Trust with respect to the Fund and the Form ADV of LSA; (vii) information relating to the manner in which LSA oversees the sub-adviser; and (viii) a memorandum from counsel, that summarized the fiduciary duties and responsibilities of the Board in reviewing and approving the Agreement. The Board also requested and received various informational materials including, without limitation: (i) documents containing information about LSA, including financial information, a description of personnel and the services provided to the Fund, information on investment advice, performance, summaries of Fund expenses, compliance program, current legal matters, and other general information; (ii) comparative expense and performance information for other mutual funds with strategies similar to the Fund; and (iii) benefits to be realized by LSA from its relationship with the Fund. The Board did not identify any particular information that was most relevant to its consideration to approve the Agreement and each Trustee may have afforded different weight to the various factors.
| 1. | The nature, extent, and quality of the services to be provided by LSA. In this regard, the Board considered LSA’s responsibilities under the Agreement. The Trustees considered the services being provided by LSA to the Fund including its process for overseeing the sub-adviser’s portfolio management of the Fund, assuring compliance with the Fund’s investment objectives and limitations, its coordination of services for the Fund among the Fund’s service providers, and its efforts to promote the Fund and grow its assets. The Trustees reviewed the |
39
| | steps LSA takes to oversee and supervise the sub-adviser, as described in the materials provided by LSA. The Trustees considered the relationship of LSA’s affiliate and its utilization of the infrastructure and other resources of its affiliate. The Trustees considered LSA’s continuity of, and commitment to retain, qualified personnel and LSA’s commitment to maintain and enhance its resources and systems, the commitment of LSA’s personnel to finding alternatives and options that allow the Fund to maintain its goals. The Trustees considered LSA’s personnel, including the education and experience of LSA’s personnel. The Trustees spent considerable time reflecting upon their recent experience with LSA during this particular renewal process and the difficulty encountered in receiving information requested for their consideration of the renewal of the Agreement in a timely manner. After considering the foregoing information and further information in the meeting materials provided by LSA (including LSA’s Form ADV), the Board concluded that further information was needed in order to fully consider the nature, extent, and quality of services provided by LSA, and the Board determined that such information would be considered at the next quarterly meeting of the Board. |
| 2. | Investment Performance of the Fund and LSA. In considering the investment performance of the Fund, the Trustees noted that LSA did not manage any accounts directly and that it had delegated the portfolio management responsibilities of the Fund to a sub-adviser. Accordingly, the Trustees concluded that their consideration of this factor for LSA was less relevant in their determination of LSA’s performance of its duties than other factors. The Trustees considered the consistency of LSA’s management oversight of the Fund’s sub-adviser with the Fund’s investment objective, strategies, and limitations. The Trustees also compared the performance of the Fund with the performance of its benchmark index and comparable funds with similar objectives managed by other investment advisers. The Trustees noted that the Fund’s performance was better than the average of its Morningstar category for the three-year period, but lower than the average for the one year and five year periods. The Trustees also observed that the Fund had outperformed its benchmark for periods of one year and shorter, but had underperformed as compared to the benchmark for the three year and five year periods. After reviewing and discussing the investment performance of the Fund further, LSA’s experience in overseeing the sub-adviser to the Fund, the Fund’s historical performance, and other relevant factors, the Board concluded, in light of all the facts and circumstances, that the investment performance, and LSA’s oversight of the sub-adviser to the Fund was satisfactory. |
| 3. | The costs of the services to be provided and profits to be realized by LSA from its relationship with the Fund. In considering the costs of services to be provided and the profits to be realized by LSA from its relationship with the Fund, the Trustees considered: (1) LSA’s financial condition; (2) asset levels of the Fund; (3) the overall expenses of the Fund; and (4) the nature and frequency of advisory fee payments. The Trustees reviewed information provided by LSA |
40
| | regarding its profits associated with managing the Fund. The Trustees also considered the relationship of LSA’s affiliate and its utilization of the infrastructure and other resources of its affiliate. The Trustees also considered potential benefits for LSA in managing the Fund. The Trustees then compared the fees and expenses of the Fund (including the management fee) to other comparable mutual funds. The Trustees noted that both the Fund’s management fee and net expense ratio were higher than the average and median of its Morningstar category and its peer group. In this regard, the Trustees reflected upon their discussion with representatives of LSA earlier in the meeting, and commented on LSA’s assertion that the firm provided a premium product in comparison to other products in the marketplace. The Board concluded that the fees to be paid to LSA by the Fund and the profits to be realized by LSA, in light of all the facts and circumstances, were fair and reasonable in relation to the nature and quality of the services provided by LSA. |
| 4. | The extent to which economies of scale would be realized as the Fund grows and whether advisory fee levels reflect these economies of scale for the benefit of the Fund’s investors. In this regard, the Board considered the Fund’s fee arrangements with LSA. The Board considered that while the management fee remained the same at all asset levels, the Fund’s shareholders had experienced benefits from the expense limitation arrangement. The Trustees noted that once the Fund’s expenses fell below the cap set by the arrangement, the shareholders would continue to benefit from the economies of scale under the Fund’s agreements with service providers other than LSA. In light of its ongoing consideration of the Fund’s asset levels, expectations for growth in the Fund, and fee levels, the Board determined that the Fund’s fee arrangements, in light of all the facts and circumstances, were fair and reasonable in relation to the nature and quality of the services provided by LSA. |
| 5. | Possible conflicts of interest and benefits to LSA. In considering LSA’s practices regarding conflicts of interest, the Trustees evaluated the potential for conflicts of interest and considered such matters as the experience and ability of the advisory personnel assigned to the Fund; the operations of LSA’s investment advisory affiliate; and the substance and administration of LSA’s code of ethics. The Trustees also considered disclosure in the registration statement of the Trust relating to LSA’s potential conflicts of interest. The Trustees noted other potential benefits (in addition to the management fee) to LSA, such as the ability to offer the Fund as an investment option for the smaller clients of LSA’s affiliate. Based on the foregoing, the Board determined that LSA’s standards and practices relating to the identification and mitigation of potential conflicts of interest and the benefits to be realized by LSA in managing the Fund were satisfactory. |
After additional consideration of the factors delineated in the memorandum provided by counsel and further discussion among the Board members, the Board determined to approve the continuation of the Agreement between the Trust and the Adviser for a three-month period.
41
VALUED ADVISERS TRUST
PRIVACY POLICY
The following is a description of the policies of the Valued Advisers Trust (the “Trust”) regarding disclosure of nonpublic personal information that shareholders provide to a series of the Trust (each, a “Fund”) or that the Fund collects from other sources. In the event that a shareholder hold shares of a Fund through a broker-dealer or other financial intermediary, the privacy policy of the financial intermediary would govern how shareholder nonpublic personal information would be shared with nonaffiliated third parties.
Categories of Information a Fund May Collect. A Fund may collect the following nonpublic personal information about its shareholders:
| | • | | Information the Fund receives from a shareholder on applications or other forms, correspondence, or conversations (such as the shareholder’s name, address, phone number, social security number, and date of birth); and |
| | • | | Information about the shareholder’s transactions with the Fund, its affiliates, or others (such as the shareholder’s account number and balance, payment history, cost basis information, and other financial information). |
Categories of Information a Fund May Disclose. A Fund may not disclose any nonpublic personal information about its current or former shareholders to unaffiliated third parties, except as required or permitted by law. A Fund is permitted by law to disclose all of the information it collects, as described above, to its service providers (such as the Fund’s custodian, administrator, transfer agent, accountant and legal counsel) to process shareholder transactions and otherwise provide services to the shareholder.
Confidentiality and Security. Each Fund shall restrict access to shareholder nonpublic personal information to those persons who require such information to provide products or services to the shareholder. Each Fund shall maintain physical, electronic, and procedural safeguards that comply with federal standards to guard shareholder nonpublic personal information.
Disposal of Information. The Funds, through their transfer agent, have taken steps to reasonably ensure that the privacy of a shareholder’s nonpublic personal information is maintained at all times, including in connection with the disposal of information that is no longer required to be maintained by the Funds. Such steps shall include, whenever possible, shredding paper documents and records prior to disposal, requiring off-site storage vendors to shred documents maintained in such locations prior to disposal, and erasing and/or obliterating any data contained on electronic media in such a manner that the information can no longer be read or reconstructed.
42
PROXY VOTING
A copy of the policies and procedures that the Fund uses to determine how to vote proxies relating to securities held in the Fund’s portfolio, as well as a record of how the Fund voted any such proxies during the most recent 12-month period ended June 30, is available without charge and upon request by calling the Fund at (877) 336-6763. This information is also available from the EDGAR database on the SEC’s website at www.sec.gov.
TRUSTEES
R. Jeffrey Young, Chairman
Ira P. Cohen
Andrea N. Mullins
OFFICERS
R. Jeffrey Young, Principal Executive Officer and President
Bryan W. Ashmus, Principal Financial Officer and Treasurer
John C. Swhear, Chief Compliance Officer, AML Officer and Vice President
Carol J. Highsmith, Vice President and Secretary
Matthew J. Miller, Vice President
INVESTMENT ADVISOR
Long Short Advisors, LLC
1818 Market Street, 33rd Floor, Suite 3323
Philadelphia, PA 19103
DISTRIBUTOR
Unified Financial Securities, LLC
9465 Counselors Row, Suite 200
Indianapolis, IN 46240
INDEPENDENT REGISTERED PUBLIC ACCOUNTING FIRM
Cohen Fund Audit Services, Ltd.
1350 Euclid Avenue, Suite 800
Cleveland, OH 44115
LEGAL COUNSEL
The Law Offices of John H. Lively & Associates, Inc.,
A member firm of The 1940 Act Law GroupTM
11300 Tomahawk Creek Parkway, Suite 310
Leawood, KS 66211
CUSTODIAN
Citibank, N.A.
388 Greenwich Street
New York, NY 10013
ADMINISTRATOR, TRANSFER AGENT AND FUND ACCOUNTANT
Ultimus Asset Services, LLC
225 Pictoria Drive, Suite 450
Cincinnati, OH 45246
This report is intended only for the information of shareholders or those who have received the Fund’s prospectus which contains information about the Fund’s management fee and expenses. Please read the prospectus carefully before investing.
Distributed by Unified Financial Securities LLC
Member FINRA/SIPC
Item 2. Code of Ethics.
As of the end of the period covered by this report, the registrant has adopted a code of ethics that applies to the registrant’s principal executive officer, principal financial officer, principal accounting officer or controller, or persons performing similar functions, regardless of whether these individuals are employed by the registrant or a third party. Pursuant to Item 12(a)(1), a copy of registrant’s code of ethics is filed as an exhibit to this Form N-CSR. During the period covered by this report, the code of ethics has not been amended, and the registrant has not granted any waivers, including implicit waivers, from the provisions of the code of ethics.
Item 3. Audit Committee Financial Expert.
(a)(1) The registrant’s Board of Trustees has determined that the registrant has at least one audit committee financial expert serving on its audit committee.
(a)(2) The audit committee financial expert is Andrea N. Mullins, who is “independent” for purposes of this Item 3 of Form N-CSR.
Item 4. Principal Accountant Fees and Services.
| | | | | | | | |
LS Opportunity Fund: | | | FY 2016 | | | $ | 14,000 | |
| | | FY 2015 | | | $ | 14,000 | |
| | |
BFS Equity Fund: | | | FY 2016 | | | $ | 13,000 | |
| | | FY 2015 | | | $ | 13,000 | |
| | |
Cloud Capital Funds: | | | FY 2016 | | | $ | 13,000 | |
| | | FY 2015 | | | $ | 13,500 | |
| | | | | | | | |
Registrant | |
| | |
LS Opportunity Fund: | | | FY 2016 | | | $ | 0 | |
| | | FY 2015 | | | $ | 0 | |
| | |
BFS Equity Fund: | | | FY 2016 | | | $ | 0 | |
| | | FY 2015 | | | $ | 0 | |
| | |
Cloud Capital Funds: | | | FY 2016 | | | $ | 0 | |
| | | FY 2015 | | | $ | 0 | |
| | | | | | | | |
Registrant | |
| | |
LS Opportunity Fund: | | | FY 2016 | | | $ | 3,000 | |
| | | FY 2015 | | | $ | 5,000 | |
| | |
BFS Equity Fund: | | | FY 2016 | | | $ | 3,000 | |
| | | FY 2015 | | | $ | 2,500 | |
| | |
Cloud Capital Funds: | | | FY 2016 | | | $ | 3,000 | |
| | | FY 2015 | | | $ | 2,500 | |
Nature of the fees: Preparation of the 1120 RIC and Excise review
| | | | | | | | |
Registrant | |
| | |
LS Opportunity Fund: | | | FY 2016 | | | $ | 0 | |
| | | FY 2015 | | | $ | 0 | |
| | |
BFS Equity Fund: | | | FY 2016 | | | $ | 0 | |
| | | FY 2015 | | | $ | 0 | |
| | |
Cloud Capital Funds: | | | FY 2016 | | | $ | 18,650 | |
| | | FY 2015 | | | $ | 19,400 | |
Nature of the fees: Rule 17f-1 Examination
| | | | |
| (e) | | (1) | | Audit Committee’s Pre-Approval Policies |
| | |
| | | | The Audit Committee Charter requires the Audit Committee to be responsible for the selection, retention or termination of auditors and, in connection therewith, to (i) evaluate the proposed fees and other compensation, if any, to be paid to the auditors, (ii) evaluate the independence of the auditors, (iii) pre-approve all audit services and, when appropriate, any non-audit services provided by the independent auditors to the Trust, (iv) pre-approve, when appropriate, any non-audit services provided by the independent auditors to the Trust’s investment adviser, or any entity controlling, controlled by, or under common control with the investment adviser and that provides ongoing services to the Trust if the engagement relates directly to the operations and financial reporting of the Trust, and (v) receive the auditors’ specific representations as to their independence; |
| | |
| | (2) | | Percentages of Services Approved by the Audit Committee |
| | | | |
Registrant | |
| |
Audit-Related Fees: | | | 0 | % |
Tax Fees: | | | 0 | % |
All Other Fees: | | | 0 | % |
(f) During audit of registrant’s financial statements for the most recent fiscal year, less than 50 percent of the hours expended on the principal accountant’s engagement were attributed to work performed by persons other than the principal accountant’s full-time, permanent employees.
(g) The aggregate non-audit fees billed by the registrant’s accountant for services rendered to the registrant, and rendered to the registrant’s investment adviser (not including any sub-adviser whose role is primarily portfolio management and is subcontracted with or overseen by another investment adviser), and any entity controlling, controlled by, or under common control with the adviser that provides ongoing services to the registrant:
| | | | | | | | |
| | | Registrant | | | Adviser | |
FY 2016 | | $ | 0 | | | $ | 0 | |
FY 2015 | | $ | 0 | | | $ | 0 | |
(h) Not applicable. The auditor performed no services for the registrant’s investment adviser or any entity controlling, controlled by, or under common control with the investment adviser that provides ongoing services to the registrant.
Item 5. Audit Committee of Listed Companies. NOT APPLICABLE – applies to listed companies only
Item 6. Schedule of Investments. Schedules filed with Item 1.
Item 7. Disclosure of Proxy Voting Policies and Procedures for Closed-End Management Investment Companies. NOT APPLICABLE – applies to closed-end funds only
Item 8. Portfolio Managers of Closed-End Investment Companies. NOT APPLICABLE – applies to closed-end funds only
Item 9. Purchases of Equity Securities by Closed-End Management Investment Company and Affiliated Purchasers. NOT APPLICABLE – applies to closed-end funds only
Item 10. Submission of Matters to a Vote of Security Holders.
The guidelines applicable to shareholders desiring to submit recommendations for nominees to the Registrant’s board of trustees are contained in the statement of additional information of the Trust with respect to the Fund(s) for which this Form N-CSR is being filed.
Item 11. Controls and Procedures.
(a) Based on their evaluation of the registrant’s disclosure controls and procedures (as defined in Rule 30a-3(c) under the Investment Company Act of 1940, as amended (the “Act”)) as of a date within 90 days of the filing date of this report, the registrant’s principal executive officer and principal financial officer have concluded that such disclosure controls and procedures are reasonably designed and are operating effectively to ensure that material information relating to the registrant is made known to them by others within those entities, particularly during the period in which this report is being prepared, and that the information required in filings on Form N-CSR is recorded, processed, summarized, and reported on a timely basis.
(b) There were no changes in the registrant’s internal control over financial reporting (as defined in Rule 30a-3(d) under the Investment Company Act of 1940) that occurred during the second fiscal quarter of the period covered by this report that have materially affected, or are reasonably likely to materially affect, the registrant’s internal control over financial reporting.
Item 12. Exhibits.
| | | | |
| (a) | | (1) | | Code is filed herewith. |
| | |
| | (2) | | Certifications by the registrant’s principal executive officer and principal financial officer, pursuant to Section 302 of the Sarbanes-Oxley Act of 2002 and required by Rule 30a-2 under the Investment Company Act of 1940 are filed herewith. |
| | |
| | (3) | | Not Applicable |
| | |
| (b) | | | | Certification pursuant to 18 U.S.C. Section 1350, as adopted pursuant to Section 906 of the Sarbanes-Oxley Act of 2002 is filed herewith. |
Pursuant to the requirements of the Securities Exchange Act of 1934 and the Investment Company Act of 1940, the registrant has duly caused this report to be signed on its behalf by the undersigned, thereunto duly authorized.
| | |
| (Registrant) | | Valued Advisers Trust |
| | |
| |
| By | | /s/ R. Jeffrey Young |
| | R. Jeffrey Young, President and Principal Executive Officer |
| |
| Date | | 8/2/2016 |
Pursuant to the requirements of the Securities Exchange Act of 1934 and the Investment Company Act of 1940, this report has been signed below by the following persons on behalf of the registrant and in the capacities and on the dates indicated.
| | |
| By | | /s/ R. Jeffrey Young |
| | R. Jeffrey Young, President and Principal Executive Officer |
| |
| Date | | 8/2/2016 |
| |
| By | | /s/ Bryan W. Ashmus |
| | Bryan W. Ashmus, Treasurer and Principal Financial Officer |
| |
| Date | | 8/2/2016 |