UNITED STATES
SECURITIES AND EXCHANGE COMMISSION
Washington, D.C. 20549
FORM N-CSR
CERTIFIED SHAREHOLDER REPORT OF REGISTERED
MANAGEMENT INVESTMENT COMPANIES
Investment Company Act file number: 811-22211
IVA FIDUCIARY TRUST
(Exact name of registrant as specified in charter)
717 Fifth Avenue, 10th Floor, New York, NY 10022
(Address of principal executive offices) (zip code)
|
|
Michael W. Malafronte International Value Advisers, LLC 717 Fifth Avenue
10th Floor
New York, NY 10022 |
(Name and address of agent for service) |
Copy to: |
Stuart E. Fross, Esq.
K&L Gates LLP
State Street Financial Center
One Lincoln Street
Boston, Massachusetts 02111-2950
Brian F. Link, Esq.
State Street Bank and Trust Company
Mail Code: JHT 1732
200 Clarendon Street
Boston, MA 02116 |
Registrant’s telephone number, including area code: (212) 584-3570
Date of fiscal year end: September 30
Date of reporting period: September 30, 2012
Item 1. Report to Shareholders.
| | |
|
|
|
| | |
IVA Worldwide Fund |
| | | IVA International Fund |
| | | |
| | | |
| | | |
| | | Annual Report |
| | | September 30, 2012 |
| | | |
| | | |
| | | |
| | | |
| | | |
| | | |
| | | |
Advised by International Value Advisers, LLC | | An investment in the Funds is not a bank deposit and is not insured or guaranteed by the Federal Deposit Insurance Corporation or any other government agency. |

| | 2 | | An Owner’s Manual |
| | 3 | | Letter from the President |
| | 4 | | Letter from the Portfolio Managers |
| | 8 | | Management’s Discussion of Fund Performance |
| | | | IVA Worldwide Fund |
| | 10 | | Performance |
| | 11 | | Portfolio Composition |
| | 12 | | Schedule of Investments |
| | | | IVA International Fund |
| | 20 | | Performance |
| | 21 | | Portfolio Composition |
| | 22 | | Schedule of Investments |
| | 30 | | Statements of Assets and Liabilities |
| | 31 | | Statements of Operations |
| | 32 | | Statements of Changes in Net Assets |
| | 33 | | Financial Highlights |
| | 39 | | Notes to Financial Statements |
| | 47 | | Report of Independent Registered Public Accounting Firm |
| | 48 | | Trustees and Officers |
| | 50 | | Additional Information |
| | 53 | | Fund Expenses |
| | 54 | | Important Tax Information |
| An Owner’s Manual | IVA Funds |
An Atypical Investment Strategy
We manage both the IVA Worldwide and IVA International Funds with a dual attempt that is unusual in the mutual fund world: in the short-term (12-18 months), our attempt is to try to preserve capital, while in the longer-term (5-10 years, i.e., over a full economic cycle), we attempt to perform better than the MSCI All Country World Index, in the case of your IVA Worldwide Fund, and the MSCI All Country World Ex-U.S. Index, in the case of your IVA International Fund.
The Worldwide Fund is typically used by investors who are looking for an “all weather fund” where we are given the latitude to decide how much we should have in the U.S. versus outside the U.S. The International Fund is typically used by investors who practice asset allocation and want to decide for themselves how much should be allocated to a domestic manager and how much should be allocated to a pure “international” (i.e., non-U.S.) manager, yet at the same time are looking for a lower risk – and lower volatility – exposure to international markets than may be obtained from a more traditional international fund.
We believe our investment approach is very different from the traditional approach of most mutual funds. We are trying to deliver returns that are as absolute as possible, i.e., returns that try to be as resilient as possible in down markets, while many of our competitors try to deliver good relative performance, i.e., try to beat an index, and thus would be fine with being down 15% if their benchmark is down 20%.
Why do we have such an unusual strategy (which, incidentally, is not easy to carry out)? Because we believe this strategy makes sense for many investors. We are fond of the quote by Mark Twain: “There are two times in a man’s life when he should not speculate: the first time is when he cannot afford to; the second time is when he can.” We realize that many investors cannot tolerate high volatility and appreciate that “life’s bills do not always come at market tops.” This strategy also appeals to us at International Value Advisers since we “eat our own cooking” for a significant part of our savings (invested in IVA products) and we have an extreme aversion to losing money.
An Eclectic Investment Approach
Here is how we try to implement our strategy:
| | n | We don’t hug benchmarks. In practical terms, this means we are willing to make big “negative bets,” i.e., having nothing or little in what has become big in the benchmark. Conversely, we will generally seek to avoid overly large positive bets. |
| | | |
| | n | We prefer having diversified portfolios (100 to 150 names). Because we invest on a global basis, we believe that diversification helps protect against weak corporate governance or insufficient disclosure, or simply against “unknown unknowns.” |
| | | |
| | n | We like the flexibility to invest in small, medium and large companies, depending on where we see value. |
| | | |
| | n | We attempt to capture equity-type returns through fixed income securities but predominantly when credit markets (or sub-sets of them) are depressed and offer this potential. |
| | | |
| | n | We hold some gold, either in bullion form or via gold mining securities, as we feel it provides a good hedge in either an inflationary or deflationary period. |
| | | |
| | n | We are willing to hold cash when we cannot find enough cheap securities that we like or when we find some, yet the broader market (Mr. Market) seems fully priced. We will seek to use that cash as ammunition for future bargains. |
| | | |
| | n | At the individual security level, we ask a lot of questions about “what can go wrong?” and will establish not only a “base case intrinsic value” but also a “worst case scenario” (What could prove us wrong? If we were wrong, are we likely to lose 25%, 30%, or even more of the money invested?). As a result, we will miss some opportunities, yet hopefully, we will also avoid instances where we experience a permanent impairment of value. |
| Letter from the President | IVA Funds |
 | Dear Shareholder,
This annual report covers the fiscal year ended September 30, 2012. Our two mutual funds, the IVA Worldwide Fund and the IVA International Fund, underperformed during this period. We acknowledged in the past, and will continue to in the future, that because of our investment strategy, our Funds may lag global equity market indices not only when they are increasing briskly but also when equities are valued too handsomely for our conservative taste.
Below is a quote from Charles de Vaulx, co-portfolio manager and chief investment officer, from our conference call on September 13, 2012:
“If you think about it, our investment strategy is unique. It’s somewhat unorthodox. It’s very eclectic. We oftentimes will deviate from the benchmarks. We can lag quite a bit in an up market and so we need clients that truly espouse our investment style — global, flexible; an investment style whose core premise is that if you can minimize losses, if you can minimize drawdowns, gains will take care of themselves, and that is one of the most powerful ways to compound wealth over time.”
Our investment strategy does not give us any room for excuses and this is why the Adviser and the Funds are fortunate to be managed by Charles de Vaulx and Chuck de Lardemelle. We do not pay attention to benchmark performance over a month, a quarter or a year. However, we attempt to perform better than equity indices over the longer-term (5-10 years, i.e., a full economic cycle). Because of our eclectic and unusual investment approach, we protected your capital in challenging equity markets during 2008; in 2009 the Funds participated nicely with sharply rising equity markets; in 2010 the Funds took advantage of volatile financial markets and outperformed their respective benchmark in an up market; and in 2011, although performance was slightly down, the Funds were resilient and performed better than their respective benchmarks during a down market. Since the IVA Funds’ inception in 2008, calendar year 2012 thus far, is the only year that performance has not totally met our and some of our clients’ expectations. In keeping with our disciplined investment philosophy, Charles and Chuck are focused on trying to preserve capital, minimize portfolio volatility, and provide good downside protection. They are willing to endure short-term underperformance and let the cash build when they cannot find enough attractive investment opportunities.
The responsibility we have to our clients spans many different departments at IVA. The investment team and the marketing and client service group are the most visible to our shareholders (in fact, almost everyone employed by IVA is a shareholder). IVA is also supported by excellent people in operations and accounting. It is most rewarding for me to observe the continued development, commitment, and strong work ethic of all my colleagues.
We manage our firm and our clients’ assets with a simple philosophy that establishes an order of priority for everything that we do. Our work begins with the client, proceeds to the firm, then to our colleagues, and finally, to the partners. This is and always was the progression. If our clients are taken care of, the rest falls into place. At IVA, every working component is structured in an effort to benefit the client.
It is tremendously fulfilling to build IVA and the Funds. We hope that in the process we are nurturing a culture where everyone at IVA respects the work we are doing for our clients.
Sincerely,

Michael W. Malafronte, President
Effective February 22, 2011, the IVA Worldwide Fund and IVA International Fund are closed to new investors. |
| Letter from the Portfolio Managers | IVA Funds |

 | October 31, 2012
Dear Shareholder,
Both Funds were up nicely this past fiscal year, especially in what has been described as a “new normal” environment, yet lagged their respective benchmarks. It is common for us to lag in very strong bull markets and is expected as both Funds were far from being fully invested in equities throughout the period. We admit that we could have lagged a little less in the IVA Worldwide Fund had it not been for a few investment mistakes on individual stocks such as Hewlett-Packard Co., Staples Inc., Sealed Air Corp., Dell Inc. and Mediaset S.p.A. Despite the lag this year, both Funds outperformed their benchmarks by a significant amount since their inception four years ago on October 1, 2008.
The period under review was less hectic than the previous year yet was contrasted and did witness some volatility, with equity markets down initially until December and then later in April and May of 2012, but otherwise mostly up throughout the rest of the year. The turning and positive points were better employment and economic data in the U.S., a massive injection of liquidity into the European banking system as well as a commitment to lower the sovereign yields of peripheral European countries (including Spain and Italy) by the European Central Bank, a more deliberate effort by the policy makers in China to prevent a hard landing and, finally, corporate profits in many parts of the world surprising on the upside (especially in the U.S., Europe and even Japan despite last year’s earthquake and a pretty strong yen).
Economic Outlook and Valuation
As equity markets recovered and as high quality bonds now offer very low yields (often negative after inflation, guaranteeing a sure way to “grow poor”), we do not feel giddy. If anything, we feel some unease. Both Funds’ equity exposure is less than it was a year ago and their cash levels are higher. The “deleveraging” process in many of the countries where the credit bubble took place earlier may have just begun (it could last 23 years based on the past episodes studied by Carmen Reinhart, Kenneth Rogoff and Vincent Reinhart) and the ultimate form and mix of the different deleveraging mechanisms (debt reduction, austerity, wealth transfer from the haves to the have-nots and debt monetization, to use Ray Dalio’s terminology) remain unknown as many countries involved are democracies where the tolerance for pain is unclear...not that it is clear either as to how things will unfold in a country such as China.
Regarding the macro economic outlook, the world and economic policies have not changed enough to alter our long held view that economic growth globally may be muted for many years to come. On one hand, things are improving a little in the U.S. with construction activity bottoming up, favorable demographics and some timely discoveries of oil and gas that will help the country reduce its trade deficit. On the other hand, the austerity measures in Europe are resulting in a worrisome slowdown while things are still unsettled, not only in China, but also in countries such as India, Brazil and South Africa.
Regarding valuation, we are encouraged that on a relative basis, equities worldwide look cheap relative to cash and high quality bonds and that corporate profits are very healthy while balance sheets have been repaired. But we are discouraged by the fact that equities are more expensive now than a year ago, especially for the high quality, dividend paying |
| Letter from the Portfolio Managers | IVA Funds |
stocks that are becoming the new “glamour” stocks of today (due to valuation, we had to sell out of names such as Wal-Mart Stores, Inc., Colgate-Palmolive Co. and Diageo Plc over the past year, for instance). We also worry that corporate profit margins probably peaked for many businesses around the world so that the high free cash flow yield differential between many stocks and high quality bonds is somewhat of an optical illusion. Come to think of it, the very low yields on high quality bonds may be deceiving as well. The Federal Reserve Bank acknowledged that without quantitative easing (“Operation Twist” and “QE3”), long term yields would probably be 1.5 percentage points higher than where they are today.
Quantitative Easing, Debt and Inflation
One of the difficulties of the investing environment today is that the possible outcomes resulting from the financial crisis that burst in 2008 remain not only unknown but quite binary: either low inflation or possibly even some deflation; or some accelerating inflation a few years out.
The major tool that has been used in many countries to deflect that financial crisis is “Quantitative Easing” (“QE”). That is a radical tool and we have seen the balance sheets of many central banks around the world balloon in size like never before in history. Yet, like joining a foreign war with no clear purpose, the reasons given for QE are wide ranging and keep changing over time: providing liquidity to prevent a global banking collapse in 2008, helping banks rebuild their balance sheets, helping lower mortgage rates to facilitate refinancing and to encourage the purchase of new homes, helping to boost equity markets in the hope to provoke a “wealth effect”...yet little is said about some of the other reasons for it such as “taxing” the savers by cutting significantly the real incomes of those who have saved for their retirements or their children’s education over their lifetime. An even more worrisome reason is that QE is a convenient way for many governments to finance unprecedented fiscal deficits at artificially low rates: governments get to borrow from the markets only for the central bank to buy that debt back. In the U.S., during the last fiscal year, around three-quarters of the deficit was financed by the Federal Reserve, according to a recent article by George Shultz (et al.) in The Wall Street Journal. These are ventures into largely unknown territory and, like a war with no clear purpose, plotting an exit strategy seems difficult and maybe even impossible.
It is too simplistic to blame the Central Bankers and their printing presses. We believe they are mere agents and that the real culprits are the governments which, all too often, let their fiscal deficits balloon so that government debt becomes way too big and unmanageable. We have often argued that we believe inflation is first and foremost a fiscal phenomenon and have mentioned Sidney Homer and Richard Sylla’s A History of Interest Rates, an account covering over four millennia of economic history that shows that periods of inflation typically come after periods of significant government spending and associated government borrowing. As John Cochrane recently argued in “Inflation and Debt” (National Affairs, 2011), “Inflation is a form of sovereign default. Paying off bonds with currency that is worth half as much as it used to be is like defaulting on half the debt...Most analysts today – even those who do worry about inflation – ignore the direct link between debt, looming deficits, and inflation...”
Thus, the prospect of rising and higher inflation three to five years out should be understood as a possibility and a risk for so called “risk-free assets” such as cash or high quality bonds. Inflation is also bad for the world economy, business and equities. But history, including recent history (late 1960s and the 1970s) suggests that equities have
| Letter from the Portfolio Managers | IVA Funds |
characteristics that may help them hold up better than many other asset classes in an inflationary environment. Morningstar wrote a good piece recently (October 11, 2012) on that topic with some interesting data points and concluded: “From today’s historically low interest-rate levels, the potential for equities to outpace inflation is an important risk-management consideration, even if inflation does not rise above historically average levels as seen during the 1970s.”
At the Berkshire Hathaway Annual General Meeting, which some of us attended in May of 2011, Warren Buffett declared that the best inflation hedge is a company with a wonderful product that requires little capital to grow (he cited See’s Candy as an example). Conversely if a company has a lot of receivables or inventory or fixed assets that have to be replaced over time, that is often a lousy business in an inflationary environment because of the much higher amount of capital employed that is needed by the business as prices go up. At IVA, we are looking for businesses likely to do well under inflation: some pricing power, low capital intensity, growing at GDP or higher, yet selling at reasonable prices. Examples include: Berkshire Hathaway Inc. (pricing power in railroads and insurance through the ability of walking away and not bidding on contracts through its unique financial strength), Applied Materials, Inc. (pricing power through its unique technology; often its equipment is the only real choice for semiconductor manufacturers such as Samsung or Intel), Google Inc., (through its quasi monopoly in search advertising, where pricing is driven by auction-like mechanisms), Sodexo SA (food catering and facilities management where contracts often have inflation escalators and require no capital to operate as payables are shorter than receivables), and MasterCard Inc. (where revenues are a percentage of the transaction, but costs are fairly fixed).
Are Corporate Profits Sustainable?
One of the unique features of today’s economic landscape is that corporate profits have bounced back to very elevated levels, in many instances almost as high or higher than before the financial crisis unfolded in 2008. As economic growth may be very slow for many years to come and as the owners of capital have enjoyed most of the benefits over the past fifteen years while not much has accrued to labor, these corporate profits could experience some reversion to the mean. That may explain why certain stocks may be in the process of becoming “glamour” stocks. Investors, out of fear and due to their frenzied quest for “certainty” in an uncertain world, have bid up the price of so called “high quality, dividend paying stocks.” That idea was sound at first and we did own many of those names at IVA a couple of years ago. But like many good ideas it may be carried too far. That some business models are superior and that some moats are much stronger than others is undeniable, but one has to be mindful and remember from history that certain disruptive forces (technology, demography...) may result in certain moats being eroded (think about what the internet has done to the newspaper industry).
As a result, we believe that stock picking will make a big difference in this low return world for the foreseeable future, with a particular emphasis on trying to identify those companies that may maintain their high margins going forward and those that may not. That requires having a team of analysts whose work goes way beyond the number crunching and increasingly studies the finer qualitative aspects of a business. As Albert Einstein said, “not everything that can be counted counts, and not everything that counts can be counted.”
In conclusion, we invite you to read, or reread, some of the pieces we posted on our website over the past year (“Stock picking makes a difference,” “Volatility as a friend in
| Letter from the Portfolio Managers | IVA Funds |
a low return world,” “So many companies are global” and “Central Bankers, Negative Real Returns and Printing Presses: How should one invest in a world where ‘risk-free assets’ have become certificates of confiscation”). We realize that a low return world is very challenging for everybody: for individuals who may not have saved enough for their future, for investment and financial advisers who have to help set the right expectations for their clients, and for institutional investors who may have a longer term horizon, yet have to meet, over time, some pretty high hurdles in terms of returns.
We try to remain candid in our communication. To restate what we just wrote in our latest newsletter: in a world where theoretical “risk-free assets” (traditionally understood as cash and U.S. Treasuries) have a high probability of delivering losses in real terms over the next decade, we are trying to deliver real absolute returns by holding a combination of reasonably valued equities, cash (as dry powder to take advantage of share price volatility), foreign government bonds, and gold. Our flexibility at IVA to navigate between these asset classes, depending on their respective prices, is an advantage few of our competitors enjoy.
We appreciate your continued confidence and thank you for your support.

Charles de Vaulx, Chief Investment Officer and Portfolio Manager

Chuck de Lardemelle, Portfolio Manager
| Management’s Discussion of Fund Performance (unaudited) | IVA Funds |
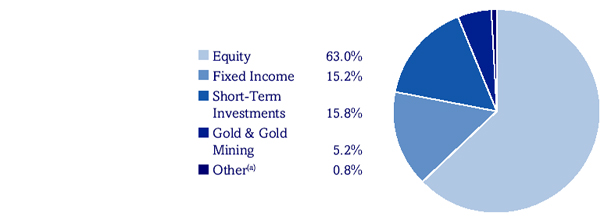
Global equity markets soared over the fiscal year period ending September 30, 2012 and we are seeing an increasing discrepancy between what is happening in the “real world” and equity markets. As a result, both Funds are cautiously positioned and over the year we reduced our equity exposure by trimming positions in companies we feel may be subject to deflationary forces or that we think have less robust corporate governance. Additionally, as the market rallied we sold or decreased exposure to a number of stocks, mostly in the consumer staples sector. As of September 30, 2012, our equity exposure totaled 63.0% in the IVA Worldwide Fund (versus 66.5% a year ago) and 57.1% in the IVA International Fund (compared to 65.3% a year ago).
Gold bullion performed well for both Funds, averaging a return of about 9% and added about 0.4% to the return in both Funds. Our exposure was 4.0% in the IVA Worldwide Fund and 3.8% in the IVA International Fund as of September 30, 2012. We still view gold as a good hedge against uncertainty and currency debasement. Just over 1% of both Funds’ net assets was in gold mining stocks at the end of the period. We bought them in September 2011, as they finally looked cheap to us relative to the metal. We are also mindful of the constraints on investing in gold bullion associated with the IRS qualifying income test. During the period, the gold mining stocks detracted about –0.1% from the return in the IVA Worldwide Fund and –0.2% from the return in the IVA International Fund.
One area that hurt performance was the derivative instruments we used to make some directional bets on interest rates, specifically the 10-year U.S. dollar Treasury bond yield (IVA Worldwide Fund only) and the 10-year Japanese government bond yield. They performed in line with what happened to their underlying instruments and detracted about –0.4% from the IVA Worldwide Fund return and about –0.3% from the IVA International Fund return. As of September 30, 2012, we had closed out of these futures contracts.
Even though both Funds underperformed their benchmark over the period partly due to their cash exposure (15.8% in the IVA Worldwide Fund and 22.2% in the IVA International Fund at fiscal year-end) as well as their allocation to short-dated foreign sovereign bonds, we are willing to endure this underperformance (which we view as short-term) and let the cash build when we cannot find enough attractive investment opportunities. We are focused on trying to preserve capital, mitigating portfolio volatility, maintaining our disciplined investment strategy, and always insisting on what we believe is enough of a margin of safety.
IVA Worldwide Fund
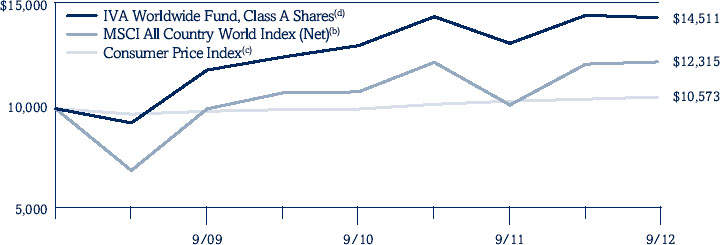
The IVA Worldwide Fund Class A shares, at net asset value, returned 9.62% for the one year period ending September 30, 2012. The MSCI All Country World Index (Net) (the “Index”) returned 20.98% over the same period.
Our corporate bonds outperformed our equities over the period, averaging a return of 20.6%, due to solid returns from our Wendel bonds, which accounted for over half of that group’s 1.5% contribution to return. Together they were among our top five positions contributing to return.
Our equities (ex-gold mining stocks) averaged gains of 13.6% versus the Index at 21.0% over the period. Equities in the U.S. contributed the most to our return, about 4.8%, due to good performance from MasterCard Inc., Class ‘A’ (technology, U.S.), News Corp. Class ‘A’ and Class ‘B’ (consumer discretionary, U.S.), Berkshire Hathaway Inc. Class ‘A’ and Class ‘B’ (holding company, U.S.), and Microsoft Corp. (technology, U.S.). However, a few low growth stocks in the region weighed on our return and our underweight exposure versus the benchmark detracted the most from relative results; our U.S. stocks averaged a return of 17.0% versus the benchmark at 29.2%. Additionally, stocks in France added about 1.3% to our return. Astellas Pharma Inc. (health care, Japan) was also one of the top five individual contributors to return over the period, which helped our Japanese equities average gains of
| Management’s Discussion of Fund Performance (unaudited) | IVA Funds |
9.1% versus the benchmark at –1.6%. The only countries to detract from our return over the period were Italy and Denmark, together about –0.2%.
By sector, our technology and consumer discretionary stocks added the most to our return, together about 4.2%. Conversely, utilities and real estate collectively detracted about –0.4% from our return due to the performance of GDF Suez SA (utilities, France) and Hulic Co., Ltd. (formerly Shoei Co., Ltd.) (real estate, Japan). The other individual equity detractors from return included: Dell Inc. (technology, U.S.), Credit Suisse Group AG (financials, Switzerland), and Miura Co., Ltd. (industrials, Japan).
Our forward foreign currency contracts, which are used to hedge currency risk, contributed about 0.6% to return over the period.
IVA International Fund
The IVA International Fund Class A shares, at net asset value, returned 9.53% for the one year period ending September 30, 2012. The MSCI All Country World (ex-U.S.) Index (Net) (the “Index”) returned 14.48% over the same period.
Our corporate bonds outperformed our equities over the period, averaging a return of 23.8% due to solid returns from our Wendel bonds which accounted for over half of that group’s 1.5% contribution to return. Together they were among our top five positions contributing to return.
Our equities (ex-gold mining stocks) averaged gains of 13.6% versus the Index at 14.4% over the period. Equities in France and Japan contributed the most to our return, together about 4.5%, due to good performance from Astellas Pharma Inc. (health care, Japan), So-net Entertainment Corp. (technology, Japan), Total SA, ADR (energy, France), and Temp Holdings Co., Ltd. (industrials, Japan). Additionally, our Japanese stocks performed well on a relative basis, averaging gains of 10.1% versus the benchmark at –1.6% as one of the companies we own, So-net Entertainment Corp., announced a takeover by its parent company at about a 70% premium to the stock price prior to the announcement. Conversely, Italy, Argentina, and India together detracted about –0.3% from our return.
By sector, our consumer staples and industrials stocks added the most to our return, together about 3.6%. Additionally, we trimmed or sold a number of stocks in these two sectors which brought our collective exposure down to 20.7% from 25.8% the prior year. Even though our financials stocks averaged a return of 0.8% versus the benchmark at 18.5%, this was the largest detractor from relative equity results due to our minimal exposure and one of our holdings there, Credit Suisse Group AG (financials, Switzerland), was amongst our top five individual equity detractors from return. Utilities and real estate detracted the most from our return, together –0.6%, due to the performance of GDF Suez SA (utilities, France) and Hulic Co., Ltd. (formerly Shoei Co., Ltd.) (real estate, Japan). Other individual equity detractors included Miura Co., Ltd. (industrials, Japan) and Mediaset S.p.A. (consumer discretionary, Italy).
Our forward foreign currency contracts, which are used to hedge currency risk, contributed about 0.8% to return over the period.
Investment Risks: There are risks associated with investing in funds that invest in securities of foreign countries, such as erratic market conditions, economic and political instability and fluctuations in currency exchange rates. Value-based investments are subject to the risk that the broad market may not recognize their intrinsic value.
| IVA Worldwide Fund | IVA Funds |
| Performance (unaudited) | As of September 30, 2012 |
| Average Annual Total Returns as of September 30, 2012 | | One Year | | Three Years | | Since Inception(a) |
| |
| |
| |
|
| Class A | | | 9.62 | % | | | | 6.80 | % | | | | 11.17 | % | |
| Class A (with a 5% maximum initial sales charge) | | | 4.12 | % | | | | 4.98 | % | | | | 9.75 | % | |
| Class C | | | 8.87 | % | | | | 5.99 | % | | | | 10.34 | % | |
| Class I | | | 9.97 | % | | | | 7.07 | % | | | | 11.43 | % | |
| MSCI All Country World Index (Net)(b) | | | 20.98 | % | | | | 7.23 | % | | | | 5.34 | % | |
| Consumer Price Index(c) | | | 2.00 | % | | | | 2.34 | % | | | | 1.40 | % | |
| Growth of a $10,000 Initial Investment | |
| |
|
| (a) | The Fund commenced investment operations on October 1, 2008. |
| (b) | The MSCI All Country World Index (Net) is an unmanaged, free float-adjusted market capitalization weighted index composed of stocks of companies located in countries throughout the world. It is designed to measure equity market performance in global developed and emerging markets. The index includes reinvestment of dividends, net of foreign withholding taxes. Please note that an investor cannot invest directly in an index. |
| (c) | The Consumer Price Index examines the weighted average of prices of a basket of consumer goods and services, such as transportation, food and medical care. Please note that an investor cannot invest directly in an index. |
| (d) | Hypothetical illustration of $10,000 invested in Class A shares on October 1, 2008, assuming the deduction of the maximum initial sales charge of 5% at the time of investment for Class A shares and the reinvestment of all distributions, including returns of capital, if any, at net asset value through September 30, 2012. The performance of the Fund’s other classes may be greater or less than the Class A shares’ performance indicated on this chart depending on whether greater or lesser sales charges and fees were incurred by shareholders investing in the other classes. |
Past performance is no guarantee of future results. The performance data quoted represents past performance and current returns may be lower or higher. The investment return and principal value will fluctuate so that an investor’s shares, when redeemed, may be worth more or less than the original cost. The returns do not reflect the deduction of taxes that a shareholder would pay on Fund distributions or the redemption of Fund shares. To obtain performance information current to the most recent month-end, please call 866-941-4482.
The maximum sales charge for Class A shares is 5.00%. Class C shares may include a 1.00% contingent deferred sales charge for the first year only. The expense ratios for the Fund are as follows: 1.29% (Class A shares); 2.04% (Class C shares); and 1.04% (Class I shares). These expense ratios are as stated in the most recent Prospectus dated January 31, 2012. More recent expense ratios can be found in the Financial Highlights section of this Annual Report.
| IVA Worldwide Fund | IVA Funds |
| Portfolio Composition (unaudited) | As of September 30, 2012 |
| Asset Allocation (As a Percent of Total Net Assets) | |
| |
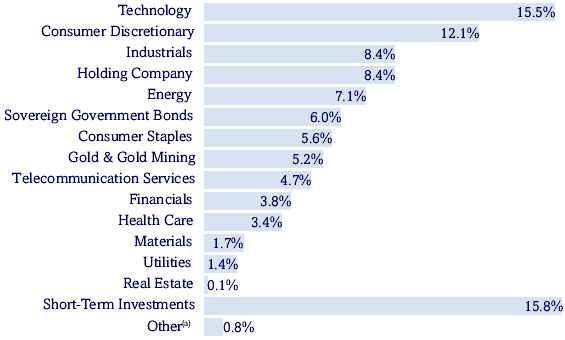
| Sector Allocation (As a Percent of Total Net Assets) | |
| |
| Top 10 Positions (As a Percent of Total Net Assets)(b) | |
| |
| Government of Singapore, 2.25% due 7/1/2013; 3.625% due 7/1/2014 | | | 4.8 | % |
| |
| Gold Bullion | | | 4.0 | % |
| |
| Wendel, 4.875% due 5/26/2016; 4.375% due 8/9/2017; 6.75% due 4/20/2018 | | | 3.7 | % |
| |
| Berkshire Hathaway Inc., Class ‘A’; Class ‘B’ | | | 3.4 | % |
| |
| Astellas Pharma Inc. | | | 3.2 | % |
| |
| Devon Energy Corp. | | | 2.4 | % |
| |
| Genting Malaysia Berhad | | | 2.0 | % |
| |
| Microsoft Corp. | | | 1.8 | % |
| |
| Secom Co., Ltd. | | | 1.8 | % |
| |
| Google Inc., Class ‘A’ | | | 1.6 | % |
| |
| Top 10 positions represent 28.7% of total net assets. |
| (a) | Other represents unrealized gains and losses on forward currency contracts and other assets and liabilities. |
| (b) | Short-Term Investments are not included. |
| IVA Worldwide Fund | IVA Funds |
Schedule of Investments
September 30, 2012 |
|
| | | | SHARES | | DESCRIPTION | | FAIR VALUE |
| COMMON STOCKS – 63.4% | | | | | | | | |
| |
| Australia | 0.4% | | | | | | | | |
| | | | 1,249,229 | | Newcrest Mining Ltd. | | $ | 37,760,358 |
| |
| |
| |
| Belgium | 0.3% | | | | | | | | |
| | | | 283,405 | | Sofina SA | | | 23,275,352 |
| |
| |
| |
| Canada | 0.6% | | | | | | | | |
| | | | 3,276,930 | | IAMGOLD Corp. | | | 51,808,263 |
| |
| |
| |
| Denmark | 0.2% | | | | | | | | |
| | | | 824,341 | | D/S Norden A/S | | | 21,995,688 |
| |
| |
| |
| France | 9.4% | | | | | | | | |
| | | | 311,352 | | Alten | | | 9,958,559 |
| |
| |
| | | | 192,725 | | Bolloré | | | 50,039,947 |
| |
| | | | 382,636 | | Cap Gemini SA | | | 16,189,430 |
| |
| |
| | | | 816,478 | | Carrefour SA | | | 16,934,327 |
| |
| | | | 326,595 | | Ciments Français SA | | | 19,263,809 |
| |
| |
| | | | 39,261 | | Financière de l’Odet SA | | | 20,054,804 |
| |
| | | | 9,245 | | Financière Marc de Lacharriere SA | | | 382,308 |
| |
| |
| | | | 5,550,875 | | GDF Suez SA | | | 124,116,817 |
| |
| | | | 2,329,011 | | Lagardère SCA | | | 63,613,982 |
| |
| |
| | | | 582,391 | | Publicis Groupe SA | | | 32,592,881 |
| |
| | | | 86,469 | | Robertet SA | | | 13,339,592 |
| |
| |
| | | | 60,339 | | Séché Environnement SA | | | 2,213,727 |
| |
| | | | 1,121,768 | | Sodexo SA | | | 84,459,106 |
| |
| |
| | | | 2,928,862 | | Teleperformance (a) | | | 83,893,616 |
| |
| | | | 1,205,035 | | Thales SA | | | 41,384,462 |
| |
| |
| | | | 2,658,238 | | Total SA, ADR | | | 133,177,724 |
| |
| | | | 6,343,959 | | Vivendi SA | | | 123,711,195 |
| |
| |
| | | | | | | | | 835,326,286 |
| |
|
| |
| |
| |
| Germany | 0.3% | | | | | | | | |
| | | | 133,797 | | Siemens AG | | | 13,343,937 |
| |
| |
| | | | 231,790 | | Wincor Nixdorf AG | | | 9,063,931 |
| |
| | | | 200,074 | | Wirecard AG | | | 4,594,467 |
| |
| |
| | | | | | | | | 27,002,335 |
| |
|
| |
| |
| |
| Hong Kong | 0.1% | | | | | | | | |
| | | | 15,826,640 | | Clear Media Ltd. (b) | | | 8,470,484 |
| |
| |
| |
| Japan | 12.1% | | | | | | | | |
| | | | 5,604,600 | | Astellas Pharma Inc. | | | 284,754,472 |
| |
| | | | 992,800 | | Benesse Holdings Inc. | | | 48,087,955 |
| |
| |
| | | | 3,187,600 | | Cosel Co., Ltd. (a) | | | 42,642,932 |
| |
| | | | 10,012 | | Fuji Media Holdings Inc. | | | 16,395,869 |
| |
| |
| | | | 1,306,300 | | Icom Inc. (a) | | | 31,602,952 |
| |
| | | | 1,771,170 | | Kose Corp. | | | 41,283,422 |
| |
| |
| | | | 213,800 | | Medikit Co., Ltd. | | | 7,123,014 |
| |
| | | | 1,622,100 | | Meitec Corp. | | | 36,956,610 |
|
| 12 | See Notes to Financial Statements. |
| IVA Worldwide Fund | IVA Funds |
Schedule of Investments
September 30, 2012 |
|
| | | | | SHARES | | DESCRIPTION | | FAIR VALUE |
| |
| | |
| | |
| | Japan | 12.1% (continued) | | | | | | | | |
| |
|
| | | | | 951,200 | | Milbon Co., Ltd. (a) | | $ | 31,921,999 |
| | |
| | |
| | | | | 3,271,704 | | Miura Co., Ltd. (a) | | | 79,235,271 |
| |
|
| | | | | 970,800 | | Nifco Inc. | | | 22,428,913 |
| | |
| | |
| | | | | 243,200 | | Nintendo Co., Ltd. | | | 30,820,707 |
| |
|
| | | | | 184,900 | | Nitto Kohki Co., Ltd. | | | 4,371,354 |
| | |
| | |
| | | | | 13,724 | | NTT DoCoMo, Inc. | | | 22,263,690 |
| |
|
| | | | | 505,200 | | Okinawa Cellular Telephone Co. | | | 10,979,231 |
| | |
| | |
| | | | | 4,526 | | Pasona Group Inc. | | | 2,957,791 |
| |
|
| | | | | 3,002,500 | | Secom Co., Ltd. | | | 156,588,608 |
| | |
| | |
| | | | | 1,550,100 | | Shiseido Co., Ltd. | | | 21,273,156 |
| |
|
| | | | | 613,688 | | Shofu Inc. | | | 6,605,560 |
| | |
| | |
| | | | | 61,900 | | SMC Corp. | | | 9,978,242 |
| |
|
| | | | | 880 | | Techno Medica Co., Ltd. | | | 4,437,212 |
| | |
| | |
| | | | | 3,016,200 | | Temp Holdings Co., Ltd. (a) | | | 36,678,291 |
| |
|
| | | | | 2,396,000 | | Toho Co., Ltd. | | | 44,057,663 |
| | |
| | |
| | | | | 208,737 | | Yahoo Japan Corp. | | | 79,520,131 |
| |
|
| | | | | | | | | | 1,072,965,045 |
| |
|
| | |
| |
|
| | Malaysia | 2.0% | | | | | | | | |
| | | | | 158,392,000 | | Genting Malaysia Berhad | | | 181,374,775 |
| |
|
| | |
| | |
| | |
| | Norway | 1.0% | | | | | | | | |
| | | | | 11,782,750 | | Orkla ASA | | | 89,487,939 |
| | |
| | |
| | |
| |
|
| | Singapore | 0.0% | | | | | | | | |
| | | | | 219,069 | | United Overseas Bank Ltd. | | | 3,507,746 |
| |
|
| | |
| | |
| | |
| | South Africa | 0.6% | | | | | | | | |
| | | | | 6,324,803 | | Net 1 U.E.P.S. Technologies Inc. (a)(c) | | | 57,239,467 |
| | |
| | |
| | |
| |
|
| | South Korea | 3.0% | | | | | | | | |
| | | | | 96,919 | | E-Mart Co., Ltd. | | | 21,146,598 |
| |
|
| | | | | 2,356,710 | | Kangwon Land, Inc. | | | 53,010,999 |
| | |
| | |
| | | | | 41,859 | | Lotte Chilsung Beverage Co., Ltd. | | | 51,936,533 |
| |
|
| | | | | 34,996 | | Lotte Confectionery Co., Ltd. | | | 48,868,607 |
| | |
| | |
| | | | | 184,520 | | Nong Shim Co., Ltd. | | | 44,078,602 |
| |
|
| | | | | 3,018,381 | | SK Telecom Co., Ltd., ADR | | | 43,887,260 |
| | |
| | |
| | | | | 11,654 | | Teems Inc. | | | 115,866 |
| |
|
| | | | | | | | | | 263,044,465 |
| |
|
| | |
| |
|
| | Switzerland | 2.7% | | | | | | | | |
| | | | | 68,492 | | APG SGA SA | | | 13,021,127 |
| |
|
| | | | | 2,228,519 | | Nestlé SA | | | 140,511,618 |
| | |
| | |
| | | | | 117,064 | | Schindler Holding AG | | | 14,388,728 |
| |
|
| | | | | 5,541,160 | | UBS AG | | | 67,460,161 |
| | |
| | |
| | | | | | | | | | 235,381,634 |
| |
|
| | |
| | |
| | |
| | Taiwan | 0.1% | | | | | | | | |
| | | | | 2,576,000 | | Taiwan Secom Co., Ltd. | | | 5,668,105 |
| |
|
| See Notes to Financial Statements. | 13 |
| IVA Worldwide Fund | IVA Funds |
Schedule of Investments
September 30, 2012 |
|
| | | | | SHARES | | DESCRIPTION | | FAIR VALUE |
| | |
| | |
| | |
| | United Kingdom | 0.7% | | | | | | | | |
| | | | | 3,429,517 | | Inmarsat Plc | | $ | 32,674,092 |
| | |
| | |
| | | | | 3,256,553 | | Millennium & Copthorne Hotels Plc | | | 25,541,407 |
| |
|
| | | | | | | | | | 58,215,499 |
| |
|
| | |
| |
|
| | United States | 29.9% | | | | | | | | |
| | | | | 1,378,895 | | Amdocs Ltd. | | | 45,489,746 |
| |
|
| | | | | 515,872 | | Annaly Capital Management Inc. | | | 8,687,285 |
| | |
| | |
| | | | | 1,439,280 | | Aon Plc | | | 75,259,951 |
| |
|
| | | | | 8,499,523 | | Applied Materials, Inc. | | | 94,897,174 |
| | |
| | |
| | | | | 376,634 | | Automatic Data Processing Inc. | | | 22,093,350 |
| |
|
| | | | | 1,670,649 | | Baker Hughes Inc. | | | 75,563,454 |
| | |
| | |
| | | | | 1,533 | | Berkshire Hathaway Inc., Class ‘A’ (c) | | | 203,429,100 |
| |
|
| | | | | 1,105,659 | | Berkshire Hathaway Inc., Class ‘B’ (c) | | | 97,519,124 |
| | |
| | |
| | | | | 436,063 | | Cimarex Energy Co. | | | 25,531,489 |
| |
|
| | | | | 61,529 | | Contango Oil & Gas Co. (c) | | | 3,023,535 |
| | |
| | |
| | | | | 120,568 | | Contango ORE Inc. (b)(c) | | | 940,430 |
| |
|
| | | | | 1,027,406 | | CVS Caremark Corp. | | | 49,746,999 |
| | |
| | |
| | | | | 8,585,032 | | Dell Inc. | | | 84,648,416 |
| |
|
| | | | | 3,495,823 | | Devon Energy Corp. | | | 211,497,292 |
| | |
| | |
| | | | | 2,075,688 | | DeVry Inc. | | | 47,242,659 |
| |
|
| | | | | 461,741 | | Energizer Holdings Inc. | | | 34,450,496 |
| | |
| | |
| | | | | 3,397,566 | | Expeditors International of Washington Inc. | | | 123,535,500 |
| |
|
| | | | | 329,017 | | Goldman Sachs Group, Inc. | | | 37,402,653 |
| | |
| | |
| | | | | 187,557 | | Google Inc., Class ‘A’ (c) | | | 141,511,757 |
| |
|
| | | | | 3,138,201 | | Hewlett-Packard Co. | | | 53,537,709 |
| | |
| | |
| | | | | 3,086,172 | | Ingram Micro Inc., Class ‘A’ (c) | | | 47,002,400 |
| |
|
| | | | | 1,679,909 | | JDA Software Group, Inc. (c) | | | 53,387,508 |
| | |
| | |
| | | | | 1,495,272 | | Liberty Interactive Corp., Series ‘A’ (c) | | | 27,662,532 |
| |
|
| | | | | 801,827 | | Marsh & McLennan Cos., Inc. | | | 27,205,990 |
| | |
| | |
| | | | | 203,914 | | MasterCard Inc., Class ‘A’ | | | 92,063,093 |
| |
|
| | | | | 5,372,999 | | Microsoft Corp. | | | 160,007,910 |
| | |
| | |
| | | | | 32,223 | | National CineMedia, Inc. | | | 527,491 |
| |
|
| | | | | 328,727 | | Newmont Mining Corp. | | | 18,411,999 |
| | |
| | |
| | | | | 566,219 | | News Corp., Class ‘A’ | | | 13,889,352 |
| |
|
| | | | | 1,367,254 | | News Corp., Class ‘B’ | | | 33,907,899 |
| | |
| | |
| | | | | 806,016 | | Occidental Petroleum Corp. | | | 69,365,737 |
| |
|
| | | | | 3,853,507 | | Oracle Corp. | | | 121,346,935 |
| | |
| | |
| | | | | 448,478 | | SEACOR Holdings Inc. (c) | | | 37,385,126 |
| |
|
| | | | | 4,562,178 | | Sealed Air Corp. | | | 70,531,272 |
| | |
| | |
| | | | | 1,368,809 | | Spansion, Inc., Class ‘A’ (c) | | | 16,316,203 |
| |
|
| | | | | 8,724,204 | | Staples Inc. | | | 100,502,830 |
| | |
| | |
| | | | | 2,972,682 | | Symantec Corp. (c) | | | 53,508,276 |
| |
|
| | | | | 900,586 | | Telephone & Data Systems, Inc. | | | 23,064,007 |
| | |
| | |
| | | | | 2,567,755 | | Texas Instruments Inc. | | | 70,741,650 |
| |
|
| | | | | 1,349,251 | | Valassis Communications, Inc. (c) | | | 33,313,007 |
| | |
| | |
| | | | | 308,409 | | The Washington Post Co., Class ‘B’ | | | 111,961,719 |
| |
|
| | | | | 1,483,875 | | Yahoo! Inc. (c) | | | 23,704,903 |
| |
|
| 14 | See Notes to Financial Statements. |
| IVA Worldwide Fund | IVA Funds |
Schedule of Investments
September 30, 2012 |
|
| | | SHARES | | | | DESCRIPTION | | FAIR VALUE |
| |
| | |
| | |
| | United States | 29.9% (continued) | | | | | | | |
| |
|
| | | 347,696 | | | | Zebra Technologies Corp. (c) | | $ | 13,052,508 |
| | |
| | |
| | | | | | | | | | 2,654,868,466 |
| |
|
| | | | | | | TOTAL COMMON STOCKS | | | |
| | | | | | | (Cost — $5,418,954,788) | | | 5,627,391,907 |
| | |
| | |
| | CONVERTIBLE PREFERRED STOCKS – 0.8% |
| | |
| | United States | 0.8% | | | | | | | | |
| | | 68,284 | USD | | | Bank of America Corp., Series ‘L’, 7.25% | | | 74,429,560 |
| | |
| | |
| | | | | | | TOTAL CONVERTIBLE PREFERRED STOCKS | | | |
| | | | | | | (Cost — $54,139,616) | | | 74,429,560 |
| |
|
| | | PRINCIPAL | | | | | | | |
| | | AMOUNT | | | | | | | |
| | CORPORATE NOTES & BONDS – 9.2% |
| | |
| | |
| | France | 3.7% | | | | | | | | |
| | | | | | | Wendel: | | | |
| | | 35,100,000 | EUR | | | 4.875% due 5/26/2016 (d) | | | 45,950,969 |
| |
|
| | | 116,950,000 | EUR | | | 4.375% due 8/9/2017 | | | 149,910,850 |
| | |
| | |
| | | 95,400,000 | EUR | | | 6.75% due 4/20/2018 | | | 131,175,306 |
| |
|
| | | | | | | | | | 327,037,125 |
| |
|
| | |
| | |
| | |
| | Netherlands | 0.3% | | | | | | | | |
| | | 22,929,000 | EUR | | | UPC Holding BV, 8% due 11/1/2016 (d) | | | 30,519,159 |
| |
|
| | |
| | |
| | |
| | Norway | 0.3% | | | | | | | | |
| | | 26,400,000 | USD | | | Golden Close Maritime Corp. Ltd., 11% due 12/9/2015 (b) | | | 28,446,000 |
| |
|
| | |
| | |
| | Switzerland | 0.5% | | | | | | | | |
| | | | | | | UBS AG: | | | |
| | | 16,953,000 | EUR | | | 4.28% due 4/15/2015 (e) | | | 19,650,474 |
| | |
| | |
| | | 8,800,000 | EUR | | | 7.152% due 12/21/2017 (e) | | | 11,463,929 |
| |
|
| | | 8,892,000 | USD | | | UBS Preferred Funding Trust V, 6.243% due 5/15/2016 (e) | | | 8,847,540 |
| |
|
| | | | | | | | | | 39,961,943 |
| |
|
| | |
| | |
| | United Kingdom | 0.2% | | | | | | | | |
| | | 19,300,000 | USD | | | Inmarsat Finance Plc, 7.375% due 12/1/2017 (d) | | | 20,940,500 |
| |
|
| | |
| |
|
| | United States | 4.2% | | | | | | | | |
| | | 6,070,000 | USD | | | Brandywine Operating Partnership, LP, 5.7% due 5/1/2017 | | | 6,770,666 |
| |
|
| | | 18,309,000 | USD | | | Cloud Peak Energy Resources LLC, 8.5% due 12/15/2019 | | | 20,231,445 |
| | |
| | |
| | | 19,016,000 | USD | | | Denbury Resources Inc., 9.75% due 3/1/2016 | | | 20,489,740 |
| |
|
| | | 3,408,000 | USD | | | Encore Acquisition Co., 9.5% due 5/1/2016 | | | 3,714,720 |
| | |
| | |
| | | | | | | Intelsat Luxembourg SA: | | | |
| | | 46,121,000 | USD | | | 11.25% due 2/4/2017 | | | 48,945,911 |
| | |
| | |
| | | 51,283,000 | USD | | | 11.5% due 2/4/2017 (f) | | | 54,552,292 |
| |
|
| See Notes to Financial Statements. | 15 |
| IVA Worldwide Fund | IVA Funds |
Schedule of Investments
September 30, 2012 |
|
| | | PRINCIPAL | | | | | | | |
| | | AMOUNT | | | | DESCRIPTION | | FAIR VALUE |
| | |
| | |
| | |
| | United States | 4.2% (continued) | | | | | | | | |
| |
|
| | | 3,418,000 | USD | | | Leucadia National Corp., 8.125% due 9/15/2015 | | $ | 3,870,885 |
| | |
| | |
| | | 1,740,000 | USD | | | Level 3 Financing Inc., 10% due 2/1/2018 | | | 1,944,450 |
| |
|
| | | 6,961,000 | USD | | | MetroPCS Wireless Inc., 7.875% due 9/1/2018 | | | 7,552,685 |
| | |
| | |
| | | 37,016,000 | USD | | | Mohawk Industries Inc., 6.375% due 1/15/2016 (g) | | | 41,828,080 |
| |
|
| | | | | | | QVC Inc.: | | | |
| | | 6,878,000 | USD | | | 7.125% due 4/15/2017 (d) | | | 7,258,677 |
| |
|
| | | 31,121,000 | USD | | | 7.5% due 10/1/2019 (d) | | | 34,451,601 |
| | |
| | |
| | | 37,482,000 | USD | | | Sealed Air Corp., 8.125% due 9/15/2019 (d) | | | 41,886,135 |
| |
|
| | | 61,574,000 | USD | | | Sirius XM Radio, Inc., 8.75% due 4/1/2015 (d) | | | 70,348,295 |
| | |
| | |
| | | 6,660,000 | USD | | | Vulcan Materials Co., 7% due 6/15/2018 | | | 7,350,975 |
| |
|
| | | | | | | | | | 371,196,557 |
| | |
| | |
| | | | | | | TOTAL CORPORATE NOTES & BONDS | | | |
| | | | | | | (Cost — $750,455,851) | | | 818,101,284 |
| |
|
| | SOVEREIGN GOVERNMENT BONDS – 6.0% |
| | |
| | |
| | Hong Kong | 1.0% | | | | | | | | |
| | | 690,150,000 | HKD | | | Government of Hong Kong, 2.66% due 12/17/2012 | | | 89,474,603 |
| |
|
| | |
| |
|
| | Singapore | 4.8% | | | | | | | | |
| | | | | | | Government of Singapore: | | | |
| | | 412,719,000 | SGD | | | 2.25% due 7/1/2013 | | | 341,297,291 |
| | |
| | |
| | | 100,262,000 | SGD | | | 3.625% due 7/1/2014 | | | 86,522,952 |
| |
|
| | | | | | | | | | 427,820,243 |
| |
|
| | |
| |
|
| | Taiwan | 0.2% | | | | | | | | |
| | | 349,300,000 | TWD | | | Government of Taiwan, 2% due 7/20/2015 | | | 12,309,752 |
| |
|
| | | | | | | TOTAL SOVEREIGN GOVERNMENT BONDS | | | |
| | | | | | | (Cost — $504,051,000) | | | 529,604,598 |
| | |
| | |
| | | OUNCES | | | | | | | |
| | COMMODITIES – 4.0% |
| | | 197,715 | | | | Gold Bullion (c) | | | 350,657,261 |
| |
|
| | | | | | | TOTAL COMMODITIES | | | |
| | | | | | | (Cost — $297,997,958) | | | 350,657,261 |
| | |
| | |
| | | PRINCIPAL | | | | | | | |
| | | AMOUNT | | | | | | | |
| | SHORT-TERM INVESTMENTS – 15.8% |
| | |
| | |
| | Commercial Paper | 15.8% | | | | | | | | |
| | | 46,100,000 | USD | | | Abbott Laboratories, 0.1% due 10/3/2012 (d) | | | 46,099,744 |
| | |
| | |
| | | | | | | BASF SE: | | | |
| | | 10,500,000 | USD | | | 0.01% due 10/1/2012 (d) | | | 10,500,000 |
| | |
| | |
| | | 32,900,000 | USD | | | 0.11% due 10/26/2012 (d) | | | 32,897,487 |
| |
|
| | | 17,400,000 | USD | | | Dell, Inc., 0.13% due 10/3/2012 (d) | | | 17,399,874 |
| |
|
| 16 | See Notes to Financial Statements. |
| IVA Worldwide Fund | IVA Funds |
Schedule of Investments
September 30, 2012 |
|
| PRINCIPAL | | | | | | | |
| AMOUNT | | | | DESCRIPTION | | FAIR VALUE |
| |
| |
| |
| Commercial Paper | 15.8% (continued) | | | | | | | |
|
| | | | | Devon Energy Corp.: | | | |
| 34,500,000 | USD | | | 0.25% due 10/2/2012 (d) | | $ | 34,499,760 |
|
| 16,000,000 | USD | | | 0.25% due 10/4/2012 (d) | | | 15,999,667 |
| |
| |
| 22,800,000 | USD | | | 0.25% due 10/5/2012 (d) | | | 22,799,367 |
|
| 4,300,000 | USD | | | Diageo Capital Plc, 0.3% due 10/1/2012 (d) | | | 4,300,000 |
| |
| |
| | | | | E.I. du Pont De Nemours and Co.: | | | |
| 30,000,000 | USD | | | 0.11% due 10/2/2012 (d) | | | 29,999,908 |
| |
| |
| 12,500,000 | USD | | | 0.12% due 10/2/2012 (d) | | | 12,499,958 |
|
| 14,000,000 | USD | | | 0.11% due 10/3/2012 (d) | | | 13,999,914 |
| |
| |
| 20,000,000 | USD | | | 0.11% due 10/12/2012 (d) | | | 19,999,328 |
|
| | | | | Electricité de France SA: | | | |
| 31,000,000 | USD | | | 0.22% due 10/3/2012 (d) | | | 30,999,621 |
|
| 20,100,000 | USD | | | 0.3% due 10/15/2012 (d) | | | 20,097,655 |
| |
| |
| 48,800,000 | USD | | | 0.28% due 10/22/2012 (d) | | | 48,792,029 |
|
| | | | | Florida Power & Light Co.: | | | |
| 15,300,000 | USD | | | 0.22% due 10/4/2012 | | | 15,299,720 |
|
| 8,000,000 | USD | | | 0.22% due 10/10/2012 | | | 7,999,560 |
| |
| |
| | | | | GDF Suez SA: | | | |
| 20,000,000 | USD | | | 0.21% due 10/9/2012 (d) | | | 19,999,067 |
| |
| |
| 30,000,000 | USD | | | 0.21% due 10/16/2012 (d) | | | 29,997,375 |
|
| | | | | Nestlé Capital Corp.: | | | |
| 15,000,000 | USD | | | 0.02% due 10/2/2012 (d) | | | 14,999,992 |
|
| 30,000,000 | USD | | | 0.02% due 10/3/2012 (d) | | | 29,999,967 |
| |
| |
| 34,300,000 | USD | | | 0.01% due 10/4/2012 (d) | | | 34,299,971 |
|
| 25,000,000 | USD | | | 0.02% due 10/4/2012 (d) | | | 24,999,958 |
| |
| |
| 25,000,000 | USD | | | 0.01% due 10/5/2012 (d) | | | 24,999,972 |
|
| 25,000,000 | USD | | | 0.02% due 10/5/2012 (d) | | | 24,999,944 |
| |
| |
| | | | | NetJets Inc.: | | | |
| 39,100,000 | USD | | | 0.12% due 10/4/2012 (d) | | | 39,099,609 |
| |
| |
| 21,600,000 | USD | | | 0.13% due 10/5/2012 (d) | | | 21,599,688 |
|
74,000,000 | USD | | | 0.12% due 10/9/2012 (d) | | | 73,998,027 | | |
| |
| | | | | Philip Morris International Inc.: | | | |
50,000,000 | USD | | | 0.07% due 10/17/2012 (d) | | | 49,998,445 | | |
| |
| 35,000,000 | USD | | | 0.08% due 10/17/2012 (d) | | | 34,998,756 |
|
30,000,000 | USD | | | 0.06% due 10/18/2012 (d) | | | 29,999,150 | | |
| |
| 25,500,000 | USD | | | 0.06% due 10/19/2012 (d) | | | 25,499,235 |
|
20,000,000 | USD | | | Reed Elsevier Plc, 0.37% due 10/2/2012 (d) | | | 19,999,794 | | |
| |
| | | | | United Parcel Service, Inc.: | | | |
| 32,000,000 | USD | | | 0.04% due 10/1/2012 (d) | | | 32,000,000 |
| |
| |
| 50,000,000 | USD | | | 0.05% due 10/1/2012 (d) | | | 50,000,000 |
| |
| |
| 50,000,000 | USD | | | 0.06% due 10/1/2012 (d) | | | 50,000,000 |
| |
| |
| 49,400,000 | USD | | | 0.06% due 10/3/2012 (d) | | | 49,399,835 |
| |
| |
| 8,700,000 | USD | | | 0.05% due 10/5/2012 (d) | | | 8,699,952 |
| |
| |
| 30,000,000 | USD | | | 0.001% due 10/10/2012 (d) | | | 29,999,993 |
| |
| |
| 40,000,000 | USD | | | 0.05% due 10/15/2012 (d) | | | 39,999,222 |
| |
| |
| 40,000,000 | USD | | | 0.06% due 10/15/2012 (d) | | | 39,999,067 |
|
| See Notes to Financial Statements. | 17 |
| IVA Worldwide Fund | IVA Funds |
Schedule of Investments
September 30, 2012 |
|
| | PRINCIPAL | | | | | | |
| | AMOUNT | | | DESCRIPTION | | FAIR VALUE |
| | |
| | |
| | Commercial Paper | 15.8% (continued) | | | | | | |
| |
|
| | | | | United Technologies Corp.: | | | |
| | 20,000,000 | USD | | 0.13% due 10/1/2012 (d) | | $ | 20,000,000 |
| |
|
| | 50,000,000 | USD | | 0.12% due 10/26/2012(d) | | | 49,995,833 |
| | |
| | |
| | | | | Wal-Mart Stores, Inc.: | | | |
| | 20,000,000 | USD | | 0.1% due 10/4/2012 (d) | | | 19,999,833 |
| | |
| | |
| | 30,000,000 | USD | | 0.11% due 10/16/2012 (d) | | | 29,998,625 |
| |
|
| | 40,100,000 | USD | | 0.1% due 10/17/2012 (d) | | | 40,098,218 |
| | |
| | |
| | 20,000,000 | USD | | 0.11% due 10/22/2012 (d) | | | 19,998,717 |
| |
|
| | 29,200,000 | USD | | Walt Disney Co., 0.09% due 10/25/2012 (d) | | | 29,198,248 |
| | |
| | |
| | 13,900,000 | USD | | Wisconsin Energy Corp., 0.25% due 10/3/2012 (d) | | | 13,899,807 |
| |
|
| | | | | TOTAL SHORT-TERM INVESTMENTS | | | |
| | | | | (Cost — $1,406,959,892) | | | 1,406,959,892 |
| | |
| | |
| | | | | TOTAL INVESTMENTS — 99.2% | | | |
| | | | | (Cost — $8,432,559,105) | | | 8,807,144,502 |
| |
|
| | | | | Other Assets In Excess of Liabilities — 0.8% | | | 74,827,052 |
| | |
| | |
| | | | | TOTAL NET ASSETS — 100.0% | | $ | 8,881,971,554 |
| |
|
The IVA Worldwide Fund had the following open forward foreign currency contracts at September 30, 2012:
| | | | | | | | | | | | | | | | | | | USD | | | NET |
| | | | | | | | SETTLEMENT | | | | LOCAL | | | | | | | VALUE AT | | | UNREALIZED |
| | FOREIGN | | | | | | DATES | | | | CURRENCY | | | USD | | | SEPTEMBER | | | APPRECIATION/ |
| | CURRENCY | | | COUNTERPARTY | | | THROUGH | | | | AMOUNT | | | EQUIVALENT | | | 30, 2012 | | | (DEPRECIATION) |
| | |
| | |
| | Contracts to Sell: | | | | | | | | | | | | | | | | | | | | | | | |
| | euro | | | State Street Bank & Trust Co. | | | 12/06/2012 | | | | EUR 664,467,000 | | | $ | 862,321,687 | | | $ | 854,444,570 | | | $ | 7,877,117 | |
| | |
| | |
| | Japanese yen | | | State Street Bank & Trust Co. | | | 12/06/2012 | | | | JPY 25,169,640,000 | | | | 321,246,638 | | | | 322,698,165 | | | | (1,451,527 | ) |
| |
|
| | South Korean won | | | State Street Bank & Trust Co. | | | 10/09/2012 | | | | KRW 87,760,000,000 | | | | 77,157,533 | | | | 78,941,717 | | | | (1,784,184 | ) |
| | |
| | |
| | Net Unrealized Appreciation on Open Forward Foreign Currency Contracts | | | $ | 4,641,406 | |
| |
|
| | Abbreviations used in this schedule: |
| | | | |
| | ADR | — | American Depositary Receipt |
| | EUR | — | euro |
| | HKD | — | Hong Kong dollar |
| | JPY | — | Japanese yen |
| | KRW | — | South Korean won |
| | SGD | — | Singapore dollar |
| | TWD | — | Taiwan dollar |
| | USD | — | United States dollar |
| 18 | See Notes to Financial Statements. |
| IVA Worldwide Fund | IVA Funds |
Schedule of Investments
September 30, 2012 |
|
| | (a) | Issuer of the security is an affiliate of the IVA Worldwide Fund as defined by the Investment Company Act of 1940. An affiliate is deemed as a company in which the IVA Worldwide Fund indirectly or directly has ownership of at least 5% of the company’s outstanding voting securities. See Schedule of Affiliates below for additional information. |
| |
|
| | Schedule of Affiliates |
| | | | SHARES | | | | | | | | | | SHARES | | | | | | | | | | | |
| | | | HELD AT | | | | | | | | | | HELD AT | | FAIR VALUE AT | | | | | | | |
| | | | SEPTEMBER 30, | | SHARE | | SHARE | | SEPTEMBER 30, | | SEPTEMBER 30, | | REALIZED | | DIVIDEND |
| | SECURITY | | 2011 | | ADDITIONS | | REDUCTIONS | | 2012 | | 2012 | | GAIN/(LOSS) | | INCOME* |
| | |
| | |
| | Contango Oil & Gas Co.** | | | 998,438 | | | | — | | | | 936,909 | | | | 61,529 | | | | — | | | $ | 10,414,838 | | | | — |
| |
|
| | Contango ORE Inc.** | | | 121,807 | | | | — | | | | 1,239 | | | | 120,568 | | | | — | | | | (11,342 | ) | | | — |
| | |
| | |
| | Cosel Co., Ltd. | | | 3,220,400 | | | | — | | | | 32,800 | | | | 3,187,600 | | | $ | 42,642,932 | | | | (106,120 | ) | | $ | 803,957 |
| |
|
| | Hulic Co., Ltd.** | | | 4,538,900 | | | | — | | | | 4,538,900 | | | | — | | | | — | | | | (15,514,355 | ) | | | — |
| | |
| | |
| | Icom Inc. | | | 1,065,300 | | | | 280,100 | | | | 39,100 | | | | 1,306,300 | | | | 31,602,952 | | | | (73,964 | ) | | | 306,969 |
| |
|
| | Milbon Co., Ltd. | | | 957,300 | | | | 3,700 | | | | 9,800 | | | | 951,200 | | | | 31,921,999 | | | | (3,199 | ) | | | 750,628 |
| | |
| | |
| | Miura Co., Ltd. | | | 3,384,504 | | | | — | | | | 112,800 | | | | 3,271,704 | | | | 79,235,271 | | | | (452,184 | ) | | | 1,540,643 |
| |
|
| | Net 1 U.E.P.S Technologies Inc. | | | 6,806,360 | | | | 163,044 | | | | 644,601 | | | | 6,324,803 | | | | 57,239,467 | | | | (2,312,569 | ) | | | — |
| | |
| | |
| | Teleperformance*** | | | 2,707,940 | | | | 251,060 | | | | 30,138 | | | | 2,928,862 | | | | 83,893,616 | | | | (113,017 | ) | | | 1,430,361 |
| |
|
| | Temp Holdings Co., Ltd. | | | 2,018,500 | | | | 997,700 | | | | — | | | | 3,016,200 | | | | 36,678,291 | | | | — | | | | 469,498 |
| | |
| | |
| | Total | | | | | | | | | | | | | | | | | | $ | 363,214,528 | | | $ | (8,171,912 | ) | | $ | 5,302,056 |
| |
|
| | * | | Dividend income is net of withholding taxes. |
| | ** | | Non-affiliated at September 30, 2012. |
| | *** | | Non-affiliated at September 30, 2011. |
| | | | |
| | (b) | | Security is deemed illiquid. As of September 30, 2012, the value of these securities amounted to 0.4% of net assets. |
| | (c) | | Non-income producing investment. |
| | (d) | | Security is exempt from registration under Rule 144A or Section 4(2) of the Securities Act of 1933 (the “1933 Act”). Any resale of these securities must generally be effected through a sale that is registered under the 1933 Act or otherwise exempted from such registration requirements. |
| | (e) | | Fixed-to-float perpetual bond. The security has no maturity date. The date shown represents the next call date. |
| | (f) | | Payment-in-kind security for which part of the income earned may be received as additional principal. |
| | (g) | | Variable rate security. The interest rate shown reflects the rate currently in effect. |
| See Notes to Financial Statements. | 19 |
| IVA International Fund | IVA Funds |
| Performance (unaudited) | As of September 30, 2012 |
| Average Annual Total Returns as of September 30, 2012 | | One Year | | Three Years | | Since Inception(a) |
| | | | | | | |
| Class A | | | 9.53 | % | | | 7.30 | % | | | 10.79 | % |
| Class A (with a 5% maximum initial sales charge) | | | 4.05 | % | | | 5.47 | % | | | 9.38 | % |
| Class C | | | 8.76 | % | | | 6.47 | % | | | 9.95 | % |
| Class I | | | 9.81 | % | | | 7.57 | % | | | 11.07 | % |
| MSCI All Country World (ex-U.S.) Index (Net)(b) | | | 14.48 | % | | | 3.17 | % | | | 3.85 | % |
| Consumer Price Index(c) | | | 2.00 | % | | | 2.34 | % | | | 1.40 | % |
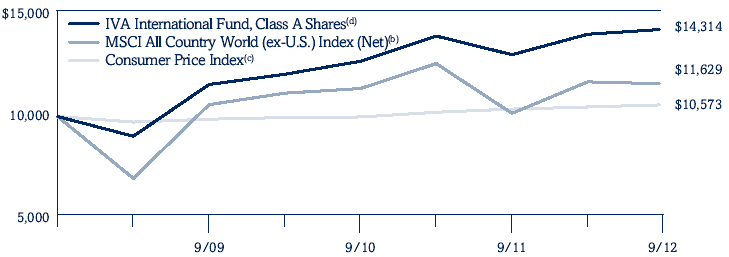
| Growth of a $10,000 Initial Investment |
| |
|
| (a) | | The Fund commenced investment operations on October 1, 2008. |
| (b) | | The MSCI All Country World (ex-U.S.) Index (Net) is an unmanaged, free float-adjusted, market capitalization weighted index composed of stocks of companies located in countries throughout the world, excluding the United States. It is designed to measure equity market performance in global developed and emerging markets outside the United States. The index includes reinvestment of dividends, net of foreign withholding taxes. Please note that an investor cannot invest directly in an index. |
| (c) | | The Consumer Price Index examines the weighted average of prices of a basket of consumer goods and services, such as transportation, food and medical care. Please note that an investor cannot invest directly in an index. |
| (d) | | Hypothetical illustration of $10,000 invested in Class A shares on October 1, 2008, assuming the deduction of the maximum initial sales charge of 5% at the time of investment for Class A shares and the reinvestment of all distributions, including returns of capital, if any, at net asset value through September 30, 2012. The performance of the Fund’s other classes may be greater or less than the Class A shares’ performance indicated on this chart depending on whether greater or lesser sales charges and fees were incurred by shareholders investing in the other classes. |
Past performance is no guarantee of future results. The performance data quoted represents past performance and current returns may be lower or higher. The investment return and principal value will fluctuate so that an investor’s shares, when redeemed, may be worth more or less than the original cost. The returns do not reflect the deduction of taxes that a shareholder would pay on Fund distributions or the redemption of Fund shares. To obtain performance information current to the most recent month-end, please call 866-941-4482.
The maximum sales charge for Class A shares is 5.00%. Class C shares may include a 1.00% contingent deferred sales charge for the first year only. The gross and net expense ratios for the Fund are as follows: 1.30% (Class A shares); 2.06% (Class C shares); and 1.05% (Class I shares). These expense ratios are as stated in the most recent Prospectus dated January 31, 2012. More recent expense ratios can be found in the Financial Highlights section of this Annual Report.
| IVA International Fund | IVA Funds |
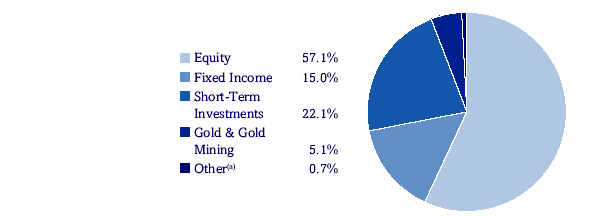
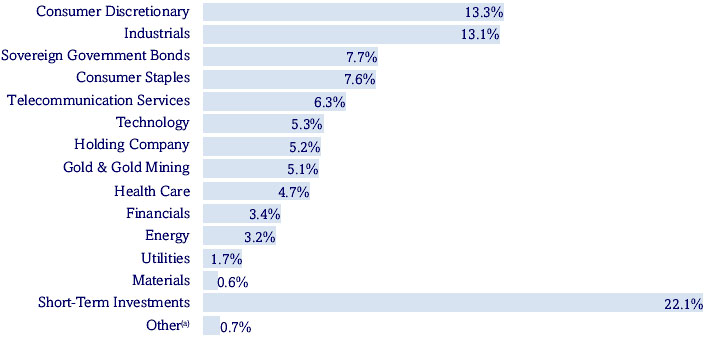
| Portfolio Composition (unaudited) | As of September 30, 2012 |
| Asset Allocation (As a Percent of Total Net Assets) |
| |
| Sector Allocation (As a Percent of Total Net Assets) |
| |
| Top 10 Positions (As a Percent of Total Net Assets)(b) | |
| |
| Government of Singapore, 2.25% due 7/1/2013; 3.625% due 7/1/2014 | | 5.7 | % |
| |
| Gold Bullion | | 3.8 | % |
| |
| Wendel, 4.875% due 5/26/2016; 4.375% due 8/9/2017; 6.75% due 4/20/2018 | | 3.5 | % |
| |
| Astellas Pharma Inc. | | 3.1 | % |
| |
| Total SA, ADR | | 2.5 | % |
| |
| Genting Malaysia Berhad | | 2.3 | % |
| |
| Secom Co., Ltd. | | 2.0 | % |
| |
| Vivendi SA | | 1.9 | % |
| |
| Nestlé SA | | 1.7 | % |
| |
| GDF Suez SA | | 1.7 | % |
| |
| Top 10 positions represent 28.2% of total net assets. |
| (a) | Other represents unrealized gains and losses on forward currency contracts and other assets and liabilities. |
| (b) | Short-Term Investments are not included. |
| IVA International Fund | IVA Funds |
| Schedule of Investments |
| September 30, 2012 |
| | | SHARES | | | DESCRIPTION | | FAIR VALUE |
| COMMON STOCKS – 58.4% |
| |
| |
| Argentina | 0.0% |
| | | | 871 | | | Nortel Inversora SA, Series ‘B’, ADR | | $ | 8,971 |
| |
| |
| |
| Australia | 0.8% |
| | | | 550,969 | | | Newcrest Mining Ltd. | | | 16,654,101 |
| |
| |
| | | | 2,133,905 | | | Programmed Maintenance Services Ltd. | | | 4,759,026 |
| |
| |
| | | | | | | | | | 21,413,127 |
| |
| |
| Belgium | 0.3% |
| | | | 113,055 | | | Sofina SA | | | 9,284,928 |
| |
| |
| |
| Canada | 0.7% |
| | | | 1,262,990 | | | IAMGOLD Corp. | | | 19,967,872 |
| |
| |
| Denmark | 0.4% |
| | | | 371,068 | | | D/S Norden A/S | | | 9,901,116 |
| |
| |
| |
| France | 17.6% |
| | | | 681,802 | | | Alten | | | 21,807,360 |
| |
| |
| | | | 76,707 | | | Bolloré | | | 19,916,535 |
| |
| |
| | | | 272,262 | | | Cap Gemini SA | | | 11,519,477 |
| |
| |
| | | | 409,770 | | | Carrefour SA | | | 8,498,918 |
| |
| |
| | | | 101,800 | | | Ciments Français SA | | | 6,004,549 |
| |
| |
| | | | 463,225 | | | CNP Assurances | | | 6,050,891 |
| |
| |
| | | | 28,956 | | | Financière de l’Odet SA | | | 14,790,935 |
| |
| |
| | | | 466,630 | | | Financière Marc de Lacharriere SA | | | 19,296,504 |
| |
| |
| | | | 2,102,788 | | | GDF Suez SA | | | 47,018,057 |
| |
| |
| | | | 1,029,966 | | | Lagardère SCA | | | 28,132,215 |
| |
| |
| | | | 663,977 | | | M6-Métropole Télévision SA | | | 9,061,446 |
| |
| |
| | | | 135,618 | | | Neopost SA | | | 7,488,634 |
| |
| |
| | | | 397,934 | | | Publicis Groupe SA | | | 22,269,945 |
| |
| |
| | | | 67,724 | | | Robertet SA | | | 10,447,796 |
| |
| |
| | | | 270,240 | | | Saft Groupe SA | | | 6,259,575 |
| |
| |
| | | | 222,795 | | | Séché Environnement SA | | | 8,173,941 |
| |
| |
| | | | 226,778 | | | Securidev SA (a) | | | 6,848,394 |
| |
| |
| | | | 2,043,924 | | | Societe d’Edition de Canal Plus | | | 12,591,652 |
| |
| |
| | | | 502,111 | | | Sodexo SA | | | 37,804,471 |
| |
| |
| | | | 1,452,892 | | | Teleperformance | | | 41,616,288 |
| |
| |
| | | | 644,701 | | | Thales SA | | | 22,140,937 |
| |
| |
| | | | 1,357,172 | | | Total SA, ADR | | | 67,994,317 |
| |
| |
| | | | 2,716,815 | | | Vivendi SA | | | 52,979,603 |
| |
| |
| | | | | | | | | | 488,712,440 |
| | |
| |
| Germany | 0.8% |
| | | | 95,289 | | | Siemens AG | | | 9,503,430 |
| |
| |
| | | | 196,934 | | | Wincor Nixdorf AG | | | 7,700,920 |
| |
| |
| | | | 181,992 | | | Wirecard AG | | | 4,179,235 |
| |
| |
| | | | | | | | | | 21,383,585 |
| | |
| 22 | See Notes to Financial Statements. |
| IVA International Fund | IVA Funds |
| Schedule of Investments |
| September 30, 2012 |
| | | SHARES | | | DESCRIPTION | | FAIR VALUE |
| |
| |
| |
| |
| |
| Hong Kong | 1.4% |
| | | | 36,621,030 | | | Clear Media Ltd. (a)(b) | | $ | 19,599,728 |
| |
| |
| | | | 17,474,261 | | | Hongkong & Shanghai Hotels Ltd. | | | 20,687,733 |
| |
| |
| | | | | | | | | | 40,287,461 |
| | |
| |
| India | 0.2% |
| | | | 10,271,789 | | | South Indian Bank Ltd. | | | 4,440,170 |
| |
| |
| |
| Indonesia | 0.2% |
| | | | 68,287,500 | | | PT Bank Bukopin Tbk | | | 4,566,771 |
| |
| |
| |
| Japan | 21.0% |
| | | | 286,800 | | | Arcs Co. Ltd. | | | 6,644,470 |
| |
| |
| | | | 326,300 | | | As One Corp. | | | 7,317,081 |
| |
| |
| | | | 1,697,000 | | | Astellas Pharma Inc. | | | 86,219,951 |
| |
| |
| | | | 117,700 | | | The Bank of Okinawa Ltd. | | | 5,188,211 |
| |
| |
| | | | 424,900 | | | Benesse Holdings Inc. | | | 20,580,754 |
| |
| |
| | | | 67,500 | | | Canon Inc. | | | 2,158,028 |
| |
| |
| | | | 1,456,900 | | | Cosel Co., Ltd. | | | 19,490,051 |
| |
| |
| | | | 784,000 | | | Daiichikosho Co., Ltd. | | | 18,836,494 |
| |
| |
| | | | 5,977 | | | Fuji Media Holdings Inc. | | | 9,788,065 |
| |
| |
| | | | 1,360,300 | | | Hi Lex Corp. | | | 19,783,963 |
| |
| |
| | | | 588,282 | | | Hitachi Tool Engineering Ltd. | | | 5,254,133 |
| |
| |
| | | | 765,600 | | | Icom Inc. (a) | | | 18,521,948 |
| |
| |
| | | | 2,366,000 | | | Iino Kaiun Kaisha Ltd. | | | 8,125,167 |
| |
| |
| | | | 209,900 | | | Japan Petroleum Exploration Co., Ltd. | | | 8,418,593 |
| |
| |
| | | | 697,340 | | | Kose Corp. | | | 16,253,991 |
| |
| |
| | | | 95,400 | | | Medikit Co., Ltd. | | | 3,178,370 |
| |
| |
| | | | 174,500 | | | Meitec Corp. | | | 3,975,666 |
| |
| |
| | | | 580,500 | | | Milbon Co., Ltd. | | | 19,481,413 |
| |
| |
| | | | 1,310,976 | | | Miura Co., Ltd. | | | 31,749,675 |
| |
| |
| | | | 390,400 | | | Nifco Inc. | | | 9,019,621 |
| |
| |
| | | | 117,600 | | | Nintendo Co., Ltd. | | | 14,903,434 |
| |
| |
| | | | 349,000 | | | Nitto Kohki Co., Ltd. | | | 8,250,961 |
| |
| |
| | | | 8,068 | | | NTT DoCoMo, Inc. | | | 13,088,273 |
| |
| |
| | | | 772,700 | | | Okinawa Cellular Telephone Co. | | | 16,792,660 |
| |
| |
| | | | 1,784 | | | Pasona Group Inc. | | | 1,165,864 |
| |
| |
| | | | 493,500 | | | San-A Co. Ltd. | | | 19,729,882 |
| |
| |
| | | | 150,800 | | | Sankyo Co. Ltd. | | | 7,024,065 |
| |
| |
| | | | 1,078,900 | | | Secom Co., Ltd. | | | 56,267,594 |
| |
| |
| | | | 10,600 | | | Secom Joshinetsu Co., Ltd. | | | 307,107 |
| |
| |
| | | | 353,900 | | | Shingakukai Co., Ltd. | | | 1,342,317 |
| |
| |
| | | | 695,500 | | | Shiseido Co., Ltd. | | | 9,544,855 |
| |
| |
| | | | 308,150 | | | Shofu Inc. | | | 3,316,838 |
| |
| |
| | | | 4,500 | | | SK Kaken Co., Ltd. | | | 189,710 |
| |
| |
| | | | 36,700 | | | SMC Corp. | | | 5,916,017 |
| |
| |
| | | | 156,700 | | | Sugi Holdings Co. Ltd. | | | 5,503,776 |
| |
| |
| | | | 576 | | | Techno Medica Co., Ltd. | | | 2,904,357 |
| |
| |
| | | | 3,405,900 | | | Temp Holdings Co., Ltd. (a) | | | 41,417,210 |
| |
| |
| See Notes to Financial Statements. | 23 |
| IVA International Fund | IVA Funds |
| Schedule of Investments |
| September 30, 2012 |
| | | SHARES | | | DESCRIPTION | | FAIR VALUE |
| |
| |
| |
| |
| |
| Japan | 21.0% (continued) |
| |
| |
| | | | 629,800 | | | Toho Co., Ltd. | | $ | 11,580,766 |
| |
| |
| | | | 149,200 | | | Tsuruha Holdings Inc. | | | 11,165,146 |
| |
| |
| | | | 78,240 | | | Yahoo Japan Corp. | | | 29,806,192 |
| |
| |
| | | | | | | | | | 580,202,669 |
| | |
| |
| Malaysia | 2.6% |
|
| | | | 2,828,800 | | | Aeon Co. Malaysia Berhad | | | 10,180,533 |
| |
| |
| | | | 55,346,400 | | | Genting Malaysia Berhad | | | 63,377,196 |
| |
| |
| | | | | | | | | | 73,557,729 |
| | |
| |
| Netherlands | 0.1% |
| | | | 18,146 | | | Hal Trust NV | | | 2,043,868 |
| |
| |
| |
| Norway | 1.4% |
| | | | 5,161,485 | | | Orkla ASA | | | 39,200,582 |
| |
| |
| |
| Singapore | 1.0% |
| | | | 4,800,291 | | | Haw Par Corp. Ltd. | | | 26,051,123 |
| |
| |
| | | | 78,224 | | | United Overseas Bank Ltd. | | | 1,252,527 |
| |
| |
| | | | | | | | | | 27,303,650 |
| | |
| |
| South Africa | 0.7% |
| | | | 2,230,235 | | | Net 1 U.E.P.S. Technologies Inc. (c) | | | 20,183,627 |
| |
| |
| |
| South Korea | 3.9% |
| | | | 51,769 | | | E-Mart Co., Ltd. | | | 11,295,393 |
| |
| |
| | | | 61,768 | | | Fursys Inc. | | | 1,556,114 |
| |
| |
| | | | 1,140,270 | | | Kangwon Land, Inc. | | | 25,648,829 |
| |
| |
| | | | 10,736 | | | Lotte Chilsung Beverage Co., Ltd. | | | 13,320,687 |
| |
| |
| | | | 11,477 | | | Lotte Confectionery Co., Ltd. | | | 16,026,546 |
| |
| |
| | | | 76,287 | | | Nong Shim Co., Ltd. | | | 18,223,630 |
| |
| |
| | | | 1,381,981 | | | SK Telecom Co., Ltd., ADR | | | 20,094,004 |
| |
| |
| | | | 64,592 | | | Teems Inc. | | | 642,186 |
| |
| |
| | | | | | | | | | 106,807,389 |
| | |
| |
| Switzerland | 3.1% |
| | | | 21,310 | | | APG SGA SA | | | 4,051,279 |
| |
| |
| | | | 63,915 | | | Credit Suisse Group AG | | | 1,354,413 |
| |
| |
| | | | 750,830 | | | Nestlé SA | | | 47,341,009 |
| |
| |
| | | | 52,104 | | | Schindler Holding AG | | | 6,404,277 |
| |
| |
| | | | 2,112,430 | | | UBS AG | | | 25,717,516 |
| |
| |
| | | | | | | | | | 84,868,494 |
| | |
| |
| Taiwan | 0.6% |
| | | | 7,663,000 | | | Taiwan Secom Co., Ltd. | | | 16,861,293 |
| |
| |
| 24 | See Notes to Financial Statements. |
| IVA International Fund | IVA Funds |
| Schedule of Investments |
| September 30, 2012 |
| | | SHARES | | | DESCRIPTION | | FAIR VALUE |
| |
| |
| |
| |
| |
| United Kingdom | 1.6% |
| |
| | | | 62,865 | | | Diageo Plc, ADR | | $ | 7,086,771 |
| |
| |
| | | | 1,731,366 | | | Inmarsat Plc | | | 16,495,271 |
| |
| |
| | | | 1,144,480 | | | LSL Property Services Plc | | | 3,881,022 |
| |
| |
| | | | 2,109,970 | | | Millennium & Copthorne Hotels Plc | | | 16,548,664 |
| |
| |
| | | | | | | | | | 44,011,728 |
| | |
| | | | | | | TOTAL COMMON STOCKS | | | |
| | | | | | | (Cost — $1,535,459,129) | | | 1,615,007,470 |
| |
| |
| | | | | | | | | | |
| | | PRINCIPAL
AMOUNT | | | | | | |
| |
| CORPORATE NOTES & BONDS – 7.3% |
| |
| |
|
| France | 3.5% |
| | | | | | | Wendel: | | | |
| | | | 19,650,000 | EUR | | 4.875% due 5/26/2016 (d) | | | 25,724,688 |
| |
| |
| | | | 36,400,000 | EUR | | 4.375% due 8/9/2017 | | | 46,658,871 |
| |
| |
| | | | 17,000,000 | EUR | | 6.75% due 4/20/2018 | | | 23,375,054 |
| |
| |
| | | | | | | | | | 95,758,613 |
| | |
| |
| Netherlands | 0.3% |
| | | | 6,311,000 | EUR | | UPC Holding BV, 8% due 11/1/2016 (d) | | | 8,400,123 |
| |
| |
| |
| Norway | 1.1% |
| | | | 11,400,000 | USD | | Golden Close Maritime Corp., Ltd., 11% | | | |
| | | | | | | due 12/9/2015 (b) | | | 12,283,500 |
| |
| |
| | | | 107,500,000 | NOK | | Stolt-Nielsen Ltd. SA, 6.67% | | | |
| | | | | | | due 6/22/2016 (b)(e) | | | 19,139,800 |
| |
| |
| | | | | | | | | | 31,423,300 |
| | |
| |
| Switzerland | 0.7% |
| | | | | | | UBS AG: | | | |
| | | | 7,806,000 | EUR | | 4.28% due 4/15/2015 (f) | | | 9,048,051 |
| |
| |
| | | | 4,350,000 | EUR | | 7.152% due 12/21/2017 (f) | | | 5,666,828 |
| |
| |
| | | | 4,338,000 | USD | | UBS Preferred Funding Trust V, 6.243% | | | |
| | | | | | | due 5/15/2016 (f) | | | 4,316,310 |
| |
| |
| | | | | | | | | | 19,031,189 |
| | |
| |
| United Kingdom | 0.3% |
| | | | 7,000,000 | USD | | Inmarsat Finance Plc, 7.375% | | | |
| | | | | | | due 12/1/2017 (d) | | | 7,595,000 |
| |
| |
| |
| United States | 1.4% |
| | | | | | | Intelsat Luxembourg SA: | | | |
| | | | 15,541,000 | USD | | 11.25% due 2/4/2017 | | | 16,492,886 |
| |
| |
| | | | 21,587,000 | USD | | 11.5% due 2/4/2017 (g) | | | 22,963,171 |
| |
| |
| | | | | | | | | | 39,456,057 |
| | |
| | | | | | | TOTAL CORPORATE NOTES & BONDS | | | |
| | | | | | | (Cost — $186,485,895) | | | 201,664,282 |
| |
| |
| See Notes to Financial Statements. | 25 |
| IVA International Fund | IVA Funds |
| Schedule of Investments |
| September 30, 2012 |
| | | PRINCIPAL | | | | | | |
| | | AMOUNT | | | DESCRIPTION | | FAIR VALUE |
| SOVEREIGN GOVERNMENT BONDS – 7.7% |
| |
| |
| |
| Hong Kong | 1.4% |
| | | | 289,350,000 | HKD | | Government of Hong Kong, 2.66% | | | |
| | | | | | | due 12/17/2012 | | $ | 37,512,825 |
| |
| |
| |
| Singapore | 5.7% |
| | | | | | | Government of Singapore: | | | |
| | | | 159,764,000 | SGD | | 2.25% due 7/1/2013 | | | 132,116,574 |
| |
| |
| | | | 30,371,000 | SGD | | 3.625% due 7/1/2014 | | | 26,209,218 |
| |
| |
| | | | | | | | | | 158,325,792 |
| | |
| |
| Taiwan | 0.2% |
| | | | 171,000,000 | TWD | | Government of Taiwan, 2% | | | |
| | | | | | | due 7/20/2015 | | | 6,026,246 |
| |
| |
| |
| Thailand | 0.4% |
| | | | 362,607,000 | THB | | Government of Thailand, 5.25% | | | |
| | | | | | | due 5/12/2014 | | | 12,172,745 |
| |
| |
| | | | | | | TOTAL SOVEREIGN GOVERNMENT BONDS | | | |
| | | | | | | (Cost — $211,684,601) | | | 214,037,608 |
| |
| |
| | | OUNCES | | | | | | |
| COMMODITIES – 3.8% |
| |
| | | | 59,247 | | | Gold Bullion (c) | | | 105,078,186 |
| |
| |
| | | | | | | TOTAL COMMODITIES | | | |
| | | | | | | (Cost — $94,077,662) | | | 105,078,186 |
| |
| |
| | | | | | | | | | |
| | | PRINCIPAL | | | | | | |
| | | AMOUNT | | | | | | |
| |
| SHORT-TERM INVESTMENTS – 22.1% |
| |
| |
| Commercial Paper | 22.1% |
| | | | 20,000,000 | USD | | Abbott Laboratories, 0.1% due | | | |
| | | | | | | 10/3/2012 (d) | | | 19,999,889 |
| |
| | | | 21,400,000 | USD | | BASF SE, 0.01% due 10/1/2012 (d) | | | 21,400,000 |
| |
| | | | 26,200,000 | USD | | Consolidated Edison Co. Inc., 0.3% | | | |
| | | | | | | due 10/1/2012 (d) | | | 26,200,000 |
| |
| | | | 25,000,000 | USD | | Devon Energy Corp., 0.25% | | | |
| | | | | | | due 10/3/2012 (d) | | | 24,999,653 |
| |
| | | | | | | E.I. du Pont de Nemours and Co.: | | | |
| | | | 20,000,000 | USD | | 0.11% due 10/2/2012 (d) | | | 19,999,939 |
| |
| | | | 12,000,000 | USD | | 0.11% due 10/12/2012 (d) | | | 11,999,597 |
| |
| | | | 8,000,000 | USD | | Electricité de France SA, 0.3% | | | |
| | | | | | | due 10/15/2012 (d) | | | 7,999,067 |
| |
| | | | | | | Florida Power & Light Co.: | | | |
| | | | 15,700,000 | USD | | 0.22% due 10/4/2012 | | | 15,699,712 |
| |
| | | | 12,000,000 | USD | | 0.22% due 10/10/2012 | | | 11,999,340 |
| |
| | | | 14,000,000 | USD | | 0.22% due 10/11/2012 | | | 13,999,144 |
| |
| | | | 20,000,000 | USD | | GDF Suez SA, 0.21% due 10/16/2012 (d) | | | 19,998,250 |
| |
| 26 | See Notes to Financial Statements. |
| IVA International Fund | IVA Funds |
| Schedule of Investments |
| September 30, 2012 |
| | | PRINCIPAL | | | | | | |
| | | AMOUNT | | | DESCRIPTION | | FAIR VALUE |
| |
| |
| |
| |
| |
| Commercial Paper | 22.1% (continued) |
| |
| | | | | | | Nestlé Capital Corp.: | | | |
| | | | 10,000,000 | USD | | 0.02% due 10/2/2012 (d) | | $ | 9,999,994 |
| |
| |
| | | | 20,000,000 | USD | | 0.02% due 10/3/2012 (d) | | | 19,999,978 |
| |
| |
| | | | 15,700,000 | USD | | 0.01% due 10/4/2012 (d) | | | 15,699,987 |
| |
| |
| | | | 16,100,000 | USD | | 0.02% due 10/4/2012 (d) | | | 16,099,973 |
| |
| |
| | | | | | | NetJets Inc.: | | | |
| | | | 11,000,000 | USD | | 0.12% due 10/3/2012 (d) | | | 10,999,927 |
| |
| |
| | | | 20,000,000 | USD | | 0.12% due 10/4/2012 (d) | | | 19,999,800 |
| |
| |
| | | | 20,000,000 | USD | | 0.13% due 10/5/2012 (d) | | | 19,999,711 |
| |
| |
| | | | 20,000,000 | USD | | 0.12% due 10/9/2012 (d) | | | 19,999,467 |
| |
| |
| | | | 12,300,000 | USD | | 0.1% due 10/10/2012 (d) | | | 12,299,692 |
| |
| |
| | | | 8,300,000 | USD | | Novartis Finance Corp., 0.11% | | | |
| | | | | | | due 10/3/2012 (d) | | | 8,299,949 |
| |
| |
| | | | | | | Philip Morris International Inc.: | | | |
| | | | 15,000,000 | USD | | 0.08% due 10/17/2012 (d) | | | 14,999,467 |
| |
| |
| | | | 20,000,000 | USD | | 0.06% due 10/18/2012 (d) | | | 19,999,433 |
| |
| |
| | | | 3,000,000 | USD | | 0.04% due 10/19/2012 (d) | | | 2,999,940 |
| |
| |
| | | | 22,500,000 | USD | | 0.06% due 10/19/2012 (d) | | | 22,499,325 |
| |
| |
| | | | | | | United Parcel Service, Inc.: | | | |
| | | | 15,700,000 | USD | | 0.05% due 10/1/2012 (d) | | | 15,700,000 |
| |
| |
| | | | 8,000,000 | USD | | 0.06% due 10/3/2012 (d) | | | 7,999,973 |
| |
| |
| | | | 41,300,000 | USD | | 0.05% due 10/5/2012 (d) | | | 41,299,771 |
| |
| |
| | | | 20,000,000 | USD | | 0.001% due 10/10/2012 (d) | | | 19,999,995 |
| |
| |
| | | | 20,000,000 | USD | | 0.05% due 10/15/2012 (d) | | | 19,999,611 |
| |
| |
| | | | 25,000,000 | USD | | United Technologies Corp., 0.12% | | | |
| | | | | | | due 10/26/2012 (d) | | | 24,997,917 |
| |
| |
| | | | | | | Wal-Mart Stores, Inc.: | | | |
| | | | 34,600,000 | USD | | 0.1% due 10/17/2012 (d) | | | 34,598,462 |
| |
| |
| | | | 30,000,000 | USD | | 0.11% due 10/22/2012 (d) | | | 29,998,075 |
| |
| |
| | | | 10,000,000 | USD | | Wisconsin Energy Corp., 0.25% | | | |
| | | | | | | due 10/3/2012 (d) | | | 9,999,861 |
| |
| |
| | | | | | | TOTAL SHORT-TERM INVESTMENTS | | | |
| | | | | | | (Cost — $612,784,899) | | | 612,784,899 |
| |
| |
| | | | | | | TOTAL INVESTMENTS — 99.3% | | | |
| | | | | | | (Cost — $2,640,492,186) | | | 2,748,572,445 |
| |
| |
| | | | | | | Other Assets In Excess of Liabilities — 0.7% | | | 19,412,733 |
| |
| |
| | | | | | | TOTAL NET ASSETS — 100.0% | | $ | 2,767,985,178 |
| | |
| See Notes to Financial Statements. | 27 |
| IVA International Fund | IVA Funds |
| Schedule of Investments |
| September 30, 2012 |
The IVA International Fund had the following open forward foreign currency contracts at September 30, 2012: |
| | | | | | | | | | | | | | | | | USD | | NET |
| | | | | | | SETTLEMENT | | | LOCAL | | | | | | | VALUE AT | | UNREALIZED |
| FOREIGN | | | | | | DATES | | | CURRENCY | | | USD | | SEPTEMBER | | APPRECIATION/ |
| CURRENCY | | | COUNTERPARTY | | | THROUGH | | | AMOUNT | | | EQUIVALENT | | 30, 2012 | | (DEPRECIATION) |
|
| Contracts to Sell: |
| | | | State Street | | | | | | | | | | | | | | | | | | | |
| | | | Bank & | | | | | | | | | | | | | | | | | | | |
Australian dollar | | | Trust Co. | | | 12/06/2012 | | | AUD 961,000 | | | $ | 974,771 | | | $ | 991,327 | | | $ | (16,556 | ) |
|
| | | | State Street | | | | | | | | | | | | | | | | | | | |
| | | | Bank & | | | | | | | | | | | | | | | | | | | |
British pound | | | Trust Co. | | | 12/06/2012 | | | GBP 1,238,000 | | | | 1,966,142 | | | | 1,998,738 | | | | (32,596 | ) |
|
| | | | State Street | | | | | | | | | | | | | | | | | | | |
| | | | Bank & | | | | | | | | | | | | | | | | | | | |
| euro | | | Trust Co. | | | 12/06/2012 | | | EUR 256,403,000 | | | | 332,744,429 | | | | 329,711,108 | | | | 3,033,321 | |
|
| | | | State Street | | | | | | | | | | | | | | | | | | | |
| | | | Bank & | | | | | | | | | | | | | | | | | | | |
Japanese yen | | | Trust Co. | | | 12/06/2012 | | | JPY 18,064,250,000 | | | | 230,411,209 | | | | 231,600,464 | | | | (1,189,255 | ) |
|
| | | | State Street | | | | | | | | | | | | | | | | | | | |
| | | | Bank & | | | | | | | | | | | | | | | | | | | |
South Korean won | | | Trust Co. | | | 10/09/2012 | | | KRW 23,530,000,000 | | | | 20,685,592 | | | | 21,165,663 | | | | (480,071 | ) |
|
| Net Unrealized Appreciation on Open Forward Foreign Currency Contracts | | | $ | 1,314,843 | |
| |
| Abbreviations used in this schedule: |
| ADR | | — | | American Depositary Receipt |
| AUD | | — | | Australian dollar |
| EUR | | — | | euro |
| GBP | | — | | British pound |
| HKD | | — | | Hong Kong dollar |
| JPY | | — | | Japanese yen |
| KRW | | — | | South Korean won |
| NOK | | — | | Norwegian krone |
| SGD | | — | | Singapore dollar |
| THB | | — | | Thai baht |
| TWD | | — | | Taiwan dollar |
| USD | | — | | United States dollar |
| 28 | See Notes to Financial Statements. |
| IVA International Fund | IVA Funds |
| Schedule of Investments |
| September 30, 2012 |
| (a) | | Issuer of the security is an affiliate of the IVA International Fund as defined by the Investment Company Act of 1940. An affiliate is deemed as a company in which the IVA International Fund indirectly or directly has ownership of at least 5% of the company’s outstanding voting securities. See Schedule of Affiliates below for additional information. |
| |
| Schedule of Affiliates |
| | | SHARES | | | | | | SHARES | | | | | | | | | | | |
| | | HELD AT | | | | | | HELD AT | | | FAIR VALUE AT | | | | | | | | |
| | | SEPTEMBER 30, | | SHARE | | SHARE | | SEPTEMBER 30, | | | SEPTEMBER 30, | | | REALIZED | | | | | DIVIDEND |
| SECURITY | | 2011 | | ADDITIONS | | REDUCTIONS | | 2012 | | | 2012 | | | LOSS | | | | | INCOME* |
|
| Clear Media Ltd. | | 36,621,030 | | — | | — | | 36,621,030 | | | $19,599,728 | | | — | | | | $ | 235,985 |
|
| |
| Icom Inc. | | 849,700 | | 29,700 | | 113,800 | | 765,600 | | | 18,521,948 | | $ | (266,355 | ) | | | | 179,023 |
|
| Securidev SA | | 202,718 | | 24,060 | | — | | 226,778 | | | 6,848,394 | | | — | | | | | 360,184 |
|
| |
| Temp Holdings Co., Ltd. | | 3,329,400 | | 76,500 | | — | | 3,405,900 | | | 41,417,210 | | | — | | | | | 631,184 |
|
| Total | | | | | | | | | | | $86,387,280 | | $ | (266,355 | ) | | | $ | 1,406,376 |
| |
| * | | Dividend income is net of withholding taxes. |
| | | |
| (b) | | Security is deemed illiquid. As of September 30, 2012, the value of these securities amounted to 1.8% of net assets. |
| (c) | | Non-income producing investment. |
| (d) | | Security is exempt from registration under Rule 144A or Section 4(2) of the Securities Act of 1933 (the “1933 Act”). Any resale of these securities must generally be effected through a sale that is registered under the 1933 Act or otherwise exempted from such registration requirements. |
| (e) | | Variable rate security. The interest rate shown reflects the rate currently in effect. |
| (f) | | Fixed-to-float perpetual bond. The security has no maturity date. The date shown represents the next call date. |
| (g) | | Payment-in-kind security for which part of the income earned may be received as additional principal. |
| See Notes to Financial Statements. | 29 |
| Statements of Assets and Liabilities | | IVA Funds |
| | | | | | | IVA | | | | | IVA | |
| | | | | | | Worldwide | | | | | International | |
| | | | | | | Fund | | | | | Fund | |
| | Assets: | | | | | | | | | | | |
| | Long-term investments, at cost: | | | | | | | | | | | |
| | Non-affiliated investments | | | | $ | 6,666,261,087 | | | | $ | 1,954,227,743 | |
| | Affiliated investments | | | | | 359,338,126 | | | | | 73,479,544 | |
| | Short-term investments, at cost | | | | | 1,406,959,892 | | | | | 612,784,899 | |
| | Foreign currency, at cost | | | | | 866 | | | | | 92,791 | |
| | Long-term investments, at fair value: | | | | | | | | | | | |
| | Non-affiliated investments | | | | $ | 7,036,970,082 | | | | $ | 2,049,400,266 | |
| | Affiliated investments | | | | | 363,214,528 | | | | | 86,387,280 | |
| | Short-term investments, at fair value | | | | | 1,406,959,892 | | | | | 612,784,899 | |
| | Foreign currency, at fair value | | | | | 870 | | | | | 92,843 | |
| | Cash | | | | | 299,703 | | | | | 268,795 | |
| | Receivable for fund shares sold | | | | | 50,028,823 | | | | | 5,203,715 | |
| | Dividends and interest receivable | | | | | 44,869,752 | | | | | 13,651,714 | |
| | Receivable for investments sold | | | | | 11,239,484 | | | | | 3,270,407 | |
| | Unrealized appreciation on open forward foreign currency contracts | | | | | 6,425,590 | | | | | 1,794,914 | |
| | Prepaid expenses | | | | | 131,705 | | | | | 33,134 | |
| | Total assets | | | | $ | 8,920,140,429 | | | | $ | 2,772,887,967 | |
| | Liabilities: | | | | | | | | | | | |
| | Payable for investments purchased | | | | $ | 13,519,609 | | | | $ | — | |
| | Payable for fund shares repurchased | | | | | 12,871,173 | | | | | 1,834,613 | |
| | Unrealized depreciation on open forward foreign currency contracts | | | | | 1,784,184 | | | | | 480,071 | |
| | Accrued investment advisory fees | | | | | 6,583,882 | | | | | 2,013,658 | |
| | Accrued distribution and service fees | | | | | 1,725,414 | | | | | 147,367 | |
| | Accrued expenses and other liabilities | | | | | 1,684,613 | | | | | 427,080 | |
| | Total liabilities | | | | | 38,168,875 | | | | | 4,902,789 | |
| | Net Assets | | | | $ | 8,881,971,554 | | | | $ | 2,767,985,178 | |
| | Net Assets Consist of: | | | | | | | | | | | |
| | Par value ($0.001 per share) | | | | $ | 549,437 | | | | $ | 173,246 | |
| | Additional paid-in-capital | | | | | 8,342,095,664 | | | | | 2,563,951,859 | |
| | Undistributed net investment income | | | | | 100,173,874 | | | | | 61,430,573 | |
| | Accumulated net realized gain on investments, futures contracts and foreign currency transactions | | | | | 59,935,420 | | | | | 33,036,363 | |
| | Unrealized appreciation from investments and foreign currency translation | | | | | 379,217,159 | | | | | 109,393,137 | |
| | Net Assets | | | | $ | 8,881,971,554 | | | | $ | 2,767,985,178 | |
| | Net Asset Value Per Share: | | | | | | | | | | | |
| | Class A | | | | | | | | | | | |
| | Net assets | | | | $ | 2,408,396,312 | | | | $ | 409,163,472 | |
| | Shares outstanding | | | | | 148,844,988 | | | | | 25,645,424 | |
| | Net asset value per share | | | | $ | 16.18 | | | | $ | 15.95 | |
| | Maximum offering price per share (with a maximum initial sales charge of 5.00%) | | | | $ | 17.03 | | | | $ | 16.79 | |
| | Class C | | | | | | | | | | | |
| | Net assets | | | | $ | 1,469,719,790 | | | | $ | 77,881,566 | |
| | Shares outstanding | | | | | 91,817,864 | | | | | 4,948,751 | |
| | Net asset value per share | | | | $ | 16.01 | | | | $ | 15.74 | |
| | Class I | | | | | | | | | | | |
| | Net assets | | | | $ | 5,003,855,452 | | | | $ | 2,280,940,140 | |
| | Shares outstanding | | | | | 308,774,143 | | | | | 142,651,891 | |
| | Net asset value per share | | | | $ | 16.21 | | | | $ | 15.99 | |
| 30 | See Notes to Financial Statements. |
| Statements of Operations | | IVA Funds |
| For the Year Ended September 30, 2012 |
| |
| | | | | IVA | | | IVA |
| | | | | Worldwide | | | International |
| | | | | Fund | | | Fund |
| | Investment Income: | | | | | | | | | | |
| | Interest | | | $ | 65,602,205 | | | | $ | 15,116,012 | |
| | Dividends: | | | | | | | | | | |
| | Non-affiliated investments | | | | 177,497,706 | | | | | 61,891,124 | |
| | Affiliated investments | | | | 5,845,891 | | | | | 1,530,922 | |
| | Less: Foreign taxes withheld | | | | (19,403,557 | ) | | | | (8,225,536 | ) |
| | Total income | | | | 229,542,245 | | | | | 70,312,522 | |
| | Expenses: | | | | | | | | | | |
| | Investment advisory fees | | | | 84,459,971 | | | | | 22,539,187 | |
| | Distribution and service fees: | | | | | | | | | | |
| | Class A | | | | 6,692,764 | | | | | 954,003 | |
| | Class C | | | | 16,318,574 | | | | | 796,101 | |
| | Custody fees | | | | 3,602,790 | | | | | 1,374,228 | |
| | Trustee fees | | | | 188,635 | | | | | 46,365 | |
| | Other expenses | | | | 7,966,957 | | | | | 1,700,062 | |
| | Total expenses | | | | 119,229,691 | | | | | 27,409,946 | |
| | Net investment income | | | | 110,312,554 | | | | | 42,902,576 | |
| | Net Realized and Change in Unrealized Gain (Loss) | | | | | | | | | | |
| | on Investments, Futures Contracts and Foreign Currency: | | | | | | | | | | |
| | Net realized gain (loss) on: | | | | | | | | | | |
| | Investments on: | | | | | | | | | | |
| | Non-affiliated investments | | | | 161,310,536 | | | | | 65,984,050 | |
| | Affiliated investments | | | | (8,171,912 | ) | | | | (266,355 | ) |
| | Futures contracts | | | | (35,978,750 | ) | | | | (5,458,783 | ) |
| | Foreign currency transactions | | | | 49,063,585 | | | | | 15,854,323 | |
| | Net realized gain | | | | 166,223,459 | | | | | 76,113,235 | |
| | Net change in unrealized appreciation (depreciation) from: | | | | | | | | | | |
| | Investments from: | | | | | | | | | | |
| | Non-affiliated investments | | | | 542,292,841 | | | | | 106,825,254 | |
| | Affiliated investments | | | | 7,583,421 | | | | | 9,355,515 | |
| | Futures contracts | | | | (1,300,135 | ) | | | | (1,215,890 | ) |
| | Foreign currency translation | | | | 1,164,133 | | | | | 1,025,671 | |
| | Net change in unrealized appreciation (depreciation) | | | | 549,740,260 | | | | | 115,990,550 | |
| | Net realized and change in unrealized gain on | | | | | | | | | | |
| | investments, futures contracts and foreign currency | | | | 715,963,719 | | | | | 192,103,785 | |
| | Increase in net assets resulting from operations | | | $ | 826,276,273 | | | | $ | 235,006,361 | |
| See Notes to Financial Statements. | 31 |
| Statements of Changes in Net Assets | | IVA Funds |
| | | | | IVA Worldwide Fund | | | IVA International Fund |
| | | | | Year Ended | | | Year Ended | | | Year Ended | | | Year Ended |
| | | | | September 30, | | | September 30, | | | September 30, | | | September 30, |
| | | | | 2012 | | | 2011 | | | 2012 | | | 2011 |
| | Operations: | | | | | | | | | | | | | | | | | | | | |
| | Net investment income | | | $ | 110,312,554 | | | | $ | 80,128,819 | | | | $ | 42,902,576 | | | | $ | 27,630,969 | |
| | Net realized gain | | | | 166,223,459 | | | | | 423,592,330 | | | | | 76,113,235 | | | | | 111,085,206 | |
| | Net change in net unrealized appreciation (depreciation) | | | | 549,740,260 | | | | | (693,518,595 | ) | | | | 115,990,550 | | | | | (133,788,156 | ) |
| | Increase (decrease) in net assets resulting from operations | | | | 826,276,273 | | | | | (189,797,446 | ) | | | | 235,006,361 | | | | | 4,928,019 | |
| | Distributions to Shareholders: | | | | | | | | | | | | | | | | | | | | |
| | Net investment income: | | | | | | | | | | | | | | | | | | | | |
| | Class A | | | | (20,111,017 | ) | | | | (8,689,921 | ) | | | | (4,961,283 | ) | | | | (442,574 | ) |
| | Class C | | | | — | | | | | — | | | | | (540,056 | ) | | | | — | |
| | Class I | | | | (49,104,499 | ) | | | | (21,223,353 | ) | | | | (32,039,991 | ) | | | | (4,753,242 | ) |
| | Net realized gain on investments: | | | | | | | | | | | | | | | | | | | | |
| | Class A | | | | (143,027,372 | ) | | | | (56,581,235 | ) | | | | (16,874,933 | ) | | | | (7,516,993 | ) |
| | Class C | | | | (88,435,829 | ) | | | | (32,155,518 | ) | | | | (3,985,245 | ) | | | | (1,672,714 | ) |
| | Class I | | | | (258,845,189 | ) | | | | (86,335,783 | ) | | | | (92,344,215 | ) | | | | (31,808,976 | ) |
| | Decrease in net assets resulting from distributions | | | | (559,523,906 | ) | | | | (204,985,810 | ) | | | | (150,745,723 | ) | | | | (46,194,499 | ) |
| | Capital Share Transactions: | | | | | | | | | | | | | | | | | | | | |
| | Proceeds from shares sold | | | | 1,799,582,994 | | | | | 4,860,852,493 | | | | | 687,721,006 | | | | | 1,169,979,907 | |
| | Reinvestment of distributions | | | | 403,223,168 | | | | | 142,569,726 | | | | | 122,389,472 | | | | | 36,791,005 | |
| | Cost of shares repurchased | | | | (2,764,328,546 | ) | | | | (1,296,330,107 | ) | | | | (390,174,647 | ) | | | | (265,211,165 | ) |
| | Increase (decrease) in net assets from capital share transactions | | | | (561,522,384 | ) | | | | 3,707,092,112 | | | | | 419,935,831 | | | | | 941,559,747 | |
| | Increase (decrease) in net assets | | | | (294,770,017 | ) | | | | 3,312,308,856 | | | | | 504,196,469 | | | | | 900,293,267 | |
| | Net Assets: | | | | | | | | | | | | | | | | | | | | |
| | Beginning of year | | | $ | 9,176,741,571 | | | | $ | 5,864,432,715 | | | | $ | 2,263,788,709 | | | | $ | 1,363,495,442 | |
| | End of year | | | $ | 8,881,971,554 | | | | $ | 9,176,741,571 | | | | $ | 2,767,985,178 | | | | $ | 2,263,788,709 | |
| | Undistributed net investment income | | | $ | 100,173,874 | | | | $ | 30,190,910 | | | | $ | 61,430,573 | | | | $ | 22,291,483 | |
| 32 | See Notes to Financial Statements. |
| Financial Highlights | | IVA Funds |
IVA Worldwide Fund — Class A
For a share of each class of beneficial interest outstanding:
| | | | Year Ended | | | Year Ended | | | Year Ended | | | Year Ended |
| | | | September 30, | | | September 30, | | | September 30, | | | September 30, |
| | | | 2012 | | | 2011 | | | 2010 | | | 2009 |
| Net asset value, beginning of year | | | $ | 15.71 | | | | $ | 16.03 | | | | $ | 15.00 | | | | $ | 12.00 | |
| Increase from investment operations:(a) | | | | | | | | | | | | | | | | | | | | |
Net investment income(b) | | | | 0.18 | | | | | 0.16 | | | | | 0.21 | | | | | 0.34 | |
Net realized and unrealized gain | | | | 1.26 | | | | | 0.00 | | | | | 1.27 | | | | | 2.70 | |
| Increase from investment operations | | | | 1.44 | | | | | 0.16 | | | | | 1.48 | | | | | 3.04 | |
| Decrease from distributions: | | | | | | | | | | | | | | | | | | | | |
Net investment income | | | | (0.12 | ) | | | | (0.06 | ) | | | | (0.10 | ) | | | | (0.04 | ) |
Net realized gain on investments | | | | (0.85 | ) | | | | (0.42 | ) | | | | (0.35 | ) | | | | — | |
| Decrease from distributions | | | | (0.97 | ) | | | | (0.48 | ) | | | | (0.45 | ) | | | | (0.04 | ) |
| Net asset value, end of year | | | $ | 16.18 | | | | $ | 15.71 | | | | $ | 16.03 | | | | $ | 15.00 | |
| Total return(c) | | | | 9.62 | % | | | | 0.86 | % | | | | 10.16 | % | | | | 25.39 | % |
| Ratios to average net assets: | | | | | | | | | | | | | | | | | | | | |
Net operating expenses | | | | 1.28 | % | | | | 1.29 | % | | | | 1.31 | % | | | | 1.36 | % |
Net investment income | | | | 1.16 | % | | | | 0.93 | % | | | | 1.41 | % | | | | 2.51 | % |
| Supplemental data: | | | | | | | | | | | | | | | | | | | | |
Portfolio turnover rate | | | | 27.9 | % | | | | 50.8 | % | | | | 28.9 | % | | | | 54.8 | % |
Net assets, end of year (000’s) | | | $ | 2,408,396 | | | | $ | 2,714,773 | | | | $ | 1,931,625 | | | | $ | 755,238 | |
| (a) | | The amounts shown for a share outstanding may not correlate with the Statement of Operations for the period due to the timing of sales and repurchases of fund shares in relation to income earned and/or gains (losses) both realized and unrealized during the period. |
| (b) | | Calculated using average daily shares outstanding. |
| (c) | | Total return assumes reinvestment of all distributions and does not reflect an initial sales charge. |
| See Notes to Financial Statements. | 33 |
| Financial Highlights | | IVA Funds |
IVA Worldwide Fund — Class C
For a share of each class of beneficial interest outstanding:
| | | Year Ended | | Year Ended | | Year Ended | | Year Ended |
| | | September 30, | | September 30, | | September 30, | | September 30, |
| | | 2012 | | 2011 | | 2010 | | 2009 |
| Net asset value, beginning of year | | $ | 15.54 | | | $ | 15.92 | | | $ | 14.92 | | | $ | 12.00 | |
| Increase from investment operations:(a) | | | | | | | | | | | | | | | | |
| Net investment income(b) | | | 0.06 | | | | 0.03 | | | | 0.10 | | | | 0.23 | |
| Net realized and unrealized gain | | | 1.26 | | | | 0.01 | | | | 1.25 | | | | 2.71 | |
| Increase from investment operations | | | 1.32 | | | | 0.04 | | | | 1.35 | | | | 2.94 | |
| Decrease from distributions: | | | | | | | | | | | | | | | | |
| Net investment income | | | — | | | | — | | | | (0.00 | )(c) | | | (0.02 | ) |
| Net realized gain on investments | | | (0.85 | ) | | | (0.42 | ) | | | (0.35 | ) | | | — | |
| Decrease from distributions | | | (0.85 | ) | | | (0.42 | ) | | | (0.35 | ) | | | (0.02 | ) |
| Net asset value, end of year | | $ | 16.01 | | | $ | 15.54 | | | $ | 15.92 | | | $ | 14.92 | |
| Total return(d) | | | 8.87 | % | | | 0.09 | % | | | 9.26 | % | | | 24.51 | % |
| Ratios to average net assets: | | | | | | | | | | | | | | | | |
| Net operating expenses | | | 2.03 | % | | | 2.04 | % | | | 2.06 | % | | | 2.12 | % |
| Net investment income | | | 0.41 | % | | | 0.18 | % | | | 0.67 | % | | | 1.75 | % |
| Supplemental data: | | | | | | | | | | | | | | | | |
| Portfolio turnover rate | | | 27.9 | % | | | 50.8 | % | | | 28.9 | % | | | 54.8 | % |
| Net assets, end of year (000’s) | | $ | 1,469,720 | | | $ | 1,631,750 | | | $ | 1,055,144 | | | $ | 340,393 | |
| (a) | | The amounts shown for a share outstanding may not correlate with the Statement of Operations for the period due to the timing of sales and repurchases of fund shares in relation to income earned and/or gains (losses) both realized and unrealized during the period. |
| (b) | | Calculated using average daily shares outstanding. |
| (c) | | Amount represents less than $0.005 per share. |
| (d) | | Total return assumes reinvestment of all distributions and does not reflect a contingent deferred sales charge. |
| 34 | See Notes to Financial Statements. |
| Financial Highlights | | IVA Funds |
IVA Worldwide Fund — Class I
For a share of each class of beneficial interest outstanding:
| | | Year Ended | | | Year Ended | | | Year Ended | | | Year Ended |
| | | September 30, | | | September 30, | | | September 30, | | | September 30, |
| | | 2012 | | | 2011 | | | 2010 | | | 2009 |
| Net asset value, beginning of year | | $ | 15.73 | | | | $ | 16.05 | | | | $ | 15.02 | | | | $ | 12.00 | |
| Increase from investment operations:(a) | | | | | | | | | | | | | | | | | | | |
Net investment income(b) | | | 0.23 | | | | | 0.20 | | | | | 0.25 | | | | | 0.37 | |
Net realized and unrealized gain | | | 1.26 | | | | | 0.00 | | | | | 1.27 | | | | | 2.69 | |
| Increase from investment operations | | | 1.49 | | | | | 0.20 | | | | | 1.52 | | | | | 3.06 | |
| Decrease from distributions: | | | | | | | | | | | | | | | | | | | |
Net investment income | | | (0.16 | ) | | | | (0.10 | ) | | | | (0.14 | ) | | | | (0.04 | ) |
Net realized gain on investments | | | (0.85 | ) | | | | (0.42 | ) | | | | (0.35 | ) | | | | — | |
| Decrease from distributions | | | (1.01 | ) | | | | (0.52 | ) | | | | (0.49 | ) | | | | (0.04 | ) |
| Net asset value, end of year | | $ | 16.21 | | | | $ | 15.73 | | | | $ | 16.05 | | | | $ | 15.02 | |
| Total return(c) | | | 9.97 | % | | | | 1.09 | % | | | | 10.40 | % | | | | 25.62 | % |
| Ratios to average net assets: | | | | | | | | | | | | | | | | | | | |
Net operating expenses | | | 1.03 | % | | | | 1.04 | % | | | | 1.06 | % | | | | 1.14 | % |
Net investment income | | | 1.43 | % | | | | 1.18 | % | | | | 1.65 | % | | | | 2.78 | % |
| Supplemental data: | | | | | | | | | | | | | | | | | | | |
Portfolio turnover rate | | | 27.9 | % | | | | 50.8 | % | | | | 28.9 | % | | | | 54.8 | % |
Net assets, end of year (000’s) | | $ | 5,003,855 | | | | $ | 4,830,219 | | | | $ | 2,877,664 | | | | $ | 1,267,395 | |
| (a) | | The amounts shown for a share outstanding may not correlate with the Statement of Operations for the period due to the timing of sales and repurchases of fund shares in relation to income earned and/or gains (losses) both realized and unrealized during the period. |
| (b) | | Calculated using average daily shares outstanding. |
| (c) | | Total return assumes reinvestment of all distributions. |
| See Notes to Financial Statements. | 35 |
| Financial Highlights | | IVA Funds |
IVA International Fund — Class A
For a share of each class of beneficial interest outstanding:
| | | Year Ended | | Year Ended | | Year Ended | | Year Ended |
| | | September 30, | | September 30, | | September 30, | | September 30, |
| | | | 2012 | | 2011 | | 2010 | | 2009 |
| Net asset value, beginning of year | | | $ | 15.56 | | | | $ | 15.59 | | | | $ | 14.59 | | | | $ | 12.00 | |
| Increase from investment operations:(a) | | | | | | | | | | | | | | | | | | | | |
Net investment income(b) | | | | 0.23 | | | | | 0.20 | | | | | 0.17 | | | | | 0.27 | |
Net realized and unrealized gain | | | | 1.16 | | | | | 0.20 | | | | | 1.25 | | | | | 2.36 | |
| Increase from investment operations | | | | 1.39 | | | | | 0.40 | | | | | 1.42 | | | | | 2.63 | |
| Decrease from distributions: | | | | | | | | | | | | | | | | | | | | |
Net investment income | | | | (0.23 | ) | | | | (0.02 | ) | | | | (0.16 | ) | | | | (0.04 | ) |
Net realized gain on investments | | | | (0.77 | ) | | | | (0.41 | ) | | | | (0.26 | ) | | | | — | |
| Decrease from distributions | | | | (1.00 | ) | | | | (0.43 | ) | | | | (0.42 | ) | | | | (0.04 | ) |
| Net asset value, end of year | | | $ | 15.95 | | | | $ | 15.56 | | | | $ | 15.59 | | | | $ | 14.59 | |
| Total return(c) | | | | 9.53 | % | | | | 2.56 | %(d) | | | | 9.96 | %(d) | | | | 21.96 | %(d) |
| Ratios to average net assets: | | | | | | | | | | | | | | | | | | | | |
Net operating expenses | | | | 1.27 | % | | | | 1.30 | % | | | | 1.39 | % | | | | 1.40 | %(e) |
Net investment income | | | | 1.52 | % | | | | 1.19 | % | | | | 1.13 | % | | | | 2.14 | %(f) |
| Supplemental data: | | | | | | | | | | | | | | | | | | | | |
Portfolio turnover rate | | | | 29.9 | % | | | | 54.3 | % | | | | 28.1 | % | | | | 46.6 | % |
Net assets, end of year (000’s) | | | $ | 409,163 | | | | $ | 371,560 | | | | $ | 240,245 | | | | $ | 104,420 | |
| (a) | | The amounts shown for a share outstanding may not correlate with the Statement of Operations for the period due to the timing of sales and repurchases of fund shares in relation to income earned and/or gains (losses) both realized and unrealized during the period. |
| (b) | | Calculated using average daily shares outstanding. |
| (c) | | Total return assumes reinvestment of all distributions and does not reflect an initial sales charge. |
| (d) | | The total returns include the effect of certain contractual fee waivers and/or expense reimbursements. |
| (e) | | Reflects certain contractual fee waivers and/or expense reimbursements (exclusive of acquired fund fees and expenses, brokerage expenses, interest expense, taxes, organizational and extraordinary expenses) to limit the amount of total operating expenses to 1.40%. The ratio of expenses to average net assets without the effect of fee waivers and/or reimbursements was 1.55% for the year ended September 30, 2009. |
| (f) | | The ratio of net investment income to average net assets without the effect of certain contractual fee waivers and/or expense reimbursements was 1.99% for the year ended September 30, 2009. |
| 36 | See Notes to Financial Statements. |
| Financial Highlights | | IVA Funds |
IVA International Fund — Class C
For a share of each class of beneficial interest outstanding:
| | | | Year Ended | | | Year Ended | | | Year Ended | | | Year Ended |
| | | | September 30, | | | September 30, | | | September 30, | | | September 30, |
| | | | 2012 | | | 2011 | | | 2010 | | | 2009 |
| Net asset value, beginning of year | | | $ | 15.35 | | | | $ | 15.48 | | | | $ | 14.51 | | | | $ | 12.00 | |
| Increase from investment operations:(a) | | | | | | | | | | | | | | | | | | | | |
Net investment income(b) | | | | 0.11 | | | | | 0.07 | | | | | 0.06 | | | | | 0.17 | |
Net realized and unrealized gain | | | | 1.15 | | | | | 0.21 | | | | | 1.23 | | | | | 2.36 | |
| Increase from investment operations | | | | 1.26 | | | | | 0.28 | | | | | 1.29 | | | | | 2.53 | |
| Decrease from distributions: | | | | | | | | | | | | | | | | | | | | |
Net investment income | | | | (0.10 | ) | | | | — | | | | | (0.06 | ) | | | | (0.02 | ) |
Net realized gain on investments | | | | (0.77 | ) | | | | (0.41 | ) | | | | (0.26 | ) | | | | — | |
| Decrease from distributions | | | | (0.87 | ) | | | | (0.41 | ) | | | | (0.32 | ) | | | | (0.02 | ) |
| Net asset value, end of year | | | $ | 15.74 | | | | $ | 15.35 | | | | $ | 15.48 | | | | $ | 14.51 | |
| Total return(c) | | | | 8.76 | % | | | | 1.76 | %(d) | | | | 9.05 | %(d) | | | | 21.10 | %(d) |
| Ratios to average net assets: | | | | | | | | | | | | | | | | | | | | |
Net operating expenses | | | | 2.02 | % | | | | 2.06 | % | | | | 2.15 | %(e) | | | | 2.15 | %(e) |
Net investment income | | | | 0.74 | % | | | | 0.42 | % | | | | 0.41 | %(f) | | | | 1.38 | %(f) |
| Supplemental data: | | | | | | | | | | | | | | | | | | | | |
Portfolio turnover rate | | | | 29.9 | % | | | | 54.3 | % | | | | 28.1 | % | | | | 46.6 | % |
Net assets, end of year (000’s) | | | $ | 77,882 | | | | $ | 79,196 | | | | $ | 55,824 | | | | $ | 19,028 | |
| (a) | | The amounts shown for a share outstanding may not correlate with the Statement of Operations for the period due to the timing of sales and repurchases of fund shares in relation to income earned and/or gains (losses) both realized and unrealized during the period. |
| (b) | | Calculated using average daily shares outstanding. |
| (c) | | Total return assumes reinvestment of all distributions and does not reflect a contingent deferred sales charge. |
| (d) | | The total returns include the effect of certain contractual fee waivers and/or expense reimbursements. |
| (e) | | Reflects certain contractual fee waivers and/or expense reimbursements (exclusive of acquired fund fees and expenses, brokerage expenses, interest expense, taxes, organizational and extraordinary expenses) to limit the amount of total operating expenses to 2.15%. The ratio of expenses to average net assets without the effect of fee waivers and/or reimbursements was 2.17% and 2.49% for the years ended September 30, 2010 and 2009, respectively. |
| (f) | | The ratio of net investment income to average net assets without the effect of certain contractual fee waivers and/or expense reimbursements was 0.38% and 1.04% for the years ended September 30, 2010 and 2009, respectively. |
| See Notes to Financial Statements. | 37 |
| Financial Highlights | | IVA Funds |
IVA International Fund — Class I
For a share of each class of beneficial interest outstanding:
| | | Year Ended | | | Year Ended | | | Year Ended | | | Year Ended |
| | | September 30, | | | September 30, | | | September 30, | | | September 30, |
| | | 2012 | | | 2011 | | | 2010 | | | 2009 |
| Net asset value, beginning of year | | $ | 15.60 | | | | $ | 15.62 | | | | $ | 14.62 | | | | $ | 12.00 | |
| Increase from investment operations:(a) | | | | | | | | | | | | | | | | | | | |
Net investment income(b) | | | 0.27 | | | | | 0.24 | | | | | 0.21 | | | | | 0.31 | |
Net realized and unrealized gain | | | 1.16 | | | | | 0.21 | | | | | 1.24 | | | | | 2.35 | |
| Increase from investment operations | | | 1.43 | | | | | 0.45 | | | | | 1.45 | | | | | 2.66 | |
| Decrease from distributions: | | | | | | | | | | | | | | | | | | | |
Net investment income | | | (0.27 | ) | | | | (0.06 | ) | | | | (0.19 | ) | | | | (0.04 | ) |
Net realized gain on investments | | | (0.77 | ) | | | | (0.41 | ) | | | | (0.26 | ) | | | | — | |
| Decrease from distributions | | | (1.04 | ) | | | | (0.47 | ) | | | | (0.45 | ) | | | | (0.04 | ) |
| Net asset value, end of year | | $ | 15.99 | | | | $ | 15.60 | | | | $ | 15.62 | | | | $ | 14.62 | |
| Total return(c) | | | 9.81 | % | | | | 2.86 | %(d) | | | | 10.19 | %(d) | | | | 22.28 | %(d) |
| Ratios to average net assets: | | | | | | | | | | | | | | | | | | | |
Net operating expenses | | | 1.02 | % | | | | 1.05 | % | | | | 1.13 | % | | | | 1.15 | %(e) |
Net investment income | | | 1.79 | % | | | | 1.45 | % | | | | 1.44 | % | | | | 2.41 | %(f) |
| Supplemental data: | | | | | | | | | | | | | | | | | | | |
Portfolio turnover rate | | | 29.9 | % | | | | 54.3 | % | | | | 28.1 | % | | | | 46.6 | % |
Net assets, end of year (000’s) | | $ | 2,280,940 | | | | $ | 1,813,032 | | | | $ | 1,067,427 | | | | $ | 360,075 | |
| (a) | | The amounts shown for a share outstanding may not correlate with the Statement of Operations for the period due to the timing of sales and repurchases of fund shares in relation to income earned and/or gains (losses) both realized and unrealized during the period. |
| (b) | | Calculated using average daily shares outstanding. |
| (c) | | Total return assumes reinvestment of all distributions. |
| (d) | | The total returns include the effect of certain contractual fee waivers and/or expense reimbursements. |
| (e) | | Reflects certain contractual fee waivers and/or expense reimbursements (exclusive of acquired fund fees and expenses, brokerage expenses, interest expense, taxes, organizational and extraordinary expenses) to limit the amount of total operating expenses to 1.15%. The ratio of expenses to average net assets without the effect of fee waivers and/or reimbursements was 1.28% for the year ended September 30, 2009. |
| (f) | | The ratio of net investment income to average net assets without the effect of certain contractual fee waivers and/or expense reimbursements was 2.28% for the year ended September 30, 2009. |
| 38 | See Notes to Financial Statements. |
| Notes to Financial Statements | IVA Funds |
Note 1 – Organization and Significant Accounting Policies
IVA Fiduciary Trust (the “Trust”) consists of the IVA Worldwide Fund (the “Worldwide Fund”) and IVA International Fund (the “International Fund”) (each, a “Fund” and, together, the “Funds”). The Worldwide Fund and the International Fund are each an investment portfolio of the Trust, an open-end series management investment company registered under the Investment Company Act of 1940, as amended (the “1940 Act”), and organized as a Massachusetts business trust. The Funds commenced investment operations on October 1, 2008. The Worldwide Fund seeks long-term growth of capital by investing in a range of securities and asset classes from markets around the world, including U.S. markets. The International Fund seeks long-term growth of capital by investing in a range of securities and asset classes from markets around the world.
The following are significant accounting policies followed by the Funds in the preparation of their financial statements in conformity with accounting principles generally accepted in the United States of America (“U.S. GAAP”).
Use of Estimates. Preparation of these financial statements in conformity with U.S. GAAP requires the Funds’ management to make estimates and assumptions that may affect the amounts reported in the financial statements and related notes. Actual results could differ from these estimates.
Valuation of the Funds. The net asset value per share (“NAV”) of a Fund’s shares of a particular class is calculated each day that the New York Stock Exchange (“NYSE”) is open.
Listed equity securities are generally valued at the last sale price on the exchange that is the primary market for such securities. Equity securities listed on the NASDAQ Stock Exchange (“NASDAQ”) are generally valued using the NASDAQ Official Closing Price. If no sales or closing prices are reported during the day, equity securities are generally valued at the mean of the last available bid and asked quotations on the exchange or market on which the security is primarily traded, or using other market information obtained from a quotation reporting system, established market makers, or pricing services. If there is only a bid or only an asked price on such date, valuation will be at such bid or asked price for long and short positions, respectively. Over-the-counter (“OTC”) equity securities not listed on NASDAQ are generally valued at the mean of the last available bid and asked quotations on the market on which the security is primarily traded, or using other market information obtained from a quotation reporting system, established market makers or pricing services. If there is only a bid or only an asked price on such date, valuation will be at such bid or asked price for long or short positions, respectively.
Precious metals, including gold bullion, are valued at the spot price at the time trading on the NYSE closes (normally 4:00 p.m. E.S.T.).
Debt securities (except for short-term investments as described below) for which market quotations are readily available are valued at the mean between the last bid and asked prices received from dealers in the OTC market in the U.S. or abroad, except that when no asked price is available, debt securities are valued at the last bid price alone. Short-term investments having a maturity of 60 days or less are generally valued at amortized cost, which approximates fair value.
Forward foreign currency contracts are valued at the current cost of offsetting such contracts.
Futures contracts are valued daily at the official settlement price determined by the exchange on which they are traded.
The value of any investment that is listed or traded on more than one exchange or market is based on the exchange or market determined by International Value Advisers, LLC (the “Adviser”) to be the primary trading venue for that investment. A quotation from the exchange or market deemed by the Adviser to be the secondary trading venue for a particular investment may be relied upon in instances where a quotation is not available on the primary exchange or market.
The Board of Trustees of the Trust (the “Board”) has established a Pricing and Fair Valuation Committee (the “Committee”) comprised of officers of the Adviser to which it has delegated the responsibility for overseeing the implementation of the Funds’ valuation procedures and fair value determinations made on behalf of the Board. The Committee may determine that market quotations are not readily available due to events relating to a single issuer (e.g., corporate actions or announcements) or events relating to multiple issuers (e.g., governmental actions or natural disasters). The Committee may determine that there has been a significant decrease in the volume and level of activity for an asset or liability whereby transactions or quoted prices may not be determinative of fair value. The Committee may determine the fair value of investments based on information provided by pricing services and other third parties, including broker-dealers and other market intermediaries, which may recommend fair value prices
| Notes to Financial Statements | IVA Funds |
or adjustments with reference to other securities, indices or assets. For securities that do not trade during NYSE hours or securities for which there is a foreign market holiday when the NYSE is open, fair valuation determinations are based on analyses of market movements after the close of those securities’ primary markets, and include reviews of developments in foreign markets, the performance of U.S. securities markets, and the performance of instruments trading in U.S. markets that represent foreign securities or baskets of foreign securities. Fair value pricing may require subjective determinations about the value of an asset or liability. Fair values used to determine the Funds’ NAVs may differ from quoted or published prices, or from prices that are used by others, for the same investments. The use of fair value pricing may not always result in adjustments to the prices of securities or other assets or liabilities held by the Funds.
Fair Value Measurement. The Funds adhere to Financial Accounting Standards Board (“FASB”) Accounting Standards Codification 820-10-65 (“ASC 820-10-65”),Fair Value Measurements and Disclosures and Accounting Standards Update No. 2011-04, Fair Value Measurement and Disclosures - Amendments to Achieve Common Fair Value Measurement Disclosure Requirements in U.S. GAAP and International Financial Reporting Standards (ASU 2011 – 04). ASC 820-10-65 establishes a single definition of fair value, creates a three-tier hierarchy as a framework for measuring fair value based on inputs used to value the Funds’ assets and liabilities, and requires additional disclosure about fair value. ASU 2011-04 provides for the disclosure of any transfers between Level 1 and Level 2 investments. The hierarchy of inputs is summarized below:
| • | Level 1 – | quoted prices in active markets for identical investments |
| |
| • | Level 2 – | other significant observable inputs (including quoted prices for similar or identical investments, interest rates, prepayment speeds, credit risk, other observable market data, etc.) |
| |
| • | Level 3 – | significant unobservable inputs (including the Funds’ own assumptions in determining the fair value of investments) |
The following is a summary of the inputs used in valuing the Worldwide Fund’s assets and liabilities at fair value:
| ASSETS | | Quoted Prices in | | Other Significant | | Significant | | | | |
| | Active Markets | | Observable | | Unobservable | | | | |
| | for Identical | | Inputs | | Inputs | | | | |
| | Investments (Level 1) | | (Level 2) | | (Level 3) | | Total |
| |
| Common stocks(a): |
Foreign | | $ | 2,972,523,441 | | | | — | | | | — | | | $ | 2,972,523,441 | |
United States | | | 2,653,928,036 | | | $ | 940,430 | | | | — | | | | 2,654,868,466 | |
| Convertible preferred stocks | | | 74,429,560 | | | | — | | | | — | | | | 74,429,560 | |
| Corporate notes & bonds(a): | | | — | | | | 818,101,284 | | | | — | | | | 818,101,284 | |
| Sovereign government bonds(a): | | | — | | | | 529,604,598 | | | | — | | | | 529,604,598 | |
| Commodities | | | 350,657,261 | | | | — | | | | — | | | | 350,657,261 | |
| Short-term investments(a): | | | 1,406,959,892 | | | | — | | | | — | | | | 1,406,959,892 | |
Unrealized appreciation on open forward foreign currency contracts | | | — | | | | 6,425,590 | | | | — | | | | 6,425,590 | |
| |
| Total assets | | $ | 7,458,498,190 | | | $ | 1,355,071,902 | | | | — | | | $ | 8,813,570,092 | |
| |
| LIABILITIES | | | | | | | | | | | | | | | | |
| |
Unrealized depreciation on open forward foreign currency contracts | | | — | | | $ | (1,784,184 | ) | | | — | | | $ | (1,784,184 | ) |
| |
| (a) | See Schedule of Investments for additional detailed categorization. |
The Fund’s policy is to recognize transfers between levels as of the end of the reporting period. At September 30, 2012, securities valued at $2,505,427,924 were transferred from Level 2 to Level 1 within the fair value hierarchy because quoted, active market prices that were representative of fair value became available. For the years ended September 30, 2012 and September 30, 2011, there were no Level 3 assets or liabilities held in the Worldwide Fund.
| Notes to Financial Statements | IVA Funds |
The following is a summary of the inputs used in valuing the International Fund’s assets and liabilities at fair value:
| ASSETS | | Quoted Prices in | | Other Significant | | Significant | | | | |
| | Active Markets | | Observable | | Unobservable | | | | |
| | for Identical | | Inputs | | Inputs | | | | |
| | Investments (Level 1) | | (Level 2) | | (Level 3) | | Total |
| |
| Common stocks(a): |
Foreign | | $ | 1,615,007,470 | | | | — | | | | — | | | $ | 1,615,007,470 | |
| Corporate notes & bonds(a) | | | — | | | $ | 201,664,282 | | | | — | | | | 201,664,282 | |
| Sovereign government bonds(a) | | | — | | | | 214,037,608 | | | | — | | | | 214,037,608 | |
| Commodities | | | 105,078,186 | | | | — | | | | — | | | | 105,078,186 | |
| Short-term investments(a) | | | 612,784,899 | | | | — | | | | — | | | | 612,784,899 | |
Unrealized appreciation on open forward foreign currency contracts | | | — | | | | 1,794,914 | | | | — | | | | 1,794,914 | |
| |
| Total assets | | $ | 2,332,870,555 | | | $ | 417,496,804 | | | | — | | | $ | 2,750,367,359 | |
| |
| LIABILITIES | | | | | | | | | | | | | | | | |
| |
Unrealized depreciation on open forward foreign currency contracts | | | — | | | $ | (480,071 | ) | | | — | | | $ | (480,071 | ) |
| |
| (a) | See Schedule of Investments for additional detailed categorization. |
The Fund’s policy is to recognize transfers between levels as of the end of the reporting period. At September 30, 2012, securities valued at $1,313,909,311 were transferred from Level 2 to Level 1 within the fair value hierarchy because quoted, active market prices that were representative of fair value became available. For the years ended September 30, 2012 and September 30, 2011, there were no Level 3 assets or liabilities held in the International Fund.
Foreign Currency Translation. Portfolio securities and other assets and liabilities initially valued in currencies other than the U.S. dollar are converted to U.S. dollars using exchange rates obtained from pricing services.
The Funds do not isolate that portion of the results of operations resulting from changes in foreign exchange rates on investments from the fluctuations arising from changes in market prices of investments held. Such fluctuations are included with the net realized and change in unrealized gain or loss on investments.
Net realized foreign exchange gains or losses arise from sales of foreign currencies, including gains and losses on forward foreign currency contracts, currency gains or losses realized between the trade and settlement dates on securities transactions, and the difference between the amounts of dividends, interest, and foreign withholding taxes recorded on each Fund’s books and the U.S. dollar equivalent of the amounts actually received or paid. Net change in unrealized foreign exchange gains and losses arise from changes in the fair values of assets and liabilities, other than investments, at the date of valuation, resulting from changes in exchange rates.
Portfolio Transactions and Investment Income. Portfolio transactions are recorded on a trade date basis. Interest income, adjusted for amortization of premium and accretion of discount, is recorded on the accrual basis. Dividend income is recorded on the ex-dividend date. Realized gains and losses on investment transactions are determined by the specific identification method.
Class Allocation. Investment income, realized and unrealized gains and losses, and Fund expenses and expense reductions, if any, are allocated daily to the various classes of each Fund pro rata on the basis of relative net assets. Each class bears certain expenses unique to that class. Differences in class-level expenses may result in payment of different per share dividends by each share class.
Distributions to Shareholders. Distributions are recorded on the ex-dividend date and are determined in accordance with federal income tax regulations, which may differ from U.S. GAAP. Accordingly, the nature of distributions and composition of net assets for tax purposes differ from those reflected in the accompanying financial statements.
Federal and Other Taxes. It is each Fund’s policy to comply with the federal income and excise tax requirements of the Internal Revenue Code of 1986, as amended, applicable to regulated investment companies. Accordingly, each Fund intends to distribute substantially all of its taxable income and net realized gains, if any, to shareholders each year. Therefore, no federal income tax provision is required in the Funds’ financial statements.
| Notes to Financial Statements | IVA Funds |
The Funds adhere to the provisions of the FASB Accounting Standards Codification 740-10 (“ASC 740-10”), Accounting for Uncertainty in Income Taxes. This standard defines the threshold for recognizing tax positions in the financial statements as “more-likely-than-not” to be sustained by the applicable taxing authority and requires measurement of a tax position meeting the “more-likely-than-not” criterion, based on the largest benefit that is more than fifty percent realized. Management has analyzed each Fund’s tax positions taken on federal and state tax returns for all open tax years (current, 2011 and 2010) and determined that no provision for income tax would be required in the Funds’ financial statements. For the year ended September 30, 2012, the Funds did not incur any tax-related interest or penalties.
Under the applicable foreign tax laws, a withholding tax may be imposed on interest, dividends and capital gains at various rates.
Forward Foreign Currency Contracts. Each Fund engages in buying and selling forward foreign currency contracts to seek to manage the exposure of investments denominated in non-U.S. currencies against fluctuations in relative value. A forward foreign currency contract involves a privately negotiated obligation to purchase or sell (with delivery generally required) a specific currency at a future date, at a price set at the time of the contract.
Futures Contracts. Each Fund may use interest rate futures contracts for investment purposes. In certain instances, the use of futures contracts can act as a hedge against the effect of interest rate fluctuations on foreign and U.S. investments and/or foreign exchange rates. A futures contract provides for the future sale by one party and purchase by another party of a specified quantity of the security or other financial instrument at a specified price and time.
When a purchase or sale of a futures contract is made by a Fund, the Fund is required to deposit with its futures commission merchant a specified amount of liquid assets (“initial margin”). The initial margin required for a futures contract is set by the exchange on which the contract is traded and may be modified during the term of the contract. The initial margin is in the nature of a performance bond or good faith deposit on the futures contract that is returned to the Fund upon termination of the contract, assuming all contractual obligations have been satisfied. Each Fund expects to earn taxable interest income on its initial margin deposits. At September 30, 2012, the Funds did not have any initial margin deposited with any futures commission merchant. A futures contract held by a Fund is valued daily at the official settlement price of the exchange on which it is traded. Each day, a Fund may pay or receive cash, as necessary, called “variation margin,” equal to the daily change in value of the futures contract. This process is known as “marking to market.” Variation margin does not represent a borrowing or loan by a Fund but is instead a settlement between a Fund and the broker of the amount one would owe the other if the futures contract expired in computing the daily NAVs. Each Fund marks to market its open futures positions.
As of September 30, 2012, the Funds did not have any open futures contracts.
Foreign Investment Risk. Each Fund invests in foreign investments. Foreign investments can involve additional risks relating to political, economic or regulatory conditions in foreign countries. These risks include fluctuations in foreign currencies; withholding or other taxes; trading, settlement, custodial, and other operational risks; and the less stringent investor protection and disclosure standards of some foreign markets. Since foreign exchanges may be open on days when a Fund does not price its shares, the value of the investments in such Fund’s portfolio may change on days when shareholders will not be able to purchase or sell the Fund’s shares.
Indemnification. Under the Trust’s organizational documents, its officers and trustees are indemnified against certain liability arising out of the performance of their duties to the Funds. The Funds have a variety of indemnification obligations under contracts with their service providers. The Funds’ maximum exposure under these arrangements is unknown. However, the Funds have not had prior claims or losses pursuant to these contracts and expects the risk of loss to be remote.
Note 2 – Investment Advisory Agreement and Distribution Agreement
International Value Advisers, LLC is the investment adviser of the Funds. The Adviser’s primary business is to provide investment management services to a variety of investment vehicles, including the Funds. The Adviser is responsible for all business activities and oversight of the investment decisions made for the Funds.
In return for providing investment advisory services to the Funds, each Fund pays the Adviser an investment advisory fee, calculated daily and paid monthly, at an annual rate of 0.90% of each Fund’s average daily net assets.
The Adviser had contractually agreed to waive fees and/or reimburse expenses (exclusive of acquired fund fees and expenses, brokerage expenses, interest expense, taxes, organizational and extraordinary expenses) to limit the amount of each Fund’s total annual operating expenses to 1.40%, 2.15% and 1.15% of each Fund’s average daily net assets for Class A, Class C and Class I shares, respectively. This agreement was in effect until January 31, 2012. For the year ended September 30, 2012, the Funds had no fees waived and/or expenses reimbursed.
| Notes to Financial Statements | IVA Funds |
The Funds have adopted Distribution and Services Plans (“12b-1 Plans”), pursuant to Rule 12b-1 under the 1940 Act. Under those 12b-1 Plans, the Funds pay a distribution fee with respect to Class A and C shares calculated at the annual rate of 0.25% and 0.75%, respectively, of the average daily net assets of each respective class. The Funds also pay a service fee with respect to Class C shares calculated at the annual rate of 0.25% of the average daily net assets. Class I shares do not participate in 12b-1 Plans. Fees paid under the 12b-1 Plans for the year ended September 30, 2012 are disclosed in the Statements of Operations.
IVA Funds Distributors, LLC, a direct subsidiary of Foreside Distributors, LLC, serves as the Funds’ sole and exclusive distributor.
There is a maximum initial sales charge of 5.00% for Class A shares. Class A shares may be subject to a contingent deferred sales charge (“CDSC”) of 0.75% if $1,000,000 or more of Class A shares were initially purchased, a “finder’s fee” was paid to the dealer of record, and the Class A shares were subsequently redeemed within 18 months.
Class C shares may be subject to a CDSC of 1.00% if shares are redeemed within the first 12 months after purchase.
Note 3 – Investments
For the year ended September 30, 2012, the aggregate cost of purchases and proceeds from sales of investments (excluding short-term investments) were as follows:
| | | Worldwide | | International |
| | | Fund | | Fund |
| |
| Purchases | | $2,277,949,315 | | $662,434,875 |
| |
| |
| Sales | | $3,407,443,345 | | $644,068,642 |
| |
The cost basis of investments for federal income tax purposes is substantially similar to the cost basis under U.S. GAAP. The following information is presented on a federal tax basis as of September 30, 2012.
| | | Worldwide | | International |
| | | Fund | | Fund |
| |
| Cost basis of investments | | $ | 8,470,349,260 | | | $ | 2,659,785,580 | |
| |
| |
| Gross unrealized appreciation | | $ | 821,772,206 | | | $ | 186,412,553 | |
| |
| |
| Gross unrealized depreciation | | $ | (484,976,964 | ) | | $ | (97,625,688 | ) |
| |
| Net unrealized appreciation | | $ | 336,795,242 | | | $ | 88,786,865 | |
| |
Note 4 – Derivative Instruments and Hedging Activities
The Funds enter into transactions involving derivative financial instruments in connection with their investing activities. During the year ended September 30, 2012, these instruments included futures and forward foreign currency contracts. These instruments are subject to various risks similar to non-derivative instruments including market, credit and liquidity risks.
The use of derivative instruments may involve risks different from, or potentially greater than, the risks associated with investing directly in investments. Specifically, derivative instruments expose a Fund to the risk that the counterparty to an OTC derivatives contract will be unable or unwilling to make timely settlement payments or otherwise to honor its obligations. OTC derivatives transactions typically can only be closed out with the other party to the transaction. If the counterparty defaults, a Fund will have contractual remedies, but there is no assurance that the counterparty will meet its contractual obligations or that, in the event of default, a Fund will succeed in enforcing them. During the year ended September 30, 2012, the Funds had exposure to OTC derivatives in the form of forward foreign currency contracts.
Forward foreign currency contracts involve elements of market risk in excess of the amounts reflected in the Statements of Assets and Liabilities. The Funds bear the risk of an unfavorable change in the foreign exchange rate underlying the forward foreign currency contract, movements in foreign investment security values and changes in interest rates. Credit risks may also arise upon entering into these contracts from the potential inability of counterparties to meet the terms of their contracts.
Futures transactions involve elements of market risk in excess of the amounts reflected in the Statements of Assets and Liabilities. A sale of a futures contract may result in losses in excess of the amount invested in the futures contract. There can be no guarantee that there will be a correlation between price movements in the futures contracts and in the securities positions covering those contracts. In addition, there are significant differences between securities markets and futures markets that could result in an imperfect correlation between the markets. The degree of imperfection of correlation depends on circumstances such as variations
| Notes to Financial Statements | IVA Funds |
in speculative market demand for futures, including technical influences in futures trading, and differences between the financial instruments held by a Fund and the instruments underlying the standard contracts available for trading in such respects as interest rate levels, maturities and creditworthiness of issuers.
The Funds adhere to FASB Accounting Standards Codification 815-10-50 (“ASC 815-10-50”), Derivative Instruments and Hedging Activities. ASC 815-10-50 requires enhanced disclosure about a Fund’s derivative and hedging activities, including how such activities are accounted for and their effect on a Fund’s financial positions, performance and cash flow.
The following summary for each Fund is grouped by risk-type and provides information about the fair value and location of derivatives within the Statements of Assets and Liabilities at September 30, 2012.
Worldwide Fund
| | | Statements of Assets | | | | |
| Risk-Type Category | | and Liabilities Location | | Fair Value |
| |
| Foreign exchange | | Unrealized appreciation on open forward foreign currency contracts | | $ | 6,425,590 | |
| |
| |
| Foreign exchange | | Unrealized depreciation on open forward foreign currency contracts | | $ | (1,784,184 | ) |
| |
| Total | | | | $ | 4,641,406 | |
| |
International Fund
| | | Statements of Assets | | | | |
| Risk-Type Category | | and Liabilities Location | | Fair Value | |
| |
| Foreign exchange | | Unrealized appreciation on open forward foreign currency contracts | | $ | 1,794,914 | |
| |
| |
| Foreign exchange | | Unrealized depreciation on open forward foreign currency contracts | | $ | (480,071 | ) |
| |
| Total | | | | $ | 1,314,843 | |
| |
The following is a summary for each Fund grouped by risk-type that provides information about the effect of derivatives and hedging activities on the Funds’ Statements of Operations for the year ended September 30, 2012.
Worldwide Fund
| | | | | | | | | Change in |
| | | | | | | | | Unrealized |
| | | | | Realized | | Appreciation/ |
| Risk-Type Category | | Derivative Instrument | | Gain/(Loss) | | (Depreciation) |
| |
| Foreign exchange | | Forward foreign currency contracts | | $ | 53,202,650 | | | $ | 432,597 | |
| |
| |
| Interest rate | | Futures contracts | | | (35,978,750 | ) | | | (1,300,135 | ) |
| |
| Total | | | | $ | 17,223,900 | | | $ | (867,538 | ) |
| |
International Fund
| | | | | | | | | Change in |
| | | | | | | | | Unrealized |
| | | | | Realized | | Appreciation/ |
| Risk-Type Category | | Derivative Instrument | | Gain/(Loss) | | (Depreciation) |
| |
| Foreign exchange | | Forward foreign currency contracts | | $ | 16,849,684 | | | $ | 726,369 | |
| |
| |
| Interest rate | | Futures contracts | | | (5,458,783 | ) | | | (1,215,890 | ) |
| |
| Total | | | | $ | 11,390,901 | | | $ | (489,521 | ) |
| |
During the year ended September 30, 2012, the Worldwide Fund had average notional values of $1,453,128,893 and $1,634,310,390 on futures contracts to sell and open forward foreign currency contracts to sell, respectively.
| Notes to Financial Statements | IVA Funds |
During the year ended September 30, 2012, the International Fund had average notional values of $287,648,028 and $691,101,178 on futures contracts to sell and open forward foreign currency contracts to sell, respectively.
Note 5 – Shares of Beneficial Interest
At September 30, 2012, the Trust had an unlimited number of shares of beneficial interest authorized with a par value of $0.001 per share. The Funds have the ability to issue multiple classes of shares. Each share of a class represents an identical interest and has the same rights, except that each class bears certain direct expenses specifically related to the distribution of its shares.
Transactions in shares of each class of each Fund were as follows:
Worldwide Fund
| | | Year Ended | | Year Ended |
| | | September 30, 2012 | | September 30, 2011 |
| |
| | | Shares | | | Amount | | Shares | | | Amount |
| |
| Class A | | | | | | | | | | | | | | | | | | |
Shares sold | | | 24,252,544 | | | | $ | 386,175,025 | | | | 77,064,980 | | | | $ | 1,305,447,075 | |
Shares reinvested | | | 8,769,980 | | | | | 132,163,588 | | | | 3,193,627 | | | | | 52,918,403 | |
Shares repurchased | | | (56,993,255 | ) | | | | (900,593,106 | ) | | | (27,954,413 | ) | | | | (470,342,110 | ) |
| |
| Net Increase (Decrease) | | | (23,970,731 | ) | | | $ | (382,254,493 | ) | | | 52,304,194 | | | | $ | 888,023,368 | |
| |
| Class C | | | | | | | | | | | | | | | | | | |
Shares sold | | | 8,010,244 | | | | $ | 125,497,599 | | | | 47,513,071 | | | | $ | 798,982,437 | |
Shares reinvested | | | 3,513,529 | | | | | 52,702,931 | | | | 1,080,716 | | | | | 17,831,811 | |
Shares repurchased | | | (24,677,438 | ) | | | | (385,997,451 | ) | | | (9,895,422 | ) | | | | (165,777,839 | ) |
| |
| Net Increase (Decrease) | | | (13,153,665 | ) | | | $ | (207,796,921 | ) | | | 38,698,365 | | | | $ | 651,036,409 | |
| |
| Class I | | | | | | | | | | | | | | | | | | |
Shares sold | | | 80,993,175 | | | | $ | 1,287,910,370 | | | | 162,536,444 | | | | $ | 2,756,422,981 | |
Shares reinvested | | | 14,489,492 | | | | | 218,356,649 | | | | 4,334,310 | | | | | 71,819,512 | |
Shares repurchased | | | (93,682,460 | ) | | | | (1,477,737,989 | ) | | | (39,177,738 | ) | | | | (660,210,158 | ) |
| |
| Net Increase | | | 1,800,207 | | | | $ | 28,529,030 | | | | 127,693,016 | | | | $ | 2,168,032,335 | |
| |
International Fund
| | | Year Ended | | Year Ended |
| | | September 30, 2012 | | September 30, 2011 |
| |
| | | Shares | | | Amount | | Shares | | | Amount |
| |
| Class A | | | | | | | | | | | | | | | | | | |
Shares sold | | | 8,542,771 | | | | $ | 129,202,545 | | | | 12,031,409 | | | | $ | 195,512,821 | |
Shares reinvested | | | 1,298,458 | | | | | 18,879,577 | | | | 447,147 | | | | | 7,091,792 | |
Shares repurchased | | | (8,071,341 | ) | | | | (124,179,381 | ) | | | (4,011,657 | ) | | | | (66,294,705 | ) |
| |
| Net Increase | | | 1,769,888 | | | | $ | 23,902,741 | | | | 8,466,899 | | | | $ | 136,309,908 | |
| |
| Class C | | | | | | | | | | | | | | | | | | |
Shares sold | | | 522,825 | | | | $ | 7,869,318 | | | | 1,932,225 | | | | $ | 31,162,113 | |
Shares reinvested | | | 231,655 | | | | | 3,342,778 | | | | 72,938 | | | | | 1,148,042 | |
Shares repurchased | | | (964,507 | ) | | | | (14,616,018 | ) | | | (452,967 | ) | | | | (7,372,331 | ) |
| |
| Net Increase (Decrease) | | | (210,027 | ) | | | $ | (3,403,922 | ) | | | 1,552,196 | | | | $ | 24,937,824 | |
| |
| Class I | | | | | | | | | | | | | | | | | | |
Shares sold | | | 35,950,689 | | | | $ | 550,649,143 | | | | 57,781,854 | | | | $ | 943,304,973 | |
Shares reinvested | | | 6,884,338 | | | | | 100,167,117 | | | | 1,800,200 | | | | | 28,551,171 | |
Shares repurchased | | | (16,417,956 | ) | | | | (251,379,248 | ) | | | (11,669,292 | ) | | | | (191,544,129 | ) |
| |
| Net Increase | | | 26,417,071 | | | | $ | 399,437,012 | | | | 47,912,762 | | | | $ | 780,312,015 | |
| |
| Notes to Financial Statements | IVA Funds |
Redemption Fees. The Funds impose a redemption fee of 2% of the total redemption amount on the Funds’ shares redeemed within 30 days of buying them or acquiring them by exchange. The purpose of the redemption fee is to deter excessive, short-term trading and other abusive trading practices, and to help offset the costs associated with the sale of portfolio securities to satisfy redemption and exchange requests made by “market timers” and other short-term shareholders, thereby insulating longer-term shareholders from such costs.
Note 6 – Income Tax Information and Distributions to Shareholders
The tax character of distributions paid during the fiscal year ended September 30, 2012 were as follows:
| | | Worldwide | | International |
| | | Fund | | Fund |
| |
| Distributions Paid From: | | | | | | | | |
| |
| |
| Ordinary income | | $ | 214,074,606 | | | $ | 72,910,356 | |
| |
| |
| Long-Term gains | | $ | 345,449,300 | | | $ | 77,835,367 | |
| |
As of September 30, 2012, the components of accumulated earnings on a tax basis were as follows:
| | | Worldwide | | International |
| | | Fund | | Fund |
| |
| Undistributed net investment income | | $ | 141,700,546 | | | $ | 79,738,151 | |
| Undistributed realized gains | | | 61,012,986 | | | | 35,462,458 | |
| Other book/tax temporary differences(a) | | | (172,677 | ) | | | (125,436 | ) |
| Unrealized appreciation/(depreciation)(b) | | | 336,785,598 | | | | 88,784,900 | |
| |
| Total accumulated earnings/(losses) | | $ | 539,326,453 | | | $ | 203,860,073 | |
| |
| (a) | | Other book/tax temporary differences are attributable primarily to the tax treatment of offering costs. |
| (b) | | The difference between book-basis and tax-basis unrealized appreciation/(depreciation) is attributable primarily to the treatment of passive foreign investment companies, the tax deferral of losses on wash sales and forward foreign currency contracts. |
Reclassification. U.S. GAAP requires that certain components of net assets be adjusted to reflect permanent differences between financial and tax reporting. These reclassifications have no effect on net assets or NAV per share. For the year ended September 30, 2012, the following reclassifications have been made:
| | | Worldwide | | International |
| | | Fund | | Fund |
| |
| Undistributed net investment income | | $ | 28,885,926 | | | $ | 33,777,844 | |
| |
| |
| Accumulated net realized gain | | $ | (54,599,929 | ) | | $ | (38,481,984 | ) |
| |
| |
| Paid-in-capital | | $ | 25,714,003 | | | $ | 4,704,140 | |
| |
| Report of Independent Registered Public Accounting Firm | IVA Funds |
| The Board of Trustees and Shareholders of |
| IVA Fiduciary Trust: |
| |
We have audited the accompanying statements of assets and liabilities of IVA Worldwide Fund and IVA International Fund (the “Funds”) (the Funds comprising IVA Fiduciary Trust), including the schedules of investments, as of September 30, 2012, and the related statements of operations for the year then ended, the statements of changes in net assets for each of the two years in the period then ended, and the financial highlights for each of the four years in the period then ended. These financial statements and financial highlights are the responsibility of the Funds’ management. Our responsibility is to express an opinion on these financial statements and financial highlights based on our audits. |
| |
We conducted our audits in accordance with the standards of the Public Company Accounting Oversight Board (United States). Those standards require that we plan and perform the audit to obtain reasonable assurance about whether the financial statements and financial highlights are free of material misstatement. We were not engaged to perform an audit of the Funds’ internal control over financial reporting. Our audits included consideration of internal control over financial reporting as a basis for designing audit procedures that are appropriate in the circumstances, but not for the purpose of expressing an opinion on the effectiveness of the Funds’ internal control over financial reporting. Accordingly, we express no such opinion. An audit also includes examining, on a test basis, evidence supporting the amounts and disclosures in the financial statements and financial highlights, assessing the accounting principles used and significant estimates made by management, and evaluating the overall financial statement presentation. Our procedures included confirmation of securities owned as of September 30, 2012, by correspondence with the custodian and others or by other appropriate auditing procedures where replies from others were not received. We believe that our audits provide a reasonable basis for our opinion. |
| |
In our opinion, the financial statements and financial highlights referred to above present fairly, in all material respects, the financial position of IVA Worldwide Fund and IVA International Fund of IVA Fiduciary Trust at September 30, 2012, the results of their operations for the year then ended, the changes in their net assets for each of the two years in the period then ended, and the financial highlights for each of the four years in the period then ended, in conformity with U.S. generally accepted accounting principles. |
| |
 |
| Boston, Massachusetts |
| November 16, 2012 |
| Trustees and Officers (unaudited) | IVA Funds |
The business and affairs of each Fund are managed under the direction of its Board of Trustees (the “Board”). The Board approves all significant agreements between a Fund and the persons or companies that furnish services to a Fund, including agreements with its investment adviser, distributor, administrator, custodian and transfer agent. The day-to-day operations of the Funds are delegated to the Funds’ investment adviser and administrator. The name, address, age and principal occupations for the past five years of the Trustees and officers of the Trust are listed below, along with the number of portfolios in the Fund complex overseen by and the other directorships held by each Trustee. Each Trustee’s mailing address is c/o International Value Advisers, LLC, 717 Fifth Avenue, New York, NY 10022.
Independent Trustees(a)
| | | | | | | | | Number of | | |
| | | | | | | | | Portfolios | | |
| | | | | Term of | | | | in the Fund | | |
| | | Position(s) | | Office (b) and | | Principal | | Complex | | Other Directorships/ |
| | | Held with | | Length of | | Occupation(s) During | | Overseen | | Trusteeships |
| Name (Birth Year) | | the Trust | | Time Served | | Past 5 Years | | by Trustee | | Held by Trustee |
| | | | | | | | | | | |
Adele R. Wailand
(1949) | | Trustee and Chair of the Board | | since 2008 | | Corporate Secretary, Case, Pomeroy & Company, Inc. (real estate and investments); Vice President & General Counsel, Case, Pomeroy & Company, Inc. (prior to 2011). | | 2 | | None. |
| | | | | | | | | | | |
Manu Bammi
(1962) | | Trustee | | since 2008 | | Founder and Chief Executive Officer, SmartAnalyst, Inc. (provider of research and analytics and decision support to businesses). | | 2 | | None. |
| | | | | | | | | | | |
Ronald S. Gutstein
(1971) | | Trustee | | since 2008 | | Institutional Trader and Market Maker, Access Securities (an institutional broker-dealer). | | 2 | | None. |
| (a) | | Trustees who are not “interested persons” of the Trust as defined in the 1940 Act. |
| (b) | | Each Trustee serves until resignation or removal from the Board. |
| Trustees and Officers (unaudited) | IVA Funds |
Interested Trustee
| | | | | | | | | Number of |
| | | | | | | | | Portfolios |
| | | | | Term of | | | | in the Fund |
| | | Position(s) | | Office (a) and | | Principal | | Complex |
| | | Held with | | Length of | | Occupation(s) During | | Overseen |
| Name (Birth Year) | | the Trust | | Time Served | | Past 5 Years | | by Trustee |
| | | | | | | | | |
Michael W.
Malafronte(b)
(1974) | | President and Trustee | | since 2008 | | Managing Partner, the Adviser (since 2010); CEO and Research Analyst, the Adviser (2007-2010); Senior Research Analyst, Arnhold and S. Bleichroeder Advisers, LLC (“ASB”) (asset management advisory services) (2005-2007). | | 2 |
| (a) | | Each Trustee serves until resignation or removal from the Board. |
| (b) | | Mr. Malafronte is considered an interested trustee due to his position as Managing Partner of the Adviser. |
Officers of the Trust
| | | | | Term of | | |
| | | | | Office and | | |
| | | Position(s) | | Length of | | |
| | | Held with | | Time | | |
| Name (Birth Year) and Address(a) | | the Trust | | Served (b) | | Principal Occupation(s) During Past 5 Years |
| | | | | | | |
Shanda Scibilia
(1971) | | Chief Compliance Officer and Secretary | | since 2008 | | Chief Operating Officer and Chief Compliance Officer, the Adviser (since 2008); acting Chief Operating Officer and head of compliance, Oppenheimer & Close (from 1998 to 2008). |
| | | | | | | |
Stefanie J. Hempstead
(1973) | | Treasurer | | since 2008 | | Chief Financial Officer, the Adviser (since 2008); Senior Vice President, ASB (prior to 2008); Vice President, ASB Securities LLC (prior to 2008); Vice President and Treasurer, First Eagle Funds and First Eagle Variable Funds (prior to 2008). |
| | | | | | | |
Christopher W. Hine
(1978) | | Assistant Treasurer | | since 2010 | | Director of Accounting, the Adviser (since 2009); Manager, Citco Fund Services (2008); Assistant Vice President, ASB (from 2006 to 2007). |
| | | | | | | |
Philip F. Coniglio
(1981) | | Assistant Secretary | | since 2011 | | Fund Operations Manager, the Adviser (since 2009); Director, Morgan Stanley (from 2007 to 2009); Manager, Morgan Stanley (from 2006 to 2007). |
| (a) | | Each officer’s mailing address is c/o International Value Advisers, LLC, 717 Fifth Avenue, New York, NY 10022. |
| (b) | | The term of office of each officer is indefinite. Length of time served represents time served as an officer of the Trust, although various positions may have been held during the period. |
| Additional Information (unaudited) | IVA Funds |
Board Approval of Investment Advisory Agreement. At telephonic and in-person meetings held on May 16, 2012 and May 21, 2012, respectively, the Board of Trustees of the Trust (the “Board”), including all of the Trustees who are not “interested persons” of the Trust (the “Independent Trustees”) discussed the Investment Advisory Agreement (the “Advisory Agreement”) related to the Funds.
To assist the Board in its evaluation of the Advisory Agreement, the Independent Trustees received comprehensive written materials and other information, in adequate time in advance of the meeting, which outlined, among other things, (i)information confirming the financial condition of the Adviser and the Adviser’s profitability derived from its relationship with each Fund, (ii) information as to the advisory fee rates paid to the Adviser by each Fund and each other fund or account managed by the Adviser, (iii)information as to the advisory fee rates paid by mutual funds to other advisers selected by Lipper, Inc. (“Lipper”) and by the Adviser, (iv)a description of the personnel and the nature and quality of the services provided by the Adviser, (v)information on compliance matters; (vi) comparative information on investment performance of the Funds, and (vii) information regarding brokerage and portfolio transactions of the Funds. The Independent Trustees reviewed the materials provided by the Adviser, which included, among other things, information prepared by Lipper containing detailed contractual management fee, expense ratio and performance comparisons for each Fund with other mutual funds in their “peer group” and “universe” as determined by the Lipper methodology, as well as for each Fund with other mutual funds in a peer group selected by the Adviser. The Independent Trustees had reviewed the memorandum prepared by Sidley Austin LLP (“Sidley Austin”), Independent Trustee Counsel, outlining the legal duties of the Independent Trustees in evaluating investment advisory arrangements.
In addition, it was noted, the Independent Trustees took into account information furnished throughout the year at regular Board meetings, including reports on investment performance, shareholder services, distribution fees and expenses, regulatory compliance and other services provided to each Fund. The Independent Trustees also considered other matters they deemed important to the approval process, such as allocation of Fund brokerage commissions, and other direct and indirect benefits to the Adviser from its relationship with the Funds. The Trustees met throughout the year with the portfolio managers of the Funds. It was noted that the Independent Trustees, in their deliberations, recognized that for many of the Funds’ shareholders, the decision to purchase Fund shares included a decision to select the Adviser as the investment adviser for their investments and that there was a strong association in the minds of Fund shareholders between the Adviser and each Fund.
In considering factors relating to the approval of the continuance of the Advisory Agreement, Sidley Austin had provided the Independent Trustees with assistance and advice. With respect to the Advisory Agreement, although it related to both Funds, the Independent Trustees had considered each Fund separately. The Independent Trustees were satisfied that the information requested, including the supplemental information request, provided the Independent Trustees with the information that they believed, in the exercise of their business judgment, was pertinent, sufficient and comprehensive for the purposes of their evaluation of the continuation of each agreement and each plan. Among other factors, the Trustees noted that they considered the following:
The nature, extent and quality of services provided by the Adviser: The Independent Trustees reviewed the services that the Adviser provides to each Fund, including, but not limited to, making the day-to-day investment decisions for each Fund, and generally managing each Fund’s investments in accordance with the stated policies of the Fund. The Independent Trustees noted that throughout the year they discussed with officers and portfolio managers of the Funds the types of transactions that were being done on behalf of each Fund. Additionally, the Independent Trustees took into account the services provided by the Adviser to its other accounts that have investment mandates similar to the Funds. In particular, they noted the greater level of portfolio management, compliance and administrative oversight services required for the Funds, mutual funds registered under the 1940 Act, as compared to the Adviser’s institutional accounts. The Independent Trustees also considered the education, background and experience of the Adviser’s personnel, noting in particular that the favorable history and reputation of the portfolio managers for the Funds have had, and are likely to continue to have, a favorable impact on the Funds. In this regard, the significant growth of the Funds during the period since inception on October 1, 2008 was noted, as well as the Fund’s imposition of a soft close and its subsequent impact on asset growth. The Independent Trustees additionally noted the Adviser’s ability to attract quality and experienced personnel and its continued investment in the growth of its business. The Independent Trustees also considered the administrative services provided by the Adviser, including compliance and accounting services, and oversight of third party service providers. After considering the above factors, the Trustees concluded that the nature, quality and extent of services provided by the Adviser are adequate and appropriate and would continue to be suitable for each Fund. The Independent Trustees’ evaluation of the nature and quality of the services provided to the Adviser supported continuation of the Advisory Agreement.
Investment performance of each Fund and the Adviser: The Independent Trustees considered the investment performance of each Fund compared to the Lipper peer funds, the Lipper universe of funds, the peer funds selected by the Adviser and the relevant benchmark index. The Independent Trustees noted that the Funds have been in operation since October 1, 2008, and also noted the extreme volatility in the markets during the period since the Funds commenced operations. It was noted that the Lipper material presented performance information since inception and for the one year and three year periods ended December 31, 2011. It was
| Additional Information (unaudited) | IVA Funds |
noted that, since inception and for the three year period, the IVA Worldwide Fund outperformed the median of the Lipper peer group and was at the median for the one year period of the Lipper peer group. Also, the Independent Trustees noted that the IVA Worldwide Fund since inception outperformed the average of the Lipper peer group, and was below the average of the Lipper peer group for the one year and three year periods. It was also noted that since inception, and for the one year and three year periods, the IVA Worldwide Fund outperformed the average and the median for the Lipper universe funds. Since inception and for the one year period, the Independent Trustees noted that the IVA Worldwide Fund outperformed the average and the median of the peer funds selected by the Adviser, but underperformed the average and the median of these funds for the three year period. With respect to the IVA International Fund, the Independent Trustees noted that since inception and for the one and three year periods, the Fund outperformed the average and the median of the Lipper peer group and the Lipper universe. It was also noted that since inception and for the one year period, the IVA International Fund outperformed the average and the median of the peer funds selected by the Adviser. For the three year period, it was noted that the IVA International Fund outperformed the average of the peer funds selected by the Adviser, and that the Class I shares outperformed the median and the Class A shares underperformed the median of the peer funds selected by the Adviser. Since inception through March 31, 2012, the Independent Trustees also noted that the performance of the IVA Worldwide Fund and the IVA International Fund exceeded the performance of each Fund’s benchmark index (the MSCI All Country World Index in the case of the IVA Worldwide Fund and the MSCI All Country World ex-U.S. Index in the case of the IVA International Fund). The Independent Trustees also noted each Fund’s favorable Morningstar risk-adjusted performance since inception compared to the Lipper peer funds and the peer funds selected by the Adviser as indicated in the materials provided by the Adviser. The Independent Trustees considered the performance of the Funds in light of the Adviser’s investment approach of focusing on preservation of capital over the short-term and seeking to outperform each Fund’s benchmark over the long term, asset allocation and the overall financial market conditions. They also noted that the Adviser’s interests were well-aligned with the Funds’ shareholders as a result of the significant investment in the Funds by the Adviser’s partners. The Independent Trustees determined that each Fund’s performance, in light of all the considerations noted above, was satisfactory. The Independent Trustees determined that the Adviser continued to be an appropriate investment adviser for each Fund and concluded that each Fund’s performance supported the continuation of the Advisory Agreement.
Cost of the services provided and profits realized by the Adviser from its relationship with each Fund: The Independent Trustees considered the investment advisory fee payable by each Fund as well as total expense ratios. The Independent Trustees considered each Fund’s contractual management fee at common asset levels compared to the Lipper peer funds. It was noted that each Fund’s contractual management fee was above the median and the average for the Lipper peer funds. The Independent Trustees noted that the contractual management fee for the IVA Worldwide Fund was slightly higher than the average and median of the peer funds selected by the Adviser and that the contractual management fee rate for the IVA International Fund was slightly higher than the average and almost equal to the median of the peer funds selected by the Adviser. With respect to the peer funds selected by the Adviser, the Independent Trustees noted that the contractual management fee rate paid by the Funds to the Adviser was lower than the fee charged by a number of advisers similar in size to the Adviser. The Independent Trustees also noted that the IVA Worldwide Fund’s actual total expense ratio was higher than the median and the average of the Lipper peer funds, but equal to the median of the Lipper universe funds, and that the IVA International Fund’s actual total expense ratio was lower than the median and the average of the Lipper peer and universe funds. They also noted that the total expense ratio for the Class A shares of both Funds was slightly higher than the average and median total expense ratio of the peer funds selected by the Adviser, while the total expense ratio for the Class I shares of both Funds was lower than the average and median total expense ratio of the peer funds selected by the Adviser. The Independent Trustees noted that the total expense ratio for each Fund had declined since the Funds commenced operations and that this decline correlated with the growth in the assets of the Funds. The Independent Trustees concluded that each Fund’s current expense structure is satisfactory.
The Independent Trustees also reviewed the fee schedule in effect for managed separate accounts, and considered that the fees charged to those accounts were lower than those charged to the Funds. The Independent Trustees were aware of the significant shareholder services, legal and regulatory requirements associated with the Adviser’s management of the Funds that was not required in servicing separate accounts.
The Independent Trustees also reviewed information regarding the profitability to the Adviser of its relationship with each Fund. The Independent Trustees considered the level of the Adviser’s profits, the change in profitability over time, and whether the profits were reasonable. The Independent Trustees took into consideration other benefits to be derived by the Adviser in connection with the Advisory Agreement. Since the Adviser has no affiliates with business relationships with the Funds, the Independent Trustees noted that the Adviser receives no additional revenues from providing other services to the Funds. Moreover, the Independent Trustees noted that the Adviser’s interests are well-aligned with the Funds’ shareholders in the efficient management of the services and costs of the third-party service providers to the Funds. The Independent Trustees took into consideration the “soft dollar” research the Adviser receives from brokers which benefits the Funds and other Adviser clients and which might offset expenses the Adviser would otherwise incur. The Independent Trustees also noted the Adviser’s willingness to soft close both Funds and its other investment products to most new investors in order to best execute its investment strategy on behalf of the existing Fund
| Additional Information (unaudited) | IVA Funds |
shareholders and investors, although this would be expected to limit the Adviser’s profitability while offering a shareholder benefit. The Independent Trustees further noted the continuing investment by the Adviser in both its infrastructure and staff. The Independent Trustees also considered the entrepreneurial risk and financial exposure assumed by the Adviser in developing and managing the Funds. They noted that the development and management of the Funds requires a high degree of knowledge, sophistication and judgment and potentially subjected the Adviser to substantial financial exposure. The Independent Trustees concluded that the profits realized by the Adviser from its relationship with each Fund were reasonable and consistent with fiduciary duties. The Independent Trustees’ evaluation of the Adviser’s profitability supported continuation of the Advisory Agreement.
The extent to which economies of scale would be realized as the Funds grow and whether fee levels would reflect such economies of scale: The Independent Trustees noted that they considered whether there have been economies of scale in respect to the management of each Fund, whether each Fund appropriately benefitted from any economies of scale and whether there is potential for realization of any further economies of scale. The Independent Trustees noted that the total expense ratio of each Fund had declined since the Funds commenced operations due to the growth in the assets of the Funds. They also noted, however, that since the Funds were closed to most new investors, it was not likely that there would be a significant further increase in Fund assets, or a significant decrease in the total expense ratio, in the foreseeable future, as evidenced by the relatively stable size of the Funds’ assets since the imposition of the soft close. The Independent Trustees again noted the continuing investment by the Adviser in both its infrastructure and staff which are expected to benefit the Funds and their shareholders. The Independent Trustees concluded that the current fee structure for each Fund was reasonable, that shareholders sufficiently participated in economies of scale at the present time at current asset levels and that no changes were currently necessary. The Independent Trustees’ evaluation of the economies of scale supported continuation of the Advisory Agreement.
Comparison of services rendered and fees paid to those under other investment advisory contracts, such as contracts of the same and other investment advisers or other clients: The Independent Trustees noted that they compared the services rendered and the fees paid under the Advisory Agreement with those under other investment management contracts of other investment advisers managing funds deemed comparable. The Independent Trustees stated that they also considered the services rendered and fees paid under the Advisory Agreement as compared to the Adviser’s other management contracts with institutional and other accounts with similar investment mandates. As noted above, the Independent Trustees acknowledged the greater level of portfolio management, compliance and administrative oversight services required for the Funds, as well as the higher level of financial exposure assumed, as compared to the Adviser’s institutional accounts and other investment funds. The Independent Trustees determined that, on a comparative basis, the fee under the Advisory Agreement for each Fund was reasonable in relation to the services provided to the Funds, and was lower than the fees charged by the Adviser to its other investment funds. The Independent Trustees’ evaluation of the Adviser’s other fee arrangements and of competitor mutual funds supported continuation of the Advisory Agreement.
Accordingly, in light of each of the findings and taken as a whole, the Independent Trustees determined that, on a comparative basis, the fee under the Advisory Agreement for each Fund was reasonable in relation to the services provided and could have been the product of an arm’s length bargain. No single factor was cited as determinative to the decision of the Trustees. Rather, after weighing all of the consideration and conclusions discussed above, the Trustees, including the Independent Trustees, unanimously recommended approval of the continuation of the Advisory Agreement for each Fund.
Proxy Voting. Information on how the Funds voted proxies relating to portfolio securities during the prior 12-month period ended June 30th of each year and a description of the policies and procedures that the Funds use to determine how to vote proxies relating to portfolio transactions are available (1) without charge, upon request, by calling 866-941-4482, and (2) on the Securities and Exchange Commission (“SEC”) website at www.sec.gov by accessing the Funds’ Form N-PX and Statement of Additional Information in the Funds’ registration statement on Form N-1A.
Schedules of Portfolio Holdings. The Funds file their complete schedules of portfolio holdings with the SEC for the first and third quarters of each fiscal year on Form N-Q. The Funds’ Form N-Q is available on the SEC’s website at www.sec.gov. The Funds’ Form N-Q may be reviewed and copied at the SEC’s Public Reference Room in Washington, D.C., and information on the operation of the Public Reference Room may be obtained by calling 800-SEC-0330. To obtain the Funds’ Form N-Q, shareholders can call 866-941-4482.
Trustees and Officers of the Funds. Additional information about Trustees and officers of the Funds is included in the Statement of Additional Information which is available, without charge, upon request, by calling 866-941-4482.
| Fund Expenses (unaudited) | IVA Funds |
As a shareholder of the Funds, you may incur two types of costs: (1) transaction costs, including initial sales charges and/or redemption fees; and (2) ongoing costs, including investment advisory fees, distribution and/or service (12b-1) fees and other operating fund expenses. The information on this page is intended to help you understand your ongoing costs of investing in the Funds and to compare these costs with the ongoing costs of investing in other mutual funds.
This example is based on an investment of $1,000 invested on April 1, 2012 and held for the six months ended September 30, 2012.
ACTUAL EXPENSES
The table below titled “Based on Actual Total Return” provides information about actual account values and actual expenses. You may use the information provided in this table, together with the amount you invested, to estimate the expenses that you paid over the period. To estimate the expenses you paid on your account, divide your ending account value by $1,000 (for example, an $8,600 ending account value divided by $1,000 = 8.6), then multiply the result by the number under the heading titled “Expenses Paid During the Period.”
BASED ON ACTUAL TOTAL RETURN FOR THE SIX MONTHS ENDED SEPTEMBER 30, 2012(a)
| | | Actual | | | | | | | | | | Annualized | | Expenses |
| | | Total | | Beginning | | Ending | | Expense | | Paid During |
| | | Return | | Account Value | | Account Value | | Ratio | | the Period(b) |
Worldwide Fund | | | | | | | | | | | | | | | | | | | | |
Class A | | | –0.80 | % | | $ | 1,000.00 | | | $ | 992.00 | | | | 1.27 | % | | $ | 6.32 | |
Class C | | | –1.17 | % | | | 1,000.00 | | | | 988.30 | | | | 2.02 | % | | | 10.04 | |
Class I | | | –0.67 | % | | | 1,000.00 | | | | 993.30 | | | | 1.02 | % | | | 5.08 | |
International Fund | | | | | | | | | | | | | | | | | | | | |
Class A | | | 1.66 | % | | $ | 1,000.00 | | | $ | 1,016.60 | | | | 1.27 | % | | $ | 6.40 | |
Class C | | | 1.35 | % | | | 1,000.00 | | | | 1,013.50 | | | | 2.02 | % | | | 10.17 | |
Class I | | | 1.85 | % | | | 1,000.00 | | | | 1,018.50 | | | | 1.02 | % | | | 5.15 | |
HYPOTHETICAL EXAMPLE FOR COMPARISON PURPOSES
The table below titled “Based on Hypothetical Total Return” provides information about hypothetical account values and hypothetical expenses based on the actual expense ratio and an assumed rate of return of 5% per year before expenses, which are not the Funds’ actual returns. The hypothetical account values and expenses may not be used to estimate the actual ending account values and expenses you paid for the period. You may use the information provided in this table to compare the ongoing costs of investing in the Funds and other funds. To do so, compare the 5% hypothetical example relating to the Funds with the 5% hypothetical examples that appear in the shareholder reports of other funds.
Please note that expenses shown in the table below are meant to highlight your ongoing costs and do not reflect any transactional costs, such as initial sales charges (loads) or redemption fees, if any. Therefore, the table is useful in comparing ongoing costs only and will not help you determine your relative total costs of owning different funds. In addition, if these transactional costs were included, your costs would have been higher.
BASED ON HYPOTHETICAL TOTAL RETURN FOR THE SIX MONTHS ENDED SEPTEMBER 30, 2012
| | | Hypothetical | | | | | | | | | | Annualized | | Expenses |
| | | Annualized | | Beginning | | Ending | | Expense | | Paid During |
| | | Total Return | | Account Value | | Account Value | | Ratio | | the Period(b) |
Worldwide Fund | | | | | | | | | | | | | | | | | | | | |
Class A | | | 5.00 | % | | $ | 1,000.00 | | | $ | 1,018.65 | | | | 1.27 | % | | $ | 6.41 | |
Class C | | | 5.00 | % | | | 1,000.00 | | | | 1,014.90 | | | | 2.02 | % | | | 10.18 | |
Class I | | | 5.00 | % | | | 1,000.00 | | | | 1,019.90 | | | | 1.02 | % | | | 5.15 | |
International Fund | | | | | | | | | | | | | | | | | | | | |
Class A | | | 5.00 | % | | $ | 1,000.00 | | | $ | 1,018.65 | | | | 1.27 | % | | $ | 6.41 | |
Class C | | | 5.00 | % | | | 1,000.00 | | | | 1,014.90 | | | | 2.02 | % | | | 10.18 | |
Class I | | | 5.00 | % | | | 1,000.00 | | | | 1,019.90 | | | | 1.02 | % | | | 5.15 | |
| (a) | | Assumes reinvestment of all dividends and capital gain distributions, if any. |
| (b) | | Expenses are equal to the Funds’ respective annualized expense ratio multiplied by the average account value over the period, multiplied by 183 days in the most recent fiscal half-year, then divided by 366. |
| Important Tax Information (unaudited) | IVA Funds |
For the fiscal year ended September 30, 2012, the Funds will designate up to the maximum amount allowable pursuant to the Internal Revenue Code, as qualified dividend income eligible for reduced tax rates. These lower rates range from 5% to 15% depending on an individual’s tax bracket. Complete information will be reported in conjunction with Form 1099-DIV.
The Funds may elect to pass through to shareholders the income tax credit for taxes paid to foreign countries. Foreign source income and foreign tax expense per outstanding share on September 30, 2012 are as follows:
| | | Foreign Source | | Foreign Tax |
| | | Income | | Expense |
| |
| Worldwide Fund | | $0.31 | | $0.03 |
| |
| |
| International Fund | | $0.43 | | $0.04 |
| |
If elected, the pass-through of the foreign tax credit will affect only those persons who are shareholders on the dividend record date in December 2012. These shareholders will receive more detailed information along with their 2012 Form 1099-DIV.
| www.ivafunds.com |
Investment Adviser |
| International Value Advisers, LLC |
| 717 Fifth Avenue |
| New York, NY 10022 |
| |
| Distributor |
| IVA Funds Distributors, LLC |
| 3 Canal Plaza, Suite 100 |
| Portland, ME 04101 |
| |
| Custodian |
| State Street Bank and Trust Company |
| 1200 Crown Colony Drive |
| Quincy, MA 02169 |
| |
| Transfer Agent |
| Boston Financial Data Services, Inc. |
| 2000 Crown Colony Drive |
| Quincy, MA 02169 |
| |
| Counsel |
| K&L Gates LLP |
| State Street Financial Center |
| One Lincoln Street |
| Boston, MA 02111-2950 |
| |
| Independent Registered Public Accounting Firm |
| Ernst & Young LLP |
| 200 Clarendon Street |
| Boston, MA 02116-5072 |
| |
This report is submitted for the general information of the Funds’ shareholders. The report is not authorized for distribution to prospective investors in the Funds unless it is accompanied or preceded by the Funds’ current prospectus, which includes information regarding the Funds’ risks, objectives, fees and expenses, experience of its management, and other information. |
| |
The commentary within An Owner’s Manual, the Letter from the President, the Letter from the Portfolio Managers, and the Management’s Discussion of Fund Performance reflects their current views and opinions as of the date of this report. Any such views are subject to change at any time based upon market or other conditions and IVA Funds disclaims any responsibility to update such views. These views may not be relied on as investment advice and, because investment decisions are based on numerous factors, may not be relied on as an indication of trading intent. References to specific securities should not be construed as recommendations or investment advice. |

Item 2. Code of Ethics.
(a) As of the end of the period covered by this Form N-CSR, the registrant has adopted a code of ethics, as defined in Item 2(b) of Form N-CSR, that applies to the registrant’s principal executive officer and principal financial officer.
(c) The registrant has not amended its code of ethics during the period covered by this Form N-CSR.
(d) The registrant has not granted any waivers from any provisions of the code of ethics during the period covered by this Form N-CSR.
(e) Not applicable.
(f) A copy of the registrant’s code of ethics is filed as Exhibit 12(a)(1) to this Form N-CSR.
Item 3. Audit Committee Financial Expert.
(a)(1) The registrant’s Board of Trustees (the “Board”) has determined that the registrant has a member serving on the registrant’s Audit Committee that possess the attributes identified in Form N-CSR to qualify as an “audit committee financial expert.”
(a)(2) The audit committee financial expert is Manu Bammi and he has been deemed to be “independent” as that term is defined in Form N-CSR.
Item 4. Principal Accountant Fees and Services.
The firm of Ernst &Young LLP (“E&Y”) serves as the independent registered public accounting firm for the registrant.
(a) Audit Fees.
For the fiscal years ended September 30, 2011 and September 30, 2012, the aggregate fees billed for professional services rendered by E&Y for the audit of the registrant’s annual financial statements and/or for services that are normally provided by E&Y in connection with statutory and regulatory filings or engagements were $53,400 and $63,000, respectively.
(b) Audit-Related Fees.
For the fiscal years ended September 30, 2011 and September 30, 2012, the aggregate fees billed for assurance and related services rendered by E&Y that are reasonably related to the performance of the audit or review of the registrant’s financial statements and that are not reported under Audit Fees above were $0 and $0, respectively.
For the twelve month periods ended September 30, 2011 and September 30, 2012, the aggregate Audit-Related Fees billed by E&Y that were required to be approved by the registrant’s Audit Committee for audit-related services rendered to the registrant’s investment adviser and any entity controlling, controlled by or under common control with the investment adviser that provides ongoing services to the registrant (the
“Affiliated Service Providers”) that relate directly to the operations and financial reporting of the registrant were $0 and $0, respectively.
(c) Tax Fees.
For the fiscal years ended September 30, 2011 and September 30, 2012, the aggregate fees billed for tax compliance, tax advice and tax planning by E&Y were $20,393 and $18,000, respectively. Services for which fees in the Tax Fees category are billed include E&Y’s review of the registrant’s U.S. federal income tax returns and the required state corporate income tax returns, as well as E&Y’s review of excise tax distribution calculations.
For the twelve month periods ended September 30, 2011 and September 30, 2012, the aggregate Tax Fees billed by E&Y that were required to be approved by the registrant’s Audit Committee for tax compliance, tax advice and tax planning services rendered on behalf of Affiliated Service Providers that relate directly to the operations and financial reporting of the registrant were $0 and $0, respectively.
(d) All Other Fees.
For the fiscal years ended September 30, 2011 and September 30, 2012, the aggregate fees billed by E&Y to the registrant for all services other than services reported under Audit Fees, Audit-Related Fees, and Tax Fees were $0 and $30,000, respectively.
For the twelve month periods ended September 30, 2011 and September 30, 2012, the aggregate fees in this category billed by E&Y that were required to be approved by the registrant’s Audit Committee for services rendered on behalf of Affiliated Service Providers that relate directly to the operations and financial reporting of the registrant were $0 and $0, respectively.
(e)(1) Audit Committee’s Pre-Approval Policies and Procedures.
The registrant’s Audit Committee has the sole authority to pre-approve all audit and non-audit services to be provided by E&Y to the registrant, subject to the de minimis exceptions for non-audit services described in Section 10A(i)(1)B of the Securities Exchange Act of 1934, as amended (“Exchange Act”). Pre-approval of audit and non-audit services is not required if the engagement to render the services is entered into pursuant to pre-approval policies and procedures established by the Audit Committee (the “Pre-Approval Procedures”). The registrant’s Audit Committee adopted Pre-Approval Procedures on November 9, 2009, which generally permit:
Audit-Related Services consisting of: (i) consultations regarding accounting, operational or regulatory implications, or regulatory/compliance matters of proposed or actual transactions affecting the operations or financial reporting and (ii) other auditing procedures and issuance of special purpose reports;
Tax Services consisting of: (i) recurring tax services and (ii) consultations regarding tax consequences of proposed or actual transactions; and
Other Non-Audit Services including: (i) business support, (ii) other control and regulatory compliance projects and (iii) training.
All such services are subject to a per calendar quarterly limitation.
(e)(2) Percentage of Services.
None of the services described in each of paragraphs (b) through (d) of this Item were approved by the registrant’s Audit Committee pursuant to paragraph (c)(7)(i)(C) of Rule 2-01 of Regulation S-X.
(f) Not applicable.
(g) For the fiscal years ended September 30, 2011 and September 30, 2012, the aggregate non-audit fees billed by E&Y for services rendered to the registrant were $20,393 and $48,000, respectively.
For the twelve month periods ended September 30, 2011 and September 30, 2012, the aggregate non-audit fees billed by E&Y for services rendered to the Affiliated Service Providers were $0 and $0, respectively.
(h) Not applicable.
Item 5. Audit Committee of Listed Registrants.
Not applicable to the registrant.
Item 6. Schedule of Investments.
(a) The audited schedules of investments are included in the report to shareholders filed under Item 1 of this Form N-CSR.
(b) Not applicable.
Item 7. Disclosure of Proxy Voting Policies and Procedures for Closed-End Management Investment Companies.
Not applicable to the registrant.
Item 8. Portfolio Managers of Closed-End Management Investment Companies.
Not applicable to the registrant.
Item 9. Purchases of Equity Securities by Closed-End Management Investment Company and Affiliated Purchasers.
Not applicable to the registrant.
Item 10. Submission of Matters to a Vote of Security Holders.
The registrant does not have procedures by which shareholders may recommend nominees to the registrant’s Board of Trustees. The Nominating and Governance
Committee may, in its sole discretion, consider nominees recommended by each Fund’s shareholders.
Item 11. Controls and Procedures.
(a) Within 90 days of the filing date of this Form N-CSR, Michael W. Malafronte, the registrant’s President and Chief Executive Officer, and Stefanie J. Hempstead, the registrant’s Treasurer and Chief Financial Officer, reviewed the registrant’s Disclosure Controls and Procedures and Internal Control over Financial Reporting (the “Procedures”) (as defined in Rule 30a-3(c) under the Investment Company Act of 1940, as amended (the “1940 Act”)) and evaluated their effectiveness. Based on their review, Mr. Malafronte and Ms. Hempstead determined that the Procedures are reasonably designed to ensure that information required to be disclosed by the registrant on Form N-CSR is accumulated and communicated to the registrant’s management to allow timely decisions regarding required disclosure.
(b) There were no changes in the registrant’s Procedures (as defined in Rule 30a-3(d) under the 1940 Act) that occurred during the second fiscal quarter of the period covered by this report that has materially affected, or is reasonably likely to materially affect, the registrant’s Procedures.
Item 12. Exhibits.
(a)(1) Code of Ethics referred to in Item 2 is filed herewith.
(a)(2) The certifications required by Rule 30a-2(a) of the 1940 Act and Section 302 of the Sarbanes-Oxley Act of 2002 (“Sarbanes-Oxley Act”) are filed herewith.
(a)(3) Not applicable.
(b) The certifications required by Rule 30a-2(b) of the 1940 Act and Section 906 of the Sarbanes-Oxley Act are filed herewith.
The certifications provided pursuant to Rule 30a-2(b) of the 1940 Act and Section 906 of the Sarbanes-Oxley Act are not deemed “filed” for purposes of Section 18 of the Securities Exchange Act of 1934, as amended (the “Exchange Act”), or otherwise subject to the liability of that section. Such certifications will not be deemed to be incorporated by reference into any filing under the Securities Act of 1933 or the Exchange Act, except to the extent that the registrant specifically incorporates them by reference.
SIGNATURES
Pursuant to the requirements of the Securities Exchange Act of 1934 and the Investment Company Act of 1940, the registrant has duly caused this report to be signed on its behalf by the undersigned, thereunto duly authorized.
IVA FIDUCIARY TRUST
| By: | | /s/ Michael W. Malafronte |
| | | Michael W. Malafronte |
| | | President and Chief Executive Officer |
| | | |
| Date: | | November 30, 2012 |
Pursuant to the requirements of the Securities Exchange Act of 1934 and the Investment Company Act of 1940, this report has been signed below by the following persons on behalf of the registrant and in the capacities and on the dates indicated.
| By: | | /s/ Michael W. Malafronte |
| | | Michael W. Malafronte |
| | | President and Chief Executive Officer |
| | | |
| Date: | | November 30, 2012 |
| | | |
| By: | | /s/ Stefanie J. Hempstead |
| | | Stefanie J. Hempstead |
| | | Treasurer and Chief Financial Officer |
| | | |
| Date: | | November 30, 2012 |
| | | |