| UNITED STATES |
| SECURITIES AND EXCHANGE COMMISSION |
| Washington, D.C. 20549 |
| | FORM N-CSR |
| | CERTIFIED SHAREHOLDER REPORT OF REGISTERED |
| MANAGEMENT INVESTMENT COMPANIES |
| | Investment Company Act file number: 811-22211 |
|
|
| | IVA FIDUCIARY TRUST |
|
|
| (Exact name of registrant as specified in charter) |
| | 717 Fifth Avenue, 10th Floor, New York, NY 10022 |
|
|
| (Address of principal executive offices) (zip code) |
| | | Michael W. Malafronte |
| International Value Advisers, LLC |
| 717 Fifth Avenue |
| 10th Floor |
| New York, NY 10022 |
| | (Name and address of agent for service) |
| | Copy to: |
| | Michael S. Caccese, Esq. |
| K&L Gates LLP |
| State Street Financial Center |
| One Lincoln Street |
| Boston, Massachusetts 02111-2950 |
| | Brian F. Link, Esq. |
| State Street Bank and Trust Company |
| Mail Code: JHT 1593 |
| 200 Clarendon Street |
| Boston, MA 02116 |
| | | Registrant’s telephone number, including area code: (212) 584-3570 |
| | | Date of fiscal year end: September 30 |
| Date of reporting period: September 30, 2013 |
| Item 1. Report to Shareholders. |

| | |
|
|
|
| | |
IVA Worldwide Fund |
| | | IVA International Fund |
| | | |
| | | |
| | | |
| | | Annual Report |
| | | September 30, 2013 |
| | | |
| | | |
| | | |
| | | |
| | | |
| | | |
| | | |
Advised by International Value Advisers, LLC | | An investment in the Funds is not a bank deposit and is not insured or guaranteed by the Federal Deposit Insurance Corporation or any other government agency. |

| | 2 | | An Owner’s Manual |
| | 3 | | Letter from the President |
| | 4 | | Letter from the Portfolio Managers |
| | 7 | | Management’s Discussion of Fund Performance |
| | | | IVA Worldwide Fund |
| | 10 | | Performance |
| | 11 | | Portfolio Composition |
| | 12 | | Schedule of Investments |
| | | | IVA International Fund |
| | 22 | | Performance |
| | 23 | | Portfolio Composition |
| | 24 | | Schedule of Investments |
| | 32 | | Statements of Assets and Liabilities |
| | 33 | | Statements of Operations |
| | 34 | | Statements of Changes in Net Assets |
| | 35 | | Financial Highlights |
| | 41 | | Notes to Financial Statements |
| | 49 | | Report of Independent Registered Public Accounting Firm |
| | 50 | | Trustees and Officers |
| | 52 | | Additional Information |
| | 55 | | Fund Expenses |
| | 56 | | Important Tax Information |
| An Owner’s Manual | IVA Funds |
An Atypical Investment Strategy
We manage both the IVA Worldwide and IVA International Funds with a dual attempt that is unusual in the mutual fund world: in the short-term (12-18 months), our attempt is to try to preserve capital, while in the longer-term (5-10 years, i.e., over a full economic cycle), we attempt to perform better than the MSCI All Country World Index, in the case of your IVA Worldwide Fund, and the MSCI All Country World Ex-U.S. Index, in the case of your IVA International Fund.
The Worldwide Fund is typically used by investors who are looking for an “all weather fund” where we are given the latitude to decide how much we should have in the U.S. versus outside the U.S. The International Fund is typically used by investors who practice asset allocation and want to decide for themselves how much should be allocated to a domestic manager and how much should be allocated to a pure “international” (i.e., non-U.S.) manager, yet at the same time are looking for a lower risk – and lower volatility – exposure to international markets than may be obtained from a more traditional international fund.
We believe our investment approach is very different from the traditional approach of most mutual funds. We are trying to deliver returns that are as absolute as possible, i.e., returns that try to be as resilient as possible in down markets, while many of our competitors try to deliver good relative performance, i.e., try to beat an index, and thus would be fine with being down 15% if their benchmark is down 20%.
Why do we have such an unusual strategy (which, incidentally, is not easy to carry out)? Because we believe this strategy makes sense for many investors. We are fond of the quote by Mark Twain: “There are two times in a man’s life when he should not speculate: the first time is when he cannot afford to; the second time is when he can.” We realize that many investors cannot tolerate high volatility and appreciate that “life’s bills do not always come at market tops.” This strategy also appeals to us at International Value Advisers since we “eat our own cooking” for a significant part of our savings (invested in IVA products) and we have an extreme aversion to losing money.
An Eclectic Investment Approach
Here is how we try to implement our strategy:
| | | We don’t hug benchmarks. In practical terms, this means we are willing to make big “negative bets,” i.e., having nothing or little in what has become big in the benchmark. Conversely, we will generally seek to avoid overly large positive bets. |
| | | |
| | | We prefer having diversified portfolios (100 to 150 names). Because we invest on a global basis, we believe that diversification helps protect against weak corporate governance or insufficient disclosure, or simply against “unknown unknowns.” |
| | | |
| | | We like the flexibility to invest in small, medium and large companies, depending on where we see value. |
| | | |
| | | We attempt to capture equity-type returns through fixed income securities but predominantly when credit markets (or sub-sets of them) are depressed and offer this potential. |
| | | |
| | | We hold some gold, either in bullion form or via gold mining securities, as we feel it provides a good hedge in either an inflationary or deflationary period, and it can help mitigate currency debasement over time. |
| | | |
| | | We are willing to hold cash when we cannot find enough cheap securities that we like or when we find some, yet the broader market (Mr. Market) seems fully priced. We will seek to use that cash as ammunition for future bargains. |
| | | |
| | | At the individual security level, we ask a lot of questions about “what can go wrong?” and will establish not only a “base case intrinsic value” but also a “worst case scenario” (What could prove us wrong? If we were wrong, are we likely to lose 25%, 30%, or even more of the money invested?). As a result, we will miss some opportunities, yet hopefully, we will also avoid instances where we experience a permanent impairment of value. |
| Letter from the President | IVA Funds |
 | Dear Shareholder,
Your two mutual funds, the IVA Worldwide Fund and the IVA International Fund (“the Funds”), recently completed their fifth year of operation with both Funds outperforming their respective benchmark. The Funds’ investment adviser, International Value Advisers, LLC, (“IVA”) is pleased with the performance of both Funds since inception October 1, 2008 through September 30, 2013. Both the IVA Worldwide Fund Class A shares, at net asset value, and the IVA International Fund Class A shares, at net asset value, have significantly outperformed their benchmarks since inception (the MSCI All Country World Index (Net) and the MSCI All Country World (ex-U.S.) Index (Net); respectively). You can find a newsletter on the IVA website (www.ivafunds.com) titled “Five Years in Review” that describes this period of time for the Funds.
When IVA was founded in October of 2007, our primary objective was to build a firm where each of our employees understood that all of the work they do is to benefit the shareholder or client. We then are able to manage our firm and our clients’ assets with a very simple philosophy; which is, there is a pecking order to everything we do: client, firm, colleague, and then partner. This is always the progression. We have learned that if the client is taken care of, the other three fall into place; i.e., everything has to benefit the client. |
This client focus is the reason why we soft closed our products in 2011. We want our investment team to be market capitalization and asset class agnostic. So while our soft close, in some cases, may pose some operational challenges for a few of our existing advisors and shareholders, we are confident that the long term benefits far outweigh the risk and mediocrity that seem inevitable if a firm with our investment strategy grows too large. History suggests that money management firms whose asset size gets too big can experience unintended negative consequences, such as seeing their performance revert to the mean.
On a personal level, it has been a rewarding experience to help build IVA. We hope that in the process we are shaping a culture where everyone associated with IVA respects the work we are doing for our clients.
I want to offer thanks to all of my colleagues and to our shareholders for their continued support.
Sincerely,

Michael W. Malafronte, President
Effective February 22, 2011, the IVA Worldwide Fund and IVA International Fund are closed to new investors.
| Letter from the Portfolio Managers | IVA Funds |
 | October 31, 2013
Dear Shareholder,
First and foremost, we are proud and honored that we celebrated the five year anniversary of your IVA Funds at the close of this past quarter. As we explained in a recent newsletter (“Five Years in Review” October 2013, available on our website), our ability to protect on the downside was a large contributor to both our absolute and relative outperformance over this five-year period. Overall good stock picking equally played a significant part in achieving our goals. We are also privileged to work with a great team, both our investment team where we are helped by ten analysts and four traders, as well as our colleagues who support our overall business in operations, compliance, accounting, sales and marketing, human resources and technology. As for our clients who have entrusted their capital with our stewardship, we thank you for your support and allowing us to do what we love to do, and doing it in our idiosyncratic way. Come to think of it, we, too, are clients as the forty three of us working for International Value Advisers, LLC (“IVA”) have well north of $100 million of our own money in the Funds and other products we manage.
Over the period under review, October 1, 2012 to September 30, 2013, central banks around the world continued to drown markets in liquidity and manipulate government debt prices. In Japan, in particular, political changes led to the Bank of Japan (BoJ) announcing very aggressive “quantitative easing” exercises, buying long term Japanese government bonds as well as other assets.
Central banks have indeed been successful in lifting asset prices. As a result of both corporate profits reaching new highs around the world and price/earnings multiple expansion, the MSCI All Country World Index returned 17.73% over this same period, in spite of a correction late May and June 2013.
Even though we argued over the past year that equities would probably be the best house in a bad neighborhood, we have not been fully invested in equities and, in fact, we have reduced our allocation to equities and simultaneously raised our cash levels as the year progressed. We have refused to “walk the walk” because the “best house” argument remains a relative argument and we, at IVA, try to deliver returns that are as absolute as possible. Today there is a school of thought that holds that ultra-low interest rates (often negative in real terms, i.e. adjusted for inflation) eliminates the need for a value investor to insist on a reasonable margin of safety, justifying holding on to stocks when they become fully priced or buying new ones without much of a discount. The seductive appeal of this argument does not sit well with us and we accept the challenge of that heightened tension that exists today between protecting capital on one hand and preserving purchasing power on the other. We recently penned a newsletter (“The Optionality of Cash” June 2013, on our website) where we argue that cash can help protect the portfolio on the downside but can also act as dry powder to “pounce” once we find compelling bargains again. We welcomed the brief correction that took place from May 22, 2013 through late June 2013 and were able to do a little buying. But the rally has resumed and we have again become net sellers. Let us be clear: we do not intend to be “long term owners of cash” (Dylan Grice) and hope to exploit some of the volatility which we believe will be with us for a while.
In the “Management’s Discussion of Fund Performance” (pages 7-9 in this Annual Report) we quantify for both the IVA Worldwide Fund and the IVA International Fund how their respective equity components performed during this past fiscal year ended September 30, 2013. The significant outperformance this year, in contrast to the underperformance the previous year, illustrates vividly that individual stock picking is “alive and well,” even in |
| Letter from the Portfolio Managers | IVA Funds |
today’s world of globalization and increased correlations. We will simply reiterate what we wrote in last year’s Annual Report:
“…we believe that stock picking will make a big difference in this low return world for the foreseeable future, with a particular emphasis on trying to identify those companies that may maintain their high margins going forward and those that may not. That requires having a team of analysts whose work goes way beyond the number crunching and increasingly studies the finer qualitative aspects of a business. As Albert Einstein said, ‘not everything that can be counted counts, and not everything that counts can be counted.’”
We reckon that the economic prospects may be slowly improving for the U.S. economy, but note that the “patient” may no longer be on “life support” yet still needs “training wheels” (in the form of quantitative easing). Given the continued appreciation of U.S. stock indices, valuation is now quite steep among U.S. equities, especially if one allows for the fact that corporate profits are rather elevated.
In a recent speech to the Economic Club of New York, former Fed Chairman Paul Volcker recalled that he entered the system as a neophyte economist in 1949: “Most striking then, as now, the Federal Reserve was committed to maintaining a pattern of very low interest rates, ranging from close to zero at the short end to 2½ percent or less for Treasury bonds. If you feel a bit impatient about the situation now, quite understandably so, recall that the earlier episode lasted 15 years.” A propos today, Paul Volcker noted: “Beneficial effects of the actual and potential monetization of public and private debt, the essence of the quantitative easing program, appear limited and diminishing over time. The old “pushing on a string” analogy is relevant. The risks of encouraging speculative distortions and the inflationary potential of the current approach plainly deserve attention.”
In a story on Bloomberg News November 1, 2013 (“Federal Reserve’s bubble alarm stuck on snooze”), Jonathan Weil quotes Larry Fink (CEO of BlackRock Inc.): “…it is imperative that the Fed begins to taper… we have seen real bubble-like markets again”; Bill Gross (Pimco): “All risk asset prices are artificially high”; Netflix’s CEO Reed Hastings comparing his company’s stock performance with the “momentum – investor – fueled euphoria”; and Tesla’s CEO Elon Musk saying that his company had “a higher valuation than we have any right to deserve.”
We commented on Japan earlier (particularly a newsletter in March, “The Real Game Changer for Japanese Equities”). We are agnostic as to whether “Abenomics” will be successful but are very intrigued by the big changes we have seen in corporate Japan in terms of capital allocation: more and more dividends being raised; more and more stock buybacks and hopefully more corporate activity and willingness by management to pay a little more attention to shareholders than they have in the past. We trimmed our exposure there as the rally unfolded, and remain well hedged on our yen exposure.
Europe remains difficult for us. The eurozone economics are witnessing some degree of stability but many weaknesses remain (worsening public debt, costly credit, vulnerable banks…). While many crisis-hit economies have been able to go from big current account deficit situations to current account surplus, it remains unclear how sustainable these are. Additionally, in a Union where each Member carries veto powers, political changes play a large role that we find difficult, if not impossible, to handicap. We believe that the risk of an anti-euro government taking over in one member country continues to grow. Also, while job cuts have been significant, unit labor costs remain higher in Spain and Italy compared to those in Germany. Even Mario Draghi, the head of the European Central Bank (ECB), recently confessed to remaining “very, very cautious about the recovery. I cannot share the enthusiasm.” He added that the recovery was “weak, fragile and uneven and from low levels.” From a valuation level, what we find is a tale of two markets: banks,
| Letter from the Portfolio Managers | IVA Funds |
utilities and telecom companies have suffered tremendous and very fundamental setbacks since 2007 and are therefore down substantially, dragging indices down; while high quality, global companies headquartered in Europe tend to trade at all-time highs and be very pricey. In the middle you’ll find a number of cyclical companies with debt, usually not that cheap, and where balance sheets are far from pristine. We continue to look for opportunities in the Old Continent but without much success over the period.
Emerging markets have performed poorly over the period, which did not come as a surprise to us. We have had almost no direct investments in the BRIC countries (Brazil, Russia, India and China) in recent time. However, we made our first investment in Brazil over the period; we also added a few names listed in Hong Kong doing business exclusively in China. But these markets are not cheap enough for us to make large commitments. In China, in particular, we worry about massive misallocation of capital and a potentially moribund banking sector.
Despite the recent correction, we are finding no opportunities in high yield debt either. In fact, we are witnessing the mirror image of 2008-2009. At that time high yield bonds were offering very attractive opportunities, many with returns better than equities and with less risk. Our remaining high yield exposure is of short duration (overall less than 3 years) and is comprised mostly of remnants of investments made in previous years.
Gold has acted poorly since September 2011 – it topped around $1900/oz. Gold may be flagging more disinflation in the next few months, especially if China’s economic growth keeps decelerating. Gold is also reacting to the possibility that real interest rates may rise in the future in various currencies. We trimmed our gold exposure earlier in 2013 as our equity exposure kept going down while our cash levels were increasing. We are keeping our options open as to what to do next there, if anything. We are pleased to have avoided gold mining stocks as we grew increasingly alarmed by rising production costs in the industry.
In conclusion, we are encouraged by the performance of your Funds over the period despite being underinvested in equities. Stock picking has been good and our big picture views (being wary of China and emerging markets, for instance) were vindicated. Our focus remains on preservation of capital during these uncertain times, believing that one of the most effective ways to compound wealth over time is to minimize losses and drawdowns. Like Ulysses during his odyssey, we are determined to ignore the sirens. We will keep insisting on appropriate discounts when we buy and hold securities. While we realize that “the purgatory of low returns” (James Montier) is not fun, we think that the challenges associated with that environment are much harder for our end clients and for the advisers that help those clients than they are for us. On our end, we are simply trying to remain disciplined and opportunistic but certainly will not change our ways on the basis that “this time is different.” On the contrary, we think that following time tested rules and principles will help us navigate the environment we are in.
We appreciate your continued confidence and thank you for your support.

Charles de Vaulx, Chief Investment Officer and Portfolio Manager

Chuck de Lardemelle, Portfolio Manager
| Management’s Discussion of Fund Performance (unaudited) | IVA Funds |
Global equity markets delivered double-digit gains over this one year period, propelled by artificially low interest rates resulting from quantitative easing, and record high corporate profit margins. Equity markets temporarily corrected from May 22, 2013 to late June 2013 when the Federal Reserve indicated it might scale back its bond buying program later this year if the U.S. economy continues to improve and the unemployment rate falls below 7%. This boosted the yield on the 10-year U.S. Treasury note from 1.63% in early-May 2013 to 2.62% on September 30, 2013.
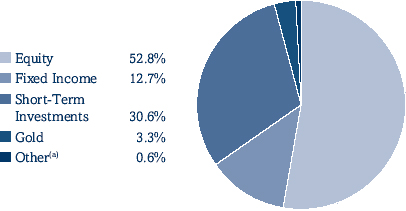
As global equity markets appreciated over this period and some of our holdings got closer to or even reached our intrinsic value estimate, we trimmed or sold out of those positions. This brought our total equity exposure down to 52.8% on September 30, 2013 from 63.0% on September 30, 2012 in the IVA Worldwide Fund, and to 54.3% from 57.1%, respectively, in the IVA International Fund. As a result, our total cash exposure rose in both Funds, to 30.6% in the IVA Worldwide Fund and to 27.5% in the IVA International Fund at period end. Even though both Funds were, on average, less than 60% invested in equities over this one year period, both Funds delivered solid absolute returns and kept close pace with their respective equity benchmark due to good stock picking.
Our Japanese equity exposure fell to 8.6% on September 30, 2013 from 12.1% on September 30, 2012 in the IVA Worldwide Fund and to 16.9% from 21.0%, respectively, in the IVA International Fund. Japanese equity markets have been rising since November 2012 when Shinzo Abe was reelected as Prime Minister with an agenda to pursue aggressive monetary policies to weaken the Japanese yen and engineer inflation. Over the period, we sold or reduced our exposure to a number of holdings (such as Temp Holdings Co., Ltd.).
In the IVA Worldwide Fund, our U.S. equity exposure fell to 24.1% at period end from 30.7% on September 30, 2012. We sold a few positions that we believe reached full valuation such as Applied Materials, Inc. and Texas Instruments Inc.
Even though we were net sellers of equities over the year, primarily in the U.S. and Japan, we found a few opportunities in emerging market equities, specifically in Brazil and China (through Hong Kong listed equities) and we increased our exposure to a South Korean holding, E-Mart Co., Ltd. We also increased our exposure to a few holdings that we view as high quality yet reasonably priced such as Nestlé SA in Switzerland and Oracle Corp. in the U.S.
We still view gold as a hedge against extreme outcomes, inflation or deflation, and it also helps to protect against the effects of currency debasement. Over the period we sold our small allocation to gold mining stocks, therefore our exposure at period end consisted solely of gold bullion. As our equity exposure came down and cash levels increased, we reduced our gold exposure over the period to 3.3% in IVA Worldwide and 3.2% in IVA International on September 30, 2013, from 5.2% in IVA Worldwide and 5.1% in IVA International on September 30, 2012. Over the year our exposure to gold was one of the largest detractors from both Funds’ returns. It detracted -1.9% from the IVA Worldwide Fund return and -2.0% from the IVA International Fund return.
Within fixed income, a few of our corporate bonds were called over the period, predominantly in the U.S., as most of our exposure is comprised of remnants of our investments from 2008/2009. Our corporate bond exposure totaled 6.8% of the IVA Worldwide Fund as of September 30, 2013 compared to 9.2% on September 30, 2012, and in the IVA International Fund, our exposure totaled 6.2% versus 7.3%, respectively.
| Management’s Discussion of Fund Performance (unaudited) | IVA Funds |
IVA Worldwide Fund
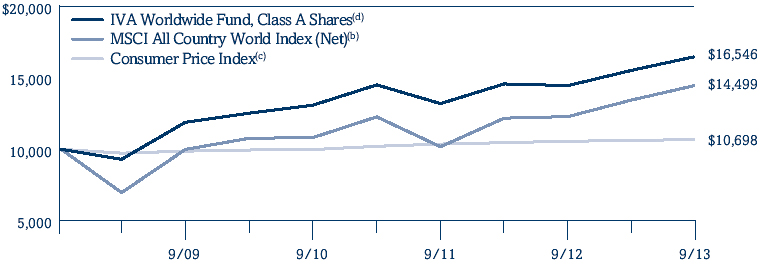
The IVA Worldwide Fund Class A, at net asset value, returned 14.02% over the one year period ending September 30, 2013 compared to the MSCI All Country World Index (Net) (the “Index”) return of 17.73% over the same period.
Because of good stock picking, particularly in the technology sector as well as the U.S. and France, our equities (ex-gold mining stocks) averaged a gain of 29.0% over the period versus the Index (ex-gold mining stocks) average return of 18.3%. By sector, our technology and industrials stocks contributed meaningfully to our return, adding 7.1%, due, in part, to solid gains from Bollore SA (industrials, France) and Temp Holdings Co., Ltd. (industrials, Japan). MasterCard Inc. Class ‘A’ (technology, U.S.) was also a key contributor to our return. There were no equity sectors that detracted from our return over the year, however, our significant underweight exposure to financials and health care stocks weighed on relative results. These two sectors added 7.4% to the Index return versus only 1.2% to the IVA Worldwide Fund return.
Geographically, our stocks in the U.S. and France added the most to our return, together 11.8% versus those in the Index adding 10.0%. We benefited from strong security selection in both countries (in particular our U.S. stocks averaged a return of 31.1% versus the Index at 19.2%) as well as overweight exposure to stocks in France. Berkshire Hathaway Inc. Class ‘A’, Class ‘B’ (holding company, U.S.) and The Washington Post Company Class ‘B’ (consumer discretionary, U.S.) were among our top five contributors to return. All equity countries contributed positively to our return this period, however, our Japanese equities underperformed those in the benchmark as we own mostly local, non-exporting stocks.
Within fixed income, our corporate bonds averaged a gain of 11.3% due to good performance from our Wendel bonds, which were among our top five contributors to return as they collectively added 0.6%. Our sovereign bonds averaged a return of -1.9% over the period and detracted about -0.1% from our return.
Our forward foreign currency contracts, which are used to hedge currency risk, contributed about 0.6% to our return, mainly due to our Japanese yen hedge which averaged 40% of our total yen exposure over the year.
The largest individual detractors from our return this period included: gold bullion (gold), IAMGOLD Corporation (gold mining), Benesse Holdings Inc. (consumer discretionary, Japan), Singapore government bonds (sovereign debt), Newcrest Mining Limited (gold mining), and Devon Energy Corp. (energy, U.S.).
IVA International Fund
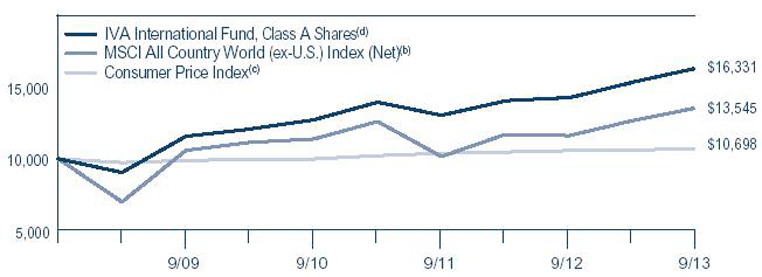
The IVA International Fund Class A, at net asset value, returned 14.09% over the one year period ending September 30, 2013 compared to the MSCI All Country World (ex-U.S.) Index (Net) (the “Index”) return of 16.48% over the same period.
Our equities (ex-gold mining stocks) averaged a return of 28.6% versus the Index (ex-gold mining stocks) average return of 17.5%. Security selection within the industrials sector was a significant plus, as these stocks collectively averaged a gain of 47.0% compared to the Index at 24.3%, and added 4.6% to our return. A number of the Fund’s top contributors to return were in this sector and included: Temp Holdings Co., Ltd. (industrials, Japan), Teleperformance SA (industrials, France), Bollore SA (industrials, France), and Financière de I’Odet SA (industrials, France). Because of our overweight exposure and strong performance, our consumer discretionary stocks added 3.7% to our return. All equity sectors contributed positively to our return over the period, however, our underweight exposure to the financials and health care sectors detracted from relative results as these two sectors added 7.4% to the Index return versus 1.4% to our return.
| Management’s Discussion of Fund Performance (unaudited) | IVA Funds |
Our allocation to France provided the largest contribution to return, with our holdings averaging a return of 43.5% versus the Index average return of 32.0%, and added 6.5% to performance. This was led by good performance from a few industrials stocks mentioned above. Even though our Japanese equities underperformed those in the Index with an average return of 20.1% versus 31.5% respectively, as we own mostly local, non-exporting stocks, they still added 3.7% to our return in U.S. dollars. The only countries to detract from our return this period were India and Mexico, together almost -0.1%.
Within fixed income, our corporate bonds averaged a gain of 11.9% due to good performance from our Wendel bonds, which were among our top five contributors to return as they collectively added 0.5%. Our sovereign bonds averaged a return of -1.7% over the period and detracted about -0.2% from our return.
Our forward foreign currency contracts, which are used to hedge currency risk, contributed about 1.8% to our return, mainly due to our Japanese yen hedge which averaged 50% of our total yen exposure over the year.
The largest individual detractors from our return this period included: gold bullion (gold), IAMGOLD Corporation (gold mining), Benesse Holdings Inc. (consumer discretionary, Japan), Newcrest Mining Limited (gold mining), and Singapore government bonds (sovereign debt).
Investment Risks: There are risks associated with investing in funds that invest in securities of foreign countries, such as erratic market conditions, economic and political instability and fluctuations in currency exchange rates. Value-based investments are subject to the risk that the broad market may not recognize their intrinsic value.
| IVA Worldwide Fund | IVA Funds |
| Performance (unaudited) | As of September 30, 2013 |
| Average Annual Total Returns as of September 30, 2013(a) | | One Year | | Five Year/
Since Inception(a) |
| | | | | |
| Class A | | | 14.02 | % | | | | 11.73 | % | |
| Class A (with a 5% maximum initial sales charge) | | | 8.33 | % | | | | 10.60 | % | |
| Class C | | | 13.13 | % | | | | 10.89 | % | |
| Class I | | | 14.28 | % | | | | 12.00 | % | |
| MSCI All Country World Index (Net)(b) | | | 17.73 | % | | | | 7.71 | % | |
| Consumer Price Index(c) | | | 1.18 | % | | | | 1.36 | % | |
| Growth of a $10,000 Initial Investment | |
| |
| (a) | The Fund commenced investment operations on October 1, 2008. |
| (b) | The MSCI All Country World Index (Net) is an unmanaged, free float-adjusted market capitalization weighted index composed of stocks of companies located in countries throughout the world. It is designed to measure equity market performance in global developed and emerging markets. The index includes reinvestment of dividends, net of foreign withholding taxes. Please note that an investor cannot invest directly in an index. |
| (c) | The Consumer Price Index examines the weighted average of prices of a basket of consumer goods and services, such as transportation, food and medical care. Please note that an investor cannot invest directly in an index. |
| (d) | Hypothetical illustration of $10,000 invested in Class A shares on October 1, 2008, assuming the deduction of the maximum initial sales charge of 5% at the time of investment for Class A shares and the reinvestment of all distributions, including returns of capital, if any, at net asset value through September 30, 2013. The performance of the Fund’s other classes may be greater or less than the Class A shares’ performance indicated on this chart depending on whether greater or lesser sales charges and fees were incurred by shareholders investing in the other classes. |
Past performance is no guarantee of future results. The performance data quoted represents past performance and current returns may be lower or higher. The investment return and principal value will fluctuate so that an investor’s shares, when redeemed, may be worth more or less than the original cost. The returns do not reflect the deduction of taxes that a shareholder would pay on Fund distributions or the redemption of Fund shares. To obtain performance information current to the most recent month-end, please call 866-941-4482.
The maximum sales charge for Class A shares is 5.00%. Class C shares may include a 1.00% contingent deferred sales charge for the first year only. Shares redeemed within 30 days of purchase may be subject to a 2.00% redemption fee. The expense ratios for the Fund are as follows: 1.28% (Class A shares); 2.03% (Class C shares); and 1.03% (Class I shares). These expense ratios are as stated in the most recent Prospectus dated January 31, 2013. More recent expense ratios can be found in the Financial Highlights section of this Annual Report.
| IVA Worldwide Fund | IVA Funds |
| Portfolio Composition (unaudited) | As of September 30, 2013 |
| Asset Allocation (As a Percent of Total Net Assets) | |
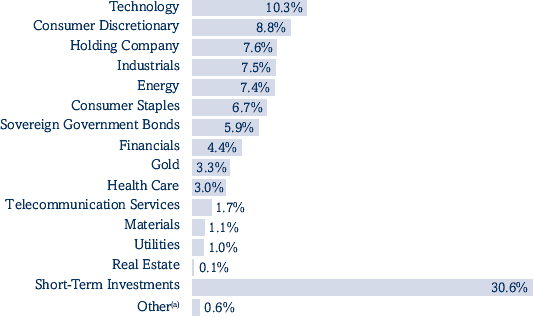
| Sector Allocation (As a Percent of Total Net Assets) | |
| Top 10 Positions (As a Percent of Total Net Assets)(b) | |
Government of Singapore, 3.625% due 7/1/2014, 2.875% due 7/1/2015, 3.75% due 9/1/2016 | | | 4.8 | % |
| |
Wendel, 4.875% due 5/26/2016, 4.375% due 8/9/2017, 6.75% due 4/20/2018 | | | 3.9 | % |
| |
| Gold Bullion | | | 3.3 | % |
| |
| Nestlé SA | | | 3.2 | % |
| |
| Astellas Pharma Inc. | | | 2.8 | % |
| |
| Berkshire Hathaway Inc., Class ‘A’, Class ‘B’ | | | 2.6 | % |
| |
| Devon Energy Corp. | | | 2.6 | % |
| |
| Genting Malaysia Berhad | | | 2.1 | % |
| |
| Oracle Corp. | | | 2.1 | % |
| |
| Expeditors International of Washington Inc. | | | 1.6 | % |
| |
| Top 10 positions represent 29.0% of total net assets. |
| (a) | Other represents unrealized gains and losses on options, forward foreign currency contracts and other assets and liabilities. |
| (b) | Short-Term Investments are not included. |
| IVA Worldwide Fund | IVA Funds |
Schedule of Investments
September 30, 2013 |
|
| | | | SHARES | | DESCRIPTION | | | FAIR VALUE |
| COMMON STOCKS – 51.7% | | | | |
| | | | | | | | | |
| Belgium | 0.3% | | | | | | | | |
| | | | 281,848 | | Sofina SA | | $ | 27,705,127 |
| |
| | | | | | | | | |
| |
| Brazil | 0.5% | | | | | | | | |
| | | | 3,105,414 | | Itaú Unibanco Holding SA, ADR | | | 43,848,446 |
| |
| | | | | | | | | |
| |
| China | 0.6% | | | | | | | | |
| | | | 15,826,640 | | Clear Media Ltd. (a) | | | 10,407,027 |
| |
| | | | 17,593,000 | | Digital China Holdings Ltd. | | | 21,549,208 |
| |
| | | | 25,576,000 | | Uni-President China Holdings Ltd. | | | 25,655,473 |
| |
| | | | | | | | | 57,611,708 |
| | | | | | | | |
| | | | | | | | | |
| |
| Denmark | 0.0% | | | | | | | | |
| | | | 105,523 | | D/S Norden A/S | | | 4,450,145 |
| |
| | | | | | | | | |
| |
| France | 7.2% | | | | | | | | |
| | | | 647,987 | | Alten | | | 27,745,324 |
| |
| | | | 175,516 | | Bolloré | | | 91,725,738 |
| |
| | | | 434,240 | | Cap Gemini SA | | | 25,830,695 |
| |
| | | | 603,762 | | Carrefour SA | | | 20,726,292 |
| |
| | | | 257,540 | | Ciments Français SA | | | 17,755,132 |
| |
| | | | 340,256 | | Eutelsat Communications Group, SA | | | 10,757,573 |
| |
| | | | 38,935 | | Financière de l’Odet SA | | | 39,238,925 |
| |
| | | | 69,300 | | Financière Marc de Lacharriere SA | | | 3,693,850 |
| |
| | | | 3,724,875 | | GDF Suez SA | | | 93,577,922 |
| |
| | | | 850,843 | | Lagardère SCA | | | 27,631,275 |
| |
| | | | 81,709 | | Publicis Groupe SA | | | 6,501,966 |
| |
| | | | 92,497 | | Robertet SA (a) | | | 18,645,057 |
| |
| | | | 60,007 | | Séché Environnement SA | | | 2,228,405 |
| |
| | | | 912,717 | | Sodexo SA | | | 85,162,060 |
| |
| | | | 935,034 | | Teleperformance | | | 45,235,011 |
| |
| | | | 672,369 | | Thales SA | | | 36,962,194 |
| |
| | | | 1,106,048 | | Total SA, ADR | | | 64,062,300 |
| | | | 2,010,186 | | Vivendi SA | | | 46,244,775 |
| |
| | | | | | | | | 663,724,494 |
| | | | | | | | |
| | | | | | | | | |
| |
| Germany | 0.6% | | | | | | | | |
| | | | 432,232 | | Siemens AG | | | 52,077,413 |
| |
| | | | 63,350 | | Wincor Nixdorf AG | | | 3,956,054 |
| |
| | | | | | | | | 56,033,467 |
| | | | | | | | |
| | | | | | | | | |
| |
| Japan | 8.6% | | | | | | | | |
| | | | 5,095,800 | | Astellas Pharma Inc. | | | 259,209,522 |
| |
| | | | 1,428,700 | | Azbil Corp. | | | 33,124,852 |
| |
| | | | 1,182,600 | | Benesse Holdings Inc. | | | 42,951,137 |
| |
| | | | 2,535,700 | | Cosel Co., Ltd. (a)(b) | | | 30,724,032 |
| |
| | | | 944,700 | | Icom Inc. (a)(b) | | | 22,326,040 |
| |
| | | | 770,470 | | Kose Corp. | | | 22,260,896 |
| |
| | | | 213,800 | | Medikit Co., Ltd. (a) | | | 7,177,781 |
| |
| 12 | See Notes to Financial Statements. |
| IVA Worldwide Fund | IVA Funds |
Schedule of Investments
September 30, 2013 |
|
| | | | SHARES | | DESCRIPTION | | | FAIR VALUE |
| | | | | | | | | |
| | | | | | | | | |
| |
| Japan | 8.6% (continued) | | | | | | | | |
| | | | 1,074,100 | | Meitec Corp. | | $ | 30,902,435 |
| |
| | | | 42,300 | | Milbon Co., Ltd. | | | 1,732,107 |
| |
| | �� | | 3,128,504 | | Miura Co., Ltd. (b) | | | 86,030,279 |
| |
| | | | 578,400 | | Nifco Inc. | | | 15,440,476 |
| |
| | | | 96,000 | | Nintendo Co., Ltd. | | | 10,870,136 |
| |
| | | | 183,800 | | Nitto Kohki Co., Ltd. | | | 3,444,322 |
| |
| | | | 1,184,300 | | NTT DoCoMo, Inc. | | | 19,181,094 |
| |
| | | | 436,900 | | Okinawa Cellular Telephone Co. | | | 11,103,069 |
| |
| | | | 1,162,900 | | Secom Co., Ltd. | | | 72,640,582 |
| |
| | | | 367,488 | | Shofu Inc. | | | 3,308,682 |
| |
| | | | 113,200 | | Sugi Holdings Co., Ltd. | | | 4,848,385 |
| |
| | | | 262,500 | | Techno Medica Co., Ltd. | | | 5,776,362 |
| |
| | | | 1,072,200 | | Temp Holdings Co., Ltd. | | | 27,029,977 |
| |
| | | | 2,110,600 | | Toho Co., Ltd. | | | 43,931,915 |
| |
| | | | 6,060,600 | | Yahoo Japan Corp. | | | 34,343,092 |
| |
| | | | | | | | | 788,357,173 |
| | | | | | | | |
| | | | | | | | | |
| |
| Malaysia | 2.1% | | | | | | | | |
| | | | 148,186,000 | | Genting Malaysia Berhad | | | 191,853,020 |
| |
| | | | | | | | | |
| |
| Norway | 0.7% | | | | | | | | |
| | | | 8,931,624 | | Orkla ASA | | | 65,057,187 |
| |
| | | | | | | | | |
| |
| Singapore | 0.0% | | | | | | | | |
| | | | 148,325 | | United Overseas Bank Ltd. | | | 2,443,807 |
| |
| | | | | | | | | |
| |
| South Africa | 0.8% | | | | | | | | |
| | | | 6,006,359 | | Net 1 U.E.P.S. Technologies Inc. (b)(c) | | | 72,136,372 |
| |
| | | | | | | | | |
| |
| South Korea | 2.6% | | | | | | | | |
| | | | 397,058 | | E-Mart Co., Ltd. | | | 89,411,251 |
| |
| | | | 1,745,970 | | Kangwon Land, Inc. | | | 46,302,506 |
| |
| | | | 37,054 | | Lotte Chilsung Beverage Co., Ltd. | | | 58,511,306 |
| |
| | | | 27,171 | | Lotte Confectionery Co., Ltd. | | | 43,107,502 |
| |
| | | | | | | | | 237,332,565 |
| | | | | | | | |
| | | | | | | | | |
| |
| Switzerland | 4.1% | | | | | | | | |
| | | | 68,115 | | APG SGA SA | | | 18,076,630 |
| |
| | | | 4,220,716 | | Nestlé SA | | | 295,195,761 |
| |
| | | | 116,420 | | Schindler Holding AG | | | 17,481,988 |
| |
| | | | 2,172,472 | | UBS AG | | | 44,441,568 |
| |
| | | | | | | | | 375,195,947 |
| | | | | | | | |
| | | | | | | | | |
| |
| Taiwan | 0.1% | | | | | | | | |
| | | | 2,561,000 | | Taiwan Secom Co., Ltd. | | | 6,132,472 |
| |
| | | | | | | | | |
| |
| United Kingdom | 0.5% | | | | | | | | |
| | | | 5,149,695 | | Millennium & Copthorne Hotels Plc | | | 46,269,497 |
| |
| See Notes to Financial Statements. | 13 |
| IVA Worldwide Fund | IVA Funds |
Schedule of Investments
September 30, 2013 |
|
| | | | SHARES | | DESCRIPTION | | | FAIR VALUE |
| | | | | | | | | |
| | | | | | | | | |
| |
| United States | 23.0% | | | | | | | | |
| | | | 1,237,876 | | Amdocs Ltd. | | $ | 45,355,777 |
| |
| | | | 2,398,368 | | Annaly Capital Management Inc. | | | 27,773,101 |
| |
| | | | 1,177,836 | | Aon Plc | | | 87,678,112 |
| |
| | | | 1,400,704 | | Baker Hughes Inc. | | | 68,774,566 |
| |
| | | | 1,339 | | Berkshire Hathaway Inc., Class ‘A’ (c) | | | 228,178,990 |
| |
| | | | 100,464 | | Berkshire Hathaway Inc., Class ‘B’ (c) | | | 11,403,669 |
| |
| | | | 505,024 | | Cimarex Energy Co. | | | 48,684,314 |
| |
| | | | 899,866 | | CVS Caremark Corp. | | | 51,067,395 |
| |
| | | | 4,088,040 | | Devon Energy Corp. | | | 236,125,190 |
| |
| | | | 1,847,155 | | DeVry Inc. | | | 56,449,057 |
| |
| | | | 1,044,320 | | Energen Corp. | | | 79,775,605 |
| |
| | | | 3,278,171 | | Expeditors International of Washington Inc. | | | 144,436,214 |
| |
| | | | 266,653 | | Goldman Sachs Group, Inc. | | | 42,187,171 |
| |
| | | | 79,863 | | Google Inc., Class ‘A’ (c) | | | 69,952,800 |
| |
| | | | 1,341,896 | | Hewlett-Packard Co. | | | 28,152,978 |
| |
| | | | 3,032,782 | | Ingram Micro Inc., Class ‘A’ (c) | | | 69,905,625 |
| |
| | | | 1,363,042 | | Liberty Interactive Corp., Series ‘A’ (c) | | | 31,990,596 |
| |
| | | | 690,229 | | Marsh & McLennan Cos., Inc. | | | 30,059,473 |
| |
| | | | 183,660 | | MasterCard Inc., Class ‘A’ | | | 123,562,775 |
| |
| | | | 2,999,705 | | Microsoft Corp. | | | 99,920,173 |
| |
| | | | 32,046 | | National CineMedia, Inc. | | | 604,387 |
| |
| | | | 273,079 | | News Corp., Class ‘B’ (c) | | | 4,486,688 |
| |
| | | | 1,082,005 | | Occidental Petroleum Corp. | | | 101,210,748 |
| |
| | | | 5,687,640 | | Oracle Corp. | | | 188,659,019 |
| |
| | | | 388,589 | | SEACOR Holdings Inc. | | | 35,143,989 |
| |
| | | | 668,659 | | Sealed Air Corp. | | | 18,180,838 |
| |
| | | | 3,645,033 | | Spansion, Inc., Class ‘A’ (b)(c) | | | 36,778,383 |
| |
| | | | 780,047 | | Telephone & Data Systems, Inc. | | | 23,050,389 |
| |
| | | | 149,199 | | The Washington Post Co., Class ‘B’ | | | 91,212,809 |
| |
| | | | 1,092,319 | | Twenty-First Century Fox Inc., Class ‘B’ | | | 36,483,455 |
| |
| | | | | | | | | 2,117,244,286 |
| | | | | | | | |
| | | | | | TOTAL COMMON STOCKS | | | |
| | | | | | (Cost — $3,665,267,691) | | | 4,755,395,713 |
| |
| | | | | | | | | |
| PREFERRED STOCKS – 0.7% |
| | | | | | | | | |
| |
| United States | 0.7% | | | | | | | | |
| | | | | | American Capital Agency Corp., | | | |
| | | 197,675 | USD | | Series ‘A’, 8% due 4/5/2017 (d) | | | 5,060,480 |
| |
| | | | | | Annaly Capital Management Inc.: | | | |
| | | 592,037 | USD | | Series ‘C’, 7.625% due 5/16/2017 (d) | | | 14,179,286 |
| |
| | | 722,129 | USD | | Series ‘D’, 7.5% due 9/13/2017 (d) | | | 16,933,925 |
| |
| | | | | | Apollo Residential Mortgage Inc., Series ‘A’, | | | |
| | | 371,500 | USD | | 8% due 9/20/2017 (d) | | | 8,574,220 |
| |
| | | | | | Capstead Mortgage Corp., Series ‘E’, | | | |
| | | 99,109 | USD | | 7.5% due 5/13/2018 (d) | | | 2,369,696 |
| |
| | | | | | CYS Investments Inc.: | | | |
| | | 13,221 | USD | | Series ‘A’, 7.75% due 8/3/2017 (d) | | | 298,530 |
| |
| | | 88,918 | USD | | Series ‘B’, 7.5% due 4/30/2018 (d) | | | 1,853,051 |
| |
| 14 | See Notes to Financial Statements. |
| IVA Worldwide Fund | IVA Funds |
Schedule of Investments
September 30, 2013 |
|
| | | | SHARES | | | DESCRIPTION | | | FAIR VALUE |
| | | | | | | | | | |
| | | | | | | | | | |
| |
| United States | 0.7% (continued) | | | | | | | | | |
| | | | | | | Hatteras Financial Corp., Series ‘A’, | | | |
| | | | 556,125 | USD | | 7.625% due 8/27/2017 (d) | | $ | 12,679,650 |
| |
| | | | | | | MFA Financial Inc., Series ‘B’, | | | |
| | | | 74,302 | USD | | 7.5% due 4/15/2018 (d) | | | 1,708,946 |
| |
| | | | | | | TOTAL PREFERRED STOCKS | | | |
| | | | | | | (Cost — $64,989,926) | | | 63,657,784 |
| |
| | | | | | | | | | |
| CONVERTIBLE PREFERRED STOCK – 0.4% |
| | | | | | | | | | |
| |
| United States | 0.4% | | | | | | | | | |
| | | | | | | Bank of America Corp., | | | |
| | | | 36,288 | USD | | Series ‘L’, 7.25% | | | 39,191,040 |
| |
| | | | | | | TOTAL CONVERTIBLE | | | |
| | | | | | | PREFERRED STOCK | | | |
| | | | | | | (Cost — $28,023,838) | | | 39,191,040 |
| |
| | | PRINCIPAL | | | | | | |
| | | AMOUNT | | | | | | |
| | | | | | | | | | |
| CORPORATE NOTES & BONDS – 6.8% |
| | | | | | | | | | |
| |
| France | 3.9% | | | | | | | | | |
| | | | | | | Wendel: | | | |
| | | | 35,100,000 | EUR | | 4.875% due 5/26/2016 (e) | | | 50,220,190 |
| |
| | | | 116,950,000 | EUR | | 4.375% due 8/9/2017 | | | 165,572,898 |
| |
| | | | 95,400,000 | EUR | | 6.75% due 4/20/2018 | | | 145,549,596 |
| |
| | | | | | | | | | 361,342,684 |
| | | | | | | | | |
| | | | | | | | | | |
| |
| Norway | 0.3% | | | | | | | | | |
| | | | | | | Golden Close Maritime Corp. Ltd., | | | |
| | | | 24,489,696 | USD | | 11% due 12/9/2015 (a) | | | 25,928,466 |
| |
| | | | | | | | | | |
| |
| Switzerland | 0.3% | | | | | | | | | |
| | | | 8,800,000 | EUR | | UBS AG, 7.152% due 12/21/2017 (f) | | | 13,169,999 |
| |
| | | | | | | UBS Preferred Funding Trust V, | | | |
| | | | 8,892,000 | USD | | 6.243% due 5/15/2016 (f) | | | 9,503,325 |
| |
| | | | | | | | | | 22,673,324 |
| | | | | | | | | |
| | | | | | | | | | |
| |
| United Kingdom | 0.2% | | | | | | | | | |
| | | | | | | Inmarsat Finance Plc, | | | |
| | | | 19,300,000 | USD | | 7.375% due 12/1/2017 (e) | | | 20,313,250 |
| |
| | | | | | | | | | |
| |
| United States | 2.1% | | | | | | | | | |
| | | | | | | Brandywine Operating Partnership, LP, | | | |
| | | | 6,070,000 | USD | | 5.7% due 5/1/2017 | | | 6,697,893 |
| |
| | | | | | | Cloud Peak Energy Resources LLC, | | | |
| | | | 18,309,000 | USD | | 8.5% due 12/15/2019 | | | 19,865,265 |
| |
| | | | | | | Intelsat Luxembourg SA, | | | |
| | | | 24,975,000 | USD | | 7.75% due 6/1/2021 (e) | | | 25,942,781 |
| |
| | | | | | | Leucadia National Corp., | | | |
| | | | 3,418,000 | USD | | 8.125% due 9/15/2015 | | | 3,802,525 |
| |
| | | | | | | Level 3 Financing Inc., | | | |
| | | | 1,740,000 | USD | | 10% due 2/1/2018 | | | 1,870,500 |
| |
| See Notes to Financial Statements. | 15 |
| IVA Worldwide Fund | IVA Funds |
Schedule of Investments
September 30, 2013 |
|
| | | PRINCIPAL | | | | | | |
| | | AMOUNT | | | DESCRIPTION | | | FAIR VALUE |
| | | | | | | | | | |
| | | | | | | | | | |
| |
| United States | 2.1% (continued) | | | | | | | | | |
| | | | | | | MetroPCS Wireless Inc., | | | |
| | | | 6,961,000 | USD | | 7.875% due 9/1/2018 | | $ | 7,552,685 |
| |
| |
| | | | | | | MFA Financial Inc., | | | |
| | | | 26,434 | USD | | 8% due 4/15/2042 (g) | | | 671,159 |
| |
| | | | | | | Mohawk Industries Inc., | | | |
| | | | 37,016,000 | USD | | 6.375% due 1/15/2016 (h) | | | 40,856,410 |
| |
| | | | | | | QVC Inc., | | | |
| | | | 31,121,000 | USD | | 7.5% due 10/1/2019 (e) | | | 33,499,765 |
| |
| | | | | | | Sealed Air Corp., | | | |
| | | | 38,288,000 | USD | | 8.125% due 9/15/2019 (e) | | | 42,882,560 |
| |
| | | | | | | Vulcan Materials Co., | | | |
| | | | 6,660,000 | USD | | 7% due 6/15/2018 | | | 7,542,450 |
| |
| | | | | | | | | | 191,183,993 |
| | | | | | | | | |
| | | | | | | TOTAL CORPORATE NOTES & BONDS | | | |
| | | | | | | (Cost — $544,981,242) | | | 621,441,717 |
| |
| | | | | | | | | | |
| SOVEREIGN GOVERNMENT BONDS – 5.9% | | | | | |
| | | | | | | | | | |
| |
| Hong Kong | 1.0% | | | | | | | | | |
| | | | | | | Government of Hong Kong, | | | |
| | | | 669,700,000 | HKD | | 1.52% due 12/21/2015 | | | 88,517,936 |
| |
| | | | | | | | | | |
| |
| Singapore | 4.8% | | | | | | | | | |
| | | | | | | Government of Singapore: | | | |
| |
| | | | 146,342,000 | SGD | | 3.625% due 7/1/2014 | | | 119,553,791 |
| |
| | | | 194,412,000 | SGD | | 2.875% due 7/1/2015 | | | 161,841,811 |
| |
| | | | 188,328,000 | SGD | | 3.75% due 9/1/2016 | | | 164,558,936 |
| |
| | | | | | | | | | 445,954,538 |
| | | | | | | | | |
| | | | | | | | | | |
| |
| Taiwan | 0.1% | | | | | | | | | |
| | | | | | | Government of Taiwan, | | | |
| | | | 349,300,000 | TWD | | 2% due 7/20/2015 | | | 12,074,507 |
| |
| | | | | | | TOTAL SOVEREIGN GOVERNMENT BONDS | | |
| | | | | | | (Cost — $541,346,663) | | | 546,546,981 |
| |
| | | | OUNCES | | | | | | |
| | | | | | | | | | |
| COMMODITIES – 3.3% | | | | | | | | | |
| | | | 226,914 | | | Gold Bullion (c) | | | 301,344,659 |
| |
| | | | | | | TOTAL COMMODITIES | | | |
| | | | | | | (Cost — $337,823,164) | | | 301,344,659 |
| |
| | | | PRINCIPAL | | | | | | |
| | | | AMOUNT | | | | | | |
| | | | | | | | | | |
| SHORT-TERM INVESTMENTS – 30.6% | | | | | |
| | | | | | | | | | |
| |
| Commercial Paper | 30.2% | | | | | | | | | |
| | | | | | | Air Liquide US LLC: | | | |
| | | | 63,000,000 | USD | | 0.09% due 10/7/2013 (e) | | | 62,999,055 |
| |
| | | | 65,000,000 | USD | | 0.08% due 10/23/2013 (e) | | | 64,996,822 |
| |
| 16 | See Notes to Financial Statements. |
| IVA Worldwide Fund | IVA Funds |
Schedule of Investments
September 30, 2013 |
|
| | | PRINCIPAL | | | | | | |
| | | AMOUNT | | | DESCRIPTION | | | FAIR VALUE |
| | | | | | | | | | |
| | | | | | | | | | |
| |
| Commercial Paper | 30.2% (continued) | | | | | | | | | |
| | | | | | | American Honda Finance Corp., | | | |
| | | | 35,000,000 | USD | | 0.09% due 10/7/2013 (e) | | $ | 34,999,475 |
| |
| | | | 15,000,000 | USD | | AT&T Inc., 0.24% due 10/28/2013 (e) | | | 14,997,300 |
| |
| | | | 15,200,000 | USD | | Coca-Cola Co., 0.04% due 10/4/2013 (e) | | | 15,199,949 |
| |
| | | | | | | Coca-Cola Enterprises, Inc.: | | | |
| | | | 13,500,000 | USD | | 0.16% due 10/1/2013 (e) | | | 13,500,000 |
| |
| | | | 13,100,000 | USD | | 0.16% due 10/7/2013 (e) | | | 13,099,651 |
| |
| | | | 30,700,000 | USD | | 0.16% due 10/28/2013 (e) | | | 30,696,316 |
| |
| | | | | | | Consolidated Edison Co. Inc.: | | | |
| | | | 38,700,000 | USD | | 0.2% due 10/3/2013 (e) | | | 38,699,570 |
| |
| | | | 58,600,000 | USD | | 0.2% due 10/7/2013 (e) | | | 58,598,047 |
| |
| | | | 19,000,000 | USD | | 0.2% due 10/9/2013 (e) | | | 18,999,156 |
| |
| | | | 19,300,000 | USD | | 0.2% due 10/10/2013 (e) | | | 19,299,035 |
| |
| | | | | | | Devon Energy Corp., | | | |
| | | | 40,000,000 | USD | | 0.16% due 10/21/2013 (e) | | | 39,996,444 |
| |
| | | | | | | Diageo Capital Plc: | | | |
| | | | 60,000,000 | USD | | 0.17% due 10/7/2013 (e) | | | 59,998,300 |
| |
| | | | 65,000,000 | USD | | 0.19% due 10/10/2013 (e) | | | 64,996,913 |
| |
| | | | 40,000,000 | USD | | 0.18% due 10/15/2013 (e) | | | 39,997,200 |
| |
| | | | | | | E.I. du Pont de Nemours & Co.: | | | |
| | | | 25,000,000 | USD | | 0.05% due 10/9/2013 (e) | | | 24,999,722 |
| |
| | | | 10,200,000 | USD | | 0.05% due 10/21/2013 (e) | | | 10,199,717 |
| |
| | | | | | | Electricité de France SA: | | | |
| | | | 50,000,000 | USD | | 0.13% due 10/9/2013 (e) | | | 49,998,556 |
| |
| | | | 33,796,000 | USD | | 0.18% due 10/28/2013 (e) | | | 33,791,438 |
| |
| | | | 50,000,000 | USD | | 0.1% due 10/30/2013 (e) | | | 49,995,972 |
| |
| | | | 50,000,000 | USD | | 0.14% due 11/27/2013 (e) | | | 49,988,917 |
| |
| | | | 4,000,000 | USD | | 0.21% due 1/10/2014 (e) | | | 3,997,439 |
| |
| | | | | | | GDF Suez SA: | | | |
| | | | 25,000,000 | USD | | 0.19% due 10/7/2013 (e) | | | 24,999,208 |
| |
| | | | 11,500,000 | USD | | 0.18% due 10/15/2013 (e) | | | 11,499,195 |
| |
| | | | 36,000,000 | USD | | 0.18% due 10/16/2013 (e) | | | 35,997,300 |
| |
| | | | | | | Google Inc.: | | | |
| | | | 11,300,000 | USD | | 0.03% due 10/16/2013 (e) | | | 11,299,859 |
| |
| | | | 24,100,000 | USD | | 0.03% due 10/25/2013 (e) | | | 24,099,518 |
| |
| | | | | | | Johnson & Johnson: | | | |
| | | | 6,000,000 | USD | | 0.03% due 10/4/2013 (e) | | | 5,999,985 |
| |
| | | | 20,000,000 | USD | | 0.03% due 10/7/2013 (e) | | | 19,999,900 |
| |
| | | | 20,000,000 | USD | | 0.03% due 10/10/2013 (e) | | | 19,999,850 |
| |
| | | | 50,000,000 | USD | | 0.03% due 10/18/2013 (e) | | | 49,999,292 |
| |
| | | | 13,500,000 | USD | | 0.03% due 10/21/2013 (e) | | | 13,499,775 |
| |
| | | | | | | L’Oréal USA Inc.: | | | |
| | | | 15,000,000 | USD | | 0.04% due 10/8/2013 (e) | | | 14,999,883 |
| |
| | | | 20,000,000 | USD | | 0.04% due 10/9/2013 (e) | | | 19,999,822 |
| |
| | | | 17,500,000 | USD | | 0.04% due 10/16/2013 (e) | | | 17,499,708 |
| |
| | | | 14,600,000 | USD | | 0.04% due 10/17/2013 (e) | | | 14,599,740 |
| |
| | | | 20,000,000 | USD | | 0.04% due 10/22/2013 (e) | | | 19,999,533 |
| |
| See Notes to Financial Statements. | 17 |
| IVA Worldwide Fund | IVA Funds |
Schedule of Investments
September 30, 2013 |
|
| | | PRINCIPAL | | | | | | |
| | | AMOUNT | | | DESCRIPTION | | | FAIR VALUE |
| | | | | | | | | | |
| | | | | | | | | | |
| |
| Commercial Paper | 30.2% (continued) | | | | | | | | | |
| | | | | | | Merck & Co. Inc., | | | |
| | | | 19,000,000 | USD | | 0.04% due 10/22/2013, (e) | | $ | 18,999,557 |
| |
| | | | | | | Mondelez International Inc.: | | | |
| | | | 35,000,000 | USD | | 0.23% due 10/23/2013 (e) | | | 34,995,081 |
| |
| | | | 64,200,000 | USD | | 0.23% due 10/24/2013 (e) | | | 64,190,566 |
| |
| | | | 38,000,000 | USD | | 0.23% due 10/25/2013 (e) | | | 37,994,173 |
| |
| | | | 20,000,000 | USD | | 0.27% due 11/6/2013 (e) | | | 19,994,600 |
| |
| | | | 29,700,000 | USD | | 0.26% due 11/7/2013 (e) | | | 29,692,063 |
| |
| | | | 20,300,000 | USD | | 0.27% due 11/7/2013 (e) | | | 20,294,367 |
| |
| | | | | | | Nestlé Capital Corp.: | | | |
| | | | 75,000,000 | USD | | 0.01% due 10/29/2013 (e) | | | 74,999,417 |
| |
| | | | 80,000,000 | USD | | 0.03% due 12/3/2013 (e) | | | 79,995,592 |
| |
| | | | 20,000,000 | USD | | 0.03% due 12/4/2013 (e) | | | 19,998,844 |
| |
| | | | 25,000,000 | USD | | 0.02% due 12/5/2013 (e) | | | 24,998,532 |
| |
| | | | 31,600,000 | USD | | 0.03% due 12/6/2013 (e) | | | 31,598,117 |
| |
| | | | | | | Nestle Finance International Ltd.: | | | |
| | | | 20,000,000 | USD | | 0.05% due 10/16/2013 | | | 19,999,583 |
| |
| | | | 10,000,000 | USD | | 0.06% due 10/25/2013 | | | 9,999,600 |
| |
| | | | 76,000,000 | USD | | 0.05% due 10/28/2013 | | | 75,997,150 |
| |
| | | | | | | NetJets Inc., | | | |
| | | | 16,500,000 | USD | | 0.03% due 10/2/2013 (e) | | | 16,499,986 |
| |
| | | | | | | Novartis Finance Corp., | | | |
| | | | 60,000,000 | USD | | 0.05% due 10/2/2013 (e) | | | 59,999,917 |
| |
| | | | | | | Orange & Rockland Utilities Inc., | | | |
| | | | 3,300,000 | USD | | 0.2% due 10/3/2013 (e) | | | 3,299,963 |
| |
| | | | | | | Philip Morris International Inc.: | | | |
| | | | 25,700,000 | USD | | 0.06% due 10/16/2013 (e) | | | 25,699,357 |
| |
| | | | 50,000,000 | USD | | 0.04% due 10/17/2013 (e) | | | 49,999,111 |
| |
| | | | | | | Praxair Inc.: | | | |
| | | | 20,000,000 | USD | | 0.02% due 10/3/2013 | | | 19,999,978 |
| |
| | | | 47,447,000 | USD | | 0.02% due 10/4/2013 | | | 47,446,921 |
| |
| | | | 2,500,000 | USD | | 0.05% due 10/16/2013 | | | 2,499,948 |
| |
| | | | 52,900,000 | USD | | 0.03% due 10/17/2013 | | | 52,899,295 |
| |
| | | | | | | Procter & Gamble Co., | | | |
| | | | 25,000,000 | USD | | 0.05% due 10/2/2013 (e) | | | 24,999,965 |
| |
| | | | | | | Reed Elsevier Plc: | | | |
| | | | 25,000,000 | USD | | 0.12% due 10/1/2013 (e) | | | 25,000,000 |
| |
| | | | 25,000,000 | USD | | 0.17% due 10/4/2013 (e) | | | 24,999,646 |
| |
| | | | 11,700,000 | USD | | 0.2% due 10/7/2013 (e) | | | 11,699,610 |
| |
| | | | 35,000,000 | USD | | 0.17% due 10/15/2013 (e) | | | 34,997,686 |
| |
| | | | | | | Roche Holding Inc.: | | | |
| | | | 50,000,000 | USD | | 0.03% due 10/15/2013 (e) | | | 49,999,417 |
| |
| | | | 50,000,000 | USD | | 0.03% due 10/16/2013 (e) | | | 49,999,375 |
| |
| | | | 15,900,000 | USD | | 0.03% due 10/17/2013 (e) | | | 15,899,788 |
| |
| | | | 25,000,000 | USD | | 0.02% due 10/18/2013 (e) | | | 24,999,764 |
| |
| | | | 30,000,000 | USD | | 0.05% due 10/24/2013 (e) | | | 29,999,042 |
| |
| 18 | See Notes to Financial Statements. |
| IVA Worldwide Fund | IVA Funds |
Schedule of Investments
September 30, 2013 |
|
| | | PRINCIPAL | | | | | | |
| | | AMOUNT | | | DESCRIPTION | | | FAIR VALUE |
| | | | | | | | | | |
| | | | | | | | | | |
| |
| Commercial Paper | 30.2% (continued) | | | | | | | | | |
| | | | | | | Telstra Corp. Ltd., | | | |
| | | | 20,000,000 | USD | | 0.12% due 11/25/2013 (e) | | $ | 19,996,333 |
| |
| | | | | | | United Parcel Service, Inc.: | | | |
| |
| | | | 50,000,000 | USD | | 0.02% due 10/1/2013 (e) | | | 50,000,000 |
| |
| | | | 50,000,000 | USD | | 0.01% due 10/10/2013 (e) | | | 49,999,875 |
| |
| | | | 35,000,000 | USD | | 0.055% due 10/11/2013 (e) | | | 34,999,465 |
| |
| | | | 50,000,000 | USD | | 0.001% due 10/15/2013 (e) | | | 49,999,981 |
| |
| | | | | | | Vodafone Group Plc: | | | |
| | | | 10,000,000 | USD | | 0.2% due 10/22/2013 (e) | | | 9,998,833 |
| |
| | | | 5,000,000 | USD | | 0.3% due 1/2/2014 (e) | | | 4,995,887 |
| |
| | | | 2,500,000 | USD | | 0.3% due 1/3/2014 (e) | | | 2,497,909 |
| |
| | | | | | | Wal-Mart Stores, Inc.: | | | |
| | | | 80,000,000 | USD | | 0.05% due 10/2/2013 (e) | | | 79,999,889 |
| |
| | | | 80,000,000 | USD | | 0.04% due 10/8/2013 (e) | | | 79,999,378 |
| |
| | | | 10,300,000 | USD | | 0.04% due 10/17/2013 (e) | | | 10,299,817 |
| |
| | | | 12,000,000 | USD | | 0.05% due 10/28/2013 (e) | | | 11,999,550 |
| |
| | | | 55,000,000 | USD | | 0.06% due 10/28/2013 (e) | | | 54,997,525 |
| |
| | | | 29,000,000 | USD | | 0.05% due 10/30/2013 (e) | | | 28,998,832 |
| |
| | | | 14,700,000 | USD | | 0.06% due 11/13/2013 (e) | | | 14,698,946 |
| |
| | | | | | | Walt Disney Co., | | | |
| | | | 24,927,000 | USD | | 0.06% due 11/20/2013 (e) | | | 24,924,923 |
| |
| | | | | | | | | | 2,781,630,716 |
| | | | | | | | | |
| | | | | | | | | | |
| |
| Treasury Bills | 0.4% | | | | | | | | | |
| | | | | | | United States Treasury Bill, | | | |
| | | | 34,281,000 | USD | | due 12/5/2013 (i) | | | 34,280,691 |
| |
| | | | | | | TOTAL SHORT-TERM INVESTMENTS | | |
| | | | | | | (Cost — $2,815,912,368) | | | 2,815,911,407 |
| |
| | | | | | | TOTAL INVESTMENTS — 99.4% | | | |
| | | | | | | (Cost — $7,998,344,892) | | | 9,143,489,301 |
| |
| | | | | | | Other Assets In Excess of Liabilities — 0.6% | | | 59,028,482 |
| |
| | | | | | | TOTAL NET ASSETS — 100.0% | | $ | 9,202,517,783 |
| | | | | | | | | |
| | | | | | | | | | |
| |
| Schedule of Written Put Options – (0.0%) | | | | | | | | | | |
| | | | | | | EXPIRATION | | | STRIKE | | | | FAIR | |
| CONTRACTS | | | DESCRIPTION | | | DATE | | | PRICE | | | | VALUE | |
| |
| (327) | | | Apple, Inc. | | | 1/17/2015 | | $ | 430.00 | | | $ | (1,536,083 | ) |
| |
| (422) | | | Apple, Inc. | | | 1/17/2015 | | | 440.00 | | | | (2,185,960 | ) |
| |
| | | | | | | Total Written Put Options | | | | | |
| | | | | | | (Premiums received — $5,976,952) | | | $ | (3,722,043 | ) |
| |
| See Notes to Financial Statements. | 19 |
| IVA Worldwide Fund | IVA Funds |
| Schedule of Investments |
| September 30, 2013 |
|
The IVA Worldwide Fund had the following open forward foreign currency contracts at September 30, 2013:
| | | | | | | | | | | | | | USD | | | | |
| | | | | | | SETTLEMENT | | LOCAL | | | | | VALUE AT | | NET |
| FOREIGN | | | | | | DATES | | CURRENCY | | USD | | SEPTEMBER 30, | | UNREALIZED |
| CURRENCY | | | COUNTERPARTY | | | THROUGH | | AMOUNT | | EQUIVALENT | | 2013 | | DEPRECIATION |
| |
| Contracts to Sell: | | | | | | | | | | | | | | | |
| | | | State Street | | | | | | | | | | | | | | | | |
| euro | | | Bank & Trust Co. | | | 12/05/2013 | | EUR 338,980,000 | | $ | 446,327,045 | | $ | 458,667,104 | | | $ | (12,340,059 | ) |
| |
| | | | State Street | | | | | | | | | | | | | | | | |
Japanese yen | | | Bank & Trust Co. | | | 12/05/2013 | | JPY 39,674,200,000 | | | 397,804,692 | | | 403,773,208 | | �� | | (5,968,516 | ) |
| |
South Korean won | | | State Street
Bank & Trust Co. | | | 10/07/2013 | | KRW 76,229,000,000 | | | 69,136,488 | | | 70,899,406 | | | | (1,762,918 | ) |
| |
| Net Unrealized Depreciation on Open Forward Foreign Currency Contracts | | | $ | (20,071,493 | ) |
| |
Abbreviations used in this schedule:
| ADR | — | American Depositary Receipt |
| EUR | — | euro |
| HKD | — | Hong Kong dollar |
| JPY | — | Japanese yen |
| KRW | — | South Korean won |
| SGD | — | Singapore dollar |
| TWD | — | Taiwan dollar |
| USD | — | United States dollar |
| (a) | | Security is deemed illiquid. As of September 30, 2013, the value of these illiquid securities amounted to 1.3% of total net assets. |
| 20 | See Notes to Financial Statements. |
| IVA Worldwide Fund | IVA Funds |
| Schedule of Investments |
| September 30, 2013 |
|
| (b) | | Issuer of the security is an affiliate of the IVA Worldwide Fund as defined by the Investment Company Act of 1940. An affiliate is deemed as a company in which the IVA Worldwide Fund indirectly or directly has ownership of at least 5% of the company’s outstanding voting securities. See Schedule of Affiliates below for additional information. |
| |
| Schedule of Affiliates | | | | | | | | | | | | | | | | | | | | |
| | | SHARES | | | | | | SHARES | | | | | | | | | | | | | | | | |
| | | HELD AT | | | | | | HELD AT | | | FAIR VALUE AT | | | | | | | | | | |
| | | SEPTEMBER 30, | | SHARE | | SHARE | | SEPTEMBER 30, | | | SEPTEMBER 30, | | REALIZED | | DIVIDEND |
| SECURITY | | 2012 | | ADDITIONS | | REDUCTIONS | | 2013 | | | 2013 | | GAIN/(LOSS) | | INCOME* |
| |
Cosel Co., Ltd. | | 3,187,600 | | — | | 651,900 | | 2,535,700 | | | | $ | 30,724,032 | | | | $ | (2,068,468 | ) | | | $ | 606,900 | |
| |
| Icom Inc. | | 1,306,300 | | — | | 361,600 | | 944,700 | | | | | 22,326,040 | | | | | (1,627,934 | ) | | | | 304,645 | |
| |
Milbon Co., Ltd.** | | 951,200 | | — | | 908,900 | | 42,300 | | | | | — | | | | | 9,774,495 | | | | | 591,698 | |
| |
| Miura Co., Ltd. | | 3,271,704 | | — | | 143,200 | | 3,128,504 | | | | | 86,030,279 | | | | | (709,849 | ) | | | | 1,263,228 | |
| |
Net 1 U.E.P.S. Technologies Inc. | | 6,324,803 | | — | | 318,444 | | 6,006,359 | | | | | 72,136,372 | | | | | (2,830,689 | ) | | | | — | |
| |
Spansion, Inc., Class ‘A’*** | | 1,368,809 | | 2,283,744 | | 7,520 | | 3,645,033 | | | | | 36,778,383 | | | | | (21,255 | ) | | | | — | |
| |
| Teleperformance** | | 2,928,862 | | 19,444 | | 2,013,272 | | 935,034 | | | | | — | | | | | 21,007,798 | | | | | 698,267 | |
| |
Temp Holdings Co., Ltd.** | | 3,016,200 | | 941,500 | | 2,885,500 | | 1,072,200 | | | | | — | | | | | 40,928,064 | | | | | 488,317 | |
| |
| Total | | | | | | | | | | | | $ | 247,995,106 | | | | $ | 64,452,162 | | | | $ | 3,953,055 | |
| |
| * | | Dividend income is net of withholding taxes. |
| ** | | Non-affiliated at September 30, 2013. |
| *** | | Non-affiliated at September 30, 2012. |
| | | |
| (c) | | Non-income producing investment. |
| (d) | | Cumulative redeemable preferred stock. The date shown represents the first optional call date. |
| (e) | | Security is exempt from registration under Rule 144A or Section 4(2) of the Securities Act of 1933 (the “1933 Act”). Any resale of these securities must generally be effected through a sale that is registered under the 1933 Act or otherwise exempted from such registration requirements. |
| (f) | | Fixed-to-float perpetual bond. The security has no maturity date. The date shown represents the next call date. |
| (g) | | Senior unsecured note. The first call date is April 15, 2017. |
| (h) | | Variable rate security. The interest rate shown reflects the rate currently in effect. |
| (i) | | This security is held at the custodian as collateral for written put options. As of September 30, 2013, portfolio securities valued at $34,280,691 were segregated to cover collateral requirements. |
| See Notes to Financial Statements. | 21 |
| IVA International Fund | IVA Funds |
| Performance (unaudited) | As of September 30, 2013 |
| | | | | | | | | Five Year/ |
| Average Annual Total Returns as of September 30, 2013(a) | | | One Year | | Since Inception(a) |
| Class A | | | | 14.09 | % | | | | 11.44 | % | |
| Class A (with a 5% maximum initial sales charge) | | | | 8.38 | % | | | | 10.31 | % | |
| Class C | | | | 13.18 | % | | | | 10.59 | % | |
| Class I | | | | 14.34 | % | | | | 11.72 | % | |
| MSCI All Country World (ex-U.S.) Index (Net)(b) | | | | 16.48 | % | | | | 6.26 | % | |
| Consumer Price Index(c) | | | | 1.18 | % | | | | 1.36 | % | |
| Growth of a $10,000 Initial Investment | |
| |
| (a) | The Fund commenced investment operations on October 1, 2008. |
| (b) | The MSCI All Country World (ex-U.S.) Index (Net) is an unmanaged, free float-adjusted, market capitalization weighted index composed of stocks of companies located in countries throughout the world, excluding the United States. It is designed to measure equity market performance in global developed and emerging markets outside the United States. The index includes reinvestment of dividends, net of foreign withholding taxes. Please note that an investor cannot invest directly in an index. |
| (c) | The Consumer Price Index examines the weighted average of prices of a basket of consumer goods and services, such as transportation, food and medical care. Please note that an investor cannot invest directly in an index. |
| (d) | Hypothetical illustration of $10,000 invested in Class A shares on October 1, 2008, assuming the deduction of the maximum initial sales charge of 5% at the time of investment for Class A shares and the reinvestment of all distributions, including returns of capital, if any, at net asset value through September 30, 2013. The performance of the Fund’s other classes may be greater or less than the Class A shares’ performance indicated on this chart depending on whether greater or lesser sales charges and fees were incurred by shareholders investing in the other classes. |
Past performance is no guarantee of future results. The performance data quoted represents past performance and current returns may be lower or higher. The investment return and principal value will fluctuate so that an investor’s shares, when redeemed, may be worth more or less than the original cost. The returns do not reflect the deduction of taxes that a shareholder would pay on Fund distributions or the redemption of Fund shares. To obtain performance information current to the most recent month-end, please call 866-941-4482.
The maximum sales charge for Class A shares is 5.00%. Class C shares may include a 1.00% contingent deferred sales charge for the first year only. Shares redeemed within 30 days of purchase may be subject to a 2.00% redemption fee. The gross and net expense ratios for the Fund are as follows: 1.27% (Class A shares); 2.02% (Class C shares); and 1.02% (Class I shares). These expense ratios are as stated in the most recent Prospectus dated January 31, 2013. More recent expense ratios can be found in the Financial Highlights section of this Annual Report.
| IVA International Fund | IVA Funds |
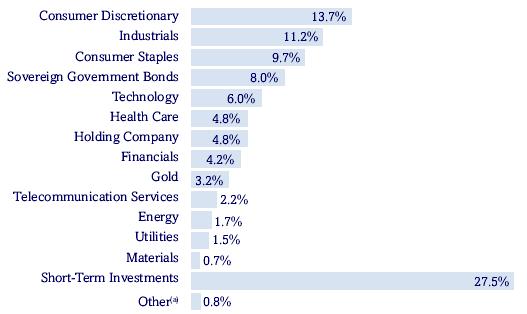
| Portfolio Composition (unaudited) | As of September 30, 2013 |
| Asset Allocation (As a Percent of Total Net Assets) | |
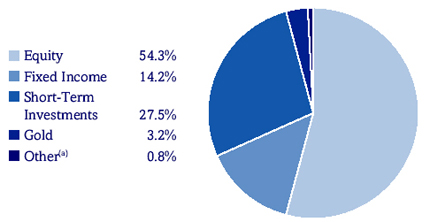
| Sector Allocation (As a Percent of Total Net Assets) | |
| Top 10 Positions (As a Percent of Total Net Assets)(b) | |
| Government of Singapore, 3.625% due 7/1/2014, 2.875% due 7/1/2015, 3.75% due 9/1/2016 | | | 6.3 | % |
| |
| Nestlé SA | | | 3.9 | % |
| |
Wendel, 4.875% due 5/26/2016, 4.375% due 8/9/2017, 6.75% due 4/20/2018 | | | 3.4 | % |
| |
| Gold Bullion | | | 3.2 | % |
| |
| Astellas Pharma Inc. | | | 3.1 | % |
| |
| Genting Malaysia Berhad | | | 2.9 | % |
| |
| E-Mart Co., Ltd. | | | 1.7 | % |
| |
| GDF Suez SA | | | 1.5 | % |
| |
| Sodexo SA | | | 1.4 | % |
| |
| Total SA, ADR | | | 1.4 | % |
| |
| Top 10 positions represent 28.8% of total net assets. |
| (a) | Other represents unrealized gains and losses on forward foreign currency contracts and other assets and liabilities. |
| (b) | Short-Term Investments are not included. |
| IVA International Fund | IVA Funds |
Schedule of Investments
September 30, 2013 |
|
| | | | SHARES | | DESCRIPTION | | | FAIR VALUE |
| COMMON STOCKS – 54.3% | | | | | | | | |
| |
| Argentina | 0.0% | | | | | | | | |
| | | | 871 | | Nortel Inversora SA, Series ‘B’, ADR (a) | | $ | 16,715 |
| |
| | | | | | | | | |
| |
| Australia | 0.1% | | | | | | | | |
| | | | 1,337,089 | | Programmed Maintenance Services Ltd. | | | 3,505,111 |
| |
| | | | | | | | | |
| |
| Belgium | 0.4% | | | | | | | | |
| | | | 125,166 | | Sofina SA | | | 12,303,582 |
| |
| | | | | | | | | |
| |
| Brazil | 1.0% | | | | | | | | |
| | | | 2,226,335 | | Itaú Unibanco Holding SA, ADR | | | 31,435,850 |
| |
| | | | | | | | | |
| |
| China | 2.3% | | | | | | | | |
| | | | 39,557,030 | | Clear Media Ltd. (b)(c) | | | 26,011,276 |
| |
| | | | 11,394,000 | | Digital China Holdings Ltd. | | | 13,956,214 |
| |
| | | | 27,368,000 | | Phoenix Satellite Television Holdings Ltd. | | | 9,774,412 |
| |
| | | | 24,303,000 | | Springland International Holdings Ltd. | | | 13,160,639 |
| |
| | | | 12,132,000 | | Uni-President China Holdings Ltd. | | | 12,169,698 |
| |
| | | | | | | | | 75,072,239 |
| | | | | | | | |
| | | | | | | | | |
| |
| Denmark | 0.1% | | | | | | | | |
| | | | 56,392 | | D/S Norden A/S | | | 2,378,179 |
| |
| | | | | | | | | |
| |
| France | 14.9% | | | | | | | | |
| | | | 916,276 | | Alten | | | 39,232,846 |
| |
| | | | 62,585 | | Bolloré | | | 32,707,305 |
| |
| | | | 310,700 | | Cap Gemini SA | | | 18,481,938 |
| |
| | | | 323,157 | | Carrefour SA | | | 11,093,521 |
| |
| | | | 105,330 | | Ciments Français SA | | | 7,261,583 |
| |
| | | | 517,541 | | CNP Assurances | | | 9,322,572 |
| |
| | | | 202,661 | | Eutelsat Communications Group, SA | | | 6,407,354 |
| |
| | | | 29,687 | | Financière de l’Odet SA | | | 29,918,735 |
| |
| | | | 492,234 | | Financière Marc de Lacharriere SA | | | 26,237,208 |
| |
| | | | 1,962,917 | | GDF Suez SA | | | 49,313,251 |
| |
| | | | 505,143 | | Lagardère SCA | | | 16,404,607 |
| |
| | | | 230,121 | | M6-Métropole Télévision SA | | | 4,935,968 |
| |
| | | | 47,926 | | Publicis Groupe SA | | | 3,813,695 |
| |
| | | | 73,288 | | Robertet SA (b) | | | 14,773,008 |
| |
| | | | 562,656 | | Saft Groupe SA | | | 15,520,652 |
| |
| | | | 298,912 | | Séché Environnement SA | | | 11,100,320 |
| |
| | | | 226,778 | | Securidev SA (b)(c) | | | 9,351,164 |
| |
| | | | 2,181,095 | | Societe d’Edition de Canal Plus | | | 16,523,894 |
| |
| | | | 488,374 | | Sodexo SA | | | 45,568,271 |
| |
| | | | 565,590 | | Teleperformance | | | 27,362,075 |
| |
| | | | 482,674 | | Thales SA | | | 26,534,076 |
| |
| | | | 787,575 | | Total SA, ADR | | | 45,616,344 |
| |
| | | | 1,078,962 | | Vivendi SA | | | 24,821,760 |
| |
| | | | | | | | | 492,302,147 |
| | | | | | | | |
| 24 | See Notes to Financial Statements. |
| IVA International Fund | IVA Funds |
Schedule of Investments
September 30, 2013 |
|
| | | | SHARES | | DESCRIPTION | | | FAIR VALUE |
| | | | | | | | | |
| |
| Germany | 0.9% | | | | | | | | |
| | | | 220,979 | | Siemens AG | | $ | 26,624,625 |
| |
| | | | 54,199 | | Wincor Nixdorf AG | | | 3,384,596 |
| |
| | | | | | | | | 30,009,221 |
| | | | | | | | |
| | | | | | | | | |
| |
| Hong Kong | 1.1% | | | | | | | | |
| | | | 20,767,761 | | Hongkong & Shanghai Hotels Ltd. | | | 31,382,323 |
| |
| | | | 13,962,000 | | Midland Holdings Ltd. | | | 5,742,568 |
| |
| | | | | | | | | 37,124,891 |
| | | | | | | | |
| | | | | | | | | |
| |
| India | 0.2% | | | | | | | | |
| | | | 17,614,307 | | South Indian Bank Ltd. | | | 5,570,853 |
| |
| | | | | | | | | |
| |
| Indonesia | 0.1% | | | | | | | | |
| | | | 88,168,000 | | PT Bank Bukopin Tbk | | | 4,872,843 |
| |
| | | | | | | | | |
| |
| Japan | 16.9% | | | | | | | | |
| | | | 295,600 | | Arcs Co. Ltd. | | | 5,479,253 |
| |
| | | | 764,900 | | As One Corp. | | | 15,757,897 |
| |
| | | | 1,986,500 | | Astellas Pharma Inc. | | | 101,047,865 |
| |
| | | | 955,200 | | Azbil Corp. | | | 22,146,608 |
| |
| | | | 60,900 | | The Bank of Okinawa Ltd. | | | 2,425,591 |
| |
| | | | 627,200 | | Benesse Holdings Inc. | | | 22,779,429 |
| |
| | | | 71,400 | | Canon Inc. | | | 2,273,585 |
| |
| | | | 1,398,400 | | Cosel Co., Ltd. (b) | | | 16,943,836 |
| |
| | | | 864,500 | | Daiichikosho Co., Ltd. | | | 23,561,682 |
| |
| | | | 1,401,300 | | Hi Lex Corp. | | | 30,693,310 |
| |
| | | | 650,000 | | Icom Inc. (b) | | | 15,361,412 |
| |
| | | | 491,140 | | Kose Corp. | | | 14,190,321 |
| |
| | | | 95,400 | | Medikit Co., Ltd. (b) | | | 3,202,808 |
| |
| | | | 174,500 | | Meitec Corp. | | | 5,020,459 |
| |
| | | | 325,300 | | Milbon Co., Ltd. | | | 13,320,438 |
| |
| | | | 1,497,276 | | Miura Co., Ltd. | | | 41,173,376 |
| |
| | | | 406,400 | | Nifco Inc. | | | 10,848,910 |
| |
| | | | 57,000 | | Nintendo Co., Ltd. | | | 6,454,143 |
| |
| | | | 472,700 | | Nitto Kohki Co., Ltd. | | | 8,858,166 |
| |
| | | | 843,100 | | NTT DoCoMo, Inc. | | | 13,654,969 |
| |
| | | | 724,900 | | Okinawa Cellular Telephone Co. | | | 18,422,099 |
| |
| | | | 1,101,000 | | San-A Co. Ltd. | | | 30,970,700 |
| |
| | | | 129,900 | | Sankyo Co. Ltd. | | | 6,336,747 |
| |
| | | | 650,500 | | Secom Co., Ltd. | | | 40,633,501 |
| |
| | | | 10,600 | | Secom Joshinetsu Co., Ltd. | | | 270,999 |
| |
| | | | 353,900 | | Shingakukai Co., Ltd. | | | 1,382,548 |
| |
| | | | 306,950 | | Shofu Inc. | | | 2,763,627 |
| |
| | | | 4,500 | | SK Kaken Co., Ltd. | | | 267,816 |
| |
| | | | 190,900 | | Sugi Holdings Co., Ltd. | | | 8,176,296 |
| |
| | | | 172,800 | | Techno Medica Co., Ltd. | | | 3,802,497 |
| |
| | | | 643,800 | | Temp Holdings Co., Ltd. | | | 16,230,087 |
| |
| IVA International Fund | IVA Funds |
Schedule of Investments
September 30, 2013 |
|
| | | | SHARES | | DESCRIPTION | | | FAIR VALUE |
| | | | | | | | | |
| |
| Japan | 16.9% (continued) | | | | | | | | |
| |
| | | | 1,015,900 | | Toho Co., Ltd. | | $ | 21,145,851 |
| |
| | | | 521,700 | | Transcosmos Inc. | | | 9,139,503 |
| |
| | | | 4,372,100 | | Yahoo Japan Corp. | | | 24,775,011 |
| |
| | | | | | | | | 559,511,340 |
| | | | | | | | |
| | | | | | | | | |
| |
| Malaysia | 2.9% | | | | | | | | |
| | | | 74,143,900 | | Genting Malaysia Berhad | | | 95,992,409 |
| |
| | | | | | | | | |
| |
| Mexico | 0.1% | | | | | | | | |
| | | | 213,675 | | Corporativo Fragua, SAB de CV | | | 3,619,554 |
| |
| | | | | | | | | |
| |
| Netherlands | 0.1% | | | | | | | | |
| | | | 18,272 | | Hal Trust NV | | | 2,377,748 |
| |
| | | | | | | | | |
| |
| Norway | 1.0% | | | | | | | | |
| | | | 4,692,937 | | Orkla ASA | | | 34,182,953 |
| |
| | | | | | | | | |
| |
| Singapore | 1.0% | | | | | | | | |
| | | | 5,455,420 | | Haw Par Corp. Ltd. (b) | | | 32,178,955 |
| |
| | | | | | | | | |
| |
| South Africa | 1.0% | | | | | | | | |
| | | | 2,720,423 | | Net 1 U.E.P.S. Technologies Inc. (a)(c) | | | 32,672,280 |
| |
| | | | | | | | | |
| |
| South Korea | 3.7% | | | | | | | | |
| | | | 247,873 | | E-Mart Co., Ltd. | | | 55,817,122 |
| |
| | | | 61,768 | | Fursys Inc. | | | 1,753,018 |
| |
| | | | 1,057,970 | | Kangwon Land, Inc. | | | 28,056,989 |
| |
| | | | 12,273 | | Lotte Chilsung Beverage Co., Ltd. | | | 19,380,074 |
| |
| | | | 11,268 | | Lotte Confectionery Co., Ltd. | | | 17,876,977 |
| |
| | | | | | | | | 122,884,180 |
| | | | | | | | |
| | | | | | | | | |
| |
| Switzerland | 5.1% | | | | | | | | |
| | | | 23,288 | | APG SGA SA | | | 6,180,262 |
| |
| | | | 1,862,826 | | Nestlé SA | | | 130,285,558 |
| |
| | | | 55,573 | | Schindler Holding AG | | | 8,345,014 |
| |
| | | | 1,212,065 | | UBS AG | | | 24,794,828 |
| |
| | | | | | | | | 169,605,662 |
| | | | | | | | |
| | | | | | | | | |
| |
| Taiwan | 0.4% | | | | | | | | |
| | | | 5,904,000 | | Taiwan Secom Co., Ltd. | | | 14,137,491 |
| |
| | | | | | | | | |
| |
| United Kingdom | 1.0% | | | | | | | | |
| | | | 3,647,823 | | Millennium & Copthorne Hotels Plc | | | 32,775,327 |
| |
| | | | | | TOTAL COMMON STOCKS | | | |
| | | | | | (Cost — $1,435,243,111) | | | 1,794,529,530 |
| |
| 26 | See Notes to Financial Statements. |
| IVA International Fund | IVA Funds |
Schedule of Investments
September 30, 2013 |
|
| | SHARES | | | | DESCRIPTION | | | FAIR VALUE |
| | | | | | | | | |
| PREFERRED STOCK – 0.0% | | | | |
| | | | | | | | | |
| |
| Switzerland | 0.0% | | | | | | | | |
| | | | | | UBS Preferred Funding Trust IV, Series ‘D’, | | | |
| | 42,664 | USD | | | 0.8823% due 10/30/2013 (d) | | $ | 624,601 |
| |
| | | | | | TOTAL PREFERRED STOCK | | | |
| | | | | | (Cost — $684,965) | | | 624,601 |
| |
| | PRINCIPAL | | | | | | | |
| | AMOUNT | | | | | | | |
| CORPORATE NOTES & BONDS – 6.2% | | | | |
| | | | | | | | | |
| |
| France | 3.4% | | | | | | | | |
| | | | | | Wendel: | | | |
| | 23,950,000 | EUR | | | 4.875% due 5/26/2016 (e) | | | 34,267,053 |
| |
| | 36,400,000 | EUR | | | 4.375% due 8/9/2017 | | | 51,533,591 |
| |
| | 17,000,000 | EUR | | | 6.75% due 4/20/2018 | | | 25,936,511 |
| |
| | | | | | | | | 111,737,155 |
| | | | | | | | |
| | | | | | | | | |
| |
| Norway | 1.6% | | | | | | | | |
| | | | | | Golden Close Maritime Corp. Ltd., | | | |
| | 10,575,096 | USD | | | 11% due 12/9/2015 (b) | | | 11,196,383 |
| |
| | | | | | Stolt-Nielsen Ltd. SA: | | | |
| | 107,500,000 | NOK | | | 6.48% due 6/22/2016 (b)(f) | | | 18,614,622 |
| |
| | 77,500,000 | NOK | | | 6.49% due 3/19/2018 (b)(f) | | | 13,371,513 |
| |
| | 62,000,000 | NOK | | | 6.72% due 9/4/2019 (b)(f) | | | 10,697,210 |
| |
| | | | | | | | | 53,879,728 |
| | | | | | | | |
| | | | | | | | | |
| |
| Singapore | 0.4% | | | | | | | | |
| | | | | | DBS Capital Funding II Corp., | | | |
| | 7,500,000 | SGD | | | 5.75% due 6/15/2018 (g) | | | 6,449,833 |
| |
| | | | | | United Overseas Bank Ltd., | | | |
| | 7,750,000 | SGD | | | 4.9% due 7/23/2018 (g) | | | 6,349,625 |
| |
| | | | | | | | | 12,799,458 |
| | | | | | | | |
| | | | | | | | | |
| |
| Switzerland | 0.3% | | | | | | | | |
| | 4,400,000 | EUR | | | UBS AG, 7.152% due 12/21/2017 (g) | | | 6,585,000 |
| |
| | | | | | UBS Preferred Funding Trust V, | | | |
| | 4,338,000 | USD | | | 6.243% due 5/15/2016 (g) | | | 4,636,237 |
| |
| | | | | | | | | 11,221,237 |
| | | | | | | | |
| | | | | | | | | |
| |
| United Kingdom | 0.2% | | | | | | | | |
| | | | | | Inmarsat Finance Plc, | | | |
| | 7,000,000 | USD | | | 7.375% due 12/1/2017 (e) | | | 7,367,500 |
| |
| | | | | | | | | |
| |
| United States | 0.3% | | | | | | | | |
| | | | | | Intelsat Luxembourg SA, | | | |
| | 8,622,000 | USD | | | 7.75% due 6/1/2021 (e) | | | 8,956,102 |
| |
| | | | | | TOTAL CORPORATE NOTES & BONDS | | | |
| | | | | | (Cost — $186,406,209) | | | 205,961,180 |
| |
| See Notes to Financial Statements. | 27 |
| IVA International Fund | IVA Funds |
Schedule of Investments
September 30, 2013 |
|
| | PRINCIPAL | | | | | | | |
| | AMOUNT | | | | DESCRIPTION | | | FAIR VALUE |
| | | | | | | | | |
| SOVEREIGN GOVERNMENT BONDS – 8.0% | | | | |
| | | | | | | | | |
| |
| Hong Kong | 1.1% | | | | | | | | |
| | | | | | Government of Hong Kong, | | | |
| | 279,650,000 | HKD | | | 1.52% due 12/21/2015 | | $ | 36,962,880 |
| |
| | | | | | | | | |
| |
| Singapore | 6.3% | | | | | | | | |
| | | | | | Government of Singapore: | | | |
| | 100,001,000 | SGD | | | 3.625% due 7/1/2014 | | | 81,695,608 |
| |
| | 75,410,000 | SGD | | | 2.875% due 7/1/2015 | | | 62,776,428 |
| |
| | 73,093,000 | SGD | | | 3.75% due 9/1/2016 | | | 63,867,860 |
| |
| | | | | | | | | 208,339,896 |
| | | | | | | | |
| | | | | | | | | |
| |
| Taiwan | 0.2% | | | | | | | | |
| | | | | | Government of Taiwan, | | | |
| | 171,000,000 | TWD | | | 2% due 7/20/2015 | | | 5,911,081 |
| |
| | | | | | | | | |
| |
| Thailand | 0.4% | | | | | | | | |
| | | | | | Government of Thailand, | | | |
| | 362,607,000 | THB | | | 5.25% due 5/12/2014 | | | 11,777,575 |
| |
| | | | | | TOTAL SOVEREIGN GOVERNMENT BONDS | | | |
| | | | | | (Cost — $262,819,838) | | | 262,991,432 |
| |
| | OUNCES | | | | | | | |
| COMMODITIES – 3.2% | | | | | | | | |
| | 80,861 | | | | Gold Bullion (a) | | | 107,384,464 |
| |
| | | | | | TOTAL COMMODITIES | | | |
| | | | | | (Cost — $122,368,458) | | | 107,384,464 |
| |
| | PRINCIPAL | | | | | | | |
| | AMOUNT | | | | | | | |
| SHORT-TERM INVESTMENTS – 27.5% | | | | |
| |
| Commercial Paper | 27.5% | | | | | | | |
| | | | | | Abbott Laboratories, | | | |
| | 36,000,000 | USD | | | 0.05% due 10/17/2013 (e) | | | 35,999,200 |
| |
| | | | | | American Honda Finance Corp., | | | |
| | 16,100,000 | USD | | | 0.05% due 10/4/2013 (e) | | | 16,099,933 |
| |
| | | | | | Coca-Cola Co., | | | |
| | 3,000,000 | USD | | | 0.04% due 10/4/2013 (e) | | | 2,999,990 |
| |
| | | | | | Coca-Cola Enterprises, Inc.: | | | |
| | 8,000,000 | USD | | | 0.16% due 10/1/2013 (e) | | | 8,000,000 |
| |
| | 26,900,000 | USD | | | 0.16% due 10/7/2013 (e) | | | 26,899,283 |
| |
| | 29,300,000 | USD | | | 0.16% due 10/28/2013 (e) | | | 29,296,484 |
| |
| | | | | | Consolidated Edison Co. Inc.: | | | |
| | 30,000,000 | USD | | | 0.2% due 10/2/2013 (e) | | | 29,999,833 |
| |
| | 23,500,000 | USD | | | 0.2% due 10/7/2013 (e) | | | 23,499,217 |
| |
| | 70,600,000 | USD | | | 0.2% due 10/8/2013 (e) | | | 70,597,254 |
| |
| | | | | | Devon Energy Corp.: | | | |
| | 20,000,000 | USD | | | 0.15% due 10/21/2013 (e) | | | 19,998,333 |
| |
| | 5,900,000 | USD | | | 0.16% due 10/21/2013 (e) | | | 5,899,476 |
| |
| | | | | | Diageo Capital Plc, | | | |
| | 26,300,000 | USD | | | 0.18% due 10/15/2013 (e) | | | 26,298,159 |
| |
| 28 | See Notes to Financial Statements. |
| IVA International Fund | IVA Funds |
Schedule of Investments
September 30, 2013 |
|
| | PRINCIPAL | | | | | | | |
| | AMOUNT | | | | DESCRIPTION | | | FAIR VALUE |
| | | | | | | | | |
| |
| Commercial Paper | 27.5% (continued) | | | | |
| |
| | | | | | E.I. du Pont de Nemours & Co.: | | | |
| | 21,800,000 | USD | | | 0.05% due 10/21/2013 (e) | | $ | 21,799,394 |
| |
| | 10,198,000 | USD | | | 0.07% due 10/3/2013 (e) | | | 10,197,960 |
| |
| | | | | | Electricité de France SA, | | | |
| | 16,204,000 | USD | | | 0.18% due 10/28/2013 (e) | | | 16,201,813 |
| |
| | | | | | Florida Power & Light Co., | | | |
| | 29,400,000 | USD | | | 0.16% due 10/2/2013 (e) | | | 29,399,869 |
| |
| | | | | | Google Inc.: | | | |
| | 36,800,000 | USD | | | 0.03% due 10/16/2013 (e) | | | 36,799,540 |
| |
| | 60,000,000 | USD | | | 0.03% due 10/25/2013 (e) | | | 59,998,800 |
| |
| | | | | | Johnson & Johnson, | | | |
| | 30,000,000 | USD | | | 0.03% due 10/10/2013 (e) | | | 29,999,775 |
| |
| | | | | | L’Oréal USA Inc., | | | |
| | 15,000,000 | USD | | | 0.04% due 10/23/2013 (e) | | | 14,999,633 |
| |
| | | | | | Merck & Co. Inc., | | | |
| | 10,000,000 | USD | | | 0.04% due 10/22/2013 (e) | | | 9,999,767 |
| |
| | | | | | Mondelez International Inc., | | | |
| | 15,000,000 | USD | | | 0.23% due 10/23/2013 (e) | | | 14,997,892 |
| |
| | | | | | NetJets Inc., | | | |
| | 26,500,000 | USD | | | 0.03% due 10/2/2013 (e) | | | 26,499,978 |
| |
| | | | | | Praxair Inc.: | | | |
| | 33,500,000 | USD | | | 0.02% due 10/3/2013 | | | 33,499,963 |
| |
| | 11,803,000 | USD | | | 0.02% due 10/4/2013 | | | 11,802,980 |
| |
| | 10,000,000 | USD | | | 0.02% due 10/7/2013 | | | 9,999,967 |
| |
| | | | | | Roche Holding Inc.: | | | |
| | 10,000,000 | USD | | | 0.02% due 10/17/2013 (e) | | | 9,999,911 |
| |
| | 9,100,000 | USD | | | 0.03% due 10/17/2013 (e) | | | 9,099,879 |
| |
| | | | | | United Parcel Service, Inc.: | | | |
| | 33,000,000 | USD | | | 0.001% due 10/7/2013 (e) | | | 32,999,995 |
| |
| | 20,000,000 | USD | | | 0.001% due 10/8/2013 (e) | | | 19,999,996 |
| |
| | 40,300,000 | USD | | | 0.001% due 10/9/2013 (e) | | | 40,299,991 |
| |
| | 31,200,000 | USD | | | 0.001% due 10/10/2013 (e) | | | 31,199,992 |
| |
| | 15,000,000 | USD | | | 0.055% due 10/11/2013 (e) | | | 14,999,771 |
| |
| | | | | | Wal-Mart Stores, Inc.: | | | |
| | 48,000,000 | USD | | | 0.03% due 10/2/2013 (e) | | | 47,999,960 |
| |
| | 6,600,000 | USD | | | 0.05% due 10/3/2013 (e) | | | 6,599,982 |
| |
| | 9,200,000 | USD | | | 0.04% due 10/8/2013 (e) | | | 9,199,928 |
| |
| | 26,300,000 | USD | | | 0.04% due 10/17/2013 (e) | | | 26,299,532 |
| |
| | 20,700,000 | USD | | | 0.04% due 10/21/2013 (e) | | | 20,699,540 |
| |
| | 18,000,000 | USD | | | 0.05% due 10/28/2013 (e) | | | 17,999,325 |
| |
| | | | | | TOTAL SHORT-TERM INVESTMENTS | | | |
| | | | | | (Cost — $909,182,295) | | | 909,182,295 |
| |
| | | | | | TOTAL INVESTMENTS — 99.2% | | | |
| | | | | | (Cost — $2,916,704,876) | | | 3,280,673,502 |
| |
| | | | | | Other Assets In Excess of Liabilities — 0.8% | | | 25,553,894 |
| |
| | | | | | TOTAL NET ASSETS — 100.0% | | $ | 3,306,227,396 |
| | | | | | | | |
| See Notes to Financial Statements. | 29 |
| IVA International Fund | IVA Funds |
Schedule of Investments
September 30, 2013 |
|
The IVA International Fund had the following open forward foreign currency contracts at September 30, 2013:
| | | | | | | | | | | | | | USD | | | | | |
| | | | | | | SETTLEMENT | | LOCAL | | | | | VALUE AT | | | NET |
| FOREIGN | | | | | | DATES | | CURRENCY | | USD | | SEPTEMBER 30, | | | UNREALIZED |
| CURRENCY | | | COUNTERPARTY | | | THROUGH | | AMOUNT | | EQUIVALENT | | 2013 | | | DEPRECIATION |
| |
| Contracts to Sell: | | | | | | | | | | | | | | | | | | | |
Australian dollar | | | State Street Bank & Trust Co. | | | 12/05/2013 | | AUD 680,000 | | $ | 610,416 | | $ | 631,736 | | | $ | (21,320 | ) |
| |
| euro | | | State Street Bank & Trust Co. | | | 12/05/2013 | | EUR 145,898,000 | | | 192,115,221 | | | 197,411,686 | | | | (5,296,465 | ) |
| |
Japanese yen | | | State Street Bank & Trust Co. | | | 12/05/2013 | | JPY 33,100,400,000 | | | 331,936,184 | | | 336,870,175 | | | | (4,933,991 | ) |
| |
South Korean won | | | State Street Bank & Trust Co. | | | 10/07/2013 | | KRW 26,725,000,000 | | | 24,239,136 | | | 24,856,506 | | | | (617,370 | ) |
| |
| Net Unrealized Depreciation on Open Forward Foreign Currency Contracts | | | $ | (10,869,146 | ) |
| |
| Abbreviations used in this schedule: |
| ADR | — | American Depositary Receipt |
| AUD | — | Australian dollar |
| EUR | — | euro |
| HKD | — | Hong Kong dollar |
| JPY | — | Japanese yen |
| KRW | — | South Korean won |
| NOK | — | Norwegian krone |
| SGD | — | Singapore dollar |
| THB | — | Thai baht |
| TWD | — | Taiwan dollar |
| USD | — | United States dollar |
| (a) | Non-income producing investment. |
| (b) | Security is deemed illiquid. As of September 30, 2013, the value of these illiquid securities amounted to 5.2% of total net assets. |
| 30 | See Notes to Financial Statements. |
| IVA International Fund | IVA Funds |
Schedule of Investments
September 30, 2013 |
|
| (c) | | Issuer of the security is an affiliate of the IVA International Fund as defined by the Investment Company Act of 1940. An affiliate is deemed as a company in which the IVA International Fund indirectly or directly has ownership of at least 5% of the company’s outstanding voting securities. See Schedule of Affiliates below for additional information. |
| |
| Schedule of Affiliates | | | | | | | | | | | | | | | | | | | | |
| | | SHARES | | | | | | SHARES | | | | | | | | | | | | | | | | |
| | | HELD AT | | | | | | HELD AT | | | FAIR VALUE AT | | | | | | | | | | |
| | | SEPTEMBER 30, | | SHARE | | SHARE | | SEPTEMBER 30, | | | SEPTEMBER 30, | | REALIZED | | DIVIDEND |
| SECURITY | | 2012 | | ADDITIONS | | REDUCTIONS | | 2013 | | | 2013 | | GAIN/(LOSS) | | INCOME* |
| |
Clear Media Ltd. | | 36,621,030 | | 2,936,000 | | — | | 39,557,030 | | | | $ | 26,011,276 | | | | | — | | | | $ | 7,498,148 | |
| |
| Icom Inc.** | | 765,600 | | — | | 115,600 | | 650,000 | | | | | — | | | | $ | (149,066 | ) | | | | 210,182 | |
| |
Net 1 U.E.P.S. Technologies Inc.*** | | 2,230,235 | | 490,188 | | — | | 2,720,423 | | | | | 32,672,280 | | | | | — | | | | | — | |
| |
| Securidev SA | | 226,778 | | — | | — | | 226,778 | | | | | 9,351,164 | | | | | — | | | | | 317,923 | |
| |
Temp Holdings Co., Ltd.** | | 3,405,900 | | 120,500 | | 2,882,600 | | 643,800 | | | | | — | | | | | 33,640,300 | | | | | 383,422 | |
| |
| Total | | | | | | | | | | | | $ | 68,034,720 | | | | $ | 33,491,234 | | | | $ | 8,409,675 | |
| |
| * | | Dividend income is net of withholding taxes. |
| ** | | Non-affiliated at September 30, 2013. |
| *** | | Non-affiliated at September 30, 2012. |
| | | |
| (d) | | Floating rate perpetual preferred stock. The rate shown reflects the rate currently in effect. The preferred stock has no maturity date. The date shown reflects the next call date. |
| (e) | | Security is exempt from registration under Rule 144A or Section 4(2) of the Securities Act of 1933 (the “1933 Act”). Any resale of these securities must generally be effected through a sale that is registered under the 1933 Act or otherwise exempted from such registration requirements. |
| (f) | | Variable rate security. The interest rate shown reflects the rate currently in effect. |
| (g) | | Fixed-to-float perpetual bond. The security has no maturity date. The date shown represents the next call date. |
| See Notes to Financial Statements. | 31 |
| Statements of Assets and Liabilities | | IVA Funds |
| | | IVA | | IVA |
| | | Worldwide | | International |
| | | Fund | | Fund |
| | | |
| Assets: | | | | | | |
Long-term investments, at cost: | | | | | | |
Non-affiliated investments | | $ | 4,942,194,116 | | $ | 1,949,339,349 |
| | | |
Affiliated investments | | | 240,238,408 | | | 58,183,232 |
| | | |
Short-term investments, at cost | | | 2,815,912,368 | | | 909,182,295 |
| | | |
Foreign currency, at cost | | | 779,336 | | | 571,199 |
| | | |
Long-term investments, at fair value: | | | | | | |
Non-affiliated investments | | $ | 6,079,582,788 | | $ | 2,303,456,487 |
| | | |
Affiliated investments | | | 247,995,106 | | | 68,034,720 |
| | | |
Short-term investments, at fair value | | | 2,815,911,407 | | | 909,182,295 |
| | | |
Foreign currency, at fair value | | | 779,682 | | | 571,388 |
| | | |
Cash | | | 275,083 | | | 314,576 |
| | | |
Receivable for investments sold | | | 59,188,348 | | | 17,056,106 |
| | | |
Dividends and interest receivable | | | 30,625,492 | | | 17,222,384 |
| | | |
Receivable for fund shares sold | | | 15,138,481 | | | 10,953,683 |
| | | |
| Total assets | | $ | 9,249,496,387 | | $ | 3,326,791,639 |
| Liabilities: | | | | | | |
Payable for investments purchased | | $ | 8,754,004 | | $ | 2,285,433 |
| | | |
Payable for fund shares repurchased | | | 4,574,822 | | | 4,410,149 |
| | | |
Unrealized depreciation on open forward foreign currency contracts | | | 20,071,493 | | | 10,869,146 |
| | | |
Written options, at value (premiums received: $5,976,952 and $0) | | | 3,722,043 | | | — |
| | | |
Accrued investment advisory fees | | | 6,733,100 | | | 2,406,152 |
| | | |
Accrued distribution and service fees | | | 1,611,379 | | | 143,498 |
| | | |
Accrued expenses and other liabilities | | | 1,511,763 | | | 449,865 |
| | | |
| Total liabilities | | | 46,978,604 | | | 20,564,243 |
| | | |
| Net Assets | | $ | 9,202,517,783 | | $ | 3,306,227,396 |
| | | |
| Net Assets Consist of: | | | | | | |
Par value ($0.001 per share) | | $ | 514,103 | | $ | 189,798 |
| | | |
Additional paid-in-capital | | | 7,776,450,711 | | | 2,836,250,856 |
| | | |
Undistributed net investment income | | | 78,916,001 | | | 70,476,339 |
| | | |
Accumulated net realized gain on investments and foreign currency transactions | | | 219,114,838 | | | 46,168,260 |
| | | |
Unrealized appreciation from investments, written options and foreign currency translation | | | 1,127,522,130 | | | 353,142,143 |
| | | |
| Net Assets | | $ | 9,202,517,783 | | $ | 3,306,227,396 |
| | | |
| Net Asset Value Per Share: | | | | | | |
| Class A | | | | | | |
Net assets | | $ | 2,378,044,845 | | $ | 377,043,133 |
| | | |
Shares outstanding | | | 132,754,964 | | | 21,680,596 |
| | | |
Net asset value per share | | $ | 17.91 | | $ | 17.39 |
| | | |
Maximum offering price per share (with a maximum initial sales charge of 5.00%) | | $ | 18.85 | | $ | 18.31 |
| | | |
| Class C | | | | | | |
Net assets | | $ | 1,380,607,552 | | $ | 81,804,414 |
| | | |
Shares outstanding | | | 77,936,776 | | | 4,771,931 |
| | | |
Net asset value per share | | $ | 17.71 | | $ | 17.14 |
| | | |
| Class I | | | | | | |
Net assets | | $ | 5,443,865,386 | | $ | 2,847,379,849 |
| | | |
Shares outstanding | | | 303,410,806 | | | 163,345,521 |
| | | |
Net asset value per share | | $ | 17.94 | | $ | 17.43 |
| | | |
| 32 | See Notes to Financial Statements. |
| Statements of Operations | | IVA Funds |
| For the Year Ended September 30, 2013 |
|
| | | IVA | | IVA |
| | | Worldwide | | International |
| | | Fund | | Fund |
| | | |
| Investment Income: | | | | | | | | |
Interest | | $ | 60,058,291 | | | $ | 15,931,527 | |
| | | |
Dividends: | | | | | | | | |
Non-affiliated investments | | | 120,499,923 | | | | 51,417,346 | |
| | | |
Affiliated investments | | | 4,326,803 | | | | 8,511,469 | |
| | | |
Less: Foreign taxes withheld | | | (11,005,968 | ) | | | (6,858,087 | ) |
| | | |
| Total income | | | 173,879,049 | | | | 69,002,255 | |
| | | |
| Expenses: | | | | | | | | |
Investment advisory fees | | | 78,649,516 | | | | 26,946,250 | |
| | | |
Distribution and service fees: | | | | | | | | |
Class A | | | 5,847,894 | | | | 975,613 | |
| | | |
Class C | | | 13,720,302 | | | | 786,699 | |
| | | |
Trustee fees | | | 186,673 | | | | 57,911 | |
| | | |
Other expenses | | | 10,173,543 | | | | 3,230,045 | |
| | | |
| Total expenses | | | 108,577,928 | | | | 31,996,518 | |
| | | |
| Net investment income | | | 65,301,121 | | | | 37,005,737 | |
| | | |
Net Realized and Change in Unrealized Gain (Loss) on Investments, Written Options and Foreign Currency: | | | | | | | | |
| Net realized gain on: | | | | | | | | |
Investments on: | | | | | | | | |
Non-affiliated investments | | | 205,434,426 | | | | 31,099,103 | |
| | | |
Affiliated investments | | | 64,452,162 | | | | 33,491,234 | |
| | | |
Foreign currency transactions | | | 65,194,624 | | | | 55,854,410 | |
| | | |
| Net realized gain | | | 335,081,212 | | | | 120,444,747 | |
| | | |
Net change in unrealized appreciation (depreciation) from: | | | | | | | | |
Investments from: | | | | | | | | |
Non-affiliated investments | | | 766,678,716 | | | | 258,944,615 | |
| | | |
Affiliated investments | | | 3,880,296 | | | | (3,056,248 | ) |
| | | |
Written options | | | 2,254,909 | | | | — | |
| | | |
Foreign currency translation | | | (24,508,950 | ) | | | (12,139,361 | ) |
| | | |
| Net change in unrealized appreciation | | | 748,304,971 | | | | 243,749,006 | |
| | | |
Net realized and change in unrealized gain on investments, written options and foreign currency | | | 1,083,386,183 | | | | 364,193,753 | |
| | | |
| Increase in net assets resulting from operations | | $ | 1,148,687,304 | | | $ | 401,199,490 | |
| | | |
| See Notes to Financial Statements. | 33 |
| Statements of Changes in Net Assets | | IVA Funds |
| | | IVA Worldwide Fund | | IVA International Fund |
| | | | | |
| | | Year Ended | | Year Ended | | Year Ended | | Year Ended |
| | | September 30, | | September 30, | | September 30, | | September 30, |
| | | 2013 | | 2012 | | 2013 | | 2012 |
| | | | | |
| Operations: | | | | | | | | | | | | | | | | |
Net investment income | | $ | 65,301,121 | | | $ | 110,312,554 | | | $ | 37,005,737 | | | $ | 42,902,576 | |
| | | | | |
Net realized gain | | | 335,081,212 | | | | 166,223,459 | | | | 120,444,747 | | | | 76,113,235 | |
| | | | | |
Net change in unrealized appreciation | | | 748,304,971 | | | | 549,740,260 | | | | 243,749,006 | | | | 115,990,550 | |
| | | | | |
Increase in net assets resulting from operations | | | 1,148,687,304 | | | | 826,276,273 | | | | 401,199,490 | | | | 235,006,361 | |
| | | | | |
Distributions to Shareholders: | | | | | | | | | | | | | | | | |
Net investment income: | | | | | | | | | | | | | | | | |
Class A | | | (43,202,437 | ) | | | (20,111,017 | ) | | | (10,873,855 | ) | | | (4,961,283 | ) |
| | | | | |
Class C | | | (15,835,870 | ) | | | — | | | | (1,539,440 | ) | | | (540,056 | ) |
| | | | | |
Class I | | | (99,833,588 | ) | | | (49,104,499 | ) | | | (68,274,470 | ) | | | (32,039,991 | ) |
| | | | | |
Net realized gain on investments: | | | | | | | | | | | | | | | | |
Class A | | | (24,482,371 | ) | | | (143,027,372 | ) | | | (7,046,076 | ) | | | (16,874,933 | ) |
| | | | | |
Class C | | | (14,678,576 | ) | | | (88,435,829 | ) | | | (1,354,841 | ) | | | (3,985,245 | ) |
| | | | | |
Class I | | | (50,090,292 | ) | | | (258,845,189 | ) | | | (40,660,017 | ) | | | (92,344,215 | ) |
| | | | | |
Decrease in net assets resulting from distributions | | | (248,123,134 | ) | | | (559,523,906 | ) | | | (129,748,699 | ) | | | (150,745,723 | ) |
| | | | | |
Capital Share Transactions: | | | | | | | | | | | | | | | | |
Proceeds from shares sold | | | 1,482,931,105 | | | | 1,799,582,994 | | | | 644,494,005 | | | | 687,721,006 | |
| | | | | |
Reinvestment of distributions | | | 188,114,438 | | | | 403,223,168 | | | | 105,046,580 | | | | 122,389,472 | |
| | | | | |
Cost of shares repurchased | | | (2,251,063,484 | ) | | | (2,764,328,546 | ) | | | (482,749,158 | ) | | | (390,174,647 | ) |
| | | | | |
Increase (decrease) in net assets from capital share transactions | | | (580,017,941 | ) | | | (561,522,384 | ) | | | 266,791,427 | | | | 419,935,831 | |
| | | | | |
Increase (decrease) in net assets | | | 320,546,229 | | | | (294,770,017 | ) | | | 538,242,218 | | | | 504,196,469 | |
| | | | | |
Net Assets: | | | | | | | | | | | | | | | | |
Beginning of year | | $ | 8,881,971,554 | | | $ | 9,176,741,571 | | | $ | 2,767,985,178 | | | $ | 2,263,788,709 | |
| | | | | |
End of year | | $ | 9,202,517,783 | | | $ | 8,881,971,554 | | | $ | 3,306,227,396 | | | $ | 2,767,985,178 | |
| | | | | |
Undistributed net investment income | | $ | 78,916,001 | | | $ | 100,173,874 | | | $ | 70,476,339 | | | $ | 61,430,573 | |
| | | | | |
| 34 | See Notes to Financial Statements. |
| Financial Highlights | | IVA Funds |
IVA Worldwide Fund — Class A
For a share of each class of beneficial interest outstanding:
| | | Year Ended | | Year Ended | | Year Ended | | Year Ended | | Year Ended |
| | | September 30, | | September 30, | | September 30, | | September 30, | | September 30, |
| | | 2013 | | 2012 | | 2011 | | 2010 | | 2009 |
| | | |
Net asset value, beginning of year | | $ | 16.18 | | | $ | 15.71 | | | $ | 16.03 | | | $ | 15.00 | | | $ | 12.00 | |
| | | |
Increase from investment operations:(a) | | | | | | | | | | | | | | | | | | | | |
Net investment income(b) | | | 0.12 | | | | 0.18 | | | | 0.16 | | | | 0.21 | | | | 0.34 | |
Net realized and unrealized gain | | | 2.08 | | | | 1.26 | | | | 0.00 | | | | 1.27 | | | | 2.70 | |
| | | |
Increase from investment operations | | | 2.20 | | | | 1.44 | | | | 0.16 | | | | 1.48 | | | | 3.04 | |
| | | |
Decrease from distributions: | | | | | | | | | | | | | | | | | | | | |
Net investment income | | | (0.30 | ) | | | (0.12 | ) | | | (0.06 | ) | | | (0.10 | ) | | | (0.04 | ) |
Net realized gain on investments | | | (0.17 | ) | | | (0.85 | ) | | | (0.42 | ) | | | (0.35 | ) | | | — | |
| | | |
Decrease from distributions | | | (0.47 | ) | | | (0.97 | ) | | | (0.48 | ) | | | (0.45 | ) | | | (0.04 | ) |
| | | |
Net asset value, end of year | | $ | 17.91 | | | $ | 16.18 | | | $ | 15.71 | | | $ | 16.03 | | | $ | 15.00 | |
| | | |
Total return(c) | | | 14.02 | % | | | 9.62 | % | | | 0.86 | % | | | 10.16 | % | | | 25.39 | % |
Ratios to average net assets: | | | | | | | | | | | | | | | | | | | | |
Net operating expenses | | | 1.27 | % | | | 1.28 | % | | | 1.29 | % | | | 1.31 | % | | | 1.36 | % |
Net investment income | | | 0.72 | % | | | 1.16 | % | | | 0.93 | % | | | 1.41 | % | | | 2.51 | % |
Supplemental data: | | | | | | | | | | | | | | | | | | | | |
Portfolio turnover rate | | | 26.3 | % | | | 27.9 | % | | | 50.8 | % | | | 28.9 | % | | | 54.8 | % |
Net assets, end of year (000’s) | | $ | 2,378,045 | | | $ | 2,408,396 | | | $ | 2,714,773 | | | $ | 1,931,625 | | | $ | 755,238 | |
| |
| (a) | | The amounts shown for a share outstanding may not correlate with the Statement of Operations for the period due to the timing of sales and repurchases of fund shares in relation to income earned and/or gains (losses) both realized and unrealized during the period. |
| (b) | | Calculated using average daily shares outstanding. |
| (c) | | Total return assumes reinvestment of all distributions and does not reflect an initial sales charge. |
| See Notes to Financial Statements. | 35 |
| Financial Highlights | | IVA Funds |
IVA Worldwide Fund — Class C
For a share of each class of beneficial interest outstanding:
| | | Year Ended | | Year Ended | | Year Ended | | Year Ended | | Year Ended |
| | | September 30, | | September 30, | | September 30, | | September 30, | | September 30, |
| | | 2013 | | 2012 | | 2011 | | 2010 | | 2009 |
| | | |
Net asset value, beginning of year | | $ | 16.01 | | | $ | 15.54 | | | $ | 15.92 | | | $ | 14.92 | | | $ | 12.00 | |
| | | |
Increase from investment operations:(a) | | | | | | | | | | | | | | | | | | | | |
Net investment income (loss)(b) | | | (0.01 | ) | | | 0.06 | | | | 0.03 | | | | 0.10 | | | | 0.23 | |
Net realized and unrealized gain | | | 2.07 | | | | 1.26 | | | | 0.01 | | | | 1.25 | | | | 2.71 | |
| | | |
Increase from investment operations | | | 2.06 | | | | 1.32 | | | | 0.04 | | | | 1.35 | | | | 2.94 | |
| | | |
Decrease from distributions: | | | | | | | | | | | | | | | | | | | | |
Net investment income | | | (0.19 | ) | | | — | | | | — | | | | (0.00 | )(c) | | | (0.02 | ) |
Net realized gain on investments | | | (0.17 | ) | | | (0.85 | ) | | | (0.42 | ) | | | (0.35 | ) | | | — | |
| | | |
Decrease from distributions | | | (0.36 | ) | | | (0.85 | ) | | | (0.42 | ) | | | (0.35 | ) | | | (0.02 | ) |
| | | |
Net asset value, end of year | | $ | 17.71 | | | $ | 16.01 | | | $ | 15.54 | | | $ | 15.92 | | | $ | 14.92 | |
| | | |
Total return(d) | | | 13.13 | % | | | 8.87 | % | | | 0.09 | % | | | 9.26 | % | | | 24.51 | % |
Ratios to average net assets: | | | | | | | | | | | | | | | | | | | | |
Net operating expenses | | | 2.02 | % | | | 2.03 | % | | | 2.04 | % | | | 2.06 | % | | | 2.12 | % |
Net investment income (loss) | | | (0.03 | )% | | | 0.41 | % | | | 0.18 | % | | | 0.67 | % | | | 1.75 | % |
Supplemental data: | | | | | | | | | | | | | | | | | | | | |
Portfolio turnover rate | | | 26.3 | % | | | 27.9 | % | | | 50.8 | % | | | 28.9 | % | | | 54.8 | % |
Net assets, end of year (000’s) | | $ | 1,380,608 | | | $ | 1,469,720 | | | $ | 1,631,750 | | | $ | 1,055,144 | | | $ | 340,393 | |
| |
| (a) | | The amounts shown for a share outstanding may not correlate with the Statement of Operations for the period due to the timing of sales and repurchases of fund shares in relation to income earned and/or gains (losses) both realized and unrealized during the period. |
| (b) | | Calculated using average daily shares outstanding. |
| (c) | | Amount represents less than $0.005 per share. |
| (d) | | Total return assumes reinvestment of all distributions and does not reflect a contingent deferred sales charge. |
| 36 | See Notes to Financial Statements. |
| Financial Highlights | | IVA Funds |
IVA Worldwide Fund — Class I
For a share of each class of beneficial interest outstanding:
| | | Year Ended | | Year Ended | | Year Ended | | Year Ended | | Year Ended |
| | | September 30, | | September 30, | | September 30, | | September 30, | | September 30, |
| | | 2013 | | 2012 | | 2011 | | 2010 | | 2009 |
| | | |
Net asset value, beginning of year | | $ | 16.21 | | | $ | 15.73 | | | $ | 16.05 | | | $ | 15.02 | | | $ | 12.00 | |
| | | |
Increase from investment operations:(a) | | | | | | | | | | | | | | | | | | | | |
Net investment income(b) | | | 0.16 | | | | 0.23 | | | | 0.20 | | | | 0.25 | | | | 0.37 | |
Net realized and unrealized gain | | | 2.08 | | | | 1.26 | | | | 0.00 | | | | 1.27 | | | | 2.69 | |
| | | |
Increase from investment operations | | | 2.24 | | | | 1.49 | | | | 0.20 | | | | 1.52 | | | | 3.06 | |
| | | |
Decrease from distributions: | | | | | | | | | | | | | | | | | | | | |
Net investment income | | | (0.34 | ) | | | (0.16 | ) | | | (0.10 | ) | | | (0.14 | ) | | | (0.04 | ) |
Net realized gain on investments | | | (0.17 | ) | | | (0.85 | ) | | | (0.42 | ) | | | (0.35 | ) | | | — | |
| | | |
Decrease from distributions | | | (0.51 | ) | | | (1.01 | ) | | | (0.52 | ) | | | (0.49 | ) | | | (0.04 | ) |
| | | |
Net asset value, end of year | | $ | 17.94 | | | $ | 16.21 | | | $ | 15.73 | | | $ | 16.05 | | | $ | 15.02 | |
| | | |
Total return(c) | | | 14.28 | % | | | 9.97 | % | | | 1.09 | % | | | 10.40 | % | | | 25.62 | % |
Ratios to average net assets: | | | | | | | | | | | | | | | | | | | | |
Net operating expenses | | | 1.02 | % | | | 1.03 | % | | | 1.04 | % | | | 1.06 | % | | | 1.14 | % |
Net investment income | | | 0.97 | % | | | 1.43 | % | | | 1.18 | % | | | 1.65 | % | | | 2.78 | % |
Supplemental data: | | | | | | | | | | | | | | | | | | | | |
Portfolio turnover rate | | | 26.3 | % | | | 27.9 | % | | | 50.8 | % | | | 28.9 | % | | | 54.8 | % |
Net assets, end of year (000’s) | | $ | 5,443,865 | | | $ | 5,003,855 | | | $ | 4,830,219 | | | $ | 2,877,664 | | | $ | 1,267,395 | |
| |
| (a) | | The amounts shown for a share outstanding may not correlate with the Statement of Operations for the period due to the timing of sales and repurchases of fund shares in relation to income earned and/or gains (losses) both realized and unrealized during the period. |
| (b) | | Calculated using average daily shares outstanding. |
| (c) | | Total return assumes reinvestment of all distributions. |
| See Notes to Financial Statements. | 37 |
| Financial Highlights | | IVA Funds |
IVA International Fund — Class A
For a share of each class of beneficial interest outstanding:
| | | Year Ended | | Year Ended | | Year Ended | | Year Ended | | Year Ended |
| | | September 30, | | September 30, | | September 30, | | September 30, | | September 30, |
| | | 2013 | | 2012 | | 2011 | | 2010 | | 2009 |
| | | |
Net asset value, beginning of year | | $ | 15.95 | | | $ | 15.56 | | | $ | 15.59 | | | $ | 14.59 | | | $ | 12.00 | |
| | | |
Increase from investment operations:(a) | | | | | | | | | | | | | | | | | | | | |
Net investment income(b) | | | 0.16 | | | | 0.23 | | | | 0.20 | | | | 0.17 | | | | 0.27 | |
Net realized and unrealized gain | | | 2.00 | | | | 1.16 | | | | 0.20 | | | | 1.25 | | | | 2.36 | |
| | | |
Increase from investment operations | | | 2.16 | | | | 1.39 | | | | 0.40 | | | | 1.42 | | | | 2.63 | |
| | | |
Decrease from distributions: | | | | | | | | | | | | | | | | | | | | |
Net investment income | | | (0.44 | ) | | | (0.23 | ) | | | (0.02 | ) | | | (0.16 | ) | | | (0.04 | ) |
Net realized gain on investments | | | (0.28 | ) | | | (0.77 | ) | | | (0.41 | ) | | | (0.26 | ) | | | — | |
| | | |
Decrease from distributions | | | (0.72 | ) | | | (1.00 | ) | | | (0.43 | ) | | | (0.42 | ) | | | (0.04 | ) |
| | | |
Net asset value, end of year | | $ | 17.39 | | | $ | 15.95 | | | $ | 15.56 | | | $ | 15.59 | | | $ | 14.59 | |
| | | |
Total return(c) | | | 14.09 | % | | | 9.53 | % | | | 2.56 | %(d) | | | 9.96 | %(d) | | | 21.96 | %(d) |
Ratios to average net assets: | | | | | | | | | | | | | | | | | | | | |
Net operating expenses | | | 1.26 | % | | | 1.27 | % | | | 1.30 | % | | | 1.39 | % | | | 1.40 | %(e) |
Net investment income | | | 0.97 | % | | | 1.52 | % | | | 1.19 | % | | | 1.13 | % | | | 2.14 | %(f) |
Supplemental data: | | | | | | | | | | | | | | | | | | | | |
Portfolio turnover rate | | | 40.1 | % | | | 29.9 | % | | | 54.3 | % | | | 28.1 | % | | | 46.6 | % |
Net assets, end of year (000’s) | | $ | 377,043 | | | $ | 409,163 | | | $ | 371,560 | | | $ | 240,245 | | | $ | 104,420 | |
| |
| (a) | | The amounts shown for a share outstanding may not correlate with the Statement of Operations for the period due to the timing of sales and repurchases of fund shares in relation to income earned and/or gains (losses) both realized and unrealized during the period. |
| (b) | | Calculated using average daily shares outstanding. |
| (c) | | Total return assumes reinvestment of all distributions and does not reflect an initial sales charge. |
| (d) | | The total returns include the effect of certain contractual fee waivers and/or expense reimbursements. |
| (e) | | Reflects certain contractual fee waivers and/or expense reimbursements (exclusive of acquired fund fees and expenses, brokerage expenses, interest expense, taxes, organizational and extraordinary expenses) to limit the amount of total operating expenses to 1.40%. The ratio of expenses to average net assets without the effect of fee waivers and/or reimbursements was 1.55% for the year ended September 30, 2009. |
| (f) | | The ratio of net investment income to average net assets without the effect of certain contractual fee waivers and/or expense reimbursements was 1.99% for the year ended September 30, 2009. |
| 38 | See Notes to Financial Statements. |
| Financial Highlights | | IVA Funds |
IVA International Fund — Class C
For a share of each class of beneficial interest outstanding:
| | | Year Ended | | Year Ended | | Year Ended | | Year Ended | | Year Ended |
| | | September 30, | | September 30, | | September 30, | | September 30, | | September 30, |
| | | 2013 | | 2012 | | 2011 | | 2010 | | 2009 |
| | | |
Net asset value, beginning of year | | $ | 15.74 | | | $ | 15.35 | | | $ | 15.48 | | | $ | 14.51 | | | $ | 12.00 | |
| | | |
Increase from investment operations:(a) | | | | | | | | | | | | | | | | | | | | |
Net investment income(b) | | | 0.04 | | | | 0.11 | | | | 0.07 | | | | 0.06 | | | | 0.17 | |
Net realized and unrealized gain | | | 1.96 | | | | 1.15 | | | | 0.21 | | | | 1.23 | | | | 2.36 | |
| | | |
Increase from investment operations | | | 2.00 | | | | 1.26 | | | | 0.28 | | | | 1.29 | | | | 2.53 | |
| | | |
Decrease from distributions: | | | | | | | | | | | | | | | | | | | | |
Net investment income | | | (0.32 | ) | | | (0.10 | ) | | | — | | | | (0.06 | ) | | | (0.02 | ) |
Net realized gain on investments | | | (0.28 | ) | | | (0.77 | ) | | | (0.41 | ) | | | (0.26 | ) | | | — | |
| | | |
Decrease from distributions | | | (0.60 | ) | | | (0.87 | ) | | | (0.41 | ) | | | (0.32 | ) | | | (0.02 | ) |
| | | |
Net asset value, end of year | | $ | 17.14 | | | $ | 15.74 | | | $ | 15.35 | | | $ | 15.48 | | | $ | 14.51 | |
| | | |
Total return(c) | | | 13.18 | % | | | 8.76 | % | | | 1.76 | %(d) | | | 9.05 | %(d) | | | 21.10 | %(d) |
Ratios to average net assets: | | | | | | | | | | | | | | | | | | | | |
Net operating expenses | | | 2.01 | % | | | 2.02 | % | | | 2.06 | % | | | 2.15 | %(e) | | | 2.15 | %(e) |
Net investment income | | | 0.26 | % | | | 0.74 | % | | | 0.42 | % | | | 0.41 | %(f) | | | 1.38 | %(f) |
Supplemental data: | | | | | | | | | | | | | | | | | | | | |
Portfolio turnover rate | | | 40.1 | % | | | 29.9 | % | | | 54.3 | % | | | 28.1 | % | | | 46.6 | % |
Net assets, end of year (000’s) | | $ | 81,804 | | | $ | 77,882 | | | $ | 79,196 | | | $ | 55,824 | | | $ | 19,028 | |
| |
| (a) | | The amounts shown for a share outstanding may not correlate with the Statement of Operations for the period due to the timing of sales and repurchases of fund shares in relation to income earned and/or gains (losses) both realized and unrealized during the period. |
| (b) | | Calculated using average daily shares outstanding. |
| (c) | | Total return assumes reinvestment of all distributions and does not reflect a contingent deferred sales charge. |
| (d) | | The total returns include the effect of certain contractual fee waivers and/or expense reimbursements. |
| (e) | | Reflects certain contractual fee waivers and/or expense reimbursements (exclusive of acquired fund fees and expenses, brokerage expenses, interest expense, taxes, organizational and extraordinary expenses) to limit the amount of total operating expenses to 2.15%. The ratio of expenses to average net assets without the effect of fee waivers and/or reimbursements was 2.17% and 2.49% for the years ended September 30, 2010 and 2009, respectively. |
| (f) | | The ratio of net investment income to average net assets without the effect of certain contractual fee waivers and/or expense reimbursements was 0.38% and 1.04% for the years ended September 30, 2010 and 2009, respectively. |
| See Notes to Financial Statements. | 39 |
| Financial Highlights | | IVA Funds |
IVA International Fund — Class I
For a share of each class of beneficial interest outstanding:
| | | Year Ended | | Year Ended | | Year Ended | | Year Ended | | Year Ended |
| | | September 30, | | September 30, | | September 30, | | September 30, | | September 30, |
| | | 2013 | | 2012 | | 2011 | | 2010 | | 2009 |
| | | |
Net asset value, beginning of year | | $ | 15.99 | | | $ | 15.60 | | | $ | 15.62 | | | $ | 14.62 | | | $ | 12.00 | |
| | | |
Increase from investment operations:(a) | | | | | | | | | | | | | | | | | | | | |
Net investment income(b) | | | 0.21 | | | | 0.27 | | | | 0.24 | | | | 0.21 | | | | 0.31 | |
Net realized and unrealized gain | | | 1.99 | | | | 1.16 | | | | 0.21 | | | | 1.24 | | | | 2.35 | |
| | | |
Increase from investment operations | | | 2.20 | | | | 1.43 | | | | 0.45 | | | | 1.45 | | | | 2.66 | |
| | | |
Decrease from distributions: | | | | | | | | | | | | | | | | | | | | |
Net investment income | | | (0.48 | ) | | | (0.27 | ) | | | (0.06 | ) | | | (0.19 | ) | | | (0.04 | ) |
Net realized gain on investments | | | (0.28 | ) | | | (0.77 | ) | | | (0.41 | ) | | | (0.26 | ) | | | — | |
| | | |
Decrease from distributions | | | (0.76 | ) | | | (1.04 | ) | | | (0.47 | ) | | | (0.45 | ) | | | (0.04 | ) |
| | | |
Net asset value, end of year | | $ | 17.43 | | | $ | 15.99 | | | $ | 15.60 | | | $ | 15.62 | | | $ | 14.62 | |
| | | |
Total return(c) | | | 14.34 | % | | | 9.81 | % | | | 2.86 | %(d) | | | 10.19 | %(d) | | | 22.28 | %(d) |
Ratios to average net assets: | | | | | | | | | | | | | | | | | | | | |
Net operating expenses | | | 1.01 | % | | | 1.02 | % | | | 1.05 | % | | | 1.13 | % | | | 1.15 | %(e) |
Net investment income | | | 1.31 | % | | | 1.79 | % | | | 1.45 | % | | | 1.44 | % | | | 2.41 | %(f) |
Supplemental data: | | | | | | | | | | | | | | | | | | | | |
Portfolio turnover rate | | | 40.1 | % | | | 29.9 | % | | | 54.3 | % | | | 28.1 | % | | | 46.6 | % |
Net assets, end of year (000’s) | | $ | 2,847,380 | | | $ | 2,280,940 | | | $ | 1,813,032 | | | $ | 1,067,427 | | | $ | 360,075 | |
| |
| (a) | | The amounts shown for a share outstanding may not correlate with the Statement of Operations for the period due to the timing of sales and repurchases of fund shares in relation to income earned and/or gains (losses) both realized and unrealized during the period. |
| (b) | | Calculated using average daily shares outstanding. |
| (c) | | Total return assumes reinvestment of all distributions. |
| (d) | | The total returns include the effect of certain contractual fee waivers and/or expense reimbursements. |
| (e) | | Reflects certain contractual fee waivers and/or expense reimbursements (exclusive of acquired fund fees and expenses, brokerage expenses, interest expense, taxes, organizational and extraordinary expenses) to limit the amount of total operating expenses to 1.15%. The ratio of expenses to average net assets without the effect of fee waivers and/or reimbursements was 1.28% for the year ended September 30, 2009. |
| (f) | | The ratio of net investment income to average net assets without the effect of certain contractual fee waivers and/or expense reimbursements was 2.28% for the year ended September 30, 2009. |
| 40 | See Notes to Financial Statements. |
| Notes to Financial Statements | | IVA Funds |
Note 1 – Organization and Significant Accounting Policies
IVA Fiduciary Trust (the “Trust”) consists of the IVA Worldwide Fund (the “Worldwide Fund”) and IVA International Fund (the “International Fund”) (each, a “Fund” and, together, the “Funds”). The Worldwide Fund and the International Fund are each an investment portfolio of the Trust, an open-end series management investment company registered under the Investment Company Act of 1940, as amended (the “1940 Act”), and organized as a Massachusetts business trust. The Funds commenced investment operations on October 1, 2008. The Worldwide Fund seeks long-term growth of capital by investing in a range of securities and asset classes from markets around the world, including U.S. markets. The International Fund seeks long-term growth of capital by investing in a range of securities and asset classes from markets around the world.
The following are significant accounting policies followed by the Funds in the preparation of their financial statements in conformity with accounting principles generally accepted in the United States of America (“U.S. GAAP”).
Use of Estimates. Preparation of these financial statements in conformity with U.S. GAAP requires the Funds’ management to make estimates and assumptions that may affect the amounts reported in the financial statements and related notes. Actual results could differ from these estimates.
Valuation of the Funds. The net asset value per share (“NAV”) of a Fund’s shares of a particular class is calculated each day that the New York Stock Exchange (“NYSE”) is open.
Listed equity securities are generally valued at the last sale price on the exchange that is the primary market for such securities. Equity securities listed on the NASDAQ Stock Exchange (“NASDAQ”) are generally valued using the NASDAQ Official Closing Price (“NOCP”). If no sales or NOCPs are reported during the day, equity securities are generally valued at the mean of the last available bid and asked quotations on the exchange or market on which the security is primarily traded, or using other market information obtained from a quotation reporting system, established market makers, or pricing services. If there is only a bid or only an asked price on such date, valuation will be at such bid or asked price for long and short positions, respectively. Over-the-counter (“OTC”) equity securities not listed on NASDAQ are generally valued at the mean of the last available bid and asked quotations on the market on which the security is primarily traded, or using other market information obtained from a quotation reporting system, established market makers or pricing services. If there is only a bid or only an asked price on such date, valuation will be at such bid or asked price for long or short positions, respectively.
Exchange-traded options are generally valued at the NBBO (National Best Bid and Offer from participant exchanges) reported by the Options Price Reporting Authority. Exchange-traded options may also be valued at the mean of the bid and asked quotations on an exchange at closing. OTC options not traded on an exchange are valued at the mean of the bid and asked quotations. If there is only a bid or only an asked price on such date, valuation will be at such bid or asked price for long or short options, respectively.
Precious metals, including gold bullion, are valued at the spot price at the time trading on the NYSE closes (normally 4:00 p.m. E.S.T.).
Debt securities (except for short-term investments having a maturity of 60 days or less as described below) for which market quotations are readily available are valued at the mean between the last bid and asked prices received from dealers in the OTC market in the U.S. or abroad, except that when no asked price is available, debt securities are valued at the last bid price alone. Short-term investments having a maturity of 60 days or less are generally valued at amortized cost, which approximates fair value.
Forward foreign currency contracts are valued at the current cost of offsetting such contracts.
The value of any investment that is listed or traded on more than one exchange or market is based on the exchange or market determined by International Value Advisers, LLC (the “Adviser”) to be the primary trading venue for that investment. A quotation from the exchange or market deemed by the Adviser to be the secondary trading venue for a particular investment may be relied upon in instances where a quotation is not available on the primary exchange or market.
| Notes to Financial Statements | | IVA Funds |
The Board of Trustees of the Trust (the “Board”) has established a Pricing and Fair Valuation Committee (the “Committee”) comprised of officers of the Adviser to which it has delegated the responsibility for overseeing the implementation of the Funds’ valuation procedures and fair value determinations made on behalf of the Board. The Committee may determine that market quotations are not readily available due to events relating to a single issuer (e.g., corporate actions or announcements) or events relating to multiple issuers (e.g., governmental actions or natural disasters). The Committee may determine that there has been a significant decrease in the volume and level of activity for an asset or liability whereby transactions or quoted prices may not be determinative of fair value. The Committee may determine the fair value of investments based on information provided by pricing services and other third parties, including broker-dealers and other market intermediaries, which may recommend fair value prices or adjustments with reference to other securities, indices or assets. For securities that do not trade during NYSE hours or securities for which there is a foreign market holiday when the NYSE is open, fair valuation determinations are based on analyses of market movements after the close of those securities’ primary markets, and include reviews of developments in foreign markets, the performance of U.S. securities markets, and the performance of instruments trading in U.S. markets that represent foreign securities or baskets of foreign securities. Fair value pricing may require subjective determinations about the value of an asset or liability. Fair values used to determine the Funds’ NAVs may differ from quoted or published prices, or from prices that are used by others, for the same investments. The use of fair value pricing may not always result in adjustments to the prices of securities or other assets or liabilities held by the Funds.
Fair Value Measurement. The Funds adhere to Financial Accounting Standards Board (“FASB”) Accounting Standards Codification 820-10-65 (“ASC 820-10-65”), Fair Value Measurements and Disclosures and Accounting Standards Update No. 2011-04, Fair Value Measurement and Disclosures - Amendments to Achieve Common Fair Value Measurement Disclosure Requirements in U.S. GAAP and International Financial Reporting Standards (ASU 2011 – 04). ASC 820-10-65 establishes a single definition of fair value, creates a three-tier hierarchy as a framework for measuring fair value based on inputs used to value the Funds’ assets and liabilities, and requires additional disclosure about fair value. ASU 2011-04 provides for the disclosure of any transfers between Level 1, Level 2 and Level 3 investments. The hierarchy of inputs is summarized below:
| | • | | Level 1 – | quoted prices in active markets for identical investments |
| | | | | |
| | • | | Level 2 – | other significant observable inputs (including quoted prices for similar or identical investments, amortized cost, interest rates, prepayment speeds, credit risk, other observable market data, etc.) |
| | | | | |
| | • | | Level 3 – | significant unobservable inputs (including the Funds’ own assumptions in determining the fair value of investments) |
The following is a summary of the inputs used in valuing the Worldwide Fund’s assets and liabilities at fair value:
| | | Quoted Prices in | | Other Significant | | Significant | | | | |
| | | Active Markets | | Observable | | Unobservable | | | | |
| | | for Identical | | Inputs | | Inputs | | | | |
| ASSETS | | Investments (Level 1) | | (Level 2) | | (Level 3) | | Total |
| |
| Common stocks: | | | | | | | | | | | | | | | | | | |
Foreign | | | $ | 2,638,151,427 | | | | | — | | | | — | | | $ | 2,638,151,427 | |
United States | | | | 2,117,244,286 | | | | | — | | | | — | | | | 2,117,244,286 | |
| Preferred stocks | | | | 63,657,784 | | | | | — | | | | — | | | | 63,657,784 | |
| Convertible preferred stock | | | | 39,191,040 | | | | | — | | | | — | | | | 39,191,040 | |
| Corporate notes & bonds | | | | — | | | | $ | 621,441,717 | | | | — | | | | 621,441,717 | |
| Sovereign government bonds | | | | — | | | | | 546,546,981 | | | | — | | | | 546,546,981 | |
| Commodities | | | | 301,344,659 | | | | | — | | | | — | | | | 301,344,659 | |
| Short-term investments | | | | — | | | | | 2,815,911,407 | | | | — | | | | 2,815,911,407 | |
| |
| Total assets | | | $ | 5,159,589,196 | | | | $ | 3,983,900,105 | | | | — | | | $ | 9,143,489,301 | |
| |
| LIABILITIES | | | | | | | | | | | | | | | | | | |
| |
Unrealized depreciation on open forward foreign currency contracts | | | | — | | | | $ | (20,071,493 | ) | | | — | | | $ | (20,071,493 | ) |
| Written options | | | $ | (3,722,043 | ) | | | | — | | | | — | | | | (3,722,043 | ) |
| |
| Total liabilities | | | $ | (3,722,043 | ) | | | $ | (20,071,493 | ) | | | — | | | $ | (23,793,536 | ) |
| |
The Fund’s policy is to recognize transfers between levels as of the end of the reporting period. At September 30, 2013, there were no significant tranfers between any levels. For the years ended September 30, 2013 and September 30, 2012, there were no Level 3 assets or liabilities held in the Worldwide Fund.
| Notes to Financial Statements | | IVA Funds |
The following is a summary of the inputs used in valuing the International Fund’s assets and liabilities at fair value:
| | | Quoted Prices in | | Other Significant | | Significant | | | | |
| | | Active Markets | | Observable | | Unobservable | | | | |
| | | for Identical | | Inputs | | Inputs | | | | |
| ASSETS | | Investments (Level 1) | | (Level 2) | | (Level 3) | | Total |
| |
| Common stocks: | | | | | | | | | | | | | | | | | | |
Foreign | | | $ | 1,794,258,531 | | | | $ | 270,999 | | | | — | | | $ | 1,794,529,530 | |
| Preferred stock | | | | 624,601 | | | | | — | | | | — | | | | 624,601 | |
| Corporate notes & bonds | | | | — | | | | | 205,961,180 | | | | — | | | | 205,961,180 | |
| Sovereign government bonds | | | | — | | | | | 262,991,432 | | | | — | | | | 262,991,432 | |
| Commodities | | | | 107,384,464 | | | | | — | | | | — | | | | 107,384,464 | |
| Short-term investments | | | | — | | | | | 909,182,295 | | | | — | | | | 909,182,295 | |
| |
| Total assets | | | $ | 1,902,267,596 | | | | $ | 1,378,405,906 | | | | — | | | $ | 3,280,673,502 | |
| |
| LIABILITIES | | | | | | | | | | | | | | | | | | |
| |
Unrealized depreciation on open forward foreign currency contracts | | | | — | | | | $ | (10,869,146 | ) | | | — | | | $ | (10,869,146 | ) |
| |
The Fund’s policy is to recognize transfers between levels as of the end of the reporting period. At September 30, 2013, the International Fund had transfers of $270,999 from Level 1 to Level 2 as a result of the Fund using quoted prices in the absence of a last price. For the years ended September 30, 2013 and September 30, 2012, there were no Level 3 assets or liabilities held in the International Fund.
Foreign Currency Translation. Portfolio securities and other assets and liabilities initially valued in currencies other than the U.S. dollar are converted to U.S. dollars using exchange rates obtained from pricing services.
The Funds do not isolate that portion of the results of operations resulting from changes in foreign exchange rates on investments from the fluctuations arising from changes in market prices of investments held. Such fluctuations are included with the net realized and change in unrealized gain or loss on investments.
Net realized foreign exchange gains or losses arise from sales of foreign currencies, including gains and losses on forward foreign currency contracts, currency gains or losses realized between the trade and settlement dates on securities transactions, and the difference between the amounts of dividends, interest, and foreign withholding taxes recorded on each Fund’s books and the U.S. dollar equivalent of the amounts actually received or paid. Net change in unrealized foreign exchange gains and losses arise from changes in the fair values of assets and liabilities, other than investments, at the date of valuation, resulting from changes in exchange rates.
Portfolio Transactions and Investment Income. Portfolio transactions are recorded on a trade date basis. Interest income, adjusted for amortization of premium and accretion of discount, is recorded on the accrual basis. Dividend income is recorded on the ex-dividend date. Realized gains and losses on investment transactions are determined by the specific identification method.
Class Allocation. Investment income, realized and unrealized gains and losses, and Fund expenses and expense reductions, if any, are allocated daily to the various classes of each Fund pro rata on the basis of relative net assets. Each class bears certain expenses unique to that class. Differences in class-level expenses may result in payment of different per share dividends by each share class.
Distributions to Shareholders. Distributions are recorded on the ex-dividend date and are determined in accordance with federal income tax regulations, which may differ from U.S. GAAP. Accordingly, the nature of distributions and composition of net assets for tax purposes differ from those reflected in the accompanying financial statements.
Federal and Other Taxes. It is each Fund’s policy to comply with the federal income and excise tax requirements of the Internal Revenue Code of 1986, as amended, applicable to regulated investment companies. Accordingly, each Fund intends to distribute substantially all of its taxable income and net realized gains, if any, to shareholders each year. Therefore, no federal income tax provision is required in the Funds’ financial statements.
| Notes to Financial Statements | IVA Funds |
The Funds adhere to the provisions of the FASB Accounting Standards Codification 740-10 (“ASC 740-10”), Accounting for Uncertainty in Income Taxes. This standard defines the threshold for recognizing tax positions in the financial statements as “more-likely-than-not” to be sustained by the applicable taxing authority and requires measurement of a tax position meeting the “more-likely-than-not” criterion, based on the largest benefit that is more than fifty percent realized. Management has analyzed each Fund’s tax positions taken on federal and state tax returns for all open tax years (current, 2012, 2011 and 2010) and determined that no provision for income tax would be required in the Funds’ financial statements. Tax-related interest or penalties, if applicable, are to be disclosed in the Statement of Operations. For the year ended September 30, 2013, the Funds did not incur any tax-related interest or penalties.
Under the applicable foreign tax laws, a withholding tax may be imposed on interest, dividends and capital gains at various rates.
Forward Foreign Currency Contracts. Each Fund engages in buying and selling forward foreign currency contracts to seek to manage the exposure of investments denominated in non-U.S. currencies against fluctuations in relative value. A forward foreign currency contract involves a privately negotiated obligation to purchase or sell (with delivery generally required) a specific currency at a future date, at a price set at the time of the contract.
Options Transactions. During the year ended September 30, 2013, the Worldwide Fund wrote covered puts on equity securities. Each Fund may write call options to seek to enhance investment return or to hedge against declines in the prices of portfolio securities or may write put options to hedge against increases in the prices of securities which it intends to purchase. A call option is covered if a Fund holds, on a share-for-share basis, either the underlying shares or a call on the same security as the call written where the exercise price of the call held is equal to or less than the exercise price of the call written (or greater than the exercise price of the call written if the difference is maintained by a Fund in cash, treasury bills or other high grade short-term obligations in a segregated account with its custodian). A put option is covered if a Fund maintains cash, treasury bills or other high grade short-term obligations with a value equal to the exercise price in a segregated account with its custodian, or holds on a share-for-share basis a put on the same equity security as the put written where the exercise price of the put held is equal to or greater than the exercise price of the put written, or lower than the exercise price of the put written if the difference is maintained in a segregated account with its custodian.
Premiums received for writing options that expire unexercised are recognized on the expiration date as realized gains. If an option is exercised, the premium received is subtracted from the cost of the purchase or added to the proceeds of the sale to determine whether the Fund has realized a gain or loss on the put or call. When a Fund enters into a closing transaction, the Fund will realize a gain or loss depending upon whether the amount from the closing transaction is greater or less than the premium received.
Foreign Investment Risk. Each Fund invests in foreign investments. Foreign investments can involve additional risks relating to political, economic or regulatory conditions in foreign countries. These risks include fluctuations in foreign currencies; withholding or other taxes; trading, settlement, custodial, and other operational risks; and the less stringent investor protection and disclosure standards of some foreign markets. Since foreign exchanges may be open on days when a Fund does not price its shares, the value of the investments in such Fund’s portfolio may change on days when shareholders will not be able to purchase or sell the Fund’s shares.
Custodian Risk. Cash is held at the Funds’ custodian, State Street Bank and Trust Company (the “Custodian”). The Funds are subject to credit risk on any cash balance that exceeds the amount insured by the Federal Deposit Insurance Corporation to the extent that the Custodian may be unable to return cash held.
Indemnification. Under the Trust’s organizational documents, its officers and trustees are indemnified against certain liability arising out of the performance of their duties to the Funds. The Funds have a variety of indemnification obligations under contracts with their service providers. The Funds’ maximum exposure under these arrangements is unknown. However, the Funds have not had prior claims or losses pursuant to these contracts and expects the risk of loss to be remote.
Note 2 – Investment Advisory Agreement and Distribution Agreement
International Value Advisers, LLC is the investment adviser of the Funds. The Adviser’s primary business is to provide investment management services to a variety of investment vehicles, including the Funds. The Adviser is responsible for all business activities and oversight of the investment decisions made for the Funds.
In return for providing investment advisory services to the Funds, each Fund pays the Adviser an investment advisory fee, calculated daily and paid monthly, at an annual rate of 0.90% of each Fund’s average daily net assets. Investment advisory fees paid for the year ended September 30, 2013 are disclosed in the Statements of Operations.
| Notes to Financial Statements | IVA Funds |
The Funds have adopted Distribution and Services Plans (“12b-1 Plans”), pursuant to Rule 12b-1 under the 1940 Act. Under those 12b-1 Plans, the Funds pay a distribution fee with respect to Class A and C shares calculated at the annual rate of 0.25% and 0.75%, respectively, of the average daily net assets of each respective class. The Funds also pay a service fee with respect to Class C shares calculated at the annual rate of 0.25% of the average daily net assets. Class I shares do not participate in 12b-1 Plans. Fees paid under the 12b-1 Plans for the year ended September 30, 2013 are disclosed in the Statements of Operations.
IVA Funds Distributors, LLC serves as the Funds’ sole and exclusive distributor.
There is a maximum initial sales charge of 5.00% for Class A shares. Class A shares may be subject to a contingent deferred sales charge (“CDSC”) of 0.75% if $1,000,000 or more of Class A shares were initially purchased, a “finder’s fee” was paid to the dealer of record, and the Class A shares were subsequently redeemed within 18 months.
Class C shares may be subject to a CDSC of 1.00% if shares are redeemed within the first 12 months after purchase.
Note 3 – Investments
For the year ended September 30, 2013, the aggregate cost of purchases and proceeds from sales of investments (excluding short-term investments) were as follows:
| | | Worldwide | | International |
| | | Fund | | Fund |
| |
| Purchases | | $ | 1,769,929,316 | | | $ | 894,480,276 | |
| |
| Sales | | $ | 3,884,638,896 | | | $ | 975,112,511 | |
| |
The cost basis of investments for federal income tax purposes is substantially similar to the cost basis under U.S. GAAP. The following information is presented on a federal tax basis as of September 30, 2013.
| | | Worldwide | | International |
| | | Fund | | Fund |
| |
| Cost basis of investments | | $ | 8,039,014,014 | | | $ | 2,942,084,277 | |
| |
| Gross unrealized appreciation | | $ | 1,264,021,216 | | | $ | 387,613,253 | |
| |
| Gross unrealized depreciation | | $ | (159,545,929 | ) | | $ | (49,024,028 | ) |
| |
| Net unrealized appreciation | | $ | 1,104,475,287 | | | $ | 338,589,225 | |
| |
For the year ended September 30, 2013, written options transactions for the Worldwide Fund were as follows:
| | | Number of Contracts | | | Premiums | |
| |
| Written Options, outstanding September 30, 2012 | | — | | | | — | |
| Options written | | (749 | ) | | $ | (5,976,952 | ) |
| Options exercised | | — | | | | — | |
| Options expired | | — | | | | — | |
| |
| Written Options, outstanding September 30, 2013 | | (749 | ) | | $ | (5,976,952 | ) |
| |
Note 4 – Derivative Instruments and Hedging Activities
The Funds enter into transactions involving derivative financial instruments in connection with their investing activities. During the year ended September 30, 2013, these instruments included written put options and forward foreign currency contracts. These instruments are subject to various risks similar to non-derivative instruments including market, credit and liquidity risks.
The use of derivative instruments may involve risks different from, or potentially greater than, the risks associated with investing directly in investments. Specifically, derivative instruments expose a Fund to the risk that the counterparty to an OTC derivatives contract will be unable or unwilling to make timely settlement payments or otherwise to honor its obligations. OTC derivatives transactions typically can only be closed out with the other party to the transaction. If the counterparty defaults, a Fund will have contractual remedies, but there is no assurance that the counterparty will meet its contractual obligations or that, in the event of default, a Fund will succeed in enforcing them. During the year ended September 30, 2013, the Funds had exposure to OTC derivatives in the form of forward foreign currency contracts.
| Notes to Financial Statements | IVA Funds |
Forward foreign currency contracts involve elements of market risk in excess of the amounts reflected in the Statements of Assets and Liabilities. The Funds bear the risk of an unfavorable change in the foreign exchange rate underlying the forward foreign currency contract, movements in foreign investment security values and changes in interest rates. Credit risks may also arise upon entering into these contracts from the potential inability of counterparties to meet the terms of their contracts.
Options transactions involve elements of market risk in excess of the amounts reflected in the Statements of Assets and Liabilities. Price fluctuation on underlying equity or debt securities and on market indices may cause the written put or call options to be assigned on unfavorable terms to the Funds. Written put options involve elements of liquidity risk if a Fund is unable to enter into a closing transaction due to there being a lack of market makers for a particular equity or debt security. Counterparty risk associated with pledged collateral to the executing counterparty is limited to the extent that the pledged collateral is held at the Funds’ custodian. Pledged cash collateral is subject to counterparty risk at the Funds’ custodian.
The Funds adhere to FASB Accounting Standards Codification 815-10-50 (“ASC 815-10-50”), Derivative Instruments and Hedging Activities. ASC 815-10-50 requires enhanced disclosure about a Fund’s derivative and hedging activities, including how such activities are accounted for and their effect on a Fund’s financial positions, performance and cash flow.
The following summary for each Fund is grouped by risk-type and provides information about the fair value and location of derivatives within the Statements of Assets and Liabilities at September 30, 2013.
Worldwide Fund
| | | Statements of Assets | | | | |
| Risk-Type Category | | and Liabilities Location | | Fair Value |
| |
| Foreign exchange | | Unrealized depreciation on open forward foreign currency contracts | | $ | (20,071,493 | ) |
| |
| Equity | | Written options | | | (3,722,043 | ) |
| |
| Total | | | | $ | (23,793,536 | ) |
| |
| | | | | | | |
| International Fund |
| | | Statements of Assets | | | | |
| Risk-Type Category | | and Liabilities Location | | Fair Value |
| |
| Foreign exchange | | Unrealized depreciation on open forward foreign currency contracts | | $ | (10,869,146 | ) |
| |
The following is a summary for each Fund grouped by risk-type that provides information about the effect of derivatives and hedging activities on the Funds’ Statements of Operations for the year ended September 30, 2013.
Worldwide Fund
| | | | | | | | Change in |
| | | | | | | | Unrealized |
| | | | | | | | Appreciation/ |
| Risk-Type Category | | Derivative Instrument | | Realized Gain | | (Depreciation) |
| |
| Foreign exchange | | Forward foreign currency contracts | | $ | 68,087,617 | | $ | (24,712,899 | ) |
| |
| Equity | | Written options | | | — | | | 2,254,909 | |
| |
| Total | | | | $ | 68,087,617 | | $ | (22,457,990 | ) |
| |
International Fund
| | | | | | | | Change in |
| | | | | | | | Unrealized |
| | | | | | | | Appreciation/ |
| Risk-Type Category | | Derivative Instrument | | Realized Gain | | (Depreciation) |
| |
| Foreign exchange | | Forward foreign currency contracts | | $ | 57,132,671 | | $ | (12,183,989 | ) |
| |
During the year ended September 30, 2013, the Worldwide Fund had average notional values of $968,541,000 and $17,569,462, on open forward foreign currency contracts to sell and written options, respectively.
| Notes to Financial Statements | IVA Funds |
During the year ended September 30, 2013, the International Fund had average notional values of $526,993,196 on open forward foreign currency contracts to sell.
Note 5 – Shares of Beneficial Interest
At September 30, 2013, the Trust had an unlimited number of shares of beneficial interest authorized with a par value of $0.001 per share. The Funds have the ability to issue multiple classes of shares. Each share of a class represents an identical interest and has the same rights, except that each class bears certain direct expenses specifically related to the distribution of its shares.
Transactions in shares of each class of each Fund were as follows:
Worldwide Fund
| | | Year Ended | | Year Ended |
| | | September 30, 2013 | | September 30, 2012 |
| |
| | | Shares | | | Amount | | | Shares | | | Amount | |
| |
| Class A | | | | | | | | | | | | | | |
Shares sold | | 18,413,860 | | | $ | 310,105,285 | | | 24,252,544 | | | $ | 386,175,025 | |
Shares reinvested | | 3,463,152 | | | | 54,925,601 | | | 8,769,980 | | | | 132,163,588 | |
Shares repurchased | | (37,967,036 | ) | | | (632,874,677 | ) | | (56,993,255 | ) | | | (900,593,106 | ) |
| |
| Net Decrease | | (16,090,024 | ) | | $ | (267,843,791 | ) | | (23,970,731 | ) | | $ | (382,254,493 | ) |
| |
| Class C | | | | | | | | | | | | | | |
Shares sold | | 4,319,841 | | | $ | 71,921,490 | | | 8,010,244 | | | $ | 125,497,599 | |
Shares reinvested | | 1,249,500 | | | | 19,704,615 | | | 3,513,529 | | | | 52,702,931 | |
Shares repurchased | | (19,450,429 | ) | | | (319,036,601 | ) | | (24,677,438 | ) | | | (385,997,451 | ) |
| |
| Net Decrease | | (13,881,088 | ) | | $ | (227,410,496 | ) | | (13,153,665 | ) | | $ | (207,796,921 | ) |
| |
| Class I | | | | | | | | | | | | | | |
Shares sold | | 65,641,694 | | | $ | 1,100,904,330 | | | 80,993,175 | | | $ | 1,287,910,370 | |
Shares reinvested | | 7,159,888 | | | | 113,484,222 | | | 14,489,492 | | | | 218,356,649 | |
Shares repurchased | | (78,164,919 | ) | | | (1,299,152,206 | ) | | (93,682,460 | ) | | | (1,477,737,989 | ) |
| |
| Net Increase (Decrease) | | (5,363,337 | ) | | $ | (84,763,654 | ) | | 1,800,207 | | | $ | 28,529,030 | |
| |
International Fund
| | | Year Ended | | Year Ended |
| | | September 30, 2013 | | September 30, 2012 |
| |
| | | Shares | | | Amount | | | Shares | | | Amount | |
| |
| Class A | | | | | | | | | | | | | | |
Shares sold | | 3,506,749 | | | $ | 57,103,069 | | | 8,542,771 | | | $ | 129,202,545 | |
Shares reinvested | | 1,008,489 | | | | 15,641,658 | | | 1,298,458 | | | | 18,879,577 | |
Shares repurchased | | (8,480,066 | ) | | | (138,134,135 | ) | | (8,071,341 | ) | | | (124,179,381 | ) |
| |
| Net Increase (Decrease) | | (3,964,828 | ) | | $ | (65,389,408 | ) | | 1,769,888 | | | $ | 23,902,741 | |
| |
| Class C | | | | | | | | | | | | | | |
Shares sold | | 423,358 | | | $ | 6,803,977 | | | 522,825 | | | $ | 7,869,318 | |
Shares reinvested | | 143,204 | | | | 2,202,481 | | | 231,655 | | | | 3,342,778 | |
Shares repurchased | | (743,382 | ) | | | (11,968,860 | ) | | (964,507 | ) | | | (14,616,018 | ) |
| |
| Net Decrease | | (176,820 | ) | | $ | (2,962,402 | ) | | (210,027 | ) | | $ | (3,403,922 | ) |
| |
| Class I | | | | | | | | | | | | | | |
Shares sold | | 35,416,832 | | | $ | 580,586,959 | | | 35,950,689 | | | $ | 550,649,143 | |
Shares reinvested | | 5,622,337 | | | | 87,202,441 | | | 6,884,338 | | | | 100,167,117 | |
Shares repurchased | | (20,345,539 | ) | | | (332,646,163 | ) | | (16,417,956 | ) | | | (251,379,248 | ) |
| |
| Net Increase | | 20,693,630 | | | $ | 335,143,237 | | | 26,417,071 | | | $ | 399,437,012 | |
| |
| Notes to Financial Statements | IVA Funds |
Redemption Fees. The Funds impose a redemption fee of 2% of the total redemption amount on the Funds’ shares redeemed within 30 days of buying them or acquiring them by exchange. The purpose of the redemption fee is to deter excessive, short-term trading and other abusive trading practices, and to help offset the costs associated with the sale of portfolio securities to satisfy redemption and exchange requests made by “market timers” and other short-term shareholders, thereby insulating longer-term shareholders from such costs.
Note 6 – Income Tax Information and Distributions to Shareholders
The tax character of distributions paid during the fiscal year ended September 30, 2013 was as follows:
| | | Worldwide | | International |
| | | Fund | | Fund |
| |
| Distributions Paid From: | | | | | | | | |
| |
| Ordinary income | | $ | 158,871,895 | | | $ | 80,687,765 | |
| |
| Long-Term gains | | $ | 89,251,239 | | | $ | 49,060,934 | |
| |
As of September 30, 2013, the components of accumulated earnings on a tax basis were as follows:
| | | Worldwide | | International |
| | | Fund | | Fund |
| |
| Undistributed net investment income | | $ | 149,800,713 | | | $ | 84,503,572 | |
| |
| Undistributed realized gains | | | 168,973,834 | | | | 46,767,374 | |
| |
| Other book/tax temporary differences(a) | | | (156,979 | ) | | | (114,033 | ) |
| |
| Unrealized appreciation(b) | | | 1,106,935,401 | | | | 338,629,829 | |
| |
| Total accumulated earnings | | $ | 1,425,552,969 | | | $ | 469,786,742 | |
| |
| (a) | Other book/tax temporary differences are attributable primarily to the tax treatment of offering costs. |
| (b) | The difference between book-basis and tax-basis unrealized appreciation is attributable primarily to the treatment of passive foreign investment companies, the tax deferral of losses on wash sales and the treatment of forward foreign currency contracts. |
Reclassification. U.S. GAAP requires that certain components of net assets be adjusted to reflect permanent differences between financial and tax reporting. These reclassifications have no effect on net assets or NAV. For the fiscal year ended September 30, 2013, the following reclassifications have been made:
| | | Worldwide | | International |
| | | Fund | | Fund |
| |
| Undistributed net investment income | | $ | 72,312,901 | | | $ | 52,727,794 | |
| |
| Accumulated net realized loss | | $ | (86,650,555 | ) | | $ | (58,251,916 | ) |
| |
| Paid-in-capital | | $ | 14,337,654 | | | $ | 5,524,122 | |
| |
| Report of Independent Registered Public Accounting Firm | IVA Funds |
The Board of Trustees and Shareholders of
IVA Fiduciary Trust:
We have audited the accompanying statements of assets and liabilities including the schedules of investments, of IVA Worldwide Fund and IVA International Fund (the “Funds”) (the Funds comprising IVA Fiduciary Trust), as of September 30, 2013, and the related statements of operations for the year then ended, the statements of changes in net assets for each of the two years in the period then ended, and the financial highlights for each of the five years in the period then ended. These financial statements and financial highlights are the responsibility of the Funds’ management. Our responsibility is to express an opinion on these financial statements and financial highlights based on our audits.
We conducted our audits in accordance with the standards of the Public Company Accounting Oversight Board (United States). Those standards require that we plan and perform the audit to obtain reasonable assurance about whether the financial statements and financial highlights are free of material misstatement. We were not engaged to perform an audit of the Funds’ internal control over financial reporting. Our audits included consideration of internal control over financial reporting as a basis for designing audit procedures that are appropriate in the circumstances, but not for the purpose of expressing an opinion on the effectiveness of the Funds’ internal control over financial reporting. Accordingly, we express no such opinion. An audit also includes examining, on a test basis, evidence supporting the amounts and disclosures in the financial statements and financial highlights, assessing the accounting principles used and significant estimates made by management, and evaluating the overall financial statement presentation. Our procedures included confirmation of securities owned as of September 30, 2013, by correspondence with the custodian and brokers or by other appropriate auditing procedures where replies from others were not received. We believe that our audits provide a reasonable basis for our opinion.
In our opinion, the financial statements and financial highlights referred to above present fairly, in all material respects, the financial position of IVA Fiduciary Trust at September 30, 2013, the results of its operations for the year then ended, the changes in its net assets for each of the two years in the period then ended, and the financial highlights of the five years in the period then ended, in conformity with U.S. generally accepted accounting principles.

Boston, Massachusetts
November 25, 2013
| Trustees and Officers (unaudited) | IVA Funds |
The business and affairs of each Fund are managed under the direction of its Board of Trustees (the “Board”). The Board approves all significant agreements between a Fund and the persons or companies that furnish services to a Fund, including agreements with its investment adviser, distributor, administrator, custodian and transfer agent. The day-to-day operations of the Funds are delegated to the Funds’ investment adviser and administrator. The name, address, age and principal occupations for the past five years of the Trustees and officers of the Trust are listed below, along with the number of portfolios in the Fund complex overseen by and the other directorships held by each Trustee. Each Trustee’s mailing address is c/o International Value Advisers, LLC, 717 Fifth Avenue, New York, NY 10022.
| Independent Trustees(a) |
| | | | | | | | | Number of | | |
| | | | | | | | | Portfolios | | |
| | | | | Term of | | | | in the Fund | | |
| | | Position(s) | | Office(b) and | | Principal | | Complex | | Other Directorships/ |
| | | Held with | | Length of | | Occupation(s) During | | Overseen | | Trusteeships |
| Name (Birth Year) | | the Trust | | Time Served | | Past 5 Years | | by Trustee | | Held by Trustee |
| | | | | | | | | | | |
| Adele R. Wailand | | Trustee and | | since 2008 | | Corporate Secretary, | | 2 | | None. |
| (1949) | | Chair of the | | | | Case, Pomeroy & | | | | |
| | | Board | | | | Company, Inc. | | | | |
| | | | | | | (real estate and | | | | |
| | | | | | | investments); Vice | | | | |
| | | | | | | President & General | | | | |
| | | | | | | Counsel, Case, | | | | |
| | | | | | | Pomeroy & Company, | | | | |
| | | | | | | Inc. (prior to 2011). | | | | |
| | | | | | | | | | | |
| Manu Bammi | | Trustee | | since 2008 | | Founder and Chief | | 2 | | None. |
| (1962) | | | | | | Executive Officer, | | | | |
| | | | | | | SmartAnalyst, Inc. | | | | |
| | | | | | | (provider of research | | | | |
| | | | | | | and analytics and | | | | |
| | | | | | | decision support | | | | |
| | | | | | | to businesses). | | | | |
| | | | | | | | | | | |
| Ronald S. Gutstein | | Trustee | | since 2008 | | Institutional Trader | | 2 | | None. |
| (1971) | | | | | | and Market Maker, | | | | |
| | | | | | | Access Securities | | | | |
| | | | | | | (an institutional | | | | |
| | | | | | | broker-dealer). | | | | |
| | | | | | | | | | | |
| William M. Rose | | Trustee | | since 2013 | | Member, Investment | | 2 | | None. |
| (1945) | | | | | | Advisory Committee, | | | | |
| | | | | | | CYMI, Inc. (family | | | | |
| | | | | | | office) (since 2011); | | | | |
| | | | | | | President/ Chief | | | | |
| | | | | | | Investment Officer/ | | | | |
| | | | | | | Strategist, Okabena | | | | |
| | | | | | | Investment Services | | | | |
| | | | | | | (registered investment | | | | |
| | | | | | | advisor) (2006-2011). | | | | |
| (a) | Trustees who are not “interested persons” of the Trust as defined in the 1940 Act. |
| (b) | Each Trustee serves until resignation or removal from the Board. |
| Trustees and Officers (unaudited) | IVA Funds |
| Interested Trustee |
| | | | | | | | | Number of |
| | | | | | | | | Portfolios |
| | | | | Term of | | | | in the Fund |
| | | Position(s) | | Office (a) and | | Principal | | Complex |
| | | Held with | | Length of | | Occupation(s) During | | Overseen |
| Name (Birth Year) | | the Trust | | Time Served | | Past 5 Years | | by Trustee |
| | | | | | | | | |
Michael W.
Malafronte(b)
(1974) | | President and Trustee | | since 2008 | | Managing Partner, the Adviser (since 2010); CEO and Research Analyst, the Adviser (2007-2010). | | 2 |
| (a) | Each Trustee serves until resignation or removal from the Board. |
| (b) | Mr. Malafronte is considered an interested trustee due to his position as Managing Partner of the Adviser. |
Officers of the Trust
| | | | | Term of | | |
| | | | | Office and | | |
| | | Position(s) | | Length of | | |
| | | Held with | | Time | | |
| Name (Birth Year) and Address(a) | | the Trust | | Served (b) | | Principal Occupation(s) During Past 5 Years |
| | | | | | | |
Shanda Scibilia
(1971) | | Chief Compliance Officer and Secretary | | since 2008 | | Chief Operating Officer and Chief Compliance Officer, the Adviser (since 2008). |
| | | | | | | |
Stefanie J. Hempstead
(1973) | | Treasurer | | since 2008 | | Chief Financial Officer, the Adviser (since 2008). |
| | | | | | | |
Christopher Hine
(1978) | | Assistant Treasurer | | since 2010 | | Director of Accounting, the Adviser (since 2009). |
| | | | | | | |
Philip F. Coniglio
(1981) | | Assistant Secretary | | since 2011 | | Fund Operations Manager, the Adviser (since 2009); Director, Morgan Stanley (from 2007 to 2009). |
| (a) | Each officer’s mailing address is c/o International Value Advisers, LLC, 717 Fifth Avenue, New York, NY 10022. |
| (b) | The term of office of each officer is indefinite. Length of time served represents time served as an officer of the Trust, although various positions may have been held during the period. |
| Additional Information (unaudited) | IVA Funds |
Board Approval of Investment Advisory Agreement. At telephonic and in-person meetings held on May 16, 2013 and May 21, 2013, respectively, the Board of Trustees of the Trust (the “Board”), including all of the Trustees who are not “interested persons” of the Trust (the “Independent Trustees”) discussed the Investment Advisory Agreement (the “Advisory Agreement”) related to the Funds.
To assist the Board in its evaluation of the Advisory Agreement, the Independent Trustees received comprehensive written materials and other information, in adequate time in advance of the meeting, which outlined, among other things, (i) information confirming the financial condition of the Adviser and the Adviser’s profitability derived from its relationship with each Fund, (ii) information as to the advisory fee rates paid to the Adviser by each Fund and each other fund or account managed by the Adviser, (iii) information as to the advisory fee rates paid by mutual funds to other advisers selected by Morningstar, Inc. (“Morningstar”), (iv) a description of the personnel and the nature and quality of the services provided by the Adviser, (v) information on compliance matters; (vi) comparative information on investment performance of the Funds, and (vii) information regarding brokerage and portfolio transactions of the Funds. The Independent Trustees reviewed the materials provided by the Adviser, which included, among other things, the Morningstar 15(c) Report to the Board of Trustees (the “Morningstar Report”) containing detailed advisory fee, expense ratio and performance comparisons for each Fund with other mutual funds in their “peer group” and “category” as determined by the Morningstar methodology. The Independent Trustees had reviewed the memorandum prepared by Sidley Austin LLP (“Sidley Austin”), Independent Trustee Counsel, outlining the legal duties of the Independent Trustees in evaluating investment advisory arrangements.
The Adviser also had provided the Independent Trustees with an analysis of its profitability with respect to providing investment advisory services to each Fund. In addition, it was noted, the Independent Trustees took into account information furnished throughout the year at regular Board meetings, including reports on investment performance, shareholder services, distribution fees and expenses, regulatory compliance and other services provided to each Fund. The Independent Trustees also considered other matters they deemed important to the approval process, such as allocation of Fund brokerage commissions, and other direct and indirect benefits to the Adviser from its relationship with the Funds. The Trustees met throughout the year with the Portfolio Managers of the Funds (the “Portfolio Managers”). It was noted that the Independent Trustees, in their deliberations, recognized that for many of the Funds’ shareholders, the decision to purchase Fund shares included a decision to select the Adviser as the investment adviser for their investments and that there was a strong association in the minds of Fund shareholders between the Adviser and each Fund.
In considering factors relating to the approval of the continuance of the Advisory Agreement, the Independent Trustees noted that Sidley Austin had provided the Independent Trustees with assistance and advice. The Independent Trustees stated that with respect to the Advisory Agreement, although it related to both Funds, the Independent Trustees had considered each Fund separately. The Independent Trustees were satisfied that the information requested, including the supplemental information requested, provided the Independent Trustees with the information that they believed, in the exercise of their business judgment, was pertinent, sufficient and comprehensive for the purposes of their evaluation of the continuation of the Advisory Agreement. Among other factors, the Trustees noted that they considered the following:
The nature, extent and quality of services provided by the Adviser: The Independent Trustees reviewed the services that the Adviser provides to each Fund, including, but not limited to, making the day-to-day investment decisions for each Fund, and generally managing each Fund’s investments in accordance with the stated policies of the Fund. The Independent Trustees noted that throughout the year they discussed with officers and Portfolio Managers of the Funds the types of transactions that were being done on behalf of each Fund. Additionally, the Independent Trustees took into account the services provided by the Adviser to its other accounts that have investment mandates similar to the Funds. In particular, they noted the greater level of portfolio management, compliance and administrative oversight services required for the Funds, mutual funds registered under the 1940 Act, as compared to the Adviser’s institutional accounts. The Independent Trustees also considered the education, background and experience of the Adviser’s personnel, noting in particular that the favorable history and reputation of the Portfolio Managers for the Funds have had, and are likely to continue to have, a favorable impact on the Funds. In this regard, the significant growth of the Funds during the period since inception was noted, as well as the Funds imposition of a soft close and its subsequent impact on asset growth. The Independent Trustees additionally noted the Adviser’s ability to attract qualified and experienced personnel and its continued investment in the growth of its business. The Independent Trustees also considered the administrative services provided by the Adviser, including compliance and accounting services, and oversight of third party service providers. After considering the above factors, the Trustees concluded that the nature, quality and extent of services provided by the Adviser are adequate and appropriate and would continue to be suitable for each Fund. The Independent Trustees’ evaluation of the nature and quality of the services provided by the Adviser supported continuation of the Advisory Agreement.
Investment performance of each Fund and the Adviser: The Independent Trustees considered the investment performance of each Fund compared to the Morningstar peer funds, the Morningstar category funds and the relevant benchmark index. The Independent Trustees noted that the Funds have been in operation since October 1, 2008, and that the Morningstar Report
| Additional Information (unaudited) | IVA Funds |
presented performance information since inception and for the one-year and three-year periods ended December 31, 2012. It was noted that, since inception and for the three-year period, the IVA Worldwide Fund outperformed the median of the Morningstar peer group and the Morningstar category on an absolute basis and most risk-adjusted performance bases as presented in the Morningstar Report. For the one-year period, it was noted that while absolute performance was positive, the IVA Worldwide Fund underperformed the median of the Morningstar peer group and Morningstar category on an absolute basis and on most riskadjusted performance bases in the Morningstar Report, but outperformed the median of the Morningstar peer group on two risk-adjusted performance measures (Standard Deviation and Morningstar Risk – an annualized measure of a fund’s downside volatility). Similarly, with respect to the IVA International Fund, the Independent Trustees noted that since inception and for the three-year period, the Fund outperformed the median of the Morningstar peer group and the Morningstar category on an absolute basis and most risk-adjusted performance bases in the Morningstar Report. It was noted that for the one-year period, that while absolute performance was positive, IVA International Fund underperformed the median of the Morningstar peer group and Morningstar category on an absolute basis and on most risk-adjusted performance bases in the Morningstar Report, but outperformed the median of the Morningstar peer group and Morningstar category on two risk-adjusted performance measures (Standard Deviation and Morningstar Risk). Since inception and for the three-year period ended December 31, 2012, the Independent Trustees also noted that the performance of the IVA Worldwide Fund and the IVA International Fund exceeded the performance of each Fund’s benchmark index (the MSCI All Country World Index in the case of the IVA Worldwide Fund and the MSCI All Country World (ex-U.S.) Index in the case of the IVA International Fund), but that each Fund underperformed the applicable benchmark index for the one-year period ended December 31, 2012. The Independent Trustees considered the performance of the Funds in light of the Adviser’s investment approach of focusing on preservation of capital over the short-term and seeking to outperform each Fund’s benchmark over the longer term representing a full market cycle, each Fund’s asset allocation and the overall financial market conditions. Each Fund’s performance on various risk-adjusted bases and upside and downside capture percentages as reported by Morningstar were noted. They also noted that the Adviser’s interests were wellaligned with the Funds’ shareholders as a result of the significant investment in the Funds by the Adviser’s partners. The Independent Trustees determined that each Fund’s performance, in light of all the considerations noted above, was satisfactory. The Independent Trustees determined that the Adviser continued to be an appropriate investment adviser for each Fund and concluded that each Fund’s performance supported the continuation of the Advisory Agreement.
Cost of the services provided and profits realized by the Adviser from its relationship with each Fund: The Independent Trustees considered the investment advisory fee payable by each Fund as well as the expense ratio of each Fund. The Independent Trustees considered each Fund’s effective advisory fee rate at different asset levels compared to the Morningstar peer group and category funds. It was noted that each Fund’s effective advisory fee rate was above the median for the Morningstar peer group and category funds. It was noted that a number of advisers in the Morningstar peer group and category receive a separate payment from the funds for administrative services provided by the adviser, but that the Adviser does not receive such a payment from the Funds. The Independent Trustees noted that when these separate administrative fees are considered, the Adviser’s fee charged for management services for both Funds is closer to the Morningstar peer group and category medians as of December 31, 2012. The Independent Trustees also noted that the IVA Worldwide Fund’s net and gross expense ratios were lower than the median of the Morningstar category funds for both Class A and Class I shares, but higher than the median of the Morningstar peer group funds for Class A shares, and that the IVA International Fund’s net and gross expense ratios were lower than the median of the Morningstar peer group and category funds for Class A shares, but the net expense ratio was slightly higher and the gross expense ratio was lower than the medians of the Morningstar category funds for Class I shares. The Independent Trustees noted that the net and gross expense ratios for each Fund had declined since the Funds commenced operations and that this decline correlated with the growth in the assets of the Funds. The Independent Trustees concluded that each Fund’s current expense structure is satisfactory.
The Independent Trustees also reviewed the fee schedule in effect for the Adviser’s managed separate accounts, and considered that the fees charged to those accounts were lower than those charged to the Funds. The Independent Trustees were aware of the significant shareholder services, legal and regulatory requirements associated with the Adviser’s management of the Funds that was not required in servicing separate accounts.
The Independent Trustees had reviewed the portfolio transaction data for each Fund in the Morningstar Report, and noted that the brokerage fee and portfolio turnover ratio for each Fund were below the median of the applicable Morningstar peer group and category funds.
| Additional Information (unaudited) | IVA Funds |
The Independent Trustees also reviewed information regarding the profitability to the Adviser of its relationship with each Fund. The Independent Trustees considered the level of the Adviser’s profits, the change in profitability over time, and whether the profits were reasonable. The Independent Trustees took into consideration other benefits to be derived by the Adviser in connection with the Advisory Agreement. Since the Adviser has no affiliates with business relationships with the Funds, the Independent Trustees noted that the Adviser receives no additional revenues from providing other services to the Funds. Moreover, the Independent Trustees noted that the Adviser’s interests are well-aligned with the Funds’ shareholders in the efficient management of the services and costs of the third-party service providers to the Funds. The Independent Trustees took into consideration the “soft dollar” research the Adviser receives from brokers which benefits the Funds and other Adviser clients and which might offset expenses the Adviser would otherwise incur. The Independent Trustees also noted the Adviser’s willingness to soft close both Funds and its other investment products to most new investors in order to best execute its investment strategy on behalf of the existing Fund shareholders and investors, and that this would be expected to limit the Adviser’s profitability while benefitting shareholders. The Independent Trustees further noted the continuing investment by the Adviser in both its infrastructure and staff. The Independent Trustees also considered the entrepreneurial risk and financial exposure assumed by the Adviser in developing and managing the Funds. They noted that the development and management of the Funds requires a high degree of knowledge, sophistication and judgment and potentially subjected the Adviser to substantial financial exposure. The Independent Trustees concluded that the profits realized by the Adviser from its relationship with each Fund were reasonable and consistent with fiduciary duties. The Independent Trustees’ evaluation of the Adviser’s profitability supported continuation of the Advisory Agreement.
The extent to which economies of scale would be realized as the Funds grow and whether fee levels would reflect such economies of scale: The Independent Trustees noted that they considered whether there have been economies of scale in respect to the management of each Fund, whether each Fund appropriately benefitted from any economies of scale and whether there is potential for realization of any further economies of scale. The Independent Trustees noted that the expense ratio of each Fund had declined since the Funds commenced operations due to the growth in the assets of the Funds. They also noted, however, that since the Funds were closed to most new investors, it was not likely that there would be a significant further increase in Fund assets, or a significant decrease in the expense ratio, in the foreseeable future, as evidenced by the relatively stable size of the Funds’ assets since the imposition of the soft close. The Independent Trustees again noted the continuing investment by the Adviser in both its infrastructure and staff which are expected to benefit the Funds and their shareholders. The Independent Trustees concluded that the current fee structure for each Fund was reasonable, that shareholders sufficiently participated in economies of scale at the present time at current asset levels and that no changes were currently necessary. The Independent Trustees’ evaluation of the economies of scale supported continuation of the Advisory Agreement.
Comparison of services rendered and fees paid to those under other investment advisory contracts, such as contracts of the same and other investment advisers or other clients: The Independent Trustees noted that they compared the services rendered and the fees paid under the Advisory Agreement with those under other investment advisory contracts of other investment advisers managing funds deemed comparable as set forth in the Morningstar Report. The Independent Trustees stated that they also considered the services rendered and fees paid under the Advisory Agreement as compared to the Adviser’s other management contracts with institutional and other accounts with similar investment mandates. As noted above, the Independent Trustees acknowledged the greater level of portfolio management, compliance and administrative oversight services required for the Funds, as well as the higher level of financial exposure assumed, as compared to the Adviser’s institutional accounts and other investment funds. The Independent Trustees determined that, on a comparative basis, the fee under the Advisory Agreement for each Fund was reasonable in relation to the services provided to the Funds, and was lower than the fees charged by the Adviser to its other investment funds. The Independent Trustees’ evaluation of the Adviser’s other fee arrangements and of comparable mutual funds advised by other advisers supported continuation of the Advisory Agreement.
No single factor was cited as determinative to the decision of the Trustees. Rather, after weighing all of the considerations and conclusions discussed above, the Trustees, including the Independent Trustees, unanimously recommended approval of the continuation of the Advisory Agreement for each Fund.
Proxy Voting. Information on how the Funds voted proxies relating to portfolio securities during the prior 12-month period ended June 30th of each year and a description of the policies and procedures that the Funds use to determine how to vote proxies relating to portfolio transactions are available (1) without charge, upon request, by calling 866-941-4482, and (2) on the Securities and Exchange Commission (“SEC”) website at www.sec.gov by accessing the Funds’ Form N-PX and Statement of Additional Information in the Funds’ registration statement on Form N-1A.
Schedules of Portfolio Holdings. The Funds file their complete schedules of portfolio holdings with the SEC for the first and third quarters of each fiscal year on Form N-Q. The Funds’ Form N-Q is available on the SEC’s website at www.sec.gov. The Funds’ Form N-Q may be reviewed and copied at the SEC’s Public Reference Room in Washington, D.C., and information on the operation of the Public Reference Room may be obtained by calling 800-SEC-0330. To obtain the Funds’ Form N-Q, shareholders can call 866-941-4482.
Trustees and Officers of the Funds. Additional information about Trustees and officers of the Funds is included in the Statement of Additional Information which is available, without charge, upon request, by calling 866-941-4482.
| Fund Expenses (unaudited) | IVA Funds |
As a shareholder of the Funds, you may incur two types of costs: (1) transaction costs, including initial sales charges and/or redemption fees; and (2) ongoing costs, including investment advisory fees, distribution and/or service (12b-1) fees and other operating fund expenses. The information on this page is intended to help you understand your ongoing costs of investing in the Funds and to compare these costs with the ongoing costs of investing in other mutual funds.
This example is based on an investment of $1,000 invested on April 1, 2013 and held for the six months ended September 30, 2013.
ACTUAL EXPENSES
The table below titled “Based on Actual Total Return” provides information about actual account values and actual expenses. You may use the information provided in this table, together with the amount you invested, to estimate the expenses that you paid over the period. To estimate the expenses you paid on your account, divide your ending account value by $1,000 (for example, an $8,600 ending account value divided by $1,000 = 8.6), then multiply the result by the number under the heading titled “Expenses Paid During the Period.”
BASED ON ACTUAL TOTAL RETURN FOR THE SIX MONTHS ENDED SEPTEMBER 30, 2013(a)
| | | Actual | | | | | | | | | | Annualized | | Expenses |
| | | Total | | Beginning | | Ending | | Expense | | Paid During |
| | | Return | | Account Value | | Account Value | | Ratio | | the Period(b) |
| Worldwide Fund | | | | | | | | | | | | | | | | | | | | |
| Class A | | | 6.10 | % | | $ | 1,000.00 | | | $ | 1,061.00 | | | | 1.27 | % | | $ | 6.56 | |
| Class C | | | 5.73 | % | | | 1,000.00 | | | | 1,057.30 | | | | 2.02 | % | | | 10.42 | |
| Class I | | | 6.28 | % | | | 1,000.00 | | | | 1,062.80 | | | | 1.02 | % | | | 5.27 | |
| International Fund | | | | | | | | | | | | | | | | | | | | |
| Class A | | | 5.91 | % | | $ | 1,000.00 | | | $ | 1,059.10 | | | | 1.26 | % | | $ | 6.50 | |
| Class C | | | 5.48 | % | | | 1,000.00 | | | | 1,054.80 | | | | 2.01 | % | | | 10.35 | |
| Class I | | | 6.02 | % | | | 1,000.00 | | | | 1,060.20 | | | | 1.01 | % | | | 5.22 | |
HYPOTHETICAL EXAMPLE FOR COMPARISON PURPOSES
The table below titled “Based on Hypothetical Total Return” provides information about hypothetical account values and hypothetical expenses based on the actual expense ratio and an assumed rate of return of 5% per year before expenses, which are not the Funds’ actual returns. The hypothetical account values and expenses may not be used to estimate the actual ending account values and expenses you paid for the period. You may use the information provided in this table to compare the ongoing costs of investing in the Funds and other funds. To do so, compare the 5% hypothetical example relating to the Funds with the 5% hypothetical examples that appear in the shareholder reports of other funds.
Please note that expenses shown in the table below are meant to highlight your ongoing costs and do not reflect any transactional costs, such as initial sales charges (loads) or redemption fees, if any. Therefore, the table is useful in comparing ongoing costs only and will not help you determine your relative total costs of owning different funds. In addition, if these transactional costs were included, your costs would have been higher.
BASED ON HYPOTHETICAL TOTAL RETURN FOR THE SIX MONTHS ENDED SEPTEMBER 30, 2013
| | | Hypothetical | | | | | | | | | | Annualized | | Expenses |
| | | Annualized | | Beginning | | Ending | | Expense | | Paid During |
| | | Total Return | | Account Value | | Account Value | | Ratio | | the Period(b) |
| Worldwide Fund | | | | | | | | | | | | | | | | | | | | |
| Class A | | | 5.00 | % | | $ | 1,000.00 | | | $ | 1,018.70 | | | | 1.27 | % | | $ | 6.43 | |
| Class C | | | 5.00 | % | | | 1,000.00 | | | | 1,014.94 | | | | 2.02 | % | | | 10.20 | |
| Class I | | | 5.00 | % | | | 1,000.00 | | | | 1,019.95 | | | | 1.02 | % | | | 5.16 | |
| International Fund | | | | | | | | | | | | | | | | | | | | |
| Class A | | | 5.00 | % | | $ | 1,000.00 | | | $ | 1,018.75 | | | | 1.26 | % | | $ | 6.38 | |
| Class C | | | 5.00 | % | | | 1,000.00 | | | | 1,014.99 | | | | 2.01 | % | | | 10.15 | |
| Class I | | | 5.00 | % | | | 1,000.00 | | | | 1,020.00 | | | | 1.01 | % | | | 5.11 | |
| (a) | Assumes reinvestment of all dividends and capital gain distributions, if any. |
| (b) | Expenses are equal to the Funds’ respective annualized expense ratio multiplied by the average account value over the period, multiplied by 183 days in the most recent fiscal half-year, then divided by 365. |
| Important Tax Information (unaudited) | IVA Funds |
For the fiscal year ended September 30, 2013, the Funds will designate up to the maximum amount allowable pursuant to the Internal Revenue Code, as qualified dividend income eligible for reduced tax rates. These lower rates range from 0% to 20% depending on an individual’s tax bracket. Complete information will be reported in conjunction with Form 1099-DIV.
The Funds may elect to pass through to shareholders the income tax credit for taxes paid to foreign countries. Foreign source income and foreign tax expense per outstanding share on September 30, 2013 are as follows:
| | | Foreign Source | | Foreign Tax |
| | | Income | | Expense |
| |
| Worldwide Fund | | $ | 0.22 | | | $ | 0.02 | |
| |
| International Fund | | $ | 0.37 | | | $ | 0.04 | |
| |
If elected, the pass-through of the foreign tax credit will affect only those persons who are shareholders on the dividend record date in December 2013. These shareholders will receive more detailed information along with their 2013 Form 1099-DIV.
| www.ivafunds.com |
| |
| Investment Adviser |
| International Value Advisers, LLC |
| 717 Fifth Avenue |
| New York, NY 10022 |
| |
| Distributor |
| IVA Funds Distributors, LLC |
| 3 Canal Plaza, Suite 100 |
| Portland, ME 04101 |
| |
| Custodian |
| State Street Bank and Trust Company |
| 1200 Crown Colony Drive |
| Quincy, MA 02169 |
| |
| Transfer Agent |
| Boston Financial Data Services, Inc. |
| 2000 Crown Colony Drive |
| Quincy, MA 02169 |
| |
| Counsel |
| K&L Gates LLP |
| State Street Financial Center |
| One Lincoln Street |
| Boston, MA 02111-2950 |
| |
| Independent Registered Public Accounting Firm |
| Ernst & Young LLP |
| 200 Clarendon Street |
| Boston MA, 02116-5072 |
This report is submitted for the general information of the Funds’ shareholders. The report is not authorized for distribution to prospective investors in the Funds unless it is accompanied or preceded by the Funds’ current prospectus, which includes information regarding the Funds’ risks, objectives, fees and expenses, experience of its management, and other information.
The commentary within An Owner’s Manual, the Letter from the President, the Letter from the Portfolio Managers, and the Management’s Discussion of Fund Performance reflects their current views and opinions as of the date of this report. Any such views are subject to change at any time based upon market or other conditions and IVA Funds disclaims any responsibility to update such views. These views may not be relied on as investment advice and, because investment decisions are based on numerous factors, may not be relied on as an indication of trading intent. References to specific securities should not be construed as recommendations or investment advice.
Item 2. Code of Ethics.
(a) As of the end of the period covered by this Form N-CSR, the registrant has adopted a code of ethics, as defined in Item 2(b) of Form N-CSR, that applies to the registrant’s principal executive officer and principal financial officer.
(c) The registrant has not amended its code of ethics during the period covered by this Form N-CSR.
(d) The registrant has not granted any waivers from any provisions of the code of ethics during the period covered by this Form N-CSR.
(e) Not applicable.
(f) A copy of the registrant’s code of ethics is filed as Exhibit 12(a)(1) to this Form N-CSR.
Item 3. Audit Committee Financial Expert.
(a)(1) The registrant’s Board of Trustees (the “Board”) has determined that the registrant has a member serving on the registrant’s Audit Committee that possess the attributes identified in Form N-CSR to qualify as an “audit committee financial expert.”
(a)(2) The audit committee financial expert is Manu Bammi and he has been deemed to be “independent” as that term is defined in Form N-CSR.
Item 4. Principal Accountant Fees and Services.
The firm of Ernst & Young LLP (“E&Y”) serves as the independent registered public accounting firm for the registrant.
(a) Audit Fees.
For the fiscal years ended September 30, 2012 and September 30, 2013, the aggregate fees billed for professional services rendered by E&Y for the audit of the registrant’s annual financial statements and/or for services that are normally provided by E&Y in connection with statutory and regulatory filings or engagements were $63,000 and $72,500, respectively.
(b) Audit-Related Fees.
For the fiscal years ended September 30, 2012 and September 30, 2013, the aggregate fees billed for assurance and related services rendered by E&Y that are reasonably related to the performance of the audit or review of the registrant’s financial statements and that are not reported under Audit Fees above were $0 and $0, respectively.
For the twelve month periods ended September 30, 2012 and September 30, 2013, the aggregate Audit-Related Fees billed by E&Y that were required to be approved by the registrant’s Audit Committee for audit-related services rendered to the registrant’s investment adviser and any entity controlling, controlled by or under common control with the investment adviser that provides ongoing services to the registrant (the
“Affiliated Service Providers”) that relate directly to the operations and financial reporting of the registrant were $0 and $0, respectively.
(c) Tax Fees.
For the fiscal years ended September 30, 2012 and September 30, 2013, the aggregate fees billed for tax compliance, tax advice and tax planning by E&Y were $18,000 and $28,525, respectively. Services for which fees in the Tax Fees category are billed include E&Y’s review of the registrant’s U.S. federal income tax returns and the required state corporate income tax returns, as well as E&Y’s review of excise tax distribution calculations.
For the twelve month periods ended September 30, 2012 and September 30, 2013, the aggregate Tax Fees billed by E&Y that were required to be approved by the registrant’s Audit Committee for tax compliance, tax advice and tax planning services rendered on behalf of Affiliated Service Providers that relate directly to the operations and financial reporting of the registrant were $0 and $0 respectively.
(d) All Other Fees.
For the fiscal years ended September 30, 2012 and September 30, 2013, the aggregate fees billed by E&Y to the registrant for all services other than services reported under Audit Fees, Audit-Related Fees, and Tax Fees were $30,000 and $0, respectively.
For the twelve month periods ended September 30, 2012 and September 30, 2013, the aggregate fees in this category billed by E&Y that were required to be approved by the registrant’s Audit Committee for services rendered on behalf of Affiliated Service Providers that relate directly to the operations and financial reporting of the registrant were $0 and $0, respectively.
(e)(1) Audit Committee’s Pre-Approval Policies and Procedures.
The registrant’s Audit Committee has the sole authority to pre-approve all audit and non-audit services to be provided by E&Y to the registrant, subject to the de minimis exceptions for non-audit services described in Section 10A(i)(1)B of the Securities Exchange Act of 1934, as amended (“Exchange Act”). Pre-approval of audit and non-audit services is not required if the engagement to render the services is entered into pursuant to pre-approval policies and procedures established by the Audit Committee (the “Pre-Approval Procedures”). The registrant’s Audit Committee adopted Pre-Approval Procedures on November 9, 2009, which generally permit:
Audit-Related Services consisting of: (i) consultations regarding accounting, operational or regulatory implications, or regulatory/compliance matters of proposed or actual transactions affecting the operations or financial reporting and (ii) other auditing procedures and issuance of special purpose reports;
Tax Services consisting of: (i) recurring tax services and (ii) consultations regarding tax consequences of proposed or actual transactions; and
Other Non-Audit Services including: (i) business support, (ii) other control and regulatory compliance projects and (iii) training.
All such services are subject to a per calendar quarterly limitation.
(e)(2) Percentage of Services.
None of the services described in each of paragraphs (b) through (d) of this Item were approved by the registrant’s Audit Committee pursuant to paragraph (c)(7)(i)(C) of Rule 2-01 of Regulation S-X.
(f) Not applicable.
(g) For the fiscal years ended September 30, 2012 and September 30, 2013, the aggregate non-audit fees billed by E&Y for services rendered to the registrant were $48,000 and $28,525, respectively.
For the twelve month periods ended September 30, 2012 and September 30, 2013, the aggregate non-audit fees billed by E&Y for services rendered to the Affiliated Service Providers were $0 and $0, respectively.
(h) Not applicable.
Item 5. Audit Committee of Listed Registrants.
Not applicable to the registrant.
Item 6. Schedule of Investments.
(a) The audited schedules of investments are included in the report to shareholders filed under Item 1 of this Form N-CSR.
(b) Not applicable.
Item 7. Disclosure of Proxy Voting Policies and Procedures for Closed-End Management Investment Companies.
Not applicable to the registrant.
Item 8. Portfolio Managers of Closed-End Management Investment Companies.
Not applicable to the registrant.
Item 9. Purchases of Equity Securities by Closed-End Management Investment Company and Affiliated Purchasers.
Not applicable to the registrant.
Item 10. Submission of Matters to a Vote of Security Holders.
The registrant does not have procedures by which shareholders may recommend nominees to the registrant’s Board of Trustees. The Nominating and Governance
Committee may, in its sole discretion, consider nominees recommended by each Fund’s shareholders.
Item 11. Controls and Procedures.
(a) Within 90 days of the filing date of this Form N-CSR, Michael W. Malafronte, the registrant’s President and Chief Executive Officer, and Stefanie J. Hempstead, the registrant’s Treasurer and Chief Financial Officer, reviewed the registrant’s Disclosure Controls and Procedures and Internal Control over Financial Reporting (the “Procedures”) (as defined in Rule 30a-3(c) under the Investment Company Act of 1940, as amended (the “1940 Act”)) and evaluated their effectiveness. Based on their review, Mr. Malafronte and Ms. Hempstead determined that the Procedures are reasonably designed to ensure that information required to be disclosed by the registrant on Form N-CSR is accumulated and communicated to the registrant’s management to allow timely decisions regarding required disclosure.
(b) There were no changes in the registrant’s Procedures (as defined in Rule 30a-3(d) under the 1940 Act) that occurred during the second fiscal quarter of the period covered by this report that has materially affected, or is reasonably likely to materially affect, the registrant’s Procedures.
Item 12. Exhibits.
(a)(1) Code of Ethics referred to in Item 2 is filed herewith.
(a)(2) The certifications required by Rule 30a-2(a) of the 1940 Act and Section 302 of the Sarbanes-Oxley Act of 2002 (“Sarbanes-Oxley Act”) are filed herewith.
(a)(3) Not applicable.
(b) The certifications required by Rule 30a-2(b) of the 1940 Act and Section 906 of the Sarbanes-Oxley Act are filed herewith.
The certifications provided pursuant to Rule 30a-2(b) of the 1940 Act and Section 906 of the Sarbanes-Oxley Act are not deemed “filed” for purposes of Section 18 of the Securities Exchange Act of 1934, as amended (the “Exchange Act”), or otherwise subject to the liability of that section. Such certifications will not be deemed to be incorporated by reference into any filing under the Securities Act of 1933 or the Exchange Act, except to the extent that the registrant specifically incorporates them by reference.
SIGNATURES
Pursuant to the requirements of the Securities Exchange Act of 1934 and the Investment Company Act of 1940, the registrant has duly caused this report to be signed on its behalf by the undersigned, thereunto duly authorized.
IVA FIDUCIARY TRUST
| By: | /s/ Michael W. Malafronte |
| | Michael W. Malafronte |
| | President and Chief Executive Officer |
| | |
| Date: | November 27, 2013 |
Pursuant to the requirements of the Securities Exchange Act of 1934 and the Investment Company Act of 1940, this report has been signed below by the following persons on behalf of the registrant and in the capacities and on the dates indicated.
| By: | /s/ Michael W. Malafronte |
| | Michael W. Malafronte |
| | President and Chief Executive Officer |
| | |
| Date: | November 27, 2013 |
| | |
| | |
| | |
| By: | /s/ Stefanie J. Hempstead |
| | Stefanie J. Hempstead |
| | Treasurer and Chief Financial Officer |
| | |
| Date: | November 27, 2013 |
