UNITED STATES
SECURITIES AND EXCHANGE COMMISSION
Washington, D.C. 20549
Form N-CSR
CERTIFIED SHAREHOLDER REPORT OF REGISTERED MANAGEMENT
INVESTMENT COMPANIES
Investment Company Act File Number 811-22321
MAINSTAY FUNDS TRUST
(Exact name of Registrant as specified in charter)
51 Madison Avenue, New York, NY 10010
(Address of principal executive offices) (Zip code)
J. Kevin Gao, Esq.
169 Lackawanna Avenue
Parsippany, New Jersey 07054
(Name and address of agent for service)
Registrant’s telephone number, including area code: (212)576-7000
Date of fiscal year end: October 31
Date of reporting period: April 30, 2013
| Item 1. | Reports to Stockholders. |
MainStay Epoch U.S. Equity Yield Fund
Message from the President and Semiannual Report
Unaudited | April 30, 2013


This page intentionally left blank
Message from the President
The U.S. stock market advanced during the six months ended April 30, 2013, generally providing double-digit returns at all capitalization levels. Value stocks tended to outpace growth stocks among large- and mid-capitalization companies, while growth stocks tended to outpace value stocks among smaller companies.
The market’s advance, however, was far from uniform. Stocks declined in early November, both before and immediately after the U.S. presidential election. Following a sharp recovery, stocks climbed until mid-December, when a Congressional stalemate on the fiscal cliff led to a brief decline. Another dip occurred in late February as investors speculated that the Federal Open Market Committee (FOMC) might stop purchasing mortgage-backed securities sooner than expected. Stocks also dipped in mid-April, as consumer sentiment dropped after the Boston marathon bombing. Despite these setbacks, U.S. stocks continued to trend upward during the six-month reporting period.
International stock markets also advanced, with several regional differences. Accommodative action by the Bank of Japan helped lower the yen and lift Japanese stocks to their highest levels since 2008. In Europe, stocks did well until early February, bolstered by the promise of support for the euro. As the year progressed, however, economic contraction, rising unemployment and systematic banking concerns took a toll on investor enthusiasm. In China, manufacturing slowed as the nation sought to balance growth and inflation risks. On the Korean peninsula, tensions rose as North Korea continued to threaten its neighbors, which added an undercurrent of caution to the market.
During the six months ended April 30, 2013, the FOMC kept the federal funds rate in a range close to zero. The FOMC also continued its direct purchases of mortgage-backed securities and longer-term U.S. government securities. With short-term interest rates likely to remain at low levels, many bond investors pursued higher yields by lengthening maturities and assuming greater risk. As a result, bonds with higher risk profiles tended
to outperform higher-quality investment-grade bonds and U.S. Treasury securities. Cash and cash equivalents essentially returned zero.
With wide variations in the performance of various asset classes, some investors might be tempted to chase higher returns by shifting back and forth between stocks and bonds. Since no one can predict where the market will move next, however, we encourage investors to select an appropriate mix of investments for their risk tolerance and time horizon and to stick with that mix, making only minor adjustments over time.
At MainStay Funds, our portfolio managers use a similar approach. Careful security selection and thoughtful sell disciplines help them pursue the investment objectives of their respective Funds. Using the principal investment strategies outlined in the Prospectus, they focus primarily on providing long-term investment potential for our shareholders.
Has this approach proved successful? In its most recent rankings, Barron’s listed MainStay Funds as the #1 fund family over the past 10 years. We were also the only mutual fund family that has appeared in Barron’s top six for the past five consecutive years.
The pages that follow provide additional insight into the specific market events, investment decisions and securities that shaped your MainStay Fund(s) during the six months ended April 30, 2013. We encourage you to read the semiannual report(s) carefully and to evaluate your results with your long-term financial goals in mind.
Sincerely,

Stephen P. Fisher
President
The opinions expressed are as of the date of this report and are subject to change. There is no guarantee that any forecast made will come to pass. This material does not constitute investment advice and is not intended as an endorsement of any specific investment.
To qualify for the Lipper/Barron’s Fund Survey, a fund family must have at least three funds in Lipper’s general U.S.-stock category, one in world equity (which combines global and international funds), one mixed-equity fund (which holds stocks and bonds), two taxable-bond funds, and one tax-exempt fund. Fund loads and 12b-1 fees aren’t included in the calculation of returns because the aim is to measure the manager’s skill. Each fund’s return is measured against all funds in its Lipper category, resulting in a percentile ranking which is then weighted by asset size relative to the fund family’s other assets in its general classifications. Finally, the score is multiplied by the general classification weightings as determined by the entire Lipper universe of funds.
Source: Barron’s, 2/9/13. Overall, MainStay Funds ranked number 56 for the one-year period, 20 for the five-year period and one for the 10-year period ended December 31, 2012, out of 62, 53 and 46 fund families, respectively. MainStay ranked number three for the 10-year period in 2009, 2010 and 2011 from among 48, 46 and 45 fund families, respectively. MainStay ranked number six from among 48 fund families for the 10-year period in 2008. Past performance is no guarantee of future results, which will vary. For the most recent MainStay Funds performance, please visit our website at mainstayinvestments.com. All mutual funds are subject to market risk and will fluctuate in value.
Not part of the Semiannual Report
Table of Contents
Investors should refer to the Fund’s Summary Prospectus and/or Prospectus and consider the Fund’s investment objectives, strategies, risks, charges and expenses carefully before investing. The Summary Prospectus and/or Prospectus contain this and other information about the Fund. You may obtain copies of the Fund’s Summary Prospectus, Prospectus and Statement of Additional Information free of charge, upon request, by calling toll-free 800-MAINSTAY (624-6782), by writing to NYLIFE Distributors LLC, Attn: MainStay Marketing Department, 169 Lackawanna Avenue, Parsippany, New Jersey 07054 or by sending an e-mail to MainStayShareholderServices@nylim.com. These documents are also available via the MainStay Funds’ website at mainstayinvestments.com/documents. Please read the Summary Prospectus and/or Prospectus carefully before investing.
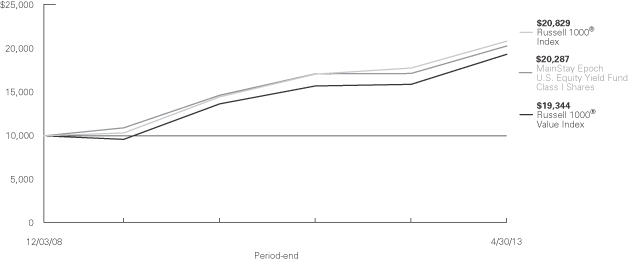
Investment and Performance Comparison1 (Unaudited)
Performance data quoted represents past performance. Past performance is no guarantee of future results. Because of market volatility, current performance may be lower or higher than the figures shown. Investment return and principal value will fluctuate, and as a result, when shares are redeemed, they may be worth more or less than their original cost. The graph below depicts the historical performance of Class I shares of the Fund. Performance will vary from class to class based on differences in class-specific expenses and sales charges. For performance information current to the most recent month-end, please call 800-MAINSTAY (624-6782) or visit mainstayinvestments.com.
Average Annual Total Returns for the Period Ended April 30, 2013
| | | | | | | | | | | | | | | | | | | | |
| Class | | Sales Charge | | | | Six Months | | | One Year | | | Since
Inception
(12/3/08) | | | Gross
Expense
Ratio2 | |
| Investor Class Shares3 | | Maximum 5.5% Initial Sales Charge | | With sales charges Excluding sales charges | |
| 10.04
16.44 | %
| |
| 11.61
18.10 | %
| |
| 15.56
17.05 | %
| |
| 2.14
2.14 | %
|
| Class | | Sales Charge | | | | Six Months | | | One Year | | | Since
Inception
(2/3/09) | | | Gross
Expense
Ratio2 | |
| Class A Shares4 | | Maximum 5.5% Initial Sales Charge | | With sales charges Excluding sales charges | |
| 10.02
16.42 | %
| |
| 11.58
18.08 | %
| |
| 15.61
17.16 | %
| |
| 2.19
2.19 | %
|
| Class | | Sales Charge | | | | Six Months | | | One Year | | | Since
Inception
(12/3/08) | | | Gross
Expense
Ratio2 | |
| Class C Shares3 | | Maximum 1% CDSC if Redeemed Within One Year of Purchase | | With sales charges Excluding sales charges | |
| 15.02
15.94 | %
| |
| 16.33
17.26 | %
| |
| 16.25
16.25 | %
| |
| 2.89
2.89 | %
|
| Class | | Sales Charge | | | | Six Months | | | One Year | | | Since
Inception
(12/3/08) | | | Gross
Expense
Ratio2 | |
| Class I Shares4 | | No Sales Charge | | | | | 16.57 | % | | | 18.31 | % | | | 17.41 | % | | | 1.94 | % |
| 1. | The performance table and graph do not reflect the deduction of taxes that a shareholder would pay on distributions or Fund share redemptions. Total returns reflect maximum applicable sales charges as indicated in the table above, changes in share price, and reinvestment of dividend and capital gain distributions. The graph assumes the initial investment amount shown above and reflects the deduction of all sales charges that would have applied for the period of investment. Performance figures reflect certain fee waivers and/or expense limitations, without which total returns may have been lower. For more information on share classes and current fee waivers and/or expense limitations, please refer to the notes to the financial statements. |
| 2. | The gross expense ratios presented reflect the Fund’s “Total Annual Fund Operating Expenses” from the most recent Prospectus and may differ from other expense ratios disclosed in this report. |
| 3. | Performance figures for Investor Class and Class C shares, first offered on November 16, 2009, include the historical performance of Class I shares from December 3, 2008 through November 15, 2009 adjusted for differences in certain expenses and fees. Unadjusted, the performance shown for Investor Class and Class C shares would likely have been different. |
| 4. | Performance figures for Class I shares and Class A shares include the historical performance of the Institutional shares from December 3, 2008 |
The footnotes on the next page are an integral part of the table and graph and should be carefully read in conjunction with them.
| | | | |
| mainstayinvestments.com | | | 5 | |
| | | | | | | | | | | | |
| Benchmark Performance | | Six Months | | | One Year | | | Since
Inception
of the Fund | |
Russell 1000® Value Index5 | | | 16.31 | % | | | 21.80 | % | | | 16.14 | % |
Russell 1000® Index6 | | | 15.05 | | | | 17.17 | | | | 18.11 | |
Average Lipper Large-Cap Core Fund7 | | | 14.17 | | | | 15.80 | | | | 17.15 | |
and the Class P shares from February 3, 2009, respectively, of the Epoch U.S. Large Cap Equity Fund (the predecessor to the Fund), through November 15, 2009. The Epoch U.S. Large Cap Equity Fund was subject to a different fee structure and was advised by Epoch Investment Partners, Inc.
| 5. | The Russell 1000® Value Index measures the performance of the large-cap value segment of the U.S. equity universe. It includes those Russell 1000® Index companies with lower price-to-book ratios and lower expected growth values. The Fund selected the Russell 1000® Value Index as its primary benchmark because it believes that this index is more reflective of its current investment style. Results assume reinvestment of all dividends and capital gains. An investment cannot be made directly in an index. |
| 6. | The Russell 1000® Index measures the performance of the large-cap segment of the U.S. equity universe. It is a subset of the Russell 3000® Index and includes approximately 1,000 of the largest securities based on a combination of their market cap and current index membership. The Russell |
| | 1000® Index represents approximately 92% of the U.S. market. The Fund has selected the Russell 1000® Index as its secondary benchmark. Results assume reinvestment of all dividends and capital gains. An investment cannot be made directly in an index. |
| 7. | The average Lipper large-cap core fund is representative of funds that, by portfolio practice, invest at least 75% of their equity assets in companies with market capitalizations (on a three-year weighted basis) above Lipper’s U.S. Diversified Equity large-cap floor. Large-cap core funds have more latitude in the companies in which they invest. These funds typically have an average price-to-earnings ratio, price-to-book ratio, and three-year sales-per-share growth value, compared to the S&P 500® Index. This benchmark is a product of Lipper Inc. Lipper Inc. is an independent monitor of fund performance. Results are based on average total returns of similar funds with all dividend and capital gain distributions reinvested. |
The footnotes on the preceding page are an integral part of the table and graph and should be carefully read in conjunction with them.
| | |
| 6 | | MainStay Epoch U.S. Equity Yield Fund |
Cost in Dollars of a $1,000 Investment in MainStay Epoch U.S. Equity Yield Fund (Unaudited)
The example below is intended to describe the fees and expenses borne by shareholders during the six-month period from November 1, 2012, to April 30, 2013, and the impact of those costs on your investment.
Example
As a shareholder of the Fund, you incur two types of costs: (1) transaction costs, including exchange fees and sales charges (loads) on purchases (as applicable), and (2) ongoing costs, including management fees, distribution and/or service (12b-1) fees, and other Fund expenses (as applicable). This example is intended to help you understand your ongoing costs (in dollars) of investing in the Fund and to compare these costs with the ongoing costs of investing in other mutual funds. The example is based on an investment of $1,000 made at the beginning of the six-month period and held for the entire period from November 1, 2012, to April 30, 2013.
This example illustrates your Fund’s ongoing costs in two ways:
Actual Expenses
The second and third data columns in the table below provide information about actual account values and actual expenses. You may use the information in these columns, together with the amount you invested, to estimate the expenses that you paid during the six months ended April 30, 2013. Simply divide your account value by $1,000 (for example, an $8,600 account value divided by $1,000 = 8.6), then
multiply the result by the number under the heading entitled “Expenses Paid During Period” to estimate the expenses you paid on your account during this period.
Hypothetical Example for Comparison Purposes
The fourth and fifth data columns in the table below provide information about hypothetical account values and hypothetical expenses based on the Fund’s actual expense ratio and an assumed rate of return of 5% per year before expenses, which is not the Fund’s actual return. The hypothetical account values and expenses may not be used to estimate the actual ending account balances or expenses you paid for the six-month period shown. You may use this information to compare the ongoing costs of investing in the Fund with the ongoing costs of investing in other Funds. To do so, compare this 5% hypothetical example with the 5% hypothetical examples that appear in the shareholder reports of the other Funds.
Please note that the expenses shown in the table are meant to highlight your ongoing costs only and do not reflect any transactional costs, such as exchange fees or sales charges (loads). Therefore, the fourth and fifth data columns of the table are useful in comparing ongoing costs only and will not help you determine the relative total costs of owning different funds. In addition, if these transactional costs were included, your costs would have been higher.
| | | | | | | | | | | | | | | | | | | | |
| | | | | | | | | | | | | | | | |
| Share Class | | Beginning
Account
Value
11/1/12 | | | Ending Account
Value (Based
on Actual
Returns and
Expenses)
4/30/13 | | | Expenses
Paid
During
Period1 | | | Ending Account
Value (Based
on Hypothetical
5% Annualized
Return and
Actual Expenses)
4/30/13 | | | Expenses
Paid
During
Period1 | |
| | | | | |
| Investor Class Shares | | $ | 1,000.00 | | | $ | 1,164.40 | | | $ | 7.35 | | | $ | 1,018.00 | | | $ | 6.85 | |
| | | | | |
| Class A Shares | | $ | 1,000.00 | | | $ | 1,164.20 | | | $ | 7.08 | | | $ | 1,018.20 | | | $ | 6.61 | |
| | | | | |
| Class C Shares | | $ | 1,000.00 | | | $ | 1,159.40 | | | $ | 11.35 | | | $ | 1,014.30 | | | $ | 10.59 | |
| | | | | |
| Class I Shares | | $ | 1,000.00 | | | $ | 1,165.70 | | | $ | 5.80 | | | $ | 1,019.40 | | | $ | 5.41 | |
| 1. | Expenses are equal to the Fund’s annualized expense ratio of each class (1.37% for Investor Class, 1.32% for Class A, 2.12% for Class C and 1.08% for Class I) multiplied by the average account value over the period, divided by 365 and multiplied by 181 (to reflect the six-month period). The table above represents the actual expenses incurred during the six-month period. |
| | | | |
| mainstayinvestments.com | | | 7 | |
Industry Composition as of April 30, 2013 (Unaudited)
| | | | |
| Multi-Utilities | | | 8.2 | % |
| Aerospace & Defense | | | 6.6 | |
| Oil, Gas & Consumable Fuels | | | 6.5 | |
| Pharmaceuticals | | | 6.1 | |
| Electric Utilities | | | 5.9 | |
| Tobacco | | | 5.7 | |
| Commercial Services & Supplies | | | 4.1 | |
| Diversified Telecommunication Services | | | 3.9 | |
| Food Products | | | 3.6 | |
| Beverages | | | 3.3 | |
| Household Products | | | 3.2 | |
| Media | | | 3.2 | |
| Semiconductors & Semiconductor Equipment | | | 3.1 | |
| Insurance | | | 2.8 | |
| Electrical Equipment | | | 2.6 | |
| IT Services | | | 2.4 | |
| Computers & Peripherals | | | 2.2 | |
| Software | | | 1.8 | |
| Chemicals | | | 1.7 | |
| | | | |
| Gas Utilities | | | 1.7 | % |
| Leisure Equipment & Products | | | 1.7 | |
| Food & Staples Retailing | | | 1.5 | |
| Capital Markets | | | 1.4 | |
| Commercial Banks | | | 1.3 | |
| Energy Equipment & Services | | | 1.3 | |
| Real Estate Investment Trusts | | | 1.3 | |
| Industrial Conglomerates | | | 1.2 | |
| Distributors | | | 1.0 | |
| Health Care Equipment & Supplies | | | 1.0 | |
| Hotels, Restaurants & Leisure | | | 1.0 | |
| Specialty Retail | | | 1.0 | |
| Diversified Financial Services | | | 0.9 | |
| Air Freight & Logistics | | | 0.5 | |
| Containers & Packaging | | | 0.5 | |
| Machinery | | | 0.5 | |
| Short-Term Investment | | | 1.3 | |
| Other Assets, Less Liabilities | | | 4.0 | |
| | | | |
| | | 100.0 | % |
| | | | |
See Portfolio of Investments beginning on page 11 for specific holdings within these categories.
Top Ten Holdings as of April 30, 2013 (excluding short-term investment)
| | |
| 8 | | MainStay Epoch U.S. Equity Yield Fund |
Portfolio Management Discussion and Analysis (Unaudited)
Questions answered by portfolio managers Eric Sappenfield, Michael Welhoelter, CFA, William Priest, CFA, John Tobin, PhD, CFA, and Kera Van Valen, CFA, of Epoch Investment Partners, Inc., the Fund’s Subadvisor.
How did MainStay Epoch U.S. Equity Yield Fund perform relative to its peers and its benchmark for the six months ended April 30, 2013?
Excluding all sales charges, MainStay Epoch U.S. Equity Yield Fund returned 16.44% for Investor Class shares, 16.42% for Class A shares and 15.94% for Class C shares for the six months ended April 30, 2013. Over the same period, Class I shares returned 16.57%. All share classes outperformed the 14.17% return of the average Lipper1 large-cap core fund for the same period. Investor Class, Class A and Class I shares outperformed—and Class C shares underperformed—the 16.31% return of the Russell 1000® Value Index2 for the six months ended April 30, 2013. The Russell 1000® Value Index is the Fund’s broad-based securities-market index. See page 5 for Fund returns with applicable sales charges.
Were there any changes to the Fund during the reporting period?
Effective February 28, 2013, John Tobin and Kera Van Valen were added as portfolio managers.
What factors affected the Fund’s relative performance during the reporting period?
The Fund provided strong absolute returns that reflected growth in cash flows and shareholder yield—including dividends, share buybacks and debt reduction—from its holdings. The Fund’s absolute performance was also supported by the global rally in equities during the reporting period.
Relative to the Russell 1000® Value Index, the Fund’s emphasis on sustainable shareholder yield was a positive factor in an environment where market gains were led by defensive companies with strong shareholder-yield characteristics. The Fund’s relative returns were hurt by not owning the large banks and some information technology companies that saw a jump in share prices during the reporting period.
During the reporting period, which sectors were the strongest positive contributors to the Fund’s relative performance and which sectors were particularly weak?
The strongest positive contributors to the Fund’s performance relative to the Russell 1000® Value Index were the materials, energy and industrials sectors. (Contributions take weightings and total returns into account.) The Fund had less exposure than the Index to materials and energy companies. This positioning enhanced results, as these sectors had the weakest returns during the reporting period. The Fund’s holdings in the materials and industrials sectors appreciated more than securities in the comparable sectors of the Russell 1000® Value Index.
Results lagged the Russell 1000® Value Index in the information technology and financials sectors. While the Fund’s overweight position relative to the Index in information technology was a positive factor, stock selection in the sector detracted. Fund returns were hindered in the financials sector by the Fund’s avoidance of the large banks, many of which did not meet our shareholder-yield criteria. The Fund’s residual cash position also detracted from relative performance in a rising equity market.
During the reporting period, which individual stocks made the strongest positive contributions to the Fund’s absolute performance and which stocks detracted the most?
The individual stocks that made the strongest positive contributors to the Fund’s absolute performance were hard disk manufacturer Seagate Technology, drug company AbbVie and health and hygiene company Kimberly-Clark. Seagate Technology reported strong results on improved pricing and stock repurchases. In January 2013, Abbott Laboratories split into two companies: Abbott Laboratories (a global health care company) and AbbVie (the biotechnology and pharmaceutical part of the business). The Fund’s position in Abbott Laboratories was also split into two parts, but AbbVie has a higher dividend commitment to its shareholders. We sold the Fund’s position in Abbott Laboratories, which has a lower dividend payment but a higher growth component. Kimberly-Clark reported strong international sales and improved profit margins. The company increased its dividend during the reporting period and has a buyback program that we believe is attractive.
During the reporting period, the most substantial detractors from the Fund’s absolute performance were Pitney Bowes, Darden Restaurants and ONEOK Partners. We sold the Fund’s position in Pitney Bowes, a company that provides hardware, software and services for physical and digital communications. The company continued to see pressure on its core businesses, and its priorities for capital allocation became unclear to us. We also sold the Fund’s position in casual dining restaurant operator Darden Restaurants after weak sales and an acquisition announcement reduced our confidence that the Fund would accumulate returns through dividends and share repurchases. Natural gas company ONEOK Partners reported a drop in earnings due to lower prices for natural gas liquids. With volumes up and new projects near completion, we continued to have confidence in the company’s ability to deliver shareholder yield, and thus held the position at the end of the reporting period.
Did the Fund make any significant purchases or sales during the reporting period?
We added a Fund position in retail pharmacy CVS Caremark after management confirmed its intention to return $5 billion to
| 1. | See footnote on page 6 for more information on Lipper Inc. |
| 2. | See footnote on page 6 for more information on the Russell 1000® Value Index. |
| | | | |
| mainstayinvestments.com | | | 9 | |
shareholders in 2013 through a combination of dividends and share repurchases. We believe that modest revenue growth, coupled with margin expansion, should allow CVS Caremark to continue generating strong free cash flow. We also established a Fund position in Health Care REIT, which operates a growing portfolio of medical office buildings. The company has a large dividend yield and plans on reducing its debt.
In addition to the sales already mentioned, we exited the Fund’s position in Diebold, a maker of ATMs. We sold the stock on the view that the company’s earnings and cash flows were being hurt by an intensifying slowdown among U.S. regional banks.
How did the Fund’s sector weightings change during the reporting period?
The Fund’s sector weightings are the result of buying and selling individual stocks and changed little during the reporting period. The most significant shifts were modest increases in energy and utilities and modest decreases in industrials and telecommunication services.
How was the Fund positioned at the end of April 2013?
As of April 30, 2013, the Fund had more exposure than the Russell 1000® Value Index to the consumer staples and utilities sectors, where an abundance of companies not only generate strong cash flows but also—as part of their capital-allocation decisions—emphasize returning capital to shareholders. As of the same date, the Fund remained significantly underweight in the financials sector, which makes up more than one-quarter of the Russell 1000® Value Index. Many of the larger financials, especially banks, were forced to cut dividends and issue new stock during the financial crisis. During the reporting period, many of these same banks continued to have their dividends restricted by regulators. These companies are still using cash to fortify their capital bases rather than provide shareholder yield. As a result, they are not appropriate candidates for the Fund at this time.
The opinions expressed are those of the portfolio managers as of the date of this report and are subject to change. There is no guarantee that any forecast made will come to pass. This material does not constitute investment advice and is not intended as an endorsement of any specific investment.
| | |
| 10 | | MainStay Epoch U.S. Equity Yield Fund |
Portfolio of Investments April 30, 2013 (Unaudited)
| | | | | | | | |
| | |
| | | Shares | | | Value | |
| | | | | | | | |
| Common Stocks 94.7%† | | | | | | | | |
Aerospace & Defense 6.6% | |
Boeing Co. (The) | | | 1,165 | | | $ | 106,493 | |
General Dynamics Corp. | | | 1,670 | | | | 123,513 | |
Honeywell International, Inc. | | | 2,455 | | | | 180,541 | |
Lockheed Martin Corp. | | | 2,035 | | | | 201,648 | |
¨Raytheon Co. | | | 3,575 | | | | 219,434 | |
United Technologies Corp. | | | 1,415 | | | | 129,175 | |
| | | | | | | | |
| | | | | | | 960,804 | |
| | | | | | | | |
Air Freight & Logistics 0.5% | |
United Parcel Service, Inc. Class B | | | 785 | | | | 67,384 | |
| | | | | | | | |
| | |
Beverages 3.3% | | | | | | | | |
Coca-Cola Co. (The) | | | 3,420 | | | | 144,769 | |
Coca-Cola Enterprises, Inc. | | | 3,320 | | | | 121,612 | |
Molson Coors Brewing Co. Class B | | | 2,665 | | | | 137,514 | |
PepsiCo., Inc. | | | 920 | | | | 75,872 | |
| | | | | | | | |
| | | | | | | 479,767 | |
| | | | | | | | |
Capital Markets 1.4% | |
BlackRock, Inc. | | | 475 | | | | 126,587 | |
Waddell & Reed Financial, Inc. Class A | | | 1,940 | | | | 83,168 | |
| | | | | | | | |
| | | | | | | 209,755 | |
| | | | | | | | |
Chemicals 1.7% | |
Dow Chemical Co. (The) | | | 1,625 | | | | 55,104 | |
E.I. du Pont de Nemours & Co. | | | 2,035 | | | | 110,928 | |
RPM International, Inc. | | | 2,300 | | | | 74,520 | |
| | | | | | | | |
| | | | | | | 240,552 | |
| | | | | | | | |
Commercial Banks 1.3% | |
Bank of Hawaii Corp. | | | 1,505 | | | | 71,773 | |
M&T Bank Corp. | | | 1,095 | | | | 109,719 | |
| | | | | | | | |
| | | | | | | 181,492 | |
| | | | | | | | |
Commercial Services & Supplies 4.1% | |
Deluxe Corp. | | | 3,575 | | | | 136,351 | |
R.R. Donnelley & Sons Co. | | | 6,995 | | | | 86,108 | |
Republic Services, Inc. | | | 3,930 | | | | 133,934 | |
¨Waste Management, Inc. | | | 5,865 | | | | 240,348 | |
| | | | | | | | |
| | | | | | | 596,741 | |
| | | | | | | | |
Computers & Peripherals 2.2% | |
Apple, Inc. | | | 240 | | | | 106,260 | |
Seagate Technology PLC | | | 5,600 | | | | 205,520 | |
| | | | | | | | |
| | | | | | | 311,780 | |
| | | | | | | | |
Containers & Packaging 0.5% | |
Bemis Co., Inc. | | | 1,805 | | | | 71,027 | |
| | | | | | | | |
|
Distributors 1.0% | |
Genuine Parts Co. | | | 1,840 | | | | 140,447 | |
| | | | | | | | |
| | | | | | | | |
| | |
| | | Shares | | | Value | |
| | | | | | | | |
Diversified Financial Services 0.9% | |
CME Group, Inc. | | | 2,203 | | | $ | 134,075 | |
| | | | | | | | |
| | | | | | | | |
|
Diversified Telecommunication Services 3.9% | |
AT&T, Inc. | | | 4,395 | | | | 164,637 | |
¨CenturyLink, Inc. | | | 5,855 | | | | 219,972 | |
Verizon Communications, Inc. | | | 3,390 | | | | 182,755 | |
| | | | | | | | |
| | | | | | | 567,364 | |
| | | | | | | | |
Electric Utilities 5.9% | |
Duke Energy Corp. | | | 2,810 | | | | 211,312 | |
Entergy Corp. | | | 1,030 | | | | 73,367 | |
Northeast Utilities | | | 3,323 | | | | 150,631 | |
PPL Corp. | | | 5,380 | | | | 179,584 | |
Southern Co. | | | 2,655 | | | | 128,051 | |
Westar Energy, Inc. | | | 3,155 | | | | 110,299 | |
| | | | | | | | |
| | | | | | | 853,244 | |
| | | | | | | | |
Electrical Equipment 2.6% | |
Eaton Corp. PLC | | | 2,890 | | | | 177,475 | |
Emerson Electric Co. | | | 3,455 | | | | 191,787 | |
| | | | | | | | |
| | | | | | | 369,262 | |
| | | | | | | | |
Energy Equipment & Services 1.3% | |
Diamond Offshore Drilling, Inc. | | | 2,709 | | | | 187,192 | |
| | | | | | | | |
|
Food & Staples Retailing 1.5% | |
CVS Caremark Corp. | | | 1,260 | | | | 73,307 | |
Wal-Mart Stores, Inc. | | | 1,915 | | | | 148,834 | |
| | | | | | | | |
| | | | | | | 222,141 | |
| | | | | | | | |
Food Products 3.6% | |
Campbell Soup Co. | | | 3,695 | | | | 171,485 | |
Hershey Co. (The) | | | 1,940 | | | | 172,970 | |
Kraft Foods Group, Inc. | | | 3,455 | | | | 177,898 | |
| | | | | | | | |
| | | | | | | 522,353 | |
| | | | | | | | |
Gas Utilities 1.7% | |
ONEOK, Inc. | | | 2,910 | | | | 149,457 | |
WGL Holdings, Inc. | | | 2,135 | | | | 98,680 | |
| | | | | | | | |
| | | | | | | 248,137 | |
| | | | | | | | |
Health Care Equipment & Supplies 1.0% | |
Medtronic, Inc. | | | 2,990 | | | | 139,573 | |
| | | | | | | | |
|
Hotels, Restaurants & Leisure 1.0% | |
McDonald’s Corp. | | | 1,350 | | | | 137,889 | |
| | | | | | | | |
|
Household Products 3.2% | |
Colgate-Palmolive Co. | | | 640 | | | | 76,423 | |
¨Kimberly-Clark Corp. | | | 2,470 | | | | 254,879 | |
Procter & Gamble Co. (The) | | | 1,705 | | | | 130,893 | |
| | | | | | | | |
| | | | | | | 462,195 | |
| | | | | | | | |
| † | Percentages indicated are based on Fund net assets. |
| ¨ | | Among the Fund’s 10 largest holdings, as of April 30, 2013, excluding short-term investment. May be subject to change daily. |
| | | | | | |
The notes to the financial statements are an integral part of,
and should be read in conjunction with, the financial statements. | | mainstayinvestments.com | | | 11 | |
Portfolio of Investments April 30, 2013 (Unaudited) (continued)
| | | | | | | | |
| | |
| | | Shares | | | Value | |
| Common Stocks (continued) | | | | | | | | |
| | | | | | | | |
Industrial Conglomerates 1.2% | |
3M Co. | | | 1,695 | | | $ | 177,483 | |
| | | | | | | | |
|
Insurance 2.8% | |
Arthur J. Gallagher & Co. | | | 5,070 | | | | 215,221 | |
Marsh & McLennan Cos., Inc. | | | 2,820 | | | | 107,188 | |
Travelers Companies, Inc. (The) | | | 975 | | | | 83,275 | |
| | | | | | | | |
| | | | | | | 405,684 | |
| | | | | | | | |
IT Services 2.4% | |
Automatic Data Processing, Inc. | | | 2,615 | | | | 176,094 | |
Paychex, Inc. | | | 4,540 | | | | 165,302 | |
| | | | | | | | |
| | | | | | | 341,396 | |
| | | | | | | | |
Leisure Equipment & Products 1.7% | |
¨Mattel, Inc. | | | 5,425 | | | | 247,706 | |
| | | | | | | | |
|
Machinery 0.5% | |
Deere & Co. | | | 763 | | | | 68,136 | |
| | | | | | | | |
|
Media 3.2% | |
Comcast Corp. Class A | | | 4,260 | | | | 167,375 | |
Regal Entertainment Group Class A | | | 5,975 | | | | 107,192 | |
Time Warner, Inc. | | | 3,124 | | | | 186,753 | |
| | | | | | | | |
| | | | | | | 461,320 | |
| | | | | | | | |
Multi-Utilities 8.2% | |
CMS Energy Corp. | | | 5,435 | | | | 162,724 | |
Dominion Resources, Inc. | | | 2,335 | | | | 144,023 | |
Integrys Energy Group, Inc. | | | 2,180 | | | | 134,201 | |
NiSource, Inc. | | | 6,430 | | | | 197,594 | |
SCANA Corp. | | | 1,980 | | | | 107,316 | |
TECO Energy, Inc. | | | 4,960 | | | | 94,885 | |
Vectren Corp. | | | 3,065 | | | | 115,121 | |
¨Wisconsin Energy Corp. | | | 5,125 | | | | 230,317 | |
| | | | | | | | |
| | | | | | | 1,186,181 | |
| | | | | | | | |
Oil, Gas & Consumable Fuels 6.5% | |
Chevron Corp. | | | 565 | | | | 68,936 | |
ConocoPhillips | | | 2,390 | | | | 144,475 | |
Enterprise Products Partners, L.P. | | | 1,715 | | | | 104,015 | |
Exxon Mobil Corp. | | | 695 | | | | 61,848 | |
Kinder Morgan Energy Partners, L.P. | | | 1,195 | | | | 105,698 | |
MarkWest Energy Partners, L.P. | | | 1,505 | | | | 95,116 | |
ONEOK Partners, L.P. | | | 1,715 | | | | 92,781 | |
Royal Dutch Shell PLC, ADR | | | 2,150 | | | | 146,135 | |
Spectra Energy Corp. | | | 3,820 | | | | 120,445 | |
| | | | | | | | |
| | | | | | | 939,449 | |
| | | | | | | | |
Pharmaceuticals 6.1% | |
¨AbbVie, Inc. | | | 5,290 | | | | 243,605 | |
Bristol-Myers Squibb Co. | | | 4,595 | | | | 182,513 | |
¨Johnson & Johnson | | | 2,735 | | | | 233,104 | |
¨Merck & Co., Inc. | | | 4,635 | | | | 217,845 | |
| | | | | | | | |
| | | | | | | 877,067 | |
| | | | | | | | |
| | | | | | | | |
| | |
| | | Shares | | | Value | |
| | | | | | | | |
Real Estate Investment Trusts 1.3% | |
Health Care REIT, Inc. | | | 1,505 | | | $ | 112,830 | |
Ventas, Inc. | | | 1,010 | | | | 80,426 | |
| | | | | | | | |
| | | | | | | 193,256 | |
| | | | | | | | |
Semiconductors & Semiconductor Equipment 3.1% | |
Intel Corp. | | | 3,230 | | | | 77,358 | |
KLA-Tencor Corp. | | | 2,555 | | | | 138,609 | |
Linear Technology Corp. | | | 1,750 | | | | 63,875 | |
Microchip Technology, Inc. | | | 4,595 | | | | 167,350 | |
| | | | | | | | |
| | | | | | | 447,192 | |
| | | | | | | | |
Software 1.8% | |
Microsoft Corp. | | | 3,905 | | | | 129,256 | |
Oracle Corp. | | | 4,195 | | | | 137,512 | |
| | | | | | | | |
| | | | | | | 266,768 | |
| | | | | | | | |
Specialty Retail 1.0% | |
Home Depot, Inc. (The) | | | 1,935 | | | | 141,932 | |
| | | | | | | | |
|
Tobacco 5.7% | |
¨Altria Group, Inc. | | | 7,020 | | | | 256,300 | |
Lorillard, Inc. | | | 3,575 | | | | 153,332 | |
Philip Morris International, Inc. | | | 2,160 | | | | 206,474 | |
Reynolds American, Inc. | | | 4,350 | | | | 206,277 | |
| | | | | | | | |
| | | | | | | 822,383 | |
| | | | | | | | |
Total Common Stocks
(Cost $11,870,570) | | | | | | | 13,679,127 | |
| | | | | | | | |
| | |
| | | | | | | | |
| | | Principal
Amount | | | | |
| Short-Term Investment 1.3% | |
Repurchase Agreement 1.3% | | | | | | | | |
State Street Bank and Trust Co.
0.01%, dated 4/30/13
due 5/1/13
Proceeds at Maturity $182,418 (Collateralized by a Federal National Mortgage Assocation security with a rate of 2.00% and a maturity date of 11/2/22, with a Principal Amount of $190,000 and a Market Value of $189,931) | | $ | 182,418 | | | | 182,418 | |
| | | | | | | | |
Total Short-Term Investment
(Cost $182,418) | | | | | | | 182,418 | |
| | | | | | | | |
Total Investments
(Cost $12,052,988) (a) | | | 96.0 | % | | | 13,861,545 | |
Other Assets, Less Liabilities | | | 4.0 | | | | 580,188 | |
Net Assets | | | 100.0 | % | | $ | 14,441,733 | |
| | | | |
| 12 | | MainStay Epoch U.S. Equity Yield Fund | | The notes to the financial statements are an integral part of,
and should be read in conjunction with, the financial statements. |
| (a) | As of April 30, 2013, cost is $12,046,132 for federal income tax purposes and net unrealized appreciation is as follows: |
| | | | |
Gross unrealized appreciation | | $ | 1,815,541 | |
Gross unrealized depreciation | | | (128 | ) |
| | | | |
Net unrealized appreciation | | $ | 1,815,413 | |
| | | | |
The following abbreviation is used in the above portfolio:
ADR—American Depositary Receipt.
The following is a summary of the fair valuations according to the inputs used as of April 30, 2013, for valuing the Fund’s assets.
Asset Valuation Inputs
| | | | | | | | | | | | | | | | |
Description | | Quoted
Prices in
Active
Markets for
Identical
Assets (Level 1) | | | Significant
Other
Observable
Inputs (Level 2) | | | Significant
Unobservable
Inputs
(Level 3) | | | Total | |
| Investments in Securities (a) | | | | | | | | | | | | | | | | |
| Common Stocks | | $ | 13,679,127 | | | $ | — | | | $ | — | | | $ | 13,679,127 | |
| Short-Term Investment | | | | | | | | | | | | | | | | |
Repurchase Agreement | | | — | | | | 182,418 | | | | — | | | | 182,418 | |
| | | | | | | | | | | | | | | | |
| Total Investments in Securities | | $ | 13,679,127 | | | $ | 182,418 | | | $ | — | | | $ | 13,861,545 | |
| | | | | | | | | | | | | | | | |
| (a) | For a complete listing of investments and their industries, see the Portfolio of Investments. |
The Fund recognizes transfers between the levels as of the beginning of the period.
For the period ended April 30, 2013, the Fund did not have any transfers between Level 1 and Level 2 fair value measurements. (See Note 2)
As of April 30, 2013, the Fund did not hold any investments with significant unobservable inputs (Level 3). (See Note 2)
| | | | | | |
The notes to the financial statements are an integral part of,
and should be read in conjunction with, the financial statements. | | mainstayinvestments.com | | | 13 | |
Statement of Assets and Liabilities as of April 30, 2013 (Unaudited)
| | | | |
| Assets | |
Investment in securities, at value
(identified cost $12,052,988) | | $ | 13,861,545 | |
Receivables: | | | | |
Fund shares sold | | | 511,105 | |
Investment securities sold | | | 302,767 | |
Dividends and interest | | | 23,134 | |
Manager (See Note 3) | | | 2,224 | |
Other assets | | | 34,293 | |
| | | | |
Total assets | | | 14,735,068 | |
| | | | |
| |
| Liabilities | | | | |
Payables: | | | | |
Investment securities purchased | | | 159,055 | |
Transfer agent (See Note 3) | | | 51,392 | |
Fund shares redeemed | | | 46,647 | |
Professional fees | | | 22,347 | |
Shareholder communication | | | 9,039 | |
NYLIFE Distributors (See Note 3) | | | 1,231 | |
Trustees | | | 187 | |
Accrued expenses | | | 3,437 | |
| | | | |
Total liabilities | | | 293,335 | |
| | | | |
Net assets | | $ | 14,441,733 | |
| | | | |
| |
| Composition of Net Assets | | | | |
Shares of beneficial interest outstanding (par value of $.001 per share) unlimited number of shares authorized | | $ | 1,148 | |
Additional paid-in capital | | | 12,374,805 | |
| | | | |
| | | 12,375,953 | |
Undistributed net investment income | | | 94,715 | |
Accumulated net realized gain (loss) on investments | | | 162,508 | |
Net unrealized appreciation (depreciation) on investments | | | 1,808,557 | |
| | | | |
Net assets | | $ | 14,441,733 | |
| | | | |
| | | | |
Investor Class | | | | |
Net assets applicable to outstanding shares | | $ | 768,925 | |
| | | | |
Shares of beneficial interest outstanding | | | 61,485 | |
| | | | |
Net asset value per share outstanding | | $ | 12.51 | |
Maximum sales charge (5.50% of offering price) | | | 0.73 | |
| | | | |
Maximum offering price per share outstanding | | $ | 13.24 | |
| | | | |
Class A | | | | |
Net assets applicable to outstanding shares | | $ | 3,671,083 | |
| | | | |
Shares of beneficial interest outstanding | | | 292,636 | |
| | | | |
Net asset value per share outstanding | | $ | 12.54 | |
Maximum sales charge (5.50% of offering price) | | | 0.73 | |
| | | | |
Maximum offering price per share outstanding | | $ | 13.27 | |
| | | | |
Class C | | | | |
Net assets applicable to outstanding shares | | $ | 670,605 | |
| | | | |
Shares of beneficial interest outstanding | | | 54,771 | |
| | | | |
Net asset value and offering price per share outstanding | | $ | 12.24 | |
| | | | |
Class I | | | | |
Net assets applicable to outstanding shares | | $ | 9,331,120 | |
| | | | |
Shares of beneficial interest outstanding | | | 739,065 | |
| | | | |
Net asset value and offering price per share outstanding | | $ | 12.63 | |
| | | | |
| | | | |
| 14 | | MainStay Epoch U.S. Equity Yield Fund | | The notes to the financial statements are an integral part of,
and should be read in conjunction with, the financial statements. |
Statement of Operations for the six months ended April 30, 2013 (Unaudited)
| | | | |
| Investment Income (Loss) | |
Income | | | | |
Dividends | | $ | 454,264 | |
Interest | | | 16 | |
| | | | |
Total income | | | 454,280 | |
| | | | |
Expenses | | | | |
Manager (See Note 3) | | | 81,197 | |
Registration | | | 29,174 | |
Professional fees | | | 21,167 | |
Custodian | | | 14,175 | |
Transfer agent (See Note 3) | | | 13,769 | |
Shareholder communication | | | 11,137 | |
Distribution/Service—Investor Class (See Note 3) | | | 710 | |
Distribution/Service—Class A (See Note 3) | | | 2,429 | |
Distribution/Service—Class C (See Note 3) | | | 2,277 | |
Trustees | | | 286 | |
Miscellaneous | | | 5,612 | |
| | | | |
Total expenses before waiver/reimbursement | | | 181,933 | |
Expense waiver/reimbursement from Manager (See Note 3) | | | (67,351 | ) |
| | | | |
Net expenses | | | 114,582 | |
| | | | |
Net investment income (loss) | | | 339,698 | |
| | | | |
|
| Realized and Unrealized Gain (Loss) on Investments | |
Net realized gain (loss) on investments | | | 400,658 | |
Net change in unrealized appreciation (depreciation) on investments | | | 1,551,761 | |
| | | | |
Net realized and unrealized gain (loss) on investments | | | 1,952,419 | |
| | | | |
Net increase (decrease) in net assets resulting from operations | | $ | 2,292,117 | |
| | | | |
| | | | | | |
The notes to the financial statements are an integral part of,
and should be read in conjunction with, the financial statements. | | mainstayinvestments.com | | | 15 | |
Statements of Changes in Net Assets
for the six months ended April 30, 2013 (Unaudited) and the year ended October 31, 2012
| | | | | | | | |
| | | 2013 | | | 2012 | |
| Increase (Decrease) in Net Assets | |
Operations: | | | | | | | | |
Net investment income (loss) | | $ | 339,698 | | | $ | 2,027,911 | |
Net realized gain (loss) on investments | | | 400,658 | | | | 52,371,551 | |
Net change in unrealized appreciation (depreciation) on investments | | | 1,551,761 | | | | (26,396,938 | ) |
| | | | |
Net increase (decrease) in net assets resulting from operations | | | 2,292,117 | | | | 28,002,524 | |
| | | | |
Dividends and distributions to shareholders: | | | | | | | | |
From net investment income: | | | | | | | | |
Investor Class | | | (4,245 | ) | | | (807 | ) |
Class A | | | (8,995 | ) | | | (1,962 | ) |
Class C | | | (2,900 | ) | | | — | |
Class I | | | (228,843 | ) | | | (1,686,234 | ) |
| | | | |
| | | (244,983 | ) | | | (1,689,003 | ) |
| | | | |
From net realized gain on investments: | | | | | | | | |
Investor Class | | | (99,362 | ) | | | (13,870 | ) |
Class A | | | (247,854 | ) | | | (30,125 | ) |
Class C | | | (78,416 | ) | | | (13,749 | ) |
Class I | | | (5,915,562 | ) | | | (13,880,465 | ) |
| | | | |
| | | (6,341,194 | ) | | | (13,938,209 | ) |
| | | | |
Total dividends and distributions to shareholders | | | (6,586,177 | ) | | | (15,627,212 | ) |
| | | | |
Capital share transactions: | | | | | | | | |
Net proceeds from sale of shares | | | 3,299,544 | | | | 57,657,095 | |
Net asset value of shares issued to shareholders in reinvestment of dividends and distributions | | | 4,002,164 | | | | 4,407,737 | |
Cost of shares redeemed | | | (27,922,850 | ) | | | (304,719,709 | ) |
| | | | |
Increase (decrease) in net assets derived from capital share transactions | | | (20,621,142 | ) | | | (242,654,877 | ) |
| | | | |
Net increase (decrease) in net assets | | | (24,915,202 | ) | | | (230,279,565 | ) |
|
| Net Assets | |
Beginning of period | | | 39,356,935 | | | | 269,636,500 | |
| | | | |
End of period | | $ | 14,441,733 | | | $ | 39,356,935 | |
| | | | |
Undistributed net investment income at end of period | | $ | 94,715 | | | $ | — | |
| | | | |
| | | | |
| 16 | | MainStay Epoch U.S. Equity Yield Fund | | The notes to the financial statements are an integral part of,
and should be read in conjunction with, the financial statements. |
Financial Highlights selected per share data and ratios
| | | | | | | | | | | | | | | | | | | | |
| | | Investor Class | |
| | | Six months
ended
April 30, | | | Year ended October 31, | | | January 1,
2010
through
October 31, | | | November 16,
2009**
through
December 31, | |
| | | 2013* | | | 2012 | | | 2011 | | | 2010*** | | | 2009 | |
Net asset value at beginning of period | | $ | 13.54 | | | $ | 12.66 | | | $ | 13.51 | | | $ | 12.67 | | | $ | 12.38 | |
| | | | | | | | | | | | | | | | | | | | |
Net investment income (loss) (a) | | | 0.15 | | | | 0.13 | | | | 0.04 | | | | 0.03 | | | | 0.02 | |
Net realized and unrealized gain (loss) on investments | | | 1.62 | | | | 1.46 | | | | 0.51 | | | | 0.81 | | | | 0.30 | |
| | | | | | | | | | | | | | | | | | | | |
Total from investment operations | | | 1.77 | | | | 1.59 | | | | 0.55 | | | | 0.84 | | | | 0.32 | |
| | | | | | | | | | | | | | | | | | | | |
Less dividends and distributions: | | | | | | | | | | | | | | | | | | | | |
From net investment income | | | (0.12 | ) | | | (0.04 | ) | | | (0.05 | ) | | | — | | | | (0.03 | ) |
From net realized gain on investments | | | (2.68 | ) | | | (0.67 | ) | | | (1.35 | ) | | | — | | | | — | |
| | | | | | | | | | | | | | | | | | | | |
Total dividends and distributions | | | (2.80 | ) | | | (0.71 | ) | | | (1.40 | ) | | | — | | | | (0.03 | ) |
| | | | | | | | | | | | | | | | | | | | |
Net asset value at end of period | | $ | 12.51 | | | $ | 13.54 | | | $ | 12.66 | | | $ | 13.51 | | | $ | 12.67 | |
| | | | | | | | | | | | | | | | | | | | |
Total investment return (b) | | | 16.44 | %(c) | | | 13.22 | % | | | 4.06 | % | | | 6.63 | %(c) | | | 2.60 | %(c) |
Ratios (to average net assets)/Supplemental Data: | | | | | | | | | | | | | | | | | | | | |
Net investment income (loss) | | | 2.49 | %†† | | | 1.02 | % | | | 0.27 | % | | | 0.25 | %†† | | | 1.11 | %†† |
Net expenses | | | 1.37 | %†† | | | 1.21 | %(d) | | | 1.36 | % | | | 1.40 | %†† | | | 1.19 | %†† |
Expenses (before waiver/reimbursement) | | | 2.03 | %†† | | | 1.50 | %(d) | | | 1.36 | % | | | 1.43 | %†† | | | 1.19 | %†† |
Portfolio turnover rate | | | 17 | % | | | 50 | % | | | 54 | % | | | 54 | % | | | 54 | % |
Net assets at end of period (in 000’s) | | $ | 769 | | | $ | 444 | | | $ | 273 | | | $ | 74 | | | $ | 28 | |
| ** | Commencement of operations. |
| *** | The Fund changed its fiscal year end from December 31 to October 31. |
| (a) | Per share data based on average shares outstanding during the period. |
| (b) | Total investment return is calculated exclusive of sales charges and assumes the reinvestment of dividends and distributions. |
| (c) | Total investment return is not annualized. |
| (d) | Net of interest expense which is less than one-tenth of a percent. (See Note 6) |
| | | | | | |
The notes to the financial statements are an integral part of,
and should be read in conjunction with, the financial statements. | | mainstayinvestments.com | | | 17 | |
Financial Highlights selected per share data and ratios
| | | | | | | | | | | | | | | | | | | | |
| | | Class A | |
| | | Six months
ended
April 30, | | | Year ended October 31, | | | January 1,
2010
through
October 31, | | | February 3,
2009**
through
December 31, | |
| | | 2013* | | | 2012 | | | 2011 | | | 2010*** | | | 2009 | |
Net asset value at beginning of period | | $ | 13.56 | | | $ | 12.68 | | | $ | 13.52 | | | $ | 12.67 | | | $ | 10.24 | |
| | | | | | | | | | | | | | | | | | | | |
Net investment income (loss) (a) | | | 0.14 | | | | 0.12 | | | | 0.05 | | | | 0.02 | | | | 0.08 | |
Net realized and unrealized gain (loss) on investments | | | 1.62 | | | | 1.47 | | | | 0.51 | | | | 0.83 | | | | 3.33 | |
| | | | | | | | | | | | | | | | | | | | |
Total from investment operations | | | 1.76 | | | | 1.59 | | | | 0.56 | | | | 0.85 | | | | 3.41 | |
| | | | | | | | | | | | | | | | | | | | |
Less dividends and distributions: | | | | | | | | | | | | | | | | | | | | |
From net investment income | | | (0.10 | ) | | | (0.04 | ) | | | (0.05 | ) | | | — | | | | (0.10 | ) |
From net realized gain on investments | | | (2.68 | ) | | | (0.67 | ) | | | (1.35 | ) | | | — | | | | (0.88 | ) |
| | | | | | | | | | | | | | | | | | | | |
Total dividends and distributions | | | (2.78 | ) | | | (0.71 | ) | | | (1.40 | ) | | | — | | | | (0.98 | ) |
| | | | | | | | | | | | | | | | | | | | |
Net asset value at end of period | | $ | 12.54 | | | $ | 13.56 | | | $ | 12.68 | | | $ | 13.52 | | | $ | 12.67 | |
| | | | | | | | | | | | | | | | | | | | |
Total investment return (b) | | | 16.42 | %(c) | | | 13.24 | % | | | 4.18 | % | | | 6.71 | %(c) | | | 33.59 | %(c) |
Ratios (to average net assets)/Supplemental Data: | | | | | | | | | | | | | | | | | | | | |
Net investment income (loss) | | | 2.35 | %†† | | | 0.89 | % | | | 0.41 | % | | | 0.19 | %†† | | | 0.76 | %†† |
Net expenses | | | 1.32 | %†† | | | 1.31 | %(d) | | | 1.25 | % | | | 1.34 | %†† | | | 1.35 | %†† |
Expenses (before waiver/reimbursement) | | | 1.98 | %†† | | | 1.62 | %(d) | | | 1.25 | % | | | 1.37 | %†† | | | 1.44 | %†† |
Portfolio turnover rate | | | 17 | % | | | 50 | % | | | 54 | % | | | 54 | % | | | 54 | % |
Net assets at end of period (in 000’s) | | $ | 3,671 | | | $ | 1,090 | | | $ | 534 | | | $ | 850 | | | $ | 127 | |
| ** | Commencement of operations. |
| *** | The Fund changed its fiscal year end from December 31 to October 31. |
| (a) | Per share data based on average shares outstanding during the period. |
| (b) | Total investment return is calculated exclusive of sales charges and assumes the reinvestment of dividends and distributions. |
| (c) | Total investment return is not annualized. |
| (d) | Net of interest expense which is less than one-tenth of a percent. (See Note 6) |
| | | | |
| 18 | | MainStay Epoch U.S. Equity Yield Fund | | The notes to the financial statements are an integral part of,
and should be read in conjunction with, the financial statements. |
Financial Highlights selected per share data and ratios
| | | | | | | | | | | | | | | | | | | | |
| | | Class C | |
| | | Six months
ended
April 30, | | | Year ended October 31, | | | January 1,
2010
through
October 31, | | | November 16,
2009**
through
December 31, | |
| | | 2013* | | | 2012 | | | 2011 | | | 2010*** | | | 2009 | |
Net asset value at beginning of period | | $ | 13.34 | | | $ | 12.53 | | | $ | 13.42 | | | $ | 12.67 | | | $ | 12.38 | |
| | | | | | | | | | | | | | | | | | | | |
Net investment income (loss) (a) | | | 0.10 | | | | 0.03 | | | | (0.05 | ) | | | (0.07 | ) | | | 0.01 | |
Net realized and unrealized gain (loss) on investments | | | 1.58 | | | | 1.45 | | | | 0.51 | | | | 0.82 | | | | 0.30 | |
| | | | | | | | | | | | | | | | | | | | |
Total from investment operations | | | 1.68 | | | | 1.48 | | | | 0.46 | | | | 0.75 | | | | 0.31 | |
| | | | | | | | | | | | | | | | | | | | |
Less dividends and distributions: | | | | | | | | | | | | | | | | | | | | |
From net investment income | | | (0.10 | ) | | | — | | | | — | | | | — | | | | (0.02 | ) |
From net realized gain on investments | | | (2.68 | ) | | | (0.67 | ) | | | (1.35 | ) | | | — | | | | — | |
| | | | | | | | | | | | | | | | | | | | |
Total dividends and distributions | | | (2.78 | ) | | | (0.67 | ) | | | (1.35 | ) | | | — | | | | (0.02 | ) |
| | | | | | | | | | | | | | | | | | | | |
Net asset value at end of period | | $ | 12.24 | | | $ | 13.34 | | | $ | 12.53 | | | $ | 13.42 | | | $ | 12.67 | |
| | | | | | | | | | | | | | | | | | | | |
Total investment return (b) | | | 15.94 | %(c) | | | 12.49 | % | | | 3.30 | % | | | 5.92 | % (c)(d) | | | 2.51 | %(c) |
Ratios (to average net assets)/Supplemental Data: | | | | | | | | | | | | | | | | | | | | |
Net investment income (loss) | | | 1.70 | %†† | | | 0.23 | % | | | (0.42 | %) | | | (0.63 | %)†† | | | 0.37 | %†† |
Net expenses | | | 2.12 | %†† | | | 1.98 | %(e) | | | 2.10 | % | | | 2.15 | % †† | | | 1.94 | %†† |
Expenses (before waiver/reimbursement) | | | 2.78 | %†† | | | 2.23 | %(e) | | | 2.10 | % | | | 2.18 | % †† | | | 1.94 | %†† |
Portfolio turnover rate | | | 17 | % | | | 50 | % | | | 54 | % | | | 54 | % | | | 54 | % |
Net assets at end of period (in 000’s) | | $ | 671 | | | $ | 393 | | | $ | 208 | | | $ | 33 | | | $ | 26 | |
| ** | Commencement of operations. |
| *** | The Fund changed its fiscal year end from December 31 to October 31. |
| (a) | Per share data based on average shares outstanding during the period. |
| (b) | Total investment return is calculated exclusive of sales charges and assumes the reinvestment of dividends and distributions. |
| (c) | Total investment return is not annualized. |
| (d) | Total investment return may reflect adjustments to conform to generally accepted accounting principles. |
| (e) | Net of interest expense which is less than one-tenth of a percent. (See Note 6) |
| | | | | | |
The notes to the financial statements are an integral part of,
and should be read in conjunction with, the financial statements. | | mainstayinvestments.com | | | 19 | |
Financial Highlights selected per share data and ratios
| | | | | | | | | | | | | | | | | | | | | | | | |
| | | Class I | |
| | | Six months
ended
April 30, | | | Year ended October 31, | | | January 1,
2010
through
October 31, | | | Year ended
December 31, | | | December 3,
2008**
through
December 31, | |
| | | 2013* | | | 2012 | | | 2011 | | | 2010*** | | | 2009 | | | 2008 | |
Net asset value at beginning of period | | $ | 13.62 | | | $ | 12.75 | | | $ | 13.58 | | | $ | 12.70 | | | $ | 10.85 | | | $ | 10.00 | |
| | | | | | | | | | | | | | | | | | | | | | | | |
Net investment income (loss) | | | 0.21 | (a) | | | 0.14 | (a) | | | 0.09 | (a) | | | 0.04 | (a) | | | 0.11 | (a) | | | 0.01 | |
Net realized and unrealized gain (loss) on investments | | | 1.58 | | | | 1.48 | | | | 0.51 | | | | 0.84 | | | | 2.74 | | | | 0.85 | |
| | | | | | | | | | | | | | | | | | | | | | | | |
Total from investment operations | | | 1.79 | | | | 1.62 | | | | 0.60 | | | | 0.88 | | | | 2.85 | | | | 0.86 | |
| | | | | | | | | | | | | | | | | | | | | | | | |
Less dividends and distributions: | | | | | | | | | | | | | | | | | | | | | | | | |
From net investment income | | | (0.10 | ) | | | (0.08 | ) | | | (0.08 | ) | | | — | | | | (0.12 | ) | | | (0.01 | ) |
From net realized gain on investments | | | (2.68 | ) | | | (0.67 | ) | | | (1.35 | ) | | | — | | | | (0.88 | ) | | | — | |
| | | | | | | | | | | | | | | | | | | | | | | | |
Total dividends and distributions | | | (2.78 | ) | | | (0.75 | ) | | | (1.43 | ) | | | — | | | | (1.00 | ) | | | (0.01 | ) |
| | | | | | | | | | | | | | | | | | | | | | | | |
Net asset value at end of period | | $ | 12.63 | | | $ | 13.62 | | | $ | 12.75 | | | $ | 13.58 | | | $ | 12.70 | | | $ | 10.85 | |
| | | | | | | | | | | | | | | | | | | | | | | | |
Total investment return (b) | | | 16.57 | %(c) | | | 13.43 | % | | | 4.43 | % | | | 6.93 | %(c) | | | 26.53 | % | | | 8.59 | %(c) |
Ratios (to average net assets)/Supplemental Data: | | | | | | | | | | | | | | | | | | | | | | | | |
Net investment income (loss) | | | 3.53 | %†† | | | 1.06 | % | | | 0.67 | % | | | 0.40 | %†† | | | 0.98 | % | | | 1.28 | %†† |
Net expenses | | | 1.08 | %†† | | | 1.05 | %(d) | | | 1.00 | % | | | 1.09 | %†† | | | 1.09 | % | | | 1.09 | %†† |
Expenses (before waiver/reimbursement) | | | 1.74 | %†† | | | 1.10 | %(d) | | | 1.00 | % | | | 1.12 | %†† | | | 1.19 | % | | | 1.16 | %†† |
Portfolio turnover rate | | | 17 | % | | | 50 | % | | | 54 | % | | | 54 | % | | | 54 | % | | | 1 | % |
Net assets at end of period (in 000’s) | | $ | 9,331 | | | $ | 37,430 | | | $ | 268,622 | | | $ | 229,830 | | | $ | 155,231 | | | $ | 98,778 | |
| ** | Commencement of operations. |
| *** | The Fund changed its fiscal year end from December 31 to October 31. |
| (a) | Per share data based on average shares outstanding during the period. |
| (b) | Total investment return is calculated exclusive of sales charges and assumes the reinvestment of dividends and distributions. Class I shares are not subject to sales charges. |
| (c) | Total investment return is not annualized. |
| (d) | Net of interest expense which is less than one-tenth of a percent. (See Note 6) |
| | | | |
| 20 | | MainStay Epoch U.S. Equity Yield Fund | | The notes to the financial statements are an integral part of,
and should be read in conjunction with, the financial statements. |
Notes to Financial Statements (Unaudited)
Note 1–Organization and Business
MainStay Funds Trust (the “Trust”) was organized as a Delaware statutory trust on April 28, 2009, and is governed by a Declaration of Trust. The Trust is registered under the Investment Company Act of 1940, as amended (the “1940 Act”), as an open-end investment management company, and is comprised of thirty-three funds (collectively referred to as the “Funds”). These financial statements and notes relate only to the MainStay Epoch U.S. Equity Yield Fund (the “Fund”), a diversified fund. Prior to September 17, 2012, the Fund’s name was MainStay Epoch U.S. Equity Fund, with a different investment objective, investment strategies, and investment process. The Fund is the successor to the Epoch U.S. Large Cap Equity Fund (the “Predecessor Fund”), which was a series of a different registered investment company for which Epoch Investment Partners, Inc. served as investment advisor. The financial statements of the Fund reflect the historical results of the Institutional Class and Class P shares of the Predecessor Fund prior to its reorganization. Upon the completion of the reorganization, the Class I and Class A shares of the Fund assumed the performance, financial and other information of the Institutional Class and Class P shares of the Predecessor Fund, respectively. All information and references to periods prior to November 16, 2009 refer to the Predecessor Fund.
The Fund currently offers four classes of shares. Investor Class and Class C shares commenced operations on November 16, 2009. Class A and Class I shares commenced operations (under former designations) on February 3, 2009 and December 3, 2008, respectively. Investor Class and Class A shares are offered at net asset value (“NAV”) per share plus an initial sales charge. No sales charge applies to investments of $1 million or more (and certain other qualified purchases) in Investor Class and Class A shares, but a contingent deferred sales charge (“CDSC”) is imposed on certain redemptions made within one year of the date of purchase. Class C shares are offered at NAV without an initial sales charge, although a 1.00% CDSC may be imposed on redemptions made within one year of the date of purchase of Class C shares. Class I shares are offered at NAV and are not subject to a sales charge. Depending upon eligibility, Investor Class shares may convert to Class A shares and Class A shares may convert to Investor Class shares. The four classes of shares have the same voting (except for issues that relate solely to one class), dividend, liquidation and other rights, and the same terms and conditions, except that Class C shares are subject to higher distribution and/or service fee rates than Investor Class and Class A shares under a distribution plan pursuant to Rule 12b-1 under the 1940 Act. Class I shares are not subject to a distribution and/or service fee.
The Fund’s investment objective is to seek current income and capital appreciation.
Note 2–Significant Accounting Policies
The Fund prepares its financial statements in accordance with generally accepted accounting principles (“GAAP”) in the United States of America and follows the significant accounting policies described below.
(A) Securities Valuation. Investments are valued as of the close of regular trading on the New York Stock Exchange (“Exchange”) (generally 4:00 p.m. Eastern time) on each day the Fund is open for business (“valuation date”).
The Board of Trustees (the “Board”) has adopted procedures for the valuation of the Fund’s securities and has delegated the responsibility for valuation determination under those procedures to the Valuation Committee of the Fund (the “Valuation Committee”). The Board has authorized the Valuation Committee to appoint a Valuation Sub-Committee (the “Sub-Committee”) to deal in the first instance with questions that arise or cannot be resolved under these procedures. The Sub-Committee meets (in person, via electronic mail or via teleconference) on an as-needed basis. The Valuation Committee meets at a later time, as necessary, to ensure that actions taken by the Sub-Committee were appropriate. The procedures recognize that, subject to the oversight of the Board and unless otherwise noted, the responsibility for day-to-day valuation of portfolio assets (including securities for which market prices are not readily available) rests with New York Life Investment Management LLC ( “New York Life Investments” or the “Manager”), aided to whatever extent necessary by the Subadvisor (as defined in Note 3(A)) of the Fund.
To assess the appropriateness of security valuations, the Manager or the Fund’s third party service provider who is subject to oversight by the Manager, regularly compares prior day prices, prices on comparable securities and the sale prices to the prior and current day prices and challenges prices exceeding certain tolerance levels with third party pricing services or broker sources. For those securities valued by recommendation, whether through a standardized fair valuation methodology or a fair valuation determination, the Valuation Committee reviews and affirms the reasonableness of the valuation based on such methodologies and determinations on a regular basis after considering all relevant information that is reasonably available.
“Fair value” is defined as the price that the Fund would receive upon selling an investment in an orderly transaction to an independent buyer in the principal or most advantageous market of the investment. Fair value measurements are determined within a framework that has established a three-tier hierarchy which maximizes the use of observable market data and minimizes the use of unobservable inputs to establish classification of fair value measurements for disclosure purposes. “Inputs” refers broadly to the assumptions that market participants would use in pricing the asset or liability, including assumptions about risk, such as the risk inherent in a particular valuation technique used to measure fair value using a pricing model and/or the risk inherent in the inputs for the valuation technique. Inputs may be observable or unobservable. Observable inputs reflect the assumptions market participants would use in pricing the asset or liability based on market data obtained from sources independent of the Fund. Unobservable inputs reflect the Fund’s own assumptions about the assumptions market participants would use in pricing the asset or liability developed based on the information available in the circumstances. The inputs or methodology used for valuing securities may not be an indication of the risks associated with investing in those securities. The three-tier hierarchy of inputs is summarized in the three broad Levels listed below.
| • | | Level 1—quoted prices in active markets for identical investments |
| • | | Level 2—other significant observable inputs (including quoted prices for similar investments in active markets, interest rates and yield curves, prepayment speeds, credit risks, etc.) |
| | | | |
| mainstayinvestments.com | | | 21 | |
Notes to Financial Statements (Unaudited) (continued)
| • | | Level 3—significant unobservable inputs (including the Fund’s own assumptions about the assumptions that market participants would use in determining the fair value of investments) |
The aggregate value by input level, as of April 30, 2013, for the Fund’s investments is included at the end of the Fund’s Portfolio of Investments.
The valuation techniques used by the Fund to measure fair value maximize the use of observable inputs and minimize the use of unobservable inputs. The Fund may utilize third party vendor evaluations, whose prices may be derived from one or more of the following standard inputs:
| | |
• Benchmark Yields | | • Reported Trades |
• Broker Dealer Quotes | | • Issuer Spreads |
• Two-sided markets | | • Benchmark securities |
• Bids/Offers | | • Reference Data (corporate actions or material event notices) |
• Industry and economic events | | • Comparable bonds |
• Equity and credit default swap curves | | • Monthly payment information |
Securities for which market values cannot be determined using the methodologies described above are valued by methods deemed in good faith by the Fund’s Valuation Committee, following the procedures established by the Board, to represent fair value. Under these procedures, the Fund primarily employs a market-based approach which may use related or comparable assets or liabilities, recent transactions, market multiples, book values, and other relevant information. The Fund may also use an income-based valuation approach in which the anticipated future cash flows of the investment are discounted to calculate fair value. Discounts may also be applied due to the nature or duration of any restrictions on the disposition of the investments. Due to the inherent uncertainty of valuations of such investments, the fair values may differ significantly from the values that would have been used had an active market existed. For the six-month period ended April 30, 2013, there have been no changes to the fair value methodologies.
Equity and non-equity securities which may be valued in this manner include, but are not limited to: (i) a security for which the trading has been halted or suspended; (ii) a debt security that has recently gone into default and for which there is not a current market quotation; (iii) a security of an issuer that has entered into a restructuring; (iv) a security that has been de-listed from a national exchange; (v) a security for which the market price is not available from a third party pricing source or, if so provided, does not, in the opinion of the Fund’s Manager or Subadvisor reflect the security’s market value; and (vi) a security whose principal market has been temporarily closed at a time when, under normal conditions, it would be open. Securities for which market quotations or observable inputs are not readily available are generally categorized as Level 3 in the hierarchy. As of April 30, 2013, the Fund did not hold any securities that were fair valued in such a manner.
Certain events may occur between the time that foreign markets close, on which securities held by the Fund principally trade, and the time at which the Fund’s NAV is calculated. These events may include, but are not limited to, situations relating to a single issuer in a market sector, significant fluctuations in U.S. or foreign markets, natural disasters,
armed conflicts, governmental actions or other developments not tied directly to the securities markets. Should the Manager or Subadvisor conclude that such events may have affected the accuracy of the last price of such securities reported on the local foreign market, the Manager or Subadvisor may, pursuant to procedures adopted by the Board, adjust the value of the local price to reflect the estimated impact on the price of such securities as a result of such events. In this instance, securities are generally categorized as Level 3 in the hierarchy. Additionally, foreign equity securities are also fair valued whenever the movement of a particular index exceeds certain thresholds. In such cases, the securities are fair valued by applying factors provided by a third party vendor in accordance with the Fund’s policies and procedures and are generally categorized as Level 2 in the hierarchy. As of April 30, 2013, certain foreign equity securities held by the Fund were not fair valued in such a manner.
Equity securities and Exchange Traded Funds are valued at the latest quoted sales prices as of the close of regular trading on the Exchange on each valuation date. Securities that are not traded on the valuation date are valued at the mean of the latest quoted bid and ask prices. Prices normally are taken from the principal market in which each security trades. Futures contracts are valued at the last posted settlement price on the market where such futures are primarily traded. Options contracts are valued at the last posted settlement price on the market where such options are principally traded. Investments in other mutual funds are valued at their respective NAVs as of the close of the Exchange on the valuation date. These securities are generally categorized as Level 1 in the hierarchy.
Temporary cash investments acquired over 60 days to maturity are valued using the latest bid prices or using valuations based on a matrix system (which considers such factors as security prices, yields, maturities, and ratings), both as furnished by independent pricing services. Other temporary cash investments which mature in 60 days or less (“Short-Term Investments”) are valued at amortized cost. The amortized cost method involves valuing a security at its cost on the date of purchase and thereafter assuming a constant amortization to maturity of the difference between such cost and the value on maturity date. Amortized cost approximates the current fair value of a security. Securities valued at amortized cost are not valued using a quoted price in an active market. These securities are generally categorized as Level 2 in the hierarchy.
(B) Income Taxes. The Fund’s policy is to comply with the requirements of the Internal Revenue Code of 1986, as amended (the “Internal Revenue Code”), applicable to regulated investment companies and to distribute all of the taxable income to the shareholders of the Fund within the allowable time limits. Therefore, no federal, state and local income tax provision is required.
Management evaluates its tax positions to determine if the tax positions taken meet the minimum recognition threshold in connection with accounting for uncertainties in income tax positions taken or expected to be taken for the purposes of measuring and recognizing tax liabilities in the financial statements. Recognition of tax benefits of an uncertain tax position is required only when the position is “more likely than not” to be sustained assuming examination by taxing authorities. Management has analyzed the Fund’s tax positions taken on federal, state and local income tax returns for all open tax years (for up to three tax years), and
| | |
| 22 | | MainStay Epoch U.S. Equity Yield Fund |
has concluded that no provision for federal, state and local income tax is required in the Fund’s financial statements. The Fund’s federal, state and local income and federal excise tax returns for tax years for which the applicable statutes of limitations have not expired are subject to examination by the Internal Revenue Service and state and local departments of revenue.
(C) Dividends and Distributions to Shareholders. Dividends and distributions are recorded on the ex-dividend date. The Fund intends to declare and pay dividends of net investment income and distributions of net realized capital and currency gains, if any, at least annually. Unless the shareholder elects otherwise, all dividends and distributions are reinvested in the same class of shares of the Fund, at NAV. Dividends and distributions to shareholders are determined in accordance with federal income tax regulations and may differ from GAAP.
(D) Security Transactions and Investment Income. The Fund records security transactions on the trade date. Realized gains and losses on security transactions are determined using the identified cost method. Dividend income is recognized on the ex-dividend date and interest income is accrued as earned using the effective interest rate method. Discounts and premiums on Short-Term Investments are accreted and amortized, respectively, on the straight-line method.
Investment income and realized and unrealized gains and losses on investments of the Fund are allocated to separate classes of shares pro rata based upon their relative net assets on the date the income is earned or realized and unrealized gains and losses are incurred.
(E) Expenses. Expenses of the Trust are allocated to the individual Funds in proportion to the net assets of the respective Funds when the expenses are incurred, except where direct allocations of expenses can be made. Expenses (other than transfer agent expenses and fees incurred under the shareholder services plans and the distribution plans further discussed in Note 3(B)) are allocated to separate classes of shares pro rata based upon their relative net assets on the date the expenses are incurred. The expenses borne by the Fund, including those of related parties to the Fund, are shown in the Statement of Operations.
(F) Use of Estimates. In preparing financial statements in conformity with GAAP, management makes estimates and assumptions that affect the reported amounts and disclosures in the financial statements. Actual results could differ from those estimates.
(G) Repurchase Agreements. The Fund may enter into repurchase agreements to earn income. The Fund may enter into repurchase agreements only with financial institutions that are deemed by the Manager or Subadvisor to be creditworthy, pursuant to guidelines established by the Fund’s Board. During the term of any repurchase agreement, the Manager or Subadvisor will continue to monitor the creditworthiness of the seller. Under the 1940 Act, repurchase agreements are considered to be collateralized loans by a Fund to the seller secured by the securities transferred to the Fund.
When the Fund invests in repurchase agreements, the Fund’s custodian takes possession of the collateral pledged for investments in the repurchase agreement. The underlying collateral is valued daily on a mark-to-market basis to determine that the value, including accrued interest, exceeds the repurchase price. In the event of the seller’s
default on the obligation to repurchase, the Fund has the right to liquidate the collateral and apply the proceeds in satisfaction of the obligation. Under certain circumstances, such as in the event of default or bankruptcy by the counterparty to the agreement, realization and/or retention of the collateral may be subject to legal proceedings and possible realized loss to the Fund.
(H) Securities Lending. In order to realize additional income, the Fund may engage in securities lending, subject to the limitations set forth in the 1940 Act and relevant guidance by the staff of the Securities and Exchange Commission. In the event the Fund does engage in securities lending, the Fund will lend through its custodian, State Street Bank and Trust Company (“State Street”). State Street will manage the Fund’s cash collateral in accordance with the lending agreement between the Fund and State Street, and indemnify the Fund’s portfolio against counterparty risk. The loans will be collateralized by cash or securities at least equal at all times to the market value of the securities loaned. Collateral will consist of U.S. Government securities, cash equivalents or irrevocable letters of credit. The Fund may bear the risk of delay in recovery of, or loss of rights in, the securities loaned should the borrower of the securities experience financial difficulty. The Fund may also record realized gain or loss on securities deemed sold due to a borrower’s inability to return securities on loan. The Fund will receive compensation for lending its securities in the form of fees or the retention of a portion of the interest on the investment of any cash received as collateral. The Fund also will continue to receive interest and dividends on the securities loaned and any gain or loss in the market price of the securities loaned that may occur during the term of the loan will be for the account of the Fund.
Although the Fund and New York Life Investments have temporarily suspended securities lending, the Fund and New York Life Investments reserve the right to reinstitute lending when deemed appropriate. The Fund did not have any portfolio securities on loan as of April 30, 2013.
(I) Indemnifications. Under the Trust’s organizational documents, its officers and trustees are indemnified against certain liabilities that may arise out of performance of their duties to the Trust. Additionally, in the normal course of business, the Fund enters into contracts with third-party service providers that contain a variety of representations and warranties and which may provide general indemnifications. The Fund’s maximum exposure under these arrangements is unknown, as this would involve future claims that may be made against the Fund that have not yet occurred. Based on experience, management is of the view that the risk of loss in connection with these potential indemnification obligations is remote. However, there can be no assurance that material liabilities related to such obligations will not arise in the future, which could adversely impact the Fund.
(J) Large Transaction Risks. From time to time, the Fund may receive large purchase or redemption orders from affiliated or unaffiliated mutual funds or other investors. Such large transactions could have adverse effects on the Fund’s performance if the Fund were required to sell securities or invest cash at times when it otherwise would not do so. This activity could also accelerate the realization of capital gains and increase the Fund’s transaction costs.
| | | | |
| mainstayinvestments.com | | | 23 | |
Notes to Financial Statements (Unaudited) (continued)
Note 3–Fees and Related Party Transactions
(A) Manager and Subadvisor. New York Life Investments, a registered investment adviser and an indirect, wholly-owned subsidiary of New York Life Insurance Company (“New York Life”), serves as the Fund’s Manager, pursuant to an Amended and Restated Management Agreement (“Management Agreement”). The Manager provides offices, conducts clerical, recordkeeping and bookkeeping services, and keeps most of the financial and accounting records required to be maintained by the Fund. Except for the portion of salaries and expenses that are the responsibility of the Fund, the Manager pays the salaries and expenses of all personnel affiliated with the Fund and certain operational expenses of the Fund. The Fund reimburses New York Life Investments in an amount equal to a portion of the salary of the Chief Compliance Officer (“CCO”) of the Fund. Epoch Investment Partners, Inc. (‘‘Epoch’’ or “Subadvisor”), a registered investment adviser, serves as Subadvisor to the Fund and is responsible for the day-to-day portfolio management of the Fund. Pursuant to the terms of an Amended and Restated Subadvisory Agreement (“Subadvisory Agreement”) between New York Life Investments and Epoch, New York Life Investments pays for the services of the Subadvisor.
The Fund pays the Manager a monthly fee for services performed and facilities furnished at an annual rate of the Fund’s average daily net assets as follows: 0.80% up to $500 million; and 0.79% in excess of $500 million. The effective management fee rate was 0.80% for the six-month period ended April 30, 2013.
New York Life Investments has contractually agreed to waive fees and/or reimburse expenses so that Total Annual Fund Operating Expenses for Class A shares do not exceed 1.32% of its average daily net assets. New York Life Investments has agreed to apply an equivalent waiver or reimbursement, in an amount equal to the number of basis points waived for Class A shares, to the other share classes. This agreement will remain in effect until February 28, 2014, and shall renew automatically for one-year terms unless New York Life Investments provides written notice of termination prior to the start of the next term or upon approval of the Board of Trustees of the Fund. Total Annual Fund Operating Expenses excludes taxes, interest, litigation, extraordinary expenses, brokerage and other transaction expenses relating to the purchase or sale of portfolio investments, and acquired (underlying) fund fees and expenses.
Total Annual Fund Operating Expenses excludes taxes, interest, litigation, extraordinary expenses, brokerage and other transaction expenses relating to the purchase or sale of portfolio investments, and acquired (underlying) fund fees and expenses.
For the six-month period ended April 30, 2013, New York Life Investments earned fees from the Fund in the amount of $81,197 and waived its fees and/or reimbursed expenses in the amount of $67,351.
State Street, 1 Lincoln Street, Boston, Massachusetts 02111, provides sub-administration and sub-accounting services to the Fund pursuant to an agreement with New York Life Investments. These services include calculating the daily NAVs of the Fund, maintaining the general ledger and sub-ledger accounts for the calculation of the Fund’s respective NAVs, and assisting New York Life Investments in conducting various aspects of the Fund’s administrative operations. For providing these services to the Fund, State Street is compensated by New York Life Investments.
(B) Distribution and Service Fees. The Trust, on behalf of the Fund, has entered into a distribution agreement with NYLIFE Distributors LLC (the “Distributor”), an indirect, wholly-owned subsidiary of New York Life. The Fund has adopted distribution plans (the “Plans”) in accordance with the provisions of Rule 12b-1 under the 1940 Act.
Pursuant to the Investor Class and Class A Plans, the Distributor receives a monthly distribution fee at an annual rate of 0.25% of the average daily net assets of the Investor Class and Class A shares for distribution and/or service activities as designated by the Distributor. Pursuant to the Class C Plan, Class C shares pay the Distributor a monthly distribution fee at an annual rate of 0.75% of the average daily net assets of the Class C shares, along with a service fee at an annual rate of 0.25% of the average daily net assets of the Class C shares, for a total 12b-1 fee of 1.00%. Class I shares are not subject to a distribution and/or service fee.
The Plans provide that the distribution and service fees are payable to the Distributor regardless of the amounts actually expended by the Distributor for distribution of the Fund’s shares and service activities.
(C) Sales Charges. The Fund was advised by the Distributor that the amount of sales charges retained on sales of Investor Class and Class A shares were $1,108 and $3,029, respectively, for the six-month period ended April 30, 2013.
The Fund was also advised that the Distributor retained CDSCs on redemptions of Class C shares of $22 for the six-month period ended April 30, 2013.
(D) Transfer, Dividend Disbursing and Shareholder Servicing Agent. NYLIM Service Company LLC, an affiliate of New York Life Investments, is the Fund’s transfer, dividend disbursing and shareholder servicing agent pursuant to an agreement between NYLIM Service Company LLC and the Trust. NYLIM Service Company LLC has entered into an agreement with Boston Financial Data Services, Inc. (“BFDS”) pursuant to which BFDS performs certain transfer agent services on behalf of NYLIM Service Company LLC. Transfer agent expenses incurred by the Fund for the six-month period ended April 30, 2013, were as follows:
| | | | |
Investor Class | | $ | 495 | |
Class A | | | 1,263 | |
Class C | | | 395 | |
Class I | | | 11,616 | |
(E) Small Account Fee. Shareholders with small accounts adversely impact the cost of providing transfer agency services. In an effort to reduce total transfer agency expenses, the Fund has implemented a small account fee on certain types of accounts. Certain shareholders with an account balance of less than $1,000 are charged an annual per account fee of $20 (assessed semi-annually), the proceeds from which offset transfer agent fees as reflected in the Statement of Operations.
(F) Capital. As of April 30, 2013, New York Life and its affiliates beneficially held shares of the Fund with values and percentages of net assets as follows:
| | | | | | | | |
Investor Class | | $ | 37,527 | | | | 4.9 | % |
Class C | | | 36,603 | | | | 5.5 | |
| | |
| 24 | | MainStay Epoch U.S. Equity Yield Fund |
Note 4–Federal Income Tax
The tax character of distributions paid during the year ended October 31, 2012, shown in the Statements of Changes in Net Assets was as follows:
| | | | |
| | | 2012 | |
Distributions paid from: | | | | |
Ordinary Income | | $ | 3,622,038 | |
Long-Term Capital Gain | | | 12,005,174 | |
Total | | $ | 15,627,212 | |
Note 5–Custodian
State Street is the custodian of the cash and the securities of the Fund. Custodial fees are charged to the Fund based on the market value of securities in the Fund and the number of certain cash transactions incurred by the Fund.
Note 6–Line of Credit
The Fund and certain affiliated funds maintain a line of credit with a syndicate of banks in order to secure a source of funds for temporary purposes to meet unanticipated or excessive redemption requests.
Effective August 29, 2012, under a second amended and restated credit agreement (the “Credit Agreement”), the aggregate commitment amount is $200,000,000 with an optional maximum amount of $250,000,000. The commitment fee is an annual rate of 0.08% of the average commitment amount payable quarterly, regardless of usage, to Bank of New York Mellon, which serves as the agent to the syndicate. The commitment fee is allocated among the Fund and certain affiliated funds based upon net assets and other factors. Interest on any revolving credit loan is charged based upon the Federal Funds Advances rate or the one month London InterBank Offered Rate, whichever is higher. The Credit Agreement expires on August 28, 2013, although the Fund, certain affiliated funds and the syndicate of banks may renew the Credit Agreement for an additional year on the same or different terms. There were no borrowings made or outstanding with respect to the Fund on the Credit Agreement during the six-month period ended April 30, 2013.
Note 7–Purchases and Sales of Securities (in 000’s)
During the six-month period ended April 30, 2013, purchases and sales of securities, other than short-term securities, were $3,554 and $29,676, respectively.
Note 8–Capital Share Transactions
| | | | | | | | |
Investor Class | | Shares | | | Amount | |
Six-month period ended April 30, 2013: | | | | | | | | |
Shares sold | | | 23,981 | | | $ | 288,661 | |
Shares issued to shareholders in reinvestment of dividends and distributions | | | 9,458 | | | | 101,298 | |
Shares redeemed | | | (1,670 | ) | | | (19,485 | ) |
| | | | | | | | |
Net increase (decrease) in shares outstanding before conversion | | | 31,769 | | | | 370,474 | |
Shares converted into Investor Class (See Note 1) | | | 433 | | | | 5,203 | |
Shares converted from Investor Class (See Note 1) | | | (3,483 | ) | | | (41,591 | ) |
| | | | | | | | |
Net increase (decrease) | | | 28,719 | | | $ | 334,086 | |
| | | | | | | | |
Year ended October 31, 2012: | | | | | | | | |
Shares sold | | | 17,504 | | | $ | 228,559 | |
Shares issued to shareholders in reinvestment of dividends and distributions | | | 1,214 | | | | 14,676 | |
Shares redeemed | | | (5,600 | ) | | | (71,838 | ) |
| | | | | | | | |
Net increase (decrease) in shares outstanding before conversion | | | 13,118 | | | | 171,397 | |
Shares converted into Investor Class (See Note 1) | | | 932 | | | | 12,680 | |
Shares converted from Investor Class (See Note 1) | | | (2,840 | ) | | | (36,709 | ) |
| | | | | | | | |
Net increase (decrease) | | | 11,210 | | | $ | 147,368 | |
| | | | | | | | |
| | |
| | | | | | | | |
Class A | | Shares | | | Amount | |
Six-month period ended April 30, 2013: | | | | | | | | |
Shares sold | | | 206,125 | | | $ | 2,427,776 | |
Shares issued to shareholders in reinvestment of dividends and distributions | | | 20,580 | | | | 221,031 | |
Shares redeemed | | | (17,540 | ) | | | (209,616 | ) |
| | | | | | | | |
Net increase (decrease) in shares outstanding before conversion | | | 209,165 | | | | 2,439,191 | |
Shares converted into Class A (See Note 1) | | | 3,475 | | | | 41,591 | |
Shares converted from Class A (See Note 1) | | | (431 | ) | | | (5,203 | ) |
| | | | | | | | |
Net increase (decrease) | | | 212,209 | | | $ | 2,475,579 | |
| | | | | | | | |
Year ended October 31, 2012: | | | | | | | | |
Shares sold | | | 51,809 | | | $ | 686,176 | |
Shares issued to shareholders in reinvestment of dividends and distributions | | | 2,289 | | | | 27,723 | |
Shares redeemed | | | (17,680 | ) | | | (228,744 | ) |
| | | | | | | | |
Net increase (decrease) in shares outstanding before conversion | | | 36,418 | | | | 485,155 | |
Shares converted into Class A (See Note 1) | | | 2,836 | | | | 36,709 | |
Shares converted from Class A (See Note 1) | | | (931 | ) | | | (12,680 | ) |
| | | | | | | | |
Net increase (decrease) | | | 38,323 | | | $ | 509,184 | |
| | | | | | | | |
| | | | |
| mainstayinvestments.com | | | 25 | |
Notes to Financial Statements (Unaudited) (continued)
| | | | | | | | |
Class C | | Shares | | | Amount | |
Six-month period ended April 30, 2013: | | | | | | | | |
Shares sold | | | 23,047 | | | $ | 269,098 | |
Shares issued to shareholders in reinvestment of dividends and distributions | | | 7,562 | | | | 79,548 | |
Shares redeemed | | | (5,300 | ) | | | (63,150 | ) |
| | | | | | | | |
Net increase (decrease) | | | 25,309 | | | $ | 285,496 | |
| | | | | | | | |
Year ended October 31, 2012: | | | | | | | | |
Shares sold | | | 18,487 | | | $ | 238,253 | |
Shares issued to shareholders in reinvestment of distributions | | | 1,146 | | | | 13,749 | |
Shares redeemed | | | (6,736 | ) | | | (86,486 | ) |
| | | | | | | | |
Net increase (decrease) | | | 12,897 | | | $ | 165,516 | |
| | | | | | | | |
| | |
| | | | | | | | |
Class I | | Shares | | | Amount | |
Six-month period ended April 30, 2013: | | | | | | | | |
Shares sold | | | 26,040 | | | $ | 314,009 | |
Shares issued to shareholders in reinvestment of dividends and distributions | | | 333,360 | | | | 3,600,287 | |
Shares redeemed | | | (2,368,555 | ) | | | (27,630,599 | ) |
| | | | | | | | |
Net increase (decrease) | | | (2,009,155 | ) | | $ | (23,716,303 | ) |
| | | | | | | | |
Year ended October 31, 2012: | | | | | | | | |
Shares sold | | | 4,482,305 | | | $ | 56,504,107 | |
Shares issued to shareholders in reinvestment of dividends and distributions | | | 358,155 | | | | 4,351,589 | |
Shares redeemed | | | (23,159,858 | ) | | | (304,332,641 | ) |
| | | | | | | | |
Net increase (decrease) | | | (18,319,398 | ) | | $ | (243,476,945 | ) |
| | | | | | | | |
Note 9–Subsequent Events
In connection with the preparation of the financial statements of the Fund as of and for the six-month period ended April 30, 2013, events and transactions subsequent to April 30, 2013, through the date the financial statements were issued have been evaluated by the Fund’s management for possible adjustment and/or disclosure. No subsequent events requiring financial statement adjustment or disclosure have been identified.
| | |
| 26 | | MainStay Epoch U.S. Equity Yield Fund |
I. Board Consideration and Approval of Management Agreement and
Subadvisory Agreement (Unaudited)
Section 15(c) of the Investment Company Act of 1940, as amended (the “1940 Act”) requires that each mutual fund’s board of trustees, including a majority of the independent trustees, annually review and approve the fund’s investment advisory agreements. At its December 10-12, 2012 meeting, the Board of Trustees of the MainStay Group of Funds (“Board”) unanimously approved the Management Agreement with respect to the MainStay Epoch U.S. Equity Yield Fund (“Fund”) and New York Life Investment Management LLC (“New York Life Investments”), and the Subadvisory Agreement between New York Life Investments and Epoch Investment Partners, Inc. (“Epoch”) with respect to the Fund.
In reaching its decision to approve the Agreements, the Board considered information furnished by New York Life Investments and Epoch in connection with a contract review process that took place at various meetings of the Board and its Contracts Committee between September 2012 and December 2012, as well as other relevant information furnished to the Board throughout the year by New York Life Investments and Epoch. Information requested by and furnished to the Board in connection with the contract review process included, among other items, reports on the Fund prepared by Strategic Insight Mutual Fund Research and Consulting, LLC (“Strategic Insight”), an independent third-party service provider engaged by the Board to report objectively on the Fund’s investment performance, management and subadvisory fees and ordinary operating expenses. The Board also considered information provided by New York Life Investments and Epoch on the fees charged to other investment advisory clients (including institutional separate accounts) that follow investment strategies similar to the Fund, and the rationale for any differences in the Fund’s management and subadvisory fees and the fees charged to those other investment advisory clients. In addition, the Board requested and received information on the profitability of the Fund to New York Life Investments and its affiliates and Epoch, and responses from New York Life Investments and Epoch to a series of questions encompassing a variety of topics prepared on behalf of the Board by independent legal counsel to the Board and its independent trustees (the “Independent Trustees”). Information provided to the Board at its meetings throughout the year included, among other items, detailed investment performance reports on the Fund prepared by the Investment Consulting Group at New York Life Investments. The structure and format for this regular reporting was developed in consultation with the Board. The Board also received from New York Life Investments throughout the year, among other items, periodic reports on legal and compliance matters, portfolio turnover, and sales and marketing activity.
In determining to approve the Agreements, the members of the Board reviewed and evaluated all of the information and factors they believed to be relevant and appropriate in light of legal advice furnished to them by independent legal counsel and through the exercise of their own business judgment. The broad factors considered by the Board are discussed in greater detail below, and included, among other items: (i) the nature, scope and quality of the services provided to the Fund by New York Life Investments and Epoch; (ii) the investment performance of the Fund, New York Life Investments and Epoch; (iii) the costs of the services provided, and profits realized, by New York Life Investments and Epoch from their relationship with the Fund; (iv) the extent to which economies of scale may be realized as the Fund grows, and the extent to which economies of scale may benefit Fund investors; and (v) the
reasonableness of the Fund’s management and subadvisory fees and overall total ordinary operating expenses, particularly as compared to similar funds and accounts managed by New York Life Investments and Epoch and third-party “peer funds” identified by Strategic Insight.
While individual members of the Board may have weighed certain factors differently, the Board’s decision to approve the Agreements was based on a consideration of all the information provided to the Board, including information provided to the Board throughout the year and specifically in connection with the contract review process. The Board’s conclusions with respect to the Agreements also were based, in part, on the Board’s consideration of the Agreements in prior years. In addition to considering the above-referenced factors, the Board observed that in the marketplace there are a range of investment options available to shareholders of the Fund, and that the Fund’s shareholders, having had the opportunity to consider other investment options, have chosen to invest in the Fund. A more detailed discussion of the factors that figured prominently in the Board’s decisions to approve the Agreements is provided below.
Nature, Scope and Quality of Services to Be Provided by New York Life Investments and Epoch
The Board examined the nature, scope and quality of the services that New York Life Investments provides to the Fund. The Board evaluated New York Life Investments’ experience in serving as manager of the Fund, noting that New York Life Investments manages other mutual funds, serves a variety of other investment advisory clients, including other pooled investment vehicles, and has experience with overseeing mutual fund service providers, including subadvisors. The Board considered the experience of senior personnel at New York Life Investments providing management and administrative services to the Fund, as well as New York Life Investments’ reputation and financial condition. The Board also considered the full range of non-advisory services that New York Life Investments supplies to the Fund under the terms of the Management Agreement, including: (i) fund accounting services provided by New York Life Investments’ Fund Accounting and Administration Group; (ii) investment oversight and analytical services provided by New York Life Investments’ Investment Consulting Group; (iii) compliance services provided by New York Life Investments’ compliance department, including oversight and implementation of the Fund’s compliance program; and (iv) legal services provided by New York Life Investments’ Office of the General Counsel. Additional information about the non-advisory services provided by New York Life Investments is set forth in the Fund’s Management Agreement. The Board also considered New York Life Investments’ willingness to invest in personnel that benefit the Fund, and noted that New York Life Investments is responsible for compensating the Fund’s officers. The Board also considered benefits to shareholders of being part of the MainStay Group of Funds, including the privilege of exchanging investments between the same class of shares without the imposition of a sales charge, as described more fully in the Fund’s prospectus.
The Board also examined the nature, scope and quality of the advisory services that Epoch provides to the Fund. The Board evaluated Epoch’s experience in serving as subadvisor to the Fund and managing other portfolios. It examined Epoch’s track record and experience in providing investment advisory services, the experience of investment advisory,
| | | | |
| mainstayinvestments.com | | | 27 | |
I. Board Consideration and Approval of Management Agreement and
Subadvisory Agreement (Unaudited) (continued)
senior management and administrative personnel at Epoch, and Epoch’s overall legal and compliance environment. The Board also reviewed Epoch’s willingness to invest in personnel that benefit the Fund. In this regard, the Board considered the experience of the Fund’s portfolio managers, the number of accounts managed by the portfolio managers and the method for compensating portfolio managers.
Based on these considerations, the Board concluded, within the context of its overall determinations regarding the Agreements, that the Fund should continue to benefit from the nature, scope and quality of these services as a result of New York Life Investments’ and Epoch’s experience, personnel, operations and resources.
Investment Performance
In evaluating the Fund’s investment performance, the Board considered investment performance results in light of the Fund’s investment objective, strategies and risks, as disclosed in the Fund’s prospectus. The Board particularly considered detailed investment reports on the Fund’s performance provided to the Board throughout the year by the Investment Consulting Group of New York Life Investments. These reports include, among other items, information on the Fund’s gross and net returns, the Fund’s investment performance relative to relevant investment categories and Fund benchmarks, the Fund’s risk-adjusted investment performance, and the Fund’s investment performance as compared to similar competitor funds, as appropriate. The Board also considered information provided by Strategic Insight showing the investment performance of the Fund as compared to peer funds.
In considering the Fund’s investment performance, the Board focused principally on the Fund’s long-term performance track record. The Board also gave weight to its ongoing discussions with senior management at New York Life Investments concerning the Fund’s investment performance, as well as discussions between the Fund’s portfolio managers and the Board that occur typically on an annual basis. In addition, the Board considered any specific actions that New York Life Investments or Epoch had taken, or had agreed with the Board to take, to enhance Fund investment performance, and the results of those actions. The Board also considered the recent revisions to the Fund’s name, investment objective and investment strategies, and New York Life Investments’ commitment to limit the Fund’s expenses in connection with implementing these changes.
Based on these considerations, the Board concluded, within the context of its overall determinations regarding the Agreements, that the long-term investment performance of the Fund, along with ongoing efforts by New York Life Investments and Epoch to enhance investment returns, supported a determination to approve the Agreements. The Fund discloses more information about investment performance in the Portfolio Management Discussion and Analysis, Investment and Performance Comparison and Financial Highlights sections of this Semiannual Report and in the Fund’s prospectus.
Costs of the Services Provided, and Profits Realized, by New York Life Investments and Epoch
The Board considered the costs of the services provided by New York Life Investments and Epoch under the Agreements, and the profits realized by New York Life Investments and its affiliates and Epoch due to
their relationships with the Fund. Because Epoch’s subadvisory fees are negotiated at arm’s-length by New York Life Investments and are paid by New York Life Investments, not the Fund, the Board principally considered the profits realized by New York Life Investments and its affiliates with respect to the Fund.
In evaluating the costs and profits of New York Life Investments and its affiliates and Epoch, the Board considered, among other factors, each party’s investments in personnel, systems, equipment and other resources necessary to manage the Fund, and that New York Life Investments is responsible for paying the subadvisory fees for the Fund. The Board acknowledged that New York Life Investments and Epoch must be in a position to pay and retain experienced professional personnel to provide services to the Fund, and that the ability to maintain a strong financial position is important in order for New York Life Investments and Epoch to continue to provide high-quality services to the Fund. The Board also noted that the Fund benefits from the allocation of certain fixed costs across the MainStay Group of Funds.
In addition, the Board noted the difficulty in obtaining reliable comparative data about mutual fund managers’ profitability, since such information generally is not publicly available and may be impacted by numerous factors, including the structure of a fund manager’s organization, the types of funds it manages, the methodology used to allocate certain fixed costs to specific funds, and the manager’s capital structure and costs of capital. While recognizing the difficulty in evaluating a manager’s profitability with respect to the Fund, and noting that other profitability methodologies may also be reasonable, the Board concluded that the profitability methodology presented by New York Life Investments to the Board, which was developed by New York Life Investments in consultation with an independent consultant, was reasonable in all material respects.
In considering the costs and profitability of the Fund, the Board also considered certain fall-out benefits that may be realized by New York Life Investments and its affiliates due to their relationships with the Fund. The Board recognized, for example, the benefits to Epoch from legally permitted “soft-dollar” arrangements by which brokers provide research and other services to Epoch in exchange for commissions paid by the Fund with respect to trades on the Fund’s portfolio securities. The Board also requested and received information from New York Life Investments and Epoch concerning other business relationships between Epoch and its affiliates and New York Life Investments and its affiliates.
The Board further considered that, in addition to fees earned by New York Life Investments for managing the Fund, New York Life Investments’ affiliates also earn revenues from serving the Fund in various other capacities, including as the Fund’s transfer agent and distributor. The Board observed that information about these other revenues, and their impact on the profitability of the Fund to New York Life Investments and its affiliates, was furnished to the Board as part of the 15(c) process. The Board noted that, although it assessed the overall profitability of the Fund to New York Life Investments and its affiliates as part of the contract review process, when considering the reasonableness of the fees to be paid to New York Life Investments and its affiliates under the Agreements, the Board considered the profitability of New York Life Investments’ relationship with the Fund on a pre-tax basis, and without regard to distribution expenses.
After evaluating the information presented to the Board, the Board concluded, within the context of its overall determinations regarding the
| | |
| 28 | | MainStay Epoch U.S. Equity Yield Fund |
Agreements, that any profits realized by New York Life Investments and its affiliates due to their relationships with the Fund supported the Board’s decision to approve the Agreements. With respect to Epoch, the Board concluded that any profits realized by Epoch due to its relationship with the Fund are the result of arm’s-length negotiations between New York Life Investments and Epoch, and are based on fees paid to Epoch by New York Life Investments, not the Fund.
Extent to Which Economies of Scale May Be Realized as the Fund Grows
The Board also considered whether the Fund’s expense structure permitted economies of scale to be shared with Fund investors. The Board reviewed information from New York Life Investments showing how the Fund’s management fee schedule compared to fee schedules of other funds and accounts managed by New York Life Investments. The Board also reviewed information from Strategic Insight showing how the Fund’s management fee schedule hypothetically would compare with fees paid for similar services by peer funds at varying asset levels. While recognizing the difficulty of determining economies of scale with precision, the Board acknowledged that economies of scale may be shared with the Fund in a number of ways, including, for example, through the imposition of management fee breakpoints and by initially setting relatively lower management fees.
Based on this information, the Board concluded, within the context of its overall determinations regarding the Agreements, that the Fund’s expense structure appropriately reflects economies of scale for the benefit of Fund investors. The Board noted, however, that it would continue to evaluate the reasonableness of the Fund’s expense structure as the Fund grows over time.
Management and Subadvisory Fees and Total Ordinary Operating Expenses
The Board evaluated the reasonableness of the fees to be paid under the Agreements and the Fund��s expected total ordinary operating expenses. The Board primarily considered the reasonableness of the management fee paid by the Fund to New York Life Investments, since the fees paid to Epoch are paid by New York Life Investments, not the Fund.
In assessing the reasonableness of the Fund’s fees and expenses, the Board primarily considered comparative data provided by Strategic Insight on the fees and expenses charged by similar mutual funds managed by other investment advisers. In addition, the Board considered information provided by New York Life Investments and Epoch on fees charged to other investment advisory clients, including institutional separate accounts and other funds with similar investment objectives as the Fund. The Board particularly considered differences in the contractual management fee schedules of the retail MainStay Funds and similarly-managed MainStay VP Portfolios, taking into account New York Life Investments’ rationale for any differences in fee schedules. The Board also took into account explanations provided by New York Life Investments about the different scope of services provided to mutual funds as compared with other investment advisory clients. Additionally, the Board considered the impact of any expense limitation arrangements on the Fund’s net management fee and expenses.
The Board noted that, outside of the Fund’s management fee and the fees charged under a share class’s Rule 12b-1 and/or shareholder services plans, a share class’s most significant “other expenses” are transfer
agent fees. Transfer agent fees are charged to the Fund based on the number of shareholder accounts (a “per-account” fee) as compared with certain other fees (e.g., management fees), which are charged based on the Fund’s average net assets. The Board took into account information from New York Life Investments showing that the Fund’s transfer agent fee schedule is reasonable, including industry data showing that the per-account fees that NYLIM Service Company LLC, the Fund’s transfer agent, charges the Fund are within the range of per-account fees charged by transfer agents to other mutual funds. In addition, the Board considered NYLIM Service Company LLC’s profitability in connection with the transfer agent services it provides to the Fund.
The Board acknowledged that, because the Fund’s transfer agent fees are billed on a per-account basis, the impact of transfer agent fees on a share class’s expense ratio may be more significant in cases where the share class has a high number of accounts with limited assets (i.e., small accounts). The Board observed that transfer agent fees are a significant portion of total expenses of many Funds in the MainStay Group of Funds. The impact of transfer agent fees on the expense ratios of these MainStay Funds tend to be greater than for other open-end retail funds, because the MainStay Group of Funds generally has a significant number of small accounts relative to competitor funds. The Board acknowledged the role that the MainStay Group of Funds historically has played in serving the investment needs of New York Life Insurance Company (“New York Life”) policyholders, who often maintain smaller account balances than other fund investors. The Board discussed measures that it and New York Life Investments have taken in recent years to mitigate the effect of small accounts on the expense ratios of Fund share classes, including: (i) encouraging New York Life agents to consolidate multiple small accounts held by the same investor into one MainStay Asset Allocation Fund account; (ii) increasing investment minimums from $500 to $1,000 in 2003; (iii) introducing Investor Class shares for certain MainStay Funds in early 2008 to consolidate smaller account investors; (iv) closing small accounts with balances below $250 in Investor Class shares or $750 in all other classes of shares; (v) no longer allowing an exception with no minimum investment amount with respect to AutoInvest accounts with subsequent monthly purchases of $100; (vi) since 2007, charging an annual $20.00 small account fee on certain accounts with balances below $1,000; and (vii) modifying the approach for billing transfer agent expenses to reduce the degree of subsidization by large accounts of smaller accounts. In addition, the Board acknowledged New York Life Investments’ efforts to encourage intermediaries to consolidate small accounts in multiple Funds held by the same investor into a single Asset Allocation Fund account, if appropriate under the circumstances, in an effort to mitigate the effect of small accounts on the Funds in the MainStay Group of Funds.
After considering all of the factors outlined above, the Board concluded that the Fund’s management and subadvisory fees and total ordinary operating expenses were within a range that is competitive and, within the context of the Board’s overall conclusions regarding the Agreements, support a conclusion that these fees and expenses are reasonable.
Conclusion
On the basis of the information provided to it and its evaluation thereof, the Board, including the Independent Trustees, unanimously voted to approve the Agreements.
| | | | |
| mainstayinvestments.com | | | 29 | |
II. Board Consideration and Approval of New Subadvisory Agreement (Unaudited)
At its March 21, 2013 meeting, the Board unanimously approved a new Subadvisory Agreement (the “Subadvisory Agreement”) between New York Life Investments and Epoch on behalf of the Fund that took effect on March 27, 2013. The Board was asked to approve the Subadvisory Agreement in connection with a “change in control” of Epoch and, accordingly, the termination by law and the express terms of the previous subadvisory agreement between New York Life Investments and Epoch with respect to the Fund.
On March 27, 2013, Epoch Holding Corporation (“Epoch Holding”) merged with Empire Merger Sub, Inc., a wholly-owned subsidiary of The Toronto-Dominion Bank, a Canadian chartered bank (“Epoch Holding Merger”) following the approval of Epoch Holding shareholders. As a result, Epoch Holding became a wholly-owned subsidiary of The Toronto- Dominion Bank (“TD Bank”). Epoch Holding is the parent company of Epoch Investment Partners, Inc. (“Epoch”), the Fund’s subadvisor. The closing of the Epoch Holding Merger resulted in a “change of control” of Epoch.
In reaching its decision to approve the continued retention of Epoch and the Agreement, the Board considered information presented to it by New York Life Investments, Epoch and TD Bank as part of its consideration and approval of the Agreement at the Board’s meeting in March 2013, as well as other relevant information furnished to it throughout the year by New York Life Investments and Epoch at regular and special Board meetings. The Board also requested and received responses from Epoch to a comprehensive list of questions encompassing a variety of topics prepared on behalf of the Board by independent legal counsel to the Board. The Board noted that it had also requested and received responses to similar questions in connection with its annual approval of the previous subadvisory agreement with Epoch at various meetings of the Board and its Contracts Committee between September 2012 and December 2012. The Board considered its historical experience with Epoch’s capabilities and resources, and its evaluation of Epoch in connection with previous contract review processes, including the contract review process that culminated with approval of the previous subadvisory agreement between New York Life Investments and Epoch, on behalf of the Fund (the “Prior Contract Review Processes”).
In determining to approve the continued retention of Epoch and approve the Agreement, the members of the Board reviewed and evaluated all of the information and factors they believed to be relevant and appropriate in light of legal advice furnished to them by independent legal counsel and through the exercise of their own business judgment. The broad factors considered by the Board are discussed in greater detail below, and included, among other things: (i) the nature, scope and quality of the services to be provided to the Fund by Epoch; (ii) the investment performance of the Fund; (iii) the costs of the services to be provided and the profits to be realized by Epoch and its affiliates from its relationship with the Fund; (iv) the extent to which economies of scale may be realized as the Fund grows, and the extent to which economies of scale may benefit Fund investors; and (v) the reasonableness of the Fund’s management and subadvisory fee levels and overall total ordinary operating expenses.
While the members of the Board may have weighed certain factors differently, the Board’s decision to approve the continued retention of Epoch and approve the Agreement was based on a comprehensive consideration of all the information provided to the Board, including information provided to the Board in connection with its review of Epoch.
The Board also considered that shareholders of the Fund approved the ability of New York Life Investments to act as a “manager of managers,” which allows the Board and New York Life Investments to retain unaffiliated subadvisors for the Fund without the approval of Fund shareholders. A more detailed discussion of the factors that figured prominently in the Board’s decision to approve the continued retention of Epoch and approve the Agreement is provided below.
Nature, Scope and Quality of Services to Be Provided by Epoch
In considering the approval of the continued retention of Epoch and approval of the Agreement, the Board examined the nature, scope and quality of the services that Epoch historically had provided to the Fund. Based on information provided to the Board in connection with the Prior Contract Review Processes, the Board acknowledged Epoch’s historical service to the Fund, and took note of the experience of Epoch’s portfolio managers, the number of accounts managed by the portfolio managers and Epoch’s method for compensating portfolio managers. The Board also considered the experience of senior personnel at Epoch, and Epoch’s plans for retaining key personnel in connection with the acquisition of Epoch Holding by TD Bank. Based on these considerations, the Board concluded, within the context of its overall determinations regarding the Agreement, that the Fund should continue to benefit from the nature, scope and quality of these services as a result of Epoch’s experience, personnel, operations and resources.
Investment Performance
In evaluating investment performance, the Board took note of the Fund’s historical investment performance results, as presented to the Board in connection with the Prior Contract Review Processes, in light of the Fund’s investment objectives, strategies and risks, as disclosed in the Fund’s prospectuses. The Board considered information about the Fund’s investment performance that is provided to the Board in connection with its regularly scheduled meetings, and also took note of information provided in connection with the Prior Contract Review Processes showing the investment performance of the Fund as compared to peer funds. The Board also considered the strength of Epoch’s resources (including research capabilities). Based on these considerations, the Board concluded, within the context of its overall determinations regarding the Agreement, that the retention of Epoch as subadvisor to the Fund is likely to benefit the Fund’s long-term investment performance.
Costs of the Services to Be Provided, and Profits to Be Realized, by Epoch
The Board considered the costs of the services to be provided by Epoch under the Agreement, and the profits to be realized by Epoch due to its relationship with the Fund, taking into account information provided to the Board in connection with the Prior Contract Review Processes. The Board noted that, in connection with Prior Contract Review Processes, Epoch has provided the Board with information about its profitability in connection with its relationship with the Fund. In addition, the Board considered past representations from Epoch and New York Life Investments that the subadvisory fees paid by New York Life Investments to Epoch were the result of arm’s-length negotiations. Because Epoch’s
| | |
| 30 | | MainStay Epoch U.S. Equity Yield Fund |
subadvisory fees are paid by New York Life Investments, and not the Fund, the Board historically has focused principally on the profitability of the Fund to New York Life Investments and its affiliates.
In evaluating the costs of the services provided by Epoch in connection with the Prior Contract Review Processes, the Board considered, among other things, Epoch’s investments in personnel, systems, equipment and other resources necessary to manage the Fund, and the fact that New York Life Investments is responsible for paying the subadvisory fees for the Fund. The Board acknowledged that Epoch must be in a position to pay and retain experienced professional personnel to provide services to the Fund, and that Epoch’s ability to maintain a strong financial position is important in order for Epoch to provide high-quality ongoing services to the Fund and its investors.
The Board also considered certain fall-out benefits that may be realized by Epoch due to its relationship with the Fund. The Board recognized, for example, the benefits to Epoch from legally permitted “soft-dollar” arrangements by which brokers may provide research and other services to Epoch in exchange for commissions paid by the Fund with respect to trades on the Fund’s portfolio securities.
As part of the Prior Contract Review Processes, the Board requested and received information from Epoch and New York Life Investments concerning other business relationships between Epoch and its affiliates and New York Life Investments and its affiliates. The Board requested and received assurances that these other business relationships did not impact New York Life Investments’ recommendation for Epoch to serve as the Fund’s subadvisor, and that neither New York Life Investments nor its affiliates are expected to benefit in its other business relationships due to Epoch’s continued engagement as the Fund’s subadvisor.
After evaluating the information presented to the Board, the Board concluded, within the context of its overall determinations regarding the Agreement, that any profits to be realized by Epoch due to its relationship with the Fund supported the Board’s determination to approve the Agreement. The Board also concluded that any profits to be realized by Epoch will be the result of arm’s-length negotiations between New York Life Investments and Epoch, and will be based on subadvisory fees paid to Epoch by New York Life Investments, not the Fund.
Extent to Which Economies of Scale May Be Realized as the Fund Grows
The Board also considered whether the Fund’s expense structures permitted economies of scale to be shared with the Fund’s investors, taking into account information provided to the Board in connection with the Prior Contract Review Processes.
Based on this information, the Board concluded, within the context of its overall determinations regarding the Agreement, that the Fund’s expense structure appropriately reflect economies of scale for the benefit of Fund investors. The Board noted, however, that it would continue to evaluate the reasonableness of the Fund’s expense structure as the Fund grows over time.
Reasonableness of Subadvisory Fees
The Board evaluated the reasonableness of the fees to be paid under the existing management agreement with New York Life Investments and the Agreement, and the Fund’s expected total ordinary operating expenses. The Board considered that the fees to be paid to Epoch under the Agreement will be paid by New York Life Investments, not the Fund, and will result in no increase in the Fund’s expenses. In assessing the reasonableness of the Fund’s fees and expenses the Board primarily considered comparative data provided to the Board in connection with the Prior Contract Review Processes on the fees and expenses charged by similar mutual funds managed by other investment advisers. In addition, the Board considered information provided by New York Life Investments and Epoch on fees charged to other investment advisory clients, including institutional separate accounts and other funds with similar investment objectives as the Fund. In this regard, the Board took into account explanations from New York Life Investments and Epoch about the different scope of services provided to retail mutual funds as compared with other investment advisory clients. The Board also took into account the impact of any expenses limitation arrangements on the Fund’s net expenses.
After considering all of the factors outlined above, the Board concluded that the Fund’s management and subadvisory fees and total ordinary operating expenses were within a range that is competitive and, within the context of the Board’s overall conclusions regarding the Agreement, support a conclusion that these fees and expenses are reasonable.
Conclusion
On the basis of the information provided to it and its evaluation thereof, the Board, including the Independent Trustees, unanimously voted to approve the Agreement.
| | | | |
| mainstayinvestments.com | | | 31 | |
Proxy Voting Policies and Procedures and Proxy Voting Record
A description of the policies and procedures that New York Life Investments uses to vote proxies related to the Fund’s securities is available without charge, upon request, (i) by visiting the Fund’s website at mainstayinvestments.com; and (ii) on the SEC’s website at www.sec.gov.
The Fund is required to file with the SEC its proxy voting records for the 12-month period ending June 30 on Form N-PX. The Fund’s most recent Form N-PX or proxy voting record is available free of charge upon request by calling 800-MAINSTAY (624-6782); visiting the Fund’s website at mainstayinvestments.com; or on the SEC’s website at www.sec.gov.
Shareholder Reports and Quarterly Portfolio Disclosure
The Fund is required to file its complete schedule of portfolio holdings with the SEC for its first and third fiscal quarters on Form N-Q. The Fund’s Form N-Q is available without charge, on the SEC’s website at www.sec.gov or by calling MainStay Investments at 800-MAINSTAY (624-6782). You also can obtain and review copies of Form N-Q by visiting the SEC’s Public Reference Room in Washington, DC (information on the operation of the Public Reference Room may be obtained by calling 1-800-SEC-0330).
| | |
| 32 | | MainStay Epoch U.S. Equity Yield Fund |
This page intentionally left blank
This page intentionally left blank
MainStay Funds
MainStay offers a wide range of Funds for virtually any investment need. The full array of MainStay open-end offerings is listed here, with information about the manager, subadvisors, legal counsel and independent registered public accounting firms.
Equity
U.S. Equity Funds
MainStay Common Stock Fund
MainStay Cornerstone Growth Fund
MainStay Epoch U.S. All Cap Fund
MainStay Epoch U.S. Equity Yield Fund
MainStay ICAP Equity Fund
MainStay ICAP Select Equity Fund
MainStay Large Cap Growth Fund1
MainStay MAP Fund
MainStay S&P 500 Index Fund
MainStay U.S. Equity Opportunities Fund
MainStay U.S. Small Cap Fund
International/Global Equity Funds
MainStay Epoch Global Choice Fund
MainStay Epoch Global Equity Yield Fund
MainStay Epoch International Small Cap Fund
MainStay ICAP Global Fund
MainStay ICAP International Fund
MainStay International Equity Fund
MainStay International Opportunities Fund
Income
Taxable Bond Funds
MainStay Floating Rate Fund
MainStay Global High Income Fund
MainStay Government Fund
MainStay High Yield Corporate Bond Fund
MainStay High Yield Opportunities Fund
MainStay Indexed Bond Fund
MainStay Intermediate Term Bond Fund
MainStay Short Duration High Yield Fund
MainStay Short Term Bond Fund
MainStay Unconstrained Bond Fund
Municipal Bond Funds
MainStay California Tax Free Opportunities Fund2
MainStay High Yield Municipal Bond Fund
MainStay New York Tax Free Opportunities Fund3
MainStay Tax Free Bond Fund
Money Market Fund
MainStay Money Market Fund
Mixed Asset
MainStay Balanced Fund
MainStay Convertible Fund
MainStay Income Builder Fund
MainStay Marketfield Fund
Asset Allocation/Target Date
MainStay Conservative Allocation Fund
MainStay Growth Allocation Fund
MainStay Moderate Allocation Fund
MainStay Moderate Growth Allocation Fund
MainStay Retirement 2010 Fund
MainStay Retirement 2020 Fund
MainStay Retirement 2030 Fund
MainStay Retirement 2040 Fund
MainStay Retirement 2050 Fund
Manager
New York Life Investment Management LLC
New York, New York
Subadvisors
Cornerstone Capital Management Holdings LLC4
New York, New York
Cornerstone Capital Management LLC4
Bloomington, Minnesota
Epoch Investment Partners, Inc.
New York, New York
Institutional Capital LLC4
Chicago, Illinois
MacKay Shields LLC4
New York, New York
Marketfield Asset Management LLC
New York, New York
Markston International LLC
White Plains, New York
Winslow Capital Management LLC
Minneapolis, Minnesota
Legal Counsel
Dechert LLP
Independent Registered Public Accounting Firms
KPMG LLP
PricewaterhouseCoopers LLP
1. Effective January 13, 2012, the Fund was closed to new investors with certain exceptions.
2. This Fund is only registered for sale in AZ, CA, NV, OR, UT, and WA.
3. This Fund is only registered for sale in CT, DE, FL, MA, NJ, NY, and VT.
4. An affiliate of New York Life Investment Management LLC.
Not part of the Semiannual Report
For more information
800-MAINSTAY (624-6782)
mainstayinvestments.com
The MainStay Funds® are managed by New York Life Investment Management LLC and distributed through NYLIFE Distributors LLC, 169 Lackawanna Avenue, Parsippany, NJ 07054, a wholly owned subsidiary of New York Life Insurance Company. NYLIFE Distributors LLC is a Member FINRA/SIPC.
MainStay Investments® is a registered service mark and name under which New York Life Investment Management LLC does business. MainStay Investments, an indirect subsidiary of New York Life Insurance Company, New York, NY 10010, provides investment advisory products and services.
This report may be distributed only when preceded or accompanied by a current Fund prospectus.
©2013 NYLIFE Distributors LLC. All rights reserved.
| | | | | | | | |
| Not FDIC/NCUA Insured | | Not a Deposit | | May Lose Value | | No Bank Guarantee | | Not Insured by Any Government Agency |
| | |
| NYLIM-30065 MS175-13 | | MSEUE10-06/13 NL0F1 |
MainStay Epoch Global Choice Fund
Message from the President and Semiannual Report
Unaudited | April 30, 2013


This page intentionally left blank
Message from the President
The U.S. stock market advanced during the six months ended April 30, 2013, generally providing double-digit returns at all capitalization levels. Value stocks tended to outpace growth stocks among large- and mid-capitalization companies, while growth stocks tended to outpace value stocks among smaller companies.
The market’s advance, however, was far from uniform. Stocks declined in early November, both before and immediately after the U.S. presidential election. Following a sharp recovery, stocks climbed until mid-December, when a Congressional stalemate on the fiscal cliff led to a brief decline. Another dip occurred in late February as investors speculated that the Federal Open Market Committee (FOMC) might stop purchasing mortgage-backed securities sooner than expected. Stocks also dipped in mid-April, as consumer sentiment dropped after the Boston marathon bombing. Despite these setbacks, U.S. stocks continued to trend upward during the six-month reporting period.
International stock markets also advanced, with several regional differences. Accommodative action by the Bank of Japan helped lower the yen and lift Japanese stocks to their highest levels since 2008. In Europe, stocks did well until early February, bolstered by the promise of support for the euro. As the year progressed, however, economic contraction, rising unemployment and systematic banking concerns took a toll on investor enthusiasm. In China, manufacturing slowed as the nation sought to balance growth and inflation risks. On the Korean peninsula, tensions rose as North Korea continued to threaten its neighbors, which added an undercurrent of caution to the market.
During the six months ended April 30, 2013, the FOMC kept the federal funds rate in a range close to zero. The FOMC also continued its direct purchases of mortgage-backed securities and longer-term U.S. government securities. With short-term interest rates likely to remain at low levels, many bond investors pursued higher yields by lengthening maturities and assuming greater risk. As a result, bonds with higher risk profiles tended
to outperform higher-quality investment-grade bonds and U.S. Treasury securities. Cash and cash equivalents essentially returned zero.
With wide variations in the performance of various asset classes, some investors might be tempted to chase higher returns by shifting back and forth between stocks and bonds. Since no one can predict where the market will move next, however, we encourage investors to select an appropriate mix of investments for their risk tolerance and time horizon and to stick with that mix, making only minor adjustments over time.
At MainStay Funds, our portfolio managers use a similar approach. Careful security selection and thoughtful sell disciplines help them pursue the investment objectives of their respective Funds. Using the principal investment strategies outlined in the Prospectus, they focus primarily on providing long-term investment potential for our shareholders.
Has this approach proved successful? In its most recent rankings, Barron’s listed MainStay Funds as the #1 fund family over the past 10 years. We were also the only mutual fund family that has appeared in Barron’s top six for the past five consecutive years.
The pages that follow provide additional insight into the specific market events, investment decisions and securities that shaped your MainStay Fund(s) during the six months ended April 30, 2013. We encourage you to read the semiannual report(s) carefully and to evaluate your results with your long-term financial goals in mind.
Sincerely,

Stephen P. Fisher
President
The opinions expressed are as of the date of this report and are subject to change. There is no guarantee that any forecast made will come to pass. This material does not constitute investment advice and is not intended as an endorsement of any specific investment.
To qualify for the Lipper/Barron’s Fund Survey, a fund family must have at least three funds in Lipper’s general U.S.-stock category, one in world equity (which combines global and international funds), one mixed-equity fund (which holds stocks and bonds), two taxable-bond funds, and one tax-exempt fund. Fund loads and 12b-1 fees aren’t included in the calculation of returns because the aim is to measure the manager’s skill. Each fund’s return is measured against all funds in its Lipper category, resulting in a percentile ranking which is then weighted by asset size relative to the fund family’s other assets in its general classifications. Finally, the score is multiplied by the general classification weightings as determined by the entire Lipper universe of funds.
Source: Barron’s, 2/9/13. Overall, MainStay Funds ranked number 56 for the one-year period, 20 for the five-year period and one for the 10-year period ended December 31, 2012, out of 62, 53 and 46 fund families, respectively. MainStay ranked number three for the 10-year period in 2009, 2010 and 2011 from among 48, 46 and 45 fund families, respectively. MainStay ranked number six from among 48 fund families for the 10-year period in 2008. Past performance is no guarantee of future results, which will vary. For the most recent MainStay Funds performance, please visit our website at mainstayinvestments.com. All mutual funds are subject to market risk and will fluctuate in value.
Not part of the Semiannual Report
Table of Contents
Investors should refer to the Fund’s Summary Prospectus and/or Prospectus and consider the Fund’s investment objectives, strategies, risks, charges and expenses carefully before investing. The Summary Prospectus and/or Prospectus contain this and other information about the Fund. You may obtain copies of the Fund’s Summary Prospectus, Prospectus and Statement of Additional Information free of charge, upon request, by calling toll-free 800-MAINSTAY (624-6782), by writing to NYLIFE Distributors LLC, Attn: MainStay Marketing Department, 169 Lackawanna Avenue, Parsippany, New Jersey 07054 or by sending an e-mail to MainStayShareholderServices@nylim.com. These documents are also available via the MainStay Funds’ website at mainstayinvestments.com/documents. Please read the Summary Prospectus and/or Prospectus carefully before investing.
Investment and Performance Comparison1 (Unaudited)
Performance data quoted represents past performance. Past performance is no guarantee of future results. Because of market volatility, current performance may be lower or higher than the figures shown. Investment return and principal value will fluctuate, and as a result, when shares are redeemed, they may be worth more or less than their original cost. The graph below depicts the historical performance of Class I shares of the Fund. Performance will vary from class to class based on differences in class-specific expenses and sales charges. For performance information current to the most recent month-end, please call 800-MAINSTAY (624-6782) or visit mainstayinvestments.com.
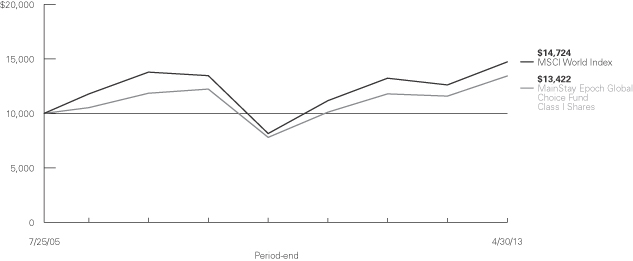
Average Annual Total Returns for the Period Ended April 30, 2013
| | | | | | | | | | | | | | | | | | | | | | | | |
| Class | | Sales Charge | | | | Six Months | | | One Year | | | Five Years | | | Since
Inception
(7/25/05) | | | Gross
Expense
Ratio2 | |
| Investor Class Shares3 | | Maximum 5.5% Initial Sales Charge | | With sales charges Excluding sales charges | |
| 6.26
12.45 | %
| |
| 8.91
15.25 | %
| |
| –0.04
1.09 | %
| |
| 2.50
3.25 | %
| |
| 1.71
1.71 | %
|
| Class | | Sales Charge | | | | Six Months | | | One Year | | | Five Years | | | Since
Inception
(8/15/06) | | | Gross
Expense
Ratio2 | |
| Class A Shares4 | | Maximum 5.5% Initial Sales Charge | | With sales charges Excluding sales charges | |
| 6.43
12.62 | %
| |
| 9.21
15.56 | %
| |
| 0.10
1.24 | %
| |
| 2.74
3.61 | %
| |
| 1.48
1.48 | %
|
| Class | | Sales Charge | | | | Six Months | | | One Year | | | Five Years | | | Since
Inception
(7/25/05) | | | Gross
Expense
Ratio2 | |
| Class C Shares3 | | Maximum 1% CDSC if Redeemed Within One Year of Purchase | | With sales charges Excluding sales charges | |
| 11.12
12.12 | %
| |
| 13.38
14.38 | %
| |
| 0.72
0.72 | %
| |
| 2.73
2.73 | %
| |
| 2.46
2.46 | %
|
| Class | | Sales Charge | | | | Six Months | | | One Year | | | Five Years | | | Since
Inception
(7/25/05) | | | Gross
Expense
Ratio2 | |
| Class I Shares4 | | No Sales Charge | | | | | 12.74 | % | | | 15.83 | % | | | 1.88 | % | | | 3.86 | % | | | 1.23 | % |
| 1. | The performance table and graph do not reflect the deduction of taxes that a shareholder would pay on dividends, distributions or Fund share redemptions. Total returns reflect maximum applicable sales charges as indicated in the table above, changes in share price, and reinvestment of dividend and capital gain distributions. The graph assumes the initial investment amount shown above and reflects the deduction of all sales charges that would have applied for the period of investment. Performance figures reflect certain fee waivers and/or expense limitations, without which total returns may have been lower. For more information on share classes and current fee waivers and/or expense limitations, please refer to the notes to the financial statements. |
| 2. | The gross expense ratios presented reflect the Fund’s “Total Annual Fund Operating Expenses” from the most recent Prospectus and may differ from other expense ratios disclosed in this report. |
| 3. | Performance figures for Investor Class and Class C shares, first offered on November 16, 2009, include the historical performance of Class I shares from July 25, 2005 through November 15, 2009 adjusted for differences in certain expenses and fees. Unadjusted, the performance shown for Investor Class and Class C shares would likely have been different. |
| 4. | Performance figures for Class I shares and Class A shares include the historical performance of the Institutional shares from July 25, 2005 and |
The footnotes on the next page are an integral part of the table and graph and should be carefully read in conjunction with them.
| | | | |
| mainstayinvestments.com | | | 5 | |
| | | | | | | | | | | | | | | | |
| Benchmark Performance | | Six
Months | | | One
Year | | | Five
Years | | | Since
Inception
of the Fund | |
MSCI World Index5 | | | 14.67 | % | | | 16.70 | % | | | 1.81 | % | | | 5.11 | % |
Average Lipper Global Multi-Cap Growth Fund6 | | | 12.53 | | | | 11.15 | | | | 0.79 | | | | 4.20 | |
| | the Class P shares from August 15, 2006, respectively, of the Epoch U.S. All Cap Equity Fund (the predecessor to the Fund) through November 15, 2009. The Epoch U.S. All Cap Equity Fund was subject to a different fee structure and was advised by Epoch Investment Partners, Inc. |
| 5. | The MSCI World Index is a free float-adjusted market capitalization weighted index that is designed to measure the equity market performance of developed markets. The MSCI World Index is the Fund’s broad-based securities market index for comparison purposes. Total returns assume reinvestment of all dividends and capital gains. An investment cannot be made directly in an index. |
| 6. | The average Lipper global multi-cap growth fund is representative of funds that, by portfolio practice, invest in a variety of market capitalization ranges without concentrating 75% of their equity assets in any one market capitalization range over an extended period of time. Global multi-cap growth funds typically have an above-average price-to-cash flow ratio, price-to-book ratio, and three-year sales-per-share growth value compared to the S&P/Citigroup BMI. This benchmark is a product of Lipper Inc. Lipper Inc. is an independent monitor of fund performance. Results are based on total returns with all dividend and capital gain distributions reinvested. |
The footnotes on the preceding page are an integral part of the table and graph and should be carefully read in conjunction with them.
| | |
| 6 | | MainStay Epoch Global Choice Fund |
Cost in Dollars of a $1,000 Investment in MainStay Epoch Global Choice Fund (Unaudited)
The example below is intended to describe the fees and expenses borne by shareholders during the six-month period from November 1, 2012, to April 30, 2013, and the impact of those costs on your investment.
Example
As a shareholder of the Fund, you incur two types of costs: (1) transaction costs, including exchange fees and sales charges (loads) on purchases (as applicable), and (2) ongoing costs, including management fees, distribution and/or service (12b-1) fees, and other Fund expenses (as applicable). This example is intended to help you understand your ongoing costs (in dollars) of investing in the Fund and to compare these costs with the ongoing costs of investing in other mutual funds. The example is based on an investment of $1,000 made at the beginning of the six-month period and held for the entire period from November 1, 2012, to April 30, 2013.
This example illustrates your Fund’s ongoing costs in two ways:
Actual Expenses
The second and third data columns in the table below provide information about actual account values and actual expenses. You may use the information in these columns, together with the amount you invested, to estimate the expenses that you paid during the six months ended April 30, 2013. Simply divide your account value by $1,000 (for example, an $8,600 account value divided by $1,000 = 8.6), then
multiply the result by the number under the heading entitled “Expenses Paid During Period” to estimate the expenses you paid on your account during this period.
Hypothetical Example for Comparison Purposes
The fourth and fifth data columns in the table below provide information about hypothetical account values and hypothetical expenses based on the Fund’s actual expense ratio and an assumed rate of return of 5% per year before expenses, which is not the Fund’s actual return. The hypothetical account values and expenses may not be used to estimate the actual ending account balances or expenses you paid for the six-month period shown. You may use this information to compare the ongoing costs of investing in the Fund with the ongoing costs of investing in other Funds. To do so, compare this 5% hypothetical example with the 5% hypothetical examples that appear in the shareholder reports of the other Funds.
Please note that the expenses shown in the table are meant to highlight your ongoing costs only and do not reflect any transactional costs, such as exchange fees or sales charges (loads). Therefore, the fourth and fifth data columns of the table are useful in comparing ongoing costs only and will not help you determine the relative total costs of owning different funds. In addition, if these transactional costs were included, your costs would have been higher.
| | | | | | | | | | | | | | | | | | | | |
| | | | | | | | | | | | | | | | |
| Share Class | | Beginning
Account
Value
11/1/12 | | | Ending Account
Value (Based
on Actual
Returns and
Expenses)
4/30/13 | | | Expenses
Paid
During
Period1 | | | Ending Account
Value (Based
on Hypothetical
5% Annualized
Return and
Actual Expenses)
4/30/13 | | | Expenses
Paid
During
Period1 | |
| | | | | |
| Investor Class Shares | | $ | 1,000.00 | | | $ | 1,124.50 | | | $ | 8.64 | | | $ | 1,016.70 | | | $ | 8.20 | |
| | | | | |
| Class A Shares | | $ | 1,000.00 | | | $ | 1,126.20 | | | $ | 7.33 | | | $ | 1,017.90 | | | $ | 6.95 | |
| | | | | |
| Class C Shares | | $ | 1,000.00 | | | $ | 1,121.20 | | | $ | 12.57 | | | $ | 1,012.90 | | | $ | 11.93 | |
| | | | | |
| Class I Shares | | $ | 1,000.00 | | | $ | 1,127.40 | | | $ | 6.01 | | | $ | 1,019.10 | | | $ | 5.71 | |
| 1. | Expenses are equal to the Fund’s annualized expense ratio of each class (1.64% for Investor Class, 1.39% for Class A, 2.39% for Class C and 1.14% for Class I) multiplied by the average account value over the period, divided by 365 and multiplied by 181 (to reflect the six-month period). The table above represents the actual expenses incurred during the six-month period. |
| | | | |
| mainstayinvestments.com | | | 7 | |
Country Composition as of April 30, 2013 (Unaudited)
| | | | |
| United States | | | 50.8 | % |
| France | | | 10.7 | |
| United Kingdom | | | 9.6 | |
| Germany | | | 8.0 | |
| Luxembourg | | | 3.5 | |
| Republic of Korea | | | 3.0 | |
| Japan | | | 2.8 | |
| | | | |
| Switzerland | | | 2.8 | % |
| Belgium | | | 2.6 | |
| Australia | | | 2.5 | |
| Israel | | | 2.2 | |
| Other Assets, Less Liabilities | | | 1.5 | |
| | | | |
| | | 100.0 | % |
| | | | |
See Portfolio of Investments beginning on page 11 for specific holdings within these categories.
Top Ten Holdings as of April 30, 2013 (excluding short-term investment)
| 1. | American International Group, Inc. |
| 6. | UnitedHealth Group, Inc. |
| | |
| 8 | | MainStay Epoch Global Choice Fund |
Portfolio Management Discussion and Analysis (Unaudited)
Questions answered by portfolio managers William Priest, CFA, Michael Welhoelter, CFA, and David Pearl of Epoch Investment Partners, Inc., the Fund’s Subadvisor.
How did MainStay Epoch Global Choice Fund perform relative to its peers and its benchmark for the six months ended April 30, 2013?
Excluding all sales charges, MainStay Epoch Global Choice Fund returned 12.45% for Investor Class shares, 12.62% for Class A shares and 12.12% for Class C shares for the six months ended April 30, 2013. Over the same period, Class I shares returned 12.74%. Investor Class and Class C shares underperformed—and Class A and Class I shares outperformed—the 12.53% return of the average Lipper1 global multi-cap growth fund over the same period. All share classes underperformed the 14.67% return of the MSCI World Index2 for the six months ended April 30, 2013. The MSCI World Index is the Fund’s broad-based securities-market index. See page 5 for Fund returns with applicable sales charges.
What factors affected the Fund’s relative performance during the reporting period?
The Fund did not appreciate as quickly as the MSCI World Index in the context of a broad double-digit rally in global equity markets. Several of the Fund’s technology holdings had returns that were negative or in the low single digits, hampering returns. Having no exposure to Japan was also a headwind. Aggressive fiscal and monetary policies put in place by Japan’s new prime minister and the nation’s central bank lifted that market to a 31% return for the reporting period, the best of any developed market. Our wariness about investing in Japan, however, is based on the low standing of minority shareholders among the priorities of many Japanese corporations and the uphill climb the government faces in implementing reforms needed to sustain any economic upturn. Finally, the Fund’s cash position was a drag in a fast-rising market.
During the reporting period, which sectors were the strongest positive contributors to the Fund’s relative performance and which sectors were particularly weak?
The strongest positive contributors to the Fund’s performance relative to the MSCI World Index were the materials, energy and industrials sectors. (Contributions take weightings and total returns into account.)
During the reporting period, the largest detractors from the Fund’s relative performance were the information technology, financials and health care sectors.
During the reporting period, which individual stocks made the strongest contributions to the Fund’s absolute performance and which stocks detracted the most?
The stocks that made the strongest positive contributions to the Fund’s absolute performance were media and entertainment
company Time Warner and aerospace companies Rolls-Royce Holdings and Boeing. Time Warner delivered strong operating results and recently announced that it would spin off Time, Inc., its publishing division, which includes Time and Fortune magazines. The publishing division has been in decline. In our view, the transaction should improve Time Warner’s growth profile and allow management to concentrate on core assets—the company’s pay TV networks and TV studio businesses. Rolls-Royce Holdings and Boeing were strong performers, as aerospace generally did well, reinforcing our theme that certain companies will benefit from a strong replacement cycle in developed markets and new demand in emerging markets. Rolls-Royce Holdings did particularly well after announcing solid 2012 results. The company’s relatively new CEO appeared to remain focused on improving operational performance and improving free cash flow.
During the reporting period, the most substantial detractors from the Fund’s absolute performance were consumer electronics and entertainment company Apple, retail restaurant operator Yum! Brands and dialysis services provider Fresenius Medical Care. Concerns about Apple’s growth prospects and the lack of an announcement that the company would increase cash returns to shareholders weighed on Apple’s stock. While Apple’s stock underperformed, we believe it is undervalued when considering the growth prospects of the company. While the company’s growth is moderating and margins may decline as a result of product mix (for example, iPad minis have lower margins than iPads), we believe that Apple still has growth potential. In our view, smartphone penetration is in the early innings in emerging markets, and tablet penetration is in early innings globally. The market seems to be pricing Apple’s stock as a dying business—particularly when excluding cash. Yum! Brands declined after a chicken supply issue arose in China. We were concerned that the company might be impaired in China, and we exited the stock. Fresenius Medical Care declined because of concerns on health care price pressures, and we eliminated the Fund’s position in the stock.
Did the Fund make any significant purchases or sales during the reporting period?
The Fund made a number of significant purchases and sales during the reporting period. Purchases included two financial companies, AIG and Citigroup. AIG has undergone significant restructuring since the global crisis. It changed management, reduced its problematic financial products business by more than 90% and made substantial investment in enterprise risk management and underwriting information technology. Today, AIG is primarily an insurance company with 60% of its earnings coming from property and casualty and 40% from life insur
| 1. | See footnote on page 6 for more information on Lipper Inc. |
| 2. | See footnote on page 6 for more information on the MSCI World Index. |
| | | | |
| mainstayinvestments.com | | | 9 | |
ance. Despite the improvement in its business profile, at the time of purchase, it traded at 9% free-cash-flow yield, which we believe should grow over time. We see meaningful growth at AIG’s property and casualty unit, driven by better underwriting and a favorable industry pricing environment. Citigroup has also shed assets since the financial crisis, notably eliminating proprietary trading, which makes results more transparent. It has also restructured its management and firmed its capital base. Citigroup is projected to generate one-third of its pre-tax earnings in the United States going forward, with the remainder split evenly among EMEA (Europe, Middle East and Africa), Latin America and Asia, giving Citigroup unparalleled exposure to capital markets growth and the global middle class.
We initiated a Fund position in United Healthcare Group, while eliminating the Fund’s position in Aetna. Over the nine months ended April 30, 2013, United Healthcare Group’s premium over Aetna narrowed considerably. Given United Healthcare Group’s exposure to unregulated businesses—approximately 25% of its earnings (compared to 0% of Aetna’s earnings)—we feel United Healthcare Group deserves to trade at a greater premium. Its unregulated businesses (health care information technology, pharmaceutical benefit management and behavioral health) are expected to grow their earnings by 40% in 2013 and could grow to 35% to 40% of United Healthcare Group’s total earnings by 2015. We sold Aetna after a period of strong performance.
In addition to the sales mentioned earlier, we sold farming equipment manufacturer Deere & Co. to fund other opportunities that in our opinion had better risk/reward characteristics.
How did the Fund’s sector weightings change during the reporting period?
The Fund had several meaningful shifts in terms of sector weightings during the reporting period. The largest increases were in materials and financials. The Fund ended the reporting period with a larger weighting than the MSCI World Index in materials. The Fund increased its position in financials from an underweight position to one that was approximately in line with the Index. The largest decreases were in health care and information technology. The Fund ended the reporting period with an underweight position relative to the MSCI World Index in both sectors.
How was the Fund positioned at the end of April 2013?
All sector weights are arrived at through stock selection rather than top-down decisions on the attractiveness of specific sectors. As of April 30, 2013, the Fund’s most significant sector variation from the MSCI World Index was an overweight position in the industrials sector, driven by the aerospace theme, followed by materials. As of the same date, the Fund also had a greater-than-benchmark weight in the consumer discretionary sector. As of April 30, 2013, the Fund had less exposure than the MSCI World Index to the energy, consumer staples, telecommunication services, health care, utilities and information technology sectors.
We continue to seek high-quality, cash-generating businesses with sound capital allocation policies. In an environment where economic growth is slower than in past cycles, this is where we see opportunity, even if the market pauses in the near term after a period of outsized returns.
The opinions expressed are those of the portfolio managers as of the date of this report and are subject to change. There is no guarantee that any forecast made will come to pass. This material does not constitute investment advice and is not intended as an endorsement of any specific investment.
| | |
| 10 | | MainStay Epoch Global Choice Fund |
Portfolio of Investments April 30, 2013 (Unaudited)
| | | | | | | | |
| | | Shares | | | Value | |
| | | | | | | | |
| Common Stocks 97.0%† | | | | | | | | |
Australia 2.5% | | | | | | | | |
Amcor, Ltd. (Containers & Packaging) | | | 390,150 | | | $ | 4,000,194 | |
| | | | | | | | |
| | |
Belgium 2.6% | | | | | | | | |
Anheuser-Busch InBev N.V. (Beverages) | | | 43,454 | | | | 4,134,634 | |
| | | | | | | | |
| | |
France 10.7% | | | | | | | | |
Essilor International S.A. (Health Care Equipment & Supplies) | | | 29,650 | | | | 3,336,225 | |
European Aeronautic Defence and Space Co. N.V. (Aerospace & Defense) | | | 42,800 | | | | 2,260,538 | |
¨Safran S.A. (Aerospace & Defense) | | | 109,668 | | | | 5,385,695 | |
¨SCOR SE (Insurance) | | | 189,700 | | | | 5,757,229 | |
| | | | | | | | |
| | | | | | | 16,739,687 | |
| | | | | | | | |
Germany 8.0% | | | | | | | | |
Bayer A.G. (Pharmaceuticals) | | | 29,715 | | | | 3,100,131 | |
GEA Group A.G. (Machinery) | | | 125,500 | | | | 4,245,147 | |
¨Linde A.G. (Chemicals) | | | 27,250 | | | | 5,153,359 | |
| | | | | | | | |
| | | | | | | 12,498,637 | |
| | | | | | | | |
Israel 2.2% | | | | | | | | |
Check Point Software Technologies, Ltd. (Software) (a) | | | 72,750 | | | | 3,391,605 | |
| | | | | | | | |
| | |
Japan 2.8% | | | | | | | | |
JSR Corp. (Chemicals) | | | 193,300 | | | | 4,447,575 | |
| | | | | | | | |
| | |
Luxembourg 3.5% | | | | | | | | |
¨SES S.A. (Media) | | | 176,919 | | | | 5,524,277 | |
| | | | | | | | |
| | |
Republic of Korea 3.0% | | | | | | | | |
Samsung Electronics Co., Ltd., GDR (Semiconductors & Semiconductor Equipment) (b) | | | 6,856 | | | | 4,737,496 | |
| | | | | | | | |
| | |
Switzerland 2.8% | | | | | | | | |
SGS S.A. (Professional Services) | | | 1,837 | | | | 4,439,384 | |
| | | | | | | | |
| | |
United Kingdom 9.5% | | | | | | | | |
¨Experian PLC (Professional Services) | | | 300,350 | | | | 5,281,330 | |
Rolls-Royce Holdings PLC (Aerospace & Defense) (a) | | | 281,450 | | | | 4,940,250 | |
WPP PLC (Media) | | | 283,146 | | | | 4,679,736 | |
| | | | | | | | |
| | | | | | | 14,901,316 | |
| | | | | | | | |
| | | | | | | | |
| | | Shares | | | Value | |
| | | | | | | | |
United States 49.4% | | | | | | | | |
¨American International Group, Inc. (Insurance) (a) | | | 153,830 | | | $ | 6,371,639 | |
Apple, Inc. (Computers & Peripherals) | | | 11,294 | | | | 5,000,418 | |
Blackstone Group L.P. (The) (Capital Markets) | | | 189,400 | | | | 3,892,170 | |
¨Boeing Co. (The) (Aerospace & Defense) | | | 61,390 | | | | 5,611,660 | |
CIT Group, Inc. (Commercial Banks) (a) | | | 109,460 | | | | 4,653,145 | |
¨Citigroup, Inc. (Diversified Financial Services) | | | 114,945 | | | | 5,363,334 | |
¨CME Group, Inc. (Diversified Financial Services) | | | 102,213 | | | | 6,220,683 | |
Comcast Corp. Class A (Media) | | | 94,300 | | | | 3,705,047 | |
CVS Caremark Corp. (Food & Staples Retailing) | | | 82,900 | | | | 4,823,122 | |
Ecolab, Inc. (Chemicals) | | | 55,942 | | | | 4,733,812 | |
International Game Technology (Hotels, Restaurants & Leisure) | | | 282,630 | | | | 4,790,578 | |
International Paper Co. (Paper & Forest Products) | | | 82,650 | | | | 3,882,897 | |
Las Vegas Sands Corp. (Hotels,
Restaurants & Leisure) | | | 87,319 | | | | 4,911,694 | |
National Oilwell Varco, Inc. (Energy Equipment & Services) | | | 71,340 | | | | 4,652,795 | |
Time Warner, Inc. (Media) | | | 58,175 | | | | 3,477,701 | |
¨UnitedHealth Group, Inc. (Health Care Providers & Services) | | | 90,400 | | | | 5,417,672 | |
| | | | | | | | |
| | | | | | | 77,508,367 | |
| | | | | | | | |
Total Common Stocks
(Cost $136,050,163) | | | | | | | 152,323,172 | |
| | | | | | | | |
| | |
| Preferred Stock 0.1% | | | | | | | | |
United Kingdom 0.1% | | | | | | | | |
Rolls-Royce Holdings PLC – Class C (Aerospace & Defense) (a)(c) | | | 33,492,550 | | | | 52,026 | |
| | | | | | | | |
Total Preferred Stock
(Cost $51,049) | | | | | | | 52,026 | |
| | | | | | | | |
| | |
| | | | | | | | |
| † | Percentages indicated are based on Fund net assets. |
| ¨ | Among the Fund’s 10 largest holdings, as of April 30, 2013, excluding short-term investment. May be subject to change daily. |
| | | | | | |
The notes to the financial statements are an integral part of,
and should be read in conjunction with, the financial statements. | | mainstayinvestments.com | | | 11 | |
Portfolio of Investments April 30, 2013 (Unaudited) (continued)
| | | | | | | | |
| | | Principal
Amount | | | Value | |
| | | | | | | | |
| Short-Term Investment 1.4% | |
Repurchase Agreement 1.4% | | | | | | | | |
United States 1.4% | | | | | | | | |
State Street Bank and Trust Co. 0.01%, dated 4/30/13
due 5/1/13
Proceeds at Maturity $2,208,609 (Collateralized by a Federal Home Loan Mortgage Corp. security with a rate of 2.10% and a maturity date of 10/7/22, with a Principal Amount of $2,270,000 and a Market Value of $2,255,399) (Capital Markets) | | $ | 2,208,608 | | | $ | 2,208,608 | |
| | | | | | | | |
Total Short-Term Investment
(Cost $2,208,608) | | | | | | | 2,208,608 | |
| | | | | | | | |
Total Investments
(Cost $138,309,820) (d) | | | 98.5 | % | | | 154,583,806 | |
Other Assets, Less Liabilities | | | 1.5 | | | | 2,407,925 | |
Net Assets | | | 100.0 | % | | $ | 156,991,731 | |
| (a) | Non-income producing security. |
| (b) | May be sold to institutional investors only under Rule 144A or securities offered pursuant to Section 4(a)(2) of the Securities Act of 1933, as amended. |
| (c) | Fair valued security—The total market value of this security as of April 30, 2013 is $52,026, which represents less than one-tenth of a percent of the Fund’s net assets. |
| (d) | As of April 30, 2013, cost is $138,479,563 for federal income tax purposes and net unrealized appreciation is as follows: |
| | | | |
Gross unrealized appreciation | | $ | 17,197,130 | |
Gross unrealized depreciation | | | (1,092,887 | ) |
| | | | |
Net unrealized appreciation | | $ | 16,104,243 | |
| | | | |
The following abbreviation is used in the above portfolio:
GDR—Global Depositary Receipt
The following is a summary of the fair valuations according to the inputs used as of April 30, 2013, for valuing the Fund’s assets.
Asset Valuation Inputs
| | | | | | | | | | | | | | | | |
Description | | Quoted
Prices in
Active
Markets for
Identical
Assets (Level 1) | | | Significant
Other
Observable
Inputs (Level 2) | | | Significant
Unobservable
Inputs (Level 3) | | | Total | |
| Investments in Securities (a) | | | | | | | | | | | | | | | | |
| Common Stocks | | $ | 152,323,172 | | | $ | — | | | $ | — | | | $ | 152,323,172 | |
| Preferred Stock (b) | | | — | | | | — | | | | 52,026 | | | | 52,026 | |
| Short-Term Investment | | | | | | | | | | | | | | | | |
Repurchase Agreement | | | — | | | | 2,208,608 | | | | — | | | | 2,208,608 | |
| | | | | | | | | | | | | | | | |
| Total Investments in Securities | | $ | 152,323,172 | | | $ | 2,208,608 | | | $ | 52,026 | | | $ | 154,583,806 | |
| | | | | | | | | | | | | | | | |
| (a) | For a complete listing of investments and their industries, see the Portfolio of Investments. |
| (b) | The Level 3 security valued at $52,026 is a security listed under United Kingdom in the Aerospace and Defense industry within the Preferred Stock section of the Portfolio of Investments. |
The Fund recognizes transfers between the levels as of the beginning of the period.
For the period ended April 30, 2013, the Fund did not have any transfers between Level 1 and Level 2 fair value measurements. (See Note 2)
| | | | |
| 12 | | MainStay Epoch Global Choice Fund | | The notes to the financial statements are an integral part of,
and should be read in conjunction with, the financial statements. |
The following is a reconciliation of investments in which significant unobservable inputs (Level 3) were used in determining value:
| | | | | | | | | | | | | | | | | | | | | | | | | | | | | | | | | | | | | | | | |
Investments in Securities | | Balance
as of
October 31,
2012 | | | Accrued
Discounts
(Premiums) | | | Realized
Gain
(Loss) | | | Change in
Unrealized
Appreciation
(Depreciation) | | | Purchases | | | Sales | | | Transfers
into
Level 3 | | | Transfers
out of
Level 3 | | | Balance
as of
April 30,
2013 | | | Change in
Unrealized
Appreciation
(Depreciation)
from
Investments
Still Held at
April 30,
2013 (a) | |
| Preferred Stock | | | | | | | | | | | | | | | | | | | | | | | | | | | | | | | | | | | | | | | | |
Aerospace & Defense | | $ | 28,337 | | | $ | — | | | $ | 260 | | | $ | 644 | | | $ | 51,050 | | | $ | (28,265 | ) | | $ | — | | | $ | — | | | $ | 52,026 | | | $ | 976 | |
| | | | | | | | | | | | | | | | | | | | | | | | | | | | | | | | | | | | | | | | |
| Total | | $ | 28,337 | | | $ | — | | | $ | 260 | | | $ | 644 | | | $ | 51,050 | | | $ | (28,265 | ) | | $ | — | | | $ | — | | | $ | 52,026 | | | $ | 976 | |
| | | | | | | | | | | | | | | | | | | | | | | | | | | | | | | | | | | | | | | | |
| (a) | Included in “Net change in unrealized appreciation (depreciation) on investments” in the Statement of Operations. |
The table below sets forth the diversification of MainStay Epoch Global Choice Fund investments by industry.
Industry Diversification (Unaudited)
| | | | | | | | |
| | | Value | | | Percent † | |
Aerospace & Defense | | $ | 18,250,169 | | | | 11.6 | % |
Beverages | | | 4,134,634 | | | | 2.6 | |
Capital Markets | | | 6,100,778 | | | | 3.9 | |
Chemicals | | | 14,334,746 | | | | 9.1 | |
Commercial Banks | | | 4,653,145 | | | | 3.0 | |
Computers & Peripherals | | | 5,000,418 | | | | 3.2 | |
Containers & Packaging | | | 4,000,194 | | | | 2.5 | |
Diversified Financial Services | | | 11,584,017 | | | | 7.4 | |
Energy Equipment & Services | | | 4,652,795 | | | | 3.0 | |
Food & Staples Retailing | | | 4,823,122 | | | | 3.1 | |
Health Care Equipment & Supplies | | | 3,336,225 | | | | 2.1 | |
Health Care Providers & Services | | | 5,417,672 | | | | 3.4 | |
Hotels, Restaurants & Leisure | | | 9,702,272 | | | | 6.2 | |
Insurance | | | 12,128,868 | | | | 7.7 | |
Machinery | | | 4,245,147 | | | | 2.7 | |
Media | | | 17,386,761 | | | | 11.1 | |
Paper & Forest Products | | | 3,882,897 | | | | 2.5 | |
Pharmaceuticals | | | 3,100,131 | | | | 2.0 | |
Professional Services | | | 9,720,714 | | | | 6.2 | |
Semiconductors & Semiconductor Equipment | | | 4,737,496 | | | | 3.0 | |
Software | | | 3,391,605 | | | | 2.2 | |
| | | | | | | | |
| | | 154,583,806 | | | | 98.5 | |
Other Assets, Less Liabilities | | | 2,407,925 | | | | 1.5 | |
| | | | | | | | |
Net Assets | | $ | 156,991,731 | | | | 100.0 | % |
| | | | | | | | |
| † | Percentages indicated are based on Fund net assets. |
| | | | | | |
The notes to the financial statements are an integral part of,
and should be read in conjunction with, the financial statements. | | mainstayinvestments.com | | | 13 | |
Statement of Assets and Liabilities as of April 30, 2013 (Unaudited)
| | | | |
| Assets | | | | |
Investment in securities, at value
(identified cost $138,309,820) | | $ | 154,583,806 | |
Cash denominated in foreign currencies
(identified cost $416,073) | | | 420,351 | |
Receivables: | | | | |
Investment securities sold | | | 3,858,578 | |
Dividends and interest | | | 532,440 | |
Fund shares sold | | | 6,375 | |
Other assets | | | 34,117 | |
| | | | |
Total assets | | | 159,435,667 | |
| | | | |
|
| Liabilities | |
Payables: | | | | |
Investment securities purchased | | | 2,278,349 | |
Manager (See Note 3) | | | 125,460 | |
Professional fees | | | 28,660 | |
Shareholder communication | | | 6,150 | |
Transfer agent (See Note 3) | | | 2,483 | |
NYLIFE Distributors (See Note 3) | | | 1,425 | |
Fund shares redeemed | | | 303 | |
Trustees | | | 63 | |
Accrued expenses | | | 1,043 | |
| | | | |
Total liabilities | | | 2,443,936 | |
| | | | |
Net assets | | $ | 156,991,731 | |
| | | | |
|
| Composition of Net Assets | |
Shares of beneficial interest outstanding (par value of $.001 per share) unlimited number of shares authorized | | $ | 8,485 | |
Additional paid-in capital | | | 138,202,737 | |
| | | | |
| | | 138,211,222 | |
Undistributed net investment income | | | 829,360 | |
Accumulated net realized gain (loss) on investments and foreign currency transactions | | | 1,673,981 | |
Net unrealized appreciation (depreciation) on investments | | | 16,273,986 | |
Net unrealized appreciation (depreciation) on translation of other assets and liabilities in foreign currencies | | | 3,182 | |
| | | | |
Net assets | | $ | 156,991,731 | |
| | | | |
| | | | |
Investor Class | | | | |
Net assets applicable to outstanding shares | | $ | 439,876 | |
| | | | |
Shares of beneficial interest outstanding | | | 24,408 | |
| | | | |
Net asset value per share outstanding | | $ | 18.02 | |
Maximum sales charge (5.50% of offering price) | | | 1.05 | |
| | | | |
Maximum offering price per share outstanding | | $ | 19.07 | |
| | | | |
Class A | | | | |
Net assets applicable to outstanding shares | | $ | 4,850,285 | |
| | | | |
Shares of beneficial interest outstanding | | | 268,303 | |
| | | | |
Net asset value per share outstanding | | $ | 18.08 | |
Maximum sales charge (5.50% of offering price) | | | 1.05 | |
| | | | |
Maximum offering price per share outstanding | | $ | 19.13 | |
| | | | |
Class C | | | | |
Net assets applicable to outstanding shares | | $ | 464,989 | |
| | | | |
Shares of beneficial interest outstanding | | | 26,457 | |
| | | | |
Net asset value and offering price per share outstanding | | $ | 17.58 | |
| | | | |
Class I | | | | |
Net assets applicable to outstanding shares | | $ | 151,236,581 | |
| | | | |
Shares of beneficial interest outstanding | | | 8,166,182 | |
| | | | |
Net asset value and offering price per share outstanding | | $ | 18.52 | |
| | | | |
| | | | |
| 14 | | MainStay Epoch Global Choice Fund | | The notes to the financial statements are an integral part of,
and should be read in conjunction with, the financial statements. |
Statement of Operations for the six months ended April 30, 2013 (Unaudited)
| | | | |
| Investment Income (Loss) | | | | |
Income | | | | |
Dividends (a) | | $ | 1,611,290 | |
Interest | | | 364 | |
| | | | |
Total income | | | 1,611,654 | |
| | | | |
Expenses | | | | |
Manager (See Note 3) | | | 616,642 | |
Registration | | | 26,991 | |
Professional fees | | | 25,485 | |
Custodian | | | 9,493 | |
Shareholder communication | | | 8,270 | |
Distribution/Service—Investor Class (See Note 3) | | | 438 | |
Distribution/Service—Class A (See Note 3) | | | 5,432 | |
Distribution/Service—Class C (See Note 3) | | | 1,965 | |
Transfer agent (See Note 3) | | | 6,949 | |
Trustees | | | 1,264 | |
Miscellaneous | | | 9,768 | |
| | | | |
Total expenses | | | 712,697 | |
| | | | |
Net investment income (loss) | | | 898,957 | |
| | | | |
|
| Realized and Unrealized Gain (Loss) on Investments and Foreign Currency Transactions | |
Net realized gain (loss) on: | | | | |
Security transactions | | | 7,436,535 | |
Foreign currency transactions | | | (21,499 | ) |
| | | | |
Net realized gain (loss) on investments and foreign currency transactions | | | 7,415,036 | |
| | | | |
Net change in unrealized appreciation (depreciation) on: | | | | |
Investments | | | 6,958,104 | |
Translation of other assets and liabilities in foreign currencies | | | 3,437 | |
| | | | |
Net change in unrealized appreciation (depreciation) on investments and foreign currency transactions | | | 6,961,541 | |
| | | | |
Net realized and unrealized gain (loss) on investments and foreign currency transactions | | | 14,376,577 | |
| | | | |
Net increase (decrease) in net assets resulting from operations | | $ | 15,275,534 | |
| | | | |
| (a) | Dividends recorded net of foreign withholding taxes in the amount of $132,224. |
| | | | | | |
The notes to the financial statements are an integral part of,
and should be read in conjunction with, the financial statements. | | mainstayinvestments.com | | | 15 | |
Statements of Changes in Net Assets
for the six months ended April 30, 2013 (Unaudited) and the year ended October 31, 2012
| | | | | | | | |
| | | 2013 | | | 2012 | |
| Increase (Decrease) in Net Assets | | | | | |
Operations: | | | | | | | | |
Net investment income (loss) | | $ | 898,957 | | | $ | 586,568 | |
Net realized gain (loss) on investments and foreign currency transactions | | | 7,415,036 | | | | 5,134,152 | |
Net change in unrealized appreciation (depreciation) on investments and foreign currency transactions | | | 6,961,541 | | | | 4,279,155 | |
| | | | |
Net increase (decrease) in net assets resulting from operations | | | 15,275,534 | | | | 9,999,875 | |
| | | | |
Dividends to shareholders: | | | | | | | | |
From net investment income: | | | | | | | | |
Investor Class | | | (94 | ) | | | — | |
Class A | | | (8,928 | ) | | | (4,714 | ) |
Class I | | | (385,981 | ) | | | (206,284 | ) |
| | | | |
Total dividends to shareholders | | | (395,003 | ) | | | (210,998 | ) |
| | | | |
Capital share transactions: | | | | | | | | |
Net proceeds from sale of shares | | | 56,349,606 | | | | 36,927,299 | |
Net asset value of shares issued to shareholders in reinvestment of dividends | | | 394,174 | | | | 209,691 | |
Cost of shares redeemed | | | (3,391,818 | ) | | | (35,627,372 | ) |
| | | | |
Increase (decrease) in net assets derived from capital share transactions | | | 53,351,962 | | | | 1,509,618 | |
| | | | |
Net increase (decrease) in net assets | | | 68,232,493 | | | | 11,298,495 | |
| | |
| Net Assets | | | | | | | | |
Beginning of period | | | 88,759,238 | | | | 77,460,743 | |
| | | | |
End of period | | $ | 156,991,731 | | | $ | 88,759,238 | |
| | | | |
Undistributed net investment income at end of period | | $ | 829,360 | | | $ | 325,406 | |
| | | | |
| | | | |
| 16 | | MainStay Epoch Global Choice Fund | | The notes to the financial statements are an integral part of,
and should be read in conjunction with, the financial statements. |
Financial Highlights selected per share data and ratios
| | | | | | | | | | | | | | | | | | | | |
| | | Investor Class | |
| | | Six months
ended
April 30, | | | Year ended October 31, | | | January 1,
2010
through
October 31, | | | November 16,
2009**
through
December 31, | |
| | | 2013* | | | 2012 | | | 2011 | | | 2010*** | | | 2009 | |
Net asset value at beginning of period | | $ | 16.03 | | | $ | 14.21 | | | $ | 14.22 | | | $ | 13.49 | | | $ | 13.36 | |
| | | | | | | | | | | | | | | | | | | | |
Net investment income (loss) | | | 0.07 | | | | 0.06 | (a) | | | (0.02 | )(a) | | | (0.02 | )(a) | | | 0.00 | ‡(a) |
Net realized and unrealized gain (loss) on investments | | | 1.93 | | | | 1.77 | | | | 0.01 | | | | 0.80 | | | | 0.18 | |
Net realized and unrealized gain (loss) on foreign currency transactions | | | (0.00 | )‡ | | | (0.01 | ) | | | (0.00 | )‡ | | | (0.05 | ) | | | (0.00 | )‡ |
| | | | | | | | | | | | | | | | | | | | |
Total from investment operations | | | 2.00 | | | | 1.82 | | | | (0.01 | ) | | | 0.73 | | | | 0.18 | |
| | | | | | | | | | | | | | | | | | | | |
Less dividends: | | | | | | | | | | | | | | | | | | | | |
From net investment income | | | (0.01 | ) | | | — | | | | — | | | | — | | | | (0.05 | ) |
| | | | | | | | | | | | | | | | | | | | |
Net asset value at end of period | | $ | 18.02 | | | $ | 16.03 | | | $ | 14.21 | | | $ | 14.22 | | | $ | 13.49 | |
| | | | | | | | | | | | | | | | | | | | |
Total investment return (b) | | | 12.45 | %(c) | | | 12.81 | % | | | (0.07 | %) | | | 5.41 | % (c) | | | 1.33 | %(c) |
Ratios (to average net assets)/Supplemental Data: | | | | | | | | | | | | | | | | | | | | |
Net investment income (loss) | | | 1.05 | %†† | | | 0.39 | % | | | (0.11 | %) | | | (0.17 | %)†† | | | 0.03 | %†† |
Net expenses | | | 1.64 | %†† | | | 1.71 | % | | | 1.76 | % | | | 1.76 | % †† | | | 1.53 | %†† |
Expenses (before waiver/reimbursement) | | | 1.64 | %†† | | | 1.71 | % | | | 1.90 | % | | | 2.10 | % †† | | | 1.72 | %†† |
Portfolio turnover rate | | | 63 | % | | | 91 | % | | | 162 | % | | | 151 | % | | | 74 | % |
Net assets at end of period (in 000’s) | | $ | 440 | | | $ | 303 | | | $ | 247 | | | $ | 119 | | | $ | 28 | |
| ** | Commencement of operations. |
| *** | The Fund changed its fiscal year end from December 31 to October 31. |
| ‡ | Less than one cent per share. |
| (a) | Per share data based on average shares outstanding during the period. |
| (b) | Total investment return is calculated exclusive of sales charges and assumes the reinvestment of dividends and distributions. |
| (c) | Total investment return is not annualized. |
| | | | | | |
The notes to the financial statements are an integral part of,
and should be read in conjunction with, the financial statements. | | mainstayinvestments.com | | | 17 | |
Financial Highlights selected per share data and ratios
| | | | | | | | | | | | | | | | | | | | | | | | | | | | |
| | | Class A | |
| | | Six months
ended
April 30, | | | Year ended October 31, | | | January 1,
2010
through
October 31, | | | Year ended December 31, | |
| | | 2013* | | | 2012 | | | 2011 | | | 2010*** | | | 2009 | | | 2008 | | | 2007 | |
Net asset value at beginning of period | | $ | 16.09 | | | $ | 14.25 | | | $ | 14.24 | | | $ | 13.49 | | | $ | 10.84 | | | $ | 17.43 | | | $ | 16.97 | |
| | | | | | | | | | | | | | | | | | | | | | | | | | | | |
Net investment income (loss) | | | 0.10 | | | | 0.09 | (a) | | | 0.02 | (a) | | | 0.01 | (a) | | | 0.04 | (a) | | | 0.02 | (a) | | | 0.01 | |
Net realized and unrealized gain (loss) on investments | | | 1.93 | | | | 1.78 | | | | 0.00 | ‡ | | | 0.79 | | | | 2.70 | | | | (6.58 | ) | | | 1.45 | |
Net realized and unrealized gain (loss) on foreign currency transactions | | | (0.00 | )‡ | | | (0.01 | ) | | | (0.00 | )‡ | | | (0.05 | ) | | | (0.01 | ) | | | — | | | | — | |
| | | | | | | | | | | | | | | | | | | | | | | | | | | | |
Total from investment operations | | | 2.03 | | | | 1.86 | | | | 0.02 | | | | 0.75 | | | | 2.73 | | | | (6.56 | ) | | | 1.46 | |
| | | | | | | | | | | | | | | | | | | | | | | | | | | | |
Less dividends and distributions: | | | | | | | | | | | | | | | | | | | | | | | | | | | | |
From net investment income | | | (0.04 | ) | | | (0.02 | ) | | | (0.01 | ) | | | — | | | | (0.08 | ) | | | (0.03 | ) | | | (0.01 | ) |
From net realized gain on investments | | | — | | | | — | | | | — | | | | — | | | | — | | | | (0.00 | )‡ | | | (1.05 | ) |
| | | | | | | | | | | | | | | | | | | | | | | | | | | | |
Total dividends and distributions | | | (0.04 | ) | | | (0.02 | ) | | | (0.01 | ) | | | — | | | | (0.08 | ) | | | (0.03 | ) | | | (1.06 | ) |
| | | | | | | | | | | | | | | | | | | | | | | | | | | | |
Redemption fee (b) | | | — | | | | — | | | | — | | | | — | | | | — | | | | — | | | | 0.06 | |
| | | | | | | | | | | | | | | | | | | | | | | | | | | | |
Net asset value at end of period | | $ | 18.08 | | | $ | 16.09 | | | $ | 14.25 | | | $ | 14.24 | | | $ | 13.49 | | | $ | 10.84 | | | $ | 17.43 | |
| | | | | | | | | | | | | | | | | | | | | | | | | | | | |
Total investment return (c) | | | 12.62 | %(d) | | | 13.07 | % | | | 0.15 | % | | | 5.56 | %(d) | | | 25.17 | % | | | (37.63 | %) | | | 8.90 | % |
Ratios (to average net assets)/Supplemental Data: | | | | | | | | | | | | | | | | | | | | | | | | | | | | |
Net investment income (loss) | | | 1.17 | %†† | | | 0.63 | % | | | 0.13 | % | | | 0.11 | %†† | | | 0.30 | % | | | 0.21 | % | | | 0.01 | % |
Net expenses | | | 1.39 | %†† | | | 1.48 | % | | | 1.54 | % | | | 1.54 | %†† | | | 1.55 | % | | | 1.54 | % | | | 1.54 | % |
Expenses (before waiver/reimbursement) | | | 1.39 | %†† | | | 1.48 | % | | | 1.68 | % | | | 1.88 | %†† | | | 1.78 | % | | | 1.75 | % | | | 1.95 | % |
Portfolio turnover rate | | | 63 | % | | | 91 | % | | | 162 | % | | | 151 | % | | | 74 | % | | | 47 | % | | | 43 | % |
Net assets at end of period (in 000’s) | | $ | 4,850 | | | $ | 3,921 | | | $ | 3,432 | | | $ | 1,855 | | | $ | 2,973 | | | $ | 339 | | | $ | 120 | |
| *** | The Fund changed its fiscal year end from December 31 to October 31. |
| ‡ | Less than one cent per share. |
| (a) | Per share data based on average shares outstanding during the period. |
| (b) | The redemption fee was discontinued as of April 1, 2010. |
| (c) | Total investment return is calculated exclusive of sales charges and assumes the reinvestment of dividends and distributions. |
| (d) | Total investment return is not annualized. |
| | | | |
| 18 | | MainStay Epoch Global Choice Fund | | The notes to the financial statements are an integral part of,
and should be read in conjunction with, the financial statements. |
Financial Highlights selected per share data and ratios
| | | | | | | | | | | | | | | | | | | | |
| | | Class C | |
| | | Six months
ended
April 30, | | | Year ended October 31, | | | January 1,
2010 through
October 31, | | | November 16,
2009**
through
December 31, | |
| | | 2013* | | | 2012 | | | 2011 | | | 2010*** | | | 2009 | |
Net asset value at beginning of period | | $ | 15.68 | | | $ | 14.01 | | | $ | 14.12 | | | $ | 13.49 | | | $ | 13.36 | |
| | | | | | | | | | | | | | | | | | | | |
Net investment income (loss) | | | 0.03 | | | | (0.05 | )(a) | | | (0.12 | )(a) | | | (0.10 | )(a) | | | (0.01 | )(a) |
Net realized and unrealized gain (loss) on investments | | | 1.87 | | | | 1.73 | | | | 0.01 | | | | 0.78 | | | | 0.17 | |
Net realized and unrealized gain (loss) on foreign currency transactions | | | (0.00 | )‡ | | | (0.01 | ) | | | (0.00 | )‡ | | | (0.05 | ) | | | (0.00 | )‡ |
| | | | | | | | | | | | | | | | | | | | |
Total from investment operations | | | 1.90 | | | | 1.67 | | | | (0.11 | ) | | | 0.63 | | | | 0.16 | |
| | | | | | | | | | | | | | | | | | | | |
Less dividends: | | | | | | | | | | | | | | | | | | | | |
From net investment income | | | — | | | | — | | | | — | | | | — | | | | (0.03 | ) |
| | | | | | | | | | | | | | | | | | | | |
Net asset value at end of period | | $ | 17.58 | | | $ | 15.68 | | | $ | 14.01 | | | $ | 14.12 | | | $ | 13.49 | |
| | | | | | | | | | | | | | | | | | | | |
Total investment return (b) | | | 12.12 | %(c) | | | 11.92 | % | | | (0.78 | %) | | | 4.67 | % (c) | | | 1.23 | % (c) |
Ratios (to average net assets)/Supplemental Data: | | | | | | | | | | | | | | | | | | | | |
Net investment income (loss) | | | 0.23 | %†† | | | (0.36 | %) | | | (0.86 | %) | | | (0.92 | %)†† | | | (0.78 | %)†† |
Net expenses | | | 2.39 | %†† | | | 2.46 | % | | | 2.51 | % | | | 2.51 | % †† | | | 2.28 | % †† |
Expenses (before waiver/reimbursement) | | | 2.39 | %†† | | | 2.46 | % | | | 2.65 | % | | | 2.85 | % †† | | | 2.47 | % †† |
Portfolio turnover rate | | | 63 | % | | | 91 | % | | | 162 | % | | | 151 | % | | | 74 | % |
Net assets at end of period (in 000’s) | | $ | 465 | | | $ | 342 | | | $ | 59 | | | $ | 38 | | | $ | 28 | |
| ** | Commencement of operations. |
| *** | The Fund changed its fiscal year end from December 31 to October 31. |
| ‡ | Less than one cent per share. |
| (a) | Per share data based on average shares outstanding during the period. |
| (b) | Total investment return is calculated exclusive of sales charges and assumes the reinvestment of dividends and distributions. |
| (c) | Total investment return is not annualized. |
| | | | | | |
The notes to the financial statements are an integral part of,
and should be read in conjunction with, the financial statements. | | mainstayinvestments.com | | | 19 | |
Financial Highlights selected per share data and ratios
| | | | | | | | | | | | | | | | | | | | | | | | | | | | |
| | | Class I | |
| | | Six months
ended
April 30, | | | Year ended October 31, | | | January 1,
2010
through
October 31, | | | Year ended December 31, | |
| | | 2013* | | | 2012 | | | 2011 | | | 2010*** | | | 2009 | | | 2008 | | | 2007 | |
Net asset value at beginning of period | | $ | 16.50 | | | $ | 14.60 | | | $ | 14.59 | | | $ | 13.79 | | | $ | 11.06 | | | $ | 17.47 | | | $ | 16.99 | |
| | | | | | | | | | | | | | | | | | | | | | | | | | | | |
Net investment income (loss) | | | 0.12 | | | | 0.12 | (a) | | | 0.05 | (a) | | | 0.04 | (a) | | | 0.07 | (a) | | | 0.05 | (a) | | | 0.04 | |
Net realized and unrealized gain (loss) on investments | | | 1.98 | | | | 1.83 | | | | 0.01 | | | | 0.81 | | | | 2.76 | | | | (6.41 | ) | | | 1.54 | |
Net realized and unrealized gain (loss) on foreign currency transactions | | | (0.00 | )‡ | | | (0.01 | ) | | | (0.00 | )‡ | | | (0.05 | ) | | | (0.01 | ) | | | — | | | | — | |
| | | | | | | | | | | | | | | | | | | | | | | | | | | | |
Total from investment operations | | | 2.10 | | | | 1.94 | | | | 0.06 | | | | 0.80 | | | | 2.82 | | | | (6.36 | ) | | | 1.58 | |
| | | | | | | | | | | | | | | | | | | | | | | | | | | | |
Less dividends and distributions: | | | | | | | | | | | | | | | | | | | | | | | | | | | | |
From net investment income | | | (0.08 | ) | | | (0.04 | ) | | | (0.05 | ) | | | — | | | | (0.09 | ) | | | (0.05 | ) | | | (0.05 | ) |
From net realized gain on investments | | | — | | | | — | | | | — | | | | — | | | | — | | | | (0.00 | )‡ | | | (1.05 | ) |
| | | | | | | | | | | | | | | | | | | | | | | | | | | | |
Total dividends and distributions | | | (0.08 | ) | | | (0.04 | ) | | | (0.05 | ) | | | — | | | | (0.09 | ) | | | (0.05 | ) | | | (1.10 | ) |
| | | | | | | | | | | | | | | | | | | | | | | | | | | | |
Redemption fee (b) | | | — | | | | — | | | | — | | | | 0.00 | ‡ | | | — | | | | 0.00 | ‡ | | | — | |
| | | | | | | | | | | | | | | | | | | | | | | | | | | | |
Net asset value at end of period | | $ | 18.52 | | | $ | 16.50 | | | $ | 14.60 | | | $ | 14.59 | | | $ | 13.79 | | | $ | 11.06 | | | $ | 17.47 | |
| | | | | | | | | | | | | | | | | | | | | | | | | | | | |
Total investment return (c) | | | 12.74 | %(d) | | | 13.33 | % | | | 0.42 | % | | | 5.80 | %(d) | | | 25.53 | % | | | (36.37 | %) | | | 9.27 | % |
Ratios (to average net assets)/Supplemental Data: | | | | | | | | | | | | | | | | | | | | | | | | | | | | |
Net investment income (loss) | | | 1.47 | %†† | | | 0.80 | % | | | 0.33 | % | | | 0.35 | %†† | | | 0.62 | % | | | 0.42 | % | | | 0.26 | % |
Net expenses | | | 1.14 | %†† | | | 1.23 | % | | | 1.29 | % | | | 1.29 | %†† | | | 1.29 | % | | | 1.29 | % | | | 1.29 | % |
Expenses (before waiver/reimbursement) | | | 1.14 | %†† | | | 1.23 | % | | | 1.43 | % | | | 1.63 | %†† | | | 1.54 | % | | | 1.50 | % | | | 1.70 | % |
Portfolio turnover rate | | | 63 | % | | | 91 | % | | | 162 | % | | | 151 | % | | | 74 | % | | | 47 | % | | | 43 | % |
Net assets at end of period (in 000’s) | | $ | 151,237 | | | $ | 84,193 | | | $ | 73,723 | | | $ | 54,695 | | | $ | 38,976 | | | $ | 56,715 | | | $ | 34,911 | |
| *** | The Fund changed its fiscal year end from December 31 to October 31. |
| ‡ | Less than one cent per share. |
| (a) | Per share data based on average shares outstanding during the period. |
| (b) | The redemption fee was discontinued as of April 1, 2010. |
| (c) | Total investment return is calculated exclusive of sales charges and assumes the reinvestment of dividends and distributions. Class I shares are not subject to sales charges. |
| (d) | Total investment return is not annualized. |
| | | | |
| 20 | | MainStay Epoch Global Choice Fund | | The notes to the financial statements are an integral part of,
and should be read in conjunction with, the financial statements. |
Notes to Financial Statements (Unaudited)
Note 1–Organization and Business
MainStay Funds Trust (the “Trust”) was organized as a Delaware statutory trust on April 28, 2009, and is governed by a Declaration of Trust. The Trust is registered under the Investment Company Act of 1940, as amended (the “1940 Act”), as an open-end investment management company, and is comprised of thirty-three funds (collectively referred to as the “Funds”). These financial statements and notes relate only to the MainStay Epoch Global Choice Fund (the “Fund”), a diversified fund. The Fund is the successor to the Epoch U.S. All Cap Equity Fund (the “Predecessor Fund”), which was a series of a different registered investment company for which Epoch Investment Partners, Inc. served as investment advisor. The financial statements of the Fund reflect the historical results of the Institutional Class and Class P shares of the Predecessor Fund prior to its reorganization on November 16, 2009. Upon the completion of the reorganization, the Class I and Class A shares of the Fund assumed the performance, financial and other information of the Institutional Class and Class P shares of the Predecessor Fund, respectively. All information and references to periods prior to November 16, 2009 refer to the Predecessor Fund.
The Fund currently offers four classes of shares. Investor Class and Class C shares commenced operations on November 16, 2009. Class I and Class A shares commenced operations (under former designations) on July 25, 2005 and August 15, 2006, respectively. Investor Class and Class A shares are offered at net asset value (“NAV”) per share plus an initial sales charge. No sales charge applies to investments of $1 million or more (and certain other qualified purchases) in Investor Class and Class A shares, but a contingent deferred sales charge (“CDSC”) is imposed on certain redemptions made within one year of the date of purchase. Class C shares are offered at NAV without an initial sales charge, although a 1.00% CDSC may be imposed on redemptions made within one year of the date of purchase of Class C shares. Class I shares are offered at NAV and are not subject to a sales charge. Depending upon eligibility, Investor Class shares may convert to Class A shares and Class A shares may convert to Investor Class shares. The four classes of shares have the same voting (except for issues that relate solely to one class), dividend, liquidation and other rights, and the same terms and conditions, except that Class C shares are subject to higher distribution and/or service fee rates than Investor Class and Class A shares under a distribution plan pursuant to Rule 12b-1 under the 1940 Act. Class I shares are not subject to a distribution and/or service fee.
The Fund’s investment objective is to seek long-term capital appreciation.
Note 2–Significant Accounting Policies
The Fund prepares its financial statements in accordance with generally accepted accounting principles (“GAAP”) in the United States of America and follows the significant accounting policies described below.
(A) Securities Valuation. Investments are valued as of the close of regular trading on the New York Stock Exchange (“Exchange”) (generally 4:00 p.m. Eastern time) on each day the Fund is open for business (“valuation date”).
The Board of Trustees (the “Board”) has adopted procedures for the valuation of the Fund’s securities and has delegated the responsibility
for valuation determination under those procedures to the Valuation Committee of the Fund (the “Valuation Committee”). The Board has authorized the Valuation Committee to appoint a Valuation Sub-Committee (the “Sub-Committee”) to deal in the first instance with questions that arise or cannot be resolved under these procedures. The Sub-Committee meets (in person, via electronic mail or via teleconference) on an as-needed basis. The Valuation Committee meets at a later time, as necessary, to ensure that actions taken by the Sub-Committee were appropriate. The procedures recognize that, subject to the oversight of the Board and unless otherwise noted, the responsibility for day-to-day valuation of portfolio assets (including securities for which market prices are not readily available) rests with New York Life Investment Management LLC ( “New York Life Investments” or the “Manager”), aided to whatever extent necessary by the Subadvisor (as defined in Note 3(A)) of the Fund.
To assess the appropriateness of security valuations, the Manager or the Fund’s third party service provider who is subject to oversight by the Manager, regularly compares prior day prices, prices on comparable securities and the sale prices to the prior and current day prices and challenges prices exceeding certain tolerance levels with third party pricing services or broker sources. For those securities valued by recommendation, whether through a standardized fair valuation methodology or a fair valuation determination, the Valuation Committee reviews and affirms the reasonableness of the valuation based on such methodologies and determinations on a regular basis after considering all relevant information that is reasonably available.
“Fair value” is defined as the price that the Fund would receive upon selling an investment in an orderly transaction to an independent buyer in the principal or most advantageous market of the investment. Fair value measurements are determined within a framework that has established a three-tier hierarchy which maximizes the use of observable market data and minimizes the use of unobservable inputs to establish classification of fair value measurements for disclosure purposes. “Inputs” refers broadly to the assumptions that market participants would use in pricing the asset or liability, including assumptions about risk, such as the risk inherent in a particular valuation technique used to measure fair value using a pricing model and/or the risk inherent in the inputs for the valuation technique. Inputs may be observable or unobservable. Observable inputs reflect the assumptions market participants would use in pricing the asset or liability based on market data obtained from sources independent of the Fund. Unobservable inputs reflect the Fund’s own assumptions about the assumptions market participants would use in pricing the asset or liability developed based on the information available in the circumstances. The inputs or methodology used for valuing securities may not be an indication of the risks associated with investing in those securities. The three-tier hierarchy of inputs is summarized in the three broad Levels listed below.
| • | | Level 1—quoted prices in active markets for identical investments |
| • | | Level 2—other significant observable inputs (including quoted prices for similar investments in active markets, interest rates and yield curves, prepayment speeds, credit risks, etc.) |
| • | | Level 3—significant unobservable inputs (including the Fund’s own assumptions about the assumptions that market participants would use in determining the fair value of investments) |
| | | | |
| mainstayinvestments.com | | | 21 | |
Notes to Financial Statements (Unaudited) (continued)
The aggregate value by input level, as of April 30, 2013, for the Fund’s investments is included at the end of the Fund’s Portfolio of Investments.
The valuation techniques used by the Fund to measure fair value maximize the use of observable inputs and minimize the use of unobservable inputs. The Fund may utilize third party vendor evaluations, whose prices may be derived from one or more of the following standard inputs:
| | |
• Benchmark Yields | | • Reported Trades |
• Broker Dealer Quotes | | • Issuer Spreads |
• Two-sided markets | | • Benchmark securities |
• Bids/Offers | | • Reference Data (corporate actions or material event notices) |
• Industry and economic events | | • Comparable bonds |
• Equity and credit default swap curves | | • Monthly payment information |
Securities for which market values cannot be determined using the methodologies described above are valued by methods deemed in good faith by the Fund’s Valuation Committee, following the procedures established by the Board, to represent fair value. Under these procedures, the Fund primarily employs a market-based approach which may use related or comparable assets or liabilities, recent transactions, market multiples, book values, and other relevant information. The Fund may also use an income-based valuation approach in which the anticipated future cash flows of the investment are discounted to calculate fair value. Discounts may also be applied due to the nature or duration of any restrictions on the disposition of the investments. Due to the inherent uncertainty of valuations of such investments, the fair values may differ significantly from the values that would have been used had an active market existed. For the six-month period ended April 30, 2013, there have been no changes to the fair value methodologies.
Equity and non-equity securities which may be valued in this manner include, but are not limited to: (i) a security for which the trading has been halted or suspended; (ii) a debt security that has recently gone into default and for which there is not a current market quotation; (iii) a security of an issuer that has entered into a restructuring; (iv) a security that has been de-listed from a national exchange; (v) a security for which the market price is not available from a third party pricing source or, if so provided, does not, in the opinion of the Fund’s Manager or Subadvisor reflect the security’s market value; and (vi) a security whose principal market has been temporarily closed at a time when, under normal conditions, it would be open. Securities for which market quotations or observable inputs are not readily available are generally categorized as Level 3 in the hierarchy. As of April 30, 2013, the Fund held securities with a value of $52,026 that were fair valued in such a manner.
Certain events may occur between the time that foreign markets close, on which securities held by the Fund principally trade, and the time at which the Fund’s NAV is calculated. These events may include, but are not limited to, situations relating to a single issuer in a market sector, significant fluctuations in U.S. or foreign markets, natural disasters, armed conflicts, governmental actions or other developments not tied directly to the securities markets. Should the Manager or Subadvisor conclude that such events may have affected the accuracy of the last
price of such securities reported on the local foreign market, the Manager or Subadvisor may, pursuant to procedures adopted by the Board, adjust the value of the local price to reflect the estimated impact on the price of such securities as a result of such events. In this instance, securities are generally categorized as Level 3 in the hierarchy. Additionally, foreign equity securities are also fair valued whenever the movement of a particular index exceeds certain thresholds. In such cases, the securities are fair valued by applying factors provided by a third party vendor in accordance with the Fund’s policies and procedures and are generally categorized as Level 2 in the hierarchy. As of April 30, 2013, certain foreign equity securities held by the Fund were not fair valued in such a manner.
Equity securities and Exchange Traded Funds are valued at the latest quoted sales prices as of the close of regular trading on the Exchange on each valuation date. Securities that are not traded on the valuation date are valued at the mean of the latest quoted bid and ask prices. Prices normally are taken from the principal market in which each security trades. Futures contracts are valued at the last posted settlement price on the market where such futures are primarily traded. Options contracts are valued at the last posted settlement price on the market where such options are principally traded. Investments in other mutual funds are valued at their respective NAVs as of the close of the Exchange on the valuation date. These securities are generally categorized as Level 1 in the hierarchy.
Temporary cash investments acquired over 60 days to maturity are valued using the latest bid prices or using valuations based on a matrix system (which considers such factors as security prices, yields, maturities, and ratings), both as furnished by independent pricing services. Other temporary cash investments which mature in 60 days or less (“Short-Term Investments”) are valued at amortized cost. The amortized cost method involves valuing a security at its cost on the date of purchase and thereafter assuming a constant amortization to maturity of the difference between such cost and the value on maturity date. Amortized cost approximates the current fair value of a security. Securities valued at amortized cost are not valued using a quoted price in an active market. These securities are generally categorized as Level 2 in the hierarchy.
(B) Income Taxes. The Fund’s policy is to comply with the requirements of the Internal Revenue Code of 1986, as amended (the “Internal Revenue Code”), applicable to regulated investment companies and to distribute all of the taxable income to the shareholders of the Fund within the allowable time limits. Therefore, no federal, state and local income tax provision is required.
Management evaluates its tax positions to determine if the tax positions taken meet the minimum recognition threshold in connection with accounting for uncertainties in income tax positions taken or expected to be taken for the purposes of measuring and recognizing tax liabilities in the financial statements. Recognition of tax benefits of an uncertain tax position is required only when the position is “more likely than not” to be sustained assuming examination by taxing authorities. Management has analyzed the Fund’s tax positions taken on federal, state and local income tax returns for all open tax years (for up to three tax years), and has concluded that no provision for federal, state and local income tax is required in the Fund’s financial statements. The Fund’s federal, state
| | |
| 22 | | MainStay Epoch Global Choice Fund |
and local income and federal excise tax returns for tax years for which the applicable statutes of limitations have not expired are subject to examination by the Internal Revenue Service and state and local departments of revenue.
(C) Foreign Taxes. Investment income received by the Fund from foreign sources may be subject to foreign income taxes. These foreign income taxes are generally withheld at the source, a portion of which may be recoverable. The Fund will accrue such taxes and recoveries as applicable, based upon its current interpretation of tax rules and regulations that exist in the markets in which it invests.
(D) Dividends and Distributions to Shareholders. Dividends and distributions are recorded on the ex-dividend date. The Fund intends to declare and pay dividends of net investment income and distributions of net realized capital and currency gains, if any, at least annually. Unless the shareholder elects otherwise, all dividends and distributions are reinvested in the same class of shares of the Fund, at NAV. Dividends and distributions to shareholders are determined in accordance with federal income tax regulations and may differ from GAAP.
(E) Security Transactions and Investment Income. The Fund records security transactions on the trade date. Realized gains and losses on security transactions are determined using the identified cost method. Dividend income is recognized on the ex-dividend date and interest income is accrued as earned using the effective interest rate method. Discounts and premiums on Short-Term Investments are accreted and amortized, respectively, on the straight-line method.
Investment income and realized and unrealized gains and losses on investments of the Fund are allocated to separate classes of shares pro rata based upon their relative net assets on the date the income is earned or realized and unrealized gains and losses are incurred.
(F) Expenses. Expenses of the Trust are allocated to the individual Funds in proportion to the net assets of the respective Funds when the expenses are incurred, except where direct allocations of expenses can be made. Expenses (other than transfer agent expenses and fees incurred under the shareholder services plans and the distribution plans further discussed in Note 3(B)) are allocated to separate classes of shares pro rata based upon their relative net assets on the date the expenses are incurred. The expenses borne by the Fund, including those of related parties to the Fund, are shown in the Statement of Operations.
(G) Use of Estimates. In preparing financial statements in conformity with GAAP, management makes estimates and assumptions that affect the reported amounts and disclosures in the financial statements. Actual results could differ from those estimates.
(H) Repurchase Agreements. The Fund may enter into repurchase agreements to earn income. The Fund may enter into repurchase agreements only with financial institutions that are deemed by the Manager or Subadvisor to be creditworthy, pursuant to guidelines established by the Fund’s Board. During the term of any repurchase agreement, the Manager or Subadvisor will continue to monitor the creditworthiness of the seller. Under the 1940 Act, repurchase agreements are considered to be collateralized loans by a Fund to the seller secured by the securities transferred to the Fund.
When the Fund invests in repurchase agreements, the Fund’s custodian takes possession of the collateral pledged for investments in the repurchase agreement. The underlying collateral is valued daily on a mark-to-market basis to determine that the value, including accrued interest, exceeds the repurchase price. In the event of the seller’s default on the obligation to repurchase, the Fund has the right to liquidate the collateral and apply the proceeds in satisfaction of the obligation. Under certain circumstances, such as in the event of default or bankruptcy by the counterparty to the agreement, realization and/or retention of the collateral may be subject to legal proceedings and possible realized loss to the Fund.
(I) Foreign Currency Transactions. The books and records of the Fund are kept in U.S. dollars. Prices of securities denominated in foreign currency amounts are translated into U.S. dollars at the mean between the buying and selling rates last quoted by any major U.S. bank at the following dates:
| (i) | market value of investment securities, other assets and liabilities— at the valuation date, and |
| (ii) | purchases and sales of investment securities, income and expenses—at the date of such transactions. |
The assets and liabilities that are denominated in foreign currency amounts are presented at the exchange rates and market values at the close of the period. The realized and unrealized changes in net assets arising from fluctuations in exchange rates and market prices of securities are not separately presented.
Net realized gain (loss) on foreign currency transactions represents net gains and losses on foreign currency forward contracts, net currency gains or losses realized as a result of differences between the amounts of securities sale proceeds or purchase cost, dividends, interest and withholding taxes as recorded on the Fund’s books, and the U.S. dollar equivalent amount actually received or paid. Net currency gains or losses from valuing such foreign currency denominated assets and liabilities, other than investments at valuation date exchange rates, are reflected in unrealized foreign exchange gains or losses.
(J) Securities Lending. In order to realize additional income, the Fund may engage in securities lending, subject to the limitations set forth in the 1940 Act and relevant guidance by the staff of the Securities and Exchange Commission. In the event the Fund does engage in securities lending, the Fund will lend through its custodian, State Street Bank and Trust Company (“State Street”). State Street will manage the Fund’s cash collateral in accordance with the lending agreement between the Fund and State Street, and indemnify the Fund’s portfolio against counterparty risk. The loans will be collateralized by cash or securities at least equal at all times to the market value of the securities loaned. Collateral will consist of U.S. Government securities, cash equivalents or irrevocable letters of credit. The Fund may bear the risk of delay in recovery of, or loss of rights in, the securities loaned should the borrower of the securities experience financial difficulty. The Fund may also record realized gain or loss on securities deemed sold due to a borrower’s inability to return securities on loan. The Fund will receive compensation for lending its securities in the form of fees or the retention of a portion of the interest on the investment of any cash received as collateral. The Fund also will continue to receive interest and dividends on the securities loaned and any gain or loss in the market price of the
| | | | |
| mainstayinvestments.com | | | 23 | |
Notes to Financial Statements (Unaudited) (continued)
securities loaned that may occur during the term of the loan will be for the account of the Fund.
Although the Fund and New York Life Investments have temporarily suspended securities lending, the Fund and New York Life Investments reserve the right to reinstitute lending when deemed appropriate. The Fund did not have any portfolio securities on loan as of April 30, 2013.
(K) Concentration of Risk. The Fund may invest in foreign securities, which carry certain risks that are in addition to the usual risks inherent in domestic instruments. These risks include those resulting from currency fluctuations, future adverse political and economic developments and possible imposition of currency exchange blockages or other foreign governmental laws or restrictions. These risks are likely to be greater in emerging markets than in developed markets.
(L) Indemnifications. Under the Trust’s organizational documents, its officers and trustees are indemnified against certain liabilities that may arise out of performance of their duties to the Trust. Additionally, in the normal course of business, the Fund enters into contracts with third-party service providers that contain a variety of representations and warranties and which may provide general indemnifications. The Fund’s maximum exposure under these arrangements is unknown, as this would involve future claims that may be made against the Fund that have not yet occurred. Based on experience, management is of the view that the risk of loss in connection with these potential indemnification obligations is remote. However, there can be no assurance that material liabilities related to such obligations will not arise in the future, which could adversely impact the Fund.
Note 3–Fees and Related Party Transactions
(A) Manager and Subadvisor. New York Life Investments, a registered investment adviser and an indirect, wholly-owned subsidiary of New York Life Insurance Company (“New York Life”), serves as the Fund’s Manager, pursuant to an Amended and Restated Management Agreement (“Management Agreement”). The Manager provides offices, conducts clerical, recordkeeping and bookkeeping services, and keeps most of the financial and accounting records required to be maintained by the Fund. Except for the portion of salaries and expenses that are the responsibility of the Fund, the Manager pays the salaries and expenses of all personnel affiliated with the Fund and certain operational expenses of the Fund. The Fund reimburses New York Life Investments in an amount equal to a portion of the salary of the Chief Compliance Officer (“CCO”) of the Fund. Epoch Investment Partners, Inc. (‘‘Epoch’’ or “Subadvisor”), a registered investment adviser, serves as Subadvisor to the Fund and is responsible for the day-to-day portfolio management of the Fund. Pursuant to the terms of an Amended and Restated Subadvisory Agreement (“Subadvisory Agreement”) between New York Life Investments and Epoch, New York Life Investments pays for the services of the Subadvisor.
The Fund pays the Manager a monthly fee for services performed and facilities furnished at an annual rate of 1.00% of the Fund’s average daily net assets.
New York Life Investments has contractually agreed to waive a portion of the management fees and/or reimburse expenses so that Total Annual Fund Operating Expenses for Class A shares do not exceed 1.54% of its average daily net assets. New York Life Investments will
apply an equivalent waiver or reimbursement, in an equal number of basis points, to the other share classes. This agreement expires on February 28, 2014 and may only be amended or terminated prior to that date by action of the Board. Total Annual Fund Operating Expenses excludes taxes, interest, litigation, extraordinary expenses, brokerage and other transaction expenses relating to the purchase or sale of portfolio investments, and acquired (underlying) fund fees and expenses.
For the six-month period ended April 30, 2013, New York Life Investments earned fees from the Fund in the amount of $616,642.
State Street, 1 Lincoln Street, Boston, Massachusetts 02111, provides sub-administration and sub-accounting services to the Fund pursuant to an agreement with New York Life Investments. These services include calculating the daily NAVs of the Fund, maintaining the general ledger and sub-ledger accounts for the calculation of the Fund’s respective NAVs, and assisting New York Life Investments in conducting various aspects of the Fund’s administrative operations. For providing these services to the Fund, State Street is compensated by New York Life Investments.
(B) Distribution and Service Fees. The Trust, on behalf of the Fund, has entered into a distribution agreement with NYLIFE Distributors LLC (the ‘‘Distributor’’), an indirect, wholly-owned subsidiary of New York Life. The Fund has adopted distribution plans (the ‘‘Plans’’) in accordance with the provisions of Rule 12b-1 under the 1940 Act.
Pursuant to the Investor Class and Class A Plans, the Distributor receives a monthly distribution fee from Investor Class and Class A shares at an annual rate of 0.25% of the average daily net assets of the Investor Class and Class A shares for distribution and/or service activities as designated by the Distributor. Pursuant to the Class C Plan, Class C shares pay the Distributor a monthly distribution fee at an annual rate of 0.75% of the average daily net assets of the Class C shares, along with a service fee at an annual rate of 0.25% of the average daily net assets of the Class C shares, for a total 12b-1 fee of 1.00%. Class I shares are not subject to a distribution and/or service fee.
The Plans provide that the distribution and service fees are payable to the Distributor regardless of the amounts actually expended by the Distributor for distribution of the Fund’s shares and service activities.
(C) Sales Charges. The Fund was advised by the Distributor that the amount of sales charges retained on sales of Investor Class and Class A shares were $451 and $850, respectively, for the six-month period ended April 30, 2013. The Fund was also advised that the Distributor retained CDSCs on redemptions of Class A and Class C shares of $30 and $213, respectively, for the six-month period ended April 30, 2013.
(D) Transfer, Dividend Disbursing and Shareholder Servicing Agent. NYLIM Service Company LLC, an affiliate of New York Life Investments, is the Fund’s transfer, dividend disbursing and shareholder servicing agent pursuant to an agreement between NYLIM Service Company LLC and the Trust. NYLIM Service Company LLC has entered into an agreement with Boston Financial Data Services, Inc. (“BFDS”) pursuant to which BFDS performs certain transfer agent services on behalf of NYLIM Service Company LLC. Transfer agent expenses
| | |
| 24 | | MainStay Epoch Global Choice Fund |
incurred by the Fund for the six-month period ended April 30, 2013, were as follows:
| | | | |
Investor Class | | $ | 444 | |
Class A | | | 219 | |
Class C | | | 503 | |
Class I | | | 5,783 | |
(E) Small Account Fee. Shareholders with small accounts adversely impact the cost of providing transfer agency services. In an effort to reduce total transfer agency expenses, the Fund has implemented a small account fee on certain types of accounts. Certain shareholders with an account balance of less than $1,000 are charged an annual per account fee of $20 (assessed semi-annually), the proceeds from which offset transfer agent fees as reflected in the Statement of Operations.
(F) Capital. As of April 30, 2013, New York Life and its affiliates beneficially held shares of the Fund with values and percentages of net assets as follows:
| | | | | | | | |
Investor Class | | $ | 33,851 | | | | 7.7 | % |
Class C | | | 32,984 | | | | 7.1 | |
Note 4–Federal Income Tax
Under the Regulated Investment Company Modernization Act of 2010, the Fund is permitted to carry forward capital losses incurred in taxable years beginning after December 22, 2010, for an unlimited period. However, any losses incurred during those future years will be required to be utilized prior to the losses incurred in pre-enactment tax years. As a result of this ordering rule, pre-enactment capital loss carryforwards may be more likely to expire unused. Additionally, post-enactment capital losses that are carried forward will retain their character as either short-term or long-term capital losses rather than being considered all short-term as under previous law.
As of October 31, 2012, for federal income tax purposes, capital loss carryforwards of $5,571,312 were available as shown in the table below, to the extent provided by the regulations to offset future realized gains of the Fund through the years indicated. To the extent that these capital loss carryforwards are used to offset future capital gains, it is probable that the capital gains so offset will not be distributed to shareholders. No capital gain distributions shall be made until any capital loss carryforwards have been fully utilized or expired.
| | | | | | | | |
Capital Loss
Available Through | | Short-Term
Capital Loss
Amounts (000’s) | | | Long-Term
Capital Loss
Amounts (000’s) | |
2017
2018 | | $
| 539
5,032 |
| | $
| —
— |
|
| Total | | $ | 5,571 | | | $ | — | |
The tax character of distributions paid during the year ended October 31, 2012, shown in the Statements of Changes in Net Assets was as follows:
| | | | |
| | | 2012 | |
Distributions paid from: | | | | |
Ordinary Income | | $ | 210,998 | |
Note 5–Custodian
State Street is the custodian of the cash and the securities of the Fund. Custodial fees are charged to the Fund based on the market value of securities in the Fund and the number of certain cash transactions incurred by the Fund.
Note 6–Line of Credit
The Fund and certain affiliated funds maintain a line of credit with a syndicate of banks in order to secure a source of funds for temporary purposes to meet unanticipated or excessive redemption requests.
Effective August 29, 2012, under a second amended and restated credit agreement (the “Credit Agreement”), the aggregate commitment amount is $200,000,000 with an optional maximum amount of $250,000,000. The commitment fee is an annual rate of 0.08% of the average commitment amount payable quarterly, regardless of usage, to Bank of New York Mellon, which serves as the agent to the syndicate. The commitment fee is allocated among the Fund and certain affiliated funds based upon net assets and other factors. Interest on any revolving credit loan is charged based upon the Federal Funds Advances rate or the one month London InterBank Offered Rate, whichever is higher. The Credit Agreement expires on August 28, 2013, although the Fund, certain affiliated funds and the syndicate of banks may renew the Credit Agreement for an additional year on the same or different terms. There were no borrowings made or outstanding with respect to the Fund on the Credit Agreement during the six-month period ended April 30, 2013.
Note 7–Purchases and Sales of Securities (in 000’s)
During the six-month period ended April 30, 2013, purchases and sales of securities, other than short-term securities, were $125,876 and $74,098, respectively.
Note 8–Capital Share Transactions
| | | | | | | | |
Investor Class | | Shares | | | Amount | |
Six-month period ended April 30, 2013: | | | | | | | | |
Shares sold | | | 6,907 | | | $ | 119,649 | |
Shares issued to shareholders in reinvestment of dividends | | | 6 | | | | 94 | |
Shares redeemed | | | (1,428 | ) | | | (24,689 | ) |
| | | | | | | | |
Net increase (decrease) | | | 5,485 | | | $ | 95,054 | |
| | | | | | | | |
Year ended October 31, 2012: | | | | | | | | |
Shares sold | | | 7,087 | | | $ | 108,009 | |
Shares redeemed | | | (2,788 | ) | | | (42,950 | ) |
| | | | | | | | |
Net increase (decrease) in shares outstanding before conversion | | | 4,299 | | | | 65,059 | |
Shares converted from Investor Class (See Note 1) | | | (2,727 | ) | | | (41,482 | ) |
| | | | | | | | |
Net increase (decrease) | | | 1,572 | | | $ | 23,577 | |
| | | | | | | | |
|
| |
| | | | |
| mainstayinvestments.com | | | 25 | |
Notes to Financial Statements (Unaudited) (continued)
| | | | | | | | |
Class A | | Shares | | | Amount | |
Six-month period ended April 30, 2013: | | | | | | | | |
Shares sold | | | 54,796 | | | $ | 921,976 | |
Shares issued to shareholders in reinvestment of dividends | | | 519 | | | | 8,581 | |
Shares redeemed | | | (30,721 | ) | | | (514,006 | ) |
| | | | | | | | |
Net increase (decrease) | | | 24,594 | | | $ | 416,551 | |
| | | | | | | | |
Year ended October 31, 2012: | | | | | | | | |
Shares sold | | | 62,532 | | | $ | 954,431 | |
Shares issued to shareholders in reinvestment of dividends | | | 332 | | | | 4,694 | |
Shares redeemed | | | (62,756 | ) | | | (970,557 | ) |
| | | | | | | | |
Net increase (decrease) in shares outstanding before conversion | | | 108 | | | | (11,432 | ) |
Shares converted into Class A (See Note 1) | | | 2,720 | | | | 41,482 | |
| | | | | | | | |
Net increase (decrease) | | | 2,828 | | | $ | 30,050 | |
| | | | | | | | |
|
| |
Class C | | Shares | | | Amount | |
Six-month period ended April 30, 2013: | | | | | | | | |
Shares sold | | | 5,989 | | | $ | 99,809 | |
Shares redeemed | | | (1,368 | ) | | | (22,904 | ) |
| | | | | | | | |
Net increase (decrease) | | | 4,621 | | | $ | 76,905 | |
| | | | | | | | |
Year ended October 31, 2012: | | | | | | | | |
Shares sold | | | 18,726 | | | $ | 277,760 | |
Shares redeemed | | | (1,128 | ) | | | (17,636 | ) |
| | | | | | | | |
Net increase (decrease) | | | 17,598 | | | $ | 260,124 | |
| | | | | | | | |
|
| |
| | | | | | | | |
Class I | | Shares | | | Amount | |
Six-month period ended April 30, 2013: | | | | | | | | |
Shares sold | | | 3,203,870 | | | $ | 55,208,172 | |
Shares issued to shareholders in reinvestment of dividends | | | 22,810 | | | | 385,499 | |
Shares redeemed | | | (163,217 | ) | | | (2,830,219 | ) |
| | | | | | | | |
Net increase (decrease) | | | 3,063,463 | | | $ | 52,763,452 | |
| | | | | | | | |
Year ended October 31, 2012: | | | | | | | | |
Shares sold | | | 2,257,123 | | | $ | 35,587,099 | |
Shares issued to shareholders in reinvestment of dividends | | | 14,157 | | | | 204,997 | |
Shares redeemed | | | (2,219,018 | ) | | | (34,596,229 | ) |
| | | | | | | | |
Net increase (decrease) | | | 52,262 | | | $ | 1,195,867 | |
| | | | | | | | |
Note 9–Subsequent Events
In connection with the preparation of the financial statements of the Fund as of and for the six-month period ended April 30, 2013, events and transactions subsequent to April 30, 2013, through the date the financial statements were issued have been evaluated by the Fund’s management for possible adjustment and/or disclosure. No subsequent events requiring financial statement adjustment or disclosure have been identified.
| | |
| 26 | | MainStay Epoch Global Choice Fund |
I. Board Consideration and Approval of Management Agreement and
Subadvisory Agreement (Unaudited)
Section 15(c) of the Investment Company Act of 1940, as amended (the “1940 Act”) requires that each mutual fund’s board of trustees, including a majority of the independent trustees, annually review and approve the fund’s investment advisory agreements. At its December 10-12, 2012 meeting, the Board of Trustees of the MainStay Group of Funds (“Board”) unanimously approved the Management Agreement with respect to the MainStay Epoch Global Choice Fund (“Fund”) and New York Life Investment Management LLC (“New York Life Investments”), and the Subadvisory Agreement between New York Life Investments and Epoch Investment Partners, Inc. (“Epoch”) with respect to the Fund.
In reaching its decision to approve the Agreements, the Board considered information furnished by New York Life Investments and Epoch in connection with a contract review process that took place at various meetings of the Board and its Contracts Committee between September 2012 and December 2012, as well as other relevant information furnished to the Board throughout the year by New York Life Investments and Epoch. Information requested by and furnished to the Board in connection with the contract review process included, among other items, reports on the Fund prepared by Strategic Insight Mutual Fund Research and Consulting, LLC (“Strategic Insight”), an independent third-party service provider engaged by the Board to report objectively on the Fund’s investment performance, management and subadvisory fees and ordinary operating expenses. The Board also considered information provided by New York Life Investments and Epoch on the fees charged to other investment advisory clients (including institutional separate accounts) that follow investment strategies similar to the Fund, and the rationale for any differences in the Fund’s management and subadvisory fees and the fees charged to those other investment advisory clients. In addition, the Board requested and received information on the profitability of the Fund to New York Life Investments and its affiliates and Epoch, and responses from New York Life Investments and Epoch to a series of questions encompassing a variety of topics prepared on behalf of the Board by independent legal counsel to the Board and its independent trustees (the “Independent Trustees”). Information provided to the Board at its meetings throughout the year included, among other items, detailed investment performance reports on the Fund prepared by the Investment Consulting Group at New York Life Investments. The structure and format for this regular reporting was developed in consultation with the Board. The Board also received from New York Life Investments throughout the year, among other items, periodic reports on legal and compliance matters, portfolio turnover, and sales and marketing activity.
In determining to approve the Agreements, the members of the Board reviewed and evaluated all of the information and factors they believed to be relevant and appropriate in light of legal advice furnished to them by independent legal counsel and through the exercise of their own business judgment. The broad factors considered by the Board are discussed in greater detail below, and included, among other items: (i) the nature, scope and quality of the services provided to the Fund by New York Life Investments and Epoch; (ii) the investment performance of the Fund, New York Life Investments and Epoch; (iii) the costs of the services provided, and profits realized, by New York Life Investments and Epoch from their relationship with the Fund; (iv) the extent to which economies of scale may be realized as the Fund grows, and the extent to which economies of scale may benefit Fund investors; and (v) the
reasonableness of the Fund’s management and subadvisory fees and overall total ordinary operating expenses, particularly as compared to similar funds and accounts managed by New York Life Investments and Epoch and third-party “peer funds” identified by Strategic Insight.
While individual members of the Board may have weighed certain factors differently, the Board’s decision to approve the Agreements was based on a consideration of all the information provided to the Board, including information provided to the Board throughout the year and specifically in connection with the contract review process. The Board’s conclusions with respect to the Agreements also were based, in part, on the Board’s consideration of the Agreements in prior years. In addition to considering the above-referenced factors, the Board observed that in the marketplace there are a range of investment options available to shareholders of the Fund, and that the Fund’s shareholders, having had the opportunity to consider other investment options, have chosen to invest in the Fund. A more detailed discussion of the factors that figured prominently in the Board’s decisions to approve the Agreements is provided below.
Nature, Scope and Quality of Services to Be Provided by New York Life Investments and Epoch
The Board examined the nature, scope and quality of the services that New York Life Investments provides to the Fund. The Board evaluated New York Life Investments’ experience in serving as manager of the Fund, noting that New York Life Investments manages other mutual funds, serves a variety of other investment advisory clients, including other pooled investment vehicles, and has experience with overseeing mutual fund service providers, including subadvisors. The Board considered the experience of senior personnel at New York Life Investments providing management and administrative services to the Fund, as well as New York Life Investments’ reputation and financial condition. The Board also considered the full range of non-advisory services that New York Life Investments supplies to the Fund under the terms of the Management Agreement, including: (i) fund accounting services provided by New York Life Investments’ Fund Accounting and Administration Group; (ii) investment oversight and analytical services provided by New York Life Investments’ Investment Consulting Group; (iii) compliance services provided by New York Life Investments’ compliance department, including oversight and implementation of the Fund’s compliance program; and (iv) legal services provided by New York Life Investments’ Office of the General Counsel. Additional information about the non-advisory services provided by New York Life Investments is set forth in the Fund’s Management Agreement. The Board also considered New York Life Investments’ willingness to invest in personnel that benefit the Fund, and noted that New York Life Investments is responsible for compensating the Fund’s officers. The Board also considered benefits to shareholders of being part of the MainStay Group of Funds, including the privilege of exchanging investments between the same class of shares without the imposition of a sales charge, as described more fully in the Fund’s prospectus.
The Board also examined the nature, scope and quality of the advisory services that Epoch provides to the Fund. The Board evaluated Epoch’s experience in serving as subadvisor to the Fund and managing other portfolios. It examined Epoch’s track record and experience in providing investment advisory services, the experience of investment advisory,
| | | | |
| mainstayinvestments.com | | | 27 | |
I. Board Consideration and Approval of Management Agreement and
Subadvisory Agreement (Unaudited) (continued)
senior management and administrative personnel at Epoch, and Epoch’s overall legal and compliance environment. The Board also reviewed Epoch’s willingness to invest in personnel that benefit the Fund. In this regard, the Board considered the experience of the Fund’s portfolio managers, the number of accounts managed by the portfolio managers and the method for compensating portfolio managers.
Based on these considerations, the Board concluded, within the context of its overall determinations regarding the Agreements, that the Fund should continue to benefit from the nature, scope and quality of these services as a result of New York Life Investments’ and Epoch’s experience, personnel, operations and resources.
Investment Performance
In evaluating the Fund’s investment performance, the Board considered investment performance results in light of the Fund’s investment objective, strategies and risks, as disclosed in the Fund’s prospectus. The Board particularly considered detailed investment reports on the Fund’s performance provided to the Board throughout the year by the Investment Consulting Group of New York Life Investments. These reports include, among other items, information on the Fund’s gross and net returns, the Fund’s investment performance relative to relevant investment categories and Fund benchmarks, the Fund’s risk-adjusted investment performance, and the Fund’s investment performance as compared to similar competitor funds, as appropriate. The Board also considered information provided by Strategic Insight showing the investment performance of the Fund as compared to peer funds.
In considering the Fund’s investment performance, the Board focused principally on the Fund’s long-term performance track record. The Board also gave weight to its ongoing discussions with senior management at New York Life Investments concerning the Fund’s investment performance, as well as discussions between the Fund’s portfolio managers and the Board that occur typically on an annual basis. In addition, the Board considered any specific actions that New York Life Investments or Epoch had taken, or had agreed with the Board to take, to enhance Fund investment performance, and the results of those actions.
Based on these considerations, the Board concluded, within the context of its overall determinations regarding the Agreements, that the long-term investment performance of the Fund, along with ongoing efforts by New York Life Investments and Epoch to enhance investment returns, supported a determination to approve the Agreements. The Fund discloses more information about investment performance in the Portfolio Management Discussion and Analysis, Investment and Performance Comparison and Financial Highlights sections of this Semiannual Report and in the Fund’s prospectus.
Costs of the Services Provided, and Profits Realized, by New York Life Investments and Epoch
The Board considered the costs of the services provided by New York Life Investments and Epoch under the Agreements, and the profits realized by New York Life Investments and its affiliates and Epoch due to their relationships with the Fund. Because Epoch’s subadvisory fees are negotiated at arm’s-length by New York Life Investments and are paid by New York Life Investments, not the Fund, the Board principally considered the profits realized by New York Life Investments and its affiliates with respect to the Fund.
In evaluating the costs and profits of New York Life Investments and its affiliates and Epoch, the Board considered, among other factors, each party’s investments in personnel, systems, equipment and other resources necessary to manage the Fund, and that New York Life Investments is responsible for paying the subadvisory fees for the Fund. The Board acknowledged that New York Life Investments and Epoch must be in a position to pay and retain experienced professional personnel to provide services to the Fund, and that the ability to maintain a strong financial position is important in order for New York Life Investments and Epoch to continue to provide high-quality services to the Fund. The Board also noted that the Fund benefits from the allocation of certain fixed costs across the MainStay Group of Funds.
In addition, the Board noted the difficulty in obtaining reliable comparative data about mutual fund managers’ profitability, since such information generally is not publicly available and may be impacted by numerous factors, including the structure of a fund manager’s organization, the types of funds it manages, the methodology used to allocate certain fixed costs to specific funds, and the manager’s capital structure and costs of capital. While recognizing the difficulty in evaluating a manager’s profitability with respect to the Fund, and noting that other profitability methodologies may also be reasonable, the Board concluded that the profitability methodology presented by New York Life Investments to the Board, which was developed by New York Life Investments in consultation with an independent consultant, was reasonable in all material respects.
In considering the costs and profitability of the Fund, the Board also considered certain fall-out benefits that may be realized by New York Life Investments and its affiliates due to their relationships with the Fund. The Board recognized, for example, the benefits to Epoch from legally permitted “soft-dollar” arrangements by which brokers provide research and other services to Epoch in exchange for commissions paid by the Fund with respect to trades on the Fund’s portfolio securities. The Board also requested and received information from New York Life Investments and Epoch concerning other business relationships between Epoch and its affiliates and New York Life Investments and its affiliates.
The Board further considered that, in addition to fees earned by New York Life Investments for managing the Fund, New York Life Investments’ affiliates also earn revenues from serving the Fund in various other capacities, including as the Fund’s transfer agent and distributor. The Board observed that information about these other revenues, and their impact on the profitability of the Fund to New York Life Investments and its affiliates, was furnished to the Board as part of the 15(c) process. The Board noted that, although it assessed the overall profitability of the Fund to New York Life Investments and its affiliates as part of the contract review process, when considering the reasonableness of the fees to be paid to New York Life Investments and its affiliates under the Agreements, the Board considered the profitability of New York Life Investments’ relationship with the Fund on a pre-tax basis, and without regard to distribution expenses.
After evaluating the information presented to the Board, the Board concluded, within the context of its overall determinations regarding the Agreements, that any profits realized by New York Life Investments and its affiliates due to their relationships with the Fund supported the Board’s decision to approve the Agreements. With respect to Epoch, the
| | |
| 28 | | MainStay Epoch Global Choice Fund |
Board concluded that any profits realized by Epoch due to its relationship with the Fund are the result of arm’s-length negotiations between New York Life Investments and Epoch, and are based on fees paid to Epoch by New York Life Investments, not the Fund.
Extent to Which Economies of Scale May Be Realized as the Fund Grows
The Board also considered whether the Fund’s expense structure permitted economies of scale to be shared with Fund investors. The Board reviewed information from New York Life Investments showing how the Fund’s management fee schedule compared to fee schedules of other funds and accounts managed by New York Life Investments. The Board also reviewed information from Strategic Insight showing how the Fund’s management fee schedule hypothetically would compare with fees paid for similar services by peer funds at varying asset levels. While recognizing the difficulty of determining economies of scale with precision, the Board acknowledged that economies of scale may be shared with the Fund in a number of ways, including, for example, through the imposition of management fee breakpoints and by initially setting relatively lower management fees.
Based on this information, the Board concluded, within the context of its overall determinations regarding the Agreements, that the Fund’s expense structure appropriately reflects economies of scale for the benefit of Fund investors. The Board noted, however, that it would continue to evaluate the reasonableness of the Fund’s expense structure as the Fund grows over time.
Management and Subadvisory Fees and Total Ordinary Operating Expenses
The Board evaluated the reasonableness of the fees to be paid under the Agreements and the Fund’s expected total ordinary operating expenses. The Board primarily considered the reasonableness of the management fee paid by the Fund to New York Life Investments, since the fees paid to Epoch are paid by New York Life Investments, not the Fund.
In assessing the reasonableness of the Fund’s fees and expenses, the Board primarily considered comparative data provided by Strategic Insight on the fees and expenses charged by similar mutual funds managed by other investment advisers. In addition, the Board considered information provided by New York Life Investments and Epoch on fees charged to other investment advisory clients, including institutional separate accounts and other funds with similar investment objectives as the Fund. The Board particularly considered differences in the contractual management fee schedules of the retail MainStay Funds and similarly-managed MainStay VP Portfolios, taking into account New York Life Investments’ rationale for any differences in fee schedules. The Board also took into account explanations provided by New York Life Investments about the different scope of services provided to mutual funds as compared with other investment advisory clients. Additionally, the Board considered the impact of any expense limitation arrangements on the Fund’s net management fee and expenses.
The Board noted that, outside of the Fund’s management fee and the fees charged under a share class’s Rule 12b-1 and/or shareholder services plans, a share class’s most significant “other expenses” are transfer agent fees. Transfer agent fees are charged to the Fund based on the
number of shareholder accounts (a “per-account” fee) as compared with certain other fees (e.g., management fees), which are charged based on the Fund’s average net assets. The Board took into account information from New York Life Investments showing that the Fund’s transfer agent fee schedule is reasonable, including industry data showing that the per-account fees that NYLIM Service Company LLC, the Fund’s transfer agent, charges the Fund are within the range of per-account fees charged by transfer agents to other mutual funds. In addition, the Board considered NYLIM Service Company LLC’s profitability in connection with the transfer agent services it provides to the Fund.
The Board acknowledged that, because the Fund’s transfer agent fees are billed on a per-account basis, the impact of transfer agent fees on a share class’s expense ratio may be more significant in cases where the share class has a high number of accounts with limited assets (i.e., small accounts). The Board observed that transfer agent fees are a significant portion of total expenses of many Funds in the MainStay Group of Funds. The impact of transfer agent fees on the expense ratios of these MainStay Funds tend to be greater than for other open-end retail funds, because the MainStay Group of Funds generally has a significant number of small accounts relative to competitor funds. The Board acknowledged the role that the MainStay Group of Funds historically has played in serving the investment needs of New York Life Insurance Company (“New York Life”) policyholders, who often maintain smaller account balances than other fund investors. The Board discussed measures that it and New York Life Investments have taken in recent years to mitigate the effect of small accounts on the expense ratios of Fund share classes, including: (i) encouraging New York Life agents to consolidate multiple small accounts held by the same investor into one MainStay Asset Allocation Fund account; (ii) increasing investment minimums from $500 to $1,000 in 2003; (iii) introducing Investor Class shares for certain MainStay Funds in early 2008 to consolidate smaller account investors; (iv) closing small accounts with balances below $250 in Investor Class shares or $750 in all other classes of shares; (v) no longer allowing an exception with no minimum investment amount with respect to AutoInvest accounts with subsequent monthly purchases of $100; (vi) since 2007, charging an annual $20.00 small account fee on certain accounts with balances below $1,000; and (vii) modifying the approach for billing transfer agent expenses to reduce the degree of subsidization by large accounts of smaller accounts. In addition, the Board acknowledged New York Life Investments’ efforts to encourage intermediaries to consolidate small accounts in multiple Funds held by the same investor into a single Asset Allocation Fund account, if appropriate under the circumstances, in an effort to mitigate the effect of small accounts on the Funds in the MainStay Group of Funds.
After considering all of the factors outlined above, the Board concluded that the Fund’s management and subadvisory fees and total ordinary operating expenses were within a range that is competitive and, within the context of the Board’s overall conclusions regarding the Agreements, support a conclusion that these fees and expenses are reasonable.
Conclusion
On the basis of the information provided to it and its evaluation thereof, the Board, including the Independent Trustees, unanimously voted to approve the Agreements.
| | | | |
| mainstayinvestments.com | | | 29 | |
II. Board Consideration and Approval of New Subadvisory Agreement (Unaudited)
At its March 21, 2013 meeting, the Board unanimously approved a new Subadvisory Agreement (the “Subadvisory Agreement”) between New York Life Investments and Epoch on behalf of the Fund that took effect on March 27, 2013. The Board was asked to approve the Subadvisory Agreement in connection with a “change in control” of Epoch and, accordingly, the termination by law and the express terms of the previous subadvisory agreement between New York Life Investments and Epoch with respect to the Fund.
On March 27, 2013, Epoch Holding Corporation (“Epoch Holding”) merged with Empire Merger Sub, Inc., a wholly-owned subsidiary of The Toronto-Dominion Bank, a Canadian chartered bank (“Epoch Holding Merger”) following the approval of Epoch Holding shareholders. As a result, Epoch Holding became a wholly-owned subsidiary of The Toronto-Dominion Bank (“TD Bank”). Epoch Holding is the parent company of Epoch Investment Partners, Inc. (“Epoch”), the Fund’s subadvisor. The closing of the Epoch Holding Merger resulted in a “change of control” of Epoch.
In reaching its decision to approve the continued retention of Epoch and the Agreement, the Board considered information presented to it by New York Life Investments, Epoch and TD Bank as part of its consideration and approval of the Agreement at the Board’s meeting in March 2013, as well as other relevant information furnished to it throughout the year by New York Life Investments and Epoch at regular and special Board meetings. The Board also requested and received responses from Epoch to a comprehensive list of questions encompassing a variety of topics prepared on behalf of the Board by independent legal counsel to the Board. The Board noted that it had also requested and received responses to similar questions in connection with its annual approval of the previous subadvisory agreement with Epoch at various meetings of the Board and its Contracts Committee between September 2012 and December 2012. The Board considered its historical experience with Epoch’s capabilities and resources, and its evaluation of Epoch in connection with previous contract review processes, including the contract review process that culminated with approval of the previous subadvisory agreement between New York Life Investments and Epoch, on behalf of the Fund (the “Prior Contract Review Processes”).
In determining to approve the continued retention of Epoch and approve the Agreement, the members of the Board reviewed and evaluated all of the information and factors they believed to be relevant and appropriate in light of legal advice furnished to them by independent legal counsel and through the exercise of their own business judgment. The broad factors considered by the Board are discussed in greater detail below, and included, among other things: (i) the nature, scope and quality of the services to be provided to the Fund by Epoch; (ii) the investment performance of the Fund; (iii) the costs of the services to be provided and the profits to be realized by Epoch and its affiliates from its relationship with the Fund; (iv) the extent to which economies of scale may be realized as the Fund grows, and the extent to which economies of scale may benefit Fund investors; and (v) the reasonableness of the Fund’s management and subadvisory fee levels and overall total ordinary operating expenses.
While the members of the Board may have weighed certain factors differently, the Board’s decision to approve the continued retention of Epoch and approve the Agreement was based on a comprehensive
consideration of all the information provided to the Board, including information provided to the Board in connection with its review of Epoch. The Board also considered that shareholders of the Fund approved the ability of New York Life Investments to act as a “manager of managers,” which allows the Board and New York Life Investments to retain unaffiliated subadvisors for the Fund without the approval of Fund shareholders. A more detailed discussion of the factors that figured prominently in the Board’s decision to approve the continued retention of Epoch and approve the Agreement is provided below.
Nature, Scope and Quality of Services to Be Provided by Epoch
In considering the approval of the continued retention of Epoch and approval of the Agreement, the Board examined the nature, scope and quality of the services that Epoch historically had provided to the Fund. Based on information provided to the Board in connection with the Prior Contract Review Processes, the Board acknowledged Epoch’s historical service to the Fund, and took note of the experience of Epoch’s portfolio managers, the number of accounts managed by the portfolio managers and Epoch’s method for compensating portfolio managers. The Board also considered the experience of senior personnel at Epoch, and Epoch’s plans for retaining key personnel in connection with the acquisition of Epoch Holding by TD Bank. Based on these considerations, the Board concluded, within the context of its overall determinations regarding the Agreement, that the Fund should continue to benefit from the nature, scope and quality of these services as a result of Epoch’s experience, personnel, operations and resources.
Investment Performance
In evaluating investment performance, the Board took note of the Fund’s historical investment performance results, as presented to the Board in connection with the Prior Contract Review Processes, in light of the Fund’s investment objectives, strategies and risks, as disclosed in the Fund’s prospectuses. The Board considered information about the Fund’s investment performance that is provided to the Board in connection with its regularly scheduled meetings, and also took note of information provided in connection with the Prior Contract Review Processes showing the investment performance of the Fund as compared to peer funds. The Board also considered the strength of Epoch’s resources (including research capabilities). Based on these considerations, the Board concluded, within the context of its overall determinations regarding the Agreement, that the retention of Epoch as subadvisor to the Fund is likely to benefit the Fund’s long-term investment performance.
Costs of the Services to Be Provided, and Profits to Be Realized, by Epoch
The Board considered the costs of the services to be provided by Epoch under the Agreement, and the profits to be realized by Epoch due to its relationship with the Fund, taking into account information provided to the Board in connection with the Prior Contract Review Processes. The Board noted that, in connection with Prior Contract Review Processes, Epoch has provided the Board with information about its profitability in connection with its relationship with the Fund. In addition, the Board considered past representations from Epoch and New York Life Investments that the subadvisory fees paid by New York Life Investments to
| | |
| 30 | | MainStay Epoch Global Choice Fund |
Epoch were the result of arm’s-length negotiations. Because Epoch’s subadvisory fees are paid by New York Life Investments, and not the Fund, the Board historically has focused principally on the profitability of the Fund to New York Life Investments and its affiliates.
In evaluating the costs of the services provided by Epoch in connection with the Prior Contract Review Processes, the Board considered, among other things, Epoch’s investments in personnel, systems, equipment and other resources necessary to manage the Fund, and the fact that New York Life Investments is responsible for paying the subadvisory fees for the Fund. The Board acknowledged that Epoch must be in a position to pay and retain experienced professional personnel to provide services to the Fund, and that Epoch’s ability to maintain a strong financial position is important in order for Epoch to provide high-quality ongoing services to the Fund and its investors.
The Board also considered certain fall-out benefits that may be realized by Epoch due to its relationship with the Fund. The Board recognized, for example, the benefits to Epoch from legally permitted “soft-dollar” arrangements by which brokers may provide research and other services to Epoch in exchange for commissions paid by the Fund with respect to trades on the Fund’s portfolio securities.
As part of the Prior Contract Review Processes, the Board requested and received information from Epoch and New York Life Investments concerning other business relationships between Epoch and its affiliates and New York Life Investments and its affiliates. The Board requested and received assurances that these other business relationships did not impact New York Life Investments’ recommendation for Epoch to serve as the Fund’s subadvisor, and that neither New York Life Investments nor its affiliates are expected to benefit in its other business relationships due to Epoch’s continued engagement as the Fund’s subadvisor.
After evaluating the information presented to the Board, the Board concluded, within the context of its overall determinations regarding the Agreement, that any profits to be realized by Epoch due to its relationship with the Fund supported the Board’s determination to approve the Agreement. The Board also concluded that any profits to be realized by Epoch will be the result of arm’s-length negotiations between New York Life Investments and Epoch, and will be based on subadvisory fees paid to Epoch by New York Life Investments, not the Fund.
Extent to Which Economies of Scale May Be Realized as the Fund Grows
The Board also considered whether the Fund’s expense structures permitted economies of scale to be shared with the Fund’s investors, taking into account information provided to the Board in connection with the Prior Contract Review Processes.
Based on this information, the Board concluded, within the context of its overall determinations regarding the Agreement, that the Fund’s expense structure appropriately reflect economies of scale for the benefit of Fund investors. The Board noted, however, that it would continue to evaluate the reasonableness of the Fund’s expense structure as the Fund grows over time.
Reasonableness of Subadvisory Fees
The Board evaluated the reasonableness of the fees to be paid under the existing management agreement with New York Life Investments and the Agreement, and the Fund’s expected total ordinary operating expenses. The Board considered that the fees to be paid to Epoch under the Agreement will be paid by New York Life Investments, not the Fund, and will result in no increase in the Fund’s expenses. In assessing the reasonableness of the Fund’s fees and expenses the Board primarily considered comparative data provided to the Board in connection with the Prior Contract Review Processes on the fees and expenses charged by similar mutual funds managed by other investment advisers. In addition, the Board considered information provided by New York Life Investments and Epoch on fees charged to other investment advisory clients, including institutional separate accounts and other funds with similar investment objectives as the Fund. In this regard, the Board took into account explanations from New York Life Investments and Epoch about the different scope of services provided to retail mutual funds as compared with other investment advisory clients. The Board also took into account the impact of any expenses limitation arrangements on the Fund’s net expenses.
After considering all of the factors outlined above, the Board concluded that the Fund’s management and subadvisory fees and total ordinary operating expenses were within a range that is competitive and, within the context of the Board’s overall conclusions regarding the Agreement, support a conclusion that these fees and expenses are reasonable.
Conclusion
On the basis of the information provided to it and its evaluation thereof, the Board, including the Independent Trustees, unanimously voted to approve the Agreement.
| | | | |
| mainstayinvestments.com | | | 31 | |
Proxy Voting Policies and Procedures and Proxy Voting Record
A description of the policies and procedures that New York Life Investments uses to vote proxies related to the Fund’s securities is available without charge, upon request, (i) by visiting the Fund’s website at mainstayinvestments.com; and (ii) on the SEC’s website at www.sec.gov.
The Fund is required to file with the SEC its proxy voting records for the 12-month period ending June 30 on Form N-PX. The Fund’s most recent Form N-PX or proxy voting record is available free of charge upon request by calling 800-MAINSTAY (624-6782); visiting the Fund’s website at mainstayinvestments.com; or on the SEC’s website at www.sec.gov.
Shareholder Reports and Quarterly Portfolio Disclosure
The Fund is required to file its complete schedule of portfolio holdings with the SEC for its first and third fiscal quarters on Form N-Q. The Fund’s Form N-Q is available without charge, on the SEC’s website at www.sec.gov or by calling MainStay Investments at 800-MAINSTAY (624-6782). You also can obtain and review copies of Form N-Q by visiting the SEC’s Public Reference Room in Washington, DC (information on the operation of the Public Reference Room may be obtained by calling 1-800-SEC-0330).
| | |
| 32 | | MainStay Epoch Global Choice Fund |
This page intentionally left blank
This page intentionally left blank
MainStay Funds
MainStay offers a wide range of Funds for virtually any investment need. The full array of MainStay open-end offerings is listed here, with information about the manager, subadvisors, legal counsel and independent registered public accounting firms.
Equity
U.S. Equity Funds
MainStay Common Stock Fund
MainStay Cornerstone Growth Fund
MainStay Epoch U.S. All Cap Fund
MainStay Epoch U.S. Equity Yield Fund
MainStay ICAP Equity Fund
MainStay ICAP Select Equity Fund
MainStay Large Cap Growth Fund1
MainStay MAP Fund
MainStay S&P 500 Index Fund
MainStay U.S. Equity Opportunities Fund
MainStay U.S. Small Cap Fund
International/Global Equity Funds
MainStay Epoch Global Choice Fund
MainStay Epoch Global Equity Yield Fund
MainStay Epoch International Small Cap Fund
MainStay ICAP Global Fund
MainStay ICAP International Fund
MainStay International Equity Fund
MainStay International Opportunities Fund
Income
Taxable Bond Funds
MainStay Floating Rate Fund
MainStay Global High Income Fund
MainStay Government Fund
MainStay High Yield Corporate Bond Fund
MainStay High Yield Opportunities Fund
MainStay Indexed Bond Fund
MainStay Intermediate Term Bond Fund
MainStay Short Duration High Yield Fund
MainStay Short Term Bond Fund
MainStay Unconstrained Bond Fund
Municipal Bond Funds
MainStay California Tax Free Opportunities Fund2
MainStay High Yield Municipal Bond Fund
MainStay New York Tax Free Opportunities Fund3
MainStay Tax Free Bond Fund
Money Market Fund
MainStay Money Market Fund
Mixed Asset
MainStay Balanced Fund
MainStay Convertible Fund
MainStay Income Builder Fund
MainStay Marketfield Fund
Asset Allocation/Target Date
MainStay Conservative Allocation Fund
MainStay Growth Allocation Fund
MainStay Moderate Allocation Fund
MainStay Moderate Growth Allocation Fund
MainStay Retirement 2010 Fund
MainStay Retirement 2020 Fund
MainStay Retirement 2030 Fund
MainStay Retirement 2040 Fund
MainStay Retirement 2050 Fund
Manager
New York Life Investment Management LLC
New York, New York
Subadvisors
Cornerstone Capital Management Holdings LLC4
New York, New York
Cornerstone Capital Management LLC4
Bloomington, Minnesota
Epoch Investment Partners, Inc.
New York, New York
Institutional Capital LLC4
Chicago, Illinois
MacKay Shields LLC4
New York, New York
Marketfield Asset Management LLC
New York, New York
Markston International LLC
White Plains, New York
Winslow Capital Management LLC
Minneapolis, Minnesota
Legal Counsel
Dechert LLP
Independent Registered Public Accounting Firms
KPMG LLP
PricewaterhouseCoopers LLP
1. Effective January 13, 2012, the Fund was closed to new investors with certain exceptions.
2. This Fund is only registered for sale in AZ, CA, NV, OR, UT, and WA.
3. This Fund is only registered for sale in CT, DE, FL, MA, NJ, NY, and VT.
4. An affiliate of New York Life Investment Management LLC.
Not part of the Semiannual Report
For more information
800-MAINSTAY (624-6782)
mainstayinvestments.com
The MainStay Funds® are managed by New York Life Investment Management LLC and distributed through NYLIFE Distributors LLC, 169 Lackawanna Avenue, Parsippany, NJ 07054, a wholly owned subsidiary of New York Life Insurance Company. NYLIFE Distributors LLC is a Member FINRA/SIPC.
MainStay Investments® is a registered service mark and name under which New York Life Investment Management LLC does business. MainStay Investments, an indirect subsidiary of New York Life Insurance Company, New York, NY 10010, provides investment advisory products and services.
This report may be distributed only when preceded or accompanied by a current Fund prospectus.
©2013 NYLIFE Distributors LLC. All rights reserved.
| | | | | | | | |
| Not FDIC/NCUA Insured | | Not a Deposit | | May Lose Value | | No Bank Guarantee | | Not Insured by Any Government Agency |
| | |
| NYLIM-30137 MS175-13 | | MSEGC10-06/13 NL0F2 |
MainStay Epoch Global Equity Yield Fund
Message from the President and Semiannual Report
Unaudited | April 30, 2013


This page intentionally left blank
Message from the President
The U.S. stock market advanced during the six months ended April 30, 2013, generally providing double-digit returns at all capitalization levels. Value stocks tended to outpace growth stocks among large- and mid-capitalization companies, while growth stocks tended to outpace value stocks among smaller companies.
The market’s advance, however, was far from uniform. Stocks declined in early November, both before and immediately after the U.S. presidential election. Following a sharp recovery, stocks climbed until mid-December, when a Congressional stalemate on the fiscal cliff led to a brief decline. Another dip occurred in late February as investors speculated that the Federal Open Market Committee (FOMC) might stop purchasing mortgage-backed securities sooner than expected. Stocks also dipped in mid-April, as consumer sentiment dropped after the Boston marathon bombing. Despite these setbacks, U.S. stocks continued to trend upward during the six-month reporting period.
International stock markets also advanced, with several regional differences. Accommodative action by the Bank of Japan helped lower the yen and lift Japanese stocks to their highest levels since 2008. In Europe, stocks did well until early February, bolstered by the promise of support for the euro. As the year progressed, however, economic contraction, rising unemployment and systematic banking concerns took a toll on investor enthusiasm. In China, manufacturing slowed as the nation sought to balance growth and inflation risks. On the Korean peninsula, tensions rose as North Korea continued to threaten its neighbors, which added an undercurrent of caution to the market.
During the six months ended April 30, 2013, the FOMC kept the federal funds rate in a range close to zero. The FOMC also continued its direct purchases of mortgage-backed securities and longer-term U.S. government securities. With short-term interest rates likely to remain at low levels, many bond investors pursued higher yields by lengthening maturities and assuming greater risk. As a result, bonds with higher risk profiles tended
to outperform higher-quality investment-grade bonds and U.S. Treasury securities. Cash and cash equivalents essentially returned zero.
With wide variations in the performance of various asset classes, some investors might be tempted to chase higher returns by shifting back and forth between stocks and bonds. Since no one can predict where the market will move next, however, we encourage investors to select an appropriate mix of investments for their risk tolerance and time horizon and to stick with that mix, making only minor adjustments over time.
At MainStay Funds, our portfolio managers use a similar approach. Careful security selection and thoughtful sell disciplines help them pursue the investment objectives of their respective Funds. Using the principal investment strategies outlined in the Prospectus, they focus primarily on providing long-term investment potential for our shareholders.
Has this approach proved successful? In its most recent rankings, Barron’s listed MainStay Funds as the #1 fund family over the past 10 years. We were also the only mutual fund family that has appeared in Barron’s top six for the past five consecutive years.
The pages that follow provide additional insight into the specific market events, investment decisions and securities that shaped your MainStay Fund(s) during the six months ended April 30, 2013. We encourage you to read the semiannual report(s) carefully and to evaluate your results with your long-term financial goals in mind.
Sincerely,

Stephen P. Fisher
President
The opinions expressed are as of the date of this report and are subject to change. There is no guarantee that any forecast made will come to pass. This material does not constitute investment advice and is not intended as an endorsement of any specific investment.
To qualify for the Lipper/Barron’s Fund Survey, a fund family must have at least three funds in Lipper’s general U.S.-stock category, one in world equity (which combines global and international funds), one mixed-equity fund (which holds stocks and bonds), two taxable-bond funds, and one tax-exempt fund. Fund loads and 12b-1 fees aren’t included in the calculation of returns because the aim is to measure the manager’s skill. Each fund’s return is measured against all funds in its Lipper category, resulting in a percentile ranking which is then weighted by asset size relative to the fund family’s other assets in its general classifications. Finally, the score is multiplied by the general classification weightings as determined by the entire Lipper universe of funds.
Source: Barron’s, 2/9/13. Overall, MainStay Funds ranked number 56 for the one-year period, 20 for the five-year period and one for the 10-year period ended December 31, 2012, out of 62, 53 and 46 fund families, respectively. MainStay ranked number three for the 10-year period in 2009, 2010 and 2011 from among 48, 46 and 45 fund families, respectively. MainStay ranked number six from among 48 fund families for the 10-year period in 2008. Past performance is no guarantee of future results, which will vary. For the most recent MainStay Funds performance, please visit our website at mainstayinvestments.com. All mutual funds are subject to market risk and will fluctuate in value.
Not part of the Semiannual Report
Table of Contents
Investors should refer to the Fund’s Summary Prospectus and/or Prospectus and consider the Fund’s investment objectives, strategies, risks, charges and expenses carefully before investing. The Summary Prospectus and/or Prospectus contain this and other information about the Fund. You may obtain copies of the Fund’s Summary Prospectus, Prospectus and Statement of Additional Information free of charge, upon request, by calling toll-free 800-MAINSTAY (624-6782), by writing to NYLIFE Distributors LLC, Attn: MainStay Marketing Department, 169 Lackawanna Avenue, Parsippany, New Jersey 07054 or by sending an e-mail to MainStayShareholderServices@nylim.com. These documents are also available via the MainStay Funds’ website at mainstayinvestments.com/documents. Please read the Summary Prospectus and/or Prospectus carefully before investing.
Investment and Performance Comparison1 (Unaudited)
Performance data quoted represents past performance. Past performance is no guarantee of future results. Because of market volatility, current performance may be lower or higher than the figures shown. Investment return and principal value will fluctuate, and as a result, when shares are redeemed, they may be worth more or less than their original cost. The graph below depicts the historical performance of Class I shares of the Fund. Performance will vary from class to class based on differences in class-specific expenses and sales charges. For performance information current to the most recent month-end, please call 800-MAINSTAY (624-6782) or visit mainstayinvestments.com.
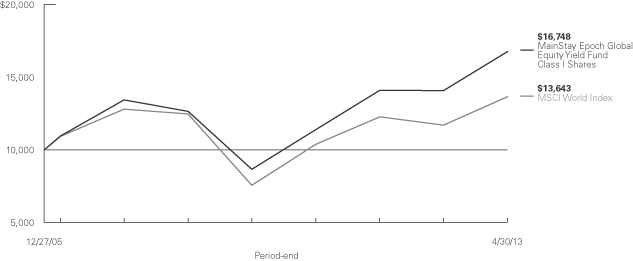
Average Annual Total Returns for the Period Ended April 30, 2013
| | | | | | | | | | | | | | | | | | | | | | | | |
| Class | | Sales Charge | | | | Six Months | | | One Year | | | Five Years | | | Since
Inception
(12/27/05) | | | Gross
Expense
Ratio2 | |
| Investor Class Shares3 | | Maximum 5.5% Initial Sales Charge | | With sales charges Excluding sales charges | |
| 8.51
14.83 | %
| |
| 12.22
18.75 | %
| |
| 4.37
5.55 | %
| |
| 6.29
7.11 | %
| |
| 1.13
1.13 | %
|
| Class | | Sales Charge | | | | Six Months | | | One Year | | | Five Years | | | Since
Inception
(8/2/06) | | | Gross
Expense
Ratio2 | |
| Class A Shares4 | | Maximum 5.5% Initial Sales Charge | | With sales charges Excluding sales charges | |
| 8.45
14.76 | %
| |
| 12.21
18.75 | %
| |
| 4.34
5.53 | %
| |
| 5.41
6.30 | %
| |
| 1.13
1.13 | %
|
| Class | | Sales Charge | | | | Six Months | | | One Year | | | Five Years | | | Since
Inception
(12/27/05) | | | Gross
Expense
Ratio2 | |
| Class C Shares3 | | Maximum 1% CDSC if Redeemed Within One Year of Purchase | | With sales charges Excluding sales charges | |
| 13.28
14.28 | %
| |
| 16.86
17.86 | %
| |
| 4.76
4.76 | %
| |
| 6.23
6.23 | %
| |
| 1.88
1.88 | %
|
| Class | | Sales Charge | | | | Six Months | | | One Year | | | Five Years | | | Since
Inception
(12/27/05) | | | Gross
Expense
Ratio2 | |
| Class I Shares4 | | No Sales Charge | | | | | 14.92 | % | | | 19.05 | % | | | 5.78 | % | | | 7.27 | % | | | 0.88 | % |
| 1. | The performance table and graph do not reflect the deduction of taxes that a shareholder would pay on dividends, distributions or Fund share redemptions. Total returns reflect maximum applicable sales charges as indicated in the table above, changes in share price, and reinvestment of dividend and capital gain distributions. The graph assumes the initial investment amount shown above and reflects the deduction of all sales charges that would have applied for the period of investment. Performance figures reflect certain fee waivers and/or expense limitations, without which total returns may have been lower. For more information on share classes and current fee waivers and/or expense limitations, please refer to the notes to the financial statements. |
| 2. | The gross expense ratios presented reflect the Fund’s “Total Annual Fund Operating Expenses” from the most recent Prospectus and may differ from other expense ratios disclosed in this report. |
| 3. | Performance figures for Investor Class and Class C shares, first offered on November 16, 2009, include the historical performance of Class I shares from December 27, 2005 through November 15, 2009, adjusted for differences in certain expenses and fees. Unadjusted, the performance shown for Investor Class and Class C shares would likely have been different. |
| 4. | Performance figures for Class I shares and Class A shares include the historical performance of the Institutional shares from December 27, 2005 |
The footnotes on the next page are an integral part of the table and graph and should be carefully read in conjunction with them.
| | | | |
| mainstayinvestments.com | | | 5 | |
| | | | | | | | | | | | | | | | |
| Benchmark Performance | | Six
Months | | | One
Year | | | Five
Years | | | Since
Inception
of the Fund | |
MSCI World Index5 | | | 14.67 | % | | | 16.70 | % | | | 1.81 | % | | | 4.32 | % |
Average Lipper Global Multi-Cap Value Fund6 | | | 14.64 | | | | 16.39 | | | | 2.40 | | | | 3.94 | |
| | and the Class P shares from August 2, 2006, respectively, of the Epoch Global Equity Shareholder Yield Fund (the predecessor to the Fund) through November 15, 2009. The Epoch Global Equity Shareholder Yield Fund was subject to a different fee structure and was advised by Epoch Investment Partners, Inc. |
| 5. | The MSCI World Index is a free float-adjusted market capitalization weighted index that is designed to measure the equity market performance of developed markets. The MSCI World Index is the Fund’s broad-based securities market index for comparison purposes. Total returns assume reinvestment of all dividends and capital gains. An investment cannot be made directly in an index. |
| 6. | The average Lipper global multi-cap value fund is representative of funds that, by portfolio practice, invest in a variety of market capitalization ranges without concentrating 75% of their equity assets in any one market capitalization range over an extended period of time. Global multi-cap value funds typically have a below-average price-to-cash flow ratio, price-to-book ratio, and three-year sales-per-share growth value compared to the S&P/Citigroup BMI. This benchmark is a product of Lipper Inc. Lipper Inc. is an independent monitor of fund performance. Results are based on total returns with all dividend and capital gain distributions reinvested. |
The footnotes on the preceding page are an integral part of the table and graph and should be carefully read in conjunction with them.
| | |
| 6 | | MainStay Epoch Global Equity Yield Fund |
Cost in Dollars of a $1,000 Investment in MainStay Epoch Global Equity Yield Fund (Unaudited)
The example below is intended to describe the fees and expenses borne by shareholders during the six-month period from November 1, 2012, to April 30, 2013, and the impact of those costs on your investment.
Example
As a shareholder of the Fund, you incur two types of costs: (1) transaction costs, including exchange fees and sales charges (loads) on purchases (as applicable), and (2) ongoing costs, including management fees, distribution and/or service (12b-1) fees, and other Fund expenses (as applicable). This example is intended to help you understand your ongoing costs (in dollars) of investing in the Fund and to compare these costs with the ongoing costs of investing in other mutual funds. The example is based on an investment of $1,000 made at the beginning of the six-month period and held for the entire period from November 1, 2012, to April 30, 2013.
This example illustrates your Fund’s ongoing costs in two ways:
Actual Expenses
The second and third data columns in the table below provide information about actual account values and actual expenses. You may use the information in these columns, together with the amount you invested, to estimate the expenses that you paid during the six months ended April 30, 2013. Simply divide your account value by $1,000 (for example, an $8,600 account value divided by $1,000 = 8.6), then
multiply the result by the number under the heading entitled “Expenses Paid During Period” to estimate the expenses you paid on your account during this period.
Hypothetical Example for Comparison Purposes
The fourth and fifth data columns in the table below provide information about hypothetical account values and hypothetical expenses based on the Fund’s actual expense ratio and an assumed rate of return of 5% per year before expenses, which is not the Fund’s actual return. The hypothetical account values and expenses may not be used to estimate the actual ending account balances or expenses you paid for the six-month period shown. You may use this information to compare the ongoing costs of investing in the Fund with the ongoing costs of investing in other Funds. To do so, compare this 5% hypothetical example with the 5% hypothetical examples that appear in the shareholder reports of the other Funds.
Please note that the expenses shown in the table are meant to highlight your ongoing costs only and do not reflect any transactional costs, such as exchange fees or sales charges (loads). Therefore, the fourth and fifth data columns of the table are useful in comparing ongoing costs only and will not help you determine the relative total costs of owning different funds. In addition, if these transactional costs were included, your costs would have been higher.
| | | | | | | | | | | | | | | | | | | | |
| | | | | | | | | | | | | | | | |
| Share Class | | Beginning
Account
Value
11/1/12 | | | Ending Account
Value (Based
on Actual
Returns and
Expenses)
4/30/13 | | | Expenses
Paid
During
Period1 | | | Ending Account
Value (Based
on Hypothetical
5% Annualized
Return and
Actual Expenses)
4/30/13 | | | Expenses
Paid
During
Period1 | |
| | | | | |
| Investor Class Shares | | $ | 1,000.00 | | | $ | 1,148.30 | | | $ | 5.81 | | | $ | 1,019.40 | | | $ | 5.46 | |
| | | | | |
| Class A Shares | | $ | 1,000.00 | | | $ | 1,147.60 | | | $ | 5.64 | | | $ | 1,019.50 | | | $ | 5.31 | |
| | | | | |
| Class C Shares | | $ | 1,000.00 | | | $ | 1,142.80 | | | $ | 9.78 | | | $ | 1,015.70 | | | $ | 9.20 | |
| | | | | |
| Class I Shares | | $ | 1,000.00 | | | $ | 1,149.20 | | | $ | 4.32 | | | $ | 1,020.80 | | | $ | 4.06 | |
| 1. | Expenses are equal to the Fund’s annualized expense ratio of each class (1.09% for Investor Class, 1.06% for Class A, 1.84% for Class C and 0.81% for Class I) multiplied by the average account value over the period, divided by 365 and multiplied by 181 (to reflect the six-month period). The table above represents the actual expenses incurred during the six-month period. |
| | | | |
| mainstayinvestments.com | | | 7 | |
Country Composition as of April 30, 2013 (Unaudited)
| | | | |
| United States | | | 51.2 | % |
| United Kingdom | | | 18.7 | |
| Germany | | | 6.5 | |
| France | | | 5.7 | |
| Switzerland | | | 5.1 | |
| Canada | | | 3.6 | |
| Australia | | | 2.1 | |
| Netherlands | | | 1.6 | |
| | | | |
| Italy | | | 1.5 | % |
| Norway | | | 0.7 | |
| Belgium | | | 0.7 | |
| Taiwan | | | 0.6 | |
| Sweden | | | 0.6 | |
| Philippines | | | 0.6 | |
| Other Assets, Less Liabilities | | | 0.8 | |
| | | | |
| | | 100.0 | % |
| | | | |
See Portfolio of Investments beginning on page 11 for specific holdings within these categories.
Top Ten Holdings as of April 30, 2013 (excluding short-term investment)
| 5. | Verizon Communications, Inc. |
| 9. | Imperial Tobacco Group PLC |
| | |
| 8 | | MainStay Epoch Global Equity Yield Fund |
Portfolio Management Discussion and Analysis (Unaudited)
Questions answered by portfolio managers Eric Sappenfield, Michael Welhoelter, CFA, and William Priest, CFA, of Epoch Investment Partners, Inc., the Fund’s Subadvisor.
How did MainStay Epoch Global Equity Yield Fund perform relative to its peers and its benchmark for the six months ended April 30, 2013?
Excluding all sales charges, MainStay Epoch Global Equity Yield Fund returned 14.83% for Investor Class shares, 14.76% for Class A shares and 14.28% for Class C shares for the six months ended April 30, 2013. Over the same period, Class I shares returned 14.92%. Investor Class, Class A and Class I shares outperformed—and Class C shares underperformed—the 14.64% return of the average Lipper1 global multi-cap value fund and the 14.67% return of the MSCI World Index2 for the six months ended April 30, 2013. The MSCI World Index is the Fund’s broad-based securities-market index. See page 5 for Fund returns with applicable sales charges.
What factors affected the Fund’s relative performance during the reporting period?
The Fund provided strong absolute returns that reflected growth in cash flows and shareholder yield (dividends, share buybacks and debt reduction) from the Fund’s holdings. The Fund’s absolute performance was also supported by the global rally in equities.
Relative to the MSCI World Index, the Fund’s emphasis on sustainable shareholder yield was a positive factor in an environment where market gains were led by defensive companies with strong shareholder-yield characteristics. Relative returns were hurt by having no exposure to Japan, which had the highest returns among developed markets. The rapid advance of Japanese stocks came on the back of aggressive monetary policies put in place by Japan’s central bank.
During the reporting period, which sectors were the strongest contributors to the Fund’s relative performance and which sectors were particularly weak?
The strongest positive contributors to the Fund’s performance relative to the MSCI World Index were the materials, information technology and health care sectors. (Contributions take weightings and total returns into account.) The Fund had less exposure than the Index to materials and information technology companies. This enhanced relative results, as these sectors had among the weakest returns during the reporting period. Even so, the Fund’s holdings in the materials, information technology and health care sectors advanced more than sector-related positions in the MSCI World Index.
The Fund’s relative results were hindered by the consumer discretionary and financials sectors. While all but one of the Fund’s consumer discretionary holdings had a positive return, the Fund’s consumer discretionary stocks did not appreciate as
fast as the sector as a whole. Having less exposure than the MSCI World Index to financials also hampered returns. The Fund’s cash position was also a drag on relative results in a fast-rising market.
During the reporting period, which individual stocks made the strongest positive contributions to the Fund’s absolute performance and which stocks detracted the most?
The strongest positive contributors to the Fund’s absolute performance were pharmaceutical maker Roche, health and hygiene company Kimberly-Clark and reinsurance company Munich Re. Roche delivered a strong 2012 earnings report at the end of January. For the year, Roche generated a 19% increase in free cash flow. The company said it expected continued growth in earnings and sales in 2013 and announced a dividend increase. Roche has now raised its dividend annually for 26 consecutive years. Over the past 10 years, Roche’s dividend has grown at a 17.6% compound annual rate. Kimberly-Clark reported strong international sales and improved its profit margins. The company has an attractive share buyback program and increased its dividend. Munich Re benefited from cyclically stronger reinsurance pricing.
During the reporting period, the most significant detractors from the Fund’s absolute performance were media company Pearson, communication technology company Pitney Bowes and financial exchange operator NYSE Euronext. Pearson reported disappointing full-year results, driven by weakness in the North American education business. The North American education business continues to be pressured by the overall macro environment and public spending cuts. Pearson also announced a restructuring plan that may be strategically sensible for the long term. Nevertheless, we believe that the plan is likely to weigh on profit and cash flow growth over the next couple of years. We sold the Fund’s position in Pitney Bowes, which provides hardware, software and services for physical and digital communications, as the company continued to see pressure on its core businesses. The company’s priorities for capital allocation also became unclear. NYSE Euronext provided disappointing operating results, which reduced our confidence in the company’s ability to continue to return attractive levels of cash to shareholders. We exited the position.
Did the Fund make any significant purchases or sales during the reporting period?
The Fund purchased Centrica, an integrated utility company based in the U.K. Centrica not only supplies natural gas and electricity to its residential and business customers, but it also explores for and produces natural gas. We believe that Centrica
| 1. | See footnote on page 6 for more information on Lipper Inc. |
| 2. | See footnote on page 6 for more information on the MSCI World Index. |
| | | | |
| mainstayinvestments.com | | | 9 | |
has ample free cash flow to sufficiently cover its dividend and share buyback program. The Fund also purchased Health Care REIT, which operates a growing portfolio of medical office buildings. The company has a large dividend yield and plans on reducing debt.
In addition to selling Pitney Bowes and NYSE Euronext, we exited the Fund’s position in Diebold, a maker of ATMs. We sold the stock on the view that earnings and cash flows were being hurt by an accelerated slowdown among U.S. regional banks.
In January 2013, Abbott Laboratories split itself into two companies: Abbott Laboratories (a global health care company) and AbbVie (the biotechnology and pharmaceutical part of the business.) The Fund’s position in Abbott Laboratories was also split into two parts, but AbbVie has a higher dividend commitment to its shareholders. We sold the Fund’s position in Abbott Laboratories, which has a lower dividend payment but a higher growth component.
How did the Fund’s sector weightings change during the reporting period?
The Fund’s sector weightings are the result of buying and selling individual stocks. The largest shifts during the reporting
period were an increase in the utilities sector and decreases in the consumer discretionary and consumer staples sectors.
How was the Fund positioned at the end of April 2013?
As of April 30, 2013, the Fund had more exposure than the MSCI World Index to the utilities and telecommunication services sectors, where an abundance of companies not only generate strong cash flows but also—as part of their capital-allocation decisions—emphasize returning capital to shareholders.
As of the same date, the Fund remained vastly underweight relative to the MSCI World Index in the financials sector, which constitutes more than one-quarter of the Index. Many of the larger financials, especially banks, were forced to cut dividends and issue new stock during the financial crisis. Many of these same banks continue to have their dividends restricted by regulators. These companies are still in the process of using cash to fortify their capital bases rather than providing shareholder yield. As a result, they are not appropriate candidates for the Fund at this time.
The opinions expressed are those of the portfolio managers as of the date of this report and are subject to change. There is no guarantee that any forecast made will come to pass. This material does not constitute investment advice and is not intended as an endorsement of any specific investment.
| | |
| 10 | | MainStay Epoch Global Equity Yield Fund |
Portfolio of Investments April 30, 2013 (Unaudited)
| | | | | | | | |
| | |
Shares | | |
Value | |
| | | | | | | | |
| Common Stocks 96.5%† | |
Australia 2.1% | | | | | | | | |
Telstra Corp., Ltd. (Diversified Telecommunication Services) | | | 5,432,000 | | | $ | 28,044,151 | |
Westpac Banking Corp. (Commercial Banks) | | | 586,202 | | | | 20,540,792 | |
| | | | | | | | |
| | | | | | | 48,584,943 | |
| | | | | | | | |
Belgium 0.7% | | | | | | | | |
Anheuser-Busch InBev N.V. (Beverages) | | | 166,200 | | | | 15,813,875 | |
| | | | | | | | |
| | |
Canada 3.6% | | | | | | | | |
¨BCE, Inc. (Diversified Telecommunication Services) | | | 887,000 | | | | 41,547,997 | |
Rogers Communications, Inc. Class B (Wireless Telecommunication Services) | | | 414,250 | | | | 20,431,865 | |
Shaw Communications, Inc. (Media) | | | 936,200 | | | | 21,317,612 | |
| | | | | | | | |
| | | | | | | 83,297,474 | |
| | | | | | | | |
France 5.7% | | | | | | | | |
Sanofi (Pharmaceuticals) | | | 190,796 | | | | 20,910,596 | |
SCOR SE (Insurance) | | | 901,100 | | | | 27,347,595 | |
Total S.A. (Oil, Gas & Consumable Fuels) | | | 609,600 | | | | 30,723,654 | |
Vinci S.A. (Construction & Engineering) | | | 586,200 | | | | 28,224,187 | |
Vivendi S.A. (Diversified Telecommunication Services) | | | 1,005,193 | | | | 22,769,178 | |
| | | | | | | | |
| | | | | | | 129,975,210 | |
| | | | | | | | |
Germany 6.5% | | | | | | | | |
BASF S.E. (Chemicals) | | | 333,500 | | | | 31,148,276 | |
Bayer A.G. (Pharmaceuticals) | | | 149,800 | | | | 15,628,457 | |
Daimler A.G. (Automobiles) | | | 594,500 | | | | 32,894,680 | |
Deutsche Post A.G. Registered (Air Freight & Logistics) | | | 452,900 | | | | 10,747,973 | |
Deutsche Telekom A.G. (Diversified Telecommunication Services) | | | 2,263,100 | | | | 26,769,868 | |
Muenchener Rueckversicherungs-Gesellschaft A.G. Registered (Insurance) | | | 161,440 | | | | 32,284,598 | |
| | | | | | | | |
| | | | | | | 149,473,852 | |
| | | | | | | | |
Italy 1.5% | | | | | | | | |
Terna S.p.A. (Electric Utilities) | | | 7,375,700 | | | | 34,521,536 | |
| | | | | | | | |
| | |
Netherlands 1.6% | | | | | | | | |
¨Royal Dutch Shell PLC, ADR (Oil, Gas & Consumable Fuels) | | | 536,300 | | | | 36,452,311 | |
| | | | | | | | |
| | |
Norway 0.7% | | | | | | | | |
Orkla ASA (Food Products) | | | 1,765,800 | | | | 15,892,659 | |
| | | | | | | | |
| | | | | | | | |
| | |
Shares | | |
Value | |
| | | | | | | | |
Philippines 0.6% | | | | | | | | |
Philippine Long Distance Telephone Co., Sponsored ADR (Wireless Telecommunication Services) | | | 175,531 | | | $ | 12,896,263 | |
| | | | | | | | |
| | |
Sweden 0.6% | | | | | | | | |
Svenska Handelsbanken AB Class A (Commercial Banks) | | | 292,600 | | | | 13,291,279 | |
| | | | | | | | |
| | |
Switzerland 5.1% | | | | | | | | |
Nestle S.A. Registered (Food Products) | | | 308,900 | | | | 22,059,540 | |
Novartis A.G. (Pharmaceuticals) | | | 319,516 | | | | 23,728,307 | |
Roche Holding A.G., Genusscheine (Pharmaceuticals) | | | 134,500 | | | | 33,617,767 | |
¨Swisscom A.G. (Diversified Telecommunication Services) | | | 81,955 | | | | 38,588,835 | |
| | | | | | | | |
| | | | | | | 117,994,449 | |
| | | | | | | | |
Taiwan 0.6% | | | | | | | | |
Taiwan Semiconductor Manufacturing Co., Ltd., Sponsored ADR (Semiconductors & Semiconductor Equipment) | | | 723,500 | | | | 13,804,380 | |
| | | | | | | | |
| | |
United Kingdom 18.7% | | | | | | | | |
AstraZeneca PLC, Sponsored ADR (Pharmaceuticals) | | | 649,450 | | | | 33,719,444 | |
BAE Systems PLC (Aerospace & Defense) | | | 5,499,900 | | | | 32,079,973 | |
British American Tobacco PLC (Tobacco) | | | 332,300 | | | | 18,406,912 | |
Centrica PLC (Multi-Utilities) | | | 4,642,500 | | | | 26,754,392 | |
Compass Group PLC (Hotels, Restaurants & Leisure) | | | 910,800 | | | | 11,983,280 | |
Diageo PLC, Sponsored ADR (Beverages) | | | 93,900 | | | | 11,474,580 | |
FirstGroup PLC (Road & Rail) | | | 4,146,100 | | | | 13,595,565 | |
¨GlaxoSmithKline PLC (Pharmaceuticals) | | | 1,412,500 | | | | 36,433,140 | |
¨Imperial Tobacco Group PLC (Tobacco) | | | 1,012,800 | | | | 36,184,352 | |
National Grid PLC (Multi-Utilities) | | | 2,251,103 | | | | 28,655,870 | |
Pearson PLC (Media) | | | 1,171,000 | | | | 21,300,169 | |
Reckitt Benckiser Group PLC (Household Products) | | | 256,300 | | | | 18,695,882 | |
Severn Trent PLC (Water Utilities) | | | 648,300 | | | | 18,338,138 | |
SSE PLC (Electric Utilities) | | | 1,275,500 | | | | 30,848,805 | |
Unilever PLC (Food Products) | | | 297,200 | | | | 12,861,724 | |
United Utilities Group PLC (Water Utilities) | | | 2,188,877 | | | | 25,177,679 | |
¨Vodafone Group PLC (Wireless Telecommunication Services) | | | 13,289,900 | | | | 40,503,260 | |
WM Morrison Supermarkets PLC (Food & Staples Retailing) | | | 2,331,050 | | | | 10,576,754 | |
| | | | | | | | |
| | | | | | | 427,589,919 | |
| | | | | | | | |
| † | Percentages indicated are based on Fund net assets. |
| ¨ | | Among the Fund’s 10 largest holdings, as of April 30, 2013, excluding short-term investment. May be subject to change daily. |
| | | | | | |
The notes to the financial statements are an integral part of,
and should be read in conjunction with, the financial statements. | | mainstayinvestments.com | | | 11 | |
Portfolio of Investments April 30, 2013 (Unaudited) (continued)
| | | | | | | | |
| | |
Shares | | |
Value | |
| | | | | | | | |
| Common Stocks (continued) | |
United States 48.5% | | | | | | | | |
AbbVie, Inc. (Pharmaceuticals) | | | 708,010 | | | $ | 32,603,861 | |
Altria Group, Inc. (Tobacco) | | | 953,700 | | | | 34,819,587 | |
Arthur J. Gallagher & Co. (Insurance) | | | 311,800 | | | | 13,235,910 | |
AT&T, Inc. (Diversified Telecommunication Services) | | | 662,355 | | | | 24,811,818 | |
Automatic Data Processing, Inc. (IT Services) | | | 198,900 | | | | 13,393,926 | |
Bristol-Myers Squibb Co. (Pharmaceuticals) | | | 408,400 | | | | 16,221,648 | |
¨CenturyLink, Inc. (Diversified Telecommunication Services) | | | 942,020 | | | | 35,391,691 | |
CME Group, Inc. (Diversified Financial Services) | | | 358,100 | | | | 21,793,966 | |
CMS Energy Corp. (Multi-Utilities) | | | 633,000 | | | | 18,952,020 | |
Coca-Cola Co. (The) (Beverages) | | | 289,000 | | | | 12,233,370 | |
Comcast Corp. Class A (Media) | | | 617,900 | | | | 24,277,291 | |
ConocoPhillips (Oil, Gas & Consumable Fuels) | | | 476,900 | | | | 28,828,605 | |
Deere & Co. (Machinery) | | | 119,400 | | | | 10,662,420 | |
Diamond Offshore Drilling, Inc. (Energy Equipment & Services) | | | 424,800 | | | | 29,353,680 | |
Dominion Resources, Inc. (Multi-Utilities) | | | 278,500 | | | | 17,177,880 | |
Dow Chemical Co. (The) (Chemicals) | | | 262,879 | | | | 8,914,227 | |
¨Duke Energy Corp. (Electric Utilities) | | | 483,197 | | | | 36,336,415 | |
E.I. du Pont de Nemours & Co. (Chemicals) | | | 332,300 | | | | 18,113,673 | |
Emerson Electric Co. (Electrical Equipment) | | | 280,800 | | | | 15,587,208 | |
Enterprise Products Partners, L.P. (Oil, Gas & Consumable Fuels) | | | 297,200 | | | | 18,025,180 | |
Health Care REIT, Inc. (Real Estate Investment Trusts) | | | 248,100 | | | | 18,600,057 | |
Honeywell International, Inc. (Aerospace & Defense) | | | 232,900 | | | | 17,127,466 | |
Integrys Energy Group, Inc. (Multi-Utilities) | | | 267,940 | | | | 16,494,386 | |
Johnson & Johnson (Pharmaceuticals) | | | 211,800 | | | | 18,051,714 | |
Kimberly-Clark Corp. (Household Products) | | | 334,300 | | | | 34,496,417 | |
Kinder Morgan Energy Partners, L.P. (Oil, Gas & Consumable Fuels) | | | 312,400 | | | | 27,631,780 | |
KLA-Tencor Corp. (Semiconductors & Semiconductor Equipment) | | | 314,800 | | | | 17,077,900 | |
Lockheed Martin Corp. (Aerospace & Defense) | | | 335,900 | | | | 33,284,331 | |
Lorillard, Inc. (Tobacco) | | | 737,900 | | | | 31,648,531 | |
MarkWest Energy Partners, L.P. (Oil, Gas & Consumable Fuels) | | | 221,100 | | | | 13,973,520 | |
Mattel, Inc. (Leisure Equipment & Products) | | | 600,350 | | | | 27,411,981 | |
McDonald’s Corp. (Hotels, Restaurants & Leisure) | | | 165,700 | | | | 16,924,598 | |
Merck & Co., Inc. (Pharmaceuticals) | | | 352,200 | | | | 16,553,400 | |
| | | | | | | | |
| | |
Shares | | |
Value | |
| | | | | | | | |
| United States (continued) | | | | | | |
Microchip Technology, Inc. (Semiconductors & Semiconductor Equipment) | | | 693,900 | | | $ | 25,271,838 | |
Microsoft Corp. (Software) | | | 547,600 | | | | 18,125,560 | |
NiSource, Inc. (Multi-Utilities) | | | 442,400 | | | | 13,594,952 | |
PepsiCo., Inc. (Beverages) | | | 155,600 | | | | 12,832,332 | |
Philip Morris International, Inc. (Tobacco) | | | 317,200 | | | | 30,321,148 | |
¨PPL Corp. (Electric Utilities) | | | 1,207,600 | | | | 40,309,688 | |
R.R. Donnelley & Sons Co. (Commercial Services & Supplies) | | | 1,132,800 | | | | 13,944,768 | |
Regal Entertainment Group Class A (Media) | | | 971,280 | | | | 17,424,763 | |
Reynolds American, Inc. (Tobacco) | | | 731,400 | | | | 34,682,988 | |
SCANA Corp. (Multi-Utilities) | | | 245,700 | | | | 13,316,940 | |
Southern Co. (Electric Utilities) | | | 458,700 | | | | 22,123,101 | |
Spectra Energy Corp. (Oil, Gas & Consumable Fuels) | | | 394,300 | | | | 12,432,279 | |
TECO Energy, Inc. (Multi-Utilities) | | | 1,174,800 | | | | 22,473,924 | |
Time Warner, Inc. (Media) | | | 359,300 | | | | 21,478,954 | |
Travelers Companies, Inc. (The) (Insurance) | | | 162,700 | | | | 13,896,207 | |
Vectren Corp. (Multi-Utilities) | | | 449,400 | | | | 16,879,464 | |
¨Verizon Communications, Inc. (Diversified Telecommunication Services) | | | 712,600 | | | | 38,416,266 | |
Waste Management, Inc. (Commercial Services & Supplies) | | | 587,400 | | | | 24,071,652 | |
| | | | | | | | |
| | | | 1,111,607,281 | |
| | | | | | | | |
Total Common Stocks
(Cost $1,899,294,181) | | | | | | | 2,211,195,431 | |
| | | | | | | | |
|
| Preferred Stock 0.4% | |
United States 0.4% | |
MetLife, Inc.
6.50% (Insurance) | | | 366,800 | | | | 9,452,436 | |
| | | | | | | | |
Total Preferred Stock
(Cost $9,117,868) | | | | | | | 9,452,436 | |
| | | | | | | | |
| | |
| | | | | | | | |
| | | | |
| 12 | | MainStay Epoch Global Equity Yield Fund | | The notes to the financial statements are an integral part of,
and should be read in conjunction with, the financial statements. |
| | | | | | | | |
| | | Principal
Amount | | | Value | |
| Short-Term Investment 2.3% | |
Repurchase Agreement 2.3% | | | | | | | | |
United States 2.3% | | | | | | | | |
State Street Bank and Trust Co. 0.01%, dated 4/30/13
due 5/1/13
Proceeds at Maturity $52,435,672 (Collateralized by a Federal Home Loan Mortgage Corp. security with a rate of 2.06% and a maturity date of 10/17/22, with a Principal Amount of $53,790,000 and a Market Value of $53,484,688) (Capital Markets) | | $ | 52,435,657 | | | $ | 52,435,657 | |
| | | | | | | | |
Total Short-Term Investment
(Cost $52,435,657) | | | | | | | 52,435,657 | |
| | | | | | | | |
Total Investments
(Cost $1,960,847,706) (a) | | | 99.2 | % | | | 2,273,083,524 | |
Other Assets, Less Liabilities | | | 0.8 | | | | 19,356,957 | |
Net Assets | | | 100.0 | % | | $ | 2,292,440,481 | |
| (a) | As of April 30, 2013, cost is $1,965,904,746 for federal income tax purposes and net unrealized appreciation is as follows: |
| | | | |
Gross unrealized appreciation | | $ | 322,820,321 | |
Gross unrealized depreciation | | | (15,641,543 | ) |
| | | | |
Net unrealized appreciation | | $ | 307,178,778 | |
| | | | |
The following abbreviation is used in the above portfolio:
ADR—American Depositary Receipt.
The following is a summary of the fair valuations according to the inputs used as of April 30, 2013, for valuing the Fund’s assets.
Asset Valuation Inputs
| | | | | | | | | | | | | | | | |
Description | | Quoted Prices in Active Markets for Identical Assets (Level 1) | | | Significant
Other
Observable
Inputs (Level 2) | | | Significant
Unobservable
Inputs (Level 3) | | | Total | |
| Investments in Securities (a) | | | | | | | | | | | | | | | | |
| Common Stocks | | $ | 2,211,195,431 | | | $ | — | | | $ | — | | | $ | 2,211,195,431 | |
| Preferred Stock | | | 9,452,436 | | | | — | | | | — | | | | 9,452,436 | |
| Short-Term Investment | | | | | | | | | | | | | | | | |
Repurchase Agreement | | | — | | | | 52,435,657 | | | | — | | | | 52,435,657 | |
| | | | | | | | | | | | | | | | |
| Total Investments in Securities | | $ | 2,220,647,867 | | | $ | 52,435,657 | | | $ | — | | | $ | 2,273,083,524 | |
| | | | | | | | | | | | | | | | |
| (a) | For a complete listing of investments and their industries, see the Portfolio of Investments. |
The Fund recognizes transfers between the levels as of the beginning of the period.
As of October 31, 2012 and April 30, 2013 foreign equity securities were not fair valued, as a result there were no transfers between Level 1 and Level 2 fair value measurements. (See Note 2)
As of April 30, 2013, the Fund did not hold any investments with significant unobservable inputs (Level 3). (See Note 2)
| | | | | | |
The notes to the financial statements are an integral part of,
and should be read in conjunction with, the financial statements. | | mainstayinvestments.com | | | 13 | |
Portfolio of Investments April 30, 2013 (Unaudited) (continued)
The table below sets forth the diversification of MainStay Epoch Global Equity Yield Fund investments by industry.
Industry Diversification (Unaudited)
| | | | | | | | |
| | | Value | | | Percent † | |
Aerospace & Defense | | $ | 82,491,770 | | | | 3.6 | % |
Air Freight & Logistics | | | 10,747,973 | | | | 0.5 | |
Automobiles | | | 32,894,680 | | | | 1.4 | |
Beverages | | | 52,354,157 | | | | 2.3 | |
Capital Markets | | | 52,435,657 | | | | 2.3 | |
Chemicals | | | 58,176,176 | | | | 2.5 | |
Commercial Banks | | | 33,832,071 | | | | 1.5 | |
Commercial Services & Supplies | | | 38,016,420 | | | | 1.7 | |
Construction & Engineering | | | 28,224,187 | | | | 1.2 | |
Diversified Financial Services | | | 21,793,966 | | | | 0.9 | |
Diversified Telecommunication Services | | | 256,339,804 | | | | 11.2 | |
Electric Utilities | | | 164,139,545 | | | | 7.2 | |
Electrical Equipment | | | 15,587,208 | | | | 0.7 | |
Energy Equipment & Services | | | 29,353,680 | | | | 1.3 | |
Food & Staples Retailing | | | 10,576,754 | | | | 0.5 | |
Food Products | | | 50,813,923 | | | | 2.2 | |
Hotels, Restaurants & Leisure | | | 28,907,878 | | | | 1.3 | |
Household Products | | | 53,192,299 | | | | 2.3 | |
Insurance | | | 96,216,746 | | | | 4.2 | |
IT Services | | | 13,393,926 | | | | 0.6 | |
Leisure Equipment & Products | | | 27,411,981 | | | | 1.2 | |
Machinery | | | 10,662,420 | | | | 0.5 | |
Media | | | 105,798,789 | | | | 4.6 | |
Multi-Utilities | | | 174,299,828 | | | | 7.6 | |
Oil, Gas & Consumable Fuels | | | 168,067,329 | | | | 7.3 | |
Pharmaceuticals | | | 247,468,334 | | | | 10.8 | |
Real Estate Investment Trusts | | | 18,600,057 | | | | 0.8 | |
Road & Rail | | | 13,595,565 | | | | 0.6 | |
Semiconductors & Semiconductor Equipment | | | 56,154,118 | | | | 2.4 | |
Software | | | 18,125,560 | | | | 0.8 | |
Tobacco | | | 186,063,518 | | | | 8.1 | |
Water Utilities | | | 43,515,817 | | | | 1.9 | |
Wireless Telecommunication Services | | | 73,831,388 | | | | 3.2 | |
| | | | | | | | |
| | | 2,273,083,524 | | | | 99.2 | |
Other Assets, Less Liabilities | | | 19,356,957 | | | | 0.8 | |
| | | | | | | | |
Net Assets | | $ | 2,292,440,481 | | | | 100.0 | % |
| | | | | | | | |
| † | Percentages indicated are based on Fund net assets. |
| | | | |
| 14 | | MainStay Epoch Global Equity Yield Fund | | The notes to the financial statements are an integral part of,
and should be read in conjunction with, the financial statements. |
Statement of Assets and Liabilities as of April 30, 2013 (Unaudited)
| | | | |
| Assets | |
Investment in securities, at value
(identified cost $1,960,847,706) | | $ | 2,273,083,524 | |
Cash denominated in foreign currencies
(identified cost $573,433) | | | 578,338 | |
Receivables: | | | | |
Investment securities sold | | | 11,493,553 | |
Fund shares sold | | | 10,344,305 | |
Dividends and interest | | | 9,455,354 | |
Other assets | | | 105,856 | |
| | | | |
Total assets | | | 2,305,060,930 | |
| | | | |
| |
| Liabilities | | | | |
Payables: | | | | |
Investment securities purchased | | | 8,869,374 | |
Fund shares redeemed | | | 1,925,567 | |
Manager (See Note 3) | | | 1,259,354 | |
Transfer agent (See Note 3) | | | 231,964 | |
NYLIFE Distributors (See Note 3) | | | 208,715 | |
Professional fees | | | 40,784 | |
Custodian | | | 30,078 | |
Shareholder communication | | | 28,972 | |
Trustees | | | 2,240 | |
Accrued expenses | | | 23,401 | |
| | | | |
Total liabilities | | | 12,620,449 | |
| | | | |
Net assets | | $ | 2,292,440,481 | |
| | | | |
| |
| Composition of Net Assets | | | | |
Shares of beneficial interest outstanding (par value of $.001 per share) unlimited number of shares authorized | | $ | 125,542 | |
Additional paid-in capital | | | 2,030,877,904 | |
| | | | |
| | | 2,031,003,446 | |
Undistributed net investment income | | | 3,505,954 | |
Accumulated net realized gain (loss) on investments and foreign currency transactions | | | (54,391,745 | ) |
Net unrealized appreciation (depreciation) on investments | | | 312,235,818 | |
Net unrealized appreciation (depreciation) on translation of other assets and liabilities in foreign currencies | | | 87,008 | |
| | | | |
Net assets | | $ | 2,292,440,481 | |
| | | | |
| | | | |
Investor Class | | | | |
Net assets applicable to outstanding shares | | $ | 5,266,545 | |
| | | | |
Shares of beneficial interest outstanding | | | 288,456 | |
| | | | |
Net asset value per share outstanding | | $ | 18.26 | |
Maximum sales charge (5.50% of offering price) | | | 1.06 | |
| | | | |
Maximum offering price per share outstanding | | $ | 19.32 | |
| | | | |
Class A | | | | |
Net assets applicable to outstanding shares | | $ | 541,785,640 | |
| | | | |
Shares of beneficial interest outstanding | | | 29,633,614 | |
| | | | |
Net asset value per share outstanding | | $ | 18.28 | |
Maximum sales charge (5.50% of offering price) | | | 1.06 | |
| | | | |
Maximum offering price per share outstanding | | $ | 19.34 | |
| | | | |
Class C | | | | |
Net assets applicable to outstanding shares | | $ | 130,304,681 | |
| | | | |
Shares of beneficial interest outstanding | | | 7,165,970 | |
| | | | |
Net asset value and offering price per share outstanding | | $ | 18.18 | |
| | | | |
Class I | | | | |
Net assets applicable to outstanding shares | | $ | 1,615,083,615 | |
| | | | |
Shares of beneficial interest outstanding | | | 88,454,246 | |
| | | | |
Net asset value and offering price per share outstanding | | $ | 18.26 | |
| | | | |
| | | | | | |
The notes to the financial statements are an integral part of,
and should be read in conjunction with, the financial statements. | | mainstayinvestments.com | | | 15 | |
Statement of Operations for the six months ended April 30, 2013 (Unaudited)
| | | | |
| Investment Income (Loss) | |
Income | | | | |
Dividends (a) | | $ | 45,513,096 | |
Interest | | | 3,125 | |
| | | | |
Total income | | | 45,516,221 | |
| | | | |
Expenses | | | | |
Manager (See Note 3) | | | 6,515,508 | |
Distribution/Service—Investor Class (See Note 3) | | | 4,931 | |
Distribution/Service—Class A (See Note 3) | | | 567,799 | |
Distribution/Service—Class C (See Note 3) | | | 533,740 | |
Transfer agent (See Note 3) | | | 704,842 | |
Registration | | | 80,703 | |
Custodian | | | 67,961 | |
Professional fees | | | 54,148 | |
Shareholder communication | | | 42,884 | |
Trustees | | | 20,208 | |
Miscellaneous | | | 53,470 | |
| | | | |
Total expenses | | | 8,646,194 | |
| | | | |
Net investment income (loss) | | | 36,870,027 | |
| | | | |
|
| Realized and Unrealized Gain (Loss) on Investments and Foreign Currency Transactions | |
Net realized gain (loss) on: | | | | |
Security transactions | | | 44,949,641 | |
Foreign currency transactions | | | (156,292 | ) |
| | | | |
Net realized gain (loss) on investments and foreign currency transactions | | | 44,793,349 | |
| | | | |
Net change in unrealized appreciation (depreciation) on: | | | | |
Investments | | | 192,109,473 | |
Translation of other assets and liabilities in foreign currencies | | | 107,064 | |
| | | | |
Net change in unrealized appreciation (depreciation) on investments and foreign currency transactions | | | 192,216,537 | |
| | | | |
Net realized and unrealized gain (loss) on investments and foreign currency transactions | | | 237,009,886 | |
| | | | |
Net increase (decrease) in net assets resulting from operations | | $ | 273,879,913 | |
| | | | |
| (a) | Dividends recorded net of foreign withholding taxes in the amount of $2,715,923. |
| | | | |
| 16 | | MainStay Epoch Global Equity Yield Fund | | The notes to the financial statements are an integral part of,
and should be read in conjunction with, the financial statements. |
Statements of Changes in Net Assets
for the six months ended April 30, 2013 (Unaudited) and the year ended October 31, 2012
| | | | | | | | |
| | | 2013 | | | 2012 | |
| Increase (Decrease) in Net Assets | |
Operations: | | | | | | | | |
Net investment income (loss) | | $ | 36,870,027 | | | $ | 45,617,266 | |
Net realized gain (loss) on investments and foreign currency transactions | | | 44,793,349 | | | | 12,685,956 | |
Net change in unrealized appreciation (depreciation) on investments and foreign currency transactions | | | 192,216,537 | | | | 68,097,990 | |
| | | | |
Net increase (decrease) in net assets resulting from operations | | | 273,879,913 | | | | 126,401,212 | |
| | | | |
Dividends to shareholders: | | | | | | | | |
From net investment income: | | | | | | | | |
Investor Class | | | (58,774 | ) | | | (78,750 | ) |
Class A | | | (6,811,553 | ) | | | (9,422,239 | ) |
Class C | | | (1,207,155 | ) | | | (1,676,756 | ) |
Class I | | | (21,846,728 | ) | | | (32,319,174 | ) |
| | | | |
Total dividends to shareholders | | | (29,924,210 | ) | | | (43,496,919 | ) |
| | | | |
Capital share transactions: | | | | | | | | |
Net proceeds from sale of shares | | | 692,111,946 | | | | 1,055,571,674 | |
Net asset value of shares issued to shareholders in reinvestment of dividends | | | 22,559,486 | | | | 31,655,397 | |
Cost of shares redeemed | | | (310,063,391 | ) | | | (558,681,020 | ) |
| | | | |
Increase (decrease) in net assets derived from capital share transactions | | | 404,608,041 | | | | 528,546,051 | |
| | | | |
Net increase (decrease) in net assets | | | 648,563,744 | | | | 611,450,344 | |
|
| Net Assets | |
Beginning of period | | | 1,643,876,737 | | | | 1,032,426,393 | |
| | | | |
End of period | | $ | 2,292,440,481 | | | $ | 1,643,876,737 | |
| | | | |
Undistributed (distribution in excess of) net investment income at end of period | | $ | 3,505,954 | | | $ | (3,439,863 | ) |
| | | | |
| | | | | | |
The notes to the financial statements are an integral part of,
and should be read in conjunction with, the financial statements. | | mainstayinvestments.com | | | 17 | |
Financial Highlights selected per share data and ratios
| | | | | | | | | | | | | | | | | | | | |
| | | Investor Class | |
| | | Six months
ended
April 30, | | | Year ended October 31, | | | January 1,
2010
through
October 31, | | | November 16,
2009**
through
December 31, | |
| | | 2013* | | | 2012 | | | 2011 | | | 2010*** | | | 2009 | |
Net asset value at beginning of period | | $ | 16.14 | | | $ | 15.19 | | | $ | 14.72 | | | $ | 13.72 | | | $ | 13.46 | |
| | | | | | | | | �� | | | | | | | | | | | |
Net investment income (loss) | | | 0.33 | (a) | | | 0.51 | (a) | | | 0.51 | (a) | | | 0.38 | (a) | | | 0.05 | |
Net realized and unrealized gain (loss) on investments | | | 2.03 | | | | 0.91 | | | | 0.44 | | | | 1.02 | | | | 0.29 | |
Net realized and unrealized gain (loss) on foreign currency transactions | | | (0.00 | )‡ | | | (0.00 | )‡ | | | (0.01 | ) | | | (0.01 | ) | | | — | |
| | | | | | | | | | | | | | | | | | | | |
Total from investment operations | | | 2.36 | | | | 1.42 | | | | 0.94 | | | | 1.39 | | | | 0.34 | |
| | | | | | | | | | | | | | | | | | | | |
Less dividends: | | | | | | | | | | | | | | | | | | | | |
From net investment income | | | (0.24 | ) | | | (0.47 | ) | | | (0.47 | ) | | | (0.39 | ) | | | (0.08 | ) |
| | | | | | | | | | | | | | | | | | | | |
Net asset value at end of period | | $ | 18.26 | | | $ | 16.14 | | | $ | 15.19 | | | $ | 14.72 | | | $ | 13.72 | |
| | | | | | | | | | | | | | | | | | | | |
Total investment return (b) | | | 14.83 | %(c) | | | 9.43 | % | | | 6.41 | % | | | 10.44 | %(c) | | | 2.54 | %(c) |
Ratios (to average net assets)/Supplemental Data: | | | | | | | | | | | | | | | | | | | | |
Net investment income (loss) | | | 3.88 | %†† | | | 3.22 | % | | | 3.32 | % | | | 3.36 | %†† | | | 2.67 | %†† |
Net expenses | | | 1.09 | %†† | | | 1.13 | % | | | 1.15 | % | | | 1.16 | %†† | | | 1.09 | %†† |
Expenses (before waiver/reimbursement) | | | 1.09 | %†† | | | 1.13 | % | | | 1.15 | % | | | 1.31 | %†† | | | 1.09 | %†† |
Portfolio turnover rate | | | 15 | % | | | 23 | % | | | 28 | % | | | 41 | % | | | 59 | % |
Net assets at end of period (in 000’s) | | $ | 5,267 | | | $ | 3,402 | | | $ | 1,406 | | | $ | 230 | | | $ | 26 | |
| ** | Commencement of operations. |
| *** | The Fund changed its fiscal year end from December 31 to October 31. |
| ‡ | Less than one cent per share. |
| (a) | Per share data based on average shares outstanding during the period. |
| (b) | Total investment return is calculated exclusive of sales charges and assumes the reinvestment of dividends and distributions. |
| (c) | Total investment return is not annualized. |
| | | | |
| 18 | | MainStay Epoch Global Equity Yield Fund | | The notes to the financial statements are an integral part of,
and should be read in conjunction with, the financial statements. |
Financial Highlights selected per share data and ratios
| | | | | | | | | | | | | | | | | | | | | | | | | | | | |
| | | Class A | |
| | | Six months
ended
April 30, | | | Year ended October 31, | | | January 1,
2010
through
October 31, | | | Year ended December 31, | |
| | | 2013* | | | 2012 | | | 2011 | | | 2010*** | | | 2009 | | | 2008 | | | 2007 | |
Net asset value at beginning of period | | $ | 16.16 | | | $ | 15.21 | | | $ | 14.73 | | | $ | 13.72 | | | $ | 11.52 | | | $ | 17.72 | | | $ | 17.94 | |
| | | | | | | | | | | | | | | | | | | | | | | | | | | | |
Net investment income (loss) | | | 0.32 | (a) | | | 0.50 | (a) | | | 0.50 | (a) | | | 0.36 | (a) | | | 0.44 | | | | 0.59 | (a) | | | 0.69 | |
Net realized and unrealized gain (loss) on investments | | | 2.05 | | | | 0.92 | | | | 0.45 | | | | 1.03 | | | | 2.14 | | | | (6.18 | ) | | | 0.79 | |
Net realized and unrealized gain (loss) on foreign currency transactions | | | (0.00 | )‡ | | | (0.00 | )‡ | | | (0.01 | ) | | | (0.01 | ) | | | (0.03 | ) | | | — | | | | — | |
| | | | | | | | | | | | | | | | | | | | | | | | | | | | |
Total from investment operations | | | 2.37 | | | | 1.42 | | | | 0.94 | | | | 1.38 | | | | 2.55 | | | | (5.59 | ) | | | 1.48 | |
| | | | | | | | | | | | | | | | | | | | | | | | | | | | |
Less dividends and distributions: | | | | | | | | | | | | | | | | | | | | | | | | | | | | |
From net investment income | | | (0.25 | ) | | | (0.47 | ) | | | (0.46 | ) | | | (0.37 | ) | | | (\0.35 | ) | | | (0.48 | ) | | | (0.72 | ) |
From net realized gain on investments | | | — | | | | — | | | | — | | | | — | | | | — | | | | (0.08 | ) | | | (0.99 | ) |
Return of capital | | | — | | | | — | | | | — | | | | — | | | | — | | | | (0.05 | ) | | | — | |
| | | | | | | | | | | | | | | | | | | | | | | | | | | | |
Total dividends and distributions | | | (0.25 | ) | | | (0.47 | ) | | | (0.46 | ) | | | (0.37 | ) | | | (0.35 | ) | | | (0.61 | ) | | | (1.71 | ) |
| | | | | | | | | | | | | | | | | | | | | | | | | | | | |
Redemption fee (b) | | | — | | | | — | | | | — | | | | — | | | | 0.00 | ‡ | | | 0.00 | ‡ | | | 0.01 | |
| | | | | | | | | | | | | | | | | | | | | | | | | | | | |
Net asset value at end of period | | $ | 18.28 | | | $ | 16.16 | | | $ | 15.21 | | | $ | 14.73 | | | $ | 13.72 | | | $ | 11.52 | | | $ | 17.72 | |
| | | | | | | | | | | | | | | | | | | | | | | | | | | | |
Total investment return (c) | | | 14.76 | %(d) | | | 9.40 | % | | | 6.45 | % | | | 10.40 | %(d) | | | 22.47 | % | | | (32.19 | %) | | | 8.34 | % |
Ratios (to average net assets)/Supplemental Data: | | | | | | | | | | | | | | | | | | | | | | | | | | | | |
Net investment income (loss) | | | 3.82 | %†† | | | 3.17 | % | | | 3.27 | % | | | 3.22 | %†† | | | 3.66 | % | | | 4.01 | % | | | 3.97 | % |
Net expenses | | | 1.06 | %†† | | | 1.13 | % | | | 1.19 | % | | | 1.24 | %†† | | | 1.21 | % | | | 1.18 | % | | | 1.16 | % |
Expenses (before waiver/reimbursement) | | | 1.06 | %†† | | | 1.13 | % | | | 1.19 | % | | | 1.39 | %†† | | | 1.21 | % | | | 1.18 | % | | | 1.16 | % |
Portfolio turnover rate | | | 15 | % | | | 23 | % | | | 28 | % | | | 41 | % | | | 59 | % | | | 72 | % | | | 47 | % |
Net assets at end of period (in 000’s) | | $ | 541,786 | | | $ | 404,497 | | | $ | 204,366 | | | $ | 33,559 | | | $ | 23,336 | | | $ | 16,480 | | | $ | 19,390 | |
| *** | The Fund changed its fiscal year end from December 31 to October 31. |
| ‡ | Less than one cent per share. |
| (a) | Per share data based on average shares outstanding during the period. |
| (b) | The redemption fee was discontinued as of April 1, 2010. |
| (c) | Total investment return is calculated exclusive of sales charges and assumes the reinvestment of dividends and distributions. |
| (d) | Total investment return is not annualized. |
| | | | | | |
The notes to the financial statements are an integral part of,
and should be read in conjunction with, the financial statements. | | mainstayinvestments.com | | | 19 | |
Financial Highlights selected per share data and ratios
| | | | | | | | | | | | | | | | | | | | |
| | | Class C | |
| | | Six months
ended
April 30, | | | Year ended October 31, | | | January 1,
2010
through
October 31, | | | November 16,
2009**
through
December 31, | |
| | | 2013* | | | 2012 | | | 2011 | | | 2010*** | | | 2009 | |
Net asset value at beginning of period | | $ | 16.08 | | | $ | 15.15 | | | $ | 14.68 | | | $ | 13.72 | | | $ | 13.46 | |
| | | | | | | | | | | | | | | | | | | | |
Net investment income (loss) | | | 0.25 | (a) | | | 0.38 | (a) | | | 0.38 | (a) | | | 0.27 | (a) | | | 0.03 | |
Net realized and unrealized gain (loss) on investments | | | 2.04 | | | | 0.91 | | | | 0.47 | | | | 1.04 | | | | 0.30 | |
Net realized and unrealized gain (loss) on foreign currency transactions | | | (0.00 | )‡ | | | (0.00 | )‡ | | | (0.01 | ) | | | (0.01 | ) | | | — | |
| | | | | | | | | | | | | | | | | | | | |
Total from investment operations | | | 2.29 | | | | 1.29 | | | | 0.84 | | | | 1.30 | | | | 0.33 | |
| | | | | | | | | | | | | | | | | | | | |
Less dividends: | | | | | | | | | | | | | | | | | | | | |
From net investment income | | | (0.19 | ) | | | (0.36 | ) | | | (0.37 | ) | | | (0.34 | ) | | | (0.07 | ) |
| | | | | | | | | | | | | | | | | | | | |
Net asset value at end of period | | $ | 18.18 | | | $ | 16.08 | | | $ | 15.15 | | | $ | 14.68 | | | $ | 13.72 | |
| | | | | | | | | | | | | | | | | | | | |
Total investment return (b) | | | 14.28 | %(c) | | | 8.65 | % | | | 5.67 | % | | | 9.83 | %(c) | | | 2.45 | %(c) |
Ratios (to average net assets)/Supplemental Data: | | | | | | | | | | | | | | | | | | | | |
Net investment income (loss) | | | 3.06 | %†† | | | 2.43 | % | | | 2.52 | % | | | 2.33 | %†† | | | 1.80 | %†† |
Net expenses | | | 1.84 | %†† | | | 1.88 | % | | | 1.90 | % | | | 1.91 | %†† | | | 1.84 | %†† |
Expenses (before waiver/reimbursement) | | | 1.84 | %†† | | | 1.88 | % | | | 1.90 | % | | | 2.06 | %†† | | | 1.84 | %†† |
Portfolio turnover rate | | | 15 | % | | | 23 | % | | | 28 | % | | | 41 | % | | | 59 | % |
Net assets at end of period (in 000’s) | | $ | 130,305 | | | $ | 95,301 | | | $ | 35,975 | | | $ | 6,547 | | | $ | 36 | |
| ** | Commencement of operations. |
| *** | The Fund changed its fiscal year end from December 31 to October 31. |
| ‡ | Less than one cent per share. |
| (a) | Per share data based on average shares outstanding during the period. |
| (b) | Total investment return is calculated exclusive of sales charges and assumes the reinvestment of dividends and distributions. |
| (c) | Total investment return is not annualized. |
| | | | |
| 20 | | MainStay Epoch Global Equity Yield Fund | | The notes to the financial statements are an integral part of,
and should be read in conjunction with, the financial statements. |
Financial Highlights selected per share data and ratios
| | | | | | | | | | | | | | | | | | | | | | | | | | | | |
| | | Class I | |
| | | Six months
ended
April 30, | | | Year ended October 31, | | | January 1,
2010
through
October 31, | | | Year ended December 31, | |
| | | 2013* | | | 2012 | | | 2011 | | | 2010*** | | | 2009 | | | 2008 | | | 2007 | |
Net asset value at beginning of period | | $ | 16.14 | | | $ | 15.19 | | | $ | 14.70 | | | $ | 13.70 | | | $ | 11.53 | | | $ | 17.75 | | | $ | 18.02 | |
| | | | | | | | | | | | | | | | | | | | | | | | | | | | |
Net investment income (loss) | | | 0.34 | (a) | | | 0.54 | (a) | | | 0.52 | (a) | | | 0.41 | (a) | | | 0.44 | | | | 0.66 | (a) | | | 0.77 | |
Net realized and unrealized gain (loss) on investments | | | 2.05 | | | | 0.92 | | | | 0.47 | | | | 1.00 | | | | 2.13 | | | | (6.24 | ) | | | 0.72 | |
Net realized and unrealized gain (loss) on foreign currency transactions | | | (0.00 | )‡ | | | (0.00 | )‡ | | | (0.01 | ) | | | (0.01 | ) | | | (0.03 | ) | | | — | | | | — | |
| | | | | | | | | | | | | | | | | | | | | | | | | | | | |
Total from investment operations | | | 2.39 | | | | 1.46 | | | | 0.98 | | | | 1.40 | | | | 2.54 | | | | (5.58 | ) | | | 1.49 | |
| | | | | | | | | | | | | | | | | | | | | | | | | | | | |
Less dividends and distributions: | | | | | | | | | | | | | | | | | | | | | | | | | | | | |
From net investment income | | | (0.27 | ) | | | (0.51 | ) | | | (0.49 | ) | | | (0.40 | ) | | | (0.37 | ) | | | (0.51 | ) | | | (0.77 | ) |
From net realized gain on investments | | | — | | | | — | | | | — | | | | — | | | | — | | | | (0.08 | ) | | | (0.99 | ) |
Return of capital | | | — | | | | — | | | | — | | | | — | | | | — | | | | (0.05 | ) | | | — | |
| | | | | | | | | | | | | | | | | | | | | | | | | | | | |
Total dividends and distributions | | | (0.27 | ) | | | (0.51 | ) | | | (0.49 | ) | | | (0.40 | ) | | | (0.37 | ) | | | (0.64 | ) | | | (1.76 | ) |
| | | | | | | | | | | | | | | | | | | | | | | | | | | | |
Redemption fee (b) | | | — | | | | — | | | | — | | | | — | | | | 0.00 | ‡ | | | 0.00 | ‡ | | | 0.00 | ‡ |
| | | | | | | | | | | | | | | | | | | | | | | | | | | | |
Net asset value at end of period | | $ | 18.26 | | | $ | 16.14 | | | $ | 15.19 | | | $ | 14.70 | | | $ | 13.70 | | | $ | 11.53 | | | $ | 17.75 | |
| | | | | | | | | | | | | | | | | | | | | | | | | | | | |
Total investment return (c) | | | 14.92 | %(d) | | | 9.66 | % | | | 6.76 | % | | | 10.54 | %(d) | | | 22.49 | % | | | (32.10 | %) | | | 8.28 | % |
Ratios (to average net assets)/Supplemental Data: | | | | | | | | | | | | | | | | | | | | | | | | | | | | |
Net investment income (loss) | | | 4.08 | %†† | | | 3.46 | % | | | 3.44 | % | | | 3.61 | %†† | | | 3.85 | % | | | 4.40 | % | | | 4.21 | % |
Net expenses | | | 0.81 | %†† | | | 0.88 | % | | | 0.94 | % | | | 0.99 | %†† | | | 0.96 | % | | | 0.93 | % | | | 0.91 | % |
Expenses (before waiver/reimbursement) | | | 0.81 | %†† | | | 0.88 | % | | | 0.94 | % | | | 1.13 | %†† | | | 0.96 | % | | | 0.93 | % | | | 0.91 | % |
Portfolio turnover rate | | | 15 | % | | | 23 | % | | | 28 | % | | | 41 | % | | | 59 | % | | | 72 | % | | | 47 | % |
Net assets at end of period (in 000’s) | | $ | 1,615,084 | | | $ | 1,140,677 | | | $ | 790,679 | | | $ | 398,750 | | | $ | 383,228 | | | $ | 297,513 | | | $ | 535,229 | |
| *** | The Fund changed its fiscal year end from December 31 to October 31. |
| ‡ | Less than one cent per share. |
| (a) | Per share data based on average shares outstanding during the period. |
| (b) | The redemption fee was discontinued as of April 1, 2010. |
| (c) | Total investment return is calculated exclusive of sales charges and assumes the reinvestment of dividends and distributions. Class I shares are not subject to sales charges. |
| (d) | Total investment return is not annualized. |
| | | | | | |
The notes to the financial statements are an integral part of,
and should be read in conjunction with, the financial statements. | | mainstayinvestments.com | | | 21 | |
Notes to Financial Statements (Unaudited)
Note 1–Organization and Business
MainStay Funds Trust (the “Trust”) was organized as a Delaware statutory trust on April 28, 2009, and is governed by a Declaration of Trust. The Trust is registered under the Investment Company Act of 1940, as amended (the “1940 Act”), as an open-end investment management company, and is comprised of thirty-three funds (collectively referred to as the “Funds”). These financial statements and notes relate only to the MainStay Epoch Global Equity Yield Fund (the “Fund”), a diversified fund. The Fund is the successor to the Epoch Global Equity Shareholder Yield Fund (the “Predecessor Fund”), which was a series of a different registered investment company for which Epoch Investment Partners, Inc. served as investment advisor. The financial statements of the Fund reflect the historical results of the Institutional Class and Class P shares of the Predecessor Fund prior to its reorganization on November 16, 2009. Upon the completion of the reorganization, the Class I and Class A shares of the Fund assumed the performance, financial and other information of the Institutional Class and Class P shares of the Predecessor Fund, respectively. All information and references to periods prior to November 16, 2009 refer to the Predecessor Fund.
The Fund currently offers four classes of shares. Investor Class and Class C shares commenced operations on November 16, 2009. Class I and Class A shares commenced operations (under former designations) on December 27, 2005 and August 2, 2006, respectively. Investor Class and Class A shares are offered at net asset value (“NAV”) per share plus an initial sales charge. No sales charge applies to investments of $1 million or more (and certain other qualified purchases) in Investor Class and Class A shares, but a contingent deferred sales charge (“CDSC”) is imposed on certain redemptions made within one year of the date of purchase. Class C shares are offered at NAV without an initial sales charge, although a 1.00% CDSC may be imposed on redemptions made within one year of the date of purchase of Class C shares. Class I shares are offered at NAV and are not subject to a sales charge. Depending upon eligibility, Investor Class shares may convert to Class A shares and Class A shares may convert to Investor Class shares. The four classes of shares have the same voting (except for issues that relate solely to one class), dividend, liquidation and other rights, and the same terms and conditions, except that Class C shares are subject to higher distribution and/or service fee rates than Investor Class and Class A shares under a distribution plan pursuant to Rule 12b-1 under the 1940 Act. Class I shares are not subject to a distribution and/or service fee.
The Fund’s investment objective is to seek a high level of income. Capital appreciation is a secondary investment objective.
Note 2–Significant Accounting Policies
The Fund prepares its financial statements in accordance with generally accepted accounting principles (“GAAP”) in the United States of America and follows the significant accounting policies described below.
(A) Securities Valuation. Investments are valued as of the close of regular trading on the New York Stock Exchange (“Exchange”) (generally 4:00 p.m. Eastern time) on each day the Fund is open for business (“valuation date”).
The Board of Trustees (the “Board”) has adopted procedures for the valuation of the Fund’s securities and has delegated the responsibility
for valuation determination under those procedures to the Valuation Committee of the Fund (the “Valuation Committee”). The Board has authorized the Valuation Committee to appoint a Valuation Sub-Committee (the “Sub-Committee”) to deal in the first instance with questions that arise or cannot be resolved under these procedures. The Sub-Committee meets (in person, via electronic mail or via teleconference) on an as-needed basis. The Valuation Committee meets at a later time, as necessary, to ensure that actions taken by the Sub-Committee were appropriate. The procedures recognize that, subject to the oversight of the Board and unless otherwise noted, the responsibility for day-to-day valuation of portfolio assets (including securities for which market prices are not readily available) rests with New York Life Investment Management LLC ( “New York Life Investments” or the “Manager”), aided to whatever extent necessary by the Subadvisor (as defined in Note 3(A)) of the Fund.
To assess the appropriateness of security valuations, the Manager or the Fund’s third party service provider who is subject to oversight by the Manager, regularly compares prior day prices, prices on comparable securities and the sale prices to the prior and current day prices and challenges prices exceeding certain tolerance levels with third party pricing services or broker sources. For those securities valued by recommendation, whether through a standardized fair valuation methodology or a fair valuation determination, the Valuation Committee reviews and affirms the reasonableness of the valuation based on such methodologies and determinations on a regular basis after considering all relevant information that is reasonably available.
“Fair value” is defined as the price that the Fund would receive upon selling an investment in an orderly transaction to an independent buyer in the principal or most advantageous market of the investment. Fair value measurements are determined within a framework that has established a three-tier hierarchy which maximizes the use of observable market data and minimizes the use of unobservable inputs to establish classification of fair value measurements for disclosure purposes. “Inputs” refers broadly to the assumptions that market participants would use in pricing the asset or liability, including assumptions about risk, such as the risk inherent in a particular valuation technique used to measure fair value using a pricing model and/or the risk inherent in the inputs for the valuation technique. Inputs may be observable or unobservable. Observable inputs reflect the assumptions market participants would use in pricing the asset or liability based on market data obtained from sources independent of the Fund. Unobservable inputs reflect the Fund’s own assumptions about the assumptions market participants would use in pricing the asset or liability developed based on the information available in the circumstances. The inputs or methodology used for valuing securities may not be an indication of the risks associated with investing in those securities. The three-tier hierarchy of inputs is summarized in the three broad Levels listed below.
| • | | Level 1—quoted prices in active markets for identical investments |
| • | | Level 2—other significant observable inputs (including quoted prices for similar investments in active markets, interest rates and yield curves, prepayment speeds, credit risks, etc.) |
| • | | Level 3—significant unobservable inputs (including the Fund’s own assumptions about the assumptions that market participants would use in determining the fair value of investments) |
| | |
| 22 | | MainStay Epoch Global Equity Yield Fund |
The aggregate value by input level, as of April 30, 2013, for the Fund’s investments is included at the end of the Fund’s Portfolio of Investments.
The valuation techniques used by the Fund to measure fair value maximize the use of observable inputs and minimize the use of unobservable inputs. The Fund may utilize third party vendor evaluations, whose prices may be derived from one or more of the following standard inputs:
| | |
• Benchmark Yields | | • Reported Trades |
• Broker Dealer Quotes | | • Issuer Spreads |
• Two-sided markets | | • Benchmark securities |
• Bids/Offers | | • Reference Data (corporate actions or material event notices) |
• Industry and economic events | | • Comparable bonds |
• Equity and credit default swap curves | | • Monthly payment information |
Securities for which market values cannot be determined using the methodologies described above are valued by methods deemed in good faith by the Fund’s Valuation Committee, following the procedures established by the Board, to represent fair value. Under these procedures, the Fund primarily employs a market-based approach which may use related or comparable assets or liabilities, recent transactions, market multiples, book values, and other relevant information. The Fund may also use an income-based valuation approach in which the anticipated future cash flows of the investment are discounted to calculate fair value. Discounts may also be applied due to the nature or duration of any restrictions on the disposition of the investments. Due to the inherent uncertainty of valuations of such investments, the fair values may differ significantly from the values that would have been used had an active market existed. For the six-month period ended April 30, 2013, there have been no changes to the fair value methodologies.
Equity and non-equity securities which may be valued in this manner include, but are not limited to: (i) a security for which the trading has been halted or suspended; (ii) a debt security that has recently gone into default and for which there is not a current market quotation; (iii) a security of an issuer that has entered into a restructuring; (iv) a security that has been de-listed from a national exchange; (v) a security for which the market price is not available from a third party pricing source or, if so provided, does not, in the opinion of the Fund’s Manager or Subadvisor reflect the security’s market value; and (vi) a security whose principal market has been temporarily closed at a time when, under normal conditions, it would be open. Securities for which market quotations or observable inputs are not readily available are generally categorized as Level 3 in the hierarchy. As of April 30, 2013, the Fund did not hold any securities that were fair valued in such a manner.
Certain events may occur between the time that foreign markets close, on which securities held by the Fund principally trade, and the time at which the Fund’s NAV is calculated. These events may include, but are not limited to, situations relating to a single issuer in a market sector, significant fluctuations in U.S. or foreign markets, natural disasters, armed conflicts, governmental actions or other developments not tied directly to the securities markets. Should the Manager or Subadvisor conclude that such events may have affected the accuracy of the last price of such securities reported on the local foreign market, the Manager or Subadvisor may, pursuant to procedures adopted by the
Board, adjust the value of the local price to reflect the estimated impact on the price of such securities as a result of such events. In this instance, securities are generally categorized as Level 3 in the hierarchy. Additionally, foreign equity securities are also fair valued whenever the movement of a particular index exceeds certain thresholds. In such cases, the securities are fair valued by applying factors provided by a third party vendor in accordance with the Fund’s policies and procedures and are generally categorized as Level 2 in the hierarchy. As of April 30, 2013, certain foreign equity securities held by the Fund were not fair valued in such a manner.
Equity securities and Exchange Traded Funds are valued at the latest quoted sales prices as of the close of regular trading on the Exchange on each valuation date. Securities that are not traded on the valuation date are valued at the mean of the latest quoted bid and ask prices. Prices normally are taken from the principal market in which each security trades. Future contracts are valued at the last posted settlement price on the market where such futures are primarily traded. Options contracts are valued at the last posted settlement price on the market where such options are principally traded. Investments in the other mutual funds are valued at their respective NAVs as of the close of the Exchange on the valuation date. These securities are generally categorized as Level 1 in the hierarchy.
Temporary cash investments acquired over 60 days to maturity are valued using the latest bid prices or using valuations based on a matrix system (which considers such factors as security prices, yields, maturities, and ratings), both as furnished by independent pricing services. Other temporary cash investments which mature in 60 days or less (“Short-Term Investments”) are valued at amortized cost. The amortized cost method involves valuing a security at its cost on the date of purchase and thereafter assuming a constant amortization to maturity of the difference between such cost and the value on maturity date. Amortized cost approximates the current fair value of a security. Securities valued at amortized cost are not valued using a quoted price in an active market. These securities are generally categorized as Level 2 in the hierarchy.
(B) Income Taxes. The Fund’s policy is to comply with the requirements of the Internal Revenue Code of 1986, as amended (the “Internal Revenue Code”), applicable to regulated investment companies and to distribute all of the taxable income to the shareholders of the Fund within the allowable time limits. Therefore, no federal, state and local income tax provision is required.
Management evaluates its tax positions to determine if the tax positions taken meet the minimum recognition threshold in connection with accounting for uncertainties in income tax positions taken or expected to be taken for the purposes of measuring and recognizing tax liabilities in the financial statements. Recognition of tax benefits of an uncertain tax position is required only when the position is “more likely than not” to be sustained assuming examination by taxing authorities. Management has analyzed the Fund’s tax positions taken on federal, state and local income tax returns for all open tax years (for up to three tax years), and has concluded that no provision for federal, state and local income tax is required in the Fund’s financial statements. The Fund’s federal, state and local income and federal excise tax returns for tax years for which the applicable statutes of limitations have not expired are subject to examination by the Internal Revenue Service and state and local departments of revenue.
| | | | |
| mainstayinvestments.com | | | 23 | |
Notes to Financial Statements (Unaudited) (continued)
(C) Foreign Taxes. Investment income received by the Fund from foreign sources may be subject to foreign income taxes. These foreign income taxes are generally withheld at the source, a portion of which may be recoverable. The Fund will accrue such taxes and recoveries as applicable, based upon its current interpretation of tax rules and regulations that exist in the markets in which it invests.
(D) Dividends and Distributions to Shareholders. Dividends and distributions are recorded on the ex-dividend date. The Fund intends to declare and pay dividends of net investment income, if any, at least quarterly and distributions of net realized capital and currency gains, if any, at least annually. Unless the shareholder elects otherwise, all dividends and distributions are reinvested in the same class of shares of the Fund, at NAV. Dividends and distributions to shareholders are determined in accordance with federal income tax regulations and may differ from GAAP.
(E) Security Transactions and Investment Income. The Fund records security transactions on the trade date. Realized gains and losses on security transactions are determined using the identified cost method. Dividend income is recognized on the ex-dividend date and interest income is accrued as earned using the effective interest rate method. Discounts and premiums on Short-Term Investments are accreted and amortized, respectively, on the straight-line method.
Investment income and realized and unrealized gains and losses on investments of the Fund are allocated to separate classes of shares pro rata based upon their relative net assets on the date the income is earned or realized and unrealized gains and losses are incurred.
(F) Expenses. Expenses of the Trust are allocated to the individual Funds in proportion to the net assets of the respective Funds when the expenses are incurred, except where direct allocations of expenses can be made. Expenses (other than transfer agent expenses and fees incurred under the shareholder services plans and the distribution plans further discussed in Note 3(B)) are allocated to separate classes of shares pro rata based upon their relative net assets on the date the expenses are incurred. The expenses borne by the Fund, including those of related parties to the Fund, are shown in the Statement of Operations.
(G) Use of Estimates. In preparing financial statements in conformity with GAAP, management makes estimates and assumptions that affect the reported amounts and disclosures in the financial statements. Actual results could differ from those estimates.
(H) Repurchase Agreements. The Fund may enter into repurchase agreements to earn income. The Fund may enter into repurchase agreements only with financial institutions that are deemed by the Manager or Subadvisor to be creditworthy, pursuant to guidelines established by the Fund’s Board. During the term of any repurchase agreement, the Manager or Subadvisor will continue to monitor the creditworthiness of the seller. Under the 1940 Act, repurchase agreements are considered to be collateralized loans by a Fund to the seller secured by the securities transferred to the Fund.
When the Fund invests in repurchase agreements, the Fund’s custodian takes possession of the collateral pledged for investments in the repurchase agreement. The underlying collateral is valued daily on a mark-to-market basis to determine that the value, including accrued
interest, exceeds the repurchase price. In the event of the seller’s default on the obligation to repurchase, the Fund has the right to liquidate the collateral and apply the proceeds in satisfaction of the obligation. Under certain circumstances, such as in the event of default or bankruptcy by the counterparty to the agreement, realization and/or retention of the collateral may be subject to legal proceedings and possible realized loss to the Fund.
(I) Foreign Currency Transactions. The books and records of the Fund are kept in U.S. dollars. Prices of securities denominated in foreign currency amounts are translated into U.S. dollars at the mean between the buying and selling rates last quoted by any major U.S. bank at the following dates:
(i) market value of investment securities, other assets and liabilities—at the valuation date, and
(ii) purchases and sales of investment securities, income and expenses—at the date of such transactions.
The assets and liabilities that are denominated in foreign currency amounts are presented at the exchange rates and market values at the close of the period. The realized and unrealized changes in net assets arising from fluctuations in exchange rates and market prices of securities are not separately presented.
Net realized gain (loss) on foreign currency transactions represents net gains and losses on foreign currency forward contracts, net currency gains or losses realized as a result of differences between the amounts of securities sale proceeds or purchase cost, dividends, interest and withholding taxes as recorded on the Fund’s books, and the U.S. dollar equivalent amount actually received or paid. Net currency gains or losses from valuing such foreign currency denominated assets and liabilities, other than investments at valuation date exchange rates, are reflected in unrealized foreign exchange gains or losses.
(J) Securities Lending. In order to realize additional income, the Fund may engage in securities lending, subject to the limitations set forth in the 1940 Act and relevant guidance by the staff of the Securities and Exchange Commission. In the event the Fund does engage in securities lending, the Fund will lend through its custodian, State Street Bank and Trust Company (“State Street”). State Street will manage the Fund’s cash collateral in accordance with the lending agreement between the Fund and State Street, and indemnify the Fund’s portfolio against counterparty risk. The loans will be collateralized by cash or securities at least equal at all times to the market value of the securities loaned. Collateral will consist of U.S. Government securities, cash equivalents or irrevocable letters of credit. The Fund may bear the risk of delay in recovery of, or loss of rights in, the securities loaned should the borrower of the securities experience financial difficulty. The Fund may also record realized gain or loss on securities deemed sold due to a borrower’s inability to return securities on loan. The Fund will receive compensation for lending its securities in the form of fees or the retention of a portion of the interest on the investment of any cash received as collateral. The Fund also will continue to receive interest and dividends on the securities loaned and any gain or loss in the market price of the securities loaned that may occur during the term of the loan will be for the account of the Fund.
| | |
| 24 | | MainStay Epoch Global Equity Yield Fund |
Although the Fund and New York Life Investments have temporarily suspended securities lending, the Fund and New York Life Investments reserve the right to reinstitute lending when deemed appropriate. The Fund did not have any portfolio securities on loan as of April 30, 2013.
(K) Concentration of Risk. The Fund invests in foreign securities, which carry certain risks that are in addition to the usual risks inherent in domestic instruments. These risks include those resulting from currency fluctuations, future adverse political and economic developments and possible imposition of currency exchange blockages or other foreign governmental laws or restrictions. These risks are likely to be greater in emerging markets than in developed markets. The ability of issuers of debt securities held by the Fund to meet their obligations may be affected by economic or political developments in a specific country, industry or region.
(L) Indemnifications. Under the Trust’s organizational documents, its officers and trustees are indemnified against certain liabilities that may arise out of performance of their duties to the Trust. Additionally, in the normal course of business, the Fund enters into contracts with third-party service providers that contain a variety of representations and warranties and which may provide general indemnifications. The Fund’s maximum exposure under these arrangements is unknown, as this would involve future claims that may be made against the Fund that have not yet occurred. Based on experience, management is of the view that the risk of loss in connection with these potential indemnification obligations is remote. However, there can be no assurance that material liabilities related to such obligations will not arise in the future, which could adversely impact the Fund.
(M) Large Transaction Risks. From time to time, the Fund may receive large purchase or redemption orders from affiliated or unaffiliated mutual funds or other investors. Such large transactions could have adverse effects on the Fund’s performance if the Fund were required to sell securities or invest cash at times when it otherwise would not do so. This activity could also accelerate the realization of capital gains and increase the Fund’s transaction costs.
Note 3–Fees and Related Party Transactions
(A) Manager and Subadvisor. New York Life Investments, a registered investment adviser and an indirect, wholly-owned subsidiary of New York Life Insurance Company (“New York Life”), serves as the Fund’s Manager, pursuant to an Amended and Restated Management Agreement (“Management Agreement”). The Manager provides offices, conducts clerical, recordkeeping and bookkeeping services, and keeps most of the financial and accounting records required to be maintained by the Fund. Except for the portion of salaries and expenses that are the responsibility of the Fund, the Manager pays the salaries and expenses of all personnel affiliated with the Fund and certain operational expenses of the Fund. The Fund reimburses New York Life Investments in an amount equal to a portion of the salary of the Chief Compliance Officer (“CCO”) of the Fund. Epoch Investment Partners, Inc. (“Epoch” or “Subadvisor”), a registered investment adviser, serves as Subadvisor to the Fund and is responsible for the day-to-day portfolio management of the Fund. Pursuant to the terms of an Amended and Restated Subadvisory Agreement (“Subadvisory Agreement”) between New York Life Investments and Epoch, New York Life Investments pays for the services of the Subadvisor.
The Fund pays the Manager a monthly fee for services performed and facilities furnished at an annual rate of 0.70% of the Fund’s average daily net assets.
For the six-month period ended April 30, 2013, New York Life Investments earned fees from the Fund in the amount of $6,515,508.
State Street, 1 Lincoln Street, Boston, Massachusetts 02111, provides sub-administration and sub-accounting services to the Fund pursuant to an agreement with New York Life Investments. These services include calculating the daily NAVs of the Fund, maintaining the general ledger and sub-ledger accounts for the calculation of the Fund’s respective NAVs, and assisting New York Life Investments in conducting various aspects of the Fund’s administrative operations. For providing these services to the Fund, State Street is compensated by New York Life Investments.
(B) Distribution and Service Fees. The Trust, on behalf of the Fund, has entered into a distribution agreement with NYLIFE Distributors LLC (the “Distributor”), an indirect, wholly-owned subsidiary of New York Life. The Fund has adopted distribution plans (the “Plans”) in accordance with the provisions of Rule 12b-1 under the 1940 Act.
Pursuant to the Investor Class and Class A Plans, the Distributor receives a monthly distribution fee at an annual rate of 0.25% of the average daily net assets of the Investor Class and Class A shares for distribution and/or service activities as designated by the Distributor. Pursuant to the Class C Plan, Class C shares pay the Distributor a monthly distribution fee at an annual rate of 0.75% of the average daily net assets of the Class C shares, along with a service fee at an annual rate of 0.25% of the average daily net assets of the Class C shares, for a total 12b-1 fee of 1.00%. Class I shares are not subject to a distribution and/or service fee.
The Plans provide that the distribution and service fees are payable to the Distributor regardless of the amounts actually expended by the Distributor for distribution of the Fund’s shares and service activities.
(C) Sales Charges. The Fund was advised by the Distributor that the amount of sales charges retained on sales of Investor Class and Class A shares were $5,799 and $63,275, respectively, for the six-month period ended April 30, 2013. The Fund was also advised that the Distributor retained CDSCs on redemptions of Class A and Class C shares of $2,257 and $18,986, respectively, for the six-month period ended April 30, 2013.
(D) Transfer, Dividend Disbursing and Shareholder Servicing Agent. NYLIM Service Company LLC, an affiliate of New York Life Investments, is the Fund’s transfer, dividend disbursing and shareholder servicing agent pursuant to an agreement between NYLIM Service Company LLC and the Trust. NYLIM Service Company LLC has entered into an agreement with Boston Financial Data Services, Inc. (“BFDS”) pursuant to which BFDS performs certain transfer agent services on behalf of NYLIM Service Company LLC. Transfer agent expenses incurred by the Fund for the six-month period ended April 30, 2013, were as follows:
| | | | |
Investor Class | | $ | 2,137 | |
Class A | | | 167,375 | |
Class C | | | 57,775 | |
Class I | | | 477,555 | |
| | | | |
| mainstayinvestments.com | | | 25 | |
Notes to Financial Statements (Unaudited) (continued)
(E) Small Account Fee. Shareholders with small accounts adversely impact the cost of providing transfer agency services. In an effort to reduce total transfer agency expenses, the Fund has implemented a small account fee on certain types of accounts. Certain shareholders with an account balance of less than $1,000 are charged an annual per account fee of $20 (assessed semi-annually), the proceeds from which offset transfer agent fees as reflected in the Statement of Operations.
Note 4–Federal Income Tax
Under the Regulated Investment Company Modernization Act of 2010, the Fund is permitted to carry forward capital losses incurred in taxable years beginning after December 22, 2010, for an unlimited period. However, any losses incurred during those future years will be required to be utilized prior to the losses incurred in pre-enactment tax years. As a result of this ordering rule, pre-enactment capital loss carryforwards may be more likely to expire unused. Additionally, post-enactment capital losses that are carried forward will retain their character as either short-term or long-term capital losses rather than being considered all short-term as under previous law.
As of October 31, 2012, for federal income tax purposes, capital loss carryforwards of $97,896,172 were available as shown in the table below, to the extent provided by the regulations to offset future realized gains of the Fund through the years indicated. To the extent that these capital loss carryforwards are used to offset future capital gains, it is probable that the capital gains so offset will not be distributed to shareholders. No capital gain distributions shall be made until any capital loss carryforwards have been fully utilized or expired.
| | | | | | | | |
Capital Loss
Available Through | | Short-Term
Capital Loss
Amounts (000’s) | | | Long-Term
Capital Loss
Amounts (000’s) | |
2016
2017 | | $
| 23,667
74,226 |
| | $
| —
— |
|
| Total | | $ | 97,893 | | | $ | — | |
The tax character of distributions paid during the year ended October 31, 2012, shown in the Statements of Changes in Net Assets was as follows:
| | | | | | |
| | | | | 2012 | |
Distributions paid from: | | | | | | |
Ordinary Income | | | | $ | 43,496,919 | |
Note 5–Custodian
State Street is the custodian of the cash and the securities of the Fund. Custodial fees are charged to the Fund based on the market value of securities in the Fund and the number of certain cash transactions incurred by the Fund.
Note 6–Line of Credit
The Fund and certain affiliated funds maintain a line of credit with a syndicate of banks in order to secure a source of funds for temporary purposes to meet unanticipated or excessive redemption requests.
Effective August 29, 2012, under a second amended and restated credit agreement (the “Credit Agreement”), the aggregate commitment amount is $200,000,000 with an optional maximum amount of $250,000,000. The commitment fee is an annual rate of 0.08% of the average commitment amount payable quarterly, regardless of usage, to Bank of New York Mellon, which serves as the agent to the syndicate. The commitment fee is allocated among the Fund and certain affiliated funds based upon net assets and other factors. Interest on any revolving credit loan is charged based upon the Federal Funds Advances rate or the one month London InterBank Offered Rate, whichever is higher. The Credit Agreement expires on August 28, 2013, although the Fund, certain affiliated funds and the syndicate of banks may renew the Credit Agreement for an additional year on the same or different terms. There were no borrowings made or outstanding with respect to the Fund on the Credit Agreement during the six-month period ended April 30, 2013.
Note 7–Purchases and Sales of Securities (in 000’s)
During the six-month period ended April 30, 2013, purchases and sales of securities, other than short-term securities, were $709,971 and $280,492, respectively.
Note 8–Capital Share Transactions
| | | | | | | | |
Investor Class | | Shares | | | Amount | |
Six-month period ended April 30, 2013: | | | | | | | | |
Shares sold | | | 102,599 | | | $ | 1,750,914 | |
Shares issued to shareholders in reinvestment of dividends | | | 3,277 | | | | 55,904 | |
Shares redeemed | | | (12,719 | ) | | | (212,299 | ) |
| | | | | | | | |
Net increase (decrease) in shares outstanding before conversion | | | 93,157 | | | | 1,594,519 | |
Shares converted into Investor Class (See Note 1) | | | 1,314 | | | | 22,964 | |
Shares converted from Investor Class (See Note 1) | | | (16,858 | ) | | | (284,649 | ) |
| | | | |
Net increase (decrease) | | | 77,613 | | | $ | 1,332,834 | |
| | | | | | | | |
Year ended October 31, 2012: | | | | | | | | |
Shares sold | | | 159,207 | | | $ | 2,480,121 | |
Shares issued to shareholders in reinvestment of dividends | | | 4,743 | | | | 74,180 | |
Shares redeemed | | | (23,057 | ) | | | (359,721 | ) |
| | | | | | | | |
Net increase (decrease) in shares outstanding before conversion | | | 140,893 | | | | 2,194,580 | |
Shares converted into Investor Class (See Note 1) | | | 7,122 | | | | 115,978 | |
Shares converted from Investor Class (See Note 1) | | | (29,768 | ) | | | (473,355 | ) |
| | | | | | | | |
Net increase (decrease) | | | 118,247 | | | $ | 1,837,203 | |
| | | | | | | | |
| | |
| 26 | | MainStay Epoch Global Equity Yield Fund |
| | | | | | | | |
Class A | | Shares | | | Amount | |
Six-month period ended April 30, 2013: | | | | | | | | |
Shares sold | | | 8,185,333 | | | $ | 138,013,353 | |
Shares issued to shareholders in reinvestment of dividends | | | 364,729 | | | | 6,221,361 | |
Shares redeemed | | | (3,962,951 | ) | | | (66,632,284 | ) |
| | | | | | | | |
Net increase (decrease) in shares outstanding before conversion | | | 4,587,111 | | | | 77,602,430 | |
Shares converted into Class A
(See Note 1) | | | 16,833 | | | | 284,649 | |
Shares converted from Class A
(See Note 1) | | | (1,312 | ) | | | (22,964 | ) |
| | | | | | | | |
Net increase (decrease) | | | 4,602,632 | | | $ | 77,864,115 | |
| | | | | | | | |
Year ended October 31, 2012: | | | | | | | | |
Shares sold | | | 18,951,953 | | | $ | 296,315,339 | |
Shares issued to shareholders in reinvestment of dividends | | | 517,618 | | | | 8,108,135 | |
Shares redeemed | | | (7,896,102 | ) | | | (123,699,483 | ) |
| | | | | | | | |
Net increase (decrease) in shares outstanding before conversion | | | 11,573,469 | | | | 180,723,991 | |
Shares converted into Class A (See Note 1) | | | 29,732 | | | | 473,355 | |
Shares converted from Class A (See Note 1) | | | (7,111 | ) | | | (115,978 | ) |
| | | | | | | | |
Net increase (decrease) | | | 11,596,090 | | | $ | 181,081,368 | |
| | | | | | | | |
| | |
| | | | | | | | |
Class C | | Shares | | | Amount | |
Six-month period ended April 30, 2013: | | | | | | | | |
Shares sold | | | 1,757,098 | | | $ | 29,616,411 | |
Shares issued to shareholders in reinvestment of dividends | | | 41,697 | | | | 710,237 | |
Shares redeemed | | | (561,298 | ) | | | (9,303,420 | ) |
| | | | | | | | |
Net increase (decrease) | | | 1,237,497 | | | $ | 21,023,228 | |
| | | | | | | | |
Year ended October 31, 2012: | | | | | | | | |
Shares sold | | | 4,146,007 | | | $ | 64,491,063 | |
Shares issued to shareholders in reinvestment of dividends | | | 60,225 | | | | 938,654 | |
Shares redeemed | | | (653,142 | ) | | | (10,216,295 | ) |
| | | | | | | | |
Net increase (decrease) | | | 3,553,090 | | | $ | 55,213,422 | |
| | | | | | | | |
| | | | | | | | |
Class I | | Shares | | | Amount | |
Six-month period ended April 30, 2013: | | | | | | | | |
Shares sold | | | 30,766,336 | | | $ | 522,731,268 | |
Shares issued to shareholders in reinvestment of dividends | | | 915,601 | | | | 15,571,984 | |
Shares redeemed | | | (13,905,294 | ) | | | (233,915,388 | ) |
| | | | | | | | |
Net increase (decrease) | | | 17,776,643 | | | $ | 304,387,864 | |
| | | | | | | | |
Year ended October 31, 2012: | | | | | | | | |
Shares sold | | | 44,261,854 | | | $ | 692,285,151 | |
Shares issued to shareholders in reinvestment of dividends | | | 1,442,963 | | | | 22,534,428 | |
Shares redeemed | | | (27,078,903 | ) | | | (424,405,521 | ) |
| | | | | | | | |
Net increase (decrease) | | | 18,625,914 | | | $ | 290,414,058 | |
| | | | | | | | |
Note 9–Subsequent Events
In connection with the preparation of the financial statements of the Fund as of and for the six-month period ended April 30, 2013, events and transactions subsequent to April 30, 2013, through the date the financial statements were issued have been evaluated by the Fund’s management for possible adjustment and/or disclosure. No subsequent events requiring financial statement adjustment or disclosure have been identified.
| | | | |
| mainstayinvestments.com | | | 27 | |
I. Board Consideration and Approval of Management Agreement and
Subadvisory Agreement (Unaudited)
Section 15(c) of the Investment Company Act of 1940, as amended (the “1940 Act”) requires that each mutual fund’s board of trustees, including a majority of the independent trustees, annually review and approve the fund’s investment advisory agreements. At its December 10-12, 2012 meeting, the Board of Trustees of the MainStay Group of Funds (“Board”) unanimously approved the Management Agreement with respect to the MainStay Epoch Global Equity Yield Fund (“Fund”) and New York Life Investment Management LLC (“New York Life Investments”), and the Subadvisory Agreement between New York Life Investments and Epoch Investment Partners, Inc. (“Epoch”) with respect to the Fund.
In reaching its decision to approve the Agreements, the Board considered information furnished by New York Life Investments and Epoch in connection with a contract review process that took place at various meetings of the Board and its Contracts Committee between September 2012 and December 2012, as well as other relevant information furnished to the Board throughout the year by New York Life Investments and Epoch. Information requested by and furnished to the Board in connection with the contract review process included, among other items, reports on the Fund prepared by Strategic Insight Mutual Fund Research and Consulting, LLC (“Strategic Insight”), an independent third-party service provider engaged by the Board to report objectively on the Fund’s investment performance, management and subadvisory fees and ordinary operating expenses. The Board also considered information provided by New York Life Investments and Epoch on the fees charged to other investment advisory clients (including institutional separate accounts) that follow investment strategies similar to the Fund, and the rationale for any differences in the Fund’s management and subadvisory fees and the fees charged to those other investment advisory clients. In addition, the Board requested and received information on the profitability of the Fund to New York Life Investments and its affiliates and Epoch, and responses from New York Life Investments and Epoch to a series of questions encompassing a variety of topics prepared on behalf of the Board by independent legal counsel to the Board and its independent trustees (the “Independent Trustees”). Information provided to the Board at its meetings throughout the year included, among other items, detailed investment performance reports on the Fund prepared by the Investment Consulting Group at New York Life Investments. The structure and format for this regular reporting was developed in consultation with the Board. The Board also received from New York Life Investments throughout the year, among other items, periodic reports on legal and compliance matters, portfolio turnover, and sales and marketing activity.
In determining to approve the Agreements, the members of the Board reviewed and evaluated all of the information and factors they believed to be relevant and appropriate in light of legal advice furnished to them by independent legal counsel and through the exercise of their own business judgment. The broad factors considered by the Board are discussed in greater detail below, and included, among other items: (i) the nature, scope and quality of the services provided to the Fund by New York Life Investments and Epoch; (ii) the investment performance of the Fund, New York Life Investments and Epoch; (iii) the costs of the services provided, and profits realized, by New York Life Investments and Epoch from their relationship with the Fund; (iv) the extent to which economies of scale may be realized as the Fund grows, and the extent to which economies of scale may benefit Fund investors; and (v) the reasonableness of the Fund’s management and subadvisory fees and
overall total ordinary operating expenses, particularly as compared to similar funds and accounts managed by New York Life Investments and Epoch and third-party “peer funds” identified by Strategic Insight.
While individual members of the Board may have weighed certain factors differently, the Board’s decision to approve the Agreements was based on a consideration of all the information provided to the Board, including information provided to the Board throughout the year and specifically in connection with the contract review process. The Board’s conclusions with respect to the Agreements also were based, in part, on the Board’s consideration of the Agreements in prior years. In addition to considering the above-referenced factors, the Board observed that in the marketplace there are a range of investment options available to shareholders of the Fund, and that the Fund’s shareholders, having had the opportunity to consider other investment options, have chosen to invest in the Fund. A more detailed discussion of the factors that figured prominently in the Board’s decisions to approve the Agreements is provided below.
Nature, Scope and Quality of Services to Be Provided by New York Life Investments and Epoch
The Board examined the nature, scope and quality of the services that New York Life Investments provides to the Fund. The Board evaluated New York Life Investments’ experience in serving as manager of the Fund, noting that New York Life Investments manages other mutual funds, serves a variety of other investment advisory clients, including other pooled investment vehicles, and has experience with overseeing mutual fund service providers, including subadvisors. The Board considered the experience of senior personnel at New York Life Investments providing management and administrative services to the Fund, as well as New York Life Investments’ reputation and financial condition. The Board also considered the full range of non-advisory services that New York Life Investments supplies to the Fund under the terms of the Management Agreement, including: (i) fund accounting services provided by New York Life Investments’ Fund Accounting and Administration Group; (ii) investment oversight and analytical services provided by New York Life Investments’ Investment Consulting Group; (iii) compliance services provided by New York Life Investments’ compliance department, including oversight and implementation of the Fund’s compliance program; and (iv) legal services provided by New York Life Investments’ Office of the General Counsel. Additional information about the non-advisory services provided by New York Life Investments is set forth in the Fund’s Management Agreement. The Board also considered New York Life Investments’ willingness to invest in personnel that benefit the Fund, and noted that New York Life Investments is responsible for compensating the Fund’s officers. The Board also considered benefits to shareholders of being part of the MainStay Group of Funds, including the privilege of exchanging investments between the same class of shares without the imposition of a sales charge, as described more fully in the Fund’s prospectus.
The Board also examined the nature, scope and quality of the advisory services that Epoch provides to the Fund. The Board evaluated Epoch’s experience in serving as subadvisor to the Fund and managing other portfolios. It examined Epoch’s track record and experience in providing investment advisory services, the experience of investment advisory, senior management and administrative personnel at Epoch, and Epoch’s overall legal and compliance environment. The Board also reviewed
| | |
| 28 | | MainStay Epoch Global Equity Yield Fund |
Epoch’s willingness to invest in personnel that benefit the Fund. In this regard, the Board considered the experience of the Fund’s portfolio managers, the number of accounts managed by the portfolio managers and the method for compensating portfolio managers.
Based on these considerations, the Board concluded, within the context of its overall determinations regarding the Agreements, that the Fund should continue to benefit from the nature, scope and quality of these services as a result of New York Life Investments’ and Epoch’s experience, personnel, operations and resources.
Investment Performance
In evaluating the Fund’s investment performance, the Board considered investment performance results in light of the Fund’s investment objective, strategies and risks, as disclosed in the Fund’s prospectus. The Board particularly considered detailed investment reports on the Fund’s performance provided to the Board throughout the year by the Investment Consulting Group of New York Life Investments. These reports include, among other items, information on the Fund’s gross and net returns, the Fund’s investment performance relative to relevant investment categories and Fund benchmarks, the Fund’s risk-adjusted investment performance, and the Fund’s investment performance as compared to similar competitor funds, as appropriate. The Board also considered information provided by Strategic Insight showing the investment performance of the Fund as compared to peer funds.
In considering the Fund’s investment performance, the Board focused principally on the Fund’s long-term performance track record. The Board also gave weight to its ongoing discussions with senior management at New York Life Investments concerning the Fund’s investment performance, as well as discussions between the Fund’s portfolio managers and the Board that occur typically on an annual basis. In addition, the Board considered any specific actions that New York Life Investments or Epoch had taken, or had agreed with the Board to take, to enhance Fund investment performance, and the results of those actions.
Based on these considerations, the Board concluded, within the context of its overall determinations regarding the Agreements, that the long-term investment performance of the Fund, along with ongoing efforts by New York Life Investments and Epoch to enhance investment returns, supported a determination to approve the Agreements. The Fund discloses more information about investment performance in the Portfolio Management Discussion and Analysis, Investment and Performance Comparison and Financial Highlights sections of this Semiannual Report and in the Fund’s prospectus.
Costs of the Services Provided, and Profits Realized, by New York Life Investments and Epoch
The Board considered the costs of the services provided by New York Life Investments and Epoch under the Agreements, and the profits realized by New York Life Investments and its affiliates and Epoch due to their relationships with the Fund. Because Epoch’s subadvisory fees are negotiated at arm’s-length by New York Life Investments and are paid by New York Life Investments, not the Fund, the Board principally considered the profits realized by New York Life Investments and its affiliates with respect to the Fund.
In evaluating the costs and profits of New York Life Investments and its affiliates and Epoch, the Board considered, among other factors, each party’s investments in personnel, systems, equipment and other resources necessary to manage the Fund, and that New York Life Investments is responsible for paying the subadvisory fees for the Fund. The Board acknowledged that New York Life Investments and Epoch must be in a position to pay and retain experienced professional personnel to provide services to the Fund, and that the ability to maintain a strong financial position is important in order for New York Life Investments and Epoch to continue to provide high-quality services to the Fund. The Board also noted that the Fund benefits from the allocation of certain fixed costs across the MainStay Group of Funds.
In addition, the Board noted the difficulty in obtaining reliable comparative data about mutual fund managers’ profitability, since such information generally is not publicly available and may be impacted by numerous factors, including the structure of a fund manager’s organization, the types of funds it manages, the methodology used to allocate certain fixed costs to specific funds, and the manager’s capital structure and costs of capital. While recognizing the difficulty in evaluating a manager’s profitability with respect to the Fund, and noting that other profitability methodologies may also be reasonable, the Board concluded that the profitability methodology presented by New York Life Investments to the Board, which was developed by New York Life Investments in consultation with an independent consultant, was reasonable in all material respects.
In considering the costs and profitability of the Fund, the Board also considered certain fall-out benefits that may be realized by New York Life Investments and its affiliates due to their relationships with the Fund. The Board recognized, for example, the benefits to Epoch from legally permitted “soft-dollar” arrangements by which brokers provide research and other services to Epoch in exchange for commissions paid by the Fund with respect to trades on the Fund’s portfolio securities. The Board also requested and received information from New York Life Investments and Epoch concerning other business relationships between Epoch and its affiliates and New York Life Investments and its affiliates.
The Board further considered that, in addition to fees earned by New York Life Investments for managing the Fund, New York Life Investments’ affiliates also earn revenues from serving the Fund in various other capacities, including as the Fund’s transfer agent and distributor. The Board observed that information about these other revenues, and their impact on the profitability of the Fund to New York Life Investments and its affiliates, was furnished to the Board as part of the 15(c) process. The Board noted that, although it assessed the overall profitability of the Fund to New York Life Investments and its affiliates as part of the contract review process, when considering the reasonableness of the fees to be paid to New York Life Investments and its affiliates under the Agreements, the Board considered the profitability of New York Life Investments’ relationship with the Fund on a pre-tax basis, and without regard to distribution expenses.
After evaluating the information presented to the Board, the Board concluded, within the context of its overall determinations regarding the Agreements, that any profits realized by New York Life Investments and its affiliates due to their relationships with the Fund supported the Board’s decision to approve the Agreements. With respect to Epoch, the
| | | | |
| mainstayinvestments.com | | | 29 | |
I. Board Consideration and Approval of Management Agreement and
Subadvisory Agreement (Unaudited) (continued)
Board concluded that any profits realized by Epoch due to its relationship with the Fund are the result of arm’s-length negotiations between New York Life Investments and Epoch, and are based on fees paid to Epoch by New York Life Investments, not the Fund.
Extent to Which Economies of Scale May Be Realized as the Fund Grows
The Board also considered whether the Fund’s expense structure permitted economies of scale to be shared with Fund investors. The Board reviewed information from New York Life Investments showing how the Fund’s management fee schedule compared to fee schedules of other funds and accounts managed by New York Life Investments. The Board also reviewed information from Strategic Insight showing how the Fund’s management fee schedule hypothetically would compare with fees paid for similar services by peer funds at varying asset levels. While recognizing the difficulty of determining economies of scale with precision, the Board acknowledged that economies of scale may be shared with the Fund in a number of ways, including, for example, through the imposition of management fee breakpoints and by initially setting relatively lower management fees.
Based on this information, the Board concluded, within the context of its overall determinations regarding the Agreements, that the Fund’s expense structure appropriately reflects economies of scale for the benefit of Fund investors. The Board noted, however, that it would continue to evaluate the reasonableness of the Fund’s expense structure as the Fund grows over time.
Management and Subadvisory Fees and Total Ordinary Operating Expenses
The Board evaluated the reasonableness of the fees to be paid under the Agreements and the Fund’s expected total ordinary operating expenses. The Board primarily considered the reasonableness of the management fee paid by the Fund to New York Life Investments, since the fees paid to Epoch are paid by New York Life Investments, not the Fund.
In assessing the reasonableness of the Fund’s fees and expenses, the Board primarily considered comparative data provided by Strategic Insight on the fees and expenses charged by similar mutual funds managed by other investment advisers. In addition, the Board considered information provided by New York Life Investments and Epoch on fees charged to other investment advisory clients, including institutional separate accounts and other funds with similar investment objectives as the Fund. The Board particularly considered differences in the contractual management fee schedules of the retail MainStay Funds and similarly-managed MainStay VP Portfolios, taking into account New York Life Investments’ rationale for any differences in fee schedules. The Board also took into account explanations provided by New York Life Investments about the different scope of services provided to mutual funds as compared with other investment advisory clients. Additionally, the Board considered the impact of any expense limitation arrangements on the Fund’s net management fee and expenses.
The Board noted that, outside of the Fund’s management fee and the fees charged under a share class’s Rule 12b-1 and/or shareholder services plans, a share class’s most significant “other expenses” are transfer agent fees. Transfer agent fees are charged to the Fund based on the
number of shareholder accounts (a “per-account” fee) as compared with certain other fees (e.g., management fees), which are charged based on the Fund’s average net assets. The Board took into account information from New York Life Investments showing that the Fund’s transfer agent fee schedule is reasonable, including industry data showing that the per-account fees that NYLIM Service Company LLC, the Fund’s transfer agent, charges the Fund are within the range of per-account fees charged by transfer agents to other mutual funds. In addition, the Board considered NYLIM Service Company LLC’s profitability in connection with the transfer agent services it provides to the Fund.
The Board acknowledged that, because the Fund’s transfer agent fees are billed on a per-account basis, the impact of transfer agent fees on a share class’s expense ratio may be more significant in cases where the share class has a high number of accounts with limited assets (i.e., small accounts). The Board observed that transfer agent fees are a significant portion of total expenses of many Funds in the MainStay Group of Funds. The impact of transfer agent fees on the expense ratios of these MainStay Funds tend to be greater than for other open-end retail funds, because the MainStay Group of Funds generally has a significant number of small accounts relative to competitor funds. The Board acknowledged the role that the MainStay Group of Funds historically has played in serving the investment needs of New York Life Insurance Company (“New York Life”) policyholders, who often maintain smaller account balances than other fund investors. The Board discussed measures that it and New York Life Investments have taken in recent years to mitigate the effect of small accounts on the expense ratios of Fund share classes, including: (i) encouraging New York Life agents to consolidate multiple small accounts held by the same investor into one MainStay Asset Allocation Fund account; (ii) increasing investment minimums from $500 to $1,000 in 2003; (iii) introducing Investor Class shares for certain MainStay Funds in early 2008 to consolidate smaller account investors; (iv) closing small accounts with balances below $250 in Investor Class shares or $750 in all other classes of shares; (v) no longer allowing an exception with no minimum investment amount with respect to AutoInvest accounts with subsequent monthly purchases of $100; (vi) since 2007, charging an annual $20.00 small account fee on certain accounts with balances below $1,000; and (vii) modifying the approach for billing transfer agent expenses to reduce the degree of subsidization by large accounts of smaller accounts. In addition, the Board acknowledged New York Life Investments’ efforts to encourage intermediaries to consolidate small accounts in multiple Funds held by the same investor into a single Asset Allocation Fund account, if appropriate under the circumstances, in an effort to mitigate the effect of small accounts on the Funds in the MainStay Group of Funds.
After considering all of the factors outlined above, the Board concluded that the Fund’s management and subadvisory fees and total ordinary operating expenses were within a range that is competitive and, within the context of the Board’s overall conclusions regarding the Agreements, support a conclusion that these fees and expenses are reasonable.
Conclusion
On the basis of the information provided to it and its evaluation thereof, the Board, including the Independent Trustees, unanimously voted to approve the Agreements.
| | |
| 30 | | MainStay Epoch Global Equity Yield Fund |
II. Board Consideration and Approval of New Subadvisory
Agreement (Unaudited)
At its March 21, 2013 meeting, the Board unanimously approved a new Subadvisory Agreement (the “Subadvisory Agreement”) between New York Life Investments and Epoch on behalf of the Fund that took effect on March 27, 2013. The Board was asked to approve the Subadvisory Agreement in connection with a “change in control” of Epoch and, accordingly, the termination by law and the express terms of the previous subadvisory agreement between New York Life Investments and Epoch with respect to the Fund.
On March 27, 2013, Epoch Holding Corporation (“Epoch Holding”) merged with Empire Merger Sub, Inc., a wholly-owned subsidiary of The Toronto-Dominion Bank, a Canadian chartered bank (“Epoch Holding Merger”) following the approval of Epoch Holding shareholders. As a result, Epoch Holding became a wholly-owned subsidiary of The Toronto-Dominion Bank (“TD Bank”). Epoch Holding is the parent company of Epoch Investment Partners, Inc. (“Epoch”), the Fund’s subadvisor. The closing of the Epoch Holding Merger resulted in a “change of control” of Epoch.
In reaching its decision to approve the continued retention of Epoch and the Agreement, the Board considered information presented to it by New York Life Investments, Epoch and TD Bank as part of its consideration and approval of the Agreement at the Board’s meeting in March 2013, as well as other relevant information furnished to it throughout the year by New York Life Investments and Epoch at regular and special Board meetings. The Board also requested and received responses from Epoch to a comprehensive list of questions encompassing a variety of topics prepared on behalf of the Board by independent legal counsel to the Board. The Board noted that it had also requested and received responses to similar questions in connection with its annual approval of the previous subadvisory agreement with Epoch at various meetings of the Board and its Contracts Committee between September 2012 and December 2012. The Board considered its historical experience with Epoch’s capabilities and resources, and its evaluation of Epoch in connection with previous contract review processes, including the contract review process that culminated with approval of the previous subadvisory agreement between New York Life Investments and Epoch, on behalf of the Fund (the “Prior Contract Review Processes”).
In determining to approve the continued retention of Epoch and approve the Agreement, the members of the Board reviewed and evaluated all of the information and factors they believed to be relevant and appropriate in light of legal advice furnished to them by independent legal counsel and through the exercise of their own business judgment. The broad factors considered by the Board are discussed in greater detail below, and included, among other things: (i) the nature, scope and quality of the services to be provided to the Fund by Epoch; (ii) the investment performance of the Fund; (iii) the costs of the services to be provided and the profits to be realized by Epoch and its affiliates from its relationship with the Fund; (iv) the extent to which economies of scale may be realized as the Fund grows, and the extent to which economies of scale may benefit Fund investors; and (v) the reasonableness of the Fund’s management and subadvisory fee levels and overall total ordinary operating expenses.
While the members of the Board may have weighed certain factors differently, the Board’s decision to approve the continued retention of Epoch and approve the Agreement was based on a comprehensive
consideration of all the information provided to the Board, including information provided to the Board in connection with its review of Epoch. The Board also considered that shareholders of the Fund approved the ability of New York Life Investments to act as a “manager of managers,” which allows the Board and New York Life Investments to retain unaffiliated subadvisors for the Fund without the approval of Fund shareholders. A more detailed discussion of the factors that figured prominently in the Board’s decision to approve the continued retention of Epoch and approve the Agreement is provided below.
Nature, Scope and Quality of Services to Be Provided by Epoch
In considering the approval of the continued retention of Epoch and approval of the Agreement, the Board examined the nature, scope and quality of the services that Epoch historically had provided to the Fund. Based on information provided to the Board in connection with the Prior Contract Review Processes, the Board acknowledged Epoch’s historical service to the Fund, and took note of the experience of Epoch’s portfolio managers, the number of accounts managed by the portfolio managers and Epoch’s method for compensating portfolio managers. The Board also considered the experience of senior personnel at Epoch, and Epoch’s plans for retaining key personnel in connection with the acquisition of Epoch Holding by TD Bank. Based on these considerations, the Board concluded, within the context of its overall determinations regarding the Agreement, that the Fund should continue to benefit from the nature, scope and quality of these services as a result of Epoch’s experience, personnel, operations and resources.
Investment Performance
In evaluating investment performance, the Board took note of the Fund’s historical investment performance results, as presented to the Board in connection with the Prior Contract Review Processes, in light of the Fund’s investment objectives, strategies and risks, as disclosed in the Fund’s prospectuses. The Board considered information about the Fund’s investment performance that is provided to the Board in connection with its regularly scheduled meetings, and also took note of information provided in connection with the Prior Contract Review Processes showing the investment performance of the Fund as compared to peer funds. The Board also considered the strength of Epoch’s resources (including research capabilities). Based on these considerations, the Board concluded, within the context of its overall determinations regarding the Agreement, that the retention of Epoch as subadvisor to the Fund is likely to benefit the Fund’s long-term investment performance.
Costs of the Services to Be Provided, and Profits to Be Realized, by Epoch
The Board considered the costs of the services to be provided by Epoch under the Agreement, and the profits to be realized by Epoch due to its relationship with the Fund, taking into account information provided to the Board in connection with the Prior Contract Review Processes. The Board noted that, in connection with Prior Contract Review Processes, Epoch has provided the Board with information about its profitability in connection with its relationship with the Fund. In addition, the Board considered past representations from Epoch and New York Life Invest-
| | | | |
| mainstayinvestments.com | | | 31 | |
II. Board Consideration and Approval of New Subadvisory
Agreement (Unaudited) (continued)
ments that the subadvisory fees paid by New York Life Investments to Epoch were the result of arm’s-length negotiations. Because Epoch’s subadvisory fees are paid by New York Life Investments, and not the Fund, the Board historically has focused principally on the profitability of the Fund to New York Life Investments and its affiliates.
In evaluating the costs of the services provided by Epoch in connection with the Prior Contract Review Processes, the Board considered, among other things, Epoch’s investments in personnel, systems, equipment and other resources necessary to manage the Fund, and the fact that New York Life Investments is responsible for paying the subadvisory fees for the Fund. The Board acknowledged that Epoch must be in a position to pay and retain experienced professional personnel to provide services to the Fund, and that Epoch’s ability to maintain a strong financial position is important in order for Epoch to provide high-quality ongoing services to the Fund and its investors.
The Board also considered certain fall-out benefits that may be realized by Epoch due to its relationship with the Fund. The Board recognized, for example, the benefits to Epoch from legally permitted “soft-dollar” arrangements by which brokers may provide research and other services to Epoch in exchange for commissions paid by the Fund with respect to trades on the Fund’s portfolio securities.
As part of the Prior Contract Review Processes, the Board requested and received information from Epoch and New York Life Investments concerning other business relationships between Epoch and its affiliates and New York Life Investments and its affiliates. The Board requested and received assurances that these other business relationships did not impact New York Life Investments’ recommendation for Epoch to serve as the Fund’s subadvisor, and that neither New York Life Investments nor its affiliates are expected to benefit in its other business relationships due to Epoch’s continued engagement as the Fund’s subadvisor.
After evaluating the information presented to the Board, the Board concluded, within the context of its overall determinations regarding the Agreement, that any profits to be realized by Epoch due to its relationship with the Fund supported the Board’s determination to approve the Agreement. The Board also concluded that any profits to be realized by Epoch will be the result of arm’s-length negotiations between New York Life Investments and Epoch, and will be based on subadvisory fees paid to Epoch by New York Life Investments, not the Fund.
Extent to Which Economies of Scale May Be Realized as the Fund Grows
The Board also considered whether the Fund’s expense structures permitted economies of scale to be shared with the Fund’s investors, taking into account information provided to the Board in connection with the Prior Contract Review Processes.
Based on this information, the Board concluded, within the context of its overall determinations regarding the Agreement, that the Fund’s expense structure appropriately reflect economies of scale for the benefit of Fund investors. The Board noted, however, that it would continue to evaluate the reasonableness of the Fund’s expense structure as the Fund grows over time.
Reasonableness of Subadvisory Fees
The Board evaluated the reasonableness of the fees to be paid under the existing management agreement with New York Life Investments and the Agreement, and the Fund’s expected total ordinary operating expenses. The Board considered that the fees to be paid to Epoch under the Agreement will be paid by New York Life Investments, not the Fund, and will result in no increase in the Fund’s expenses. In assessing the reasonableness of the Fund’s fees and expenses the Board primarily considered comparative data provided to the Board in connection with the Prior Contract Review Processes on the fees and expenses charged by similar mutual funds managed by other investment advisers. In addition, the Board considered information provided by New York Life Investments and Epoch on fees charged to other investment advisory clients, including institutional separate accounts and other funds with similar investment objectives as the Fund. In this regard, the Board took into account explanations from New York Life Investments and Epoch about the different scope of services provided to retail mutual funds as compared with other investment advisory clients. The Board also took into account the impact of any expenses limitation arrangements on the Fund’s net expenses.
After considering all of the factors outlined above, the Board concluded that the Fund’s management and subadvisory fees and total ordinary operating expenses were within a range that is competitive and, within the context of the Board’s overall conclusions regarding the Agreement, support a conclusion that these fees and expenses are reasonable.
Conclusion
On the basis of the information provided to it and its evaluation thereof, the Board, including the Independent Trustees, unanimously voted to approve the Agreement.
| | |
| 32 | | MainStay Epoch Global Equity Yield Fund |
Proxy Voting Policies and Procedures and Proxy Voting Record
A description of the policies and procedures that New York Life Investments uses to vote proxies related to the Fund’s securities is available without charge, upon request, (i) by visiting the Fund’s website at mainstayinvestments.com; and (ii) on the SEC’s website at www.sec.gov.
The Fund is required to file with the SEC its proxy voting records for the 12-month period ending June 30 on Form N-PX. The Fund’s most recent Form N-PX or proxy voting record is available free of charge upon request by calling 800-MAINSTAY (624-6782); visiting the Fund’s website at mainstayinvestments.com; or on the SEC’s website at www.sec.gov.
Shareholder Reports and Quarterly Portfolio Disclosure
The Fund is required to file its complete schedule of portfolio holdings with the SEC for its first and third fiscal quarters on Form N-Q. The Fund’s Form N-Q is available without charge, on the SEC’s website at www.sec.gov or by calling MainStay Investments at
800-MAINSTAY (624-6782). You also can obtain and review copies of Form N-Q by visiting the SEC’s Public Reference Room in Washington, DC (information on the operation of the Public Reference Room may be obtained by calling 1-800-SEC-0330).
| | | | |
| mainstayinvestments.com | | | 33 | |
This page intentionally left blank
MainStay Funds
MainStay offers a wide range of Funds for virtually any investment need. The full array of MainStay open-end offerings is listed here, with information about the manager, subadvisors, legal counsel and independent registered public accounting firms.
Equity
U.S. Equity Funds
MainStay Common Stock Fund
MainStay Cornerstone Growth Fund
MainStay Epoch U.S. All Cap Fund
MainStay Epoch U.S. Equity Yield Fund
MainStay ICAP Equity Fund
MainStay ICAP Select Equity Fund
MainStay Large Cap Growth Fund1
MainStay MAP Fund
MainStay S&P 500 Index Fund
MainStay U.S. Equity Opportunities Fund
MainStay U.S. Small Cap Fund
International/Global Equity Funds
MainStay Epoch Global Choice Fund
MainStay Epoch Global Equity Yield Fund
MainStay Epoch International Small Cap Fund
MainStay ICAP Global Fund
MainStay ICAP International Fund
MainStay International Equity Fund
MainStay International Opportunities Fund
Income
Taxable Bond Funds
MainStay Floating Rate Fund
MainStay Global High Income Fund
MainStay Government Fund
MainStay High Yield Corporate Bond Fund
MainStay High Yield Opportunities Fund
MainStay Indexed Bond Fund
MainStay Intermediate Term Bond Fund
MainStay Short Duration High Yield Fund
MainStay Short Term Bond Fund
MainStay Unconstrained Bond Fund
Municipal Bond Funds
MainStay California Tax Free Opportunities Fund2
MainStay High Yield Municipal Bond Fund
MainStay New York Tax Free Opportunities Fund3
MainStay Tax Free Bond Fund
Money Market Fund
MainStay Money Market Fund
Mixed Asset
MainStay Balanced Fund
MainStay Convertible Fund
MainStay Income Builder Fund
MainStay Marketfield Fund
Asset Allocation/Target Date
MainStay Conservative Allocation Fund
MainStay Growth Allocation Fund
MainStay Moderate Allocation Fund
MainStay Moderate Growth Allocation Fund
MainStay Retirement 2010 Fund
MainStay Retirement 2020 Fund
MainStay Retirement 2030 Fund
MainStay Retirement 2040 Fund
MainStay Retirement 2050 Fund
Manager
New York Life Investment Management LLC
New York, New York
Subadvisors
Cornerstone Capital Management Holdings LLC4
New York, New York
Cornerstone Capital Management LLC4
Bloomington, Minnesota
Epoch Investment Partners, Inc.
New York, New York
Institutional Capital LLC4
Chicago, Illinois
MacKay Shields LLC4
New York, New York
Marketfield Asset Management LLC
New York, New York
Markston International LLC
White Plains, New York
Winslow Capital Management LLC
Minneapolis, Minnesota
Legal Counsel
Dechert LLP
Independent Registered Public Accounting Firms
KPMG LLP
PricewaterhouseCoopers LLP
1. Effective January 13, 2012, the Fund was closed to new investors with certain exceptions.
2. This Fund is only registered for sale in AZ, CA, NV, OR, UT, and WA.
3. This Fund is only registered for sale in CT, DE, FL, MA, NJ, NY, and VT.
4. An affiliate of New York Life Investment Management LLC.
Not part of the Semiannual Report
For more information
800-MAINSTAY (624-6782)
mainstayinvestments.com
The MainStay Funds® are managed by New York Life Investment Management LLC and distributed through NYLIFE Distributors LLC, 169 Lackawanna Avenue, Parsippany, NJ 07054, a wholly owned subsidiary of New York Life Insurance Company. NYLIFE Distributors LLC is a Member FINRA/SIPC.
MainStay Investments® is a registered service mark and name under which New York Life Investment Management LLC does business. MainStay Investments, an indirect subsidiary of New York Life Insurance Company, New York, NY 10010, provides investment advisory products and services.
This report may be distributed only when preceded or accompanied by a current Fund prospectus.
©2013 NYLIFE Distributors LLC. All rights reserved.
| | | | | | | | |
| Not FDIC/NCUA Insured | | Not a Deposit | | May Lose Value | | No Bank Guarantee | | Not Insured by Any Government Agency |
| | |
| NYLIM-30138 MS175-13 | | MSEGEY10-06/13 NL0F3 |
MainStay Epoch International Small Cap Fund
Message from the President and Semiannual Report
Unaudited | April 30, 2013


This page intentionally left blank
Message from the President
The U.S. stock market advanced during the six months ended April 30, 2013, generally providing double-digit returns at all capitalization levels. Value stocks tended to outpace growth stocks among large- and mid-capitalization companies, while growth stocks tended to outpace value stocks among smaller companies.
The market’s advance, however, was far from uniform. Stocks declined in early November, both before and immediately after the U.S. presidential election. Following a sharp recovery, stocks climbed until mid-December, when a Congressional stalemate on the fiscal cliff led to a brief decline. Another dip occurred in late February as investors speculated that the Federal Open Market Committee (FOMC) might stop purchasing mortgage-backed securities sooner than expected. Stocks also dipped in mid-April, as consumer sentiment dropped after the Boston marathon bombing. Despite these setbacks, U.S. stocks continued to trend upward during the six-month reporting period.
International stock markets also advanced, with several regional differences. Accommodative action by the Bank of Japan helped lower the yen and lift Japanese stocks to their highest levels since 2008. In Europe, stocks did well until early February, bolstered by the promise of support for the euro. As the year progressed, however, economic contraction, rising unemployment and systematic banking concerns took a toll on investor enthusiasm. In China, manufacturing slowed as the nation sought to balance growth and inflation risks. On the Korean peninsula, tensions rose as North Korea continued to threaten its neighbors, which added an undercurrent of caution to the market.
During the six months ended April 30, 2013, the FOMC kept the federal funds rate in a range close to zero. The FOMC also continued its direct purchases of mortgage-backed securities and longer-term U.S. government securities. With short-term interest rates likely to remain at low levels, many bond investors pursued higher yields by lengthening maturities and assuming greater risk. As a result, bonds with higher risk profiles tended
to outperform higher-quality investment-grade bonds and U.S. Treasury securities. Cash and cash equivalents essentially returned zero.
With wide variations in the performance of various asset classes, some investors might be tempted to chase higher returns by shifting back and forth between stocks and bonds. Since no one can predict where the market will move next, however, we encourage investors to select an appropriate mix of investments for their risk tolerance and time horizon and to stick with that mix, making only minor adjustments over time.
At MainStay Funds, our portfolio managers use a similar approach. Careful security selection and thoughtful sell disciplines help them pursue the investment objectives of their respective Funds. Using the principal investment strategies outlined in the Prospectus, they focus primarily on providing long-term investment potential for our shareholders.
Has this approach proved successful? In its most recent rankings, Barron’s listed MainStay Funds as the #1 fund family over the past 10 years. We were also the only mutual fund family that has appeared in Barron’s top six for the past five consecutive years.
The pages that follow provide additional insight into the specific market events, investment decisions and securities that shaped your MainStay Fund(s) during the six months ended April 30, 2013. We encourage you to read the semiannual report(s) carefully and to evaluate your results with your long-term financial goals in mind.
Sincerely,

Stephen P. Fisher
President
The opinions expressed are as of the date of this report and are subject to change. There is no guarantee that any forecast made will come to pass. This material does not constitute investment advice and is not intended as an endorsement of any specific investment.
To qualify for the Lipper/Barron’s Fund Survey, a fund family must have at least three funds in Lipper’s general U.S.-stock category, one in world equity (which combines global and international funds), one mixed-equity fund (which holds stocks and bonds), two taxable-bond funds, and one tax-exempt fund. Fund loads and 12b-1 fees aren’t included in the calculation of returns because the aim is to measure the manager’s skill. Each fund’s return is measured against all funds in its Lipper category, resulting in a percentile ranking which is then weighted by asset size relative to the fund family’s other assets in its general classifications. Finally, the score is multiplied by the general classification weightings as determined by the entire Lipper universe of funds.
Source: Barron’s, 2/9/13. Overall, MainStay Funds ranked number 56 for the one-year period, 20 for the five-year period and one for the 10-year period ended December 31, 2012, out of 62, 53 and 46 fund families, respectively. MainStay ranked number three for the 10-year period in 2009, 2010 and 2011 from among 48, 46 and 45 fund families, respectively. MainStay ranked number six from among 48 fund families for the 10-year period in 2008. Past performance is no guarantee of future results, which will vary. For the most recent MainStay Funds performance, please visit our website at mainstayinvestments.com. All mutual funds are subject to market risk and will fluctuate in value.
Not part of the Semiannual Report
Table of Contents
Investors should refer to the Fund’s Summary Prospectus and/or Prospectus and consider the Fund’s investment objectives, strategies, risks, charges and expenses carefully before investing. The Summary Prospectus and/or Prospectus contain this and other information about the Fund. You may obtain copies of the Fund’s Summary Prospectus, Prospectus and Statement of Additional Information free of charge, upon request, by calling toll-free 800-MAINSTAY (624-6782), by writing to NYLIFE Distributors LLC, Attn: MainStay Marketing Department, 169 Lackawanna Avenue, Parsippany, New Jersey 07054 or by sending an e-mail to MainStayShareholderServices@nylim.com. These documents are also available via the MainStay Funds’ website at mainstayinvestments.com/documents. Please read the Summary Prospectus and/or Prospectus carefully before investing.
Investment and Performance Comparison1 (Unaudited)
Performance data quoted represents past performance. Past performance is no guarantee of future results. Because of market volatility, current performance may be lower or higher than the figures shown. Investment return and principal value will fluctuate, and as a result, when shares are redeemed, they may be worth more or less than their original cost. The graph below depicts the historical performance of Class I shares of the Fund. Performance will vary from class to class based on differences in class-specific expenses and sales charges. For performance information current to the most recent month-end, please call 800-MAINSTAY (624-6782) or visit mainstayinvestments.com.
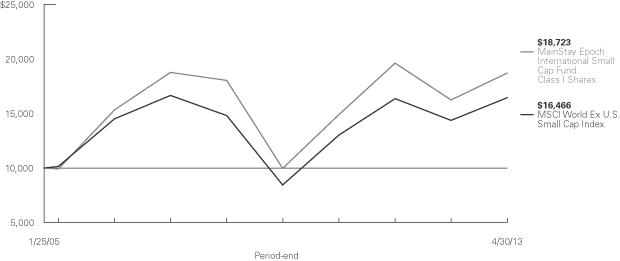
Average Annual Total Returns for the Period Ended April 30, 2013
| | | | | | | | | | | | | | | | | | | | | | | | |
| Class | | Sales Charge | | | | Six Months | | | One Year | | | Five Years | | | Since
Inception
(1/25/05) | | | Gross
Expense
Ratio2 | |
| Investor Class Shares3 | | Maximum 5.5% Initial Sales Charge | | With sales charges Excluding sales charges | |
| 6.40
12.60 | %
| |
| 8.42
14.73 | %
| |
| –0.82
0.31 | %
| |
| 6.72
7.45 | %
| |
| 1.76
1.76 | %
|
| Class | | Sales Charge | | | | Six Months | | | One Year | | | Five Years | | | Since
Inception
(8/2/06) | | | Gross
Expense
Ratio2 | |
| Class A Shares4 | | Maximum 5.5% Initial Sales Charge | | With sales charges Excluding sales charges | |
| 6.48
12.68 | %
| |
| 8.56
14.87 | %
| |
| –0.79
0.34 | %
| |
| 2.84
3.71 | %
| |
| 1.64
1.64 | %
|
| Class | | Sales Charge | | | | Six Months | | | One Year | | | Five Years | | | Since
Inception
(1/25/05) | | | Gross
Expense
Ratio2 | |
| Class C Shares3 | | Maximum 1% CDSC if Redeemed Within One Year of Purchase | | With sales charges Excluding sales charges | |
| 11.18
12.18 | %
| |
| 12.88
13.88 | %
| |
| –0.28
–0.28 | %
| |
| 6.80
6.80 | %
| |
| 2.51
2.51 | %
|
| Class | | Sales Charge | | | | Six Months | | | One Year | | | Five Years | | | Since
Inception
(1/25/05) | | | Gross
Expense
Ratio2 | |
| Class I Shares4 | | No Sales Charge | | | | | 12.84 | % | | | 15.16 | % | | | 0.74 | % | | | 7.88 | % | | | 1.39 | % |
| 1. | The performance table and graph do not reflect the deduction of taxes that a shareholder would pay on dividends, distributions or Fund share redemptions. Total returns reflect maximum applicable sales charges as indicated in the table above, changes in share price, and reinvestment of dividend and capital gain distributions. The graph assumes the initial investment amount shown above and reflects the deduction of all sales charges that would have applied for the period of investment. Performance figures reflect certain fee waivers and/or expense limitations, without which total returns may have been lower. For more information on share classes and current fee waivers and/or expense limitations, please refer to the notes to the financial statements. |
| 2. | The gross expense ratios presented reflect the Fund’s “Total Annual Fund Operating Expenses” from the most recent Prospectus and may differ from other expense ratios disclosed in this report. |
| 3. | Performance figures for Investor Class and Class C shares, first offered on November 16, 2009, include the historical performance of Class I shares from January 25, 2005 through November 15, 2009 adjusted for differences in certain expenses and fees. Unadjusted, the performance for Investor Class and Class C shares would likely have been different. |
| 4. | Performance figures for Class I shares and Class A shares include the historical performance of the Institutional shares from January 25, 2005 and the Class P shares from August 2, 2006, respectively, of the Epoch International Small Cap Fund (the predecessor to the Fund), through November 15, 2009. The Epoch International Small Cap Fund was subject to a different fee structure and was advised by Epoch Investment Partners, Inc. |
The footnotes on the next page are an integral part of the tables and graphs and should be carefully read in conjunction with them.
| | | | |
| mainstayinvestments.com | | | 5 | |
| | | | | | | | | | | | | | | | |
| Benchmark Performance | | Six
Months | | | One
Year | | | Five
Years | | | Since
Inception
of the Fund | |
MSCI World Ex U.S. Small Cap Index5 | | | 15.13 | % | | | 14.68 | % | | | 2.14 | % | | | 6.22 | % |
Average Lipper International Small-/Mid-Cap Growth Fund6 | | | 14.82 | | | | 16.80 | | | | 2.69 | | | | 8.08 | |
| 5. | The MSCI World Ex U.S. Small Cap Index is composed of small capitalization stocks designed to measure equity performance in global developed markets, excluding the U.S. The MSCI World Ex U.S. Small Cap Index is the Fund’s broad-based securities market index for comparison purposes. Total returns assume reinvestment of all dividends and capital gains. An investment cannot be made directly in an index. |
| 6. | The average Lipper international small-/mid-cap growth fund is representative of funds that, by portfolio practice, invest at least 75% of their equity assets in companies strictly outside of the U.S. with market |
| | capitalizations (on a three-year weighted basis) below Lipper’s international large-cap floor. International small-/mid-cap growth funds typically have an above-average price-to-cash flow ratio, price-to book ratio, and three-year sales-per-share growth value compared to their cap-specific subset of the S&P/Citigroup World ex-U.S. BMI. This benchmark is a product of Lipper Inc. Lipper Inc. is an independent monitor of fund performance. Results are based on average total returns of similar funds with all dividend and capital gain distributions reinvested. |
The footnotes on the preceding page are an integral part of the table and graph and should be carefully read in conjunction with them.
| | |
| 6 | | MainStay Epoch International Small Cap Fund |
Cost in Dollars of a $1,000 Investment in MainStay Epoch International Small Cap Fund (Unaudited)
The example below is intended to describe the fees and expenses borne by shareholders during the six-month period from November 1, 2012, to April 30, 2013, and the impact of those costs on your investment.
Example
As a shareholder of the Fund, you incur two types of costs: (1) transaction costs, including exchange fees and sales charges (loads) on purchases (as applicable), and (2) ongoing costs, including management fees, distribution and/or service (12b-1) fees, and other Fund expenses (as applicable). This example is intended to help you understand your ongoing costs (in dollars) of investing in the Fund and to compare these costs with the ongoing costs of investing in other mutual funds. The example is based on an investment of $1,000 made at the beginning of the six-month period and held for the entire period from November 1, 2012, to April 30, 2013.
This example illustrates your Fund’s ongoing costs in two ways:
Actual Expenses
The second and third data columns in the table below provide information about actual account values and actual expenses. You may use the information in these columns, together with the amount you invested, to estimate the expenses that you paid during the six months ended April 30, 2013. Simply divide your account value by $1,000 (for example, an $8,600 account value divided by $1,000 = 8.6), then
multiply the result by the number under the heading entitled “Expenses Paid During Period” to estimate the expenses you paid on your account during this period.
Hypothetical Example for Comparison Purposes
The fourth and fifth data columns in the table below provide information about hypothetical account values and hypothetical expenses based on the Fund’s actual expense ratio and an assumed rate of return of 5% per year before expenses, which is not the Fund’s actual return. The hypothetical account values and expenses may not be used to estimate the actual ending account balances or expenses you paid for the six-month period shown. You may use this information to compare the ongoing costs of investing in the Fund with the ongoing costs of investing in other Funds. To do so, compare this 5% hypothetical example with the 5% hypothetical examples that appear in the shareholder reports of the other Funds.
Please note that the expenses shown in the table are meant to highlight your ongoing costs only and do not reflect any transactional costs, such as exchange fees or sales charges (loads). Therefore, the fourth and fifth data columns of the table are useful in comparing ongoing costs only and will not help you determine the relative total costs of owning different funds. In addition, if these transactional costs were included, your costs would have been higher.
| | | | | | | | | | | | | | | | | | | | |
| | | | | | | | | | | | | | | | |
| Share Class | | Beginning
Account
Value
11/1/12 | | | Ending Account
Value (Based
on Actual
Returns and
Expenses)
4/30/13 | | | Expenses
Paid
During
Period1 | | | Ending Account
Value (Based
on Hypothetical
5% Annualized
Return and
Actual Expenses)
4/30/13 | | | Expenses
Paid
During
Period1 | |
| | | | | |
| Investor Class Shares | | $ | 1,000.00 | | | $ | 1,126.00 | | | $ | 9.44 | | | $ | 1,015.90 | | | $ | 8.95 | |
| | | | | |
| Class A Shares | | $ | 1,000.00 | | | $ | 1,126.80 | | | $ | 8.70 | | | $ | 1,016.60 | | | $ | 8.25 | |
| | | | | |
| Class C Shares | | $ | 1,000.00 | | | $ | 1,121.80 | | | $ | 13.36 | | | $ | 1,012.20 | | | $ | 12.67 | |
| | | | | |
| Class I Shares | | $ | 1,000.00 | | | $ | 1,128.40 | | | $ | 7.39 | | | $ | 1,017.90 | | | $ | 7.00 | |
| 1. | Expenses are equal to the Fund’s annualized expense ratio of each class (1.79% for Investor Class, 1.65% for Class A, 2.54% for Class C and 1.40% for Class I) multiplied by the average account value over the period, divided by 365 and multiplied by 181 (to reflect the six-month period). The table above represents the actual expenses incurred during the six-month period. |
| | | | |
| mainstayinvestments.com | | | 7 | |
Country Composition as of April 30, 2013 (Unaudited)
| | | | |
| United Kingdom | | | 27.0 | % |
| Japan | | | 22.9 | |
| Germany | | | 7.0 | |
| Italy | | | 6.8 | |
| Switzerland | | | 6.6 | |
| France | | | 5.2 | |
| Canada | | | 4.8 | |
| Hong Kong | | | 2.5 | |
| Spain | | | 2.0 | |
| Norway | | | 1.6 | |
| Australia | | | 1.5 | |
| Ireland | | | 1.3 | |
| Netherlands | | | 1.3 | |
| Taiwan | | | 1.3 | |
| Bermuda | | | 1.1 | |
| | | | |
| Sweden | | | 1.1 | % |
| Austria | | | 1.0 | |
| Singapore | | | 0.7 | |
| Brazil | | | 0.6 | |
| Luxembourg | | | 0.6 | |
| Monaco | | | 0.6 | |
| Mexico | | | 0.5 | |
| Portugal | | | 0.5 | |
| Republic of Korea | | | 0.5 | |
| United Arab Emirates | | | 0.4 | |
| Philippines | | | 0.3 | |
| Greece | | | 0.2 | |
| United States | | | 0.2 | |
| Other Assets, Less Liabilities | | | –0.1 | |
| | | | |
| | | 100.0 | % |
| | | | |
See Portfolio of Investments beginning on page 11 for specific holdings within these categories.
Top Ten Holdings as of April 30, 2013 (excluding short-term investment)
| 2. | ProSiebenSat.1 Media A.G. |
| 3. | Barratt Developments PLC |
| 6. | Altran Technologies S.A. |
| 7. | Intermediate Capital Group PLC |
| 8. | Temenos Group A.G. Registered |
| 9. | Babcock International Group PLC |
| | |
| 8 | | MainStay Epoch International Small Cap Fund |
Portfolio Management Discussion and Analysis (Unaudited)
Questions answered by portfolio managers Eric Citerne, CFA, Michael Welhoelter, CFA, and William Priest, CFA, of Epoch Investment Partners, Inc., the Fund’s Subadvisor.
How did MainStay Epoch International Small Cap Fund perform relative to its peers and its benchmark during the six months ended April 30, 2013?
Excluding all sales charges, MainStay Epoch International Small Cap Fund returned 12.60% for Investor Class shares, 12.68% for Class A shares and 12.18% for Class C shares for the six months ended April 30, 2013. Over the same period, Class I shares returned 12.84%. All share classes underperformed the 14.82% return of the average Lipper1 international small-/mid-cap growth fund and the 15.13% return of the MSCI World Ex U.S. Small Cap Index2 during the six months ended April 30, 2013. The MSCI World Ex U.S. Small Cap Index is the Fund’s broad-based securities-market index. See page 5 for Fund returns with applicable sales charges.
What factors affected the Fund’s relative performance during the reporting period?
Several factors affected the Fund’s performance relative to the MSCI World Ex U.S. Small Cap Index during the reporting period. The main detractors from relative performance were stock selection in the industrials and consumer discretionary sectors. Stock selection in the materials sector was a positive contributor during the reporting period.
During the reporting period, which sectors were the strongest positive contributors to the Fund’s relative performance and which sectors were particularly weak?
The strongest positive contributor to the Fund’s performance relative to the MSCI World Ex U.S. Small Cap Index was the materials sector, where stock selection proved favorable. (Contributions take weightings and total returns into account.) The Fund’s overweight position and stock selection within the health care sector also helped relative performance. An overweight position in the information technology sector contributed positively to the Fund’s relative return.
Stock selection within the industrials sector was the largest detractor from the Fund’s relative results during the reporting period. Financials and consumer discretionary were large positive contributors to absolute performance, but returns relative to the MSCI World Ex U.S. Small Cap Index were hurt by stock selection in both sectors and by an underweight position in financials.
During the reporting period, which individual stocks made the strongest positive contributions to the Fund’s absolute performance and which stocks detracted the most?
U.K.-based equipment rental company Ashtead Group was a strong contributor during the reporting period and was a large
position in the Fund. The company continued to deliver positive results on strong demand. Barratt Developments, which builds homes and commercial developments in the U.K., benefited from the government’s pledge to provide and guarantee billions of pounds in loans to home buyers in an effort to boost home ownership and construction. German company ProSiebenSat. 1 Media was another top contributor. Stock performance was driven by growth in the company’s digital leisure activities segment and by a special dividend resulting from the sale of the company’s Scandinavian assets.
Among the Fund’s largest detractors from absolute performance during the reporting period was Netherlands-based construction service company Royal Imtech. Shares of Royal Imtech declined after the company announced fraudulent reporting activity at its Polish subsidiary. Canadian gold producer Detour Gold saw its stock price decline as the price of gold slumped below $1,400 an ounce, dragging producers and miners further into bear-market territory.
Did the Fund make any significant purchases or sales during the reporting period?
The Fund purchased shares of JSR during the reporting period. This Japan-based company is mainly engaged in the manufacture and sale of elastomer and resin products. The Fund also bought shares of Japanese analyzer instruments and systems manufacturer Horiba, as signs of the country’s long overdue recovery appeared to be gaining traction under Prime Minster Abe’s aggressive stimulus policies. The Fund also established a position in Italian financial services provider Mediolanum. The purchase came as the International Monetary Fund praised the Italian banking system for taking the steps necessary to improve its governance, cut costs and meet capital adequacy requirements.
We eliminated Royal Imtech from the Fund. The company’s involvement in fraudulent reporting activity came on the heels of working-capital issues that we were already closely monitoring. Shares of Xingda, a Chinese materials company focused on the tire industry, declined after a profit warning. The announcement resulted from a tepid recovery for heavy-duty tire cords and from tax increases (that is, suppression of subsidies because of the weak fiscal condition of the local government). We eliminated the Fund’s position in the company.
How did the Fund’s sector weightings change during the reporting period?
The most significant change in the Fund’s sector weightings relative to the MSCI World Ex U.S. Small Cap Index was in the industrials sector, where we reduced an overweight position at the beginning of the reporting period to an underweight position by the end of April. The Fund’s health care exposure was also
| 1. | See footnote on page 6 for more information on Lipper Inc. |
| 2. | See footnote on page 6 for more information on the MSCI World Ex U.S. Small Cap Index. |
| | | | |
| mainstayinvestments.com | | | 9 | |
reduced but remained significantly overweight relative to the Index. The largest increase in exposure occurred in the information technology sector, where the Fund’s weighting increased from a moderate to a significantly overweight position relative to the Index. We also increased the Fund’s allocation to the financials sector, bringing it closer to the Index weight.
How was the Fund positioned at the end of April 2013?
All sector weights are arrived at through stock selection rather than top-down decisions on the attractiveness of specific sectors. As of April 30, 2013, the Fund was overweight relative to the MSCI World Ex U.S. Small Cap Index in the information
technology sector (with positions in 14 companies compared to 11 in the Index) and in the health care sector (with positions in 11 companies compared to seven in the Index.) On the same date, the Fund remained considerably less exposed than the Index to consumer staples and financials, despite a significant increase to the latter sector during the reporting period.
We remain committed to investing in high-quality, cash-generating businesses with sound capital allocation policies. In an environment where economic growth is slower than in past cycles, this is where we see opportunity, even if the market pauses in the near term after a period of outsized returns.
The opinions expressed are those of the portfolio managers as of the date of this report and are subject to change. There is no guarantee that any forecast made will come to pass. This material does not constitute investment advice and is not intended as an endorsement of any specific investment.
| | |
| 10 | | MainStay Epoch International Small Cap Fund |
Portfolio of Investments April 30, 2013 (Unaudited)
| | | | | | | | |
| | |
| | | Shares | | | Value | |
| | | | | | | | |
| Common Stocks 97.7%† | | | | | | | | |
Australia 1.5% | | | | | | | | |
Ausenco, Ltd. (Construction & Engineering) | | | 228,984 | | | $ | 657,564 | |
Challenger, Ltd. (Diversified Financial Services) | | | 91,685 | | | | 399,210 | |
Flight Centre, Ltd. (Hotels, Restaurants & Leisure) | | | 15,570 | | | | 616,118 | |
Pacific Brands, Ltd. (Distributors) | | | 382,290 | | | | 340,835 | |
| | | | | | | | |
| | | | | | | 2,013,727 | |
| | | | | | | | |
Austria 1.0% | | | | | | | | |
Andritz A.G. (Machinery) | | | 19,590 | | | | 1,276,537 | |
| | | | | | | | |
| | |
Bermuda 1.1% | | | | | | | | |
Validus Holdings, Ltd. (Insurance) | | | 38,800 | | | | 1,498,068 | |
| | | | | | | | |
| | |
Brazil 0.6% | | | | | | | | |
BR Properties S.A. (Real Estate Management & Development) | | | 31,660 | | | | 352,877 | |
Porto Seguro S.A. (Insurance) | | | 32,340 | | | | 405,876 | |
| | | | | | | | |
| | | | | | | 758,753 | |
| | | | | | | | |
Canada 4.8% | | | | | | | | |
Algonquin Power & Utilities Corp. (Independent Power Producers & Energy Traders) (a) | | | 97,100 | | | | 767,200 | |
Algonquin Power & Utilities Corp. (Independent Power Producers & Energy Traders) | | | 84,833 | | | | 670,277 | |
Calfrac Well Services, Ltd. (Energy Equipment & Services) | | | 21,050 | | | | 534,686 | |
Capstone Mining Corp. (Metals & Mining) (b) | | | 255,060 | | | | 516,475 | |
CCL Industries, Inc. Class B (Containers & Packaging) | | | 23,390 | | | | 1,461,744 | |
Cott Corp. (Beverages) | | | 86,350 | | | | 948,826 | |
Dorel Industries, Inc. Class B (Household Durables) | | | 11,870 | | | | 512,527 | |
Whitecap Resources, Inc. (Oil, Gas & Consumable Fuels) | | | 93,000 | | | | 954,509 | |
| | | | | | | | |
| | | | | | | 6,366,244 | |
| | | | | | | | |
France 5.2% | | | | | | | | |
Alten, Ltd. (IT Services) | | | 26,660 | | | | 960,607 | |
¨Altran Technologies S.A. (IT Services) (b) | | | 292,240 | | | | 2,301,496 | |
Eurofins Scientific (Life Sciences Tools & Services) (b) | | | 4,720 | | | | 1,025,641 | |
IPSOS (Media) | | | 33,830 | | | | 1,133,859 | |
JC Decaux S.A. (Media) | | | 12,950 | | | | 355,928 | |
Mersen (Electrical Equipment) | | | 22,900 | | | | 529,276 | |
Saft Groupe S.A. (Electrical Equipment) | | | 24,596 | | | | 605,401 | |
| | | | | | | | |
| | | | | | | 6,912,208 | |
| | | | | | | | |
| | | | | | | | |
| | |
| | | Shares | | | Value | |
| | | | | | | | |
Germany 4.8% | | | | | | | | |
Deutsche Wohnen A.G. (Real Estate Management & Development) | | | 43,136 | | | $ | 760,659 | |
Deutz A.G. (Machinery) (b) | | | 90,400 | | | | 489,067 | |
Duerr A.G. (Machinery) | | | 8,950 | | | | 1,018,136 | |
GFK SE (Media) | | | 14,250 | | | | 813,154 | |
Hamburger Hafen und Logistik A.G. (Transportation Infrastructure) | | | 30,075 | | | | 647,183 | |
Krones A.G. (Machinery) | | | 9,300 | | | | 646,798 | |
KUKA A.G. (Machinery) (b) | | | 11,450 | | | | 517,212 | |
Morphosys A.G. (Life Sciences Tools & Services) (b) | | | 32,850 | | | | 1,491,884 | |
| | | | | | | | |
| | | | | | | 6,384,093 | |
| | | | | | | | |
Greece 0.2% | | | | | | | | |
Hellenic Exchanges S.A. (Diversified Financial Services) | | | 50,230 | | | | 336,706 | |
| | | | | | | | |
| | |
Hong Kong 2.5% | | | | | | | | |
Hutchison Telecommunications Hong Kong Holdings, Ltd. (Diversified Telecommunication Services) | | | 790,760 | | | | 419,828 | |
Kingboard Chemical Holdings, Ltd. (Electronic Equipment, Instruments & Components) | | | 205,320 | | | | 559,592 | |
Peace Mark Holdings, Ltd. (Textiles, Apparel & Luxury Goods) (a)(b)(c) | | | 1,118,750 | | | | 1,442 | |
Sino Biopharmaceutical, Ltd. (Pharmaceuticals) | | | 1,372,300 | | | | 946,091 | |
Television Broadcasts, Ltd. (Media) | | | 92,220 | | | | 692,825 | |
Vitasoy International Holdings, Ltd. (Food Products) | | | 593,930 | | | | 723,264 | |
| | | | | | | | |
| | | | | | | 3,343,042 | |
| | | | | | | | |
Ireland 1.3% | | | | | | | | |
Smurfit Kappa Group PLC (Containers & Packaging) | | | 118,580 | | | | 1,759,968 | |
| | | | | | | | |
| | |
Italy 6.8% | | | | | | | | |
Amplifon S.p.A. (Health Care Providers & Services) | | | 138,150 | | | | 711,373 | |
Astaldi S.p.A. (Construction & Engineering) | | | 168,798 | | | | 1,165,956 | |
Azimut Holding S.p.A (Capital Markets) | | | 68,300 | | | | 1,270,062 | |
Banca Generali S.p.A. (Capital Markets) | | | 60,503 | | | | 1,246,983 | |
Banca Popolare dell’Emilia Romagna Scrl (Commercial Banks) | | | 39,100 | | | | 331,098 | |
Danieli & Co. S.p.A. (Machinery) | | | 54,094 | | | | 905,449 | |
Lottomatica Group S.p.A (Hotels, Restaurants & Leisure) | | | 15,200 | | | | 387,542 | |
Mediolanum S.p.A. (Insurance) | | | 218,525 | | | | 1,472,029 | |
| † | Percentages indicated are based on Fund net assets. |
| ¨ | | Among the Fund’s 10 largest holdings, as of April 30, 2013, excluding short-term investment. May be subject to change daily. |
| | | | | | |
The notes to the financial statements are an integral part of,
and should be read in conjunction with, the financial statements. | | mainstayinvestments.com | | | 11 | |
Portfolio of Investments April 30, 2013 (Unaudited) (continued)
| | | | | | | | |
| | |
| | | Shares | | | Value | |
| | | | | | | | |
| Common Stocks (continued) | | | | | | | | |
Italy (continued) | | | | | | | | |
Salvatore Ferragamo Italia S.p.A. (Textiles, Apparel & Luxury Goods) | | | 23,680 | | | $ | 706,973 | |
Tod’s S.p.A. (Textiles, Apparel & Luxury Goods) | | | 5,949 | | | | 863,366 | |
| | | | | | | | |
| | | | | | | 9,060,831 | |
| | | | | | | | |
Japan 22.9% | | | | | | | | |
Air Water, Inc. (Chemicals) | | | 58,160 | | | | 939,652 | |
Anritsu Corp. (Electronic Equipment, Instruments & Components) | | | 61,900 | | | | 923,881 | |
ASKUL Corp. (Internet & Catalog Retail) | | | 46,100 | | | | 817,633 | |
Century Tokyo Leasing Corp. (Diversified Financial Services) | | | 22,900 | | | | 675,125 | |
Daicel Corp. (Chemicals) | | | 148,000 | | | | 1,191,773 | |
DTS Corp. (Software) | | | 48,000 | | | | 804,062 | |
GMO Internet, Inc. (Internet Software & Services) | | | 131,200 | | | | 1,717,302 | |
Hitachi Zosen Corp. (Machinery) | | | 223,000 | | | | 370,580 | |
Horiba, Ltd. (Electronic Equipment, Instruments & Components) | | | 45,250 | | | | 1,633,892 | |
Japan Logistics Fund, Inc. (Real Estate Investment Trusts) | | | 89 | | | | 962,261 | |
JGC Corp. (Construction & Engineering) | | | 52,750 | | | | 1,561,099 | |
¨JSR Corp. (Chemicals) | | | 100,800 | | | | 2,319,274 | |
Kansai Paint Co., Ltd. (Chemicals) | | | 69,440 | | | | 889,681 | |
KYB Co., Ltd. (Auto Components) | | | 159,000 | | | | 866,072 | |
MISUMI Group, Inc. (Trading Companies & Distributors) | | | 13,600 | | | | 414,480 | |
Monex Group, Inc. (Capital Markets) | | | 780 | | | | 351,254 | |
Nabtesco Corp. (Machinery) | | | 43,800 | | | | 965,995 | |
Nifco, Inc. (Auto Components) | | | 30,450 | | | | 693,742 | |
Nihon Kohden Corp. (Health Care Equipment & Supplies) | | | 16,500 | | | | 633,867 | |
Nippon Shokubai Co., Ltd. (Chemicals) | | | 131,000 | | | | 1,284,669 | |
Rohto Pharmaceutical Co., Ltd. (Pharmaceuticals) | | | 78,000 | | | | 1,094,568 | |
Santen Pharmaceutical Co., Ltd. (Pharmaceuticals) | | | 8,500 | | | | 425,501 | |
Sawai Pharmaceutical Co., Ltd. (Pharmaceuticals) | | | 13,600 | | | | 1,755,019 | |
Sundrug Co., Ltd. (Food & Staples Retailing) | | | 26,600 | | | | 1,167,852 | |
Suruga Bank, Ltd. (Commercial Banks) | | | 92,000 | | | | 1,625,112 | |
¨Sysmex Corp. (Health Care Equipment & Supplies) | | | 29,300 | | | | 1,887,511 | |
Takata Corp. (Auto Components) | | | 18,600 | | | | 356,603 | |
Tokyo Ohka Kogyo Co., Ltd. (Chemicals) | | | 35,800 | | | | 774,868 | |
Toyo Tanso Co., Ltd. (Electrical Equipment) | | | 21,600 | | | | 471,506 | |
TS Tech Co., Ltd. (Auto Components) | | | 24,300 | | | | 737,587 | |
| | | | | | | | |
| | | | | | | 30,312,421 | |
| | | | | | | | |
Luxembourg 0.6% | | | | | | | | |
L’Occitane International S.A. (Specialty Retail) | | | 253,450 | | | | 734,860 | |
| | | | | | | | |
| | | | | | | | |
| | |
| | | Shares | | | Value | |
| | | | | | | | |
Mexico 0.5% | | | | | | | | |
Genomma Lab Internacional S.A.B. de C.V. Class B (Pharmaceuticals) (b) | | | 103,270 | | | $ | 223,001 | |
Grupo Aeroportuario Del Sureste S.A.B. de C.V. Class B (Transportation Infrastructure) | | | 40,700 | | | | 505,134 | |
| | | | | | | | |
| | | | | | | 728,135 | |
| | | | | | | | |
Monaco 0.6% | | | | | | | | |
Scorpio Tankers, Inc. (Oil, Gas & Consumable Fuels) (b) | | | 91,600 | | | | 792,340 | |
| | | | | | | | |
| | |
Netherlands 1.3% | | | | | | | | |
Delta Lloyd N.V. (Insurance) | | | 50,690 | | | | 971,303 | |
Fugro N.V. (Energy Equipment & Services) | | | 13,389 | | | | 774,514 | |
| | | | | | | | |
| | | | | | | 1,745,817 | |
| | | | | | | | |
Norway 1.6% | | | | | | | | |
Dolphin Group ASA (Energy Equipment & Services) (b) | | | 174,776 | | | | 189,430 | |
Petroleum Geo-Services ASA (Energy Equipment & Services) | | | 56,660 | | | | 829,291 | |
SpareBank 1 SMN (Commercial Banks) | | | 41,250 | | | | 350,516 | |
SpareBank 1 SR Bank ASA (Commercial Banks) | | | 80,666 | | | | 720,419 | |
| | | | | | | | |
| | | | | | | 2,089,656 | |
| | | | | | | | |
Philippines 0.3% | | | | | | | | |
Globe Telecom, Inc. (Wireless Telecommunication Services) | | | 10,020 | | | | 348,120 | |
| | | | | | | | |
| | |
Portugal 0.5% | | | | | | | | |
Banco Espirito Santo S.A. (Commercial Banks) (b) | | | 584,460 | | | | 668,873 | |
| | | | | | | | |
| | |
Republic of Korea 0.5% | | | | | | | | |
Daum Communications Corp. (Internet Software & Services) | | | 7,950 | | | | 649,687 | |
| | | | | | | | |
| | |
Singapore 0.7% | | | | | | | | |
Biosensors International Group, Ltd. (Health Care Equipment & Supplies) (b) | | | 905,230 | | | | 881,932 | |
| | | | | | | | |
| | |
Spain 2.0% | | | | | | | | |
Bolsas Y Mercados Espanoles S.A. (Diversified Financial Services) | | | 45,450 | | | | 1,233,021 | |
Jazztel PLC (Diversified Telecommunication Services) (b) | | | 191,543 | | | | 1,440,363 | |
| | | | | | | | |
| | | | | | | 2,673,384 | |
| | | | | | | | |
Sweden 1.1% | | | | | | | | |
Modern Times Group AB Class B (Media) | | | 33,260 | | | | 1,422,558 | |
| | | | | | | | |
| | |
Switzerland 6.6% | | | | | | | | |
EFG International A.G. (Capital Markets) (b) | | | 71,082 | | | | 951,786 | |
GAM Holding A.G. (Capital Markets) (b) | | | 98,850 | | | | 1,743,536 | |
| | | | |
| 12 | | MainStay Epoch International Small Cap Fund | | The notes to the financial statements are an integral part of,
and should be read in conjunction with, the financial statements. |
| | | | | | | | |
| | |
| | | Shares | | | Value | |
| | | | | | | | |
| Common Stocks (continued) | | | | | | | | |
Switzerland (continued) | | | | | | | | |
Helvetia Holding A.G. (Insurance) | | | 2,100 | | | $ | 880,270 | |
Kuoni Reisen Holding A.G. Registered (Hotels, Restaurants & Leisure) (b) | | | 2,659 | | | | 810,741 | |
Partners Group Holding A.G. (Capital Markets) | | | 3,700 | | | | 949,075 | |
Sulzer A.G. (Machinery) | | | 8,450 | | | | 1,441,353 | |
¨Temenos Group A.G. Registered (Software) (b) | | | 84,464 | | | | 1,998,503 | |
| | | | | | | | |
| | | | | | | 8,775,264 | |
| | | | | | | | |
Taiwan 1.3% | | | | | | | | |
TXC Corp. (Electronic Equipment, Instruments & Components) | | | 563,459 | | | | 878,257 | |
WPG Holdings, Ltd. (Electronic Equipment, Instruments & Components) | | | 663,532 | | | | 799,287 | |
| | | | | | | | |
| | | | | | | 1,677,544 | |
| | | | | | | | |
United Arab Emirates 0.4% | | | | | | | | |
Polarcus, Ltd. (Energy Equipment & Services) (b) | | | 535,981 | | | | 484,256 | |
| | | | | | | | |
| | |
United Kingdom 27.0% | | | | | | | | |
Aberdeen Asset Management PLC (Capital Markets) | | | 119,280 | | | | 831,367 | |
Afren PLC (Oil, Gas & Consumable Fuels) (b) | | | 655,400 | | | | 1,365,226 | |
Alent PLC (Chemicals) (b) | | | 151,470 | | | | 798,090 | |
¨Ashtead Group PLC (Trading Companies & Distributors) | | | 342,280 | | | | 3,123,623 | |
¨Babcock International Group PLC (Commercial Services & Supplies) | | | 115,710 | | | | 1,923,198 | |
¨Barratt Developments PLC (Household Durables) (b) | | | 607,740 | | | | 2,937,830 | |
Beazley PLC (Insurance) | | | 224,937 | | | | 784,416 | |
Bovis Homes Group PLC (Household Durables) | | | 67,255 | | | | 802,334 | |
Catlin Group, Ltd. (Insurance) | | | 192,300 | | | | 1,569,717 | |
Domino’s Pizza Group PLC (Hotels, Restaurants & Leisure) | | | 78,650 | | | | 795,333 | |
Enquest PLC (Oil, Gas & Consumable Fuels) (b) | | | 317,270 | | | | 635,260 | |
Informa PLC (Media) | | | 183,297 | | | | 1,360,982 | |
¨Intermediate Capital Group PLC (Capital Markets) | | | 326,840 | | | | 2,144,511 | |
Lancashire Holdings, Ltd. (Insurance) | | | 49,240 | | | | 647,462 | |
Meggitt PLC (Aerospace & Defense) | | | 143,940 | | | | 1,047,739 | |
Micro Focus International PLC (Software) | | | 87,523 | | | | 910,211 | |
Millennium & Copthorne Hotels PLC (Hotels, Restaurants & Leisure) | | | 134,980 | | | | 1,185,690 | |
Paragon Group of Cos. PLC (Thrifts & Mortgage Finance) | | | 158,937 | | | | 771,268 | |
¨Playtech, Ltd. (Software) | | | 248,830 | | | | 2,369,368 | |
Premier Oil PLC (Oil, Gas & Consumable Fuels) (b) | | | 317,630 | | | | 1,839,853 | |
Restaurant Group PLC (Hotels, Restaurants & Leisure) | | | 166,350 | | | | 1,245,228 | |
Rexam PLC (Containers & Packaging) | | | 182,772 | | | | 1,466,389 | |
| | | | | | | | |
| | |
| | | Shares | | | Value | |
| | | | | | | | |
United Kingdom (continued) | | | | | | | | |
Spectris PLC (Electronic Equipment, Instruments & Components) | | | 26,800 | | | $ | 878,388 | |
SThree PLC (Professional Services) | | | 97,894 | | | | 510,173 | |
Subsea 7 S.A. (Energy Equipment & Services) | | | 64,731 | | | | 1,394,189 | |
Taylor Wimpey PLC (Household Durables) | | | 628,446 | | | | 907,863 | |
Vesuvius PLC (Machinery) | | | 82,120 | | | | 443,913 | |
Whitbread PLC (Hotels, Restaurants & Leisure) | | | 26,050 | | | | 1,033,875 | |
| | | | | | | | |
| | | | | | | 35,723,496 | |
| | | | | | | | |
Total Common Stocks
(Cost $104,826,065) | | | | | | | 129,418,520 | |
| | | | | | | | |
| |
| Preferred Stock 2.2% | | | | | |
Germany 2.2% | | | | | | | | |
¨ProSiebenSat.1 Media A.G. 5.47% (Media) | | | 76,940 | | | | 2,946,565 | |
| | | | | | | | |
Total Preferred Stock
(Cost $1,612,468) | | | | | | | 2,946,565 | |
| | | | | | | | |
| | |
| | | | | | | | |
| | | Principal Amount | | | | |
| Short-Term Investment 0.2% | | | | | |
Repurchase Agreement 0.2% | | | | | | | | |
United States 0.2% | | | | | | | | |
State Street Bank and Trust Co.
0.01%, dated 4/30/13
due 5/1/13
Proceeds at Maturity $228,995 (Collateralized by a Federal Home Loan Mortgage Corp. security with a rate of 2.10% and a maturity date of 10/17/22, with a Principal Amount of $240,000 and a Market Value of $238,456) (Capital Markets) | | $ | 228,995 | | | | 228,995 | |
| | | | | | | | |
Total Short-Term Investment
(Cost $228,995) | | | | | | | 228,995 | |
| | | | | | | | |
Total Investments
(Cost $106,667,528) (d) | | | 100.1 | % | | | 132,594,080 | |
Other Assets, Less Liabilities | | | (0.1 | ) | | | (177,881 | ) |
Net Assets | | | 100.0 | % | | $ | 132,416,199 | |
| (a) | Fair valued security—The total market value of these securities as of April 30, 2013 is $768,642, which represents 0.6% of the Fund’s net assets. |
| (b) | Non-income producing security. |
| (c) | Illiquid security—The total market value of this security as of April 30, 2013 is $1,442, which represents less than one-tenth of a percent of the Fund’s net assets. |
| | | | | | |
The notes to the financial statements are an integral part of,
and should be read in conjunction with, the financial statements. | | mainstayinvestments.com | | | 13 | |
Portfolio of Investments April 30, 2013 (Unaudited) (continued)
| (d) | As of April 30, 2013, cost is $110,090,333 for federal income tax purposes and net unrealized appreciation is as follows: |
| | | | |
Gross unrealized appreciation | | $ | 29,117,202 | |
Gross unrealized depreciation | | | (6,613,455 | ) |
| | | | |
Net unrealized appreciation | | $ | 22,503,747 | |
| | | | |
The following is a summary of the fair valuations according to the inputs used as of April 30, 2013, for valuing the Fund’s assets.
Asset Valuation Inputs
| | | | | | | | | | | | | | | | |
Description | | Quoted
Prices in
Active
Markets for
Identical
Assets (Level 1) | | | Significant
Other
Observable
Inputs (Level 2) | | | Significant
Unobservable
Inputs (Level 3) | | | Total | |
Investments in Securities (a) | | | | | | | | | | | | | | | | |
| Common Stocks (b) | | $ | 128,649,878 | | | $ | — | | | $ | 768,642 | | | $ | 129,418,520 | |
| Preferred Stock | | | 2,946,565 | | | | — | | | | — | | | | 2,946,565 | |
| Short-Term Investment | | | | | | | | | | | | | | | | |
Repurchase Agreements | | | — | | | | 228,995 | | | | — | | | | 228,995 | |
| | | | | | | | | | | | | | | | |
| Total Investments in Securities | | $ | 131,596,443 | | | $ | 228,995 | | | $ | 768,642 | | | $ | 132,594,080 | |
| | | | | | | | | | | | | | | | |
| (a) | For a complete listing of investments and their industries, see the Portfolio of Investments. |
| (b) | The Level 3 securities valued at $767,200 and $1,442 are securities listed under Canada in the Independent Power Producers & Energy Traders industry and Hong Kong in the Textiles, Apparel & Luxury Goods industry, respectively, within the Common Stocks section of the Portfolio of Investments. |
The Fund recognizes transfers between the levels as of the beginning of the period.
As of October 31, 2012 and April 30, 2013 foreign equity securities were not fair valued, as a result there were no transfers between Level 1 and Level 2 fair value measurements. (See Note 2)
The following is a reconciliation of investments in which significant unobservable inputs (Level 3) were used in determining value:
| | | | | | | | | | | | | | | | | | | | | | | | | | | | | | | | | | | | | | | | |
Investments in
Securities | | Balance
as of October 31, 2012 | | | Accrued Discounts
(Premiums) | | | Realized
Gain (Loss) | | | Change in Unrealized Appreciation
(Depreciation) | | | Purchases | | | Sales | | | Transfers
into Level 3 | | | Transfers
out of Level 3 | | | Balance
as of April 30,
2013 | | | Change in
Unrealized Appreciation (Depreciation) from Investments Still Held at April 30, 2013 (a) | |
| Common Stocks | | | | | | | | | | | | | | | | | | | | | | | | | | | | | | | | | | | | | |
Canada | | $ | 671,801 | | | $ | — | | | $ | — | | | $ | 95,399 | | | $ | — | | | $ | — | | | $ | — | | | $ | — | | | $ | 767,200 | | | $ | 95,399 | |
Hong Kong | | | 1,444 | | | | — | | | | — | | | | (2 | ) | | | — | | | | — | | | | — | | | | — | | | | 1,442 | | | | (2 | ) |
| | | | | | | | | | | | | | | | | | | | | | | | | | | | | | | | | | | | | | | | |
| Total | | $ | 673,245 | | | $ | — | | | $ | — | | | $ | 95,397 | | | $ | — | | | $ | — | | | $ | — | | | $ | — | | | $ | 768,642 | | | $ | 95,397 | |
| | | | | | | | | | | | | | | | | | | | | | | | | | | | | | | | | | | | | | | | |
| (a) | Included in “Net change in unrealized appreciation (depreciation) on investments” in the Statement of Operations. |
| | | | |
| 14 | | MainStay Epoch International Small Cap Fund | | The notes to the financial statements are an integral part of,
and should be read in conjunction with, the financial statements. |
The table below sets forth the diversification of MainStay Epoch International Small Cap Fund investments by industry.
Industry Diversification (Unaudited)
| | | | | | | | |
| | | Value | | | Percent † | |
Aerospace & Defense | | $ | 1,047,739 | | | | 0.8 | % |
Auto Components | | | 2,654,004 | | | | 2.0 | |
Beverages | | | 948,826 | | | | 0.7 | |
Capital Markets | | | 9,717,569 | | | | 7.3 | |
Chemicals | | | 8,198,007 | | | | 6.2 | |
Commercial Banks | | | 3,696,018 | | | | 2.8 | |
Commercial Services & Supplies | | | 1,923,198 | | | | 1.4 | |
Construction & Engineering | | | 3,384,619 | | | | 2.5 | |
Containers & Packaging | | | 4,688,101 | | | | 3.5 | |
Distributors | | | 340,835 | | | | 0.3 | |
Diversified Financial Services | | | 2,644,062 | | | | 2.0 | |
Diversified Telecommunication Services | | | 1,860,191 | | | | 1.4 | |
Electrical Equipment | | | 1,606,183 | | | | 1.2 | |
Electronic Equipment, Instruments & Components | | | 5,673,297 | | | | 4.3 | |
Energy Equipment & Services | | | 4,206,366 | | | | 3.2 | |
Food & Staples Retailing | | | 1,167,852 | | | | 0.9 | |
Food Products | | | 723,264 | | | | 0.5 | |
Health Care Equipment & Supplies | | | 3,403,310 | | | | 2.6 | |
Health Care Providers & Services | | | 711,373 | | | | 0.5 | |
Hotels, Restaurants & Leisure | | | 6,074,527 | | | | 4.6 | |
Household Durables | | | 5,160,554 | | | | 3.9 | |
Independent Power Producers & Energy Traders | | | 1,437,477 | | | | 1.1 | |
Insurance | | | 8,229,141 | | | | 6.2 | |
Internet & Catalog Retail | | | 817,633 | | | | 0.6 | |
Internet Software & Services | | | 2,366,989 | | | | 1.8 | |
IT Services | | | 3,262,103 | | | | 2.5 | |
Life Sciences Tools & Services | | | 2,517,525 | | | | 1.9 | |
Machinery | | | 8,075,040 | | | | 6.1 | |
Media | | | 8,725,871 | | | | 6.6 | |
Metals & Mining | | | 516,475 | | | | 0.4 | |
Oil, Gas & Consumable Fuels | | | 5,587,188 | | | | 4.2 | |
Pharmaceuticals | | | 4,444,180 | | | | 3.4 | |
Professional Services | | | 510,173 | | | | 0.4 | |
Real Estate Investment Trusts | | | 962,261 | | | | 0.7 | |
Real Estate Management & Development | | | 1,113,536 | | | | 0.8 | |
Software | | | 6,082,144 | | | | 4.6 | |
Specialty Retail | | | 734,860 | | | | 0.5 | |
Textiles, Apparel & Luxury Goods | | | 1,571,781 | | | | 1.2 | |
Thrifts & Mortgage Finance | | | 771,268 | | | | 0.6 | |
Trading Companies & Distributors | | | 3,538,103 | | | | 2.7 | |
Transportation Infrastructure | | | 1,152,317 | | | | 0.9 | |
Wireless Telecommunication Services | | | 348,120 | | | | 0.3 | |
| | | | | | | | |
| | | 132,594,080 | | | | 100.1 | |
Other Assets, Less Liabilities | | | (177,881 | ) | | | –0.1 | |
| | | | | | | | |
Net Assets | | $ | 132,416,199 | | | | 100.0 | % |
| | | | | | | | |
| † | Percentages indicated are based on Fund net assets. |
| | | | | | |
The notes to the financial statements are an integral part of,
and should be read in conjunction with, the financial statements. | | mainstayinvestments.com | | | 15 | |
Statement of Assets and Liabilities as of April 30, 2013 (Unaudited)
| | | | |
| Assets | |
Investment in securities, at value
(identified cost $106,667,528) | | $ | 132,594,080 | |
Cash denominated in foreign currencies
(identified cost $620,910) | | | 626,755 | |
Receivables: | | | | |
Dividends and interest | | | 528,006 | |
Investment securities sold | | | 130,244 | |
Fund shares sold | | | 54,774 | |
Other assets | | | 33,305 | |
| | | | |
Total assets | | | 133,967,164 | |
| | | | |
| |
| Liabilities | | | | |
Payables: | | | | |
Investment securities purchased | | | 1,273,318 | |
Manager (See Note 3) | | | 116,622 | |
Fund shares redeemed | | | 54,697 | |
Transfer agent (See Note 3) | | | 48,306 | |
Professional fees | | | 29,823 | |
Custodian | | | 16,066 | |
Shareholder communication | | | 8,329 | |
NYLIFE Distributors (See Note 3) | | | 2,276 | |
Trustees | | | 485 | |
Accrued expenses | | | 1,043 | |
| | | | |
Total liabilities | | | 1,550,965 | |
| | | | |
Net assets | | $ | 132,416,199 | |
| | | | |
| |
| Composition of Net Assets | | | | |
Shares of beneficial interest outstanding (par value of $.001 per share) unlimited number of shares authorized | | $ | 6,560 | |
Additional paid-in capital | | | 188,795,894 | |
| | | | |
| | | 188,802,454 | |
Distributions in excess of net investment income | | | (345,590 | ) |
Accumulated net realized gain (loss) on investments and foreign currency transactions | | | (81,970,474 | ) |
Net unrealized appreciation (depreciation) on investments | | | 25,926,552 | |
Net unrealized appreciation (depreciation) on translation of other assets and liabilities in foreign currencies | | | 3,257 | |
| | | | |
Net assets | | $ | 132,416,199 | |
| | | | |
| | | | |
Investor Class | | | | |
Net assets applicable to outstanding shares | | $ | 750,815 | |
| | | | |
Shares of beneficial interest outstanding | | | 38,380 | |
| | | | |
Net asset value per share outstanding | | $ | 19.56 | |
Maximum sales charge (5.50% of offering price) | | | 1.14 | |
| | | | |
Maximum offering price per share outstanding | | $ | 20.70 | |
| | | | |
Class A | | | | |
Net assets applicable to outstanding shares | | $ | 4,417,861 | |
| | | | |
Shares of beneficial interest outstanding | | | 225,148 | |
| | | | |
Net asset value per share outstanding | | $ | 19.62 | |
Maximum sales charge (5.50% of offering price) | | | 1.14 | |
| | | | |
Maximum offering price per share outstanding | | $ | 20.76 | |
| | | | |
Class C | | | | |
Net assets applicable to outstanding shares | | $ | 1,109,092 | |
| | | | |
Shares of beneficial interest outstanding | | | 57,539 | |
| | | | |
Net asset value and offering price per share outstanding | | $ | 19.28 | |
| | | | |
Class I | | | | |
Net assets applicable to outstanding shares | | $ | 126,138,431 | |
| | | | |
Shares of beneficial interest outstanding | | | 6,238,878 | |
| | | | |
Net asset value and offering price per share outstanding | | $ | 20.22 | |
| | | | |
| | | | |
| 16 | | MainStay Epoch International Small Cap Fund | | The notes to the financial statements are an integral part of,
and should be read in conjunction with, the financial statements. |
Statement of Operations for the six months ended April 30, 2013 (Unaudited)
| | | | |
| Investment Income (Loss) | |
Income | | | | |
Dividends (a) | | $ | 1,700,907 | |
Interest (b) | | | 36 | |
| | | | |
Total income | | | 1,700,943 | |
| | | | |
Expenses | | | | |
Manager (See Note 3) | | | 812,349 | |
Transfer agent (See Note 3) | | | 119,254 | |
Custodian | | | 67,843 | |
Registration | | | 28,804 | |
Professional fees | | | 27,377 | |
Distribution/Service—Investor Class (See Note 3) | | | 955 | |
Distribution/Service—Class A (See Note 3) | | | 6,396 | |
Distribution/Service—Class C (See Note 3) | | | 10,191 | |
Shareholder communication | | | 10,764 | |
Trustees | | | 1,827 | |
Miscellaneous | | | 11,215 | |
| | | | |
Total expenses before waiver/reimbursement | | | 1,096,975 | |
Expense waiver/reimbursement from Manager (See Note 3) | | | (43,071 | ) |
| | | | |
Net expenses | | | 1,053,904 | |
| | | | |
Net investment income (loss) | | | 647,039 | |
| | | | |
|
| Realized and Unrealized Gain (Loss) on Investments and Foreign Currency Transactions | |
Net realized gain (loss) on: | | | | |
Security transactions | | | 4,787,623 | |
Foreign currency transactions | | | (77,274 | ) |
| | | | |
Net realized gain (loss) on investments and foreign currency transactions | | | 4,710,349 | |
| | | | |
Net change in unrealized appreciation (depreciation) on: | | | | |
Investments | | | 12,217,858 | |
Translation of other assets and liabilities in foreign currencies | | | 8,734 | |
| | | | |
Net change in unrealized appreciation (depreciation) on investments and foreign currency transactions | | | 12,226,592 | |
| | | | |
Net realized and unrealized gain (loss) on investments and foreign currency transactions | | | 16,936,941 | |
| | | | |
Net increase (decrease) in net assets resulting from operations | | $ | 17,583,980 | |
| | | | |
| (a) | Dividends recorded net of foreign withholding taxes in the amount of $93,209. |
| (b) | Interest recorded net of foreign withholding taxes in the amount of $5. |
| | | | | | |
The notes to the financial statements are an integral part of,
and should be read in conjunction with, the financial statements. | | mainstayinvestments.com | | | 17 | |
Statements of Changes in Net Assets
for the six months ended April 30, 2013 (Unaudited) and the year ended October 31, 2012
| | | | | | | | |
| | | 2013 | | | 2012 | |
| Increase (Decrease) in Net Assets | |
Operations: | | | | | | | | |
Net investment income (loss) | | $ | 647,039 | | | $ | 2,689,666 | |
Net realized gain (loss) on investments and foreign currency transactions | | | 4,710,349 | | | | 48,004 | |
Net change in unrealized appreciation (depreciation) on investments and foreign currency transactions | | | 12,226,592 | | | | 15,624,876 | |
| | | | |
Net increase (decrease) in net assets resulting from operations | | | 17,583,980 | | | | 18,362,546 | |
| | | | |
Dividends to shareholders: | | | | | | | | |
From net investment income: | | | | | | | | |
Investor Class | | | (16,727 | ) | | | — | |
Class A | | | (119,872 | ) | | | — | |
Class C | | | (33,534 | ) | | | — | |
Class I | | | (3,513,873 | ) | | | (522,014 | ) |
| | | | |
Total dividends to shareholders | | | (3,684,006 | ) | | | (522,014 | ) |
| | | | |
Capital share transactions: | | | | | | | | |
Net proceeds from sale of shares | | | 12,057,848 | | | | 28,921,093 | |
Net asset value of shares issued to shareholders in reinvestment of dividends | | | 3,466,426 | | | | 501,867 | |
Cost of shares redeemed | | | (59,948,887 | ) | | | (150,194,506 | ) |
| | | | | | | | |
Increase (decrease) in net assets derived from capital share transactions | | | (44,424,613 | ) | | | (120,771,546 | ) |
| | | | | | | | |
Net increase (decrease) in net assets | | | (30,524,639 | ) | | | (102,931,014 | ) |
|
| Net Assets | |
Beginning of period | | | 162,940,838 | | | | 265,871,852 | |
| | | | |
End of period | | $ | 132,416,199 | | | $ | 162,940,838 | |
| | | | |
Undistributed (distributions in excess of) net investment income at end of period | | $ | (345,590 | ) | | $ | 2,691,377 | |
| | | | |
| | | | |
| 18 | | MainStay Epoch International Small Cap Fund | | The notes to the financial statements are an integral part of,
and should be read in conjunction with, the financial statements. |
Financial Highlights selected per share data and ratios
| | | | | | | | | | | | | | | | | | | | |
| | | Investor Class | |
| | | Six months ended April 30, | | | Year ended October 31, | | | January 1, 2010 through October 31, | | | November 16, 2009** through December 31, | |
| | | 2013* | | | 2012 | | | 2011 | | | 2010*** | | | 2009 | |
Net asset value at beginning of period | | $ | 17.75 | | | $ | 16.30 | | | $ | 18.97 | | | $ | 15.81 | | | $ | 16.11 | |
| | | | | | | | | | | | | | | | | | | | |
Net investment income (loss) (a) | | | 0.05 | | | | 0.16 | | | | 0.10 | | | | 0.04 | | | | 0.00 | ‡ |
Net realized and unrealized gain (loss) on investments | | | 2.15 | | | | 1.30 | | | | (2.25 | ) | | | 3.13 | | | | (0.30 | ) |
Net realized and unrealized gain (loss) on foreign currency transactions | | | (0.01 | ) | | | (0.01 | ) | | | (0.03 | ) | | | (0.01 | ) | | | — | |
| | | | | | | | | | | | | | | | | | | | |
Total from investment operations | | | 2.19 | | | | 1.45 | | | | (2.18 | ) | | | 3.16 | | | | (0.30 | ) |
| | | | | | | | | | | | | | | | | | | | |
Less dividends: | | | | | | | | | | | | | | | | | | | | |
From net investment income | | | (0.38 | ) | | | — | | | | (0.49 | ) | | | — | | | | — | |
| | | | | | | | | | | | | | | | | | | | |
Redemption fee (b) | | | — | | | | — | | | | — | | | | — | | | | 0.00 | ‡ |
| | | | | | | | | | | | | | | | | | | | |
Net asset value at end of period | | $ | 19.56 | | | $ | 17.75 | | | $ | 16.30 | | | $ | 18.97 | | | $ | 15.81 | |
| | | | | | | | | | | | | | | | | | | | |
Total investment return (c) | | | 12.60 | %(d) | | | 8.90 | % | | | (11.89 | %) | | | 19.99 | %(d) | | | (1.86 | %)(d) |
Ratios (to average net assets)/Supplemental Data: | | | | | | | | | | | | | | | | | | | | |
Net investment income (loss) | | | 0.57 | %†† | | | 0.99 | % | | | 0.51 | % | | | 0.30 | %†† | | | 0.15 | % †† |
Net expenses | | | 1.79 | %†† | | | 1.73 | %(e) | | | 1.76 | % | | | 1.85 | %†† | | | 1.59 | % †† |
Expenses (before waiver/reimbursement) | | | 1.85 | %†† | | | 1.76 | %(e) | | | 1.76 | % | | | 1.88 | %†† | | | 1.59 | % †† |
Portfolio turnover rate | | | 29 | % | | | 44 | % | | | 69 | % | | | 41 | % | | | 105 | % |
Net assets at end of period (in 000’s) | | $ | 751 | | | $ | 780 | | | $ | 807 | | | $ | 303 | | | $ | 31 | |
| ** | Commencement of operations. |
| *** | The Fund changed its fiscal year end from December 31 to October 31. |
| ‡ | Less than one cent per share. |
| (a) | Per share data based on average shares outstanding during the period. |
| (b) | The redemption fee was discontinued as of April 1, 2010. |
| (c) | Total investment return is calculated exclusive of sales charges and assumes the reinvestment of dividends and distributions. |
| (d) | Total investment return is not annualized. |
| (e) | Net of interest expense which is less than one-tenth of a percent. (See Note 6) |
| | | | | | |
The notes to the financial statements are an integral part of,
and should be read in conjunction with, the financial statements. | | mainstayinvestments.com | | | 19 | |
Financial Highlights selected per share data and ratios
| | | | | | | | | | | | | | | | | | | | | | | | | | | | |
| | | Class A | |
| | | Six months
ended
April 30, | | | Year ended October 31, | | | January 1,
2010
through
October 31, | | | Year ended December 31, | |
| | | 2013* | | | 2012 | | | 2011 | | | 2010*** | | | 2009 | | | 2008 | | | 2007 | |
Net asset value at beginning of period | | $ | 17.80 | | | $ | 16.33 | | | $ | 18.95 | | | $ | 15.80 | | | $ | 10.98 | | | $ | 23.39 | | | $ | 23.49 | |
| | | | | | | | | | | | | | | | | | | | | | | | | | | | |
Net investment income (loss) | | | 0.06 | (a) | | | 0.19 | (a) | | | 0.10 | (a) | | | 0.02 | (a) | | | 0.06 | (a) | | | 0.03 | (a) | | | (0.04 | ) |
Net realized and unrealized gain (loss) on investments | | | 2.16 | | | | 1.29 | | | | (2.24 | ) | | | 3.14 | | | | 4.76 | | | | (11.51 | ) | | | 3.39 | |
Net realized and unrealized gain (loss) on foreign currency transactions | | | (0.01 | ) | | | (0.01 | ) | | | (0.03 | ) | | | (0.01 | ) | | | — | | | | — | | | | — | |
| | | | | | | | | | | | | | | | | | | | | | | | | | | | |
Total from investment operations | | | 2.21 | | | | 1.47 | | | | (2.17 | ) | | | 3.15 | | | | 4.82 | | | | (11.48 | ) | | | 3.35 | |
| | | | | | | | | | | | | | | | | | | | | | | | | | | | |
Less dividends and distributions: | | | | | | | | | | | | | | | | | | | | | | | | | | | | |
From net investment income | | | (0.39 | ) | | | — | | | | (0.45 | ) | | | — | | | | — | | | | — | | | | (0.01 | ) |
From net realized gain on investments | | | — | | | | — | | | | — | | | | — | | | | — | | | | (0.94 | ) | | | (3.48 | ) |
| | | | | | | | | | | | | | | | | | | | | | | | | | | | |
Total dividends and distributions | | | (0.39 | ) | | | — | | | | (0.45 | ) | | | — | | | | — | | | | (0.94 | ) | | | (3.49 | ) |
| | | | | | | | | | | | | | | | | | | | | | | | | | | | |
Redemption fee (b) | | | — | | | | — | | | | — | | | | — | | | | 0.00 | ‡ | | | 0.01 | | | | 0.04 | |
| | | | | | | | | | | | | | | | | | | | | | | | | | | | |
Net asset value at end of period | | $ | 19.62 | | | $ | 17.80 | | | $ | 16.33 | | | $ | 18.95 | | | $ | 15.80 | | | $ | 10.98 | | | $ | 23.39 | |
| | | | | | | | | | | | | | | | | | | | | | | | | | | | |
Total investment return (c) | | | 12.68 | %(d) | | | 9.00 | % | | | (11.82 | %) | | | 19.94 | %(d) | | | 43.90 | % | | | (49.01 | %) | | | 14.54 | % |
Ratios (to average net assets)/Supplemental Data: | | | | | | | | | | | | | | | | | | | | | | | | | | | | |
Net investment income (loss) | | | 0.63 | %†† | | | 1.15 | % | | | 0.53 | % | | | 0.12 | %†† | | | 0.42 | % | | | 0.17 | % | | | (0.10 | %) |
Net expenses | | | 1.65 | %†† | | | 1.61 | %(e) | | | 1.69 | % | | | 1.89 | %†† | | | 1.83 | % | | | 1.74 | % | | | 1.70 | % |
Expenses (before waiver/reimbursement) | | | 1.71 | %†† | | | 1.64 | %(e) | | | 1.69 | % | | | 1.92 | %†† | | | 1.83 | % | | | 1.74 | % | | | 1.70 | % |
Portfolio turnover rate | | | 29 | % | | | 44 | % | | | 69 | % | | | 41 | % | | | 105 | % | | | 107 | % | | | 140 | % |
Net assets at end of period (in 000’s) | | $ | 4,418 | | | $ | 5,536 | | | $ | 5,261 | | | $ | 5,175 | | | $ | 2,749 | | | $ | 1,098 | | | $ | 2,858 | |
| *** | The Fund changed its fiscal year end from December 31 to October 31. |
| ‡ | Less than one cent per share. |
| (a) | Per share data based on average shares outstanding during the period. |
| (b) | The redemption fee was discontinued as of April 1, 2010. |
| (c) | Total investment return is calculated exclusive of sales charges and assumes the reinvestment of dividends and distributions. |
| (d) | Total investment return is not annualized. |
| (e) | Net of interest expense which is less than one-tenth of a percent. (See Note 6) |
| | | | |
| 20 | | MainStay Epoch International Small Cap Fund | | The notes to the financial statements are an integral part of,
and should be read in conjunction with, the financial statements. |
Financial Highlights selected per share data and ratios
| | | | | | | | | | | | | | | | | | | | |
| | | Class C | |
| | | Six months
ended
April 30, | | | Year ended October 31, | | | January 1,
2010
through
October 31, | | | November 16,
2009**
through
December 31, | |
| | | 2013* | | | 2012 | | | 2011 | | | 2010*** | | | 2009 | |
Net asset value at beginning of period | | $ | 17.44 | | | $ | 16.13 | | | $ | 18.84 | | | $ | 15.79 | | | $ | 16.11 | |
| | | | | | | | | | | | | | | | | | | | |
Net investment income (loss) (a) | | | (0.03 | ) | | | 0.05 | | | | (0.05 | ) | | | (0.04 | ) | | | (0.01 | ) |
Net realized and unrealized gain (loss) on investments | | | 2.14 | | | | 1.27 | | | | (2.22 | ) | | | 3.10 | | | | (0.31 | ) |
Net realized and unrealized gain (loss) on foreign currency transactions | | | (0.01 | ) | | | (0.01 | ) | | | (0.03 | ) | | | (0.01 | ) | | | — | |
| | | | | | | | | | | | | | | | | | | | |
Total from investment operations | | | 2.10 | | | | 1.31 | | | | (2.30 | ) | | | 3.05 | | | | (0.32 | ) |
| | | | | | | | | | | | | | | | | | | | |
Less dividends: | | | | | | | | | | | | | | | | | | | | |
From net investment income | | | (0.26 | ) | | | — | | | | (0.41 | ) | | | — | | | | — | |
| | | | | | | | | | | | | | | | | | | | |
Redemption fee (b) | | | — | | | | — | | | | — | | | | — | | | | 0.00 | ‡ |
| | | | | | | | | | | | | | | | | | | | |
Net asset value at end of period | | $ | 19.28 | | | $ | 17.44 | | | $ | 16.13 | | | $ | 18.84 | | | $ | 15.79 | |
| | | | | | | | | | | | | | | | | | | | |
Total investment return (c) | | | 12.18 | % (d) | | | 8.12 | % | | | (12.57 | %) | | | 19.32 | % (d) | | | (1.99 | %)(d) |
Ratios (to average net assets)/Supplemental Data: | | | | | | | | | | | | | | | | | | | | |
Net investment income (loss) | | | (0.36 | %)†† | | | 0.30 | % | | | (0.29 | %) | | | (0.28 | %)†† | | | (0.65 | %)†† |
Net expenses | | | 2.54 | % †† | | | 2.48 | %(e) | | | 2.51 | % | | | 2.60 | % †† | | | 2.34 | % †† |
Expenses (before waiver/reimbursement) | | | 2.60 | % †† | | | 2.51 | %(e) | | | 2.51 | % | | | 2.63 | % †† | | | 2.34 | % †† |
Portfolio turnover rate | | | 29 | % | | | 44 | % | | | 69 | % | | | 41 | % | | | 105 | % |
Net assets at end of period (in 000’s) | | $ | 1,109 | | | $ | 2,334 | | | $ | 2,064 | | | $ | 1,476 | | | $ | 25 | |
| ** | Commencement of operations. |
| *** | The Fund changed its fiscal year end from December 31 to October 31. |
| ‡ | Less than one cent per share. |
| (a) | Per share data based on average shares outstanding during the period. |
| (b) | The redemption fee was discontinued as of April 1, 2010. |
| (c) | Total investment return is calculated exclusive of sales charges and assumes the reinvestment of dividends and distributions. |
| (d) | Total investment return is not annualized. |
| (e) | Net of interest expense which is less than one-tenth of a percent. (See Note 6) |
| | | | | | |
The notes to the financial statements are an integral part of,
and should be read in conjunction with, the financial statements. | | mainstayinvestments.com | | | 21 | |
Financial Highlights selected per share data and ratios
| | | | | | | | | | | | | | | | | | | | | | | | | | | | |
| | | Class I | |
| | | Six months
ended
April 30, | | | Year ended October 31, | | | January 1,
2010
through
October 31, | | | Year ended December 31, | |
| | | 2013* | | | 2012 | | | 2011 | | | 2010*** | | | 2009 | | | 2008 | | | 2007 | |
Net asset value at beginning of period | | $ | 18.35 | | | $ | 16.83 | | | $ | 19.51 | | | $ | 16.24 | | | $ | 11.16 | | | $ | 23.77 | | | $ | 23.91 | |
| | | | | | | | | | | | | | | | | | | | | | | | | | | | |
Net investment income (loss) | | | 0.08 | (a) | | | 0.21 | (a) | | | 0.13 | (a) | | | 0.04 | (a) | | | 0.09 | (a) | | | 0.06 | (a) | | | 0.04 | |
Net realized and unrealized gain (loss) on investments | | | 2.23 | | | | 1.35 | | | | (2.29 | ) | | | 3.24 | | | | 4.99 | | | | (11.69 | ) | | | 3.31 | |
Net realized and unrealized gain (loss) on foreign currency transactions | | | (0.01 | ) | | | (0.01 | ) | | | (0.03 | ) | | | (0.01 | ) | | | — | | | | — | | | | — | |
| | | | | | | | | | | | | | | | | | | | | | | | | | | | |
Total from investment operations | | | 2.30 | | | | 1.55 | | | | (2.19 | ) | | | 3.27 | | | | 5.08 | | | | (11.63 | ) | | | 3.35 | |
| | | | | | | | | | | | | | | | | | | | | | | | | | | | |
Less dividends and distributions: | | | | | | | | | | | | | | | | | | | | | | | | | | | | |
From net investment income | | | (0.43 | ) | | | (0.03 | ) | | | (0.49 | ) | | | — | | | | — | | | | (0.04 | ) | | | (0.01 | ) |
From net realized gain on investments | | | — | | | | — | | | | — | | | | — | | | | — | | | | (0.94 | ) | | | (3.48 | ) |
| | | | | | | | | | | | | | | | | | | | | | | | | | | | |
Total dividends and distributions | | | (0.43 | ) | | | (0.03 | ) | | | (0.49 | ) | | | — | | | | — | | | | (0.98 | ) | | | (3.49 | ) |
| | | | | | | | | | | | | | | | | | | | | | | | | | | | |
Redemption fee (b) | | | — | | | | — | | | | — | | | | — | | | | — | | | | 0.00 | ‡ | | | — | |
| | | | | | | | | | | | | | | | | | | | | | | | | | | | |
Net asset value at end of period | | $ | 20.22 | | | $ | 18.35 | | | $ | 16.83 | | | $ | 19.51 | | | $ | 16.24 | | | $ | 11.16 | | | $ | 23.77 | |
| | | | | | | | | | | | | | | | | | | | | | | | | | | | |
Total investment return (c) | | | 12.84 | %(d) | | | 9.26 | % | | | (11.59 | %) | | | 20.14 | %(d) | | | 45.52 | % | | | (48.89 | %) | | | 14.12 | % |
Ratios (to average net assets)/Supplemental Data: | | | | | | | | | | | | | | | | | | | | | | | | | | | | |
Net investment income (loss) | | | 0.91 | %†† | | | 1.27 | % | | | 0.69 | % | | | 0.31 | %†† | | | 0.67 | % | | | 0.30 | % | | | 0.15 | % |
Net expenses | | | 1.40 | %†† | | | 1.36 | %(e) | | | 1.44 | % | | | 1.65 | %†† | | | 1.60 | % | | | 1.49 | % | | | 1.45 | % |
Expenses (before waiver/reimbursement) | | | 1.46 | %†† | | | 1.39 | %(e) | | | 1.44 | % | | | 1.67 | %†† | | | 1.60 | % | | | 1.49 | % | | | 1.45 | % |
Portfolio turnover rate | | | 29 | % | | | 44 | % | | | 69 | % | | | 41 | % | | | 105 | % | | | 107 | % | | | 140 | % |
Net assets at end of period (in 000’s) | | $ | 126,138 | | | $ | 154,291 | | | $ | 257,740 | | | $ | 178,909 | | | $ | 167,568 | | | $ | 149,505 | | | $ | 451,242 | |
| *** | The Fund changed its fiscal year end from December 31 to October 31. |
| ‡ | Less than one cent per share. |
| (a) | Per share data based on average shares outstanding during the period. |
| (b) | The redemption fee was discontinued as of April 1, 2010. |
| (c) | Total investment return is calculated exclusive of sales charges and assumes the reinvestment of dividends and distributions. Class I shares are not subject to sales charges. |
| (d) | Total investment return is not annualized. |
| (e) | Net of interest expense which is less than one-tenth of a percent. (See Note 6) |
| | | | |
| 22 | | MainStay Epoch International Small Cap Fund | | The notes to the financial statements are an integral part of,
and should be read in conjunction with, the financial statements. |
Notes to Financial Statements (Unaudited)
Note 1–Organization and Business
MainStay Funds Trust (the “Trust”) was organized as a Delaware statutory trust on April 28, 2009, and is governed by a Declaration of Trust. The Trust is registered under the Investment Company Act of 1940, as amended (the “1940 Act”), as an open-end investment management company, and is comprised of thirty-three funds (collectively referred to as the “Funds”). These financial statements and notes relate only to the MainStay Epoch International Small Cap Fund (the “Fund”), a diversified fund. The Fund is the successor to the Epoch International Small Cap Fund (the “Predecessor Fund”), which was a series of a different registered investment company for which Epoch Investment Partners, Inc. served as investment advisor. The financial statements of the Fund reflect the historical results of the Institutional Class and Class P shares of the Predecessor Fund prior to its reorganization on November 16, 2009. Upon the completion of the reorganization, the Class I and Class A shares of the Fund assumed the performance, financial and other information of the Institutional Class and Class P shares of the Predecessor Fund, respectively. All information and references to periods prior to November 16, 2009 refer to the Predecessor Fund.
The Fund currently offers four classes of shares. Investor Class and Class C shares commenced operations on November 16, 2009. Class A and Class I shares commenced operations (under former designations) on August 2, 2006 and January 25, 2005, respectively. Investor Class and Class A shares are offered at net asset value (“NAV”) per share plus an initial sales charge. No sales charge applies to investments of $1 million or more (and certain other qualified purchases) in Investor Class and Class A shares, but a contingent deferred sales charge (“CDSC”) is imposed on certain redemptions made within one year of the date of purchase. Class C shares are offered at NAV without an initial sales charge, although a 1.00% CDSC may be imposed on redemptions made within one year of the date of purchase of Class C shares. Class I shares are offered at NAV and are not subject to a sales charge. Depending upon eligibility, Investor Class shares may convert to Class A shares and Class A shares may convert to Investor Class shares. The four classes of shares have the same voting (except for issues that relate solely to one class), dividend, liquidation and other rights, and the same terms and conditions, except that Class C shares are subject to higher distribution and/or service fee rates than Investor Class and Class A shares under a distribution plan pursuant to Rule 12b-1 under the 1940 Act. Class I shares are not subject to a distribution and/or service fee.
The Fund’s investment objective is to seek long-term capital appreciation.
Note 2–Significant Accounting Policies
The Fund prepares its financial statements in accordance with generally accepted accounting principles (“GAAP”) in the United States of America and follows the significant accounting policies described below.
(A) Securities Valuation. Investments are valued as of the close of regular trading on the New York Stock Exchange (“Exchange”) (generally 4:00 p.m. Eastern time) on each day the Fund is open for business (“valuation date”).
The Board of Trustees (the “Board”) has adopted procedures for the valuation of the Fund’s securities and has delegated the responsibility
for valuation determination under those procedures to the Valuation Committee of the Fund (the “Valuation Committee”). The Board has authorized the Valuation Committee to appoint a Valuation Sub-Committee (the “Sub-Committee”) to deal in the first instance with questions that arise or cannot be resolved under these procedures. The Sub-Committee meets (in person, via electronic mail or via teleconference) on an as-needed basis. The Valuation Committee meets at a later time, as necessary, to ensure that actions taken by the Sub-Committee were appropriate. The procedures recognize that, subject to the oversight of the Board and unless otherwise noted, the responsibility for day-to-day valuation of portfolio assets (including securities for which market prices are not readily available) rests with New York Life Investment Management LLC ( “New York Life Investments” or the “Manager”), aided to whatever extent necessary by the Subadvisor (as defined in Note 3(A)) of the Fund.
To assess the appropriateness of security valuations, the Manager or the Fund’s third party service provider who is subject to oversight by the Manager, regularly compares prior day prices, prices on comparable securities and the sale prices to the prior and current day prices and challenges prices exceeding certain tolerance levels with third party pricing services or broker sources. For those securities valued by recommendation, whether through a standardized fair valuation methodology or a fair valuation determination, the Valuation Committee reviews and affirms the reasonableness of the valuation based on such methodologies and determinations on a regular basis after considering all relevant information that is reasonably available.
“Fair value” is defined as the price that the Fund would receive upon selling an investment in an orderly transaction to an independent buyer in the principal or most advantageous market of the investment. Fair value measurements are determined within a framework that has established a three-tier hierarchy which maximizes the use of observable market data and minimizes the use of unobservable inputs to establish classification of fair value measurements for disclosure purposes. “Inputs” refers broadly to the assumptions that market participants would use in pricing the asset or liability, including assumptions about risk, such as the risk inherent in a particular valuation technique used to measure fair value using a pricing model and/or the risk inherent in the inputs for the valuation technique. Inputs may be observable or unobservable. Observable inputs reflect the assumptions market participants would use in pricing the asset or liability based on market data obtained from sources independent of the Fund. Unobservable inputs reflect the Fund’s own assumptions about the assumptions market participants would use in pricing the asset or liability developed based on the information available in the circumstances. The inputs or methodology used for valuing securities may not be an indication of the risks associated with investing in those securities. The three-tier hierarchy of inputs is summarized in the three broad Levels listed below.
| • | | Level 1—quoted prices in active markets for identical investments |
| • | | Level 2—other significant observable inputs (including quoted prices for similar investments in active markets, interest rates and yield curves, prepayment speeds, credit risks, etc.) |
| • | | Level 3—significant unobservable inputs (including the Fund’s own assumptions about the assumptions that market participants would use in determining the fair value of investments) |
| | | | |
| mainstayinvestments.com | | | 23 | |
Notes to Financial Statements (Unaudited) (continued)
The aggregate value by input level, as of April 30, 2013, for the Fund’s investments is included at the end of the Fund’s Portfolio of Investments.
The valuation techniques used by the Fund to measure fair value maximize the use of observable inputs and minimize the use of unobservable inputs. The Fund may utilize third party vendor evaluations, whose prices may be derived from one or more of the following standard inputs:
| | |
• Benchmark Yields | | • Reported Trades |
• Broker Dealer Quotes | | • Issuer Spreads |
• Two-sided markets | | • Benchmark securities |
• Bids/Offers | | • Reference Data (corporate actions or material event notices) |
• Industry and economic events | | • Comparable bonds |
• Equity and credit default swap curves | | • Monthly payment information |
Securities for which market values cannot be determined using the methodologies described above are valued by methods deemed in good faith by the Fund’s Valuation Committee, following the procedures established by the Board, to represent fair value. Under these procedures, the Fund primarily employs a market-based approach which may use related or comparable assets or liabilities, recent transactions, market multiples, book values, and other relevant information. The Fund may also use an income-based valuation approach in which the anticipated future cash flows of the investment are discounted to calculate fair value. Discounts may also be applied due to the nature or duration of any restrictions on the disposition of the investments. Due to the inherent uncertainty of valuations of such investments, the fair values may differ significantly from the values that would have been used had an active market existed. For the six-month period ended April 30, 2013, there have been no changes to the fair value methodologies.
Equity and non-equity securities which may be valued in this manner include, but are not limited to: (i) a security for which the trading has been halted or suspended; (ii) a debt security that has recently gone into default and for which there is not a current market quotation; (iii) a security of an issuer that has entered into a restructuring; (iv) a security that has been de-listed from a national exchange; (v) a security for which the market price is not available from a third party pricing source or, if so provided, does not, in the opinion of the Fund’s Manager or Subadvisor reflect the security’s market value; and (vi) a security whose principal market has been temporarily closed at a time when, under normal conditions, it would be open. Securities for which market quotations or observable inputs are not readily available are generally categorized as Level 3 in the hierarchy. As of April 30, 2013, the Fund held securities with a value of $768,642 that were fair valued in such a manner.
Certain events may occur between the time that foreign markets close, on which securities held by the Fund principally trade, and the time at which the Fund’s NAV is calculated. These events may include, but are not limited to, situations relating to a single issuer in a market sector, significant fluctuations in U.S. or foreign markets, natural disasters, armed conflicts, governmental actions or other developments not tied directly to the securities markets. Should the Manager or Subadvisor conclude that such events may have affected the accuracy of the last
price of such securities reported on the local foreign market, the Manager or Subadvisor may, pursuant to procedures adopted by the Board, adjust the value of the local price to reflect the estimated impact on the price of such securities as a result of such events. In this instance, securities are generally categorized as Level 3 in the hierarchy. Additionally, foreign equity securities are also fair valued whenever the movement of a particular index exceeds certain thresholds. In such cases, the securities are fair valued by applying factors provided by a third party vendor in accordance with the Fund’s policies and procedures and are generally categorized as Level 2 in the hierarchy. As of April 30, 2013, certain foreign equity securities held by the Fund were not fair valued in such a manner.
Equity securities and Exchange Traded Funds are valued at the latest quoted sales prices as of the close of regular trading on the Exchange on each valuation date. Securities that are not traded on the valuation date are valued at the mean of the latest quoted bid and ask prices. Prices normally are taken from the principal market in which each security trades. Futures contracts are valued at the last posted settlement price on the market where such futures are primarily traded. Options contracts are valued at the last posted settlement price on the market where such options are principally traded. Investments in other mutual funds are valued at their respective NAVs as of the close of the Exchange on the valuation date. These securities are generally categorized as Level 1 in the hierarchy.
Temporary cash investments acquired over 60 days to maturity are valued using the latest bid prices or using valuations based on a matrix system (which considers such factors as security prices, yields, maturities, and ratings), both as furnished by independent pricing services. Other temporary cash investments which mature in 60 days or less (“Short-Term Investments”) are valued at amortized cost. The amortized cost method involves valuing a security at its cost on the date of purchase and thereafter assuming a constant amortization to maturity of the difference between such cost and the value on maturity date. Amortized cost approximates the current fair value of a security. Securities valued at amortized cost are not valued using a quoted price in an active market. These securities are generally categorized as Level 2 in the hierarchy.
Foreign currency forward contracts are valued at their fair market values determined on the basis of the mean between the last current bid and ask prices based on dealer or exchange quotations and are generally categorized as Level 2 in the hierarchy.
Generally, a security is considered illiquid if it cannot be sold or disposed of in the ordinary course of business at approximately the price at which it is valued. Its illiquidity might prevent the sale of such security at a time when the Manager or Subadvisor might wish to sell, and these securities could have the effect of decreasing the overall level of a Fund’s liquidity. Further, the lack of an established secondary market may make it more difficult to value illiquid securities, requiring the Fund to rely on judgments that may be somewhat subjective in determining value, which could vary from the amount that the Fund could realize upon disposition. Difficulty in selling illiquid securities may result in a loss or may be costly to the Fund. Under the supervision of the Board, the Manager or Subadvisor determines the liquidity of the Fund’s investments; in doing so, the Manager or Subadvisor may consider various factors, including (i) the frequency of trades and quotations,
| | |
| 24 | | MainStay Epoch International Small Cap Fund |
(ii) the number of dealers and prospective purchasers, (iii) dealer undertakings to make a market, and (iv) the nature of the security and the market in which it trades (e.g., the time needed to dispose of the security, the method of soliciting offers and the mechanics of transfer). Illiquid securities generally will be valued in good faith in such a manner as the Board deems appropriate to reflect their fair value.
(B) Income Taxes. The Fund’s policy is to comply with the requirements of the Internal Revenue Code of 1986, as amended (the “Internal Revenue Code”), applicable to regulated investment companies and to distribute all of the taxable income to the shareholders of the Fund within the allowable time limits. Therefore, no federal, state and local income tax provision is required.
Management evaluates its tax positions to determine if the tax positions taken meet the minimum recognition threshold in connection with accounting for uncertainties in income tax positions taken or expected to be taken for the purposes of measuring and recognizing tax liabilities in the financial statements. Recognition of tax benefits of an uncertain tax position is required only when the position is “more likely than not” to be sustained assuming examination by taxing authorities. Management has analyzed the Fund’s tax positions taken on federal, state and local income tax returns for all open tax years (for up to three tax years), and has concluded that no provision for federal, state and local income tax is required in the Fund’s financial statements. The Fund’s federal, state and local income and federal excise tax returns for tax years for which the applicable statutes of limitations have not expired are subject to examination by the Internal Revenue Service and state and local departments of revenue.
(C) Foreign Taxes. Investment income received by the Fund from foreign sources may be subject to foreign income taxes. These foreign income taxes are generally withheld at the source, a portion of which may be recoverable. The Fund will accrue such taxes and recoveries as applicable, based upon its current interpretation of tax rules and regulations that exist in the markets in which it invests.
The Fund may be subject to taxation on realized capital gains, repatriation proceeds and other transaction-based taxes imposed by certain countries in which it invests. The Fund will accrue such taxes as applicable based upon its current interpretation of tax rules and regulations that exist in the market in which it invests. Capital gains taxes relating to positions still held are reflected as a liability on the Statement of Assets and Liabilities, as well as an adjustment to the Fund’s net unrealized appreciation (depreciation). Taxes related to capital gains realized during the six-month period ended April 30, 2013, if any, are reflected as part of net realized gain (loss) in the Statement of Operations. Changes in tax liabilities related to capital gains taxes on unrealized investment gains, if any, are reflected as part of the change in net unrealized appreciation (depreciation) on investments in the Statement Operations. Transaction-based charges are generally assessed as a percentage of the transaction amount.
(D) Dividends and Distributions to Shareholders. Dividends and distributions are recorded on the ex-dividend date. The Fund intends to declare and pay dividends of net investment income and distributions of net realized capital and currency gains, if any, at least annually. Unless the shareholder elects otherwise, all dividends and distributions are reinvested in the same class of shares of the Fund, at
NAV. Dividends and distributions to shareholders are determined in accordance with federal income tax regulations and may differ from GAAP.
(E) Security Transactions and Investment Income. The Fund records security transactions on the trade date. Realized gains and losses on security transactions are determined using the identified cost method. Dividend income is recognized on the ex-dividend date and interest income is accrued as earned using the effective interest rate method. Discounts and premiums on Short-Term Investments are accreted and amortized, respectively, on the straight-line method.
Investment income and realized and unrealized gains and losses on investments of the Fund are allocated to separate classes of shares pro rata based upon their relative net assets on the date the income is earned or realized and unrealized gains and losses are incurred.
(F) Expenses. Expenses of the Trust are allocated to the individual Funds in proportion to the net assets of the respective Funds when the expenses are incurred, except where direct allocations of expenses can be made. Expenses (other than transfer agent expenses and fees incurred under the shareholder services plans and the distribution plans further discussed in Note 3(B)) are allocated to separate classes of shares pro rata based upon their relative net assets on the date the expenses are incurred. The expenses borne by the Fund, including those of related parties to the Fund, are shown in the Statement of Operations.
(G) Use of Estimates. In preparing financial statements in conformity with GAAP, management makes estimates and assumptions that affect the reported amounts and disclosures in the financial statements. Actual results could differ from those estimates.
(H) Repurchase Agreements. The Fund may enter into repurchase agreements to earn income. The Fund may enter into repurchase agreements only with financial institutions that are deemed by the Manager or Subadvisor to be creditworthy, pursuant to guidelines established by the Fund’s Board. During the term of any repurchase agreement, the Manager or Subadvisor will continue to monitor the creditworthiness of the seller. Under the 1940 Act, repurchase agreements are considered to be collateralized loans by a Fund to the seller secured by the securities transferred to the Fund.
When the Fund invests in repurchase agreements, the Fund’s custodian takes possession of the collateral pledged for investments in the repurchase agreement. The underlying collateral is valued daily on a mark-to-market basis to determine that the value, including accrued interest, exceeds the repurchase price. In the event of the seller’s default on the obligation to repurchase, the Fund has the right to liquidate the collateral and apply the proceeds in satisfaction of the obligation. Under certain circumstances, such as in the event of default or bankruptcy by the counterparty to the agreement, realization and/or retention of the collateral may be subject to legal proceedings and possible realized loss to the Fund.
(I) Foreign Currency Transactions. The books and records of the Fund are kept in U.S. dollars. Prices of securities denominated in foreign currency amounts are translated into U.S. dollars at the mean between
| | | | |
| mainstayinvestments.com | | | 25 | |
Notes to Financial Statements (Unaudited) (continued)
the buying and selling rates last quoted by any major U.S. bank at the following dates:
(i) market value of investment securities, other assets and liabilities—at the valuation date, and
(ii) purchases and sales of investment securities, income and expenses—at the date of such transactions.
The assets and liabilities that are denominated in foreign currency amounts are presented at the exchange rates and market values at the close of the period. The realized and unrealized changes in net assets arising from fluctuations in exchange rates and market prices of securities are not separately presented.
Net realized gain (loss) on foreign currency transactions represents net gains and losses on foreign currency forward contracts, net currency gains or losses realized as a result of differences between the amounts of securities sale proceeds or purchase cost, dividends, interest and withholding taxes as recorded on the Fund’s books, and the U.S. dollar equivalent amount actually received or paid. Net currency gains or losses from valuing such foreign currency denominated assets and liabilities, other than investments at valuation date exchange rates, are reflected in unrealized foreign exchange gains or losses.
(J) Rights and Warrants. Rights are certificates that permit the holder to purchase a certain number of shares, or a fractional share, of a new stock from the issuer at a specific price. Warrants are instruments that entitle the holder to buy an equity security at a specific price for a specific period of time. The Fund may enter into rights and warrants when securities are acquired through a corporate action. With respect to warrants in international markets, the securities may be purchased only when the underlying security cannot be purchased due to the many restrictions an industry and/or country might place on foreign investors. These investments can provide a greater potential for profit or loss than an equivalent investment in the underlying security. Prices of these investments do not necessarily move in tandem with the prices of the underlying securities.
There is risk involved in the purchase of rights and warrants in that these investments are speculative investments. The Fund could also lose the entire value of its investment in warrants, if such warrants are not exercised by the date of its expiration. The securities are sold as soon as the opportunity becomes available. The Fund is exposed to risk until the sale or exercise of each right or warrant is completed. As of April 30, 2013, the Fund did not hold any rights or warrants.
(K) Securities Lending. In order to realize additional income, the Fund may engage in securities lending, subject to the limitations set forth in the 1940 Act and relevant guidance by the staff of the Securities and Exchange Commission. In the event the Fund does engage in securities lending, the Fund will lend through its custodian, State Street Bank and Trust Company (“State Street”). State Street will manage the Fund’s cash collateral in accordance with the lending agreement between the Fund and State Street, and indemnify the Fund’s portfolio against counterparty risk. The loans will be collateralized by cash or securities at least equal at all times to the market value of the securities loaned. Collateral will consist of U.S. Government securities, cash equivalents or irrevocable letters of credit. The Fund may bear the risk of delay in recovery of, or loss of rights in, the securities loaned should the bor-
rower of the securities experience financial difficulty. The Fund may also record realized gain or loss on securities deemed sold due to a borrower’s inability to return securities on loan. The Fund will receive compensation for lending its securities in the form of fees or the retention of a portion of the interest on the investment of any cash received as collateral. The Fund also will continue to receive interest and dividends on the securities loaned and any gain or loss in the market price of the securities loaned that may occur during the term of the loan will be for the account of the Fund.
Although the Fund and New York Life Investments have temporarily suspended securities lending, the Fund and New York Life Investments reserve the right to reinstitute lending when deemed appropriate. The Fund did not have any portfolio securities on loan as of April 30, 2013.
(L) Concentration of Risk. The Fund invests in foreign securities, which carry certain risks that are in addition to the usual risks inherent in domestic instruments. These risks include those resulting from currency fluctuations, future adverse political and economic developments and possible imposition of currency exchange blockages or other foreign governmental laws or restrictions. These risks are likely to be greater in emerging markets than in developed markets. The ability of issuers of debt securities held by the Fund to meet their obligations may be affected by economic or political developments in a specific country, industry or region.
(M) Indemnifications. Under the Trust’s organizational documents, its officers and trustees are indemnified against certain liabilities that may arise out of performance of their duties to the Trust. Additionally, in the normal course of business, the Fund enters into contracts with third-party service providers that contain a variety of representations and warranties and which may provide general indemnifications. The Fund’s maximum exposure under these arrangements is unknown, as this would involve future claims that may be made against the Fund that have not yet occurred. Based on experience, management is of the view that the risk of loss in connection with these potential indemnification obligations is remote. However, there can be no assurance that material liabilities related to such obligations will not arise in the future, which could adversely impact the Fund.
Note 3–Fees and Related Party Transactions
(A) Manager and Subadvisor. New York Life Investments, a registered investment adviser and an indirect, wholly-owned subsidiary of New York Life Insurance Company (“New York Life”), serves as the Fund’s Manager, pursuant to an Amended and Restated Management Agreement (“Management Agreement”). The Manager provides offices, conducts clerical, recordkeeping and bookkeeping services, and keeps most of the financial and accounting records required to be maintained by the Fund. Except for the portion of salaries and expenses that are the responsibility of the Fund, the Manager pays the salaries and expenses of all personnel affiliated with the Fund and certain operational expenses of the Fund. The Fund reimburses New York Life Investments in an amount equal to a portion of the salary of the Chief Compliance Officer (“CCO”) of the Fund. Epoch Investment Partners, Inc. (“Epoch” or “Subadvisor”), a registered investment adviser, serves as Subadvisor to the Fund and is responsible for the day-to-day portfolio management of the Fund. Pursuant to the terms of an Amended and Restated Subadvisory Agreement (“Subadvisory Agreement”) between New York Life
| | |
| 26 | | MainStay Epoch International Small Cap Fund |
Investments and Epoch, New York Life Investments pays for the services of the Subadvisor.
The Fund pays the Manager a monthly fee for services performed and facilities furnished at an annual rate of 1.10% of the Fund’s average daily net assets.
New York Life Investments has contractually agreed to waive a portion of its management fee so that the management fee does not exceed 1.05%. This agreement will remain in effect until February 28, 2014, and shall renew automatically for one-year terms unless New York Life Investments provides written notice of termination prior to the start of the next term or upon approval of the Board.
New York Life Investments has contractually agreed to waive fees and/or reimburse expenses so that Total Annual Fund Operating Expenses for Class A shares do not exceed 1.65% of its average daily net assets. New York Life Investments will apply an equivalent waiver or reimbursement, in an equal number of basis points, to the other classes. This agreement will remain in effect until February 28, 2014, and shall renew automatically for one-year terms unless New York Life Investments provides written notice of termination prior to the start of the next term or upon approval of the Board. Total Annual Fund Operating Expenses excludes taxes, interest, litigation, extraordinary expenses, brokerage and other transaction expenses relating to the purchase or sale of portfolio investments, and acquired (underlying) fund fees and expenses.
For the six-month period ended April 30, 2013, New York Life Investments earned fees from the Fund in the amount of $812,349 and waived its fees and/or reimbursed expenses in the amount of $43,071.
State Street, 1 Lincoln Street, Boston, Massachusetts 02111, provides sub-administration and sub-accounting services to the Fund pursuant to an agreement with New York Life Investments. These services include calculating the daily NAVs of the Fund, maintaining the general ledger and sub-ledger accounts for the calculation of the Fund’s respective NAVs, and assisting New York Life Investments in conducting various aspects of the Fund’s administrative operations. For providing these services to the Fund, State Street is compensated by New York Life Investments.
(B) Distribution and Service Fees. The Trust, on behalf of the Fund, has entered into a distribution agreement with NYLIFE Distributors LLC (the “Distributor”), an indirect, wholly-owned subsidiary of New York Life. The Fund has adopted distribution plans (the “Plans”) in accordance with the provisions of Rule 12b-1 under the 1940 Act.
Pursuant to the Investor Class and Class A Plans, the Distributor receives a monthly distribution fee from Investor Class and Class A shares at an annual rate of 0.25% of the average daily net assets of the Investor Class and Class A shares for distribution and/or service activities as designated by the Distributor. Pursuant to the Class C Plan, Class C shares pay the Distributor a monthly distribution fee at an annual rate of 0.75% of the average daily net assets of the Class C shares, along with a service fee at an annual rate of 0.25% of the average daily net assets of the Class C shares, for a total 12b-1 fee of 1.00%. Class I shares are not subject to a distribution and/or service fee.
The Plans provide that the distribution and service fees are payable to the Distributor regardless of the amounts actually expended by the Distributor for distribution of the Fund’s shares and service activities.
(C) Sales Charges. The Fund was advised by the Distributor that the amount of sales charges retained on sales of Investor Class and Class A shares were $340 and $474, respectively, for the six-month period ended April 30, 2013. The Fund was also advised that the Distributor retained CDSCs on redemptions of Class C shares of $110 for the six-month period ended April 30, 2013.
(D) Transfer, Dividend Disbursing and Shareholder Servicing Agent. NYLIM Service Company LLC, an affiliate of New York Life Investments, is the Fund’s transfer, dividend disbursing and shareholder servicing agent pursuant to an agreement between NYLIM Service Company LLC and the Trust. NYLIM Service Company LLC has entered into an agreement with Boston Financial Data Services, Inc. (“BFDS”) pursuant to which BFDS performs certain transfer agent services on behalf of NYLIM Service Company LLC. Transfer agent expenses incurred by the Fund for the six-month period ended April 30, 2013, were as follows:
| | | | |
Investor Class | | $ | 1,168 | |
Class A | | | 4,070 | |
Class C | | | 3,111 | |
Class I | | | 110,905 | |
(E) Small Account Fee. Shareholders with small accounts adversely impact the cost of providing transfer agency services. In an effort to reduce total transfer agency expenses, the Fund has implemented a small account fee on certain types of accounts. Certain shareholders with an account balance of less than $1,000 are charged an annual per account fee of $20 (assessed semi-annually), the proceeds from which offset transfer agent fees as reflected in the Statement of Operations.
Note 4–Federal Income Tax
Under the Regulated Investment Company Modernization Act of 2010, the Fund is permitted to carry forward capital losses incurred in taxable years beginning after December 22, 2010, for an unlimited period. However, any losses incurred during those future years will be required to be utilized prior to the losses incurred in pre-enactment tax years. As a result of this ordering rule, pre-enactment capital loss carryforwards may be more likely to expire unused. Additionally, post-enactment capital losses that are carried forward will retain their character as either short-term or long-term capital losses rather than being considered all short-term as under previous law.
As of October 31, 2012, for federal income tax purposes, capital loss carryforwards of $84,244,562 were available as shown in the table below, to the extent provided by the regulations to offset future realized gains of the Fund through the years indicated. To the extent that these capital loss carryforwards are used to offset future capital gains, it is probable that the capital gains so offset will not be distributed to share-
| | | | |
| mainstayinvestments.com | | | 27 | |
Notes to Financial Statements (Unaudited) (continued)
holders. No capital gain distributions shall be made until any capital loss carryforwards have been fully utilized or expired.
| | | | | | | | |
Capital Loss
Available Through | | Short-Term Capital Loss
Amounts (000’s) | | | Long-Term Capital Loss
Amounts (000’s) | |
2016
2017 Unlimited | | $
| 17,420
66,764 61 |
| | $
| —
— — |
|
| Total | | $ | 84,245 | | | $ | — | |
The tax character of distributions paid during the year ended October 31, 2012, shown in the Statements of Changes in Net Assets was as follows:
| | | | |
| | | 2012 | |
Distributions paid from: | | | | |
Ordinary Income | | $ | 522,014 | |
Note 5–Custodian
State Street is the custodian of the cash and the securities of the Fund. Custodial fees are charged to the Fund based on the market value of securities in the Fund and the number of certain cash transactions incurred by the Fund.
Note 6–Line of Credit
The Fund and certain affiliated funds maintain a line of credit with a syndicate of banks in order to secure a source of funds for temporary purposes to meet unanticipated or excessive redemption requests.
Effective August 29, 2012, under a second amended and restated credit agreement (the “Credit Agreement”), the aggregate commitment amount is $200,000,000 with an optional maximum amount of $250,000,000. The commitment fee is an annual rate of 0.08% of the average commitment amount payable quarterly, regardless of usage, to Bank of New York Mellon, which serves as the agent to the syndicate. The commitment fee is allocated among the Fund and certain affiliated funds based upon net assets and other factors. Interest on any revolving credit loan is charged based upon the Federal Funds Advances rate or the one month London InterBank Offered Rate, whichever is higher. The Credit Agreement expires on August 28, 2013, although the Fund, certain affiliated funds and the syndicate of banks may renew the Credit Agreement for an additional year on the same or different terms. There were no borrowings made or outstanding with respect to the Fund on the Credit Agreement during the six-month period ended April 30, 2013.
Note 7–Purchases and Sales of Securities (in 000’s)
During the six-month period ended April 30, 2013, purchases and sales of securities, other than short-term securities, were $43,338 and $89,888, respectively.
Note 8–Capital Share Transactions
| | | | | | | | |
Investor Class | | Shares | | | Amount | |
Six-month period ended April 30, 2013: | | | | | | | | |
Shares sold | | | 5,288 | | | $ | 97,093 | |
Shares issued to shareholders in reinvestment of dividends | | | 955 | | | | 16,725 | |
Shares redeemed | | | (6,394 | ) | | | (117,554 | ) |
| | | | |
Net increase (decrease) in shares outstanding before conversion | | | (151 | ) | | | (3,736 | ) |
Shares converted into Investor Class (See Note 1) | | | 394 | | | | 7,488 | |
Shares converted from Investor Class (See Note 1) | | | (5,816 | ) | | | (108,249 | ) |
| | | | |
Net increase (decrease) | | | (5,573 | ) | | $ | (104,497 | ) |
| | | | |
Year ended October 31, 2012: | | | | | | | | |
Shares sold | | | 9,758 | | | $ | 163,883 | |
Shares redeemed | | | (13,238 | ) | | | (217,065 | ) |
| | | | |
Net increase (decrease) in shares outstanding before conversion | | | (3,480 | ) | | | (53,182 | ) |
Shares converted into Investor Class (See Note 1) | | | 1,571 | | | | 27,593 | |
Shares converted from Investor Class (See Note 1) | | | (3,667 | ) | | | (63,819 | ) |
| | | | |
Net increase (decrease) | | | (5,576 | ) | | $ | (89,408 | ) |
| | | | |
|
| |
Class A | | Shares | | | Amount | |
Six-month period ended April 30, 2013: | | | | | | | | |
Shares sold | | | 35,301 | | | $ | 638,406 | |
Shares issued to shareholders in reinvestment of dividends | | | 6,337 | | | | 111,287 | |
Shares redeemed | | | (132,876 | ) | | | (2,464,218 | ) |
| | | | |
Net increase (decrease) in shares outstanding before conversion | | | (91,238 | ) | | | (1,714,525 | ) |
Shares converted into Class A (See Note 1) | | | 5,800 | | | | 108,249 | |
Shares converted from Class A (See Note 1) | | | (393 | ) | | | (7,488 | ) |
| | | | |
Net increase (decrease) | | | (85,831 | ) | | $ | (1,613,764 | ) |
| | | | |
Year ended October 31, 2012: | | | | | | | | |
Shares sold | | | 58,120 | | | $ | 968,074 | |
Shares redeemed | | | (71,415 | ) | | | (1,193,803 | ) |
| | | | |
Net increase (decrease) in shares outstanding before conversion | | | (13,295 | ) | | | (225,729 | ) |
Shares converted into Class A (See Note 1) | | | 3,659 | | | | 63,819 | |
Shares converted from Class A (See Note 1) | | | (1,568 | ) | | | (27,593 | ) |
| | | | |
Net increase (decrease) | | | (11,204 | ) | | $ | (189,503 | ) |
| | | | |
|
| |
Class C | | Shares | | | Amount | |
Six-month period ended April 30, 2013: | | | | | | | | |
Shares sold | | | 6,541 | | | $ | 115,441 | |
Shares issued to shareholders in reinvestment of dividends | | | 1,934 | | | | 33,494 | |
Shares redeemed | | | (84,799 | ) | | | (1,572,045 | ) |
| | | | |
Net increase (decrease) | | | (76,324 | ) | | $ | (1,423,110 | ) |
| | | | |
Year ended October 31, 2012: | | | | | | | | |
Shares sold | | | 26,078 | | | $ | 431,241 | |
Shares redeemed | | | (20,148 | ) | | | (323,265 | ) |
| | | | |
Net increase (decrease) | | | 5,930 | | | $ | 107,976 | |
| | | | |
| | |
| 28 | | MainStay Epoch International Small Cap Fund |
| | | | | | | | |
Class I | | Shares | | | Amount | |
Six-month period ended April 30, 2013: | | | | | | | | |
Shares sold | | | 578,716 | | | $ | 11,206,908 | |
Shares issued to shareholders in reinvestment of dividends | | | 182,794 | | | | 3,304,920 | |
Shares redeemed | | | (2,930,677 | ) | | | (55,795,070 | ) |
| | | | |
Net increase (decrease) | | | (2,169,167 | ) | | $ | (41,283,242 | ) |
| | | | |
Year ended October 31, 2012: | | | | | | | | |
Shares sold | | | 1,669,355 | | | $ | 27,357,895 | |
Shares issued to shareholders in reinvestment of dividends and distributions | | | 30,903 | | | | 501,867 | |
Shares redeemed | | | (8,610,871 | ) | | | (148,460,373 | ) |
| | | | |
Net increase (decrease) | | | (6,910,613 | ) | | $ | (120,600,611 | ) |
| | | | |
Note 9–Subsequent Events
In connection with the preparation of the financial statements of the Fund as of and for the six-month period ended April 30, 2013, events and transactions subsequent to April 30, 2013, through the date the financial statements were issued have been evaluated by the Fund’s management for possible adjustment and/or disclosure. No subsequent events requiring financial statement adjustment or disclosure have been identified.
| | | | |
| mainstayinvestments.com | | | 29 | |
I. Board Consideration and Approval of Management Agreement and
Subadvisory Agreement (Unaudited)
Section 15(c) of the Investment Company Act of 1940, as amended (the “1940 Act”) requires that each mutual fund’s board of trustees, including a majority of the independent trustees, annually review and approve the fund’s investment advisory agreements. At its December 10-12, 2012 meeting, the Board of Trustees of the MainStay Group of Funds (“Board”) unanimously approved the Management Agreement with respect to the MainStay Epoch International Small Cap Fund (“Fund”) and New York Life Investment Management LLC (“New York Life Investments”), and the Subadvisory Agreement between New York Life Investments and Epoch Investment Partners, Inc. (“Epoch”) with respect to the Fund.
In reaching its decision to approve the Agreements, the Board considered information furnished by New York Life Investments and Epoch in connection with a contract review process that took place at various meetings of the Board and its Contracts Committee between September 2012 and December 2012, as well as other relevant information furnished to the Board throughout the year by New York Life Investments and Epoch. Information requested by and furnished to the Board in connection with the contract review process included, among other items, reports on the Fund prepared by Strategic Insight Mutual Fund Research and Consulting, LLC (“Strategic Insight”), an independent third-party service provider engaged by the Board to report objectively on the Fund’s investment performance, management and subadvisory fees and ordinary operating expenses. The Board also considered information provided by New York Life Investments and Epoch on the fees charged to other investment advisory clients (including institutional separate accounts) that follow investment strategies similar to the Fund, and the rationale for any differences in the Fund’s management and subadvisory fees and the fees charged to those other investment advisory clients. In addition, the Board requested and received information on the profitability of the Fund to New York Life Investments and its affiliates and Epoch, and responses from New York Life Investments and Epoch to a series of questions encompassing a variety of topics prepared on behalf of the Board by independent legal counsel to the Board and its independent trustees (the “Independent Trustees”). Information provided to the Board at its meetings throughout the year included, among other items, detailed investment performance reports on the Fund prepared by the Investment Consulting Group at New York Life Investments. The structure and format for this regular reporting was developed in consultation with the Board. The Board also received from New York Life Investments throughout the year, among other items, periodic reports on legal and compliance matters, portfolio turnover, and sales and marketing activity.
In determining to approve the Agreements, the members of the Board reviewed and evaluated all of the information and factors they believed to be relevant and appropriate in light of legal advice furnished to them by independent legal counsel and through the exercise of their own business judgment. The broad factors considered by the Board are discussed in greater detail below, and included, among other items: (i) the nature, scope and quality of the services provided to the Fund by New York Life Investments and Epoch; (ii) the investment performance of the Fund, New York Life Investments and Epoch; (iii) the costs of the services provided, and profits realized, by New York Life Investments and Epoch from their relationship with the Fund; (iv) the extent to which economies of scale may be realized as the Fund grows, and the extent to which economies of scale may benefit Fund investors; and (v) the reasonableness of the Fund’s management and subadvisory fees and
overall total ordinary operating expenses, particularly as compared to similar funds and accounts managed by New York Life Investments and Epoch and third-party “peer funds” identified by Strategic Insight.
While individual members of the Board may have weighed certain factors differently, the Board’s decision to approve the Agreements was based on a consideration of all the information provided to the Board, including information provided to the Board throughout the year and specifically in connection with the contract review process. The Board’s conclusions with respect to the Agreements also were based, in part, on the Board’s consideration of the Agreements in prior years. In addition to considering the above-referenced factors, the Board observed that in the marketplace there are a range of investment options available to shareholders of the Fund, and that the Fund’s shareholders, having had the opportunity to consider other investment options, have chosen to invest in the Fund. A more detailed discussion of the factors that figured prominently in the Board’s decisions to approve the Agreements is provided below.
Nature, Scope and Quality of Services to Be Provided by New York Life Investments and Epoch
The Board examined the nature, scope and quality of the services that New York Life Investments provides to the Fund. The Board evaluated New York Life Investments’ experience in serving as manager of the Fund, noting that New York Life Investments manages other mutual funds, serves a variety of other investment advisory clients, including other pooled investment vehicles, and has experience with overseeing mutual fund service providers, including subadvisors. The Board considered the experience of senior personnel at New York Life Investments providing management and administrative services to the Fund, as well as New York Life Investments’ reputation and financial condition. The Board also considered the full range of non-advisory services that New York Life Investments supplies to the Fund under the terms of the Management Agreement, including: (i) fund accounting services provided by New York Life Investments’ Fund Accounting and Administration Group; (ii) investment oversight and analytical services provided by New York Life Investments’ Investment Consulting Group; (iii) compliance services provided by New York Life Investments’ compliance department, including oversight and implementation of the Fund’s compliance program; and (iv) legal services provided by New York Life Investments’ Office of the General Counsel. Additional information about the non-advisory services provided by New York Life Investments is set forth in the Fund’s Management Agreement. The Board also considered New York Life Investments’ willingness to invest in personnel that benefit the Fund, and noted that New York Life Investments is responsible for compensating the Fund’s officers. The Board also considered benefits to shareholders of being part of the MainStay Group of Funds, including the privilege of exchanging investments between the same class of shares without the imposition of a sales charge, as described more fully in the Fund’s prospectus.
The Board also examined the nature, scope and quality of the advisory services that Epoch provides to the Fund. The Board evaluated Epoch’s experience in serving as subadvisor to the Fund and managing other portfolios. It examined Epoch’s track record and experience in providing investment advisory services, the experience of investment advisory, senior management and administrative personnel at Epoch, and Epoch’s overall legal and compliance environment. The Board also reviewed
| | |
| 30 | | MainStay Epoch International Small Cap Fund |
Epoch’s willingness to invest in personnel that benefit the Fund. In this regard, the Board considered the experience of the Fund’s portfolio managers, the number of accounts managed by the portfolio managers and the method for compensating portfolio managers.
Based on these considerations, the Board concluded, within the context of its overall determinations regarding the Agreements, that the Fund should continue to benefit from the nature, scope and quality of these services as a result of New York Life Investments’ and Epoch’s experience, personnel, operations and resources.
Investment Performance
In evaluating the Fund’s investment performance, the Board considered investment performance results in light of the Fund’s investment objective, strategies and risks, as disclosed in the Fund’s prospectus. The Board particularly considered detailed investment reports on the Fund’s performance provided to the Board throughout the year by the Investment Consulting Group of New York Life Investments. These reports include, among other items, information on the Fund’s gross and net returns, the Fund’s investment performance relative to relevant investment categories and Fund benchmarks, the Fund’s risk-adjusted investment performance, and the Fund’s investment performance as compared to similar competitor funds, as appropriate. The Board also considered information provided by Strategic Insight showing the investment performance of the Fund as compared to peer funds.
In considering the Fund’s investment performance, the Board focused principally on the Fund’s long-term performance track record. The Board also gave weight to its ongoing discussions with senior management at New York Life Investments concerning the Fund’s investment performance, as well as discussions between the Fund’s portfolio managers and the Board that occur typically on an annual basis. In addition, the Board considered any specific actions that New York Life Investments or Epoch had taken, or had agreed with the Board to take, to enhance Fund investment performance, and the results of those actions. The Board discussed its disappointment with the Fund’s relative investment performance over various time periods, and noted that the Board would continue to discuss with management actions that may improve the Fund’s investment performance in the coming year.
Based on these considerations, the Board concluded, within the context of its overall determinations regarding the Agreements, that the long-term investment performance of the Fund, along with ongoing efforts by New York Life Investments and Epoch to enhance investment returns, supported a determination to approve the Agreements. The Fund discloses more information about investment performance in the Portfolio Management Discussion and Analysis, Investment and Performance Comparison and Financial Highlights sections of this Semiannual Report and in the Fund’s prospectus.
Costs of the Services Provided, and Profits Realized, by New York Life Investments and Epoch
The Board considered the costs of the services provided by New York Life Investments and Epoch under the Agreements, and the profits realized by New York Life Investments and its affiliates and Epoch due to their relationships with the Fund. Because Epoch’s subadvisory fees are negotiated at arm’s-length by New York Life Investments and are paid by New York Life Investments, not the Fund, the Board principally
considered the profits realized by New York Life Investments and its affiliates with respect to the Fund.
In evaluating the costs and profits of New York Life Investments and its affiliates and Epoch, the Board considered, among other factors, each party’s investments in personnel, systems, equipment and other resources necessary to manage the Fund, and that New York Life Investments is responsible for paying the subadvisory fees for the Fund. The Board acknowledged that New York Life Investments and Epoch must be in a position to pay and retain experienced professional personnel to provide services to the Fund, and that the ability to maintain a strong financial position is important in order for New York Life Investments and Epoch to continue to provide high-quality services to the Fund. The Board also noted that the Fund benefits from the allocation of certain fixed costs across the MainStay Group of Funds.
In addition, the Board noted the difficulty in obtaining reliable comparative data about mutual fund managers’ profitability, since such information generally is not publicly available and may be impacted by numerous factors, including the structure of a fund manager’s organization, the types of funds it manages, the methodology used to allocate certain fixed costs to specific funds, and the manager’s capital structure and costs of capital. While recognizing the difficulty in evaluating a manager’s profitability with respect to the Fund, and noting that other profitability methodologies may also be reasonable, the Board concluded that the profitability methodology presented by New York Life Investments to the Board, which was developed by New York Life Investments in consultation with an independent consultant, was reasonable in all material respects.
In considering the costs and profitability of the Fund, the Board also considered certain fall-out benefits that may be realized by New York Life Investments and its affiliates due to their relationships with the Fund. The Board recognized, for example, the benefits to Epoch from legally permitted “soft-dollar” arrangements by which brokers provide research and other services to Epoch in exchange for commissions paid by the Fund with respect to trades on the Fund’s portfolio securities. The Board also requested and received information from New York Life Investments and Epoch concerning other business relationships between Epoch and its affiliates and New York Life Investments and its affiliates.
The Board further considered that, in addition to fees earned by New York Life Investments for managing the Fund, New York Life Investments’ affiliates also earn revenues from serving the Fund in various other capacities, including as the Fund’s transfer agent and distributor. The Board observed that information about these other revenues, and their impact on the profitability of the Fund to New York Life Investments and its affiliates, was furnished to the Board as part of the 15(c) process. The Board noted that, although it assessed the overall profitability of the Fund to New York Life Investments and its affiliates as part of the contract review process, when considering the reasonableness of the fees to be paid to New York Life Investments and its affiliates under the Agreements, the Board considered the profitability of New York Life Investments’ relationship with the Fund on a pre-tax basis, and without regard to distribution expenses.
After evaluating the information presented to the Board, the Board concluded, within the context of its overall determinations regarding the Agreements, that any profits realized by New York Life Investments and its affiliates due to their relationships with the Fund supported the
| | | | |
| mainstayinvestments.com | | | 31 | |
I. Board Consideration and Approval of Management Agreement and
Subadvisory Agreement (Unaudited) (continued)
Board’s decision to approve the Agreements. With respect to Epoch, the Board concluded that any profits realized by Epoch due to its relationship with the Fund are the result of arm’s-length negotiations between New York Life Investments and Epoch, and are based on fees paid to Epoch by New York Life Investments, not the Fund.
Extent to Which Economies of Scale May Be Realized as the Fund Grows
The Board also considered whether the Fund’s expense structure permitted economies of scale to be shared with Fund investors. The Board reviewed information from New York Life Investments showing how the Fund’s management fee schedule compared to fee schedules of other funds and accounts managed by New York Life Investments. The Board also reviewed information from Strategic Insight showing how the Fund’s management fee schedule hypothetically would compare with fees paid for similar services by peer funds at varying asset levels. While recognizing the difficulty of determining economies of scale with precision, the Board acknowledged that economies of scale may be shared with the Fund in a number of ways, including, for example, through the imposition of management fee breakpoints and by initially setting relatively lower management fees.
Based on this information, the Board concluded, within the context of its overall determinations regarding the Agreements, that the Fund’s expense structure appropriately reflects economies of scale for the benefit of Fund investors. The Board noted, however, that it would continue to evaluate the reasonableness of the Fund’s expense structure as the Fund grows over time.
Management and Subadvisory Fees and Total Ordinary Operating Expenses
The Board evaluated the reasonableness of the fees to be paid under the Agreements and the Fund’s expected total ordinary operating expenses. The Board primarily considered the reasonableness of the management fee paid by the Fund to New York Life Investments, since the fees paid to Epoch are paid by New York Life Investments, not the Fund.
In assessing the reasonableness of the Fund’s fees and expenses, the Board primarily considered comparative data provided by Strategic Insight on the fees and expenses charged by similar mutual funds managed by other investment advisers. In addition, the Board considered information provided by New York Life Investments and Epoch on fees charged to other investment advisory clients, including institutional separate accounts and other funds with similar investment objectives as the Fund. The Board particularly considered differences in the contractual management fee schedules of the retail MainStay Funds and similarly-managed MainStay VP Portfolios, taking into account New York Life Investments’ rationale for any differences in fee schedules. The Board also took into account explanations provided by New York Life Investments about the different scope of services provided to mutual funds as compared with other investment advisory clients. Additionally, the Board considered the impact of any expense limitation arrangements on the Fund’s net management fee and expenses.
The Board noted that, outside of the Fund’s management fee and the fees charged under a share class’s Rule 12b-1 and/or shareholder services plans, a share class’s most significant “other expenses” are transfer
agent fees. Transfer agent fees are charged to the Fund based on the number of shareholder accounts (a “per-account” fee) as compared with certain other fees (e.g., management fees), which are charged based on the Fund’s average net assets. The Board took into account information from New York Life Investments showing that the Fund’s transfer agent fee schedule is reasonable, including industry data showing that the per-account fees that NYLIM Service Company LLC, the Fund’s transfer agent, charges the Fund are within the range of per-account fees charged by transfer agents to other mutual funds. In addition, the Board considered NYLIM Service Company LLC’s profitability in connection with the transfer agent services it provides to the Fund.
The Board acknowledged that, because the Fund’s transfer agent fees are billed on a per-account basis, the impact of transfer agent fees on a share class’s expense ratio may be more significant in cases where the share class has a high number of accounts with limited assets (i.e., small accounts). The Board observed that transfer agent fees are a significant portion of total expenses of many Funds in the MainStay Group of Funds. The impact of transfer agent fees on the expense ratios of these MainStay Funds tend to be greater than for other open-end retail funds, because the MainStay Group of Funds generally has a significant number of small accounts relative to competitor funds. The Board acknowledged the role that the MainStay Group of Funds historically has played in serving the investment needs of New York Life Insurance Company (“New York Life”) policyholders, who often maintain smaller account balances than other fund investors. The Board discussed measures that it and New York Life Investments have taken in recent years to mitigate the effect of small accounts on the expense ratios of Fund share classes, including: (i) encouraging New York Life agents to consolidate multiple small accounts held by the same investor into one MainStay Asset Allocation Fund account; (ii) increasing investment minimums from $500 to $1,000 in 2003; (iii) introducing Investor Class shares for certain MainStay Funds in early 2008 to consolidate smaller account investors; (iv) closing small accounts with balances below $250 in Investor Class shares or $750 in all other classes of shares; (v) no longer allowing an exception with no minimum investment amount with respect to AutoInvest accounts with subsequent monthly purchases of $100; (vi) since 2007, charging an annual $20.00 small account fee on certain accounts with balances below $1,000; and (vii) modifying the approach for billing transfer agent expenses to reduce the degree of subsidization by large accounts of smaller accounts. In addition, the Board acknowledged New York Life Investments’ efforts to encourage intermediaries to consolidate small accounts in multiple Funds held by the same investor into a single Asset Allocation Fund account, if appropriate under the circumstances, in an effort to mitigate the effect of small accounts on the Funds in the MainStay Group of Funds.
After considering all of the factors outlined above, the Board concluded that the Fund’s management and subadvisory fees and total ordinary operating expenses were within a range that is competitive and, within the context of the Board’s overall conclusions regarding the Agreements, support a conclusion that these fees and expenses are reasonable.
Conclusion
On the basis of the information provided to it and its evaluation thereof, the Board, including the Independent Trustees, unanimously voted to approve the Agreements.
| | |
| 32 | | MainStay Epoch International Small Cap Fund |
II. Board Consideration and Approval of New Subadvisory
Agreement (Unaudited)
At its March 21, 2013 meeting, the Board unanimously approved a new Subadvisory Agreement (the “Subadvisory Agreement”) between New York Life Investments and Epoch on behalf of the Fund that took effect on March 27, 2013. The Board was asked to approve the Subadvisory Agreement in connection with a “change in control” of Epoch and, accordingly, the termination by law and the express terms of the previous subadvisory agreement between New York Life Investments and Epoch with respect to the Fund.
On March 27, 2013, Epoch Holding Corporation (“Epoch Holding”) merged with Empire Merger Sub, Inc., a wholly-owned subsidiary of The Toronto-Dominion Bank, a Canadian chartered bank (“Epoch Holding Merger”) following the approval of Epoch Holding shareholders. As a result, Epoch Holding became a wholly-owned subsidiary of The Toronto- Dominion Bank (“TD Bank”). Epoch Holding is the parent company of Epoch Investment Partners, Inc. (“Epoch”), the Fund’s subadvisor. The closing of the Epoch Holding Merger resulted in a “change of control” of Epoch.
In reaching its decision to approve the continued retention of Epoch and the Agreement, the Board considered information presented to it by New York Life Investments, Epoch and TD Bank as part of its consideration and approval of the Agreement at the Board’s meeting in March 2013, as well as other relevant information furnished to it throughout the year by New York Life Investments and Epoch at regular and special Board meetings. The Board also requested and received responses from Epoch to a comprehensive list of questions encompassing a variety of topics prepared on behalf of the Board by independent legal counsel to the Board. The Board noted that it had also requested and received responses to similar questions in connection with its annual approval of the previous subadvisory agreement with Epoch at various meetings of the Board and its Contracts Committee between September 2012 and December 2012. The Board considered its historical experience with Epoch’s capabilities and resources, and its evaluation of Epoch in connection with previous contract review processes, including the contract review process that culminated with approval of the previous subadvisory agreement between New York Life Investments and Epoch, on behalf of the Fund (the “Prior Contract Review Processes”).
In determining to approve the continued retention of Epoch and approve the Agreement, the members of the Board reviewed and evaluated all of the information and factors they believed to be relevant and appropriate in light of legal advice furnished to them by independent legal counsel and through the exercise of their own business judgment. The broad factors considered by the Board are discussed in greater detail below, and included, among other things: (i) the nature, scope and quality of the services to be provided to the Fund by Epoch; (ii) the investment performance of the Fund; (iii) the costs of the services to be provided and the profits to be realized by Epoch and its affiliates from its relationship with the Fund; (iv) the extent to which economies of scale may be realized as the Fund grows, and the extent to which economies of scale may benefit Fund investors; and (v) the reasonableness of the Fund’s management and subadvisory fee levels and overall total ordinary operating expenses.
While the members of the Board may have weighed certain factors differently, the Board’s decision to approve the continued retention of Epoch and approve the Agreement was based on a comprehensive consideration of all the information provided to the Board, including
information provided to the Board in connection with its review of Epoch. The Board also considered that shareholders of the Fund approved the ability of New York Life Investments to act as a “manager of managers,” which allows the Board and New York Life Investments to retain unaffiliated subadvisors for the Fund without the approval of Fund shareholders. A more detailed discussion of the factors that figured prominently in the Board’s decision to approve the continued retention of Epoch and approve the Agreement is provided below.
Nature, Scope and Quality of Services to Be Provided by Epoch
In considering the approval of the continued retention of Epoch and approval of the Agreement, the Board examined the nature, scope and quality of the services that Epoch historically had provided to the Fund. Based on information provided to the Board in connection with the Prior Contract Review Processes, the Board acknowledged Epoch’s historical service to the Fund, and took note of the experience of Epoch’s portfolio managers, the number of accounts managed by the portfolio managers and Epoch’s method for compensating portfolio managers. The Board also considered the experience of senior personnel at Epoch, and Epoch’s plans for retaining key personnel in connection with the acquisition of Epoch Holding by TD Bank. Based on these considerations, the Board concluded, within the context of its overall determinations regarding the Agreement, that the Fund should continue to benefit from the nature, scope and quality of these services as a result of Epoch’s experience, personnel, operations and resources.
Investment Performance
In evaluating investment performance, the Board took note of the Fund’s historical investment performance results, as presented to the Board in connection with the Prior Contract Review Processes, in light of the Fund’s investment objectives, strategies and risks, as disclosed in the Fund’s prospectuses. The Board considered information about the Fund’s investment performance that is provided to the Board in connection with its regularly scheduled meetings, and also took note of information provided in connection with the Prior Contract Review Processes showing the investment performance of the Fund as compared to peer funds. The Board also considered the strength of Epoch’s resources (including research capabilities). Based on these considerations, the Board concluded, within the context of its overall determinations regarding the Agreement, that the retention of Epoch as subadvisor to the Fund is likely to benefit the Fund’s long-term investment performance.
Costs of the Services to Be Provided, and Profits to Be Realized, by Epoch
The Board considered the costs of the services to be provided by Epoch under the Agreement, and the profits to be realized by Epoch due to its relationship with the Fund, taking into account information provided to the Board in connection with the Prior Contract Review Processes. The Board noted that, in connection with Prior Contract Review Processes, Epoch has provided the Board with information about its profitability in connection with its relationship with the Fund. In addition, the Board considered past representations from Epoch and New York Life Investments that the subadvisory fees paid by New York Life Investments to
| | | | |
| mainstayinvestments.com | | | 33 | |
II. Board Consideration and Approval of New Subadvisory
Agreement (Unaudited) (continued)
Epoch were the result of arm’s-length negotiations. Because Epoch’s subadvisory fees are paid by New York Life Investments, and not the Fund, the Board historically has focused principally on the profitability of the Fund to New York Life Investments and its affiliates.
In evaluating the costs of the services provided by Epoch in connection with the Prior Contract Review Processes, the Board considered, among other things, Epoch’s investments in personnel, systems, equipment and other resources necessary to manage the Fund, and the fact that New York Life Investments is responsible for paying the subadvisory fees for the Fund. The Board acknowledged that Epoch must be in a position to pay and retain experienced professional personnel to provide services to the Fund, and that Epoch’s ability to maintain a strong financial position is important in order for Epoch to provide high-quality ongoing services to the Fund and its investors.
The Board also considered certain fall-out benefits that may be realized by Epoch due to its relationship with the Fund. The Board recognized, for example, the benefits to Epoch from legally permitted “soft-dollar” arrangements by which brokers may provide research and other services to Epoch in exchange for commissions paid by the Fund with respect to trades on the Fund’s portfolio securities.
As part of the Prior Contract Review Processes, the Board requested and received information from Epoch and New York Life Investments concerning other business relationships between Epoch and its affiliates and New York Life Investments and its affiliates. The Board requested and received assurances that these other business relationships did not impact New York Life Investments’ recommendation for Epoch to serve as the Fund’s subadvisor, and that neither New York Life Investments nor its affiliates are expected to benefit in its other business relationships due to Epoch’s continued engagement as the Fund’s subadvisor.
After evaluating the information presented to the Board, the Board concluded, within the context of its overall determinations regarding the Agreement, that any profits to be realized by Epoch due to its relationship with the Fund supported the Board’s determination to approve the Agreement. The Board also concluded that any profits to be realized by Epoch will be the result of arm’s-length negotiations between New York Life Investments and Epoch, and will be based on subadvisory fees paid to Epoch by New York Life Investments, not the Fund.
Extent to Which Economies of Scale May Be Realized as the Fund Grows
The Board also considered whether the Fund’s expense structures permitted economies of scale to be shared with the Fund’s investors, taking into account information provided to the Board in connection with the Prior Contract Review Processes.
Based on this information, the Board concluded, within the context of its overall determinations regarding the Agreement, that the Fund’s expense structure appropriately reflect economies of scale for the benefit of Fund investors. The Board noted, however, that it would continue to evaluate the reasonableness of the Fund’s expense structure as the Fund grows over time.
Reasonableness of Subadvisory Fees
The Board evaluated the reasonableness of the fees to be paid under the existing management agreement with New York Life Investments and the Agreement, and the Fund’s expected total ordinary operating expenses. The Board considered that the fees to be paid to Epoch under the Agreement will be paid by New York Life Investments, not the Fund, and will result in no increase in the Fund’s expenses. In assessing the reasonableness of the Fund’s fees and expenses the Board primarily considered comparative data provided to the Board in connection with the Prior Contract Review Processes on the fees and expenses charged by similar mutual funds managed by other investment advisers. In addition, the Board considered information provided by New York Life Investments and Epoch on fees charged to other investment advisory clients, including institutional separate accounts and other funds with similar investment objectives as the Fund. In this regard, the Board took into account explanations from New York Life Investments and Epoch about the different scope of services provided to retail mutual funds as compared with other investment advisory clients. The Board also took into account the impact of any expenses limitation arrangements on the Fund’s net expenses.
After considering all of the factors outlined above, the Board concluded that the Fund’s management and subadvisory fees and total ordinary operating expenses were within a range that is competitive and, within the context of the Board’s overall conclusions regarding the Agreement, support a conclusion that these fees and expenses are reasonable.
Conclusion
On the basis of the information provided to it and its evaluation thereof, the Board, including the Independent Trustees, unanimously voted to approve the Agreement.
| | |
| 34 | | MainStay Epoch International Small Cap Fund |
Proxy Voting Policies and Procedures and Proxy Voting Record
A description of the policies and procedures that New York Life Investments uses to vote proxies related to the Fund’s securities is available without charge, upon request, (i) by visiting the Fund’s website at mainstayinvestments.com; and (ii) on the SEC’s website at www.sec.gov.
The Fund is required to file with the SEC its proxy voting records for the 12-month period ending June 30 on Form N-PX. The Fund’s most recent Form N-PX or proxy voting record is available free of charge upon request by calling 800-MAINSTAY (624-6782); visiting the Fund’s website at mainstayinvestments.com; or on the SEC’s website at www.sec.gov.
Shareholder Reports and Quarterly Portfolio Disclosure
The Fund is required to file its complete schedule of portfolio holdings with the SEC for its first and third fiscal quarters on Form N-Q. The Fund’s Form N-Q is available without charge, on the SEC’s website at www.sec.gov or by calling MainStay Investments at 800-MAINSTAY (624-6782). You also can obtain and review copies of Form N-Q by visiting the SEC’s Public Reference Room in Washington, DC (information on the operation of the Public Reference Room may be obtained by calling 1-800-SEC-0330).
| | | | |
| mainstayinvestments.com | | | 35 | |
This page intentionally left blank
This page intentionally left blank
This page intentionally left blank
MainStay Funds
MainStay offers a wide range of Funds for virtually any investment need. The full array of MainStay open-end offerings is listed here, with information about the manager, subadvisors, legal counsel and independent registered public accounting firms.
Equity
U.S. Equity Funds
MainStay Common Stock Fund
MainStay Cornerstone Growth Fund
MainStay Epoch U.S. All Cap Fund
MainStay Epoch U.S. Equity Yield Fund
MainStay ICAP Equity Fund
MainStay ICAP Select Equity Fund
MainStay Large Cap Growth Fund1
MainStay MAP Fund
MainStay S&P 500 Index Fund
MainStay U.S. Equity Opportunities Fund
MainStay U.S. Small Cap Fund
International/Global Equity Funds
MainStay Epoch Global Choice Fund
MainStay Epoch Global Equity Yield Fund
MainStay Epoch International Small Cap Fund
MainStay ICAP Global Fund
MainStay ICAP International Fund
MainStay International Equity Fund
MainStay International Opportunities Fund
Income
Taxable Bond Funds
MainStay Floating Rate Fund
MainStay Global High Income Fund
MainStay Government Fund
MainStay High Yield Corporate Bond Fund
MainStay High Yield Opportunities Fund
MainStay Indexed Bond Fund
MainStay Intermediate Term Bond Fund
MainStay Short Duration High Yield Fund
MainStay Short Term Bond Fund
MainStay Unconstrained Bond Fund
Municipal Bond Funds
MainStay California Tax Free Opportunities Fund2
MainStay High Yield Municipal Bond Fund
MainStay New York Tax Free Opportunities Fund3
MainStay Tax Free Bond Fund
Money Market Fund
MainStay Money Market Fund
Mixed Asset
MainStay Balanced Fund
MainStay Convertible Fund
MainStay Income Builder Fund
MainStay Marketfield Fund
Asset Allocation/Target Date
MainStay Conservative Allocation Fund
MainStay Growth Allocation Fund
MainStay Moderate Allocation Fund
MainStay Moderate Growth Allocation Fund
MainStay Retirement 2010 Fund
MainStay Retirement 2020 Fund
MainStay Retirement 2030 Fund
MainStay Retirement 2040 Fund
MainStay Retirement 2050 Fund
Manager
New York Life Investment Management LLC
New York, New York
Subadvisors
Cornerstone Capital Management Holdings LLC4
New York, New York
Cornerstone Capital Management LLC4
Bloomington, Minnesota
Epoch Investment Partners, Inc.
New York, New York
Institutional Capital LLC4
Chicago, Illinois
MacKay Shields LLC4
New York, New York
Marketfield Asset Management LLC
New York, New York
Markston International LLC
White Plains, New York
Winslow Capital Management LLC
Minneapolis, Minnesota
Legal Counsel
Dechert LLP
Independent Registered Public Accounting Firms
KPMG LLP
PricewaterhouseCoopers LLP
1. Effective January 13, 2012, the Fund was closed to new investors with certain exceptions.
2. This Fund is only registered for sale in AZ, CA, NV, OR, UT, and WA.
3. This Fund is only registered for sale in CT, DE, FL, MA, NJ, NY, and VT.
4. An affiliate of New York Life Investment Management LLC.
Not part of the Semiannual Report
For more information
800-MAINSTAY (624-6782)
mainstayinvestments.com
The MainStay Funds® are managed by New York Life Investment Management LLC and distributed through NYLIFE Distributors LLC, 169 Lackawanna Avenue, Parsippany, NJ 07054, a wholly owned subsidiary of New York Life Insurance Company. NYLIFE Distributors LLC is a Member FINRA/SIPC.
MainStay Investments® is a registered service mark and name under which New York Life Investment Management LLC does business. MainStay Investments, an indirect subsidiary of New York Life Insurance Company, New York, NY 10010, provides investment advisory products and services.
This report may be distributed only when preceded or accompanied by a current Fund prospectus.
©2013 NYLIFE Distributors LLC. All rights reserved.
| | | | | | | | |
| Not FDIC/NCUA Insured | | Not a Deposit | | May Lose Value | | No Bank Guarantee | | Not Insured by Any Government Agency |
| | |
| NYLIM-30213 MS175-13 | | MSEISC10-06/13 NL0F4 |
MainStay High Yield Municipal Bond Fund
Message from the President and Semiannual Report
Unaudited | April 30, 2013


This page intentionally left blank
Message from the President
The U.S. stock market advanced during the six months ended April 30, 2013, generally providing double-digit returns at all capitalization levels. Value stocks tended to outpace growth stocks among large- and mid-capitalization companies, while growth stocks tended to outpace value stocks among smaller companies.
The market’s advance, however, was far from uniform. Stocks declined in early November, both before and immediately after the U.S. presidential election. Following a sharp recovery, stocks climbed until mid-December, when a Congressional stalemate on the fiscal cliff led to a brief decline. Another dip occurred in late February as investors speculated that the Federal Open Market Committee (FOMC) might stop purchasing mortgage-backed securities sooner than expected. Stocks also dipped in mid-April, as consumer sentiment dropped after the Boston marathon bombing. Despite these setbacks, U.S. stocks continued to trend upward during the six-month reporting period.
International stock markets also advanced, with several regional differences. Accommodative action by the Bank of Japan helped lower the yen and lift Japanese stocks to their highest levels since 2008. In Europe, stocks did well until early February, bolstered by the promise of support for the euro. As the year progressed, however, economic contraction, rising unemployment and systematic banking concerns took a toll on investor enthusiasm. In China, manufacturing slowed as the nation sought to balance growth and inflation risks. On the Korean peninsula, tensions rose as North Korea continued to threaten its neighbors, which added an undercurrent of caution to the market.
During the six months ended April 30, 2013, the FOMC kept the federal funds rate in a range close to zero. The FOMC also continued its direct purchases of mortgage-backed securities and longer-term U.S. government securities. With short-term interest rates likely to remain at low levels, many bond investors pursued higher yields by lengthening maturities and assuming greater risk. As a result, bonds with higher risk profiles tended
to outperform higher-quality investment-grade bonds and U.S. Treasury securities. Cash and cash equivalents essentially returned zero.
With wide variations in the performance of various asset classes, some investors might be tempted to chase higher returns by shifting back and forth between stocks and bonds. Since no one can predict where the market will move next, however, we encourage investors to select an appropriate mix of investments for their risk tolerance and time horizon and to stick with that mix, making only minor adjustments over time.
At MainStay Funds, our portfolio managers use a similar approach. Careful security selection and thoughtful sell disciplines help them pursue the investment objectives of their respective Funds. Using the principal investment strategies outlined in the Prospectus, they focus primarily on providing long-term investment potential for our shareholders.
Has this approach proved successful? In its most recent rankings, Barron’s listed MainStay Funds as the #1 fund family over the past 10 years. We were also the only mutual fund family that has appeared in Barron’s top six for the past five consecutive years.
The pages that follow provide additional insight into the specific market events, investment decisions and securities that shaped your MainStay Fund(s) during the six months ended April 30, 2013. We encourage you to read the semiannual report(s) carefully and to evaluate your results with your long-term financial goals in mind.
Sincerely,

Stephen P. Fisher
President
The opinions expressed are as of the date of this report and are subject to change. There is no guarantee that any forecast made will come to pass. This material does not constitute investment advice and is not intended as an endorsement of any specific investment.
To qualify for the Lipper/Barron’s Fund Survey, a fund family must have at least three funds in Lipper’s general U.S.-stock category, one in world equity (which combines global and international funds), one mixed-equity fund (which holds stocks and bonds), two taxable-bond funds, and one tax-exempt fund. Fund loads and 12b-1 fees aren’t included in the calculation of returns because the aim is to measure the manager’s skill. Each fund’s return is measured against all funds in its Lipper category, resulting in a percentile ranking which is then weighted by asset size relative to the fund family’s other assets in its general classifications. Finally, the score is multiplied by the general classification weightings as determined by the entire Lipper universe of funds.
Source: Barron’s, 2/9/13. Overall, MainStay Funds ranked number 56 for the one-year period, 20 for the five-year period and one for the 10-year period ended December 31, 2012, out of 62, 53 and 46 fund families, respectively. MainStay ranked number three for the 10-year period in 2009, 2010 and 2011 from among 48, 46 and 45 fund families, respectively. MainStay ranked number six from among 48 fund families for the 10-year period in 2008. Past performance is no guarantee of future results, which will vary. For the most recent MainStay Funds performance, please visit our website at mainstayinvestments.com. All mutual funds are subject to market risk and will fluctuate in value.
Not part of the Semiannual Report
Table of Contents
Investors should refer to the Fund’s Summary Prospectus and/or Prospectus and consider the Fund’s investment objectives, strategies, risks, charges and expenses carefully before investing. The Summary Prospectus and/or Prospectus contain this and other information about the Fund. You may obtain copies of the Fund’s Summary Prospectus, Prospectus and Statement of Additional Information free of charge, upon request, by calling toll-free 800-MAINSTAY (624-6782), by writing to NYLIFE Distributors LLC, Attn: MainStay Marketing Department, 169 Lackawanna Avenue, Parsippany, New Jersey 07054 or by sending an e-mail to MainStayShareholderServices@nylim.com. These documents are also available via the MainStay Funds’ website at mainstayinvestments.com/documents. Please read the Summary Prospectus and/or Prospectus carefully before investing.
Investment and Performance Comparison1 (Unaudited)
Performance data quoted represents past performance. Past performance is no guarantee of future results. Because of market volatility, current performance may be lower or higher than the figures shown. Investment return and principal value will fluctuate, and as a result, when shares are redeemed, they may be worth more or less than their original cost. The graph below depicts the historical performance of Class I shares of the Fund. Performance will vary from class to class based on differences in class-specific expenses and sales charges. For performance information current to the most recent month-end, please call 800-MAINSTAY (624-6782) or visit mainstayinvestments.com.
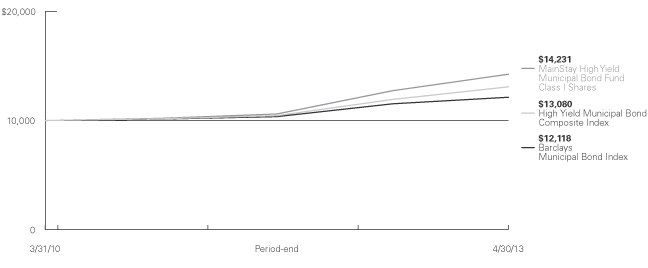
Average Annual Total Returns for the Period Ended April 30, 2013
| | | | | | | | | | | | | | | | | | | | |
| Class | | Sales Charge | | | | Six Months | | | One Year | | | Since
Inception
(3/31/10) | | | Gross
Expense
Ratio2 | |
| Investor Class Shares | | Maximum 4.5% Initial Sales Charge | | With sales charges Excluding sales charges | |
| –0.40
4.29 | %
| |
| 6.57
11.59 | %
| |
| 10.12
11.77 | %
| |
| 0.95
0.95 | %
|
| Class A Shares | | Maximum 4.5% Initial Sales Charge | | With sales charges Excluding sales charges | |
| –0.40
4.29 |
| |
| 6.66
11.69 |
| |
| 10.22
11.88 |
| |
| 0.93
0.93 |
|
| Class C Shares | | Maximum 1% CDSC if Redeemed Within One Year of Purchase | | With sales charges Excluding sales charges | |
| 2.91
3.90 |
| |
| 9.76
10.76 |
| |
| 10.96
10.96 |
| |
| 1.69
1.69 |
|
| Class I Shares | | No Sales Charge | | | | | 4.42 | | | | 11.87 | | | | 12.11 | | | | 0.68 | |
| 1. | The performance table and graph do not reflect the deduction of taxes that a shareholder would pay on dividends, distributions or Fund share redemptions. Total returns reflect maximum applicable sales charges as indicated in the table above, changes in share price, and reinvestment of dividend and capital gain distributions. The graph assumes the initial investment amount shown above and reflects the deduction of all sales charges that would have applied for the period of investment. Performance |
| | figures reflect certain fee waivers and/or expense limitations, without which total returns may have been lower. For more information on share classes and current fee waivers and/or expense limitations, please refer to the notes to the financial statements. |
| 2. | The gross expense ratios presented reflect the Fund’s “Total Annual Fund Operating Expenses” from the most recent Prospectus and may differ from other expense ratios disclosed in this report. |
The footnotes on the next page are an integral part of the table and graph and should be carefully read in conjunction with them.
| | | | |
| mainstayinvestments.com | | | 5 | |
| | | | | | | | | | |
| Benchmark Performance | | Six
Months | | One
Year | | | Since
Inception | |
Barclays Municipal Bond Index3 | | 1.78% | | | 5.19 | % | | | 6.43 | % |
High Yield Municipal Bond Composite Index4 | | 3.70 | | | 9.71 | | | | 9.09 | |
Average Lipper High Yield Municipal Debt Fund5 | | 3.24 | | | 9.60 | | | | 8.77 | |
| 3. | The Barclays Municipal Bond Index includes approximately 46,000 municipal bonds, rated Baa or better by Moody’s, with a maturity of at least one year. Bonds subject to the alternative minimum tax or with floating or zero coupons are excluded. The Barclays Municipal Bond Index is the Fund’s broad-based securities market index for comparison purposes. Results assume the reinvestment of all dividends and capital gains. An investment cannot be made directly in an index. |
| 4. | The High Yield Municipal Bond Composite Index consists of the Barclays High Yield Municipal Bond Index and the Barclays Municipal Bond Index weighted 60%/40%, respectively. The Barclays High Yield Municipal Bond |
| | Index is an unmanaged index made up of bonds that are non-investment grade, unrated, or rated below Ba1 by Moody’s Investors Service with a remaining maturity of at least one year. The High Yield Municipal Bond Composite Index is the Fund’s secondary benchmark. Results assume reinvestment of all dividends and capital gains. An investment cannot be made directly in an index. |
| 5. | The average Lipper high yield municipal debt fund is representative of funds that typically invest 50% or more of their assets in municipal debt issues rated BBB or less. This benchmark is a product of Lipper Inc. Lipper Inc. is an independent monitor of fund performance. Results are based on average total returns of similar funds with all dividends and capital gains reinvested. |
The footnotes on the preceding page are an integral part of the table and graph and should be carefully read in conjunction with them.
| | |
| 6 | | MainStay High Yield Municipal Bond Fund |
Cost in Dollars of a $1,000 Investment in MainStay High Yield Municipal Bond Fund (Unaudited)
The example below is intended to describe the fees and expenses borne by shareholders during the six-month period from November 1, 2012, to April 30, 2013, and the impact of those costs on your investment.
Example
As a shareholder of the Fund, you incur two types of costs: (1) transaction costs, including exchange fees and sales charges (loads) on purchases (as applicable), and (2) ongoing costs, including management fees, distribution and/or service (12b-1) fees, and other Fund expenses (as applicable). This example is intended to help you understand your ongoing costs (in dollars) of investing in the Fund and to compare these costs with the ongoing costs of investing in other mutual funds. The example is based on an investment of $1,000 made at the beginning of the six-month period and held for the entire period from November 1, 2012, to April 30, 2013.
This example illustrates your Fund’s ongoing costs in two ways:
Actual Expenses
The second and third data columns in the table below provide information about actual account values and actual expenses. You may use the information in these columns, together with the amount you invested, to estimate the expenses that you paid during the six months ended April 30, 2013. Simply divide your account value by $1,000 (for example, an $8,600 account value divided by $1,000 = 8.6), then
multiply the result by the number under the heading entitled “Expenses Paid During Period” to estimate the expenses you paid on your account during this period.
Hypothetical Example for Comparison Purposes
The fourth and fifth data columns in the table below provide information about hypothetical account values and hypothetical expenses based on the Fund’s actual expense ratio and an assumed rate of return of 5% per year before expenses, which is not the Fund’s actual return. The hypothetical account values and expenses may not be used to estimate the actual ending account balances or expenses you paid for the six-month period shown. You may use this information to compare the ongoing costs of investing in the Fund with the ongoing costs of investing in other Funds. To do so, compare this 5% hypothetical example with the 5% hypothetical examples that appear in the shareholder reports of the other Funds.
Please note that the expenses shown in the table are meant to highlight your ongoing costs only and do not reflect any transactional costs, such as exchange fees or sales charges (loads). Therefore, the fourth and fifth data columns of the table are useful in comparing ongoing costs only and will not help you determine the relative total costs of owning different funds. In addition, if these transactional costs were included, your costs would have been higher.
| | | | | | | | | | | | | | | | | | | | |
| | | | | | | | | | | | | | | | |
| Share Class | | Beginning
Account
Value
11/1/12 | | | Ending Account
Value (Based
on Actual
Returns and
Expenses)
4/30/13 | | | Expenses
Paid
During
Period1 | | | Ending Account
Value (Based
on Hypothetical
5% Annualized
Return and
Actual Expenses)
4/30/13 | | | Expenses
Paid
During
Period1 | |
| | | | | |
| Investor Class Shares | | $ | 1,000.00 | | | $ | 1,042.90 | | | $ | 4.41 | | | $ | 1,020.50 | | | $ | 4.36 | |
| | | | | |
| Class A Shares | | $ | 1,000.00 | | | $ | 1,042.90 | | | $ | 4.36 | | | $ | 1,020.50 | | | $ | 4.31 | |
| | | | | |
| Class C Shares | | $ | 1,000.00 | | | $ | 1,039.00 | | | $ | 8.19 | | | $ | 1,016.80 | | | $ | 8.10 | |
| | | | | |
| Class I Shares | | $ | 1,000.00 | | | $ | 1,044.20 | | | $ | 3.09 | | | $ | 1,021.80 | | | $ | 3.06 | |
| 1. | Expenses are equal to the Fund’s annualized expense ratio of each class (0.87% for Investor Class, 0.86% for Class A, 1.62% for Class C and 0.61% for Class I) multiplied by the average account value over the period, divided by 365 and multiplied by 181 (to reflect the six-month period). The table above represents the actual expenses incurred during the six-month period. |
| | | | |
| mainstayinvestments.com | | | 7 | |
Portfolio Composition as of April 30, 2013 (Unaudited)
| | | | |
| California | | | 18.2 | % |
| Texas | | | 10.9 | |
| Michigan | | | 6.7 | |
| Ohio | | | 5.7 | |
| Pennsylvania | | | 5.1 | |
| New Jersey | | | 4.6 | |
| New York | | | 4.6 | |
| Florida | | | 4.3 | |
| Virginia | | | 3.6 | |
| Alabama | | | 2.9 | |
| Guam | | | 2.5 | |
| Indiana | | | 2.5 | |
| Illinois | | | 2.4 | |
| Iowa | | | 2.0 | |
| Colorado | | | 1.9 | |
| Arizona | | | 1.6 | |
| Nebraska | | | 1.6 | |
| Wisconsin | | | 1.6 | |
| Tennessee | | | 1.4 | |
| Kansas | | | 1.3 | |
| Washington | | | 1.3 | |
| Missouri | | | 1.2 | |
| Louisiana | | | 1.1 | |
| Maryland | | | 1.1 | |
| | | | |
| Massachusetts | | | 1.0 | % |
| Oregon | | | 0.9 | |
| Alaska | | | 0.8 | |
| District of Columbia | | | 0.8 | |
| Oklahoma | | | 0.8 | |
| Rhode Island | | | 0.8 | |
| New Hampshire | | | 0.6 | |
| Minnesota | | | 0.5 | |
| U.S. Virgin Islands | | | 0.5 | |
| West Virginia | | | 0.5 | |
| Connecticut | | | 0.4 | |
| Georgia | | | 0.4 | |
| Nevada | | | 0.3 | |
| Delaware | | | 0.2 | |
| Utah | | | 0.2 | |
| Wyoming | | | 0.2 | |
| Kentucky | | | 0.1 | |
| Mississippi | | | 0.1 | |
| Multi-State | | | 0.1 | |
| North Carolina | | | 0.1 | |
| South Carolina | | | 0.1 | |
| Vermont | | | 0.1 | |
| Other Assets, Less Liabilities | | | 0.4 | |
| | | | |
| | | 100.0 | % |
| | | | |
See Portfolio of Investments beginning on page 11 for specific holdings within these categories.
Top Ten Holdings or Issuers Held as of April 30, 2013
| 1. | Golden State Tobacco Securitization Corp., Revenue Bonds, 4.50%–5.00%, due 6/1/27–6/1/45 |
| 2. | Texas Municipal Gas Acquisition & Supply Corp. III, Revenue Bonds, 5.00%, due 12/15/28–12/15/31 |
| 3. | Harris County-Houston Sports Authority, Revenue Bonds, zero coupon–5.375%, due 11/15/13–11/15/41 |
| 4. | San Joaquin Hills Transportation Corridor Agency, Revenue Bonds, zero coupon–5.375%, due 1/15/24–1/15/36 |
| 5. | Central Texas Regional Mobility Authority, Revenue Bonds, zero coupon–6.75%, due 1/1/23–1/1/41 |
| 6. | City of Orlando, Tourist Development Tax Revenue, 3rd Lien, 6th Cent Contract, Revenue Bonds, 5.50%, due 11/1/38 |
| 7. | Michigan Tobacco Settlement Finance Authority, Revenue Bonds, 6.00%, due 6/1/34–6/1/48 |
| 8. | Buckeye Tobacco Settlement Financing Authority, Asset-Backed, Senior Turbo, Revenue Bonds, 5.875%, due 6/1/30–6/1/47 |
| 9. | Montgomery County Public Building Authority, Tennessee County Loan Pool, Revenue Bonds, 0.25%, due 4/1/32–7/1/38 |
| 10. | Central Plains Energy, Project No. 3, Revenue Bonds, 5.00%–5.25%, due 9/1/37–9/1/42 |
| | |
| 8 | | MainStay High Yield Municipal Bond Fund |
Portfolio Management Discussion and Analysis (Unaudited)
Questions answered by portfolio managers John Loffredo, CFA, Robert DiMella, CFA, and Michael Petty of MacKay Shields LLC, the Fund’s Subadvisor.
How did MainStay High Yield Municipal Bond Fund perform relative to its peers and its benchmark during the six months ended April 30, 2013?
Excluding all sales charges, MainStay High Yield Municipal Bond Fund returned 4.29% for Investor Class shares and Class A shares and 3.90% for Class C shares for the six months ended April 30, 2013. Over the same period, Class I shares returned 4.42%. All share classes outperformed the 3.24% return of the average Lipper1 high yield municipal debt fund, the 1.78% return of the Barclays Municipal Bond Index2 and the 3.70% return of the High Yield Municipal Bond Composite Index.3 All share classes underperformed the 5.00% return of the Barclays High Yield Municipal Bond Index4 for the six months ended April 30, 2013. The Barclays Municipal Bond Index is the Fund’s broad-based securities-market index. The High Yield Municipal Bond Composite Index is the Fund’s secondary benchmark. The Barclays High Yield Municipal Bond Index is a component of the Fund’s secondary benchmark. See page 5 for Fund returns with applicable sales charges.
What factors affected the Fund’s relative performance during the reporting period?
The Fund’s outperformance of the Barclays Municipal Bond Index primarily resulted from spread5 compression of high-yield securities. These securities are part of the Fund’s investment strategy but are not included in the Index. The Fund outperformed its Lipper peer group and the High Yield Municipal Bond Composite Index primarily because of security selection among municipal bonds rated BBB6 and lower. The Fund underper-
formed the Barclays High Yield Municipal Bond Index largely because tobacco bonds produced the highest returns in the municipal market during the reporting period and the Fund carried a much lower exposure to these securities than the
Index. Our investment philosophy emphasizes diversification and risk management; and as a result, the Fund maintains an appropriately lower allocation to the tobacco sector.
What was the Fund’s duration7 strategy during the reporting period?
The Fund typically maintains a duration close to that of the Barclays High Yield Municipal Bond Index. Nevertheless, we believe that the Fund’s market sensitivity is driven more by spread duration,8 which measures the Fund’s sensitivity to changes in yield spreads, than by interest-rate sensitivity. During the reporting period, the Fund had an overweight position in lower-rated investment-grade bonds and in higher-rated non-investment-grade bonds with excess return potential—based on spread—relative to the Barclays Municipal Bond Index.
What specific factors, risks or market forces prompted significant decisions for the Fund during the reporting period?
The expectation of a continued low-interest-rate environment and potentially higher tax rates in 2013 led investors to focus on tax-exempt income, which was beneficial for lower-quality municipal bonds. Accordingly, we continued to believe that credit spreads would tighten. The risk of year-end market illiquidity led us to raise cash levels in early December 2012. This positioning served the Fund well, as market outflows caused a temporary municipal-market sell-off during the final month of 2012. As the new year got underway, we believed that the municipal credit cycle had reached a low point, which led us to emphasize tax-backed credits that we felt would benefit from an improving economic environment.
| 1. | See footnote on page 6 for more information on Lipper Inc. |
| 2. | See footnote on page 6 for more information on the Barclays Municipal Bond Index. |
| 3. | See footnote on page 6 for more information on the High Yield Municipal Bond Composite Index. |
| 4. | See footnote on page 6 for more information on the Barclays High Yield Municipal Bond Index, which is a component of the High Yield Municipal Bond Composite Index. |
| 5. | The terms “spread” and “yield spread” may refer to the difference in yield between a security or type of security and comparable U.S. Treasury issues. The terms may also refer to the difference in yield between two specific securities or types of securities at a given time. |
| 6. | An obligation rated ‘BBB’ by Standard & Poor’s (“S&P”) is deemed by S&P to exhibit adequate protection parameters. It is the opinion of S&P, however, that adverse economic conditions or changing circumstances are more likely to lead to a weakened capacity of the obligor to meet its financial commitment on the obligation. When applied to Fund holdings, ratings are based solely on the creditworthiness of the bonds in the portfolio and are not meant to represent the security or safety of the Fund. |
| 7. | Duration is a measure of the price sensitivity of a fixed-income investment to changes in interest rates. Duration is expressed as a number of years and is considered to be a more accurate sensitivity gauge than average maturity. |
| 8. | Spread duration measures the sensitivity of a security or a portfolio to changes in yield spreads. In this context, the yield spread refers to the incremental yield over comparable U.S. Treasury securities that a security or portfolio is currently delivering. Spread duration is commonly quantified as the percent change in price for the security or portfolio resulting from a one percentage point (100 basis point) change in spreads. An increase in spreads is called widening and would result in a price decline for a security or portfolio with positive spread duration. A decline in spreads is called tightening and would result in a price increase for a security or portfolio with positive spread duration. |
| | | | |
| mainstayinvestments.com | | | 9 | |
During the reporting period, which market segments were the strongest positive contributors to the Fund’s performance and which market segments were particularly weak?
A continuation of strong returns from the tobacco sector, driven by improved credit fundamentals and the partial settlement of the disputed MSA payments (payments under the Tobacco Master Settlement Agreement), which had been withheld by
the cigarette manufacturers, resulted in MSA-backed bonds producing the strongest absolute returns in the Fund. The Fund’s absence from Puerto Rico municipal bonds was a positive contributor to relative performance, as that segment significantly underperformed the Barclays Municipal Bond Index. (Contributions take weightings and total returns into account.) The Fund also benefited from spread compression during the reporting period, as lower-rated bonds generally produced higher returns than high-quality municipals.
Detracting from relative performance was the Fund’s underweight exposure to non-rated securities, as riskier assets exhibited the most spread compression.
Did the Fund make any significant purchases or sales during the reporting period?
As the Fund’s rate of asset accumulation moderated during the reporting period, transactions became more evenly distributed between buys and sells. Purchases tended to remain focused on sectors that we continue to favor, such as tobacco, health care, charter schools and bonds rated in the BB9 to BBB categories. We also continued to find opportunities in monoline insured bonds10 that have either had ratings withdrawn or lowered since the credit crisis. At the same time, the strong demand for income has allowed us to sell selected securities that had seen prices increase to a point that we deemed too aggressive for the
issues’ credit characteristics. Another significant part of our overall strategy is to avoid Puerto Rico municipal bonds. Even after several ratings downgrades, Puerto Rico municipal bonds may still face price declines as the government struggles to resolve its fiscal imbalance.
How did the Fund’s sector weightings change during the reporting period?
The Fund continued to uncover investment opportunities spread across many different sectors of the municipal market. We increased the Fund’s exposure to certain states that were affected by negative news reports, primarily California and Michigan. Since we believed that spreads on Puerto Rico municipal bonds would widen over time, we maintained zero exposure to that segment. On a relative-weight basis, the Fund increased its exposure to tobacco, special tax, health care and education bonds. In contrast, the Fund reduced its relative exposure to corporate-backed municipals in the industrial development revenue sector.
How was the Fund positioned at the end of the reporting period?
As of April, 30, 2013, the Fund held an underweight position relative to the High Yield Municipal Bond Composite Index in tobacco bonds, securities based on land-secured infrastructure projects and industrial development revenue bonds. As of the same date, the Fund had an overweight position relative to the High Yield Municipal Bond Composite Index in the education, special tax and transportation sectors. In terms of quality breakdown, the Fund held an overweight position in BBB-rated bonds and an underweight position in B-rated11 and non-rated bonds. The Fund’s duration was slightly longer than that of the High Yield Municipal Bond Composite Index.
| 9. | An obligation rated ‘BB’ by S&P is deemed by S&P to be less vulnerable to nonpayment than other speculative issues. It is the opinion of S&P, however, that the obligor faces major ongoing uncertainties or exposure to adverse business, financial or economic conditions which could lead to the obligor’s inadequate capacity to meet its financial commitment on the obligation. When applied to Fund holdings, ratings are based solely on the creditworthiness of the bonds in the portfolio and are not meant to represent the security or safety of the Fund. |
| 10. | Monoline insurance is a form of credit enhancement designed to provide bondholders with an extra measure protection, often in the form of a credit wrap. Typically, the insurer carries a higher credit rating than the issuer of the bond. |
| 11. | An obligation rated ‘B’ by S&P is deemed by S&P to be more vulnerable to nonpayment than obligations rated ‘BB’, but in the opinion of S&P, the obligor currently has the capacity to meet its financial commitment on the obligation. It is the opinion of S&P, however, that adverse business, financial, or economic conditions will likely impair the obligor’s capacity or willingness to meet its financial commitment on the obligation. |
The opinions expressed are those of the portfolio managers as of the date of this report and are subject to change. There is no guarantee that any forecast made will come to pass. This material does not constitute investment advice and is not intended as an endorsement of any specific investment.
| | |
| 10 | | MainStay High Yield Municipal Bond Fund |
Portfolio of Investments April 30, 2013 (Unaudited)
| | | | | | | | |
| | | Principal
Amount | | | Value | |
| | | | | �� | | | |
| Municipal Bonds 99.4%† | | | | | | | | |
Alabama 2.9% | | | | | | | | |
Alabama Water Pollution Control Authority, Revenue Bonds | | | | | | | | |
Series B, Insured: AMBAC
4.125%, due 2/15/14 | | $ | 1,060,000 | | | $ | 1,050,640 | |
Series B, Insured: AMBAC
4.25%, due 2/15/15 | | | 1,150,000 | | | | 1,118,662 | |
Birmingham Jefferson Civic Center, Special Tax | | | | | | | | |
Series A, Insured: AMBAC
4.00%, due 7/1/13 | | | 275,000 | | | | 275,006 | |
Series A, Insured: AMBAC
4.125%, due 7/1/17 | | | 200,000 | | | | 199,528 | |
Series A, Insured: AMBAC
4.25%, due 7/1/16 | | | 245,000 | | | | 244,297 | |
Series A, Insured: AMBAC
4.50%, due 7/1/22 | | | 250,000 | | | | 248,743 | |
Series A, Insured: AMBAC
4.50%, due 7/1/23 | | | 100,000 | | | | 98,543 | |
Colbert County-Northwest Alabama Health Care Authority, Revenue Bonds
5.75%, due 6/1/27 | | | 4,000,000 | | | | 4,002,280 | |
Jefferson County, Limited General Obligation | | | | | | | | |
Series A, Insured: NATL-RE
5.00%, due 4/1/21 | | | 1,250,000 | | | | 1,232,137 | |
Series A, Insured: NATL-RE
5.25%, due 4/1/17 | | | 570,000 | | | | 569,949 | |
Jefferson County, Limited Obligation School, Revenue Bonds | | | | | | | | |
Series A, Insured: AMBAC
4.75%, due 1/1/25 | | | 3,740,000 | | | | 3,582,845 | |
Series A
4.75%, due 1/1/25 | | | 500,000 | | | | 478,990 | |
Series A
5.25%, due 1/1/14 | | | 330,000 | | | | 330,330 | |
Series A
5.25%, due 1/1/15 | | | 710,000 | | | | 710,568 | |
Series A
5.25%, due 1/1/16 | | | 240,000 | | | | 240,161 | |
Series A
5.25%, due 1/1/17 | | | 330,000 | | | | 330,112 | |
Series A
5.50%, due 1/1/21 | | | 2,250,000 | | | | 2,253,690 | |
Series A
5.50%, due 1/1/22 | | | 5,750,000 | | | | 5,759,430 | |
| | | | | | | | |
| | | Principal
Amount | | | Value | |
| | | | | | | | |
Alabama (continued) | |
Jefferson County, Public Building Authority, Revenue Bonds | | | | | | | | |
Insured: AMBAC
5.00%, due 4/1/14 | | $ | 1,250,000 | | | $ | 1,238,425 | |
Insured: AMBAC
5.00%, due 4/1/15 | | | 1,510,000 | | | | 1,476,402 | |
Insured: AMBAC
5.00%, due 4/1/16 | | | 525,000 | | | | 501,055 | |
Insured: AMBAC
5.00%, due 4/1/26 | | | 4,500,000 | | | | 3,774,375 | |
Insured: AMBAC
5.125%, due 4/1/18 | | | 1,115,000 | | | | 1,030,349 | |
Insured: AMBAC
5.125%, due 4/1/21 | | | 250,000 | | | | 219,773 | |
Montgomery Airport Authority, Revenue Bonds
Insured: RADIAN
5.375%, due 8/1/32 | | | 500,000 | | | | 511,480 | |
| | | | | | | | |
| | | | | | | 31,477,770 | |
| | | | | | | | |
Alaska 0.8% | | | | | | | | |
Northern Tobacco Securitization Corp., Tobacco Settlement, Asset-Backed, Revenue Bonds
Series A
5.00%, due 6/1/46 | | | 9,545,000 | | | | 8,554,897 | |
| | | | | | | | |
| | |
Arizona 1.6% | | | | | | | | |
Arizona Health Facilities Authority, Phoenix Children’s Hospital, Revenue Bonds
5.00%, due 2/1/42 | | | 2,500,000 | | | | 2,693,475 | |
Florence Town, Inc. Industrial Development Authority, Legacy Traditional School Project, Revenue Bonds
6.00%, due 7/1/43 | | | 3,250,000 | | | | 3,329,202 | |
Phoenix Industrial Development Authority, Espiritu Community Development Corp., Revenue Bonds
Series A
6.25%, due 7/1/36 | | | 875,000 | | | | 884,476 | |
Phoenix Industrial Development Authority, Great Hearts Academies Project, Revenue Bonds
6.40%, due 7/1/47 | | | 1,000,000 | | | | 1,075,380 | |
| † | Percentages indicated are based on Fund net assets. |
| ¨ | | Among the Fund’s 10 largest holdings or issuers held, as of April 30, 2013. May be subject to change daily. |
| | | | | | |
The notes to the financial statements are an integral part of,
and should be read in conjunction with, the financial statements. | | mainstayinvestments.com | | | 11 | |
Portfolio of Investments April 30, 2013 (Unaudited) (continued)
| | | | | | | | |
| | | Principal
Amount | | | Value | |
| | | | | | | | |
| Municipal Bonds (continued) | |
Arizona (continued) | |
Pima County Industrial Development Authority, Edkey Charter Schools Project, Revenue Bonds | | | | | | | | |
6.00%, due 7/1/33 | | $ | 1,500,000 | | | $ | 1,576,125 | |
6.00%, due 7/1/43 | | | 2,250,000 | | | | 2,285,168 | |
Pima County Industrial Development Authority, Paradise Education Center Project, Revenue Bonds | | | | | | | | |
Series A
5.00%, due 6/1/16 | | | 85,000 | | | | 85,086 | |
Series A
5.875%, due 6/1/33 | | | 645,000 | | | | 645,419 | |
6.10%, due 6/1/45 | | | 1,100,000 | | | | 1,149,863 | |
Pima County Industrial Development Authority, Tucson Electric Power Co. Project, Revenue Bonds
4.00%, due 9/1/29 | | | 1,250,000 | | | | 1,260,075 | |
Yavapai County Industrial Development Authority, Agribusiness and Equine Center, Revenue Bonds
5.125%, due 3/1/42 | | | 2,340,000 | | | | 2,306,889 | |
7.875%, due 3/1/42 | | | 500,000 | | | | 589,100 | |
| | | | | | | | |
| | | | | | | 17,880,258 | |
| | | | | | | | |
California 18.2% | | | | | | | | |
Alameda Corridor Transportation Authority, Revenue Bonds Series 1999-A, Insured: NATL-RE
(zero coupon), due 10/1/35 | | | 3,440,000 | | | | 1,226,050 | |
Anaheim Public Financing Authority, Public Improvement Project, Revenue Bonds Series A-1, Insured: FGIC, NATL-RE 4.75%, due 9/1/33 | | | 12,600,000 | | | | 13,644,414 | |
Bassett Unified School District, Unlimited General Obligation | | | | | | | | |
Series C, Insured: FGIC, NATL-RE
(zero coupon), due 8/1/41 | | | 2,050,000 | | | | 448,725 | |
Series C, Insured: FGIC, NATL-RE
(zero coupon), due 8/1/42 | | | 2,000,000 | | | | 413,680 | |
Bell Community Housing Authority, Revenue Bonds
Insured: AMBAC
5.00%, due 10/1/30 | | | 1,105,000 | | | | 952,742 | |
California County Tobacco Securitization Agency, Asset Backed, Sonoma County Corp., Revenue Bonds
5.125%, due 6/1/38 | | | 9,815,000 | | | | 8,830,948 | |
California Educational Facilities Authority, Dominican University, Revenue Bonds
5.00%, due 12/1/36 | | | 1,000,000 | | | | 1,043,590 | |
| | | | | | | | |
| | | Principal
Amount | | | Value | |
| | | | | | | | |
California (continued) | |
California Municipal Finance Authority, Community Hospitals Center, Revenue Bonds
5.50%, due 2/1/39 | | $ | 1,640,000 | | | $ | 1,772,627 | |
California Municipal Finance Authority, Santa Rosa Academy Project, Revenue Bonds | | | | | | | | |
Series A
5.75%, due 7/1/30 | | | 1,000,000 | | | | 1,038,890 | |
Series A
6.00%, due 7/1/42 | | | 1,500,000 | | | | 1,567,590 | |
California Municipal Finance Authority, Southwestern Law School, Revenue Bonds
6.50%, due 11/1/41 | | | 1,000,000 | | | | 1,213,650 | |
California Municipal Finance Authority, University of La Verne, Revenue Bonds
Series A
6.25%, due 6/1/40 | | | 500,000 | | | | 578,310 | |
California Pollution Control Financing Authority, Revenue Bonds
5.00%, due 11/21/45 (a) | | | 7,000,000 | | | | 7,202,370 | |
California School Finance Authority, Coastal Academy Project, Revenue Bonds | | | | | | | | |
Series A
5.00%, due 10/1/33 | | | 1,000,000 | | | | 1,026,410 | |
Series A
5.00%, due 10/1/42 | | | 1,240,000 | | | | 1,252,016 | |
California State Municipal Finance Authority, Partnerships Uplift Community Project, Revenue Bonds | | | | | | | | |
Series A
4.75%, due 8/1/22 | | | 295,000 | | | | 300,735 | |
Series A
5.25%, due 8/1/42 | | | 1,700,000 | | | | 1,747,532 | |
Series A
5.30%, due 8/1/47 | | | 675,000 | | | | 693,826 | |
California State Public Works Board, Capital Project, Revenue Bonds
Series I-1
6.625%, due 11/1/34 | | | 4,375,000 | | | | 4,835,731 | |
California Statewide Communities Development Authority, Aspire Public Schools, Revenue Bonds | | | | | | | | |
5.20%, due 7/1/20 | | | 100,000 | | | | 105,250 | |
6.00%, due 7/1/40 | | | 2,000,000 | | | | 2,113,680 | |
6.375%, due 7/1/45 | | | 3,000,000 | | | | 3,218,010 | |
California Statewide Communities Development Authority, California Baptist University, Revenue Bonds
7.50%, due 11/1/41 | | | 1,000,000 | | | | 1,256,750 | |
| | | | |
| 12 | | MainStay High Yield Municipal Bond Fund | | The notes to the financial statements are an integral part of,
and should be read in conjunction with, the financial statements. |
| | | | | | | | |
| | | Principal
Amount | | | Value | |
| | | | | | | | |
| Municipal Bonds (continued) | |
California (continued) | |
California Statewide Communities Development Authority, Lancer Plaza Project, Revenue Bonds | | | | | | | | |
5.125%, due 11/1/23 | | $ | 500,000 | | | $ | 501,815 | |
5.625%, due 11/1/33 | | | 680,000 | | | | 683,482 | |
5.875%, due 11/1/43 | | | 435,000 | | | | 436,523 | |
California Statewide Communities Development Authority, Sonoma Country Day School, Revenue Bonds
4.375%, due 7/1/29 | | | 8,100,000 | | | | 5,946,291 | |
Cathedral City Public Financing Authority, Tax Allocation | | | | | | | | |
Series A, Insured: NATL-RE
(zero coupon), due 8/1/23 | | | 925,000 | | | | 561,845 | |
Series A, Insured: NATL-RE
(zero coupon), due 8/1/26 | | | 1,085,000 | | | | 548,782 | |
Ceres Unified School District, Unlimited General Obligation
Series A
(zero coupon), due 8/1/45 | | | 7,400,000 | | | | 893,180 | |
Contra Costa County Public Financing Authority, Contra Costa Centre Project, Tax Allocation
Series A, Insured: RADIAN
4.375%, due 8/1/21 | | | 250,000 | | | | 210,618 | |
Davis Redevelopment Agency, Davis Redevelopment Project, Tax Allocation
Series A
7.00%, due 12/1/36 | | | 1,375,000 | | | | 1,727,440 | |
Fontana Unified School District, Unlimited General Obligation | | | | | | | | |
Series C
(zero coupon), due 8/1/38 | | | 10,000,000 | | | | 2,507,500 | |
Series C
(zero coupon), due 8/1/39 | | | 17,900,000 | | | | 4,222,252 | |
Series C
(zero coupon), due 8/1/43 | | | 16,000,000 | | | | 2,958,080 | |
Series C
(zero coupon), due 8/1/44 | | | 8,000,000 | | | | 1,396,320 | |
Foothill-Eastern Transportation Corridor Agency, Revenue Bonds | | | | | | | | |
(zero coupon), due 1/15/26 | | | 15,000,000 | | | | 7,083,900 | |
Insured: NATL-RE
(zero coupon), due 1/15/30 | | | 150,000 | | | | 55,428 | |
Insured: NATL-RE
(zero coupon), due 1/15/31 | | | 850,000 | | | | 295,401 | |
(zero coupon), due 1/15/31 | | | 15,000,000 | | | | 5,229,600 | |
Series A, Insured: NATL-RE
5.00%, due 1/1/35 | | | 280,000 | | | | 280,011 | |
5.75%, due 1/15/40 | | | 485,000 | | | | 485,223 | |
| | | | | | | | |
| | | Principal
Amount | | | Value | |
| | | | | | | | |
California (continued) | |
Fresno, California Unified School District Education, Unlimited General Obligation
Series G
(zero coupon), due 8/1/41 | | $ | 10,000,000 | | | $ | 1,797,400 | |
Golden State Tobacco Securitization Corp., Asset Backed, Revenue Bonds
Series A-2
5.30%, due 6/1/37 | | | 5,000,000 | | | | 4,646,850 | |
¨Golden State Tobacco Securitization Corp., Revenue Bonds | | | | | | | | |
Series A-1
4.50%, due 6/1/27 | | | 4,050,000 | | | | 3,950,775 | |
Series A, Insured: AGC
5.00%, due 6/1/45 | | | 20,000,000 | | | | 20,920,400 | |
Hayward Unified School District, Unlimited General Obligation
Series A, Insured: AGM
(zero coupon), due 8/1/37 | | | 6,135,000 | | | | 1,362,952 | |
Lancaster Financing Authority, Lancaster Residential Project 5 & 6, Tax Allocation
Insured: AMBAC
5.00%, due 2/1/16 | | | 325,000 | | | | 314,044 | |
Lemoore Redevelopment Agency, Lemoore Redevelopment Project, Tax Allocation
7.375%, due 8/1/40 | | | 1,000,000 | | | | 1,116,940 | |
Mendocino-Lake Community College District, Unlimited General Obligation | | | | | | | | |
Series B, Insured: AGM
(zero coupon), due 8/1/39 | | | 8,400,000 | | | | 1,616,244 | |
Series B, Insured: AGM
(zero coupon), due 8/1/51 | | | 40,000,000 | | | | 2,823,200 | |
Oakley Redevelopment Agency, Revenue Bonds
Series A, Insured: AMBAC
5.00%, due 9/1/33 | | | 100,000 | | | | 85,405 | |
Rohnerville California School District, Unlimited General Obligation | | | | | | | | |
Series B, Insured: AGM
(zero coupon), due 8/1/42 | | | 1,000,000 | | | | 232,820 | |
Series B, Insured: AGM
(zero coupon), due 8/1/47 | | | 1,000,000 | | | | 178,000 | |
Sacramento Regional Art Facilities Financing Authority, Certificates of Participation
Insured: AMBAC
5.00%, due 9/1/32 | | | 3,250,000 | | | | 3,251,300 | |
San Bernardino County Redevelopment Agency, Sevaine Redevelopment Project, Tax Allocation
Series A, Insured: RADIAN
5.00%, due 9/1/25 | | | 50,000 | | | | 50,457 | |
| | | | | | |
The notes to the financial statements are an integral part of,
and should be read in conjunction with, the financial statements. | | mainstayinvestments.com | | | 13 | |
Portfolio of Investments April 30, 2013 (Unaudited) (continued)
| | | | | | | | |
| | | Principal
Amount | | | Value | |
| | | | | | | | |
| Municipal Bonds (continued) | |
California (continued) | |
San Buenaventura, Community Memorial Health System, Revenue Bonds
7.50%, due 12/1/41 | | $ | 6,150,000 | | | $ | 7,572,556 | |
San Francisco City and County Redevelopment Agency, Mission Bay South Redevelopment, Tax Allocation
Series D
7.00%, due 8/1/41 | | | 435,000 | | | | 506,401 | |
San Francisco City and County Redevelopment Agency, Successor Agency Community, 6-Mission Bay Public Improvements, Special Tax | | | | | | | | |
Series C
(zero coupon), due 8/1/37 | | | 5,015,000 | | | | 1,307,160 | |
Series C
(zero coupon), due 8/1/38 | | | 2,000,000 | | | | 486,360 | |
Series C
5.00%, due 8/1/27 | | | 1,335,000 | | | | 1,470,956 | |
Series C
5.00%, due 8/1/29 | | | 655,000 | | | | 716,865 | |
¨San Joaquin Hills Transportation Corridor Agency, Revenue Bonds | | | | | | | | |
Series A, Insured: NATL-RE
(zero coupon), due 1/15/24 | | | 265,000 | | | | 160,802 | |
Series A, Insured: NATL-RE
(zero coupon), due 1/15/25 | | | 1,710,000 | | | | 990,329 | |
Series A, Insured: NATL-RE
(zero coupon), due 1/15/26 | | | 550,000 | | | | 303,254 | |
Series A, Insured: NATL-RE
(zero coupon), due 1/15/30 | | | 500,000 | | | | 223,780 | |
Series A, Insured: NATL-RE
(zero coupon), due 1/15/32 | | | 1,510,000 | | | | 602,701 | |
Series A, Insured: NATL-RE
(zero coupon), due 1/15/34 | | | 6,610,000 | | | | 2,357,985 | |
Series A, Insured: NATL-RE
(zero coupon), due 1/15/36 | | | 12,290,000 | | | | 3,899,125 | |
Series A, Insured: NATL-RE
5.25%, due 1/15/30 | | | 6,590,000 | | | | 6,590,132 | |
Series A, Insured: NATL-RE
5.375%, due 1/15/29 | | | 3,160,000 | | | | 3,160,442 | |
San Jose Redevelopment Agency, Merged Area Redevelopment Project, Tax Allocation
Insured: XLCA
4.50%, due 8/1/33 | | | 790,000 | | | | 781,666 | |
San Ysidro School District, Unlimited General Obligation
Series F, Insured: AGM
(zero coupon), due 8/1/49 | | | 27,410,000 | | | | 2,344,377 | |
| | | | | | | | |
| | | Principal
Amount | | | Value | |
| | | | | | | | |
California (continued) | |
Stockton Public Financing Authority, Parking & Capital Projects, Revenue Bonds | | | | | | | | |
Insured: FGIC, NATL-RE
4.25%, due 9/1/15 | | $ | 25,000 | | | $ | 24,977 | |
Insured: FGIC, NATL-RE
4.80%, due 9/1/20 | | | 125,000 | | | | 122,541 | |
Insured: FGIC, NATL-RE
5.125%, due 9/1/30 | | | 2,900,000 | | | | 2,801,226 | |
Insured: FGIC, NATL-RE
5.25%, due 9/1/23 | | | 345,000 | | | | 341,453 | |
Insured: FGIC, NATL-RE
5.25%, due 9/1/24 | | | 100,000 | | | | 98,483 | |
Insured: FGIC, NATL-RE
5.25%, due 9/1/34 | | | 340,000 | | | | 332,296 | |
Insured: FGIC, NATL-RE
5.375%, due 9/1/21 | | | 125,000 | | | | 125,024 | |
Stockton Public Financing Authority, Redevelopment Projects, Revenue Bonds | | | | | | | | |
Series A, Insured: RADIAN
5.00%, due 9/1/24 | | | 190,000 | | | | 159,896 | |
Series A, Insured: RADIAN
5.25%, due 9/1/31 | | | 120,000 | | | | 95,114 | |
Stockton Public Financing Authority, Revenue Bonds
Series A, Insured: NATL-RE
4.00%, due 8/1/19 | | | 50,000 | | | | 45,899 | |
Stockton Redevelopment Agency, Stockton Events Center-Arena Project, Revenue Bonds | | | | | | | | |
Insured: FGIC, NATL-RE
4.00%, due 9/1/21 | | | 75,000 | | | | 69,547 | |
Insured: FGIC, NATL-RE
4.125%, due 9/1/22 | | | 100,000 | | | | 94,531 | |
Insured: FGIC, NATL-RE
4.25%, due 9/1/24 | | | 215,000 | | | | 192,874 | |
Insured: FGIC, NATL-RE
4.25%, due 9/1/25 | | | 20,000 | | | | 17,897 | |
Insured: FGIC, NATL-RE
5.00%, due 9/1/28 | | | 2,265,000 | | | | 2,164,343 | |
Insured: FGIC, NATL-RE
5.00%, due 9/1/36 | | | 150,000 | | | | 140,571 | |
Stockton Unified School District, Unlimited General Obligation
Series D, Insured: AGM
(zero coupon), due 8/1/42 | | | 9,080,000 | | | | 2,138,703 | |
Stockton, Wastewater Systems Project, Certificates of Participation
Series A, Insured: NATL-RE
5.20%, due 9/1/29 | | | 2,060,000 | | | | 2,060,515 | |
| | | | |
| 14 | | MainStay High Yield Municipal Bond Fund | | The notes to the financial statements are an integral part of,
and should be read in conjunction with, the financial statements. |
| | | | | | | | |
| | | Principal
Amount | | | Value | |
| | | | | | | | |
| Municipal Bonds (continued) | |
California (continued) | |
Stockton-East Water District, Certificates of Participation | | | | | | | | |
Series B, Insured: FGIC, NATL-RE
(zero coupon), due 4/1/26 | | $ | 100,000 | | | $ | 46,029 | |
Series B, Insured: FGIC, NATL-RE
(zero coupon), due 4/1/27 | | | 140,000 | | | | 60,596 | |
Sutter Union High School District, Unlimited General Obligation
Series B
(zero coupon), due 6/1/50 | | | 16,260,000 | | | | 1,481,123 | |
Tobacco Securitization Authority Northern California, Asset-Backed, Revenue Bonds | | | | | | | | |
Series A-1
5.125%, due 6/1/46 | | | 8,140,000 | | | | 7,335,117 | |
Series A
5.375%, due 6/1/38 | | | 2,100,000 | | | | 1,906,821 | |
Series A-1
5.50%, due 6/1/45 | | | 3,755,000 | | | | 3,409,878 | |
Turlock Public Financing Authority, Tax Allocation
7.50%, due 9/1/39 | | | 500,000 | | | | 575,390 | |
West Contra Costa California Healthcare District, Certificates of Participation
6.25%, due 7/1/42 | | | 5,000,000 | | | | 5,905,100 | |
| | | | | | | | |
| | | | | | | 200,074,839 | |
| | | | | | | | |
Colorado 1.9% | | | | | | | | |
Bromley Park Metropolitan District No. 2, Limited General Obligation
Insured: RADIAN
5.00%, due 12/1/16 | | | 25,000 | | | | 26,714 | |
Colorado Educational & Cultural Facilities Authority, Charter School Mountain Phoenix Community, Revenue Bonds
7.00%, due 10/1/42 | | | 1,000,000 | | | | 994,980 | |
Colorado Educational & Cultural Facilities Authority, Johnson & Wales University Project, Revenue Bonds
Series A, Insured: XLCA
5.00%, due 4/1/28 | | | 185,000 | | | | 185,213 | |
Colorado Health Facilities Authority, Christian Living Community, Revenue Bonds | | | | | | | | |
5.125%, due 1/1/30 | | | 500,000 | | | | 538,180 | |
5.25%, due 1/1/37 | | | 750,000 | | | | 802,747 | |
Denver Convention Center Hotel Authority, Revenue Bonds | | | | | | | | |
Series, Insured: XLCA
4.75%, due 12/1/35 | | | 635,000 | | | | 657,035 | |
Series, Insured: XLCA
5.00%, due 12/1/35 | | | 130,000 | | | | 135,569 | |
| | | | | | | | |
| | | Principal
Amount | | | Value | |
| | | | | | | | |
Colorado (continued) | |
Denver, United Airlines Project, Revenue Bonds
5.75%, due 10/1/32 (a) | | $ | 2,000,000 | | | $ | 2,098,280 | |
E-470 Public Highway Authority, Revenue Bonds | | | | | | | | |
Series B, Insured: NATL-RE
(zero coupon), due 9/1/22 | | | 5,000,000 | | | | 3,545,850 | |
Series B, Insured: NATL-RE
(zero coupon), due 9/1/25 | | | 245,000 | | | | 146,983 | |
Series B, Insured: NATL-RE
(zero coupon), due 9/1/26 | | | 4,540,000 | | | | 2,556,928 | |
Series B, Insured: NATL-RE
(zero coupon), due 9/1/27 | | | 735,000 | | | | 360,378 | |
Series B, Insured: NATL-RE
(zero coupon), due 9/1/28 | | | 1,405,000 | | | | 643,729 | |
Series B, Insured: NATL-RE
(zero coupon), due 9/1/29 | | | 4,510,000 | | | | 2,116,543 | |
Series B, Insured: NATL-RE
(zero coupon), due 9/1/30 | | | 500,000 | | | | 220,640 | |
Series B, Insured: NATL-RE
(zero coupon), due 9/1/35 | | | 1,520,000 | | | | 491,933 | |
Series B, Insured: NATL-RE
(zero coupon), due 9/1/37 | | | 100,000 | | | | 28,841 | |
(zero coupon), due 9/1/40 | | | 3,450,000 | | | | 869,986 | |
(zero coupon), due 9/1/41 | | | 3,925,000 | | | | 938,546 | |
Fronterra Village Metropolitan District No. 2, Limited General Obligation
Insured: RADIAN
4.875%, due 12/1/27 | | | 500,000 | | | | 493,815 | |
Harvest Junction Metropolitan District, Limited General Obligation | | | | | | | | |
5.00%, due 12/1/30 | | | 765,000 | | | | 792,976 | |
5.375%, due 12/1/37 | | | 755,000 | | | | 789,488 | |
Pitkin County Colorado Industrial Development, Aspen Skiing Co. Project, Revenue Bonds
Series A
0.18%, due 4/1/16 (b) | | | 1,700,000 | | | | 1,700,000 | |
Table Rock Metropolitan District, Limited General Obligation
Insured: RADIAN
4.25%, due 12/1/27 | | | 275,000 | | | | 264,704 | |
| | | | | | | | |
| | | | | | | 21,400,058 | |
| | | | | | | | |
Connecticut 0.4% | | | | | | | | |
Connecticut State Health & Educational Facility Authority, Hartford Health Care, Revenue Bonds
Series A
5.00%, due 7/1/41 | | | 1,175,000 | | | | 1,278,764 | |
| | | | | | |
The notes to the financial statements are an integral part of,
and should be read in conjunction with, the financial statements. | | mainstayinvestments.com | | | 15 | |
Portfolio of Investments April 30, 2013 (Unaudited) (continued)
| | | | | | | | |
| | | Principal
Amount | | | Value | |
| | | | | | | | |
| Municipal Bonds (continued) | |
Connecticut (continued) | |
Connecticut, Special Obligation Parking Revenue, Bradley International Airport, Revenue Bonds | | | | | | | | |
Series A, Insured: ACA
6.50%, due 7/1/18 (a) | | $ | 1,000,000 | | | $ | 1,003,680 | |
Series A, Insured: ACA
6.60%, due 7/1/24 (a) | | | 2,075,000 | | | | 2,082,616 | |
| | | | | | | | |
| | | | | | | 4,365,060 | |
| | | | | | | | |
Delaware 0.2% | | | | | | | | |
Delaware State Economic Development Authority, Newark Charter School, Revenue Bonds
5.00%, due 9/1/42 | | | 1,350,000 | | | | 1,442,839 | |
Delaware State Health Facilities Authority, Nanticoke Memorial Hospital Project, Revenue Bonds
Series B
5.625%, due 5/1/32 | | | 515,000 | | | | 515,237 | |
| | | | | | | | |
| | | | | | | 1,958,076 | |
| | | | | | | | |
District of Columbia 0.8% | | | | | | | | |
District of Columbia, Center Strategic & International Studies, Revenue Bonds
6.625%, due 3/1/41 | | | 1,000,000 | | | | 1,095,720 | |
District of Columbia, Friendship Public Charter School, Inc., Revenue Bonds | | | | | | | | |
Insured: ACA
5.00%, due 6/1/23 | | | 3,320,000 | | | | 3,365,783 | |
Insured: ACA
5.25%, due 6/1/33 | | | 4,120,000 | | | | 4,160,046 | |
District of Columbia, James F. Oyster Elementary School Pilot, Revenue Bonds
Insured: ACA
6.25%, due 11/1/31 | | | 620,000 | | | | 620,050 | |
| | | | | | | | |
| | | | | | | 9,241,599 | |
| | | | | | | | |
Florida 4.3% | | | | | | | | |
Bay County Educational Facilities Revenue, Bay Haven Charter Academy, Inc., Revenue Bonds
5.00%, due 9/1/45 | | | 575,000 | | | | 576,340 | |
Bay County Educational Facilities Revenue, Bay Haven Charter, Revenue Bonds
Series A
6.00%, due 9/1/40 | | | 1,000,000 | | | | 1,091,470 | |
Capital Projects Finance Authority, Revenue Bonds
Series F-1, Insured: NATL-RE
5.00%, due 10/1/31 | | | 3,250,000 | | | | 3,234,367 | |
| | | | | | | | |
| | | Principal
Amount | | | Value | |
| | | | | | | | |
Florida (continued) | | | | | | | | |
¨City of Orlando, Tourist Development Tax Revenue, 3rd Lien, 6th Cent Contract, Revenue Bonds Insured: GTY
5.50%, due 11/1/38 | | $ | 16,320,000 | | | $ | 16,928,083 | |
County of St. Lucie, South Hutchison Island, Special Assessment
Insured: AMBAC
5.00%, due 11/1/25 | | | 810,000 | | | | 813,200 | |
Florida Development Finance Corp., Bay Area Charter Foundation LLC, Revenue Bonds
Series A
7.75%, due 6/15/42 | | | 2,000,000 | | | | 2,290,640 | |
Florida Municipal Power Agency, All Requirements Supply, Revenue Bonds
Series C
0.22%, due 10/1/35 (b) | | | 7,600,000 | | | | 7,600,000 | |
Miami Beach Health Facilities Authority, Mount Sinai Medical Center of Florida Project, Revenue Bonds
6.75%, due 11/15/29 | | | 865,000 | | | | 915,317 | |
Mid-Bay Bridge Authority, Revenue Bonds
Series A
7.25%, due 10/1/40 | | | 2,500,000 | | | | 3,194,200 | |
North Sumter County Florida Utility Dependent District, Revenue Bonds
6.25%, due 10/1/43 | | | 1,500,000 | | | | 1,687,110 | |
Orange County Health Facilities Authority, Mayflower Retirement Center, Inc., Revenue Bonds | | | | | | | | |
5.00%, due 6/1/36 | | | 710,000 | | | | 753,828 | |
5.125%, due 6/1/42 | | | 350,000 | | | | 372,855 | |
Pinellas County Health Facilities Authority, Hospital Facilities Bayfront Projects, Revenue Bonds | | | | | | | | |
0.23%, due 7/1/34 (b) | | | 2,500,000 | | | | 2,500,000 | |
Series A
0.23%, due 7/1/36 (b) | | | 1,400,000 | | | | 1,400,000 | |
Sarasota Manatee Airport Authority, Revenue Bonds
0.23%, due 8/1/14 (b) | | | 1,580,000 | | | | 1,580,000 | |
Seminole County Industrial Development Authority, Choices in Learning, Revenue Bonds
Series A
7.375%, due 11/15/41 | | | 750,000 | | | | 862,148 | |
Village Center Community Development District, Recreational Revenue, Revenue Bonds
Series A, Insured: NATL-RE
5.00%, due 11/1/32 | | | 140,000 | | | | 141,513 | |
| | | | |
| 16 | | MainStay High Yield Municipal Bond Fund | | The notes to the financial statements are an integral part of,
and should be read in conjunction with, the financial statements. |
| | | | | | | | |
| | | Principal
Amount | | | Value | |
| | | | | | | | |
| Municipal Bonds (continued) | |
Florida (continued) | | | | | | | | |
Volusia County Industrial Development Authority, Student Housing-Stetson University Project, Revenue Bonds Insured: CIFG
5.00%, due 6/1/35 | | $ | 1,270,000 | | | $ | 1,277,938 | |
| | | | | | | | |
| | | | | | | 47,219,009 | |
| | | | | | | | |
Georgia 0.4% | | | | | | | | |
Marietta Development Authority, University Facilities-Life University, Inc. Project, Revenue Bonds
7.00%, due 6/15/39 | | | 3,000,000 | | | | 3,239,970 | |
McDuffie County Development Authority,
Temple-Inland Forest, Revenue Bonds
6.95%, due 12/1/23 (a) | | | 600,000 | | | | 612,180 | |
| | | | | | | | |
| | | | | | | 3,852,150 | |
| | | | | | | | |
Guam 2.5% | | | | | | | | |
Guam Government, Business Privilege Tax, Revenue Bonds | | | | | | | | |
Series B-1
5.00%, due 1/1/37 | | | 1,500,000 | | | | 1,665,150 | |
Series B-1
5.00%, due 1/1/42 | | | 2,000,000 | | | | 2,217,040 | |
Guam Government, Hotel Occupancy Tax, Revenue Bonds
Series A
6.50%, due 11/1/40 | | | 1,290,000 | | | | 1,532,817 | |
Guam Government, Unlimited General Obligation | | | | | | | | |
Series A
5.00%, due 11/15/23 | | | 555,000 | | | | 574,797 | |
Series A
5.25%, due 11/15/37 | | | 6,000,000 | | | | 6,150,660 | |
Series A
7.00%, due 11/15/39 | | | 2,040,000 | | | | 2,321,234 | |
Guam Government, Waterworks Authority, Revenue Bonds | | | | | | | | |
5.875%, due 7/1/35 | | | 3,885,000 | | | | 4,025,676 | |
6.00%, due 7/1/25 | | | 3,735,000 | | | | 3,895,605 | |
Guam Power Authority, Revenue Bonds
Series A
5.00%, due 10/1/34 | | | 5,030,000 | | | | 5,583,954 | |
| | | | | | | | |
| | | | | | | 27,966,933 | |
| | | | | | | | |
Illinois 2.4% | | | | | | | | |
Illinois Finance Authority, Chicago Charter School Project, Revenue Bonds | | | | | | | | |
5.00%, due 12/1/36 | | | 3,600,000 | | | | 3,717,828 | |
Series A
7.125%, due 10/1/41 | | | 1,500,000 | | | | 1,770,180 | |
| | | | | | | | |
| | | Principal
Amount | | | Value | |
| | | | | | | | |
Illinois (continued) | | | | | | | | |
Illinois Finance Authority, Community Rehab Providers, Revenue Bonds
Series A
5.60%, due 7/1/19 | | $ | 495,000 | | | $ | 476,730 | |
Illinois Finance Authority, Ingalls Health System, Revenue Bonds
5.00%, due 5/15/43 | | | 3,000,000 | | | | 3,201,060 | |
Illinois Finance Authority, Noble Network Charter School, Revenue Bonds | | | | | | | | |
Series A, Insured: ACA
5.00%, due 9/1/27 | | | 1,000,000 | | | | 1,007,680 | |
Series C, Insured: ACA
5.00%, due 9/1/31 | | | 2,000,000 | | | | 2,001,680 | |
Series C, Insured: ACA
5.00%, due 9/1/32 | | | 2,780,000 | | | | 2,779,805 | |
Illinois Finance Authority, Roosevelt University Project, Revenue Bonds
6.50%, due 4/1/44 | | | 8,750,000 | | | | 9,987,950 | |
Illinois Finance Authority, Wesleyan University, Revenue Bonds
Series B, Insured: CIFG
4.50%, due 9/1/35 | | | 550,000 | | | | 559,344 | |
Massac County Hospital District, Limited General Obligation Insured: AGC
4.50%, due 11/1/31 | | | 110,000 | | | | 115,766 | |
Village of Matteson, Utility Revenue Source, Unlimited General Obligation Insured: AGM
4.00%, due 12/1/26 | | | 250,000 | | | | 246,533 | |
| | | | | | | | |
| | | | | | | 25,864,556 | |
| | | | | | | | |
Indiana 2.5% | | | | | | | | |
Anderson Economic Development Revenue, Anderson University Project, Revenue Bonds | | | | | | | | |
5.00%, due 10/1/24 | | | 805,000 | | | | 792,595 | |
5.00%, due 10/1/28 | | | 4,000,000 | | | | 3,781,760 | |
5.00%, due 10/1/32 | | | 2,555,000 | | | | 2,366,236 | |
Carmel Redevelopment District, Certificate of Partcipation
Series C
6.50%, due 7/15/35 (c) | | | 1,000,000 | | | | 1,075,680 | |
Hammond Local Public Improvement Bond Bank, Revenue Bonds
Series A
6.75%, due 8/15/35 | | | 1,500,000 | | | | 1,570,740 | |
Indiana Finance Authority, Educational Facilities-Marian University Project, Revenue Bonds
6.375%, due 9/15/41 | | | 670,000 | | | | 744,712 | |
| | | | | | |
The notes to the financial statements are an integral part of,
and should be read in conjunction with, the financial statements. | | mainstayinvestments.com | | | 17 | |
Portfolio of Investments April 30, 2013 (Unaudited) (continued)
| | | | | | | | |
| | | Principal
Amount | | | Value | |
| | | | | | | | |
| Municipal Bonds (continued) | |
Indiana (continued) | | | | | | | | |
Indiana Finance Authority, King’s Daughters Hospital & Healthcare, Revenue Bonds | | | | | | | | |
5.50%, due 8/15/40 | | $ | 3,900,000 | | | $ | 4,276,896 | |
5.50%, due 8/15/45 | | | 1,500,000 | | | | 1,642,980 | |
Indiana Finance Authority, Marquette Manor LLC, Revenue Bonds
5.00%, due 3/1/39 | | | 5,505,000 | | | | 5,841,631 | |
Indiana Finance Authority, Private Activity Ohio River Bridge, Revenue Bonds
Series A
5.25%, due 1/1/51 (a) | | | 5,500,000 | | | | 5,921,740 | |
| | | | | | | | |
| | | | | | | 28,014,970 | |
| | | | | | | | |
Iowa 2.0% | | | | | | | | |
Iowa Higher Education Loan Authority, Private College Facility, Wartburg College, Revenue Bonds
Series B
5.50%, due 10/1/31 | | | 100,000 | | | | 99,423 | |
Iowa Higher Education Loan Authority, Wartburg College, Revenue Bonds | | | | | | | | |
Series A
4.65%, due 10/1/15 | | | 1,000,000 | | | | 1,010,990 | |
Series A
5.00%, due 10/1/21 | | | 605,000 | | | | 611,637 | |
Series A
5.05%, due 10/1/24 | | | 250,000 | | | | 251,975 | |
Series A
5.10%, due 10/1/25 | | | 250,000 | | | | 251,920 | |
Series A
5.25%, due 10/1/30 | | | 170,000 | | | | 170,454 | |
Iowa Tobacco Settlement Authority,
Asset-Backed, Revenue Bonds | | | | | | | | |
Series C
5.375%, due 6/1/38 | | | 6,145,000 | | | | 5,927,467 | |
Series C
5.625%, due 6/1/46 | | | 6,730,000 | | | | 6,600,851 | |
Xenia Rural Water District, Revenue Bonds | | | | | | | | |
Insured: AGC
4.00%, due 12/1/14 | | | 280,000 | | | | 289,668 | |
Insured: AGC
4.50%, due 12/1/31 | | | 1,920,000 | | | | 1,941,485 | |
Insured: AGC
4.50%, due 12/1/41 | | | 960,000 | | | | 961,229 | |
Insured: AGC
5.00%, due 12/1/41 | | | 3,925,000 | | | | 4,002,205 | |
| | | | | | | | |
| | | | | | | 22,119,304 | |
| | | | | | | | |
| | | | | | | | |
| | | Principal
Amount | | | Value | |
| | | | | | | | |
Kansas 1.3% | | | | | | | | |
City Of Olathe, Kansas, Olathe Medical Center, Revenue Bonds | | | | | | | | |
0.22%, due 9/1/32 (b) | | $ | 2,200,000 | | | $ | 2,200,000 | |
Series B
0.22%, due 9/1/35 (b) | | | 600,000 | | | | 600,000 | |
Wyandotte County-Kansas City Unified Government, Capital Appreciation, Sales Tax, Revenue Bonds
(zero coupon), due 6/1/21 | | | 17,340,000 | | | | 11,675,716 | |
| | | | | | | | |
| | | | | | | 14,475,716 | |
| | | | | | | | |
Kentucky 0.1% | | | | | | | | |
Glasgow Healthcare Revenue, T. J. Samson Community Hospital, Revenue Bonds
6.45%, due 2/1/41 | | | 1,000,000 | | | | 1,145,340 | |
| | | | | | | | |
| | |
Louisiana 1.1% | | | | | | | | |
Louisiana Public Facilities Authority, Belle Chasse Education Foundation, Revenue Bonds
6.50%, due 5/1/31 | | | 3,750,000 | | | | 4,389,450 | |
Louisiana Public Facilities Authority, Black & Gold Facilities Project, Revenue Bonds | | | | | | | | |
Series A, Insured: CIFG
4.50%, due 7/1/38 | | | 1,275,000 | | | | 1,138,932 | |
Series A, Insured: CIFG
5.00%, due 7/1/22 | | | 100,000 | | | | 101,455 | |
Series A, Insured: AGC
5.00%, due 7/1/39 | | | 610,000 | | | | 634,845 | |
Louisiana Public Facilities Authority, Susla Facilities, Inc. Project, Revenue Bonds
Series A
5.75%, due 7/1/39 | | | 6,145,000 | | | | 6,144,447 | |
| | | | | | | | |
| | | | | | | 12,409,129 | |
| | | | | | | | |
Maryland 1.1% | | | | | | | | |
Baltimore Convention Center, Revenue Bonds | | | | | | | | |
Series A, Insured: XLCA
4.60%, due 9/1/30 | | | 625,000 | | | | 627,937 | |
Series A, Insured: XLCA
5.00%, due 9/1/32 | | | 2,330,000 | | | | 2,362,340 | |
Series A, Insured: XLCA
5.25%, due 9/1/23 | | | 210,000 | | | | 217,812 | |
Series A, Insured: XLCA
5.25%, due 9/1/26 | | | 180,000 | | | | 185,845 | |
Series A, Insured: XLCA
5.25%, due 9/1/27 | | | 275,000 | | | | 283,498 | |
Series A, Insured: XLCA
5.25%, due 9/1/28 | | | 100,000 | | | | 102,776 | |
| | | | |
| 18 | | MainStay High Yield Municipal Bond Fund | | The notes to the financial statements are an integral part of,
and should be read in conjunction with, the financial statements. |
| | | | | | | | |
| | | Principal
Amount | | | Value | |
| | | | | | | | |
| Municipal Bonds (continued) | |
Maryland (continued) | | | | | | | | |
Baltimore Convention Center, Revenue Bonds (continued) | | | | | | | | |
Series A, Insured: XLCA
5.25%, due 9/1/39 | | $ | 2,400,000 | | | $ | 2,447,952 | |
Maryland Economic Development Corp. University of Maryland College Park Project, Revenue Bonds
Insured: AGC
4.50%, due 6/1/35 | | | 1,430,000 | | | | 1,450,306 | |
Maryland Health & Higher Educational Facilities Authority, Charlestown Community, Revenue Bonds
6.25%, due 1/1/45 | | | 1,000,000 | | | | 1,152,630 | |
Maryland Health & Higher Educational Facilities Authority, Institute College of Art, Revenue Bonds
5.00%, due 6/1/47 | | | 1,000,000 | | | | 1,094,490 | |
Maryland Health & Higher Educational Facilities Authority, Notre Dame Maryland University, Revenue Bonds
5.00%, due 10/1/42 | | | 2,255,000 | | | | 2,444,285 | |
| | | | | | | | |
| | | | | | | 12,369,871 | |
| | | | | | | | |
Massachusetts 1.0% | | | | | | | | |
Massachusetts Development Finance Agency, Eastern Nazarene College, Revenue Bonds
5.625%, due 4/1/19 | | | 140,000 | | | | 140,431 | |
Massachusetts Development Finance Agency, Seven Hills Foundation & Affiliates, Revenue Bonds
Insured: RADIAN
5.00%, due 9/1/35 | | | 100,000 | | | | 100,452 | |
Massachusetts Educational Financing Authority, Revenue Bonds | | | | | | | | |
Series J
4.90%, due 7/1/28 (a) | | | 6,500,000 | | | | 6,887,660 | |
Series J
5.00%, due 7/1/30 (a) | | | 500,000 | | | | 526,510 | |
Massachusetts Port Authority Facilities, Delta Airlines, Inc. Project, Revenue Bonds | | | | | | | | |
Series A, Insured: AMBAC
5.00%, due 1/1/21 (a) | | | 375,000 | | | | 375,041 | |
Series A, Insured: AMBAC
5.50%, due 1/1/19 (a) | | | 560,000 | | | | 565,561 | |
Massachusetts State Health & Educational Facilities Authority, Fisher College, Revenue Bonds
Series A
5.125%, due 4/1/37 | | | 500,000 | | | | 507,865 | |
| | | | | | | | |
| | | Principal
Amount | | | Value | |
| | | | | | | | |
Massachusetts (continued) | | | | | | | | |
Massachusetts State Health & Educational Facilities Authority, Lowell General Hospital, Revenue Bonds
Series C
5.125%, due 7/1/35 | | $ | 1,945,000 | | | $ | 2,031,397 | |
| | | | | | | | |
| | | | | | | 11,134,917 | |
| | | | | | | | |
Michigan 6.7% | | | | | | | | |
Advanced Technology Academy, Public School Academy, Revenue Bonds
6.00%, due 11/1/37 | | | 550,000 | | | | 574,832 | |
Allen Academy, Michigan Public School Academy, Revenue Bonds | | | | | | | | |
5.50%, due 6/1/22 | | | 1,065,000 | | | | 1,088,622 | |
6.00%, due 6/1/33 | | | 1,000,000 | | | | 1,004,440 | |
Central Plains Energy, Project No. 3, Revenue Bonds
Series C, Insured: AMBAC
4.50%, due 5/1/31 | | | 305,000 | | | | 291,571 | |
Chandler Park Academy, Revenue Bonds | | | | | | | | |
5.125%, due 11/1/30 | | | 1,050,000 | | | | 1,042,209 | |
5.125%, due 11/1/35 | | | 605,000 | | | | 590,401 | |
Detroit, Michigan Water and Sewerage Department, Senior Lien, Revenue Bonds
Series A
5.25%, due 7/1/39 | | | 4,000,000 | | | | 4,372,400 | |
Detroit, Unlimited General Obligation | | | | | | | | |
Series A-1, Insured: AMBAC
4.60%, due 4/1/24 | | | 130,000 | | | | 110,438 | |
Series B-1, Insured: AMBAC
5.00%, due 4/1/14 | | | 695,000 | | | | 687,925 | |
Series A, Insured: XLCA
5.25%, due 4/1/17 | | | 1,500,000 | | | | 1,448,475 | |
Series A, Insured: XLCA
5.25%, due 4/1/18 | | | 2,935,000 | | | | 2,806,183 | |
Series A, Insured: XLCA
5.25%, due 4/1/19 | | | 750,000 | | | | 711,547 | |
Series A-1, Insured: AMBAC
5.25%, due 4/1/22 | | | 375,000 | | | | 346,012 | |
Series A-1, Insured: AMBAC
5.25%, due 4/1/24 | | | 295,000 | | | | 265,400 | |
Series A-1, Insured: NATL-RE
5.375%, due 4/1/18 | | | 1,160,000 | | | | 1,117,231 | |
Flint, Michigan Hospital Building Authority Rental, Hurley Medical Center, Revenue Bonds
Series A
5.25%, due 7/1/39 | | | 1,250,000 | | | | 1,267,125 | |
| | | | | | |
The notes to the financial statements are an integral part of,
and should be read in conjunction with, the financial statements. | | mainstayinvestments.com | | | 19 | |
Portfolio of Investments April 30, 2013 (Unaudited) (continued)
| | | | | | | | |
| | | Principal
Amount | | | Value | |
| | | | | | | | |
| Municipal Bonds (continued) | |
Michigan (continued) | | | | | | | | |
Michigan Finance Authority, Educational Facility, St. Catherine Siena, Revenue Bonds
Series A
8.00%, due 10/1/30 | | $ | 1,250,000 | | | $ | 1,404,100 | |
Michigan Finance Authority, Public School Academy, Revenue Bonds | | | | | | | | |
5.75%, due 2/1/33 | | | 3,500,000 | | | | 3,625,755 | |
7.00%, due 10/1/31 | | | 2,120,000 | | | | 2,449,342 | |
7.00%, due 10/1/36 | | | 1,740,000 | | | | 1,992,109 | |
7.50%, due 11/1/40 | | | 855,000 | | | | 987,337 | |
7.75%, due 7/15/26 | | | 1,020,000 | | | | 1,100,641 | |
8.00%, due 7/15/41 | | | 2,000,000 | | | | 2,156,580 | |
Michigan Finance Authority, Revenue Bonds
Series A
5.00%, due 6/1/39 | | | 6,920,000 | | | | 7,369,316 | |
Michigan Higher Education Facilities Authority, Creative Studies, Revenue Bonds | | | | | | | | |
5.875%, due 12/1/28 | | | 2,360,000 | | | | 2,532,422 | |
6.125%, due 12/1/33 | | | 4,100,000 | | | | 4,419,595 | |
6.125%, due 12/1/37 | | | 980,000 | | | | 1,055,499 | |
Michigan Municipal Bond Authority, Local Government Loan Program, Revenue Bonds
Series B, Insured: AMBAC
5.00%, due 12/1/34 | | | 340,000 | | | | 338,317 | |
Michigan Public Educational Facilities Authority, Dr. Joseph F. Pollack, Revenue Bonds
8.00%, due 4/1/40 | | | 500,000 | | | | 564,355 | |
Michigan Public Educational Facilities Authority, Landmark Academy, Revenue Bonds
7.00%, due 12/1/39 | | | 5,105,000 | | | | 5,555,312 | |
Michigan Public Educational Facilities Authority, Richfield Public School Academy, Revenue Bonds
5.00%, due 9/1/36 | | | 1,500,000 | | | | 1,475,550 | |
Michigan State Strategic Fund, Evangelical Homes, Revenue Bonds
5.50%, due 6/1/47 | | | 4,250,000 | | | | 4,313,495 | |
¨Michigan Tobacco Settlement Finance Authority, Revenue Bonds | | | | | | | | |
Series A
6.00%, due 6/1/34 | | | 6,335,000 | | | | 5,987,589 | |
Series A
6.00%, due 6/1/48 | | | 9,235,000 | | | | 8,623,273 | |
| | | | | | | | |
| | | | | | | 73,675,398 | |
| | | | | | | | |
| | | | | | | | |
| | | Principal
Amount | | | Value | |
| | | | | | | | |
Minnesota 0.5% | | | | | | | | |
St. Paul Housing & Redevelopment Authority, Charter School Lease, Nova Classical Academy, Revenue Bonds
Series A
6.625%, due 9/1/42 | | $ | 1,000,000 | | | $ | 1,128,670 | |
St. Paul Port Authority, Energy Park Utility Co. Project, Revenue Bonds | | | | | | | | |
5.45%, due 8/1/28 (a) | | | 250,000 | | | | 261,910 | |
5.70%, due 8/1/36 (a) | | | 1,250,000 | | | | 1,315,213 | |
St. Paul Port Authority, Minnesota Public Radio Project, Revenue Bonds
Series 7
0.21%, due 5/1/25 (b) | | | 2,000,000 | | | | 2,000,000 | |
Winona, Health Care Facilities, Winona Health Obligation, Revenue Bonds
5.00%, due 7/1/34 | | | 400,000 | | | | 422,620 | |
| | | | | | | | |
| | | | | | | 5,128,413 | |
| | | | | | | | |
Mississippi 0.1% | | | | | | | | |
Mississippi Business Finance Corp., System Energy Resources, Inc. Project, Revenue Bonds
5.875%, due 4/1/22 | | | 100,000 | | | | 100,313 | |
Mississippi Development Bank, Magnolia Regional Health Center Project, Revenue Bonds
Series A
6.75%, due 10/1/36 | | | 1,250,000 | | | | 1,540,400 | |
| | | | | | | | |
| | | | | | | 1,640,713 | |
| | | | | | | | |
Missouri 1.2% | | | | | | | | |
Arnold Retail Corridor Transportation Development District, Revenue Bonds
6.65%, due 5/1/38 | | | 500,000 | | | | 532,205 | |
Branson Industrial Development Authority, Branson Landing-Retail Project, Tax Allocation | | | | | | | | |
5.25%, due 6/1/21 | | | 550,000 | | | | 535,156 | |
5.50%, due 6/1/29 | | | 3,510,000 | | | | 3,299,295 | |
Kansas City Industrial Development Authority, Kansas City Parking LLC, Revenue Bonds
6.25%, due 9/1/32 | | | 1,000,000 | | | | 1,105,280 | |
Lees Summit Industrial Development Authority, Fair Community Improvement District, Special Assessment | | | | | | | | |
5.00%, due 5/1/35 | | | 1,725,000 | | | | 1,740,214 | |
6.00%, due 5/1/42 | | | 2,800,000 | | | | 2,828,644 | |
Lees Summit Tax Increment, Summit Fair Project, Tax Allocation
7.25%, due 4/1/30 | | | 1,500,000 | | | | 1,583,700 | |
| | | | |
| 20 | | MainStay High Yield Municipal Bond Fund | | The notes to the financial statements are an integral part of,
and should be read in conjunction with, the financial statements. |
| | | | | | | | |
| | | Principal
Amount | | | Value | |
| | | | | | | | |
| Municipal Bonds (continued) | |
Missouri (continued) | | | | | | | | |
St. Louis County Industrial Development Authority, Friendship Village Sunset Hills, Revenue Bonds
5.00%, due 9/1/42 | | $ | 1,500,000 | | | $ | 1,588,830 | |
| | | | | | | | |
| | | | | | | 13,213,324 | |
| | | | | | | | |
Nebraska 1.6% | | | | | | | | |
¨Central Plains Energy, Project No. 3, Revenue Bonds | | | | | | | | |
5.00%, due 9/1/42 | | | 7,715,000 | | | | 8,353,570 | |
5.25%, due 9/1/37 | | | 4,985,000 | | | | 5,579,162 | |
Gage County Hospital Authority No. 1, Beatrice Community Hospital & Health Center, Inc., Revenue Bonds
Series B
6.75%, due 6/1/35 | | | 2,815,000 | | | | 3,181,851 | |
| | | | | | | | |
| | | | | | | 17,114,583 | |
| | | | | | | | |
Nevada 0.3% | | | | | | | | |
Clark County Economic Development Revenue, University Southern Nevada Project, Revenue Bonds | | | | | | | | |
Insured: RADIAN
4.625%, due 4/1/37 | | | 1,645,000 | | | | 1,599,680 | |
Insured: RADIAN
5.00%, due 4/1/27 | | | 775,000 | | | | 808,836 | |
Director of the State of Nevada Department of Business & Industry, Tahoe Regional Planning Agency, Revenue Bonds
Series A, Insured: AMBAC
4.50%, due 6/1/37 | | | 945,000 | | | | 714,515 | |
Reno, Revenue Bonds
Series B, Insured: FGIC, NATL-RE
(zero coupon), due 6/1/38 | | | 1,155,000 | | | | 256,133 | |
| | | | | | | | |
| | | | | | | 3,379,164 | |
| | | | | | | | |
New Hampshire 0.6% | | | | | | | | |
Manchester Housing & Redevelopment Authority, Inc., Revenue Bonds | | | | | | | | |
Series B, Insured: RADIAN
(zero coupon), due 1/1/17 | | | 1,305,000 | | | | 1,012,758 | |
Series B, Insured: ACA
(zero coupon), due 1/1/26 | | | 1,400,000 | | | | 470,764 | |
Series A, Insured: ACA
6.75%, due 1/1/14 | | | 140,000 | | | | 139,955 | |
Series A, Insured: ACA
6.75%, due 1/1/15 | | | 350,000 | | | | 348,922 | |
| | | | | | | | |
| | | Principal
Amount | | | Value | |
| | | | | | | | |
New Hampshire (continued) | | | | | | | | |
New Hampshire Health & Education Facilities Authority, Southern New Hampshire University, Revenue Bonds
5.00%, due 1/1/42 | | $ | 4,000,000 | | | $ | 4,334,600 | |
| | | | | | | | |
| | | | | | | 6,306,999 | |
| | | | | | | | |
New Jersey 4.6% | | | | | | | | |
Camden County Improvement Authority, Heath Care Redevelopment, Revenue Bonds
Series A
5.75%, due 2/15/34 | | | 1,000,000 | | | | 1,049,260 | |
Mercer County Improvement Authority, Atlantic Foundation Project, Revenue Bonds
0.24%, due 9/1/28 (b) | | | 500,000 | | | | 500,000 | |
Middlesex County Improvement Authority, George Street Student Housing Project, Revenue Bonds
Series A
5.00%, due 8/15/35 | | | 160,000 | | | | 169,531 | |
New Jersey Economic Development Authority, Applewood Estates Project, Revenue Bonds | | | | | | | | |
Series A, Insured: RADIAN
5.00%, due 10/1/25 | | | 290,000 | | | | 319,014 | |
Series A, Insured: RADIAN
5.00%, due 10/1/35 | | | 3,880,000 | | | | 4,268,194 | |
New Jersey Economic Development Authority, Continental Airlines, Inc. Project, Revenue Bonds | | | | | | | | |
5.125%, due 9/15/23 (a) | | | 2,175,000 | | | | 2,292,124 | |
5.25%, due 9/15/29 (a) | | | 8,720,000 | | | | 9,188,090 | |
5.50%, due 4/1/28 (a) | | | 180,000 | | | | 180,677 | |
New Jersey Economic Development Authority, Continental Airlines, Revenue Bonds
5.75%, due 9/15/27 (a) | | | 3,335,000 | | | | 3,449,491 | |
New Jersey Economic Development Authority, Paterson Charter School, Revenue Bonds | | | | | | | | |
Series C
5.00%, due 7/1/32 | | | 1,125,000 | | | | 1,161,686 | |
Series C
5.30%, due 7/1/44 | | | 4,500,000 | | | | 4,665,015 | |
New Jersey Economic Development Authority, Paterson Charter Science & Technology, Revenue Bonds | | | | | | | | |
Series A
5.00%, due 7/1/22 | | | 630,000 | | | | 675,927 | |
| | | | | | |
The notes to the financial statements are an integral part of,
and should be read in conjunction with, the financial statements. | | mainstayinvestments.com | | | 21 | |
Portfolio of Investments April 30, 2013 (Unaudited) (continued)
| | | | | | | | |
| | | Principal
Amount | | | Value | |
| | | | | | | | |
| Municipal Bonds (continued) | |
New Jersey (continued) | | | | | | | | |
New Jersey Economic Development Authority, Paterson Charter Science & Technology, Revenue Bonds (continued) | | | | | | | | |
Series A
6.00%, due 7/1/32 | | $ | 650,000 | | | $ | 722,033 | |
Series A
6.10%, due 7/1/44 | | | 1,900,000 | | | | 2,096,156 | |
New Jersey Economic Development Authority, St. Barnabas Healthcare, Revenue Bonds
Series A, Insured: NATL-RE
(zero coupon), due 7/1/18 | | | 225,000 | | | | 196,513 | |
New Jersey Health Care Facilities Financing Authority, Bayshore Community Hospital, Revenue Bonds Insured: RADIAN
5.125%, due 7/1/32 | | | 175,000 | | | | 175,082 | |
New Jersey Health Care Facilities Financing Authority, St. Barnabas Healthcare, Revenue Bonds | | | | | | | | |
Insured: NATL-RE
(zero coupon), due 7/1/17 | | | 120,000 | | | | 108,343 | |
Series B
(zero coupon), due 7/1/31 | | | 205,000 | | | | 85,110 | |
New Jersey Higher Education Student Assistance Authority, Revenue Bonds
Series 1
5.375%, due 12/1/24 (a) | | | 4,000,000 | | | | 4,597,480 | |
New Jersey Tobacco Settlement Financing Corp., Revenue Bonds
Series 1A
5.00%, due 6/1/41 | | | 14,000,000 | | | | 12,509,140 | |
Tobacco Settlement Financing Corp., Revenue Bonds
Series 1A
4.625%, due 6/1/26 | | | 2,460,000 | | | | 2,395,351 | |
| | | | | | | | |
| | | | | | | 50,804,217 | |
| | | | | | | | |
New York 4.6% | | | | | | | | |
City of New York, Unlimited General Obligation
Series A-6, Insured: AGM
0.35%, due 11/1/26 (b) | | | 4,100,000 | | | | 4,100,000 | |
Erie County Tobacco Asset Securitization Corp., Tobacco Assessment, Asset-Backed, Revenue Bonds
Series A
5.00%, due 6/1/45 | | | 490,000 | | | | 412,066 | |
| | | | | | | | |
| | | Principal
Amount | | | Value | |
| | | | | | | | |
New York (continued) | | | | | | | | |
Nassau County Tobacco Settlement Corp.,
Asset-Backed, Revenue Bonds | | | | | | | | |
Series A-3
5.00%, due 6/1/35 | | $ | 1,590,000 | | | $ | 1,382,712 | |
Series A-3
5.125%, due 6/1/46 | | | 5,015,000 | | | | 4,280,302 | |
New York City Industrial Development Agency, British Airways PLC Project, Revenue Bonds
5.25%, due 12/1/32 (a) | | | 555,000 | | | | 555,011 | |
New York City Industrial Development Agency, JFK International Airport, Revenue Bonds
Series A
8.00%, due 8/1/12 (a)(d) | | | 6,770,000 | | | | 6,769,729 | |
New York City Industrial Development Agency, Pilot-Queens Baseball Stadium, Revenue Bonds | | | | | | | | |
Insured: AMBAC
4.75%, due 1/1/42 | | | 2,430,000 | | | | 2,454,300 | |
Insured: AMBAC
5.00%, due 1/1/46 | | | 5,975,000 | | | | 6,105,076 | |
New York City Industrial Development Agency, Vaughn College of Aeronautics & Technology, Revenue Bonds | | | | | | | | |
Series B
5.00%, due 12/1/28 | | | 1,000,000 | | | | 1,045,300 | |
Series B
5.25%, due 12/1/36 | | | 2,500,000 | | | | 2,617,800 | |
New York Liberty Development Corp.,
Bank of America, Revenue Bonds
Class 3
6.375%, due 7/15/49 | | | 1,000,000 | | | | 1,198,270 | |
Newburgh, Limited General Obligation | | | | | | | | |
Series A
5.00%, due 6/15/21 | | | 750,000 | | | | 818,257 | |
Series A
5.00%, due 6/15/26 | | | 960,000 | | | | 1,001,395 | |
Series A
5.50%, due 6/15/31 | | | 750,000 | | | | 794,063 | |
Onondaga Civic Development Corp., Josephs Hospital Health Center, Revenue Bonds
5.00%, due 7/1/42 | | | 9,500,000 | | | | 9,853,115 | |
Southampton Housing Authority, Revenue Bonds
3.50%, due 5/15/47 | | | 300,000 | | | | 291,627 | |
| | | | |
| 22 | | MainStay High Yield Municipal Bond Fund | | The notes to the financial statements are an integral part of,
and should be read in conjunction with, the financial statements. |
| | | | | | | | |
| | | Principal
Amount | | | Value | |
| | | | | | | | |
| Municipal Bonds (continued) | |
New York (continued) | | | | | | | | |
Suffolk County Economic Development Corp., Peconic Landing Southold, Revenue Bonds
6.00%, due 12/1/40 | | $ | 1,000,000 | | | $ | 1,115,520 | |
Tompkins County Development Corp., Kendall at Ithaca, Inc. Project, Revenue Bonds
4.50%, due 7/1/42 | | | 500,000 | | | | 505,030 | |
TSASC, Inc., Revenue Bonds | | | | | | | | |
Series 1
5.00%, due 6/1/34 | | | 720,000 | | | | 653,652 | |
Series 1
5.125%, due 6/1/42 | | | 5,770,000 | | | | 5,107,777 | |
| | | | | | | | |
| | | | | | | 51,061,002 | |
| | | | | | | | |
North Carolina 0.1% | | | | | | | | |
North Carolina State Medical Care Commission, First Mortgage-Lutheran Services, Revenue Bonds
5.00%, due 3/1/42 | | | 1,000,000 | | | | 1,019,610 | |
| | | | | | | | |
| | |
Ohio 5.7% | | | | | | | | |
Akron Bath Copley Joint Township Hospital District, Akron General Health System, Revenue Bonds
5.00%, due 1/1/31 | | | 6,000,000 | | | | 6,442,440 | |
Buckeye Tobacco Settlement Financing Authority, Asset-Backed, Revenue Bonds | | | | | | | | |
Series A-2
5.125%, due 6/1/24 | | | 100,000 | | | | 92,830 | |
Series A-2
5.75%, due 6/1/34 | | | 9,525,000 | | | | 8,354,854 | |
¨Buckeye Tobacco Settlement Financing Authority, Asset-Backed, Senior Turbo, Revenue Bonds | | | | | | | | |
Series A-2
5.875%, due 6/1/30 | | | 10,815,000 | | | | 9,701,812 | |
Series A-2
5.875%, due 6/1/47 | | | 5,190,000 | | | | 4,637,109 | |
Cleveland-Cuyahoga County Port Authority, Revenue Bonds | | | | | | | | |
7.00%, due 12/1/18 | | | 825,000 | | | | 828,820 | |
7.35%, due 12/1/31 | | | 6,000,000 | | | | 6,057,540 | |
Cleveland-Cuyahoga County Port Authority, Student Housing Euclid Avenue-Fenn Project, Revenue Bonds | | | | | | | | |
Insured: AMBAC
4.25%, due 8/1/15 | | | 210,000 | | | | 211,560 | |
| | | | | | | | |
| | | Principal
Amount | | | Value | |
| | | | | | | | |
Ohio (continued) | | | | | | | | |
Cleveland-Cuyahoga County Port Authority, Student Housing Euclid Avenue-Fenn Project, Revenue Bonds (continued) | | | | | | | | |
Insured: AMBAC
4.50%, due 8/1/36 | | $ | 995,000 | | | $ | 881,948 | |
Insured: AMBAC
5.00%, due 8/1/21 | | | 125,000 | | | | 126,290 | |
Insured: AMBAC
5.00%, due 8/1/28 | | | 110,000 | | | | 108,835 | |
Hamilton County Ohio Health Care, Life Enriching Communities Project, Revenue Bonds
5.00%, due 1/1/42 | | | 2,330,000 | | | | 2,462,507 | |
Muskingum County, Ohio Hospital Facilities, Genesis Healthcare System Project, Revenue Bonds | | | | | | | | |
5.00%, due 2/15/33 | | | 3,340,000 | | | | 3,425,604 | |
5.00%, due 2/15/44 | | | 5,550,000 | | | | 5,592,347 | |
Ohio Higher Educational Facilities Commission, Wittenberg University, Revenue Bonds
Insured: AMBAC, NATL-RE
5.00%, due 6/1/29 | | | 140,000 | | | | 140,444 | |
Ohio State Environmental Facilities Revenue, Ford Motor Co. Project, Revenue Bonds
6.15%, due 6/1/30 (a) | | | 125,000 | | | | 125,250 | |
Ohio State Water Development Authority, Firstenergy, Revenue Bonds
Series C
0.25%, due 6/1/33 (b) | | | 8,465,000 | | | | 8,465,000 | |
Southeastern Ohio Port Authority, Hospital Facilities Revenue, Memorial Health Systems, Revenue Bonds | | | | | | | | |
5.75%, due 12/1/32 | | | 1,000,000 | | | | 1,103,790 | |
6.00%, due 12/1/42 | | | 2,000,000 | | | | 2,229,760 | |
Summit County Development Finance Authority, Brimfield Project,
Revenue Bonds
Series G
4.875%, due 5/15/25 | | | 500,000 | | | | 494,165 | |
Summit County Development Finance Authority, Cleveland-Glats East Development, Tax Allocation
Series B
6.875%, due 5/15/40 | | | 1,250,000 | | | | 1,390,325 | |
| | | | | | | | |
| | | | | | | 62,873,230 | |
| | | | | | | | |
| | | | | | |
The notes to the financial statements are an integral part of,
and should be read in conjunction with, the financial statements. | | mainstayinvestments.com | | | 23 | |
Portfolio of Investments April 30, 2013 (Unaudited) (continued)
| | | | | | | | |
| | | Principal
Amount | | | Value | |
| | | | | | | | |
| Municipal Bonds (continued) | |
Oklahoma 0.8% | | | | | | | | |
Norman Regional Hospital Authority, Revenue Bonds | | | | | | | | |
5.125%, due 9/1/37 | | $ | 7,395,000 | | | $ | 7,630,605 | |
Insured: RADIAN
5.50%, due 9/1/32 | | | 55,000 | | | | 55,097 | |
Oklahoma Development Finance Authority, Duncan Regional Hospital, Revenue Bonds
0.21%, due 12/1/38 (b) | | | 1,400,000 | | | | 1,400,000 | |
| | | | | | | | |
| | | | | | | 9,085,702 | |
| | | | | | | | |
Oregon 0.9% | | | | | | | | |
Medford Hospital Facilities Authority, Rogue Valley Manor Project, Revenue Bonds
0.19%, due 8/15/37 (b) | | | 9,100,000 | | | | 9,100,000 | |
Oregon State Facilities Authority Revenue, Student Housing Chief Ashland, Revenue Bonds
Insured: AGM
5.00%, due 7/1/44 | | | 1,000,000 | | | | 1,113,840 | |
| | | | | | | | |
| | | | | | | 10,213,840 | |
| | | | | | | | |
Pennsylvania 5.0% | | | | | | | | |
Aleppo Township, Sewer Revenue, Revenue Bonds | | | | | | | | |
5.75%, due 12/1/36 | | | 1,220,000 | | | | 1,281,671 | |
5.75%, due 12/1/41 | | | 1,055,000 | | | | 1,110,124 | |
Allegheny County Higher Education Building, Carlow University Project, Revenue Bonds
7.00%, due 11/1/40 | | | 1,000,000 | | | | 1,140,130 | |
Allegheny County Industrial Development Authority, Propel Charter Montour, Revenue Bonds
Series A
6.75%, due 8/15/35 | | | 300,000 | | | | 335,643 | |
Chester County Health & Education Facilities Authority, Chester Country Hospital, Revenue Bonds
Series A
6.75%, due 7/1/31 | | | 885,000 | | | | 886,513 | |
Clairton Municipal Authority, Revenue Bonds | | | | | | | | |
Series B
5.00%, due 12/1/37 | | | 2,000,000 | | | | 2,121,060 | |
Series B
5.00%, due 12/1/42 | | | 1,000,000 | | | | 1,058,980 | |
| | | | | | | | |
| | | Principal
Amount | | | Value | |
| | | | | | | | |
Pennsylvania (continued) | | | | | | | | |
Cumberland County Municipal Authority, Asbury Pennsylvania Obligation Group, Revenue Bonds | | | | | | | | |
5.25%, due 1/1/32 | | $ | 1,100,000 | | | $ | 1,149,368 | |
5.25%, due 1/1/41 | | | 2,600,000 | | | | 2,684,786 | |
Erie County, Hospital Authority Health Facilities, St. Mary’s Home Erie Project, Revenue Bonds
Series A, Insured: RADIAN
4.50%, due 7/1/23 | | | 340,000 | | | | 341,676 | |
Harrisburg Authority, Harrisburg University of Science, Revenue Bonds
Series B
6.00%, due 9/1/36 (c)(d) | | | 2,600,000 | | | | 1,869,374 | |
Harrisburg Authority, Revenue Bonds
5.25%, due 7/15/31 | | | 2,000,000 | | | | 1,807,300 | |
Harrisburg Parking Authority Revenue, Revenue Bonds | | | | | | | | |
Series T, Insured: XLCA
4.00%, due 5/15/19 | | | 100,000 | | | | 93,131 | |
Series R, Insured: XLCA
4.25%, due 5/15/16 | | | 60,000 | | | | 57,786 | |
Series J, Insured: NATL-RE
5.00%, due 9/1/22 | | | 950,000 | | | | 904,609 | |
Harrisburg, Unlimited General Obligation | | | | | | | | |
Series D, Insured: AMBAC
(zero coupon), due 9/15/13 | | | 175,000 | | | | 170,618 | |
Series F, Insured: AMBAC
(zero coupon), due 9/15/13 | | | 385,000 | | | | 375,360 | |
Series D, Insured: AMBAC
(zero coupon), due 3/15/14 | | | 520,000 | | | | 489,824 | |
Series F, Insured: AMBAC
(zero coupon), due 3/15/14 | | | 335,000 | | | | 315,560 | |
Series D, Insured: AMBAC
(zero coupon), due 9/15/14 | | | 70,000 | | | | 63,724 | |
Series F, Insured: AMBAC
(zero coupon), due 9/15/14 | | | 515,000 | | | | 468,825 | |
Series D, Insured: AMBAC
(zero coupon), due 3/15/15 | | | 345,000 | | | | 302,969 | |
Series F, Insured: AMBAC
(zero coupon), due 3/15/15 | | | 460,000 | | | | 403,958 | |
Series F, Insured: AMBAC
(zero coupon), due 9/15/15 | | | 455,000 | | | | 385,963 | |
Series D, Insured: AMBAC
(zero coupon), due 3/15/16 | | | 430,000 | | | | 351,362 | |
Series F, Insured: AMBAC
(zero coupon), due 3/15/16 | | | 310,000 | | | | 253,307 | |
Series D, Insured: AMBAC
(zero coupon), due 9/15/16 | | | 185,000 | | | | 145,948 | |
Series F, Insured: AMBAC
(zero coupon), due 9/15/16 | | | 415,000 | | | | 327,398 | |
| | | | |
| 24 | | MainStay High Yield Municipal Bond Fund | | The notes to the financial statements are an integral part of,
and should be read in conjunction with, the financial statements. |
| | | | | | | | |
| | | Principal
Amount | | | Value | |
| | | | | | | | |
| Municipal Bonds (continued) | |
Pennsylvania (continued) | | | | | | | | |
Harrisburg, Unlimited General Obligation (continued) | | | | | | | | |
Series F, Insured: AMBAC
(zero coupon), due 3/15/17 | | $ | 35,000 | | | $ | 26,659 | |
Series D, Insured: AMBAC
(zero coupon), due 9/15/17 | | | 200,000 | | | | 147,078 | |
Series F, Insured: AMBAC
(zero coupon), due 3/15/18 | | | 400,000 | | | | 281,344 | |
Series D, Insured: AMBAC
(zero coupon), due 9/15/18 | | | 365,000 | | | | 247,627 | |
Series F, Insured: AMBAC
(zero coupon), due 9/15/18 | | | 270,000 | | | | 183,176 | |
Series F, Insured: AMBAC
(zero coupon), due 9/15/19 | | | 125,000 | | | | 77,458 | |
Series F, Insured: AMBAC
(zero coupon), due 3/15/20 | | | 15,000 | | | | 8,952 | |
Series F, Insured: AMBAC
(zero coupon), due 9/15/20 | | | 280,000 | | | | 160,955 | |
Series F, Insured: AMBAC
(zero coupon), due 9/15/22 | | | 210,000 | | | | 99,305 | |
Montgomery County Higher Education & Health Authority, Holy Redeemer Health System, Revenue Bonds
Series A, Insured: AMBAC
5.25%, due 10/1/27 | | | 100,000 | | | | 100,101 | |
Northeastern Pennsylvania Hospital & Education Authority, Wilkes University Project, Revenue Bonds
Series A
5.25%, due 3/1/42 | | | 1,450,000 | | | | 1,571,916 | |
Pennsylvania Economic Development Financing Authority, US Airways Group, Revenue Bonds
Series B
8.00%, due 5/1/29 | | | 250,000 | | | | 298,580 | |
Pennsylvania Higher Educational Facilities Authority, AICUP Financing Program, Gwynedd-Mercy College Project, Revenue Bonds
Series KK1
5.375%, due 5/1/42 | | | 1,785,000 | | | | 1,898,205 | |
Pennsylvania Higher Educational Facilities Authority, AICUP Financing Program, Valley College, Revenue Bonds
5.00%, due 11/1/42 | | | 535,000 | | | | 568,684 | |
Pennsylvania Higher Educational Facilities Authority, Fortier II LLC, Revenue Bonds
Series A, Insured: RADIAN
5.125%, due 4/1/33 | | | 250,000 | | | | 250,528 | |
| | | | | | | | |
| | | Principal
Amount | | | Value | |
| | | | | | | | |
Pennsylvania (continued) | | | | | | | | |
Pennsylvania Higher Educational Facilities Authority, Shippensburg University, Revenue Bonds
6.25%, due 10/1/43 | | $ | 1,000,000 | | | $ | 1,179,030 | |
Pennsylvania Higher Educational Facilities Authority, University of the Arts, Revenue Bonds | | | | | | | | |
Series A, Insured: RADIAN
5.00%, due 9/15/33 | | | 150,000 | | | | 150,606 | |
Insured: RADIAN
5.75%, due 3/15/30 | | | 1,040,000 | | | | 1,040,863 | |
Pennsylvania State Higher Educational Facilities Authority, Shippensburg University Student Services, Revenue Bonds | | | | | | | | |
5.00%, due 10/1/35 | | | 650,000 | | | | 713,414 | |
5.00%, due 10/1/44 | | | 1,000,000 | | | | 1,084,350 | |
Philadelphia Authority for Industrial Development, Discovery Charter School Project, Revenue Bonds
5.875%, due 4/1/32 | | | 480,000 | | | | 523,608 | |
Philadelphia Authority for Industrial Development, First Philadelphia Charter, Revenue Bonds
Series A
5.85%, due 8/15/37 | | | 1,650,000 | | | | 1,692,537 | |
Philadelphia Authority for Industrial Development, New Foundation Charter School Project, Revenue Bonds
6.625%, due 12/15/41 | | | 1,000,000 | | | | 1,108,560 | |
Philadelphia Authority for Industrial Development, Please Touch Museum Project, Revenue Bonds | | | | | | | | |
4.25%, due 9/1/19 | | | 405,000 | | | | 396,608 | |
5.25%, due 9/1/26 | | | 1,500,000 | | | | 1,504,440 | |
5.25%, due 9/1/31 | | | 2,425,000 | | | | 2,417,749 | |
5.25%, due 9/1/36 | | | 1,125,000 | | | | 1,106,336 | |
Philadelphia Hospitals and Higher Education Facilities Authority, Temple University Health System, Revenue Bonds
Series A
5.625%, due 7/1/42 | | | 7,000,000 | | | | 7,613,270 | |
Scranton, Unlimited General Obligation
Series A
7.25%, due 9/1/23 | | | 2,000,000 | | | | 1,948,120 | |
West Shore Area Authority, Holy Spirit Hospital Sisters, Revenue Bonds
6.50%, due 1/1/41 | | | 1,200,000 | | | | 1,415,916 | |
| | | | | | |
The notes to the financial statements are an integral part of,
and should be read in conjunction with, the financial statements. | | mainstayinvestments.com | | | 25 | |
Portfolio of Investments April 30, 2013 (Unaudited) (continued)
| | | | | | | | |
| | | Principal
Amount | | | Value | |
| | | | | | | | |
| Municipal Bonds (continued) | |
Pennsylvania (continued) | | | | | | | | |
York General Authority, York City Recreation Corp., Revenue Bonds | | | | | | | | |
Insured: AMBAC
5.50%, due 5/1/15 | | $ | 655,000 | | | $ | 666,011 | |
Insured: AMBAC
5.50%, due 5/1/18 | | | 1,475,000 | | | | 1,494,809 | |
York, Unlimited General Obligation
7.25%, due 11/15/41 | | | 1,370,000 | | | | 1,604,475 | |
| | | | | | | | |
| | | | | | | 54,478,237 | |
| | | | | | | | |
Rhode Island 0.8% | | | | | | | | |
Providence Redevelopment Agency, Port Providence Lease, Certificates of Participation | | | | | | | | |
Series A, Insured: RADIAN
(zero coupon), due 9/1/24 | | | 1,735,000 | | | | 841,215 | |
Series A, Insured: RADIAN
(zero coupon), due 9/1/26 | | | 685,000 | | | | 287,953 | |
Series A, Insured: RADIAN
(zero coupon), due 9/1/29 | | | 1,835,000 | | | | 621,735 | |
Series A, Insured: RADIAN
(zero coupon), due 9/1/30 | | | 1,835,000 | | | | 577,897 | |
Series A, Insured: RADIAN
(zero coupon), due 9/1/32 | | | 1,500,000 | | | | 411,285 | |
Series A, Insured: RADIAN
(zero coupon), due 9/1/34 | | | 1,000,000 | | | | 234,950 | |
Series A, Insured: RADIAN
(zero coupon), due 9/1/35 | | | 280,000 | | | | 60,155 | |
Series A, Insured: RADIAN
(zero coupon), due 9/1/36 | | | 445,000 | | | | 88,243 | |
Providence, Special Obligation, Tax Allocation
Series E, Insured: RADIAN
5.00%, due 6/1/13 | | | 600,000 | | | | 600,144 | |
Rhode Island Health and Educational Building Corp., Public Schools Financing Program, Revenue Bonds Series B, Insured: AMBAC
5.00%, due 5/15/21 | | | 1,000,000 | | | | 1,024,950 | |
Tobacco Settlement Financing Corp., Asset-Backed, Revenue Bonds
Series A
6.125%, due 6/1/32 | | | 205,000 | | | | 207,029 | |
Woonsocket, Unlimited General Obligation | | | | | | | | |
Insured: FGIC, NATL-RE
5.75%, due 10/1/14 | | | 520,000 | | | | 519,516 | |
Insured: FGIC, NATL-RE
5.75%, due 10/1/15 | | | 500,000 | | | | 498,135 | |
Insured: FGIC, NATL-RE
5.75%, due 10/1/16 | | | 530,000 | | | | 523,280 | |
| | | | | | | | |
| | | Principal
Amount | | | Value | |
| | | | | | | | |
Rhode Island (continued) | | | | | | | | |
Woonsocket, Unlimited General Obligation (continued) | | | | | | | | |
Insured: FGIC, NATL-RE
6.00%, due 10/1/17 | | $ | 1,200,000 | | | $ | 1,187,808 | |
Insured: FGIC, NATL-RE
6.00%, due 10/1/18 | | | 695,000 | | | | 683,484 | |
| | | | | | | | |
| | | | | | | 8,367,779 | |
| | | | | | | | |
South Carolina 0.1% | | | | | | | | |
Richland County, Benedict College Project, Revenue Bonds
Insured: AGM, RADIAN
5.125%, due 1/1/28 | | | 100,000 | | | | 100,143 | |
Richland County, Educational Facilities Revenue, Benedict College Project, Revenue Bonds
Insured: RADIAN
5.75%, due 7/1/19 | | | 130,000 | | | | 130,042 | |
South Carolina Educational Facilities Authority, Benedict College, Revenue Bonds
Insured: RADIAN
5.625%, due 7/1/31 | | | 220,000 | | | | 219,113 | |
South Carolina Jobs-Economic Development Authority, Conway Hospital Inc. Project, Revenue Bonds
4.00%, due 7/1/37 | | | 1,000,000 | | | | 1,015,710 | |
| | | | | | | | |
| | | | | | | 1,465,008 | |
| | | | | | | | |
Tennessee 1.4% | | | | | | | | |
Chattanooga Health Educational & Housing Facility Board, CDFI Phase I LLC, Revenue Bonds | | | | | | | | |
Series A
5.125%, due 10/1/35 | | | 100,000 | | | | 103,877 | |
Series B
6.00%, due 10/1/35 | | | 500,000 | | | | 524,710 | |
Clarksville Tennessee Public Building Authority, Financing Morris Town Loans, Revenue Bonds
0.25%, due 7/1/35 (b) | | | 650,000 | | | | 650,000 | |
Clarksville Tennessee Public Building Authority, Pooled Financing Bond Fund, Revenue Bonds
0.25%, due 7/1/31 (b) | | | 300,000 | | | | 300,000 | |
¨Montgomery County Public Building Authority, Tennessee County Loan Pool, Revenue Bonds | | | | | | | | |
0.25%, due 4/1/32 (b) | | | 600,000 | | | | 600,000 | |
0.25%, due 7/1/38 (b) | | | 13,425,000 | | | | 13,425,000 | |
| | | | | | | | |
| | | | | | | 15,603,587 | |
| | | | | | | | |
| | | | |
| 26 | | MainStay High Yield Municipal Bond Fund | | The notes to the financial statements are an integral part of,
and should be read in conjunction with, the financial statements. |
| | | | | | | | |
| | | Principal
Amount | | | Value | |
| | | | | | | | |
| Municipal Bonds (continued) | |
Texas 10.9% | | | | | | | | |
Austin Convention Enterprises, Inc., Revenue Bonds | | | | | | | | |
Series A, Insured: XLCA
4.30%, due 1/1/33 | | $ | 675,000 | | | $ | 675,196 | |
Series A, Insured: XLCA
5.00%, due 1/1/34 | | | 8,750,000 | | | | 9,078,650 | |
¨Central Texas Regional Mobility Authority, Revenue Bonds | | | | | | | | |
(zero coupon), due 1/1/23 | | | 1,655,000 | | | | 1,124,705 | |
(zero coupon), due 1/1/33 | | | 205,000 | | | | 74,971 | |
(zero coupon), due 1/1/34 | | | 3,275,000 | | | | 1,128,860 | |
(zero coupon), due 1/1/35 | | | 3,700,000 | | | | 1,195,544 | |
(zero coupon), due 1/1/36 | | | 2,000,000 | | | | 608,040 | |
(zero coupon), due 1/1/39 | | | 3,500,000 | | | | 890,995 | |
5.00%, due 1/1/33 | | | 3,000,000 | | | | 3,191,400 | |
6.75%, due 1/1/41 | | | 7,500,000 | | | | 8,823,075 | |
Clifton Higher Education Finance Corp., Idea Public Schools, Revenue Bonds
5.75%, due 8/15/41 | | | 1,750,000 | | | | 1,993,320 | |
¨Harris County-Houston Sports Authority, Revenue Bonds | | | | | | | | |
Series B, Insured: NATL-RE
(zero coupon), due 11/15/13 | | | 215,000 | | | | 209,019 | |
Series B, Insured: NATL-RE
(zero coupon), due 11/15/15 | | | 1,350,000 | | | | 1,178,509 | |
Series B, Insured: NATL-RE
(zero coupon), due 11/15/16 | | | 180,000 | | | | 148,837 | |
Series B, Insured: NATL-RE
(zero coupon), due 11/15/18 | | | 850,000 | | | | 630,139 | |
Series G, Insured: NATL-RE
(zero coupon), due 11/15/18 | | | 325,000 | | | | 250,689 | |
Series B, Insured: NATL-RE
(zero coupon), due 11/15/20 | | | 285,000 | | | | 189,348 | |
Series B, Insured: NATL-RE
(zero coupon), due 11/15/22 | | | 2,565,000 | | | | 1,528,817 | |
Series H, Insured: NATL-RE
(zero coupon), due 11/15/24 | | | 530,000 | | | | 293,721 | |
Series H, Insured: NATL-RE
(zero coupon), due 11/15/26 | | | 600,000 | | | | 299,790 | |
Series H, Insured: NATL-RE
(zero coupon), due 11/15/29 | | | 605,000 | | | | 253,434 | |
Series H, Insured: NATL-RE
(zero coupon), due 11/15/30 | | | 425,000 | | | | 167,186 | |
Series A-3, Insured: NATL-RE
(zero coupon), due 11/15/32 | | | 370,000 | | | | 124,731 | |
Series H, Insured: NATL-RE
(zero coupon), due 11/15/32 | | | 250,000 | | | | 86,758 | |
Series A-3, Insured: NATL-RE
(zero coupon), due 11/15/33 | | | 590,000 | | | | 187,036 | |
| | | | | | | | |
| | | Principal
Amount | | | Value | |
| | | | | | | | |
Texas (continued) | | | | | | | | |
Harris County-Houston Sports Authority, Revenue Bonds (continued) | | | | | | | | |
Series H, Insured: NATL-RE
(zero coupon), due 11/15/33 | | $ | 185,000 | | | $ | 60,151 | |
Series A, Insured: NATL-RE
(zero coupon), due 11/15/34 | | | 1,535,000 | | | | 508,684 | |
Series A-3, Insured: NATL-RE
(zero coupon), due 11/15/34 | | | 970,000 | | | | 289,118 | |
Series A, Insured: NATL-RE
(zero coupon), due 11/15/38 | | | 31,815,000 | | | | 8,099,463 | |
Series H, Insured: NATL-RE
(zero coupon), due 11/15/38 | | | 1,365,000 | | | | 321,662 | |
Series H, Insured: NATL-RE
(zero coupon), due 11/15/39 | | | 1,165,000 | | | | 256,964 | |
Series A, Insured: NATL-RE
(zero coupon), due 11/15/40 | | | 525,000 | | | | 117,280 | |
Series H, Insured: NATL-RE
(zero coupon), due 11/15/40 | | | 905,000 | | | | 187,480 | |
Series H, Insured: NATL-RE
(zero coupon), due 11/15/41 | | | 700,000 | | | | 136,178 | |
Series G, Insured: NATL-RE
5.25%, due 11/15/21 | | | 110,000 | | | | 111,097 | |
Series B, Insured: NATL-RE
5.25%, due 11/15/40 | | | 3,945,000 | | | | 3,953,442 | |
Series G, Insured: NATL-RE
5.375%, due 11/15/41 | | | 195,000 | | | | 195,417 | |
Harris County-Houston Sports Authority, Texas Higher Education Finance Corp., Revenue Bonds
Series A, Insured: NATL-RE
5.00%, due 11/15/28 | | | 550,000 | | | | 554,114 | |
Houston Airport System Revenue, Special Facilities Continental Airlines, Revenue Bonds | | | | | | | | |
Series B
6.125%, due 7/15/27 (a) | | | 175,000 | | | | 175,688 | |
Series C
6.125%, due 7/15/27 (a) | | | 480,000 | | | | 481,886 | |
Series A
6.625%, due 7/15/38 (a) | | | 1,000,000 | | | | 1,132,670 | |
Series E
6.75%, due 7/1/21 (a) | | | 755,000 | | | | 757,831 | |
Series E
7.00%, due 7/1/29 (a) | | | 500,000 | | | | 502,315 | |
Houston Higher Education Finance Corp., Revenue Bonds | | | | | | | | |
Series A
6.00%, due 8/15/36 | | | 675,000 | | | | 729,452 | |
Series A
6.00%, due 8/15/41 | | | 740,000 | | | | 796,388 | |
Series A
6.875%, due 5/15/41 | | | 1,700,000 | | | | 2,159,204 | |
| | | | | | |
The notes to the financial statements are an integral part of,
and should be read in conjunction with, the financial statements. | | mainstayinvestments.com | | | 27 | |
Portfolio of Investments April 30, 2013 (Unaudited) (continued)
| | | | | | | | |
| | | Principal
Amount | | | Value | |
| | | | | | | | |
| Municipal Bonds (continued) | |
Texas (continued) | | | | | | | | |
North Texas Education Finance Corp., Revenue Bonds
Series A
5.25%, due 12/1/47 | | $ | 7,255,000 | | | $ | 7,859,414 | |
San Juan, Texas Higher Education Finance Authority, Idea Public Schools, Revenue Bonds
Series A
6.70%, due 8/15/40 | | | 1,000,000 | | | | 1,188,010 | |
¨Texas Municipal Gas Acquisition & Supply Corp. III, Revenue Bonds | | | | | | | | |
5.00%, due 12/15/28 | | | 2,500,000 | | | | 2,722,200 | |
5.00%, due 12/15/30 | | | 12,000,000 | | | | 12,966,360 | |
5.00%, due 12/15/31 | | | 8,500,000 | | | | 9,149,315 | |
Texas Private Activity Bond Surface Transportation Corp., LBJ Infrastructure, Revenue Bonds | | | | | | | | |
7.00%, due 6/30/40 | | | 3,080,000 | | | | 3,777,589 | |
7.50%, due 6/30/33 | | | 750,000 | | | | 954,480 | |
Texas Private Activity Bond Surface Transportation Corp., NTE Mobility, Revenue Bonds
6.875%, due 12/31/39 | | | 3,050,000 | | | | 3,675,280 | |
Texas State Public Finance Authority Charter School Finance Corp., Cosmos Foundation, Revenue Bonds
Series A
5.375%, due 2/15/37 | | | 500,000 | | | | 522,325 | |
Texas State Public Finance Authority Charter School Finance Corp., ED—Burnham Wood Project, Revenue Bonds
Series A
6.25%, due 9/1/36 | | | 1,300,000 | | | | 1,339,000 | |
Texas State Turnpike Authority, Central Texas System, Revenue Bonds
Insured: AMBAC
(zero coupon), due 8/15/37 | | | 155,000 | | | | 36,586 | |
Texas Transportation Commission, First Tier, Revenue Bonds
Series A
5.00%, due 8/15/41 | | | 10,500,000 | | | | 11,465,160 | |
Travis County Cultural Education Facilities Finance Corp., Wayside Schools, Revenue Bonds
Series A
5.25%, due 8/15/42 | | | 1,250,000 | | | | 1,265,825 | |
Travis County Health Facilities Development Corp., Westminster Manor, Revenue Bonds
7.125%, due 11/1/40 | | | 1,000,000 | | | | 1,191,540 | |
| | | | | | | | |
| | | Principal
Amount | | | Value | |
| | | | | | | | |
Texas (continued) | | | | | | | | |
Tyler Health Facilities Development Corp., Revenue Bonds
Series A
5.375%, due 11/1/37 | | $ | 5,250,000 | | | $ | 5,651,152 | |
| | | | | | | | |
| | | | | | | 119,623,490 | |
| | | | | | | | |
U.S. Virgin Islands 0.5% | | | | | | | | |
Virgin Islands Public Finance Authority, Gross Receipts Taxes Loan, Revenue Bonds
Series A
5.00%, due 10/1/32 | | | 5,000,000 | | | | 5,599,400 | |
| | | | | | | | |
| | |
Utah 0.2% | | | | | | | | |
Santa Clara Municipal Building Authority, Revenue Bonds
Insured: AGC
4.125%, due 2/1/28 (c) | | | 800,000 | | | | 800,288 | |
Utah State Charter School Finance Authority, Da Vinci Academy, Revenue Bonds
Series A
7.75%, due 3/15/39 | | | 750,000 | | | | 848,678 | |
Utah State Charter School Finance Authority, North Star Academy, Revenue Bonds
Series A
7.00%, due 7/15/45 | | | 600,000 | | | | 687,444 | |
| | | | | | | | |
| | | | | | | 2,336,410 | |
| | | | | | | | |
Vermont 0.1% | | | | | | | | |
Vermont Educational & Health Buildings Financing Agency, Developmental & Mental Health Services, Revenue Bonds | | | | | | | | |
Series A, Insured: RADIAN
4.75%, due 8/15/36 | | | 450,000 | | | | 423,382 | |
Series A, Insured: RADIAN
5.75%, due 2/15/37 | | | 140,000 | | | | 141,875 | |
Vermont Educational & Health Buildings Financing Agency, Landmark College Project, Revenue Bonds
Series A, Insured: RADIAN
5.00%, due 7/1/34 | | | 200,000 | | | | 183,474 | |
| | | | | | | | |
| | | | | | | 748,731 | |
| | | | | | | | |
Virginia 3.6% | | | | | | | | |
Albermarle County Economic Development Authority, Westminster-Canterbury Blue, Revenue Bonds
Series A
5.00%, due 1/1/42 | | | 1,000,000 | | | | 1,026,950 | |
| | | | |
| 28 | | MainStay High Yield Municipal Bond Fund | | The notes to the financial statements are an integral part of,
and should be read in conjunction with, the financial statements. |
| | | | | | | | |
| | | Principal
Amount | | | Value | |
| | | | | | | | |
| Municipal Bonds (continued) | |
Virginia (continued) | | | | | | | | |
Madison County Industrial Development Authority, Woodberry Forest School, Revenue Bonds
0.23%, due 10/1/37 (b) | | $ | 965,000 | | | $ | 965,000 | |
Norfolk, Virginia Redevelopment & Housing Authority, Old Dominion University Project, Revenue Bonds
0.23%, due 8/1/31 (b) | | | 1,100,000 | | | | 1,100,000 | |
Route 460 Funding Corp., Senior Lien, Revenue Bonds
Series A
5.00%, due 7/1/52 | | | 7,000,000 | | | | 7,491,750 | |
Stafford County & Staunton Industrial Development Authority, Chesterfield County Economic Development, Revenue Bonds
Series B, Insured: XLCA
5.00%, due 8/1/37 | | | 8,775,000 | | | | 9,224,894 | |
Virginia Small Business Financing Authority, Elizabeth River, Revenue Bonds
5.50%, due 1/1/42 (a) | | | 7,300,000 | | | | 7,969,118 | |
Virginia Small Business Financing Authority, Senior Lien, Elizabeth River Crossing, Revenue Bonds
6.00%, due 1/1/37 (a) | | | 1,300,000 | | | | 1,500,980 | |
Virginia Small Business Financing Authority, Senior Lien-Express Lanes LLC, Revenue Bonds
5.00%, due 1/1/40 (a) | | | 3,500,000 | | | | 3,649,800 | |
Virginia Small Business Financing Authority, University Real Estate, Revenue Bonds
0.23%, due 7/1/30 (b) | | | 6,400,000 | | | | 6,400,000 | |
| | | | | | | | |
| | | | | | | 39,328,492 | |
| | | | | | | | |
Washington 1.3% | | | | | | | | |
Grant County Public Hospital District No. 3, Columbia Basin Hospital, Unlimited General Obligation | | | | | | | | |
5.25%, due 12/1/29 | | | 1,150,000 | | | | 1,220,656 | |
5.50%, due 12/1/36 | | | 2,000,000 | | | | 2,135,780 | |
Greater Wenatchee Regional Events, Center Public Facilities District, Revenue Bonds | | | | | | | | |
Series A
5.00%, due 9/1/27 | | | 1,000,000 | | | | 1,073,590 | |
Series A
5.25%, due 9/1/32 | | | 1,000,000 | | | | 1,072,760 | |
Series A
5.50%, due 9/1/42 | | | 2,500,000 | | | | 2,679,850 | |
| | | | | | | | |
| | | Principal
Amount | | | Value | |
| | | | | | | | |
Washington (continued) | | | | | | | | |
King County Public Hospital District No. 4, Limited General Obligation
7.00%, due 12/1/40 | | $ | 1,000,000 | | | $ | 1,100,060 | |
Port of Seattle Industrial Development Corp., King County Public Hospital District, Special Facilities Delta Airlines, Revenue Bonds
5.00%, due 4/1/30 (a) | | | 2,000,000 | | | | 2,056,640 | |
Tobacco Settlement Authority of Washington, Asset-Backed, Revenue Bonds
6.625%, due 6/1/32 | | | 165,000 | | | | 168,297 | |
Washington State Housing Finance Commission, Riverview Retirement Community, Revenue Bonds
5.00%, due 1/1/48 | | | 3,000,000 | | | | 3,022,680 | |
| | | | | | | | |
| | | | | | | 14,530,313 | |
| | | | | | | | |
West Virginia 0.5% | | | | | | | | |
Brooke County, Bethany College, Revenue Bonds
Series A
6.75%, due 10/1/37 | | | 2,500,000 | | | | 2,931,125 | |
Ohio County Building Commission, Brooke County, Wheeling Jesuit University Project, Revenue Bonds
Series B
5.25%, due 6/1/15 | | | 525,000 | | | | 537,778 | |
Ohio County, Fort Henry Economic Opportunity, Revenue Bonds
5.75%, due 3/1/36 | | | 400,000 | | | | 431,448 | |
Ohio County, Wheeling Jesuit, Revenue Bonds
Series A
5.50%, due 6/1/36 | | | 1,945,000 | | | | 1,895,286 | |
| | | | | | | | |
| | | | | | | 5,795,637 | |
| | | | | | | | |
Wisconsin 1.6% | | | | | | | | |
Menasha, Unlimited General Obligation
4.40%, due 9/1/17 | | | 100,000 | | | | 97,738 | |
Public Finance Authority Revenue, Continuing Care Retirement Community Revenue, Glenridge Palmer Ranch, Revenue Bonds
Series A
8.25%, due 6/1/46 | | | 1,000,000 | | | | 1,210,170 | |
Public Finance Authority, Charter School Revenue, Explore Knowledge Foundation Project, Revenue Bonds | | | | | | | | |
Series A
5.75%, due 7/15/32 | | | 1,820,000 | | | | 1,888,305 | |
Series A
6.00%, due 7/15/42 | | | 1,165,000 | | | | 1,200,591 | |
| | | | | | |
The notes to the financial statements are an integral part of,
and should be read in conjunction with, the financial statements. | | mainstayinvestments.com | | | 29 | |
Portfolio of Investments April 30, 2013 (Unaudited) (continued)
| | | | | | | | |
| | | Principal
Amount | | | Value | |
| | | | | | | | |
| Municipal Bonds (continued) | |
Wisconsin (continued) | | | | | | | | |
Public Finance Authority, Roseman University Health Sciences, Revenue Bonds | | | | | | | | |
5.00%, due 4/1/22 | | $ | 930,000 | | | $ | 970,762 | |
5.50%, due 4/1/32 | | | 1,250,000 | | | | 1,300,862 | |
5.75%, due 4/1/42 | | | 1,500,000 | | | | 1,566,915 | |
Public Finance Authority, Wisconsin Airport Facilities, AFCO Investors II Portfolio, Revenue Bonds
5.75%, due 10/1/31 (a) | | | 1,670,000 | | | | 1,674,125 | |
Warrens, Unlimited General Obligation
4.70%, due 12/1/19 | | | 120,000 | | | | 102,515 | |
Wisconsin Health & Educational Facilities Authority, Sauk-prairie Memorial Hospital, Inc., Revenue Bonds | | | | | | | | |
5.25%, due 2/1/43 | | | 2,645,000 | | | | 2,679,649 | |
5.375%, due 2/1/48 | | | 4,945,000 | | | | 4,993,164 | |
| | | | | | | | |
| | | | | | | 17,684,796 | |
| | | | | | | | |
Wyoming 0.2% | | | | | | | | |
West Park Hospital District, West Park Hospital Project, Revenue Bonds
Series B
6.50%, due 6/1/27 | | | 500,000 | | | | 598,470 | |
Wyoming Community Development Authority, Student Housing, Revenue Bonds
6.50%, due 7/1/43 | | | 930,000 | | | | 1,066,310 | |
| | | | | | | | |
| | | | | | | 1,664,780 | |
| | | | | | | | |
Total Municipal Bonds
(Cost $1,014,193,394) | | | | | | | 1,094,267,307 | |
| | | | | | | | |
| | |
| | | | | | | | |
| | |
| | | Shares | | | | |
| Unaffiliated Investment Companies 0.2% | | | | | |
California 0.0%‡ | | | | | | | | |
BlackRock MuniYield California Insured Fund, Inc. | | | 13,566 | | | | 219,226 | |
Nuveen California Municipal Market Opportunity Fund | | | 2,969 | | | | 49,256 | |
| | | | | | | | |
| | | | | | | 268,482 | |
| | | | | | | | |
Michigan 0.0%‡ | | | | | | | | |
Nuveen Michigan Quality Income | | | 24,503 | | | | 379,306 | |
| | | | | | | | |
| | |
Multi-State 0.1% | | | | | | | | |
SPDR Nuveen S&P High Yield Municipal Bond ETF | | | 18,000 | | | | 1,061,460 | |
| | | | | | | | |
| | | | | | | | |
| | |
| | | Shares | | | Value | |
| | | | | | | | |
New York 0.0%‡ | | | | | | | | |
Nuveen New York Dividend Advantage Municipal Fund | | | 620 | | | $ | 9,480 | |
| | | | | | | | |
| | |
Pennsylvania 0.1% | | | | | | | | |
Nuveen Pennsylvania Investment Quality Municipal Fund | | | 7,206 | | | | 109,820 | |
Nuveen Pennsylvania Premium Income Municipal Fund 2 | | | 20,000 | | | | 292,200 | |
| | | | | | | | |
| | | | | | | 402,020 | |
| | | | | | | | |
Total Unaffiliated Investment Companies
(Cost $1,985,795) | | | | | | | 2,120,748 | |
| | | | | | | | |
Total Investments
(Cost $1,016,179,189) (g) | | | 99.6 | % | | | 1,096,388,055 | |
Other Assets, Less Liabilities | | | 0.4 | | | | 4,177,398 | |
Net Assets | | | 100.0 | % | | $ | 1,100,565,453 | |
| | |
| | | | | | | | |
| | | | | | | | |
| | | Contracts
Short | | | Unrealized
Appreciation
(Depreciation) (e) | |
| Futures Contracts (0.0%)‡ | | | | | | | | |
United States Treasury Notes
June 2013 (10 Year) (f) | | | (650 | ) | | $ | (133,656 | ) |
| | | | | | | | |
Total Futures Contracts
(Settlement Value $(86,683,594)) | | | | | | $ | (133,656 | ) |
| | | | | | | | |
| ‡ | Less than one-tenth of a percent. |
| (a) | Interest on these securities is subject to alternative minimum tax. |
| (b) | Variable rate securities that may be tendered back to the issuer at any time prior to maturity at par. Rate shown is the rate in effect as of April 30, 2013. |
| (c) | Illiquid security—The total market value of these securities as of April 30, 2013 is $3,745,342, which represents 0.3% of the Fund’s net assets. |
| (e) | Represents the difference between the value of the contracts at the time they were opened and the value as of April 30, 2013. |
| (f) | As of April 30, 2013, cash in the amount of $715,000 is on deposit with broker for futures transactions. |
| (g) | As of April 30, 2013, cost is $1,016,192,756 for federal income tax purposes and net unrealized appreciation is as follows: |
| | | | |
Gross unrealized appreciation | | $ | 81,471,928 | |
Gross unrealized depreciation | | | (1,276,629 | ) |
| | | | |
Net unrealized appreciation | | $ | 80,195,299 | |
| | | | |
| | | | |
| 30 | | MainStay High Yield Municipal Bond Fund | | The notes to the financial statements are an integral part of,
and should be read in conjunction with, the financial statements. |
The following abbreviations are used in the above portfolio:
ACA—ACA Financial Guaranty Corp.
AGC—Assured Guaranty Corporation
AGM—Assured Guaranty Municipal Corp.
AMBAC—Ambac Assurance Corp.
CIFG—CIFG Group
ETF—Exchange Traded Fund
FGIC—Financial Guaranty Insurance Co.
GTY—Assured Guaranty Corp.
NATL-RE—National Public Finance Guarantee Corp.
RADIAN—Radian Asset Assurance, Inc.
SPDR—Standard & Poor’s Depositary Receipt
XLCA—XL Capital Assurance, Inc.
The following is a summary of the fair valuations according to the inputs used as of April 30, 2013, for valuing the Fund’s assets and liabilities.
Asset Valuation Inputs
| | | | | | | | | | | | | | | | |
Description | | Quoted
Prices in
Active
Markets for
Identical
Assets
(Level 1) | | | Significant
Other
Observable
Inputs
(Level 2) | | | Significant
Unobservable
Inputs
(Level 3) | | | Total | |
| Investments in Securities (a) | | | | | | | | | | | | | | | | |
| Municipal Bonds | | $ | — | | | $ | 1,094,267,307 | | | $ | — | | | $ | 1,094,267,307 | |
| Unaffiliated Investment Companies | | | 2,120,748 | | | | — | | | | — | | | | 2,120,748 | |
| | | | | | | | | | | | | | | | |
| Total Investments in Securities | | $ | 2,120,748 | | | $ | 1,094,267,307 | | | $ | — | | | $ | 1,096,388,055 | |
| | | | | | | | | | | | | | | | |
Liability Valuation Inputs
| | | | | | | | | | | | | | | | |
Description | | Quoted
Prices in
Active
Markets for
Identical
Assets
(Level 1) | | | Significant
Other
Observable
Inputs
(Level 2) | | | Significant
Unobservable
Inputs
(Level 3) | | | Total | |
| Other Financial Instruments | | | | | | | | | | | | | | | | |
| Futures Contracts Short (b) | | $ | (133,656 | ) | | $ | — | | | $ | — | | | $ | (133,656 | ) |
| | | | | | | | | | | | | | | | |
| Total Other Financial Instruments | | $ | (133,656 | ) | | $ | — | | | $ | — | | | $ | (133,656 | ) |
| | | | | | | | | | | | | | | | |
| (a) | For a complete listing of investments and their industries, see the Portfolio of Investments. |
| (b) | The value listed for this security reflects unrealized appreciation (depreciation) as shown on the Portfolio of Investments. |
The Fund recognizes transfers between the levels as of the beginning of the period.
For the period ended April 30, 2013, the Fund did not have any transfers between Level 1 and Level 2 fair value measurements. (See Note 2)
As of April 30, 2013, the Fund did not hold any investments with significant unobservable inputs (Level 3). (See Note 2)
| | | | | | |
The notes to the financial statements are an integral part of,
and should be read in conjunction with, the financial statements. | | mainstayinvestments.com | | | 31 | |
Statement of Assets and Liabilities as of April 30, 2013 (Unaudited)
| | | | |
| Assets | |
Investment in securities, at value
(identified cost $1,016,179,189) | | $ | 1,096,388,055 | |
Cash collateral on deposit at broker | | | 715,000 | |
Cash | | | 292,975 | |
Receivables: | | | | |
Dividends and interest | | | 14,898,743 | |
Fund shares sold | | | 6,530,884 | |
Variation margin on futures contracts | | | 60,938 | |
Other assets | | | 95,967 | |
| | | | |
Total assets | | | 1,118,982,562 | |
| | | | |
|
| Liabilities | |
Payables: | | | | |
Investment securities purchased | | | 13,581,929 | |
Fund shares redeemed | | | 2,757,619 | |
Manager (See Note 3) | | | 470,771 | |
NYLIFE Distributors (See Note 3) | | | 290,648 | |
Transfer agent (See Note 3) | | | 80,606 | |
Professional fees | | | 34,817 | |
Shareholder communication | | | 17,450 | |
Custodian | | | 4,429 | |
Trustees | | | 2,202 | |
Accrued expenses | | | 7,041 | |
Dividend payable | | | 1,169,597 | |
| | | | |
Total liabilities | | | 18,417,109 | |
| | | | |
Net assets | | $ | 1,100,565,453 | |
| | | | |
|
| Composition of Net Assets | |
Shares of beneficial interest outstanding (par value of $.001 per share) unlimited number of shares authorized | | $ | 90,724 | |
Additional paid-in capital | | | 1,008,949,340 | |
| | | | |
| | | 1,009,040,064 | |
Distributions in excess of net investment income | | | (94,191 | ) |
Accumulated net realized gain (loss) on investments | | | 11,544,370 | |
Net unrealized appreciation (depreciation) on investments and futures contracts | | | 80,075,210 | |
| | | | |
Net assets | | $ | 1,100,565,453 | |
| | | | |
| | | | |
Investor Class | | | | |
Net assets applicable to outstanding shares | | $ | 2,452,012 | |
| | | | |
Shares of beneficial interest outstanding | | | 202,301 | |
| | | | |
Net asset value per share outstanding | | $ | 12.12 | |
Maximum sales charge (4.50% of offering price) | | | 0.57 | |
| | | | |
Maximum offering price per share outstanding | | $ | 12.69 | |
| | | | |
Class A | | | | |
Net assets applicable to outstanding shares | | $ | 458,103,313 | |
| | | | |
Shares of beneficial interest outstanding | | | 37,746,641 | |
| | | | |
Net asset value per share outstanding | | $ | 12.14 | |
Maximum sales charge (4.50% of offering price) | | | 0.57 | |
| | | | |
Maximum offering price per share outstanding | | $ | 12.71 | |
| | | | |
Class C | | | | |
Net assets applicable to outstanding shares | | $ | 241,166,932 | |
| | | | |
Shares of beneficial interest outstanding | | | 19,919,043 | |
| | | | |
Net asset value and offering price per share outstanding | | $ | 12.11 | |
| | | | |
Class I | | | | |
Net assets applicable to outstanding shares | | $ | 398,843,196 | |
| | | | |
Shares of beneficial interest outstanding | | | 32,855,636 | |
| | | | |
Net asset value and offering price per share outstanding | | $ | 12.14 | |
| | | | |
| | | | |
| 32 | | MainStay High Yield Municipal Bond Fund | | The notes to the financial statements are an integral part of,
and should be read in conjunction with, the financial statements. |
Statement of Operations for the six months ended April 30, 2013 (Unaudited)
| | | | |
| Investment Income (Loss) | |
Income | | | | |
Interest | | $ | 27,290,867 | |
Dividends | | | 351,019 | |
| | | | |
Total income | | | 27,641,886 | |
| | | | |
Expenses | |
Manager (See Note 3) | | | 2,931,378 | |
Distribution/Service—Investor Class (See Note 3) | | | 2,672 | |
Distribution/Service—Class A (See Note 3) | | | 583,761 | |
Distribution/Service—Class C (See Note 3) | | | 1,142,601 | |
Transfer agent (See Note 3) | | | 303,906 | |
Registration | | | 69,437 | |
Professional fees | | | 41,727 | |
Shareholder communication | | | 33,196 | |
Custodian | | | 17,230 | |
Trustees | | | 11,958 | |
Miscellaneous | | | 18,589 | |
| | | | |
Total expenses before waiver/reimbursement | | | 5,156,455 | |
Expense waiver/reimbursement from Manager (See Note 3) | | | (168,614 | ) |
| | | | |
Net expenses | | | 4,987,841 | |
| | | | |
Net investment income (loss) | | | 22,654,045 | |
| | | | |
|
| Realized and Unrealized Gain (Loss) on Investments and Futures Contracts | |
Net realized gain (loss) on investments | | | 11,559,068 | |
| | | | |
Net change in unrealized appreciation (depreciation) on: | | | | |
Investments | | | 9,661,372 | |
Futures contracts | | | (133,656 | ) |
| | | | |
Net change in unrealized appreciation (depreciation) on investments and futures contracts | | | 9,527,716 | |
| | | | |
Net realized and unrealized gain (loss) on investments and futures transactions | | | 21,086,784 | |
| | | | |
Net increase (decrease) in net assets resulting from operations | | $ | 43,740,829 | |
| | | | |
| | | | | | |
The notes to the financial statements are an integral part of,
and should be read in conjunction with, the financial statements. | | mainstayinvestments.com | | | 33 | |
Statements of Changes in Net Assets
for the six months ended April 30, 2013 (Unaudited) and the year ended October 31, 2012
| | | | | | | | |
| | | 2013 | | | 2012 | |
| Increase (Decrease) in Net Assets | |
Operations: | | | | | | | | |
Net investment income (loss) | | $ | 22,654,045 | | | $ | 27,527,377 | |
Net realized gain (loss) on investments | | | 11,559,068 | | | | 3,750,242 | |
Net change in unrealized appreciation (depreciation) on investments and futures contracts | | | 9,527,716 | | | | 65,370,065 | |
| | | | |
Net increase (decrease) in net assets resulting from operations | | | 43,740,829 | | | | 96,647,684 | |
| | | | |
Dividends and distributions to shareholders: | | | | | | | | |
From net investment income: | | | | | | | | |
Investor Class | | | (46,169 | ) | | | (67,764 | ) |
Class A | | | (10,104,427 | ) | | | (14,157,985 | ) |
Class C | | | (4,064,980 | ) | | | (4,513,602 | ) |
Class I | | | (8,438,617 | ) | | | (8,856,092 | ) |
| | | | |
| | | (22,654,193 | ) | | | (27,595,443 | ) |
| | | | |
From net realized gain on investments: | | | | | | | | |
Investor Class | | | (4,820 | ) | | | — | |
Class A | | | (1,158,741 | ) | | | — | |
Class C | | | (524,093 | ) | | | — | |
Class I | | | (825,321 | ) | | | — | |
| | | | |
| | | (2,512,975 | ) | | | — | |
| | | | |
Total dividends and distributions to shareholders | | | (25,167,168 | ) | | | (27,595,443 | ) |
| | | | |
Capital share transactions: | | | | | | | | |
Net proceeds from sale of shares | | | 313,793,184 | | | | 874,386,468 | |
Net asset value of shares issued to shareholders in reinvestment of dividends and distributions | | | 17,111,147 | | | | 17,116,287 | |
Cost of shares redeemed | | | (275,660,082 | ) | | | (190,804,415 | ) |
| | | | |
Increase (decrease) in net assets derived from capital share transactions | | | 55,244,249 | | | | 700,698,340 | |
| | | | |
Net increase (decrease) in net assets | | | 73,817,910 | | | | 769,750,581 | |
|
| Net Assets | |
Beginning of period | | | 1,026,747,543 | | | | 256,996,962 | |
| | | | |
End of period | | $ | 1,100,565,453 | | | $ | 1,026,747,543 | |
| | | | |
Distributions in excess of net investment income at end of period | | $ | (94,191 | ) | | $ | (94,043 | ) |
| | | | |
| | | | |
| 34 | | MainStay High Yield Municipal Bond Fund | | The notes to the financial statements are an integral part of,
and should be read in conjunction with, the financial statements. |
Financial Highlights selected per share data and ratios
| | | | | | | | | | | | | | | | |
| | | Investor Class | |
| | | Six months
ended
April 30, | | | Year ended October 31, | | | March 31,
2010**
through
October 31, | |
| | | 2013* | | | 2012 | | | 2011 | | | 2010 | |
Net asset value at beginning of period | | $ | 11.90 | | | $ | 10.57 | | | $ | 10.75 | | | $ | 10.00 | |
| | | | | | | | | | | | | | | | |
Net investment income (loss) | | | 0.26 | | | | 0.51 | (a) | | | 0.57 | (a) | | | 0.27 | |
Net realized and unrealized gain (loss) on investments | | | 0.25 | | | | 1.33 | | | | (0.17 | ) | | | 0.75 | |
| | | | | | | | | | | | | | | | |
Total from investment operations | | | 0.51 | | | | 1.84 | | | | 0.40 | | | | 1.02 | |
| | | | | | | | | | | | | | | | |
Less dividends and distributions: | | | | | | | | | | | | | | | | |
From net investment income | | | (0.26 | ) | | | (0.51 | ) | | | (0.55 | ) | | | (0.27 | ) |
From net realized gain on investments | | | (0.03 | ) | | | — | | | | (0.03 | ) | | | — | |
| | | | | | | | | | | | | | | | |
Total dividends and distributions | | | (0.29 | ) | | | (0.51 | ) | | | (0.58 | ) | | | (0.27 | ) |
| | | | | | | | | | | | | | | | |
Net asset value at end of period | | $ | 12.12 | | | $ | 11.90 | | | $ | 10.57 | | | $ | 10.75 | |
| | | | | | | | | | | | | | | | |
Total investment return (b) | | | 4.29 | %(c) | | | 17.80 | % | | | 4.03 | % | | | 10.32 | %(c) |
Ratios (to average net assets)/Supplemental Data: | | | | | | | | | | | | | | | | |
Net investment income (loss) | | | 4.33 | %†† | | | 4.48 | % | | | 5.58 | % | | | 5.03 | %†† |
Net expenses | | | 0.87 | %†† | | | 0.87 | % | | | 0.90 | % | | | 1.00 | %†† |
Expenses (before waiver/reimbursement) | | | 0.90 | %†† | | | 0.93 | % | | | 1.09 | % | | | 1.73 | %†† |
Portfolio turnover rate | | | 42 | % | | | 117 | % | | | 154 | % | | | 163 | % |
Net assets at end of period (in 000’s) | | $ | 2,452 | | | $ | 1,902 | | | $ | 989 | | | $ | 598 | |
| ** | Commencement of operations. |
| (a) | Per share data based on average shares outstanding during the period. |
| (b) | Total investment return is calculated exclusive of sales charges and assumes the reinvestment of dividends and distributions. |
| (c) | Total investment return is not annualized. |
| | | | | | |
The notes to the financial statements are an integral part of,
and should be read in conjunction with, the financial statements. | | mainstayinvestments.com | | | 35 | |
Financial Highlights selected per share data and ratios
| | | | | | | | | | | | | | | | |
| | | Class A | |
| | | Six months
ended
April 30, | | | Year ended October 31, | | | March 31,
2010**
through
October 31, | |
| | | 2013* | | | 2012 | | | 2011 | | | 2010 | |
Net asset value at beginning of period | | $ | 11.92 | | | $ | 10.58 | | | $ | 10.77 | | | $ | 10.00 | |
| | | | | | | | | | | | | | | | |
Net investment income (loss) | | | 0.26 | | | | 0.50 | (a) | | | 0.58 | (a) | | | 0.27 | |
Net realized and unrealized gain (loss) on investments | | | 0.25 | | | | 1.35 | | | | (0.19 | ) | | | 0.78 | |
| | | | | | | | | | | | | | | | |
Total from investment operations | | | 0.51 | | | | 1.85 | | | | 0.39 | | | | 1.05 | |
| | | | | | | | | | | | | | | | |
Less dividends and distributions: | | | | | | | | | | | | | | | | |
From net investment income | | | (0.26 | ) | | | (0.51 | ) | | | (0.55 | ) | | | (0.28 | ) |
From net realized gain on investments | | | (0.03 | ) | | | — | | | | (0.03 | ) | | | — | |
| | | | | | | | | | | | | | | | |
Total dividends and distributions | | | (0.29 | ) | | | (0.51 | ) | | | (0.58 | ) | | | (0.28 | ) |
| | | | | | | | | | | | | | | | |
Net asset value at end of period | | $ | 12.14 | | | $ | 11.92 | | | $ | 10.58 | | | $ | 10.77 | |
| | | | | | | | | | | | | | | | |
Total investment return (b) | | | 4.29 | %(c) | | | 17.89 | % | | | 4.00 | % | | | 10.59 | %(c) |
Ratios (to average net assets)/Supplemental Data: | | | | | | | | | | | | | | | | |
Net investment income (loss) | | | 4.33 | %†† | | | 4.41 | % | | | 5.58 | % | | | 5.20 | %†† |
Net expenses | | | 0.86 | %†† | | | 0.85 | % | | | 0.85 | % | | | 0.85 | %†† |
Expenses (before waiver/reimbursement) | | | 0.89 | %†† | | | 0.91 | % | | | 1.04 | % | | | 1.58 | %†† |
Portfolio turnover rate | | | 42 | % | | | 117 | % | | | 154 | % | | | 163 | % |
Net assets at end of period (in 000’s) | | $ | 458,103 | | | $ | 489,759 | | | $ | 150,071 | | | $ | 23,062 | |
| ** | Commencement of operations. |
| (a) | Per share data based on average shares outstanding during the period. |
| (b) | Total investment return is calculated exclusive of sales charges and assumes the reinvestment of dividends and distributions. |
| (c) | Total investment return is not annualized. |
| | | | |
| 36 | | MainStay High Yield Municipal Bond Fund | | The notes to the financial statements are an integral part of,
and should be read in conjunction with, the financial statements. |
Financial Highlights selected per share data and ratios
| | | | | | | | | | | | | | | | |
| | | Class C | |
| | | Six months
ended
April 30, | | | Year ended October 31, | | | March 31,
2010**
through
October 31, | |
| | | 2013* | | | 2012 | | | 2011 | | | 2010 | |
Net asset value at beginning of period | | $ | 11.89 | | | $ | 10.56 | | | $ | 10.75 | | | $ | 10.00 | |
| | | | | | | | | | | | | | | | |
Net investment income (loss) | | | 0.21 | | | | 0.41 | (a) | | | 0.50 | (a) | | | 0.22 | |
Net realized and unrealized gain (loss) on investments | | | 0.25 | | | | 1.34 | | | | (0.18 | ) | | | 0.77 | |
| | | | | | | | | | | | | | | | |
Total from investment operations | | | 0.46 | | | | 1.75 | | | | 0.32 | | | | 0.99 | |
| | | | | | | | | | | | | | | | |
Less dividends and distributions: | | | | | | | | | | | | | | | | |
From net investment income | | | (0.21 | ) | | | (0.42 | ) | | | (0.48 | ) | | | (0.24 | ) |
From net realized gain on investments | | | (0.03 | ) | | | — | | | | (0.03 | ) | | | — | |
| | | | | | | | | | | | | | | | |
Total dividends and distributions | | | (0.24 | ) | | | (0.42 | ) | | | (0.51 | ) | | | (0.24 | ) |
| | | | | | | | | | | | | | | | |
Net asset value at end of period | | $ | 12.11 | | | $ | 11.89 | | | $ | 10.56 | | | $ | 10.75 | |
| | | | | | | | | | | | | | | | |
Total investment return (b) | | | 3.90 | %(c) | | | 16.90 | % | | | 3.22 | % | | | 9.96 | %(c) |
Ratios (to average net assets)/Supplemental Data: | | | | | | | | | | | | | | | | |
Net investment income (loss) | | | 3.56 | %†† | | | 3.58 | % | | | 4.79 | % | | | 4.33 | %†† |
Net expenses | | | 1.62 | %†† | | | 1.61 | % | | | 1.65 | % | | | 1.75 | %†† |
Expenses (before waiver/reimbursement) | | | 1.65 | %†† | | | 1.67 | % | | | 1.84 | % | | | 2.48 | %†† |
Portfolio turnover rate | | | 42 | % | | | 117 | % | | | 154 | % | | | 163 | % |
Net assets at end of period (in 000’s) | | $ | 241,167 | | | $ | 213,253 | | | $ | 45,632 | | | $ | 5,477 | |
| ** | Commencement of operations. |
| (a) | Per share data based on average shares outstanding during the period. |
| (b) | Total investment return is calculated exclusive of sales charges and assumes the reinvestment of dividends and distributions. |
| (c) | Total investment return is not annualized. |
| | | | | | |
The notes to the financial statements are an integral part of,
and should be read in conjunction with, the financial statements. | | mainstayinvestments.com | | | 37 | |
Financial Highlights selected per share data and ratios
| | | | | | | | | | | | | | | | |
| | | Class I | |
| | | Six months
ended
April 30, | | | Year ended October 31, | | | March 31,
2010**
through
October 31, | |
| | | 2013* | | | 2012 | | | 2011 | �� | | 2010 | |
Net asset value at beginning of period | | $ | 11.92 | | | $ | 10.58 | | | $ | 10.77 | | | $ | 10.00 | |
| | | | | | | | | | | | | | | | |
Net investment income (loss) | | | 0.27 | | | | 0.53 | (a) | | | 0.60 | (a) | | | 0.29 | |
Net realized and unrealized gain (loss) on investments | | | 0.25 | | | | 1.35 | | | | (0.18 | ) | | | 0.76 | |
| | | | | | | | | | | | | | | | |
Total from investment operations | | | 0.52 | | | | 1.88 | | | | 0.42 | | | | 1.05 | |
| | | | | | | | | | | | | | | | |
Less dividends and distributions: | | | | | | | | | | | | | | | | |
From net investment income | | | (0.27 | ) | | | (0.54 | ) | | | (0.58 | ) | | | (0.28 | ) |
From net realized gain on investments | | | (0.03 | ) | | | — | | | | (0.03 | ) | | | — | |
| | | | | | | | | | | | | | | | |
Total dividends and distributions | | | (0.30 | ) | | | (0.54 | ) | | | (0.61 | ) | | | (0.28 | ) |
| | | | | | | | | | | | | | | | |
Net asset value at end of period | | $ | 12.14 | | | $ | 11.92 | | | $ | 10.58 | | | $ | 10.77 | |
| | | | | | | | | | | | | | | | |
Total investment return (b) | | | 4.42 | %(c) | | | 18.19 | % | | | 4.21 | % | | | 10.66 | %(c) |
Ratios (to average net assets)/Supplemental Data: | | | | | | | | | | | | | | | | |
Net investment income (loss) | | | 4.58 | %†† | | | 4.62 | % | | | 5.88 | % | | | 5.26 | %†† |
Net expenses | | | 0.61 | %†† | | | 0.60 | % | | | 0.60 | % | | | 0.60 | %†† |
Expenses (before waiver/reimbursement) | | | 0.64 | %†† | | | 0.66 | % | | | 0.79 | % | | | 1.33 | %†† |
Portfolio turnover rate | | | 42 | % | | | 117 | % | | | 154 | % | | | 163 | % |
Net assets at end of period (in 000’s) | | $ | 398,843 | | | $ | 321,835 | | | $ | 60,305 | | | $ | 44,720 | |
| ** | Commencement of operations. |
| (a) | Per share data based on average shares outstanding during the period. |
| (b) | Total investment return is calculated exclusive of sales charges and assumes the reinvestment of dividends and distributions. Class I shares are not subject to sales charges. |
| (c) | Total investment return is not annualized. |
| | | | |
| 38 | | MainStay High Yield Municipal Bond Fund | | The notes to the financial statements are an integral part of,
and should be read in conjunction with, the financial statements. |
Notes to Financial Statements (Unaudited)
Note 1–Organization and Business
MainStay Funds Trust (the “Trust”) was organized as a Delaware statutory trust on April 28, 2009, and is governed by a Declaration of Trust. The Trust is registered under the Investment Company Act of 1940, as amended (the “1940 Act”), as an open-end investment management company, and is comprised of thirty-three funds (collectively referred to as the “Funds”). These financial statements and notes relate only to the MainStay High Yield Municipal Bond Fund (the “Fund”), a diversified fund.
The Fund currently offers four classes of shares. Investor Class, Class A, Class C and Class I shares commenced operations on March 31, 2010. Investor Class and Class A shares are offered at net asset value (“NAV”) per share plus an initial sales charge. No sales charge applies to investments of $500,000 or more (and certain other qualified purchases) in Investor Class and Class A shares, but a contingent deferred sales charge (“CDSC”) is imposed on certain redemptions made within one year of the date of purchase. Class C shares are offered at NAV without an initial sales charge, although a 1.00% CDSC may be imposed on redemptions made within one year of the date of purchase of Class C shares. Class I shares are offered at NAV and are not subject to a sales charge. Depending upon eligibility, Investor Class shares may convert to Class A shares, and Class A shares may convert to Investor Class shares. The four classes of shares have the same voting (except for issues that relate solely to one class), dividend, liquidation and other rights, and the same terms and conditions, except that Class C shares are subject to higher distribution and/or service fee rates than Investor Class and Class A shares under a distribution plan pursuant to Rule 12b-1 under the 1940 Act. Class I shares are not subject to a distribution and/or service fee.
The Fund’s investment objective is to seek a high level of current income exempt from federal income taxes. The Fund’s secondary investment objective is total return.
Note 2–Significant Accounting Policies
The Fund prepares its financial statements in accordance with generally accepted accounting principles (“GAAP”) in the United States of America and follows the significant accounting policies described below.
(A) Securities Valuation. Investments are valued as of the close of regular trading on the New York Stock Exchange (“Exchange”) (generally 4:00 p.m. Eastern time) on each day the Fund is open for business (“valuation date”).
The Board of Trustees (the “Board”) has adopted procedures for the valuation of the Fund’s securities and has delegated the responsibility for valuation determination under those procedures to the Valuation Committee of the Fund (the “Valuation Committee”). The Board has authorized the Valuation Committee to appoint a Valuation Sub-Committee (the “Sub-Committee”) to deal in the first instance with questions that arise or cannot be resolved under these procedures. The Sub-Committee meets (in person, via electronic mail or via teleconference) on an as-needed basis. The Valuation Committee meets at a later time, as necessary, to ensure that actions taken by the Sub-Committee were appropriate. The procedures recognize that, subject to the oversight of the Board and unless otherwise noted, the responsibility
for day-to-day valuation of portfolio assets (including securities for which market prices are not readily available) rests with New York Life Investment Management LLC ( “New York Life Investments” or the “Manager”), aided to whatever extent necessary by the Subadvisor (as defined in Note 3(A)) of the Fund.
To assess the appropriateness of security valuations, the Manager or the Fund’s third party service provider who is subject to oversight by the Manager, regularly compares prior day prices, prices on comparable securities and the sale prices to the prior and current day prices and challenges prices exceeding certain tolerance levels with third party pricing services or broker sources. For those securities valued by recommendation, whether through a standardized fair valuation methodology or a fair valuation determination, the Valuation Committee reviews and affirms the reasonableness of the valuation based on such methodologies and determinations on a regular basis after considering all relevant information that is reasonably available.
“Fair value” is defined as the price that the Fund would receive upon selling an investment in an orderly transaction to an independent buyer in the principal or most advantageous market of the investment. Fair value measurements are determined within a framework that has established a three-tier hierarchy which maximizes the use of observable market data and minimizes the use of unobservable inputs to establish classification of fair value measurements for disclosure purposes. “Inputs” refers broadly to the assumptions that market participants would use in pricing the asset or liability, including assumptions about risk, such as the risk inherent in a particular valuation technique used to measure fair value using a pricing model and/or the risk inherent in the inputs for the valuation technique. Inputs may be observable or unobservable. Observable inputs reflect the assumptions market participants would use in pricing the asset or liability based on market data obtained from sources independent of the Fund. Unobservable inputs reflect the Fund’s own assumptions about the assumptions market participants would use in pricing the asset or liability developed based on the information available in the circumstances. The inputs or methodology used for valuing securities may not be an indication of the risks associated with investing in those securities. The three-tier hierarchy of inputs is summarized in the three broad Levels listed below.
| • | | Level 1—quoted prices in active markets for identical investments |
| • | | Level 2—other significant observable inputs (including quoted prices for similar investments in active markets, interest rates and yield curves, prepayment speeds, credit risks, etc.) |
| • | | Level 3—significant unobservable inputs (including the Fund’s own assumptions about the assumptions that market participants would use in determining the fair value of investments) |
The aggregate value by input level, as of April 30, 2013, for the Fund’s investments is included at the end of the Fund’s Portfolio of Investments.
The valuation techniques used by the Fund to measure fair value maximize the use of observable inputs and minimize the use of unobservable inputs. The Fund may utilize third party vendor
| | | | |
| mainstayinvestments.com | | | 39 | |
Notes to Financial Statements (Unaudited) (continued)
evaluations, whose prices may be derived from one or more of the following standard inputs:
| | |
• Benchmark Yields | | • Reported Trades |
• Broker Dealer Quotes | | • Issuer Spreads |
• Two-sided markets | | • Benchmark securities |
• Bids/Offers | | • Reference Data (corporate actions or material event notices) |
• Industry and economic events | | • Comparable bonds |
• Equity and credit default swap curves | | • Monthly payment information |
Securities for which market values cannot be determined using the methodologies described above are valued by methods deemed in good faith by the Fund’s Valuation Committee, following the procedures established by the Board, to represent fair value. Under these procedures, the Fund primarily employs a market-based approach which may use related or comparable assets or liabilities, recent transactions, market multiples, book values, and other relevant information. The Fund may also use an income-based valuation approach in which the anticipated future cash flows of the investment are discounted to calculate fair value. Discounts may also be applied due to the nature or duration of any restrictions on the disposition of the investments. Due to the inherent uncertainty of valuations of such investments, the fair values may differ significantly from the values that would have been used had an active market existed. For the six-month period ended April 30, 2013, there have been no changes to the fair value methodologies.
Equity and non-equity securities which may be valued in this manner include, but are not limited to: (i) a security for which the trading has been halted or suspended; (ii) a debt security that has recently gone into default and for which there is not a current market quotation; (iii) a security of an issuer that has entered into a restructuring; (iv) a security that has been de-listed from a national exchange; (v) a security for which the market price is not available from a third party pricing source or, if so provided, does not, in the opinion of the Fund’s Manager or Subadvisor reflect the security’s market value; and (vi) a security whose principal market has been temporarily closed at a time when, under normal conditions, it would be open. Securities for which market quotations or observable inputs are not readily available are generally categorized as Level 3 in the hierarchy. As of April 30, 2013, the Fund did not hold any securities that were fair valued in such a manner.
Futures contracts are valued at the last posted settlement price on the market where such futures are primarily traded. Investments in other mutual funds are valued at their respective NAVs as of the close of the Exchange on the valuation date. These securities are generally categorized as Level 1 in the hierarchy.
Debt securities are valued at the evaluated mean prices supplied by a pricing agent or brokers selected by the Fund’s Manager in consultation with the Fund’s Subadvisor whose prices reflect broker/dealer supplied valuations and electronic data processing techniques, if such prices are deemed by the Fund’s Manager, in consultation with the Fund’s Subadvisor, to be representative of market values, at the regular close of trading of the Exchange on each valuation date. Debt securities, including corporate bonds, U.S. government and federal agency bonds, municipal bonds, foreign bonds, Yankee bonds, convertible bonds, asset-backed securities and mortgage-backed securities are generally categorized as Level 2 in the hierarchy.
Temporary cash investments acquired over 60 days to maturity are valued using the latest bid prices or using valuations based on a matrix system (which considers such factors as security prices, yields, maturities, and ratings), both as furnished by independent pricing services. Other temporary cash investments which mature in 60 days or less (“Short-Term Investments”) are valued at amortized cost. The amortized cost method involves valuing a security at its cost on the date of purchase and thereafter assuming a constant amortization to maturity of the difference between such cost and the value on maturity date. Amortized cost approximates the current fair value of a security. Securities valued at amortized cost are not valued using a quoted price in an active market. These securities are generally categorized as Level 2 in the hierarchy.
Generally, a security is considered illiquid if it cannot be sold or disposed of in the ordinary course of business at approximately the price at which it is valued. Its illiquidity might prevent the sale of such security at a time when the Manager or Subadvisor might wish to sell, and these securities could have the effect of decreasing the overall level of a Fund’s liquidity. Further, the lack of an established secondary market may make it more difficult to value illiquid securities, requiring the Fund to rely on judgments that may be somewhat subjective in determining value, which could vary from the amount that the Fund could realize upon disposition. Difficulty in selling illiquid securities may result in a loss or may be costly to the Fund. Under the supervision of the Board, the Manager or Subadvisor determines the liquidity of the Fund’s investments; in doing so, the Manager or Subadvisor may consider various factors, including (i) the frequency of trades and quotations, (ii) the number of dealers and prospective purchasers, (iii) dealer undertakings to make a market, and (iv) the nature of the security and the market in which it trades (e.g., the time needed to dispose of the security, the method of soliciting offers and the mechanics of transfer). Illiquid securities generally will be valued in good faith in such a manner as the Board deems appropriate to reflect their fair value.
(B) Income Taxes. The Fund’s policy is to comply with the requirements of the Internal Revenue Code of 1986, as amended (the “Internal Revenue Code”), applicable to regulated investment companies and to distribute all of the taxable income to the shareholders of the Fund within the allowable time limits. Therefore, no federal, state and local income tax provision is required.
Management evaluates its tax positions to determine if the tax positions taken meet the minimum recognition threshold in connection with accounting for uncertainties in income tax positions taken or expected to be taken for the purposes of measuring and recognizing tax liabilities in the financial statements. Recognition of tax benefits of an uncertain tax position is required only when the position is “more likely than not” to be sustained assuming examination by taxing authorities. Management has analyzed the Fund’s tax positions taken on federal, state and local income tax returns for all open tax years (for up to three tax years), and has concluded that no provision for federal, state and local income tax is required in the Fund’s financial statements. The Fund’s federal, state and local income and federal excise tax returns for tax years for which the applicable statutes of limitations have not expired are subject to examination by the Internal Revenue Service and state and local departments of revenue.
| | |
| 40 | | MainStay High Yield Municipal Bond Fund |
(C) Dividends and Distributions to Shareholders. Dividends and distributions are recorded on the ex-dividend date. The Fund intends to declare dividends of net investment income, if any, at least daily and intends to pay them at least monthly and declares and pays distributions of net realized capital gains, if any, at least annually. Unless the shareholder elects otherwise, all dividends and distributions are reinvested in the same class of shares of the Fund, at NAV. Dividends and distributions to shareholders are determined in accordance with federal income tax regulations and may differ from GAAP.
(D) Security Transactions and Investment Income. The Fund records security transactions on the trade date. Realized gains and losses on security transactions are determined using the identified cost method. Interest income is accrued as earned using the effective interest rate method. Discounts and premiums on securities purchased, other than Short-Term Investments, for the Fund are accreted and amortized, respectively, on the effective interest rate method over the life of the respective securities or, in the case of a callable security, over the period to the first date of call. Discounts and premiums on Short-Term Investments are accreted and amortized, respectively, on the straight-line method.
Investment income and realized and unrealized gains and losses on investments of the Fund are allocated to separate classes of shares pro rata based upon their relative net assets on the date the income is earned or realized and unrealized gains and losses are incurred.
(E) Expenses. Expenses of the Trust are allocated to the individual Funds in proportion to the net assets of the respective Funds when the expenses are incurred, except where direct allocations of expenses can be made. Expenses (other than transfer agent expenses and fees incurred under the shareholder services plans and the distribution plans further discussed in Note 3(B)) are allocated to separate classes of shares pro rata based upon their relative net assets on the date the expenses are incurred. The expenses borne by the Fund, including those of related parties to the Fund, are shown in the Statement of Operations.
(F) Use of Estimates. In preparing financial statements in conformity with GAAP, management makes estimates and assumptions that affect the reported amounts and disclosures in the financial statements. Actual results could differ from those estimates.
(G) Futures Contracts. A futures contract is an agreement to purchase or sell a specified quantity of an underlying instrument at a specified future date and price, or to make or receive a cash payment based on the value of a financial instrument (e.g., foreign currency, interest rate, security, or securities index). The Fund is subject to equity price risk and/or interest rate risk in the normal course of investing in these transactions. During the period the futures contract is open, changes in the value of the contract are recognized as unrealized appreciation or depreciation by ‘‘marking-to-market’’ such contract on a daily basis to reflect the market value of the contract at the end of each day’s trading. The Fund agrees to receive from or pay to the broker an amount of cash equal to the daily fluctuation in the value of the contract. Such receipts or payments are known as ‘‘variation margin.’’ When the futures contract is closed, the Fund records a realized gain or loss equal to the difference between the proceeds from (or cost of) the closing transaction and the Fund’s basis in the contract.
The use of futures contracts involves, to varying degrees, elements of market risk in excess of the amount recognized in the Statement of Assets and Liabilities. The contract or notional amounts and variation margin reflect the extent of the Fund’s involvement in open futures positions. Risks arise from the possible imperfect correlation in movements in the price of futures contracts, interest rates and the underlying hedged assets, and the possible inability of counterparties to meet the terms of their contracts. However, the Fund’s activities in futures contracts have minimal counterparty risk as they are conducted through regulated exchanges that guarantee the futures against default by the counterparty. In the event of a bankruptcy or insolvency of a futures commission merchant that holds margin on behalf of the Fund, the Fund may not be entitled to the return of all of the margin owed to the Fund, potentially resulting in a loss. The Fund may invest in futures contracts to help manage the duration and yield curve of the portfolio while minimizing the exposure to wider bid/ask spreads in traditional bonds. The Fund’s investment in futures contracts and other derivatives may increase the volatility of the Fund’s NAV and may result in a loss to the Fund.
(H) Securities Lending. In order to realize additional income, the Fund may engage in securities lending, subject to the limitations set forth in the 1940 Act and relevant guidance by the staff of the Securities and Exchange Commission. In the event the Fund does engage in securities lending, the Fund will lend through its custodian, State Street Bank and Trust Company (“State Street”). State Street will manage the Fund’s cash collateral in accordance with the lending agreement between the Fund and State Street, and indemnify the Fund’s portfolio against counterparty risk. The loans will be collateralized by cash or securities at least equal at all times to the market value of the securities loaned. Collateral will consist of U.S. Government securities, cash equivalents or irrevocable letters of credit. The Fund may bear the risk of delay in recovery of, or loss of rights in, the securities loaned should the borrower of the securities experience financial difficulty. The Fund may also record realized gain or loss on securities deemed sold due to a borrower’s inability to return securities on loan. The Fund will receive compensation for lending its securities in the form of fees or the retention of a portion of the interest on the investment of any cash received as collateral. The Fund also will continue to receive interest and dividends on the securities loaned and any gain or loss in the market price of the securities loaned that may occur during the term of the loan will be for the account of the Fund.
Although the Fund and New York Life Investments have temporarily suspended securities lending, the Fund and New York Life Investments reserve the right to reinstitute lending when deemed appropriate. The Fund did not have any portfolio securities on loan as of April 30, 2013.
(I) Concentration of Risk. The ability of issuers of debt securities held by the Fund to meet their obligations may be affected by economic or political developments in a specific industry or region.
(J) Indemnifications. Under the Trust’s organizational documents, its officers and trustees are indemnified against certain liabilities that may arise out of performance of their duties to the Trust. Additionally, in the normal course of business, the Fund enters into contracts with third-party service providers that contain a variety of representations and warranties and which may provide general indemnifications. The Fund’s maximum exposure under these arrangements is unknown, as this
| | | | |
| mainstayinvestments.com | | | 41 | |
Notes to Financial Statements (Unaudited) (continued)
would involve future claims that may be made against the Fund that have not yet occurred. Based on experience, management is of the view that the risk of loss in connection with these potential indemnification obligations is remote. However, there can be no assurance that material liabilities related to such obligations will not arise in the future, which could adversely impact the Fund.
(K) Quantitative Disclosure of Derivative Holdings. The following tables show additional disclosures about the Fund’s derivative and hedging activities, including how such activities are accounted for and their effect on the Fund’s financial positions, performance and cash flows. These derivatives are not accounted for as hedging instruments.
Fair value of derivatives instruments as of April 30, 2013:
Asset Derivatives
| | | | | | | | | | |
| | | Statement of
Assets and
Liabilities
Location | | Interest
Rate
Contracts
Risk | | | Total | |
Futures Contracts | | Net Assets-Net unrealized appreciation (depreciation) on investments and futures contracts (a) | | $ | (133,656 | ) | | $ | (133,656 | ) |
| | | | | | |
Total Fair Value | | | | $ | (133,656 | ) | | $ | (133,656 | ) |
| | | | | | |
| (a) | Includes cumulative appreciation (depreciation) of futures contracts as reported in the Portfolio of Investments. Only current day’s variation margin is reported within the Statement of Assets and Liabilities. |
The effect of derivative instruments on the Statement of Operations for the period ended April 30, 2013:
Number of Contracts, Notional Amounts or Shares/Units (1)
| | | | | | | | |
| | | Interest
Rate
Contracts
Risk | | | Total | |
Futures Contracts Short | | | (650 | ) | | | (650 | ) |
| | | | |
| (1) | Amount disclosed represents the weighted average held during the period ended April 30, 2013. |
Note 3–Fees and Related Party Transactions
(A) Manager and Subadvisor. New York Life Investments, a registered investment adviser and an indirect, wholly-owned subsidiary of New York Life Insurance Company (“New York Life”), serves as the Fund’s Manager, pursuant to an Amended and Restated Management Agreement (“Management Agreement”). The Manager provides offices, conducts clerical, recordkeeping and bookkeeping services, and keeps most of the financial and accounting records required to be maintained by the Fund. Except for the portion of salaries and expenses that are the responsibility of the Fund, the Manager pays the salaries and expenses of all personnel affiliated with the Fund and certain operational expenses of the Fund. The Fund reimburses New York Life Investments in an
amount equal to a portion of the salary of the Chief Compliance Officer (“CCO”) of the Fund. MacKay Shields LLC (“MacKay Shields” or the ‘‘Subadvisor’’), a registered investment adviser and an indirect, wholly-owned subsidiary of New York Life, serves as Subadvisor to the Fund and is responsible for the day-to-day portfolio management of the Fund. Pursuant to the terms of an Amended and Restated Subadvisory Agreement (“Subadvisory Agreement”) between New York Life Investments and MacKay Shields, New York Life Investments pays for the services of the Subadvisor.
The Fund pays the Manager a monthly fee for services performed and facilities furnished at an annual rate of the Fund’s average daily net assets as follows: 0.55% up to $1 billion and 0.54% in excess of $1 billion.
New York Life Investments has contractually agreed to waive fees and/or reimburse expenses so that Total Annual Fund Operating Expenses for Class A shares do not exceed 0.875% of its average daily net assets. New York Life Investments will apply an equivalent waiver or reimbursement, in an equal number of basis points, to the other share classes of the Fund. This agreement will remain in effect until February 28, 2014, and shall renew automatically for one-year terms unless New York Life Investments provides written notice of termination prior to the start of the next term or upon approval of the Board. Total Annual Fund Operating Expenses excludes taxes, interest, litigation, extraordinary expenses, brokerage and other transaction expenses relating to the purchase or sale of portfolio investments, and acquired (underlying) fund fees and expenses.
Prior to February 28, 2013, New York Life Investments contractually agreed to waive fees and/or reimburse expenses so that Total Annual Fund Operating Expenses for Class A shares did not exceed 0.85% of its average daily net assets. New York Life Investments applied an equivalent waiver or reimbursement in an equal number of basis points, to the other classes of the Fund.
For the six-month period ended April 30, 2013, New York Life Investments earned fees from the Fund in the amount of $2,931,378 and waived its fees and/or reimbursed expenses in the amount of $168,614.
State Street, 1 Lincoln Street, Boston, Massachusetts 02111, provides sub-administration and sub-accounting services to the Fund pursuant to an agreement with New York Life Investments. These services include calculating the daily NAVs of the Fund, maintaining the general ledger and sub-ledger accounts for the calculation of the Fund’s respective NAVs, and assisting New York Life Investments in conducting various aspects of the Fund’s administrative operations. For providing these services to the Fund, State Street is compensated by New York Life Investments.
(B) Distribution and Service Fees. The Trust, on behalf of the Fund, has entered into a distribution agreement with NYLIFE Distributors LLC (the ‘‘Distributor’’), an indirect, wholly-owned subsidiary of New York Life. The Fund has adopted distribution plans (the ‘‘Plans’’) in accordance with the provisions of Rule 12b-1 under the 1940 Act.
Pursuant to the Investor Class and Class A Plans, the Distributor receives a monthly distribution fee from Investor Class and Class A shares at an annual rate of 0.25% of the average daily net assets of the
| | |
| 42 | | MainStay High Yield Municipal Bond Fund |
Investor Class and Class A shares for distribution and/or service activities as designated by the Distributor. Pursuant to the Class C Plan, Class C shares pay the Distributor a monthly distribution fee at an annual rate of 0.75% of the average daily net assets of the Class C shares, along with a service fee at an annual rate of 0.25% of the average daily net assets of the Class C shares, for a total 12b-1 fee of 1.00%. Class I shares are not subject to a distribution and/or service fee.
The Plans provide that the distribution and service fees are payable to the Distributor regardless of the amounts actually expended by the Distributor for distribution of the Fund’s shares and service activities.
(C) Sales Charges. The Fund was advised by the Distributor that the amount of sales charges retained on sales of Investor Class and Class A shares were $2,916 and $98,474, respectively, for the six-month period ended April 30, 2013. The Fund was also advised that the Distributor retained CDSCs on redemptions of Class A and Class C shares of $62,740 and $35,772, respectively, for the six-month period ended April 30, 2013.
(D) Transfer, Dividend Disbursing and Shareholder Servicing Agent. NYLIM Service Company LLC, an affiliate of New York Life Investments, is the Fund’s transfer, dividend disbursing and shareholder servicing agent pursuant to an agreement between NYLIM Service Company LLC and the Trust. NYLIM Service Company LLC has entered into an agreement with Boston Financial Data Services, Inc. (“BFDS”) pursuant to which BFDS performs certain transfer agent services on behalf of NYLIM Service Company LLC. Transfer agent expenses incurred by the Fund for the six-month period ended April 30, 2013, were as follows:
| | | | |
Investor Class | | $ | 713 | |
Class A | | | 126,835 | |
Class C | | | 75,695 | |
Class I | | | 100,663 | |
(E) Small Account Fee. Shareholders with small accounts adversely impact the cost of providing transfer agency services. In an effort to reduce total transfer agency expenses, the Fund has implemented a small account fee on certain types of accounts. Certain shareholders with an account balance of less than $1,000 are charged an annual per account fee of $20 (assessed semi-annually), the proceeds from which offset transfer agent fees as reflected in the Statement of Operations.
Note 4–Federal Income Tax
The tax character of distributions paid during the year ended October 31, 2012, shown in the Statements of Changes in Net Assets was as follows:
| | | | |
| | | 2012 | |
Distributions paid from: | | | | |
Ordinary Income | | $ | 1,243,308 | |
Exempt Interest Dividends | | | 26,352,135 | |
Total | | $ | 27,595,443 | |
Note 5–Custodian
State Street is the custodian of the cash and the securities of the Fund. Custodial fees are charged to the Fund based on the market value of securities in the Fund and the number of certain cash transactions incurred by the Fund.
Note 6–Line of Credit
The Fund and certain affiliated funds maintain a line of credit with a syndicate of banks in order to secure a source of funds for temporary purposes to meet unanticipated or excessive redemption requests.
Effective August 29, 2012, under a second amended and restated credit agreement (the “Credit Agreement”), the aggregate commitment amount is $200,000,000 with an optional maximum amount of $250,000,000. The commitment fee is an annual rate of 0.08% of the average commitment amount payable quarterly, regardless of usage, to Bank of New York Mellon, which serves as the agent to the syndicate. The commitment fee is allocated among the Fund and certain affiliated funds based upon net assets and other factors. Interest on any revolving credit loan is charged based upon the Federal Funds Advances rate or the one month London InterBank Offered Rate, whichever is higher. The Credit Agreement expires on August 28, 2013, although the Fund, certain affiliated funds and the syndicate of banks may renew the Credit Agreement for an additional year on the same or different terms. There were no borrowings made or outstanding with respect to the Fund on the Credit Agreement during the six-month period ended April 30, 2013.
Note 7–Purchases and Sales of Securities (in 000’s)
During the six-month period ended April 30, 2013, purchases and sales of securities, other than short-term securities, were $515,273 and $448,168, respectively.
| | | | |
| mainstayinvestments.com | | | 43 | |
Notes to Financial Statements (Unaudited) (continued)
Note 8–Capital Share Transactions
| | | | | | | | |
Investor Class | | Shares | | | Amount | |
Six-month period ended April 30, 2013: | | | | | | | | |
Shares sold | | | 67,007 | | | $ | 806,738 | |
Shares issued to shareholders in reinvestment of dividends and distributions | | | 4,081 | | | | 49,225 | |
Shares redeemed | | | (10,773 | ) | | | (129,678 | ) |
| | | | |
Net increase (decrease) in shares outstanding before conversion | | | 60,315 | | | | 726,285 | |
Shares converted into Investor Class (See Note 1) | | | 6,760 | | | | 81,257 | |
Shares converted from Investor Class (See Note 1) | | | (24,526 | ) | | | (293,380 | ) |
| | | | |
Net increase (decrease) | | | 42,549 | | | $ | 514,162 | |
| | | | |
Year ended October 31, 2012: | | | | | | | | |
Shares sold | | | 168,686 | | | $ | 1,914,878 | |
Shares issued to shareholders in reinvestment of dividends | | | 5,590 | | | | 63,654 | |
Shares redeemed | | | (36,778 | ) | | | (418,446 | ) |
| | | | |
Net increase (decrease) in shares outstanding before conversion | | | 137,498 | | | | 1,560,086 | |
Shares converted into Investor Class (See Note 1) | | | 9,396 | | | | 108,509 | |
Shares converted from Investor Class (See Note 1) | | | (80,732 | ) | | | (926,709 | ) |
| | | | |
Net increase (decrease) | | | 66,162 | | | $ | 741,886 | |
| | | | |
| | |
| | | | | | | | |
Class A | | Shares | | | Amount | |
Six-month period ended April 30, 2013: | | | | | | | | |
Shares sold | | | 8,971,274 | | | $ | 108,080,007 | |
Shares issued to shareholders in reinvestment of dividends and distributions | | | 680,279 | | | | 8,214,823 | |
Shares redeemed | | | (13,015,746 | ) | | | (156,281,013 | ) |
| | | | |
Net increase (decrease) in shares outstanding before conversion | | | (3,364,193 | ) | | | (39,986,183 | ) |
Shares converted into Class A (See Note 1) | | | 24,485 | | | | 293,380 | |
Shares converted from Class A (See Note 1) | | | (6,749 | ) | | | (81,257 | ) |
| | | | |
Net increase (decrease) | | | (3,346,457 | ) | | $ | (39,774,060 | ) |
| | | | |
Year ended October 31, 2012: | | | | | | | | |
Shares sold | | | 35,527,707 | | | $ | 402,633,010 | |
Shares issued to shareholders in reinvestment of dividends | | | 834,193 | | | | 9,546,677 | |
Shares redeemed | | | (9,522,150 | ) | | | (108,475,009 | ) |
| | | | |
Net increase (decrease) in shares outstanding before conversion | | | 26,839,750 | | | | 303,704,678 | |
Shares converted into Class A (See Note 1) | | | 80,650 | | | | 926,709 | |
Shares converted from Class A (See Note 1) | | | (9,387 | ) | | | (108,509 | ) |
| | | | |
Net increase (decrease) | | | 26,911,013 | | | $ | 304,522,878 | |
| | | | |
| | | | | | | | |
Class C | | Shares | | | Amount | |
Six-month period ended April 30, 2013: | | | | | | | | |
Shares sold | | | 3,623,565 | | | $ | 43,561,622 | |
Shares issued to shareholders in reinvestment of dividends and distributions | | | 246,122 | | | | 2,965,328 | |
Shares redeemed | | | (1,885,368 | ) | | | (22,662,987 | ) |
| | | | |
Net increase (decrease) | | | 1,984,319 | | | $ | 23,863,963 | |
| | | | |
Year ended October 31, 2012: | | | | | | | | |
Shares sold | | | 14,346,472 | | | $ | 162,599,673 | |
Shares issued to shareholders in reinvestment of dividends | | | 235,715 | | | | 2,707,769 | |
Shares redeemed | | | (970,105 | ) | | | (11,178,175 | ) |
| | | | |
Net increase (decrease) | | | 13,612,082 | | | $ | 154,129,267 | |
| | | | |
| | |
| | | | | | | | |
Class I | | Shares | | | Amount | |
Six-month period ended April 30, 2013: | | | | | | | | |
Shares sold | | | 13,391,558 | | | $ | 161,344,817 | |
Shares issued to shareholders in reinvestment of dividends and distributions | | | 486,932 | | | | 5,881,771 | |
Shares redeemed | | | (8,018,954 | ) | | | (96,586,404 | ) |
| | | | |
Net increase (decrease) | | | 5,859,536 | | | $ | 70,640,184 | |
| | | | |
Year ended October 31, 2012: | | | | | | | | |
Shares sold | | | 27,054,577 | | | $ | 307,238,907 | |
Shares issued to shareholders in reinvestment of dividends | | | 414,765 | | | | 4,798,187 | |
Shares redeemed | | | (6,171,160 | ) | | | (70,732,785 | ) |
| | | | |
Net increase (decrease) | | | 21,298,182 | | | $ | 241,304,309 | |
| | | | |
Note 9–Subsequent Events
In connection with the preparation of the financial statements of the Fund as of and for the six-month period ended April 30, 2013, events and transactions subsequent to April 30, 2013, through the date the financial statements were issued have been evaluated by the Fund’s management for possible adjustment and/or disclosure. No subsequent events requiring financial statement adjustment or disclosure have been identified.
| | |
| 44 | | MainStay High Yield Municipal Bond Fund |
Board Consideration and Approval of Management Agreement and
Subadvisory Agreement (Unaudited)
Section 15(c) of the Investment Company Act of 1940, as amended (the “1940 Act”) requires that each mutual fund’s board of trustees, including a majority of the independent trustees, annually review and approve the fund’s investment advisory agreements. At its December 10-12, 2012 meeting, the Board of Trustees of the MainStay Group of Funds (“Board”) unanimously approved the Management Agreement with respect to the MainStay High Yield Municipal Bond Fund (“Fund”) and New York Life Investment Management LLC (“New York Life Investments”), and the Subadvisory Agreement between New York Life Investments and MacKay Shields LLC (“MacKay Shields”) with respect to the Fund.
In reaching its decision to approve the Agreements, the Board considered information furnished by New York Life Investments and MacKay Shields in connection with a contract review process that took place at various meetings of the Board and its Contracts Committee between September 2012 and December 2012, as well as other relevant information furnished to the Board throughout the year by New York Life Investments and MacKay Shields. Information requested by and furnished to the Board in connection with the contract review process included, among other items, reports on the Fund prepared by Strategic Insight Mutual Fund Research and Consulting, LLC (“Strategic Insight”), an independent third-party service provider engaged by the Board to report objectively on the Fund’s investment performance, management and subadvisory fees and ordinary operating expenses. The Board also considered information provided by New York Life Investments and MacKay Shields on the fees charged to other investment advisory clients (including institutional separate accounts) that follow investment strategies similar to the Fund, and the rationale for any differences in the Fund’s management and subadvisory fees and the fees charged to those other investment advisory clients. In addition, the Board requested and received information on the profitability of the Fund to New York Life Investments and its affiliates, including MacKay Shields as subadvisor to the Fund, and responses from New York Life Investments and MacKay Shields to a series of questions encompassing a variety of topics prepared on behalf of the Board by independent legal counsel to the Board and its independent trustees (the “Independent Trustees”). Information provided to the Board at its meetings throughout the year included, among other items, detailed investment performance reports on the Fund prepared by the Investment Consulting Group at New York Life Investments. The structure and format for this regular reporting was developed in consultation with the Board. The Board also received from New York Life Investments throughout the year, among other items, periodic reports on legal and compliance matters, portfolio turnover, and sales and marketing activity.
In determining to approve the Agreements, the members of the Board reviewed and evaluated all of the information and factors they believed to be relevant and appropriate in light of legal advice furnished to them by independent legal counsel and through the exercise of their own business judgment. The broad factors considered by the Board are discussed in greater detail below, and included, among other items: (i) the nature, scope and quality of the services provided to the Fund by New York Life Investments and MacKay Shields; (ii) the investment performance of the Fund, New York Life Investments and MacKay Shields; (iii) the costs of the services provided, and profits realized, by New York Life Investments and MacKay Shields from their relationship with the Fund; (iv) the extent to which economies of scale may be
realized as the Fund grows, and the extent to which economies of scale may benefit Fund investors; and (v) the reasonableness of the Fund’s management and subadvisory fees and overall total ordinary operating expenses, particularly as compared to similar funds and accounts managed by New York Life Investments and MacKay Shields and third-party “peer funds” identified by Strategic Insight.
While individual members of the Board may have weighed certain factors differently, the Board’s decision to approve the Agreements was based on a consideration of all the information provided to the Board, including information provided to the Board throughout the year and specifically in connection with the contract review process. The Board’s conclusions with respect to the Agreements also were based, in part, on the Board’s consideration of the Agreements in prior years. In addition to considering the above-referenced factors, the Board observed that in the marketplace there are a range of investment options available to shareholders of the Fund, and that the Fund’s shareholders, having had the opportunity to consider other investment options, have chosen to invest in the Fund. A more detailed discussion of the factors that figured prominently in the Board’s decisions to approve the Agreements is provided below.
Nature, Scope and Quality of Services to Be Provided by New York Life Investments and MacKay Shields
The Board examined the nature, scope and quality of the services that New York Life Investments provides to the Fund. The Board evaluated New York Life Investments’ experience in serving as manager of the Fund, noting that New York Life Investments manages other mutual funds, serves a variety of other investment advisory clients, including other pooled investment vehicles, and has experience with overseeing mutual fund service providers, including subadvisors. The Board considered the experience of senior personnel at New York Life Investments providing management and administrative services to the Fund, as well as New York Life Investments’ reputation and financial condition. The Board also considered the full range of non-advisory services that New York Life Investments supplies to the Fund under the terms of the Management Agreement, including: (i) fund accounting services provided by New York Life Investments’ Fund Accounting and Administration Group; (ii) investment oversight and analytical services provided by New York Life Investments’ Investment Consulting Group; (iii) compliance services provided by New York Life Investments’ compliance department, including oversight and implementation of the Fund’s compliance program; and (iv) legal services provided by New York Life Investments’ Office of the General Counsel. Additional information about the non-advisory services provided by New York Life Investments is set forth in the Fund’s Management Agreement. The Board also considered New York Life Investments’ willingness to invest in personnel that benefit the Fund, and noted that New York Life Investments is responsible for compensating the Fund’s officers. The Board also considered benefits to shareholders of being part of the MainStay Group of Funds, including the privilege of exchanging investments between the same class of shares without the imposition of a sales charge, as described more fully in the Fund’s prospectus.
The Board also examined the nature, scope and quality of the advisory services that MacKay Shields provides to the Fund. The Board evaluated MacKay Shields’ experience in serving as subadvisor to the Fund and managing other portfolios. It examined MacKay Shields’ track record
| | | | |
| mainstayinvestments.com | | | 45 | |
Board Consideration and Approval of Management Agreement and
Subadvisory Agreement (Unaudited) (continued)
and experience in providing investment advisory services, the experience of investment advisory, senior management and administrative personnel at MacKay Shields, and MacKay Shields’ overall legal and compliance environment. The Board also reviewed MacKay Shields’ willingness to invest in personnel that benefit the Fund. In this regard, the Board considered the experience of the Fund’s portfolio managers, the number of accounts managed by the portfolio managers and the method for compensating portfolio managers.
Based on these considerations, the Board concluded, within the context of its overall determinations regarding the Agreements, that the Fund should continue to benefit from the nature, scope and quality of these services as a result of New York Life Investments’ and MacKay Shields’ experience, personnel, operations and resources.
Investment Performance
In evaluating the Fund’s investment performance, the Board considered investment performance results in light of the Fund’s investment objective, strategies and risks, as disclosed in the Fund’s prospectus. The Board particularly considered detailed investment reports on the Fund’s performance provided to the Board throughout the year by the Investment Consulting Group of New York Life Investments. These reports include, among other items, information on the Fund’s gross and net returns, the Fund’s investment performance relative to relevant investment categories and Fund benchmarks, the Fund’s risk-adjusted investment performance, and the Fund’s investment performance as compared to similar competitor funds, as appropriate. The Board also considered information provided by Strategic Insight showing the investment performance of the Fund as compared to peer funds.
In evaluating the performance of the Fund, the Board considered that the Fund had not been in operation for a sufficient time period to establish a meaningful investment performance track record. In addition, the Board considered any specific actions that New York Life Investments or MacKay Shields had taken, or had agreed with the Board to take, to enhance Fund investment performance, and the results of those actions. The Board noted favorably the Fund’s strong investment performance as compared to its peers since the Fund’s inception.
Based on these considerations, the Board concluded, within the context of its overall determinations regarding the Agreements, that the long-term investment performance of the Fund, along with ongoing efforts by New York Life Investments and MacKay Shields to enhance investment returns, supported a determination to approve the Agreements. The Fund discloses more information about investment performance in the Portfolio Management Discussion and Analysis, Investment and Performance Comparison and Financial Highlights sections of this Semiannual Report and in the Fund’s prospectus.
Costs of the Services Provided, and Profits Realized, by New York Life Investments and MacKay Shields
The Board considered the costs of the services provided by New York Life Investments and MacKay Shields under the Agreements, and the profits realized by New York Life Investments and its affiliates, including MacKay Shields, due to their relationships with the Fund. Because MacKay Shields is an affiliate of New York Life Investments whose subadvisory fees are paid directly by New York Life Investments, the
Board considered cost and profitability information for New York Life Investments and MacKay Shields in the aggregate.
In evaluating the costs and profits of New York Life Investments and its affiliates, including MacKay Shields, the Board considered, among other factors, each party’s investments in personnel, systems, equipment and other resources necessary to manage the Fund, and that New York Life Investments is responsible for paying the subadvisory fees for the Fund. The Board acknowledged that New York Life Investments and MacKay Shields must be in a position to pay and retain experienced professional personnel to provide services to the Fund, and that the ability to maintain a strong financial position is important in order for New York Life Investments and MacKay Shields to continue to provide high-quality services to the Fund. The Board also noted that the Fund benefits from the allocation of certain fixed costs across the MainStay Group of Funds.
In addition, the Board noted the difficulty in obtaining reliable comparative data about mutual fund managers’ profitability, since such information generally is not publicly available and may be impacted by numerous factors, including the structure of a fund manager’s organization, the types of funds it manages, the methodology used to allocate certain fixed costs to specific funds, and the manager’s capital structure and costs of capital. While recognizing the difficulty in evaluating a manager’s profitability with respect to the Fund, and noting that other profitability methodologies may also be reasonable, the Board concluded that the profitability methodology presented by New York Life Investments to the Board, which was developed by New York Life Investments in consultation with an independent consultant, was reasonable in all material respects.
In considering the costs and profitability of the Fund, the Board also considered certain fall-out benefits that may be realized by New York Life Investments and its affiliates due to their relationships with the Fund.
The Board further considered that, in addition to fees earned by New York Life Investments for managing the Fund, New York Life Investments’ affiliates also earn revenues from serving the Fund in various other capacities, including as the Fund’s transfer agent and distributor. The Board observed that information about these other revenues, and their impact on the profitability of the Fund to New York Life Investments and its affiliates, was furnished to the Board as part of the 15(c) process. The Board noted that, although it assessed the overall profitability of the Fund to New York Life Investments and its affiliates as part of the contract review process, when considering the reasonableness of the fees to be paid to New York Life Investments and its affiliates under the Agreements, the Board considered the profitability of New York Life Investments’ relationship with the Fund on a pre-tax basis, and without regard to distribution expenses.
After evaluating the information presented to the Board, the Board concluded, within the context of its overall determinations regarding the Agreements, that any profits realized by New York Life Investments and its affiliates, including MacKay Shields, due to their relationships with the Fund supported the Board’s decision to approve the Agreements.
Extent to Which Economies of Scale May Be Realized as the Fund Grows
The Board also considered whether the Fund’s expense structure permitted economies of scale to be shared with Fund investors. The
| | |
| 46 | | MainStay High Yield Municipal Bond Fund |
Board reviewed information from New York Life Investments showing how the Fund’s management fee schedule compared to fee schedules of other funds and accounts managed by New York Life Investments. The Board also reviewed information from Strategic Insight showing how the Fund’s management fee schedule hypothetically would compare with fees paid for similar services by peer funds at varying asset levels. While recognizing the difficulty of determining economies of scale with precision, the Board acknowledged that economies of scale may be shared with the Fund in a number of ways, including, for example, through the imposition of management fee breakpoints and by initially setting relatively lower management fees.
Based on this information, the Board concluded, within the context of its overall determinations regarding the Agreements, that the Fund’s expense structure appropriately reflects economies of scale for the benefit of Fund investors. The Board noted, however, that it would continue to evaluate the reasonableness of the Fund’s expense structure as the Fund grows over time.
Management and Subadvisory Fees and Total Ordinary Operating Expenses
The Board evaluated the reasonableness of the fees to be paid under the Agreements and the Fund’s expected total ordinary operating expenses. The Board primarily considered the reasonableness of the management fee paid by the Fund to New York Life Investments, since the fees paid to MacKay Shields are paid by New York Life Investments, not the Fund.
In assessing the reasonableness of the Fund’s fees and expenses, the Board primarily considered comparative data provided by Strategic Insight on the fees and expenses charged by similar mutual funds managed by other investment advisers. In addition, the Board considered information provided by New York Life Investments and MacKay Shields on fees charged to other investment advisory clients, including institutional separate accounts and other funds with similar investment objectives as the Fund. The Board particularly considered differences in the contractual management fee schedules of the retail MainStay Funds and similarly-managed MainStay VP Portfolios, taking into account New York Life Investments’ rationale for any differences in fee schedules. The Board also took into account explanations provided by New York Life Investments about the different scope of services provided to mutual funds as compared with other investment advisory clients. Additionally, the Board considered the impact of any expense limitation arrangements on the Fund’s net management fee and expenses. In addition, the Board considered and approved New York Life Investments’ proposal to modify the Fund’s contractual expense limitation arrangements to reduce the subsidization by New York Life Investments of the Fund’s expenses, noting that the Fund’s management fee and total expenses would be reasonable under the revised expense limitation arrangements. The Board also noted that New York Life Investments had agreed to add a new management fee breakpoint for the Fund.
The Board noted that, outside of the Fund’s management fee and the fees charged under a share class’s Rule 12b-1 and/or shareholder services plans, a share class’s most significant “other expenses” are transfer agent fees. Transfer agent fees are charged to the Fund based on the number of shareholder accounts (a “per-account” fee) as
compared with certain other fees (e.g., management fees), which are charged based on the Fund’s average net assets. The Board took into account information from New York Life Investments showing that the Fund’s transfer agent fee schedule is reasonable, including industry data showing that the per-account fees that NYLIM Service Company LLC, the Fund’s transfer agent, charges the Fund are within the range of per-account fees charged by transfer agents to other mutual funds. In addition, the Board considered NYLIM Service Company LLC’s profitability in connection with the transfer agent services it provides to the Fund.
The Board acknowledged that, because the Fund’s transfer agent fees are billed on a per-account basis, the impact of transfer agent fees on a share class’s expense ratio may be more significant in cases where the share class has a high number of accounts with limited assets (i.e., small accounts). The Board observed that transfer agent fees are a significant portion of total expenses of many Funds in the MainStay Group of Funds. The impact of transfer agent fees on the expense ratios of these MainStay Funds tend to be greater than for other open-end retail funds, because the MainStay Group of Funds generally has a significant number of small accounts relative to competitor funds. The Board acknowledged the role that the MainStay Group of Funds historically has played in serving the investment needs of New York Life Insurance Company (“New York Life”) policyholders, who often maintain smaller account balances than other fund investors. The Board discussed measures that it and New York Life Investments have taken in recent years to mitigate the effect of small accounts on the expense ratios of Fund share classes, including: (i) encouraging New York Life agents to consolidate multiple small accounts held by the same investor into one MainStay Asset Allocation Fund account; (ii) increasing investment minimums from $500 to $1,000 in 2003; (iii) introducing Investor Class shares for certain MainStay Funds in early 2008 to consolidate smaller account investors; (iv) closing small accounts with balances below $250 in Investor Class shares or $750 in all other classes of shares; (v) no longer allowing an exception with no minimum investment amount with respect to AutoInvest accounts with subsequent monthly purchases of $100; (vi) since 2007, charging an annual $20.00 small account fee on certain accounts with balances below $1,000; and (vii) modifying the approach for billing transfer agent expenses to reduce the degree of subsidization by large accounts of smaller accounts. In addition, the Board acknowledged New York Life Investments’ efforts to encourage intermediaries to consolidate small accounts in multiple Funds held by the same investor into a single Asset Allocation Fund account, if appropriate under the circumstances, in an effort to mitigate the effect of small accounts on the Funds in the MainStay Group of Funds.
After considering all of the factors outlined above, the Board concluded that the Fund’s management and subadvisory fees and total ordinary operating expenses were within a range that is competitive and, within the context of the Board’s overall conclusions regarding the Agreements, support a conclusion that these fees and expenses are reasonable.
Conclusion
On the basis of the information provided to it and its evaluation thereof, the Board, including the Independent Trustees, unanimously voted to approve the Agreements.
| | | | |
| mainstayinvestments.com | | | 47 | |
Proxy Voting Policies and Procedures and Proxy Voting Record
A description of the policies and procedures that New York Life Investments uses to vote proxies related to the Fund’s securities is available without charge, upon request, (i) by visiting the Fund’s website at mainstayinvestments.com; or (ii) on the SEC’s website at www.sec.gov.
The Fund is required to file with the SEC its proxy voting record for the 12-month period ending June 30 on Form N-PX. The Fund’s most recent Form N-PX, once it is filed, will be available free of charge upon request (i) by calling 800-MAINSTAY (624-6782); (ii) by visiting the Fund’s website at mainstayinvestments.com; or (iii) on the SEC’s website at www.sec.gov.
Shareholder Reports and Quarterly Portfolio Disclosure
The Fund is required to file its complete schedule of portfolio holdings with the SEC for its first and third fiscal quarters on Form N-Q. The Fund’s Form N-Q will be available without charge on the SEC’s website at www.sec.gov or by calling MainStay Investments at 800-MAINSTAY (624-6782). You also can obtain and review copies of Form N-Q by visiting the SEC’s Public Reference Room in Washington, DC (information on the operation of the Public Reference Room may be obtained by calling 1-800-SEC-0330).
| | |
| 48 | | MainStay High Yield Municipal Bond Fund |
This page intentionally left blank
This page intentionally left blank
MainStay Funds
MainStay offers a wide range of Funds for virtually any investment need. The full array of MainStay open-end offerings is listed here, with information about the manager, subadvisors, legal counsel and independent registered public accounting firms.
Equity
U.S. Equity Funds
MainStay Common Stock Fund
MainStay Cornerstone Growth Fund
MainStay Epoch U.S. All Cap Fund
MainStay Epoch U.S. Equity Yield Fund
MainStay ICAP Equity Fund
MainStay ICAP Select Equity Fund
MainStay Large Cap Growth Fund1
MainStay MAP Fund
MainStay S&P 500 Index Fund
MainStay U.S. Equity Opportunities Fund
MainStay U.S. Small Cap Fund
International/Global Equity Funds
MainStay Epoch Global Choice Fund
MainStay Epoch Global Equity Yield Fund
MainStay Epoch International Small Cap Fund
MainStay ICAP Global Fund
MainStay ICAP International Fund
MainStay International Equity Fund
MainStay International Opportunities Fund
Income
Taxable Bond Funds
MainStay Floating Rate Fund
MainStay Global High Income Fund
MainStay Government Fund
MainStay High Yield Corporate Bond Fund
MainStay High Yield Opportunities Fund
MainStay Indexed Bond Fund
MainStay Intermediate Term Bond Fund
MainStay Short Duration High Yield Fund
MainStay Short Term Bond Fund
MainStay Unconstrained Bond Fund
Municipal Bond Funds
MainStay California Tax Free Opportunities Fund2
MainStay High Yield Municipal Bond Fund
MainStay New York Tax Free Opportunities Fund3
MainStay Tax Free Bond Fund
Money Market Fund
MainStay Money Market Fund
Mixed Asset
MainStay Balanced Fund
MainStay Convertible Fund
MainStay Income Builder Fund
MainStay Marketfield Fund
Asset Allocation/Target Date
MainStay Conservative Allocation Fund
MainStay Growth Allocation Fund
MainStay Moderate Allocation Fund
MainStay Moderate Growth Allocation Fund
MainStay Retirement 2010 Fund
MainStay Retirement 2020 Fund
MainStay Retirement 2030 Fund
MainStay Retirement 2040 Fund
MainStay Retirement 2050 Fund
Manager
New York Life Investment Management LLC
New York, New York
Subadvisors
Cornerstone Capital Management Holdings LLC4
New York, New York
Cornerstone Capital Management LLC4
Bloomington, Minnesota
Epoch Investment Partners, Inc.
New York, New York
Institutional Capital LLC4
Chicago, Illinois
MacKay Shields LLC4
New York, New York
Marketfield Asset Management LLC
New York, New York
Markston International LLC
White Plains, New York
Winslow Capital Management LLC
Minneapolis, Minnesota
Legal Counsel
Dechert LLP
Independent Registered Public Accounting Firms
KPMG LLP
PricewaterhouseCoopers LLP
1. Effective January 13, 2012, the Fund was closed to new investors with certain exceptions.
2. This Fund is only registered for sale in AZ, CA, NV, OR, UT, and WA.
3. This Fund is only registered for sale in CT, DE, FL, MA, NJ, NY, and VT.
4. An affiliate of New York Life Investment Management LLC.
Not part of the Semiannual Report
For more information
800-MAINSTAY (624-6782)
mainstayinvestments.com
The MainStay Funds® are managed by New York Life Investment Management LLC and distributed through NYLIFE Distributors LLC, 169 Lackawanna Avenue, Parsippany, NJ 07054, a wholly owned subsidiary of New York Life Insurance Company. NYLIFE Distributors LLC is a Member FINRA/SIPC.
MainStay Investments® is a registered service mark and name under which New York Life Investment Management LLC does business. MainStay Investments, an indirect subsidiary of New York Life Insurance Company, New York, NY 10010, provides investment advisory products and services.
This report may be distributed only when preceded or accompanied by a current Fund prospectus.
©2013 NYLIFE Distributors LLC. All rights reserved.
| | | | | | | | |
| Not FDIC/NCUA Insured | | Not a Deposit | | May Lose Value | | No Bank Guarantee | | Not Insured by Any Government Agency |
| | |
| NYLIM-30096 MS175-13 | | MSMHY10-06/13 NL0F5 |
MainStay ICAP Funds
Message from the President and Semiannual Report
Unaudited | April 30, 2013

MainStay ICAP Equity Fund
MainStay ICAP Select Equity Fund
MainStay ICAP Global Fund
MainStay ICAP International Fund

This page intentionally left blank
Message from the President
The U.S. stock market advanced during the six months ended April 30, 2013, generally providing double-digit returns at all capitalization levels. Value stocks tended to outpace growth stocks among large- and mid-capitalization companies, while growth stocks tended to outpace value stocks among smaller companies.
The market’s advance, however, was far from uniform. Stocks declined in early November, both before and immediately after the U.S. presidential election. Following a sharp recovery, stocks climbed until mid-December, when a Congressional stalemate on the fiscal cliff led to a brief decline. Another dip occurred in late February as investors speculated that the Federal Open Market Committee (FOMC) might stop purchasing mortgage-backed securities sooner than expected. Stocks also dipped in mid-April, as consumer sentiment dropped after the Boston marathon bombing. Despite these setbacks, U.S. stocks continued to trend upward during the six-month reporting period.
International stock markets also advanced, with several regional differences. Accommodative action by the Bank of Japan helped lower the yen and lift Japanese stocks to their highest levels since 2008. In Europe, stocks did well until early February, bolstered by the promise of support for the euro. As the year progressed, however, economic contraction, rising unemployment and systematic banking concerns took a toll on investor enthusiasm. In China, manufacturing slowed as the nation sought to balance growth and inflation risks. On the Korean peninsula, tensions rose as North Korea continued to threaten its neighbors, which added an undercurrent of caution to the market.
During the six months ended April 30, 2013, the FOMC kept the federal funds rate in a range close to zero. The FOMC also continued its direct purchases of mortgage-backed securities and longer-term U.S. government securities. With short-term interest rates likely to remain at low levels, many bond investors pursued higher yields by lengthening maturities and assuming greater risk. As a result, bonds with higher risk profiles tended
to outperform higher-quality investment-grade bonds and U.S. Treasury securities. Cash and cash equivalents essentially returned zero.
With wide variations in the performance of various asset classes, some investors might be tempted to chase higher returns by shifting back and forth between stocks and bonds. Since no one can predict where the market will move next, however, we encourage investors to select an appropriate mix of investments for their risk tolerance and time horizon and to stick with that mix, making only minor adjustments over time.
At MainStay Funds, our portfolio managers use a similar approach. Careful security selection and thoughtful sell disciplines help them pursue the investment objectives of their respective Funds. Using the principal investment strategies outlined in the Prospectus, they focus primarily on providing long-term investment potential for our shareholders.
Has this approach proved successful? In its most recent rankings, Barron’s listed MainStay Funds as the #1 fund family over the past 10 years. We were also the only mutual fund family that has appeared in Barron’s top six for the past five consecutive years.
The pages that follow provide additional insight into the specific market events, investment decisions and securities that shaped your MainStay Fund(s) during the six months ended April 30, 2013. We encourage you to read the semiannual report(s) carefully and to evaluate your results with your long-term financial goals in mind.
Sincerely,

Stephen P. Fisher
President
The opinions expressed are as of the date of this report and are subject to change. There is no guarantee that any forecast made will come to pass. This material does not constitute investment advice and is not intended as an endorsement of any specific investment.
To qualify for the Lipper/Barron’s Fund Survey, a fund family must have at least three funds in Lipper’s general U.S.-stock category, one in world equity (which combines global and international funds), one mixed-equity fund (which holds stocks and bonds), two taxable-bond funds, and one tax-exempt fund. Fund loads and 12b-1 fees aren’t included in the calculation of returns because the aim is to measure the manager’s skill. Each fund’s return is measured against all funds in its Lipper category, resulting in a percentile ranking which is then weighted by asset size relative to the fund family’s other assets in its general classifications. Finally, the score is multiplied by the general classification weightings as determined by the entire Lipper universe of funds.
Source: Barron’s, 2/9/13. Overall, MainStay Funds ranked number 56 for the one-year period, 20 for the five-year period and one for the 10-year period ended December 31, 2012, out of 62, 53 and 46 fund families, respectively. MainStay ranked number three for the 10-year period in 2009, 2010 and 2011 from among 48, 46 and 45 fund families, respectively. MainStay ranked number six from among 48 fund families for the 10-year period in 2008. Past performance is no guarantee of future results, which will vary. For the most recent MainStay Funds performance, please visit our website at mainstayinvestments.com. All mutual funds are subject to market risk and will fluctuate in value.
Not part of the Semiannual Report
Table of Contents
Investors should refer to each Fund’s Summary Prospectus and/or Prospectus and consider each Fund’s investment objectives, strategies, risks, charges and expenses carefully before investing. The Summary Prospectus and/or Prospectus contain this and other information about each Fund. You may obtain copies of each Fund’s Summary Prospectus, Prospectus and Statement of Additional Information free of charge, upon request, by calling toll-free 800-MAINSTAY (624-6782), by writing to NYLIFE Distributors LLC, Attn: MainStay Marketing Department, 169 Lackawanna Avenue, Parsippany, New Jersey 07054 or by sending an e-mail to MainStayShareholderServices@nylim.com. These documents are also available via the MainStay Funds’ website at mainstayinvestments.com/documents. Please read each Summary Prospectus and/or Prospectus carefully before investing.
MainStay ICAP Equity Fund
Investment and Performance Comparison1 (Unaudited)
Performance data quoted represents past performance. Past performance is no guarantee of future results. Because of market volatility, current performance may be lower or higher than the figures shown. Investment return and principal value will fluctuate, and as a result, when shares are redeemed, they may be worth more or less than their original cost. The graph below depicts the historical performance of Class I shares of the Fund. Performance will vary from class to class based on differences in class-specific expenses and sales charges. For performance information current to the most recent month-end, please call 800-MAINSTAY (624-6782) or visit mainstayinvestments.com.
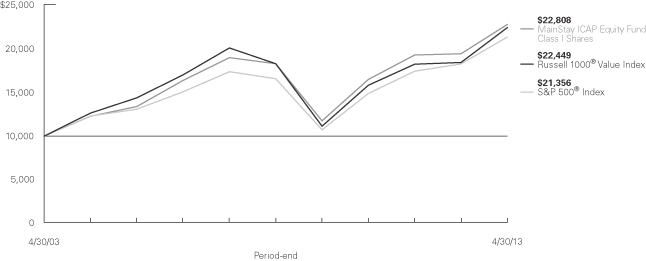
Average Annual Total Returns for the Period Ended April 30, 2013
| | | | | | | | | | | | | | | | | | | | | | | | |
| Class | | Sales Charge | | | | Six Months | | | One Year | | | Five Years | | | Ten Years | | | Gross
Expense
Ratio2 | |
| Investor Class Shares3 | | Maximum 5.5% Initial Sales Charge | | With sales charges Excluding sales charges | |
| 8.62
14.94 | %
| |
| 10.33
16.75 | %
| |
| 2.78
3.95 | %
| |
| 7.54
8.15 | %
| |
| 1.43
1.43 | %
|
| Class A Shares4 | | Maximum 5.5% Initial Sales Charge | | With sales charges Excluding sales charges | |
| 8.74
15.07 |
| |
| 10.59
17.03 |
| |
| 3.01
4.19 |
| |
| 7.67
8.28 |
| |
| 1.17
1.17 |
|
| Class C Shares4 | | Maximum 1% CDSC
if Redeemed Within One Year of Purchase | | With sales charges Excluding sales charges | |
| 13.51
14.51 |
| |
| 14.86
15.86 |
| |
| 3.17
3.17 |
| |
| 7.34
7.34 |
| |
| 2.18
2.18 |
|
| Class I Shares | | No Sales Charge | | | | | 15.23 | | | | 17.35 | | �� | | 4.50 | | | | 8.59 | | | | 0.92 | |
| Class R1 Shares4 | | No Sales Charge | | | | | 15.17 | | | | 17.27 | | | | 4.40 | | | | 8.49 | | | | 1.02 | |
| Class R2 Shares4 | | No Sales Charge | | | | | 14.99 | | | | 16.91 | | | | 4.12 | | | | 8.21 | | | | 1.27 | |
| Class R3 Shares4 | | No Sales Charge | | | | | 14.85 | | | | 16.64 | | | | 3.87 | | | | 7.94 | | | | 1.52 | |
| 1. | The performance table and graph do not reflect the deduction of taxes that a shareholder would pay on distributions or Fund share redemptions. Total returns reflect maximum applicable sales charges as indicated in the table above, changes in share price, and reinvestment of dividend and capital gain distributions. The graph assumes the initial investment amount shown above and reflects the deduction of all sales charges that would have applied for the period of investment. Performance figures reflect certain fee waivers and/or expense limitations, without which total returns may have been lower. For more information on share classes and current fee waivers and/or expense limitations, please refer to the notes to the financial statements. Effective August 31, 2006, ICAP Equity Fund was renamed MainStay ICAP Equity Fund. At that time, the Fund’s existing no-load shares were redesignated as Class I shares. |
| 2. | The gross expense ratios presented reflect the Fund’s “Total Annual Fund Operating Expenses” from the most recent Prospectus and may differ from other expense ratios disclosed in this report. |
| 3. | Performance figures for Investor Class shares, first offered on April 29, 2008, include the historical performance of Class A shares through April 28, 2008, adjusted for differences in certain expenses and fees. Unadjusted, the performance shown for Investor Class shares would likely have been different. |
| 4. | Performance figures for Class A, C, R1, R2 and R3 shares, first offered on September 1, 2006, include the historical performance of Class I shares through August 31, 2006, adjusted for differences in certain expenses and fees. Unadjusted, the performance for these share classes would likely have been different. |
The footnotes on the next page are an integral part of the table and graph and should be carefully read in conjunction with them.
| | | | |
| mainstayinvestments.com | | | 5 | |
| | | | | | | | | | | | | | | | |
| Benchmark Performance | | Six
Months | | | One
Year | | | Five
Years | | | Ten
Years | |
Russell 1000® Value Index5 | | | 16.31 | % | | | 21.80 | % | | | 4.17 | % | | | 8.42 | % |
S&P 500® Index6 | | | 14.42 | | | | 16.89 | | | | 5.21 | | | | 7.88 | |
Average Lipper Large-Cap Value Fund7 | | | 15.25 | | | | 18.41 | | | | 3.52 | | | | 7.51 | |
| 5. | The Russell 1000® Value Index measures the performance of the large-cap value segment of the U.S. equity universe. It includes those Russell 1000® Index companies with lower price-to-book ratios and lower expected growth values. The Russell 1000® Value Index is the Fund’s broad-based securities market index for comparison purposes. Results assume reinvestment of all dividends and capital gains. An investment cannot be made directly in an index. |
| 6. | “S&P 500®” is a trademark of The McGraw-Hill Companies, Inc. The S&P 500® Index is widely regarded as the standard index for measuring large-cap U.S. stock market performance. The S&P 500® Index is the Fund’s secondary benchmark. Results assume reinvestment of all dividends and capital gains. An investment cannot be made directly in an index. |
| 7. | The average Lipper large-cap value fund is representative of funds that, by portfolio practice, invest at least 75% of their equity assets in companies with market capitalizations (on a three-year weighted basis) above Lipper’s U.S. Diversified Equity large-cap floor. Large-cap value funds typically have a below average price-to-earnings ratio, price-to-book ratio, and three-year sales-per-share growth value, compared to the S&P 500® Index. This benchmark is a product of Lipper Inc. Lipper Inc. is an independent monitor of fund performance. Results are based on total returns with all dividend and capital gain distributions reinvested. |
The footnotes on the preceding page are an integral part of the table and graph and should be carefully read in conjunction with them.
| | |
| 6 | | MainStay ICAP Equity Fund |
Cost in Dollars of a $1,000 Investment in MainStay ICAP Equity Fund (Unaudited)
The example below is intended to describe the fees and expenses borne by shareholders during the six-month period from November 1, 2012, to April 30, 2013, and the impact of those costs on your investment.
Example
As a shareholder of the Fund, you incur two types of costs: (1) transaction costs, including exchange fees and sales charges (loads) on purchases (as applicable), and (2) ongoing costs, including management fees, distribution and/or service (12b-1) fees, and other Fund expenses (as applicable). This example is intended to help you understand your ongoing costs (in dollars) of investing in the Fund and to compare these costs with the ongoing costs of investing in other mutual funds. The example is based on an investment of $1,000 made at the beginning of the six-month period and held for the entire period from November 1, 2012, to April 30, 2013.
This example illustrates your Fund’s ongoing costs in two ways:
Actual Expenses
The second and third data columns in the table below provide information about actual account values and actual expenses. You may use the information in these columns, together with the amount you invested, to estimate the expenses that you paid during the six months ended April 30, 2013. Simply divide your account value by $1,000 (for example, an $8,600 account value divided by $1,000 = 8.6), then
multiply the result by the number under the heading entitled “Expenses Paid During Period” to estimate the expenses you paid on your account during this period.
Hypothetical Example for Comparison Purposes
The fourth and fifth data columns in the table below provide information about hypothetical account values and hypothetical expenses based on the Fund’s actual expense ratio and an assumed rate of return of 5% per year before expenses, which is not the Fund’s actual return. The hypothetical account values and expenses may not be used to estimate the actual ending account balances or expenses you paid for the six-month period shown. You may use this information to compare the ongoing costs of investing in the Fund with the ongoing costs of investing in other Funds. To do so, compare this 5% hypothetical example with the 5% hypothetical examples that appear in the shareholder reports of the other Funds.
Please note that the expenses shown in the table are meant to highlight your ongoing costs only and do not reflect any transactional costs, such as exchange fees or sales charges (loads). Therefore, the fourth and fifth data columns of the table are useful in comparing ongoing costs only and will not help you determine the relative total costs of owning different funds. In addition, if these transactional costs were included, your costs would have been higher.
| | | | | | | | | | | | | | | | | | | | |
| | | | | | | | | | | | | | | | |
| Share Class | | Beginning
Account
Value
11/1/12 | | | Ending Account
Value (Based
on Actual
Returns and
Expenses)
4/30/13 | | | Expenses
Paid
During
Period1 | | | Ending Account
Value (Based
on Hypothetical
5% Annualized
Return and
Actual Expenses)
4/30/13 | | | Expenses
Paid
During
Period1 | |
| | | | | |
| Investor Class Shares | | $ | 1,000.00 | | | $ | 1,149.40 | | | $ | 7.46 | | | $ | 1,017.90 | | | $ | 7.00 | |
| | | | | |
| Class A Shares | | $ | 1,000.00 | | | $ | 1,150.70 | | | $ | 6.29 | | | $ | 1,018.90 | | | $ | 5.91 | |
| | | | | |
| Class C Shares | | $ | 1,000.00 | | | $ | 1,145.10 | | | $ | 11.44 | | | $ | 1,014.10 | | | $ | 10.74 | |
| | | | | |
| Class I Shares | | $ | 1,000.00 | | | $ | 1,152.30 | | | $ | 4.80 | | | $ | 1,020.30 | | | $ | 4.51 | |
| | | | | |
| Class R1 Shares | | $ | 1,000.00 | | | $ | 1,151.70 | | | $ | 5.28 | | | $ | 1,019.90 | | | $ | 4.96 | |
| | | | | |
| Class R2 Shares | | $ | 1,000.00 | | | $ | 1,149.90 | | | $ | 6.82 | | | $ | 1,018.40 | | | $ | 6.41 | |
| | | | | |
| Class R3 Shares | | $ | 1,000.00 | | | $ | 1,148.50 | | | $ | 8.15 | | | $ | 1,017.20 | | | $ | 7.65 | |
| 1. | Expenses are equal to the Fund’s annualized expense ratio of each class (1.40% for Investor Class, 1.18% for Class A, 2.15% for Class C, 0.90% for Class I, 0.99% for Class R1, 1.28% for Class R2 and 1.53% for Class R3) multiplied by the average account value over the period, divided by 365 and multiplied by 181 (to reflect the six-month period). The table above represents the actual expenses incurred during the six-month period. |
| | | | |
| mainstayinvestments.com | | | 7 | |
Industry Composition as of April 30, 2013 (Unaudited)
| | | | |
| Pharmaceuticals | | | 10.3 | % |
| Oil, Gas & Consumable Fuels | | | 9.1 | |
| Media | | | 6.5 | |
| Diversified Financial Services | | | 5.4 | |
| Health Care Equipment & Supplies | | | 4.8 | |
| Commercial Banks | | | 4.7 | |
| Health Care Providers & Services | | | 4.2 | |
| Industrial Conglomerates | | | 4.2 | |
| Wireless Telecommunication Services | | | 3.8 | |
| Insurance | | | 3.5 | |
| Chemicals | | | 3.4 | |
| Semiconductors & Semiconductor Equipment | | | 3.2 | |
| Aerospace & Defense | | | 2.8 | |
| Consumer Finance | | | 2.8 | |
| Hotels, Restaurants & Leisure | | | 2.7 | |
| Machinery | | | 2.6 | |
| | | | |
| Communications Equipment | | | 2.4 | % |
| Auto Components | | | 2.3 | |
| Beverages | | | 2.0 | |
| Diversified Telecommunication Services | | | 2.0 | |
| Electric Utilities | | | 2.0 | |
| Energy Equipment & Services | | | 2.0 | |
| Software | | | 2.0 | |
| Food & Staples Retailing | | | 1.8 | |
| Multiline Retail | | | 1.8 | |
| Automobiles | | | 1.3 | |
| Containers & Packaging | | | 1.2 | |
| Biotechnology | | | 0.7 | |
| Short-Term Investment | | | 4.2 | |
| Other Assets, Less Liabilities | | | 0.3 | |
| | | | |
| | | 100.0 | % |
| | | | |
See Portfolio of Investments beginning on page 11 for specific holdings within these categories.
Top Ten Holdings as of April 30, 2013 (excluding short-term investment)
| 5. | Vodafone Group PLC, Sponsored ADR |
| 7. | Texas Instruments, Inc. |
| 9. | Capital One Financial Corp. |
| 10. | Honeywell International, Inc. |
| | |
| 8 | | MainStay ICAP Equity Fund |
Portfolio Management Discussion and Analysis (Unaudited)
Questions answered by portfolio managers Jerrold K. Senser, CFA, Thomas R. Wenzel, CFA, and Thomas M. Cole, CFA, of Institutional Capital LLC (ICAP), the Fund’s Subadvisor.
How did MainStay ICAP Equity Fund perform relative to its peers and its benchmark during the six months ended April 30, 2013?
Excluding all sales charges, MainStay ICAP Equity Fund returned 14.94% for Investor Class shares, 15.07% for Class A shares and 14.51% for Class C shares for the six months ended April 30, 2013. Over the same period, Class I shares returned 15.23%, Class R1 shares returned 15.17%, Class R2 shares returned 14.99% and Class R3 shares returned 14.85%. All share classes underperformed the 15.25% return of the average Lipper1 large-cap value fund and the 16.31% return of the Russell 1000® Value Index2 for the six months ended April 30, 2013. The Russell 1000® Value Index is the Fund’s broad-based securities-market index. See page 5 for Fund returns with applicable sales charges.
What factors affected the Fund’s relative performance during the reporting period?
A number of key drivers affected the Fund’s performance relative to the Russell 1000® Value Index. Favorable stock selection in the consumer discretionary and health care sectors added to the Fund’s relative performance. Stock selection in the energy and financials sectors, however, detracted from the Fund’s relative performance. The Fund benefited from an overweight position relative to the Russell 1000® Value Index in the information technology sector. An underweight position in the financials sector detracted from the Fund’s performance relative to the Index.
During the reporting period, which sectors were the strongest positive contributors to the Fund’s relative performance and which sectors were particularly weak?
The sectors that made the strongest positive contributions to the Fund’s performance relative to the Russell 1000® Value Index were consumer discretionary, health care and utilities. (Contributions take weightings and total returns into account.) Favorable stock selection was the primary driver in the consumer discretionary and health care sectors. An underweight position in the utilities sector added to the Fund’s relative performance.
The sectors that detracted the most from the Fund’s performance relative to the Russell 1000® Value Index were financials, materials and energy. Stock selection was the primary driver in each case.
During the reporting period, which individual stocks made the strongest positive contributions to the Fund’s absolute performance and which stocks detracted the most?
The stocks that made the strongest positive contributions to the Fund’s absolute performance were media company Time Warner, semiconductor manufacturer Texas Instruments and
diversified pharmaceutical company Pfizer. Time Warner’s stock outpaced the Russell 1000® Value Index, as the company reported strong operational performance and provided expectations of growth in affiliate-fee revenue. Texas Instruments’ stock advanced as the company continued to exit unattractive businesses and reduce expenditures to increase operating margins. Pfizer showed strong performance during the reporting period, as investors approved of the company’s plan to divest its nutritionals and animal health businesses. All three companies returned cash to shareholders through dividends and stock buybacks. All three positions remained in the Fund at the end of the reporting period.
Major detractors from the Fund’s absolute performance included gold miner Barrick Gold, natural gas producer Encana and software maker Microsoft. Barrick Gold lagged as production delays and cost overruns hampered the company’s results and outlook. Encana suffered as continued low natural gas prices and increased capital expenditures weighed on the company’s results. Microsoft underperformed the Russell 1000® Value Index, as the success of Windows 8 took longer than expected for the marketplace to assess because of limited hardware availability. We eliminated the Fund’s positions in Barrick Gold and Microsoft by the end of the reporting period. Encana remained in the Fund at the end of the reporting period because we believed that the stock was attractively valued and had strong catalysts for potential appreciation.
Did the Fund make any significant purchases or sales during the reporting period?
We continued to look for stocks with attractive valuations and specific catalysts that we believed could trigger appreciation over a 12- to 18-month time frame.
We added a position in regional bank PNC Financial because we believed that the company’s new management would improve the bank’s organic growth and strengthen cost efficiencies. We also added a position in integrated electric utility company Exelon. We anticipate that electric power prices will recover, driven by rising natural gas prices and tighter power markets.
In addition to the sales already mentioned, we sold the Fund’s holdings in integrated oil and gas producer Occidental Petroleum in favor of other stocks that we believed had greater potential upside and were more attractive on a relative valuation basis. We sold the Fund’s position in asset manager BlackRock when the stock approached our target price and, in our view, showed limited upside potential.
| 1. | See footnote on page 6 for more information on Lipper Inc. |
| 2. | See footnote on page 6 for more information on the Russell 1000® Value Index. |
| | | | |
| mainstayinvestments.com | | | 9 | |
How did the Fund’s sector weightings change during the reporting period?
The Fund increased its exposure relative to the Russell 1000® Value Index in the utilities and consumer staples sectors. Even with the increased exposure, however, the Fund remained underweight in both sectors relative to the Russell 1000® Value Index.
During the reporting period, the Fund decreased its sector weightings relative to the Russell 1000® Value Index in information technology and financials. In information technology, the Fund reduced its overweight position relative to the Index. In financials, the Fund moved from an underweight
position to a more substantially underweight position relative to the Index.
How was the Fund positioned at the end of the reporting period?
As of April 30, 2013, the Fund was most significantly overweight relative to the Russell 1000® Value Index in the health care and consumer discretionary sectors. As of the same date, the Fund was most significantly underweight relative to the Index in financials and utilities. This positioning reflected our view on the prospects for economic growth and the relative attractiveness of individual holdings in these sectors.
The opinions expressed are those of the portfolio managers as of the date of this report and are subject to change. There is no guarantee that any forecast made will come to pass. This material does not constitute investment advice and is not intended as an endorsement of any specific investment.
| | |
| 10 | | MainStay ICAP Equity Fund |
Portfolio of Investments April 30, 2013 (Unaudited)
| | | | | | | | |
| | |
| | | Shares | | | Value | |
| | | | | | | | |
| Common Stocks 95.5%† | | | | | | | | |
Aerospace & Defense 2.8% | | | | | | | | |
¨Honeywell International, Inc. | | | 377,975 | | | $ | 27,796,282 | |
| | | | | | | | |
|
Auto Components 2.3% | |
Johnson Controls, Inc. | | | 663,421 | | | | 23,226,369 | |
| | | | | | | | |
|
Automobiles 1.3% | |
Ford Motor Co. | | | 909,000 | | | | 12,462,390 | |
| | | | | | | | |
|
Beverages 2.0% | |
Coca-Cola Co. (The) | | | 464,062 | | | | 19,643,744 | |
| | | | | | | | |
|
Biotechnology 0.7% | |
Gilead Sciences, Inc. (a) | | | 135,900 | | | | 6,881,976 | |
| | | | | | | | |
|
Chemicals 3.4% | |
Monsanto Co. | | | 217,519 | | | | 23,235,380 | |
Mosaic Co. (The) | | | 170,600 | | | | 10,507,254 | |
| | | | | | | | |
| | | | | | | 33,742,634 | |
| | | | | | | | |
Commercial Banks 4.7% | | | | | | | | |
BB&T Corp. | | | 545,565 | | | | 16,787,035 | |
PNC Financial Services Group, Inc. | | | 325,350 | | | | 22,084,758 | |
Wells Fargo & Co. | | | 207,556 | | | | 7,882,977 | |
| | | | | | | | |
| | | | | | | 46,754,770 | |
| | | | | | | | |
Communications Equipment 2.4% | | | | | | | | |
Cisco Systems, Inc. | | | 1,139,750 | | | | 23,843,570 | |
| | | | | | | | |
|
Consumer Finance 2.8% | |
¨Capital One Financial Corp. | | | 483,600 | | | | 27,942,408 | |
| | | | | | | | |
|
Containers & Packaging 1.2% | |
Owens-Illinois, Inc. (a) | | | 464,791 | | | | 12,214,707 | |
| | | | | | | | |
|
Diversified Financial Services 5.4% | |
Citigroup, Inc. | | | 587,550 | | | | 27,415,083 | |
JPMorgan Chase & Co. | | | 530,550 | | | | 26,002,256 | |
| | | | | | | | |
| | | | | | | 53,417,339 | |
| | | | | | | | |
Diversified Telecommunication Services 2.0% | | | | | |
BCE, Inc. | | | 429,999 | | | | 20,149,753 | |
| | | | | | | | |
|
Electric Utilities 2.0% | |
Exelon Corp. | | | 529,700 | | | | 19,869,047 | |
| | | | | | | | |
| | | | | | | | |
| | |
| | | Shares | | | Value | |
| | | | | | | | |
Energy Equipment & Services 2.0% | |
Halliburton Co. | | | 474,350 | | | $ | 20,287,950 | |
| | | | | | | | |
|
Food & Staples Retailing 1.8% | |
CVS Caremark Corp. | | | 314,150 | | | | 18,277,247 | |
| | | | | | | | |
|
Health Care Equipment & Supplies 4.8% | |
Baxter International, Inc. | | | 375,400 | | | | 26,229,198 | |
Covidien PLC | | | 341,006 | | | | 21,769,823 | |
| | | | | | | | |
| | | | | | | 47,999,021 | |
| | | | | | | | |
Health Care Providers & Services 4.2% | | | | | | | | |
McKesson Corp. | | | 186,550 | | | | 19,740,721 | |
UnitedHealth Group, Inc. | | | 372,100 | | | | 22,299,953 | |
| | | | | | | | |
| | | | | | | 42,040,674 | |
| | | | | | | | |
Hotels, Restaurants & Leisure 2.7% | | | | | | | | |
McDonald’s Corp. | | | 260,800 | | | | 26,638,112 | |
| | | | | | | | |
|
Industrial Conglomerates 4.2% | |
¨General Electric Co. | | | 1,881,750 | | | | 41,944,208 | |
| | | | | | | | |
|
Insurance 3.5% | |
ACE, Ltd. | | | 273,491 | | | | 24,378,987 | |
MetLife, Inc. | | | 257,826 | | | | 10,052,636 | |
| | | | | | | | |
| | | | | | | 34,431,623 | |
| | | | | | | | |
Machinery 2.6% | | | | | | | | |
Cummins, Inc. | | | 95,500 | | | | 10,160,245 | |
Stanley Black & Decker, Inc. | | | 214,050 | | | | 16,013,081 | |
| | | | | | | | |
| | | | | | | 26,173,326 | |
| | | | | | | | |
Media 6.5% | | | | | | | | |
¨Time Warner, Inc. | | | 565,142 | | | | 33,784,189 | |
¨Viacom, Inc. Class B | | | 485,234 | | | | 31,050,123 | |
| | | | | | | | |
| | | | | | | 64,834,312 | |
| | | | | | | | |
Multiline Retail 1.8% | |
Dollar General Corp. (a) | | | 341,700 | | | | 17,799,153 | |
| | | | | | | | |
|
Oil, Gas & Consumable Fuels 9.1% | |
Encana Corp. | | | 692,700 | | | | 12,780,315 | |
¨Exxon Mobil Corp. | | | 485,750 | | | | 43,226,892 | |
Marathon Oil Corp. | | | 590,600 | | | | 19,294,902 | |
Southwestern Energy Co. (a) | | | 418,050 | | | | 15,643,431 | |
| | | | | | | | |
| | | | | | | 90,945,540 | |
| | | | | | | | |
Pharmaceuticals 10.3% | | | | | | | | |
¨Johnson & Johnson | | | 497,050 | | | | 42,363,572 | |
Novartis A.G., ADR | | | 209,500 | | | | 15,452,720 | |
¨Pfizer, Inc. | | | 1,522,620 | | | | 44,262,563 | |
| | | | | | | | |
| | | | | | | 102,078,855 | |
| | | | | | | | |
| † | Percentages indicated are based on Fund net assets. |
| ¨ | | Among the Fund’s 10 largest holdings, as of April 30, 2013, excluding short-term investment. May be subject to change daily. |
| | | | | | |
The notes to the financial statements are an integral part of,
and should be read in conjunction with, the financial statements. | | mainstayinvestments.com | | | 11 | |
Portfolio of Investments April 30, 2013 (Unaudited) (continued)
| | | | | | | | |
| | |
| | | Shares | | | Value | |
| | | | | | | | |
| Common Stocks (continued) | |
Semiconductors & Semiconductor Equipment 3.2% | |
¨Texas Instruments, Inc. | | | 892,338 | | | $ | 32,311,559 | |
| | | | | | | | |
|
Software 2.0% | |
Adobe Systems, Inc. (a) | | | 448,550 | | | | 20,220,634 | |
| | | | | | | | |
|
Wireless Telecommunication Services 3.8% | |
¨Vodafone Group PLC, Sponsored ADR | | | 1,235,626 | | | | 37,797,799 | |
| | | | | | | | |
Total Common Stocks
(Cost $715,424,598) | | | | | | | 951,725,002 | |
| | | | | | | | |
| | | | | | | | |
| | | Principal
Amount | | | Value | |
| | | | | | | | |
| Short-Term Investment 4.2% | | | | | |
Repurchase Agreement 4.2% | | | | | | | | |
State Street Bank and Trust Co.
0.01%, dated 4/30/13
due 5/1/13
Proceeds at Maturity $41,714,243 (Collateralized by a Federal National Motgage Association security with a rate of 2.17% and a maturity date of 11/7/22, with a Principal Amount of $42,055,000 and a Market Value of $42,553,352) | | $ | 41,714,231 | | | $ | 41,714,231 | |
| | | | | | | | |
Total Short-Term Investment
(Cost $41,714,231) | | | | | | | 41,714,231 | |
| | | | | | | | |
Total Investments
(Cost $757,138,829) (b) | | | 99.7 | % | | | 993,439,233 | |
Other Assets, Less Liabilities | | | 0.3 | | | | 2,605,061 | |
Net Assets | | | 100.0 | % | | $ | 996,044,294 | |
| (a) | Non-income producing security. |
| (b) | As of April 30, 2013, cost is $770,561,591 for federal income tax purposes and net unrealized appreciation is as follows: |
| | | | |
Gross unrealized appreciation | | $ | 237,605,257 | |
Gross unrealized depreciation | | | (14,727,615 | ) |
| | | | |
Net unrealized appreciation | | $ | 222,877,642 | |
| | | | |
The following abbreviation is used in the above portfolio:
ADR—American Depositary Receipt.
The following is a summary of the fair valuations according to the inputs used as of April 30, 2013, for valuing the Fund’s assets.
Asset Valuation Inputs
| | | | | | | | | | | | | | | | |
Description | | Quoted
Prices in
Active
Markets for
Identical
Assets (Level 1) | | | Significant
Other
Observable
Inputs (Level 2) | | | Significant
Unobservable
Inputs
(Level 3) | | | Total | |
| Investments in Securities (a) | | | | | | | | | | | | | | | | |
| Common Stocks | | $ | 951,725,002 | | | $ | — | | | $ | — | | | $ | 951,725,002 | |
| Short-Term Investment | | | | | | | | | | | | | | | | |
Repurchase Agreement | | | — | | | | 41,714,231 | | | | — | | | | 41,714,231 | |
| | | | | | | | | | | | | | | | |
| Total Investments in Securities | | $ | 951,725,002 | | | $ | 41,714,231 | | | $ | — | | | $ | 993,439,233 | |
| | | | | | | | | | | | | | | | |
| (a) | For a complete listing of investments and their industries, see the Portfolio of Investments. |
The Fund recognizes transfers between the levels as of the beginning of the period.
For the period ended April 30, 2013, the Fund did not have any transfers between Level 1 and Level 2 fair value measurements. (See Note 2)
As of April 30, 2013, the Fund did not hold any investments with significant unobservable inputs (Level 3). (See Note 2)
| | | | |
| 12 | | MainStay ICAP Equity Fund | | The notes to the financial statements are an integral part of,
and should be read in conjunction with, the financial statements. |
Statement of Assets and Liabilities as of April 30, 2013 (Unaudited)
| | | | |
| Assets | |
Investment in securities, at value
(identified cost $757,138,829) | | $ | 993,439,233 | |
Receivables: | | | | |
Investment securities sold | | | 3,799,226 | |
Fund shares sold | | | 1,383,302 | |
Dividends and interest | | | 730,555 | |
Other assets | | | 49,705 | |
| | | | |
Total assets | | | 999,402,021 | |
| | | | |
| |
| Liabilities | | | | |
Payables: | | | | |
Investment securities purchased | | | 1,759,334 | |
Fund shares redeemed | | | 655,888 | |
Manager (See Note 3) | | | 643,756 | |
Transfer agent (See Note 3) | | | 143,320 | |
Shareholder communication | | | 77,624 | |
Professional fees | | | 36,675 | |
NYLIFE Distributors (See Note 3) | | | 23,460 | |
Custodian | | | 2,542 | |
Trustees | | | 2,382 | |
Accrued expenses | | | 12,746 | |
| | | | |
Total liabilities | | | 3,357,727 | |
| | | | |
Net assets | | $ | 996,044,294 | |
| | | | |
| |
| Composition of Net Assets | | | | |
Shares of beneficial interest outstanding (par value of $.001 per share) unlimited number of shares authorized | | $ | 22,083 | |
Additional paid-in capital | | | 868,899,152 | |
| | | | |
| | | 868,921,235 | |
Undistributed net investment income | | | 216,018 | |
Accumulated net realized gain (loss) on investments and foreign currency transactions | | | (109,393,363 | ) |
Net unrealized appreciation (depreciation) on investments | | | 236,300,404 | |
| | | | |
Net assets | | $ | 996,044,294 | |
| | | | |
| | | | |
Investor Class | | | | |
Net assets applicable to outstanding shares | | $ | 13,091,582 | |
| | | | |
Shares of beneficial interest outstanding | | | 291,080 | |
| | | | |
Net asset value per share outstanding | | $ | 44.98 | |
Maximum sales charge (5.50% of offering price) | | | 2.62 | |
| | | | |
Maximum offering price per share outstanding | | $ | 47.60 | |
| | | | |
Class A | | | | |
Net assets applicable to outstanding shares | | $ | 38,758,639 | |
| | | | |
Shares of beneficial interest outstanding | | | 860,432 | |
| | | | |
Net asset value per share outstanding | | $ | 45.05 | |
Maximum sales charge (5.50% of offering price) | | | 2.62 | |
| | | | |
Maximum offering price per share outstanding | | $ | 47.67 | |
| | | | |
Class C | | | | |
Net assets applicable to outstanding shares | | $ | 9,797,508 | |
| | | | |
Shares of beneficial interest outstanding | | | 219,967 | |
| | | | |
Net asset value and offering price per share outstanding | | $ | 44.54 | |
| | | | |
Class I | | | | |
Net assets applicable to outstanding shares | | $ | 906,351,622 | |
| | | | |
Shares of beneficial interest outstanding | | | 20,088,737 | |
| | | | |
Net asset value and offering price per share outstanding | | $ | 45.12 | |
| | | | |
Class R1 | | | | |
Net assets applicable to outstanding shares | | $ | 6,644,611 | |
| | | | |
Shares of beneficial interest outstanding | | | 147,209 | |
| | | | |
Net asset value and offering price per share outstanding | | $ | 45.14 | |
| | | | |
Class R2 | | | | |
Net assets applicable to outstanding shares | | $ | 18,198,853 | |
| | | | |
Shares of beneficial interest outstanding | | | 404,033 | |
| | | | |
Net asset value and offering price per share outstanding | | $ | 45.04 | |
| | | | |
Class R3 | | | | |
Net assets applicable to outstanding shares | | $ | 3,201,479 | |
| | | | |
Shares of beneficial interest outstanding | | | 71,228 | |
| | | | |
Net asset value and offering price per share outstanding | | $ | 44.95 | |
| | | | |
| | | | | | |
The notes to the financial statements are an integral part of,
and should be read in conjunction with, the financial statements. | | mainstayinvestments.com | | | 13 | |
Statement of Operations for the six months ended April 30, 2013 (Unaudited)
| | | | |
| Investment Income (Loss) | |
Income | | | | |
Dividends (a) | | $ | 10,910,771 | |
Interest | | | 1,284 | |
| | | | |
Total income | | | 10,912,055 | |
| | | | |
Expenses | | | | |
Manager (See Note 3) | | | 3,626,224 | |
Transfer agent (See Note 3) | | | 419,707 | |
Distribution/Service—Investor Class (See Note 3) | | | 15,624 | |
Distribution/Service—Class A (See Note 3) | | | 41,767 | |
Distribution/Service—Class C (See Note 3) | | | 44,546 | |
Distribution/Service—Class R2 (See Note 3) | | | 17,144 | |
Distribution/Service—Class R3 (See Note 3) | | | 7,230 | |
Shareholder communication | | | 49,210 | |
Registration | | | 44,535 | |
Professional fees | | | 36,274 | |
Shareholder service (See Note 3) | | | 11,257 | |
Trustees | | | 10,598 | |
Custodian | | | 7,008 | |
Miscellaneous | | | 24,004 | |
| | | | |
Total expenses before waiver/reimbursement | | | 4,355,128 | |
Expense waiver/reimbursement from Manager (See Note 3) | | | (105,025 | ) |
| | | | |
Net expenses | | | 4,250,103 | |
| | | | |
Net investment income (loss) | | | 6,661,952 | |
| | | | |
|
| Realized and Unrealized Gain (Loss) on Investments and Foreign Currency Transactions | |
Net realized gain (loss) on: | | | | |
Security transactions | | | 45,633,546 | |
Foreign currency transactions | | | 726 | |
| | | | |
Net realized gain (loss) on investments and foreign currency transactions | | | 45,634,272 | |
| | | | |
Net change in unrealized appreciation (depreciation) on investments | | | 77,282,911 | |
| | | | |
Net realized and unrealized gain (loss) on investments and foreign currency transactions | | | 122,917,183 | |
| | | | |
Net increase (decrease) in net assets resulting from operations | | $ | 129,579,135 | |
| | | | |
| (a) | Dividends recorded net of foreign withholding taxes in the amount of $269,813. |
| | | | |
| 14 | | MainStay ICAP Equity Fund | | The notes to the financial statements are an integral part of,
and should be read in conjunction with, the financial statements. |
Statements of Changes in Net Assets
for the six months ended April 30, 2013 (Unaudited) and the year ended October 31, 2012
| | | | | | | | |
| | | 2013 | | | 2012 | |
| Increase (Decrease) in Net Assets | |
Operations: | | | | | | | | |
Net investment income (loss) | | $ | 6,661,952 | | | $ | 15,574,565 | |
Net realized gain (loss) on investments and foreign currency transactions | | | 45,634,272 | | | | 44,752,926 | |
Net change in unrealized appreciation (depreciation) on investments | | | 77,282,911 | | | | 60,045,827 | |
| | | | |
Net increase (decrease) in net assets resulting from operations | | | 129,579,135 | | | | 120,373,318 | |
| | | | |
Dividends to shareholders: | | | | | | | | |
From net investment income: | | | | | | | | |
Investor Class | | | (65,450 | ) | | | (144,668 | ) |
Class A | | | (211,383 | ) | | | (430,657 | ) |
Class C | | | (14,223 | ) | | | (58,590 | ) |
Class I | | | (6,371,395 | ) | | | (14,782,823 | ) |
Class R1 | | | (43,697 | ) | | | (72,230 | ) |
Class R2 | | | (77,082 | ) | | | (125,932 | ) |
Class R3 | | | (14,132 | ) | | | (34,666 | ) |
| | | | |
Total dividends to shareholders | | | (6,797,362 | ) | | | (15,649,566 | ) |
| | | | |
Capital share transactions: | | | | | | | | |
Net proceeds from sale of shares | | | 137,023,889 | | | | 336,499,969 | |
Net asset value of shares issued to shareholders in reinvestment of dividends | | | 6,609,289 | | | | 15,241,083 | |
Cost of shares redeemed | | | (150,632,423 | ) | | | (362,347,043 | ) |
| | | | |
Increase (decrease) in net assets derived from capital share transactions | | | (6,999,245 | ) | | | (10,605,991 | ) |
| | | | |
Net increase (decrease) in net assets | | | 115,782,528 | | | | 94,117,761 | |
|
| Net Assets | |
Beginning of period | | | 880,261,766 | | | | 786,144,005 | |
| | | | |
End of period | | $ | 996,044,294 | | | $ | 880,261,766 | |
| | | | |
Undistributed net investment income at end of period | | $ | 216,018 | | | $ | 351,428 | |
| | | | |
| | | | | | |
The notes to the financial statements are an integral part of,
and should be read in conjunction with, the financial statements. | | mainstayinvestments.com | | | 15 | |
Financial Highlights selected per share data and ratios
| | | | | | | | | | | | | | | | | | | | | | | | |
| | | Investor Class | |
| | | Six months
ended
April 30, | | | Year ended October 31, | | | April 29,
2008**
through
October 31, | |
| | | 2013* | | | 2012 | | | 2011 | | | 2010 | | | 2009 | | | 2008 | |
Net asset value at beginning of period | | $ | 39.34 | | | $ | 35.05 | | | $ | 33.81 | | | $ | 29.89 | | | $ | 26.95 | | | $ | 39.51 | |
| | | | | | | | | | | | | | | | | | | | | | | | |
Net investment income (loss) | | | 0.21 | (a) | | | 0.46 | (a) | | | 0.37 | (a) | | | 0.22 | (a) | | | 0.32 | (a) | | | 0.27 | |
Net realized and unrealized gain (loss) on investments | | | 5.65 | | | | 4.30 | | | | 1.22 | | | | 3.95 | | | | 3.15 | | | | (12.55 | ) |
| | | | | | | | | | | | | | | | | | | | | | | | |
Total from investment operations | | | 5.86 | | | | 4.76 | | | | 1.59 | | | | 4.17 | | | | 3.47 | | | | (12.28 | ) |
| | | | | | | | | | | | | | | | | | | | | | | | |
Less dividends: | | | | | | | | | | | | | | | | | | | | | | | | |
From net investment income | | | (0.22 | ) | | | (0.47 | ) | | | (0.35 | ) | | | (0.25 | ) | | | (0.53 | ) | | | (0.28 | ) |
| | | | | | | | | | | | | | | | | | | | | | | | |
Net asset value at end of period | | $ | 44.98 | | | $ | 39.34 | | | $ | 35.05 | | | $ | 33.81 | | | $ | 29.89 | | | $ | 26.95 | |
| | | | | | | | | | | | | | | | | | | | | | | | |
Total investment return (b) | | | 14.94 | %(c) | | | 13.61 | % | | | 4.67 | % | | | 14.02 | % | | | 13.32 | % | | | (31.24 | %)(c) |
Ratios (to average net assets)/Supplemental Data: | | | | | | | | | | | | | | | | | | | | | | | | |
Net investment income (loss) | | | 1.02 | %†† | | | 1.22 | % | | | 1.01 | % | | | 0.69 | % | | | 1.24 | % | | | 1.54 | % †† |
Net expenses | | | 1.40 | %†† | | | 1.43 | % | | | 1.46 | % | | | 1.56 | % | | | 1.29 | % | | | 1.19 | % †† |
Expenses (before waiver/reimbursement) | | | 1.40 | %†† | | | 1.43 | % | | | 1.46 | % | | | 1.56 | % | | | 1.69 | % | | | 1.61 | % †† |
Portfolio turnover rate | | | 33 | % | | | 75 | % | | | 74 | % | | | 64 | % | | | 93 | % | | | 106 | % |
Net assets at end of period (in 000’s) | | $ | 13,092 | | | $ | 11,979 | | | $ | 11,633 | | | $ | 12,036 | | | $ | 11,465 | | | $ | 10,798 | |
| ** | Commencement of operations. |
| (a) | Per share data based on average shares outstanding during the period. |
| (b) | Total investment return is calculated exclusive of sales charges and assumes the reinvestment of dividends and distributions. |
| (c) | Total investment return is not annualized. |
| | | | |
| 16 | | MainStay ICAP Equity Fund | | The notes to the financial statements are an integral part of,
and should be read in conjunction with, the financial statements. |
Financial Highlights selected per share data and ratios
| | | | | | | | | | | | | | | | | | | | | | | | | | | | |
| | | Class A | |
| | | Six months
ended
April 30, | | | Year ended October 31, | | | January 1,
2008***
through
October 31, | | | Year ended
December 31, | |
| | | 2013* | | | 2012 | | | 2011 | | | 2010 | | | 2009 | | | 2008 | | | 2007 | |
Net asset value at beginning of period | | $ | 39.41 | | | $ | 35.07 | | | $ | 33.84 | | | $ | 29.89 | | | $ | 26.93 | | | $ | 41.53 | | | $ | 45.01 | |
| | | | | | | | | | | | | | | | | | | | | | | | | | | | |
Net investment income (loss) | | | 0.25 | (a) | | | 0.55 | (a) | | | 0.49 | (a) | | | 0.34 | (a) | | | 0.35 | (a) | | | 0.42 | | | | 0.66 | |
Net realized and unrealized gain (loss) on investments | | | 5.66 | | | | 4.34 | | | | 1.19 | | | | 3.96 | | | | 3.15 | | | | (14.59 | ) | | | 1.88 | |
| | | | | | | | | | | | | | | | | | | | | | | | | | | | |
Total from investment operations | | | 5.91 | | | | 4.89 | | | | 1.68 | | | | 4.30 | | | | 3.50 | | | | (14.17 | ) | | | 2.54 | |
| | | | | | | | | | | | | | | | | | | | | | | | | | | | |
Less dividends and distributions: | | | | | | | | | | | | | | | | | | | | | | | | | | | | |
From net investment income | | | (0.27 | ) | | | (0.55 | ) | | | (0.45 | ) | | | (0.35 | ) | | | (0.54 | ) | | | (0.43 | ) | | | (0.61 | ) |
From net realized gain on investments | | | — | | | | — | | | | — | | | | — | | | | — | | | | — | | | | (5.41 | ) |
| | | | | | | | | | | | | | | | | | | | | | | | | | | | |
Total dividends and distributions | | | (0.27 | ) | | | (0.55 | ) | | | (0.45 | ) | | | (0.35 | ) | | | (0.54 | ) | | | (0.43 | ) | | | (6.02 | ) |
| | | | | | | | | | | | | | | | | | | | | | | | | | | | |
Net asset value at end of period | | $ | 45.05 | | | $ | 39.41 | | | $ | 35.07 | | | $ | 33.84 | | | $ | 29.89 | | | $ | 26.93 | | | $ | 41.53 | |
| | | | | | | | | | | | | | | | | | | | | | | | | | | | |
Total investment return (b) | | | 15.07 | %(c) | | | 13.93 | % | | | 4.94 | % | | | 14.44 | % | | | 13.46 | % | | | (34.38 | %)(c) | | | 5.78 | % |
Ratios (to average net assets)/Supplemental Data: | | | | | | | | | | | | | | | | | | | | | | | | | | | | |
Net investment income (loss) | | | 1.19 | %†† | | | 1.46 | % | | | 1.34 | % | | | 1.08 | % | | | 1.35 | % | | | 1.38 | % †† | | | 1.22 | % |
Net expenses | | | 1.18 | %†† | | | 1.17 | % | | | 1.18 | % | | | 1.18 | % | | | 1.18 | % | | | 1.18 | % †† | | | 1.18 | % |
Expenses (before waiver/reimbursement) | | | 1.18 | %†† | | | 1.17 | % | | | 1.18 | % | | | 1.18 | % | | | 1.26 | % | | | 1.35 | % †† | | | 1.36 | % |
Portfolio turnover rate | | | 33 | % | | | 75 | % | | | 74 | % | | | 64 | % | | | 93 | % | | | 106 | % | | | 71 | % |
Net assets at end of period (in 000’s) | | $ | 38,759 | | | $ | 29,809 | | | $ | 28,388 | | | $ | 24,138 | | | $ | 25,257 | | | $ | 21,826 | | | $ | 51,349 | |
| *** | The Fund changed its fiscal year end from December 31 to October 31. |
| (a) | Per share data based on average shares outstanding during the period. |
| (b) | Total investment return is calculated exclusive of sales charges and assumes the reinvestment of dividends and distributions. |
| (c) | Total investment return is not annualized. |
| | | | | | |
The notes to the financial statements are an integral part of,
and should be read in conjunction with, the financial statements. | | mainstayinvestments.com | | | 17 | |
Financial Highlights selected per share data and ratios
| | | | | | | | | | | | | | | | | | | | | | | | | | | | |
| | | Class C | |
| | | Six months
ended
April 30, | | | Year ended October 31, | | | January 1,
2008***
through
October 31, | | | Year ended
December 31, | |
| | | 2013* | | | 2012 | | | 2011 | | | 2010 | | | 2009 | | | 2008 | | | 2007 | |
Net asset value at beginning of period | | $ | 38.97 | | | $ | 34.78 | | | $ | 33.59 | | | $ | 29.78 | | | $ | 26.86 | | | $ | 41.43 | | | $ | 44.96 | |
| | | | | | | | | | | | | | | | | | | | | | | | | | | | |
Net investment income (loss) | | | 0.05 | (a) | | | 0.17 | (a) | | | 0.09 | (a) | | | (0.02 | ) (a) | | | 0.13 | (a) | | | 0.19 | | | | 0.34 | |
Net realized and unrealized gain (loss) on investments | | | 5.59 | | | | 4.28 | | | | 1.21 | | | | 3.93 | | | | 3.13 | | | | (14.55 | ) | | | 1.85 | |
| | | | | | | | | | | | | | | | | | | | | | | | | | | | |
Total from investment operations | | | 5.64 | | | | 4.45 | | | | 1.30 | | | | 3.91 | | | | 3.26 | | | | (14.36 | ) | | | 2.19 | |
| | | | | | | | | | | | | | | | | | | | | | | | | | | | |
Less dividends and distributions: | | | | | | | | | | | | | | | | | | | | | | | | | | | | |
From net investment income | | | (0.07 | ) | | | (0.26 | ) | | | (0.11 | ) | | | (0.10 | ) | | | (0.34 | ) | | | (0.21 | ) | | | (0.31 | ) |
From net realized gain on investments | | | — | | | | — | | | | — | | | | — | | | | — | | | | — | | | | (5.41 | ) |
| | | | | | | | | | | | | | | | | | | | | | | | | | | | |
Total dividends and distributions | | | (0.07 | ) | | | (0.26 | ) | | | (0.11 | ) | | | (0.10 | ) | | | (0.34 | ) | | | (0.21 | ) | | | (5.72 | ) |
| | | | | | | | | | | | | | | | | | | | | | | | | | | | |
Net asset value at end of period | | $ | 44.54 | | | $ | 38.97 | | | $ | 34.78 | | | $ | 33.59 | | | $ | 29.78 | | | $ | 26.86 | | | $ | 41.43 | |
| | | | | | | | | | | | | | | | | | | | | | | | | | | | |
Total investment return (b) | | | 14.51 | %(c) | | | 12.77 | % | | | 3.86 | % | | | 13.15 | % | | | 12.51 | % | | | (34.82 | %)(c) | | | 4.99 | % |
Ratios (to average net assets)/Supplemental Data: | | | | | | | | | | | | | | | | | | | | | | | | | | | | |
Net investment income (loss) | | | 0.26 | %†† | | | 0.44 | % | | | 0.26 | % | | | (0.07 | %) | | | 0.52 | % | | | 0.65 | % †† | | | 0.49 | % |
Net expenses | | | 2.15 | %†† | | | 2.18 | % | | | 2.21 | % | | | 2.31 | % | | | 2.04 | % | | | 1.94 | % †† | | | 1.93 | % |
Expenses (before waiver/reimbursement) | | | 2.15 | %†† | | | 2.18 | % | | | 2.21 | % | | | 2.31 | % | | | 2.44 | % | | | 2.30 | % †† | | | 2.11 | % |
Portfolio turnover rate | | | 33 | % | | | 75 | % | | | 74 | % | | | 64 | % | | | 93 | % | | | 106 | % | | | 71 | % |
Net assets at end of period (in 000’s) | | $ | 9,798 | | | $ | 8,620 | | | $ | 7,872 | | | $ | 6,825 | | | $ | 5,206 | | | $ | 4,996 | | | $ | 8,606 | |
| *** | The Fund changed its fiscal year end from December 31 to October 31. |
| (a) | Per share data based on average shares outstanding during the period. |
| (b) | Total investment return is calculated exclusive of sales charges and assumes the reinvestment of dividends and distributions. |
| (c) | Total investment return is not annualized. |
| | | | |
| 18 | | MainStay ICAP Equity Fund | | The notes to the financial statements are an integral part of,
and should be read in conjunction with, the financial statements. |
Financial Highlights selected per share data and ratios
| | | | | | | | | | | | | | | | | | | | | | | | | | | | |
| | | Class I | |
| | | Six months
ended
April 30, | | | Year ended October 31, | | | January 1,
2008***
through
October 31, | | | Year ended
December 31, | |
| | | 2013* | | | 2012 | | | 2011 | | | 2010 | | | 2009 | | | 2008 | | | 2007 | |
Net asset value at beginning of period | | $ | 39.47 | | | $ | 35.12 | | | $ | 33.89 | | | $ | 29.93 | | | $ | 26.97 | | | $ | 41.57 | | | $ | 45.03 | |
| | | | | | | | | | | | | | | | | | | | | | | | | | | | |
Net investment income (loss) | | | 0.32 | (a) | | | 0.65 | (a) | | | 0.57 | (a) | | | 0.43 | (a) | | | 0.45 | (a) | | | 0.54 | | | | 0.77 | |
Net realized and unrealized gain (loss) on investments | | | 5.65 | | | | 4.34 | | | | 1.22 | | | | 3.96 | | | | 3.14 | | | | (14.62 | ) | | | 1.94 | |
| | | | | | | | | | | | | | | | | | | | | | | | | | | | |
Total from investment operations | | | 5.97 | | | | 4.99 | | | | 1.79 | | | | 4.39 | | | | 3.59 | | | | (14.08 | ) | | | 2.71 | |
| | | | | | | | | | | | | | | | | | | | | | | | | | | | |
Less dividends and distributions: | | | | | | | | | | | | | | | | | | | | | | | | | | | | |
From net investment income | | | (0.32 | ) | | | (0.64 | ) | | | (0.56 | ) | | | (0.43 | ) | | | (0.63 | ) | | | (0.52 | ) | | | (0.76 | ) |
From net realized gain on investments | | | — | | | | — | | | | — | | | | — | | | | — | | | | — | | | | (5.41 | ) |
| | | | | | | | | | | | | | | | | | | | | | | | | | | | |
Total dividends and distributions | | | (0.32 | ) | | | (0.64 | ) | | | (0.56 | ) | | | (0.43 | ) | | | (0.63 | ) | | | (0.52 | ) | | | (6.17 | ) |
| | | | | | | | | | | | | | | | | | | | | | | | | | | | |
Net asset value at end of period | | $ | 45.12 | | | $ | 39.47 | | | $ | 35.12 | | | $ | 33.89 | | | $ | 29.93 | | | $ | 26.97 | | | $ | 41.57 | |
| | | | | | | | | | | | | | | | | | | | | | | | | | | | |
Total investment return (b) | | | 15.23 | %(c) | | | 14.23 | % | | | 5.23 | % | | | 14.76 | % | | | 13.86 | % | | | (34.18 | %)(c) | | | 6.20 | % |
Ratios (to average net assets)/Supplemental Data: | | | | | | | | | | | | | | | | | | | | | | | | | | | | |
Net investment income (loss) | | | 1.51 | %†† | | | 1.72 | % | | | 1.57 | % | | | 1.35 | % | | | 1.76 | % | | | 1.79 | % †† | | | 1.63 | % |
Net expenses | | | 0.90 | %†† | | | 0.90 | % | | | 0.90 | % | | | 0.90 | % | | | 0.83 | % | | | 0.80 | % †† | | | 0.80 | % |
Expenses (before waiver/reimbursement) | | | 0.93 | %†† | | | 0.92 | % | | | 0.93 | % | | | 0.93 | % | | | 1.02 | % | | | 0.96 | % †† | | | 0.92 | % |
Portfolio turnover rate | | | 33 | % | | | 75 | % | | | 74 | % | | | 64 | % | | | 93 | % | | | 106 | % | | | 71 | % |
Net assets at end of period (in 000’s) | | $ | 906,352 | | | $ | 809,605 | | | $ | 725,422 | | | $ | 801,517 | | | $ | 705,425 | | | $ | 732,479 | | | $ | 1,041,210 | |
| *** | The Fund changed its fiscal year end from December 31 to October 31. |
| (a) | Per share data based on average shares outstanding during the period. |
| (b) | Total investment return is calculated exclusive of sales charges and assumes the reinvestment of dividends and distributions. Class I shares are not subject to sales charges. |
| (c) | Total investment return is not annualized. |
| | | | | | |
The notes to the financial statements are an integral part of,
and should be read in conjunction with, the financial statements. | | mainstayinvestments.com | | | 19 | |
Financial Highlights selected per share data and ratios
| | | | | | | | | | | | | | | | | | | | | | | | | | | | |
| | | Class R1 | |
| | | Six months
ended
April 30, | | | Year ended October 31, | | | January 1,
2008***
through
October 31, | | | Year ended
December 31, | |
| | | 2013* | | | 2012 | | | 2011 | | | 2010 | | | 2009 | | | 2008 | | | 2007 | |
Net asset value at beginning of period | | $ | 39.49 | | | $ | 35.14 | | | $ | 33.91 | | | $ | 29.94 | | | $ | 26.98 | | | $ | 41.59 | | | $ | 45.00 | |
| | | | | | | | | | | | | | | | | | | | | | | | | | | | |
Net investment income (loss) | | | 0.29 | (a) | | | 0.63 | (a) | | | 0.53 | (a) | | | 0.40 | (a) | | | 0.39 | (a) | | | 0.52 | | | | 0.77 | |
Net realized and unrealized gain (loss) on investments | | | 5.67 | | | | 4.33 | | | | 1.22 | | | | 3.97 | | | | 3.18 | | | | (14.64 | ) | | | 1.94 | |
| | | | | | | | | | | | | | | | | | | | | | | | | | | | |
Total from investment operations | | | 5.96 | | | | 4.96 | | | | 1.75 | | | | 4.37 | | | | 3.57 | | | | (14.12 | ) | | | 2.71 | |
| | | | | | | | | | | | | | | | | | | | | | | | | | | | |
Less dividends and distributions: | | | | | | | | | | | | | | | | | | | | | | | | | | | | |
From net investment income | | | (0.31 | ) | | | (0.61 | ) | | | (0.52 | ) | | | (0.40 | ) | | | (0.61 | ) | | | (0.49 | ) | | | (0.71 | ) |
From net realized gain on investments | | | — | | | | — | | | | — | | | | — | | | | — | | | | — | | | | (5.41 | ) |
| | | | | | | | | | | | | | | | | | | | | | | | | | | | |
Total dividends and distributions | | | (0.31 | ) | | | (0.61 | ) | | | (0.52 | ) | | | (0.40 | ) | | | (0.61 | ) | | | (0.49 | ) | | | (6.12 | ) |
| | | | | | | | | | | | | | | | | | | | | | | | | | | | |
Net asset value at end of period | | $ | 45.14 | | | $ | 39.49 | | | $ | 35.14 | | | $ | 33.91 | | | $ | 29.94 | | | $ | 26.98 | | | $ | 41.59 | |
| | | | | | | | | | | | | | | | | | | | | | | | | | | | |
Total investment return (b) | | | 15.17 | %(c) | | | 14.13 | % | | | 5.14 | % | | | 14.67 | % | | | 13.73 | % | | | (34.24 | %)(c) | | | 6.10 | % |
Ratios (to average net assets)/Supplemental Data: | | | | | | | | | | | | | | | | | | | | | | | | | | | | |
Net investment income (loss) | | | 1.39 | %†† | | | 1.65 | % | | | 1.47 | % | | | 1.24 | % | | | 1.49 | % | | | 1.66 | % †† | | | 1.72 | % |
Net expenses | | | 0.99 | %†† | | | 0.99 | % | | | 0.99 | % | | | 1.01 | % | | | 0.94 | % | | | 0.90 | % †† | | | 0.90 | % |
Expenses (before reimbursement/waiver) | | | 1.03 | %†† | | | 1.02 | % | | | 1.03 | % | | | 1.03 | % | | | 1.11 | % | | | 1.06 | % †† | | | 1.02 | % |
Portfolio turnover rate | | | 33 | % | | | 75 | % | | | 74 | % | | | 64 | % | | | 93 | % | | | 106 | % | | | 71 | % |
Net assets at end of period (in 000’s) | | $ | 6,645 | | | $ | 4,658 | | | $ | 3,869 | | | $ | 3,351 | | | $ | 2,268 | | | $ | 1,370 | | | $ | 1,097 | |
| *** | The Fund changed its fiscal year end from December 31 to October 31. |
| (a) | Per share data based on average shares outstanding during the period. |
| (b) | Total investment return is calculated exclusive of sales charges and assumes the reinvestment of dividends and distributions. Class R1 shares are not subject to sales charges. |
| (c) | Total investment return is not annualized. |
| | | | |
| 20 | | MainStay ICAP Equity Fund | | The notes to the financial statements are an integral part of,
and should be read in conjunction with, the financial statements. |
Financial Highlights selected per share data and ratios
| | | | | | | | | | | | | | | | | | | | | | | | | | | | |
| | | Class R2 | |
| | | Six months
ended
April 30, | | | Year ended October 31, | | | January 1,
2008***
through
October 31, | | | Year ended
December 31, | |
| | | 2013* | | | 2012 | | | 2011 | | | 2010 | | | 2009 | | | 2008 | | | 2007 | |
Net asset value at beginning of period | | $ | 39.40 | | | $ | 35.08 | | | $ | 33.85 | | | $ | 29.90 | | | $ | 26.94 | | | $ | 41.54 | | | $ | 45.02 | |
| | | | | | | | | | | | | | | | | | | | | | | | | | | | |
Net investment income (loss) | | | 0.23 | (a) | | | 0.47 | (a) | | | 0.44 | (a) | | | 0.30 | (a) | | | 0.33 | (a) | | | 0.44 | | | | 0.63 | |
Net realized and unrealized gain (loss) on investments | | | 5.66 | | | | 4.37 | | | | 1.21 | | | | 3.97 | | | | 3.17 | | | | (14.62 | ) | | | 1.92 | |
| | | | | | | | | | | | | | | | | | | | | | | | | | | | |
Total from investment operations | | | 5.89 | | | | 4.84 | | | | 1.65 | | | | 4.27 | | | | 3.50 | | | | (14.18 | ) | | | 2.55 | |
| | | | | | | | | | | | | | | | | | | | | | | | | | | | |
Less dividends and distributions: | | | | | | | | | | | | | | | | | | | | | | | | | | | | |
From net investment income | | | (0.25 | ) | | | (0.52 | ) | | | (0.42 | ) | | | (0.32 | ) | | | (0.54 | ) | | | (0.42 | ) | | | (0.62 | ) |
From net realized gain on investments | | | — | | | | — | | | | — | | | | — | | | | — | | | | — | | | | (5.41 | ) |
| | | | | | | | | | | | | | | | | | | | | | | | | | | | |
Total dividends and distributions | | | (0.25 | ) | | | (0.52 | ) | | | (0.42 | ) | | | (0.32 | ) | | | (0.54 | ) | | | (0.42 | ) | | | (6.03 | ) |
| | | | | | | | | | | | | | | | | | | | | | | | | | | | |
Net asset value at end of period | | $ | 45.04 | | | $ | 39.40 | | | $ | 35.08 | | | $ | 33.85 | | | $ | 29.90 | | | $ | 26.94 | | | $ | 41.54 | |
| | | | | | | | | | | | | | | | | | | | | | | | | | | | |
Total investment return (b) | | | 14.99 | %(c) | | | 13.82 | % | | | 4.84 | % | | | 14.36 | % | | | 13.47 | % | | | (34.38 | %)(c) | | | 5.82 | % |
Ratios (to average net assets)/Supplemental Data: | | | | | | | | | | | | | | | | | | | | | | | | | | | | |
Net investment income (loss) | | | 1.09 | %†† | | | 1.24 | % | | | 1.22 | % | | | 0.93 | % | | | 1.27 | % | | | 1.43 | % †† | | | 1.29 | % |
Net expenses | | | 1.28 | %†† | | | 1.27 | % | | | 1.28 | % | | | 1.28 | % | | | 1.19 | % | | | 1.15 | % †† | | | 1.15 | % |
Expenses (before waiver/reimbursement) | | | 1.28 | %†† | | | 1.27 | % | | | 1.28 | % | | | 1.28 | % | | | 1.36 | % | | | 1.31 | % †† | | | 1.27 | % |
Portfolio turnover rate | | | 33 | % | | | 75 | % | | | 74 | % | | | 64 | % | | | 93 | % | | | 106 | % | | | 71 | % |
Net assets at end of period (in 000’s) | | $ | 18,199 | | | $ | 12,618 | | | $ | 6,096 | | | $ | 4,313 | | | $ | 2,050 | | | $ | 781 | | | $ | 1,156 | |
| *** | The Fund changed its fiscal year end from December 31 to October 31. |
| (a) | Per share data based on average shares outstanding during the period. |
| (b) | Total investment return is calculated exclusive of sales charges and assumes the reinvestment of dividends and distributions. Class R2 shares are not subject to sales charges. |
| (c) | Total investment return is not annualized. |
| | | | | | |
The notes to the financial statements are an integral part of,
and should be read in conjunction with, the financial statements. | | mainstayinvestments.com | | | 21 | |
Financial Highlights selected per share data and ratios
| | | | | | | | | | | | | | | | | | | | | | | | | | | | |
| | | Class R3 | |
| | | Six months
ended
April 30, | | | Year ended October 31, | | | January 1,
2008***
through
October 31, | | | Year ended
December 31, | |
| | | 2013* | | | 2012 | | | 2011 | | | 2010 | | | 2009 | | | 2008 | | | 2007 | |
Net asset value at beginning of period | | $ | 39.32 | | | $ | 35.04 | | | $ | 33.81 | | | $ | 29.89 | | | $ | 26.93 | | | $ | 41.52 | | | $ | 45.00 | |
| | | | | | | | | | | | | | | | | | | | | | | | | | | | |
Net investment income (loss) | | | 0.19 | (a) | | | 0.43 | (a) | | | 0.33 | (a) | | | 0.22 | (a) | | | 0.23 | (a) | | | 0.38 | | | | 0.57 | |
Net realized and unrealized gain (loss) on investments | | | 5.63 | | | | 4.30 | | | | 1.23 | | | | 3.97 | | | | 3.21 | | | | (14.61 | ) | | | 1.86 | |
| | | | | | | | | | | | | | | | | | | | | | | | | | | | |
Total from investment operations | | | 5.82 | | | | 4.73 | | | | 1.56 | | | | 4.19 | | | | 3.44 | | | | (14.23 | ) | | | 2.43 | |
| | | | | | | | | | | | | | | | | | | | | | | | | | | | |
Less dividends and distributions: | | | | | | | | | | | | | | | | | | | | | | | | | | | | |
From net investment income | | | (0.19 | ) | | | (0.45 | ) | | | (0.33 | ) | | | (0.27 | ) | | | (0.48 | ) | | | (0.36 | ) | | | (0.50 | ) |
From net realized gain on investments | | | — | | | | — | | | | — | | | | — | | | | — | | | | — | | | | (5.41 | ) |
| | | | | | | | | | | | | | | | | | | | | | | | | | | | |
Total dividends and distributions | | | (0.19 | ) | | | (0.45 | ) | | | (0.33 | ) | | | (0.27 | ) | | | (0.48 | ) | | | (0.36 | ) | | | (5.91 | ) |
| | | | | | | | | | | | | | | | | | | | | | | | | | | | |
Net asset value at end of period | | $ | 44.95 | | | $ | 39.32 | | | $ | 35.04 | | | $ | 33.81 | | | $ | 29.89 | | | $ | 26.93 | | | $ | 41.52 | |
| | | | | | | | | | | | | | | | | | | | | | | | | | | | |
Total investment return (b) | | | 14.85 | %(c) | | | 13.52 | % | | | 4.59 | % | | | 14.07 | % | | | 13.22 | % | | | (34.51 | %)(c) | | | 5.55 | % |
Ratios (to average net assets)/Supplemental Data: | | | | | | | | | | | | | | | | | | | | | | | | | | | | |
Net investment income (loss) | | | 0.93 | %†† | | | 1.15 | % | | | 0.92 | % | | | 0.70 | % | | | 0.88 | % | | | 1.16 | % †† | | | 0.98 | % |
Net expenses | | | 1.53 | %†† | | | 1.52 | % | | | 1.53 | % | | | 1.53 | % | | | 1.45 | % | | | 1.40 | % †† | | | 1.40 | % |
Expenses (before waiver/reimbursement) | | | 1.53 | %†† | | | 1.52 | % | | | 1.53 | % | | | 1.53 | % | | | 1.60 | % | | | 1.57 | % †† | | | 1.52 | % |
Portfolio turnover rate | | | 33 | % | | | 75 | % | | | 74 | % | | | 64 | % | | | 93 | % | | | 106 | % | | | 71 | % |
Net assets at end of period (in 000’s) | | $ | 3,201 | | | $ | 2,972 | | | $ | 2,864 | | | $ | 2,257 | | | $ | 365 | | | $ | 72 | | | $ | 67 | |
| *** | The Fund changed its fiscal year end from December 31 to October 31. |
| (a) | Per share data based on average shares outstanding during the period. |
| (b) | Total investment return is calculated exclusive of sales charges and assumes the reinvestment of dividends and distributions. Class R3 shares are not subject to sales charges. |
| (c) | Total investment return is not annualized. |
| | | | |
| 22 | | MainStay ICAP Equity Fund | | The notes to the financial statements are an integral part of,
and should be read in conjunction with, the financial statements. |
MainStay ICAP Select Equity Fund
Investment and Performance Comparison1 (Unaudited)
Performance data quoted represents past performance. Past performance is no guarantee of future results. Because of market volatility, current performance may be lower or higher than the figures shown. Investment return and principal value will fluctuate, and as a result, when shares are redeemed, they may be worth more or less than their original cost. The graph below depicts the historical performance of Class I shares of the Fund. Performance will vary from class to class based on differences in class-specific expenses and sales charges. For performance information current to the most recent month-end, please call 800-MAINSTAY (624-6782) or visit mainstayinvestments.com.
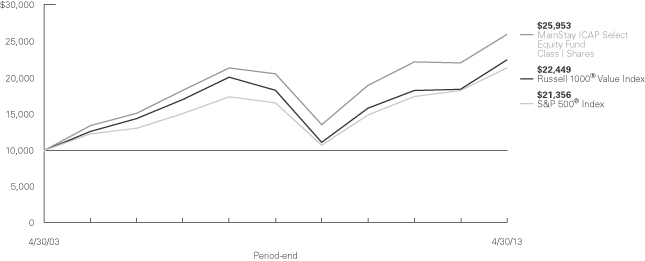
Average Annual Total Returns for the Period Ended April 30, 2013
| | | | | | | | | | | | | | | | | | | | | | | | |
| Class | | Sales Charge | | | | Six Months | | | One Year | | | Five Years | | | Ten Years | | | Gross
Expense
Ratio2 | |
Investor Class Shares3 | | Maximum 5.5% I
nitial Sales Charge | | With sales charges | | | 9.14 | % | | | 10.61 | % | | | 3.07 | % | | | 8.96 | % | | | 1.43 | % |
| | | | | Excluding sales charges | | | 15.49 | | | | 17.05 | | | | 4.24 | | | | 9.58 | | | | 1.43 | |
Class A Shares4 | | Maximum 5.5%
Initial Sales Charge | | With sales charges | | | 9.26 | | | | 10.88 | | | | 3.31 | | | | 9.09 | | | | 1.25 | |
| | | | | Excluding sales charges | | | 15.62 | | | | 17.33 | | | | 4.49 | | | | 9.71 | | | | 1.25 | |
Class B Shares5 | | Maximum 5% CDSC | | With sales charges | | | 10.06 | | | | 11.17 | | | | 3.12 | | | | 8.76 | | | | 2.18 | |
| | | if Redeemed Within the
First Six Years of Purchase | | Excluding sales charges | | | 15.06 | | | | 16.17 | | | | 3.47 | | | | 8.76 | | | | 2.18 | |
Class C Shares4 | | Maximum 1% CDSC | | With sales charges | | | 14.06 | | | | 15.21 | | | | 3.47 | | | | 8.77 | | | | 2.18 | |
| | | if Redeemed Within
One Year of Purchase | | Excluding sales charges | | | 15.06 | | | | 16.21 | | | | 3.47 | | | | 8.77 | | | | 2.18 | |
| Class I Shares | | No Sales Charge | | | | | 15.78 | | | | 17.68 | | | | 4.77 | | | | 10.01 | | | | 1.00 | |
| Class R1 Shares4 | | No Sales Charge | | | | | 15.72 | | | | 17.56 | | | | 4.63 | | | | 9.88 | | | | 1.10 | |
| Class R2 Shares4 | | No Sales Charge | | | | | 15.58 | | | | 17.25 | | | | 4.36 | | | | 9.60 | | | | 1.35 | |
| Class R3 Shares4 | | No Sales Charge | | | | | 15.38 | | | | 16.85 | | | | 4.09 | | | | 9.32 | | | | 1.60 | |
| 1. | The performance table and graph do not reflect the deduction of taxes that a shareholder would pay on distributions or Fund share redemptions. Total returns reflect maximum applicable sales charges as indicated in the table above, changes in share price, and reinvestment of dividend and capital gain distributions. The graph assumes the initial investment amount shown above and reflects the deduction of all sales charges that would have applied for the period of investment. Performance figures reflect certain fee waivers and/or expense limitations, without which total returns may have been lower. For more information on share classes and current fee waivers and/or expense limitations, please refer to the notes to the financial statements. Effective August 31, 2006, ICAP Select Equity Fund was renamed MainStay ICAP Select Equity Fund. At that time, the Fund’s existing no-load shares were redesignated as Class I shares. |
| 2. | The gross expense ratios presented reflect the Fund’s “Total Annual Fund Operating Expenses” from the most recent Prospectus and may differ from other expense ratios disclosed in this report. |
| 3. | Performance figures for Investor Class shares, first offered on April 29, 2008, include the historical performance of Class A shares through April 28, 2008, adjusted for differences in certain expenses and fees. Unadjusted, the performance for Investor Class shares would likely have been different. |
| 4. | Performance figures for Class A, C, R1, R2 and R3 shares, first offered on September 1, 2006, include the historical performance of Class I shares through August 31, 2006, adjusted for differences in certain expenses and fees. Unadjusted, the performance for these share classes would likely have been different. |
| 5. | Performance figures for Class B shares, first offered on November 13, 2009, include the historical performance of Class I shares through November 12, 2009, adjusted for differences in certain expenses and fees. Unadjusted, the performance for Class B shares would likely have been different. |
The footnotes on the next page are an integral part of the table and graph and should be carefully read in conjunction with them.
| | | | |
| mainstayinvestments.com | | | 23 | |
| | | | | | | | | | | | | | | | |
| Benchmark Performance | | Six
Months | | | One
Year | | | Five
Years | | | Ten
Years | |
Russell 1000® Value Index6 | | | 16.31 | % | | | 21.80 | % | | | 4.17 | % | | | 8.42 | % |
S&P 500® Index7 | | | 14.42 | | | | 16.89 | | | | 5.21 | | | | 7.88 | |
Average Lipper Large-Cap Value Fund8 | | | 15.25 | | | | 18.41 | | | | 3.52 | | | | 7.51 | |
| 6. | The Russell 1000® Value Index measures the performance of the large-cap value segment of the U.S. equity universe. It includes those Russell 1000® Index companies with lower price-to-book ratios and lower expected growth values. The Russell 1000® Value Index is the Fund’s broad-based securities market index for comparison purposes. Results assume reinvestment of all dividends and capital gains. An investment cannot be made directly in an index. |
| 7. | “S&P 500®” is a trademark of The McGraw-Hill Companies, Inc. The S&P 500® Index is widely regarded as the standard index for measuring large-cap U.S. stock market performance. The S&P 500® Index is the Fund’s secondary benchmark. Results assume reinvestment of all dividends and capital gains. An investment cannot be made directly in an index. |
| 8. | The average Lipper large-cap value fund is representative of funds that, by portfolio practice, invest at least 75% of their equity assets in companies with market capitalizations (on a three-year weighted basis) above Lipper’s U.S. Diversified Equity large-cap floor. Large-cap value funds typically have a below average price-to-earnings ratio, price-to-book ratio, and three-year sales-per-share growth value, compared to the S&P 500® Index. This benchmark is a product of Lipper Inc. Lipper Inc. is an independent monitor of fund performance. Results are based on total returns with all dividend and capital gain distributions reinvested. |
| | |
| 24 | | MainStay ICAP Select Equity Fund |
The footnotes on the preceding page are an integral part of the table and graph and should be carefully read in conjunction with them.
Cost in Dollars of a $1,000 Investment in MainStay ICAP Select Equity Fund (Unaudited)
The example below is intended to describe the fees and expenses borne by shareholders during the six-month period from November 1, 2012, to April 30, 2013, and the impact of those costs on your investment.
Example
As a shareholder of the Fund, you incur two types of costs: (1) transaction costs, including exchange fees and sales charges (loads) on purchases (as applicable), and (2) ongoing costs, including management fees, distribution and/or service (12b-1) fees, and other Fund expenses (as applicable). This example is intended to help you understand your ongoing costs (in dollars) of investing in the Fund and to compare these costs with the ongoing costs of investing in other mutual funds. The example is based on an investment of $1,000 made at the beginning of the six-month period and held for the entire period from November 1, 2012, to April 30, 2013.
This example illustrates your Fund’s ongoing costs in two ways:
Actual Expenses
The second and third data columns in the table below provide information about actual account values and actual expenses. You may use the information in these columns, together with the amount you invested, to estimate the expenses that you paid during the six months ended April 30, 2013. Simply divide your account value by $1,000 (for example, an $8,600 account value divided by $1,000 = 8.6), then
multiply the result by the number under the heading entitled “Expenses Paid During Period” to estimate the expenses you paid on your account during this period.
Hypothetical Example for Comparison Purposes
The fourth and fifth data columns in the table below provide information about hypothetical account values and hypothetical expenses based on the Fund’s actual expense ratio and an assumed rate of return of 5% per year before expenses, which is not the Fund’s actual return. The hypothetical account values and expenses may not be used to estimate the actual ending account balances or expenses you paid for the six-month period shown. You may use this information to compare the ongoing costs of investing in the Fund with the ongoing costs of investing in other Funds. To do so, compare this 5% hypothetical example with the 5% hypothetical examples that appear in the shareholder reports of the other Funds.
Please note that the expenses shown in the table are meant to highlight your ongoing costs only and do not reflect any transactional costs, such as exchange fees or sales charges (loads). Therefore, the fourth and fifth data columns of the table are useful in comparing ongoing costs only and will not help you determine the relative total costs of owning different funds. In addition, if these transactional costs were included, your costs would have been higher.
| | | | | | | | | | | | | | | | | | | | |
| | | | | | | | | | | | | | | | |
Share Class | | Beginning
Account
Value
11/1/12 | | | Ending Account
Value (Based
on Actual
Returns and
Expenses)
4/30/13 | | | Expenses
Paid
During
Period1 | | | Ending Account
Value (Based
on Hypothetical
5% Annualized
Return and
Actual Expenses)
4/30/13 | | | Expenses
Paid
During
Period1 | |
| | | | | |
| Investor Class Shares | | $ | 1,000.00 | | | $ | 1,154.90 | | | $ | 7.53 | | | $ | 1,017.80 | | | $ | 7.05 | |
| | | | | |
| Class A Shares | | $ | 1,000.00 | | | $ | 1,156.20 | | | $ | 6.31 | | | $ | 1,018.90 | | | $ | 5.91 | |
| | | | | |
| Class B Shares | | $ | 1,000.00 | | | $ | 1,150.60 | | | $ | 11.52 | | | $ | 1,014.10 | | | $ | 10.79 | |
| | | | | |
| Class C Shares | | $ | 1,000.00 | | | $ | 1,150.60 | | | $ | 11.52 | | | $ | 1,014.10 | | | $ | 10.79 | |
| | | | | |
| Class I Shares | | $ | 1,000.00 | | | $ | 1,157.80 | | | $ | 4.82 | | | $ | 1,020.30 | | | $ | 4.51 | |
| | | | | |
| Class R1 Shares | | $ | 1,000.00 | | | $ | 1,157.20 | | | $ | 5.35 | | | $ | 1,019.80 | | | $ | 5.01 | |
| | | | | |
| Class R2 Shares | | $ | 1,000.00 | | | $ | 1,155.80 | | | $ | 6.68 | | | $ | 1,018.60 | | | $ | 6.26 | |
| | | | | |
| Class R3 Shares | | $ | 1,000.00 | | | $ | 1,153.80 | | | $ | 8.49 | | | $ | 1,016.90 | | | $ | 7.95 | |
| 1. | Expenses are equal to the Fund’s annualized expense ratio of each class (1.41% for Investor Class, 1.18% for Class A, 2.16% for Class B and Class C, 0.90% for Class I, 1.00% for Class R1, 1.25% for Class R2 and 1.59% for Class R3) multiplied by the average account value over the period, divided by 365 and multiplied by 181 (to reflect the six-month period). The table above represents the actual expenses incurred during the six-month period. |
| | | | |
| mainstayinvestments.com | | | 25 | |
Industry Composition as of April 30, 2013 (Unaudited)
| | | | |
| Pharmaceuticals | | | 11.8 | % |
| Oil, Gas & Consumable Fuels | | | 10.6 | |
| Media | | | 8.6 | |
| Health Care Equipment & Supplies | | | 6.5 | |
| Diversified Financial Services | | | 6.1 | |
| Industrial Conglomerates | | | 5.1 | |
| Wireless Telecommunication Services | | | 4.5 | |
| Commercial Banks | | | 4.4 | |
| Chemicals | | | 4.1 | |
| Semiconductors & Semiconductor Equipment | | | 4.0 | |
| Hotels, Restaurants & Leisure | | | 3.5 | |
| Aerospace & Defense | | | 3.3 | |
| | | | |
| Auto Components | | | 3.2 | % |
| Consumer Finance | | | 3.2 | |
| Food & Staples Retailing | | | 3.1 | |
| Communications Equipment | | | 3.0 | |
| Electric Utilities | | | 2.5 | |
| Software | | | 2.4 | |
| Beverages | | | 2.3 | |
| Energy Equipment & Services | | | 2.2 | |
| Health Care Providers & Services | | | 2.2 | |
| Short-Term Investment | | | 3.1 | |
| Other Assets, Less Liabilities | | | 0.3 | |
| | | | |
| | | 100.0 | % |
| | | | |
See Portfolio of Investments beginning on page 29 for specific holdings within these categories.
Top Ten Holdings as of April 30, 2013 (excluding short-term investment)
| 6. | Vodafone Group PLC, Sponsored ADR |
| 7. | Texas Instruments, Inc. |
| 9. | Baxter International, Inc. |
| | |
| 26 | | MainStay ICAP Select Equity Fund |
Portfolio Management Discussion and Analysis (Unaudited)
Questions answered by portfolio managers Jerrold K. Senser, CFA, Thomas R. Wenzel, CFA, and Thomas M. Cole, CFA, of Institutional Capital LLC (ICAP), the Fund’s Subadvisor.
How did MainStay ICAP Select Equity Fund perform relative to its peers and its benchmark during the six months ended April 30, 2013?
Excluding all sales charges, MainStay ICAP Select Equity Fund returned 15.49% for Investor Class shares, 15.62% for Class A shares and 15.06% for Class B and Class C shares for the six months ended April 30, 2013. Over the same period, Class I shares returned 15.78%, Class R1 shares returned 15.72%, Class R2 shares returned 15.58% and Class R3 shares returned 15.38%. Investor Class, Class A, Class I, Class R1, Class R2 and Class R3 shares outperformed—and Class B and Class C shares underperformed—the 15.25% return of the average Lipper1 large-cap value fund for the six months ended April 30, 2013. All share classes underperformed the 16.31% return of the Russell 1000® Value Index2 for the same period. The Russell 1000® Value Index is the Fund’s broad-based securities-market index. See page 23 for Fund returns with applicable sales charges.
What factors affected the Fund’s relative performance during the reporting period?
A number of key drivers affected the Fund’s performance relative to the Russell 1000® Value Index. Favorable stock selection in the consumer discretionary and health care sectors added to the Fund’s relative performance. Stock selection in the materials and information technology sectors, however, detracted from performance relative to the Index. The Fund benefited by being overweight relative to the Russell 1000® Value Index in the information technology sector. An underweight position in the financials sector detracted from the Fund’s performance relative to the Russell 1000® Value Index.
During the reporting period, which sectors were the strongest positive contributors to the Fund’s relative performance and which sectors were particularly weak?
The sectors that made the strongest positive contributions to the Fund’s performance relative to the Russell 1000® Value Index were consumer discretionary, health care and information technology. (Contributions take weightings and total returns into account.) Favorable stock selection was the primary driver for consumer discretionary and health care. An overweight position in the information technology sector added to the Fund’s relative performance.
The sectors that detracted the most from the Fund’s performance relative to the Russell 1000® Value Index were materials, financials and energy. Stock selection was the primary driver in each case.
During the reporting period, which individual stocks made the strongest positive contributions to the Fund’s absolute performance and which stocks detracted the most?
The stocks that made the strongest positive contributions to the Fund’s absolute performance were media company Time Warner, semiconductor manufacturer Texas Instruments and diversified pharmaceutical company Pfizer. Time Warner’s stock outpaced the Russell 1000® Value Index, as the company reported strong operational performance and provided expectations of growth in affiliate-fee revenue. Texas Instruments’ stock advanced as the company continued to exit unattractive businesses and reduce expenditures to increase operating margins. Pfizer showed strong performance during the reporting period, as investors approved of the company’s plan to divest its nutritionals and animal health businesses. All three companies returned cash to shareholders through dividends and stock buybacks. All three positions remained in the Fund at the end of the reporting period.
Detractors from the Fund’s absolute performance included gold miner Barrick Gold, natural gas producer Encana and software maker Microsoft. Barrick Gold lagged as production delays and cost overruns hampered the company’s results and outlook. Encana suffered as continued low natural gas prices and increased capital expenditures weighed on the company’s results. Microsoft underperformed the Russell 1000® Value Index, as the success of Windows 8 took longer than expected for the marketplace to assess because of limited hardware availability. We eliminated the Fund’s positions in Barrick Gold and Microsoft by the end of the reporting period. Encana remained in the Fund at the end of the reporting period because we believed that the stock was attractively valued and had strong catalysts for potential appreciation.
Did the Fund make any significant purchases or sales during the reporting period?
We continued to look for stocks with attractive valuations and specific catalysts that we believed could trigger appreciation over a 12- to 18-month time frame.
We added a Fund position in global restaurant company McDonald’s. In our view, McDonald’s reimaging initiative and emphasis on value could benefit the stock by improving the company’s competitive position. We also added a Fund position in pharmacy retailer CVS Caremark. In our view, the firm is well-positioned to return significant levels of cash to shareholders via share buybacks and dividends.
| 1. | See footnote on page 24 for more information on Lipper Inc. |
| 2. | See footnote on page 24 for more information on the Russell 1000® Value Index. |
| | | | |
| mainstayinvestments.com | | | 27 | |
In addition to the sales already mentioned, we sold the Fund’s positions in integrated oil and gas producer Occidental Petroleum and in diversified global health care firm Novartis. Each was sold for other positions that we believed had greater potential upside and were more attractive on a relative valuation basis.
How did the Fund’s sector weightings change during the reporting period?
The Fund increased its sector exposure relative to the Russell 1000® Value Index in the consumer staples and utilities sectors. In both sectors, the Fund maintained underweight positions relative to the Russell 1000® Value Index.
During the reporting period, the Fund decreased its sector weightings relative to the Russell 1000® Value Index in the
information technology and financials sectors. In information technology, the Fund remained overweight relative to the Index. In financials, the Fund moved from an underweight position to a more substantially underweight position relative to the Index.
How was the Fund positioned at the end of the reporting period?
As of April 30, 2013, the Fund was most significantly overweight relative to the Russell 1000® Value Index in the health care and consumer discretionary sectors. As of the same date, the Fund was most significantly underweight relative to the Index in financials and utilities. This positioning reflected our view on the prospects for economic growth and the relative attractiveness of individual holdings in these sectors.
The opinions expressed are those of the portfolio managers as of the date of this report and are subject to change. There is no guarantee that any forecast made will come to pass. This material does not constitute investment advice and is not intended as an endorsement of any specific investment.
| | |
| 28 | | MainStay ICAP Select Equity Fund |
Portfolio of Investments April 30, 2013 (Unaudited)
| | | | | | | | |
| | |
| | | Shares | | | Value | |
| | | | | | | | |
| Common Stocks 96.6%† | |
Aerospace & Defense 3.3% | |
Honeywell International, Inc. | | | 2,029,124 | | | $ | 149,221,779 | |
| | | | | | | | |
|
Auto Components 3.2% | |
Johnson Controls, Inc. | | | 4,180,225 | | | | 146,349,677 | |
| | | | | | | | |
|
Beverages 2.3% | |
Coca-Cola Co. (The) | | | 2,498,200 | | | | 105,748,806 | |
| | | | | | | | |
|
Chemicals 4.1% | |
Monsanto Co. | | | 1,100,653 | | | | 117,571,753 | |
Mosaic Co. (The) | | | 1,107,250 | | | | 68,195,528 | |
| | | | | | | | |
| | | | 185,767,281 | |
| | | | | | | | |
Commercial Banks 4.4% | |
BB&T Corp. | | | 2,508,258 | | | | 77,179,099 | |
PNC Financial Services Group, Inc. | | | 1,798,500 | | | | 122,082,180 | |
| | | | | | | | |
| | | | 199,261,279 | |
| | | | | | | | |
Communications Equipment 3.0% | |
Cisco Systems, Inc. | | | 6,455,387 | | | | 135,046,696 | |
| | | | | | | | |
|
Consumer Finance 3.2% | |
Capital One Financial Corp. | | | 2,474,572 | | | | 142,980,770 | |
| | | | | | | | |
|
Diversified Financial Services 6.1% | |
Citigroup, Inc. | | | 3,032,657 | | | | 141,503,775 | |
JPMorgan Chase & Co. | | | 2,691,184 | | | | 131,894,928 | |
| | | | | | | | |
| | | | 273,398,703 | |
| | | | | | | | |
Electric Utilities 2.5% | |
Exelon Corp. | | | 2,972,500 | | | | 111,498,475 | |
| | | | | | | | |
|
Energy Equipment & Services 2.2% | |
Halliburton Co. | | | 2,342,600 | | | | 100,193,002 | |
| | | | | | | | |
|
Food & Staples Retailing 3.1% | |
CVS Caremark Corp. | | | 2,374,700 | | | | 138,160,046 | |
| | | | | | | | |
|
Health Care Equipment & Supplies 6.5% | |
¨Baxter International, Inc. | | | 2,348,600 | | | | 164,096,682 | |
Covidien PLC | | | 2,050,077 | | | | 130,876,916 | |
| | | | | | | | |
| | | | 294,973,598 | |
| | | | | | | | |
Health Care Providers & Services 2.2% | |
McKesson Corp. | | | 949,350 | | | | 100,460,217 | |
| | | | | | | | |
|
Hotels, Restaurants & Leisure 3.5% | |
¨McDonald’s Corp. | | | 1,545,200 | | | | 157,826,728 | |
| | | | | | | | |
| | | | | | | | |
| | |
| | | Shares | | | Value | |
| | | | | | | | |
Industrial Conglomerates 5.1% | |
¨General Electric Co. | | | 10,405,165 | | | $ | 231,931,128 | |
| | | | | | | | |
|
Media 8.6% | |
¨Time Warner, Inc. | | | 3,605,659 | | | | 215,546,295 | |
¨Viacom, Inc. Class B | | | 2,687,944 | | | | 172,001,537 | |
| | | | | | | | |
| | | | 387,547,832 | |
| | | | | | | | |
Oil, Gas & Consumable Fuels 10.6% | |
Encana Corp. | | | 3,578,050 | | | | 66,015,022 | |
¨Exxon Mobil Corp. | | | 2,428,114 | | | | 216,077,865 | |
Marathon Oil Corp. | | | 3,456,600 | | | | 112,927,122 | |
Southwestern Energy Co. (a) | | | 2,205,066 | | | | 82,513,570 | |
| | | | | | | | |
| | | | 477,533,579 | |
| | | | | | | | |
Pharmaceuticals 11.8% | |
¨Johnson & Johnson | | | 2,770,950 | | | | 236,168,069 | |
¨Pfizer, Inc. | | | 10,206,503 | | | | 296,703,042 | |
| | | | | | | | |
| | | | 532,871,111 | |
| | | | | | | | |
Semiconductors & Semiconductor Equipment 4.0% | |
¨Texas Instruments, Inc. | | | 4,923,450 | | | | 178,278,124 | |
| | | | | | | | |
|
Software 2.4% | |
Adobe Systems, Inc. (a) | | | 2,391,150 | | | | 107,793,042 | |
| | | | | | | | |
|
Wireless Telecommunication Services 4.5% | |
¨Vodafone Group PLC, Sponsored ADR | | | 6,696,901 | | | | 204,858,202 | |
| | | | | | | | |
Total Common Stocks
(Cost $3,329,702,029) | | | | | | | 4,361,700,075 | |
| | | | | | | | |
| | |
| | | | | | | | |
| | | Principal
Amount | | | | |
| | | | | | | | |
| Short-Term Investment 3.1% | |
Repurchase Agreement 3.1% | |
State Street Bank and Trust Co.
0.01%, dated 4/30/13
due 5/1/13
Proceeds at Maturity $139,972,110 (Collateralized by Federal National Mortgage Association securities with rates between 2.08% and 2.17% and maturity dates between 11/2/22 and 11/7/22, with a Principal Amount of $141,250,000 and a Market Value of $142,774,462) | | $ | 139,972,071 | | | $ | 139,972,071 | |
| | | | | | | | |
Total Short-Term Investment
(Cost $139,972,071) | | | | | | | 139,972,071 | |
| | | | | | | | |
Total Investments
(Cost $3,469,674,100) (b) | | | 99.7 | % | | | 4,501,672,146 | |
Other Assets, Less Liabilities | | | 0.3 | | | | 15,288,771 | |
Net Assets | | | 100.0 | % | | $ | 4,516,960,917 | |
| † | Percentages indicated are based on Fund net assets. |
| ¨ | | Among the Fund’s 10 largest holdings, as of April 30, 2013, excluding short-term investment. May be subject to change daily. |
| | | | | | |
The notes to the financial statements are an integral part of,
and should be read in conjunction with, the financial statements. | | mainstayinvestments.com | | | 29 | |
Portfolio of Investments April 30, 2013 (Unaudited) (continued)
| (a) | Non-income producing security. |
| (b) | As of April 30, 2013, cost is $3,510,714,502 for federal income tax purposes and net unrealized appreciation is as follows: |
| | | | |
Gross unrealized appreciation | | $ | 1,040,172,167 | |
Gross unrealized depreciation | | | (49,214,523 | ) |
| | | | |
Net unrealized appreciation | | $ | 990,957,644 | |
| | | | |
The following abbreviation is used in the above portfolio:
ADR—American Depositary Receipt.
The following is a summary of the fair valuations according to the inputs used as of April 30, 2013, for valuing the Fund’s assets.
Asset Valuation Inputs
| | | | | | | | | | | | | | | | |
Description | | Quoted
Prices in
Active
Markets for
Identical
Assets (Level 1) | | | Significant
Other
Observable
Inputs (Level 2) | | | Significant
Unobservable
Inputs
(Level 3) | | | Total | |
| Investments in Securities (a) | | | | | | | | | | | | | | | | |
| Common Stocks | | $ | 4,361,700,075 | | | $ | — | | | $ | — | | | $ | 4,361,700,075 | |
| Short-Term Investment | | | | | | | | | | | | | | | | |
Repurchase Agreement | | | — | | | | 139,972,071 | | | | — | | | | 139,972,071 | |
| | | | | | | | | | | | | | | | |
| Total Investments in Securities | | $ | 4,361,700,075 | | | $ | 139,972,071 | | | $ | — | | | $ | 4,501,672,146 | |
| | | | | | | | | | | | | | | | |
| (a) | For a complete listing of investments and their industries, see the Portfolio of Investments. |
The Fund recognizes transfers between the levels as of the beginning of the period.
For the period ended April 30, 2013, the Fund did not have any transfers between Level 1 and Level 2 fair value measurements. (See Note 2)
As of April 30, 2013, the Fund did not hold any investments with significant unobservable inputs (Level 3). (See Note 2)
| | | | |
| 30 | | MainStay ICAP Select Equity Fund | | The notes to the financial statements are an integral part of,
and should be read in conjunction with, the financial statements. |
Statement of Assets and Liabilities as of April 30, 2013 (Unaudited)
| | | | |
| Assets | | | | |
Investment in securities, at value
(identified cost $3,469,674,100) | | $ | 4,501,672,146 | |
Receivables: | | | | |
Investment securities sold | | | 18,946,421 | |
Fund shares sold | | | 11,364,572 | |
Dividends and interest | | | 3,560,236 | |
Other assets | | | 112,176 | |
| | | | |
Total assets | | | 4,535,655,551 | |
| | | | |
|
| Liabilities | |
Payables: | | | | |
Investment securities purchased | | | 8,785,297 | |
Fund shares redeemed | | | 5,330,493 | |
Manager (See Note 3) | | | 2,662,466 | |
Transfer agent (See Note 3) | | | 1,069,567 | |
Shareholder communication | | | 378,368 | |
NYLIFE Distributors (See Note 3) | | | 325,957 | |
Professional fees | | | 92,490 | |
Trustees | | | 8,562 | |
Custodian | | | 4,103 | |
Accrued expenses | | | 37,331 | |
| | | | |
Total liabilities | | | 18,694,634 | |
| | | | |
Net assets | | $ | 4,516,960,917 | |
| | | | |
|
| Composition of Net Assets | |
Shares of beneficial interest outstanding (par value of $.001 per share) unlimited number of shares authorized | | $ | 104,959 | |
Additional paid-in capital | | | 3,836,289,981 | |
| | | | |
| | | 3,836,394,940 | |
Undistributed net investment income | | | 1,428,969 | |
Accumulated net realized gain (loss) on investments | | | (352,861,038 | ) |
Net unrealized appreciation (depreciation) on investments | | | 1,031,998,046 | |
| | | | |
Net assets | | $ | 4,516,960,917 | |
| | | | |
| | | | |
Investor Class | | | | |
Net assets applicable to outstanding shares | | $ | 190,505,084 | |
| | | | |
Shares of beneficial interest outstanding | | | 4,431,525 | |
| | | | |
Net asset value per share outstanding | | $ | 42.99 | |
Maximum sales charge (5.50% of offering price) | | | 2.50 | |
| | | | |
Maximum offering price per share outstanding | | $ | 45.49 | |
| | | | |
Class A | | | | |
Net assets applicable to outstanding shares | | $ | 722,929,333 | |
| | | | |
Shares of beneficial interest outstanding | | | 16,815,269 | |
| | | | |
Net asset value per share outstanding | | $ | 42.99 | |
Maximum sales charge (5.50% of offering price) | | | 2.50 | |
| | | | |
Maximum offering price per share outstanding | | $ | 45.49 | |
| | | | |
Class B | | | | |
Net assets applicable to outstanding shares | | $ | 52,889,026 | |
| | | | |
Shares of beneficial interest outstanding | | | 1,240,578 | |
| | | | |
Net asset value and offering price per share outstanding | | $ | 42.63 | |
| | | | |
Class C | | | | |
Net assets applicable to outstanding shares | | $ | 103,231,669 | |
| | | | |
Shares of beneficial interest outstanding | | | 2,421,817 | |
| | | | |
Net asset value and offering price per share outstanding | | $ | 42.63 | |
| | | | |
Class I | | | | |
Net assets applicable to outstanding shares | | $ | 3,373,476,060 | |
| | | | |
Shares of beneficial interest outstanding | | | 78,331,376 | |
| | | | |
Net asset value and offering price per share outstanding | | $ | 43.07 | |
| | | | |
Class R1 | | | | |
Net assets applicable to outstanding shares | | $ | 29,731,210 | |
| | | | |
Shares of beneficial interest outstanding | | | 690,162 | |
| | | | |
Net asset value and offering price per share outstanding | | $ | 43.08 | |
| | | | |
Class R2 | | | | |
Net assets applicable to outstanding shares | | $ | 27,412,629 | |
| | | | |
Shares of beneficial interest outstanding | | | 637,631 | |
| | | | |
Net asset value and offering price per share outstanding | | $ | 42.99 | |
| | | | |
Class R3 | | | | |
Net assets applicable to outstanding shares | | $ | 16,785,906 | |
| | | | |
Shares of beneficial interest outstanding | | | 390,986 | |
| | | | |
Net asset value and offering price per share outstanding | | $ | 42.93 | |
| | | | |
| | | | | | |
The notes to the financial statements are an integral part of,
and should be read in conjunction with, the financial statements. | | mainstayinvestments.com | | | 31 | |
Statement of Operations for the six months ended April 30, 2013 (Unaudited)
| | | | |
| Investment Income (Loss) | |
Income | | | | |
Dividends (a) | | $ | 49,098,202 | |
Interest | | | 6,009 | |
| | | | |
Total income | | | 49,104,211 | |
| | | | |
Expenses | | | | |
Manager (See Note 3) | | | 16,421,634 | |
Transfer agent (See Note 3) | | | 3,365,636 | |
Distribution/Service—Investor Class (See Note 3) | | | 231,057 | |
Distribution/Service—Class A (See Note 3) | | | 816,343 | |
Distribution/Service—Class B (See Note 3) | | | 262,441 | |
Distribution/Service—Class C (See Note 3) | | | 491,033 | |
Distribution/Service—Class R2 (See Note 3) | | | 29,927 | |
Distribution/Service—Class R3 (See Note 3) | | | 38,216 | |
Shareholder communication | | | 423,538 | |
Professional fees | | | 87,186 | |
Registration | | | 79,945 | |
Trustees | | | 46,381 | |
Shareholder service (See Note 3) | | | 33,715 | |
Custodian | | | 13,861 | |
Miscellaneous | | | 88,966 | |
| | | | |
Total expenses before waiver/reimbursement | | | 22,429,879 | |
Expense waiver/reimbursement from Manager (See Note 3) | | | (1,519,872 | ) |
| | | | |
Net expenses | | | 20,910,007 | |
| | | | |
Net investment income (loss) | | | 28,194,204 | |
| | | | |
|
| Realized and Unrealized Gain (Loss) on Investments | |
Net realized gain (loss) on investments | | | 171,268,788 | |
Net change in unrealized appreciation (depreciation) on investments | | | 398,586,589 | |
| | | | |
Net realized and unrealized gain (loss) on investments | | | 569,855,377 | |
| | | | |
Net increase (decrease) in net assets resulting from operations | | $ | 598,049,581 | |
| | | | |
| (a) | Dividends recorded net of foreign withholding taxes in the amount of $1,001,969. |
| | | | |
| 32 | | MainStay ICAP Select Equity Fund | | The notes to the financial statements are an integral part of,
and should be read in conjunction with, the financial statements. |
Statements of Changes in Net Assets
for the six months ended April 30, 2013 (Unaudited) and the year ended October 31, 2012
| | | | | | | | |
| | | 2013 | | | 2012 | |
| Increase (Decrease) in Net Assets | |
Operations: | | | | | | | | |
Net investment income (loss) | | $ | 28,194,204 | | | $ | 63,278,296 | |
Net realized gain (loss) on investments (a) | | | 171,268,788 | | | | 112,152,473 | |
Net change in unrealized appreciation (depreciation) on investments | | | 398,586,589 | | | | 318,030,099 | |
| | | | |
Net increase (decrease) in net assets resulting from operations | | | 598,049,581 | | | | 493,460,868 | |
| | | | |
Dividends to shareholders: | | | | | | | | |
From net investment income: | | | | | | | | |
Investor Class | | | (912,238 | ) | | | (2,358,389 | ) |
Class A | | | (3,992,693 | ) | | | (9,073,352 | ) |
Class B | | | (69,883 | ) | | | (365,035 | ) |
Class C | | | (125,707 | ) | | | (579,430 | ) |
Class I | | | (22,731,847 | ) | | | (50,860,316 | ) |
Class R1 | | | (196,594 | ) | | | (404,819 | ) |
Class R2 | | | (137,310 | ) | | | (319,966 | ) |
Class R3 | | | (63,325 | ) | | | (161,532 | ) |
| | | | |
Total dividends to shareholders | | | (28,229,597 | ) | | | (64,122,839 | ) |
| | | | |
Capital share transactions: | | | | | | | | |
Net proceeds from sale of shares | | | 630,591,533 | | | | 1,009,701,685 | |
Net asset value of shares issued to shareholders in reinvestment of dividends | | | 25,563,996 | | | | 57,322,080 | |
Cost of shares redeemed (b) | | | (597,375,817 | ) | | | (1,249,569,081 | ) |
| | | | |
Increase (decrease) in net assets derived from capital share transactions | | | 58,779,712 | | | | (182,545,316 | ) |
| | | | |
Net increase (decrease) in net assets | | | 628,599,696 | | | | 246,792,713 | |
| | |
| Net Assets | | | | | | | | |
Beginning of period | | | 3,888,361,221 | | | | 3,641,568,508 | |
| | | | |
End of period | | $ | 4,516,960,917 | | | $ | 3,888,361,221 | |
| | | | |
| | | | | | | | |
Undistributed net investment income at end of period | | $ | 1,428,969 | | | $ | 1,464,362 | |
| | | | |
| (a) | Includes realized gains of $1,170,138 due to in-kind redemptions during the year ended October 31, 2012. (See Note 9) |
| (b) | Includes in-kind redemptions in the amount of $36,596,388 during the year ended October 31, 2012. (See Note 9) |
| | | | | | |
The notes to the financial statements are an integral part of,
and should be read in conjunction with, the financial statements. | | mainstayinvestments.com | | | 33 | |
Financial Highlights selected per share data and ratios
| | | | | | | | | | | | | | | | | | | | | | | | |
| | | Investor Class | |
| | | Six months
ended
April 30, | | | Year ended October 31, | | | April 29,
2008**
through
October 31, | |
| | | 2013* | | | 2012 | | | 2011 | | | 2010 | | | 2009 | | | 2008 | |
Net asset value at beginning of period | | $ | 37.41 | | | $ | 33.41 | | | $ | 33.06 | | | $ | 28.68 | | | $ | 25.62 | | | $ | 36.87 | |
| | | | | | | | | | | | | | | | | | | | | | | | |
Net investment income (loss) | | | 0.20 | (a) | | | 0.46 | (a) | | | 0.38 | | | | 0.22 | (a) | | | 0.25 | | | | 0.25 | (a) |
Net realized and unrealized gain (loss) on investments | | | 5.58 | | | | 4.01 | | | | 0.32 | | | | 4.38 | | | | 3.10 | | | | (11.25 | ) |
| | | | | | | | | | | | | | | | | | | | | | | | |
Total from investment operations | | | 5.78 | | | | 4.47 | | | | 0.70 | | | | 4.60 | | | | 3.35 | | | | (11.00 | ) |
| | | | | | | | | | | | | | | | | | | | | | | | |
Less dividends | | | | | | | | | | | | | | | | | | | | | | | | |
From net investment income | | | (0.20 | ) | | | (0.47 | ) | | | (0.35 | ) | | | (0.22 | ) | | | (0.29 | ) | | | (0.25 | ) |
| | | | | | | | | | | | | | | | | | | | | | | | |
Net asset value at end of period | | $ | 42.99 | | | $ | 37.41 | | | $ | 33.41 | | | $ | 33.06 | | | $ | 28.68 | | | $ | 25.62 | |
| | | | | | | | | | | | | | | | | | | | | | | | |
Total investment return (b) | | | 15.49 | %(c) | | | 13.46 | % | | | 2.08 | % | | | 16.12 | % | | | 13.33 | % | | | (29.97 | %)(c) |
Ratios (to average net assets)/Supplemental Data: | | | | | | | | | | | | | | | | | | | | | | | | |
Net investment income (loss) | | | 1.00 | %†† | | | 1.28 | % | | | 1.08 | % | | | 0.71 | % | | | 0.99 | % | | | 1.49 | % †† |
Net expenses | | | 1.41 | %†† | | | 1.43 | % | | | 1.43 | % | | | 1.47 | % | | | 1.30 | % | | | 1.15 | % †† |
Expenses (before waiver/reimbursement) | | | 1.41 | %†† | | | 1.43 | % | | | 1.43 | % | | | 1.51 | % | | | 1.45 | % | | | 1.31 | % †† |
Portfolio turnover rate | | | 37 | % | | | 64 | % | | | 71 | % | | | 55 | % | | | 101 | % | | | 117 | % |
Net assets at end of period (in 000’s) | | $ | 190,505 | | | $ | 177,880 | | | $ | 181,060 | | | $ | 185,828 | | | $ | 9,808 | | | $ | 7,601 | |
| ** | Commencement of operations. |
| (a) | Per share data based on average shares outstanding during the period. |
| (b) | Total investment return is calculated exclusive of sales charges and assumes the reinvestment of dividends and distributions. |
| (c) | Total investment return is not annualized. |
| | | | |
| 34 | | MainStay ICAP Select Equity Fund | | The notes to the financial statements are an integral part of,
and should be read in conjunction with, the financial statements. |
Financial Highlights selected per share data and ratios
| | | | | | | | | | | | | | | | | | | | | | | | | | | | |
| | | Class A | |
| | | Six months
ended
April 30, | | | Year ended October 31, | | | January 1,
2008***
through
October 31, | | | Year ended
December 31, | |
| | | 2013* | | | 2012 | | | 2011 | | | 2010 | | | 2009 | | | 2008 | | | 2007 | |
Net asset value at beginning of period | | $ | 37.41 | | | $ | 33.42 | | | $ | 33.07 | | | $ | 28.69 | | | $ | 25.62 | | | $ | 38.79 | | | $ | 41.60 | |
| | | | | | | | | | | | | | | | | | | | | | | | | | | | |
Net investment income (loss) | | | 0.24 | (a) | | | 0.54 | (a) | | | 0.46 | | | | 0.31 | (a) | | | 0.32 | | | | 0.42 | (a) | | | 0.48 | (a) |
Net realized and unrealized gain (loss) on investments | | | 5.58 | | | | 4.01 | | | | 0.33 | | | | 4.38 | | | | 3.09 | | | | (13.18 | ) | | | 2.23 | |
| | | | | | | | | | | | | | | | | | | | | | | | | | | | |
Total from investment operations | | | 5.82 | | | | 4.55 | | | | 0.79 | | | | 4.69 | | | | 3.41 | | | | (12.76 | ) | | | 2.71 | |
| | | | | | | | | | | | | | | | | | | | | | | | | | | | |
Less dividends and distributions: | | | | | | | | | | | | | | | | | | | | | | | | | | | | |
From net investment income | | | (0.24 | ) | | | (0.56 | ) | | | (0.44 | ) | | | (0.31 | ) | | | (0.34 | ) | | | (0.41 | ) | | | (0.51 | ) |
From net realized gain on investments | | | — | | | | — | | | | — | | | | — | | | | — | | | | — | | | | (5.01 | ) |
| | | | | | | | | | | | | | | | | | | | | | | | | | | | |
Total dividends and distributions | | | (0.24 | ) | | | (0.56 | ) | | | (0.44 | ) | | | (0.31 | ) | | | (0.34 | ) | | | (0.41 | ) | | | (5.52 | ) |
| | | | | | | | | | | | | | | | | | | | | | | | | | | | |
Net asset value at end of period | | $ | 42.99 | | | $ | 37.41 | | | $ | 33.42 | | | $ | 33.07 | | | $ | 28.69 | | | $ | 25.62 | | | $ | 38.79 | |
| | | | | | | | | | | | | | | | | | | | | | | | | | | | |
Total investment return (b) | | | 15.62 | %(c) | | | 13.71 | % | | | 2.35 | % | | | 16.46 | % | | | 13.58 | % | | | (33.14 | %)(c) | | | 6.62 | % |
Ratios (to average net assets)/Supplemental Data: | | | | | | | | | | | | | | | | | | | | | | | | | | | | |
Net investment income (loss) | | | 1.20 | %†† | | | 1.50 | % | | | 1.33 | % | | | 1.01 | % | | | 1.21 | % | | | 1.47 | % †† | | | 1.09 | % |
Net expenses | �� | | 1.18 | %†† | | | 1.18 | % | | | 1.18 | % | | | 1.18 | % | | | 1.09 | % | | | 1.10 | % †† | | | 1.15 | % |
Expenses (before waiver/reimbursement) | | | 1.24 | %†† | | | 1.25 | % | | | 1.21 | % | | | 1.23 | % | | | 1.28 | % | | | 1.24 | % †† | | | 1.26 | % |
Portfolio turnover rate | | | 37 | % | | | 64 | % | | | 71 | % | | | 55 | % | | | 101 | % | | | 117 | % | | | 123 | % |
Net assets at end of period (in 000’s) | | $ | 722,929 | | | $ | 606,575 | | | $ | 542,404 | | | $ | 478,386 | | | $ | 190,956 | | | $ | 142,130 | | | $ | 161,070 | |
| *** | The Fund changed its fiscal year end from December 31 to October 31. |
| (a) | Per share data based on average shares outstanding during the period. |
| (b) | Total investment return is calculated exclusive of sales charges and assumes the reinvestment of dividends and distributions. |
| (c) | Total investment return is not annualized. |
| | | | | | |
The notes to the financial statements are an integral part of,
and should be read in conjunction with, the financial statements. | | mainstayinvestments.com | | | 35 | |
Financial Highlights selected per share data and ratios
| | | | | | | | | | | | | | | | |
| | | Class B | |
| | | Six months
ended
April 30, | | | Year ended October 31, | | | November 13,
2009**
through
October 31, | |
| | | 2013* | | | 2012 | | | 2011 | | | 2010 | |
Net asset value at beginning of period | | $ | 37.10 | | | $ | 33.15 | | | $ | 32.84 | | | $ | 29.93 | |
| | | | | | | | | | | | | | | | |
Net investment income (loss) | | | 0.06 | (a) | | | 0.21 | (a) | | | 0.10 | | | | (0.01 | )(a) |
Net realized and unrealized gain (loss) on investments | | | 5.52 | | | | 3.95 | | | | 0.34 | | | | 2.99 | |
| | | | | | | | | | | | | | | | |
Total from investment operations | | | 5.58 | | | | 4.16 | | | | 0.44 | | | | 2.98 | |
| | | | | | | | | | | | | | | | |
Less dividends: | | | | | | | | | | | | | | | | |
From net investment income | | | (0.05 | ) | | | (0.21 | ) | | | (0.13 | ) | | | (0.07 | ) |
| | | | | | | | | | | | | | | | |
Net asset value at end of period | | $ | 42.63 | | | $ | 37.10 | | | $ | 33.15 | | | $ | 32.84 | |
| | | | | | | | | | | | | | | | |
Total investment return (b) | | | 15.06 | %(c) | | | 12.60 | % | | | 1.32 | % | | | 9.98 | % (c) |
Ratios (to average net assets)/Supplemental Data: | | | | | | | | | | | | | | | | |
Net investment income (loss) | | | 0.28 | %†† | | | 0.59 | % | | | 0.35 | % | | | (0.04 | %)†† |
Net expenses | | | 2.16 | %†† | | | 2.18 | % | | | 2.18 | % | | | 2.22 | % †† |
Expenses (before waiver/reimbursement) | | | 2.16 | %†† | | | 2.18 | % | | | 2.18 | % | | | 2.26 | % †† |
Portfolio turnover rate | | | 37 | % | | | 64 | % | | | 71 | % | | | 55 | % |
Net assets at end of period (in 000’s) | | $ | 52,889 | | | $ | 52,558 | | | $ | 64,649 | | | $ | 85,952 | |
| ** | Commencement of operations. |
| (a) | Per share data based on average shares outstanding during the period. |
| (b) | Total investment return is calculated exclusive of sales charges and assumes the reinvestment of dividends and distributions. |
| (c) | Total investment return is not annualized. |
| | | | |
| 36 | | MainStay ICAP Select Equity Fund | | The notes to the financial statements are an integral part of,
and should be read in conjunction with, the financial statements. |
Financial Highlights selected per share data and ratios
| | | | | | | | | | | | | | | | | | | | | | | | | | | | |
| | | Class C | |
| | | Six months
ended
April 30, | | | Year ended October 31, | | | January 1,
2008***
through
October 31, | | | Year ended
December 31, | |
| | | 2013* | | | 2012 | | | 2011 | | | 2010 | | | 2009 | | | 2008 | | | 2007 | |
Net asset value at beginning of period | | $ | 37.10 | | | $ | 33.15 | | | $ | 32.84 | | | $ | 28.56 | | | $ | 25.53 | | | $ | 38.68 | | | $ | 41.56 | |
| | | | | | | | | | | | | | | | | | | | | | | | | | | | |
Net investment income (loss) | | | 0.05 | (a) | | | 0.19 | (a) | | | 0.12 | | | | (0.01 | )(a) | | | 0.07 | | | | 0.18 | (a) | | | 0.14 | (a) |
Net realized and unrealized gain (loss) on investments | | | 5.53 | | | | 3.97 | | | | 0.33 | | | | 4.36 | | | | 3.09 | | | | (13.12 | ) | | | 2.24 | |
| | | | | | | | | | | | | | | | | | | | | | | | | | | | |
Total from investment operations | | | 5.58 | | | | 4.16 | | | | 0.45 | | | | 4.35 | | | | 3.16 | | | | (12.94 | ) | | | 2.38 | |
| | | | | | | | | | | | | | | | | | | | | | | | | | | | |
Less dividends and distributions: | | | | | | | | | | | | | | | | | | | | | | | | | | | | |
From net investment income | | | (0.05 | ) | | | (0.21 | ) | | | (0.14 | ) | | | (0.07 | ) | | | (0.13 | ) | | | (0.21 | ) | | | (0.25 | ) |
From net realized gain on investments | | | — | | | | — | | | | — | | | | — | | | | — | | | | — | | | | (5.01 | ) |
| | | | | | | | | | | | | | | | | | | | | | | | | | | | |
Total dividends and distributions | | | (0.05 | ) | | | (0.21 | ) | | | (0.14 | ) | | | (0.07 | ) | | | (0.13 | ) | | | (0.21 | ) | | | (5.26 | ) |
| | | | | | | | | | | | | | | | | | | | | | | | | | | | |
Net asset value at end of period | | $ | 42.63 | | | $ | 37.10 | | | $ | 33.15 | | | $ | 32.84 | | | $ | 28.56 | | | $ | 25.53 | | | $ | 38.68 | |
| | | | | | | | | | | | | | | | | | | | | | | | | | | | |
Total investment return (b) | | | 15.06 | %(c) | | | 12.60 | % | | | 1.32 | % | | | 15.25 | % | | | 12.50 | % | | | (33.59 | %)(c) | | | 5.83 | % |
Ratios (to average net assets)/Supplemental Data: | | | | | | | | | | | | | | | | | | | | | | | | | | | | |
Net investment income (loss) | | | 0.24 | %†† | | | 0.53 | % | | | 0.34 | % | | | (0.02 | %) | | | 0.28 | % | | | 0.65 | % †† | | | 0.33 | % |
Net expenses | | | 2.16 | %†† | | | 2.18 | % | | | 2.18 | % | | | 2.22 | % | | | 2.05 | % | | | 1.91 | % †† | | | 1.90 | % |
Expenses (before waiver/reimbursement) | | | 2.16 | %†† | | | 2.18 | % | | | 2.18 | % | | | 2.26 | % | | | 2.21 | % | | | 2.05 | % †† | | | 2.01 | % |
Portfolio turnover rate | | | 37 | % | | | 64 | % | | | 71 | % | | | 55 | % | | | 101 | % | | | 117 | % | | | 123 | % |
Net assets at end of period (in 000’s) | | $ | 103,232 | | | $ | 95,321 | | | $ | 95,887 | | | $ | 95,241 | | | $ | 55,841 | | | $ | 47,831 | | | $ | 45,789 | |
| *** | The Fund changed its fiscal year end from December 31 to October 31. |
| (a) | Per share data based on average shares outstanding during the period. |
| (b) | Total investment return is calculated exclusive of sales charges and assumes the reinvestment of dividends and distributions. |
| (c) | Total investment return is not annualized. |
| | | | | | |
The notes to the financial statements are an integral part of,
and should be read in conjunction with, the financial statements. | | mainstayinvestments.com | | | 37 | |
Financial Highlights selected per share data and ratios
| | | | | | | | | | | | | | | | | | | | | | | | | | | | |
| | | Class I | |
| | | Six months
ended
April 30, | | | Year ended October 31, | | | January 1,
2008***
through
October 31, | | | Year ended
December 31, | |
| | | 2013* | | | 2012 | | | 2011 | | | 2010 | | | 2009 | | | 2008 | | | 2007 | |
Net asset value at beginning of period | | $ | 37.48 | | | $ | 33.47 | | | $ | 33.12 | | | $ | 28.74 | | | $ | 25.67 | | | $ | 38.84 | | | $ | 41.62 | |
| | | | | | | | | | | | | | | | | | | | | | | | | | | | |
Net investment income (loss) | | | 0.30 | (a) | | | 0.65 | (a) | | | 0.55 | | | | 0.41 | (a) | | | 0.37 | | | | 0.51 | (a) | | | 0.64 | (a) |
Net realized and unrealized gain (loss) on investments | | | 5.59 | | | | 4.02 | | | | 0.34 | | | | 4.37 | | | | 3.10 | | | | (13.20 | ) | | | 2.21 | |
| | | | | | | | | | | | | | | | | | | | | | | | | | | | |
Total from investment operations | | | 5.89 | | | | 4.67 | | | | 0.89 | | | | 4.78 | | | | 3.47 | | | | (12.69 | ) | | | 2.85 | |
| | | | | | | | | | | | | | | | | | | | | | | | | | | | |
Less dividends and distributions: | | | | | | | | | | | | | | | | | | | | | | | | | | | | |
From net investment income | | | (0.30 | ) | | | (0.66 | ) | | | (0.54 | ) | | | (0.40 | ) | | | (0.40 | ) | | | (0.48 | ) | | | (0.62 | ) |
From net realized gain on investments | | | — | | | | — | | | | — | | | | — | | | | — | | | | — | | | | (5.01 | ) |
| | | | | | | | | | | | | | | | | | | | | | | | | | | | |
Total dividends and distributions | | | (0.30 | ) | | | (0.66 | ) | | | (0.54 | ) | | | (0.40 | ) | | | (0.40 | ) | | | (0.48 | ) | | | (5.63 | ) |
| | | | | | | | | | | | | | | | | | | | | | | | | | | | |
Net asset value at end of period | | $ | 43.07 | | | $ | 37.48 | | | $ | 33.47 | | | $ | 33.12 | | | $ | 28.74 | | | $ | 25.67 | | | $ | 38.84 | |
| | | | | | | | | | | | | | | | | | | | | | | | | | | | |
Total investment return (b) | | | 15.78 | %(c) | | | 14.07 | % | | | 2.63 | % | | | 16.77 | % | | | 13.89 | % | | | (32.99 | %)(c) | | | 6.95 | % |
Ratios (to average net assets)/Supplemental Data: | | | | | | | | | | | | | | | | | | | | | | | | | | | | |
Net investment income (loss) | | | 1.49 | %†† | | | 1.81 | % | | | 1.61 | % | | | 1.32 | % | | | 1.50 | % | | | 1.78 | % †† | | | 1.44 | % |
Net expenses | | | 0.90 | %†† | | | 0.90 | % | | | 0.90 | % | | | 0.90 | % | | | 0.83 | % | | | 0.80 | % †† | | | 0.80 | % |
Expenses (before waiver/reimbursement) | | | 0.99 | %†† | | | 1.00 | % | | | 0.96 | % | | | 0.98 | % | | | 1.03 | % | | | 0.94 | % †† | | | 0.91 | % |
Portfolio turnover rate | | | 37 | % | | | 64 | % | | | 71 | % | | | 55 | % | | | 101 | % | | | 117 | % | | | 123 | % |
Net assets at end of period (in 000’s) | | $ | 3,373,476 | | | $ | 2,892,113 | | | $ | 2,702,189 | | | $ | 2,041,651 | | | $ | 1,454,261 | | | $ | 1,296,268 | | | $ | 1,863,460 | |
| *** | The Fund changed its fiscal year end from December 31 to October 31. |
| (a) | Per share data based on average shares outstanding during the period. |
| (b) | Total investment return is calculated exclusive of sales charges and assumes the reinvestment of dividends and distributions. Class I shares are not subject to sales charges. |
| (c) | Total investment return is not annualized. |
| | | | |
| 38 | | MainStay ICAP Select Equity Fund | | The notes to the financial statements are an integral part of,
and should be read in conjunction with, the financial statements. |
Financial Highlights selected per share data and ratios
| | | | | | | | | | | | | | | | | | | | | | | | | | | | |
| | | Class R1 | |
| | | Six months
ended
April 30, | | | Year ended October 31, | | | January 1,
2008***
through
October 31, | | | Year ended
December 31, | |
| | | 2013* | | | 2012 | | | 2011 | | | 2010 | | | 2009 | | | 2008 | | | 2007 | |
Net asset value at beginning of period | | $ | 37.49 | | | $ | 33.48 | | | $ | 33.13 | | | $ | 28.74 | | | $ | 25.68 | | | $ | 38.85 | | | $ | 41.62 | |
| | | | | | | | | | | | | | | | | | | | | | | | | | | | |
Net investment income (loss) | | | 0.28 | (a) | | | 0.59 | (a) | | | 0.51 | | | | 0.35 | (a) | | | 0.35 | | | | 0.42 | (a) | | | 0.59 | (a) |
Net realized and unrealized
gain (loss) on investments | | | 5.59 | | | | 4.03 | | | | 0.33 | | | | 4.39 | | | | 3.08 | | | | (13.13 | ) | | | 2.24 | |
| | | | | | | | | | | | | | | | | | | | | | | | | | | | |
Total from investment operations | | | 5.87 | | | | 4.62 | | | | 0.84 | | | | 4.74 | | | | 3.43 | | | | (12.71 | ) | | | 2.83 | |
| | | | | | | | | | | | | | | | | | | | | | | | | | | | |
Less dividends and distributions: | | | | | | | | | | | | | | | | | | | | | | | | | | | | |
From net investment income | | | (0.28 | ) | | | (0.61 | ) | | | (0.49 | ) | | | (0.35 | ) | | | (0.37 | ) | | | (0.46 | ) | | | (0.59 | ) |
From net realized gain on investments | | | — | | | | — | | | | — | | | | — | | | | — | | | | — | | | | (5.01 | ) |
| | | | | | | | | | | | | | | | | | | | | | | | | | | | |
Total dividends and distributions | | | (0.28 | ) | | | (0.61 | ) | | | (0.49 | ) | | | (0.35 | ) | | | (0.37 | ) | | | (0.46 | ) | | | (5.60 | ) |
| | | | | | | | | | | | | | | | | | | | | | | | | | | | |
Net asset value at end of period | | $ | 43.08 | | | $ | 37.49 | | | $ | 33.48 | | | $ | 33.13 | | | $ | 28.74 | | | $ | 25.68 | | | $ | 38.85 | |
| | | | | | | | | | | | | | | | | | | | | | | | | | | | |
Total investment return (b) | | | 15.72 | %(c) | | | 13.91 | % | | | 2.47 | % | | | 16.60 | % | | | 13.69 | % | | | (33.03 | %)(c) | | | 6.87 | % |
Ratios (to average net assets)/Supplemental Data: | | | | | | | | | | | | | | | | | | | | | | | | | | | | |
Net investment income (loss) | | | 1.39 | %†† | | | 1.64 | % | | | 1.45 | % | | | 1.12 | % | | | 1.23 | % | | | 1.55 | % †† | | | 1.33 | % |
Net expenses | | | 1.00 | %†† | | | 1.03 | % | | | 1.06 | % | | | 1.08 | % | | | 0.98 | % | | | 0.91 | % †† | | | 0.90 | % |
Expenses (before reimbursement/waiver) | | | 1.09 | %†† | | | 1.10 | % | | | 1.06 | % | | | 1.08 | % | | | 1.13 | % | | | 1.06 | % †† | | | 1.01 | % |
Portfolio turnover rate | | | 37 | % | | | 64 | % | | | 71 | % | | | 55 | % | | | 101 | % | | | 117 | % | | | 123 | % |
Net assets at end of period (in 000’s) | | $ | 29,731 | | | $ | 26,903 | | | $ | 20,156 | | | $ | 15,583 | | | $ | 13,628 | | | $ | 5,286 | | | $ | 1,440 | |
| *** | The Fund changed its fiscal year end from December 31 to October 31. |
| (a) | Per share data based on average shares outstanding during the period. |
| (b) | Total investment return is calculated exclusive of sales charges and assumes the reinvestment of dividends and distributions. Class R1 shares are not subject to sales charges. |
| (c) | Total investment return is not annualized. |
| | | | | | |
The notes to the financial statements are an integral part of,
and should be read in conjunction with, the financial statements. | | mainstayinvestments.com | | | 39 | |
Financial Highlights selected per share data and ratios
| | | | | | | | | | | | | | | | | | | | | | | | | | | | |
| | | Class R2 | |
| | | Six months
ended
April 30, | | | Year ended October 31, | | | January 1,
2008***
through
October 31, | | | Year ended
December 31, | |
| | | 2013* | | | 2012 | | | 2011 | | | 2010 | | | 2009 | | | 2008 | | | 2007 | |
Net asset value at beginning of period | | $ | 37.41 | | | $ | 33.42 | | | $ | 33.07 | | | $ | 28.69 | | | $ | 25.63 | | | $ | 38.80 | | | $ | 41.60 | |
| | | | | | | | | | | | | | | | | | | | | | | | | | | | |
Net investment income (loss) | | | 0.23 | (a) | | | 0.52 | (a) | | | 0.40 | | | | 0.27 | (a) | | | 0.26 | | | | 0.40 | (a) | | | 0.53 | (a) |
Net realized and unrealized gain (loss) on investments | | | 5.58 | | | | 3.99 | | | | 0.35 | | | | 4.38 | | | | 3.11 | | | | (13.18 | ) | | | 2.18 | |
| | | | | | | | | | | | | | | | | | | | | | | | | | | | |
Total from investment operations | | | 5.81 | | | | 4.51 | | | | 0.75 | | | | 4.65 | | | | 3.37 | | | | (12.78 | ) | | | 2.71 | |
| | | | | | | | | | | | | | | | | | | | | | | | | | | | |
Less dividends and distributions: | | | | | | | | | | | | | | | | | | | | | | | | | | | | |
From net investment income | | | (0.23 | ) | | | (0.52 | ) | | | (0.40 | ) | | | (0.27 | ) | | | (0.31 | ) | | | (0.39 | ) | | | (0.50 | ) |
From net realized gain on investments | | | — | | | | — | | | | — | | | | — | | | | — | | | | — | | | | (5.01 | ) |
| | | | | | | | | | | | | | | | | | | | | | | | | | | | |
Total dividends and distributions | | | (0.23 | ) | | | (0.52 | ) | | | (0.40 | ) | | | (0.27 | ) | | | (0.31 | ) | | | (0.39 | ) | | | (5.51 | ) |
| | | | | | | | | | | | | | | | | | | | | | | | | | | | |
Net asset value at end of period | | $ | 42.99 | | | $ | 37.41 | | | $ | 33.42 | | | $ | 33.07 | | | $ | 28.69 | | | $ | 25.63 | | | $ | 38.80 | |
| | | | | | | | | | | | | | | | | | | | | | | | | | | | |
Total investment return (b) | | | 15.58 | %(c) | | | 13.59 | % | | | 2.21 | % | | | 16.29 | % | | | 13.46 | % | | | (33.18 | %)(c) | | | 6.56 | % |
Ratios (to average net assets)/Supplemental Data: | | | | | | | | | | | | | | | | | | | | | | | | | | | | |
Net investment income (loss) | | | 1.13 | %†† | | | 1.44 | % | | | 1.21 | % | | | 0.88 | % | | | 1.07 | % | | | 1.42 | % †† | | | 1.18 | % |
Net expenses | | | 1.25 | %†† | | | 1.28 | % | | | 1.31 | % | | | 1.33 | % | | | 1.22 | % | | | 1.15 | % †† | | | 1.15 | % |
Expenses (before waiver/reimbursement) | | | 1.34 | %†† | | | 1.35 | % | | | 1.31 | % | | | 1.33 | % | | | 1.38 | % | | | 1.29 | % †† | | | 1.26 | % |
Portfolio turnover rate | | | 37 | % | | | 64 | % | | | 71 | % | | | 55 | % | | | 101 | % | | | 117 | % | | | 123 | % |
Net assets at end of period (in 000’s) | | $ | 27,413 | | | $ | 22,433 | | | $ | 21,933 | | | $ | 24,776 | | | $ | 11,099 | | | $ | 10,796 | | | $ | 12,712 | |
| *** | The Fund changed its fiscal year end from December 31 to October 31. |
| (a) | Per share data based on average shares outstanding during the period. |
| (b) | Total investment return is calculated exclusive of sales charges and assumes the reinvestment of dividends and distributions. Class R2 shares are not subject to sales charges. |
| (c) | Total investment return is not annualized. |
| | | | |
| 40 | | MainStay ICAP Select Equity Fund | | The notes to the financial statements are an integral part of,
and should be read in conjunction with, the financial statements. |
Financial Highlights selected per share data and ratios
| | | | | | | | | | | | | | | | | | | | | | | | | | | | |
| | | Class R3 | |
| | | Six months
ended
April 30, | | | Year ended October 31, | | | January 1,
2008***
through
October 31, | | | Year ended
December 31, | |
| | | 2013* | | | 2012 | | | 2011 | | | 2010 | | | 2009 | | | 2008 | | | 2007 | |
Net asset value at beginning of period | | $ | 37.36 | | | $ | 33.38 | | | $ | 33.02 | | | $ | 28.66 | | | $ | 25.60 | | | $ | 38.76 | | | $ | 41.58 | |
| | | | | | | | | | | | | | | | | | | | | | | | | | | | |
Net investment income (loss) | | | 0.16 | (a) | | | 0.40 | (a) | | | 0.34 | | | | 0.18 | (a) | | | 0.21 | | | | 0.28 | (a) | | | 0.31 | (a) |
Net realized and unrealized gain (loss) on investments | | | 5.57 | | | | 3.99 | | | | 0.33 | | | | 4.38 | | | | 3.10 | | | | (13.10 | ) | | | 2.29 | |
| | | | | | | | | | | | | | | | | | | | | | | | | | | | |
Total from investment operations | | | 5.73 | | | | 4.39 | | | | 0.67 | | | | 4.56 | | | | 3.31 | | | | (12.82 | ) | | | 2.60 | |
| | | | | | | | | | | | | | | | | | | | | | | | | | | | |
Less dividends and distributions: | | | | | | | | | | | | | | | | | | | | | | | | | | | | |
From net investment income | | | (0.16 | ) | | | (0.41 | ) | | | (0.31 | ) | | | (0.20 | ) | | | (0.25 | ) | | | (0.34 | ) | | | (0.41 | ) |
From net realized gain on investments | | | — | | | | — | | | | — | | | | — | | | | — | | | | — | | | | (5.01 | ) |
| | | | | | | | | | | | | | | | | | | | | | | | | | | | |
Total dividends and distributions | | | (0.16 | ) | | | (0.41 | ) | | | (0.31 | ) | | | (0.20 | ) | | | (0.25 | ) | | | (0.34 | ) | | | (5.42 | ) |
| | | | | | | | | | | | | | | | | | | | | | | | | | | | |
Net asset value at end of period | | $ | 42.93 | | | $ | 37.36 | | | $ | 33.38 | | | $ | 33.02 | | | $ | 28.66 | | | $ | 25.60 | | | $ | 38.76 | |
| | | | | | | | | | | | | | | | | | | | | | | | | | | | |
Total investment return (b) | | | 15.38 | %(c) | | | 13.24 | % | | | 1.99 | % | | | 15.97 | % | | | 13.16 | % | | | (33.29 | %)(c) | | | 6.30 | % |
Ratios (to average net assets)/Supplemental Data: | | | | | | | | | | | | | | | | | | | | | | | | | | | | |
Net investment income (loss) | | | 0.81 | %†† | | | 1.10 | % | | | 0.98 | % | | | 0.58 | % | | | 0.78 | % | | | 1.02 | % †† | | | 0.70 | % |
Net expenses | | | 1.59 | %†† | | | 1.60 | % | | | 1.56 | % | | | 1.58 | % | | | 1.47 | % | | | 1.40 | % †† | | | 1.40 | % |
Expenses (before waiver/reimbursement) | | | 1.59 | %†† | | | 1.60 | % | | | 1.56 | % | | | 1.58 | % | | | 1.63 | % | | | 1.55 | % †† | | | 1.51 | % |
Portfolio turnover rate | | | 37 | % | | | 64 | % | | | 71 | % | | | 55 | % | | | 101 | % | | | 117 | % | | | 123 | % |
Net assets at end of period (in 000’s) | | $ | 16,786 | | | $ | 14,578 | | | $ | 13,291 | | | $ | 11,994 | | | $ | 4,558 | | | $ | 2,963 | | | $ | 185 | |
| *** | The Fund changed its fiscal year end from December 31 to October 31. |
| (a) | Per share data based on average shares outstanding during the period. |
| (b) | Total investment return is calculated exclusive of sales charges and assumes the reinvestment of dividends and distributions. Class R3 shares are not subject to sales charges. |
| (c) | Total investment return is not annualized. |
| | | | | | |
The notes to the financial statements are an integral part of,
and should be read in conjunction with, the financial statements. | | mainstayinvestments.com | | | 41 | |
MainStay ICAP Global Fund
Investment and Performance Comparison1 (Unaudited)
Performance data quoted represents past performance. Past performance is no guarantee of future results. Because of market volatility, current performance may be lower or higher than the figures shown. Investment return and principal value will fluctuate, and as a result, when shares are redeemed, they may be worth more or less than their original cost. The graph below depicts the historical performance of Class I shares of the Fund. Performance will vary from class to class based on differences in class-specific expenses and sales charges. For performance information current to the most recent month-end, please call 800-MAINSTAY (624-6782) or visit mainstayinvestments.com.
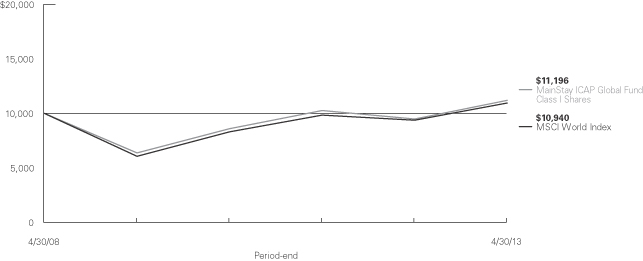
Average Annual Total Returns for the Period Ended April 30, 2013
| | | | | | | | | | | | | | | | | | | | | | | | |
| Class | | Sales Charge | | | | Six Months | | | One Years | | | Five Year | | | Since
Inception
(4/30/08) | | | Gross
Expense
Ratio2 | |
| Investor Class Shares | | Maximum 5.5% Initial Sales Charge | | With sales charges Excluding sales charges | |
| 9.66
16.04 | %
| |
| 11.28
17.75 | %
| |
| 0.81
1.96 | %
| |
| 0.81
1.96 | %
| |
| 1.59
1.59 | %
|
| Class A Shares | | Maximum 5.5% Initial Sales Charge | | With sales charges Excluding sales charges | |
| 9.68
16.07 |
| |
| 11.30
17.77 |
| |
| 0.89
2.04 |
| |
| 0.89
2.04 |
| |
| 1.38
1.38 |
|
| Class C Shares | | Maximum 1% CDSC if Redeemed Within One Year of Purchase | | With sales charges Excluding sales charges | |
| 14.61
15.61 |
| |
| 15.79
16.79 |
| |
| 1.23
1.23 |
| |
| 1.23
1.23 |
| |
| 2.34
2.34 |
|
| Class I Shares | | No Sales Charge | | | | | 16.21 | | | | 18.05 | | | | 2.28 | | | | 2.28 | | | | 1.13 | |
| 1. | The performance table and graph do not reflect the deduction of taxes that a shareholder would pay on distributions or Fund share redemptions. Total returns reflect maximum applicable sales charges as indicated in the table above, changes in share price, and reinvestment of dividend and capital gain distributions. The graph assumes the initial investment amount shown above and reflects the deduction of all sales charges that would have applied for the period of investment. Performance figures reflect certain fee waivers and/or expense limitations, without which total returns may have |
| | been lower. For more information on share classes and current fee waivers and/or expense limitations, please refer to the notes to the financial statements. |
| 2. | The gross expense ratios presented reflect the Fund’s “Total Annual Fund Operating Expenses” from the most recent Prospectus and may differ from other expense ratios disclosed in this report. |
The footnotes on the next page are an integral part of the table and graph and should be carefully read in conjunction with them.
| | |
| 42 | | MainStay ICAP Global Fund |
| | | | | | | | | | | | | | | | |
| Benchmark Performance | | Six
Months | | | One
Year | | | Five
Years | | | Since
Inception | |
MSCI World Index3 | | | 14.67 | % | | | 16.70 | % | | | 1.81 | % | | | 1.81 | % |
Average Lipper Global Large-Cap Value Fund4 | | | 15.00 | | | | 17.82 | | | | 1.76 | | | | 1.76 | |
| 3. | The MSCI World Index is a free float-adjusted market capitalization weighted index that is designed to measure the equity market performance of developed markets. The MSCI World Index is the Fund’s broad-based securities market index for comparison purposes. Total returns assume reinvestment of all dividends and capital gains. An investment cannot be made directly in an index. |
| 4. | The average Lipper global large-cap value fund is representative of funds that, by portfolio practice, invest at least 75% of their equity assets in |
| | companies both inside and outside of the U.S. with market capitalizations (on a three-year weighted basis) above Lipper’s global large-cap floor. Global large-cap value funds typically have a below average price-to-cash flow ratio, price-to-book ratio, and three-year sales-per-share growth value compared to their large-cap-specific subset of the S&P/Citigroup World BMI. This benchmark is a product of Lipper Inc. Lipper Inc. is an independent monitor of fund performance. Results are based on total returns with all dividend and capital gain distributions reinvested. |
The footnotes on the preceding page are an integral part of the table and graph and should be carefully read in conjunction with them.
| | | | |
| mainstayinvestments.com | | | 43 | |
Cost in Dollars of a $1,000 Investment in MainStay ICAP Global Fund (Unaudited)
The example below is intended to describe the fees and expenses borne by shareholders during the six-month period from November 1, 2012, to April 30, 2013, and the impact of those costs on your investment.
Example
As a shareholder of the Fund, you incur two types of costs: (1) transaction costs, including exchange fees and sales charges (loads) on purchases (as applicable), and (2) ongoing costs, including management fees, distribution and/or service (12b-1) fees, and other Fund expenses (as applicable). This example is intended to help you understand your ongoing costs (in dollars) of investing in the Fund and to compare these costs with the ongoing costs of investing in other mutual funds. The example is based on an investment of $1,000 made at the beginning of the six-month period and held for the entire period from November 1, 2012, to April 30, 2013.
This example illustrates your Fund’s ongoing costs in two ways:
Actual Expenses
The second and third data columns in the table below provide information about actual account values and actual expenses. You may use the information in these columns, together with the amount you invested, to estimate the expenses that you paid during the six months ended April 30, 2013. Simply divide your account value by $1,000 (for example, an $8,600 account value divided by $1,000 = 8.6), then
multiply the result by the number under the heading entitled “Expenses Paid During Period” to estimate the expenses you paid on your account during this period.
Hypothetical Example for Comparison Purposes
The fourth and fifth data columns in the table below provide information about hypothetical account values and hypothetical expenses based on the Fund’s actual expense ratio and an assumed rate of return of 5% per year before expenses, which is not the Fund’s actual return. The hypothetical account values and expenses may not be used to estimate the actual ending account balances or expenses you paid for the six-month period shown. You may use this information to compare the ongoing costs of investing in the Fund with the ongoing costs of investing in other Funds. To do so, compare this 5% hypothetical example with the 5% hypothetical examples that appear in the shareholder reports of the other Funds.
Please note that the expenses shown in the table are meant to highlight your ongoing costs only and do not reflect any transactional costs, such as exchange fees or sales charges (loads). Therefore, the fourth and fifth data columns of the table are useful in comparing ongoing costs only and will not help you determine the relative total costs of owning different funds. In addition, if these transactional costs were included, your costs would have been higher.
| | | | | | | | | | | | | | | | | | | | |
| | | | | | | | | | | | | | | | |
| Share Class | | Beginning
Account
Value
11/1/12 | | | Ending Account
Value (Based
on Actual
Returns and
Expenses)
4/30/13 | | | Expenses
Paid
During
Period1 | | | Ending Account
Value (Based
on Hypothetical
5% Annualized
Return and
Actual Expenses)
4/30/13 | | | Expenses
Paid
During
Period1 | |
| | | | | |
| Investor Class Shares | | $ | 1,000.00 | | | $ | 1,160.40 | | | $ | 6.43 | | | $ | 1,018.80 | | | $ | 6.01 | |
| | | | | |
| Class A Shares | | $ | 1,000.00 | | | $ | 1,160.70 | | | $ | 6.16 | | | $ | 1,019.10 | | | $ | 5.76 | |
| | | | | |
| Class C Shares | | $ | 1,000.00 | | | $ | 1,156.10 | | | $ | 10.42 | | | $ | 1,015.10 | | | $ | 9.74 | |
| | | | | |
| Class I Shares | | $ | 1,000.00 | | | $ | 1,162.10 | | | $ | 4.82 | | | $ | 1,020.30 | | | $ | 4.51 | |
| 1. | Expenses are equal to the Fund’s annualized expense ratio of each class (1.20% for Investor Class, 1.15% for Class A, 1.95% for Class C and 0.90% for Class I) multiplied by the average account value over the period, divided by 365 and multiplied by 181 (to reflect the six-month period). The table above represents the actual expenses incurred during the six-month period. |
| | |
| 44 | | MainStay ICAP Global Fund |
Country Composition as of April 30, 2013 (Unaudited)
| | | | |
| United States | | | 50.8 | % |
| Japan | | | 11.8 | |
| United Kingdom | | | 7.9 | |
| Germany | | | 5.8 | |
| France | | | 4.7 | |
| Switzerland | | | 4.0 | |
| Italy | | | 2.8 | |
| Canada | | | 2.7 | |
| | | | |
| Singapore | | | 2.4 | % |
| Israel | | | 2.0 | |
| Norway | | | 1.6 | |
| Netherlands | | | 1.3 | |
| China | | | 1.1 | |
| India | | | 0.8 | |
| Other Assets, Less Liabilities | | | 0.3 | |
| | | | |
| | | 100.0 | % |
| | | | |
See Portfolio of Investments beginning on page 48 for specific holdings within these categories.
Top Ten Holdings as of April 30, 2013 (excluding short-term investment)
| 2. | Nippon Telegraph & Telephone Corp. |
| 4. | Vodafone Group PLC, Sponsored ADR |
| 7. | DBS Group Holdings, Ltd. |
| | | | |
| mainstayinvestments.com | | | 45 | |
Portfolio Management Discussion and Analysis (Unaudited)
Questions answered by portfolio managers Jerrold K. Senser, CFA, Thomas R. Wenzel, CFA, and Thomas M. Cole, CFA, of Institutional Capital LLC (ICAP), the Fund’s Subadvisor.
How did MainStay ICAP Global Fund perform relative to its peers and its benchmark during the six months ended April 30, 2013?
Excluding all sales charges, MainStay ICAP Global Fund returned 16.04% for Investor Class shares, 16.07% for Class A shares and 15.61% for Class C shares for the six months ended April 30, 2013. Over the same period, Class I shares returned 16.21%. All share classes outperformed the 15.00% return of the average Lipper1 global large-cap value fund and the 14.67% return of the MSCI World Index2 for the six months ended April 30, 2013. The MSCI World Index is the Fund’s broad-based securities-market index. See page 42 for Fund returns with applicable sales charges.
What factors affected the Fund’s relative performance during the reporting period?
A number of key drivers affected the Fund’s performance relative to the MSCI World Index. Favorable stock selection in the consumer discretionary and information technology sectors added to the Fund’s relative performance. Stock selection in the materials and health care sectors, however, detracted from the Fund’s relative performance. The Fund benefited by being overweight relative to the MSCI World Index in the health care sector. An underweight position in the consumer staples sector, detracted from the Fund’s performance relative to the Index.
During the reporting period, which sectors were the strongest positive contributors to the Fund’s relative performance and which sectors were particularly weak?
The sectors that made the strongest positive contributions to the Fund’s performance relative to the MSCI World Index were consumer discretionary, information technology and health care. (Contributions take weightings and total returns into account.) Favorable stock selection was the primary driver for the consumer discretionary and information technology sectors. An overweight position in health care added to the Fund’s relative performance.
The sectors that detracted the most from the Fund’s performance relative to the MSCI World Index were materials, energy and telecommunication services. Stock selection was the primary driver for the materials and telecommunication services sectors. An overweight position in energy detracted from the Fund’s relative performance.
During the reporting period, which individual stocks made the strongest positive contributions to the Fund’s absolute performance and which stocks detracted the most?
The stocks that made the strongest positive contributions to the Fund’s absolute performance were media company Time Warner, global tire supplier Bridgestone and auto parts manufacturer Johnson Controls. Time Warner’s stock outpaced the MSCI World Index, as the company reported strong operational performance and provided expectations of growth in affiliate-fee revenue. Bridgestone’s results exceeded expectations because of increased pricing and profit margins, aided by a weaker yen. Johnson Controls’ stock rose as profit margins showed signs of improvement following the company’s restructuring initiatives. All three positions remained in the Fund at the end of the reporting period.
Major detractors from the Fund’s absolute performance included global gold mining company Barrick Gold, North American natural gas producer Encana and German steel producer ThyssenKrupp. Barrick Gold lagged as production delays and cost overruns hampered the company’s results and outlook. We sold the Fund’s position in Barrick Gold because of the risk that these issues would continue rather than be resolved. Encana suffered as continued low natural gas prices and increased capital expenditures weighed on the company’s results. ThyssenKrupp underperformed the MSCI World Index after the company’s results and restructuring efforts suggested to some investors that a dilutive equity issuance might be forthcoming. Encana and ThyssenKrupp remained in the Fund at the end of the reporting period because we believed that these stocks were attractively valued and had strong catalysts for potential appreciation.
Did the Fund make any significant purchases or sales during the reporting period?
We continued to look for stocks with attractive valuations and specific catalysts that we believed could trigger appreciation over a 12- to 18-month time frame.
We added a Fund position in diversified pharmaceutical company Teva Pharmaceutical because we believed that the stock could benefit from management’s focus on further integration of the company’s past acquisitions. We also added a Fund position in global restaurant company McDonald’s. In our view, McDonald’s reimaging initiative and emphasis on value could benefit the stock by improving the company’s competitive position.
In addition to the sales already mentioned, we sold the Fund’s positions in French food, beverage and nutrition company Danone and in software maker Microsoft. Each was sold when we found other stocks that we believed had greater potential upside and were more attractive on a relative valuation basis.
| 1. | See footnote on page 43 for more information on Lipper Inc. |
| 2. | See footnote on page 43 for more information on the MSCI World Index. |
| | |
| 46 | | MainStay ICAP Global Fund |
How did the Fund’s sector weightings change during the reporting period?
The Fund increased its sector exposure relative to the MSCI World Index in health care and financials. In health care, the Fund added to a position that was already overweight relative to the MSCI World Index. Even with the increase in financials, however, the Fund remained underweight relative to the Index.
During the reporting period, the Fund decreased its weightings relative to the MSCI World Index in the industrials and information technology sectors. In industrials, the Fund remained overweight relative to the MSCI World Index, but at a reduced level. In information technology, the Fund moved from an
underweight position to one that was more substantially underweight relative to the Index.
How was the Fund positioned at the end of the reporting period?
As of April 30, 2013, the Fund was most significantly overweight relative to the MSCI World Index in the health care and telecommunication services sectors. As of the same date, the Fund was most significantly underweight relative to the Index in consumer staples and information technology. This positioning reflected our view on the prospects for economic growth and the relative attractiveness of individual holdings in these sectors.
The opinions expressed are those of the portfolio managers as of the date of this report and are subject to change. There is no guarantee that any forecast made will come to pass. This material does not constitute investment advice and is not intended as an endorsement of any specific investment.
| | | | |
| mainstayinvestments.com | | | 47 | |
Portfolio of Investments April 30, 2013 (Unaudited)
| | | | | | | | |
| | |
| | | Shares | | | Value | |
| | | | | | | | |
| Common Stocks 97.8%† | |
Canada 2.7% | |
BCE, Inc. (Diversified Telecommunication Services) | | | 15,250 | | | $ | 714,615 | |
Encana Corp. (Oil, Gas & Consumable Fuels) | | | 47,500 | | | | 876,375 | |
| | | | | | | | |
| | | | 1,590,990 | |
| | | | | | | | |
China 1.1% | |
China Communications Construction Co., Ltd. Class H (Construction & Engineering) | | | 665,500 | | | | 638,044 | |
| | | | | | | | |
|
France 4.7% | |
¨Sanofi (Pharmaceuticals) | | | 16,000 | | | | 1,753,546 | |
Vallourec S.A. (Machinery) | | | 20,000 | | | | 961,242 | |
| | | | | | | | |
| | | | 2,714,788 | |
| | | | | | | | |
Germany 5.8% | |
Bayer A.G. (Pharmaceuticals) | | | 9,300 | | | | 970,258 | |
SAP A.G. (Software) | | | 7,600 | | | | 603,632 | |
Siemens A.G. (Industrial Conglomerates) | | | 9,500 | | | | 992,125 | |
ThyssenKrupp A.G. (Metals & Mining) (a) | | | 44,300 | | | | 801,312 | |
| | | | | | | | |
| | | | 3,367,327 | |
| | | | | | | | |
India 0.8% | |
ICICI Bank, Ltd., Sponsored ADR (Commercial Banks) | | | 10,100 | | | | 472,882 | |
| | | | | | | | |
|
Israel 2.0% | |
Teva Pharmaceutical Industries, Ltd., Sponsored ADR (Pharmaceuticals) | | | 30,850 | | | | 1,181,247 | |
| | | | | | | | |
|
Italy 2.8% | |
¨ENI S.p.A. (Oil, Gas & Consumable Fuels) | | | 66,950 | | | | 1,601,164 | |
| | | | | | | | |
|
Japan 11.8% | |
Bridgestone Corp. (Auto Components) | | | 18,750 | | | | 706,840 | |
Mitsubishi Corp. (Trading Companies & Distributors) | | | 67,900 | | | | 1,217,512 | |
Mitsubishi Estate Co., Ltd. (Real Estate Management & Development) | | | 27,000 | | | | 876,596 | |
¨Nippon Telegraph & Telephone Corp. (Diversified Telecommunication Services) | | | 36,700 | | | | 1,816,459 | |
Nissan Motor Co., Ltd. (Automobiles) | | | 125,950 | | | | 1,312,666 | |
Tokio Marine Holdings, Inc. (Insurance) | | | 29,100 | | | | 922,388 | |
| | | | | | | | |
| | | | 6,852,461 | |
| | | | | | | | |
Netherlands 1.3% | |
Akzo Nobel N.V. (Chemicals) | | | 12,499 | | | | 753,565 | |
| | | | | | | | |
|
Norway 1.6% | |
DnB NOR ASA (Commercial Banks) | | | 55,100 | | | | 900,577 | |
| | | | | | | | |
|
Singapore 2.4% | |
¨DBS Group Holdings, Ltd. (Commercial Banks) | | | 103,650 | | | | 1,410,387 | |
| | | | | | | | |
| | | | | | | | |
| | |
| | | Shares | | | Value | |
| | | | | | | | |
Switzerland 4.0% | |
ABB, Ltd. (Electrical Equipment) (a) | | | 47,250 | | | $ | 1,069,706 | |
Novartis A.G. (Pharmaceuticals) | | | 16,800 | | | | 1,247,623 | |
| | | | | | | | |
| | | | 2,317,329 | |
| | | | | | | | |
United Kingdom 7.9% | |
BP PLC (Oil, Gas & Consumable Fuels) | | | 100,800 | | | | 730,278 | |
Lloyds Banking Group PLC (Commercial Banks) (a) | | | 1,512,800 | | | | 1,276,705 | |
Smith & Nephew PLC (Health Care Equipment & Supplies) | | | 72,600 | | | | 828,319 | |
¨Vodafone Group PLC, Sponsored ADR (Wireless Telecommunication Services) | | | 56,600 | | | | 1,731,394 | |
| | | | | | | | |
| | | | 4,566,696 | |
| | | | | | | | |
United States 48.9% | |
Adobe Systems, Inc. (Software) (a) | | | 18,100 | | | | 815,948 | |
Baxter International, Inc. (Health Care Equipment & Supplies) | | | 15,650 | | | | 1,093,465 | |
BB&T Corp. (Commercial Banks) | | | 16,250 | | | | 500,013 | |
Capital One Financial Corp. (Consumer Finance) | | | 17,900 | | | | 1,034,262 | |
Cisco Systems, Inc. (Communications Equipment) | | | 47,850 | | | | 1,001,022 | |
Citigroup, Inc. (Diversified Financial Services) | | | 23,700 | | | | 1,105,842 | |
Coca-Cola Co. (The) (Beverages) | | | 15,900 | | | | 673,047 | |
¨Covidien PLC (Health Care Equipment & Supplies) | | | 21,650 | | | | 1,382,136 | |
CVS Caremark Corp. (Food & Staples Retailing) | | | 11,050 | | | | 642,889 | |
Exelon Corp. (Electric Utilities) | | | 23,050 | | | | 864,606 | |
Exxon Mobil Corp. (Oil, Gas & Consumable Fuels) | | | 13,150 | | | | 1,170,218 | |
¨General Electric Co. (Industrial Conglomerates) | | | 63,650 | | | | 1,418,758 | |
Halliburton Co. (Energy Equipment & Services) | | | 20,150 | | | | 861,816 | |
Honeywell International, Inc. (Aerospace & Defense) | | | 12,250 | | | | 900,865 | |
¨Johnson & Johnson (Pharmaceuticals) | | | 16,500 | | | | 1,406,295 | |
¨Johnson Controls, Inc. (Auto Components) | | | 39,850 | | | | 1,395,148 | |
JPMorgan Chase & Co. (Diversified Financial Services) | | | 17,500 | | | | 857,675 | |
Marathon Oil Corp. (Oil, Gas & Consumable Fuels) | | | 17,550 | | | | 573,359 | |
McDonald’s Corp. (Hotels, Restaurants & Leisure) | | | 8,550 | | | | 873,297 | |
McKesson Corp. (Health Care Providers & Services) | | | 6,600 | | | | 698,412 | |
Monsanto Co. (Chemicals) | | | 8,500 | | | | 907,970 | |
Mosaic Co. (The) (Chemicals) | | | 9,200 | | | | 566,628 | |
¨Pfizer, Inc. (Pharmaceuticals) | | | 71,550 | | | | 2,079,958 | |
PNC Financial Services Group, Inc. (Commercial Banks) | | | 14,600 | | | | 991,048 | |
Southwestern Energy Co. (Oil, Gas & Consumable Fuels) (a) | | | 25,800 | | | | 965,436 | |
Texas Instruments, Inc. (Semiconductors & Semiconductor Equipment) | | | 30,150 | | | | 1,091,732 | |
Time Warner, Inc. (Media) | | | 18,385 | | | | 1,099,055 | |
Viacom, Inc. Class B (Media) | | | 20,900 | | | | 1,337,391 | |
| | | | | | | | |
| | | | | | | 28,308,291 | |
| | | | | | | | |
Total Common Stocks
(Cost $45,326,718) | | | | | | | 56,675,748 | |
| | | | | | | | |
| † | Percentages indicated are based on Fund net assets. |
| ¨ | | Among the Fund’s 10 largest holdings, as of April 30, 2013, excluding short-term investment. May be subject to change daily. |
| | | | |
| 48 | | MainStay ICAP Global Fund | | The notes to the financial statements are an integral part of,
and should be read in conjunction with, the financial statements. |
Portfolio of Investments April 30, 2013 (Unaudited) (continued)
| | | | | | | | |
| | | Principal
Amount | | | Value | |
| | | | | | | | |
| Short-Term Investment 1.9% | | | | | | | | |
Repurchase Agreement 1.9% | | | | | | | | |
United States 1.9% | | | | | | | | |
State Street Bank and Trust Co.
0.01%, dated 4/30/13
due 5/1/13
Proceeds at Maturity $1,091,945 (Collateralized by a Federal Home Loan Mortgage Corp. security with a rate of 2.10% and a maturity date of 10/17/22, with a Principal Amount of $1,125,000 and a Market Value of $1,117,764) (Capital Markets) | | $ | 1,091,945 | | | $ | 1,091,945 | |
| | | | | | | | |
Total Short-Term Investment
(Cost $1,091,945) | | | | | | | 1,091,945 | |
| | | | | | | | |
Total Investments
(Cost $46,418,663) (b) | | | 99.7 | % | | | 57,767,693 | |
Other Assets, Less Liabilities | | | 0.3 | | | | 171,549 | |
Net Assets | | | 100.0 | % | | $ | 57,939,242 | |
| (a) | Non-income producing security. |
| (b) | As of April 30, 2013, cost is $46,832,481 for federal income tax purposes and net unrealized appreciation is as follows: |
| | | | |
Gross unrealized appreciation | | $ | 11,758,391 | |
Gross unrealized depreciation | | | (823,179 | ) |
| | | | |
Net unrealized appreciation | | $ | 10,935,212 | |
| | | | |
The following abbreviation is used in the above portfolio:
ADR—American Depositary Receipt.
The following is a summary of the fair valuations according to the inputs used as of April 30, 2013, for valuing the Fund’s assets.
Asset Valuation Inputs
| | | | | | | | | | | | | | | | |
Description | | Quoted
Prices in
Active
Markets for
Identical
Assets (Level 1) | | | Significant
Other
Observable
Inputs (Level 2) | | | Significant
Unobservable
Inputs
(Level 3) | | | Total | |
| Investments in Securities (a) | | | | | | | | | | | | | | | | |
| Common Stocks | | $ | 56,675,748 | | | $ | — | | | $ | — | | | $ | 56,675,748 | |
| Short-Term Investment | | | | | | | | | | | | | | | | |
Repurchase Agreement | | | — | | | | 1,091,945 | | | | — | | | | 1,091,945 | |
| | | | | | | | | | | | | | | | |
| Total Investments in Securities | | $ | 56,675,748 | | | $ | 1,091,945 | | | $ | — | | | $ | 57,767,693 | |
| | | | | | | | | | | | | | | | |
| (a) | For a complete listing of investments and their industries, see the Portfolio of Investments. |
The Fund recognizes transfers between the levels as of the beginning of the period.
As of October 31, 2012 and April 30, 2013 foreign equity securities were not fair valued, as a result there were no transfers between Level 1 and Level 2 fair value measurements. (See Note 2)
As of April 30, 2013, the Fund did not hold any investments with significant unobservable inputs (Level 3). (See Note 2)
| | | | | | |
The notes to the financial statements are an integral part of,
and should be read in conjunction with, the financial statements. | | mainstayinvestments.com | | | 49 | |
Portfolio of Investments April 30, 2013 (Unaudited) (continued)
The table below sets forth the diversification of MainStay ICAP Global Fund investments by industry.
Industry Diversification (Unaudited)
| | | | | | | | |
| | | Value | | | Percent † | |
Aerospace & Defense | | $ | 900,865 | | | | 1.5 | % |
Auto Components | | | 2,101,988 | | | | 3.6 | |
Automobiles | | | 1,312,666 | | | | 2.3 | |
Beverages | | | 673,047 | | | | 1.2 | |
Capital Markets | | | 1,091,945 | | | | 1.9 | |
Chemicals | | | 2,228,163 | | | | 3.8 | |
Commercial Banks | | | 5,551,612 | | | | 9.6 | |
Communications Equipment | | | 1,001,022 | | | | 1.7 | |
Construction & Engineering | | | 638,044 | | | | 1.1 | |
Consumer Finance | | | 1,034,262 | | | | 1.8 | |
Diversified Financial Services | | | 1,963,517 | | | | 3.4 | |
Diversified Telecommunication Services | | | 2,531,074 | | | | 4.4 | |
Electric Utilities | | | 864,606 | | | | 1.5 | |
Electrical Equipment | | | 1,069,706 | | | | 1.8 | |
Energy Equipment & Services | | | 861,816 | | | | 1.5 | |
Food & Staples Retailing | | | 642,889 | | | | 1.1 | |
Health Care Equipment & Supplies | | | 3,303,920 | | | | 5.7 | |
Health Care Providers & Services | | | 698,412 | | | | 1.2 | |
Hotels, Restaurants & Leisure | | | 873,297 | | | | 1.5 | |
Industrial Conglomerates | | | 2,410,883 | | | | 4.2 | |
Insurance | | | 922,388 | | | | 1.6 | |
Machinery | | | 961,242 | | | | 1.7 | |
Media | | | 2,436,446 | | | | 4.2 | |
Metals & Mining | | | 801,312 | | | | 1.4 | |
Oil, Gas & Consumable Fuels | | | 5,916,830 | | | | 10.2 | |
Pharmaceuticals | | | 8,638,927 | | | | 14.9 | |
Real Estate Management & Development | | | 876,596 | | | | 1.5 | |
Semiconductors & Semiconductor Equipment | | | 1,091,732 | | | | 1.9 | |
Software | | | 1,419,580 | | | | 2.4 | |
Trading Companies & Distributors | | | 1,217,512 | | | | 2.1 | |
Wireless Telecommunication Services | | | 1,731,394 | | | | 3.0 | |
| | | | | | | | |
| | | 57,767,693 | | | | 99.7 | |
Other Assets, Less Liabilities | | | 171,549 | | | | 0.3 | |
| | | | | | | | |
Net Assets | | $ | 57,939,242 | | | | 100.0 | % |
| | | | | | | | |
| † | Percentages indicated are based on Fund net assets. |
| | | | |
| 50 | | MainStay ICAP Global Fund | | The notes to the financial statements are an integral part of,
and should be read in conjunction with, the financial statements. |
Statement of Assets and Liabilities as of April 30, 2013 (Unaudited)
| | | | |
| Assets | |
Investment in securities, at value
(identified cost $46,418,663) | | $ | 57,767,693 | |
Cash denominated in foreign currencies
(identified cost $46) | | | 46 | |
Receivables: | | | | |
Dividends and interest | | | 181,863 | |
Investment securities sold | | | 131,733 | |
Fund shares sold | | | 1,023 | |
Other assets | | | 38,834 | |
| | | | |
Total assets | | | 58,121,192 | |
| | | | |
|
| Liabilities | |
Payables: | | | | |
Investment securities purchased | | | 76,984 | |
Fund shares redeemed | | | 35,822 | |
Professional fees | | | 29,816 | |
Manager (See Note 3) | | | 27,975 | |
Shareholder communication | | | 4,111 | |
Custodian | | | 3,102 | |
Transfer agent (See Note 3) | | | 2,689 | |
NYLIFE Distributors (See Note 3) | | | 1,337 | |
Trustees | | | 114 | |
| | | | |
Total liabilities | | | 181,950 | |
| | | | |
Net assets | | $ | 57,939,242 | |
| | | | |
| |
| Composition of Net Assets | | | | |
Shares of beneficial interest outstanding (par value of $.001 per share) unlimited number of shares authorized | | $ | 5,637 | |
Additional paid-in capital | | | 55,432,908 | |
| | | | |
| | | 55,438,545 | |
Undistributed net investment income | | | 248,068 | |
Accumulated net realized gain (loss) on investments and foreign currency transactions | | | (9,094,548 | ) |
Net unrealized appreciation (depreciation) on investments | | | 11,349,030 | |
Net unrealized appreciation (depreciation) on translation of other assets and liabilities in foreign currencies | | | (1,853 | ) |
| | | | |
Net assets | | $ | 57,939,242 | |
| | | | |
| | | | |
Investor Class | | | | |
Net assets applicable to outstanding shares | | $ | 793,097 | |
| | | | |
Shares of beneficial interest outstanding | | | 77,434 | |
| | | | |
Net asset value per share outstanding | | $ | 10.24 | |
Maximum sales charge (5.50% of offering price) | | | 0.60 | |
| | | | |
Maximum offering price per share outstanding | | $ | 10.84 | |
| | | | |
Class A | | | | |
Net assets applicable to outstanding shares | | $ | 4,080,180 | |
| | | | |
Shares of beneficial interest outstanding | | | 397,703 | |
| | | | |
Net asset value per share outstanding | | $ | 10.26 | |
Maximum sales charge (5.50% of offering price) | | | 0.60 | |
| | | | |
Maximum offering price per share outstanding | | $ | 10.86 | |
| | | | |
Class C | | | | |
Net assets applicable to outstanding shares | | $ | 436,563 | |
| | | | |
Shares of beneficial interest outstanding | | | 42,800 | |
| | | | |
Net asset value and offering price per share outstanding | | $ | 10.20 | |
| | | | |
Class I | | | | |
Net assets applicable to outstanding shares | | $ | 52,629,402 | |
| | | | |
Shares of beneficial interest outstanding | | | 5,119,427 | |
| | | | |
Net asset value and offering price per share outstanding | | $ | 10.28 | |
| | | | |
| | | | | | |
The notes to the financial statements are an integral part of,
and should be read in conjunction with, the financial statements. | | mainstayinvestments.com | | | 51 | |
Statement of Operations for the six months ended April 30, 2013 (Unaudited)
| | | | |
| Investment Income (Loss) | |
Income | | | | |
Dividends (a) | | $ | 591,387 | |
Interest | | | 55 | |
| | | | |
Total income | | | 591,442 | |
| | | | |
Expenses | | | | |
Manager (See Note 3) | | | 213,670 | |
Registration | | | 26,644 | |
Professional fees | | | 25,254 | |
Shareholder communication | | | 8,129 | |
Custodian | | | 7,476 | |
Distribution/Service—Investor Class (See Note 3) | | | 908 | |
Distribution/Service—Class A (See Note 3) | | | 4,727 | |
Distribution/Service—Class C (See Note 3) | | | 1,653 | |
Transfer agent (See Note 3) | | | 7,194 | |
Trustees | | | 615 | |
Miscellaneous | | | 7,688 | |
| | | | |
Total expenses before waiver/reimbursement | | | 303,958 | |
Expense waiver/reimbursement from Manager (See Note 3) | | | (56,055 | ) |
| | | | |
Net expenses | | | 247,903 | |
| | | | |
Net investment income (loss) | | | 343,539 | |
| | | | |
|
| Realized and Unrealized Gain (Loss) on Investments and Foreign Currency Transactions | |
Net realized gain (loss) on: | | | | |
Security transactions | | | 2,103,627 | |
Foreign currency transactions | | | (11,917 | ) |
| | | | |
Net realized gain (loss) on investments and foreign currency transactions | | | 2,091,710 | |
| | | | |
Net change in unrealized appreciation (depreciation) on: | | | | |
Investments | | | 5,628,982 | |
Translation of other assets and liabilities in foreign currencies | | | 745 | |
| | | | |
Net change in unrealized appreciation (depreciation) on investments and foreign currency transactions | | | 5,629,727 | |
| | | | |
Net realized and unrealized gain (loss) on investments and foreign currency transactions | | | 7,721,437 | |
| | | | |
Net increase (decrease) in net assets resulting from operations | | $ | 8,064,976 | |
| | | | |
| (a) | Dividends recorded net of foreign withholding taxes in the amount of $31,406. |
| | | | |
| 52 | | MainStay ICAP Global Fund | | The notes to the financial statements are an integral part of,
and should be read in conjunction with, the financial statements. |
Statements of Changes in Net Assets
for the six months ended April 30, 2013 (Unaudited) and the year ended October 31, 2012
| | | | | | | | |
| | | 2013 | | | 2012 | |
| Increase (Decrease) in Net Assets | |
Operations: | | | | | | | | |
Net investment income (loss) | | $ | 343,539 | | | $ | 949,920 | |
Net realized gain (loss) on investments and foreign currency transactions | | | 2,091,710 | | | | 92,167 | |
Net change in unrealized appreciation (depreciation) on investments and foreign currency transactions | | | 5,629,727 | | | | 3,523,627 | |
| | | | |
Net increase (decrease) in net assets resulting from operations | | | 8,064,976 | | | | 4,565,714 | |
| | | | |
Dividends to shareholders: | | | | | | | | |
From net investment income: | | | | | | | | |
Investor Class | | | (9,647 | ) | | | (2,768 | ) |
Class A | | | (52,615 | ) | | | (23,917 | ) |
Class C | | | (1,899 | ) | | | (520 | ) |
Class I | | | (798,553 | ) | | | (290,800 | ) |
| | | | |
Total dividends to shareholders | | | (862,714 | ) | | | (318,005 | ) |
| | | | |
Capital share transactions: | | | | | | | | |
Net proceeds from sale of shares | | | 490,492 | | | | 811,419 | |
Net asset value of shares issued to shareholders in reinvestment of dividends | | | 861,281 | | | | 317,177 | |
Cost of shares redeemed | | | (312,352 | ) | | | (6,050,578 | ) |
| | | | |
Increase (decrease) in net assets derived from capital share transactions | | | 1,039,421 | | | | (4,921,982 | ) |
| | | | |
Net increase (decrease) in net assets | | | 8,241,683 | | | | (674,273 | ) |
| | |
| Net Assets | | | | | | | | |
Beginning of period | | | 49,697,559 | | | | 50,371,832 | |
| | | | |
End of period | | $ | 57,939,242 | | | $ | 49,697,559 | |
| | | | |
Undistributed net investment income at end of period | | $ | 248,068 | | | $ | 767,243 | |
| | | | |
| | | | | | |
The notes to the financial statements are an integral part of,
and should be read in conjunction with, the financial statements. | | mainstayinvestments.com | | | 53 | |
Financial Highlights selected per share data and ratios
| | | | | | | | | | | | | | | | | | | | | | | | |
| | | Investor Class | |
| | | Six months
ended
April 30, | | | Year ended October 31, | | | April 30,
2008**
through
October 31, | |
| | | 2013* | | | 2012 | | | 2011 | | | 2010 | | | 2009 | | | 2008 | |
Net asset value at beginning of period | | $ | 8.95 | | | $ | 8.26 | | | $ | 8.51 | | | $ | 7.67 | | | $ | 6.46 | | | $ | 10.00 | |
| | | | | | | | | | | | | | | | | | | | | | | | |
Net investment income (loss) | | | 0.05 | | | | 0.14 | (a) | | | 0.13 | (a) | | | 0.10 | | | | 0.11 | | | | 0.08 | (a) |
Net realized and unrealized gain (loss) on investments | | | 1.37 | | | | 0.59 | | | | (0.25 | ) | | | 0.83 | | | | 1.24 | | | | (3.57 | ) |
Net realized and unrealized gain (loss) on foreign currency transactions | | | (0.00 | )‡ | | | (0.00 | )‡ | | | (0.00 | )‡ | | | 0.00 | ‡ | | | (0.00 | )‡ | | | (0.00 | )‡ |
| | | | | | | | | | | | | | | | | | | | | | | | |
Total from investment operations | | | 1.42 | | | | 0.73 | | | | (0.12 | ) | | | 0.93 | | | | 1.35 | | | | (3.49 | ) |
| | | | | | | | | | | | | | | | | | | | | | | | |
Less dividends: | | | | | | | | | | | | | | | | | | | | | | | | |
From net investment income | | | (0.13 | ) | | | (0.04 | ) | | | (0.13 | ) | | | (0.09 | ) | | | (0.14 | ) | | | (0.05 | ) |
| | | | | | | | | | | | | | | | | | | | | | | | |
Redemption fee (b) | | | — | | | | — | | | | — | | | | — | | | | — | | | | 0.00 | ‡(a) |
| | | | | | | | | | | | | | | | | | | | | | | | |
Net asset value at end of period | | $ | 10.24 | | | $ | 8.95 | | | $ | 8.26 | | | $ | 8.51 | | | $ | 7.67 | | | $ | 6.46 | |
| | | | | | | | | | | | | | | | | | | | | | | | |
Total investment return (c) | | | 16.04 | %(d) | | | 8.90 | % | | | (1.56 | %) | | | 12.32 | % | | | 21.46 | % | | | (35.07 | %)(d) |
Ratios (to average net assets)/Supplemental Data: | | | | | | | | | | | | | | | | | | | | | | | | |
Net investment income (loss) | | | 1.02 | %†† | | | 1.68 | % | | | 1.50 | % | | | 1.26 | % | | | 1.57 | % | | | 1.84 | % †† |
Net expenses | | | 1.20 | %†† | | | 1.20 | % | | | 1.20 | % | | | 1.20 | % | | | 1.20 | % | | | 1.20 | % †† |
Expenses (before waiver/reimbursement) | | | 1.62 | %†† | | | 1.59 | % | | | 1.62 | % | | | 1.72 | % | | | 1.68 | % | | | 2.18 | % †† |
Portfolio turnover rate | | | 34 | % | | | 89 | % | | | 71 | % | | | 79 | % | | | 106 | % | | | 75 | % |
Net assets at end of period (in 000’s) | | $ | 793 | | | $ | 635 | | | $ | 558 | | | $ | 368 | | | $ | 209 | | | $ | 56 | |
| ** | Commencement of operations. |
| ‡ | Less than one cent per share. |
| (a) | Per share data based on average shares outstanding during the period. |
| (b) | The redemption fee was discontinued as of April 1, 2010. |
| (c) | Total investment return is calculated exclusive of sales charges and assumes the reinvestment of dividends and distributions. |
| (d) | Total investment return is not annualized. |
| | | | |
| 54 | | MainStay ICAP Global Fund | | The notes to the financial statements are an integral part of,
and should be read in conjunction with, the financial statements. |
Financial Highlights selected per share data and ratios
| | | | | | | | | | | | | | | | | | | | | | | | |
| | | Class A | |
| | | Six months
ended
April 30, | | | Year ended October 31, | | | April 30,
2008**
through
October 31, | |
| | | 2013* | | | 2012 | | | 2011 | | | 2010 | | | 2009 | | | 2008 | |
Net asset value at beginning of period | | $ | 8.97 | | | $ | 8.28 | | | $ | 8.52 | | | $ | 7.68 | | | $ | 6.47 | | | $ | 10.00 | |
| | | | | | | | | | | | | | | | | | | | | | | | |
Net investment income (loss) | | | 0.05 | | | | 0.15 | (a) | | | 0.13 | (a) | | | 0.12 | | | | 0.10 | | | | 0.09 | (a) |
Net realized and unrealized gain (loss) on investments | | | 1.37 | | | | 0.58 | | | | (0.24 | ) | | | 0.81 | | | | 1.26 | | | | (3.57 | ) |
Net realized and unrealized gain (loss) on foreign currency transactions | | | (0.00 | )‡ | | | (0.00 | )‡ | | | (0.00 | )‡ | | | 0.00 | ‡ | | | (0.00 | )‡ | | | (0.00 | )‡ |
| | | | | | | | | | | | | | | | | | | | | | | | |
Total from investment operations | | | 1.42 | | | | 0.73 | | | | (0.11 | ) | | | 0.93 | | | | 1.36 | | | | (3.48 | ) |
| | | | | | | | | | | | | | | | | | | | | | | | |
Less dividends: | | | | | | | | | | | | | | | | | | | | | | | | |
From net investment income | | | (0.13 | ) | | | (0.04 | ) | | | (0.13 | ) | | | (0.09 | ) | | | (0.15 | ) | | | (0.05 | ) |
| | | | | | | | | | | | | | | | | | | | | | | | |
Redemption fee (b) | | | — | | | | — | | | | — | | | | 0.00 | ‡(a) | | | 0.00 | ‡(a) | | | 0.00 | ‡(a) |
| | | | | | | | | | | | | | | | | | | | | | | | |
Net asset value at end of period | | $ | 10.26 | | | $ | 8.97 | | | $ | 8.28 | | | $ | 8.52 | | | $ | 7.68 | | | $ | 6.47 | |
| | | | | | | | | | | | | | | | | | | | | | | | |
Total investment return (c) | | | 16.07 | %(d) | | | 8.91 | % | | | (1.40 | %) | | | 12.36 | % | | | 21.49 | % | | | (34.97 | %)(d) |
Ratios (to average net assets)/Supplemental Data: | | | | | | | | | | | | | | | | | | | | | | | | |
Net investment income (loss) | | | 1.06 | %†† | | | 1.71 | % | | | 1.46 | % | | | 1.30 | % | | | 1.63 | % | | | 2.02 | % †† |
Net expenses | | | 1.15 | %†† | | | 1.15 | % | | | 1.15 | % | | | 1.15 | % | | | 1.15 | % | | | 1.15 | % †† |
Expenses (before waiver/reimbursement) | | | 1.36 | %†† | | | 1.38 | % | | | 1.42 | % | | | 1.53 | % | | | 1.46 | % | | | 1.99 | % †† |
Portfolio turnover rate | | | 34 | % | | | 89 | % | | | 71 | % | | | 79 | % | | | 106 | % | | | 75 | % |
Net assets at end of period (in 000’s) | | $ | 4,080 | | | $ | 3,503 | | | $ | 4,584 | | | $ | 2,398 | | | $ | 801 | | | $ | 374 | |
| ** | Commencement of operations. |
| ‡ | Less than one cent per share. |
| (a) | Per share data based on average shares outstanding during the period. |
| (b) | The redemption fee was discontinued as of April 1, 2010. |
| (c) | Total investment return is calculated exclusive of sales charges and assumes the reinvestment of dividends and distributions. |
| (d) | Total investment return is not annualized. |
| | | | | | |
The notes to the financial statements are an integral part of,
and should be read in conjunction with, the financial statements. | | mainstayinvestments.com | | | 55 | |
Financial Highlights selected per share data and ratios
| | | | | | | | | | | | | | | | | | | | | | | | |
| | | Class C | |
| | | Six months
ended
April 30, | | | Year ended October 31, | | | April 30,
2008**
through
October 31, | |
| | | 2013* | | | 2012 | | | 2011 | | | 2010 | | | 2009 | | | 2008 | |
Net asset value at beginning of period | | $ | 8.88 | | | $ | 8.23 | | | $ | 8.48 | | | $ | 7.65 | | | $ | 6.45 | | | $ | 10.00 | |
| | | | | | | | | | | | | | | | | | | | | | | | |
Net investment income (loss) | | | 0.01 | | | | 0.08 | (a) | | | 0.06 | (a) | | | 0.04 | | | | 0.06 | | | | 0.05 | (a) |
Net realized and unrealized gain (loss) on investments | | | 1.37 | | | | 0.58 | | | | (0.24 | ) | | | 0.83 | | | | 1.24 | | | | (3.57 | ) |
Net realized and unrealized gain (loss) on foreign currency transactions | | | (0.00 | )‡ | | | (0.00 | )‡ | | | (0.00 | )‡ | | | 0.00 | ‡ | | | (0.00 | )‡ | | | (0.00 | )‡ |
| | | | | | | | | | | | | | | | | | | | | | | | |
Total from investment operations | | | 1.38 | | | | 0.66 | | | | (0.18 | ) | | | 0.87 | | | | 1.30 | | | | (3.52 | ) |
| | | | | | | | | | | | | | | | | | | | | | | | |
Less dividends: | | | | | | | | | | | | | | | | | | | | | | | | |
From net investment income | | | (0.06 | ) | | | (0.01 | ) | | | (0.07 | ) | | | (0.04 | ) | | | (0.10 | ) | | | (0.03 | ) |
| | | | | | | | | | | | | | | | | | | | | | | | |
Redemption fee (b) | | | — | | | | — | | | | — | | | | — | | | | — | | | | 0.00 | ‡(a) |
| | | | | | | | | | | | | | | | | | | | | | | | |
Net asset value at end of period | | $ | 10.20 | | | $ | 8.88 | | | $ | 8.23 | | | $ | 8.48 | | | $ | 7.65 | | | $ | 6.45 | |
| | | | | | | | | | | | | | | | | | | | | | | | |
Total investment return (c) | | | 15.61 | %(d) | | | 8.06 | % | | | (2.19 | %) | | | 11.45 | % | | | 20.56 | % | | | (35.26 | %)(d) |
Ratios (to average net assets)/Supplemental Data: | | | | | | | | | | | | | | | | | | | | | | | | |
Net investment income (loss) | | | 0.31 | %†† | | | 0.88 | % | | | 0.74 | % | | | 0.49 | % | | | 0.71 | % | | | 1.15 | % †† |
Net expenses | | | 1.95 | %†† | | | 1.95 | % | | | 1.95 | % | | | 1.95 | % | | | 1.95 | % | | | 1.95 | % †† |
Expenses (before waiver/reimbursement) | | | 2.37 | %†† | | | 2.34 | % | | | 2.37 | % | | | 2.47 | % | | | 2.42 | % | | | 2.93 | % †† |
Portfolio turnover rate | | | 34 | % | | | 89 | % | | | 71 | % | | | 79 | % | | | 106 | % | | | 75 | % |
Net assets at end of period (in 000’s) | | $ | 437 | | | $ | 287 | | | $ | 357 | | | $ | 172 | | | $ | 142 | | | $ | 20 | |
| ** | Commencement of operations. |
| ‡ | Less than one cent per share. |
| (a) | Per share data based on average shares outstanding during the period. |
| (b) | The redemption fee was discontinued as of April 1, 2010. |
| (c) | Total investment return is calculated exclusive of sales charges and assumes the reinvestment of dividends and distributions. |
| (d) | Total investment return is not annualized. |
| | | | |
| 56 | | MainStay ICAP Global Fund | | The notes to the financial statements are an integral part of,
and should be read in conjunction with, the financial statements. |
Financial Highlights selected per share data and ratios
| | | | | | | | | | | | | | | | | | | | | | | | |
| | | Class I | |
| | | Six months
ended
April 30, | | | Year ended October 31, | | | April 30,
2008**
through
October 31, | |
| | | 2013* | | | 2012 | | | 2011 | | | 2010 | | | 2009 | | | 2008 | |
Net asset value at beginning of period | | $ | 9.00 | | | $ | 8.30 | | | $ | 8.53 | | | $ | 7.69 | | | $ | 6.47 | | | $ | 10.00 | |
| | | | | | | | | | | | | | | | | | | | | | | | |
Net investment income (loss) | | | 0.06 | | | | 0.17 | (a) | | | 0.16 | (a) | | | 0.12 | | | | 0.13 | | | | 0.10 | (a) |
Net realized and unrealized gain (loss) on investments | | | 1.38 | | | | 0.58 | | | | (0.24 | ) | | | 0.83 | | | | 1.25 | | | | (3.58 | ) |
Net realized and unrealized gain (loss) on foreign currency transactions | | | (0.00 | )‡ | | | (0.00 | )‡ | | | (0.00 | )‡ | | | 0.00 | ‡ | | | (0.00 | )‡ | | | (0.00 | )‡ |
| | | | | | | | | | | | | | | | | | | | | | | | |
Total from investment operations | | | 1.44 | | | | 0.75 | | | | (0.08 | ) | | | 0.95 | | | | 1.38 | | | | (3.48 | ) |
| | | | | | | | | | | | | | | | | | | | | | | | |
Less dividends: | | | | | | | | | | | | | | | | | | | | | | | | |
From net investment income | | | (0.16 | ) | | | (0.05 | ) | | | (0.15 | ) | | | (0.11 | ) | | | (0.16 | ) | | | (0.05 | ) |
| | | | | | | | | | | | | | | | | | | | | | | | |
Redemption fee (b) | | | — | | | | — | | | | — | | | | 0.00 | ‡(a) | | | — | | | | 0.00 | ‡(a) |
| | | | | | | | | | | | | | | | | | | | | | | | |
Net asset value at end of period | | $ | 10.28 | | | $ | 9.00 | | | $ | 8.30 | | | $ | 8.53 | | | $ | 7.69 | | | $ | 6.47 | |
| | | | | | | | | | | | | | | | | | | | | | | | |
Total investment return (c) | | | 16.21 | %(d) | | | 9.27 | % | | | (1.23 | %) | | | 12.56 | % | | | 21.74 | % | | | (34.86 | %)(d) |
Ratios (to average net assets)/Supplemental Data: | | | | | | | | | | | | | | | | | | | | | | | | |
Net investment income (loss) | | | 1.31 | %†† | | | 1.94 | % | | | 1.78 | % | | | 1.50 | % | | | 2.02 | % | | | 2.25 | % †† |
Net expenses | | | 0.90 | %†† | | | 0.90 | % | | | 0.90 | % | | | 0.90 | % | | | 0.90 | % | | | 0.90 | % †† |
Expenses (before waiver/reimbursement) | | | 1.11 | %†† | | | 1.13 | % | | | 1.17 | % | | | 1.27 | % | | | 1.20 | % | | | 1.74 | % †† |
Portfolio turnover rate | | | 34 | % | | | 89 | % | | | 71 | % | | | 79 | % | | | 106 | % | | | 75 | % |
Net assets at end of period (in 000’s) | | $ | 52,629 | | | $ | 45,273 | | | $ | 44,873 | | | $ | 42,867 | | | $ | 37,680 | | | $ | 31,662 | |
| ** | Commencement of operations. |
| ‡ | Less than one cent per share. |
| (a) | Per share data based on average shares outstanding during the period. |
| (b) | The redemption fee was discontinued as of April 1, 2010. |
| (c) | Total investment return is calculated exclusive of sales charges and assumes the reinvestment of dividends and distributions. Class I shares are not subject to sales charges. |
| (d) | Total investment return is not annualized. |
| | | | | | |
The notes to the financial statements are an integral part of,
and should be read in conjunction with, the financial statements. | | mainstayinvestments.com | | | 57 | |
MainStay ICAP International Fund
Investment and Performance Comparison1 (Unaudited)
Performance data quoted represents past performance. Past performance is no guarantee of future results. Because of market volatility, current performance may be lower or higher than the figures shown. Investment return and principal value will fluctuate, and as a result, when shares are redeemed, they may be worth more or less than their original cost. The graph below depicts the historical performance of Class I shares of the Fund. Performance will vary from class to class based on differences in class-specific expenses and sales charges. For performance information current to the most recent month-end, please call 800-MAINSTAY (624-6782) or visit mainstayinvestments.com.
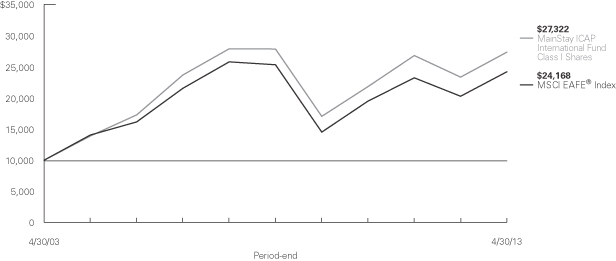
Average Annual Total Returns for the Period Ended April 30, 2013
| | | | | | | | | | | | | | | | | | | | | | | | |
| Class | | Sales Charge | | | | Six Months | | | One Year | | | Five Years | | | Ten Years | | | Gross
Expense
Ratio2 | |
| Investor Class Shares3 | | Maximum 5.5% Initial Sales Charge | | With sales charges Excluding sales charges | |
| 9.07
15.42 | %
| |
| 10.12
16.53 | %
| |
| –1.99
–0.87 | %
| |
| 9.52
10.14 | %
| |
| 1.45
1.45 | %
|
| Class A Shares4 | | Maximum 5.5% Initial Sales Charge | | With sales charges Excluding sales charges | |
| 9.11
15.46 |
| |
| 10.19
16.60 |
| |
| –1.81
–0.69 |
| |
| 9.62
10.25 |
| |
| 1.31
1.31 |
|
| Class C Shares4 | | Maximum 1% CDSC if Redeemed Within One Year of Purchase | | With sales charges Excluding sales charges | |
| 14.00
15.00 |
| |
| 14.62
15.62 |
| |
| –1.61
–1.61 |
| |
| 9.32
9.32 |
| |
| 2.20
2.20 |
|
| Class I Shares | | No Sales Charge | | | | | 15.67 | | | | 17.06 | | | | –0.36 | | | | 10.57 | | | | 1.06 | |
| Class R1 Shares4 | | No Sales Charge | | | | | 15.62 | | | | 16.93 | | | | –0.48 | | | | 10.45 | | | | 1.16 | |
| Class R2 Shares4 | | No Sales Charge | | | | | 15.40 | | | | 16.51 | | | | –0.80 | | | | 10.14 | | | | 1.41 | |
| Class R3 Shares4 | | No Sales Charge | | | | | 15.27 | | | | 16.22 | | | | –1.05 | | | | 9.86 | | | | 1.66 | |
| 1. | The performance table and graph do not reflect the deduction of taxes that a shareholder would pay on distributions or Fund share redemptions. Total returns reflect maximum applicable sales charges as indicated in the table above, changes in share price, and reinvestment of dividend and capital gain distributions. The graph assumes the initial investment amount shown above and reflects the deduction of all sales charges that would have applied for the period of investment. Performance figures reflect certain fee waivers and/or expense limitations, without which total returns may have been lower. For more information on share classes and current fee waivers and/or expense limitations, please refer to the notes to the financial statements. Effective August 31, 2006 ICAP International Fund was renamed MainStay ICAP International Fund. At that time, the Fund’s existing no-load shares were redesignated as Class I shares. |
| 2. | The gross expense ratios presented reflect the Fund’s “Total Annual Fund Operating Expenses” from the most recent Prospectus and may differ from other expense ratios disclosed in this report. |
| 3. | Performance figures for Investor Class shares, first offered on April 29, 2008, include the historical performance of Class A shares through April 28, 2008, adjusted for differences in certain expenses and fees. Unadjusted, the performance for Investor Class shares would likely have been different. |
| 4. | Performance figures for Class A, C, R1, R2 and R3 shares, first offered on September 1, 2006, include the historical performance of Class I shares through August 31, 2006, adjusted for differences in certain expenses and fees. Unadjusted, the performance for these shares classes would likely have been different. |
The footnotes on the next page are an integral part of the table and graph and should be carefully read in conjunction with them.
| | |
| 58 | | MainStay ICAP International Fund |
| | | | | | | | | | | | | | | | |
| Benchmark Performance | | Six
Months | | | One Year | | | Five
Years | | | Ten
Years | |
MSCI EAFE® Index5 | | | 16.90 | % | | | 19.39 | % | | | –0.93 | % | | | 9.23 | % |
Average Lipper International Large-Cap Core Fund6 | | | 14.84 | | | | 16.71 | | | | –1.15 | | | | 8.82 | |
| 5. | The MSCI EAFE® Index consists of international stocks representing the developed world outside North America. The MSCI EAFE® Index is the Fund’s broad-based securities market index for comparison purposes. Results assume reinvestment of all dividends and capital gains. An investment cannot be made directly in an index. |
| 6. | The average Lipper international large-cap core fund is representative of funds that, by portfolio practice, invest at least 75% of their equity assets in companies strictly outside of the U.S. with market capitalizations (on a three-year weighted basis) above Lipper’s international large-cap floor. International large-cap core funds typically have an average price-to cash |
| | flow ratio, price-to-book ratio, and three-year sales-per-share growth value compared to their large-cap-specific subset of the S&P/Citigroup World ex-U.S. BMI. This benchmark is a product of Lipper Inc. Lipper Inc. is an independent monitor of fund performance. Results are based on total returns with all dividend and capital gain distributions reinvested. |
The footnotes on the preceding page are an integral part of the table and graph and should be carefully read in conjunction with them.
| | | | |
| mainstayinvestments.com | | | 59 | |
Cost in Dollars of a $1,000 Investment in MainStay ICAP International Fund (Unaudited)
The example below is intended to describe the fees and expenses borne by shareholders during the six-month period from November 1, 2012, to April 30, 2013, and the impact of those costs on your investment.
Example
As a shareholder of the Fund, you incur two types of costs: (1) transaction costs, including exchange fees and sales charges (loads) on purchases (as applicable), and (2) ongoing costs, including management fees, distribution and/or service (12b-1) fees, and other Fund expenses (as applicable). This example is intended to help you understand your ongoing costs (in dollars) of investing in the Fund and to compare these costs with the ongoing costs of investing in other mutual funds. The example is based on an investment of $1,000 made at the beginning of the six-month period and held for the entire period from November 1, 2012, to April 30, 2013.
This example illustrates your Fund’s ongoing costs in two ways:
Actual Expenses
The second and third data columns in the table below provide information about actual account values and actual expenses. You may use the information in these columns, together with the amount you invested, to estimate the expenses that you paid during the six months ended April 30, 2013. Simply divide your account value by $1,000 (for example, an $8,600 account value divided by $1,000 = 8.6), then
multiply the result by the number under the heading entitled “Expenses Paid During Period” to estimate the expenses you paid on your account during this period.
Hypothetical Example for Comparison Purposes
The fourth and fifth data columns in the table below provide information about hypothetical account values and hypothetical expenses based on the Fund’s actual expense ratio and an assumed rate of return of 5% per year before expenses, which is not the Fund’s actual return. The hypothetical account values and expenses may not be used to estimate the actual ending account balances or expenses you paid for the six-month period shown. You may use this information to compare the ongoing costs of investing in the Fund with the ongoing costs of investing in other Funds. To do so, compare this 5% hypothetical example with the 5% hypothetical examples that appear in the shareholder reports of the other Funds.
Please note that the expenses shown in the table are meant to highlight your ongoing costs only and do not reflect any transactional costs, such as exchange fees or sales charges (loads). Therefore, the fourth and fifth data columns of the table are useful in comparing ongoing costs only and will not help you determine the relative total costs of owning different funds. In addition, if these transactional costs were included, your costs would have been higher.
| | | | | | | | | | | | | | | | | | | | |
| | | | | | | | | | | | | | | | |
| Share Class | | Beginning
Account
Value
11/1/12 | | | Ending Account
Value (Based
on Actual
Returns and
Expenses)
4/30/13 | | | Expenses
Paid
During
Period1 | | | Ending Account
Value (Based
on Hypothetical
5% Annualized
Return and
Actual Expenses)
4/30/13 | | | Expenses
Paid
During
Period1 | |
| | | | | |
| Investor Class Shares | | $ | 1,000.00 | | | $ | 1,154.20 | | | $ | 7.53 | | | $ | 1,017.80 | | | $ | 7.05 | |
| | | | | |
| Class A Shares | | $ | 1,000.00 | | | $ | 1,154.60 | | | $ | 6.89 | | | $ | 1,018.40 | | | $ | 6.46 | |
| | | | | |
| Class C Shares | | $ | 1,000.00 | | | $ | 1,150.00 | | | $ | 11.51 | | | $ | 1,014.10 | | | $ | 10.79 | |
| | | | | |
| Class I Shares | | $ | 1,000.00 | | | $ | 1,156.70 | | | $ | 5.08 | | | $ | 1,020.10 | | | $ | 4.76 | |
| | | | | |
| Class R1 Shares | | $ | 1,000.00 | | | $ | 1,156.20 | | | $ | 5.61 | | | $ | 1,019.60 | | | $ | 5.26 | |
| | | | | |
| Class R2 Shares | | $ | 1,000.00 | | | $ | 1,154.00 | | | $ | 7.42 | | | $ | 1,017.90 | | | $ | 6.95 | |
| | | | | |
| Class R3 Shares | | $ | 1,000.00 | | | $ | 1,152.70 | | | $ | 8.75 | | | $ | 1,016.70 | | | $ | 8.20 | |
| 1. | Expenses are equal to the Fund’s annualized expense ratio of each class (1.41% for Investor Class, 1.29% for Class A, 2.16% for Class C, 0.95% for Class I, 1.05% for Class R1, 1.39% for Class R2 and 1.64% for Class R3) multiplied by the average account value over the period, divided by 365 and multiplied by 181 (to reflect the six-month period). The table above represents the actual expenses incurred during the six-month period. |
| | |
| 60 | | MainStay ICAP International Fund |
Country Composition as of April 30, 2013 (Unaudited)
| | | | |
| Japan | | | 20.9 | % |
| United Kingdom | | | 15.4 | |
| Germany | | | 14.0 | |
| France | | | 10.8 | |
| Switzerland | | | 9.3 | |
| Canada | | | 5.8 | |
| Italy | | | 4.8 | |
| United States | | | 4.3 | |
| | | | |
| Netherlands | | | 3.5 | % |
| Singapore | | | 3.1 | |
| Norway | | | 3.0 | |
| Israel | | | 2.5 | |
| China | | | 1.3 | |
| India | | | 1.1 | |
| Other Assets, Less Liabilities | | | 0.2 | |
| | | | |
| | | 100.0 | % |
| | | | |
See Portfolio of Investments beginning on page 64 for specific holdings within these categories.
Top Ten Holdings as of April 30, 2013 (excluding short-term investment)
| 2. | Vodafone Group PLC, Sponsored ADR |
| 5. | Nippon Telegraph & Telephone Corp. |
| 7. | Lloyds Banking Group PLC |
| 10. | DBS Group Holdings, Ltd. |
| | | | |
| mainstayinvestments.com | | | 61 | |
Portfolio Management Discussion and Analysis (Unaudited)
Questions answered by portfolio managers Jerrold K. Senser, CFA, Thomas R. Wenzel, CFA, and Thomas M. Cole, CFA, of Institutional Capital LLC (ICAP), the Fund’s Subadvisor.
How did MainStay ICAP International Fund perform relative to its peers and its benchmark during the six months ended April 30, 2013?
Excluding all sales charges, MainStay ICAP International Fund returned 15.42% for Investor Class shares, 15.46% for Class A shares and 15.00% for Class C shares for the six months ended April 30, 2013. Over the same period, Class I shares returned 15.67%, Class R1 shares returned 15.62%, Class R2 shares returned 15.40% and Class R3 shares returned 15.27%. All share classes outperformed the 14.84% return of the average Lipper1 international large-cap core fund for the six months ended April 30, 2013. All share classes underperformed the 16.90% return of the MSCI EAFE® Index2 for the same period. The MSCI EAFE® Index is the Fund’s broad-based securities-market index. See page 58 for Fund returns with applicable sales charges.
What factors affected the Fund’s relative performance during the reporting period?
A number of key drivers affected the Fund’s performance relative to the MSCI EAFE® Index. Favorable stock selection in the consumer discretionary and financials sectors added to the Fund’s relative performance. Stock selection in the materials and telecommunication services sectors, however, detracted from the Fund’s relative performance. The Fund benefited from an overweight position relative to the MSCI EAFE® Index in the health care sector. An underweight position in the financials sector detracted from the Fund’s performance relative to the Index.
During the reporting period, which sectors were the strongest positive contributors to the Fund’s performance and which sectors were particularly weak?
The sectors that made the strongest positive contributions to the Fund’s performance relative to the MSCI EAFE® Index were consumer discretionary, utilities and health care. (Contributions take weightings and total returns into account.) Favorable stock selection was the primary driver in the consumer discretionary sector. Having an underweight position in utilities and an overweight position in health care added to the Fund’s relative performance.
The sectors that detracted most from the Fund’s performance relative to the MSCI EAFE® Index were materials, telecommunication services and energy. Stock selection was the primary driver in the materials and telecommunication services sectors. An overweight position in the energy sector detracted from the Fund’s relative performance.
During the reporting period, which individual stocks made the strongest positive contributions to the Fund’s performance and which stocks detracted the most?
The stocks that made the strongest positive contributions to the Fund’s absolute performance were global tire supplier Bridgestone, diversified health care company Novartis and U.K. retail and commercial bank Lloyds Banking Group. Bridgestone’s results exceeded expectations because of increased pricing and profit margins, aided by a weaker yen. Novartis benefited from the success of Afinitor (a cancer treatment) and Gilenya (a multiple sclerosis treatment) as well as from signs that lingering manufacturing issues seemed closer to resolution. Lloyds Banking Group’s shares advanced on growth in core profits and improved cost control. All three positions were held by the Fund at the end of the reporting period.
Major detractors from the Fund’s absolute performance included global gold mining company Barrick Gold, German steel producer ThyssenKrupp and North American natural gas producer Encana. Barrick Gold lagged as production delays and cost overruns hampered the company’s results and outlook. We sold the Fund’s position in Barrick Gold because of the risk that these issues would continue rather than be resolved. ThyssenKrupp underperformed the MSCI EAFE® Index after results and restructuring efforts suggested to some investors that a dilutive equity issuance might be forthcoming. Encana suffered as continued low natural gas prices and increased capital expenditures weighed on the company’s results. ThyssenKrupp and Encana remained in the Fund at the end of the reporting period because we believed that these stocks were attractively valued and had strong catalysts for potential appreciation.
Did the Fund make any significant purchases or sales during the reporting period?
We continued to look for stocks with attractive valuations and specific catalysts that we believed could trigger appreciation over a 12- to 18-month time frame.
We added a Fund position in diversified pharmaceutical company Teva Pharmaceutical because we believe its stock could benefit from management’s focus on further integration of the company’s past acquisitions. We also added a Fund position in global orthopedics company Smith & Nephew. We believed that the stock could benefit from growth in the company’s advanced wound therapy business. This growth has been driven by the recent acquisition of Healthpoint and by continued market share gains in the negative pressure wound therapy segment.
In addition to the sales already mentioned, we sold the Fund’s position in French industrial company Schneider Electric. We sold Schneider Electric when we found other stocks that we
| 1. | See footnote on page 59 for more information on Lipper Inc. |
| 2. | See footnote on page 59 for more information on the MSCI EAFE® Index. |
| | |
| 62 | | MainStay ICAP International Fund |
believed had greater potential upside and were more attractive on a relative valuation basis.
How did the Fund’s sector weightings change during the reporting period?
The Fund increased its sector exposure relative to the MSCI EAFE® Index in health care and financials. In health care, the Fund added to a position that was already overweight relative to the MSCI EAFE® Index. Even with the increase in financials, however, the Fund remained underweight relative to the Index.
During the reporting period, the Fund decreased its allocations relative to the MSCI EAFE® Index in the consumer staples and industrials sectors. In consumer staples, the Fund moved from
an underweight position to one that was more substantially underweight relative to the Index. In industrials, the Fund remained overweight relative to the Index, but at a reduced level.
How was the Fund positioned at the end of the reporting period?
As of April 30, 2013, the Fund was most significantly overweight relative to the MSCI EAFE® Index in the health care and telecommunication services sectors. As of the same date, the Fund was most significantly underweight relative to the Index in consumer staples and financials. This positioning reflected our view on the prospects for economic growth and the relative attractiveness of individual holdings in these sectors.
The opinions expressed are those of the portfolio managers as of the date of this report and are subject to change. There is no guarantee that any forecast made will come to pass. This material does not constitute investment advice and is not intended as an endorsement of any specific investment.
| | | | |
| mainstayinvestments.com | | | 63 | |
Portfolio of Investments April 30, 2013 (Unaudited)
| | | | | | | | |
| | |
| | | Shares | | | Value | |
| | | | | | | | |
| Common Stocks 95.5%† | | | | | | | | |
Canada 5.8% | | | | | | | | |
¨BCE, Inc. (Diversified Telecommunication Services) | | | 826,200 | | | $ | 38,715,732 | |
Canadian Imperial Bank of Commerce (Commercial Banks) | | | 168,200 | | | | 13,459,364 | |
Encana Corp. (Oil, Gas & Consumable Fuels) | | | 960,200 | | | | 17,715,690 | |
| | | | | | | | |
| | | | 69,890,786 | |
| | | | | | | | |
China 1.3% | |
China Communications Construction Co., Ltd. Class H (Construction & Engineering) | | | 16,465,000 | | | | 15,785,726 | |
| | | | | | | | |
|
France 10.8% | |
Danone S.A. (Food Products) | | | 187,550 | | | | 14,328,126 | |
Pernod-Ricard S.A. (Beverages) | | | 56,600 | | | | 7,006,703 | |
¨Sanofi (Pharmaceuticals) | | | 500,100 | | | | 54,809,269 | |
Total S.A. (Oil, Gas & Consumable Fuels) | | | 596,000 | | | | 30,038,218 | |
Vallourec S.A. (Machinery) | | | 471,800 | | | | 22,675,702 | |
| | | | | | | | |
| | | | 128,858,018 | |
| | | | | | | | |
Germany 14.0% | |
¨Bayer A.G. (Pharmaceuticals) | | | 423,200 | | | | 44,151,955 | |
Bayerische Motoren Werke A.G. (Automobiles) | | | 208,500 | | | | 19,234,621 | |
Muenchener Rueckversicherungs-Gesellschaft A.G. Registered (Insurance) | | | 99,450 | | | | 19,887,904 | |
SAP A.G. (Software) | | | 347,900 | | | | 27,632,056 | |
Siemens A.G. (Industrial Conglomerates) | | | 339,450 | | | | 35,450,180 | |
ThyssenKrupp A.G. (Metals & Mining) (a) | | | 1,204,630 | | | | 21,789,727 | |
| | | | | | | | |
| | | | 168,146,443 | |
| | | | | | | | |
India 1.1% | |
ICICI Bank, Ltd., Sponsored ADR (Commercial Banks) | | | 273,200 | | | | 12,791,224 | |
| | | | | | | | |
|
Israel 2.5% | |
Teva Pharmaceutical Industries, Ltd., Sponsored ADR (Pharmaceuticals) | | | 780,500 | | | | 29,885,345 | |
| | | | | | | | |
|
Italy 4.8% | |
¨ENI S.p.A. (Oil, Gas & Consumable Fuels) | | | 2,406,250 | | | | 57,547,443 | |
| | | | | | | | |
|
Japan 20.9% | |
Bridgestone Corp. (Auto Components) | | | 894,800 | | | | 33,732,267 | |
KOMATSU, Ltd. (Machinery) | | | 1,244,200 | | | �� | 33,936,788 | |
¨Mitsubishi Corp. (Trading Companies & Distributors) | | | 2,302,750 | | | | 41,290,527 | |
| | | | | | | | |
| | |
| | | Shares | | | Value | |
| | | | | | | | |
Japan (continued) | |
Mitsubishi Estate Co., Ltd. (Real Estate Management & Development) | | | 623,900 | | | $ | 20,255,870 | |
¨Nippon Telegraph & Telephone Corp. (Diversified Telecommunication Services) | | | 1,007,250 | | | | 49,853,631 | |
Nissan Motor Co., Ltd. (Automobiles) | | | 3,386,400 | | | | 35,293,454 | |
Tokio Marine Holdings, Inc. (Insurance) | | | 1,143,400 | | | | 36,242,561 | |
| | | | | | | | |
| | | | 250,605,098 | |
| | | | | | | | |
Netherlands 3.5% | |
Akzo Nobel N.V. (Chemicals) | | | 455,957 | | | | 27,489,644 | |
Wolters Kluwer N.V. (Media) | | | 661,600 | | | | 14,637,746 | |
| | | | | | | | |
| | | | 42,127,390 | |
| | | | | | | | |
Norway 3.0% | |
DnB NOR ASA (Commercial Banks) | | | 2,162,450 | | | | 35,343,954 | |
| | | | | | | | |
|
Singapore 3.1% | |
¨DBS Group Holdings, Ltd. (Commercial Banks) | | | 2,747,050 | | | | 37,379,685 | |
| | | | | | | | |
|
Switzerland 9.3% | |
ABB, Ltd. (Electrical Equipment) (a) | | | 1,444,150 | | | | 32,694,512 | |
Holcim, Ltd. (Construction Materials) (a) | | | 224,250 | | | | 17,473,556 | |
¨Novartis A.G. (Pharmaceuticals) | | | 816,400 | | | | 60,628,544 | |
| | | | | | | | |
| | | | 110,796,612 | |
| | | | | | | | |
United Kingdom 15.4% | |
BP PLC (Oil, Gas & Consumable Fuels) | | | 2,069,600 | | | | 14,993,887 | |
GlaxoSmithKline PLC (Pharmaceuticals) | | | 1,106,600 | | | | 28,542,947 | |
¨Lloyds Banking Group PLC (Commercial Banks) (a) | | | 49,373,900 | | | | 41,668,360 | |
Smith & Nephew PLC (Health Care Equipment & Supplies) | | | 2,189,500 | | | | 24,980,781 | |
¨Vodafone Group PLC, Sponsored ADR (Wireless Telecommunication Services) | | | 1,902,750 | | | | 58,205,122 | |
WPP PLC (Media) | | | 941,650 | | | | 15,563,254 | |
| | | | | | | | |
| | | | | | | 183,954,351 | |
| | | | | | | | |
Total Common Stocks
(Cost $942,286,125) | | | | 1,143,112,075 | |
| | | | | | | | |
| | |
| | | | | | | | |
| † | Percentages indicated are based on Fund net assets. |
| ¨ | | Among the Fund’s 10 largest holdings, as of April 30, 2013, excluding short-term investment. May be subject to change daily. |
| | | | |
| 64 | | MainStay ICAP International Fund | | The notes to the financial statements are an integral part of,
and should be read in conjunction with, the financial statements. |
Portfolio of Investments April 30, 2013 (Unaudited) (continued)
| | | | | | | | |
| | | Principal
Amount | | | Value | |
| | | | | | | | |
| Short-Term Investment 4.3% | | | | | |
Repurchase Agreement 4.3% | | | | | | | | |
United States 4.3% | | | | | | | | |
State Street Bank and Trust Co.
0.01%, dated 4/30/13
due 5/1/13
Proceeds at Maturity $50,889,592 (Collateralized by a Federal National Mortgage Association security with a rate of 2.17% and a maturity date of 11/7/22, with a Principal Amount of $51,300,000 and a Market Value of $51,907,905) (Capital Markets) | | $ | 50,889,578 | | | $ | 50,889,578 | |
| | | | | | | | |
Total Short-Term Investment
(Cost $50,889,578) | | | | | | | 50,889,578 | |
| | | | | | | | |
Total Investments
(Cost $993,175,703) (b) | | | 99.8 | % | | | 1,194,001,653 | |
Other Assets, Less Liabilities | | | 0.2 | | | | 2,713,833 | |
Net Assets | | | 100.0 | % | | $ | 1,196,715,486 | |
| (a) | Non-income producing security. |
| (b) | As of April 30, 2013, cost is $999,906,457 for federal income tax purposes and net unrealized appreciation is as follows: |
| | | | |
Gross unrealized appreciation | | $ | 210,363,473 | |
Gross unrealized depreciation | | | (16,268,277 | ) |
| | | | |
Net unrealized appreciation | | $ | 194,095,196 | |
| | | | |
The following abbreviation is used in the above portfolio:
ADR—American Depositary Receipt.
The following is a summary of the fair valuations according to the inputs used as of April 30, 2013, for valuing the Fund’s assets.
Asset Valuation Inputs
| | | | | | | | | | | | | | | | |
Description | | Quoted
Prices in
Active
Markets for
Identical
Assets (Level 1) | | | Significant
Other
Observable
Inputs (Level 2) | | | Significant
Unobservable
Inputs
(Level 3) | | | Total | |
| Investments in Securities (a) | | | | | | | | | | | | | | | | |
| Common Stocks | | $ | 1,143,112,075 | | | $ | — | | | $ | — | | | $ | 1,143,112,075 | |
| Short-Term Investment | | | | | | | | | | | | | | | | |
Repurchase Agreement | | | — | | | | 50,889,578 | | | | — | | | | 50,889,578 | |
| | | | | | | | | | | | | | | | |
| Total Investments in Securities | | $ | 1,143,112,075 | | | $ | 50,889,578 | | | $ | — | | | $ | 1,194,001,653 | |
| | | | | | | | | | | | | | | | |
| (a) | For a complete listing of investments and their industries, see the Portfolio of Investments. |
The Fund recognizes transfers between the levels as of the beginning of the period.
As of October 31, 2012 and April 30, 2013 foreign equity securities were not fair valued, as a result there were no transfers between Level 1 and Level 2 fair value measurements. (See Note 2)
As of April 30, 2013, the Fund did not hold any investments with significant unobservable inputs (Level 3). (See Note 2)
| | | | | | |
The notes to the financial statements are an integral part of,
and should be read in conjunction with, the financial statements. | | mainstayinvestments.com | | | 65 | |
Portfolio of Investments April 30, 2013 (Unaudited) (continued)
The table below sets forth the diversification of MainStay ICAP International Fund investments by industry.
Industry Diversification (Unaudited)
| | | | | | | | |
| | | Value | | | Percent † | |
Auto Components | | $ | 33,732,267 | | | | 2.8 | % |
Automobiles | | | 54,528,075 | | | | 4.6 | |
Beverages | | | 7,006,703 | | | | 0.6 | |
Capital Markets | | | 50,889,578 | | | | 4.3 | |
Chemicals | | | 27,489,644 | | | | 2.3 | |
Commercial Banks | | | 140,642,587 | | | | 11.8 | |
Construction & Engineering | | | 15,785,726 | | | | 1.3 | |
Construction Materials | | | 17,473,556 | | | | 1.5 | |
Diversified Telecommunication Services | | | 88,569,363 | | | | 7.4 | |
Electrical Equipment | | | 32,694,512 | | | | 2.7 | |
Food Products | | | 14,328,126 | | | | 1.2 | |
Health Care Equipment & Supplies | | | 24,980,781 | | | | 2.1 | |
Industrial Conglomerates | | | 35,450,180 | | | | 3.0 | |
Insurance | | | 56,130,465 | | | | 4.7 | |
Machinery | | | 56,612,490 | | | | 4.7 | |
Media | | | 30,201,000 | | | | 2.5 | |
Metals & Mining | | | 21,789,727 | | | | 1.8 | |
Oil, Gas & Consumable Fuels | | | 120,295,238 | | | | 10.0 | |
Pharmaceuticals | | | 218,018,060 | | | | 18.2 | |
Real Estate Management & Development | | | 20,255,870 | | | | 1.7 | |
Software | �� | | 27,632,056 | | | | 2.3 | |
Trading Companies & Distributors | | | 41,290,527 | | | | 3.4 | |
Wireless Telecommunication Services | | | 58,205,122 | | | | 4.9 | |
| | | | | | | | |
| | | 1,194,001,653 | | | | 99.8 | |
Other Assets, Less Liabilities | | | 2,713,833 | | | | 0.2 | |
| | | | | | | | |
Net Assets | | $ | 1,196,715,486 | | | | 100.0 | % |
| | | | | | | | |
| † | Percentages indicated are based on Fund net assets. |
| | | | |
| 66 | | MainStay ICAP International Fund | | The notes to the financial statements are an integral part of,
and should be read in conjunction with, the financial statements. |
Statement of Assets and Liabilities as of April 30, 2013 (Unaudited)
| | | | |
| Assets | |
Investment in securities, at value
(identified cost $993,175,703) | | $ | 1,194,001,653 | |
Cash denominated in foreign currencies
(identified cost $67,963) | | | 68,693 | |
Receivables: | | | | |
Dividends and interest | | | 5,908,223 | |
Investment securities sold | | | 3,567,175 | |
Fund shares sold | | | 2,402,502 | |
Other assets | | | 57,976 | |
| | | | |
Total assets | | | 1,206,006,222 | |
| | | | |
|
| Liabilities | |
Payables: | | | | |
Investment securities purchased | | | 4,565,582 | |
Fund shares redeemed | | | 3,389,143 | |
Manager (See Note 3) | | | 715,762 | |
Transfer agent (See Note 3) | | | 324,430 | |
Shareholder communication | | | 136,787 | |
NYLIFE Distributors (See Note 3) | | | 85,511 | |
Professional fees | | | 48,066 | |
Custodian | | | 18,524 | |
Trustees | | | 2,228 | |
Accrued expenses | | | 4,703 | |
| | | | |
Total liabilities | | | 9,290,736 | |
| | | | |
Net assets | | $ | 1,196,715,486 | |
| | | | |
| |
| Composition of Net Assets | | | | |
Shares of beneficial interest outstanding (par value of $.001 per share) unlimited number of shares authorized | | $ | 36,952 | |
Additional paid-in capital | | | 1,222,932,916 | |
| | | | |
| | | 1,222,969,868 | |
Undistributed net investment income | | | 8,069,885 | |
Accumulated net realized gain (loss) on investments and foreign currency transactions | | | (235,095,722 | ) |
Net unrealized appreciation (depreciation) on investments | | | 200,825,950 | |
Net unrealized appreciation (depreciation) on translation of other assets and liabilities in foreign currencies | | | (54,495 | ) |
| | | | |
Net assets | | $ | 1,196,715,486 | |
| | | | |
| | | | |
Investor Class | | | | |
Net assets applicable to outstanding shares | | $ | 9,838,010 | |
| | | | |
Shares of beneficial interest outstanding | | | 304,535 | |
| | | | |
Net asset value per share outstanding | | $ | 32.31 | |
Maximum sales charge (5.50% of offering price) | | | 1.88 | |
| | | | |
Maximum offering price per share outstanding | | $ | 34.19 | |
| | | | |
Class A | | | | |
Net assets applicable to outstanding shares | | $ | 288,175,354 | |
| | | | |
Shares of beneficial interest outstanding | | | 8,915,070 | |
| | | | |
Net asset value per share outstanding | | $ | 32.32 | |
Maximum sales charge (5.50% of offering price) | | | 1.88 | |
| | | | |
Maximum offering price per share outstanding | | $ | 34.20 | |
| | | | |
Class C | | | | |
Net assets applicable to outstanding shares | | $ | 15,259,770 | |
| | | | |
Shares of beneficial interest outstanding | | | 480,391 | |
| | | | |
Net asset value and offering price per share outstanding | | $ | 31.77 | |
| | | | |
Class I | | | | |
Net assets applicable to outstanding shares | | $ | 822,566,197 | |
| | | | |
Shares of beneficial interest outstanding | | | 25,364,098 | |
| | | | |
Net asset value and offering price per share outstanding | | $ | 32.43 | |
| | | | |
Class R1 | | | | |
Net assets applicable to outstanding shares | | $ | 830,415 | |
| | | | |
Shares of beneficial interest outstanding | | | 25,647 | |
| | | | |
Net asset value and offering price per share outstanding | | $ | 32.38 | |
| | | | |
Class R2 | | | | |
Net assets applicable to outstanding shares | | $ | 47,921,764 | |
| | | | |
Shares of beneficial interest outstanding | | | 1,483,985 | |
| | | | |
Net asset value and offering price per share outstanding | | $ | 32.29 | |
| | | | |
Class R3 | | | | |
Net assets applicable to outstanding shares | | $ | 12,123,976 | |
| | | | |
Shares of beneficial interest outstanding | | | 377,871 | |
| | | | |
Net asset value and offering price per share outstanding | | $ | 32.08 | |
| | | | |
| | | | | | |
The notes to the financial statements are an integral part of,
and should be read in conjunction with, the financial statements. | | mainstayinvestments.com | | | 67 | |
Statement of Operations for the six months ended April 30, 2013 (Unaudited)
| | | | |
| Investment Income (Loss) | |
Income | | | | |
Dividends (a) | | $ | 13,970,832 | |
Interest | | | 1,447 | |
| | | | |
Total income | | | 13,972,279 | |
| | | | |
Expenses | | | | |
Manager (See Note 3) | | | 4,385,137 | |
Transfer agent (See Note 3) | | | 1,001,122 | |
Distribution/Service—Investor Class (See Note 3) | | | 11,544 | |
Distribution/Service—Class A (See Note 3) | | | 327,044 | |
Distribution/Service—Class C (See Note 3) | | | 71,939 | |
Distribution/Service—Class R2 (See Note 3) | | | 55,760 | |
Distribution/Service—Class R3 (See Note 3) | | | 28,222 | |
Shareholder communication | | | 146,180 | |
Custodian | | | 66,047 | |
Registration | | | 49,094 | |
Professional fees | | | 43,535 | |
Shareholder service (See Note 3) | | | 28,288 | |
Trustees | | | 12,596 | |
Miscellaneous | | | 28,280 | |
| | | | |
Total expenses before waiver/reimbursement | | | 6,254,788 | |
Expense waiver/reimbursement from Manager (See Note 3) | | | (352,407 | ) |
| | | | |
Net expenses | | | 5,902,381 | |
| | | | |
Net investment income (loss) | | | 8,069,898 | |
| | | | |
|
| Realized and Unrealized Gain (Loss) on Investments and Foreign Currency Transactions | |
Net realized gain (loss) on: | | | | |
Security transactions | | | 25,316,739 | |
Foreign currency transactions | | | (425,630 | ) |
| | | | |
Net realized gain (loss) on investments and foreign currency transactions | | | 24,891,109 | |
| | | | |
Net change in unrealized appreciation (depreciation) on: | | | | |
Investments | | | 126,073,053 | |
Translation of other assets and liabilities in foreign currencies | | | 20,127 | |
| | | | |
Net change in unrealized appreciation (depreciation) on investments and foreign currency transactions | | | 126,093,180 | |
| | | | |
Net realized and unrealized gain (loss) on investments and foreign currency transactions | | | 150,984,289 | |
| | | | |
Net increase (decrease) in net assets resulting from operations | | $ | 159,054,187 | |
| | | | |
| (a) | Dividends recorded net of foreign withholding taxes in the amount of $1,542,723. |
| | | | |
| 68 | | MainStay ICAP International Fund | | The notes to the financial statements are an integral part of,
and should be read in conjunction with, the financial statements. |
Statements of Changes in Net Assets
for the six months ended April 30, 2013 (Unaudited) and the year ended October 31, 2012
| | | | | | | | |
| | | 2013 | | | 2012 | |
| Increase (Decrease) in Net Assets | |
Operations: | | | | | | | | |
Net investment income (loss) | | $ | 8,069,898 | | | $ | 21,307,614 | |
Net realized gain (loss) on investments and foreign currency transactions | | | 24,891,109 | | | | (37,493,543 | ) |
Net change in unrealized appreciation (depreciation) on investments and foreign currency transactions | | | 126,093,180 | | | | 55,942,842 | |
| | | | |
Net increase (decrease) in net assets resulting from operations | | | 159,054,187 | | | | 39,756,913 | |
| | | | |
Dividends to shareholders: | | | | | | | | |
From net investment income: | | | | | | | | |
Investor Class | | | (145,660 | ) | | | — | |
Class A | | | (4,362,177 | ) | | | (68,568 | ) |
Class C | | | (123,430 | ) | | | — | |
Class I | | | (15,026,192 | ) | | | (1,610,668 | ) |
Class R1 | | | (12,375 | ) | | | (780 | ) |
Class R2 | | | (725,651 | ) | | | — | |
Class R3 | | | (161,189 | ) | | | — | |
| | | | |
Total dividends to shareholders | | | (20,556,674 | ) | | | (1,680,016 | ) |
| | | | |
Capital share transactions: | | | | | | | | |
Net proceeds from sale of shares | | | 179,439,307 | | | | 364,012,834 | |
Net asset value of shares issued to shareholders in reinvestment of dividends | | | 19,559,999 | | | | 1,569,126 | |
Cost of shares redeemed | | | (162,019,640 | ) | | | (300,982,570 | ) |
| | | | |
Increase (decrease) in net assets derived from capital share transactions | | | 36,979,666 | | | | 64,599,390 | |
| | | | |
Net increase (decrease) in net assets | | | 175,477,179 | | | | 102,676,287 | |
|
| Net Assets | |
Beginning of period | | | 1,021,238,307 | | | | 918,562,020 | |
| | | | |
End of period | | $ | 1,196,715,486 | | | $ | 1,021,238,307 | |
| | | | |
Undistributed net investment income at end of period | | $ | 8,069,885 | | | $ | 20,556,661 | |
| | | | |
| | | | | | |
The notes to the financial statements are an integral part of,
and should be read in conjunction with, the financial statements. | | mainstayinvestments.com | | | 69 | |
Financial Highlights selected per share data and ratios
| | | | | | | | | | | | | | | | | | | | | | | | |
| | | Investor Class | |
| | | Six months
ended
April 30, | | | Year ended October 31, | | | April 29,
2008**
through
October 31, | |
| | | 2013* | | | 2012 | | | 2011 | | | 2010 | | | 2009 | | | 2008 | |
Net asset value at beginning of period | | $ | 28.45 | | | $ | 27.46 | | | $ | 29.15 | | | $ | 27.05 | | | $ | 22.19 | | | $ | 36.83 | |
| | | | | | | | | | | | | | | | | | | | | | | | |
Net investment income (loss) | | | 0.17 | (a) | | | 0.49 | (a) | | | 0.47 | | | | 0.29 | (a) | | | 0.49 | (a) | | | 0.47 | (a) |
Net realized and unrealized gain (loss) on investments | | | 4.17 | | | | 0.52 | | | | (1.69 | ) | | | 2.09 | | | | 5.13 | | | | (14.56 | ) |
Net realized and unrealized gain (loss) on foreign currency transactions | | | (0.01 | ) | | | (0.02 | ) | | | (0.03 | ) | | | 0.00 | ‡ | | | (0.01 | ) | | | (0.01 | ) |
| | | | | | | | | | | | | | | | | | | | | | | | |
Total from investment operations | | | 4.33 | | | | 0.99 | | | | (1.25 | ) | | | 2.38 | | | | 5.61 | | | | (14.10 | ) |
| | | | | | | | | | | | | | | | | | | | | | | | |
Less dividends: | | | | | | | | | | | | | | | | | | | | | | | | |
From net investment income | | | (0.47 | ) | | | — | | | | (0.44 | ) | | | (0.28 | ) | | | (0.75 | ) | | | (0.54 | ) |
| | | | | | | | | | | | | | | | | | | | | | | | |
Redemption fee (b) | | | — | | | | — | | | | — | | | | 0.00 | ‡(a) | | | 0.00 | ‡(a) | | | 0.00 | ‡(a) |
| | | | | | | | | | | | | | | | | | | | | | | | |
Net asset value at end of period | | $ | 32.31 | | | $ | 28.45 | | | $ | 27.46 | | | $ | 29.15 | | | $ | 27.05 | | | $ | 22.19 | |
| | | | | | | | | | | | | | | | | | | | | | | | |
Total investment return (c) | | | 15.42 | %(d) | | | 3.61 | % | | | (4.44 | %) | | | 9.02 | % | | | 25.99 | % | | | (38.80 | %)(d) |
Ratios (to average net assets)/Supplemental Data: | | | | | | | | | | | | | | | | | | | | | | | | |
Net investment income (loss) | | | 1.11 | %†† | | | 1.78 | % | | | 1.58 | % | | | 1.07 | % | | | 2.14 | % | | | 2.96 | % †† |
Net expenses | | | 1.41 | %†† | | | 1.45 | % | | | 1.44 | % | | | 1.55 | % | | | 1.38 | % | | | 1.24 | % †† |
Expenses (before waiver/reimbursement) | | | 1.41 | %†† | | | 1.45 | % | | | 1.44 | % | | | 1.55 | % | | | 1.62 | % | | | 1.49 | % †† |
Portfolio turnover rate | | | 27 | % | | | 74 | % | | | 62 | % | | | 80 | % | | | 96 | % | | | 79 | % |
Net assets at end of period (in 000’s) | | $ | 9,838 | | | $ | 8,849 | | | $ | 9,864 | | | $ | 10,343 | | | $ | 10,373 | | | $ | 8,674 | |
| ** | Commencement of operations. |
| ‡ | Less than one cent per share. |
| (a) | Per share data based on average shares outstanding during the period. |
| (b) | The redemption fee was discontinued as of April 1, 2010. |
| (c) | Total investment return is calculated exclusive of sales charges and assumes the reinvestment of dividends and distributions. |
| (d) | Total investment return is not annualized. |
| | | | |
| 70 | | MainStay ICAP International Fund | | The notes to the financial statements are an integral part of,
and should be read in conjunction with, the financial statements. |
Financial Highlights selected per share data and ratios
| | | | | | | | | | | | | | | | | | | | | | | | | | | | |
| | | Class A | |
| | | Six months
ended
April 30, | | | Year ended October 31, | | | January 1,
2008***
through
October 31, | | | Year ended
December 31, | |
| | | 2013* | | | 2012 | | | 2011 | | | 2010 | | | 2009 | | | 2008 | | | 2007 | |
Net asset value at beginning of period | | $ | 28.49 | | | $ | 27.48 | | | $ | 29.18 | | | $ | 27.05 | | | $ | 22.19 | | | $ | 38.22 | | | $ | 39.09 | |
| | | | | | | | | | | | | | | | | | | | | | | | | | | | |
Net investment income (loss) | | | 0.19 | (a) | | | 0.55 | (a) | | | 0.50 | | | | 0.37 | (a) | | | 0.50 | (a) | | | 0.77 | (a) | | | 0.57 | (a) |
Net realized and unrealized
gain (loss) on investments | | | 4.17 | | | | 0.49 | | | | (1.67 | ) | | | 2.07 | | | | 5.19 | | | | (16.22 | ) | | | 3.67 | |
Net realized and unrealized gain
(loss) on foreign currency transactions | | | (0.01 | ) | | | (0.02 | ) | | | (0.03 | ) | | | 0.00 | ‡ | | | (0.01 | ) | | | (0.01 | ) | | | — | |
| | | | | | | | | | | | | | | | | | | | | | | | | | | | |
Total from investment operations | | | 4.35 | | | | 1.02 | | | | (1.20 | ) | | | 2.44 | | | | 5.68 | | | | (15.46 | ) | | | 4.24 | |
| | | | | | | | | | | | | | | | | | | | | | | | | | | | |
Less dividends and distributions: | | | | | | | | | | | | | | | | | | | | | | | | | | | | |
From net investment income | | | (0.52 | ) | | | (0.01 | ) | | | (0.50 | ) | | | (0.31 | ) | | | (0.82 | ) | | | (0.57 | ) | | | (0.69 | ) |
From net realized gain on investments | | | — | | | | — | | | | — | | | | — | | | | — | | | | — | | | | (4.42 | ) |
| | | | | | | | | | | | | | | | | | | | | | | | | | | | |
Total dividends and distributions | | | (0.52 | ) | | | (0.01 | ) | | | (0.50 | ) | | | (0.31 | ) | | | (0.82 | ) | | | (0.57 | ) | | | (5.11 | ) |
| | | | | | | | | | | | | | | | | | | | | | | | | | | | |
Redemption fee (b) | | | — | | | | — | | | | — | | | | 0.00 | ‡(a) | | | 0.00 | ‡(a) | | | 0.00 | ‡(a) | | | 0.00 | ‡(a) |
| | | | | | | | | | | | | | | | | | | | | | | | | | | | |
Net asset value at end of period | | $ | 32.32 | | | $ | 28.49 | | | $ | 27.48 | | | $ | 29.18 | | | $ | 27.05 | | | $ | 22.19 | | | $ | 38.22 | |
| | | | | | | | | | | | | | | | | | | | | | | | | | | | |
Total investment return (c) | | | 15.46 | %(d) | | | 3.76 | % | | | (4.31 | %) | | | 9.30 | % | | | 26.36 | % | | | (40.97 | %)(d) | | | 11.20 | % |
Ratios (to average net assets)/Supplemental Data: | | | | | | | | | | | | | | | | | | | | | | | | | | | | |
Net investment income (loss) | | | 1.26 | %†† | | | 2.00 | % | | | 1.77 | % | | | 1.36 | % | | | 2.13 | % | | | 2.78 | % †† | | | 1.36 | % |
Net expenses | | | 1.29 | %†† | | | 1.31 | % | | | 1.29 | % | | | 1.30 | % | | | 1.14 | % | | | 1.10 | % †† | | | 1.15 | % |
Expenses (before waiver/reimbursement) | | | 1.29 | %†† | | | 1.31 | % | | | 1.29 | % | | | 1.36 | % | | | 1.37 | % | | | 1.31 | % †† | | | 1.33 | % |
Portfolio turnover rate | | | 27 | % | | | 74 | % | | | 62 | % | | | 80 | % | | | 96 | % | | | 79 | % | | | 109 | % |
Net assets at end of period (in 000’s) | | $ | 288,175 | | | $ | 240,403 | | | $ | 159,275 | | | $ | 193,508 | | | $ | 138,355 | | | $ | 73,122 | | | $ | 121,098 | |
| *** | The Fund changed its fiscal year end from December 31 to October 31. |
| ‡ | Less than one cent per share. |
| (a) | Per share data based on average shares outstanding during the period. |
| (b) | The redemption fee was discontinued as of April 1, 2010. |
| (c) | Total investment return is calculated exclusive of sales charges and assumes the reinvestment of dividends and distributions. |
| (d) | Total investment return is not annualized. |
| | | | | | |
The notes to the financial statements are an integral part of,
and should be read in conjunction with, the financial statements. | | mainstayinvestments.com | | | 71 | |
Financial Highlights selected per share data and ratios
| | | | | | | | | | | | | | | | | | | | | | | | | | | | |
| | | Class C | |
| | | Six months
ended
April 30, | | | Year ended October 31, | | | January 1,
2008***
through
October 31, | | | Year ended
December 31, | |
| | | 2013* | | | 2012 | | | 2011 | | | 2010 | | | 2009 | | | 2008 | | | 2007 | |
Net asset value at beginning of period | | $ | 27.87 | | | $ | 27.11 | | | $ | 28.87 | | | $ | 26.87 | | | $ | 22.02 | | | $ | 38.04 | | | $ | 39.03 | |
| | | | | | | | | | | | | | | | | | | | | | | | | | | | |
Net investment income (loss) | | | 0.05 | (a) | | | 0.28 | (a) | | | 0.27 | | | | 0.08 | (a) | | | 0.29 | (a) | | | 0.54 | (a) | | | 0.25 | (a) |
Net realized and unrealized
gain (loss) on investments | | | 4.11 | | | | 0.50 | | | | (1.69 | ) | | | 2.09 | | | | 5.13 | | | | (16.12 | ) | | | 3.66 | |
Net realized and unrealized gain (loss) on foreign currency transactions | | | (0.01 | ) | | | (0.02 | ) | | | (0.03 | ) | | | 0.00 | ‡ | | | (0.01 | ) | | | (0.01 | ) | | | — | |
| | | | | | | | | | | | | | | | | | | | | | | | | | | | |
Total from investment operations | | | 4.15 | | | | 0.76 | | | | (1.45 | ) | | | 2.17 | | | | 5.41 | | | | (15.59 | ) | | | 3.91 | |
| | | | | | | | | | | | | | | | | | | | | | | | | | | | |
Less dividends and distributions: | | | | | | | | | | | | | | | | | | | | | | | | | | | | |
From net investment income | | | (0.25 | ) | | | — | | | | (0.31 | ) | | | (0.17 | ) | | | (0.56 | ) | | | (0.43 | ) | | | (0.48 | ) |
From net realized gain on investments | | | — | | | | — | | | | — | | | | — | | | | — | | | | — | | | | (4.42 | ) |
| | | | | | | | | | | | | | | | | | | | | | | | | | | | |
Total dividends and distributions | | | (0.25 | ) | | | — | | | | (0.31 | ) | | | (0.17 | ) | | | (0.56 | ) | | | (0.43 | ) | | | (4.90 | ) |
| | | | | | | | | | | | | | | | | | | | | | | | | | | | |
Redemption fee (b) | | | — | | | | — | | | | — | | | | 0.00 | ‡(a) | | | 0.00 | ‡(a) | | | 0.00 | ‡(a) | | | 0.00 | ‡(a) |
| | | | | | | | | | | | | | | | | | | | | | | | | | | | |
Net asset value at end of period | | $ | 31.77 | | | $ | 27.87 | | | $ | 27.11 | | | $ | 28.87 | | | $ | 26.87 | | | $ | 22.02 | | | $ | 38.04 | |
| | | | | | | | | | | | | | | | | | | | | | | | | | | | |
Total investment return (c) | | | 15.00 | %(d) | | | 2.80 | %(e) | | | (5.16 | %) | | | 8.20 | % | | | 25.06 | % | | | (41.39 | %)(d) | | | 10.35 | % |
Ratios (to average net assets)/Supplemental Data: | | | | | | | | | | | | | | | | | | | | | | | | | | | | |
Net investment income (loss) | | | 0.35 | %†† | | | 1.05 | % | | | 0.89 | % | | | 0.31 | % | | | 1.30 | % | | | 1.98 | % †† | | | 0.60 | % |
Net expenses | | | 2.16 | %†† | | | 2.20 | % | | | 2.19 | % | | | 2.29 | % | | | 2.13 | % | | | 1.96 | % †† | | | 1.90 | % |
Expenses (before waiver/reimbursement) | | | 2.16 | %†† | | | 2.20 | % | | | 2.19 | % | | | 2.29 | % | | | 2.37 | % | | | 2.17 | % †† | | | 2.08 | % |
Portfolio turnover rate | | | 27 | % | | | 74 | % | | | 62 | % | | | 80 | % | | | 96 | % | | | 79 | % | | | 109 | % |
Net assets at end of period (in 000’s) | | $ | 15,260 | | | $ | 13,832 | | | $ | 15,931 | | | $ | 15,538 | | | $ | 19,244 | | | $ | 19,586 | | | $ | 32,652 | |
| *** | The Fund changed its fiscal year end from December 31 to October 31. |
| ‡ | Less than one cent per share. |
| (a) | Per share data based on average shares outstanding during the period. |
| (b) | The redemption fee was discontinued as of April 1, 2010. |
| (c) | Total investment return is calculated exclusive of sales charges and assumes the reinvestment of dividends and distributions. |
| (d) | Total investment return is not annualized. |
| (e) | Total investment return may reflect adjustments to conform to generally accepted accounting principles. |
| | | | |
| 72 | | MainStay ICAP International Fund | | The notes to the financial statements are an integral part of,
and should be read in conjunction with, the financial statements. |
Financial Highlights selected per share data and ratios
| | | | | | | | | | | | | | | | | | | | | | | | | | | | |
| | | Class I | |
| | | Six months
ended
April 30, | | | Year ended October 31, | | | January 1,
2008***
through
October 31, | | | Year ended
December 31, | |
| | | 2013* | | | 2012 | | | 2011 | | | 2010 | | | 2009 | | | 2008 | | | 2007 | |
Net asset value at beginning of period | | $ | 28.63 | | | $ | 27.56 | | | $ | 29.26 | | | $ | 27.12 | | | $ | 22.25 | | | $ | 38.26 | | | $ | 39.10 | |
| | | | | | | | | | | | | | | | | | | | | | | | | | | | |
Net investment income (loss) | | | 0.24 | (a) | | | 0.64 | (a) | | | 0.60 | | | | 0.46 | (a) | | | 0.60 | (a) | | | 0.87 | (a) | | | 0.78 | (a) |
Net realized and unrealized
gain (loss) on investments | | | 4.19 | | | | 0.51 | | | | (1.67 | ) | | | 2.08 | | | | 5.15 | | | | (16.26 | ) | | | 3.59 | |
Net realized and unrealized gain (loss) on foreign currency transactions | | | (0.01 | ) | | | (0.02 | ) | | | (0.03 | ) | | | 0.00 | ‡ | | | (0.01 | ) | | | (0.01 | ) | | | — | |
| | | | | | | | | | | | | | | | | | | | | | | | | | | | |
Total from investment operations | | | 4.42 | | | | 1.13 | | | | (1.10 | ) | | | 2.54 | | | | 5.74 | | | | (15.40 | ) | | | 4.37 | |
| | | | | | | | | | | | | | | | | | | | | | | | | | | | |
Less dividends and distributions: | | | | | | | | | | | | | | | | | | | | | | | | | | | | |
From net investment income | | | (0.62 | ) | | | (0.06 | ) | | | (0.60 | ) | | | (0.40 | ) | | | (0.87 | ) | | | (0.61 | ) | | | (0.79 | ) |
From net realized gain on investments | | | — | | | | — | | | | — | | | | — | | | | — | | | | — | | | | (4.42 | ) |
| | | | | | | | | | | | | | | | | | | | | | | | | | | | |
Total dividends and distributions | | | (0.62 | ) | | | (0.06 | ) | | | (0.60 | ) | | | (0.40 | ) | | | (0.87 | ) | | | (0.61 | ) | | | (5.21 | ) |
| | | | | | | | | | | | | | | | | | | | | | | | | | | | |
Redemption fee (b) | | | — | | | | — | | | | — | | | | 0.00 | ‡(a) | | | 0.00 | ‡(a) | | | 0.00 | ‡(a) | | | 0.00 | ‡(a) |
| | | | | | | | | | | | | | | | | | | | | | | | | | | | |
Net asset value at end of period | | $ | 32.43 | | | $ | 28.63 | | | $ | 27.56 | | | $ | 29.26 | | | $ | 27.12 | | | $ | 22.25 | | | $ | 38.26 | |
| | | | | | | | | | | | | | | | | | | | | | | | | | | | |
Total investment return (c) | | | 15.67 | %(d) | | | 4.12 | % | | | (3.95 | %) | | | 9.62 | % | | | 26.71 | % | | | (40.81 | %)(d) | | | 11.52 | % |
Ratios (to average net assets)/Supplemental Data: | | | | | | | | | | | | | | | | | | | | | | | | | | | | |
Net investment income (loss) | | | 1.60 | %†† | | | 2.30 | % | | | 2.10 | % | | | 1.70 | % | | | 2.59 | % | | | 3.12 | % †† | | | 1.86 | % |
Net expenses | | | 0.95 | %†† | | | 0.95 | % | | | 0.95 | % | | | 0.95 | % | | | 0.85 | % | | | 0.80 | % †† | | | 0.80 | % |
Expenses (before waiver/reimbursement) | | | 1.04 | %†† | | | 1.06 | % | | | 1.04 | % | | | 1.11 | % | | | 1.13 | % | | | 1.01 | % †† | | | 0.98 | % |
Portfolio turnover rate | | | 27 | % | | | 74 | % | | | 62 | % | | | 80 | % | | | 96 | % | | | 79 | % | | | 109 | % |
Net assets at end of period (in 000’s) | | $ | 822,566 | | | $ | 704,106 | | | $ | 685,355 | | | $ | 587,673 | | | $ | 487,411 | | | $ | 389,517 | | | $ | 753,984 | |
| *** | The Fund changed its fiscal year end from December 31 to October 31. |
| ‡ | Less than one cent per share. |
| (a) | Per share data based on average shares outstanding during the period. |
| (b) | The redemption fee was discontinued as of April 1, 2010. |
| (c) | Total investment return is calculated exclusive of sales charges and assumes the reinvestment of dividends and distributions. Class I shares are not subject to sales charges. |
| (d) | Total investment return is not annualized. |
| | | | | | |
The notes to the financial statements are an integral part of,
and should be read in conjunction with, the financial statements. | | mainstayinvestments.com | | | 73 | |
Financial Highlights selected per share data and ratios
| | | | | | | | | | | | | | | | | | | | | | | | | | | | |
| | | Class R1 | |
| | | Six months
ended
April 30, | | | Year ended October 31, | | | January 1,
2008***
through
October 31, | | | Year ended
December 31, | |
| | | 2013* | | | 2012 | | | 2011 | | | 2010 | | | 2009 | | | 2008 | | | 2007 | |
Net asset value at beginning of period | | $ | 28.57 | | | $ | 27.52 | | | $ | 29.22 | | | $ | 27.07 | | | $ | 22.22 | | | $ | 38.23 | | | $ | 39.08 | |
| | | | | | | | | | | | | | | | | | | | | | | | | | | | |
Net investment income (loss) | | | 0.24 | (a) | | | 0.64 | (a) | | | 0.54 | | | | 0.40 | (a) | | | 0.59 | (a) | | | 0.82 | (a) | | | 0.47 | (a) |
Net realized and unrealized gain (loss) on investments | | | 4.17 | | | | 0.48 | | | | (1.64 | ) | | | 2.10 | | | | 5.12 | | | | (16.22 | ) | | | 3.86 | |
Net realized and unrealized gain (loss) on foreign currency transactions | | | (0.01 | ) | | | (0.02 | ) | | | (0.03 | ) | | | 0.00 | ‡ | | | (0.01 | ) | | | (0.01 | ) | | | — | |
| | | | | | | | | | | | | | | | | | | | | | | | | | | | |
Total from investment operations | | | 4.40 | | | | 1.10 | | | | (1.13 | ) | | | 2.50 | | | | 5.70 | | | | (15.41 | ) | | | 4.33 | |
| | | | | | | | | | | | | | | | | | | | | | | | | | | | |
Less dividends and distributions: | | | | | | | | | | | | | | | | | | | | | | | | | | | | |
From net investment income | | | (0.59 | ) | | | (0.05 | ) | | | (0.57 | ) | | | (0.35 | ) | | | (0.85 | ) | | | (0.60 | ) | | | (0.76 | ) |
From net realized gain on investments | | | — | | | | — | | | | — | | | | — | | | | — | | | | — | | | | (4.42 | ) |
| | | | | | | | | | | | | | | | | | | | | | | | | | | | |
Total dividends and distributions | | | (0.59 | ) | | | (0.05 | ) | | | (0.57 | ) | | | (0.35 | ) | | | (0.85 | ) | | | (0.60 | ) | | | (5.18 | ) |
| | | | | | | | | | | | | | | | | | | | | | | | | | | | |
Redemption fee (b) | | | — | | | | — | | | | — | | | | 0.00 | ‡(a) | | | 0.00 | ‡(a) | | | 0.00 | ‡(a) | | | 0.00 | ‡(a) |
| | | | | | | | | | | | | | | | | | | | | | | | | | | | |
Net asset value at end of period | | $ | 32.38 | | | $ | 28.57 | | | $ | 27.52 | | | $ | 29.22 | | | $ | 27.07 | | | $ | 22.22 | | | $ | 38.23 | |
| | | | | | | | | | | | | | | | | | | | | | | | | | | | |
Total investment return (c) | | | 15.62 | %(d) | | | 4.05 | % | | | (4.09 | %) | | | 9.48 | % | | | 26.56 | % | | | (40.89 | %)(d) | | | 11.41 | % |
Ratios (to average net assets)/Supplemental Data: | | | | | | | | | | | | | | | | | | | | | | | | | | | | |
Net investment income (loss) | | | 1.60 | %†† | | | 2.30 | % | | | 1.61 | % | | | 1.47 | % | | | 2.54 | % | | | 2.95 | % †† | | | 1.12 | % |
Net expenses | | | 1.05 | %†† | | | 1.05 | % | | | 1.05 | % | | | 1.10 | % | | | 0.99 | % | | | 0.90 | % †† | | | 0.90 | % |
Expenses (before reimbursement/waiver) | | | 1.14 | %†† | | | 1.16 | % | | | 1.14 | % | | | 1.21 | % | | | 1.22 | % | | | 1.11 | % †† | | | 1.08 | % |
Portfolio turnover rate | | | 27 | % | | | 74 | % | | | 62 | % | | | 80 | % | | | 96 | % | | | 79 | % | | | 109 | % |
Net assets at end of period (in 000’s) | | $ | 830 | | | $ | 590 | | | $ | 480 | | | $ | 949 | | | $ | 675 | | | $ | 170 | | | $ | 418 | |
| *** | The Fund changed its fiscal year end from December 31 to October 31. |
| ‡ | Less than one cent per share. |
| (a) | Per share data based on average shares outstanding during the period. |
| (b) | The redemption fee was discontinued as of April 1, 2010. |
| (c) | Total investment return is calculated exclusive of sales charges and assumes the reinvestment of dividends and distributions. Class R1 shares are not subject to sales charges. |
| (d) | Total investment return is not annualized. |
| | | | |
| 74 | | MainStay ICAP International Fund | | The notes to the financial statements are an integral part of,
and should be read in conjunction with, the financial statements. |
Financial Highlights selected per share data and ratios
| | | | | | | | | | | | | | | | | | | | | | | | | | | | |
| | | Class R2 | |
| | | Six months
ended
April 30, | | | Year ended October 31, | | | January 1,
2008***
through
October 31, | | | Year ended
December 31, | |
| | | 2013* | | | 2012 | | | 2011 | | | 2010 | | | 2009 | | | 2008 | | | 2007 | |
Net asset value at beginning of period | | $ | 28.45 | | | $ | 27.45 | | | $ | 29.14 | | | $ | 27.05 | | | $ | 22.18 | | | $ | 38.20 | | | $ | 39.08 | |
| | | | | | | | | | | | | | | | | | | | | | | | | | | | |
Net investment income (loss) | | | 0.17 | (a) | | | 0.51 | (a) | | | 0.47 | | | | 0.32 | (a) | | | 0.44 | (a) | | | 0.74 | (a) | | | 0.35 | (a) |
Net realized and unrealized
gain (loss) on investments | | | 4.17 | | | | 0.51 | | | | (1.67 | ) | | | 2.07 | | | | 5.23 | | | | (16.20 | ) | | | 3.88 | |
Net realized and unrealized gain (loss) on foreign currency transactions | | | (0.01 | ) | | | (0.02 | ) | | | (0.03 | ) | | | 0.00 | ‡ | | | (0.01 | ) | | | (0.01 | ) | | | — | |
| | | | | | | | | | | | | | | | | | | | | | | | | | | | |
Total from investment operations | | | 4.33 | | | | 1.00 | | | | (1.23 | ) | | | 2.39 | | | | 5.66 | | | | (15.47 | ) | | | 4.23 | |
| | | | | | | | | | | | | | | | | | | | | | | | | | | | |
Less dividends and distributions: | | | | | | | | | | | | | | | | | | | | | | | | | | | | |
From net investment income | | | (0.49 | ) | | | — | | | | (0.46 | ) | | | (0.30 | ) | | | (0.79 | ) | | | (0.55 | ) | | | (0.69 | ) |
From net realized gain on investments | | | — | | | | — | | | | — | | | | — | | | | — | | | | — | | | | (4.42 | ) |
| | | | | | | | | | | | | | | | | | | | | | | | | | | | |
Total dividends and distributions | | | (0.49 | ) | | | — | | | | (0.46 | ) | | | (0.30 | ) | | | (0.79 | ) | | | (0.55 | ) | | | (5.11 | ) |
| | | | | | | | | | | | | | | | | | | | | | | | | | | | |
Redemption fee (b) | | | — | | | | — | | | | — | | | | 0.00 | ‡(a) | | | 0.00 | ‡(a) | | | 0.00 | ‡(a) | | | 0.00 | ‡(a) |
| | | | | | | | | | | | | | | | | | | | | | | | | | | | |
Net asset value at end of period | | $ | 32.29 | | | $ | 28.45 | | | $ | 27.45 | | | $ | 29.14 | | | $ | 27.05 | | | $ | 22.18 | | | $ | 38.20 | |
| | | | | | | | | | | | | | | | | | | | | | | | | | | | |
Total investment return (c) | | | 15.40 | %(d) | | | 3.64 | % | | | (4.37 | %) | | | 9.06 | % | | | 26.27 | % | | | (41.00 | %)(d) | | | 11.16 | % |
Ratios (to average net assets)/Supplemental Data: | | | | | | | | | | | | | | | | | | | | | | | | | | | | |
Net investment income (loss) | | | 1.13 | %†† | | | 1.85 | % | | | 1.63 | % | | | 1.17 | % | | | 1.84 | % | | | 2.72 | % †† | | | 0.83 | % |
Net expenses | | | 1.39 | %†† | | | 1.41 | % | | | 1.40 | % | | | 1.46 | % | | | 1.27 | % | | | 1.15 | % †† | | | 1.15 | % |
Expenses (before waiver/reimbursement) | | | 1.39 | %†† | | | 1.41 | % | | | 1.40 | % | | | 1.46 | % | | | 1.47 | % | | | 1.36 | % †† | | | 1.33 | % |
Portfolio turnover rate | | | 27 | % | | | 74 | % | | | 62 | % | | | 80 | % | | | 96 | % | | | 79 | % | | | 109 | % |
Net assets at end of period (in 000’s) | | $ | 47,922 | | | $ | 42,435 | | | $ | 37,081 | | | $ | 39,156 | | | $ | 27,480 | | | $ | 9,445 | | | $ | 12,816 | |
| *** | The Fund changed its fiscal year end from December 31 to October 31. |
| ‡ | Less than one cent per share. |
| (a) | Per share data based on average shares outstanding during the period. |
| (b) | The redemption fee was discontinued as of April 1, 2010. |
| (c) | Total investment return is calculated exclusive of sales charges and assumes the reinvestment of dividends and distributions. Class R2 shares are not subject to sales charges. |
| (d) | Total investment return is not annualized. |
| | | | | | |
The notes to the financial statements are an integral part of,
and should be read in conjunction with, the financial statements. | | mainstayinvestments.com | | | 75 | |
Financial Highlights selected per share data and ratios
| | | | | | | | | | | | | | | | | | | | | | | | | | | | |
| | | Class R3 | |
| | | Six months
ended
April 30, | | | Year ended October 31, | | | January 1,
2008***
through
October 31, | | | Year ended
December 31, | |
| | | 2013* | | | 2012 | | | 2011 | | | 2010 | | | 2009 | | | 2008 | | | 2007 | |
Net asset value at beginning of period | | $ | 28.24 | | | $ | 27.31 | | | $ | 29.01 | | | $ | 26.95 | | | $ | 22.13 | | | $ | 38.13 | | | $ | 39.06 | |
| | | | | | | | | | | | | | | | | | | | | | | | | | | | |
Net investment income (loss) | | | 0.13 | (a) | | | 0.44 | (a) | | | 0.40 | | | | 0.25 | (a) | | | 0.39 | (a) | | | 0.75 | (a) | | | 0.21 | (a) |
Net realized and unrealized
gain (loss) on investments | | | 4.14 | | | | 0.51 | | | | (1.68 | ) | | | 2.08 | | | | 5.19 | | | | (16.24 | ) | | | 3.89 | |
Net realized and unrealized gain (loss) on foreign currency transactions | | | (0.01 | ) | | | (0.02 | ) | | | (0.03 | ) | | | 0.00 | ‡ | | | (0.01 | ) | | | (0.01 | ) | | | — | |
| | | | | | | | | | | | | | | | | | | | | | | | | | | | |
Total from investment operations | | | 4.26 | | | | 0.93 | | | | (1.31 | ) | | | 2.33 | | | | 5.57 | | | | (15.50 | ) | | | 4.10 | |
| | | | | | | | | | | | | | | | | | | | | | | | | | | | |
Less dividends and distributions: | | | | | | | | | | | | | | | | | | | | | | | | | | | | |
From net investment income | | | (0.42 | ) | | | — | | | | (0.39 | ) | | | (0.27 | ) | | | (0.75 | ) | | | (0.50 | ) | | | (0.61 | ) |
From net realized gain on investments | | | — | | | | — | | | | — | | | | — | | | | — | | | | — | | | | (4.42 | ) |
| | | | | | | | | | | | | | | | | | | | | | | | | | | | |
Total dividends and distributions | | | (0.42 | ) | | | — | | | | (0.39 | ) | | | (0.27 | ) | | | (0.75 | ) | | | (0.50 | ) | | | (5.03 | ) |
| | | | | | | | | | | | | | | | | | | | | | | | | | | | |
Redemption fee (b) | | | — | | | | — | | | | — | | | | 0.00 | ‡(a) | | | 0.00 | ‡(a) | | | 0.00 | ‡(a) | | | 0.00 | ‡(a) |
| | | | | | | | | | | | | | | | | | | | | | | | | | | | |
Net asset value at end of period | | $ | 32.08 | | | $ | 28.24 | | | $ | 27.31 | | | $ | 29.01 | | | $ | 26.95 | | | $ | 22.13 | | | $ | 38.13 | |
| | | | | | | | | | | | | | | | | | | | | | | | | | | | |
Total investment return (c) | | | 15.27 | %(d) | | | 3.41 | % | | | (4.65 | %) | | | 8.85 | % | | | 25.87 | % | | | (41.11 | %)(d) | | | 10.82 | % |
Ratios (to average net assets)/Supplemental Data: | | | | | | | | | | | | | | | | | | | | | | | | | | | | |
Net investment income (loss) | | | 0.88 | %†† | | | 1.60 | % | | | 1.37 | % | | | 0.91 | % | | | 1.60 | % | | | 2.77 | % †† | | | 0.49 | % |
Net expenses | | | 1.64 | %†† | | | 1.66 | % | | | 1.65 | % | | | 1.71 | % | | | 1.54 | % | | | 1.40 | % †† | | | 1.40 | % |
Expenses (before waiver/reimbursement) | | | 1.64 | %†† | | | 1.66 | % | | | 1.65 | % | | | 1.71 | % | | | 1.72 | % | | | 1.62 | % †† | | | 1.58 | % |
Portfolio turnover rate | | | 27 | % | | | 74 | % | | | 62 | % | | | 80 | % | | | 96 | % | | | 79 | % | | | 109 | % |
Net assets at end of period (in 000’s) | | $ | 12,124 | | | $ | 11,023 | | | $ | 10,577 | | | $ | 10,208 | | | $ | 6,536 | | | $ | 1,112 | | | $ | 289 | |
| *** | The Fund changed its fiscal year end from December 31 to October 31. |
| ‡ | Less than one cent per share. |
| (a) | Per share data based on average shares outstanding during the period. |
| (b) | The redemption fee was discontinued as of April 1, 2010. |
| (c) | Total investment return is calculated exclusive of sales charges and assumes the reinvestment of dividends and distributions. Class R3 shares are not subject to sales charges. |
| (d) | Total investment return is not annualized. |
| | | | |
| 76 | | MainStay ICAP International Fund | | The notes to the financial statements are an integral part of,
and should be read in conjunction with, the financial statements. |
Notes to Financial Statements (Unaudited)
Note 1–Organization and Business
MainStay Funds Trust (the “Trust”) was organized as a Delaware statutory trust on April 28, 2009 and is governed by a Declaration of Trust. The Trust is registered under the Investment Company Act of 1940, as amended (the “1940 Act”), as an open-end investment management company, and is comprised of thirty-three funds (collectively referred to as the “Funds” and each individually, referred to as a “Fund”). These financial statements and notes relate only to the MainStay ICAP Equity Fund, MainStay ICAP Select Equity Fund, MainStay ICAP Global Fund and MainStay ICAP International Fund (collectively referred to as the “ICAP Funds” and each individually referred to as an “ICAP Fund”). Each ICAP Fund is the successor of a series of ICAP Funds, Inc. with the same name (each a “Predecessor Fund”). The reorganizations of the Predecessor Funds with and into the respective ICAP Funds occurred on February 26, 2010. All information regarding and references to periods prior to February 26, 2010 relate to the respective Predecessor Funds.
The ICAP Funds commenced operations on the dates indicated below:
| | |
Commencement
of Operations | | Funds |
April 30, 2008 | | MainStay ICAP Global Fund |
December 31, 1997 | | MainStay ICAP Select Equity Fund MainStay ICAP International Fund |
December 31, 1994 | | MainStay ICAP Equity Fund |
The MainStay ICAP Equity Fund and MainStay ICAP International Fund offer seven classes of shares: Investor Class, Class A, Class C, Class I, Class R1, Class R2 and Class R3 shares. Each of these share classes, other than Investor Class and Class I shares, commenced operations on September 1, 2006. Class I shares commenced operations (under a former designation) on December 31, 1994 for MainStay ICAP Equity Fund and on December 31, 1997 for MainStay ICAP International Fund. Investor Class shares commenced operations on April 29, 2008 for MainStay ICAP Equity Fund and MainStay ICAP International Fund.
The MainStay ICAP Global Fund offers four classes of shares: Investor Class, Class A, Class C and Class I shares. All share classes of the MainStay ICAP Global Fund commenced operations on April 30, 2008.
The MainStay ICAP Select Equity Fund offers eight classes of shares: Investor Class, Class A, Class B, Class C, Class I, Class R1, Class R2 and Class R3 shares. Each of these share classes other than Investor Class, Class B and Class I shares commenced operations on September 1, 2006. Class I shares commenced operations on December 31, 1997 (under a former designation) and Investor Class shares commenced operations on April 29, 2008. Class B shares commenced operations on November 13, 2009.
Investor Class and Class A shares are offered at net asset value (“NAV”) per share plus an initial sales charge. No sales charge applies to investments of $1 million or more (and certain other qualified purchases) in Investor Class and Class A shares, but a contingent deferred sales charge (“CDSC”) is imposed on certain redemptions made within one year of the date of purchase. Class B and Class C shares are offered at NAV without an initial sales charge, although a declining CDSC may be imposed on redemptions made within six years of the date of purchase of Class B shares and a 1.00% CDSC may be imposed on redemptions
made within one year of the date of purchase of Class C shares. Class I, Class R1, Class R2 and Class R3 shares are offered at NAV and are not subject to a sales charge. Depending upon eligibility, Class B shares convert to either Investor Class or Class A shares at the end of the calendar quarter eight years after the date they were purchased. Additionally, depending upon eligibility, Investor Class shares may convert to Class A shares and Class A shares may convert to Investor Class shares. Each class of shares has the same voting (except for issues that relate solely to one class), dividend, liquidation and other rights, and the same terms and conditions, except that Class B and Class C shares are subject to higher distribution and/or service fee rates, than Investor Class, Class A, Class R2 and Class R3 shares under a distribution plan pursuant to Rule 12b-1 under the 1940 Act. Class I and Class R1 shares are not subject to a distribution and/or service fee. Class R1, Class R2 and Class R3 shares are subject to a shareholder service fee. This is in addition to any fees paid under a distribution plan, where applicable.
The investment objective for each ICAP Fund is to seek total return.
Note 2–Significant Accounting Policies
The ICAP Funds prepare their financial statements in accordance with generally accepted accounting principles (“GAAP”) in the United States of America and follow the significant accounting policies described below.
(A) Securities Valuation. Investments are valued as of the close of regular trading on the New York Stock Exchange (“Exchange”) (generally 4:00 p.m. Eastern time) on each day the ICAP Funds are open for business (“valuation date”).
The Board of Trustees (the “Board”) has adopted procedures for the valuation of each ICAP Fund’s securities and has delegated the responsibility for valuation determination under those procedures to the Valuation Committee of the ICAP Funds (the “Valuation Committee”). The Board has authorized the Valuation Committee to appoint a Valuation Sub-Committee (the “Sub-Committee”) to deal in the first instance with questions that arise or cannot be resolved under these procedures. The Sub-Committee meets (in person, via electronic mail or via teleconference) on an as-needed basis. The Valuation Committee meets at a later time, as necessary, to ensure that actions taken by the Sub-Committee were appropriate. The procedures recognize that, subject to the oversight of the Board and unless otherwise noted, the responsibility for day-to-day valuation of portfolio assets (including securities for which market prices are not readily available) rests with New York Life Investment Management LLC ( “New York Life Investments” or the “Manager”), aided to whatever extent necessary by the Subadvisor (as defined in Note 3(A)) of each ICAP Fund.
To assess the appropriateness of security valuations, the Manager or the ICAP Funds’ third party service provider who is subject to oversight by the Manager, regularly compares prior day prices, prices on comparable securities and the sale prices to the prior and current day prices and challenges prices exceeding certain tolerance levels with third party pricing services or broker sources. For those securities valued by recommendation, whether through a standardized fair valuation methodology or a fair valuation determination, the Valuation Committee reviews and affirms the reasonableness of the valuation based on such methodologies and determinations on a regular basis after considering all relevant information that is reasonably available.
| | | | |
| mainstayinvestments.com | | | 77 | |
Notes to Financial Statements (Unaudited) (continued)
“Fair value” is defined as the price that an ICAP Fund would receive upon selling an investment in an orderly transaction to an independent buyer in the principal or most advantageous market of the investment. Fair value measurements are determined within a framework that has established a three-tier hierarchy which maximizes the use of observable market data and minimizes the use of unobservable inputs to establish classification of fair value measurements for disclosure purposes. “Inputs” refers broadly to the assumptions that market participants would use in pricing the asset or liability, including assumptions about risk, such as the risk inherent in a particular valuation technique used to measure fair value using a pricing model and/or the risk inherent in the inputs for the valuation technique. Inputs may be observable or unobservable. Observable inputs reflect the assumptions market participants would use in pricing the asset or liability based on market data obtained from sources independent of the ICAP Funds. Unobservable inputs reflect each ICAP Fund’s own assumptions about the assumptions market participants would use in pricing the asset or liability developed based on the information available in the circumstances. The inputs or methodology used for valuing securities may not be an indication of the risks associated with investing in those securities. The three-tier hierarchy of inputs is summarized in the three broad Levels listed below.
| • | | Level 1—quoted prices in active markets for identical investments |
| • | | Level 2—other significant observable inputs (including quoted prices for similar investments in active markets, interest rates and yield curves, prepayment speeds, credit risks, etc.) |
| • | | Level 3—significant unobservable inputs (including each ICAP Fund’s own assumptions about the assumptions that market participants would use in determining the fair value of investments) |
The aggregate value by input level, as of April 30, 2013, for each ICAP Fund’s investments is included at the end of each ICAP Fund’s Portfolio of Investments.
The valuation techniques used by the ICAP Funds to measure fair value maximize the use of observable inputs and minimize the use of unobservable inputs. The ICAP Funds may utilize third party vendor evaluations, whose prices may be derived from one or more of the following standard inputs:
| | |
• Benchmark Yields | | • Reported Trades |
• Broker Dealer Quotes | | • Issuer Spreads |
• Two-sided markets | | • Benchmark securities |
• Bids/Offers | | • Reference Data (corporate actions or material event notices) |
• Industry and economic events | | • Comparable bonds |
• Equity and credit default swap curves | | • Monthly payment information |
Securities for which market values cannot be determined using the methodologies described above are valued by methods deemed in good faith by the ICAP Funds’ Valuation Committee, following the procedures established by the Board, to represent fair value. Under these procedures, the ICAP Funds primarily employ a market-based approach which may use related or comparable assets or liabilities, recent transactions, market multiples, book values, and other relevant information. The ICAP Funds may also use an income-based valuation approach in which the
anticipated future cash flows of the investment are discounted to calculate fair value. Discounts may also be applied due to the nature or duration of any restrictions on the disposition of the investments. Due to the inherent uncertainty of valuations of such investments, the fair values may differ significantly from the values that would have been used had an active market existed. For the six-month period ended April 30, 2013, there have been no changes to the fair value methodologies.
Equity and non-equity securities which may be valued in this manner include, but are not limited to: (i) a security for which the trading has been halted or suspended; (ii) a debt security that has recently gone into default and for which there is not a current market quotation; (iii) a security of an issuer that has entered into a restructuring; (iv) a security that has been de-listed from a national exchange; (v) a security for which the market price is not available from a third party pricing source or, if so provided, does not, in the opinion of the ICAP Funds’ Manager or Subadvisor reflect the security’s market value; and (vi) a security whose principal market has been temporarily closed at a time when, under normal conditions, it would be open. Securities for which market quotations or observable inputs are not readily available are generally categorized as Level 3 in the hierarchy. As of April 30, 2013, the ICAP Funds did not hold any securities that were fair valued in such a manner.
Certain events may occur between the time that foreign markets close, on which securities held by the ICAP Funds principally trade, and the time at which the ICAP Funds’ NAVs are calculated. These events may include, but are not limited to, situations relating to a single issuer in a market sector, significant fluctuations in U.S. or foreign markets, natural disasters, armed conflicts, governmental actions or other developments not tied directly to the securities markets. Should the Manager or Subadvisor conclude that such events may have affected the accuracy of the last price of such securities reported on the local foreign market, the Manager or Subadvisor may, pursuant to procedures adopted by the Board, adjust the value of the local price to reflect the estimated impact on the price of such securities as a result of such events. In this instance, securities are generally categorized as Level 3 in the hierarchy. Additionally, foreign equity securities are also fair valued whenever the movement of a particular index exceeds certain thresholds. In such cases, the securities are fair valued by applying factors provided by a third party vendor in accordance with the ICAP Funds’ policies and procedures and are generally categorized as Level 2 in the hierarchy. As of April 30, 2013, certain foreign equity securities held by the ICAP Funds were not fair valued in such a manner.
Equity securities and Exchange Traded Funds are valued at the latest quoted sales prices as of the close of regular trading on the Exchange on each valuation date. Securities that are not traded on the valuation date are valued at the mean of the latest quoted bid and ask prices. Prices normally are taken from the principal market in which each security trades. Investments in other mutual funds are valued at their respective NAVs as of the close of the Exchange on the valuation date. These securities are generally categorized as Level 1 in the hierarchy.
Temporary cash investments acquired over 60 days to maturity are valued using the latest bid prices or using valuations based on a matrix system (which considers such factors as security prices, yields, maturities, and ratings), both as furnished by independent pricing services. Other temporary cash investments which mature in 60 days or less
(“Short-Term Investments”) are valued at amortized cost. The amortized cost method involves valuing a security at its cost on the date of purchase and thereafter assuming a constant amortization to maturity of the difference between such cost and the value on maturity date. Amortized cost approximates the current fair value of a security. Securities valued at amortized cost are not valued using a quoted price in an active market. These securities are generally categorized as Level 2 in the hierarchy.
(B) Income Taxes. Each ICAP Fund is treated as a separate entity for federal income tax purposes. The ICAP Funds’ policy is to comply with the requirements of the Internal Revenue Code of 1986, as amended (the “Internal Revenue Code”), applicable to regulated investment companies and to distribute all of the taxable income to the shareholders of each ICAP Fund within the allowable time limits. Therefore, no federal, state and local income tax provision is required.
Management evaluates its tax positions to determine if the tax positions taken meet the minimum recognition threshold in connection with accounting for uncertainties in income tax positions taken or expected to be taken for the purposes of measuring and recognizing tax liabilities in the financial statements. Recognition of tax benefits of an uncertain tax position is required only when the position is “more likely than not” to be sustained assuming examination by taxing authorities. Management has analyzed the ICAP Funds’ tax positions taken on federal, state and local income tax returns for all open tax years (for up to three tax years), and has concluded that no provision for federal, state and local income tax is required in the ICAP Funds’ financial statements. The ICAP Funds’ federal, state and local income and federal excise tax returns for tax years for which the applicable statutes of limitations have not expired are subject to examination by the Internal Revenue Service and state and local departments of revenue.
(C) Foreign Taxes. Investment income received by the ICAP Funds from foreign sources may be subject to foreign income taxes. These foreign income taxes are generally withheld at the source, a portion of which may be recoverable. The ICAP Funds will accrue such taxes and recoveries as applicable, based upon its current interpretation of tax rules and regulations that exist in the markets in which it invests.
(D) Dividends and Distributions to Shareholders. Dividends and distributions are recorded on the ex-dividend date. Dividends from net investment income, if any, are declared and paid at least quarterly for the MainStay ICAP Equity Fund and MainStay ICAP Select Equity Fund, to the extent that income is available. MainStay ICAP Global Fund and MainStay ICAP International Fund will declare and pay dividends from net investment income, if any, at least annually. Distributions from net realized capital gains, if any, are declared and paid annually. Unless the shareholder elects otherwise, all dividends and distributions are reinvested in the same class of shares of the respective ICAP Fund, at NAV. Dividends and distributions to shareholders are determined in accordance with federal income tax regulations and may differ from GAAP.
(E) Security Transactions and Investment Income. The ICAP Funds record security transactions on the trade date. Realized gains and losses on security transactions are determined using the identified cost method. Dividend income is recognized on the ex-dividend date and interest income is accrued as earned using the effective interest rate
method. Discounts and premiums on securities purchased, other than Short-Term Investments, for the ICAP Funds are accreted and amortized, respectively, on the effective interest rate method over the life of the respective securities or, in the case of a callable security, over the period to the first date of call. Discounts and premiums on Short-Term Investments are accreted and amortized, respectively, on the straight-line method.
Investment income and realized and unrealized gains and losses on investments of the ICAP Funds are allocated to separate classes of shares pro rata based upon their relative net assets on the date the income is earned or realized and unrealized gains and losses are incurred.
(F) Expenses. Expenses of the Trust are allocated to the individual Funds in proportion to the net assets of the respective Funds when the expenses are incurred, except where direct allocations of expenses can be made. Expenses (other than transfer agent expenses and fees incurred under the shareholder services plans and the distribution plans further discussed in Note 3(B)) are allocated to separate classes of shares pro rata based upon their relative net assets on the date the expenses are incurred. The expenses borne by the ICAP Funds, including those of related parties to the ICAP Funds, are shown in the Statement of Operations.
(G) Use of Estimates. In preparing financial statements in conformity with GAAP, management makes estimates and assumptions that affect the reported amounts and disclosures in the financial statements. Actual results could differ from those estimates.
(H) Repurchase Agreements. The ICAP Funds may enter into repurchase agreements to earn income. The ICAP Funds may enter into repurchase agreements only with financial institutions that are deemed by the Manager or Subadvisor to be creditworthy, pursuant to guidelines established by the ICAP Funds’ Board. During the term of any repurchase agreement, the Manager or Subadvisor will continue to monitor the creditworthiness of the seller. Under the 1940 Act, repurchase agreements are considered to be collateralized loans by a ICAP Fund to the seller secured by the securities transferred to the respective ICAP Fund.
When the ICAP Funds invest in repurchase agreements, the ICAP Funds’ custodian takes possession of the collateral pledged for investments in the repurchase agreement. The underlying collateral is valued daily on a mark-to-market basis to determine that the value, including accrued interest, exceeds the repurchase price. In the event of the seller’s default on the obligation to repurchase, the ICAP Funds have the right to liquidate the collateral and apply the proceeds in satisfaction of the obligation. Under certain circumstances, such as in the event of default or bankruptcy by the counterparty to the agreement, realization and/or retention of the collateral may be subject to legal proceedings and possible realized loss to the respective ICAP Fund.
(I) Foreign Currency Transactions. The books and records of the ICAP Funds are kept in U.S. dollars. Prices of securities denominated in foreign currency amounts are translated into U.S. dollars at the mean between the buying and selling rates last quoted by any major U.S. bank at the following dates:
| (i) | market value of investment securities, other assets and liabilities— at the valuation date, and |
| | | | |
| mainstayinvestments.com | | | 79 | |
Notes to Financial Statements (Unaudited) (continued)
| (ii) | purchases and sales of investment securities, income and expenses—at the date of such transactions. |
The assets and liabilities that are denominated in foreign currency amounts are presented at the exchange rates and market values at the close of the period. The realized and unrealized changes in net assets arising from fluctuations in exchange rates and market prices of securities are not separately presented.
Net realized gain (loss) on foreign currency transactions represents net gains and losses on foreign currency forward contracts, net currency gains or losses realized as a result of differences between the amounts of securities sale proceeds or purchase cost, dividends, interest and withholding taxes as recorded on the ICAP Funds’ books, and the U.S. dollar equivalent amount actually received or paid. Net currency gains or losses from valuing such foreign currency denominated assets and liabilities, other than investments at valuation date exchange rates, are reflected in unrealized foreign exchange gains or losses.
(J) Securities Lending. In order to realize additional income, the ICAP Funds may engage in securities lending, subject to the limitations set forth in the 1940 Act and relevant guidance by the staff of the Securities and Exchange Commission. In the event the ICAP Funds do engage in securities lending, the ICAP Funds will lend through their custodian, State Street Bank and Trust Company (“State Street”). State Street will manage the ICAP Funds’ cash collateral in accordance with the lending agreement between the ICAP Funds and State Street, and indemnify the ICAP Funds’ portfolios against counterparty risk. The loans will be collateralized by cash or securities at least equal at all times to the market value of the securities loaned. Collateral will consist of U.S. Government securities, cash equivalents or irrevocable letters of credit. The ICAP Funds may bear the risk of delay in recovery of, or loss of rights in, the securities loaned should the borrower of the securities experience financial difficulty. The ICAP Funds may also record realized gain or loss on securities deemed sold due to a borrower’s inability to return securities on loan. The ICAP Funds will receive compensation for lending their securities in the form of fees or the retention of a portion of the interest on the investment of any cash received as collateral. The ICAP Funds also will continue to receive interest and dividends on the securities loaned and any gain or loss in the market price of the securities loaned that may occur during the term of the loan will be for the account of the ICAP Funds.
Although the ICAP Funds and New York Life Investments have temporarily suspended securities lending, the ICAP Funds and New York Life Investments reserve the right to reinstitute lending when deemed appropriate. The ICAP Funds did not have any portfolio securities on loan as of April 30, 2013.
(K) Rights and Warrants. Rights are certificates that permit the holder to purchase a certain number of shares, or a fractional share, of a new stock from the issuer at a specific price. Warrants are instruments that entitle the holder to buy an equity security at a specific price for a specific period of time. The ICAP Funds may enter into rights and warrants when securities are acquired through a corporate action. With respect to warrants in international markets, the securities may be purchased only when the underlying security cannot be purchased due to the many restrictions an industry and/or country might place on foreign investors. These investments can provide a greater potential for
profit or loss than an equivalent investment in the underlying security. Prices of these investments do not necessarily move in tandem with the prices of the underlying securities.
There is risk involved in the purchase of rights and warrants in that these investments are speculative investments. The ICAP Funds could also lose the entire value of their investment in warrants, if such warrants are not exercised by the date of its expiration. The securities are sold as soon as the opportunity becomes available. The ICAP Funds are exposed to risk until the sale or exercise of each right or warrant is completed. As of April 30, 2013, the ICAP Funds did not hold any rights or warrants.
(L) Concentration of Risk. The ICAP Funds may invest in foreign securities, which carry certain risks that are in addition to the usual risks inherent in domestic instruments. These risks include those resulting from currency fluctuations, future adverse political or economic developments and possible imposition of currency exchange blockages or other foreign governmental laws or restrictions. These risks are likely to be greater in emerging markets than in developed markets.
(M) Indemnifications. Under the Trust’s organizational documents, its officers and trustees are indemnified against certain liabilities that may arise out of performance of their duties to the Trust. Additionally, in the normal course of business, the ICAP Funds enter into contracts with third-party service providers that contain a variety of representations and warranties and which may provide general indemnifications. The ICAP Funds’ maximum exposure under these arrangements is unknown, as this would involve future claims that may be made against the ICAP Funds that have not yet occurred. Based on experience, management is of the view that the risk of loss in connection with these potential indemnification obligations is remote. However, there can be no assurance that material liabilities related to such obligations will not arise in the future, which could adversely impact the ICAP Funds.
(N) Quantitative Disclosure of Derivative Holdings. The following tables show additional disclosures about the ICAP Funds’ derivative and hedging activities, including how such activities are accounted for and their effect on the ICAP Funds’ financial positions, performance and cash flows. These derivatives are not accounted for as hedging instruments.
ICAP Global Fund
The effect of derivative instruments on the Statement of Operations for the period ended April 30, 2013:
Realized Gain (Loss)
| | | | | | | | | | |
| | | Statement of
Operations
Location | | Equity
Contracts
Risk | | | Total | |
Rights | | Net realized gain (loss) on security transactions | | $ | 45 | | | $ | 45 | |
| | | | | | |
Total Realized Gain (Loss) | | | | $ | 45 | | | $ | 45 | |
| | | | | | |
ICAP International Fund
The effect of derivative instruments on the Statement of Operations for the period ended April 30, 2013:
Realized Gain (Loss)
| | | | | | | | | | |
| | | Statement of
Operations
Location | | Equity
Contracts
Risk | | | Total | |
Rights | | Net realized gain (loss) on security transactions | | $ | 36 | | | $ | 36 | |
| | | | | | |
Total Realized Gain (Loss) | | | | $ | 36 | | | $ | 36 | |
| | | | | | |
Note 3–Fees and Related Party Transactions
(A) Manager and Subadvisor. New York Life Investments, a registered investment adviser and an indirect, wholly-owned subsidiary of New York Life Insurance Company (“New York Life”), serves as the ICAP Funds’ Manager, pursuant to an Amended and Restated Management Agreement, (“Management Agreement”). The Manager provides offices, conducts clerical, recordkeeping and bookkeeping services, and keeps most of the financial and accounting records required to be maintained by the ICAP Funds. Except for the portion of salaries and expenses that are the responsibility of the ICAP Funds, the Manager pays the salaries and expenses of all personnel affiliated with the ICAP Funds and certain operational expenses of the ICAP Funds. The ICAP Funds reimburse New York Life Investments in an amount equal to a portion of the salary of the Chief Compliance Officer (“CCO”) of the ICAP Funds. Institutional Capital LLC (“ICAP” or the “Subadvisor”), a registered investment adviser and an indirect, wholly-owned subsidiary of New York Life, serves as Subadvisor to the ICAP Funds and is responsible for the day-to-day portfolio management of the ICAP Funds. Pursuant to the terms of an Amended and Restated Subadvisory Agreement (“Subadvisory Agreement”) between New York Life Investments and ICAP, New York Life Investments pays for the services of the Subadvisor.
The MainStay ICAP Global Fund pays the Manager a monthly fee for the services performed and facilities furnished at an annual rate of 0.80% of the average daily net assets of the Fund. The MainStay ICAP Equity Fund, MainStay ICAP Select Equity Fund and MainStay ICAP International Fund pay the Manager a monthly fee for services performed and facilities furnished at an annual rate of the average daily net assets as follows: 0.80% up to $5 billion and 0.775% in excess of $5 billion. The effective management fee rates (exclusive of any applicable waivers/reimbursements) for each of the ICAP Funds for the six-month period ended April 30, 2013 were as follows:
| | | | |
Funds | | Management
Fee Rate | |
MainStay ICAP Equity Fund | | | 0.80 | % |
MainStay ICAP Select Equity Fund | | | 0.80 | |
MainStay ICAP Global Fund | | | 0.80 | |
MainStay ICAP International Fund | | | 0.80 | |
In connection with the discussion below regarding expense limitation agreements, Total Annual Fund Operating Expenses excludes taxes, interest, litigation, extraordinary expenses, brokerage and other transaction expenses relating to the purchase or sale of portfolio investments and acquired (underlying) fund fees and expenses.
MainStay ICAP Equity Fund
New York Life Investments has contractually agreed to waive a portion of the MainStay ICAP Equity Fund’s management fees and/or reimburse expenses so that Total Annual Fund Operating Expenses for Class I shares do not exceed 0.90% of its average daily net assets. This agreement will remain in effect until February 28, 2014, and shall renew automatically for one-year terms unless New York Life Investments provides written notice of termination prior to the start of the next term or upon approval of the Board.
Additionally, New York Life Investments has agreed to voluntarily waive fees and/or reimburse expenses of the appropriate class of the MainStay ICAP Equity Fund so that Total Annual Fund Operating Expenses of a class do not exceed the following percentages of average daily net assets: Investor Class, 1.85%; Class C, 2.60%; and Class R1, 0.99%. This voluntary waiver or reimbursement may be discontinued at any time without notice.
MainStay ICAP Select Equity Fund
New York Life Investments has contractually agreed to waive a portion of the MainStay ICAP Select Equity Fund’s management fees and/or reimburse expenses so that Total Annual Fund Operating Expenses of a class do not exceed the following percentages of average daily net assets: Class A, 1.18% and Class I, 0.90%. This agreement will remain in effect until February 28, 2014, and shall renew automatically for one-year terms unless New York Life Investments provides written notice of termination prior to the start of the next term or upon approval of the Board.
Additionally, New York Life Investments agreed to voluntarily waive fees and/or reimburse expenses of Class R1 and Class R2 shares of the MainStay ICAP Select Equity Fund so that Total Annual Fund Operating Expenses do not exceed 1.00% and 1.25%, respectively, of its average daily net assets. This voluntary waiver or reimbursement may be discontinued at any time without notice.
MainStay ICAP Global Fund
New York Life Investments has contractually agreed to waive a portion of the MainStay ICAP Global Fund’s management fees and/or reimburse expenses so that Total Annual Fund Operating Expenses of a class do not exceed the following percentages of average daily net assets: Investor Class, 1.20%; Class A, 1.15%; Class C, 1.95%; and Class I, 0.90%. This agreement will remain in effect until February 28, 2014, and shall renew automatically for one-year terms unless New York Life Investments provides written notice of termination prior to the start of the next term or upon approval of the Board.
| | | | |
| mainstayinvestments.com | | | 81 | |
Notes to Financial Statements (Unaudited) (continued)
MainStay ICAP International Fund
New York Life Investments has contractually agreed to waive a portion of the MainStay ICAP International Fund’s management fees and/or reimburse expenses so that Total Annual Fund Operating Expenses for Class I shares do not exceed 0.95% of its average daily net assets. This agreement will remain in effect until February 28, 2014, and shall renew automatically for one-year terms unless New York Life Investments provides written notice of termination prior to the start of the next term or upon approval of the Board.
Additionally, New York Life Investments has agreed to voluntarily waive fees and/or reimburse expenses of Class R1 shares of the MainStay ICAP International Fund so that Total Annual Fund Operating Expenses do not exceed 1.05% of its average daily net assets. This voluntary waiver or reimbursement may be discontinued at any time without notice.
For the six-month period ended April 30, 2013, New York Life Investments earned fees from the ICAP Funds and waived its fees and/or reimbursed expenses as follows:
| | | | | | | | |
| | | Fees
earned | | | Fees
waived/
reimbursed | |
MainStay ICAP Equity Fund | | $ | 3,626,224 | | | $ | 105,025 | |
MainStay ICAP Select Equity Fund | | | 16,421,634 | | | | 1,519,872 | |
MainStay ICAP Global Fund | | | 213,670 | | | | 56,055 | |
MainStay ICAP International Fund | | | 4,385,137 | | | | 352,407 | |
State Street, 1 Lincoln Street, Boston, Massachusetts 02111, provides sub-administration and sub-accounting services to the ICAP Funds pursuant to an agreement with New York Life Investments. These services include calculating the daily NAVs of the ICAP Funds, maintaining the general ledger and sub-ledger accounts for the calculation of the ICAP Funds’ respective NAVs, and assisting New York Life Investments in conducting various aspects of the ICAP Funds’ administrative operations. For providing these services to the ICAP Funds, State Street is compensated by New York Life Investments.
(B) Distribution, Service and Shareholder Service Fees. The Trust, on behalf of the ICAP Funds, has entered into a distribution agreement with NYLIFE Distributors LLC (the “Distributor”), an indirect, wholly-owned subsidiary of New York Life. The ICAP Funds have adopted distribution plans (the “Plans”) in accordance with the provisions of Rule 12b-1 under the 1940 Act.
Pursuant to the Investor Class, Class A and Class R2 Plans, the Distributor receives a monthly distribution fee from the Investor Class, Class A and Class R2 shares, at an annual rate of 0.25% of the average daily net assets of the Investor Class, Class A and Class R2 shares for distribution and/or service activities as designated by the Distributor. Pursuant to the Class B and Class C Plans, Class B and Class C shares pay the Distributor a monthly distribution fee at an annual rate of 0.75% of the average daily net assets of the Class B and Class C shares, along with a service fee at an annual rate of 0.25% of the average daily net assets of the Class B and Class C shares, for a total 12b-1 fee of 1.00%. Pursuant to the Class R3 Plan, the Distributor receives a monthly distribution and/or service fee from the Class R3 shares at an
annual rate of 0.50% of the average daily net assets of the Class R3 shares. Class I and Class R1 shares are not subject to a distribution and/or service fee.
The Plans provide that the distribution and service fees are payable to the Distributor regardless of the amounts actually expended by the Distributor for distribution of the ICAP Funds’ shares and service activities.
In accordance with the Shareholder Services Plans for the Class R1, Class R2 and Class R3 shares, the Manager has agreed to provide, through its affiliates or independent third parties, various shareholder and administrative support services to shareholders of the Class R1, Class R2 and Class R3 shares of the ICAP Funds that offer these share classes. For its services, the Manager is entitled to a Shareholder Service Fee accrued daily and paid monthly at an annual rate of 0.10% of the average daily net assets of the Class R1, Class R2 and Class R3 shares of the applicable ICAP Funds. This is in addition to any fees paid under a distribution plan, where applicable.
Shareholder Service Fees incurred by each ICAP Fund for the six-month period ended April 30, 2013, were as follows:
| | | | |
MainStay ICAP Equity Fund | |
Class R1 | | $ | 2,953 | |
Class R2 | | | 6,858 | |
Class R3 | | | 1,446 | |
| |
| | | | |
MainStay ICAP Select Equity Fund | |
Class R1 | | $ | 14,101 | |
Class R2 | | | 11,971 | |
Class R3 | | | 7,643 | |
| |
| | | | |
MainStay ICAP International Fund | |
Class R1 | | $ | 334 | |
Class R2 | | | 22,309 | |
Class R3 | | | 5,645 | |
(C) Sales Charges. The ICAP Funds were advised by the Distributor that the amount of sales charges retained on sales of Investor Class and Class A shares for the six-month period ended April 30, 2013 were as follows:
| | | | |
MainStay ICAP Equity Fund | |
Investor Class | | $ | 4,023 | |
Class A | | | 6,241 | |
| |
| | | | |
MainStay ICAP Select Equity Fund | |
Investor Class | | $ | 19,492 | |
Class A | | | 25,610 | |
| |
| | | | |
MainStay ICAP Global Fund | |
Investor Class | | $ | 719 | |
Class A | | | 180 | |
| |
| | | | |
| | | | |
MainStay ICAP International Fund | |
Investor Class | | $ | 2,854 | |
Class A | | | 4,598 | |
The ICAP Funds were also advised that the Distributor retained CDSCs on redemptions of Investor Class, Class A, Class B and Class C shares, for the six-month period ended April 30, 2013 as follows:
| | | | |
MainStay ICAP Equity Fund | |
Class A | | $ | 1 | |
Class C | | | 353 | |
| |
| | | | |
MainStay ICAP Select Equity Fund | |
Investor Class | | $ | 51 | |
Class A | | | 2,924 | |
Class B | | | 35,933 | |
Class C | | | 3,530 | |
| |
| | | | |
MainStay ICAP International Fund | |
Class C | | $ | 998 | |
(D) Transfer, Dividend Disbursing and Shareholder Servicing Agent. NYLIM Service Company LLC, an affiliate of New York Life Investments, is the ICAP Funds’ transfer, dividend disbursing and shareholder servicing agent pursuant to an agreement between NYLIM Service Company LLC and the Trust. NYLIM Service Company LLC has entered into an agreement with Boston Financial Data Services, Inc. (“BFDS”) pursuant to which BFDS performs certain transfer agent services on behalf of NYLIM Service Company LLC. Transfer agent expenses incurred by the ICAP Funds for the six-month period ended April 30, 2013, were as follows:
| | | | |
MainStay ICAP Equity Fund | | | | |
Investor Class | | $ | 19,726 | |
Class A | | | 14,502 | |
Class C | | | 14,055 | |
Class I | | | 361,684 | |
Class R1 | | | 2,566 | |
Class R2 | | | 5,913 | |
Class R3 | | | 1,261 | |
| |
| | | | |
MainStay ICAP Select Equity Fund | | | | |
Investor Class | | $ | 295,720 | |
Class A | | | 490,358 | |
Class B | | | 84,053 | |
Class C | | | 157,130 | |
Class I | | | 2,287,739 | |
Class R1 | | | 21,179 | |
Class R2 | | | 17,975 | |
Class R3 | | | 11,482 | |
| | | | |
MainStay ICAP Global Fund | | | | |
Investor Class | | $ | 1,028 | |
Class A | | | 412 | |
Class C | | | 467 | |
Class I | | | 5,287 | |
| |
| | | | |
MainStay ICAP International Fund | | | | |
Investor Class | | $ | 13,809 | |
Class A | | | 235,591 | |
Class C | | | 21,506 | |
Class I | | | 679,241 | |
Class R1 | | | 602 | |
Class R2 | | | 40,198 | |
Class R3 | | | 10,175 | |
(E) Small Account Fee. Shareholders with small accounts adversely impact the cost of providing transfer agency services. In an effort to reduce total transfer agency expenses, the ICAP Funds have implemented a small account fee on certain types of accounts. Certain shareholders with an account balance of less than $1,000 are charged an annual per account fee of $20 (assessed semi-annually), the proceeds from which offset transfer agent fees as reflected in the Statement of Operations.
(F) Capital. As of April 30, 2013, New York Life and its affiliates beneficially held shares of the ICAP Funds with values and percentages of net assets as follows:
| | | | | | | | |
MainStay ICAP Equity Fund | | | | | |
Class I | | $ | 82,571,723 | | | | 9.1 | % |
| | |
| | | | | | | | |
MainStay ICAP Select Equity Fund | | | | | |
Class A | | $ | 175,721 | | | | 0.0 | %‡ |
| ‡ | Less than one-tenth of a percent. |
| | | | | | | | |
MainStay ICAP Global Fund | | | | | |
Class A | | $ | 53,094 | | | | 1.3 | % |
Class C | | | 25,903 | | | | 5.9 | |
Class I | | | 50,431,450 | | | | 95.8 | |
Note 4–Federal Income Tax
Under the Regulated Investment Company Modernization Act of 2010, the ICAP Funds are permitted to carry forward capital losses incurred in taxable years beginning after December 22, 2010, for an unlimited period. However, any losses incurred during those future years will be required to be utilized prior to the losses incurred in pre-enactment tax years. As a result of this ordering rule, pre-enactment capital loss carryforwards may be more likely to expire unused. Additionally, post-enactment capital losses that are carried forward will retain their character as either short-term or long-term capital losses rather than being considered all short-term as under previous law.
| | | | |
| mainstayinvestments.com | | | 83 | |
Notes to Financial Statements (Unaudited) (continued)
MainStay ICAP Equity Fund
As of October 31, 2012, for federal income tax purposes, capital loss carryforwards of $141,604,873 were available as shown in the table below, to the extent provided by the regulations to offset future realized gains of the MainStay ICAP Equity Fund through the years indicated. To the extent that these capital loss carryforwards are used to offset future capital gains, it is probable that the capital gains so offset will not be distributed to shareholders. No capital gain distributions shall be made until any capital loss carryforwards have been fully utilized or expired.
| | | | |
Capital Loss
Available Through | | Short-Term
Capital Loss
Amounts (000’s) | | Long-Term
Capital Loss
Amounts (000’s) |
| 2017 | | $141,605 | | $— |
| Total | | $141,605 | | $— |
MainStay ICAP Select Equity Fund
As of October 31, 2012, for federal income tax purposes, capital loss carryforwards of $483,089,424 were available as shown in the table below, to the extent provided by the regulations to offset future realized gains of the MainStay ICAP Select Equity Fund through the years indicated. To the extent that these capital loss carryforwards are used to offset future capital gains, it is probable that the capital gains so offset will not be distributed to shareholders. No capital gain distributions shall be made until any capital loss carryforwards have been fully utilized or expired.
| | | | | | | | |
Capital Loss
Available Through | | Short-Term
Capital Loss
Amounts (000’s) | | | Long-Term
Capital Loss
Amounts (000’s) | |
2016
2017 | | $
| 86,839
396,250 |
| | $
| —
— |
|
| Total | | $ | 483,089 | | | $ | — | |
MainStay ICAP Global Fund
As of October 31, 2012, for federal income tax purposes, capital loss carryforwards of $10,772,416 were available as shown in the table below, to the extent provided by the regulations to offset future realized gains of the MainStay ICAP Global Fund through the years indicated. To the extent that these capital loss carryforwards are used to offset future capital gains, it is probable that the capital gains so offset will not be distributed to shareholders. No capital gain distributions shall be made until any capital loss carryforwards have been fully utilized or expired.
| | | | | | | | |
Capital Loss
Available Through | | Short-Term
Capital Loss
Amounts (000’s) | | | Long-Term
Capital Loss
Amounts (000’s) | |
2016
2017 | | $
| 1,637
9,135 |
| | $
| —
— |
|
| Total | | $ | 10,772 | | | $ | — | |
MainStay ICAP International Fund
As of October 31, 2012, for federal income tax purposes, capital loss carryforwards of $253,259,973 were available as shown in the table below, to the extent provided by the regulations to offset future realized
gains of the MainStay ICAP International Fund through the years indicated. To the extent that these capital loss carryforwards are used to offset future capital gains, it is probable that the capital gains so offset will not be distributed to shareholders. No capital gain distributions shall be made until any capital loss carryforwards have been fully utilized or expired.
| | | | | | | | |
Capital Loss
Available Through | | Short-Term
Capital Loss
Amounts (000’s) | | | Long-Term
Capital Loss
Amounts (000’s) | |
| 2016 | | $ | 67,705 | | | $ | — | |
| 2017 | | | 146,267 | | | | — | |
| Unlimited | | | 18,483 | | | | 20,805 | |
| Total | | | $232,455 | | | | $20,805 | |
The tax character of distributions paid during the year ended October 31, 2012, shown in the Statements of Changes in Net Assets was as follows:
| | | | | | | | | | | | |
| | | 2012 | |
| | | Tax Based
Distributions
from
Ordinary
Income | | | Tax Based
Distributions
from
Long-Term
Capital Gains | | | Total | |
MainStay ICAP Equity Fund | | $ | 15,649,566 | | | $ | — | | | $ | 15,649,566 | |
MainStay ICAP Select Equity Fund | | | 64,122,839 | | | | — | | | | 64,122,839 | |
MainStay ICAP Global Fund | | | 318,005 | | | | — | | | | 318,005 | |
MainStay ICAP International Fund | | | 1,680,016 | | | | — | | | | 1,680,016 | |
Note 5–Custodian
State Street is the custodian of the cash and the securities of the ICAP Funds. Custodial fees are charged to the ICAP Funds based on the market value of securities in the ICAP Funds and the number of certain cash transactions incurred by the ICAP Funds.
Note 6–Line of Credit
The ICAP Funds and certain affiliated funds maintain a line of credit with a syndicate of banks in order to secure a source of funds for temporary purposes to meet unanticipated or excessive redemption requests.
Effective August 29, 2012, under a second amended and restated credit agreement (the “Credit Agreement”), the aggregate commitment amount is $200,000,000 with an optional maximum amount of $250,000,000. The commitment fee is an annual rate of 0.08% of the average commitment amount payable quarterly, regardless of usage, to Bank of New York Mellon, which serves as the agent to the syndicate. The commitment fee is allocated among the Fund and certain affiliated funds based upon net assets and other factors. Interest on any revolving credit loan is charged based upon the Federal Funds Advances rate or the one month London InterBank Offered Rate, whichever is higher. The Credit Agreement expires on August 28, 2013, although the Fund, certain affiliated funds and the syndicate of banks may renew the Credit Agreement for an additional year on the same or different terms. There were no borrowings made or outstanding with respect to the ICAP Funds on the Credit Agreement during the six-month period ended April 30, 2013.
Note 7–Purchases and Sales of Securities (in 000’s)
For the six-month period ended April 30, 2013, purchases and sales of securities, other than short-term securities, were as follows:
| | | | | | | | |
| | | Other | |
| | | Purchases | | | Sales | |
MainStay ICAP Equity Fund | | $ | 288,832 | | | $ | 321,571 | |
MainStay ICAP Select Equity Fund | | | 1,486,166 | | | | 1,536,933 | |
MainStay ICAP Global Fund | | | 18,600 | | | | 18,144 | |
MainStay ICAP International Fund | | | 292,049 | | | | 296,619 | |
Note 8–Capital Share Transactions
MainStay ICAP Equity Fund
| | | | | | | | |
Investor Class | | Shares | | | Amount | |
Six-month period ended April 30, 2013: | | | | | | | | |
Shares sold | | | 19,307 | | | $ | 812,716 | |
Shares issued to shareholders in reinvestment of dividends | | | 1,564 | | | | 65,281 | |
Shares redeemed | | | (25,312 | ) | | | (1,062,303 | ) |
| | | | | | | | |
Net increase (decrease) in shares outstanding before conversion | | | (4,441 | ) | | | (184,306 | ) |
Shares converted into Investor Class (See Note 1) | | | 487 | | | | 21,760 | |
Shares converted from Investor Class (See Note 1) | | | (9,446 | ) | | | (417,413 | ) |
| | | | | | | | |
Net increase (decrease) | | | (13,400 | ) | | $ | (579,959 | ) |
| | | | | | | | |
Year ended October 31, 2012: | | | | | | | | |
Shares sold | | | 44,385 | | | $ | 1,694,133 | |
Shares issued to shareholders in reinvestment of dividends and distributions | | | 3,724 | | | | 144,300 | |
Shares redeemed | | | (51,901 | ) | | | (1,951,964 | ) |
| | | | | | | | |
Net increase (decrease) in shares outstanding before conversion | | | (3,792 | ) | | | (113,531 | ) |
Shares converted into Investor Class
(See Note 1) | | | 3,476 | | | | 139,430 | |
Shares converted from Investor Class
(See Note 1) | | | (27,104 | ) | | | (1,036,462 | ) |
| | | | | | | | |
Net increase (decrease) | | | (27,420 | ) | | $ | (1,010,563 | ) |
| | | | | | | | |
| | | | | | | | |
Class A | | Shares | | | Amount | |
Six-month period ended April 30, 2013: | | | | | | | | |
Shares sold | | | 208,878 | | | $ | 8,894,794 | |
Shares issued to shareholders in reinvestment of dividends | | | 4,662 | | | | 196,121 | |
Shares redeemed | | | (118,509 | ) | | | (4,955,948 | ) |
| | | | | | | | |
Net increase (decrease) in shares outstanding before conversion | | | 95,031 | | | | 4,134,967 | |
Shares converted into Class A
(See Note 1) | | | 9,429 | | | | 417,413 | |
Shares converted from Class A
(See Note 1) | | | (486 | ) | | | (21,760 | ) |
| | | | | | | | |
Net increase (decrease) | | | 103,974 | | | $ | 4,530,620 | |
| | | | | | | | |
Year ended October 31, 2012: | | | | | | | | |
Shares sold | | | 138,146 | | | $ | 5,261,445 | |
Shares issued to shareholders in reinvestment of dividends and distributions | | | 10,139 | | | | 393,620 | |
Shares redeemed | | | (224,782 | ) | | | (8,506,584 | ) |
| | | | | | | | |
Net increase (decrease) in shares outstanding before conversion | | | (76,497 | ) | | | (2,851,519 | ) |
Shares converted into Class A
(See Note 1) | | | 27,063 | | | | 1,036,462 | |
Shares converted from Class A
(See Note 1) | | | (3,470 | ) | | | (139,430 | ) |
| | | | | | | | |
Net increase (decrease) | | | (52,904 | ) | | $ | (1,954,487 | ) |
| | | | | | | | |
| | |
| | | | | | | | |
Class C | | Shares | | | Amount | |
Six-month period ended April 30, 2013: | | | | | | | | |
Shares sold | | | 23,617 | | | $ | 1,004,335 | |
Shares issued to shareholders in reinvestment of dividends | | | 234 | | | | 9,536 | |
Shares redeemed | | | (25,090 | ) | | | (1,021,632 | ) |
| | | | | | | | |
Net increase (decrease) | | | (1,239 | ) | | $ | (7,761 | ) |
| | | | | | | | |
Year ended October 31, 2012: | | | | | | | | |
Shares sold | | | 45,018 | | | $ | 1,672,637 | |
Shares issued to shareholders in reinvestment of dividends | | | 1,002 | | | | 38,434 | |
Shares redeemed | | | (51,121 | ) | | | (1,892,523 | ) |
| | | | | | | | |
Net increase (decrease) | | | (5,101 | ) | | $ | (181,452 | ) |
| | | | | | | | |
| | |
| | | | | | | | |
| | | | |
| mainstayinvestments.com | | | 85 | |
Notes to Financial Statements (Unaudited) (continued)
| | | | | | | | |
Class I | | Shares | | | Amount | |
Six-month period ended April 30, 2013: | | | | | | | | |
Shares sold | | | 2,718,623 | | | $ | 117,734,476 | |
Shares issued to shareholders in reinvestment of dividends | | | 148,230 | | | | 6,207,488 | |
Shares redeemed | | | (3,291,446 | ) | | | (139,686,069 | ) |
| | | | | | | | |
Net increase (decrease) | | | (424,593 | ) | | $ | (15,744,105 | ) |
| | | | | | | | |
Year ended October 31, 2012: | | | | | | | | |
Shares sold | | | 8,386,863 | | | $ | 316,576,344 | |
Shares issued to shareholders in reinvestment of dividends and distributions | | | 373,243 | | | | 14,439,082 | |
Shares redeemed | | | (8,900,041 | ) | | | (344,048,716 | ) |
| | | | | | | | |
Net increase (decrease) | | | (139,935 | ) | | $ | (13,033,290 | ) |
| | | | | | | | |
| | |
| | | | | | | | |
Class R1 | | Shares | | | Amount | |
Six-month period ended April 30, 2013: | | | | | | | | |
Shares sold | | | 47,066 | | | $ | 1,927,873 | |
Shares issued to shareholders in reinvestment of dividends | | | 1,041 | | | | 43,697 | |
Shares redeemed | | | (18,863 | ) | | | (791,350 | ) |
| | | | | | | | |
Net increase (decrease) | | | 29,244 | | | $ | 1,180,220 | |
| | | | | | | | |
Year ended October 31, 2012: | | | | | | | | |
Shares sold | | | 51,906 | | | $ | 1,941,159 | |
Shares issued to shareholders in reinvestment of dividends | | | 1,860 | | | | 72,230 | |
Shares redeemed | | | (45,881 | ) | | | (1,642,461 | ) |
| | | | | | | | |
Net increase (decrease) | | | 7,885 | | | $ | 370,928 | |
| | | | | | | | |
| | |
| | | | | | | | |
Class R2 | | Shares | | | Amount | |
Six-month period ended April 30, 2013: | | | | | | | | |
Shares sold | | | 133,995 | | | $ | 5,899,138 | |
Shares issued to shareholders in reinvestment of dividends | | | 1,748 | | | | 73,034 | |
Shares redeemed | | | (51,945 | ) | | | (2,197,804 | ) |
| | | | | | | | |
Net increase (decrease) | | | 83,798 | | | $ | 3,774,368 | |
| | | | | | | | |
Year ended October 31, 2012: | | | | | | | | |
Shares sold | | | 218,710 | | | $ | 8,113,308 | |
Shares issued to shareholders in reinvestment of dividends and distributions | | | 3,056 | | | | 118,751 | |
Shares redeemed | | | (75,321 | ) | | | (2,869,784 | ) |
| | | | | | | | |
Net increase (decrease) | | | 146,445 | | | $ | 5,362,275 | |
| | | | | | | | |
| | |
| | | | | | | | |
| | | | | | | | |
Class R3 | | Shares | | | Amount | |
Six-month period ended April 30, 2013: | | | | | | | | |
Shares sold | | | 17,781 | | | $ | 750,557 | |
Shares issued to shareholders in reinvestment of dividends | | | 340 | | | | 14,132 | |
Shares redeemed | | | (22,476 | ) | | | (917,317 | ) |
| | | | | | | | |
Net increase (decrease) | | | (4,355 | ) | | $ | (152,628 | ) |
| | | | | | | | |
Year ended October 31, 2012: | | | | | | | | |
Shares sold | | | 32,375 | | | $ | 1,240,943 | |
Shares issued to shareholders in reinvestment of dividends and distributions | | | 896 | | | | 34,666 | |
Shares redeemed | | | (39,434 | ) | | | (1,435,011 | ) |
| | | | | | | | |
Net increase (decrease) | | | (6,163 | ) | | $ | (159,402 | ) |
| | | | | | | | |
MainStay ICAP Select Equity Fund
| | | | | | | | |
Investor Class | | Shares | | | Amount | |
Six-month period ended April 30, 2013: | | | | | | | | |
Shares sold | | | 98,924 | | | $ | 4,022,121 | |
Shares issued to shareholders in reinvestment of dividends | | | 22,868 | | | | 907,009 | |
Shares redeemed | | | (316,136 | ) | | | (12,698,819 | ) |
| | | | | | | | |
Net increase (decrease) in shares outstanding before conversion | | | (194,344 | ) | | | (7,769,689 | ) |
Shares converted into Investor Class (See Note 1) | | | 111,212 | | | | 4,566,792 | |
Shares converted from Investor Class (See Note 1) | | | (240,214 | ) | | | (10,143,329 | ) |
| | | | | | | | |
Net increase (decrease) | | | (323,346 | ) | | $ | (13,346,226 | ) |
| | | | | | | | |
Year ended October 31, 2012: | | | | | | | | |
Shares sold | | | 185,395 | | | $ | 6,690,933 | |
Shares issued to shareholders in reinvestment of dividends and distributions | | | 66,711 | | | | 2,344,848 | |
Shares redeemed | | | (722,343 | ) | | | (25,950,269 | ) |
| | | | | | | | |
Net increase (decrease) in shares outstanding before conversion | | | (470,237 | ) | | | (16,914,488 | ) |
Shares converted into Investor Class (See Note 1) | | | 313,009 | | | | 11,157,641 | |
Shares converted from Investor Class (See Note 1) | | | (506,628 | ) | | | (18,557,836 | ) |
| | | | | | | | |
Net increase (decrease) | | | (663,856 | ) | | $ | (24,314,683 | ) |
| | | | | | | | |
| | |
| | | | | | | | |
| | | | | | | | |
Class A | | Shares | | | Amount | |
Six-month period ended April 30, 2013: | | | | | | | | |
Shares sold | | | 1,974,422 | | | $ | 79,641,224 | |
Shares issued to shareholders in reinvestment of dividends | | | 78,037 | | | | 3,108,664 | |
Shares redeemed | | | (1,714,113 | ) | | | (68,463,315 | ) |
| | | | | | | | |
Net increase (decrease) in shares outstanding before conversion | | | 338,346 | | | | 14,286,573 | |
Shares converted into Class A
(See Note 1) | | | 275,855 | | | | 11,600,646 | |
Shares converted from Class A
(See Note 1) | | | (11,449 | ) | | | (488,660 | ) |
| | | | | | | | |
Net increase (decrease) | | | 602,752 | | | $ | 25,398,559 | |
| | | | | | | | |
Year ended October 31, 2012: | | | | | | | | |
Shares sold | | | 4,970,881 | | | $ | 178,245,091 | |
Shares issued to shareholders in reinvestment of dividends and distributions | | | 204,575 | | | | 7,228,473 | |
Shares redeemed | | | (5,805,527 | ) | | | (210,387,848 | ) |
| | | | | | | | |
Net increase (decrease) in shares outstanding before conversion | | | (630,071 | ) | | | (24,914,284 | ) |
Shares converted into Class A
(See Note 1) | | | 638,824 | | | | 23,283,562 | |
Shares converted from Class A
(See Note 1) | | | (27,814 | ) | | | (1,061,905 | ) |
| | | | | | | | |
Net increase (decrease) | | | (19,061 | ) | | $ | (2,692,627 | ) |
| | | | | | | | |
| | |
| | | | | | | | |
Class B | | Shares | | | Amount | |
Six-month period ended April 30, 2013: | | | | | | | | |
Shares sold | | | 71,096 | | | $ | 2,839,599 | |
Shares issued to shareholders in reinvestment of dividends | | | 1,802 | | | | 68,255 | |
Shares redeemed | | | (112,247 | ) | | | (4,462,466 | ) |
| | | | | | | | |
Net increase (decrease) in shares outstanding before conversion | | | (39,349 | ) | | | (1,554,612 | ) |
Shares converted from Class B
(See Note 1) | | | (136,629 | ) | | | (5,535,449 | ) |
| | | | | | | | |
Net increase (decrease) | | | (175,978 | ) | | $ | (7,090,061 | ) |
| | | | | | | | |
Year ended October 31, 2012: | | | | | | | | |
Shares sold | | | 158,063 | | | $ | 5,629,437 | |
Shares issued to shareholders in reinvestment of dividends | | | 10,508 | | | | 356,179 | |
Shares redeemed | | | (281,046 | ) | | | (10,038,872 | ) |
| | | | | | | | |
Net increase (decrease) in shares outstanding before conversion | | | (112,475 | ) | | | (4,053,256 | ) |
Shares converted from Class B
(See Note 1) | | | (421,145 | ) | | | (14,821,462 | ) |
| | | | | | | | |
Net increase (decrease) | | | (533,620 | ) | | $ | (18,874,718 | ) |
| | | | | | | | |
| | |
| | | | | | | | |
| | | | | | | | |
Class C | | Shares | | | Amount | |
Six-month period ended April 30, 2013: | | | | | | | | |
Shares sold | | | 126,639 | | | $ | 5,095,192 | |
Shares issued to shareholders in reinvestment of dividends | | | 2,169 | | | | 82,179 | |
Shares redeemed | | | (276,549 | ) | | | (10,956,188 | ) |
| | | | | | | | |
Net increase (decrease) | | | (147,741 | ) | | $ | (5,778,817 | ) |
| | | | | | | | |
Year ended October 31, 2012: | | | | | | | | |
Shares sold | | | 274,068 | | | $ | 9,782,349 | |
Shares issued to shareholders in reinvestment of dividends | | | 10,402 | | | | 353,229 | |
Shares redeemed | | | (607,657 | ) | | | (21,600,234 | ) |
| | | | | | | | |
Net increase (decrease) | | | (323,187 | ) | | $ | (11,464,656 | ) |
| | | | | | | | |
| | |
| | | | | | | | |
Class I | | Shares | | | Amount | |
Six-month period ended April 30, 2013: | | | | | | | | |
Shares sold | | | 12,976,863 | | | $ | 527,988,337 | |
Shares issued to shareholders in reinvestment of dividends | | | 525,496 | | | | 21,012,529 | |
Shares redeemed | | | (12,339,772 | ) | | | (490,036,194 | ) |
| | | | | | | | |
Net increase (decrease) | | | 1,162,587 | | | $ | 58,964,672 | |
| | | | | | | | |
Year ended October 31, 2012: | | | | | | | | |
Shares sold | | | 22,029,531 | | | $ | 788,991,898 | |
Shares issued to shareholders in reinvestment of dividends and distributions | | | 1,301,310 | | | | 46,191,248 | |
Shares redeemed (a) | | | (26,892,686 | ) | | | (962,755,371 | ) |
| | | | | | | | |
Net increase (decrease) | | | (3,561,845 | ) | | $ | (127,572,225 | ) |
| | | | | | | | |
| | |
| | | | | | | | |
Class R1 | | Shares | | | Amount | |
Six-month period ended April 30, 2013: | | | | | | | | |
Shares sold | | | 66,495 | | | $ | 2,706,735 | |
Shares issued to shareholders in reinvestment of dividends | | | 4,921 | | | | 196,412 | |
Shares redeemed | | | (98,888 | ) | | | (4,009,013 | ) |
| | | | | | | | |
Net increase (decrease) | | | (27,472 | ) | | $ | (1,105,866 | ) |
| | | | | | | | |
Year ended October 31, 2012: | | | | | | | | |
Shares sold | | | 309,870 | | | $ | 11,520,433 | |
Shares issued to shareholders in reinvestment of dividends | | | 11,133 | | | | 396,308 | |
Shares redeemed | | | (205,429 | ) | | | (7,409,970 | ) |
| | | | | | | | |
Net increase (decrease) | | | 115,574 | | | $ | 4,506,771 | |
| | | | | | | | |
| | |
| | | | | | | | |
Class R2 | | Shares | | | Amount | |
Six-month period ended April 30, 2013: | | | | | | | | |
Shares sold | | | 154,091 | | | $ | 6,273,341 | |
Shares issued to shareholders in reinvestment of dividends | | | 3,239 | | | | 128,870 | |
Shares redeemed | | | (119,301 | ) | | | (4,751,146 | ) |
| | | | | | | | |
Net increase (decrease) | | | 38,029 | | | $ | 1,651,065 | |
| | | | | | | | |
Year ended October 31, 2012: | | | | | | | | |
Shares sold | | | 152,215 | | | $ | 5,523,270 | |
Shares issued to shareholders in reinvestment of dividends and distributions | | | 8,435 | | | | 298,015 | |
Shares redeemed | | | (217,422 | ) | | | (7,720,328 | ) |
| | | | | | | | |
Net increase (decrease) | | | (56,772 | ) | | $ | (1,899,043 | ) |
| | | | | | | | |
| | | | |
| mainstayinvestments.com | | | 87 | |
Notes to Financial Statements (Unaudited) (continued)
| | | | | | | | |
Class R3 | | Shares | | | Amount | |
Six-month period ended April 30, 2013: | | | | | | | | |
Shares sold | | | 49,481 | | | $ | 2,024,984 | |
Shares issued to shareholders in reinvestment of dividends | | | 1,518 | | | | 60,078 | |
Shares redeemed | | | (50,175 | ) | | | (1,998,676 | ) |
| | | | | | | | |
Net increase (decrease) | | | 824 | | | $ | 86,386 | |
| | | | | | | | |
Year ended October 31, 2012: | | | | | | | | |
Shares sold | | | 91,193 | | | $ | 3,318,274 | |
Shares issued to shareholders in reinvestment of dividends and distributions | | | 4,388 | | | | 153,780 | |
Shares redeemed | | | (103,641 | ) | | | (3,706,189 | ) |
| | | | | | | | |
Net increase (decrease) | | | (8,060 | ) | | $ | (234,135 | ) |
| | | | | | | | |
| (a) | Includes the redemption of 963,146 shares through an in-kind transfer of securities in the amount of $36,596,388. (See Note 9) |
MainStay ICAP Global Fund
| | | | | | | | |
Investor Class | | Shares | | | Amount | |
Six-month period ended April 30, 2013: | | | | | | | | |
Shares sold | | | 15,562 | | | $ | 147,287 | |
Shares issued to shareholders in reinvestment of dividends | | | 1,058 | | | | 9,620 | |
Shares redeemed | | | (6,689 | ) | | | (65,303 | ) |
| | | | | | | | |
Net increase (decrease) in shares outstanding before conversion | | | 9,931 | | | | 91,604 | |
Shares converted from Investor Class
(See Note 1) | | | (3,417 | ) | | | (32,815 | ) |
| | | | | | | | |
Net increase (decrease) | | | 6,514 | | | $ | 58,789 | |
| | | | | | | | |
Year ended October 31, 2012: | | | | | | | | |
Shares sold | | | 22,319 | | | $ | 194,527 | |
Shares issued to shareholders in reinvestment of dividends and distributions | | | 338 | | | | 2,768 | |
Shares redeemed | | | (14,269 | ) | | | (121,065 | ) |
| | | | | | | | |
Net increase (decrease) in shares outstanding before conversion | | | 8,388 | | | | 76,230 | |
Shares converted into Investor Class
(See Note 1) | | | 4,181 | | | | 38,164 | |
Shares converted from Investor Class
(See Note 1) | | | (9,170 | ) | | | (81,856 | ) |
| | | | | | | | |
Net increase (decrease) | | | 3,399 | | | $ | 32,538 | |
| | | | | | | | |
| | |
| | | | | | | | |
| | | | | | | | |
Class A | | Shares | | | Amount | |
Six-month period ended April 30, 2013: | | | | | | | | |
Shares sold | | | 20,581 | | | $ | 194,484 | |
Shares issued to shareholders in reinvestment of dividends | | | 5,633 | | | | 51,258 | |
Shares redeemed | | | (22,476 | ) | | | (216,059 | ) |
| | | | | | | | |
Net increase (decrease) in shares outstanding before conversion | | | 3,738 | | | | 29,683 | |
Shares converted into Class A
(See Note 1) | | | 3,414 | | | | 32,815 | |
| | | | | | | | |
Net increase (decrease) | | | 7,152 | | | $ | 62,498 | |
| | | | | | | | |
Year ended October 31, 2012: | | | | | | | | |
Shares sold | | | 31,477 | | | $ | 271,665 | |
Shares issued to shareholders in reinvestment of dividends and distributions | | | 2,823 | | | | 23,123 | |
Shares redeemed | | | (202,461 | ) | | | (1,722,462 | ) |
| | | | | | | | |
Net increase (decrease) in shares outstanding before conversion | | | (168,161 | ) | | | (1,427,674 | ) |
Shares converted into Class A
(See Note 1) | | | 9,156 | | | | 81,856 | |
Shares converted from Class A
(See Note 1) | | | (4,175 | ) | | | (38,164 | ) |
| | | | | | | | |
Net increase (decrease) | | | (163,180 | ) | | $ | (1,383,982 | ) |
| | | | | | | | |
| | |
| | | | | | | | |
Class C | | Shares | | | Amount | |
Six-month period ended April 30, 2013: | | | | | | | | |
Shares sold | | | 13,491 | | | $ | 133,963 | |
Shares issued to shareholders in reinvestment of dividends | | | 203 | | | | 1,850 | |
Shares redeemed | | | (3,212 | ) | | | (30,990 | ) |
| | | | | | | | |
Net increase (decrease) | | | 10,482 | | | $ | 104,823 | |
| | | | | | | | |
Year ended October 31, 2012: | | | | | | | | |
Shares sold | | | 2,002 | | | $ | 17,607 | |
Shares issued to shareholders in reinvestment of dividends | | | 59 | | | | 486 | |
Shares redeemed | | | (13,148 | ) | | | (115,163 | ) |
| | | | | | | | |
Net increase (decrease) | | | (11,087 | ) | | $ | (97,070 | ) |
| | | | | | | | |
| | |
| | | | | | | | |
Class I | | Shares | | | Amount | |
Six-month period ended April 30, 2013: | | | | | | | | |
Shares sold | | | 1,514 | | | $ | 14,758 | |
Shares issued to shareholders in reinvestment of dividends | | | 87,657 | | | | 798,553 | |
| | | | | | | | |
Net increase (decrease) | | | 89,171 | | | $ | 813,311 | |
| | | | | | | | |
Year ended October 31, 2012: | | | | | | | | |
Shares sold | | | 39,008 | | | $ | 327,620 | |
Shares issued to shareholders in reinvestment of dividends and distributions | | | 35,464 | | | | 290,800 | |
Shares redeemed | | | (453,822 | ) | | | (4,091,888 | ) |
| | | | | | | | |
Net increase (decrease) | | | (379,350 | ) | | $ | (3,473,468 | ) |
| | | | | | | | |
MainStay ICAP International Fund
| | | | | | | | |
Investor Class | | Shares | | | Amount | |
Six-month period ended April 30, 2013: | | | | | | | | |
Shares sold | | | 22,297 | | | $ | 680,503 | |
Shares issued to shareholders in reinvestment of dividends | | | 4,979 | | | | 144,550 | |
Shares redeemed | | | (25,937 | ) | | | (783,865 | ) |
| | | | | | | | |
Net increase (decrease) in shares outstanding before conversion | | | 1,339 | | | | 41,188 | |
Shares converted into Investor Class (See Note 1) | | | 927 | | | | 28,774 | |
Shares converted from Investor Class (See Note 1) | | | (8,749 | ) | | | (269,103 | ) |
| | | | | | | | |
Net increase (decrease) | | | (6,483 | ) | | $ | (199,141 | ) |
| | | | | | | | |
Year ended October 31, 2012: | | | | | | | | |
Shares sold | | | 37,109 | | | $ | 1,024,165 | |
Shares redeemed | | | (69,513 | ) | | | (1,925,100 | ) |
| | | | | | | | |
Net increase (decrease) in shares outstanding before conversion | | | (32,404 | ) | | | (900,935 | ) |
Shares converted into Investor Class (See Note 1) | | | 5,639 | | | | 164,356 | |
Shares converted from Investor Class (See Note 1) | | | (21,398 | ) | | | (599,631 | ) |
| | | | | | | | |
Net increase (decrease) | | | (48,163 | ) | | $ | (1,336,210 | ) |
| | | | | | | | |
| | |
| | | | | | | | |
Class A | | Shares | | | Amount | |
Six-month period ended April 30, 2013: | | | | | | | | |
Shares sold | | | 1,316,274 | | | $ | 40,037,050 | |
Shares issued to shareholders in reinvestment of dividends | | | 142,215 | | | | 4,129,921 | |
Shares redeemed | | | (989,180 | ) | | | (29,987,161 | ) |
| | | | | | | | |
Net increase (decrease) in shares outstanding before conversion | | | 469,309 | | | | 14,179,810 | |
Shares converted into Class A
(See Note 1) | | | 8,745 | | | | 269,103 | |
Shares converted from Class A
(See Note 1) | | | (927 | ) | | | (28,774 | ) |
| | | | | | | | |
Net increase (decrease) | | | 477,127 | | | $ | 14,420,139 | |
| | | | | | | | |
Year ended October 31, 2012: | | | | | | | | |
Shares sold | | | 4,630,228 | | | $ | 128,659,827 | |
Shares issued to shareholders in reinvestment of dividends and distributions | | | 2,340 | | | | 63,093 | |
Shares redeemed | | | (2,007,399 | ) | | | (55,673,117 | ) |
| | | | | | | | |
Net increase (decrease) in shares outstanding before conversion | | | 2,625,169 | | | | 73,049,803 | |
Shares converted into Class A
(See Note 1) | | | 21,386 | | | | 599,631 | |
Shares converted from Class A
(See Note 1) | | | (5,633 | ) | | | (164,356 | ) |
| | | | | | | | |
Net increase (decrease) | | | 2,640,922 | | | $ | 73,485,078 | |
| | | | | | | | |
| | |
| | | | | | | | |
| | | | | | | | |
Class C | | Shares | | | Amount | |
Six-month period ended April 30, 2013: | | | | | | | | |
Shares sold | | | 33,003 | | | $ | 986,845 | |
Shares issued to shareholders in reinvestment of dividends | | | 3,806 | | | | 108,957 | |
Shares redeemed | | | (52,676 | ) | | | (1,557,755 | ) |
| | | | | | | | |
Net increase (decrease) | | | (15,867 | ) | | $ | (461,953 | ) |
| | | | | | | | |
Year ended October 31, 2012: | | | | | | | | |
Shares sold | | | 34,585 | | | $ | 943,907 | |
Shares redeemed | | | (126,069 | ) | | | (3,397,224 | ) |
| | | | | | | | |
Net increase (decrease) | | | (91,484 | ) | | $ | (2,453,317 | ) |
| | | | | | | | |
| | |
| | | | | | | | |
Class I | | Shares | | | Amount | |
Six-month period ended April 30, 2013: | | | | | | | | |
Shares sold | | | 4,175,330 | | | $ | 128,153,207 | |
Shares issued to shareholders in reinvestment of dividends | | | 493,838 | | | | 14,365,737 | |
Shares redeemed | | | (3,897,526 | ) | | | (118,836,485 | ) |
| | | | | | | | |
Net increase (decrease) | | | 771,642 | | | $ | 23,682,459 | |
| | | | | | | | |
Year ended October 31, 2012: | | | | | | | | |
Shares sold | | | 7,775,536 | | | $ | 213,435,362 | |
Shares issued to shareholders in reinvestment of dividends and distributions | | | 55,716 | | | | 1,505,444 | |
Shares redeemed | | | (8,104,700 | ) | | | (223,936,471 | ) |
| | | | | | | | |
Net increase (decrease) | | | (273,448 | ) | | $ | (8,995,665 | ) |
| | | | | | | | |
| | |
| | | | | | | | |
Class R1 | | Shares | | | Amount | |
Six-month period ended April 30, 2013: | | | | | | | | |
Shares sold | | | 5,887 | | | $ | 182,053 | |
Shares issued to shareholders in reinvestment of dividends | | | 318 | | | | 9,241 | |
Shares redeemed | | | (1,212 | ) | | | (37,487 | ) |
| | | | | | | | |
Net increase (decrease) | | | 4,993 | | | $ | 153,807 | |
| | | | | | | | |
Year ended October 31, 2012: | | | | | | | | |
Shares sold | | | 8,001 | | | $ | 221,437 | |
Shares issued to shareholders in reinvestment of dividends | | | 22 | | | | 589 | |
Shares redeemed | | | (4,811 | ) | | | (127,378 | ) |
| | | | | | | | |
Net increase (decrease) | | | 3,212 | | | $ | 94,648 | |
| | | | | | | | |
| | |
| | | | | | | | |
Class R2 | | Shares | | | Amount | |
Six-month period ended April 30, 2013: | | | | | | | | |
Shares sold | | | 233,891 | | | $ | 7,076,486 | |
Shares issued to shareholders in reinvestment of dividends | | | 22,869 | | | | 663,671 | |
Shares redeemed | | | (264,343 | ) | | | (7,991,057 | ) |
| | | | | | | | |
Net increase (decrease) | | | (7,583 | ) | | $ | (250,900 | ) |
| | | | | | | | |
Year ended October 31, 2012: | | | | | | | | |
Shares sold | | | 563,000 | | | $ | 15,414,518 | |
Shares redeemed | | | (422,239 | ) | | | (11,715,982 | ) |
| | | | | | | | |
Net increase (decrease) | | | 140,761 | | | $ | 3,698,536 | |
| | | | | | | | |
| | |
| | | | | | | | |
| | | | |
| mainstayinvestments.com | | | 89 | |
Notes to Financial Statements (Unaudited) (continued)
| | | | | | | | |
Class R3 | | Shares | | | Amount | |
Six-month period ended April 30, 2013: | | | | | | | | |
Shares sold | | | 76,275 | | | $ | 2,323,163 | |
Shares issued to shareholders in reinvestment of dividends | | | 4,779 | | | | 137,922 | |
Shares redeemed | | | (93,569 | ) | | | (2,825,830 | ) |
| | | | | | | | |
Net increase (decrease) | | | (12,515 | ) | | $ | (364,745 | ) |
| | | | | | | | |
Year ended October 31, 2012: | | | | | | | | |
Shares sold | | | 158,450 | | | $ | 4,313,618 | |
Shares redeemed | | | (155,298 | ) | | | (4,207,298 | ) |
| | | | | | | | |
Net increase (decrease) | | | 3,152 | | | $ | 106,320 | |
| | | | | | | | |
Note 9–In-Kind Transfer of Securities
During the year ended October 31, 2012, the MainStay ICAP Select Equity Fund redeemed shares of beneficial interest in exchange for securities. The securities were transferred at their current value on the date of transaction.
| | | | | | | | | | | | |
Transaction
Date | | Shares | | | Redeemed
Value | | | Gain (Loss) | |
3/30/12 | | | 963,146 | | | $ | 36,596,388 | | | $ | 1,170,138 | |
Note 10–Subsequent Events
In connection with the preparation of the financial statements of the ICAP Funds as of and for the six-month period ended April 30, 2013, events and transactions subsequent to April 30, 2013, through the date the financial statements were issued have been evaluated by the ICAP Funds’ management for possible adjustment and/or disclosure. No subsequent events requiring financial statement adjustment or disclosure have been identified.
Board Consideration and Approval of Management Agreements and
Subadvisory Agreements (Unaudited)
Section 15(c) of the Investment Company Act of 1940, as amended (the “1940 Act”) requires that each mutual fund’s board of trustees, including a majority of the independent trustees, annually review and approve the fund’s investment advisory agreements. At its December 10-12, 2012 meeting, the Board of Trustees of the MainStay Group of Funds (“Board”) unanimously approved the Management Agreements with respect to the MainStay ICAP Equity Fund, MainStay ICAP Global Fund, MainStay ICAP International Fund and MainStay ICAP Select Equity Fund (“ICAP Funds”) and New York Life Investment Management LLC (“New York Life Investments”), and the Subadvisory Agreements between New York Life Investments and Institutional Capital LLC (“ICAP”) with respect to the ICAP Funds.
In reaching its decision to approve the Agreements, the Board considered information furnished by New York Life Investments and ICAP in connection with a contract review process that took place at various meetings of the Board and its Contracts Committee between September 2012 and December 2012, as well as other relevant information furnished to the Board throughout the year by New York Life Investments and ICAP. Information requested by and furnished to the Board in connection with the contract review process included, among other items, reports on the ICAP Funds prepared by Strategic Insight Mutual Fund Research and Consulting, LLC (“Strategic Insight”), an independent third-party service provider engaged by the Board to report objectively on the ICAP Funds’ investment performance, management and subadvisory fees and ordinary operating expenses. The Board also considered information provided by New York Life Investments and ICAP on the fees charged to other investment advisory clients (including institutional separate accounts) that follow investment strategies similar to the ICAP Funds, and the rationale for any differences in the ICAP Funds’ management and subadvisory fees and the fees charged to those other investment advisory clients. In addition, the Board requested and received information on the profitability of the ICAP Funds to New York Life Investments and its affiliates, including ICAP as subadvisor to the ICAP Funds, and responses from New York Life Investments and ICAP to a series of questions encompassing a variety of topics prepared on behalf of the Board by independent legal counsel to the Board and its independent trustees (the “Independent Trustees”). Information provided to the Board at its meetings throughout the year included, among other items, detailed investment performance reports on the ICAP Funds prepared by the Investment Consulting Group at New York Life Investments. The structure and format for this regular reporting was developed in consultation with the Board. The Board also received from New York Life Investments throughout the year, among other items, periodic reports on legal and compliance matters, portfolio turnover, and sales and marketing activity.
In determining to approve the Agreements, the members of the Board reviewed and evaluated all of the information and factors they believed to be relevant and appropriate in light of legal advice furnished to them by independent legal counsel and through the exercise of their own business judgment. The broad factors considered by the Board are discussed in greater detail below, and included, among other items: (i) the nature, scope and quality of the services provided to the ICAP Funds by New York Life Investments and ICAP; (ii) the investment performance of the ICAP Funds, New York Life Investments and ICAP; (iii) the costs of the services provided, and profits realized, by New York
Life Investments and ICAP from their relationship with the ICAP Funds; (iv) the extent to which economies of scale may be realized as the ICAP Funds grow, and the extent to which economies of scale may benefit ICAP Fund investors; and (v) the reasonableness of the ICAP Funds’ management and subadvisory fees and overall total ordinary operating expenses, particularly as compared to similar funds and accounts managed by New York Life Investments and ICAP and third-party “peer funds” identified by Strategic Insight.
While individual members of the Board may have weighed certain factors differently, the Board’s decision to approve the Agreements was based on a consideration of all the information provided to the Board, including information provided to the Board throughout the year and specifically in connection with the contract review process. The Board’s conclusions with respect to the Agreements also were based, in part, on the Board’s consideration of the Agreements in prior years. In addition to considering the above-referenced factors, the Board observed that in the marketplace there are a range of investment options available to shareholders of the ICAP Funds, and that the ICAP Funds’ shareholders, having had the opportunity to consider other investment options, have chosen to invest in the ICAP Funds. A more detailed discussion of the factors that figured prominently in the Board’s decisions to approve the Agreements is provided below.
Nature, Scope and Quality of Services to Be Provided by New York Life Investments and ICAP
The Board examined the nature, scope and quality of the services that New York Life Investments provides to the ICAP Funds. The Board evaluated New York Life Investments’ experience in serving as manager of the ICAP Funds, noting that New York Life Investments manages other mutual funds, serves a variety of other investment advisory clients, including other pooled investment vehicles, and has experience with overseeing mutual fund service providers, including subadvisors. The Board considered the experience of senior personnel at New York Life Investments providing management and administrative services to the ICAP Funds, as well as New York Life Investments’ reputation and financial condition. The Board also considered the full range of non-advisory services that New York Life Investments supplies to the ICAP Funds under the terms of the Management Agreements, including: (i) fund accounting services provided by New York Life Investments’ Fund Accounting and Administration Group; (ii) investment oversight and analytical services provided by New York Life Investments’ Investment Consulting Group; (iii) compliance services provided by New York Life Investments’ compliance department, including oversight and implementation of the ICAP Funds’ compliance program; and (iv) legal services provided by New York Life Investments’ Office of the General Counsel. Additional information about the non-advisory services provided by New York Life Investments is set forth in the ICAP Funds’ Management Agreements. The Board also considered New York Life Investments’ willingness to invest in personnel that benefit the ICAP Funds, and noted that New York Life Investments is responsible for compensating the ICAP Funds’ officers. The Board also considered benefits to shareholders of being part of the MainStay Group of Funds, including the privilege of exchanging investments between the same class of shares without the imposition of a sales charge, as described more fully in the ICAP Funds’ prospectus.
| | | | |
| mainstayinvestments.com | | | 91 | |
Board Consideration and Approval of Management Agreements and
Subadvisory Agreements (Unaudited) (continued)
The Board also examined the nature, scope and quality of the advisory services that ICAP provides to the ICAP Funds. The Board evaluated ICAP’s experience in serving as subadvisor to the ICAP Funds and managing other portfolios. It examined ICAP’s track record and experience in providing investment advisory services, the experience of investment advisory, senior management and administrative personnel at ICAP, and ICAP’s overall legal and compliance environment. The Board also reviewed ICAP’s willingness to invest in personnel that benefit the ICAP Funds. In this regard, the Board considered the experience of the ICAP Funds’ portfolio managers, the number of accounts managed by the portfolio managers and the method for compensating portfolio managers.
Based on these considerations, the Board concluded, within the context of its overall determinations regarding the Agreements, that the ICAP Funds should continue to benefit from the nature, scope and quality of these services as a result of New York Life Investments’ and ICAP’s experience, personnel, operations and resources.
Investment Performance
In evaluating the ICAP Funds’ investment performance, the Board considered investment performance results in light of the ICAP Funds’ investment objectives, strategies and risks, as disclosed in the ICAP Funds’ prospectus. The Board particularly considered detailed investment reports on the ICAP Funds’ performance provided to the Board throughout the year by the Investment Consulting Group of New York Life Investments. These reports include, among other items, information on the ICAP Funds’ gross and net returns, the ICAP Funds’ investment performance relative to relevant investment categories and ICAP Fund benchmarks, the ICAP Funds’ risk-adjusted investment performance, and the ICAP Funds’ investment performance as compared to similar competitor funds, as appropriate. The Board also considered information provided by Strategic Insight showing the investment performance of the ICAP Funds as compared to peer funds.
In considering the ICAP Funds’ investment performance, the Board focused principally on the ICAP Funds’ long-term performance track record. The Board also gave weight to its ongoing discussions with senior management at New York Life Investments concerning the ICAP Funds’ investment performance, as well as discussions between the ICAP Funds’ portfolio managers and the Board that occur typically on an annual basis. In addition, the Board considered any specific actions that New York Life Investments or ICAP had taken, or had agreed with the Board to take, to enhance ICAP Fund investment performance, and the results of those actions.
Based on these considerations, the Board concluded, within the context of its overall determinations regarding the Agreements, that the long-term investment performance of the ICAP Funds, along with ongoing efforts by New York Life Investments and ICAP to enhance investment returns, supported a determination to approve the Agreements. The ICAP Funds disclose more information about investment performance in the Portfolio Management Discussion and Analysis, Investment and Performance Comparison and Financial Highlights sections of this Semiannual Report and in the ICAP Funds’ prospectus.
Costs of the Services Provided, and Profits Realized, by New York Life Investments and ICAP
The Board considered the costs of the services provided by New York Life Investments and ICAP under the Agreements, and the profits realized by New York Life Investments and its affiliates, including ICAP, due to their relationships with the ICAP Funds. Because ICAP is an affiliate of New York Life Investments whose subadvisory fees are paid directly by New York Life Investments, the Board considered cost and profitability information for New York Life Investments and ICAP in the aggregate.
In evaluating the costs and profits of New York Life Investments and its affiliates, including ICAP, the Board considered, among other factors, each party’s investments in personnel, systems, equipment and other resources necessary to manage the ICAP Funds, and that New York Life Investments is responsible for paying the subadvisory fees for the ICAP Funds. The Board acknowledged that New York Life Investments and ICAP must be in a position to pay and retain experienced professional personnel to provide services to the ICAP Funds, and that the ability to maintain a strong financial position is important in order for New York Life Investments and ICAP to continue to provide high-quality services to the ICAP Funds. The Board also noted that the ICAP Funds benefit from the allocation of certain fixed costs across the MainStay Group of Funds.
In addition, the Board noted the difficulty in obtaining reliable comparative data about mutual fund managers’ profitability, since such information generally is not publicly available and may be impacted by numerous factors, including the structure of a fund manager’s organization, the types of funds it manages, the methodology used to allocate certain fixed costs to specific funds, and the manager’s capital structure and costs of capital. While recognizing the difficulty in evaluating a manager’s profitability with respect to the ICAP Funds, and noting that other profitability methodologies may also be reasonable, the Board concluded that the profitability methodology presented by New York Life Investments to the Board, which was developed by New York Life Investments in consultation with an independent consultant, was reasonable in all material respects.
In considering the costs and profitability of the ICAP Funds, the Board also considered certain fall-out benefits that may be realized by New York Life Investments and its affiliates due to their relationships with the ICAP Funds. The Board recognized, for example, the benefits to ICAP from legally permitted “soft-dollar” arrangements by which brokers provide research and other services to ICAP in exchange for commissions paid by the ICAP Funds with respect to trades on the ICAP Funds’ portfolio securities.
The Board further considered that, in addition to fees earned by New York Life Investments for managing the ICAP Funds, New York Life Investments’ affiliates also earn revenues from serving the ICAP Funds in various other capacities, including as the ICAP Funds’ transfer agent and distributor. The Board observed that information about these other revenues, and their impact on the profitability of the ICAP Funds to New York Life Investments and its affiliates, was furnished to the Board as part of the 15(c) process. The Board noted that, although it assessed the overall profitability of the ICAP Funds to New York Life Investments and its affiliates as part of the contract review process, when considering the reasonableness of the fees to be paid to New York Life
Investments and its affiliates under the Agreements, the Board considered the profitability of New York Life Investments’ relationship with the ICAP Funds on a pre-tax basis, and without regard to distribution expenses.
After evaluating the information presented to the Board, the Board concluded, within the context of its overall determinations regarding the Agreements, that any profits realized by New York Life Investments and its affiliates, including ICAP, due to their relationships with the ICAP Funds supported the Board’s decision to approve the Agreements.
Extent to Which Economies of Scale May Be Realized as the ICAP Funds Grow
The Board also considered whether the ICAP Funds’ expense structures permitted economies of scale to be shared with ICAP Fund investors. The Board reviewed information from New York Life Investments showing how the ICAP Funds’ management fee schedules compared to fee schedules of other funds and accounts managed by New York Life Investments. The Board also reviewed information from Strategic Insight showing how the ICAP Funds’ management fee schedules hypothetically would compare with fees paid for similar services by peer funds at varying asset levels. While recognizing the difficulty of determining economies of scale with precision, the Board acknowledged that economies of scale may be shared with the ICAP Funds in a number of ways, including, for example, through the imposition of management fee breakpoints and by initially setting relatively lower management fees.
Based on this information, the Board concluded, within the context of its overall determinations regarding the Agreements, that the ICAP Funds’ expense structures appropriately reflect economies of scale for the benefit of ICAP Fund investors. The Board noted, however, that it would continue to evaluate the reasonableness of the ICAP Funds’ expense structures as the ICAP Funds grow over time.
Management and Subadvisory Fees and Total Ordinary Operating Expenses
The Board evaluated the reasonableness of the fees to be paid under the Agreements and the ICAP Funds’ expected total ordinary operating expenses. The Board primarily considered the reasonableness of the management fee paid by the ICAP Funds to New York Life Investments, since the fees paid to ICAP are paid by New York Life Investments, not the ICAP Funds.
In assessing the reasonableness of the ICAP Funds’ fees and expenses, the Board primarily considered comparative data provided by Strategic Insight on the fees and expenses charged by similar mutual funds managed by other investment advisers. In addition, the Board considered information provided by New York Life Investments and ICAP on fees charged to other investment advisory clients, including institutional separate accounts and other funds with similar investment objectives as the ICAP Funds. The Board particularly considered differences in the contractual management fee schedules of the retail MainStay Funds and similarly-managed MainStay VP Portfolios, taking into account New York Life Investments’ rationale for any differences in fee schedules. The Board also took into account explanations provided by New York Life Investments about the different scope of services provided to mutual funds as compared with other investment advisory clients. Additionally,
the Board considered the impact of any expense limitation arrangements on the ICAP Funds’ net management fees and expenses.
The Board noted that, outside of the ICAP Funds’ management fees and the fees charged under a share class’s Rule 12b-1 and/or shareholder services plans, a share class’s most significant “other expenses” are transfer agent fees. Transfer agent fees are charged to the ICAP Funds based on the number of shareholder accounts (a “per-account” fee) as compared with certain other fees (e.g., management fees), which are charged based on the ICAP Funds’ average net assets. The Board took into account information from New York Life Investments showing that the ICAP Funds’ transfer agent fee schedule is reasonable, including industry data showing that the per-account fees that NYLIM Service Company LLC, the ICAP Funds’ transfer agent, charges the ICAP Funds are within the range of per-account fees charged by transfer agents to other mutual funds. In addition, the Board considered NYLIM Service Company LLC’s profitability in connection with the transfer agent services it provides to the ICAP Funds.
The Board acknowledged that, because the ICAP Funds’ transfer agent fees are billed on a per-account basis, the impact of transfer agent fees on a share class’s expense ratio may be more significant in cases where the share class has a high number of accounts with limited assets (i.e., small accounts). The Board observed that transfer agent fees are a significant portion of total expenses of many Funds in the MainStay Group of Funds. The impact of transfer agent fees on the expense ratios of these MainStay Funds tend to be greater than for other open-end retail funds, because the MainStay Group of Funds generally has a significant number of small accounts relative to competitor funds. The Board acknowledged the role that the MainStay Group of Funds historically has played in serving the investment needs of New York Life Insurance Company (“New York Life”) policyholders, who often maintain smaller account balances than other fund investors. The Board discussed measures that it and New York Life Investments have taken in recent years to mitigate the effect of small accounts on the expense ratios of Fund share classes, including: (i) encouraging New York Life agents to consolidate multiple small accounts held by the same investor into one MainStay Asset Allocation Fund account; (ii) increasing investment minimums from $500 to $1,000 in 2003; (iii) introducing Investor Class shares for certain MainStay Funds in early 2008 to consolidate smaller account investors; (iv) closing small accounts with balances below $250 in Investor Class shares or $750 in all other classes of shares; (v) no longer allowing an exception with no minimum investment amount with respect to AutoInvest accounts with subsequent monthly purchases of $100; (vi) since 2007, charging an annual $20.00 small account fee on certain accounts with balances below $1,000; and (vii) modifying the approach for billing transfer agent expenses to reduce the degree of subsidization by large accounts of smaller accounts. In addition, the Board acknowledged New York Life Investments’ efforts to encourage intermediaries to consolidate small accounts in multiple Funds held by the same investor into a single Asset Allocation Fund account, if appropriate under the circumstances, in an effort to mitigate the effect of small accounts on the Funds in the MainStay Group of Funds.
After considering all of the factors outlined above, the Board concluded that the ICAP Funds’ management and subadvisory fees and total ordinary operating expenses were within a range that is competitive and,
| | | | |
| mainstayinvestments.com | | | 93 | |
Board Consideration and Approval of Management Agreements and
Subadvisory Agreements (Unaudited) (continued)
within the context of the Board’s overall conclusions regarding the Agreements, support a conclusion that these fees and expenses are reasonable.
Conclusion
On the basis of the information provided to it and its evaluation thereof, the Board, including the Independent Trustees, unanimously voted to approve the Agreements.
Proxy Voting Policies and Procedures and Proxy Voting Record
A description of the policies and procedures that New York Life Investments uses to vote proxies related to the ICAP Funds’ securities is available without charge, upon request, (i) by visiting the MainStay Funds’ website at mainstayinvestments.com; and (ii) on the SEC’s website at www.sec.gov.
The ICAP Funds are required to file with the SEC their proxy voting records for each ICAP Fund for the 12-month period ending June 30 on Form N-PX. The most recent Form N-PX or relevant ICAP Fund proxy voting record is available free of charge upon request by calling 800-MAINSTAY (624-6782); visiting the MainStay Funds’ website at mainstayinvestments.com; or on the SEC’s website at www.sec.gov.
Shareholder Reports and Quarterly Portfolio Disclosure
Each ICAP Fund is required to file its complete schedule of portfolio holdings with the SEC for its first and third fiscal quarters on Form N-Q. Each ICAP Fund’s Form N-Q is available without charge, on the SEC’s website at www.sec.gov or by calling MainStay Investments at 800-MAINSTAY (624-6782). You also can obtain and review copies of Form N-Q by visiting the SEC’s Public Reference Room in Washington, DC (information on the operation of the Public Reference Room may be obtained by calling 1-800-SEC-0330).
| | | | |
| mainstayinvestments.com | | | 95 | |
This page intentionally left blank
This page intentionally left blank
This page intentionally left blank
MainStay Funds
MainStay offers a wide range of Funds for virtually any investment need. The full array of MainStay open-end offerings is listed here, with information about the manager, subadvisors, legal counsel and independent registered public accounting firms.
Equity
U.S. Equity Funds
MainStay Common Stock Fund
MainStay Cornerstone Growth Fund
MainStay Epoch U.S. All Cap Fund
MainStay Epoch U.S. Equity Yield Fund
MainStay ICAP Equity Fund
MainStay ICAP Select Equity Fund
MainStay Large Cap Growth Fund1
MainStay MAP Fund
MainStay S&P 500 Index Fund
MainStay U.S. Equity Opportunities Fund
MainStay U.S. Small Cap Fund
International/Global Equity Funds
MainStay Epoch Global Choice Fund
MainStay Epoch Global Equity Yield Fund
MainStay Epoch International Small Cap Fund
MainStay ICAP Global Fund
MainStay ICAP International Fund
MainStay International Equity Fund
MainStay International Opportunities Fund
Income
Taxable Bond Funds
MainStay Floating Rate Fund
MainStay Global High Income Fund
MainStay Government Fund
MainStay High Yield Corporate Bond Fund
MainStay High Yield Opportunities Fund
MainStay Indexed Bond Fund
MainStay Intermediate Term Bond Fund
MainStay Short Duration High Yield Fund
MainStay Short Term Bond Fund
MainStay Unconstrained Bond Fund
Municipal Bond Funds
MainStay California Tax Free Opportunities Fund2
MainStay High Yield Municipal Bond Fund
MainStay New York Tax Free Opportunities Fund3
MainStay Tax Free Bond Fund
Money Market Fund
MainStay Money Market Fund
Mixed Asset
MainStay Balanced Fund
MainStay Convertible Fund
MainStay Income Builder Fund
MainStay Marketfield Fund
Asset Allocation/Target Date
MainStay Conservative Allocation Fund
MainStay Growth Allocation Fund
MainStay Moderate Allocation Fund
MainStay Moderate Growth Allocation Fund
MainStay Retirement 2010 Fund
MainStay Retirement 2020 Fund
MainStay Retirement 2030 Fund
MainStay Retirement 2040 Fund
MainStay Retirement 2050 Fund
Manager
New York Life Investment Management LLC
New York, New York
Subadvisors
Cornerstone Capital Management Holdings LLC4
New York, New York
Cornerstone Capital Management LLC4
Bloomington, Minnesota
Epoch Investment Partners, Inc.
New York, New York
Institutional Capital LLC4
Chicago, Illinois
MacKay Shields LLC4
New York, New York
Marketfield Asset Management LLC
New York, New York
Markston International LLC
White Plains, New York
Winslow Capital Management LLC
Minneapolis, Minnesota
Legal Counsel
Dechert LLP
Independent Registered Public Accounting Firms
KPMG LLP
PricewaterhouseCoopers LLP
1. Effective January 13, 2012, the Fund was closed to new investors with certain exceptions.
2. This Fund is only registered for sale in AZ, CA, NV, OR, UT, and WA.
3. This Fund is only registered for sale in CT, DE, FL, MA, NJ, NY, and VT.
4. An affiliate of New York Life Investment Management LLC.
Not part of the Semiannual Report
For more information
800-MAINSTAY (624-6782)
mainstayinvestments.com
The MainStay Funds® are managed by New York Life Investment Management LLC and distributed through NYLIFE Distributors LLC, 169 Lackawanna Avenue, Parsippany, NJ 07054, a wholly owned subsidiary of New York Life Insurance Company. NYLIFE Distributors LLC is a Member FINRA/SIPC.
MainStay Investments® is a registered service mark and name under which New York Life Investment Management LLC does business. MainStay Investments, an indirect subsidiary of New York Life Insurance Company, New York, NY 10010, provides investment advisory products and services.
This report may be distributed only when preceded or accompanied by a current Fund prospectus.
©2013 NYLIFE Distributors LLC. All rights reserved.
| | | | | | | | |
| Not FDIC/NCUA Insured | | Not a Deposit | | May Lose Value | | No Bank Guarantee | | Not Insured by Any Government Agency |
| | |
| NYLIM-30026 MS175-13 | | MSIC10-06/13 NL0E1 |
MainStay Epoch U.S. All Cap Fund
Message from the President and Semiannual Report
Unaudited | April 30, 2013


This page intentionally left blank
Message from the President
The U.S. stock market advanced during the six months ended April 30, 2013, generally providing double-digit returns at all capitalization levels. Value stocks tended to outpace growth stocks among large- and mid-capitalization companies, while growth stocks tended to outpace value stocks among smaller companies.
The market’s advance, however, was far from uniform. Stocks declined in early November, both before and immediately after the U.S. presidential election. Following a sharp recovery, stocks climbed until mid-December, when a Congressional stalemate on the fiscal cliff led to a brief decline. Another dip occurred in late February as investors speculated that the Federal Open Market Committee (FOMC) might stop purchasing mortgage-backed securities sooner than expected. Stocks also dipped in mid-April, as consumer sentiment dropped after the Boston marathon bombing. Despite these setbacks, U.S. stocks continued to trend upward during the six-month reporting period.
International stock markets also advanced, with several regional differences. Accommodative action by the Bank of Japan helped lower the yen and lift Japanese stocks to their highest levels since 2008. In Europe, stocks did well until early February, bolstered by the promise of support for the euro. As the year progressed, however, economic contraction, rising unemployment and systematic banking concerns took a toll on investor enthusiasm. In China, manufacturing slowed as the nation sought to balance growth and inflation risks. On the Korean peninsula, tensions rose as North Korea continued to threaten its neighbors, which added an undercurrent of caution to the market.
During the six months ended April 30, 2013, the FOMC kept the federal funds rate in a range close to zero. The FOMC also continued its direct purchases of mortgage-backed securities and longer-term U.S. government securities. With short-term interest rates likely to remain at low levels, many bond investors pursued higher yields by lengthening maturities and assuming greater risk. As a result, bonds with higher risk profiles tended
to outperform higher-quality investment-grade bonds and U.S. Treasury securities. Cash and cash equivalents essentially returned zero.
With wide variations in the performance of various asset classes, some investors might be tempted to chase higher returns by shifting back and forth between stocks and bonds. Since no one can predict where the market will move next, however, we encourage investors to select an appropriate mix of investments for their risk tolerance and time horizon and to stick with that mix, making only minor adjustments over time.
At MainStay Funds, our portfolio managers use a similar approach. Careful security selection and thoughtful sell disciplines help them pursue the investment objectives of their respective Funds. Using the principal investment strategies outlined in the Prospectus, they focus primarily on providing long-term investment potential for our shareholders.
Has this approach proved successful? In its most recent rankings, Barron’s listed MainStay Funds as the #1 fund family over the past 10 years. We were also the only mutual fund family that has appeared in Barron’s top six for the past five consecutive years.
The pages that follow provide additional insight into the specific market events, investment decisions and securities that shaped your MainStay Fund(s) during the six months ended April 30, 2013. We encourage you to read the semiannual report(s) carefully and to evaluate your results with your long-term financial goals in mind.
Sincerely,

Stephen P. Fisher
President
The opinions expressed are as of the date of this report and are subject to change. There is no guarantee that any forecast made will come to pass. This material does not constitute investment advice and is not intended as an endorsement of any specific investment.
To qualify for the Lipper/Barron’s Fund Survey, a fund family must have at least three funds in Lipper’s general U.S.-stock category, one in world equity (which combines global and international funds), one mixed-equity fund (which holds stocks and bonds), two taxable-bond funds, and one tax-exempt fund. Fund loads and 12b-1 fees aren’t included in the calculation of returns because the aim is to measure the manager’s skill. Each fund’s return is measured against all funds in its Lipper category, resulting in a percentile ranking which is then weighted by asset size relative to the fund family’s other assets in its general classifications. Finally, the score is multiplied by the general classification weightings as determined by the entire Lipper universe of funds.
Source: Barron’s, 2/9/13. Overall, MainStay Funds ranked number 56 for the one-year period, 20 for the five-year period and one for the 10-year period ended December 31, 2012, out of 62, 53 and 46 fund families, respectively. MainStay ranked number three for the 10-year period in 2009, 2010 and 2011 from among 48, 46 and 45 fund families, respectively. MainStay ranked number six from among 48 fund families for the 10-year period in 2008. Past performance is no guarantee of future results, which will vary. For the most recent MainStay Funds performance, please visit our website at mainstayinvestments.com. All mutual funds are subject to market risk and will fluctuate in value.
Not part of the Semiannual Report
Table of Contents
Investors should refer to the Fund’s Summary Prospectus and/or Prospectus and consider the Fund’s investment objectives, strategies, risks, charges and expenses carefully before investing. The Summary Prospectus and/or Prospectus contain this and other information about the Fund. You may obtain copies of the Fund’s Summary Prospectus, Prospectus and Statement of Additional Information free of charge, upon request, by calling toll-free 800-MAINSTAY (624-6782), by writing to NYLIFE Distributors LLC, Attn: MainStay Marketing Department, 169 Lackawanna Avenue, Parsippany, New Jersey 07054 or by sending an e-mail to MainStayShareholderServices@nylim.com. These documents are also available via the MainStay Funds’ website at mainstayinvestments.com/documents. Please read the Summary Prospectus and/or Prospectus carefully before investing.
Investment and Performance Comparison1 (Unaudited)
Performance data quoted represents past performance. Past performance is no guarantee of future results. Because of market volatility, current performance may be lower or higher than the figures shown. Investment return and principal value will fluctuate, and as a result, when shares are redeemed, they may be worth more or less than their original cost. The graph below depicts the historical performance of Class I shares of the Fund. Performance will vary from class to class based on differences in class-specific expenses and sales charges. For performance information current to the most recent month-end, please call 800-MAINSTAY (624-6782) or visit mainstayinvestments.com.
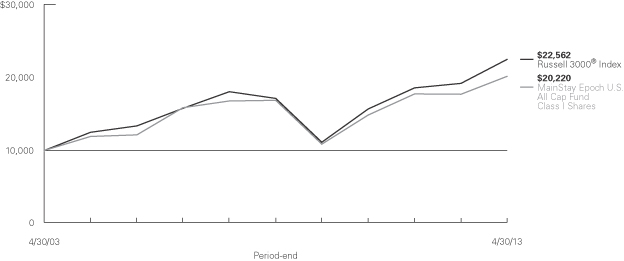
Average Annual Total Returns for the Period Ended April 30, 2013
| | | | | | | | | | | | | | | | | | | | | | | | |
| Class | | Sales Charge | | | | Six Months | | | One Year | | | Five Years | | | Ten Years | | | Gross
Expense
Ratio2 | |
| Investor Class Shares3 | | Maximum 5.5% Initial Sales Charge | | With sales charges Excluding sales charges | |
| 8.47
14.78 | %
| |
| 6.97
13.20 | %
| |
| 1.74
2.90 | %
| |
| 6.04
6.64 | %
| |
| 1.58
1.58 | %
|
| Class A Shares4 | | Maximum 5.5% Initial Sales Charge | | With sales charges Excluding sales charges | |
| 8.71
15.04 |
| |
| 7.51
13.77 |
| |
| 2.21
3.37 |
| |
| 6.28
6.88 |
| |
| 1.14
1.14 |
|
| Class B Shares4 | | Maximum 5% CDSC if Redeemed Within the First
Six Years of Purchase | | With sales charges Excluding sales charges | |
| 9.36
14.36 |
| |
| 7.42
12.36 |
| |
| 1.78
2.13 |
| |
| 5.84
5.84 |
| |
| 2.33
2.33 |
|
| Class C Shares4 | | Maximum 1% CDSC if Redeemed Within One Year of Purchase | | With sales charges Excluding sales charges | |
| 13.35
14.35 |
| |
| 11.36
12.34 |
| |
| 2.12
2.12 |
| |
| 5.85
5.85 |
| |
| 2.33
2.33 |
|
| Class I Shares | | No Sales Charge | | | | | 15.18 | | | | 13.98 | | | | 3.63 | | | | 7.29 | | | | 0.89 | |
| 1. | The performance table and graph do not reflect the deduction of taxes that a shareholder would pay on distributions or Fund share redemptions. Total returns reflect maximum applicable sales charges as indicated in the table above, changes in share price, and reinvestment of dividend and capital gain distributions. The graph assumes the initial investment amount shown above and reflects the deduction of all sales charges that would have applied for the period of investment. Performance figures reflect certain fee waivers and/or expense limitations, without which total returns may have been lower. For more information on share classes and current fee waivers and/or expense limitations, please refer to the notes to the financial statements. |
| 2. | The gross expense ratios presented reflect the Fund’s “Total Annual Fund Operating Expenses” from the most recent Prospectus and may differ from other expense ratios disclosed in this report. |
| 3. | Performance figures for Investor Class shares, first offered on February 28, 2008, include the historical performance of Class A shares through February 27, 2008, adjusted for differences in certain expenses and fees. Unadjusted, the performance shown for Investor Class shares would likely have been different. |
| 4. | Performance figures for Class A, B and C shares, first offered on January 2, 2004, include the historical performance of Class I shares through January 1, 2004, adjusted for differences in certain expenses and fees. Unadjusted, the performance shown for Class A, B and C shares would likely have been different. |
The footnotes on the next page are an integral part of the table and graph and should be carefully read in conjunction with them.
| | | | |
| mainstayinvestments.com | | | 5 | |
| | | | | | | | | | | | | | | | |
| Benchmark Performance | | Six
Months | | | One
Year | | | Five
Years | | | Ten
Years | |
Russell 3000® Index5 | | | 15.16 | % | | | 17.21 | % | | | 5.63 | % | | | 8.48 | % |
Average Lipper Multi-Cap Core Fund6 | | | 14.99 | | | | 15.56 | | | | 4.46 | | | | 8.17 | |
| 5. | The Russell 3000® Index measures the performance of the largest 3,000 U.S. companies representing approximately 98% of the investable U.S. equity market. The Russell 3000® Index is the Fund’s broad-based securities market index for comparison purposes. Total returns assume reinvestment of all dividends and capital gains. An investment cannot be made directly in an index. |
| 6. | The average Lipper multi-cap core fund is representative of funds that, by portfolio practice, invest in a variety of market-capitalization ranges without |
| | concentrating 75% of their equity assets in any one market-capitalization range over an extended period of time. Multi-cap core funds typically have an average price-to-earnings ratio, price-to-book ratio, and three-year sales-per-share growth value, compared to the S&P SuperComposite 1500 Index. This benchmark is a product of Lipper Inc. Lipper Inc. is an independent monitor of fund performance. Results are based on average total returns of similar funds with all dividend and capital gain distributions reinvested. |
The footnotes on the preceding page are an integral part of the table and graph and should be carefully read in conjunction with them.
| | |
| 6 | | MainStay Epoch U.S. All Cap Fund |
Cost in Dollars of a $1,000 Investment in MainStay Epoch U.S. All Cap Fund (Unaudited)
The example below is intended to describe the fees and expenses borne by shareholders during the six-month period from November 1, 2012, to April 30, 2013, and the impact of those costs on your investment.
Example
As a shareholder of the Fund, you incur two types of costs: (1) transaction costs, including exchange fees and sales charges (loads) on purchases (as applicable), and (2) ongoing costs, including management fees, distribution and/or service (12b-1) fees, and other Fund expenses (as applicable). This example is intended to help you understand your ongoing costs (in dollars) of investing in the Fund and to compare these costs with the ongoing costs of investing in other mutual funds. The example is based on an investment of $1,000 made at the beginning of the six-month period and held for the entire period from November 1, 2012, to April 30, 2013.
This example illustrates your Fund’s ongoing costs in two ways:
Actual Expenses
The second and third data columns in the table below provide information about actual account values and actual expenses. You may use the information in these columns, together with the amount you invested, to estimate the expenses that you paid during the six months ended April 30, 2013. Simply divide your account value by $1,000 (for example, an $8,600 account value divided by $1,000 = 8.6), then
multiply the result by the number under the heading entitled “Expenses Paid During Period” to estimate the expenses you paid on your account during this period.
Hypothetical Example for Comparison Purposes
The fourth and fifth data columns in the table below provide information about hypothetical account values and hypothetical expenses based on the Fund’s actual expense ratio and an assumed rate of return of 5% per year before expenses, which is not the Fund’s actual return. The hypothetical account values and expenses may not be used to estimate the actual ending account balances or expenses you paid for the six-month period shown. You may use this information to compare the ongoing costs of investing in the Fund with the ongoing costs of investing in other Funds. To do so, compare this 5% hypothetical example with the 5% hypothetical examples that appear in the shareholder reports of the other Funds.
Please note that the expenses shown in the table are meant to highlight your ongoing costs only and do not reflect any transactional costs, such as exchange fees or sales charges (loads). Therefore, the fourth and fifth data columns of the table are useful in comparing ongoing costs only and will not help you determine the relative total costs of owning different funds. In addition, if these transactional costs were included, your costs would have been higher.
| | | | | | | | | | | | | | | | | | | | |
| | | | | | | | | | | | | | | | |
| Share Class | | Beginning
Account
Value
11/1/12 | | | Ending Account
Value (Based
on Actual
Returns and
Expenses)
4/30/13 | | | Expenses
Paid
During
Period1 | | | Ending Account
Value (Based
on Hypothetical
5% Annualized
Return and
Actual Expenses)
4/30/13 | | | Expenses
Paid
During
Period1 | |
| | | | | |
| Investor Class Shares | | $ | 1,000.00 | | | $ | 1,147.80 | | | $ | 8.47 | | | $ | 1,016.90 | | | $ | 7.95 | |
| | | | | |
| Class A Shares | | $ | 1,000.00 | | | $ | 1,150.40 | | | $ | 6.18 | | | $ | 1,019.00 | | | $ | 5.81 | |
| | | | | |
| Class B Shares | | $ | 1,000.00 | | | $ | 1,143.60 | | | $ | 12.44 | | | $ | 1,013.20 | | | $ | 11.68 | |
| | | | | |
| Class C Shares | | $ | 1,000.00 | | | $ | 1,143.50 | | | $ | 12.44 | | | $ | 1,013.20 | | | $ | 11.68 | |
| | | | | |
| Class I Shares | | $ | 1,000.00 | | | $ | 1,151.80 | | | $ | 4.86 | | | $ | 1,020.30 | | | $ | 4.56 | |
| 1. | Expenses are equal to the Fund’s annualized expense ratio of each class (1.59% for Investor Class, 1.16% for Class A, 2.34% for Class B and Class C and 0.91% for Class I) multiplied by the average account value over the period, divided by 365 and multiplied by 181 (to reflect the six-month period). The table above represents the actual expenses incurred during the six-month period. |
| | | | |
| mainstayinvestments.com | | | 7 | |
Industry Composition as of April 30, 2013 (Unaudited)
| | | | |
| Health Care Providers & Services | | | 6.7 | % |
| Software | | | 6.3 | |
| Oil, Gas & Consumable Fuels | | | 5.4 | |
| Chemicals | | | 5.1 | |
| Aerospace & Defense | | | 4.7 | |
| Media | | | 4.3 | |
| Hotels, Restaurants & Leisure | | | 4.2 | |
| Machinery | | | 4.1 | |
| Pharmaceuticals | | | 3.7 | |
| IT Services | | | 3.6 | |
| Consumer Finance | | | 3.4 | |
| Capital Markets | | | 3.1 | |
| Food Products | | | 3.1 | |
| Specialty Retail | | | 3.0 | |
| Computers & Peripherals | | | 2.9 | |
| Multi-Utilities | | | 2.7 | |
| Diversified Financial Services | | | 2.6 | |
| Insurance | | | 2.5 | |
| | | | |
| Auto Components | | | 2.1 | % |
| Diversified Telecommunication Services | | | 2.1 | |
| Food & Staples Retailing | | | 2.1 | |
| Semiconductors & Semiconductor Equipment | | | 2.0 | |
| Beverages | | | 1.9 | |
| Distributors | | | 1.9 | |
| Building Products | | | 1.7 | |
| Energy Equipment & Services | | | 1.7 | |
| Life Sciences Tools & Services | | | 1.7 | |
| Containers & Packaging | | | 1.6 | |
| Multiline Retail | | | 1.6 | |
| Commercial Banks | | | 1.5 | |
| Health Care Equipment & Supplies | | | 1.4 | |
| Commercial Services & Supplies | | | 1.3 | |
| Short-Term Investment | | | 3.4 | |
| Other Assets, Less Liabilities | | | 0.6 | |
| | | | |
| | | 100.0 | % |
| | | | |
See Portfolio of Investments beginning on page 11 for specific holdings within these categories.
Top Ten Holdings as of April 30, 2013 (excluding short-term investment)
| 9. | UnitedHealth Group, Inc. |
| | |
| 8 | | MainStay Epoch U.S. All Cap Fund |
Portfolio Management Discussion and Analysis (Unaudited)
Questions answered by portfolio managers David Pearl, Michael Welhoelter, CFA, and William Priest, CFA, of Epoch Investment Partners, Inc., the Fund’s Subadvisor.
How did MainStay Epoch U.S. All Cap Fund perform relative to its peers and its benchmark during the six months ended April 30, 2013?
Excluding all sales charges, MainStay Epoch U.S. All Cap Fund returned 14.78% for Investor Class shares, 15.04% for Class A shares, 14.36% for Class B shares and 14.35% for Class C shares for the six months ended April 30, 2013. Over the same period, Class I shares returned 15.18%. Investor Class, Class B and Class C shares underperformed—and Class A and Class I shares outperformed—the 14.99% return of the average Lipper1 multi-cap core fund for the same period. Class I shares outperformed—and all other share classes underperformed—the 15.16% return of the Russell 3000® Index2 for the six months ended April 30, 2013. The Russell 3000® Index is the Fund’s broad-based securities-market index. See page 5 for Fund returns with applicable sales charges.
What factors affected the Fund’s relative performance during the reporting period?
Stock selection was strong during the reporting period, with the largest positive contributions coming from the industrials and materials sectors. (Contributions take weightings and total returns into account.) Stock selection in the energy sector was the greatest detractor.
During the reporting period, which sectors were the strongest positive contributors to the Fund’s relative performance and which sectors were particularly weak?
Favorable stock selection made industrials and materials the Fund’s strongest positively contributing sectors relative to the Russell 3000® Index during the reporting period. Overweight positions in the consumer discretionary and health care sectors also contributed positively during the reporting period.
Stock selection in the energy sector was the biggest detractor from performance relative to the Russell 3000® Index. Poor stock selection in telecommunication services also hurt the Fund’s relative results. The Fund’s residual cash position also detracted from relative performance in a rising equity market.
During the reporting period, which individual stocks made the strongest positive contributions to the Fund’s absolute performance and which stocks detracted the most?
The individual stocks that made the strongest positive contributions to the Fund’s absolute performance were media and entertainment company Time Warner, aerospace company Boeing and asset manager BlackRock. Time Warner managed
to increase its bottom line by 4% on a year-over-year basis. Boeing advanced as the glitch in its new 787 commercial aircraft’s battery system was deemed to be resolved. BlackRock, the world’s largest asset manager, saw strong inflows into its exchange-traded fund (ETF) business during the reporting period.
The most substantial detractors from absolute performance during the reporting period were consumer electronics and entertainment company Apple, department store operator Kohl’s and oilfield equipment manufacturer National Oilwell Varco. Shares of Apple fell as investors focused on slowing profit growth, even though the company reported its strongest quarterly results ever. Kohl’s suffered when the company lowered guidance for the first quarter of 2013, citing problems with proper pricing, high inventory and ineffective marketing strategies. National Oilwell Varco, which provides equipment and components for oil and gas drilling worldwide, beat expectations on revenues and earnings per share for the fourth quarter of 2012, but the company warned of short-term headwinds in 2013, putting negative pressure on the stock price.
Did the Fund make any significant purchases or sales during the reporting period?
The Fund initiated several new holdings during the reporting period, including a position in agricultural equipment maker AGCO. The company has a strong position in Europe, Africa, the Middle East and South America. AGCO is benefiting from a number of secular tailwinds because of growing protein consumption in the emerging markets and what we believe is a long-term trend toward farm consolidation in all markets, which ultimately requires larger equipment. The company is well positioned and attractively valued and has a history of prudent capital allocation. The Fund also purchased shares of retail pharmacy CVS Caremark during the reporting period. CVS Caremark has been a substantial beneficiary of the contract dispute between Walgreens and Express Scripts.
The Fund sold its position in agricultural and construction giant Deere & Co., as the stock met its target price after a period of strong performance. MetLife, which provides insurance, annuities and employee benefit programs throughout the world, was also among the positions the Fund eliminated during the reporting period. We feel that the company’s free cash flow will come under pressure as low rates and ongoing regulatory uncertainty continue. The Fund also sold its position in computer maker Dell, as we became disappointed with management’s stated intentions not to accelerate stock buybacks or other shareholder-friendly measures.
| 1. | See footnote on page 6 for more information on Lipper Inc. |
| 2. | See footnote on page 6 for more information on the Russell 3000® Index. |
| | | | |
| mainstayinvestments.com | | | 9 | |
How did the Fund’s sector weightings change during the reporting period?
Changes in sector weightings relative to the Russell 3000® Index were minimal during the reporting period. We increased the Fund’s exposure to the industrials sector, moving from a slight underweight position to an overweight position relative to the Index. We also increased the Fund’s consumer staples exposure, although the position remained significantly underweight relative to the Index. We trimmed the Fund’s energy-sector exposure, which remained underweight relative to the Index. We also decreased the Fund’s exposure to the health care sector but maintained an overweight position relative to the Index.
How was the Fund positioned at the end of April 2013?
All sector weights are arrived at through stock selection rather than top-down decisions on the attractiveness of specific sectors. As of April 30, 2013, the Fund’s most significant deviation
from the Russell 3000® Index was an overweight position in the consumer discretionary sector, where a number of holdings experienced increased revenue as aggregate consumer spending increased. The Fund was also overweight relative to the Russell 3000® Index in the health care sector, where many companies continued to benefit from an increase in plan participation rates. As of April 30, 2013, the Fund’s most significantly underweight position relative to the Russell 3000® Index was in the financials sector. The Fund also had underweight positions relative to the Index in the consumer staples, energy and information technology sectors.
We remain committed to investing in high-quality, cash- generating businesses with sound capital allocation policies. In an environment where economic growth is slower than in past cycles, this is where we see opportunity, even if the market pauses in the near term after a period of outsized returns.
The opinions expressed are those of the portfolio managers as of the date of this report and are subject to change. There is no guarantee that any forecast made will come to pass. This material does not constitute investment advice and is not intended as an endorsement of any specific investment.
| | |
| 10 | | MainStay Epoch U.S. All Cap Fund |
Portfolio of Investments April 30, 2013 (Unaudited)
| | | | | | | | |
| | |
Shares | | | Value | |
| | | | | | | | |
| Common Stocks 96.0%† | |
Aerospace & Defense 4.7% | |
¨Boeing Co. (The) | | | 142,120 | | | $ | 12,991,189 | |
Rockwell Collins, Inc. | | | 96,610 | | | | 6,078,701 | |
United Technologies Corp. | | | 52,000 | | | | 4,747,080 | |
| | | | | | | | |
| | | | | | | 23,816,970 | |
| | | | | | | | |
Auto Components 2.1% | |
Dana Holding Corp. | | | 295,080 | | | | 5,090,130 | |
Visteon Corp. (a) | | | 96,610 | | | | 5,679,702 | |
| | | | | | | | |
| | | | | | | 10,769,832 | |
| | | | | | | | |
Beverages 1.9% | |
PepsiCo., Inc. | | | 116,850 | | | | 9,636,619 | |
| | | | | | | | |
|
Building Products 1.7% | |
Masco Corp. | | | 449,270 | | | | 8,733,809 | |
| | | | | | | | |
| | |
Capital Markets 3.1% | | | | | | | | |
Ameriprise Financial, Inc. | | | 85,060 | | | | 6,339,522 | |
BlackRock, Inc. | | | 34,870 | | | | 9,292,855 | |
| | | | | | | | |
| | | | | | | 15,632,377 | |
| | | | | | | | |
Chemicals 5.1% | |
E.I. du Pont de Nemours & Co. | | | 150,920 | | | | 8,226,649 | |
Ecolab, Inc. | | | 80,562 | | | | 6,817,157 | |
¨Praxair, Inc. | | | 97,100 | | | | 11,098,530 | |
| | | | | | | | |
| | | | | | | 26,142,336 | |
| | | | | | | | |
Commercial Banks 1.5% | |
CIT Group, Inc. (a) | | | 183,660 | | | | 7,807,387 | |
| | | | | | | | |
|
Commercial Services & Supplies 1.3% | |
Waste Connections, Inc. | | | 175,190 | | | | 6,648,461 | |
| | | | | | | | |
|
Computers & Peripherals 2.9% | |
¨Apple, Inc. | | | 33,314 | | | | 14,749,773 | |
| | | | | | | | |
|
Consumer Finance 3.4% | |
American Express Co. | | | 147,407 | | | | 10,084,113 | |
Capital One Financial Corp. | | | 122,834 | | | | 7,097,348 | |
| | | | | | | | |
| | | | | | | 17,181,461 | |
| | | | | | | | |
Containers & Packaging 1.6% | |
Rock-Tenn Co. Class A | | | 80,730 | | | | 8,084,302 | |
| | | | | | | | |
|
Distributors 1.9% | |
Genuine Parts Co. | | | 126,250 | | | | 9,636,662 | |
| | | | | | | | |
| | | | | | | | |
| | |
Shares | | | Value | |
| | | | | | | | |
Diversified Financial Services 2.6% | |
Citigroup, Inc. | | | 107,680 | | | $ | 5,024,349 | |
CME Group, Inc. | | | 130,545 | | | | 7,944,968 | |
| | | | | | | | |
| | | | | | | 12,969,317 | |
| | | | | | | | |
Diversified Telecommunication Services 2.1% | |
¨CenturyLink, Inc. | | | 289,830 | | | | 10,888,913 | |
| | | | | | | | |
|
Energy Equipment & Services 1.7% | |
National Oilwell Varco, Inc. | | | 129,785 | | | | 8,464,578 | |
| | | | | | | | |
|
Food & Staples Retailing 2.1% | |
¨CVS Caremark Corp. | | | 180,400 | | | | 10,495,672 | |
| | | | | | | | |
|
Food Products 3.1% | |
Ingredion, Inc. | | | 139,167 | | | | 10,021,416 | |
J.M. Smucker Co. (The) | | | 55,866 | | | | 5,767,047 | |
| | | | | | | | |
| | | | | | | 15,788,463 | |
| | | | | | | | |
Health Care Equipment & Supplies 1.4% | |
Abbott Laboratories | | | 193,550 | | | | 7,145,866 | |
| | | | | | | | |
|
Health Care Providers & Services 6.7% | |
Aetna, Inc. | | | 161,900 | | | | 9,299,536 | |
DaVita HealthCare Partners, Inc. (a) | | | 78,240 | | | | 9,283,176 | |
Laboratory Corporation of America Holdings (a) | | | 53,403 | | | | 4,985,704 | |
¨UnitedHealth Group, Inc. | | | 179,800 | | | | 10,775,414 | |
| | | | | | | | |
| | | | | | | 34,343,830 | |
| | | | | | | | |
Hotels, Restaurants & Leisure 4.2% | |
International Game Technology | | | 499,270 | | | | 8,462,626 | |
Life Time Fitness, Inc. (a) | | | 120,710 | | | | 5,574,388 | |
McDonald’s Corp. | | | 73,740 | | | | 7,531,804 | |
| | | | | | | | |
| | | | | | | 21,568,818 | |
| | | | | | | | |
Insurance 2.5% | |
American International Group, Inc. (a) | | | 126,250 | | | | 5,229,275 | |
Marsh & McLennan Cos., Inc. | | | 194,290 | | | | 7,384,963 | |
| | | | | | | | |
| | | | | | | 12,614,238 | |
| | | | | | | | |
IT Services 3.6% | |
Cognizant Technology Solutions Corp. Class A (a) | | | 18,454 | | | | 1,195,819 | |
Fidelity National Information Services, Inc. | | | 134,710 | | | | 5,664,555 | |
¨Visa, Inc. Class A | | | 67,158 | | | | 11,313,437 | |
| | | | | | | | |
| | | | | | | 18,173,811 | |
| | | | | | | | |
Life Sciences Tools & Services 1.7% | |
Agilent Technologies, Inc. | | | 213,145 | | | | 8,832,729 | |
| | | | | | | | |
| † | Percentages indicated are based on Fund net assets. |
| ¨ | | Among the Fund’s 10 largest holdings, as of April 30, 2013, excluding short-term investment. May be subject to change daily. |
| | | | | | |
The notes to the financial statements are an integral part of,
and should be read in conjunction with, the financial statements. | | mainstayinvestments.com | | | 11 | |
Portfolio of Investments April 30, 2013 (Unaudited) (continued)
| | | | | | | | |
| | |
Shares | | | Value | |
| | | | | | | | |
| Common Stocks (continued) | |
Machinery 4.1% | |
AGCO Corp. | | | 111,140 | | | $ | 5,918,205 | |
Ingersoll-Rand PLC | | | 147,400 | | | | 7,930,120 | |
Wabtec Corp. | | | 67,602 | | | | 7,094,154 | |
| | | | | | | | |
| | | | | | | 20,942,479 | |
| | | | | | | | |
Media 4.3% | |
Comcast Corp. Class A | | | 245,140 | | | | 9,631,551 | |
¨Time Warner, Inc. | | | 206,020 | | | | 12,315,875 | |
| | | | | | | | |
| | | | | | | 21,947,426 | |
| | | | | | | | |
Multi-Utilities 2.7% | |
Vectren Corp. | | | 150,030 | | | | 5,635,127 | |
Wisconsin Energy Corp. | | | 182,870 | | | | 8,218,178 | |
| | | | | | | | |
| | | | | | | 13,853,305 | |
| | | | | | | | |
Multiline Retail 1.6% | |
Kohl’s Corp. | | | 177,950 | | | | 8,374,327 | |
| | | | | | | | |
|
Oil, Gas & Consumable Fuels 5.4% | |
Devon Energy Corp. | | | 124,850 | | | | 6,874,241 | |
¨Exxon Mobil Corp. | | | 128,250 | | | | 11,412,968 | |
Occidental Petroleum Corp. | | | 104,327 | | | | 9,312,228 | |
| | | | | | | | |
| | | | | | | 27,599,437 | |
| | | | | | | | |
Pharmaceuticals 3.7% | |
AbbVie, Inc. | | | 193,550 | | | | 8,912,978 | |
Endo Health Solutions, Inc. (a) | | | 272,260 | | | | 9,975,606 | |
| | | | | | | | |
| | | | | | | 18,888,584 | |
| | | | | | | | |
Semiconductors & Semiconductor Equipment 2.0% | |
Texas Instruments, Inc. | | | 275,158 | | | | 9,963,471 | |
| | | | | | | | |
|
Software 6.3% | |
Electronic Arts, Inc. (a) | | | 258,030 | | | | 4,543,908 | |
¨Microsoft Corp. | | | 546,320 | | | | 18,083,192 | |
Oracle Corp. | | | 295,850 | | | | 9,697,963 | |
| | | | | | | | |
| | | | | | | 32,325,063 | |
| | | | | | | | |
Specialty Retail 3.0% | |
Staples, Inc. | | | 412,550 | | | | 5,462,162 | |
TJX Cos., Inc. | | | 201,700 | | | | 9,836,909 | |
| | | | | | | | |
| | | | | | | 15,299,071 | |
| | | | | | | | |
Total Common Stocks
(Cost $391,074,534) | | | | | | | 489,319,387 | |
| | | | | | | | |
| | | | | | | | |
| | | Principal
Amount | | | Value | |
| | | | | | | | |
| Short-Term Investment 3.4% | |
Repurchase Agreement 3.4% | |
State Street Bank and Trust Co.
0.01%, dated 4/30/13
due 5/1/13
Proceeds at Maturity $17,273,107 (Collateralized by a Federal Home Loan Mortgage Corp. security with a rate of 2.10% and a maturity date of 10/17/22, with a Principal Amount of $17,735,000 and a Market Value of $17,620,928) | | $ | 17,273,103 | | | $ | 17,273,103 | |
| | | | | | | | |
Total Short-Term Investment
(Cost $17,273,103) | | | | | | | 17,273,103 | |
| | | | | | | | |
Total Investments
(Cost $408,347,637) (b) | | | 99.4 | % | | | 506,592,490 | |
Other Assets, Less Liabilities | | | 0.6 | | | | 3,069,240 | |
Net Assets | | | 100.0 | % | | $ | 509,661,730 | |
| (a) | Non-income producing security. |
| (b) | As of April 30, 2013, cost is $409,188,984 for federal income tax purposes and net unrealized appreciation is as follows: |
| | | | |
Gross unrealized appreciation | | $ | 102,472,490 | |
Gross unrealized depreciation | | | (5,068,984 | ) |
| | | | |
Net unrealized appreciation | | $ | 97,403,506 | |
| | | | |
| | | | |
| 12 | | MainStay Epoch U.S. All Cap Fund | | The notes to the financial statements are an integral part of,
and should be read in conjunction with, the financial statements. |
The following is a summary of the fair valuations according to the inputs used as of April 30, 2013, for valuing the Fund’s assets.
Asset Valuation Inputs
| | | | | | | | | | | | | | | | |
Description | | Quoted
Prices in
Active
Markets for
Identical
Assets (Level 1) | | | Significant
Other
Observable
Inputs (Level 2) | | | Significant
Unobservable
Inputs
(Level 3) | | | Total | |
| Investments in Securities (a) | | | | | | | | | | | | | | | | |
| Common Stocks | | $ | 489,319,387 | | | $ | — | | | $ | — | | | $ | 489,319,387 | |
| Short-Term Investment | | | | | | | | | | | | | | | | |
Repurchase Agreement | | | — | | | | 17,273,103 | | | | — | | | | 17,273,103 | |
| | | | | | | | | | | | | | | | |
| Total Investments in Securities | | $ | 489,319,387 | | | $ | 17,273,103 | | | $ | — | | | $ | 506,592,490 | |
| | | | | | | | | | | | | | | | |
| (a) | For a complete listing of investments and their industries, see the Portfolio of Investments. |
The Fund recognizes transfers between the levels as of the beginning of the period.
For the period ended April 30, 2013, the Fund did not have any transfers between Level 1 and Level 2 fair value measurements. (See Note 2)
As of April 30, 2013, the Fund did not hold any investments with significant unobservable inputs (Level 3). (See Note 2)
| | | | | | |
The notes to the financial statements are an integral part of,
and should be read in conjunction with, the financial statements. | | mainstayinvestments.com | | | 13 | |
Statement of Assets and Liabilities as of April 30, 2013 (Unaudited)
| | | | |
| Assets | |
Investment in securities, at value
(identified cost $408,347,637) | | $ | 506,592,490 | |
Receivables: | | | | |
Investment securities sold | | | 3,298,470 | |
Dividends and interest | | | 318,835 | |
Fund shares sold | | | 75,951 | |
Other assets | | | 41,693 | |
| | | | |
Total assets | | | 510,327,439 | |
| | | | |
| |
| Liabilities | | | | |
Payables: | | | | |
Manager (See Note 3) | | | 342,136 | |
Fund shares redeemed | | | 244,890 | |
Professional fees | | | 25,621 | |
Transfer agent (See Note 3) | | | 19,354 | |
Shareholder communication | | | 14,822 | |
NYLIFE Distributors (See Note 3) | | | 11,023 | |
Trustees | | | 1,226 | |
Custodian | | | 741 | |
Accrued expenses | | | 5,896 | |
| | | | |
Total liabilities | | | 665,709 | |
| | | | |
Net assets | | $ | 509,661,730 | |
| | | | |
| |
| Composition of Net Assets | | | | |
Shares of beneficial interest outstanding (par value of $.001 per share) unlimited number of shares authorized | | $ | 20,378 | |
Additional paid-in capital | | | 392,726,335 | |
| | | | |
| | | 392,746,713 | |
Undistributed net investment income | | | 1,439,668 | |
Accumulated net realized gain (loss) on investments | | | 17,230,496 | |
Net unrealized appreciation (depreciation) on investments | | | 98,244,853 | |
| | | | |
Net assets | | $ | 509,661,730 | |
| | | | |
| | | | |
Investor Class | | | | |
Net assets applicable to outstanding shares | | $ | 9,272,538 | |
| | | | |
Shares of beneficial interest outstanding | | | 399,703 | |
| | | | |
Net asset value per share outstanding | | $ | 23.20 | |
Maximum sales charge (5.50% of offering price) | | | 1.35 | |
| | | | |
Maximum offering price per share outstanding | | $ | 24.55 | |
| | | | |
Class A | | | | |
Net assets applicable to outstanding shares | | $ | 13,217,799 | |
| | | | |
Shares of beneficial interest outstanding | | | 563,285 | |
| | | | |
Net asset value per share outstanding | | $ | 23.47 | |
Maximum sales charge (5.50% of offering price) | | | 1.37 | |
| | | | |
Maximum offering price per share outstanding | | $ | 24.84 | |
| | | | |
Class B | | | | |
Net assets applicable to outstanding shares | | $ | 5,228,350 | |
| | | | |
Shares of beneficial interest outstanding | | | 244,229 | |
| | | | |
Net asset value and offering price per share outstanding | | $ | 21.41 | |
| | | | |
Class C | | | | |
Net assets applicable to outstanding shares | | $ | 2,806,170 | |
| | | | |
Shares of beneficial interest outstanding | | | 130,963 | |
| | | | |
Net asset value and offering price per share outstanding | | $ | 21.43 | |
| | | | |
Class I | | | | |
Net assets applicable to outstanding shares | | $ | 479,136,873 | |
| | | | |
Shares of beneficial interest outstanding | | | 19,040,187 | |
| | | | |
Net asset value and offering price per share outstanding | | $ | 25.16 | |
| | | | |
| | | | |
| 14 | | MainStay Epoch U.S. All Cap Fund | | The notes to the financial statements are an integral part of,
and should be read in conjunction with, the financial statements. |
Statement of Operations for the six months ended April 30, 2013 (Unaudited)
| | | | |
| Investment Income (Loss) | |
Income | | | | |
Dividends | | $ | 4,765,524 | |
Interest | | | 647 | |
| | | | |
Total income | | | 4,766,171 | |
| | | | |
Expenses | | | | |
Manager (See Note 3) | | | 1,942,937 | |
Distribution/Service—Investor Class (See Note 3) | | | 10,653 | |
Distribution/Service—Class A (See Note 3) | | | 15,131 | |
Distribution/Service—Class B (See Note 3) | | | 25,501 | |
Distribution/Service—Class C (See Note 3) | | | 12,881 | |
Transfer agent (See Note 3) | | | 55,142 | |
Registration | | | 34,478 | |
Professional fees | | | 28,772 | |
Shareholder communication | | | 18,144 | |
Custodian | | | 6,174 | |
Trustees | | | 5,335 | |
Miscellaneous | | | 12,806 | |
| | | | |
Total expenses | | | 2,167,954 | |
| | | | |
Net investment income (loss) | | | 2,598,217 | |
| | | | |
|
| Realized and Unrealized Gain (Loss) on Investments | |
Net realized gain (loss) on investments | | | 18,071,966 | |
Net change in unrealized appreciation (depreciation) on investments | | | 45,085,554 | |
| | | | |
Net realized and unrealized gain (loss) on investments | | | 63,157,520 | |
| | | | |
Net increase (decrease) in net assets resulting from operations | | $ | 65,755,737 | |
| | | | |
| | | | | | |
The notes to the financial statements are an integral part of,
and should be read in conjunction with, the financial statements. | | mainstayinvestments.com | | | 15 | |
Statements of Changes in Net Assets
for the six months ended April 30, 2013 (Unaudited) and the year ended October 31, 2012
| | | | | | | | |
| | | 2013 | | | 2012 | |
| Increase (Decrease) in Net Assets | |
Operations: | | | | | | | | |
Net investment income (loss) | | $ | 2,598,217 | | | $ | 5,090,006 | |
Net realized gain (loss) on investments | | | 18,071,966 | | | | 61,315,085 | |
Net change in unrealized appreciation (depreciation) on investments | | | 45,085,554 | | | | (3,367,851 | ) |
| | | | |
Net increase (decrease) in net assets resulting from operations | | | 65,755,737 | | | | 63,037,240 | |
| | | | |
Dividends and distributions to shareholders: | | | | | | | | |
From net investment income: | | | | | | | | |
Investor Class | | | (39,198 | ) | | | — | |
Class A | | | (113,108 | ) | | | (40,944 | ) |
Class I | | | (4,583,711 | ) | | | (3,574,059 | ) |
| | | | |
| | | (4,736,017 | ) | | | (3,615,003 | ) |
| | | | |
From net realized gain on investments: | | | | | | | | |
Investor Class | | | (911,738 | ) | | | (309,758 | ) |
Class A | | | (1,368,610 | ) | | | (421,881 | ) |
Class B | | | (621,440 | ) | | | (255,910 | ) |
Class C | | | (290,447 | ) | | | (155,828 | ) |
Class I | | | (43,495,827 | ) | | | (22,061,882 | ) |
| | | | |
| | | (46,688,062 | ) | | | (23,205,259 | ) |
| | | | |
Total dividends and distributions to shareholders | | | (51,424,079 | ) | | | (26,820,262 | ) |
| | | | |
Capital share transactions: | | | | | | | | |
Net proceeds from sale of shares | | | 64,257,481 | | | | 80,671,274 | |
Net asset value of shares issued to shareholders in reinvestment of dividends and distributions | | | 50,907,972 | | | | 26,262,518 | |
Cost of shares redeemed | | | (72,609,883 | ) | | | (302,663,062 | ) |
| | | | |
Increase (decrease) in net assets derived from capital share transactions | | | 42,555,570 | | | | (195,729,270 | ) |
| | | | |
Net increase (decrease) in net assets | | | 56,887,228 | | | | (159,512,292 | ) |
| | |
| Net Assets | | | | | | | | |
Beginning of period | | | 452,774,502 | | | | 612,286,794 | |
| | | | |
End of period | | $ | 509,661,730 | | | $ | 452,774,502 | |
| | | | |
Undistributed net investment income at end of period | | $ | 1,439,668 | | | $ | 3,577,468 | |
| | | | |
| | | | |
| 16 | | MainStay Epoch U.S. All Cap Fund | | The notes to the financial statements are an integral part of,
and should be read in conjunction with, the financial statements. |
Financial Highlights selected per share data and ratios
| | | | | | | | | | | | | | | | | | | | | | | | |
| | | Investor Class | |
| | | Six months
ended
April 30, | | | Year ended October 31, | | | February 28,
2008**
through
October 31, | |
| | | 2013* | | | 2012 | | | 2011 | | | 2010 | | | 2009 | | | 2008 | |
Net asset value at beginning of period | | $ | 22.92 | | | $ | 21.68 | | | $ | 20.74 | | | $ | 17.66 | | | $ | 15.40 | | | $ | 23.34 | |
| | | | | | | | | | | | | | | | | | | | | | | | |
Net investment income (loss) (a) | | | 0.05 | | | | 0.06 | | | | (0.03 | ) | | | (0.01 | ) | | | (0.05 | ) | | | (0.13 | ) |
Net realized and unrealized gain (loss) on investments | | | 2.93 | | | | 2.07 | | | | 0.97 | | | | 3.11 | | | | 2.31 | | | | (7.81 | ) |
| | | | | | | | | | | | | | | | | | | | | | | | |
Total from investment operations | | | 2.98 | | | | 2.13 | | | | 0.94 | | | | 3.10 | | | | 2.26 | | | | (7.94 | ) |
| | | | | | | | | | | | | | | | | | | | | | | | |
Less dividends and distributions: | | | | | | | | | | | | | | | | | | | | | | | | |
From net investment income | | | (0.11 | ) | | | — | | | | — | | | | (0.02 | ) | | | — | | | | — | |
From net realized gain on investments | | | (2.59 | ) | | | (0.89 | ) | | | — | | | | — | | | | — | | | | — | |
| | | | | | | | | | | | | | | | | | | | | | | | |
Total dividends and distributions | | | (2.70 | ) | | | (0.89 | ) | | | — | | | | (0.02 | ) | | | — | | | | — | |
| | | | | | | | | | | | | | | | | | | | | | | | |
Net asset value at end of period | | $ | 23.20 | | | $ | 22.92 | | | $ | 21.68 | | | $ | 20.74 | | | $ | 17.66 | | | $ | 15.40 | |
| | | | | | | | | | | | | | | | | | | | | | | | |
Total investment return (b) | | | 14.78 | %(c) | | | 10.14 | % | | | 4.53 | % | | | 17.56 | % | | | 14.68 | % (d) | | | (34.02 | %)(c) |
Ratios (to average net assets)/Supplemental Data: | | | | | | | | | | | | | | | | | | | | | | | | |
Net investment income (loss) | | | 0.49 | %†† | | | 0.27 | % | | | (0.12 | %) | | | (0.04 | %) | | | (0.29 | %) | | | (0.88 | %)†† |
Net expenses | | | 1.59 | %†† | | | 1.58 | %(e) | | | 1.58 | % | | | 1.69 | % | | | 1.67 | % | | | 1.64 | % †† |
Expenses (before waiver/reimbursement) | | | 1.59 | %†† | | | 1.58 | %(e) | | | 1.58 | % | | | 1.69 | % | | | 1.96 | % | | | 1.66 | % †† |
Portfolio turnover rate | | | 22 | % | | | 31 | % | | | 42 | % | | | 41 | % | | | 135 | % | | | 56 | % |
Net assets at end of period (in 000’s) | | $ | 9,273 | | | $ | 8,064 | | | $ | 7,659 | | | $ | 7,238 | | | $ | 6,384 | | | $ | 5,460 | |
| ** | Commencement of operations. |
| (a) | Per share data based on average shares outstanding during the period. |
| (b) | Total investment return is calculated exclusive of sales charges and assumes the reinvestment of dividends and distributions. |
| (c) | Total investment return is not annualized. |
| (d) | Total investment return may reflect adjustments to conform to generally accepted accounting principles. |
| (e) | Net of interest expense which is less than one-tenth of a percent. (See Note 6) |
| | | | | | |
The notes to the financial statements are an integral part of,
and should be read in conjunction with, the financial statements. | | mainstayinvestments.com | | | 17 | |
Financial Highlights selected per share data and ratios
| | | | | | | | | | | | | | | | | | | | | | | | |
| | | Class A | |
| | | Six months ended
April 30, | | | Year ended October 31, | |
| | | 2013* | | | 2012 | | | 2011 | | | 2010 | | | 2009 | | | 2008 | |
Net asset value at beginning of period | | $ | 23.20 | | | $ | 21.92 | | | $ | 20.93 | | | $ | 17.76 | | | $ | 15.42 | | | $ | 28.85 | |
| | | | | | | | | | | | | | | | | | | | | | | | |
Net investment income (loss) (a) | | | 0.10 | | | | 0.16 | | | | 0.07 | | | | 0.09 | | | | 0.02 | | | | (0.14 | ) |
Net realized and unrealized gain (loss) on investments | | | 2.97 | | | | 2.10 | | | | 0.97 | | | | 3.13 | | | | 2.32 | | | | (11.05 | ) |
| | | | | | | | | | | | | | | | | | | | | | | | |
Total from investment operations | | | 3.07 | | | | 2.26 | | | | 1.04 | | | | 3.22 | | | | 2.34 | | | | (11.19 | ) |
| | | | | | | | | | | | | | | | | | | | | | | | |
Less dividends and distributions: | | | | | | | | | | | | | | | | | | | | | | | | |
From net investment income | | | (0.21 | ) | | | (0.09 | ) | | | (0.05 | ) | | | (0.05 | ) | | | — | | | | — | |
From net realized gain on investments | | | (2.59 | ) | | | (0.89 | ) | | | — | | | | — | | | | — | | | | (2.24 | ) |
| | | | | | | | | | | | | | | | | | | | | | | | |
Total dividends and distributions | | | (2.80 | ) | | | (0.98 | ) | | | (0.05 | ) | | | (0.05 | ) | | | — | | | | (2.24 | ) |
| | | | | | | | | | | | | | | | | | | | | | | | |
Net asset value at end of period | | $ | 23.47 | | | $ | 23.20 | | | $ | 21.92 | | | $ | 20.93 | | | $ | 17.76 | | | $ | 15.42 | |
| | | | | | | | | | | | | | | | | | | | | | | | |
Total investment return (b) | | | 15.04 | %(c) | | | 10.71 | % | | | 4.96 | % | | | 18.15 | % | | | 15.18 | %(d) | | | (41.88 | %) |
Ratios (to average net assets)/Supplemental Data: | | | | | | | | | | | | | | | | | | | | | | | | |
Net investment income (loss) | | | 0.95 | %†† | | | 0.70 | % | | | 0.30 | % | | | 0.48 | % | | | 0.13 | % | | | (0.59 | %) |
Net expenses | | | 1.16 | %†† | | | 1.14 | %(e) | | | 1.15 | % | | | 1.19 | % | | | 1.26 | % | | | 1.39 | % |
Expenses (before waiver/reimbursement) | | | 1.16 | %†† | | | 1.14 | %(e) | | | 1.15 | % | | | 1.19 | % | | | 1.34 | % | | | 1.40 | % |
Portfolio turnover rate | | | 22 | % | | | 31 | % | | | 42 | % | | | 41 | % | | | 135 | % | | | 56 | % |
Net assets at end of period (in 000’s) | | $ | 13,218 | | | $ | 12,451 | | | $ | 10,466 | | | $ | 9,749 | | | $ | 14,006 | | | $ | 12,771 | |
| (a) | Per share data based on average shares outstanding during the period. |
| (b) | Total investment return is calculated exclusive of sales charges and assumes the reinvestment of dividends and distributions. |
| (c) | Total investment return is not annualized. |
| (d) | Total investment return may reflect adjustments to conform to generally accepted accounting principles. |
| (e) | Net of interest expense which is less than one-tenth of a percent. (See Note 6) |
| | | | |
| 18 | | MainStay Epoch U.S. All Cap Fund | | The notes to the financial statements are an integral part of,
and should be read in conjunction with, the financial statements. |
Financial Highlights selected per share data and ratios
| | | | | | | | | | | | | | | | | | | | | | | | |
| | | Class B | |
| | | Six months
ended
April 30, | | | Year ended October 31, | |
| | | 2013* | | | 2012 | | | 2011 | | | 2010 | | | 2009 | | | 2008 | |
Net asset value at beginning of period | | $ | 21.31 | | | $ | 20.37 | | | $ | 19.63 | | | $ | 16.84 | | | $ | 14.80 | | | $ | 28.03 | |
| | | | | | | | | | | | | | | | | | | | | | | | |
Net investment income (loss) (a) | | | (0.02 | ) | | | (0.10 | ) | | | (0.18 | ) | | | (0.14 | ) | | | (0.15 | ) | | | (0.34 | ) |
Net realized and unrealized gain (loss) on investments | | | 2.71 | | | | 1.93 | | | | 0.92 | | | | 2.95 | | | | 2.19 | | | | (10.65 | ) |
| | | | | | | | | | | | | | | | | | | | | | | | |
Total from investment operations | | | 2.69 | | | | 1.83 | | | | 0.74 | | | | 2.81 | | | | 2.04 | | | | (10.99 | ) |
| | | | | | | | | | | | | | | | | | | | | | | | |
Less dividends and distributions: | | | | | | | | | | | | | | | | | | | | | | | | |
From net investment income | | | — | | | | — | | | | — | | | | (0.02 | ) | | | — | | | | — | |
From net realized gain on investments | | | (2.59 | ) | | | (0.89 | ) | | | — | | | | — | | | | — | | | | (2.24 | ) |
| | | | | | | | | | | | | | | | | | | | | | | | |
Total dividends and distributions | | | (2.59 | ) | | | (0.89 | ) | | | — | | | | (0.02 | ) | | | — | | | | (2.24 | ) |
| | | | | | | | | | | | | | | | | | | | | | | | |
Net asset value at end of period | | $ | 21.41 | | | $ | 21.31 | | | $ | 20.37 | | | $ | 19.63 | | | $ | 16.84 | | | $ | 14.80 | |
| | | | | | | | | | | | | | | | | | | | | | | | |
Total investment return (b) | | | 14.36 | % (c) | | | 9.34 | % | | | 3.77 | % | | | 16.69 | % | | | 13.78 | % (d) | | | (42.43 | %) |
Ratios (to average net assets)/Supplemental Data: | | | | | | | | | | | | | | | | | | | | | | | | |
Net investment income (loss) | | | (0.22 | %)†† | | | (0.46 | %) | | | (0.86 | %) | | | (0.77 | %) | | | (1.04 | %) | | | (1.55 | %) |
Net expenses | | | 2.34 | % †† | | | 2.33 | % (e) | | | 2.33 | % | | | 2.44 | % | | | 2.42 | % | | | 2.34 | % |
Expenses (before waiver/reimbursement) | | | 2.34 | % †† | | | 2.33 | % (e) | | | 2.33 | % | | | 2.44 | % | | | 2.71 | % | | | 2.35 | % |
Portfolio turnover rate | | | 22 | % | | | 31 | % | | | 42 | % | | | 41 | % | | | 135 | % | | | 56 | % |
Net assets at end of period (in 000’s) | | $ | 5,228 | | | $ | 5,137 | | | $ | 5,978 | | | $ | 6,362 | | | $ | 6,383 | | | $ | 6,191 | |
| (a) | Per share data based on average shares outstanding during the period. |
| (b) | Total investment return is calculated exclusive of sales charges and assumes the reinvestment of dividends and distributions. |
| (c) | Total investment return is not annualized. |
| (d) | Total investment return may reflect adjustments to conform to generally accepted accounting principles. |
| (e) | Net of interest expense which is less than one-tenth of a percent. (See Note 6) |
| | | | | | |
The notes to the financial statements are an integral part of,
and should be read in conjunction with, the financial statements. | | mainstayinvestments.com | | | 19 | |
Financial Highlights selected per share data and ratios
| | | | | | | | | | | | | | | | | | | | | | | | |
| | | Class C | |
| | | Six months
ended
April 30, | | | Year ended October 31, | |
| | | 2013* | | | 2012 | | | 2011 | | | 2010 | | | 2009 | | | 2008 | |
Net asset value at beginning of period | | $ | 21.33 | | | $ | 20.39 | | | $ | 19.65 | | | $ | 16.86 | | | $ | 14.82 | | | $ | 28.06 | |
| | | | | | | | | | | | | | | | | | | | | | | | |
Net investment income (loss) (a) | | | (0.03 | ) | | | (0.09 | ) | | | (0.18 | ) | | | (0.14 | ) | | | (0.15 | ) | | | (0.34 | ) |
Net realized and unrealized gain (loss) on investments | | | 2.72 | | | | 1.92 | | | | 0.92 | | | | 2.95 | | | | 2.19 | | | | (10.66 | ) |
| | | | | | | | | | | | | | | | | | | | | | | | |
Total from investment operations | | | 2.69 | | | | 1.83 | | | | 0.74 | | | | 2.81 | | | | 2.04 | | | | (11.00 | ) |
| | | | | | | | | | | | | | | | | | | | | | | | |
Less dividends and distributions: | | | | | | | | | | | | | | | | | | | | | | | | |
From net investment income | | | — | | | | — | | | | — | | | | (0.02 | ) | | | — | | | | — | |
From net realized gain on investments | | | (2.59 | ) | | | (0.89 | ) | | | — | | | | — | | | | — | | | | (2.24 | ) |
| | | | | | | | | | | | | | | | | | | | | | | | |
Total dividends and distributions | | | (2.59 | ) | | | (0.89 | ) | | | — | | | | (0.02 | ) | | | — | | | | (2.24 | ) |
| | | | | | | | | | | | | | | | | | | | | | | | |
Net asset value at end of period | | $ | 21.43 | | | $ | 21.33 | | | $ | 20.39 | | | $ | 19.65 | | | $ | 16.86 | | | $ | 14.82 | |
| | | | | | | | | | | | | | | | | | | | | | | | |
Total investment return (b) | | | 14.35 | % (c) | | | 9.33 | % | | | 3.77 | % | | | 16.67 | % | | | 13.77 | % (d) | | | (42.42 | %) |
Ratios (to average net assets)/Supplemental Data: | | | | | | | | | | | | | | | | | | | | | | | | |
Net investment income (loss) | | | (0.27 | %)†† | | | (0.45 | %) | | | (0.86 | %) | | | (0.79 | %) | | | (1.03 | %) | | | (1.55 | %) |
Net expenses | | | 2.34 | % †† | | | 2.33 | % (e) | | | 2.33 | % | | | 2.44 | % | | | 2.42 | % | | | 2.34 | % |
Expenses (before waiver/reimbursement) | | | 2.34 | % †† | | | 2.33 | % (e) | | | 2.33 | % | | | 2.44 | % | | | 2.71 | % | | | 2.35 | % |
Portfolio turnover rate | | | 22 | % | | | 31 | % | | | 42 | % | | | 41 | % | | | 135 | % | | | 56 | % |
Net assets at end of period (in 000’s) | | $ | 2,806 | | | $ | 2,409 | | | $ | 3,498 | | | $ | 3,959 | | | $ | 3,514 | | | $ | 4,004 | |
| (a) | Per share data based on average shares outstanding during the period. |
| (b) | Total investment return is calculated exclusive of sales charges and assumes the reinvestment of dividends and distributions. |
| (c) | Total investment return is not annualized. |
| (d) | Total investment return may reflect adjustments to conform to generally accepted accounting principles. |
| (e) | Net of interest expense which is less than one-tenth of a percent. (See Note 6) |
| | | | |
| 20 | | MainStay Epoch U.S. All Cap Fund | | The notes to the financial statements are an integral part of,
and should be read in conjunction with, the financial statements. |
Financial Highlights selected per share data and ratios
| | | | | | | | | | | | | | | | | | | | | | | | |
| | | Class I | |
| | | Six months
ended
April 30, | | | Year ended October 31, | |
| | | 2013* | | | 2012 | | | 2011 | | | 2010 | | | 2009 | | | 2008 | |
Net asset value at beginning of period | | $ | 24.71 | | | $ | 23.29 | | | $ | 22.24 | | | $ | 18.87 | | | $ | 16.33 | | | $ | 30.28 | |
| | | | | | | | | | | | | | | | | | | | | | | | |
Net investment income (loss) (a) | | | 0.14 | | | | 0.23 | | | | 0.13 | | | | 0.13 | | | | 0.07 | | | | (0.03 | ) |
Net realized and unrealized gain (loss) on investments | | | 3.17 | | | | 2.22 | | | | 1.03 | | | | 3.34 | | | | 2.47 | | | | (11.68 | ) |
| | | | | | | | | | | | | | | | | | | | | | | | |
Total from investment operations | | | 3.31 | | | | 2.45 | | | | 1.16 | | | | 3.47 | | | | 2.54 | | | | (11.71 | ) |
| | | | | | | | | | | | | | | | | | | | | | | | |
Less dividends and distributions: | | | | | | | | | | | | | | | | | | | | | | | | |
From net investment income | | | (0.27 | ) | | | (0.14 | ) | | | (0.11 | ) | | | (0.10 | ) | | | — | | | | — | |
From net realized gain on investments | | | (2.59 | ) | | | (0.89 | ) | | | — | | | | — | | | | — | | | | (2.24 | ) |
| | | | | | | | | | | | | | | | | | | | | | | | |
Total dividends and distributions | | | (2.86 | ) | | | (1.03 | ) | | | (0.11 | ) | | | (0.10 | ) | | | — | | | | (2.24 | ) |
| | | | | | | | | | | | | | | | | | | | | | | | |
Net asset value at end of period | | $ | 25.16 | | | $ | 24.71 | | | $ | 23.29 | | | $ | 22.24 | | | $ | 18.87 | | | $ | 16.33 | |
| | | | | | | | | | | | | | | | | | | | | | | | |
Total investment return (b) | | | 15.18 | %(c) | | | 10.96 | % | | | 5.20 | % | | | 18.42 | % | | | 15.55 | %(d) | | | (41.60 | %) |
Ratios (to average net assets)/Supplemental Data: | | | | | | | | | | | | | | | | | | | | | | | | |
Net investment income (loss) | | | 1.18 | %†† | | | 0.98 | % | | | 0.55 | % | | | 0.62 | % | | | 0.42 | % | | | (0.14 | %) |
Net expenses | | | 0.91 | %†† | | | 0.89 | %(e) | | | 0.90 | % | | | 0.94 | % | | | 0.95 | % | | | 0.93 | % |
Expenses (before waiver/reimbursement) | | | 0.91 | %†† | | | 0.89 | %(e) | | | 0.90 | % | | | 0.94 | % | | | 1.09 | % | | | 0.97 | % |
Portfolio turnover rate | | | 22 | % | | | 31 | % | | | 42 | % | | | 41 | % | | | 135 | % | | | 56 | % |
Net assets at end of period (in 000’s) | | $ | 479,137 | | | $ | 424,714 | | | $ | 584,686 | | | $ | 510,263 | | | $ | 195,303 | | | $ | 157,222 | |
| (a) | Per share data based on average shares outstanding during the period. |
| (b) | Total investment return is calculated exclusive of sales charges and assumes the reinvestment of dividends and distributions. Class I shares are not subject to sales charges. |
| (c) | Total investment return is not annualized. |
| (d) | Total investment return may reflect adjustments to conform to generally accepted accounting principles. |
| (e) | Net of interest expense which is less than one-tenth of a percent. (See Note 6) |
| | | | | | |
The notes to the financial statements are an integral part of,
and should be read in conjunction with, the financial statements. | | mainstayinvestments.com | | | 21 | |
Notes to Financial Statements (Unaudited)
Note 1–Organization and Business
MainStay Funds Trust (the “Trust”) was organized as a Delaware statutory trust on April 28, 2009, and is governed by a Declaration of Trust. The Trust is registered under the Investment Company Act of 1940, as amended (the “1940 Act”), as an open-end investment management company, and is comprised of thirty-three funds (collectively referred to as the “Funds”). These financial statements and notes relate only to the MainStay Epoch U.S. All Cap Fund (the “Fund”), a diversified fund. The Fund is the successor of the MainStay Epoch U.S. All Cap Fund, a series of Eclipse Funds Inc. (the “Predecessor Fund”). The reorganization of the Predecessor Fund with and into the Fund occurred on February 26, 2010. All information and references to periods prior to February 26, 2010 relate to the Predecessor Fund.
The Fund currently offers five classes of shares. Class I shares commenced operations on January 2, 1991. Class A, Class B and Class C shares commenced operations on January 2, 2004. Investor Class shares commenced operations on February 28, 2008. Investor Class and Class A shares are offered at net asset value (“NAV”) per share plus an initial sales charge. No sales charge applies to investments of $1 million or more (and certain other qualified purchases) in Investor Class and Class A shares, but a contingent deferred sales charge (“CDSC”) is imposed on certain redemptions made within one year of the date of purchase. Class B and Class C shares are offered at NAV without an initial sales charge, although a declining CDSC may be imposed on redemptions made within six years of the date of purchase of Class B shares and a 1.00% CDSC may be imposed on redemptions made within one year of the date of purchase of Class C shares. Class I shares are offered at NAV and are not subject to a sales charge. Depending upon eligibility, Class B shares convert to either Investor Class or Class A shares at the end of the calendar quarter eight years after the date they were purchased. Additionally, depending upon eligibility, Investor Class shares may convert to Class A shares and Class A shares may convert to Investor Class shares. The five classes of shares have the same voting (except for issues that relate solely to one class), dividend, liquidation and other rights, and the same terms and conditions, except that Class B and Class C shares are subject to higher distribution and/or service fee rates than Investor Class and Class A shares under a distribution plan pursuant to Rule 12b-1 under the 1940 Act. Class I shares are not subject to a distribution and/or service fee.
The Fund’s investment objective is to seek long-term capital appreciation.
Note 2–Significant Accounting Policies
The Fund prepares its financial statements in accordance with generally accepted accounting principles (“GAAP”) in the United States of America and follows the significant accounting policies described below.
(A) Securities Valuation. Investments are valued as of the close of regular trading on the New York Stock Exchange (“Exchange”) (generally 4:00 p.m. Eastern time) on each day the Fund is open for business (“valuation date”).
The Board of Trustees (the “Board”) has adopted procedures for the valuation of the Fund’s securities and has delegated the responsibility for valuation determination under those procedures to the Valuation
Committee of the Fund (the “Valuation Committee”). The Board has authorized the Valuation Committee to appoint a Valuation Sub-Committee (the “Sub-Committee”) to deal in the first instance with questions that arise or cannot be resolved under these procedures. The Sub-Committee meets (in person, via electronic mail or via teleconference) on an as-needed basis. The Valuation Committee meets at a later time, as necessary, to ensure that actions taken by the Sub-Committee were appropriate. The procedures recognize that, subject to the oversight of the Board and unless otherwise noted, the responsibility for day-to-day valuation of portfolio assets (including securities for which market prices are not readily available) rests with New York Life Investment Management LLC ( “New York Life Investments” or the “Manager”), aided to whatever extent necessary by the Subadvisor (as defined in Note 3(A)) of the Fund.
To assess the appropriateness of security valuations, the Manager or the Fund’s third party service provider who is subject to oversight by the Manager, regularly compares prior day prices, prices on comparable securities and the sale prices to the prior and current day prices and challenges prices exceeding certain tolerance levels with third party pricing services or broker sources. For those securities valued by recommendation, whether through a standardized fair valuation methodology or a fair valuation determination, the Valuation Committee reviews and affirms the reasonableness of the valuation based on such methodologies and determinations on a regular basis after considering all relevant information that is reasonably available.
“Fair value” is defined as the price that the Fund would receive upon selling an investment in an orderly transaction to an independent buyer in the principal or most advantageous market of the investment. Fair value measurements are determined within a framework that has established a three-tier hierarchy which maximizes the use of observable market data and minimizes the use of unobservable inputs to establish classification of fair value measurements for disclosure purposes. “Inputs” refers broadly to the assumptions that market participants would use in pricing the asset or liability, including assumptions about risk, such as the risk inherent in a particular valuation technique used to measure fair value using a pricing model and/or the risk inherent in the inputs for the valuation technique. Inputs may be observable or unobservable. Observable inputs reflect the assumptions market participants would use in pricing the asset or liability based on market data obtained from sources independent of the Fund. Unobservable inputs reflect the Fund’s own assumptions about the assumptions market participants would use in pricing the asset or liability developed based on the information available in the circumstances. The inputs or methodology used for valuing securities may not be an indication of the risks associated with investing in those securities. The three-tier hierarchy of inputs is summarized in the three broad Levels listed below.
| • | | Level 1—quoted prices in active markets for identical investments |
| • | | Level 2—other significant observable inputs (including quoted prices for similar investments in active markets, interest rates and yield curves, prepayment speeds, credit risks, etc.) |
| • | | Level 3—significant unobservable inputs (including the Fund’s own assumptions about the assumptions that market participants would use in determining the fair value of investments) |
| | |
| 22 | | MainStay Epoch U.S. All Cap Fund |
The aggregate value by input level, as of April 30, 2013, for the Fund’s investments is included at the end of the Fund’s Portfolio of Investments.
The valuation techniques used by the Fund to measure fair value maximize the use of observable inputs and minimize the use of unobservable inputs. The Fund may utilize third party vendor evaluations, whose prices may be derived from one or more of the following standard inputs:
| | |
• Benchmark Yields | | • Reported Trades |
• Broker Dealer Quotes | | • Issuer Spreads |
• Two-sided markets | | • Benchmark securities |
• Bids/Offers | | • Reference Data (corporate actions or material event notices) |
• Industry and economic events | | • Comparable bonds |
• Equity and credit default swap curves | | • Monthly payment information |
Securities for which market values cannot be determined using the methodologies described above are valued by methods deemed in good faith by the Fund’s Valuation Committee, following the procedures established by the Board, to represent fair value. Under these procedures, the Fund primarily employs a market-based approach which may use related or comparable assets or liabilities, recent transactions, market multiples, book values, and other relevant information. The Fund may also use an income-based valuation approach in which the anticipated future cash flows of the investment are discounted to calculate fair value. Discounts may also be applied due to the nature or duration of any restrictions on the disposition of the investments. Due to the inherent uncertainty of valuations of such investments, the fair values may differ significantly from the values that would have been used had an active market existed. For the six-month period ended April 30, 2013, there have been no changes to the fair value methodologies.
Equity and non-equity securities which may be valued in this manner include, but are not limited to: (i) a security for which the trading has been halted or suspended; (ii) a debt security that has recently gone into default and for which there is not a current market quotation; (iii) a security of an issuer that has entered into a restructuring; (iv) a security that has been de-listed from a national exchange; (v) a security for which the market price is not available from a third party pricing source or, if so provided, does not, in the opinion of the Fund’s Manager or Subadvisor reflect the security’s market value; and (vi) a security whose principal market has been temporarily closed at a time when, under normal conditions, it would be open. Securities for which market quotations or observable inputs are not readily available are generally categorized as Level 3 in the hierarchy. As of April 30, 2013, the Fund did not hold any securities that were fair valued in such a manner.
Certain events may occur between the time that foreign markets close, on which securities held by the Fund principally trade, and the time at which the Fund’s NAV is calculated. These events may include, but are not limited to, situations relating to a single issuer in a market sector, significant fluctuations in U.S. or foreign markets, natural disasters, armed conflicts, governmental actions or other developments not tied directly to the securities markets. Should the Manager or Subadvisor conclude that such events may have affected the accuracy of the last price of such securities reported on the local foreign market, the
Manager or Subadvisor may, pursuant to procedures adopted by the Board, adjust the value of the local price to reflect the estimated impact on the price of such securities as a result of such events. In this instance, securities are generally categorized as Level 3 in the hierarchy. Additionally, foreign equity securities are also fair valued whenever the movement of a particular index exceeds certain thresholds. In such cases, the securities are fair valued by applying factors provided by a third party vendor in accordance with the Fund’s policies and procedures and are generally categorized as Level 2 in the hierarchy. As of April 30, 2013, the Fund did not hold any foreign equity securities.
Equity securities and Exchange Traded Funds are valued at the latest quoted sales prices as of the close of regular trading on the Exchange on each valuation date. Securities that are not traded on the valuation date are valued at the mean of the latest quoted bid and ask prices. Prices normally are taken from the principal market in which each security trades. Futures contracts are valued at the last posted settlement price on the market where such futures are primarily traded. Options contracts are valued at the last posted settlement price on the market where such options are principally traded. Investments in other mutual funds are valued at their respective NAVs as of the close of the Exchange on the valuation date. These securities are generally categorized as Level 1 in the hierarchy.
Temporary cash investments acquired over 60 days to maturity are valued using the latest bid prices or using valuations based on a matrix system (which considers such factors as security prices, yields, maturities, and ratings), both as furnished by independent pricing services. Other temporary cash investments which mature in 60 days or less (“Short-Term Investments”) are valued at amortized cost. The amortized cost method involves valuing a security at its cost on the date of purchase and thereafter assuming a constant amortization to maturity of the difference between such cost and the value on maturity date. Amortized cost approximates the current fair value of a security. Securities valued at amortized cost are not valued using a quoted price in an active market. These securities are generally categorized as Level 2 in the hierarchy.
(B) Income Taxes. The Fund’s policy is to comply with the requirements of the Internal Revenue Code of 1986, as amended (the “Internal Revenue Code”), applicable to regulated investment companies and to distribute all of the taxable income to the shareholders of the Fund within the allowable time limits. Therefore, no federal, state and local income tax provision is required.
Management evaluates its tax positions to determine if the tax positions taken meet the minimum recognition threshold in connection with accounting for uncertainties in income tax positions taken or expected to be taken for the purposes of measuring and recognizing tax liabilities in the financial statements. Recognition of tax benefits of an uncertain tax position is required only when the position is “more likely than not” to be sustained assuming examination by taxing authorities. Management has analyzed the Fund’s tax positions taken on federal, state and local income tax returns for all open tax years (for up to three tax years), and has concluded that no provision for federal, state and local income tax is required in the Fund’s financial statements. The Fund’s federal, state and local income and federal excise tax returns for tax years for which the applicable statutes of limitations have not expired are subject to
| | | | |
| mainstayinvestments.com | | | 23 | |
Notes to Financial Statements (Unaudited) (continued)
examination by the Internal Revenue Service and state and local departments of revenue.
(C) Dividends and Distributions to Shareholders. Dividends and distributions are recorded on the ex-dividend date. The Fund intends to declare and pay dividends of net investment income and distributions of net realized capital and currency gains, if any, at least annually. Unless the shareholder elects otherwise, all dividends and distributions are reinvested in the same class of shares of the Fund, at NAV. Dividends and distributions to shareholders are determined in accordance with federal income tax regulations and may differ from GAAP.
(D) Security Transactions and Investment Income. The Fund records security transactions on the trade date. Realized gains and losses on security transactions are determined using the identified cost method. Dividend income is recognized on the ex-dividend date and interest income is accrued as earned using the effective interest rate method. Discounts and premiums on securities purchased, other than Short-Term Investments, for the Fund are accreted and amortized, respectively, on the effective interest rate method over the life of the respective securities or, in the case of a callable security, over the period to the first date of call. Discounts and premiums on Short-Term Investments are accreted and amortized, respectively, on the straight-line method.
Investment income and realized and unrealized gains and losses on investments of the Fund are allocated to separate classes of shares pro rata based upon their relative net assets on the date the income is earned or realized and unrealized gains and losses are incurred.
(E) Expenses. Expenses of the Trust are allocated to the individual Funds in proportion to the net assets of the respective Funds when the expenses are incurred, except where direct allocations of expenses can be made. Expenses (other than transfer agent expenses and fees incurred under the shareholder services plans and the distribution plans further discussed in Note 3(B)) are allocated to separate classes of shares pro rata based upon their relative net assets on the date the expenses are incurred. The expenses borne by the Fund, including those of related parties to the Fund, are shown in the Statement of Operations.
(F) Use of Estimates. In preparing financial statements in conformity with GAAP, management makes estimates and assumptions that affect the reported amounts and disclosures in the financial statements. Actual results could differ from those estimates.
(G) Repurchase Agreements. The Fund may enter into repurchase agreements to earn income. The Fund may enter into repurchase agreements only with financial institutions that are deemed by the Manager or Subadvisor to be creditworthy, pursuant to guidelines established by the Fund’s Board. During the term of any repurchase agreement, the Manager or Subadvisor will continue to monitor the creditworthiness of the seller. Under the 1940 Act, repurchase agreements are considered to be collateralized loans by a Fund to the seller secured by the securities transferred to the Fund.
When the Fund invests in repurchase agreements, the Fund’s custodian takes possession of the collateral pledged for investments in the repurchase agreement. The underlying collateral is valued daily on a
mark-to-market basis to determine that the value, including accrued interest, exceeds the repurchase price. In the event of the seller’s default on the obligation to repurchase, the Fund has the right to liquidate the collateral and apply the proceeds in satisfaction of the obligation. Under certain circumstances, such as in the event of default or bankruptcy by the counterparty to the agreement, realization and/or retention of the collateral may be subject to legal proceedings and possible realized loss to the Fund.
(H) Securities Lending. In order to realize additional income, the Fund may engage in securities lending, subject to the limitations set forth in the 1940 Act and relevant guidance by the staff of the Securities and Exchange Commission. In the event the Fund does engage in securities lending, the Fund will lend through its custodian, State Street Bank and Trust Company (“State Street”). State Street will manage the Fund’s cash collateral in accordance with the lending agreement between the Fund and State Street, and indemnify the Fund’s portfolio against counterparty risk. The loans will be collateralized by cash or securities at least equal at all times to the market value of the securities loaned. Collateral will consist of U.S. Government securities, cash equivalents or irrevocable letters of credit. The Fund may bear the risk of delay in recovery of, or loss of rights in, the securities loaned should the borrower of the securities experience financial difficulty. The Fund may also record realized gain or loss on securities deemed sold due to a borrower’s inability to return securities on loan. The Fund will receive compensation for lending its securities in the form of fees or the retention of a portion of the interest on the investment of any cash received as collateral. The Fund also will continue to receive interest and dividends on the securities loaned and any gain or loss in the market price of the securities loaned that may occur during the term of the loan will be for the account of the Fund.
Although the Fund and New York Life Investments have temporarily suspended securities lending, the Fund and New York Life Investments reserve the right to reinstitute lending when deemed appropriate. The Fund did not have any portfolio securities on loan as of April 30, 2013.
(I) Indemnifications. Under the Trust’s organizational documents, its officers and trustees are indemnified against certain liabilities that may arise out of performance of their duties to the Trust. Additionally, in the normal course of business, the Fund enters into contracts with third-party service providers that contain a variety of representations and warranties and which may provide general indemnifications. The Fund’s maximum exposure under these arrangements is unknown, as this would involve future claims that may be made against the Fund that have not yet occurred. Based on experience, management is of the view that the risk of loss in connection with these potential indemnification obligations is remote. However, there can be no assurance that material liabilities related to such obligations will not arise in the future, which could adversely impact the Fund.
Note 3–Fees and Related Party Transactions
(A) Manager and Subadvisor. New York Life Investments, a registered investment adviser and an indirect, wholly-owned subsidiary of New York Life Insurance Company (“New York Life”), serves as the Fund’s Manager, pursuant to an Amended and Restated Management Agreement (“Management Agreement”). The Manager provides offices, conducts clerical, recordkeeping and bookkeeping services, and keeps
| | |
| 24 | | MainStay Epoch U.S. All Cap Fund |
most of the financial and accounting records required to be maintained by the Fund. Except for the portion of salaries and expenses that are the responsibility of the Fund, the Manager pays the salaries and expenses of all personnel affiliated with the Fund and certain operational expenses of the Fund. The Fund reimburses New York Life Investments in an amount equal to a portion of the salary of the Chief Compliance Officer (“CCO”) of the Fund. Epoch Investment Partners, Inc. (“Epoch” or “Subadvisor”), a registered investment adviser, serves as Subadvisor to the Fund and is responsible for the day-to-day portfolio management of the Fund.
On March 27, 2013, Epoch Holding Corporation (“Epoch Holding”) merged with Empire Merger Sub, Inc., a wholly-owned subsidiary of The Toronto-Dominion Bank, a Canadian chartered bank (“Epoch Holding Merger”) following the approval of Epoch Holding shareholders. As a result, Epoch Holding became a wholly-owned subsidiary of The Toronto-Dominion Bank (“TD Bank”). Epoch Holding is the parent company of Epoch. The closing of the Epoch Holding Merger resulted in a change of control of Epoch and an automatic termination of the previous subadvisory agreement with Epoch under the Investment Company Act of 1940, as amended.
At a meeting held on March 21, 2013, the Board approved the continued retention of Epoch as the Fund’s subadvisor under the terms of an interim subadvisory agreement that took effect on March 27, 2013, following the closing of the Epoch Holding Merger. The Board also approved a new subadvisory agreement with Epoch that has identical terms to the previous subadvisory agreement in all material respects. Shareholder approval of the continued retention of Epoch as subadvisor and the new subadvisory agreement is required. The continued retention of Epoch as subadvisor and the new subadvisory agreement, among other proposals, are being considered by shareholders at a special meeting scheduled for July 1, 2013.
The Fund pays the Manager a monthly fee for services performed and facilities furnished at an annual rate of the Fund’s average daily net assets as follows: 0.85% up to $500 million; 0.825% from $500 million to $1 billion; and 0.80% in excess of $1 billion. The effective management fee rate was 0.85% for the six-month period ended April 30, 2013.
For the six-month period ended April 30, 2013, New York Life Investments earned fees from the Fund in the amount of $1,942,937.
State Street, 1 Lincoln Street, Boston, Massachusetts 02111, provides sub-administration and sub-accounting services to the Fund pursuant to an agreement with New York Life Investments. These services include calculating the daily NAVs of the Fund, maintaining the general ledger and sub-ledger accounts for the calculation of the Fund’s respective NAVs, and assisting New York Life Investments in conducting various aspects of the Fund’s administrative operations. For providing these services to the Fund, State Street is compensated by New York Life Investments.
(B) Distribution and Service Fees. The Trust, on behalf of the Fund, has entered into a distribution agreement with NYLIFE Distributors LLC (the “Distributor”), an indirect, wholly-owned subsidiary of New York Life. The Fund has adopted distribution plans (the “Plans”) in accordance with the provisions of Rule 12b-1 under the 1940 Act.
Pursuant to the Investor Class and Class A Plans, the Distributor receives a monthly distribution fee from the Investor Class and Class A
shares at an annual rate of 0.25% of the average daily net assets of the Investor Class and Class A shares for distribution and/or service activities as designated by the Distributor. Pursuant to the Class B and Class C Plans, Class B and Class C shares pay the Distributor a monthly distribution fee at an annual rate of 0.75% of the average daily net assets of the Class B and Class C shares along with a service fee at an annual rate of 0.25% of the average daily net assets of the Class B and Class C shares, for a total 12b-1 fee of 1.00%. Class I shares are not subject to a distribution and/or service fee.
The Plans provide that the distribution and service fees are payable to the Distributor regardless of the amounts actually expended by the Distributor for distribution of the Fund’s shares and service activities.
(C) Sales Charges. The Fund was advised by the Distributor that the amount of sales charges retained on sales of Investor Class and Class A shares were $2,113 and $2,140, respectively, for the six-month period ended April 30, 2013. The Fund was also advised that the Distributor retained CDSCs on redemptions of Class A, Class B and Class C shares of $133, $3,158 and $181, respectively, for the six-month period ended April 30, 2013.
(D) Transfer, Dividend Disbursing and Shareholder Servicing Agent. NYLIM Service Company LLC, an affiliate of New York Life Investments, is the Fund’s transfer, dividend disbursing and shareholder servicing agent pursuant to an agreement between NYLIM Service Company LLC and the Trust. NYLIM Service Company LLC has entered into an agreement with Boston Financial Data Services, Inc. (“BFDS”) pursuant to which BFDS performs certain transfer agent services on behalf of NYLIM Service Company LLC. Transfer agent expenses incurred by the Fund for the six-month period ended April 30, 2013, were as follows:
| | | | |
Investor Class | | $ | 18,943 | |
Class A | | | 526 | |
Class B | | | 11,347 | |
Class C | | | 5,723 | |
Class I | | | 18,603 | |
(E) Small Account Fee. Shareholders with small accounts adversely impact the cost of providing transfer agency services. In an effort to reduce total transfer agency expenses, the Fund has implemented a small account fee on certain types of accounts. Certain shareholders with an account balance of less than $1,000 are charged an annual per account fee of $20 (assessed semi-annually), the proceeds from which offset transfer agent fees as reflected in the Statement of Operations.
(F) Capital. As of April 30, 2013, New York Life and its affiliates beneficially held shares of the Fund with values and percentages of net assets as follows:
| | | | | | | | |
Class I | | $ | 147,683,915 | | | | 30.8 | % |
| | | | |
| mainstayinvestments.com | | | 25 | |
Notes to Financial Statements (Unaudited) (continued)
Note 4–Federal Income Tax
The tax character of distributions paid during the year ended October 31, 2012, shown in the Statements of Changes in Net Assets was as follows:
| | | | |
| | | 2012 | |
Distributions paid from: | | | | |
Ordinary Income | | $ | 3,615,003 | |
Long Term Capital Gain | | | 23,205,259 | |
Total | | $ | 26,820,262 | |
Note 5–Custodian
State Street is the custodian of the cash and the securities of the Fund. Custodial fees are charged to the Fund based on the market value of securities in the Fund and the number of certain cash transactions incurred by the Fund.
Note 6–Line of Credit
The Fund and certain affiliated funds maintain a line of credit with a syndicate of banks in order to secure a source of funds for temporary purposes to meet unanticipated or excessive redemption requests.
Effective August 29, 2012, under a second amended and restated credit agreement (the “Credit Agreement”), the aggregate commitment amount is $200,000,000 with an optional maximum amount of $250,000,000. The commitment fee is an annual rate of 0.08% of the average commitment amount payable quarterly, regardless of usage, to Bank of New York Mellon, which serves as the agent to the syndicate. The commitment fee is allocated among the Fund and certain affiliated funds based upon net assets and other factors. Interest on any revolving credit loan is charged based upon the Federal Funds Advances rate or the one month London InterBank Offered Rate, whichever is higher. The Credit Agreement expires on August 28, 2013, although the Fund, certain affiliated funds and the syndicate of banks may renew the Credit Agreement for an additional year on the same or different terms. There were no borrowings made or outstanding with respect to the Fund on the Credit Agreement during the six-month period ended April 30, 2013.
Note 7–Purchases and Sales of Securities (in 000’s)
During the six-month period ended April 30, 2013, purchases and sales of securities, other than short-term securities, were $98,433 and $109,761, respectively.
Note 8–Capital Share Transactions
| | | | | | | | |
Investor Class | | Shares | | | Amount | |
Six-month period ended April 30, 2013: | | | | | | | | |
Shares sold | | | 20,247 | | | $ | 446,314 | |
Shares issued to shareholders in reinvestment of dividends and distributions | | | 46,953 | | | | 950,805 | |
Shares redeemed | | | (31,099 | ) | | | (682,822 | ) |
| | | | |
Net increase (decrease) in shares outstanding before conversion | | | 36,101 | | | | 714,297 | |
Shares converted into Investor Class
(See Note 1) | | | 24,243 | | | | 523,266 | |
Shares converted from Investor Class
(See Note 1) | | | (12,546 | ) | | | (276,101 | ) |
| | | | |
Net increase (decrease) | | | 47,798 | | | $ | 961,462 | |
| | | | |
Year ended October 31, 2012: | | | | | | | | |
Shares sold | | | 46,781 | | | $ | 1,061,323 | |
Shares issued to shareholders in reinvestment of distributions | | | 14,664 | | | | 308,737 | |
Shares redeemed | | | (66,190 | ) | | | (1,488,502 | ) |
| | | | | | | | |
Net increase (decrease) in shares outstanding before conversion | | | (4,745 | ) | | | (118,442 | ) |
Shares converted into Investor Class
(See Note 1) | | | 40,546 | | | | 908,326 | |
Shares converted from Investor Class
(See Note 1) | | | (37,152 | ) | | | (835,306 | ) |
| | | | |
Net increase (decrease) | | | (1,351 | ) | | $ | (45,422 | ) |
| | | | |
| | |
| | | | | | | | |
| | | | | | | | |
Class A | | Shares | | | Amount | |
Six-month period ended April 30, 2013: | | | | | | | | |
Shares sold | | | 44,538 | | | $ | 997,611 | |
Shares issued to shareholders in reinvestment of dividends and distributions | | | 62,400 | | | | 1,276,072 | |
Shares redeemed | | | (94,434 | ) | | | (2,045,037 | ) |
| | | | |
Net increase (decrease) in shares outstanding before conversion | | | 12,504 | | | | 228,646 | |
Shares converted into Class A (See Note 1) | | | 16,740 | | | | 372,774 | |
Shares converted from Class A (See Note 1) | | | (2,592 | ) | | | (58,801 | ) |
| | | | |
Net increase (decrease) | | | 26,652 | | | $ | 542,619 | |
| | | | |
Year ended October 31, 2012: | | | | | | | | |
Shares sold | | | 125,997 | | | $ | 2,815,474 | |
Shares issued to shareholders in reinvestment of dividends and distributions | | | 19,782 | | | | 419,789 | |
Shares redeemed | | | (128,218 | ) | | | (2,906,985 | ) |
| | | | | | | | |
Net increase (decrease) in shares outstanding before conversion | | | 17,561 | | | | 328,278 | |
Shares converted into Class A (See Note 1) | | | 45,898 | | | | 1,043,902 | |
Shares converted from Class A (See Note 1) | | | (4,244 | ) | | | (99,763 | ) |
| | | | |
Net increase (decrease) | | | 59,215 | | | $ | 1,272,417 | |
| | | | |
| | |
| | | | | | | | |
| | |
| 26 | | MainStay Epoch U.S. All Cap Fund |
| | | | | | | | |
Class B | | Shares | | | Amount | |
Six-month period ended April 30, 2013: | | | | | | | | |
Shares sold | | | 22,472 | | | $ | 455,997 | |
Shares issued to shareholders in reinvestment of distributions | | | 32,179 | | | | 603,047 | |
Shares redeemed | | | (23,324 | ) | | | (478,899 | ) |
| | | | |
Net increase (decrease) in shares outstanding before conversion | | | 31,327 | | | | 580,145 | |
Shares converted from Class B (See Note 1) | | | (28,126 | ) | | | (561,138 | ) |
| | | | |
Net increase (decrease) | | | 3,201 | | | $ | 19,007 | |
| | | | |
Year ended October 31, 2012: | | | | | | | | |
Shares sold | | | 42,149 | | | $ | 877,730 | |
Shares issued to shareholders in reinvestment of distributions | | | 12,420 | | | | 244,607 | |
Shares redeemed | | | (58,330 | ) | | | (1,213,880 | ) |
| | | | |
Net increase (decrease) in shares outstanding before conversion | | | (3,761 | ) | | | (91,543 | ) |
Shares converted from Class B (See Note 1) | | | (48,689 | ) | | | (1,017,159 | ) |
| | | | |
Net increase (decrease) | | | (52,450 | ) | | $ | (1,108,702 | ) |
| | | | |
| | |
| | | | | | | | |
Class C | | Shares | | | Amount | |
Six-month period ended April 30, 2013: | | | | | | | | |
Shares sold | | | 19,783 | | | $ | 394,915 | |
Shares issued to shareholders in reinvestment of distributions | | | 13,455 | | | | 252,416 | |
Shares redeemed | | | (15,206 | ) | | | (313,117 | ) |
| | | | |
Net increase (decrease) | | | 18,032 | | | $ | 334,214 | |
| | | | |
Year ended October 31, 2012: | | | | | | | | |
Shares sold | | | 31,218 | | | $ | 648,911 | |
Shares issued to shareholders in reinvestment of distributions | | | 7,313 | | | | 144,288 | |
Shares redeemed | | | (97,170 | ) | | | (2,042,595 | ) |
| | | | |
Net increase (decrease) | | | (58,639 | ) | | $ | (1,249,396 | ) |
| | | | |
| | |
| | | | | | | | |
| | | | | | | | |
Class I | | Shares | | | Amount | |
Six-month period ended April 30, 2013: | | | | | | | | |
Shares sold | | | 2,584,594 | | | $ | 61,962,644 | |
Shares issued to shareholders in reinvestment of dividends and distributions | | | 2,182,822 | | | | 47,825,632 | |
Shares redeemed | | | (2,914,587 | ) | | | (69,090,008 | ) |
| | | | |
Net increase (decrease) | | | 1,852,829 | | | $ | 40,698,268 | |
| | | | |
Year ended October 31, 2012: | | | | | | | | |
Shares sold | | | 3,132,067 | | | $ | 75,267,836 | |
Shares issued to shareholders in reinvestment of dividends and distributions | | | 1,114,587 | | | | 25,145,097 | |
Shares redeemed | | | (12,158,673 | ) | | | (295,011,100 | ) |
| | | | |
Net increase (decrease) | | | (7,912,019 | ) | | $ | (194,598,167 | ) |
| | | | |
Note 9–Subsequent Events
In connection with the preparation of the financial statements of the Fund as of and for the six-month period ended April 30, 2013, events and transactions subsequent to April 30, 2013, through the date the financial statements were issued have been evaluated by the Fund’s management for possible adjustment and/or disclosure. No subsequent events requiring financial statement adjustment or disclosure have been identified except as described below:
At a meeting held on March 21, 2013, the Board approved the continued retention of Epoch as the Fund’s subadvisor under the terms of an interim subadvisory agreement that took effect on March 27, 2013, following the closing of the Epoch Holding Merger (See Note 3). The Board also approved a new subadvisory agreement with Epoch that has identical terms to the previous subadvisory agreement in all material respects. Shareholder approval of the continued retention of Epoch as subadvisor and the new subadvisory agreement is required. The continued retention of Epoch as subadvisor and the new subadvisory agreement, among other proposals, are being considered by shareholders at a special meeting scheduled for July 1, 2013.
| | | | |
| mainstayinvestments.com | | | 27 | |
I. Board Consideration and Approval of Management Agreement and
Subadvisory Agreement (Unaudited)
Section 15(c) of the Investment Company Act of 1940, as amended (the “1940 Act”) requires that each mutual fund’s board of trustees, including a majority of the independent trustees, annually review and approve the fund’s investment advisory agreements. At its December 10-12, 2012 meeting, the Board of Trustees of the MainStay Group of Funds (“Board”) unanimously approved the Management Agreement with respect to the MainStay Epoch U.S. All Cap Fund (“Fund”) and New York Life Investment Management LLC (“New York Life Investments”), and the Subadvisory Agreement between New York Life Investments and Epoch Investment Partners, Inc. (“Epoch”) with respect to the Fund.
In reaching its decision to approve the Agreements, the Board considered information furnished by New York Life Investments and Epoch in connection with a contract review process that took place at various meetings of the Board and its Contracts Committee between September 2012 and December 2012, as well as other relevant information furnished to the Board throughout the year by New York Life Investments and Epoch. Information requested by and furnished to the Board in connection with the contract review process included, among other items, reports on the Fund prepared by Strategic Insight Mutual Fund Research and Consulting, LLC (“Strategic Insight”), an independent third-party service provider engaged by the Board to report objectively on the Fund’s investment performance, management and subadvisory fees and ordinary operating expenses. The Board also considered information provided by New York Life Investments and Epoch on the fees charged to other investment advisory clients (including institutional separate accounts) that follow investment strategies similar to the Fund, and the rationale for any differences in the Fund’s management and subadvisory fees and the fees charged to those other investment advisory clients. In addition, the Board requested and received information on the profitability of the Fund to New York Life Investments and its affiliates and Epoch, and responses from New York Life Investments and Epoch to a series of questions encompassing a variety of topics prepared on behalf of the Board by independent legal counsel to the Board and its independent trustees (the “Independent Trustees”). Information provided to the Board at its meetings throughout the year included, among other items, detailed investment performance reports on the Fund prepared by the Investment Consulting Group at New York Life Investments. The structure and format for this regular reporting was developed in consultation with the Board. The Board also received from New York Life Investments throughout the year, among other items, periodic reports on legal and compliance matters, portfolio turnover, and sales and marketing activity.
In determining to approve the Agreements, the members of the Board reviewed and evaluated all of the information and factors they believed to be relevant and appropriate in light of legal advice furnished to them by independent legal counsel and through the exercise of their own business judgment. The broad factors considered by the Board are discussed in greater detail below, and included, among other items: (i) the nature, scope and quality of the services provided to the Fund by New York Life Investments and Epoch; (ii) the investment performance of the Fund, New York Life Investments and Epoch; (iii) the costs of the services provided, and profits realized, by New York Life Investments and Epoch from their relationship with the Fund; (iv) the extent to which economies of scale may be realized as the Fund grows, and the extent to which economies of scale may benefit Fund investors; and (v) the
reasonableness of the Fund’s management and subadvisory fees and overall total ordinary operating expenses, particularly as compared to similar funds and accounts managed by New York Life Investments and Epoch and third-party “peer funds” identified by Strategic Insight.
While individual members of the Board may have weighed certain factors differently, the Board’s decision to approve the Agreements was based on a consideration of all the information provided to the Board, including information provided to the Board throughout the year and specifically in connection with the contract review process. The Board’s conclusions with respect to the Agreements also were based, in part, on the Board’s consideration of the Agreements in prior years. In addition to considering the above-referenced factors, the Board observed that in the marketplace there are a range of investment options available to shareholders of the Fund, and that the Fund’s shareholders, having had the opportunity to consider other investment options, have chosen to invest in the Fund. A more detailed discussion of the factors that figured prominently in the Board’s decisions to approve the Agreements is provided below.
Nature, Scope and Quality of Services to Be Provided by New York Life Investments and Epoch
The Board examined the nature, scope and quality of the services that New York Life Investments provides to the Fund. The Board evaluated New York Life Investments’ experience in serving as manager of the Fund, noting that New York Life Investments manages other mutual funds, serves a variety of other investment advisory clients, including other pooled investment vehicles, and has experience with overseeing mutual fund service providers, including subadvisors. The Board considered the experience of senior personnel at New York Life Investments providing management and administrative services to the Fund, as well as New York Life Investments’ reputation and financial condition. The Board also considered the full range of non-advisory services that New York Life Investments supplies to the Fund under the terms of the Management Agreement, including: (i) fund accounting services provided by New York Life Investments’ Fund Accounting and Administration Group; (ii) investment oversight and analytical services provided by New York Life Investments’ Investment Consulting Group; (iii) compliance services provided by New York Life Investments’ compliance department, including oversight and implementation of the Fund’s compliance program; and (iv) legal services provided by New York Life Investments’ Office of the General Counsel. Additional information about the non-advisory services provided by New York Life Investments is set forth in the Fund’s Management Agreement. The Board also considered New York Life Investments’ willingness to invest in personnel that benefit the Fund, and noted that New York Life Investments is responsible for compensating the Fund’s officers. The Board also considered benefits to shareholders of being part of the MainStay Group of Funds, including the privilege of exchanging investments between the same class of shares without the imposition of a sales charge, as described more fully in the Fund’s prospectus.
The Board also examined the nature, scope and quality of the advisory services that Epoch provides to the Fund. The Board evaluated Epoch’s experience in serving as subadvisor to the Fund and managing other portfolios. It examined Epoch’s track record and experience in providing investment advisory services, the experience of investment advisory,
| | |
| 28 | | MainStay Epoch U.S. All Cap Fund |
senior management and administrative personnel at Epoch, and Epoch’s overall legal and compliance environment. The Board also reviewed Epoch’s willingness to invest in personnel that benefit the Fund. In this regard, the Board considered the experience of the Fund’s portfolio managers, the number of accounts managed by the portfolio managers and the method for compensating portfolio managers.
Based on these considerations, the Board concluded, within the context of its overall determinations regarding the Agreements, that the Fund should continue to benefit from the nature, scope and quality of these services as a result of New York Life Investments’ and Epoch’s experience, personnel, operations and resources.
Investment Performance
In evaluating the Fund’s investment performance, the Board considered investment performance results in light of the Fund’s investment objective, strategies and risks, as disclosed in the Fund’s prospectus. The Board particularly considered detailed investment reports on the Fund’s performance provided to the Board throughout the year by the Investment Consulting Group of New York Life Investments. These reports include, among other items, information on the Fund’s gross and net returns, the Fund’s investment performance relative to relevant investment categories and Fund benchmarks, the Fund’s risk-adjusted investment performance, and the Fund’s investment performance as compared to similar competitor funds, as appropriate. The Board also considered information provided by Strategic Insight showing the investment performance of the Fund as compared to peer funds.
In considering the Fund’s investment performance, the Board focused principally on the Fund’s long-term performance track record. The Board also gave weight to its ongoing discussions with senior management at New York Life Investments concerning the Fund’s investment performance, as well as discussions between the Fund’s portfolio managers and the Board that occur typically on an annual basis. In addition, the Board considered any specific actions that New York Life Investments or Epoch had taken, or had agreed with the Board to take, to enhance Fund investment performance, and the results of those actions.
Based on these considerations, the Board concluded, within the context of its overall determinations regarding the Agreements, that the long-term investment performance of the Fund, along with ongoing efforts by New York Life Investments and Epoch to enhance investment returns, supported a determination to approve the Agreements. The Fund discloses more information about investment performance in the Portfolio Management Discussion and Analysis, Investment and Performance Comparison and Financial Highlights sections of this Semiannual Report and in the Fund’s prospectus.
Costs of the Services Provided, and Profits Realized, by New York Life Investments and Epoch
The Board considered the costs of the services provided by New York Life Investments and Epoch under the Agreements, and the profits realized by New York Life Investments and its affiliates and Epoch due to their relationships with the Fund. Because Epoch’s subadvisory fees are negotiated at arm’s-length by New York Life Investments and are paid by New York Life Investments, not the Fund, the Board principally considered the profits realized by New York Life Investments and its affiliates with respect to the Fund.
In evaluating the costs and profits of New York Life Investments and its affiliates and Epoch, the Board considered, among other factors, each party’s investments in personnel, systems, equipment and other resources necessary to manage the Fund, and that New York Life Investments is responsible for paying the subadvisory fees for the Fund. The Board acknowledged that New York Life Investments and Epoch must be in a position to pay and retain experienced professional personnel to provide services to the Fund, and that the ability to maintain a strong financial position is important in order for New York Life Investments and Epoch to continue to provide high-quality services to the Fund. The Board also noted that the Fund benefits from the allocation of certain fixed costs across the MainStay Group of Funds.
In addition, the Board noted the difficulty in obtaining reliable comparative data about mutual fund managers’ profitability, since such information generally is not publicly available and may be impacted by numerous factors, including the structure of a fund manager’s organization, the types of funds it manages, the methodology used to allocate certain fixed costs to specific funds, and the manager’s capital structure and costs of capital. While recognizing the difficulty in evaluating a manager’s profitability with respect to the Fund, and noting that other profitability methodologies may also be reasonable, the Board concluded that the profitability methodology presented by New York Life Investments to the Board, which was developed by New York Life Investments in consultation with an independent consultant, was reasonable in all material respects.
In considering the costs and profitability of the Fund, the Board also considered certain fall-out benefits that may be realized by New York Life Investments and its affiliates due to their relationships with the Fund. The Board recognized, for example, the benefits to Epoch from legally permitted “soft-dollar” arrangements by which brokers provide research and other services to Epoch in exchange for commissions paid by the Fund with respect to trades on the Fund’s portfolio securities. The Board also requested and received information from New York Life Investments and Epoch concerning other business relationships between Epoch and its affiliates and New York Life Investments and its affiliates.
The Board further considered that, in addition to fees earned by New York Life Investments for managing the Fund, New York Life Investments’ affiliates also earn revenues from serving the Fund in various other capacities, including as the Fund’s transfer agent and distributor. The Board observed that information about these other revenues, and their impact on the profitability of the Fund to New York Life Investments and its affiliates, was furnished to the Board as part of the 15(c) process. The Board noted that, although it assessed the overall profitability of the Fund to New York Life Investments and its affiliates as part of the contract review process, when considering the reasonableness of the fees to be paid to New York Life Investments and its affiliates under the Agreements, the Board considered the profitability of New York Life Investments’ relationship with the Fund on a pre-tax basis, and without regard to distribution expenses.
After evaluating the information presented to the Board, the Board concluded, within the context of its overall determinations regarding the Agreements, that any profits realized by New York Life Investments and its affiliates due to their relationships with the Fund supported the Board’s decision to approve the Agreements. With respect to Epoch, the
| | | | |
| mainstayinvestments.com | | | 29 | |
I. Board Consideration and Approval of Management Agreement and
Subadvisory Agreement (Unaudited) (continued)
Board concluded that any profits realized by Epoch due to its relationship with the Fund are the result of arm’s-length negotiations between New York Life Investments and Epoch, and are based on fees paid to Epoch by New York Life Investments, not the Fund.
Extent to Which Economies of Scale May Be Realized as the Fund Grows
The Board also considered whether the Fund’s expense structure permitted economies of scale to be shared with Fund investors. The Board reviewed information from New York Life Investments showing how the Fund’s management fee schedule compared to fee schedules of other funds and accounts managed by New York Life Investments. The Board also reviewed information from Strategic Insight showing how the Fund’s management fee schedule hypothetically would compare with fees paid for similar services by peer funds at varying asset levels. While recognizing the difficulty of determining economies of scale with precision, the Board acknowledged that economies of scale may be shared with the Fund in a number of ways, including, for example, through the imposition of management fee breakpoints and by initially setting relatively lower management fees.
Based on this information, the Board concluded, within the context of its overall determinations regarding the Agreements, that the Fund’s expense structure appropriately reflects economies of scale for the benefit of Fund investors. The Board noted, however, that it would continue to evaluate the reasonableness of the Fund’s expense structure as the Fund grows over time.
Management and Subadvisory Fees and Total Ordinary Operating Expenses
The Board evaluated the reasonableness of the fees to be paid under the Agreements and the Fund’s expected total ordinary operating expenses. The Board primarily considered the reasonableness of the management fee paid by the Fund to New York Life Investments, since the fees paid to Epoch are paid by New York Life Investments, not the Fund.
In assessing the reasonableness of the Fund’s fees and expenses, the Board primarily considered comparative data provided by Strategic Insight on the fees and expenses charged by similar mutual funds managed by other investment advisers. In addition, the Board considered information provided by New York Life Investments and Epoch on fees charged to other investment advisory clients, including institutional separate accounts and other funds with similar investment objectives as the Fund. The Board particularly considered differences in the contractual management fee schedules of the retail MainStay Funds and similarly-managed MainStay VP Portfolios, taking into account New York Life Investments’ rationale for any differences in fee schedules. The Board also took into account explanations provided by New York Life Investments about the different scope of services provided to mutual funds as compared with other investment advisory clients. Additionally, the Board considered the impact of any expense limitation arrangements on the Fund’s net management fee and expenses.
The Board noted that, outside of the Fund’s management fee and the fees charged under a share class’s Rule 12b-1 and/or shareholder services plans, a share class’s most significant “other expenses” are transfer agent fees. Transfer agent fees are charged to the Fund based
on the number of shareholder accounts (a “per-account” fee) as compared with certain other fees (e.g., management fees), which are charged based on the Fund’s average net assets. The Board took into account information from New York Life Investments showing that the Fund’s transfer agent fee schedule is reasonable, including industry data showing that the per-account fees that NYLIM Service Company LLC, the Fund’s transfer agent, charges the Fund are within the range of per-account fees charged by transfer agents to other mutual funds. In addition, the Board considered NYLIM Service Company LLC’s profitability in connection with the transfer agent services it provides to the Fund.
The Board acknowledged that, because the Fund’s transfer agent fees are billed on a per-account basis, the impact of transfer agent fees on a share class’s expense ratio may be more significant in cases where the share class has a high number of accounts with limited assets (i.e., small accounts). The Board observed that transfer agent fees are a significant portion of total expenses of many Funds in the MainStay Group of Funds. The impact of transfer agent fees on the expense ratios of these MainStay Funds tend to be greater than for other open-end retail funds, because the MainStay Group of Funds generally has a significant number of small accounts relative to competitor funds. The Board acknowledged the role that the MainStay Group of Funds historically has played in serving the investment needs of New York Life Insurance Company (“New York Life”) policyholders, who often maintain smaller account balances than other fund investors. The Board discussed measures that it and New York Life Investments have taken in recent years to mitigate the effect of small accounts on the expense ratios of Fund share classes, including: (i) encouraging New York Life agents to consolidate multiple small accounts held by the same investor into one MainStay Asset Allocation Fund account; (ii) increasing investment minimums from $500 to $1,000 in 2003; (iii) introducing Investor Class shares for certain MainStay Funds in early 2008 to consolidate smaller account investors; (iv) closing small accounts with balances below $250 in Investor Class shares or $750 in all other classes of shares; (v) no longer allowing an exception with no minimum investment amount with respect to AutoInvest accounts with subsequent monthly purchases of $100; (vi) since 2007, charging an annual $20.00 small account fee on certain accounts with balances below $1,000; and (vii) modifying the approach for billing transfer agent expenses to reduce the degree of subsidization by large accounts of smaller accounts. In addition, the Board acknowledged New York Life Investments’ efforts to encourage intermediaries to consolidate small accounts in multiple Funds held by the same investor into a single Asset Allocation Fund account, if appropriate under the circumstances, in an effort to mitigate the effect of small accounts on the Funds in the MainStay Group of Funds.
After considering all of the factors outlined above, the Board concluded that the Fund’s management and subadvisory fees and total ordinary operating expenses were within a range that is competitive and, within the context of the Board’s overall conclusions regarding the Agreements, support a conclusion that these fees and expenses are reasonable.
Conclusion
On the basis of the information provided to it and its evaluation thereof, the Board, including the Independent Trustees, unanimously voted to approve the Agreements.
| | |
| 30 | | MainStay Epoch U.S. All Cap Fund |
II. Board Consideration and Approval of Interim Subadvisory Agreement and
New Subadvisory Agreement (Unaudited)
At its March 21, 2013 meeting, the Board unanimously approved an interim Subadvisory Agreement (the “Interim Subadvisory Agreement”) between New York Life Investments and Epoch on behalf of the Fund that took effect on March 27, 2013, as well as a new Subadvisory Agreement (the “Subadvisory Agreement”) between New York Life Investments and Epoch to take effect upon approval by shareholders of the Fund. The Board was asked to approve the Interim Subadvisory Agreement and Subadvisory Agreement in connection with a “change in control” of Epoch and, accordingly, the termination by law and the express terms of the previous subadvisory agreement between New York Life Investments and Epoch with respect to the Fund.
On March 27, 2013, Epoch Holding Corporation (“Epoch Holding”) merged with Empire Merger Sub, Inc., a wholly-owned subsidiary of The Toronto-Dominion Bank, a Canadian chartered bank (“Epoch Holding Merger”) following the approval of Epoch Holding shareholders. As a result, Epoch Holding became a wholly-owned subsidiary of The Toronto-Dominion Bank (“TD Bank”). Epoch Holding is the parent company of Epoch. The closing of the Epoch Holding Merger resulted in a “change of control” of Epoch.
In reaching its decision to approve the continued retention of Epoch and the Interim Subadvisory Agreement and Subadvisory Agreement, the Board considered information presented to it by New York Life Investments, Epoch and TD Bank as part of its consideration and approval of the Interim Subadvisory Agreement and Subadvisory Agreement at the Board’s meeting in March 2013, as well as other relevant information furnished to it throughout the year by New York Life Investments and Epoch at regular and special Board meetings. The Board also requested and received responses from Epoch to a comprehensive list of questions encompassing a variety of topics prepared on behalf of the Board by independent legal counsel to the Board. The Board noted that it had also requested and received responses to similar questions in connection with its annual approval of the previous subadvisory agreement with Epoch at various meetings of the Board and its Contracts Committee between September 2012 and December 2012. The Board considered its historical experience with Epoch’s capabilities and resources, and its evaluation of Epoch in connection with previous contract review processes, including the contract review process that culminated with approval of the previous subadvisory agreement between New York Life Investments and Epoch, on behalf of the Fund (the “Prior Contract Review Processes”).
In determining to approve the continued retention of Epoch and approve the Interim Subadvisory Agreement and Subadvisory Agreement, the members of the Board reviewed and evaluated all of the information and factors they believed to be relevant and appropriate in light of legal advice furnished to them by independent legal counsel and through the exercise of their own business judgment. The broad factors considered by the Board are discussed in greater detail below, and included, among other things: (i) the nature, scope and quality of the services to be provided to the Fund by Epoch; (ii) the investment performance of the Fund; (iii) the costs of the services to be provided and the profits to be realized by Epoch and its affiliates from its relationship with the Fund; (iv) the extent to which economies of scale may be realized as the Fund grows, and the extent to which economies of scale may benefit Fund investors;
and (v) the reasonableness of the Fund’s management and subadvisory fee levels and overall total ordinary operating expenses.
While the members of the Board may have weighed certain factors differently, the Board’s decision to approve the continued retention of Epoch and approve the Interim Subadvisory Agreement and Subadvisory Agreement was based on a comprehensive consideration of all the information provided to the Board, including information provided to the Board in connection with its review of Epoch. A more detailed discussion of the factors that figured prominently in the Board’s decision to approve the continued retention of Epoch and approve the Interim Subadvisory Agreement and Subadvisory Agreement is provided below.
Nature, Scope and Quality of Services to Be Provided by Epoch
In considering the approval of the continued retention of Epoch and approval of the Interim Subadvisory Agreement and Subadvisory Agreement, the Board examined the nature, scope and quality of the services that Epoch historically had provided to the Fund. Based on information provided to the Board in connection with the Prior Contract Review Processes, the Board acknowledged Epoch’s historical service to the Fund, and took note of the experience of Epoch’s portfolio managers, the number of accounts managed by the portfolio managers and Epoch’s method for compensating portfolio managers. The Board also considered the experience of senior personnel at Epoch, and Epoch’s plans for retaining key personnel in connection with the acquisition of Epoch Holding by TD Bank. Based on these considerations, the Board concluded, within the context of its overall determinations regarding the Interim Subadvisory Agreement and Subadvisory Agreement, that the Fund should continue to benefit from the nature, scope and quality of these services as a result of Epoch’s experience, personnel, operations and resources.
Investment Performance
In evaluating investment performance, the Board took note of the Fund’s historical investment performance results, as presented to the Board in connection with the Prior Contract Review Processes, in light of the Fund’s investment objective, strategies and risks, as disclosed in the Fund’s prospectus. The Board considered information about the Fund’s investment performance that is provided to the Board in connection with its regularly scheduled meetings, and also took note of information provided in connection with the Prior Contract Review Processes showing the investment performance of the Fund as compared to peer funds. The Board also considered the strength of Epoch’s resources (including research capabilities). Based on these considerations, the Board concluded, within the context of its overall determinations regarding the Interim Subadvisory Agreement and Subadvisory Agreement, that the retention of Epoch as subadvisor to the Fund is likely to benefit the Fund’s long-term investment performance.
Costs of the Services to Be Provided, and Profits to Be Realized, by Epoch
The Board considered the costs of the services to be provided by Epoch under the Interim Subadvisory Agreement and Subadvisory Agreement, and the profits to be realized by Epoch due to its relationship with the
| | | | |
| mainstayinvestments.com | | | 31 | |
II. Board Consideration and Approval of Interim Subadvisory Agreement and
New Subadvisory Agreement (Unaudited) (continued)
Fund, taking into account information provided to the Board in connection with the Prior Contract Review Processes. The Board noted that, in connection with the Prior Contract Review Processes, Epoch has provided the Board with information about its profitability in connection with its relationship with the Fund. In addition, the Board considered past representations from Epoch and New York Life Investments that the subadvisory fee paid by New York Life Investments to Epoch was the result of arm’s-length negotiations. Because Epoch’s subadvisory fee is paid by New York Life Investments, and not the Fund, the Board historically has focused principally on the profitability of the Fund to New York Life Investments and its affiliates.
In evaluating the costs of the services provided by Epoch in connection with the Prior Contract Review Processes, the Board considered, among other things, Epoch’s investments in personnel, systems, equipment and other resources necessary to manage the Fund, and the fact that New York Life Investments is responsible for paying the subadvisory fee for the Fund. The Board acknowledged that Epoch must be in a position to pay and retain experienced professional personnel to provide services to the Fund, and that Epoch’s ability to maintain a strong financial position is important in order for Epoch to provide high-quality ongoing services to the Fund and its investors.
The Board also considered certain fall-out benefits that may be realized by Epoch due to its relationship with the Fund. The Board recognized, for example, the benefits to Epoch from legally permitted “soft-dollar” arrangements by which brokers may provide research and other services to Epoch in exchange for commissions paid by the Fund with respect to trades on the Fund’s portfolio securities.
As part of the Prior Contract Review Processes, the Board requested and received information from Epoch and New York Life Investments concerning other business relationships between Epoch and its affiliates and New York Life Investments and its affiliates. The Board requested and received assurances that these other business relationships did not impact New York Life Investments’ recommendation for Epoch to serve as the Fund’s subadvisor, and that neither New York Life Investments nor its affiliates are expected to benefit in its other business relationships due to Epoch’s continued engagement as the Fund’s subadvisor.
After evaluating the information presented to the Board, the Board concluded, within the context of its overall determinations regarding the Interim Subadvisory Agreement and Subadvisory Agreement, that any profits to be realized by Epoch due to its relationship with the Fund supported the Board’s determination to approve the Interim Subadvisory Agreement and Subadvisory Agreement. The Board also concluded that any profits to be realized by Epoch will be the result of arm’s-length negotiations between New York Life Investments and Epoch, and will be based on subadvisory fees paid to Epoch by New York Life Investments, not the Fund.
Extent to Which Economies of Scale May Be Realized as the Fund Grows
The Board also considered whether the Fund’s expense structure permitted economies of scale to be shared with the Fund’s investors, taking into account information provided to the Board in connection with the Prior Contract Review Processes.
Based on this information, the Board concluded, within the context of its overall determinations regarding the Interim Subadvisory Agreement and Subadvisory Agreement, that the Fund’s expense structure appropriately reflects economies of scale for the benefit of Fund investors. The Board noted, however, that it would continue to evaluate the reasonableness of the Fund’s expense structure as the Fund grows over time.
Reasonableness of Subadvisory Fees
The Board evaluated the reasonableness of the fees to be paid under the existing management agreement with New York Life Investments and the Interim Subadvisory Agreement and Subadvisory Agreement, and the Fund’s expected total ordinary operating expenses. The Board considered that the fees to be paid to Epoch under the Interim Subadvisory Agreement and Subadvisory Agreement will be paid by New York Life Investments, not the Fund, and will result in no increase in the Fund’s expenses. In assessing the reasonableness of the Fund’s fees and expenses the Board primarily considered comparative data provided to the Board in connection with the Prior Contract Review Processes on the fees and expenses charged by similar mutual funds managed by other investment advisers. In addition, the Board considered information provided by New York Life Investments and Epoch on fees charged to other investment advisory clients, including institutional separate accounts and other funds with similar investment objectives as the Fund. In this regard, the Board took into account explanations from New York Life Investments and Epoch about the different scope of services provided to retail mutual funds as compared with other investment advisory clients. The Board also took into account the impact of any expenses limitation arrangements on the Fund’s net expenses.
After considering all of the factors outlined above, the Board concluded that the Fund’s management and subadvisory fees and total ordinary operating expenses were within a range that is competitive and, within the context of the Board’s overall conclusions regarding the Interim Subadvisory Agreement and Subadvisory Agreement, support a conclusion that these fees and expenses are reasonable.
Conclusion
On the basis of the information provided to it and its evaluation thereof, the Board, including the Independent Trustees, unanimously voted to approve the Interim Subadvisory Agreement and Subadvisory Agreement.
| | |
| 32 | | MainStay Epoch U.S. All Cap Fund |
Proxy Voting Policies and Procedures and Proxy Voting Record
A description of the policies and procedures that New York Life Investments uses to vote proxies related to the Fund’s securities is available without charge, upon request, (i) by visiting the Fund’s website at mainstayinvestments.com; and (ii) on the Securities and Exchange Commission’s (“SEC”) website at www.sec.gov.
The Fund is required to file with the SEC its proxy voting record for the 12-month period ending June 30 on Form N-PX. The Fund’s most recent Form N-PX is available free of charge upon request by calling 800-MAINSTAY (624-6782); visiting the Fund’s website at mainstayinvestments.com; or on the SEC’s website at www.sec.gov.
Shareholder Reports and Quarterly Portfolio Disclosure
The Fund is required to file its complete schedule of portfolio holdings with the SEC for its first and third fiscal quarters on Form N-Q. The Fund’s Form N-Q is available without charge, on the SEC’s website at www.sec.gov or by calling MainStay Investments at 800-MAINSTAY (624-6782). You also can obtain and review copies of Form N-Q by visiting the SEC’s Public Reference Room in Washington, DC (information on the operation of the Public Reference Room may be obtained by calling 1-800-SEC-0330).
| | | | |
| mainstayinvestments.com | | | 33 | |
This page intentionally left blank
MainStay Funds
MainStay offers a wide range of Funds for virtually any investment need. The full array of MainStay open-end offerings is listed here, with information about the manager, subadvisors, legal counsel and independent registered public accounting firms.
Equity
U.S. Equity Funds
MainStay Common Stock Fund
MainStay Cornerstone Growth Fund
MainStay Epoch U.S. All Cap Fund
MainStay Epoch U.S. Equity Yield Fund
MainStay ICAP Equity Fund
MainStay ICAP Select Equity Fund
MainStay Large Cap Growth Fund1
MainStay MAP Fund
MainStay S&P 500 Index Fund
MainStay U.S. Equity Opportunities Fund
MainStay U.S. Small Cap Fund
International/Global Equity Funds
MainStay Epoch Global Choice Fund
MainStay Epoch Global Equity Yield Fund
MainStay Epoch International Small Cap Fund
MainStay ICAP Global Fund
MainStay ICAP International Fund
MainStay International Equity Fund
MainStay International Opportunities Fund
Income
Taxable Bond Funds
MainStay Floating Rate Fund
MainStay Global High Income Fund
MainStay Government Fund
MainStay High Yield Corporate Bond Fund
MainStay High Yield Opportunities Fund
MainStay Indexed Bond Fund
MainStay Intermediate Term Bond Fund
MainStay Short Duration High Yield Fund
MainStay Short Term Bond Fund
MainStay Unconstrained Bond Fund
Municipal Bond Funds
MainStay California Tax Free Opportunities Fund2
MainStay High Yield Municipal Bond Fund
MainStay New York Tax Free Opportunities Fund3
MainStay Tax Free Bond Fund
Money Market Fund
MainStay Money Market Fund
Mixed Asset
MainStay Balanced Fund
MainStay Convertible Fund
MainStay Income Builder Fund
MainStay Marketfield Fund
Asset Allocation/Target Date
MainStay Conservative Allocation Fund
MainStay Growth Allocation Fund
MainStay Moderate Allocation Fund
MainStay Moderate Growth Allocation Fund
MainStay Retirement 2010 Fund
MainStay Retirement 2020 Fund
MainStay Retirement 2030 Fund
MainStay Retirement 2040 Fund
MainStay Retirement 2050 Fund
Manager
New York Life Investment Management LLC
New York, New York
Subadvisors
Cornerstone Capital Management Holdings LLC4
New York, New York
Cornerstone Capital Management LLC4
Bloomington, Minnesota
Epoch Investment Partners, Inc.
New York, New York
Institutional Capital LLC4
Chicago, Illinois
MacKay Shields LLC4
New York, New York
Marketfield Asset Management LLC
New York, New York
Markston International LLC
White Plains, New York
Winslow Capital Management LLC
Minneapolis, Minnesota
Legal Counsel
Dechert LLP
Independent Registered Public Accounting Firms
KPMG LLP
PricewaterhouseCoopers LLP
1. Effective January 13, 2012, the Fund was closed to new investors with certain exceptions.
2. This Fund is only registered for sale in AZ, CA, NV, OR, UT, and WA.
3. This Fund is only registered for sale in CT, DE, FL, MA, NJ, NY, and VT.
4. An affiliate of New York Life Investment Management LLC.
Not part of the Semiannual Report
For more information
800-MAINSTAY (624-6782)
mainstayinvestments.com
The MainStay Funds® are managed by New York Life Investment Management LLC and distributed through NYLIFE Distributors LLC, 169 Lackawanna Avenue, Parsippany, NJ 07054, a wholly owned subsidiary of New York Life Insurance Company. NYLIFE Distributors LLC is a Member FINRA/SIPC.
MainStay Investments® is a registered service mark and name under which New York Life Investment Management LLC does business. MainStay Investments, an indirect subsidiary of New York Life Insurance Company, New York, NY 10010, provides investment advisory products and services.
This report may be distributed only when preceded or accompanied by a current Fund prospectus.
©2013 NYLIFE Distributors LLC. All rights reserved.
| | | | | | | | |
| Not FDIC/NCUA Insured | | Not a Deposit | | May Lose Value | | No Bank Guarantee | | Not Insured by Any Government Agency |
| | |
| NYLIM-30066 MS175-13 | | MSEUAC10-06/13 NL0A1 |
MainStay S&P 500 Index Fund
Message from the President and Semiannual Report
Unaudited | April 30, 2013


This page intentionally left blank
Message from the President
The U.S. stock market advanced during the six months ended April 30, 2013, generally providing double-digit returns at all capitalization levels. Value stocks tended to outpace growth stocks among large- and mid-capitalization companies, while growth stocks tended to outpace value stocks among smaller companies.
The market’s advance, however, was far from uniform. Stocks declined in early November, both before and immediately after the U.S. presidential election. Following a sharp recovery, stocks climbed until mid-December, when a Congressional stalemate on the fiscal cliff led to a brief decline. Another dip occurred in late February as investors speculated that the Federal Open Market Committee (FOMC) might stop purchasing mortgage-backed securities sooner than expected. Stocks also dipped in mid-April, as consumer sentiment dropped after the Boston marathon bombing. Despite these setbacks, U.S. stocks continued to trend upward during the six-month reporting period.
International stock markets also advanced, with several regional differences. Accommodative action by the Bank of Japan helped lower the yen and lift Japanese stocks to their highest levels since 2008. In Europe, stocks did well until early February, bolstered by the promise of support for the euro. As the year progressed, however, economic contraction, rising unemployment and systematic banking concerns took a toll on investor enthusiasm. In China, manufacturing slowed as the nation sought to balance growth and inflation risks. On the Korean peninsula, tensions rose as North Korea continued to threaten its neighbors, which added an undercurrent of caution to the market.
During the six months ended April 30, 2013, the FOMC kept the federal funds rate in a range close to zero. The FOMC also continued its direct purchases of mortgage-backed securities and longer-term U.S. government securities. With short-term interest rates likely to remain at low levels, many bond investors pursued higher yields by lengthening maturities and assuming greater risk. As a result, bonds with higher risk profiles tended
to outperform higher-quality investment-grade bonds and U.S. Treasury securities. Cash and cash equivalents essentially returned zero.
With wide variations in the performance of various asset classes, some investors might be tempted to chase higher returns by shifting back and forth between stocks and bonds. Since no one can predict where the market will move next, however, we encourage investors to select an appropriate mix of investments for their risk tolerance and time horizon and to stick with that mix, making only minor adjustments over time.
At MainStay Funds, our portfolio managers use a similar approach. Careful security selection and thoughtful sell disciplines help them pursue the investment objectives of their respective Funds. Using the principal investment strategies outlined in the Prospectus, they focus primarily on providing long-term investment potential for our shareholders.
Has this approach proved successful? In its most recent rankings, Barron’s listed MainStay Funds as the #1 fund family over the past 10 years. We were also the only mutual fund family that has appeared in Barron’s top six for the past five consecutive years.
The pages that follow provide additional insight into the specific market events, investment decisions and securities that shaped your MainStay Fund(s) during the six months ended April 30, 2013. We encourage you to read the semiannual report(s) carefully and to evaluate your results with your long-term financial goals in mind.
Sincerely,

Stephen P. Fisher
President
The opinions expressed are as of the date of this report and are subject to change. There is no guarantee that any forecast made will come to pass. This material does not constitute investment advice and is not intended as an endorsement of any specific investment.
To qualify for the Lipper/Barron’s Fund Survey, a fund family must have at least three funds in Lipper’s general U.S.-stock category, one in world equity (which combines global and international funds), one mixed-equity fund (which holds stocks and bonds), two taxable-bond funds, and one tax-exempt fund. Fund loads and 12b-1 fees aren’t included in the calculation of returns because the aim is to measure the manager’s skill. Each fund’s return is measured against all funds in its Lipper category, resulting in a percentile ranking which is then weighted by asset size relative to the fund family’s other assets in its general classifications. Finally, the score is multiplied by the general classification weightings as determined by the entire Lipper universe of funds.
Source: Barron’s, 2/9/13. Overall, MainStay Funds ranked number 56 for the one-year period, 20 for the five-year period and one for the 10-year period ended December 31, 2012, out of 62, 53 and 46 fund families, respectively. MainStay ranked number three for the 10-year period in 2009, 2010 and 2011 from among 48, 46 and 45 fund families, respectively. MainStay ranked number six from among 48 fund families for the 10-year period in 2008. Past performance is no guarantee of future results, which will vary. For the most recent MainStay Funds performance, please visit our website at mainstayinvestments.com. All mutual funds are subject to market risk and will fluctuate in value.
Not part of the Semiannual Report
Table of Contents
Investors should refer to the Fund’s Summary Prospectus and/or Prospectus and consider the Fund’s investment objectives, strategies, risks, charges and expenses carefully before investing. The Summary Prospectus and/or Prospectus contain this and other information about the Fund. You may obtain copies of the Fund’s Summary Prospectus, Prospectus and Statement of Additional Information free of charge, upon request, by calling toll-free 800-MAINSTAY (624-6782), by writing to NYLIFE Distributors LLC, Attn: MainStay Marketing Department, 169 Lackawanna Avenue, Parsippany, New Jersey 07054 or by sending an e-mail to MainStayShareholderServices@nylim.com. These documents are also available via the MainStay Funds’ website at mainstayinvestments.com/documents. Please read the Summary Prospectus and/or Prospectus carefully before investing.
Investment and Performance Comparison1 (Unaudited)
Performance data quoted represents past performance. Past performance is no guarantee of future results. Because of market volatility, current performance may be lower or higher than the figures shown. Investment return and principal value will fluctuate, and as a result, when shares are redeemed, they may be worth more or less than their original cost. The graph below depicts the historical performance of Class I shares of the Fund. Performance will vary from class to class based on differences in class-specific expenses and sales charges. For performance information current to the most recent month-end, please call 800-MAINSTAY (624-6782) or visit mainstayinvestments.com.
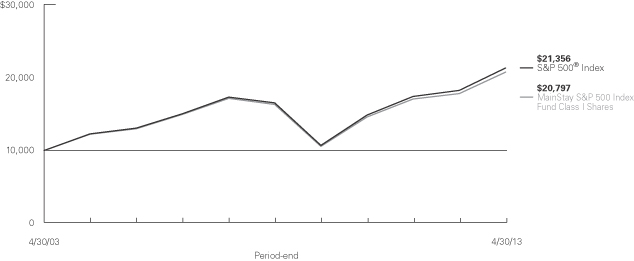
Average Annual Total Returns for the Period Ended April 30, 2013
| | | | | | | | | | | | | | | | | | | | | | | | |
| Class | | Sales Charge | | | | Six Months | | | One Year | | | Five Years | | | Ten Years | | | Gross
Expense
Ratio2 | |
Investor Class Shares3 | | Maximum 3% Initial Sales Charge | | With sales charges | | | 10.55 | % | | | 12.58 | % | | | 3.93 | % | | | 6.91 | % | | | 0.87 | % |
| | | | | Excluding sales charges | | | 13.97 | | | | 16.06 | | | | 4.56 | | | | 7.23 | | | | 0.87 | |
Class A Shares4 | | Maximum 3% Initial Sales Charge | | With sales charges | | | 10.64 | | | | 12.71 | | | | 4.01 | | | | 6.95 | | | | 0.68 | |
| | | | | Excluding sales charges | | | 14.07 | | | | 16.20 | | | | 4.65 | | | | 7.27 | | | | 0.68 | |
| Class I Shares | | No Sales Charge | | | | | 14.21 | | | | 16.50 | | | | 4.92 | | | | 7.60 | | | | 0.43 | |
| 1. | The performance table and graph do not reflect the deduction of taxes that a shareholder would pay on distributions or Fund share redemptions. Total returns reflect maximum applicable sales charges as indicated in the table above, changes in share price, and reinvestment of dividend and capital gain distributions. The graph assumes the initial investment amount shown above and reflects the deduction of all sales charges that would have applied for the period of investment. Performance figures reflect certain fee waivers and/or expense limitations, without which total returns may have been lower. For more information on share classes and current fee waivers and/or expense limitations, please refer to the notes to the financial statements. |
| 2. | The gross expense ratios presented reflect the Fund’s “Total Annual Fund Operating Expenses” from the most recent Prospectus and may differ from other expense ratios disclosed in this report. |
| 3. | Performance figures for Investor Class shares, first offered on February 28, 2008, include the historical performance of Class A shares through February 27, 2008, adjusted for differences in certain expenses and fees. Unadjusted, the performance shown for Investor Class shares would likely have been different. |
| 4. | Performance figures for Class A shares, first offered on January 2, 2004, include the historical performance of Class I shares through January 1, 2004, adjusted for differences in certain expenses and fees. Unadjusted, the performance shown for Class A shares would likely have been different. |
The footnotes on the next page are an integral part of the table and graph and should be carefully read in conjunction with them.
| | | | |
| mainstayinvestments.com | | | 5 | |
| | | | | | | | | | | | | | | | |
| Benchmark Performance | | Six
Months | | | One
Year | | | Five
Years | | | Ten
Years | |
S&P 500® Index5 | | | 14.42% | | | | 16.89 | % | | | 5.21 | % | | | 7.88 | % |
Average Lipper S&P 500 Index Objective Fund6 | | | 14.05% | | | | 16.21 | | | | 4.63 | | | | 7.36 | |
| 5. | S&P 500® Index is a trademark of The McGraw-Hill Companies, Inc. The S&P 500® Index is widely regarded as the standard index for measuring large-cap U.S. stock market performance. The S&P 500® Index is the Fund’s broad-based securities market index for comparison purposes. Results assume reinvestment of all dividends and capital gains. An investment cannot be made directly in an index. |
| 6. | The average Lipper S&P 500 Index objective fund is representative of funds that are passively managed and commit by prospectus language to replicate |
| | the performance of the S&P 500® Index (including reinvested dividends). In addition, S&P 500 Index objective funds have limited expenses (advisor fee no higher than 0.50%). This benchmark is a product of Lipper Inc. Lipper Inc. is an independent monitor of fund performance. Results are based on average total returns of similar funds with all dividend and capital gain distributions reinvested. |
The footnotes on the preceding page are an integral part of the table and graph and should be carefully read in conjunction with them.
| | |
| 6 | | MainStay S&P 500 Index Fund |
Cost in Dollars of a $1,000 Investment in MainStay S&P 500 Index Fund (Unaudited)
The example below is intended to describe the fees and expenses borne by shareholders during the six-month period from November 1, 2012, to April 30, 2013, and the impact of those costs on your investment.
Example
As a shareholder of the Fund, you incur two types of costs: (1) transaction costs, including exchange fees and sales charges (loads) on purchases (as applicable), and (2) ongoing costs, including management fees, distribution and/or service (12b-1) fees, and other Fund expenses (as applicable). This example is intended to help you understand your ongoing costs (in dollars) of investing in the Fund and to compare these costs with the ongoing costs of investing in other mutual funds. The example is based on an investment of $1,000 made at the beginning of the six-month period and held for the entire period from November 1, 2012, to April 30, 2013.
This example illustrates your Fund’s ongoing costs in two ways:
Actual Expenses
The second and third data columns in the table below provide information about actual account values and actual expenses. You may use the information in these columns, together with the amount you invested, to estimate the expenses that you paid during the six months ended April 30, 2013. Simply divide your account value by $1,000 (for
example, an $8,600 account value divided by $1,000 = 8.6), then
multiply the result by the number under the heading entitled ‘‘Expenses Paid During Period’’ to estimate the expenses you paid on your account during this period.
Hypothetical Example for Comparison Purposes
The fourth and fifth data columns in the table below provide information about hypothetical account values and hypothetical expenses based on the Fund’s actual expense ratio and an assumed rate of return of 5% per year before expenses, which is not the Fund’s actual return. The hypothetical account values and expenses may not be used to estimate the actual ending account balances or expenses you paid for the six-month period shown. You may use this information to compare the ongoing costs of investing in the Fund with the ongoing costs of investing in other Funds. To do so, compare this 5% hypothetical example with the 5% hypothetical examples that appear in the shareholder reports of the other Funds.
Please note that the expenses shown in the table are meant to highlight your ongoing costs only and do not reflect any transactional costs, such as exchange fees or sales charges (loads). Therefore, the fourth and fifth data columns of the table are useful in comparing ongoing costs only and will not help you determine the relative total costs of owning different funds. In addition, if these transactional costs were included, your costs would have been higher.
| | | | | | | | | | | | | | | | | | | | |
| | | | | | | | | | | | | | | | |
| Share Class | | Beginning
Account
Value
11/1/12 | | | Ending Account
Value (Based
on Actual
Returns and
Expenses)
4/30/13 | | | Expenses
Paid
During
Period1 | | | Ending Account
Value (Based
on Hypothetical
5% Annualized
Return and
Actual Expenses)
4/30/13 | | | Expenses
Paid
During
Period1 | |
| | | | | |
| Investor Class Shares | | $ | 1,000.00 | | | $ | 1,139.70 | | | $ | 3.71 | | | $ | 1,021.30 | | | $ | 3.51 | |
| | | | | |
| Class A Shares | | $ | 1,000.00 | | | $ | 1,140.70 | | | $ | 3.18 | | | $ | 1,021.80 | | | $ | 3.01 | |
| | | | | |
| Class I Shares | | $ | 1,000.00 | | | $ | 1,142.10 | | | $ | 1.86 | | | $ | 1,023.10 | | | $ | 1.76 | |
| 1. | Expenses are equal to the Fund’s annualized expense ratio of each class (0.70% for Investor Class, 0.60% for Class A and 0.35% for Class I) multiplied by the average account value over the period, divided by 365 and multiplied by 181 (to reflect the six-month period). The table above represents the actual expenses incurred during the six-month period. |
| | | | |
| mainstayinvestments.com | | | 7 | |
Industry Composition as of April 30, 2013 (Unaudited)
| | | | | | |
| Oil, Gas & Consumable Fuels | | | 8.5 | % |
| Pharmaceuticals | | | 5.9 | |
| Insurance | | | 4.0 | |
| Computers & Peripherals | | | 3.9 | |
| Diversified Financial Services | | | 3.7 | |
| IT Services | | | 3.6 | |
| Media | | | 3.5 | |
| Software | | | 3.4 | |
| Diversified Telecommunication Services | | | 2.7 | |
| Commercial Banks | | | 2.6 | |
| Beverages | | | 2.4 | |
| Chemicals | | | 2.4 | |
| Food & Staples Retailing | | | 2.4 | |
| Aerospace & Defense | | | 2.3 | |
| Industrial Conglomerates | | | 2.3 | |
| Internet Software & Services | | | 2.2 | |
| Specialty Retail | | | 2.2 | |
| Household Products | | | 2.1 | |
| Real Estate Investment Trusts | | | 2.1 | |
| Biotechnology | | | 2.0 | |
| Capital Markets | | | 2.0 | |
| Electric Utilities | | | 2.0 | |
| Health Care Equipment & Supplies | | | 2.0 | |
| Semiconductors & Semiconductor Equipment | | | 2.0 | |
| Health Care Providers & Services | | | 1.9 | |
| Food Products | | | 1.8 | |
| Hotels, Restaurants & Leisure | | | 1.8 | |
| Tobacco | | | 1.8 | |
| Communications Equipment | | | 1.7 | |
| Energy Equipment & Services | | | 1.7 | |
| Machinery | | | 1.7 | |
| Multi-Utilities | | | 1.3 | |
| Internet & Catalog Retail | | | 1.0 | |
| Consumer Finance | | | 0.9 | |
| | | | | | |
| Multiline Retail | | | 0.8 | % |
| Road & Rail | | | 0.8 | |
| Air Freight & Logistics | | | 0.7 | |
| Textiles, Apparel & Luxury Goods | | | 0.7 | |
| Electrical Equipment | | | 0.6 | |
| Commercial Services & Supplies | | | 0.5 | |
| Life Sciences Tools & Services | | | 0.5 | |
| Metals & Mining | | | 0.5 | |
| Automobiles | | | 0.4 | |
| Electronic Equipment & Instruments | | | 0.4 | |
| Auto Components | | | 0.3 | |
| Household Durables | | | 0.3 | |
| Wireless Telecommunication Services | | | 0.3 | |
| Containers & Packaging | | | 0.2 | |
| Personal Products | | | 0.2 | |
| Trading Companies & Distributors | | | 0.2 | |
| Airlines | | | 0.1 | |
| Construction & Engineering | | | 0.1 | |
| Distributors | | | 0.1 | |
| Diversified Consumer Services | | | 0.1 | |
| Gas Utilities | | | 0.1 | |
| Health Care Technology | | | 0.1 | |
| Independent Power Producers & Energy Traders | | | 0.1 | |
| Leisure Equipment & Products | | | 0.1 | |
| Office Electronics | | | 0.1 | |
| Paper & Forest Products | | | 0.1 | |
| Professional Services | | | 0.1 | |
| Thrifts & Mortgage Finance | | | 0.1 | |
| Building Products | | | 0.0 | ‡ |
| Construction Materials | | | 0.0 | ‡ |
| Real Estate Management & Development | | | 0.0 | ‡ |
| Short-Term Investments | | | 4.7 | |
| Other Assets, Less Liabilities | | | –1.1 | |
| | | | | | |
| | | 100.0 | % |
| | | | | | |
See Portfolio of Investments beginning on page 10 for specific holdings within these categories.
| ‡ | Less than one-tenth of a percent. |
Top Ten Holdings as of April 30, 2013 (excluding short-term investments)
| 8. | International Business Machines Corp. |
| 9. | Procter & Gamble Co. (The) |
| | |
| 8 | | MainStay S&P 500 Index Fund |
Portfolio Management Discussion and Analysis (Unaudited)
Questions answered by portfolio managers Francis J. Ok and Lee Baker of Cornerstone Capital Management Holdings LLC, the Fund’s Subadvisor.
How did MainStay S&P 500 Index Fund perform relative to its peers and its benchmark during the six months ended April 30, 2013?
Excluding all sales charges, MainStay S&P 500 Index Fund returned 13.97% for Investor Class shares and 14.07% for Class A shares for the six months ended April 30, 2013. Over the same period, the Fund’s Class I shares returned 14.21%. Class A and Class I shares outperformed—and Investor Class shares underperformed—the 14.05% return of the average Lipper1 S&P 500 Index objective fund for the six months ended April 30, 2013. All share classes underperformed the 14.42% return of the S&P 500® Index2 for the six months ended April 30, 2013. The S&P 500® Index is the Fund’s broad-based securities-market index. Because the Fund incurs operating expenses that the Index does not, the Fund’s net performance will typically lag that of the Index. See page 5 for Fund returns with applicable sales charges.
Were there any changes to the Fund during the reporting period?
Effective January 25, 2013, Madison Square Investors LLC, the Subadvisor to MainStay S&P 500 Index Fund, changed its name to Cornerstone Capital Management Holdings LLC.
During the reporting period, how was the Fund’s performance materially affected by investments in derivatives?
MainStay S&P 500 Index Fund invests in futures contracts to provide an efficient means of maintaining liquidity while remaining fully invested in the market. Since these futures track the performance of the S&P 500® Index closely, they had a positive impact on the Fund’s overall performance.
During the reporting period, which S&P 500® industries had the highest total returns and which industries had the lowest total returns?
The S&P 500® industries with the highest total returns were airlines, biotechnology and diversified consumer services. The S&P 500® industries with the lowest total returns were metals & mining, computers & peripherals and thrifts & mortgage finance.
During the reporting period, which industries made the strongest positive contributions to the Fund’s absolute performance and which industries made the weakest contributions?
The S&P 500® industries that made the strongest positive contributions to the Fund’s absolute performance were pharma-
ceuticals, diversified financial services, and media. (Contributions take weightings and total returns into account.) The industries that made the weakest contributions to the Fund’s performance were computers & peripherals, metals & mining and thrifts & mortgage finance.
During the reporting period, which individual stocks in the S&P 500® Index had the highest total returns and which stocks had the lowest total returns?
The S&P 500® stocks with the highest total returns were Internet-based entertainment provider Netflix, health care company Tenet Healthcare and renewable energy company First Solar. The S&P 500® stocks with the lowest total returns were mining companies Cliffs Natural Resources and Newmont Mining, followed by retailer J.C. Penny.
During the reporting period, which S&P 500® stocks made the strongest contributions to the Fund’s absolute performance and which stocks made the weakest contributions?
The S&P 500® stocks that made the strongest contributions to the Fund’s absolute performance were diversified health care company Johnson & Johnson, Internet search provider Google and software giant Microsoft. The S&P 500® stocks that made the weakest contributions to the Fund’s absolute performance were computers & peripherals company Apple and mining companies Newmont Mining and Freeport-McMoRan Copper & Gold.
Were there any changes in the S&P 500® Index during the reporting period?
During the six months ended April 30, 2013, there were six additions to and six deletions from the S&P 500® Index. In terms of Index weight, significant additions to the Index included research-based pharmaceutical company AbbVie and biotechnology company Regeneron Pharmaceuticals. Significant deletions from the S&P 500® Index included global electrical products manufacturer Cooper Industries and wireless broadband provider MetroPCS Communications.
| 1. | See footnote on page 6 for more information on Lipper Inc. |
| 2. | See footnote on page 6 for more information on the S&P 500® Index. |
The opinions expressed are those of the portfolio managers as of the date of this report and are subject to change. There is no guarantee that any forecasts made will come to pass. This material does not constitute investment advice and is not intended as an endorsement of any specific investment.
| | | | |
| mainstayinvestments.com | | | 9 | |
Portfolio of Investments April 30, 2013 (Unaudited)
| | | | | | | | |
| | |
| | | Shares | | | Value | |
| | | | | | | | |
| Common Stocks 96.4%† | | | | | | | | |
Aerospace & Defense 2.3% | |
Boeing Co. (The) | | | 79,550 | | | $ | 7,271,666 | |
General Dynamics Corp. | | | 38,619 | | | | 2,856,261 | |
Honeywell International, Inc. | | | 91,413 | | | | 6,722,512 | |
L-3 Communications Holdings, Inc. | | | 10,653 | | | | 865,556 | |
Lockheed Martin Corp. | | | 31,367 | | | | 3,108,156 | |
Northrop Grumman Corp. | | | 27,718 | | | | 2,099,361 | |
Precision Castparts Corp. | | | 17,109 | | | | 3,272,781 | |
Raytheon Co. | | | 38,031 | | | | 2,334,343 | |
Rockwell Collins, Inc. | | | 15,964 | | | | 1,004,455 | |
Textron, Inc. | | | 31,738 | | | | 817,254 | |
United Technologies Corp. | | | 98,398 | | | | 8,982,753 | |
| | | | | | | | |
| | | | | | | 39,335,098 | |
| | | | | | | | |
Air Freight & Logistics 0.7% | |
C.H. Robinson Worldwide, Inc. | | | 18,809 | | | | 1,117,066 | |
Expeditors International of
Washington, Inc. | | | 24,539 | | | | 881,686 | |
FedEx Corp. | | | 34,185 | | | | 3,213,732 | |
United Parcel Service, Inc. Class B | | | 83,503 | | | | 7,167,898 | |
| | | | | | | | |
| | | | | | | 12,380,382 | |
| | | | | | | | |
Airlines 0.1% | |
Southwest Airlines Co. | | | 85,108 | | | | 1,165,980 | |
| | | | | | | | |
|
Auto Components 0.3% | |
BorgWarner, Inc. (a) | | | 13,661 | | | | 1,067,880 | |
Delphi Automotive PLC | | | 34,449 | | | | 1,591,888 | |
Goodyear Tire & Rubber Co. (The) (a) | | | 28,500 | | | | 356,108 | |
Johnson Controls, Inc. | | | 79,651 | | | | 2,788,582 | |
| | | | | | | | |
| | | | | | | 5,804,458 | |
| | | | | | | | |
Automobiles 0.4% | |
Ford Motor Co. | | | 458,475 | | | | 6,285,692 | |
Harley-Davidson, Inc. | | | 26,550 | | | | 1,450,958 | |
| | | | | | | | |
| | | | | | | 7,736,650 | |
| | | | | | | | |
Beverages 2.4% | |
Beam, Inc. | | | 18,907 | | | | 1,223,472 | |
Brown-Forman Corp. Class B | | | 17,637 | | | | 1,243,409 | |
Coca-Cola Co. (The) | | | 448,017 | | | | 18,964,560 | |
Coca-Cola Enterprises, Inc. | | | 30,754 | | | | 1,126,519 | |
Constellation Brands, Inc. Class A (a) | | | 17,823 | | | | 879,565 | |
Dr. Pepper Snapple Group, Inc. | | | 23,803 | | | | 1,162,300 | |
Molson Coors Brewing Co. Class B | | | 18,122 | | | | 935,095 | |
Monster Beverage Corp. (a) | | | 16,835 | | | | 949,494 | |
PepsiCo., Inc. | | | 180,526 | | | | 14,887,979 | |
| | | | | | | | |
| | | | | | | 41,372,393 | |
| | | | | | | | |
Biotechnology 2.0% | |
Alexion Pharmaceuticals, Inc. (a) | | | 22,672 | | | | 2,221,856 | |
Amgen, Inc. | | | 87,484 | | | | 9,116,708 | |
| | | | | | | | |
| | |
| | | Shares | | | Value | |
| | | | | | | | |
Biotechnology (continued) | |
Biogen Idec, Inc. (a) | | | 27,657 | | | $ | 6,054,947 | |
Celgene Corp. (a) | | | 48,947 | | | | 5,779,172 | |
Gilead Sciences, Inc. (a) | | | 177,954 | | | | 9,011,591 | |
Regeneron Pharmaceuticals, Inc. (a) | | | 8,915 | | | | 1,917,973 | |
| | | | | | | | |
| | | | | | | 34,102,247 | |
| | | | | | | | |
Building Products 0.0%‡ | |
Masco Corp. | | | 41,592 | | | | 808,548 | |
| | | | | | | | |
|
Capital Markets 2.0% | |
Ameriprise Financial, Inc. | | | 23,784 | | | | 1,772,622 | |
Bank of New York Mellon Corp. | | | 136,453 | | | | 3,850,704 | |
BlackRock, Inc. | | | 14,638 | | | | 3,901,027 | |
Charles Schwab Corp. (The) | | | 127,602 | | | | 2,164,130 | |
E*TRADE Financial Corp. (a) | | | 33,268 | | | | 342,328 | |
Franklin Resources, Inc. | | | 16,096 | | | | 2,489,407 | |
Goldman Sachs Group, Inc. (The) | | | 51,148 | | | | 7,471,188 | |
Invesco, Ltd. | | | 51,872 | | | | 1,646,417 | |
Legg Mason, Inc. | | | 13,415 | | | | 427,402 | |
Morgan Stanley | | | 161,100 | | | | 3,568,365 | |
Northern Trust Corp. | | | 25,496 | | | | 1,374,744 | |
State Street Corp. | | | 53,405 | | | | 3,122,590 | |
T. Rowe Price Group, Inc. | | | 30,276 | | | | 2,195,010 | |
| | | | | | | | |
| | | | | | | 34,325,934 | |
| | | | | | | | |
Chemicals 2.4% | |
Air Products & Chemicals, Inc. | | | 24,269 | | | | 2,110,432 | |
Airgas, Inc. | | | 8,010 | | | | 774,167 | |
CF Industries Holdings, Inc. | | | 7,301 | | | | 1,361,710 | |
Dow Chemical Co. (The) | | | 140,779 | | | | 4,773,816 | |
E.I. du Pont de Nemours & Co. | | | 109,210 | | | | 5,953,037 | |
Eastman Chemical Co. | | | 17,805 | | | | 1,186,703 | |
Ecolab, Inc. | | | 30,989 | | | | 2,622,289 | |
FMC Corp. | | | 15,992 | | | | 970,714 | |
International Flavors & Fragrances, Inc. | | | 9,489 | | | | 732,456 | |
LyondellBasell Industries, N.V. Class A | | | 44,193 | | | | 2,682,515 | |
Monsanto Co. | | | 62,632 | | | | 6,690,350 | |
Mosaic Co. (The) | | | 32,343 | | | | 1,992,005 | |
PPG Industries, Inc. | | | 16,666 | | | | 2,452,235 | |
Praxair, Inc. | | | 34,736 | | | | 3,970,325 | |
Sherwin-Williams Co. (The) | | | 10,032 | | | | 1,836,960 | |
Sigma-Aldrich Corp. | | | 14,066 | | | | 1,106,854 | |
| | | | | | | | |
| | | | | | | 41,216,568 | |
| | | | | | | | |
Commercial Banks 2.6% | |
BB&T Corp. | | | 81,423 | | | | 2,505,386 | |
Comerica, Inc. | | | 21,937 | | | | 795,216 | |
Fifth Third Bancorp | | | 102,312 | | | | 1,742,373 | |
First Horizon National Corp. | | | 29,001 | | | | 301,610 | |
Huntington Bancshares, Inc. | | | 100,045 | | | | 717,323 | |
| † | Percentages indicated are based on Fund net assets. |
| ¨ | | Among the Fund’s 10 largest holdings, as of April 30, 2013, excluding short-term investments. May be subject to change daily. |
| | | | |
| 10 | | MainStay S&P 500 Index Fund | | The notes to the financial statements are an integral part of,
and should be read in conjunction with, the financial statements. |
| | | | | | | | |
| | |
| | | Shares | | | Value | |
| | | | | | | | |
| Common Stocks (continued) | |
Commercial Banks (continued) | |
KeyCorp | | | 107,991 | | | $ | 1,076,670 | |
M&T Bank Corp. | | | 14,188 | | | | 1,421,638 | |
PNC Financial Services Group, Inc. | | | 61,662 | | | | 4,185,617 | |
Regions Financial Corp. | | | 164,608 | | | | 1,397,522 | |
SunTrust Banks, Inc. | | | 62,713 | | | | 1,834,355 | |
U.S. Bancorp | | | 217,813 | | | | 7,248,817 | |
Wells Fargo & Co. | | | 572,990 | | | | 21,762,160 | |
Zions Bancorp. | | | 21,447 | | | | 528,025 | |
| | | | | | | | |
| | | | 45,516,712 | |
| | | | | | | | |
Commercial Services & Supplies 0.5% | |
ADT Corp. (The) (a) | | | 25,764 | | | | 1,124,341 | |
Avery Dennison Corp. | | | 11,823 | | | | 490,063 | |
Cintas Corp. | | | 12,538 | | | | 562,580 | |
Iron Mountain, Inc. | | | 19,844 | | | | 751,294 | |
Pitney Bowes, Inc. | | | 23,365 | | | | 319,400 | |
Republic Services, Inc. | | | 34,894 | | | | 1,189,187 | |
Stericycle, Inc. (a) | | | 10,148 | | | | 1,099,231 | |
Tyco International, Ltd. | | | 54,347 | | | | 1,745,626 | |
Waste Management, Inc. | | | 50,743 | | | | 2,079,448 | |
| | | | | | | | |
| | | | 9,361,170 | |
| | | | | | | | |
Communications Equipment 1.7% | |
Cisco Systems, Inc. | | | 623,260 | | | | 13,038,599 | |
F5 Networks, Inc. (a) | | | 9,206 | | | | 703,615 | |
Harris Corp. | | | 13,190 | | | | 609,378 | |
JDS Uniphase Corp. (a) | | | 26,997 | | | | 364,459 | |
Juniper Networks, Inc. (a) | | | 60,172 | | | | 995,847 | |
Motorola Solutions, Inc. | | | 32,204 | | | | 1,842,069 | |
QUALCOMM, Inc. | | | 200,833 | | | | 12,375,329 | |
| | | | | | | | |
| | | | 29,929,296 | |
| | | | | | | | |
Computers & Peripherals 3.9% | |
¨Apple, Inc. | | | 109,780 | | | | 48,605,095 | |
Dell, Inc. | | | 169,686 | | | | 2,273,793 | |
EMC Corp. (a) | | | 245,868 | | | | 5,514,819 | |
Hewlett-Packard Co. | | | 228,255 | | | | 4,702,053 | |
NetApp, Inc. (a) | | | 41,806 | | | | 1,458,611 | |
SanDisk Corp. (a) | | | 28,131 | | | | 1,475,190 | |
Seagate Technology PLC | | | 37,333 | | | | 1,370,121 | |
Western Digital Corp. | | | 25,319 | | | | 1,399,634 | |
| | | | | | | | |
| | | | 66,799,316 | |
| | | | | | | | |
Construction & Engineering 0.1% | |
Fluor Corp. | | | 18,996 | | | | 1,082,392 | |
Jacobs Engineering Group, Inc. (a) | | | 15,108 | | | | 762,652 | |
Quanta Services, Inc. (a) | | | 24,881 | | | | 683,730 | |
| | | | | | | | |
| | | | 2,528,774 | |
| | | | | | | | |
Construction Materials 0.0%‡ | |
Vulcan Materials Co. | | | 15,068 | | | | 751,592 | |
| | | | | | | | |
| | | | | | | | |
| | |
| | | Shares | | | Value | |
| | | | | | | | |
Consumer Finance 0.9% | |
American Express Co. | | | 112,338 | | | $ | 7,685,043 | |
Capital One Financial Corp. | | | 68,059 | | | | 3,932,449 | |
Discover Financial Services | | | 57,907 | | | | 2,532,852 | |
SLM Corp. | | | 52,992 | | | | 1,094,285 | |
| | | | | | | | |
| | | | | | | 15,244,629 | |
| | | | | | | | |
Containers & Packaging 0.2% | |
Ball Corp. | | | 17,670 | | | | 779,600 | |
Bemis Co., Inc. | | | 12,030 | | | | 473,381 | |
MeadWestvaco Corp. | | | 20,211 | | | | 696,875 | |
Owens-Illinois, Inc. (a) | | | 19,229 | | | | 505,338 | |
Sealed Air Corp. | | | 22,642 | | | | 500,841 | |
| | | | | | | | |
| | | | | | | 2,956,035 | |
| | | | | | | | |
Distributors 0.1% | |
Genuine Parts Co. | | | 18,065 | | | | 1,378,901 | |
| | | | | | | | |
|
Diversified Consumer Services 0.1% | |
Apollo Group, Inc. Class A (a) | | | 11,756 | | | | 215,957 | |
H&R Block, Inc. | | | 31,574 | | | | 875,863 | |
| | | | | | | | |
| | | | | | | 1,091,820 | |
| | | | | | | | |
Diversified Financial Services 3.7% | |
Bank of America Corp. | | | 1,264,792 | | | | 15,569,589 | |
Citigroup, Inc. | | | 355,203 | | | | 16,573,772 | |
CME Group, Inc. | | | 35,791 | | | | 2,178,240 | |
IntercontinentalExchange, Inc. (a) | | | 8,475 | | | | 1,380,832 | |
JPMorgan Chase & Co. | | | 447,396 | | | | 21,926,878 | |
Leucadia National Corp. | | | 34,246 | | | | 1,057,859 | |
McGraw-Hill Cos., Inc. (The) | | | 32,632 | | | | 1,765,717 | |
Moody’s Corp. | | | 22,523 | | | | 1,370,525 | |
NASDAQ OMX Group, Inc. (The) | | | 13,804 | | | | 406,942 | |
NYSE Euronext | | | 28,664 | | | | 1,112,450 | |
| | | | | | | | |
| | | | | | | 63,342,804 | |
| | | | | | | | |
Diversified Telecommunication Services 2.7% | |
AT&T, Inc. | | | 641,782 | | | | 24,041,154 | |
CenturyLink, Inc. | | | 73,154 | | | | 2,748,396 | |
Frontier Communications Corp. | | | 116,296 | | | | 483,791 | |
Verizon Communications, Inc. | | | 334,106 | | | | 18,011,654 | |
Windstream Corp. | | | 68,471 | | | | 583,373 | |
| | | | | | | | |
| | | | | | | 45,868,368 | |
| | | | | | | | |
Electric Utilities 2.0% | |
American Electric Power Co., Inc. | | | 56,472 | | | | 2,904,355 | |
Duke Energy Corp. | | | 82,368 | | | | 6,194,074 | |
Edison International | | | 37,947 | | | | 2,041,549 | |
Entergy Corp. | | | 20,648 | | | | 1,470,757 | |
Exelon Corp. | | | 99,944 | | | | 3,748,899 | |
FirstEnergy Corp. | | | 48,708 | | | | 2,269,793 | |
NextEra Energy, Inc. | | | 49,386 | | | | 4,051,134 | |
Northeast Utilities | | | 36,546 | | | | 1,656,630 | |
Pepco Holdings, Inc. | | | 28,997 | | | | 655,332 | |
| | | | | | |
The notes to the financial statements are an integral part of,
and should be read in conjunction with, the financial statements. | | mainstayinvestments.com | | | 11 | |
Portfolio of Investments April 30, 2013 (Unaudited) (continued)
| | | | | | | | |
| | |
| | | Shares | | | Value | |
| | | | | | | | |
| | | | | | | | |
| Common Stocks (continued) | |
Electric Utilities (continued) | | | | | | | | |
Pinnacle West Capital Corp. | | | 12,758 | | | $ | 776,962 | |
PPL Corp. | | | 67,628 | | | | 2,257,423 | |
Southern Co. | | | 101,910 | | | | 4,915,119 | |
Xcel Energy, Inc. | | | 56,780 | | | | 1,805,036 | |
| | | | | | | | |
| | | | | | | 34,747,063 | |
| | | | | | | | |
Electrical Equipment 0.6% | |
Eaton Corp. PLC | | | 55,068 | | | | 3,381,726 | |
Emerson Electric Co. | | | 84,404 | | | | 4,685,266 | |
Rockwell Automation, Inc. | | | 16,220 | | | | 1,375,131 | |
Roper Industries, Inc. | | | 11,621 | | | | 1,390,453 | |
| | | | | | | | |
| | | | | | | 10,832,576 | |
| | | | | | | | |
Electronic Equipment & Instruments 0.4% | |
Amphenol Corp. Class A | | | 18,756 | | | | 1,416,453 | |
Corning, Inc. | | | 172,110 | | | | 2,495,595 | |
FLIR Systems, Inc. | | | 16,945 | | | | 411,933 | |
Jabil Circuit, Inc. | | | 21,791 | | | | 387,880 | |
Molex, Inc. | | | 16,033 | | | | 442,030 | |
TE Connectivity, Ltd. | | | 49,141 | | | | 2,140,090 | |
| | | | | | | | |
| | | | | | | 7,293,981 | |
| | | | | | | | |
Energy Equipment & Services 1.7% | |
Baker Hughes, Inc. | | | 51,644 | | | | 2,344,121 | |
Cameron International Corp. (a) | | | 28,972 | | | | 1,783,227 | |
Diamond Offshore Drilling, Inc. | | | 8,096 | | | | 559,434 | |
Ensco PLC Class A | | | 27,023 | | | | 1,558,687 | |
FMC Technologies, Inc. (a) | | | 27,767 | | | | 1,507,748 | |
Halliburton Co. | | | 108,921 | | | | 4,658,551 | |
Helmerich & Payne, Inc. | | | 12,308 | | | | 721,495 | |
Nabors Industries, Ltd. | | | 33,818 | | | | 500,168 | |
National Oilwell Varco, Inc. | | | 49,663 | | | | 3,239,021 | |
Noble Corp. | | | 29,420 | | | | 1,103,250 | |
Rowan Cos. PLC Class A (a) | | | 14,465 | | | | 470,546 | |
Schlumberger, Ltd. | | | 155,261 | | | | 11,556,076 | |
| | | | | | | | |
| | | | | | | 30,002,324 | |
| | | | | | | | |
Food & Staples Retailing 2.4% | |
Costco Wholesale Corp. | | | 50,922 | | | | 5,521,472 | |
CVS Caremark Corp. | | | 143,899 | | | | 8,372,044 | |
Kroger Co. (The) | | | 60,600 | | | | 2,083,428 | |
Safeway, Inc. | | | 27,894 | | | | 628,173 | |
Sysco Corp. | | | 68,924 | | | | 2,402,691 | |
Wal-Mart Stores, Inc. | | | 195,514 | | | | 15,195,348 | |
Walgreen Co. | | | 100,290 | | | | 4,965,358 | |
Whole Foods Market, Inc. | | | 20,000 | | | | 1,766,400 | |
| | | | | | | | |
| | | | | | | 40,934,914 | |
| | | | | | | | |
Food Products 1.8% | |
Archer-Daniels-Midland Co. | | | 76,707 | | | | 2,603,436 | |
Campbell Soup Co. | | | 20,982 | | | | 973,775 | |
ConAgra Foods, Inc. | | | 48,105 | | | | 1,701,474 | |
| | | | | | | | |
| | |
| | | Shares | | | Value | |
| | | | | | | | |
Food Products (continued) | | | | | | | | |
Dean Foods Co. (a) | | | 21,524 | | | $ | 411,969 | |
General Mills, Inc. | | | 75,511 | | | | 3,807,265 | |
H.J. Heinz Co. | | | 37,295 | | | | 2,700,904 | |
Hershey Co. (The) | | | 17,444 | | | | 1,555,307 | |
Hormel Foods Corp. | | | 15,613 | | | | 644,348 | |
J.M. Smucker Co. (The) | | | 12,537 | | | | 1,294,194 | |
Kellogg Co. | | | 29,188 | | | | 1,898,388 | |
Kraft Foods Group, Inc. | | | 69,263 | | | | 3,566,352 | |
McCormick & Co., Inc. | | | 15,447 | | | | 1,111,257 | |
Mead Johnson Nutrition Co. | | | 23,737 | | | | 1,924,833 | |
Mondelez International, Inc. Class A | | | 207,389 | | | | 6,522,384 | |
Tyson Foods, Inc. Class A | | | 33,749 | | | | 831,238 | |
| | | | | | | | |
| | | | | | | 31,547,124 | |
| | | | | | | | |
Gas Utilities 0.1% | |
AGL Resources, Inc. | | | 13,685 | | | | 600,087 | |
ONEOK, Inc. | | | 23,883 | | | | 1,226,631 | |
| | | | | | | | |
| | | | | | | 1,826,718 | |
| | | | | | | | |
Health Care Equipment & Supplies 2.0% | |
Abbott Laboratories | | | 183,598 | | | | 6,778,438 | |
Baxter International, Inc. | | | 63,814 | | | | 4,458,684 | |
Becton, Dickinson & Co. | | | 22,672 | | | | 2,137,970 | |
Boston Scientific Corp. (a) | | | 160,851 | | | | 1,204,774 | |
C.R. Bard, Inc. | | | 8,891 | | | | 883,410 | |
CareFusion Corp. (a) | | | 25,843 | | | | 864,190 | |
Covidien PLC | | | 55,178 | | | | 3,522,564 | |
DENTSPLY International, Inc. | | | 16,745 | | | | 709,151 | |
Edwards Lifesciences Corp. (a) | | | 13,484 | | | | 860,144 | |
Intuitive Surgical, Inc. (a) | | | 4,691 | | | | 2,309,332 | |
Medtronic, Inc. | | | 118,033 | | | | 5,509,780 | |
St. Jude Medical, Inc. | | | 33,420 | | | | 1,377,572 | |
Stryker Corp. | | | 33,675 | | | | 2,208,407 | |
Varian Medical Systems, Inc. (a) | | | 12,901 | | | | 840,371 | |
Zimmer Holdings, Inc. | | | 19,953 | | | | 1,525,407 | |
| | | | | | | | |
| | | | | | | 35,190,194 | |
| | | | | | | | |
Health Care Providers & Services 1.9% | |
Aetna, Inc. | | | 38,340 | | | | 2,202,249 | |
AmerisourceBergen Corp. | | | 26,913 | | | | 1,456,531 | |
Cardinal Health, Inc. | | | 39,727 | | | | 1,756,728 | |
Cigna Corp. | | | 33,595 | | | | 2,222,981 | |
Coventry Health Care, Inc. | | | 15,586 | | | | 772,286 | |
DaVita HealthCare Partners, Inc. (a) | | | 9,866 | | | | 1,170,601 | |
Express Scripts Holding Co. (a) | | | 95,675 | | | | 5,680,225 | |
Humana, Inc. | | | 18,398 | | | | 1,363,476 | |
Laboratory Corporation of America Holdings (a) | | | 10,883 | | | | 1,016,037 | |
McKesson Corp. | | | 27,222 | | | | 2,880,632 | |
Patterson Cos., Inc. | | | 9,901 | | | | 375,743 | |
Quest Diagnostics, Inc. | | | 18,492 | | | | 1,041,654 | |
Tenet Healthcare Corp. (a) | | | 12,133 | | | | 550,353 | |
| | | | |
| 12 | | MainStay S&P 500 Index Fund | | The notes to the financial statements are an integral part of,
and should be read in conjunction with, the financial statements. |
| | | | | | | | |
| | |
| | | Shares | | | Value | |
| | | | | | | | |
| Common Stocks (continued) | |
Health Care Providers & Services (continued) | |
UnitedHealth Group, Inc. | | | 119,805 | | | $ | 7,179,914 | |
WellPoint, Inc. | | | 35,442 | | | | 2,584,431 | |
| | | | | | | | |
| | | | 32,253,841 | |
| | | | | | | | |
Health Care Technology 0.1% | |
Cerner Corp. (a) | | | 16,942 | | | | 1,639,477 | |
| | | | | | | | |
| | |
Hotels, Restaurants & Leisure 1.8% | | | | | | | | |
Carnival Corp. | | | 52,093 | | | | 1,797,729 | |
Chipotle Mexican Grill, Inc. (a) | | | 3,628 | | | | 1,317,653 | |
Darden Restaurants, Inc. | | | 14,930 | | | | 770,836 | |
International Game Technology | | | 31,120 | | | | 527,484 | |
Marriott International, Inc. Class A | | | 28,822 | | | | 1,241,075 | |
McDonald’s Corp. | | | 117,175 | | | | 11,968,255 | |
Starbucks Corp. | | | 87,587 | | | | 5,328,793 | |
Starwood Hotels & Resorts Worldwide, Inc. | | | 22,894 | | | | 1,477,121 | |
Wyndham Worldwide Corp. | | | 16,121 | | | | 968,550 | |
Wynn Resorts, Ltd. | | | 9,248 | | | | 1,269,750 | |
Yum! Brands, Inc. | | | 52,731 | | | | 3,592,036 | |
| | | | | | | | |
| | | | 30,259,282 | |
| | | | | | | | |
Household Durables 0.3% | |
D.R. Horton, Inc. | | | 32,345 | | | | 843,558 | |
Garmin, Ltd. | | | 12,694 | | | | 445,305 | |
Harman International Industries, Inc. | | | 7,819 | | | | 349,587 | |
Leggett & Platt, Inc. | | | 16,366 | | | | 527,640 | |
Lennar Corp. Class A | | | 18,952 | | | | 781,201 | |
Newell Rubbermaid, Inc. | | | 33,646 | | | | 886,236 | |
PulteGroup, Inc. (a) | | | 39,320 | | | | 825,327 | |
Whirlpool Corp. | | | 9,181 | | | | 1,049,205 | |
| | | | | | | | |
| | | | 5,708,059 | |
| | | | | | | | |
Household Products 2.1% | |
Clorox Co. (The) | | | 15,332 | | | | 1,322,385 | |
Colgate-Palmolive Co. | | | 51,389 | | | | 6,136,360 | |
Kimberly-Clark Corp. | | | 45,310 | | | | 4,675,539 | |
¨Procter & Gamble Co. (The) | | | 319,306 | | | | 24,513,122 | |
| | | | | | | | |
| | | | 36,647,406 | |
| | | | | | | | |
Independent Power Producers & Energy Traders 0.1% | |
AES Corp. (The) | | | 72,315 | | | | 1,002,286 | |
NRG Energy, Inc. | | | 37,473 | | | | 1,044,372 | |
| | | | | | | | |
| | | | 2,046,658 | |
| | | | | | | | |
Industrial Conglomerates 2.3% | |
3M Co. | | | 74,292 | | | | 7,779,115 | |
Danaher Corp. | | | 67,774 | | | | 4,130,148 | |
¨General Electric Co. | | | 1,215,463 | | | | 27,092,670 | |
| | | | | | | | |
| | | | 39,001,933 | |
| | | | | | | | |
Insurance 4.0% | |
ACE, Ltd. | | | 39,656 | | | | 3,534,936 | |
Aflac, Inc. | | | 54,540 | | | | 2,969,158 | |
| | | | | | | | |
| | |
| | | Shares | | | Value | |
| | | | | | | | |
Insurance (continued) | |
Allstate Corp. (The) | | | 55,809 | | | $ | 2,749,151 | |
American International Group, Inc. (a) | | | 172,289 | | | | 7,136,210 | |
Aon PLC | | | 36,420 | | | | 2,197,947 | |
Assurant, Inc. | | | 9,454 | | | | 449,443 | |
Berkshire Hathaway, Inc. Class B (a) | | | 213,202 | | | | 22,667,637 | |
Chubb Corp. (The) | | | 30,568 | | | | 2,692,124 | |
Cincinnati Financial Corp. | | | 17,033 | | | | 833,084 | |
Genworth Financial, Inc. Class A (a) | | | 57,255 | | | | 574,268 | |
Hartford Financial Services Group,
Inc. (The) | | | 50,755 | | | | 1,425,708 | |
Lincoln National Corp. | | | 31,732 | | | | 1,079,205 | |
Loews Corp. | | | 36,411 | | | | 1,626,479 | |
Marsh & McLennan Cos., Inc. | | | 64,100 | | | | 2,436,441 | |
MetLife, Inc. | | | 127,830 | | | | 4,984,092 | |
Principal Financial Group, Inc. | | | 32,316 | | | | 1,166,608 | |
Progressive Corp. (The) | | | 65,292 | | | | 1,651,235 | |
Prudential Financial, Inc. | | | 54,278 | | | | 3,279,477 | |
Torchmark Corp. | | | 11,118 | | | | 690,094 | |
Travelers Companies, Inc. (The) | | | 44,179 | | | | 3,773,328 | |
Unum Group | | | 30,935 | | | | 862,777 | |
XL Group PLC | | | 34,478 | | | | 1,073,645 | |
| | | | | | | | |
| | | | 69,853,047 | |
| | | | | | | | |
Internet & Catalog Retail 1.0% | |
Amazon.com, Inc. (a) | | | 42,506 | | | | 10,788,448 | |
Expedia, Inc. | | | 10,909 | | | | 609,158 | |
Netflix, Inc. (a) | | | 6,466 | | | | 1,397,109 | |
Priceline.com, Inc. (a) | | | 5,829 | | | | 4,056,926 | |
TripAdvisor, Inc. (a) | | | 12,762 | | | | 671,026 | |
| | | | | | | | |
| | | | 17,522,667 | |
| | | | | | | | |
Internet Software & Services 2.2% | |
Akamai Technologies, Inc. (a) | | | 20,648 | | | | 906,654 | |
eBay, Inc. (a) | | | 136,396 | | | | 7,145,787 | |
¨Google, Inc. Class A (a) | | | 31,213 | | | | 25,737,303 | |
VeriSign, Inc. (a) | | | 17,833 | | | | 821,566 | |
Yahoo!, Inc. (a) | | | 113,284 | | | | 2,801,513 | |
| | | | | | | | |
| | | | 37,412,823 | |
| | | | | | | | |
IT Services 3.6% | |
Accenture PLC Class A | | | 75,340 | | | | 6,135,690 | |
Automatic Data Processing, Inc. | | | 56,694 | | | | 3,817,774 | |
Cognizant Technology Solutions Corp. Class A (a) | | | 35,275 | | | | 2,285,820 | |
Computer Sciences Corp. | | | 18,099 | | | | 847,938 | |
Fidelity National Information
Services, Inc. | | | 34,272 | | | | 1,441,138 | |
Fiserv, Inc. (a) | | | 15,602 | | | | 1,421,498 | |
¨International Business Machines Corp. | | | 122,460 | | | | 24,803,048 | |
MasterCard, Inc. Class A | | | 12,341 | | | | 6,823,709 | |
Paychex, Inc. | | | 37,599 | | | | 1,368,980 | |
SAIC, Inc. | | | 33,044 | | | | 493,677 | |
Teradata Corp. (a) | | | 19,649 | | | | 1,003,475 | |
Total System Services, Inc. | | | 18,841 | | | | 445,024 | |
Visa, Inc. Class A | | | 60,281 | | | | 10,154,937 | |
| | | | | | |
The notes to the financial statements are an integral part of,
and should be read in conjunction with, the financial statements. | | mainstayinvestments.com | | | 13 | |
Portfolio of Investments April 30, 2013 (Unaudited) (continued)
| | | | | | | | |
| | |
| | | Shares | | | Value | |
| | | | | | | | |
| Common Stocks (continued) | |
IT Services (continued) | |
Western Union Co. | | | 66,484 | | | $ | 984,628 | |
| | | | | | | | |
| | | | | | | 62,027,336 | |
| | | | | | | | |
Leisure Equipment & Products 0.1% | |
Hasbro, Inc. | | | 13,505 | | | | 639,732 | |
Mattel, Inc. | | | 40,270 | | | | 1,838,728 | |
| | | | | | | | |
| | | | | | | 2,478,460 | |
| | | | | | | | |
Life Sciences Tools & Services 0.5% | |
Agilent Technologies, Inc. | | | 40,588 | | | | 1,681,967 | |
Life Technologies Corp. (a) | | | 19,919 | | | | 1,467,831 | |
PerkinElmer, Inc. | | | 13,287 | | | | 407,246 | |
Thermo Fisher Scientific, Inc. | | | 41,803 | | | | 3,372,666 | |
Waters Corp. (a) | | | 10,105 | | | | 933,702 | |
| | | | | | | | |
| | | | | | | 7,863,412 | |
| | | | | | | | |
Machinery 1.7% | |
Caterpillar, Inc. | | | 76,569 | | | | 6,483,097 | |
Cummins, Inc. | | | 20,627 | | | | 2,194,506 | |
Deere & Co. | | | 45,626 | | | | 4,074,402 | |
Dover Corp. | | | 20,419 | | | | 1,408,503 | |
Flowserve Corp. | | | 5,658 | | | | 894,643 | |
Illinois Tool Works, Inc. | | | 48,548 | | | | 3,134,259 | |
Ingersoll-Rand PLC | | | 32,216 | | | | 1,733,221 | |
Joy Global, Inc. | | | 12,330 | | | | 696,891 | |
PACCAR, Inc. | | | 41,172 | | | | 2,049,542 | |
Pall Corp. | | | 13,056 | | | | 870,966 | |
Parker Hannifin Corp. | | | 17,407 | | | | 1,541,738 | |
Pentair, Ltd. | | | 24,359 | | | | 1,323,912 | |
Snap-On, Inc. | | | 6,773 | | | | 583,833 | |
Stanley Black & Decker, Inc. | | | 18,567 | | | | 1,388,997 | |
Xylem, Inc. | | | 21,614 | | | | 599,788 | |
| | | | | | | | |
| | | | | | | 28,978,298 | |
| | | | | | | | |
Media 3.5% | |
Cablevision Systems Corp. Class A | | | 25,137 | | | | 373,536 | |
CBS Corp. Class B | | | 68,395 | | | | 3,131,123 | |
Comcast Corp. Class A | | | 308,533 | | | | 12,742,413 | |
DIRECTV Class A (a) | | | 66,992 | | | | 3,789,067 | |
Discovery Communications, Inc.
Class A (a) | | | 28,562 | | | | 2,251,257 | |
Gannett Co., Inc. | | | 26,959 | | | | 543,493 | |
Interpublic Group of Cos., Inc. (The) | | | 48,521 | | | | 671,531 | |
News Corp. Class A | | | 233,749 | | | | 7,239,207 | |
Omnicom Group, Inc. | | | 30,556 | | | | 1,826,332 | |
Scripps Networks Interactive Class A | | | 10,066 | | | | 670,194 | |
Time Warner Cable, Inc. | | | 34,543 | | | | 3,243,242 | |
Time Warner, Inc. | | | 109,268 | | | | 6,532,041 | |
Viacom, Inc. Class B | | | 53,229 | | | | 3,406,124 | |
Walt Disney Co. (The) | | | 211,039 | | | | 13,261,691 | |
Washington Post Co. (The) Class B | | | 529 | | | | 234,527 | |
| | | | | | | | |
| | | | 59,915,778 | |
| | | | | | | | |
| | | | | | | | |
| | |
| | | Shares | | | Value | |
| | | | | | | | |
Metals & Mining 0.5% | |
Alcoa, Inc. | | | 124,247 | | | $ | 1,056,099 | |
Allegheny Technologies, Inc. | | | 12,481 | | | | 336,737 | |
Cliffs Natural Resources, Inc. | | | 17,535 | | | | 374,197 | |
Freeport-McMoRan Copper & Gold, Inc. | | | 110,555 | | | | 3,364,189 | |
Newmont Mining Corp. | | | 57,784 | | | | 1,872,202 | |
Nucor Corp. | | | 36,972 | | | | 1,612,719 | |
United States Steel Corp. | | | 16,803 | | | | 299,093 | |
| | | | | | | | |
| | | | 8,915,236 | |
| | | | | | | | |
Multi-Utilities 1.3% | |
Ameren Corp. | | | 28,259 | | | | 1,024,389 | |
CenterPoint Energy, Inc. | | | 49,775 | | | | 1,228,447 | |
CMS Energy Corp. | | | 30,863 | | | | 924,038 | |
Consolidated Edison, Inc. | | | 34,112 | | | | 2,171,229 | |
Dominion Resources, Inc. | | | 67,366 | | | | 4,155,135 | |
DTE Energy Co. | | | 20,001 | | | | 1,457,673 | |
Integrys Energy Group, Inc. | | | 9,172 | | | | 564,628 | |
NiSource, Inc. | | | 36,116 | | | | 1,109,845 | |
PG&E Corp. | | | 51,272 | | | | 2,483,616 | |
Public Service Enterprise Group, Inc. | | | 58,925 | | | | 2,157,244 | |
SCANA Corp. | | | 16,265 | | | | 881,563 | |
Sempra Energy | | | 26,425 | | | | 2,189,311 | |
TECO Energy, Inc. | | | 23,709 | | | | 453,553 | |
Wisconsin Energy Corp. | | | 26,846 | | | | 1,206,459 | |
| | | | | | | | |
| | | | 22,007,130 | |
| | | | | | | | |
Multiline Retail 0.8% | |
Dollar General Corp. (a) | | | 35,344 | | | | 1,841,069 | |
Dollar Tree, Inc. (a) | | | 26,838 | | | | 1,276,415 | |
Family Dollar Stores, Inc. | | | 11,301 | | | | 693,542 | |
J.C. Penney Co., Inc. | | | 16,585 | | | | 272,326 | |
Kohl’s Corp. | | | 24,694 | | | | 1,162,100 | |
Macy’s, Inc. | | | 46,133 | | | | 2,057,532 | |
Nordstrom, Inc. | | | 17,804 | | | | 1,007,528 | |
Target Corp. | | | 75,951 | | | | 5,359,103 | |
| | | | | | | | |
| | | | 13,669,615 | |
| | | | | | | | |
Office Electronics 0.1% | |
Xerox Corp. | | | 143,384 | | | | 1,230,235 | |
| | | | | | | | |
|
Oil, Gas & Consumable Fuels 8.5% | |
Anadarko Petroleum Corp. | | | 58,512 | | | | 4,959,477 | |
Apache Corp. | | | 45,793 | | | | 3,383,187 | |
Cabot Oil & Gas Corp. | | | 24,455 | | | | 1,664,163 | |
Chesapeake Energy Corp. | | | 60,441 | | | | 1,181,017 | |
¨Chevron Corp. | | | 227,084 | | | | 27,706,519 | |
ConocoPhillips | | | 142,723 | | | | 8,627,605 | |
CONSOL Energy, Inc. | | | 26,510 | | | | 891,796 | |
Denbury Resources, Inc. (a) | | | 43,654 | | | | 780,970 | |
Devon Energy Corp. | | | 44,136 | | | | 2,430,128 | |
EOG Resources, Inc. | | | 31,764 | | | | 3,848,526 | |
EQT Corp. | | | 17,419 | | | | 1,308,515 | |
¨Exxon Mobil Corp. | | | 523,724 | | | | 46,606,199 | |
| | | | |
| 14 | | MainStay S&P 500 Index Fund | | The notes to the financial statements are an integral part of,
and should be read in conjunction with, the financial statements. |
| | | | | | | | |
| | |
| | | Shares | | | Value | |
| | | | | | | | |
| Common Stocks (continued) | |
Oil, Gas & Consumable Fuels (continued) | |
Hess Corp. | | | 34,604 | | | $ | 2,497,717 | |
Kinder Morgan, Inc. | | | 73,806 | | | | 2,885,815 | |
Marathon Oil Corp. | | | 82,725 | | | | 2,702,626 | |
Marathon Petroleum Corp. | | | 38,742 | | | | 3,035,823 | |
Murphy Oil Corp. | | | 21,313 | | | | 1,323,324 | |
Newfield Exploration Co. (a) | | | 15,720 | | | | 342,539 | |
Noble Energy, Inc. | | | 20,991 | | | | 2,378,070 | |
Occidental Petroleum Corp. | | | 94,158 | | | | 8,404,543 | |
Peabody Energy Corp. | | | 31,246 | | | | 626,795 | |
Phillips 66 | | | 72,649 | | | | 4,427,957 | |
Pioneer Natural Resources Co. | | | 15,432 | | | | 1,886,253 | |
QEP Resources, Inc. | | | 20,701 | | | | 594,326 | |
Range Resources Corp. | | | 18,923 | | | | 1,391,219 | |
Southwestern Energy Co. (a) | | | 41,033 | | | | 1,535,455 | |
Spectra Energy Corp. | | | 77,687 | | | | 2,449,471 | |
Tesoro Corp. | | | 16,292 | | | | 869,993 | |
Valero Energy Corp. | | | 64,633 | | | | 2,606,003 | |
Williams Cos., Inc. (The) | | | 79,665 | | | | 3,037,626 | |
WPX Energy, Inc. (a) | | | 23,177 | | | | 362,256 | |
| | | | | | | | |
| | | | 146,745,913 | |
| | | | | | | | |
Paper & Forest Products 0.1% | |
International Paper Co. | | | 51,573 | | | | 2,422,900 | |
| | | | | | | | |
|
Personal Products 0.2% | |
Avon Products, Inc. | | | 50,320 | | | | 1,165,411 | |
Estee Lauder Cos., Inc. (The) Class A | | | 28,021 | | | | 1,943,257 | |
| | | | | | | | |
| | | | 3,108,668 | |
| | | | | | | | |
Pharmaceuticals 5.9% | |
AbbVie, Inc. | | | 184,454 | | | | 8,494,107 | |
Actavis, Inc. (a) | | | 14,866 | | | | 1,571,782 | |
Allergan, Inc. | | | 35,886 | | | | 4,074,855 | |
Bristol-Myers Squibb Co. | | | 191,392 | | | | 7,602,090 | |
Eli Lilly & Co. | | | 116,690 | | | | 6,462,292 | |
Forest Laboratories, Inc. (a) | | | 27,229 | | | | 1,018,637 | |
Hospira, Inc. (a) | | | 19,229 | | | | 636,865 | |
¨Johnson & Johnson | | | 326,540 | | | | 27,831,004 | |
Merck & Co., Inc. | | | 353,287 | | | | 16,604,489 | |
Mylan, Inc. (a) | | | 46,236 | | | | 1,345,930 | |
Perrigo Co. | | | 10,235 | | | | 1,222,161 | |
¨Pfizer, Inc. | | | 840,336 | | | | 24,428,568 | |
| | | | | | | | |
| | | | 101,292,780 | |
| | | | | | | | |
Professional Services 0.1% | |
Dun & Bradstreet Corp. | | | 4,815 | | | | 425,887 | |
Equifax, Inc. | | | 13,958 | | | | 854,230 | |
Robert Half International, Inc. | | | 16,525 | | | | 542,350 | |
| | | | | | | | |
| | | | | | | 1,822,467 | |
| | | | | | | | |
| | | | | | | | |
| | |
| | | Shares | | | Value | |
| | | | | | | | |
Real Estate Investment Trusts 2.1% | |
American Tower Corp. | | | 46,146 | | | $ | 3,875,802 | |
Apartment Investment & Management Co. Class A | | | 16,950 | | | | 527,314 | |
AvalonBay Communities, Inc. | | | 13,299 | | | | 1,769,299 | |
Boston Properties, Inc. | | | 17,725 | | | | 1,939,647 | |
Equity Residential | | | 37,549 | | | | 2,180,095 | |
HCP, Inc. | | | 52,996 | | | | 2,824,687 | |
Health Care REIT, Inc. | | | 30,502 | | | | 2,286,735 | |
Host Hotels & Resorts, Inc. | | | 84,140 | | | | 1,537,238 | |
Kimco Realty Corp. | | | 47,393 | | | | 1,127,005 | |
Plum Creek Timber Co., Inc. | | | 18,808 | | | | 969,364 | |
ProLogis, Inc. | | | 57,687 | | | | 2,419,970 | |
Public Storage | | | 16,784 | | | | 2,769,360 | |
Simon Property Group, Inc. | | | 36,666 | | | | 6,529,115 | |
Ventas, Inc. | | | 34,125 | | | | 2,717,374 | |
Vornado Realty Trust | | | 19,926 | | | | 1,744,721 | |
Weyerhaeuser Co. | | | 63,410 | | | | 1,934,639 | |
| | | | | | | | |
| | | | | | | 37,152,365 | |
| | | | | | | | |
Real Estate Management & Development 0.0%‡ | |
CBRE Group, Inc. (a) | | | 35,159 | | | | 851,551 | |
| | | | | | | | |
|
Road & Rail 0.8% | |
CSX Corp. | | | 119,322 | | | | 2,934,128 | |
Norfolk Southern Corp. | | | 36,885 | | | | 2,855,637 | |
Ryder System, Inc. | | | 5,952 | | | | 345,632 | |
Union Pacific Corp. | | | 54,897 | | | | 8,122,560 | |
| | | | | | | | |
| | | | | | | 14,257,957 | |
| | | | | | | | |
Semiconductors & Semiconductor Equipment 2.0% | |
Advanced Micro Devices, Inc. (a) | | | 70,022 | | | | 197,462 | |
Altera Corp. | | | 37,261 | | | | 1,192,725 | |
Analog Devices, Inc. | | | 35,928 | | | | 1,580,473 | |
Applied Materials, Inc. | | | 140,610 | | | | 2,040,251 | |
Broadcom Corp. Class A | | | 61,190 | | | | 2,202,840 | |
First Solar, Inc. (a) | | | 6,988 | | | | 325,361 | |
Intel Corp. | | | 578,143 | | | | 13,846,525 | |
KLA-Tencor Corp. | | | 19,395 | | | | 1,052,179 | |
Lam Research Corp. (a) | | | 18,954 | | | | 876,054 | |
Linear Technology Corp. | | | 26,809 | | | | 978,529 | |
LSI Corp. (a) | | | 64,971 | | | | 424,910 | |
Microchip Technology, Inc. | | | 22,551 | | | | 821,307 | |
Micron Technology, Inc. (a) | | | 118,491 | | | | 1,116,185 | |
NVIDIA Corp. | | | 72,126 | | | | 993,175 | |
Teradyne, Inc. (a) | | | 21,837 | | | | 359,000 | |
Texas Instruments, Inc. | | | 129,140 | | | | 4,676,159 | |
Xilinx, Inc. | | | 30,537 | | | | 1,157,658 | |
| | | | | | | | |
| | | | 33,840,793 | |
| | | | | | | | |
Software 3.4% | |
Adobe Systems, Inc. (a) | | | 58,045 | | | | 2,616,669 | |
Autodesk, Inc. (a) | | | 26,436 | | | | 1,041,050 | |
| | | | | | |
The notes to the financial statements are an integral part of,
and should be read in conjunction with, the financial statements. | | mainstayinvestments.com | | | 15 | |
Portfolio of Investments April 30, 2013 (Unaudited) (continued)
| | | | | | | | |
| | |
| | | Shares | | | Value | |
| | | | | | | | |
| Common Stocks (continued) | |
Software (continued) | |
BMC Software, Inc. (a) | | | 15,325 | | | $ | 696,981 | |
CA, Inc. | | | 39,141 | | | | 1,055,633 | |
Citrix Systems, Inc. (a) | | | 21,778 | | | | 1,353,938 | |
Electronic Arts, Inc. (a) | | | 35,163 | | | | 619,220 | |
Intuit, Inc. | | | 32,477 | | | | 1,936,928 | |
¨Microsoft Corp. | | | 881,197 | | | | 29,167,621 | |
Oracle Corp. | | | 431,650 | | | | 14,149,487 | |
Red Hat, Inc. (a) | | | 22,481 | | | | 1,077,514 | |
Salesforce.com, Inc. (a) | | | 62,996 | | | | 2,589,766 | |
Symantec Corp. (a) | | | 81,000 | | | | 1,968,300 | |
| | | | | | | | |
| | | | 58,273,107 | |
| | | | | | | | |
Specialty Retail 2.2% | |
Abercrombie & Fitch Co. Class A | | | 9,289 | | | | 460,363 | |
AutoNation, Inc. (a) | | | 4,498 | | | | 204,704 | |
AutoZone, Inc. (a) | | | 4,247 | | | | 1,737,405 | |
Bed Bath & Beyond, Inc. (a) | | | 26,433 | | | | 1,818,590 | |
Best Buy Co., Inc. | | | 30,976 | | | | 805,066 | |
Carmax, Inc. (a) | | | 26,596 | | | | 1,224,480 | |
GameStop Corp. Class A | | | 14,385 | | | | 502,037 | |
Gap, Inc. (The) | | | 34,733 | | | | 1,319,507 | |
Home Depot, Inc. (The) | | | 174,773 | | | | 12,819,600 | |
L Brands, Inc. | | | 27,781 | | | | 1,400,440 | |
Lowe’s Companies, Inc. | | | 129,748 | | | | 4,984,918 | |
O’Reilly Automotive, Inc. (a) | | | 12,960 | | | | 1,390,867 | |
PetSmart, Inc. | | | 12,598 | | | | 859,688 | |
Ross Stores, Inc. | | | 26,087 | | | | 1,723,568 | |
Staples, Inc. | | | 79,510 | | | | 1,052,712 | |
Tiffany & Co. | | | 13,863 | | | | 1,021,426 | |
TJX Cos., Inc. | | | 85,112 | | | | 4,150,912 | |
Urban Outfitters, Inc. (a) | | | 12,711 | | | | 526,744 | |
| | | | | | | | |
| | | | 38,003,027 | |
| | | | | | | | |
Textiles, Apparel & Luxury Goods 0.7% | |
Coach, Inc. | | | 32,821 | | | | 1,931,844 | |
Fossil, Inc. (a) | | | 6,383 | | | | 626,300 | |
NIKE, Inc. Class B | | | 84,807 | | | | 5,393,725 | |
PVH Corp. | | | 9,103 | | | | 1,050,577 | |
Ralph Lauren Corp. | | | 7,115 | | | | 1,291,942 | |
VF Corp. | | | 10,239 | | | | 1,824,795 | |
| | | | | | | | |
| | | | 12,119,183 | |
| | | | | | | | |
Thrifts & Mortgage Finance 0.1% | |
Hudson City Bancorp, Inc. | | | 55,359 | | | | 460,033 | |
People’s United Financial, Inc. | | | 39,924 | | | | 525,400 | |
| | | | | | | | |
| | | | | | | 985,433 | |
| | | | | | | | |
Tobacco 1.8% | |
Altria Group, Inc. | | | 234,934 | | | | 8,577,440 | |
Lorillard, Inc. | | | 44,615 | | | | 1,913,538 | |
Philip Morris International, Inc. | | | 192,612 | | | | 18,411,781 | |
Reynolds American, Inc. | | | 37,846 | | | | 1,794,657 | |
| | | | | | | | |
| | | | | | | 30,697,416 | |
| | | | | | | | |
| | | | | | | | |
| | |
| | | Shares | | | Value | |
| | | | | | | | |
Trading Companies & Distributors 0.2% | |
Fastenal Co. | | | 31,386 | | | $ | 1,539,483 | |
W.W. Grainger, Inc. | | | 6,981 | | | | 1,720,607 | |
| | | | | | | | |
| | | | | | | 3,260,090 | |
| | | | | | | | |
Wireless Telecommunication Services 0.3% | |
Crown Castle International
Corp. (a) | | | 34,129 | | | | 2,627,933 | |
MetroPCS Communications,
Inc. (a) | | | 19,140 | | | | 226,618 | |
Sprint Nextel Corp. (a) | | | 349,402 | | | | 2,463,284 | |
| | | | | | | | |
| | | | | | | 5,317,835 | |
| | | | | | | | |
Total Common Stocks
(Cost $838,068,988) | | | | 1,664,974,747 | (b) |
| | | | | | | | |
| | |
| | | | | | | | |
| | | Principal Amount | | | | |
| Short-Term Investments 4.7% | |
Repurchase Agreement 0.0%‡ | | | | | | | | |
State Street Bank and Trust Co.
0.01%, dated 4/30/13
due 5/1/13
Proceeds at Maturity $54,200 (Collateralized by a Federal National Mortgage Association security with a rate of 2.08% and a maturity date of 11/2/22, with a Principal Amount of $55,000 and a Market Value of $55,583) | | $ | 54,200 | | | | 54,200 | |
| | | | | | | | |
Total Repurchase Agreement
(Cost $54,200) | | | | 54,200 | |
| | | | | | | | |
| | |
U.S. Government 4.7% | | | | | | | | |
United States Treasury Bills | | | | | | | | |
0.035% - 0.092%,
due 7/11/13 (c) | | | 17,600,000 | | | | 17,599,120 | |
0.049% - 0.074%,
due 7/25/13 (c)(d) | | | 7,000,000 | | | | 6,999,160 | |
0.056%, due 7/11/13 (c) | | | 56,600,000 | | | | 56,597,170 | |
| | | | | | | | |
Total U.S. Government
(Cost $81,190,931) | | | | 81,195,450 | |
| | | | | | | | |
Total Short-Term Investments
(Cost $81,245,131) | | | | 81,249,650 | |
| | | | | | | | |
Total Investments
(Cost $919,314,119) (f) | | | 101.1 | % | | | 1,746,224,397 | |
Other Assets, Less Liabilities | | | (1.1 | ) | | | (18,373,995 | ) |
Net Assets | | | 100.0 | % | | $ | 1,727,850,402 | |
| | |
| | | | | | | | |
| | | | | | | | |
| | | Contracts
Long | | | Unrealized
Appreciation
(Depreciation) (e) | |
| Futures Contracts 0.1% | | | | | | | | |
Standard & Poor’s 500 Index Mini
June 2013 | | | 996 | | | $ | 2,174,600 | |
| | | | | | | | |
Total Futures Contracts
(Settlement Value $79,291,560) (b) | | | | | | $ | 2,174,600 | |
| | | | | | | | |
| | | | |
| 16 | | MainStay S&P 500 Index Fund | | The notes to the financial statements are an integral part of,
and should be read in conjunction with, the financial statements. |
| ‡ | Less than one-tenth of a percent. |
| (a) | Non-income producing security. |
| (b) | The combined market value of common stocks and settlement value of Standard & Poor’s 500 Index futures contracts represents 100.9% of net assets. |
| (c) | Interest rate presented is yield to maturity. |
| (d) | Represents a security, or a portion thereof, which is maintained at a broker as collateral for futures contracts. |
| (e) | Represents the difference between the value of the contracts at the time they were opened and the value as of April 30, 2013. |
| (f) | As of April 30, 2013, cost is $962,346,802 for federal income tax purposes and net unrealized appreciation is as follows: |
| | | | |
Gross unrealized appreciation | | $ | 854,150,213 | |
Gross unrealized depreciation | | | (70,272,618 | ) |
| | | | |
Net unrealized appreciation | | $ | 783,877,595 | |
| | | | |
The following is a summary of the fair valuations according to the inputs used as of April 30, 2013, for valuing the Fund’s assets.
Asset Valuation Inputs
| | | | | | | | | | | | | | | | |
Description | | Quoted
Prices in
Active
Markets for
Identical
Assets (Level 1) | | | Significant
Other
Observable
Inputs (Level 2) | | | Significant
Unobservable
Inputs
(Level 3) | | | Total | |
| Investments in Securities (a) | | | | | | | | | | | | | | | | |
| Common Stocks | | $ | 1,664,974,747 | | | $ | — | | | $ | — | | | $ | 1,664,974,747 | |
| Short-Term Investments | | | | | | | | | | | | | | | | |
Repurchase Agreement | | | — | | | | 54,200 | | | | — | | | | 54,200 | |
U.S. Government | | | — | | | | 81,195,450 | | | | — | | | | 81,195,450 | |
| | | | | | | | | | | | | | | | |
| Total Short-Term Investments | | | — | | | | 81,249,650 | | | | — | | | | 81,249,650 | |
| | | | | | | | | | | | | | | | |
| Total Investments in Securities | | | 1,664,974,747 | | | | 81,249,650 | | | | — | | | | 1,746,224,397 | |
| | | | | | | | | | | | | | | | |
| Other Financial Instruments | | | | | | | | | | | | | | | | |
Futures Contracts Long (b) | | | 2,174,600 | | | | — | | | | — | | | | 2,174,600 | |
| | | | | | | | | | | | | | | | |
| Total Other Financial Instruments | | | 2,174,600 | | | | — | | | | — | | | | 2,174,600 | |
| | | | | | | | | | | | | | | | |
| Total Investments in Securities and Other Financial Instruments | | $ | 1,667,149,347 | | | $ | 81,249,650 | | | $ | — | | | $ | 1,748,398,997 | |
| | | | | | | | | | | | | | | | |
| (a) | For a complete listing of investments and their industries, see the Portfolio of Investments. |
| (b) | The value listed for these securities reflects unrealized appreciation (depreciation) as shown on the Portfolio of Investments. |
The Fund recognizes transfers between the levels as of the beginning of the period.
For the period ended April 30, 2013, the Fund did not have any transfers between Level 1 and Level 2 fair value measurements. (See Note 2)
As of April 30, 2013, the Fund did not hold any investments with significant unobservable inputs (Level 3). (See Note 2)
| | | | | | |
The notes to the financial statements are an integral part of,
and should be read in conjunction with, the financial statements. | | mainstayinvestments.com | | | 17 | |
Statement of Assets and Liabilities as of April 30, 2013 (Unaudited)
| | | | |
| Assets | |
Investment in securities, at value
(identified cost $919,314,119) | | $ | 1,746,224,397 | |
Receivables: | | | | |
Fund shares sold | | | 1,719,726 | |
Dividends and interest | | | 1,504,981 | |
Variation margin on futures contracts | | | 203,273 | |
Investment securities sold | | | 3,221 | |
Other assets | | | 40,289 | |
| | | | |
Total assets | | | 1,749,695,887 | |
| | | | |
| |
| Liabilities | | | | |
Payables: | | | | |
Fund shares redeemed | | | 18,873,823 | |
Investment securities purchased | | | 1,917,750 | |
Transfer agent (See Note 3) | | | 492,347 | |
Manager (See Note 3) | | | 240,576 | |
NYLIFE Distributors (See Note 3) | | | 96,852 | |
Shareholder communication | | | 58,724 | |
Professional fees | | | 50,889 | |
Custodian | | | 10,493 | |
Trustees | | | 4,277 | |
Accrued expenses | | | 99,754 | |
| | | | |
Total liabilities | | | 21,845,485 | |
| | | | |
Net assets | | $ | 1,727,850,402 | |
| | | | |
| |
| Composition of Net Assets | | | | |
Shares of beneficial interest outstanding (par value of $.001 per share) unlimited number of shares authorized | | $ | 46,679 | |
Additional paid-in capital | | | 1,021,389,258 | |
| | | | |
| | | 1,021,435,937 | |
Undistributed net investment income | | | 8,561,285 | |
Accumulated net realized gain (loss) on investments and futures transactions | | | (131,231,698 | ) |
Net unrealized appreciation (depreciation) on investments and futures contracts | | | 829,084,878 | |
| | | | |
Net assets | | $ | 1,727,850,402 | |
| | | | |
| | | | |
Investor Class | | | | |
Net assets applicable to outstanding shares | | $ | 25,043,103 | |
| | | | |
Shares of beneficial interest outstanding | | | 681,031 | |
| | | | |
Net asset value per share outstanding | | $ | 36.77 | |
Maximum sales charge (3.00% of offering price) | | | 1.14 | |
| | | | |
Maximum offering price per share outstanding | | $ | 37.91 | |
| | | | |
Class A | | | | |
Net assets applicable to outstanding shares | | $ | 453,519,896 | |
| | | | |
Shares of beneficial interest outstanding | | | 12,331,938 | |
| | | | |
Net asset value per share outstanding | | $ | 36.78 | |
Maximum sales charge (3.00% of offering price) | | | 1.14 | |
| | | | |
Maximum offering price per share outstanding | | $ | 37.92 | |
| | | | |
Class I | | | | |
Net assets applicable to outstanding shares | | $ | 1,249,287,403 | |
| | | | |
Shares of beneficial interest outstanding | | | 33,666,373 | |
| | | | |
Net asset value and offering price per share outstanding | | $ | 37.11 | |
| | | | |
| | | | |
| 18 | | MainStay S&P 500 Index Fund | | The notes to the financial statements are an integral part of,
and should be read in conjunction with, the financial statements. |
Statement of Operations for the six months ended April 30, 2013 (Unaudited)
| | | | |
| Investment Income (Loss) | |
Income | | | | |
Dividends (a) | | $ | 19,100,147 | |
Interest | | | 28,537 | |
| | | | |
Total income | | | 19,128,684 | |
| | | | |
Expenses | | | | |
Manager (See Note 3) | | | 1,994,644 | |
Transfer agent (See Note 3) | | | 1,344,832 | |
Distribution/Service—Investor Class (See Note 3) | | | 28,479 | |
Distribution/Service—Class A (See Note 3) | | | 528,365 | |
Shareholder communication | | | 66,483 | |
Professional fees | | | 48,851 | |
Registration | | | 26,038 | |
Custodian | | | 23,302 | |
Trustees | | | 19,205 | |
Miscellaneous | | | 44,093 | |
| | | | |
Total expenses before waiver/reimbursement | | | 4,124,292 | |
Expense waiver/reimbursement from Manager (See Note 3) | | | (646,206 | ) |
| | | | |
Net expenses | | | 3,478,086 | |
| | | | |
Net investment income (loss) | | | 15,650,598 | |
| | | | |
|
| Realized and Unrealized Gain (Loss) on Investments and Futures Contracts | |
Net realized gain (loss) on: | | | | |
Security transactions | | | 14,437,648 | |
Futures transactions | | | 3,851,975 | |
| | | | |
Net realized gain (loss) on investments and
futures transactions | | | 18,289,623 | |
| | | | |
Net change in unrealized appreciation (depreciation) on: | | | | |
Investments | | | 183,197,431 | |
Futures contracts | | | 5,663,867 | |
| | | | |
Net change in unrealized appreciation (depreciation) on investments and futures contracts | | | 188,861,298 | |
| | | | |
Net realized and unrealized gain (loss) on investments and futures transactions | | | 207,150,921 | |
| | | | |
Net increase (decrease) in net assets resulting from operations | | $ | 222,801,519 | |
| | | | |
| (a) | Dividends recorded net of foreign withholding taxes in the amount of $23,410. |
| | | | | | |
The notes to the financial statements are an integral part of,
and should be read in conjunction with, the financial statements. | | mainstayinvestments.com | | | 19 | |
Statements of Changes in Net Assets
for the six months ended April 30, 2013 (Unaudited) and the year ended October 31, 2012
| | | | | | | | |
| | | 2013 | | | 2012 | |
| Increase (Decrease) in Net Assets | |
Operations: | | | | | | | | |
Net investment income (loss) | | $ | 15,650,598 | | | $ | 25,709,037 | |
Net realized gain (loss) on investments, futures transactions and foreign currency transactions | | | 18,289,623 | | | | 25,833,231 | |
Net change in unrealized appreciation (depreciation) on investments, investments sold short and futures contracts | | | 188,861,298 | | | | 157,701,035 | |
| | | | |
Net increase (decrease) in net assets resulting from operations | | | 222,801,519 | | | | 209,243,303 | |
| | | | |
Dividends to shareholders: | | | | | | | | |
From net investment income: | | | | | | | | |
Investor Class | | | (311,654 | ) | | | (274,408 | ) |
Class A | | | (6,216,050 | ) | | | (2,837,215 | ) |
Class I | | | (21,172,320 | ) | | | (18,767,421 | ) |
| | | | |
Total dividends to shareholders | | | (27,700,024 | ) | | | (21,879,044 | ) |
| | | | |
Capital share transactions: | | | | | | | | |
Net proceeds from sale of shares | | | 172,845,953 | | | | 434,971,976 | |
Net asset value of shares issued in connection with the acquisition of MainStay Equity Index Fund (See Note 10) | | | — | | | | 191,583,350 | |
Net asset value of shares issued to shareholders in reinvestment of dividends | | | 27,421,857 | | | | 21,815,659 | |
Cost of shares redeemed | | | (303,892,444 | ) | | | (523,574,907 | ) |
| | | | |
Increase (decrease) in net assets derived from capital share transactions | | | (103,624,634 | ) | | | 124,796,078 | |
| | | | |
Net increase (decrease) in net assets | | | 91,476,861 | | | | 312,160,337 | |
|
| Net Assets | |
Beginning of period | | | 1,636,373,541 | | | | 1,324,213,204 | |
| | | | |
End of period | | $ | 1,727,850,402 | | | $ | 1,636,373,541 | |
| | | | |
Undistributed net investment income at end of period | | $ | 8,561,285 | | | $ | 20,610,711 | |
| | | | |
| | | | |
| 20 | | MainStay S&P 500 Index Fund | | The notes to the financial statements are an integral part of,
and should be read in conjunction with, the financial statements. |
Financial Highlights selected per share data and ratios
| | | | | | | | | | | | | | | | | | | | | | | | |
| | | Investor Class | |
| | | Six months
ended
April 30, | | | Year ended October 31, | | | February 28,
2008**
through
October 31, | |
| | | 2013* | | | 2012 | | | 2011 | | | 2010 | | | 2009 | | | 2008 | |
Net asset value at beginning of period | | $ | 32.73 | | | $ | 28.98 | | | $ | 27.33 | | | $ | 23.93 | | | $ | 22.47 | | | $ | 31.35 | |
| | | | | | | | | | | | | | | | | | | | | | | | |
Net investment income (loss) | | | 0.27 | | | | 0.44 | (a) | | | 0.38 | | | | 0.33 | | | | 0.38 | | | | 0.26 | |
Net realized and unrealized gain (loss) on investments | | | 4.24 | | | | 3.70 | | | | 1.62 | | | | 3.41 | | | | 1.59 | | | | (9.14 | ) |
Net realized and unrealized gain (loss) on foreign currency transactions | | | — | | | | (0.00 | )‡ | | | — | | | | — | | | | — | | | | — | |
| | | | | | | | | | | | | | | | | | | | | | | | |
Total from investment operations | | | 4.51 | | | | 4.14 | | | | 2.00 | | | | 3.74 | | | | 1.97 | | | | (8.88 | ) |
| | | | | | | | | | | | | | | | | | | | | | | | |
Less dividends: | | | | | | | | | | | | | | | | | | | | | | | | |
From net investment income | | | (0.47 | ) | | | (0.39 | ) | | | (0.35 | ) | | | (0.34 | ) | | | (0.51 | ) | | | — | |
| | | | | | | | | | | | | | | | | | | | | | | | |
Net asset value at end of period | | $ | 36.77 | | | $ | 32.73 | | | $ | 28.98 | | | $ | 27.33 | | | $ | 23.93 | | | $ | 22.47 | |
| | | | | | | | | | | | | | | | | | | | | | | | |
Total investment return (b) | | | 13.97 | %(c) | | | 14.48 | % | | | 7.35 | % | | | 15.75 | % | | | 9.21 | % | | | (28.33 | %)(c) |
Ratios (to average net assets)/Supplemental Data: | | | | | | | | | | | | | | | | | | | | | | | | |
Net investment income (loss) | | | 1.58 | %†† | | | 1.42 | % | | | 1.29 | % | | | 1.30 | % | | | 1.75 | % | | | 1.63 | % †† |
Net expenses | | | 0.70 | %†† | | | 0.70 | % | | | 0.70 | % | | | 0.70 | % | | | 0.63 | % | | | 0.60 | % †† |
Expenses (before waiver/reimbursement) | | | 0.84 | %†† | | | 0.87 | % | | | 0.91 | % | | | 1.01 | % | | | 1.15 | % | | | 1.06 | % †† |
Portfolio turnover rate | | | 1 | % | | | 9 | % | | | 4 | % | | | 11 | % | | | 8 | % | | | 5 | % |
Net assets at end of period (in 000’s) | | $ | 25,043 | | | $ | 21,475 | | | $ | 20,134 | | | $ | 19,295 | | | $ | 17,822 | | | $ | 15,372 | |
| ** | Commencement of operations. |
| ‡ | Less than one cent per share. |
| (a) | Per share data based on average shares outstanding during the period. |
| (b) | Total investment return is calculated exclusive of sales charges and assumes the reinvestment of dividends and distributions. |
| (c) | Total investment return is not annualized. |
| | | | | | |
The notes to the financial statements are an integral part of,
and should be read in conjunction with, the financial statements. | | mainstayinvestments.com | | | 21 | |
Financial Highlights selected per share data and ratios
| | | | | | | | | | | | | | | | | | | | | | | | |
| | | Class A | |
| | | Six months
ended April 30, | | | Year ended October 31, | |
| | | 2013* | | | 2012 | | | 2011 | | | 2010 | | | 2009 | | | 2008 | |
Net asset value at beginning of period | | $ | 32.74 | | | $ | 28.99 | | | $ | 27.34 | | | $ | 23.92 | | | $ | 22.47 | | | $ | 35.79 | |
| | | | | | | | | | | | | | | | | | | | | | | | |
Net investment income (loss) | | | 0.29 | | | | 0.47 | (a) | | | 0.42 | | | | 0.37 | | | | 0.38 | | | | 0.51 | |
Net realized and unrealized gain (loss) on investments | | | 4.25 | | | | 3.70 | | | | 1.61 | | | | 3.40 | | | | 1.58 | | | | (13.35 | ) |
Net realized and unrealized gain (loss) on foreign currency transactions | | | — | | | | (0.00 | )‡ | | | — | | | | — | | | | — | | | | — | |
| | | | | | | | | | | | | | | | | | | | | | | | |
Total from investment operations | | | 4.54 | | | | 4.17 | | | | 2.03 | | | | 3.77 | | | | 1.96 | | | | (12.84 | ) |
| | | | | | | | | | | | | | | | | | | | | | | | |
Less dividends: | | | | | | | | | | | | | | | | | | | | | | | | |
From net investment income | | | (0.50 | ) | | | (0.42 | ) | | | (0.38 | ) | | | (0.35 | ) | | | (0.51 | ) | | | (0.48 | ) |
| | | | | | | | | | | | | | | | | | | | | | | | |
Net asset value at end of period | | $ | 36.78 | | | $ | 32.74 | | | $ | 28.99 | | | $ | 27.34 | | | $ | 23.92 | | | $ | 22.47 | |
| | | | | | | | | | | | | | | | | | | | | | | | |
Total investment return (b) | | | 14.07 | %(c) | | | 14.59 | % | | | 7.46 | % | | | 15.88 | % | | | 9.18 | % | | | (36.32 | %) |
Ratios (to average net assets)/Supplemental Data: | | | | | | | | | | | | | | | | | | | | | | | | |
Net investment income (loss) | | | 1.69 | %†† | | | 1.47 | % | | | 1.39 | % | | | 1.40 | % | | | 1.79 | % | | | 1.65 | % |
Net expenses | | | 0.60 | %†† | | | 0.60 | % | | | 0.60 | % | | | 0.60 | % | | | 0.60 | % | | | 0.60 | % |
Expenses (before waiver/reimbursement) | | | 0.68 | %†† | | | 0.68 | % | | | 0.69 | % | | | 0.74 | % | | | 0.86 | % | | | 0.79 | % |
Portfolio turnover rate | | | 1 | % | | | 9 | % | | | 4 | % | | | 11 | % | | | 8 | % | | | 5 | % |
Net assets at end of period (in 000’s) | | $ | 453,520 | | | $ | 408,258 | | | $ | 195,006 | | | $ | 193,335 | | | $ | 196,774 | | | $ | 182,351 | |
| ‡ | Less than one cent per share. |
| (a) | Per share data based on average shares outstanding during the period. |
| (b) | Total investment return is calculated exclusive of sales charges and assumes the reinvestment of dividends and distributions. |
| (c) | Total investment return is not annualized. |
| | | | |
| 22 | | MainStay S&P 500 Index Fund | | The notes to the financial statements are an integral part of,
and should be read in conjunction with, the financial statements. |
Financial Highlights selected per share data and ratios
| | | | | | | | | | | | | | | | | | | | | | | | |
| | | Class I | |
| | | Six months
ended April 30, | | | Year ended October 31, | |
| | | 2013* | | | 2012 | | | 2011 | | | 2010 | | | 2009 | | | 2008 | |
Net asset value at beginning of period | | $ | 33.06 | | | $ | 29.28 | | | $ | 27.60 | | | $ | 24.15 | | | $ | 22.69 | | | $ | 36.14 | |
| | | | | | | | | | | | | | | | | | | | | | | | |
Net investment income (loss) | | | 0.34 | | | | 0.55 | (a) | | | 0.50 | | | | 0.44 | | | | 0.44 | | | | 0.60 | |
Net realized and unrealized gain (loss) on investments | | | 4.28 | | | | 3.73 | | | | 1.63 | | | | 3.42 | | | | 1.60 | | | | (13.46 | ) |
Net realized and unrealized gain (loss) on foreign currency transactions | | | — | | | | (0.00 | )‡ | | | — | | | | — | | | | — | | | | — | |
| | | | | | | | | | | | | | | | | | | | | | | | |
Total from investment operations | | | 4.62 | | | | 4.28 | | | | 2.13 | | | | 3.86 | | | | 2.04 | | | | (12.86 | ) |
| | | | | | | | | | | | | | | | | | | | | | | | |
Less dividends: | | | | | | | | | | | | | | | | | | | | | | | | |
From net investment income | | | (0.57 | ) | | | (0.50 | ) | | | (0.45 | ) | | | (0.41 | ) | | | (0.58 | ) | | | (0.59 | ) |
| | | | | | | | | | | | | | | | | | | | | | | | |
Net asset value at end of period | | $ | 37.11 | | | $ | 33.06 | | | $ | 29.28 | | | $ | 27.60 | | | $ | 24.15 | | | $ | 22.69 | |
| | | | | | | | | | | | | | | | | | | | | | �� | | |
Total investment return (b) | | | 14.21 | %(c) | | | 14.84 | % | | | 7.75 | % | | | 16.13 | % | | | 9.55 | % | | | (36.13 | %) |
Ratios (to average net assets)/Supplemental Data: | | | | | | | | | | | | | | | | | | | | | | | | |
Net investment income (loss) | | | 1.96 | %†† | | | 1.77 | % | | | 1.64 | % | | | 1.65 | % | | | 2.07 | % | | | 1.95 | % |
Net expenses | | | 0.35 | %†† | | | 0.35 | % | | | 0.35 | % | | | 0.35 | % | | | 0.32 | % | | | 0.30 | % |
Expenses (before waiver/reimbursement) | | | 0.43 | %†† | | | 0.43 | % | | | 0.44 | % | | | 0.49 | % | | | 0.61 | % | | | 0.49 | % |
Portfolio turnover rate | | | 1 | % | | | 9 | % | | | 4 | % | | | 11 | % | | | 8 | % | | | 5 | % |
Net assets at end of period (in 000’s) | | $ | 1,249,287 | | | $ | 1,206,641 | | | $ | 1,109,073 | | | $ | 1,120,188 | | | $ | 1,044,598 | | | $ | 919,826 | |
| ‡ | Less than one cent per share. |
| (a) | Per share data based on average shares outstanding during the period. |
| (b) | Total investment return is calculated exclusive of sales charges and assumes the reinvestment of dividends and distributions. Class I shares are not subject to sales charges. |
| (c) | Total investment return is not annualized. |
| | | | | | |
The notes to the financial statements are an integral part of,
and should be read in conjunction with, the financial statements. | | mainstayinvestments.com | | | 23 | |
Notes to Financial Statements (Unaudited)
Note 1–Organization and Business
MainStay Funds Trust (the “Trust”) was organized as a Delaware statutory trust on April 28, 2009, and is governed by a Declaration of Trust. The Trust is registered under the Investment Company Act of 1940, as amended (the “1940 Act”), as an open-end investment management company, and is comprised of thirty-three funds (collectively referred to as the “Funds”). These financial statements and notes relate only to the MainStay S&P 500 Index Fund (the “Fund”), a diversified fund. The Fund is the successor of the MainStay S&P 500 Index Fund, a series of Eclipse Funds Inc. (the “Predecessor Fund”). The reorganization of the Predecessor Fund with and into the Fund occurred on February 26, 2010. All information and references to periods prior to February 26, 2010, relate to the Predecessor Fund.
The Fund currently offers three classes of shares. Class I shares commenced operations on January 2, 1991. Class A shares commenced operations on January 2, 2004. Investor Class shares commenced operations on February 28, 2008. Investor Class and Class A shares are offered at net asset value (“NAV”) per share plus an initial sales charge. No sales charge applies to investments of $1 million or more (and certain other qualified purchases) in Investor Class and Class A shares, but a contingent deferred sales charge (“CDSC”) is imposed on certain redemptions made within one year of the date of purchase. Class I shares are offered at NAV and are not subject to a sales charge. Depending upon eligibility, Investor Class shares may convert to Class A shares and Class A shares may convert to Investor Class shares. The three classes of shares have the same voting (except for issues that relate solely to one class), dividend, liquidation and other rights, and the same terms and conditions, except that Investor Class and Class A shares are subject to a distribution and/or service fee. Class I shares are not subject to a distribution and/or service fee.
The Fund’s investment objective is to seek investment results that correspond to the total return performance (reflecting reinvestment of dividends) of common stocks in the aggregate, as represented by the S&P 500® Index.
Note 2–Significant Accounting Policies
The Fund prepares its financial statements in accordance with generally accepted accounting principles (“GAAP”) in the United States of America and follows the significant accounting policies described below.
(A) Securities Valuation. Investments are valued as of the close of regular trading on the New York Stock Exchange (“Exchange”) (generally 4:00 p.m. Eastern time) on each day the Fund is open for business (“valuation date”).
The Board of Trustees (the “Board”) has adopted procedures for the valuation of the Fund’s securities and has delegated the responsibility for valuation determination under those procedures to the Valuation Committee of the Fund (the “Valuation Committee”). The Board has authorized the Valuation Committee to appoint a Valuation Sub-Committee (the “Sub-Committee”) to deal in the first instance with questions that arise or cannot be resolved under these procedures. The Sub-Committee meets (in person, via electronic mail or via teleconference) on an as-needed basis. The Valuation Committee meets at a later time, as necessary, to ensure that actions taken by the Sub-Committee were appropriate. The procedures recognize that, subject to
the oversight of the Board and unless otherwise noted, the responsibility for day-to-day valuation of portfolio assets (including securities for which market prices are not readily available) rests with New York Life Investment Management LLC ( “New York Life Investments” or the “Manager”), aided to whatever extent necessary by the Subadvisor (as defined in Note 3(A)) of the Fund.
To assess the appropriateness of security valuations, the Manager or the Fund’s third party service provider who is subject to oversight by the Manager, regularly compares prior day prices, prices on comparable securities and the sale prices to the prior and current day prices and challenges prices exceeding certain tolerance levels with third party pricing services or broker sources. For those securities valued by recommendation, whether through a standardized fair valuation methodology or a fair valuation determination, the Valuation Committee reviews and affirms the reasonableness of the valuation based on such methodologies and determinations on a regular basis after considering all relevant information that is reasonably available.
“Fair value” is defined as the price that the Fund would receive upon selling an investment in an orderly transaction to an independent buyer in the principal or most advantageous market of the investment. Fair value measurements are determined within a framework that has established a three-tier hierarchy which maximizes the use of observable market data and minimizes the use of unobservable inputs to establish classification of fair value measurements for disclosure purposes. “Inputs” refers broadly to the assumptions that market participants would use in pricing the asset or liability, including assumptions about risk, such as the risk inherent in a particular valuation technique used to measure fair value using a pricing model and/or the risk inherent in the inputs for the valuation technique. Inputs may be observable or unobservable. Observable inputs reflect the assumptions market participants would use in pricing the asset or liability based on market data obtained from sources independent of the Fund. Unobservable inputs reflect the Fund’s own assumptions about the assumptions market participants would use in pricing the asset or liability developed based on the information available in the circumstances. The inputs or methodology used for valuing securities may not be an indication of the risks associated with investing in those securities. The three-tier hierarchy of inputs is summarized in the three broad Levels listed below.
| • | | Level 1—quoted prices in active markets for identical investments |
| • | | Level 2—other significant observable inputs (including quoted prices for similar investments in active markets, interest rates and yield curves, prepayment speeds, credit risks, etc.) |
| • | | Level 3—significant unobservable inputs (including the Fund’s own assumptions about the assumptions that market participants would use in determining the fair value of investments) |
The aggregate value by input level, as of April 30, 2013, for the Fund’s investments is included at the end of the Fund’s Portfolio of Investments.
The valuation techniques used by the Fund to measure fair value maximize the use of observable inputs and minimize the use of unobservable inputs. The Fund may utilize third party vendor
| | |
| 24 | | MainStay S&P 500 Index Fund |
evaluations, whose prices may be derived from one or more of the following standard inputs:
| | |
• Benchmark Yields | | • Reported Trades |
• Broker Dealer Quotes | | • Issuer Spreads |
• Two-sided markets | | • Benchmark securities |
• Bids/Offers | | • Reference Data (corporate actions or material event notices) |
• Industry and economic events | | • Comparable bonds |
• Equity and credit default swap curves | | • Monthly payment information |
Securities for which market values cannot be determined using the methodologies described above are valued by methods deemed in good faith by the Fund’s Valuation Committee, following the procedures established by the Board, to represent fair value. Under these procedures, the Fund primarily employs a market-based approach which may use related or comparable assets or liabilities, recent transactions, market multiples, book values, and other relevant information. The Fund may also use an income-based valuation approach in which the anticipated future cash flows of the investment are discounted to calculate fair value. Discounts may also be applied due to the nature or duration of any restrictions on the disposition of the investments. Due to the inherent uncertainty of valuations of such investments, the fair values may differ significantly from the values that would have been used had an active market existed. For the six-month period ended April 30, 2013, there have been no changes to the fair value methodologies.
Equity and non-equity securities which may be valued in this manner include, but are not limited to: (i) a security for which the trading has been halted or suspended; (ii) a debt security that has recently gone into default and for which there is not a current market quotation; (iii) a security of an issuer that has entered into a restructuring; (iv) a security that has been de-listed from a national exchange; (v) a security for which the market price is not available from a third party pricing source or, if so provided, does not, in the opinion of the Fund’s Manager or Subadvisor reflect the security’s market value; and (vi) a security whose principal market has been temporarily closed at a time when, under normal conditions, it would be open. Securities for which market quotations or observable inputs are not readily available are generally categorized as Level 3 in the hierarchy. As of April 30, 2013, the Fund did not hold any securities that were fair valued in such a manner.
Certain events may occur between the time that foreign markets close, on which securities held by the Fund principally trade, and the time at which the Fund’s NAV is calculated. These events may include, but are not limited to, situations relating to a single issuer in a market sector, significant fluctuations in U.S. or foreign markets, natural disasters, armed conflicts, governmental actions or other developments not tied directly to the securities markets. Should the Manager or Subadvisor conclude that such events may have affected the accuracy of the last price of such securities reported on the local foreign market, the Manager or Subadvisor may, pursuant to procedures adopted by the Fund’s Board, adjust the value of the local price to reflect the estimated impact on the price of such securities as a result of such events. In this instance, securities are generally categorized as Level 3 in the hierarchy. Additionally, foreign equity securities are also fair valued whenever the movement of a particular index exceeds certain thresholds. In such cases, the securities are fair valued by applying factors provided
by a third party vendor in accordance with the Fund’s policies and procedures and are generally categorized as Level 2 in the hierarchy. As of April 30, 2013, the Fund did not hold any foreign equity securities.
Equity securities and Exchange Traded Funds are valued at the latest quoted sales prices as of the close of regular trading on the Exchange on each valuation date. Securities that are not traded on the valuation date are valued at the mean of the latest quoted bid and ask prices. Prices normally are taken from the principal market in which each security trades. Futures contracts are valued at the last posted settlement price on the market where such futures are primarily traded. Investments in other mutual funds are valued at their respective NAVs as of the close of the Exchange on the valuation date. These securities are generally categorized as Level 1 in the hierarchy.
Temporary cash investments acquired over 60 days to maturity are valued using the latest bid prices or using valuations based on a matrix system (which considers such factors as security prices, yields, maturities, and ratings), both as furnished by independent pricing services. Other temporary cash investments which mature in 60 days or less (“Short-Term Investments”) are valued at amortized cost. The amortized cost method involves valuing a security at its cost on the date of purchase and thereafter assuming a constant amortization to maturity of the difference between such cost and the value on maturity date. Amortized cost approximates the current fair value of a security. Securities valued at amortized cost are not valued using a quoted price in an active market. These securities are generally categorized as Level 2 in the hierarchy.
(B) Income Taxes. The Fund’s policy is to comply with the requirements of the Internal Revenue Code of 1986, as amended (the “Internal Revenue Code”), applicable to regulated investment companies and to distribute all of the taxable income to the shareholders of the Fund within the allowable time limits. Therefore, no federal, state and local income tax provision is required.
Management evaluates its tax positions to determine if the tax positions taken meet the minimum recognition threshold in connection with accounting for uncertainties in income tax positions taken or expected to be taken for the purposes of measuring and recognizing tax liabilities in the financial statements. Recognition of tax benefits of an uncertain tax position is required only when the position is “more likely than not” to be sustained assuming examination by taxing authorities. Management has analyzed the Fund’s tax positions taken on federal, state and local income tax returns for all open tax years (for up to three tax years), and has concluded that no provision for federal, state and local income tax is required in the Fund’s financial statements. The Fund’s federal, state and local income and federal excise tax returns for tax years for which the applicable statutes of limitations have not expired are subject to examination by the Internal Revenue Service and state and local departments of revenue.
(C) Dividends and Distributions to Shareholders. Dividends and distributions are recorded on the ex-dividend date. The Fund intends to declare and pay dividends of net investment income and distributions of net realized capital and currency gains, if any, at least annually. Unless the shareholder elects otherwise, all dividends and distributions are reinvested in the same class of shares of the Fund, at NAV. Dividends and distributions to shareholders are determined in accordance with federal income tax regulations and may differ from GAAP.
| | | | |
| mainstayinvestments.com | | | 25 | |
Notes to Financial Statements (Unaudited) (continued)
(D) Security Transactions and Investment Income. The Fund records security transactions on the trade date. Realized gains and losses on security transactions are determined using the identified cost method. Dividend income is recognized on the ex-dividend date and interest income is accrued as earned using the effective interest rate method. Discounts and premiums on Short-Term Investments are accreted and amortized, respectively, on the straight-line method.
Investment income and realized and unrealized gains and losses on investments of the Fund are allocated to separate classes of shares pro rata based upon their relative net assets on the date the income is earned or realized and unrealized gains and losses are incurred.
(E) Expenses. Expenses of the Trust are allocated to the individual Funds in proportion to the net assets of the respective Funds when the expenses are incurred, except where direct allocations of expenses can be made. Expenses (other than transfer agent expenses and fees incurred under the shareholder services plans and the distribution plans further discussed in Note 3(B)) are allocated to separate classes of shares pro rata based upon their relative net assets on the date the expenses are incurred. The expenses borne by the Fund, including those of related parties to the Fund, are shown in the Statement of Operations.
(F) Use of Estimates. In preparing financial statements in conformity with GAAP, management makes estimates and assumptions that affect the reported amounts and disclosures in the financial statements. Actual results could differ from those estimates.
(G) Repurchase Agreements. The Fund may enter into repurchase agreements to earn income. The Fund may enter into repurchase agreements only with financial institutions that are deemed by the Manager or Subadvisor to be creditworthy, pursuant to guidelines established by the Fund’s Board. During the term of any repurchase agreement, the Manager or Subadvisor will continue to monitor the creditworthiness of the seller. Under the 1940 Act, repurchase agreements are considered to be collateralized loans by a Fund to the seller secured by the securities transferred to the Fund.
When the Fund invests in repurchase agreements, the Fund’s custodian takes possession of the collateral pledged for investments in the repurchase agreement. The underlying collateral is valued daily on a mark-to-market basis to determine that the value, including accrued interest, exceeds the repurchase price. In the event of the seller’s default on the obligation to repurchase, the Fund has the right to liquidate the collateral and apply the proceeds in satisfaction of the obligation. Under certain circumstances, such as in the event of default or bankruptcy by the counterparty to the agreement, realization and/or retention of the collateral may be subject to legal proceedings and possible realized loss to the Fund.
(H) Futures Contracts. A futures contract is an agreement to purchase or sell a specified quantity of an underlying instrument at a specified future date and price, or to make or receive a cash payment based on the value of a financial instrument (e.g., foreign currency, interest rate, security, or securities index). The Fund is subject to equity price risk in the normal course of investment in these transactions. During the period the futures contract is open, changes in the value of the contract are recognized as unrealized appreciation or depreciation by “marking-to-market” such contract on a daily basis to reflect the
market value of the contract at the end of each day’s trading. The Fund agrees to receive from or pay to the broker an amount of cash equal to the daily fluctuation in the value of the contract. Such receipts or payments are known as “variation margin.” When the futures contract is closed, the Fund records a realized gain or loss equal to the difference between the proceeds from (or cost of) the closing transaction and the Fund’s basis in the contract.
The use of futures contracts involves, to varying degrees, elements of market risk in excess of the amount recognized in the Statement of Assets and Liabilities. The contract or notional amounts and variation margin reflect the extent of the Fund’s involvement in open futures positions. Risks arise from the possible imperfect correlation in movements in the price of futures contracts, interest rates and the underlying hedged assets, and the possible inability of counterparties to meet the terms of their contracts. However, the Fund’s activities in futures contracts have minimal counterparty risk as they are conducted through regulated exchanges that guarantee the futures against default by the counterparty. In the event of a bankruptcy or insolvency of a futures commission merchant that holds margin on behalf of the Fund, the Fund may not be entitled to the return of all of the margin owed to the Fund, potentially resulting in a loss. The Fund invests in futures contracts to provide an efficient means of maintaining liquidity while being fully invested in the market. The Fund’s investment in futures contracts and other derivatives may increase the volatility of the Fund’s NAV and may result in a loss to the Fund.
(I) Rights and Warrants. Rights are certificates that permit the holder to purchase a certain number of shares, or a fractional share, of a new stock from the issuer at a specific price. Warrants are instruments that entitle the holder to buy an equity security at a specific price for a specific period of time. The Fund may enter into rights and warrants when securities are acquired through a corporate action. With respect to warrants in international markets, the securities may be purchased only when the underlying security cannot be purchased due to the many restrictions an industry and/or country might place on foreign investors. These investments can provide a greater potential for profit or loss than an equivalent investment in the underlying security. Prices of these investments do not necessarily move in tandem with the prices of the underlying securities.
There is risk involved in the purchase of rights and warrants in that these investments are speculative investments. The Fund could also lose the entire value of its investment in warrants, if such warrants are not exercised by the date of its expiration. The securities are sold as soon as the opportunity becomes available. The Fund is exposed to risk until each sale is completed. As of April 30, 2013, the Fund did not hold any rights or warrants.
(J) Foreign Currency Transactions. The books and records of the Fund are kept in U.S. dollars. Prices of securities denominated in foreign currency amounts are translated into U.S. dollars at the mean between the buying and selling rates last quoted by any major U.S. bank at the following dates:
(i) market value of investment securities, other assets and liabilities—at the valuation date, and
(ii) purchases and sales of investment securities, income and expenses—at the date of such transactions.
| | |
| 26 | | MainStay S&P 500 Index Fund |
The assets and liabilities that are denominated in foreign currency amounts are presented at the exchange rates and market values at the close of the period. The realized and unrealized changes in net assets arising from fluctuations in exchange rates and market prices of securities are not separately presented.
Net realized gain (loss) on foreign currency transactions represents net gains and losses on foreign currency forward contracts, net currency gains or losses realized as a result of differences between the amounts of securities sale proceeds or purchase cost, dividends, interest and withholding taxes as recorded on the Fund’s books, and the U.S. dollar equivalent amount actually received or paid. Net currency gains or losses from valuing such foreign currency denominated assets and liabilities, other than investments at valuation date exchange rates, are reflected in unrealized foreign exchange gains or losses.
(K) Securities Lending. In order to realize additional income, the Fund may engage in securities lending, subject to the limitations set forth in the 1940 Act and relevant guidance by the staff of the Securities and Exchange Commission. In the event the Fund does engage in securities lending, the Fund will lend through its custodian, State Street Bank and Trust Company (“State Street”). State Street will manage the Fund’s cash collateral in accordance with the lending agreement between the Fund and State Street, and indemnify the Fund’s portfolio against counterparty risk. The loans will be collateralized by cash or securities at least equal at all times to the market value of the securities loaned. Collateral will consist of U.S. Government securities, cash equivalents or irrevocable letters of credit. The Fund may bear the risk of delay in recovery of, or loss of rights in, the securities loaned should the borrower of the securities experience financial difficulty. The Fund may also record realized gain or loss on securities deemed sold due to a borrower’s inability to return securities on loan. The Fund will receive compensation for lending its securities in the form of fees or the retention of a portion of the interest on the investment of any cash received as collateral. The Fund also will continue to receive interest and dividends on the securities loaned and any gain or loss in the market price of the securities loaned that may occur during the term of the loan will be for the account of the Fund.
Although the Fund and New York Life Investments have temporarily suspended securities lending, the Fund and New York Life Investments reserve the right to reinstitute lending when deemed appropriate. The Fund did not have any portfolio securities on loan as of April 30, 2013.
(L) Indemnifications. Under the Trust’s organizational documents, its officers and trustees are indemnified against certain liabilities that may arise out of performance of their duties to the Trust. Additionally, in the normal course of business, the Fund enters into contracts with third-party service providers that contain a variety of representations and warranties and which may provide general indemnifications. The Fund’s maximum exposure under these arrangements is unknown, as this would involve future claims that may be made against the Fund that have not yet occurred. Based on experience, management is of the view that the risk of loss in connection with these potential indemnification obligations is remote. However, there can be no assurance that material liabilities related to such obligations will not arise in the future, which could adversely impact the Fund.
(M) Quantitative Disclosure of Derivative Holdings. The following tables show additional disclosures about the Fund’s derivative and hedging activities, including how such activities are accounted for and their effect on the Fund’s financial positions, performance and cash flows. These derivatives are not accounted for as hedging instruments.
Fair value of derivatives instruments as of April 30, 2013:
Asset Derivatives
| | | | | | | | | | |
| | | Statement of
Assets and
Liabilities
Location | | Equity
Contracts
Risk | | | Total | |
Futures Contracts | | Net Assets-Net unrealized appreciation (depreciation) on investments and futures contracts (a) | | $ | 2,174,600 | | | $ | 2,174,600 | |
| | | | | | |
Total Fair Value | | | | $ | 2,174,600 | | | $ | 2,174,600 | |
| | | | | | |
| (a) | Includes cumulative appreciation (depreciation) of futures contracts as reported in the Portfolio of Investments. Only current day’s variation margin is reported within the Statement of Assets and Liabilities. |
Realized Gain (Loss)
| | | | | | | | | | |
| | | Statement of
Operations
Location | | Equity
Contracts
Risk | | | Total | |
Futures Contracts | | Net realized gain (loss) on futures transactions | | $ | 3,851,975 | | | $ | 3,851,975 | |
| | | | | | |
Total Realized Gain (Loss) | | | | $ | 3,851,975 | | | $ | 3,851,975 | |
| | | | | | |
Change in Unrealized Appreciation (Depreciation)
| | | | | | | | | | |
| | | Statement of
Operations
Location | | Equity
Contracts
Risk | | | Total | |
Futures Contracts | | Net change in unrealized appreciation (depreciation) on futures contracts | | $ | 5,663,867 | | | $ | 5,663,867 | |
| | | | | | |
Total Change in Unrealized Appreciation (Depreciation) | | | | $ | 5,663,867 | | | $ | 5,663,867 | |
| | | | | | |
Number of Contracts, Notional Amounts or Shares/Units
| | | | | | | | |
| | | Equity
Contracts
Risk | | | Total | |
Futures Contracts Long (1) | | | 1,039 | | | | 1,039 | |
| | | | |
| (1) | Amount disclosed represents the weighted average held during the period ended April 30, 2013. |
| | | | |
| mainstayinvestments.com | | | 27 | |
Notes to Financial Statements (Unaudited) (continued)
Note 3–Fees and Related Party Transactions
(A) Manager and Subadvisor. New York Life Investments, a registered investment adviser and an indirect, wholly-owned subsidiary of New York Life Insurance Company (“New York Life”), serves as the Fund’s Manager, pursuant to an Amended and Restated Management Agreement (“Management Agreement”). The Manager provides offices, conducts clerical, recordkeeping and bookkeeping services, and keeps most of the financial and accounting records required to be maintained by the Fund. Except for the portion of salaries and expenses that are the responsibility of the Fund, the Manager pays the salaries and expenses of all personnel affiliated with the Fund and certain operational expenses of the Fund. The Fund reimburses New York Life Investments in an amount equal to a portion of the salary of the Chief Compliance Officer (“CCO”) of the Fund. Cornerstone Capital Management Holdings LLC (“Cornerstone Holdings” or “Subadvisor”), a registered investment adviser and an indirect, wholly-owned subsidiary of New York Life, serves as Subadvisor to the Fund and is responsible for the day-to-day portfolio management of the Fund. Pursuant to the terms of an Amended and Restated Subadvisory Agreement (“Subadvisory Agreement”) between New York Life Investments and Cornerstone Capital Holdings, New York Life Investments pays for the services of the Subadvisor. Effective January 25, 2013, Madison Square Investors LLC changed its name to Cornerstone Capital Management Holdings LLC.
The Fund pays the Manager a monthly fee for services performed and facilities furnished at an annual rate of the Fund’s average daily net assets as follows: 0.25% up to $1 billion; 0.225% from $1 billion to $2 billion; 0.215% from $2 billion to $3 billion; and 0.20% in excess of $3 billion. The effective management fee rate (exclusive of any applicable waivers/reimbursements) was 0.24% for the six-month period ended April 30, 2013.
New York Life Investments has contractually agreed to waive fees and/or reimburse expenses so that Total Annual Fund Operating Expenses for Class A shares do not exceed 0.60% of its average daily net assets. New York Life Investments will apply an equivalent waiver or reimbursement, in an equal number of basis points, to the other share classes. This agreement will remain in effect until February 28, 2014, and shall renew automatically for one-year terms unless New York Life Investments provides written notice of termination prior to the start of the next term or upon approval of the Board. Total Annual Fund Operating Expenses excludes taxes, interest, litigation, extraordinary expenses, brokerage and other transaction expenses relating to the purchase or sale of portfolio investments, and acquired (underlying) fund fees and expenses.
Additionally, New York Life Investments has agreed to voluntarily waive fees and/or reimburse expenses so that Total Annual Fund Operating Expenses of Investor Class shares do not exceed 0.70% of its average daily net assets. This voluntary waiver and/or reimbursement may be discontinued at any time.
For the six-month period ended April 30, 2013, New York Life Investments earned fees from the Fund in the amount of $1,994,644 and waived its fees and/or reimbursed expenses in the amount of $646,206.
State Street, 1 Lincoln Street, Boston, Massachusetts 02111, provides sub-administration and sub-accounting services to the Fund pursuant to
an agreement with New York Life Investments. These services include calculating the daily NAVs of the Fund, maintaining the general ledger and sub-ledger accounts for the calculation of the Fund’s respective NAVs, and assisting New York Life Investments in conducting various aspects of the Fund’s administrative operations. For providing these services to the Fund, State Street is compensated by New York Life Investments.
(B) Distribution and Service Fees. The Trust, on behalf of the Fund, has entered into a distribution agreement with NYLIFE Distributors LLC (the ‘‘Distributor’’), an indirect, wholly-owned subsidiary of New York Life. The Fund has adopted distribution plans (the ‘‘Plans’’) in accordance with the provisions of Rule 12b-1 under the 1940 Act.
Pursuant to the Investor Class and Class A Plans, the Distributor receives a monthly distribution fee from the Investor Class and Class A shares at an annual rate of 0.25% of the average daily net assets of the Investor Class and Class A shares for distribution and/or service activities as designated by the Distributor. Class I shares are not subject to a distribution and/or service fee.
The Plans provide that the distribution and service fees are payable to the Distributor regardless of the amounts actually expended by the Distributor for distribution of the Fund’s shares and service activities.
(C) Sales Charges. The Fund was advised by the Distributor that the amount of sales charges retained on sales of Investor Class and Class A shares were $4,295 and $5,862, respectively, for the six-month period ended April 30, 2013. The Fund was also advised that the Distributor retained CDSCs on redemptions of Class A shares of $175 for the six-month period ended April 30, 2013.
(D) Transfer, Dividend Disbursing and Shareholder Servicing Agent. NYLIM Service Company LLC, an affiliate of New York Life Investments, is the Fund’s transfer, dividend disbursing and shareholder servicing agent pursuant to an agreement between NYLIM Service Company LLC and the Trust. NYLIM Service Company LLC has entered into an agreement with Boston Financial Data Services, Inc. (“BFDS”) pursuant to which BFDS performs certain transfer agent services on behalf of NYLIM Service Company LLC. Transfer agent expenses incurred by the Fund for the six-month period ended April 30, 2013, were as follows:
| | | | |
Investor Class | | $ | 36,982 | |
Class A | | | 336,862 | |
Class I | | | 970,988 | |
(E) Small Account Fee. Shareholders with small accounts adversely impact the cost of providing transfer agency services. In an effort to reduce total transfer agency expenses, the Fund has implemented a small account fee on certain types of accounts. Certain shareholders with an account balance of less than $1,000 are charged an annual per account fee of $20 (assessed semi-annually), the proceeds from which offset transfer agent fees as reflected in the Statement of Operations.
| | |
| 28 | | MainStay S&P 500 Index Fund |
(F) Capital. As of April 30, 2013, New York Life and its affiliates beneficially held shares of the Fund with the following values and percentages of net assets as follows:
| | | | | | | | |
Class I | | $ | 159,483,204 | | | | 12.8 | % |
Note 4–Federal Income Tax
Under the Regulated Investment Company Modernization Act of 2010, the Fund is permitted to carry forward capital losses incurred in taxable years beginning after December 22, 2010, for an unlimited period. However, any losses incurred during those future years will be required to be utilized prior to the losses incurred in pre-enactment tax years. As a result of this ordering rule, pre-enactment capital loss carryforwards may be more likely to expire unused. Additionally, post-enactment capital losses that are carried forward will retain their character as either short-term or long-term capital losses rather than being considered all short-term as under previous law.
As of October 31, 2012, for federal income tax purposes, capital loss carryforwards of $109,977,905 were available as shown in the table below, to the extent provided by the regulations to offset future realized gains of the Fund through the years indicated. To the extent that these capital loss carryforwards are used to offset future capital gains, it is probable that the capital gains so offset will not be distributed to shareholders. No capital gain distributions shall be made until any capital loss carryforwards have been fully utilized or expired.
| | | | | | | | |
Capital Loss Available Through | | Short-Term
Capital Loss Amounts (000’s) | | | Long-Term
Capital Loss Amounts (000’s) | |
| 2014 | | $ | 47,614 | | | $ | — | |
| 2016 | | | 39,050 | | | | — | |
| 2018 | | | 21,698 | | | | — | |
| 2019 | | | 1,616 | | | | — | |
| Total | | $ | 109,978 | | | $ | — | |
The tax character of distributions paid during the year ended October 31, 2012, shown in the Statements of Changes in Net Assets was as follows:
| | | | |
| | | 2012 | |
Distributions paid from: | | | | |
Ordinary Income | | $ | 21,879,044 | |
Note 5–Custodian
State Street is the custodian of the cash and the securities of the Fund. Custodial fees are charged to the Fund based on the market value of securities in the Fund and the number of certain cash transactions incurred by the Fund.
Note 6–Line of Credit
The Fund and certain affiliated funds maintain a line of credit with a syndicate of banks in order to secure a source of funds for temporary purposes to meet unanticipated or excessive redemption requests.
Effective August 29, 2012, under a second amended and restated credit agreement (the “Credit Agreement”), the aggregate commitment amount is $200,000,000 with an optional maximum amount of $250,000,000. The commitment fee is an annual rate of 0.08% of the average commitment amount payable quarterly, regardless of usage, to Bank of New York Mellon, which serves as the agent to the syndicate. The commitment fee is allocated among the Fund and certain affiliated funds based upon net assets and other factors. Interest on any revolving credit loan is charged based upon the Federal Funds Advances rate or the one month London InterBank Offered Rate, whichever is higher. The Credit Agreement expires on August 28, 2013, although the Fund, certain affiliated funds and the syndicate of banks may renew the Credit Agreement for an additional year on the same or different terms. There were no borrowings made or outstanding with respect to the Fund on the Credit Agreement during the six-month period ended April 30, 2013.
Note 7–Purchases and Sales of Securities (in 000’s)
During the six-month period ended April 30, 2013, purchases and sales of securities, other than short-term securities, were $20,031 and $76,909, respectively.
Note 8–Capital Share Transactions
| | | | | | | | |
Investor Class | | Shares | | | Amount | |
Six-month period ended April 30, 2013: | | | | | | | | |
Shares sold | | | 75,367 | | | $ | 2,589,772 | |
Shares issued to shareholders in reinvestment of dividends | | | 9,510 | | | | 311,163 | |
Shares redeemed | | | (49,500 | ) | | | (1,689,588 | ) |
| | | | |
Net increase (decrease) in shares outstanding before conversion | | | 35,377 | | | | 1,211,347 | |
Shares converted into Investor Class (See Note 1) | | | 5,184 | | | | 186,532 | |
Shares converted from Investor Class (See Note 1) | | | (15,704 | ) | | | (555,078 | ) |
| | | | |
Net increase (decrease) | | | 24,857 | | | $ | 842,801 | |
| | | | |
Year ended October 31, 2012: | | | | | | | | |
Shares sold | | | 107,916 | | | $ | 3,364,665 | |
Shares issued to shareholders in reinvestment of dividends | | | 9,498 | | | | 273,921 | |
Shares redeemed | | | (120,018 | ) | | | (3,745,076 | ) |
| �� | | | |
Net increase (decrease) in shares outstanding before conversion | | | (2,604 | ) | | | (106,490 | ) |
Shares converted into Investor Class (See Note 1) | | | 4,057 | | | | 134,215 | |
Shares converted from Investor Class (See Note 1) | | | (40,040 | ) | | | (1,260,732 | ) |
| | | | |
Net increase (decrease) | | | (38,587 | ) | | $ | (1,233,007 | ) |
| | | | |
| | | | |
| mainstayinvestments.com | | | 29 | |
Notes to Financial Statements (Unaudited) (continued)
| | | | | | | | |
Class A | | Shares | | | Amount | |
Six-month period ended April 30, 2013: | | | | | | | | |
Shares sold | | | 957,682 | | | $ | 32,873,952 | |
Shares issued to shareholders in reinvestment of dividends | | | 181,761 | | | | 5,945,387 | |
Shares redeemed | | | (1,286,571 | ) | | | (44,065,841 | ) |
| | | | |
Net increase (decrease) in shares outstanding before conversion | | | (147,128 | ) | | | (5,246,502 | ) |
Shares converted into Class A (See Note 1) | | | 15,705 | | | | 555,078 | |
Shares converted from Class A (See Note 1) | | | (5,184 | ) | | | (186,532 | ) |
| | | | |
Net increase (decrease) | | | (136,607 | ) | | $ | (4,877,956 | ) |
| | | | |
Year ended October 31, 2012: | | | | | | | | |
Shares sold | | | 1,351,106 | | | $ | 41,870,871 | |
Shares issued in connection with the acquisition of MainStay Equity Index Fund (See Note 10) | | | 6,311,135 | | | | 191,583,350 | |
Shares issued to shareholders in reinvestment of dividends | | | 96,298 | | | | 2,776,272 | |
Shares redeemed | | | (2,051,992 | ) | | | (64,006,572 | ) |
| | | | |
Net increase (decrease) in shares outstanding before conversion | | | 5,706,547 | | | | 172,223,921 | |
Shares converted into Class A (See Note 1) | | | 40,047 | | | | 1,260,732 | |
Shares converted from Class A (See Note 1) | | | (4,057 | ) | | | (134,215 | ) |
| | | | |
Net increase (decrease) | | | 5,742,537 | | | $ | 173,350,438 | |
| | | | |
| | |
| | | | | | | | |
Class I | | Shares | | | Amount | |
Six-month period ended April 30, 2013: | | | | | | | | |
Shares sold | | | 4,039,639 | | | $ | 137,382,229 | |
Shares issued to shareholders in reinvestment of dividends | | | 641,957 | | | | 21,165,307 | |
Shares redeemed | | | (7,508,871 | ) | | | (258,137,015 | ) |
| | | | |
Net increase (decrease) | | | (2,827,275 | ) | | $ | (99,589,479 | ) |
| | | | |
Year ended October 31, 2012: | | | | | | | | |
Shares sold | | | 12,438,549 | | | $ | 389,736,440 | |
Shares issued to shareholders in reinvestment of dividends | | | 645,971 | | | | 18,765,466 | |
Shares redeemed | | | (14,474,314 | ) | | | (455,823,259 | ) |
| | | | |
Net increase (decrease) | | | (1,389,794 | ) | | $ | (47,321,353 | ) |
| | | | |
Note 9–Litigation
The Fund has been named as a defendant and a putative member of the proposed defendant group of shareholders in the case now entitled Kirschner v. FitzSimons, et al. (In re Tribune Company), No. 12-2652 (S.D.N.Y.) (the “FitzSimons action”) as a result of its ownership of shares in the Tribune Company (“Tribune”) in 2007 when Tribune effected a leveraged buyout transaction (“LBO”) by which Tribune converted to a privately-held company. In its complaint, which was served on the Fund in October 2012, the plaintiff asserts claims against certain insiders, shareholders, professional advisers, and others involved in the LBO. Separately, the complaint also seeks to recover proceeds received by shareholders through the LBO from a putative defendant class comprised of former Tribune shareholders other than the insiders, major shareholders and certain other defendants. The sole claim and cause of action brought against the Fund either as a named defendant or as a member of the putative defendant class is for fraudulent conveyance pursuant to United States Bankruptcy Code Section 548(a)(1)(A).
In June 2011, certain Tribune creditors filed numerous additional actions asserting state law constructive fraudulent conveyance claims (the “SLCFC actions”) against specifically-named former Tribune shareholders and, in some cases, putative defendant classes comprised of former Tribune shareholders. One of the SLCFC actions, entitled Deutsche Bank Trust Co. Americas v. Blackrock Institutional Trust Co., No. 11-9319 (S.D.N.Y.) (the “Deutsche Bank action”), named the Fund as a defendant.
The FitzSimons and Deutsche Bank actions have been consolidated with the majority of the other Tribune LBO-related lawsuits in a multidistrict litigation proceeding entitled In re Tribune Co. Fraudulent Conveyance Litig., No. 11-md-2296 (S.D.N.Y.) (the “MDL Proceeding”). On November 6, 2012, the defendants moved to dismiss the SLCFC actions, including the Deutsche Bank action. Oral arguments on this motion were held on May 23, 2013. The Court has not yet issued a decision on the motion.
On May 17, 2013, the plaintiff in the FitzSimons action requested leave of the Court to file a Fifth Amended Complaint. The Court has not yet ruled on this matter.
These lawsuits do not allege any misconduct on the part of the Fund. The value of the proceeds received by the Fund in connection with the LBO and the Fund’s cost basis in shares of Tribune was as follows:
| | | | | | | | |
Fund | | Proceeds | | | Cost
Basis | |
MainStay S&P 500 Index Fund* | | $ | 1,025,100 | | | $ | 907,116 | |
| * | Inclusive of payments received into MainStay Equity Index Fund prior to the acquisition. (See Note 10) |
At this stage of the proceedings management is not able to assess with any reasonable certainty the probable outcome of the pending litigation or the effect, if any, on the Fund’s NAVs.
Note 10–Fund Acquisitions
At a meeting held on December 14, 2011, the Board of Trustees approved a plan of reorganization whereby the Fund would acquire the assets, including the investments, and assume the liabilities on MainStay Equity Index Fund, a series of MainStay Funds. Shareholders of MainStay Equity Index Fund approved this reorganization on May 12, 2012, which was then completed on May 25, 2012. The aggregate net assets of the Fund immediately before the acquisition were $1,432,012,589 and the combined net assets after the acquisition were $1,623,595,939.
The acquisition was accomplished by a tax-free exchange of the following:
| | | | | | | | |
| | | Shares | | | Value | |
MainStay Equity Index Fund | | | 3,967,860 | | | | 191,583,350 | |
In exchange for the MainStay Equity Index Fund shares and net assets, the Fund issued 6,311,135 Class A shares.
| | |
| 30 | | MainStay S&P 500 Index Fund |
MainStay Equity Index Fund’s net assets after adjustments for any permanent book-to-tax differences at the acquisition date were as follows, which include the following amounts of capital stock, unrealized appreciation (depreciation), accumulated net realized gain (loss) and undistributed net investment income:
| | | | | | | | | | | | | | | | | | | | |
| | | Total Net Assets | | | Capital Stock | | | Unrealized
Appreciation
(Depreciation) | | | Accumulated
Net Realized
Gain (Loss) | | | Undistributed
Net Investment
Income | |
MainStay Equity Index Fund | | $ | 191,583,350 | | | $ | 101,293,453 | | | $ | 94,828,154 | | | $ | (4,615,069 | ) | | $ | 76,812 | |
Assuming the acquisition of MainStay Equity Index had been completed on November 1, 2011, the beginning of the annual reporting period of the Fund, the Fund’s pro forma results of operations for the period ended October 31, 2012, are as follows:
| | | | |
Net investment income (loss) | | $ | 27,882,293 | |
Net gain on investments | | $ | 193,816,793 | |
Net increase in net assets resulting from operations | | $ | 221,699,086 | |
Because the combined investment portfolios have been managed as a single integrated portfolio since the acquisition was completed, it is not practicable to separate the amounts of revenue and earnings of the MainStay Equity Index Fund that have been included in the Fund’s Statement of Operations since May 25, 2012.
For financial reporting purposes, assets received and shares issued by the Fund were recorded at fair value; however, the cost basis of the
investments received from MainStay Equity Index fund was carried forward to align ongoing reporting of the Fund’s realized and unrealized gains and losses with amounts distributable to shareholders for tax purposes.
Note 11–Subsequent Events
In connection with the preparation of the financial statements of the Fund as of and for the six-month period ended April 30, 2013, events and transactions subsequent to April 30, 2013, through the date the financial statements were issued have been evaluated by the Fund’s management for possible adjustment and/or disclosure. No subsequent events requiring financial statement adjustment or disclosure have been identified.
| | | | |
| mainstayinvestments.com | | | 31 | |
Board Consideration and Approval of Management Agreement and
Subadvisory Agreement (Unaudited)
Section 15(c) of the Investment Company Act of 1940, as amended (the “1940 Act”) requires that each mutual fund’s board of trustees, including a majority of the independent trustees, annually review and approve the fund’s investment advisory agreements. At its December 10-12, 2012 meeting, the Board of Trustees of the MainStay Group of Funds (“Board”) unanimously approved the Management Agreement with respect to the MainStay S&P 500 Index Fund (“Fund”) and New York Life Investment Management LLC (“New York Life Investments”), and the Subadvisory Agreement between New York Life Investments and Madison Square Investors LLC, which subsequently changed its name to Cornerstone Capital Management Holdings LLC (“Cornerstone Holdings”), with respect to the Fund.
In reaching its decision to approve the Agreements, the Board considered information furnished by New York Life Investments and Cornerstone Holdings in connection with a contract review process that took place at various meetings of the Board and its Contracts Committee between September 2012 and December 2012, as well as other relevant information furnished to the Board throughout the year by New York Life Investments and Cornerstone Holdings. Information requested by and furnished to the Board in connection with the contract review process included, among other items, reports on the Fund prepared by Strategic Insight Mutual Fund Research and Consulting, LLC (“Strategic Insight”), an independent third-party service provider engaged by the Board to report objectively on the Fund’s investment performance, management and subadvisory fees and ordinary operating expenses. The Board also considered information provided by New York Life Investments and Cornerstone Holdings on the fees charged to other investment advisory clients (including institutional separate accounts) that follow investment strategies similar to the Fund, and the rationale for any differences in the Fund’s management and subadvisory fees and the fees charged to those other investment advisory clients. In addition, the Board requested and received information on the profitability of the Fund to New York Life Investments and its affiliates, including Cornerstone Holdings as subadvisor to the Fund, and responses from New York Life Investments and Cornerstone Holdings to a series of questions encompassing a variety of topics prepared on behalf of the Board by independent legal counsel to the Board and its independent trustees (the “Independent Trustees”). Information provided to the Board at its meetings throughout the year included, among other items, detailed investment performance reports on the Fund prepared by the Investment Consulting Group at New York Life Investments. The structure and format for this regular reporting was developed in consultation with the Board. The Board also received from New York Life Investments throughout the year, among other items, periodic reports on legal and compliance matters, portfolio turnover, and sales and marketing activity.
In determining to approve the Agreements, the members of the Board reviewed and evaluated all of the information and factors they believed to be relevant and appropriate in light of legal advice furnished to them by independent legal counsel and through the exercise of their own business judgment. The broad factors considered by the Board are discussed in greater detail below, and included, among other items: (i) the nature, scope and quality of the services provided to the Fund by New York Life Investments and Cornerstone Holdings; (ii) the investment performance of the Fund, New York Life Investments and Cornerstone Holdings; (iii) the costs of the services provided, and profits realized, by
New York Life Investments and Cornerstone Holdings from their relationship with the Fund; (iv) the extent to which economies of scale may be realized as the Fund grows, and the extent to which economies of scale may benefit Fund investors; and (v) the reasonableness of the Fund’s management and subadvisory fees and overall total ordinary operating expenses, particularly as compared to similar funds and accounts managed by New York Life Investments and Cornerstone Holdings and third-party “peer funds” identified by Strategic Insight.
While individual members of the Board may have weighed certain factors differently, the Board’s decision to approve the Agreements was based on a consideration of all the information provided to the Board, including information provided to the Board throughout the year and specifically in connection with the contract review process. The Board’s conclusions with respect to the Agreements also were based, in part, on the Board’s consideration of the Agreements in prior years. In addition to considering the above-referenced factors, the Board observed that in the marketplace there are a range of investment options available to shareholders of the Fund, and that the Fund’s shareholders, having had the opportunity to consider other investment options, have chosen to invest in the Fund. A more detailed discussion of the factors that figured prominently in the Board’s decisions to approve the Agreements is provided below.
Nature, Scope and Quality of Services to Be Provided by New York Life Investments and Cornerstone Holdings
The Board examined the nature, scope and quality of the services that New York Life Investments provides to the Fund. The Board evaluated New York Life Investments’ experience in serving as manager of the Fund, noting that New York Life Investments manages other mutual funds, serves a variety of other investment advisory clients, including other pooled investment vehicles, and has experience with overseeing mutual fund service providers, including subadvisors. The Board considered the experience of senior personnel at New York Life Investments providing management and administrative services to the Fund, as well as New York Life Investments’ reputation and financial condition. The Board also considered the full range of non-advisory services that New York Life Investments supplies to the Fund under the terms of the Management Agreement, including: (i) fund accounting services provided by New York Life Investments’ Fund Accounting and Administration Group; (ii) investment oversight and analytical services provided by New York Life Investments’ Investment Consulting Group; (iii) compliance services provided by New York Life Investments’ compliance department, including oversight and implementation of the Fund’s compliance program; and (iv) legal services provided by New York Life Investments’ Office of the General Counsel. Additional information about the non-advisory services provided by New York Life Investments is set forth in the Fund’s Management Agreement. The Board also considered New York Life Investments’ willingness to invest in personnel that benefit the Fund, and noted that New York Life Investments is responsible for compensating the Fund’s officers. The Board also considered benefits to shareholders of being part of the MainStay Group of Funds, including the privilege of exchanging investments between the same class of shares without the imposition of a sales charge, as described more fully in the Fund’s prospectus.
| | |
| 32 | | MainStay S&P 500 Index Fund |
The Board also examined the nature, scope and quality of the advisory services that Cornerstone Holdings provides to the Fund. The Board evaluated Cornerstone Holdings’ experience in serving as subadvisor to the Fund and managing other portfolios. It examined Cornerstone Holdings’ track record and experience in providing investment advisory services, the experience of investment advisory, senior management and administrative personnel at Cornerstone Holdings, and Cornerstone Holdings’ overall legal and compliance environment. The Board also reviewed Cornerstone Holdings’ willingness to invest in personnel that benefit the Fund. In this regard, the Board considered the experience of the Fund’s portfolio managers, the number of accounts managed by the portfolio managers and the method for compensating portfolio managers.
Based on these considerations, the Board concluded, within the context of its overall determinations regarding the Agreements, that the Fund should continue to benefit from the nature, scope and quality of these services as a result of New York Life Investments’ and Cornerstone Holdings’ experience, personnel, operations and resources.
Investment Performance
In evaluating the Fund’s investment performance, the Board considered investment performance results in light of the Fund’s investment objective, strategies and risks, as disclosed in the Fund’s prospectus. The Board particularly considered detailed investment reports on the Fund’s performance provided to the Board throughout the year by the Investment Consulting Group of New York Life Investments. These reports include, among other items, information on the Fund’s gross and net returns, the Fund’s investment performance relative to relevant investment categories and Fund benchmarks, the Fund’s risk-adjusted investment performance, and the Fund’s investment performance as compared to similar competitor funds, as appropriate. The Board also considered information provided by Strategic Insight showing the investment performance of the Fund as compared to peer funds.
In considering the Fund’s investment performance, the Board focused principally on the Fund’s long-term performance track record. The Board also gave weight to its ongoing discussions with senior management at New York Life Investments concerning the Fund’s investment performance, as well as discussions between the Fund’s portfolio managers and the Board that occur typically on an annual basis. In addition, the Board considered any specific actions that New York Life Investments or Cornerstone Holdings had taken, or had agreed with the Board to take, to enhance Fund investment performance, and the results of those actions.
Based on these considerations, the Board concluded, within the context of its overall determinations regarding the Agreements, that the long-term investment performance of the Fund, along with ongoing efforts by New York Life Investments and Cornerstone Holdings to enhance investment returns, supported a determination to approve the Agreements. The Fund discloses more information about investment performance in the Portfolio Management Discussion and Analysis, Investment and Performance Comparison and Financial Highlights sections of this Semiannual Report and in the Fund’s prospectus.
Costs of the Services Provided, and Profits Realized, by New York Life Investments and Cornerstone Holdings
The Board considered the costs of the services provided by New York Life Investments and Cornerstone Holdings under the Agreements, and the profits realized by New York Life Investments and its affiliates, including Cornerstone Holdings, due to their relationships with the Fund. Because Cornerstone Holdings is an affiliate of New York Life Investments whose subadvisory fees are paid directly by New York Life Investments, the Board considered cost and profitability information for New York Life Investments and Cornerstone Holdings in the aggregate.
In evaluating the costs and profits of New York Life Investments and its affiliates, including Cornerstone Holdings, the Board considered, among other factors, each party’s investments in personnel, systems, equipment and other resources necessary to manage the Fund, and that New York Life Investments is responsible for paying the subadvisory fees for the Fund. The Board acknowledged that New York Life Investments and Cornerstone Holdings must be in a position to pay and retain experienced professional personnel to provide services to the Fund, and that the ability to maintain a strong financial position is important in order for New York Life Investments and Cornerstone Holdings to continue to provide high-quality services to the Fund. The Board also noted that the Fund benefits from the allocation of certain fixed costs across the MainStay Group of Funds.
In addition, the Board noted the difficulty in obtaining reliable comparative data about mutual fund managers’ profitability, since such information generally is not publicly available and may be impacted by numerous factors, including the structure of a fund manager’s organization, the types of funds it manages, the methodology used to allocate certain fixed costs to specific funds, and the manager’s capital structure and costs of capital. While recognizing the difficulty in evaluating a manager’s profitability with respect to the Fund, and noting that other profitability methodologies may also be reasonable, the Board concluded that the profitability methodology presented by New York Life Investments to the Board, which was developed by New York Life Investments in consultation with an independent consultant, was reasonable in all material respects.
In considering the costs and profitability of the Fund, the Board also considered certain fall-out benefits that may be realized by New York Life Investments and its affiliates due to their relationships with the Fund. The Board recognized, for example, the benefits to Cornerstone Holdings from legally permitted “soft-dollar” arrangements by which brokers provide research and other services to Cornerstone Holdings in exchange for commissions paid by the Fund with respect to trades on the Fund’s portfolio securities.
The Board further considered that, in addition to fees earned by New York Life Investments for managing the Fund, New York Life Investments’ affiliates also earn revenues from serving the Fund in various other capacities, including as the Fund’s transfer agent and distributor. The Board observed that information about these other revenues, and their impact on the profitability of the Fund to New York Life Investments and its affiliates, was furnished to the Board as part of the 15(c) process. The Board noted that, although it assessed the overall profitability of the Fund to New York Life Investments and its affiliates as part of the contract review process, when considering the reasonableness of the
| | | | |
| mainstayinvestments.com | | | 33 | |
Board Consideration and Approval of Management Agreement and
Subadvisory Agreement (Unaudited) (continued)
fees to be paid to New York Life Investments and its affiliates under the Agreements, the Board considered the profitability of New York Life Investments’ relationship with the Fund on a pre-tax basis, and without regard to distribution expenses.
After evaluating the information presented to the Board, the Board concluded, within the context of its overall determinations regarding the Agreements, that any profits realized by New York Life Investments and its affiliates, including Cornerstone Holdings, due to their relationships with the Fund supported the Board’s decision to approve the Agreements.
Extent to Which Economies of Scale May Be Realized as the Fund Grows
The Board also considered whether the Fund’s expense structure permitted economies of scale to be shared with Fund investors. The Board reviewed information from New York Life Investments showing how the Fund’s management fee schedule compared to fee schedules of other funds and accounts managed by New York Life Investments. The Board also reviewed information from Strategic Insight showing how the Fund’s management fee schedule hypothetically would compare with fees paid for similar services by peer funds at varying asset levels. While recognizing the difficulty of determining economies of scale with precision, the Board acknowledged that economies of scale may be shared with the Fund in a number of ways, including, for example, through the imposition of management fee breakpoints and by initially setting relatively lower management fees.
Based on this information, the Board concluded, within the context of its overall determinations regarding the Agreements, that the Fund’s expense structure appropriately reflects economies of scale for the benefit of Fund investors. The Board noted, however, that it would continue to evaluate the reasonableness of the Fund’s expense structure as the Fund grows over time.
Management and Subadvisory Fees and Total Ordinary Operating Expenses
The Board evaluated the reasonableness of the fees to be paid under the Agreements and the Fund’s expected total ordinary operating expenses. The Board primarily considered the reasonableness of the management fee paid by the Fund to New York Life Investments, since the fees paid to Cornerstone Holdings are paid by New York Life Investments, not the Fund.
In assessing the reasonableness of the Fund’s fees and expenses, the Board primarily considered comparative data provided by Strategic Insight on the fees and expenses charged by similar mutual funds managed by other investment advisers. In addition, the Board considered information provided by New York Life Investments and Cornerstone Holdings on fees charged to other investment advisory clients, including institutional separate accounts and other funds with similar investment objectives as the Fund. The Board particularly considered differences in the contractual management fee schedules of the retail MainStay Funds and similarly-managed MainStay VP Portfolios, taking into account New York Life Investments’ rationale for any differences in fee schedules. The Board also took into account explanations provided by New York Life Investments about the different scope of services
provided to mutual funds as compared with other investment advisory clients. Additionally, the Board considered the impact of any expense limitation arrangements on the Fund’s net management fee and expenses.
The Board noted that, outside of the Fund’s management fee and the fees charged under a share class’s Rule 12b-1 and/or shareholder services plans, a share class’s most significant “other expenses” are transfer agent fees. Transfer agent fees are charged to the Fund based on the number of shareholder accounts (a “per-account” fee) as compared with certain other fees (e.g., management fees), which are charged based on the Fund’s average net assets. The Board took into account information from New York Life Investments showing that the Fund’s transfer agent fee schedule is reasonable, including industry data showing that the per-account fees that NYLIM Service Company LLC, the Fund’s transfer agent, charges the Fund are within the range of per-account fees charged by transfer agents to other mutual funds. In addition, the Board considered NYLIM Service Company LLC’s profitability in connection with the transfer agent services it provides to the Fund.
The Board acknowledged that, because the Fund’s transfer agent fees are billed on a per-account basis, the impact of transfer agent fees on a share class’s expense ratio may be more significant in cases where the share class has a high number of accounts with limited assets (i.e., small accounts). The Board observed that transfer agent fees are a significant portion of total expenses of many Funds in the MainStay Group of Funds. The impact of transfer agent fees on the expense ratios of these MainStay Funds tend to be greater than for other open-end retail funds, because the MainStay Group of Funds generally has a significant number of small accounts relative to competitor funds. The Board acknowledged the role that the MainStay Group of Funds historically has played in serving the investment needs of New York Life Insurance Company (“New York Life”) policyholders, who often maintain smaller account balances than other fund investors. The Board discussed measures that it and New York Life Investments have taken in recent years to mitigate the effect of small accounts on the expense ratios of Fund share classes, including: (i) encouraging New York Life agents to consolidate multiple small accounts held by the same investor into one MainStay Asset Allocation Fund account; (ii) increasing investment minimums from $500 to $1,000 in 2003; (iii) introducing Investor Class shares for certain MainStay Funds in early 2008 to consolidate smaller account investors; (iv) closing small accounts with balances below $250 in Investor Class shares or $750 in all other classes of shares; (v) no longer allowing an exception with no minimum investment amount with respect to AutoInvest accounts with subsequent monthly purchases of $100; (vi) since 2007, charging an annual $20.00 small account fee on certain accounts with balances below $1,000; and (vii) modifying the approach for billing transfer agent expenses to reduce the degree of subsidization by large accounts of smaller accounts. In addition, the Board acknowledged New York Life Investments’ efforts to encourage intermediaries to consolidate small accounts in multiple Funds held by the same investor into a single Asset Allocation Fund account, if appropriate under the circumstances, in an effort to mitigate the effect of small accounts on the Funds in the MainStay Group of Funds.
| | |
| 34 | | MainStay S&P 500 Index Fund |
After considering all of the factors outlined above, the Board concluded that the Fund’s management and subadvisory fees and total ordinary operating expenses were within a range that is competitive and, within the context of the Board’s overall conclusions regarding the Agreements, support a conclusion that these fees and expenses are reasonable.
Conclusion
On the basis of the information provided to it and its evaluation thereof, the Board, including the Independent Trustees, unanimously voted to approve the Agreements.
| | | | |
| mainstayinvestments.com | | | 35 | |
Proxy Voting Policies and Procedures and Proxy Voting Record
A description of the policies and procedures that New York Life Investments uses to vote proxies related to the Fund’s securities is available without charge, upon request, (i) by visiting the Fund’s website at mainstayinvestments.com; or (ii) on the Securities and Exchange Commission’s (“SEC”) website at www.sec.gov.
The Fund is required to file with the SEC its proxy voting record for the 12-month period ending June 30 on Form N-PX. The Fund’s most recent Form N-PX is available free of charge upon request (i) by calling 800-MAINSTAY (624-6782); (ii) by visiting the Fund’s website at mainstayinvestments.com; or (iii) on the SEC’s website at www.sec.gov.
Shareholder Reports and Quarterly Portfolio Disclosure
The Fund is required to file its complete schedule of portfolio holdings with the SEC for its first and third fiscal quarters on Form N-Q. The Fund’s Form N-Q is available without charge on the SEC’s website at www.sec.gov or by calling MainStay Investments at 800-MAINSTAY (624-6782). You also can obtain and review copies of Form N-Q by visiting the SEC’s Public Reference Room in Washington, DC (information on the operation of the Public Reference Room may be obtained by calling 1-800-SEC-0330).
| | |
| 36 | | MainStay S&P 500 Index Fund |
This page intentionally left blank
This page intentionally left blank
MainStay Funds
MainStay offers a wide range of Funds for virtually any investment need. The full array of MainStay open-end offerings is listed here, with information about the manager, subadvisors, legal counsel and independent registered public accounting firms.
Equity
U.S. Equity Funds
MainStay Common Stock Fund
MainStay Cornerstone Growth Fund
MainStay Epoch U.S. All Cap Fund
MainStay Epoch U.S. Equity Yield Fund
MainStay ICAP Equity Fund
MainStay ICAP Select Equity Fund
MainStay Large Cap Growth Fund1
MainStay MAP Fund
MainStay S&P 500 Index Fund
MainStay U.S. Equity Opportunities Fund
MainStay U.S. Small Cap Fund
International/Global Equity Funds
MainStay Epoch Global Choice Fund
MainStay Epoch Global Equity Yield Fund
MainStay Epoch International Small Cap Fund
MainStay ICAP Global Fund
MainStay ICAP International Fund
MainStay International Equity Fund
MainStay International Opportunities Fund
Income
Taxable Bond Funds
MainStay Floating Rate Fund
MainStay Global High Income Fund
MainStay Government Fund
MainStay High Yield Corporate Bond Fund
MainStay High Yield Opportunities Fund
MainStay Indexed Bond Fund
MainStay Intermediate Term Bond Fund
MainStay Short Duration High Yield Fund
MainStay Short Term Bond Fund
MainStay Unconstrained Bond Fund
Municipal Bond Funds
MainStay California Tax Free Opportunities Fund2
MainStay High Yield Municipal Bond Fund
MainStay New York Tax Free Opportunities Fund3
MainStay Tax Free Bond Fund
Money Market Fund
MainStay Money Market Fund
Mixed Asset
MainStay Balanced Fund
MainStay Convertible Fund
MainStay Income Builder Fund
MainStay Marketfield Fund
Asset Allocation/Target Date
MainStay Conservative Allocation Fund
MainStay Growth Allocation Fund
MainStay Moderate Allocation Fund
MainStay Moderate Growth Allocation Fund
MainStay Retirement 2010 Fund
MainStay Retirement 2020 Fund
MainStay Retirement 2030 Fund
MainStay Retirement 2040 Fund
MainStay Retirement 2050 Fund
Manager
New York Life Investment Management LLC
New York, New York
Subadvisors
Cornerstone Capital Management Holdings LLC4
New York, New York
Cornerstone Capital Management LLC4
Bloomington, Minnesota
Epoch Investment Partners, Inc.
New York, New York
Institutional Capital LLC4
Chicago, Illinois
MacKay Shields LLC4
New York, New York
Marketfield Asset Management LLC
New York, New York
Markston International LLC
White Plains, New York
Winslow Capital Management LLC
Minneapolis, Minnesota
Legal Counsel
Dechert LLP
Independent Registered Public Accounting Firms
KPMG LLP
PricewaterhouseCoopers LLP
1. Effective January 13, 2012, the Fund was closed to new investors with certain exceptions.
2. This Fund is only registered for sale in AZ, CA, NV, OR, UT, and WA.
3. This Fund is only registered for sale in CT, DE, FL, MA, NJ, NY, and VT.
4. An affiliate of New York Life Investment Management LLC.
Not part of the Semiannual Report
For more information
800-MAINSTAY (624-6782)
mainstayinvestments.com
The MainStay Funds® are managed by New York Life Investment Management LLC and distributed through NYLIFE Distributors LLC, 169 Lackawanna Avenue, Parsippany, NJ 07054, a wholly owned subsidiary of New York Life Insurance Company. NYLIFE Distributors LLC is a Member FINRA/SIPC.
MainStay Investments® is a registered service mark and name under which New York Life Investment Management LLC does business. MainStay Investments, an indirect subsidiary of New York Life Insurance Company, New York, NY 10010, provides investment advisory products and services.
This report may be distributed only when preceded or accompanied by a current Fund prospectus.
©2013 NYLIFE Distributors LLC. All rights reserved.
| | | | | | | | |
| Not FDIC/NCUA Insured | | Not a Deposit | | May Lose Value | | No Bank Guarantee | | Not Insured by Any Government Agency |
| | |
| NYLIM-30037 MS175-13 | | MSSP10-06/13 NL0A6 |
MainStay Retirement Funds
Message from the President and Semiannual Report
Unaudited | April 30, 2013

MainStay Retirement 2010 Fund
MainStay Retirement 2020 Fund
MainStay Retirement 2030 Fund
MainStay Retirement 2040 Fund
MainStay Retirement 2050 Fund

This page intentionally left blank
Message from the President
The U.S. stock market advanced during the six months ended April 30, 2013, generally providing double-digit returns at all capitalization levels. Value stocks tended to outpace growth stocks among large- and mid-capitalization companies, while growth stocks tended to outpace value stocks among smaller companies.
The market’s advance, however, was far from uniform. Stocks declined in early November, both before and immediately after the U.S. presidential election. Following a sharp recovery, stocks climbed until mid-December, when a Congressional stalemate on the fiscal cliff led to a brief decline. Another dip occurred in late February as investors speculated that the Federal Open Market Committee (FOMC) might stop purchasing mortgage-backed securities sooner than expected. Stocks also dipped in mid-April, as consumer sentiment dropped after the Boston marathon bombing. Despite these setbacks, U.S. stocks continued to trend upward during the six-month reporting period.
International stock markets also advanced, with several regional differences. Accommodative action by the Bank of Japan helped lower the yen and lift Japanese stocks to their highest levels since 2008. In Europe, stocks did well until early February, bolstered by the promise of support for the euro. As the year progressed, however, economic contraction, rising unemployment and systematic banking concerns took a toll on investor enthusiasm. In China, manufacturing slowed as the nation sought to balance growth and inflation risks. On the Korean peninsula, tensions rose as North Korea continued to threaten its neighbors, which added an undercurrent of caution to the market.
During the six months ended April 30, 2013, the FOMC kept the federal funds rate in a range close to zero. The FOMC also continued its direct purchases of mortgage-backed securities and longer-term U.S. government securities. With short-term interest rates likely to remain at low levels, many bond investors pursued higher yields by lengthening maturities and assuming greater risk. As a result, bonds with higher risk profiles tended
to outperform higher-quality investment-grade bonds and U.S. Treasury securities. Cash and cash equivalents essentially returned zero.
With wide variations in the performance of various asset classes, some investors might be tempted to chase higher returns by shifting back and forth between stocks and bonds. Since no one can predict where the market will move next, however, we encourage investors to select an appropriate mix of investments for their risk tolerance and time horizon and to stick with that mix, making only minor adjustments over time.
At MainStay Funds, our portfolio managers use a similar approach. Careful security selection and thoughtful sell disciplines help them pursue the investment objectives of their respective Funds. Using the principal investment strategies outlined in the Prospectus, they focus primarily on providing long-term investment potential for our shareholders.
Has this approach proved successful? In its most recent rankings, Barron’s listed MainStay Funds as the #1 fund family over the past 10 years. We were also the only mutual fund family that has appeared in Barron’s top six for the past five consecutive years.
The pages that follow provide additional insight into the specific market events, investment decisions and securities that shaped your MainStay Fund(s) during the six months ended April 30, 2013. We encourage you to read the semiannual report(s) carefully and to evaluate your results with your long-term financial goals in mind.
Sincerely,

Stephen P. Fisher
President
The opinions expressed are as of the date of this report and are subject to change. There is no guarantee that any forecast made will come to pass. This material does not constitute investment advice and is not intended as an endorsement of any specific investment.
To qualify for the Lipper/Barron’s Fund Survey, a fund family must have at least three funds in Lipper’s general U.S.-stock category, one in world equity (which combines global and international funds), one mixed-equity fund (which holds stocks and bonds), two taxable-bond funds, and one tax-exempt fund. Fund loads and 12b-1 fees aren’t included in the calculation of returns because the aim is to measure the manager’s skill. Each fund’s return is measured against all funds in its Lipper category, resulting in a percentile ranking which is then weighted by asset size relative to the fund family’s other assets in its general classifications. Finally, the score is multiplied by the general classification weightings as determined by the entire Lipper universe of funds.
Source: Barron’s, 2/9/13. Overall, MainStay Funds ranked number 56 for the one-year period, 20 for the five-year period and one for the 10-year period ended December 31, 2012, out of 62, 53 and 46 fund families, respectively. MainStay ranked number three for the 10-year period in 2009, 2010 and 2011 from among 48, 46 and 45 fund families, respectively. MainStay ranked number six from among 48 fund families for the 10-year period in 2008. Past performance is no guarantee of future results, which will vary. For the most recent MainStay Funds performance, please visit our website at mainstayinvestments.com. All mutual funds are subject to market risk and will fluctuate in value.
Not part of the Semiannual Report
Table of Contents
Investors should refer to each Fund’s Summary Prospectus and/or Prospectus and consider each Fund’s investment objectives, strategies, risks, charges and expenses carefully before investing. The Summary Prospectus and/or Prospectus contain this and other information about each Fund. You may obtain copies of each Fund’s Summary Prospectus, Prospectus and Statement of Additional Information free of charge, upon request, by calling toll-free 800-MAINSTAY (624-6782), by writing to NYLIFE Distributors LLC, Attn: MainStay Marketing Department, 169 Lackawanna Avenue, Parsippany, New Jersey 07054 or by sending an e-mail to MainStayShareholderServices@nylim.com. These documents are also available via the MainStay Funds’ website at mainstayinvestments.com/documents. Please read each Fund’s Summary Prospectus and/or Prospectus carefully before investing.
MainStay Retirement 2010 Fund
Investment and Performance Comparison1 (Unaudited)
Performance data quoted represents past performance. Past performance is no guarantee of future results. Because of market volatility, current performance may be lower or higher than the figures shown. Investment return and principal value will fluctuate, and as a result, when shares are redeemed, they may be worth more or less than their original cost. The graph below depicts the historical performance of Class I shares of the Fund. Performance will vary from class to class based on differences in class-specific expenses and sales charges. For performance information current to the most recent month-end, please call 800-MAINSTAY (624-6782) or visit mainstayinvestments.com.
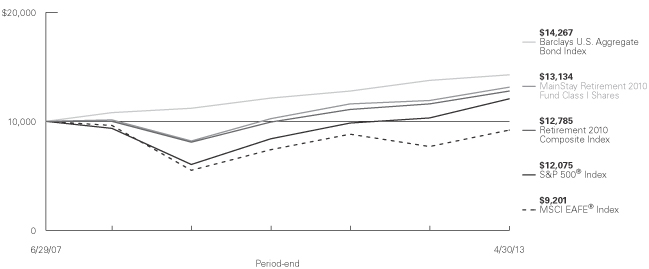
Average Annual Total Returns for the Period Ended April 30, 2013
| | | | | | | | | | | | | | | | | | | | | | | | |
| Class | | Sales Charge | | | | Six Months | | | One Year | | | Five Years | | | Since Inception
(6/29/07) | | | Gross
Expense
Ratio2 | |
| Investor Class Shares3 | | Maximum 5.5% Initial Sales Charge | | With sales charges Excluding sales charges | |
| 1.77
7.69 | %
| |
| 3.82
9.86 | %
| |
| 3.78
4.96 | %
| |
| 3.45
4.45 | %
| |
| 1.81
1.81 | %
|
| Class A Shares | | Maximum 5.5% Initial Sales Charge | | With sales charges Excluding sales charges | |
| 1.84
7.77 |
| |
| 4.01
10.06 |
| |
| 3.84
5.03 |
| |
| 3.50
4.51 |
| |
| 1.39
1.39 |
|
| Class I Shares | | No Sales Charge | | | | | 7.85 | | | | 10.22 | | | | 5.29 | | | | 4.78 | | | | 1.14 | |
| Class R1 Shares4 | | No Sales Charge | | | | | 7.85 | | | | 10.23 | | | | 5.19 | | | | 4.67 | | | | 1.24 | |
| Class R2 Shares5 | | No Sales Charge | | | | | 7.64 | | | | 9.92 | | | | 4.94 | | | | 4.43 | | | | 1.49 | |
| Class R3 Shares6 | | No Sales Charge | | | | | 7.59 | | | | 9.66 | | | | 4.66 | | | | 4.15 | | | | 1.74 | |
| 1. | The performance table and graph do not reflect the deduction of taxes that a shareholder would pay on dividends, distributions or Fund share redemptions. Total returns reflect maximum applicable sales charges as indicated in the table above, changes in share price, and reinvestment of dividend and capital gain distributions. The graph assumes the initial investment amount shown above and reflects the deduction of all sales charges that would have applied for the period of investment. Performance figures reflect certain fee waivers and/or expense limitations, without which total returns may have been lower. For more information on share classes and current fee waivers and/or expense limitations, please refer to the notes to the financial statements. |
| 2. | The gross expense ratios presented reflect the Fund’s “Total Annual Fund Operating Expenses” from the most recent Prospectus and may differ from other expense ratios disclosed in this report. |
| 3. | Performance figures for Investor Class shares, first offered on February 28, 2008 include the historical performance of Class A shares through February 27, 2008, adjusted for differences in certain expenses and fees. Unadjusted, the performance shown for Investor Class shares would likely have been different. |
| 4. | Class R1 shares were first offered to the public on June 29, 2007, although this class of shares has not yet commenced operations as of April 30, 2013. As a result, the performance for Class R1 shares include the historical performance of Class A shares through April 30, 2013, adjusted for differences in certain expenses and fees. Unadjusted, the performance shown for Class R1 shares would likely have been different. |
| 5. | Class R2 shares were first offered on June 29, 2007, although this class did not commence investment operations until January 8, 2009. Performance figures for Class R2 shares include the historical performance of Class A shares through January 7, 2009, adjusted for differences in certain expenses and fees. Unadjusted, the performance shown for Class R2 shares would likely have been different. |
| 6. | Class R3 shares were first offered on June 29, 2007, although this class did not commence investment operations until May 1, 2008. Performance figures for Class R3 shares include the historical performance of Class A shares through April 30, 2008, adjusted for differences in certain expenses and fees. Unadjusted, the performance shown for Class R3 shares would likely have been different. |
The footnotes on the next page are an integral part of the table and graph and should be carefully read in conjunction with them.
| | | | |
| mainstayinvestments.com | | | 5 | |
| | | | | | | | | | | | | | | | |
| Benchmark Performance | | Six Months | | | One
Year | | | Five
Years | | | Since
Inception | |
S&P 500® Index7 | | | 14.42 | % | | | 16.89 | % | | | 5.21 | % | | | 3.29 | % |
MSCI EAFE® Index8 | | | 16.90 | | | | 19.39 | | | | –0.93 | | | | –1.42 | |
Barclays U.S. Aggregate Bond Index9 | | | 0.90 | | | | 3.68 | | | | 5.72 | | | | 6.28 | |
Retirement 2010 Composite Index10 | | | 7.38 | | | | 10.19 | | | | 5.00 | | | | 4.30 | |
Average Lipper Mixed-Asset Target 2010 Fund11 | | | 5.99 | | | | 8.19 | | | | 3.86 | | | | 3.26 | |
| 7. | “S&P 500®” is a trademark of The McGraw-Hill Companies, Inc. The S&P 500® Index is widely regarded as the standard index for measuring large-cap U.S. stock market performance. The S&P 500 Index is the Fund’s broad-based securities market index. Results assume reinvestment of all income and capital gains. An investment cannot be made directly in an index. |
| 8. | The MSCI EAFE® Index consists of international stocks representing the developed world outside of North America. The MSCI EAFE® Index is the Fund’s secondary benchmark. Results assume reinvestment of all income and capital gains. An investment cannot be made directly in an index. |
| 9. | The Barclays U.S. Aggregate Bond Index is a broad-based benchmark that measures the investment grade, U.S. dollar-denominated, fixed-rate taxable bond market, including Treasurys, government-related and corporate securities, mortgage-backed securities (agency fixed-rate and hybrid adjustable rate mortgage pass-throughs), asset-backed securities, and commercial mortgage-backed securities. The Fund has selected the |
| | Barclays U.S. Aggregate Bond Index as an additional benchmark. Results assume reinvestment of all income and capital gains. An investment cannot be made directly in an index. |
| 10. | The Retirement 2010 Composite Index consists of the S&P 500® Index, the MSCI EAFE® Index and the Barclays U.S. Aggregate Bond Index weighted according to the Fund’s current allocation, changing annually through the target retirement date. The Fund has selected the Retirement 2010 Composite Index as an additional benchmark. Total returns assume reinvestment of all dividends and capital gains. An investment cannot be made directly in an index. |
| 11. | The average Lipper mixed-asset target 2010 fund is representative of funds that seek to maximize assets for retirement or other purposes with an expected time horizon not exceeding December 31, 2010. This benchmark is a product of Lipper Inc. Lipper Inc. is an independent monitor of fund performance. Results are based on average total returns of similar funds with all dividend and capital gain distributions reinvested. |
The footnotes on the preceding page are an integral part of the table and graph and should be carefully read in conjunction with them.
| | |
| 6 | | MainStay Retirement 2010 Fund |
Cost in Dollars of a $1,000 Investment in MainStay Retirement 2010 Fund (Unaudited)
The example below is intended to describe the fees and expenses borne by shareholders during the six-month period from November 1, 2012, to April 30, 2013, and the impact of those costs on your investment.
Example
As a shareholder of the Fund, you incur two types of costs: (1) transaction costs, including exchange fees and sales charges (loads) on purchases (as applicable), and (2) ongoing costs, including management fees, distribution and/or service (12b-1) fees, and other Fund expenses (as applicable). This example is intended to help you understand your ongoing costs (in dollars) of investing in the Fund and to compare these costs with the ongoing costs of investing in other mutual funds. The example is based on an investment of $1,000 made at the beginning of the six-month period and held for the entire period from November 1, 2012, to April 30, 2013.
This example illustrates your Fund’s ongoing costs in two ways:
Actual Expenses
The second and third data columns in the table below provide information about actual account values and actual expenses. You may use the information in these columns, together with the amount you invested, to estimate the expenses that you paid during the six months ended April 30, 2013. Simply divide your account value by $1,000 (for example, an $8,600 account value divided by $1,000 = 8.6), then
multiply the result by the number under the heading entitled “Expenses Paid During Period” to estimate the expenses you paid on your account during this period.
Hypothetical Example for Comparison Purposes
The fourth and fifth data columns in the table below provide information about hypothetical account values and hypothetical expenses based on the Fund’s actual expense ratio and an assumed rate of return of 5% per year before expenses, which is not the Fund’s actual return. The hypothetical account values and expenses may not be used to estimate the actual ending account balances or expenses you paid for the six-month period shown. You may use this information to compare the ongoing costs of investing in the Fund with the ongoing costs of investing in other Funds. To do so, compare this 5% hypothetical example with the 5% hypothetical examples that appear in the shareholder reports of the other Funds.
Please note that the expenses shown in the table are meant to highlight your ongoing costs only and do not reflect any transactional costs, such as exchange fees or sales charges (loads). Therefore, the fourth and fifth data columns of the table are useful in comparing ongoing costs only and will not help you determine the relative total costs of owning different funds. In addition, if these transactional costs were included, your costs would have been higher.
| | | | | | | | | | | | | | | | | | | | |
| | | | | | | | | | | | | | | | |
| Share Class | | Beginning
Account
Value
11/1/12 | | | Ending Account
Value (Based
on Actual
Returns and
Expenses)
4/30/13 | | | Expenses
Paid
During
Period1 | | | Ending Account
Value (Based
on Hypothetical
5% Annualized
Return and
Actual Expenses)
4/30/13 | | | Expenses
Paid
During
Period1 | |
| | | | | |
| Investor Class Shares | | $ | 1,000.00 | | | $ | 1,076.90 | | | $ | 2.42 | | | $ | 1,022.50 | | | $ | 2.36 | |
| | | | | |
| Class A Shares | | $ | 1,000.00 | | | $ | 1,077.70 | | | $ | 1.91 | | | $ | 1,023.00 | | | $ | 1.86 | |
| | | | | |
| Class I Shares | | $ | 1,000.00 | | | $ | 1,078.50 | | | $ | 0.62 | | | $ | 1,024.20 | | | $ | 0.60 | |
| | | | | |
| Class R2 Shares | | $ | 1,000.00 | | | $ | 1,076.40 | | | $ | 2.42 | | | $ | 1,022.50 | | | $ | 2.36 | |
| | | | | |
| Class R3 Shares | | $ | 1,000.00 | | | $ | 1,075.90 | | | $ | 3.71 | | | $ | 1,021.20 | | | $ | 3.61 | |
| 1. | Expenses are equal to the Fund’s annualized expense ratio of each class (0.47% for Investor Class, 0.37% for Class A, 0.12% for Class I, 0.47% for Class R2 and 0.72% for Class R3) multiplied by the average account value over the period, divided by 365 and multiplied by 181 (to reflect the six-month period). The table above represents the actual expenses incurred during the six-month period. In addition to the fees and expenses which the Fund bears directly, the Fund indirectly bears a pro rata share of the fees and expenses of the Underlying Funds in which it invests. Such indirect expenses are not included in the above-reported expense figures. |
| | | | |
| mainstayinvestments.com | | | 7 | |
Investment Objectives of Underlying Funds as of April 30, 2013 (Unaudited)
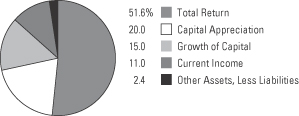
See Portfolio of Investments beginning on page 12 for specific holdings within these categories.
| | |
| 8 | | MainStay Retirement 2010 Fund |
Portfolio Management Discussion and Analysis (Unaudited)
Questions answered by portfolio managers Jae S. Yoon, CFA, Jonathan Swaney and Poul Kristensen, CFA, of New York Life Investments.1
How did MainStay Retirement 2010 Fund perform relative to its peers and its benchmark during the six months ended April 30, 2013?
Excluding all sales charges, MainStay Retirement 2010 Fund returned 7.69% for Investor Class shares and 7.77% for Class
A shares for the six months ended April 30, 2013. Over the same period, Class I shares returned 7.85%, Class R1 shares2 returned 7.85%, Class R2 shares returned 7.64% and Class
R3 shares returned 7.59%. All share classes outperformed the 5.99% return of the average Lipper3 mixed-asset target 2010 fund for the six months ended April 30, 2013. Over the same period, all share classes underperformed the 14.42% return
of the S&P 500® Index4 and the 16.90% return of the MSCI EAFE® Index.5 The S&P 500® Index is the Fund’s broad-based securities-market index, and the MSCI EAFE® Index is the secondary benchmark of the Fund. All share classes outper-
formed the 0.90% return of the Barclays U.S. Aggregate Bond Index6 and the 7.38% return of the Retirement 2010 Composite Index7 for the six months ended April 30, 2013. The Barclays U.S. Aggregate Bond Index and the Retirement 2010 Com-
posite Index are additional benchmarks of the Fund. See page
5 for Fund returns with applicable sales charges.
Were there any changes to the Fund during the reporting period?
Effective February 28, 2013, the Fund’s Principal Investment Strategies were modified to broaden the investment ranges for each of the asset classes in which the Fund may invest by an additional ten percentage points. Also effective February 28, 2013, Poul Kristensen, CFA, was added as a portfolio manager. Please see the Prospectus dated February 28, 2013, for more information.
What factors affected the Fund’s relative performance during the reporting period?
The Fund invests primarily in mutual funds managed by New York Life Investments, mutual funds managed by an advisor not affiliated with New York Life Investments or exchange traded funds (“ETFs”), if a New York Life Investments managed mutual fund in a particular asset class is not available (collectively, “Underlying Funds”). The Underlying Funds may invest in fixed-income securities or in domestic or international stocks at various capitalization levels. The Fund’s primary benchmark, on the other hand, consists entirely of U.S. large-cap stocks. These differences—particularly the Fund’s sub-
stantial allocation to Underlying Funds that invest in fixed-income securities—accounted for many of the challenges the Fund experienced in terms of relative performance.
During the reporting period, the Fund provided slightly better returns than the Retirement 2010 Composite Index and better returns than the average peer fund. The Fund’s asset-allocation policy was largely a wash. We maintained a neutral blend at the start of the reporting period, then moved aggressively to overweight equities during the latter half of the fourth quarter. This proved to be a very profitable strategy, although the benefit was almost entirely offset by a heavy allocation to emerging-market stocks, an emphasis on large-cap stocks rather than small-cap stocks, and a bias toward U.S. equities over those of other developed nations. In the fixed-income portion of the Fund, a bias toward lower-quality bond offerings aided performance. Our decision to keep duration8 short in the fixed-income portion of the Fund had no meaningful impact on the Fund’s performance.
Performance of the Underlying Funds also influenced relative results. Relying on MainStay Large Cap Growth Fund more heavily than MainStay Cornerstone Growth Fund proved beneficial. Other positive contributors in the equity portion of the
Fund included MainStay MAP Fund and MainStay U.S. Small Cap Fund. All told, the performance of all Underlying Funds contributed positively—but not significantly—to relative performance.
How did you allocate the Fund’s assets during the reporting period and why?
We considered a variety of information, including the portfolio-level characteristics of the Underlying Funds, such as capitalization, style biases, sector exposures, credit quality and duration. We also examined the attributes of the Underlying Funds’ holdings, such as valuation metrics, earnings data and technical indicators. Finally, we evaluated the historical success of the managers responsible for the Underlying Funds. Generally speaking, we seek to invest in Underlying Funds that occupy attractively valued segments of the market, invest in fairly priced securities and are steered by individuals who have consistently demonstrated capable management in the past.
The Fund’s allocations to stocks and bonds varied over the course of the reporting period in response to the changing environment. We believed that equities presented a sizable valuation advantage over bonds and that corporate profit gains
| 1. | “New York Life Investments” is a service mark used by New York Life Investment Management LLC. |
| 2. | See footnote on page 5 for more information on Class R1 shares. |
| 3. | See footnote on page 6 for more information on Lipper Inc. |
| 4. | See footnote on page 6 for more information on the S&P 500® Index. |
| 5. | See footnote on page 6 for more information on the MSCI EAFE® Index. |
| 6. | See footnote on page 6 for more information on the Barclays U.S. Aggregate Bond Index. |
| 7. | See footnote on page 6 for more information on the Retirement 2010 Composite Index. |
| 8. | Duration is a measure of the price sensitivity of a fixed-income investment to changes in interest rates. Duration is expressed as a number of years and is considered a more accurate sensitivity gauge than average maturity. |
| | | | |
| mainstayinvestments.com | | | 9 | |
would help propel stock prices higher. For these reasons, we gave the Fund a decisive tilt in favor of stocks over bonds throughout most of the reporting period. Within the equity portion of the Fund, we maintained a bias in favor of Underlying Funds that invest in U.S. stocks over Underlying Funds that invest in stocks traded in other developed markets. We were particularly concerned about countries that are likely to struggle with deleveraging issues even greater than those presented in the United States. Results were mixed, as Japan in particular experienced very strong returns on the back of aggressive fiscal and monetary policy changes. The Fund was also significantly overweight in emerging-market economies because we believed that these markets would benefit most from gradually strengthening global economic growth. During the reporting period, however, that posture detracted significantly from performance, as emerging-market stocks generally trailed stocks in developed markets by a wide margin.
In the fixed-income portion of the Fund, we continued to maintain a shorter duration than the Barclays U.S. Aggregate Bond Index. We also tilted the fixed-income portion of the Fund decidedly toward Underlying Funds that invest in corporate bonds over those that invest primarily in government-backed issues. This positioning reflected our opinion that high-grade bonds were very expensive and that issues from corporate borrowers deemed to be of lower quality represented a far more attractive proposition. Given ample liquidity and healthy corporate balance sheets, we believed that default rates were likely to remain low. We also believed that investors were likely to find the higher yields available from corporate debt quite attractive compared to the yields available on U.S. Treasury instruments.
How did the Fund’s allocations change over the course of the reporting period?
Position sizes naturally fluctuate with changing market conditions, and such changes do not always reflect an explicit change in our strategic or tactical point of view. That said, many of the most notable allocation changes during the reporting period were associated with the expanding list of eligible investments, as several new MainStay Funds became available. MainStay Short Duration High Yield Fund was one such product. The Fund selected this Underlying Fund as part of an ongoing effort to protect against a potential rise in interest rates. We quickly built the Fund’s position after the Underlying Fund’s launch in December 2012. The purchases were made with proceeds from MainStay High Yield Corporate Bond Fund and MainStay Floating Rate Fund.
MainStay Cornerstone Growth Fund was another new product. We established a position in this Underlying Fund using proceeds from MainStay Large Cap Growth Fund as we sought to widen strategy diversification within that portion of the market.
A new holding was established in MainStay High Yield Municipal Bond Fund, which further diversified sources of credit risk within the fixed-income portion of the Fund. We believed that high-yield municipal bonds would be attractive despite the inapplicability of tax benefits usually associated with these types of instruments.
There were two other changes of note. First, we increased the Fund’s position in MainStay U.S. Small Cap Fund as we unwound the Fund’s previous large-cap bias. The increased allocation was funded from a mix of Underlying Equity Funds. Second, we increased the Fund’s position in MainStay Common Stock Fund, as the strategy employed in that Underlying Fund has proven very effective in the post–credit crisis environment.
During the reporting period, which Underlying Equity Funds had the highest total returns and which Underlying Equity Funds had the lowest total returns?
MainStay International Opportunities Fund (formerly MainStay 130/30 International Fund) generated the highest absolute return by a comfortable margin, followed by MainStay U.S. Small Cap Fund. Although none of the Underlying Equity Funds in which the Fund invested provided negative returns for the reporting period, the lowest absolute returns in the equity portion of the Fund came from MainStay Cornerstone Growth Fund and Vanguard FTSE Emerging Markets ETF.
Which Underlying Equity Funds made the strongest positive contributions to the Fund’s overall performance, and which Underlying Equity Funds were the greatest detractors?
Because contributions take weightings and total returns into account and position sizes may vary, the Underlying Funds with the highest (or lowest) returns may not always have the most significantly positive (or negative) contributions to performance.
During the reporting period, large positions in MainStay MAP Fund and MainStay Large Cap Growth Fund made the largest positive contributions to the Fund’s overall performance. Although none of the Underlying Equity Funds in which the Fund invested had negative total returns, the smallest contributions came from a new position being built in MainStay Cornerstone Growth Fund and from a small position in MainStay International Equity Fund.
What factors and risks affected the Fund’s Underlying Fixed Income Fund investments during the reporting period?
Monetary policy continued to play a significant role in fixed-income markets, as has been the case for several years. Faced with persistently sluggish economic growth, slow rates of job creation and the prospect of significant fiscal drag, the Federal Reserve elected to extend its large-scale asset purchase program indefinitely. This decision helped keep interest rates close to their all-time lows. During the reporting period, the Fund favored Underlying Fixed Income Funds that invest in higher-yielding
| | |
| 10 | | MainStay Retirement 2010 Fund |
corporate bonds over those that invest primarily in government-backed issues. This strategy proved fortunate. Credit performed quite well as default rates remained low and the comparatively higher yields of these bonds attracted many buyers.
During the reporting period, which fixed-income market segments were strong performers and which segments were particularly weak?
High-yield corporate bonds performed exceptionally well as spreads9 to U.S. Treasurys continued to contract. The lowest returns came from the most liquid, highest-quality and shortest-term debt instruments. Cash returned nothing, and returns on short-term U.S. government debt and AAA bonds were only slightly higher.
Which Underlying Fixed Income Funds made the strongest positive contributions to the Fund’s performance, and which Underlying Fixed Income Funds were the greatest detractors?
The largest contributions to the fixed-income portion of the Fund came from MainStay Floating Rate Fund and a much larger position in MainStay Intermediate Term Bond Fund. The contribution from positions in a variety of other Underlying Fixed Income Funds, including MainStay Money Market Fund and MainStay Indexed Bond Fund, was effectively zero.
| 9. | The terms “spread” and “yield spread” may refer to the difference in yield between a security or type of security and comparable U.S. Treasury issues. The terms may also refer to the difference in yield between two specific securities or types of securities at a given time. |
The opinions expressed are those of the portfolio managers as of the date of this report and are subject to change. There is no guarantee that any forecast made will come to pass. This material does not constitute investment advice and is not intended as an endorsement of any specific investment.
| | | | |
| mainstayinvestments.com | | | 11 | |
Portfolio of Investments April 30, 2013 (Unaudited)
| | | | | | | | |
| | |
| | | Shares | | | Value | |
| | | | | | | | |
| Affiliated Investment Companies 89.2%† | |
Equity Funds 42.4% | |
MainStay Common Stock Fund Class I | | | 254,838 | | | $ | 3,748,668 | |
MainStay Cornerstone Growth Fund Class I | | | 33,845 | | | | 1,010,276 | |
MainStay Epoch International Small Cap Fund Class I | | | 33,645 | | | | 680,306 | |
MainStay Epoch U.S. All Cap Fund Class I | | | 113,513 | | | | 2,855,997 | |
MainStay ICAP Equity Fund Class I | | | 66,037 | | | | 2,979,567 | |
MainStay ICAP International Fund Class I | | | 38,249 | | | | 1,240,409 | |
MainStay ICAP Select Equity Fund Class I | | | 5,737 | | | | 247,099 | |
MainStay International Equity Fund Class I | | | 42,255 | | | | 532,840 | |
MainStay Large Cap Growth Fund Class I | | | 223,335 | | | | 1,969,816 | |
MainStay MAP Fund Class I | | | 132,166 | | | | 5,262,843 | |
MainStay S&P 500 Index Fund Class I | | | 68,642 | | | | 2,547,299 | |
| | | | | | | | |
Total Equity Funds
(Cost $18,791,499) | | | | | | | 23,075,120 | |
| | | | | | | | |
|
Fixed Income Funds 46.8% | |
MainStay Floating Rate Fund Class I | | | 268,913 | | | | 2,597,699 | |
MainStay High Yield Corporate Bond Fund Class I | | | 114,459 | | | | 711,937 | |
MainStay High Yield Municipal Bond Fund Class I | | | 43,611 | | | | 529,440 | |
MainStay Indexed Bond Fund Class I | | | 634,114 | | | | 7,190,853 | |
MainStay Intermediate Term Bond Fund Class I | | | 1,092,358 | | | | 12,157,942 | |
MainStay Money Market Fund Class A | | | 1,275,750 | | | | 1,275,750 | |
MainStay Short Duration High Yield Fund Class I | | | 87,664 | | | | 882,776 | |
MainStay Short Term Bond Fund Class I | | | 9,993 | | | | 96,135 | |
| | | | | | | | |
Total Fixed Income Funds
(Cost $24,834,430) | | | | | | | 25,442,532 | |
| | | | | | | | |
Total Affiliated Investment Companies (Cost $43,625,929) | | | | | | | 48,517,652 | |
| | | | | | | | |
| | | | | | | | |
| | |
| | | Shares | | | Value | |
| | | | | | | | |
| Unaffiliated Investment Companies 8.4% | |
Equity Funds 5.5% | | | | | | | | |
iShares Russell 2000 Index ETF | | | 9,310 | | | $ | 876,444 | |
Vanguard Emerging Markets ETF | | | 47,853 | | | | 2,094,047 | |
| | | | | | | | |
Total Equity Funds
(Cost $2,675,161) | | | | | | | 2,970,491 | |
| | | | | | | | |
| | |
Fixed Income Funds 2.9% | | | | | | | | |
iShares Barclays TIPS Bond Fund ETF | | | 7,626 | | | | 931,516 | |
Market Vectors Emerging Markets Local Currency Bond ETF | | | 23,936 | | | | 660,394 | |
| | | | | | | | |
Total Fixed Income Funds
(Cost $1,459,612) | | | | | | | 1,591,910 | |
| | | | | | | | |
Total Unaffiliated Investment Companies
(Cost $4,134,773) | | | | | | | 4,562,401 | |
| | | | | | | | |
Total Investments
(Cost $47,760,702) (a) | | | 97.6 | % | | | 53,080,053 | |
Other Assets, Less Liabilities | | | 2.4 | | | | 1,286,326 | |
Net Assets | | | 100.0 | % | | $ | 54,366,379 | |
| † | Percentages indicated are based on Fund net assets. |
| (a) | As of April 30, 2013, cost is $48,342,849 for federal income tax purposes and net unrealized appreciation is as follows: |
| | | | |
Gross unrealized appreciation | | $ | 5,319,351 | |
Gross unrealized depreciation | | | (582,147 | ) |
| | | | |
Net unrealized appreciation | | $ | 4,737,204 | |
| | | | |
The following abbreviations are used in the above portfolio:
| TIPS—Treasury | Inflation Protected Security |
| | | | |
| 12 | | MainStay Retirement 2010 Fund | | The notes to the financial statements are an integral part of,
and should be read in conjunction with, the financial statements. |
The following is a summary of the fair valuations according to the inputs used as of April 30, 2013, for valuing the Fund’s assets.
Asset Valuation Inputs
| | | | | | | | | | | | | | | | |
Description | | Quoted
Prices in
Active
Markets for
Identical
Assets
(Level 1) | | | Significant
Other
Observable
Inputs
(Level 2) | | | Significant
Unobservable
Inputs
(Level 3) | | | Total | |
| Investments (a) | | | | | | | | | | | | | | | | |
| Affiliated Investment Companies | | | | | | | | | | | | | | | | |
Equity Funds | | $ | 23,075,120 | | | $ | — | | | $ | — | | | $ | 23,075,120 | |
Fixed Income Funds | | | 25,442,532 | | | | — | | | | — | | | | 25,442,532 | |
| | | | | | | | | | | | | | | | |
| Total Affiliated Investment Companies | | | 48,517,652 | | | | — | | | | — | | | | 48,517,652 | |
| | | | | | | | | | | | | | | | |
| Unaffiliated Investment Companies | | | | | | | | | | | | | | | | |
Equity Funds | | | 2,970,491 | | | | — | | | | — | | | | 2,970,491 | |
Fixed Income Funds | | | 1,591,910 | | | | — | | | | — | | | | 1,591,910 | |
| | | | | | | | | | | | | | | | |
| Total Unaffiliated Investment Companies | | | 4,562,401 | | | | — | | | | — | | | | 4,562,401 | |
| | | | | | | | | | | | | | | | |
| Total Investments | | $ | 53,080,053 | | | $ | — | | | $ | — | | | $ | 53,080,053 | |
| | | | | | | | | | | | | | | | |
| (a) | For a complete listing of investments, see the Portfolio of Investments. |
The Fund recognizes transfers between the levels as of the beginning of the period.
For the period ended April 30, 2013, the Fund did not have any transfers between Level 1 and Level 2 fair value measurements. (See Note 2)
As of April 30, 2013, the Fund did not hold any investments with significant unobservable inputs (Level 3). (See Note 2)
| | | | | | |
The notes to the financial statements are an integral part of,
and should be read in conjunction with, the financial statements. | | mainstayinvestments.com | | | 13 | |
Statement of Assets and Liabilities as of April 30, 2013 (Unaudited)
| | | | |
| Assets | | | | |
Investment in affiliated investment companies, at value (identified cost $43,625,929) | | $ | 48,517,652 | |
Investments in unaffiliated investment companies, at value (identified cost $4,134,773) | | | 4,562,401 | |
Cash | | | 3,572 | |
Receivables: | | | | |
Fund shares sold | | | 1,306,418 | |
Manager (See Note 3) | | | 9,945 | |
Other assets | | | 30,983 | |
| | | | |
Total assets | | | 54,430,971 | |
| | | | |
| |
| Liabilities | | | | |
Payables: | | | | |
Fund shares redeemed | | | 21,272 | |
Transfer agent (See Note 3) | | | 14,736 | |
Professional fees | | | 14,664 | |
NYLIFE Distributors (See Note 3) | | | 5,764 | |
Shareholder communication | | | 4,961 | |
Custodian | | | 1,312 | |
Trustees | | | 153 | |
Accrued expenses | | | 1,730 | |
| | | | |
Total liabilities | | | 64,592 | |
| | | | |
Net assets | | $ | 54,366,379 | |
| | | | |
| |
| Composition of Net Assets | | | | |
Shares of beneficial interest outstanding (par value of $.001 per share) unlimited number of shares authorized | | $ | 5,248 | |
Additional paid-in capital | | | 48,046,729 | |
| | | | |
| | | 48,051,977 | |
Undistributed net investment income | | | 101,046 | |
Accumulated net realized gain (loss) on | | | 894,005 | |
Net unrealized appreciation (depreciation) on investments | | | 5,319,351 | |
| | | | |
Net assets | | $ | 54,366,379 | |
| | | | |
| | | | |
Investor Class | | | | |
Net assets applicable to outstanding shares | | $ | 1,144,182 | |
| | | | |
Shares of beneficial interest outstanding | | | 110,559 | |
| | | | |
Net asset value per share outstanding | | $ | 10.35 | |
Maximum sales charge (5.50% of offering price) | | | 0.60 | |
| | | | |
Maximum offering price per share outstanding | | $ | 10.95 | |
| | | | |
Class A | | | | |
Net assets applicable to outstanding shares | | $ | 7,971,111 | |
| | | | |
Shares of beneficial interest outstanding | | | 772,586 | |
| | | | |
Net asset value per share outstanding | | $ | 10.32 | |
Maximum sales charge (5.50% of offering price) | | | 0.60 | |
| | | | |
Maximum offering price per share outstanding | | $ | 10.92 | |
| | | | |
Class I | | | | |
Net assets applicable to outstanding shares | | $ | 25,601,791 | |
| | | | |
Shares of beneficial interest outstanding | | | 2,464,626 | |
| | | | |
Net asset value and offering price per share outstanding | | $ | 10.39 | |
| | | | |
Class R2 | | | | |
Net assets applicable to outstanding shares | | $ | 18,779,354 | |
| | | | |
Shares of beneficial interest outstanding | | | 1,816,409 | |
| | | | |
Net asset value and offering price per share outstanding | | $ | 10.34 | |
| | | | |
Class R3 | | | | |
Net assets applicable to outstanding shares | | $ | 869,941 | |
| | | | |
Shares of beneficial interest outstanding | | | 84,226 | |
| | | | |
Net asset value and offering price per share outstanding | | $ | 10.33 | |
| | | | |
| | | | |
| 14 | | MainStay Retirement 2010 Fund | | The notes to the financial statements are an integral part of,
and should be read in conjunction with, the financial statements. |
Statement of Operations for the six months ended April 30, 2013 (Unaudited)
| | | | |
| Investment Income (Loss) | | | | |
Income | | | | |
Dividend distributions from affiliated investment companies | | $ | 642,732 | |
Dividend distributions from unaffiliated investment companies | | | 51,525 | |
| | | | |
Total income | | | 694,257 | |
| | | | |
Expenses | | | | |
Transfer agent (See Note 3) | | | 43,574 | |
Registration | | | 33,663 | |
Distribution/Service—Investor Class (See Note 3) | | | 1,304 | |
Distribution/Service—Class A (See Note 3) | | | 8,502 | |
Distribution/Service—Class R2 (See Note 3) | | | 20,808 | |
Distribution/Service—Class R3 (See Note 3) | | | 2,132 | |
Manager (See Note 3) | | | 25,279 | |
Professional fees | | | 13,578 | |
Shareholder service (See Note 3) | | | 8,752 | |
Shareholder communication | | | 5,654 | |
Custodian | | | 3,618 | |
Trustees | | | 596 | |
Miscellaneous | | | 3,790 | |
| | | | |
Total expenses before waiver/reimbursement | | | 171,250 | |
Expense waiver/reimbursement from Manager (See Note 3) | | | (97,637 | ) |
| | | | |
Net expenses | | | 73,613 | |
| | | | |
Net investment income (loss) | | | 620,644 | |
| | | | |
|
| Realized and Unrealized Gain (Loss) on Investments | |
Net realized gain (loss) on: | | | | |
Affiliated investment company transactions | | | 989,932 | |
Unaffiliated investment company transactions | | | 5,211 | |
Realized capital gain distributions from affiliated investment companies | | | 481,048 | |
| | | | |
Net realized gain (loss) on investments from affiliated and unaffiliated investment companies | | | 1,476,191 | |
| | | | |
Net change in unrealized appreciation (depreciation) on investments | | | 1,663,652 | |
| | | | |
Net realized and unrealized gain (loss) on investments | | | 3,139,843 | |
| | | | |
Net increase (decrease) in net assets resulting from operations | | $ | 3,760,487 | |
| | | | |
| | | | | | |
The notes to the financial statements are an integral part of,
and should be read in conjunction with, the financial statements. | | mainstayinvestments.com | | | 15 | |
Statements of Changes in Net Assets
for the six months ended April 30, 2013 (Unaudited) and the year ended October 31, 2012
| | | | | | | | |
| | | 2013 | | | 2012 | |
| Increase (Decrease) in Net Assets | |
Operations: | | | | | | | | |
Net investment income (loss) | | $ | 620,644 | | | $ | 1,328,267 | |
Net realized gain (loss) on investments from affiliated and unaffiliated investment companies transactions | | | 1,476,191 | | | | 1,182,575 | |
Net change in unrealized appreciation (depreciation) on investments | | | 1,663,652 | | | | 3,161,791 | |
| | | | |
Net increase (decrease) in net assets resulting from operations | | | 3,760,487 | | | | 5,672,633 | |
| | | | |
Dividends and distributions to shareholders: | | | | | | | | |
From net investment income: | | | | | | | | |
Investor Class | | | (27,033 | ) | | | (13,271 | ) |
Class A | | | (171,025 | ) | | | (147,448 | ) |
Class I | | | (750,878 | ) | | | (1,032,287 | ) |
Class R2 | | | (430,862 | ) | | | (312,739 | ) |
Class R3 | | | (20,542 | ) | | | (13,876 | ) |
| | | | |
| | | (1,400,340 | ) | | | (1,519,621 | ) |
| | | | |
From net realized gain on investments: | | | | | | | | |
Investor Class | | | (25,105 | ) | | | (35,190 | ) |
Class A | | | (155,612 | ) | | | (370,669 | ) |
Class I | | | (613,760 | ) | | | (2,423,295 | ) |
Class R2 | | | (408,571 | ) | | | (840,792 | ) |
Class R3 | | | (21,515 | ) | | | (40,444 | ) |
| | | | |
| | | (1,224,563 | ) | | | (3,710,390 | ) |
| | | | |
Total dividends and distributions to shareholders | | | (2,624,903 | ) | | | (5,230,011 | ) |
| | | | |
Capital share transactions: | | | | | | | | |
Net proceeds from sale of shares | | | 9,004,470 | | | | 15,977,229 | |
Net asset value of shares issued to shareholders in reinvestment of dividends and distributions | | | 2,621,957 | | | | 5,227,180 | |
Cost of shares redeemed | | | (12,120,394 | ) | | | (34,490,741 | ) |
| | | | |
Increase (decrease) in net assets derived from capital share transactions | | | (493,967 | ) | | | (13,286,332 | ) |
| | | | |
Net increase (decrease) in net assets | | | 641,617 | | | | (12,843,710 | ) |
|
| Net Assets | |
Beginning of period | | | 53,724,762 | | | | 66,568,472 | |
| | | | |
End of period | | $ | 54,366,379 | | | $ | 53,724,762 | |
| | | | |
Undistributed net investment income at end of period | | $ | 101,046 | | | $ | 880,742 | |
| | | | |
| | | | |
| 16 | | MainStay Retirement 2010 Fund | | The notes to the financial statements are an integral part of,
and should be read in conjunction with, the financial statements. |
Financial Highlights selected per share data and ratios
| | | | | | | | | | | | | | | | | | | | | | | | |
| | | Investor Class | |
| | | Six months
ended
April 30, | | | Year ended October 31, | | | February 28,
2008**
through
October 31, | |
| | | 2013* | | | 2012 | | | 2011 | | | 2010 | | | 2009 | | | 2008 | |
Net asset value at beginning of period | | $ | 10.13 | | | $ | 10.03 | | | $ | 10.07 | | | $ | 9.15 | | | $ | 7.95 | | | $ | 9.95 | |
| | | | | | | | | | | | | | | | | | | | | | | | |
Net investment income (loss) (a) | | | 0.11 | | | | 0.18 | | | | 0.21 | | | | 0.17 | | | | 0.22 | | | | 0.15 | |
Net realized and unrealized gain (loss) on investments | | | 0.63 | | | | 0.69 | | | | 0.13 | | | | 0.94 | | | | 1.17 | | | | (2.15 | ) |
| | | | | | | | | | | | | | | | | | | | | | | | |
Total from investment operations | | | 0.74 | | | | 0.87 | | | | 0.34 | | | | 1.11 | | | | 1.39 | | | | (2.00 | ) |
| | | | | | | | | | | | | | | | | | | | | | | | |
Less dividends and distributions: | | | | | | | | | | | | | | | | | | | | | | | | |
From net investment income | | | (0.27 | ) | | | (0.21 | ) | | | (0.24 | ) | | | (0.19 | ) | | | (0.19 | ) | | | — | |
From net realized gain on investments | | | (0.25 | ) | | | (0.56 | ) | | | (0.14 | ) | | | — | | | | — | | | | — | |
| | | | | | | | | | | | | | | | | | | | | | | | |
Total dividends and distributions | | | (0.52 | ) | | | (0.77 | ) | | | (0.38 | ) | | | (0.19 | ) | | | (0.19 | ) | | | — | |
| | | | | | | | | | | | | | | | | | | | | | | | |
Net asset value at end of period | | $ | 10.35 | | | $ | 10.13 | | | $ | 10.03 | | | $ | 10.07 | | | $ | 9.15 | | | $ | 7.95 | |
| | | | | | | | | | | | | | | | | | | | | | | | |
Total investment return (b) | | | 7.69 | %(c) | | | 9.35 | % | | | 3.44 | % | | | 12.34 | % | | | 17.90 | % | | | (20.10 | %)(c) |
Ratios (to average net assets)/Supplemental Data: | | | | | | | | | | | | | | | | | | | | | | | | |
Net investment income (loss) | | | 2.26 | %†† | | | 1.79 | % | | | 2.03 | % | | | 1.82 | % | | | 2.61 | % | | | 2.38 | % †† |
Net expenses (d) | | | 0.47 | %†† | | | 0.47 | % | | | 0.47 | % | | | 0.47 | % | | | 0.38 | % | | | 0.46 | % †† |
Expenses (before waiver/reimbursement) (d) | | | 1.01 | %†† | | | 1.11 | % | | | 1.42 | % | | | 2.03 | % | | | 0.89 | % | | | 6.41 | % †† |
Portfolio turnover rate | | | 32 | % | | | 95 | % | | | 107 | % | | | 81 | % | | | 76 | % | | | 127 | % |
Net assets at end of period (in 000’s) | | $ | 1,144 | | | $ | 977 | | | $ | 601 | | | $ | 468 | | | $ | 163 | | | $ | 41 | |
| ** | Commencement of operations. |
| (a) | Per share data based on average shares outstanding during the period. |
| (b) | Total investment return is calculated exclusive of sales charges and assumes the reinvestment of dividends and distributions. |
| (c) | Total investment return is not annualized. |
| (d) | In addition to the fees and expenses which the Fund bears directly, the Fund indirectly bears a pro-rata share of the fees and expenses of the Underlying Funds in which it invests. Such indirect expenses are not included in the above expense ratios. |
| | | | | | |
The notes to the financial statements are an integral part of,
and should be read in conjunction with, the financial statements. | | mainstayinvestments.com | | | 17 | |
Financial Highlights selected per share data and ratios
| | | | | | | | | | | | | | | | | | | | | | | | |
| | | Class A | |
| | | Six months
ended
April 30, | | | Year ended October 31, | |
| | | 2013* | | | 2012 | | | 2011 | | | 2010 | | | 2009 | | | 2008 | |
Net asset value at beginning of period | | $ | 10.10 | | | $ | 10.01 | | | $ | 10.04 | | | $ | 9.12 | | | $ | 7.95 | | | $ | 10.57 | |
| | | | | | | | | | | | | | | | | | | | | | | | |
Net investment income (loss) (a) | | | 0.12 | | | | 0.19 | | | | 0.22 | | | | 0.19 | | | | 0.23 | | | | 0.24 | |
Net realized and unrealized gain (loss) on investments | | | 0.63 | | | | 0.68 | | | | 0.14 | | | | 0.92 | | | | 1.15 | | | | (2.80 | ) |
| | | | | | | | | | | | | | | | | | | | | | | | |
Total from investment operations | | | 0.75 | | | | 0.87 | | | | 0.36 | | | | 1.11 | | | | 1.38 | | | | (2.56 | ) |
| | | | | | | | | | | | | | | | | | | | | | | | |
Less dividends and distributions: | | | | | | | | | | | | | | | | | | | | | | | | |
From net investment income | | | (0.28 | ) | | | (0.22 | ) | | | (0.25 | ) | | | (0.19 | ) | | | (0.21 | ) | | | (0.05 | ) |
From net realized gain on investments | | | (0.25 | ) | | | (0.56 | ) | | | (0.14 | ) | | | — | | | | — | | | | (0.01 | ) |
| | | | | | | | | | | | | | | | | | | | | | | | |
Total dividends and distributions | | | (0.53 | ) | | | (0.78 | ) | | | (0.39 | ) | | | (0.19 | ) | | | (0.21 | ) | | | (0.06 | ) |
| | | | | | | | | | | | | | | | | | | | | | | | |
Net asset value at end of period | | $ | 10.32 | | | $ | 10.10 | | | $ | 10.01 | | | $ | 10.04 | | | $ | 9.12 | | | $ | 7.95 | |
| | | | | | | | | | | | | | | | | | | | | | | | |
Total investment return (b) | | | 7.77 | %(c) | | | 9.40 | % | | | 3.54 | % | | | 12.51 | % | | | 17.85 | % | | | (24.37 | %) |
Ratios (to average net assets)/Supplemental Data: | | | | | | | | | | | | | | | | | | | | | | | | |
Net investment income (loss) | | | 2.30 | %†† | | | 1.93 | % | | | 2.18 | % | | | 2.01 | % | | | 2.78 | % | | | 2.46 | % |
Net expenses (d) | | | 0.37 | %†† | | | 0.37 | % | | | 0.37 | % | | | 0.37 | % | | | 0.37 | % | | | 0.38 | % |
Expenses (before waiver/reimbursement) (d) | | | 0.76 | %†† | | | 0.69 | % | | | 0.78 | % | | | 1.00 | % | | | 1.09 | % | | | 1.81 | % |
Portfolio turnover rate | | | 32 | % | | | 95 | % | | | 107 | % | | | 81 | % | | | 76 | % | | | 127 | % |
Net assets at end of period (in 000’s) | | $ | 7,971 | | | $ | 6,064 | | | $ | 6,358 | | | $ | 6,935 | | | $ | 6,570 | | | $ | 4,418 | |
| (a) | Per share data based on average shares outstanding during the period. |
| (b) | Total investment return is calculated exclusive of sales charges and assumes the reinvestment of dividends and distributions. |
| (c) | Total investment return is not annualized. |
| (d) | In addition to the fees and expenses which the Fund bears directly, the Fund indirectly bears a pro-rata share of the fees and expenses of the Underlying Funds in which it invests. Such indirect expenses are not included in the above expense ratios. |
| | | | |
| 18 | | MainStay Retirement 2010 Fund | | The notes to the financial statements are an integral part of,
and should be read in conjunction with, the financial statements. |
Financial Highlights selected per share data and ratios
| | | | | | | | | | | | | | | | | | | | | | | | |
| | | Class I | |
| | | Six months
ended
April 30, | | | Year ended October 31, | |
| | | 2013* | | | 2012 | | | 2011 | | | 2010 | | | 2009 | | | 2008 | |
Net asset value at beginning of period | | $ | 10.19 | | | $ | 10.08 | | | $ | 10.11 | | | $ | 9.18 | | | $ | 7.96 | | | $ | 10.58 | |
| | | | | | | | | | | | | | | | | | | | | | | | |
Net investment income (loss) (a) | | | 0.13 | | | | 0.22 | | | | 0.24 | | | | 0.22 | | | | 0.25 | | | | 0.26 | |
Net realized and unrealized gain (loss) on investments | | | 0.63 | | | | 0.69 | | | | 0.14 | | | | 0.92 | | | | 1.18 | | | | (2.81 | ) |
| | | | | | | | | | | | | | | | | | | | | | | | |
Total from investment operations | | | 0.76 | | | | 0.91 | | | | 0.38 | | | | 1.14 | | | | 1.43 | | | | (2.55 | ) |
| | | | | | | | | | | | | | | | | | | | | | | | |
Less dividends and distributions: | | | | | | | | | | | | | | | | | | | | | | | | |
From net investment income | | | (0.31 | ) | | | (0.24 | ) | | | (0.27 | ) | | | (0.21 | ) | | | (0.21 | ) | | | (0.06 | ) |
From net realized gain on investments | | | (0.25 | ) | | | (0.56 | ) | | | (0.14 | ) | | | — | | | | — | | | | (0.01 | ) |
| | | | | | | | | | | | | | | | | | | | | | | | |
Total dividends and distributions | | | (0.56 | ) | | | (0.80 | ) | | | (0.41 | ) | | | (0.21 | ) | | | (0.21 | ) | | | (0.07 | ) |
| | | | | | | | | | | | | | | | | | | | | | | | |
Net asset value at end of period | | $ | 10.39 | | | $ | 10.19 | | | $ | 10.08 | | | $ | 10.11 | | | $ | 9.18 | | | $ | 7.96 | |
| | | | | | | | | | | | | | | | | | | | | | | | |
Total investment return (b) | | | 7.85 | %(c) | | | 9.72 | % | | | 3.85 | % | | | 12.66 | % | | | 18.38 | % | | | (24.25 | %) |
Ratios (to average net assets)/Supplemental Data: | | | | | | | | | | | | | | | | | | | | | | | | |
Net investment income (loss) | | | 2.62 | %†† | | | 2.25 | % | | | 2.36 | % | | | 2.28 | % | | | 2.98 | % | | | 2.77 | % |
Net expenses (d) | | | 0.12 | %†† | | | 0.12 | % | | | 0.12 | % | | | 0.12 | % | | | 0.12 | % | | | 0.13 | % |
Expenses (before waiver/reimbursement) (d) | | | 0.51 | %†† | | | 0.44 | % | | | 0.53 | % | | | 0.76 | % | | | 0.84 | % | | | 1.51 | % |
Portfolio turnover rate | | | 32 | % | | | 95 | % | | | 107 | % | | | 81 | % | | | 76 | % | | | 127 | % |
Net assets at end of period (in 000’s) | | $ | 25,602 | | | $ | 29,583 | | | $ | 43,984 | | | $ | 35,009 | | | $ | 33,025 | | | $ | 20,105 | |
| (a) | Per share data based on average shares outstanding during the period. |
| (b) | Total investment return is calculated exclusive of sales charges and assumes the reinvestment of dividends and distributions. Class I shares are not subject to sales charges. |
| (c) | Total investment return is not annualized. |
| (d) | In addition to the fees and expenses which the Fund bears directly, the Fund indirectly bears a pro-rata share of the fees and expenses of the Underlying Funds in which it invests. Such indirect expenses are not included in the above expense ratios. |
| | | | | | |
The notes to the financial statements are an integral part of,
and should be read in conjunction with, the financial statements. | | mainstayinvestments.com | | | 19 | |
Financial Highlights selected per share data and ratios
| | | | | | | | | | | | | | | | | | | | |
| | | Class R2 | |
| | | Six months
ended
April 30, | | | Year ended October 31, | | | January 8,
2009**
through
October 31, | |
| | | 2013* | | | 2012 | | | 2011 | | | 2010 | | | 2009 | |
Net asset value at beginning of period | | $ | 10.12 | | | $ | 10.01 | | | $ | 10.05 | | | $ | 9.12 | | | $ | 7.84 | |
| | | | | | | | | | | | | | | | | | | | |
Net investment income (loss) (a) | | | 0.12 | | | | 0.18 | | | | 0.20 | | | | 0.18 | | | | 0.15 | |
Net realized and unrealized gain (loss) on investments | | | 0.62 | | | | 0.70 | | | | 0.14 | | | | 0.93 | | | | 1.13 | |
| | | | | | | | | | | | | | | | | | | | |
Total from investment operations | | | 0.74 | | | | 0.88 | | | | 0.34 | | | | 1.11 | | | | 1.28 | |
| | | | | | | | | | | | | | | | | | | | |
Less dividends and distributions: | | | | | | | | | | | | | | | | | | | | |
From net investment income | | | (0.27 | ) | | | (0.21 | ) | | | (0.24 | ) | | | (0.18 | ) | | | — | |
From net realized gain on investments | | | (0.25 | ) | | | (0.56 | ) | | | (0.14 | ) | | | — | | | | — | |
| | | | | | | | | | | | | | | | | | | | |
Total dividends and distributions | | | (0.52 | ) | | | (0.77 | ) | | | (0.38 | ) | | | (0.18 | ) | | | — | |
| | | | | | | | | | | | | | | | | | | | |
Net asset value at end of period | | $ | 10.34 | | | $ | 10.12 | | | $ | 10.01 | | | $ | 10.05 | | | $ | 9.12 | |
| | | | | | | | | | | | | | | | | | | | |
Total investment return (b) | | | 7.64 | %(c) | | | 9.33 | % | | | 3.53 | % | | | 12.37 | % | | | 16.33 | %(c)(d) |
Ratios (to average net assets)/Supplemental Data: | | | | | | | | | | | | | | | | | | | | |
Net investment income (loss) | | | 2.30 | %†† | | | 1.82 | % | | | 2.04 | % | | | 1.90 | % | | | 2.12 | %†† |
Net expenses (e) | | | 0.47 | %†† | | | 0.47 | % | | | 0.47 | % | | | 0.47 | % | | | 0.47 | %†† |
Expenses (before waiver/reimbursement) (e) | | | 0.86 | %†† | | | 0.79 | % | | | 0.88 | % | | | 1.10 | % | | | 1.18 | %†† |
Portfolio turnover rate | | | 32 | % | | | 95 | % | | | 107 | % | | | 81 | % | | | 76 | % |
Net assets at end of period (in 000’s) | | $ | 18,779 | | | $ | 16,234 | | | $ | 14,890 | | | $ | 1,781 | | | $ | 1,821 | |
| ** | Commencement of operations. |
| (a) | Per share data based on average shares outstanding during the period. |
| (b) | Total investment return is calculated exclusive of sales charges and assumes the reinvestment of dividends and distributions. Class R2 shares are not subject to sales charges. |
| (c) | Total investment return is not annualized. |
| (d) | Total investment return may reflect adjustments to conform to generally accepted accounting principles. |
| (e) | In addition to the fees and expenses which the Fund bears directly, the Fund indirectly bears a pro-rata share of the fees and expenses of the Underlying Funds in which it invests. Such indirect expenses are not included in the above expense ratios. |
| | | | |
| 20 | | MainStay Retirement 2010 Fund | | The notes to the financial statements are an integral part of,
and should be read in conjunction with, the financial statements. |
Financial Highlights selected per share data and ratios
| | | | | | | | | | | | | | | | | | | | | | | | |
| | | Class R3 | |
| | | Six months
ended
April 30, | | | Year ended October 31, | | | May 1,
2008**
through
October 31, | |
| | | 2013* | | | 2012 | | | 2011 | | | 2010 | | | 2009 | | | 2008 | |
Net asset value at beginning of period | | $ | 10.09 | | | $ | 10.00 | | | $ | 10.04 | | | $ | 9.13 | | | $ | 7.93 | | | $ | 10.07 | |
| | | | | | | | | | | | | | | | | | | | | | | | |
Net investment income (loss) (a) | | | 0.10 | | | | 0.15 | | | | 0.18 | | | | 0.16 | | | | 0.20 | | | | 0.14 | |
Net realized and unrealized gain (loss) on investments | | | 0.63 | | | | 0.69 | | | | 0.13 | | | | 0.92 | | | | 1.17 | | | | (2.28 | ) |
| | | | | | | | | | | | | | | | | | | | | | | | |
Total from investment operations | | | 0.73 | | | | 0.84 | | | | 0.31 | | | | 1.08 | | | | 1.37 | | | | (2.14 | ) |
| | | | | | | | | | | | | | | | | | | | | | | | |
Less dividends and distributions: | | | | | | | | | | | | | | | | | | | | | | | | |
From net investment income | | | (0.24 | ) | | | (0.19 | ) | | | (0.21 | ) | | | (0.17 | ) | | | (0.17 | ) | | | — | |
From net realized gain on investments | | | (0.25 | ) | | | (0.56 | ) | | | (0.14 | ) | | | — | | | | — | | | | — | |
| | | | | | | | | | | | | | | | | | | | | | | | |
Total dividends and distributions | | | (0.49 | ) | | | (0.75 | ) | | | (0.35 | ) | | | (0.17 | ) | | | (0.17 | ) | | | — | |
| | | | | | | | | | | | | | | | | | | | | | | | |
Net asset value at end of period | | $ | 10.33 | | | $ | 10.09 | | | $ | 10.00 | | | $ | 10.04 | | | $ | 9.13 | | | $ | 7.93 | |
| | | | | | | | | | | | | | | | | | | | | | | | |
Total investment return (b) | | | 7.59 | %(c) | | | 9.05 | % | | | 3.18 | % | | | 11.99 | % | | | 17.62 | % | | | (21.25 | %)(c) |
Ratios (to average net assets)/Supplemental Data: | | | | | | | | | | | | | | | | | | | | | | | | |
Net investment income (loss) | | | 2.07 | %†† | | | 1.55 | % | | | 1.82 | % | | | 1.67 | % | | | 2.47 | % | | | 3.25 | % †† |
Net expenses (d) | | | 0.72 | %†† | | | 0.72 | % | | | 0.72 | % | | | 0.72 | % | | | 0.72 | % | | | 0.73 | % †† |
Expenses (before waiver/reimbursement) (d) | | | 1.11 | %†† | | | 1.04 | % | | | 1.13 | % | | | 1.35 | % | | | 1.44 | % | | | 1.86 | % †† |
Portfolio turnover rate | | | 32 | % | | | 95 | % | | | 107 | % | | | 81 | % | | | 76 | % | | | 127 | % |
Net assets at end of period (in 000’s) | | $ | 870 | | | $ | 867 | | | $ | 735 | | | $ | 866 | | | $ | 996 | | | $ | 887 | |
| ** | Commencement of operations. |
| (a) | Per share data based on average shares outstanding during the period. |
| (b) | Total investment return is calculated exclusive of sales charges and assumes the reinvestment of dividends and distributions. Class R3 shares are not subject to sales charges. |
| (c) | Total investment return is not annualized. |
| (d) | In addition to the fees and expenses which the Fund bears directly, the Fund indirectly bears a pro-rata share of the fees and expenses of the Underlying Funds in which it invests. Such indirect expenses are not included in the above expense ratios. |
| | | | | | |
The notes to the financial statements are an integral part of,
and should be read in conjunction with, the financial statements. | | mainstayinvestments.com | | | 21 | |
MainStay Retirement 2020 Fund
Investment and Performance Comparison1 (Unaudited)
Performance data quoted represents past performance. Past performance is no guarantee of future results. Because of market volatility, current performance may be lower or higher than the figures shown. Investment return and principal value will fluctuate, and as a result, when shares are redeemed, they may be worth more or less than their original cost. The graph below depicts the historical performance of Class I shares of the Fund. Performance will vary from class to class based on differences in class-specific expenses and sales charges. For performance information current to the most recent month-end, please call 800-MAINSTAY (624-6782) or visit mainstayinvestments.com.
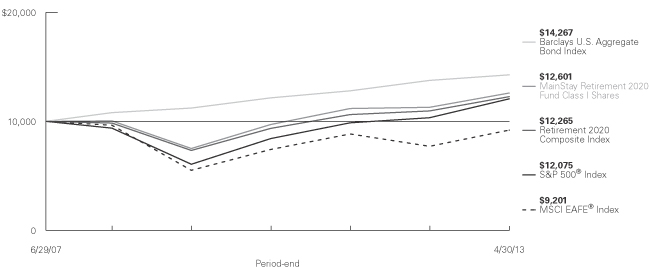
Average Annual Total Returns for the Period Ended April 30, 2013
| | | | | | | | | | | | | | | | | | | | | | | | |
| Class | | Sales Charge | | | | Six Months | | | One Year | | | Five Years | | | Since
Inception
(6/29/07) | | | Gross Expense Ratio2 | |
| Investor Class Shares3 | | Maximum 5.5% Initial Sales Charge | | With sales charges Excluding sales charges | |
| 3.34
9.35 | %
| |
| 5.19
11.31 | %
| |
| 3.13
4.30 | %
| |
| 2.71
3.71 | %
| |
| 1.56
1.56 | %
|
| Class A Shares | | Maximum 5.5% Initial Sales Charge | | With sales charges Excluding sales charges | |
| 3.42
9.44 |
| |
| 5.27
11.40 |
| |
| 3.21
4.39 |
| |
| 2.80
3.80 |
| |
| 1.35
1.35 |
|
| Class I Shares | | No Sales Charge | | | | | 9.47 | | | | 11.66 | | | | 4.64 | | | | 4.04 | | | | 1.10 | |
| Class R1 Shares4 | | No Sales Charge | | | | | 9.52 | | | | 11.57 | | | | 4.55 | | | | 3.96 | | | | 1.20 | |
| Class R2 Shares5 | | No Sales Charge | | | | | 9.33 | | | | 11.28 | | | | 4.29 | | | | 3.71 | | | | 1.45 | |
| Class R3 Shares6 | | No Sales Charge | | | | | 9.20 | | | | 10.92 | | | | 4.01 | | | | 3.42 | | | | 1.70 | |
| 1. | The performance table and graph do not reflect the deduction of taxes that a shareholder would pay on dividends, distributions or Fund share redemptions. Total returns reflect maximum applicable sales charges as indicated in the table above, changes in share price, and reinvestment of dividend and capital gain distributions. The graph assumes the initial investment amount shown above and reflects the deduction of all sales charges that would have applied for the period of investment. Performance figures reflect certain fee waivers and/or expense limitations, without which total returns may have been lower. For more information on share classes and current fee waivers and/or expense limitations, please refer to the notes to the financial statements. |
| 2. | The gross expense ratios presented reflect the Fund’s “Total Annual Fund Operating Expenses” from the most recent Prospectus and may differ from other expense ratios disclosed in this report. |
| 3. | Performance figures for Investor Class shares, first offered on February 28, 2008, include the historical performance of Class A shares through February 27, 2008, adjusted for differences in certain expenses and fees. Unadjusted, the performance shown for Investor Class shares would likely have been different. |
| 4. | Class R1 shares were first offered to the public on June 29, 2007, although this class has not yet commenced operations as of April 30, 2013. As a result, the performance for Class R1 shares include the historical performance of Class A shares through April 30, 2013, adjusted for differences in certain expenses and fees. Unadjusted, the performance shown for the Class R1 shares would likely have been different. |
| 5. | Class R2 shares were first offered on June 29, 2007, although this class did not commence investment operations until January 8, 2009. Performance figures for Class R2 shares include the historical performance of Class A shares through January 7, 2009, adjusted for differences in certain expenses and fees. Unadjusted, the performance shown for Class R2 shares would likely have been different. |
| 6. | Class R3 shares were first offered on June 29, 2007, although this class did not commence investment operations until May 1, 2008. Performance figures for Class R3 shares include the historical performance of Class A shares through April 30, 2008, adjusted for differences in expenses and fees. Unadjusted, the performance shown for the Class R3 shares would likely have been different. |
The footnotes on the next page are an integral part of the table and graph and should be carefully read in conjunction with them.
| | |
| 22 | | MainStay Retirement 2020 Fund |
| | | | | | | | | | | | | | | | |
| Benchmark Performance | | Six
Months | | | One
Year | | | Five
Years | | | Since
Inception | |
S&P 500® Index7 | | | 14.42 | % | | | 16.89 | % | | | 5.21 | % | | | 3.29 | % |
MSCI EAFE® Index8 | | | 16.90 | | | | 19.39 | | | | –0.93 | | | | –1.42 | |
Barclays U.S. Aggregate Bond Index9 | | | 0.90 | | | | 3.68 | | | | 5.72 | | | | 6.28 | |
Retirement 2020 Composite Index10 | | | 9.09 | | | | 11.86 | | | | 4.48 | | | | 3.56 | |
Average Lipper Mixed-Asset Target 2020 Fund11 | | | 7.62 | | | | 9.90 | | | | 3.68 | | | | 2.59 | |
| 7. | “S&P 500®” is a trademark of The McGraw-Hill Companies, Inc. The S&P 500® Index is widely regarded as the standard index for measuring large-cap U.S. stock market performance. The S&P 500 Index is the broad-based securities market index. Results assume reinvestment of all income and capital gains. An investment cannot be made directly in an index. |
| 8. | The MSCI EAFE® Index consists of international stocks representing the developed world outside of North America. The MSCI EAFE® Index is the Fund’s secondary benchmark. Results assume reinvestment of all income and capital gains. An investment cannot be made directly in an index. |
| 9. | The Barclays U.S. Aggregate Bond Index is a broad-based benchmark that measures the investment grade, U.S. dollar-denominated, fixed-rate taxable bond market, including Treasurys, government-related and corporate securities, mortgage-backed securities (agency fixed-rate and hybrid adjustable rate mortgage pass-throughs), asset-backed securities, and commercial mortgage-backed securities. The Fund has selected the Barclays U.S. Aggregate Bond Index as an additional benchmark. Results |
| | assume reinvestment of all income and capital gains. An investment cannot be made directly in an index. |
| 10. | The Retirement 2020 Composite Index consists of the S&P 500® Index, the MSCI EAFE® Index and the Barclays U.S. Aggregate Bond Index weighted according to the Fund’s current allocation, changing annually through the target retirement date. The Fund has selected the Retirement 2020 Composite Index as an additional benchmark. Total returns assume reinvestment of all dividends and capital gains. An investment cannot be made directly in an index. |
| 11. | The average Lipper mixed-asset target 2020 fund is representative of funds that seek to maximize assets for retirement or other purposes with an expected time horizon from January 1, 2016, to December 31, 2020. This benchmark is a product of Lipper Inc. Lipper Inc. is an independent monitor of fund performance. Results are based on average total returns of similar funds with all dividend and capital gain distributions reinvested. |
The footnotes on the preceding page are an integral part of the table and graph and should be carefully read in conjunction with them.
| | | | |
| mainstayinvestments.com | | | 23 | |
Cost in Dollars of a $1,000 Investment in MainStay Retirement 2020 Fund (Unaudited)
The example below is intended to describe the fees and expenses borne by shareholders during the six-month period from November 1, 2012, to April 30, 2013, and the impact of those costs on your investment.
Example
As a shareholder of the Fund, you incur two types of costs: (1) transaction costs, including exchange fees and sales charges (loads) on purchases (as applicable), and (2) ongoing costs, including management fees, distribution and/or service (12b-1) fees, and other Fund expenses (as applicable). This example is intended to help you understand your ongoing costs (in dollars) of investing in the Fund and to compare these costs with the ongoing costs of investing in other mutual funds. The example is based on an investment of $1,000 made at the beginning of the six-month period and held for the entire period from November 1, 2012, to April 30, 2013.
This example illustrates your Fund’s ongoing costs in two ways:
Actual Expenses
The second and third data columns in the table below provide information about actual account values and actual expenses. You may use the information in these columns, together with the amount you invested, to estimate the expenses that you paid during the six months ended April 30, 2013. Simply divide your account value by $1,000 (for example, an $8,600 account value divided by $1,000 = 8.6), then
multiply the result by the number under the heading entitled “Expenses Paid During Period” to estimate the expenses you paid on your account during this period.
Hypothetical Example for Comparison Purposes
The fourth and fifth data columns in the table below provide information about hypothetical account values and hypothetical expenses based on the Fund’s actual expense ratio and an assumed rate of return of 5% per year before expenses, which is not the Fund’s actual return. The hypothetical account values and expenses may not be used to estimate the actual ending account balances or expenses you paid for the six-month period shown. You may use this information to compare the ongoing costs of investing in the Fund with the ongoing costs of investing in other Funds. To do so, compare this 5% hypothetical example with the 5% hypothetical examples that appear in the shareholder reports of the other Funds.
Please note that the expenses shown in the table are meant to highlight your ongoing costs only and do not reflect any transactional costs, such as exchange fees or sales charges (loads). Therefore, the fourth and fifth data columns of the table are useful in comparing ongoing costs only and will not help you determine the relative total costs of owning different funds. In addition, if these transactional costs were included, your costs would have been higher.
| | | | | | | | | | | | | | | | | | | | |
| | | | | | | | | | | | | | | | |
| Share Class | | Beginning
Account
Value
11/1/12 | | | Ending Account
Value (Based
on Actual
Returns and
Expenses)
4/30/13 | | | Expenses
Paid
During
Period1 | | | Ending Account
Value (Based
on Hypothetical
5% Annualized
Return and
Actual Expenses)
4/30/13 | | | Expenses
Paid
During
Period1 | |
| | | | | |
| Investor Class Shares | | $ | 1,000.00 | | | $ | 1,093.50 | | | $ | 2.44 | | | $ | 1,022.50 | | | $ | 2.36 | |
| | | | | |
| Class A Shares | | $ | 1,000.00 | | | $ | 1,094.40 | | | $ | 1.92 | | | $ | 1,023.00 | | | $ | 1.86 | |
| | | | | |
| Class I Shares | | $ | 1,000.00 | | | $ | 1,094.70 | | | $ | 0.62 | | | $ | 1,024.20 | | | $ | 0.60 | |
| | | | | |
| Class R2 Shares | | $ | 1,000.00 | | | $ | 1,093.30 | | | $ | 2.44 | | | $ | 1,022.50 | | | $ | 2.36 | |
| | | | | |
| Class R3 Shares | | $ | 1,000.00 | | | $ | 1,092.00 | | | $ | 3.73 | | | $ | 1,021.20 | | | $ | 3.61 | |
| 1. | Expenses are equal to the Fund’s annualized expense ratio of each class (0.47% for Investor Class, 0.37% for Class A, 0.12% for Class I, 0.47% for Class R2 and 0.72% for Class R3) multiplied by the average account value over the period, divided by 365 and multiplied by 181 (to reflect the six-month period). The table above represents the actual expenses incurred during the six-month period. In addition to the fees and expenses which the Fund bears directly, the Fund indirectly bears a pro rata share of the fees and expenses of the Underlying Funds in which it invests. Such indirect expenses are not included in the above-reported expense figures. |
| | |
| 24 | | MainStay Retirement 2020 Fund |
Investment Objectives of Underlying Funds as of April 30, 2013 (Unaudited)
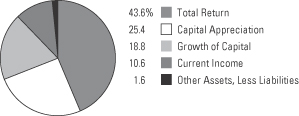
See Portfolio of Investments beginning on page 29 for specific holdings within these categories.
| | | | |
| mainstayinvestments.com | | | 25 | |
Portfolio Management Discussion and Analysis (Unaudited)
Questions answered by portfolio managers Jae S. Yoon, CFA, Jonathan Swaney and Poul Kristensen, CFA, of New York Life Investments.1
How did MainStay Retirement 2020 Fund perform relative to its peers and its benchmark during the six months ended April 30, 2013?
Excluding all sales charges, MainStay Retirement 2020 Fund returned 9.35% for Investor Class shares and 9.44% for Class A shares for the six months ended April 30, 2013. Over the same period, Class I shares returned 9.47%, Class R1 shares2 returned 9.52%, Class R2 shares returned 9.33% and Class
R3 shares returned 9.20%. All share classes outperformed the 7.62% return of the average Lipper3 mixed-asset target 2020 fund for the six months ended April 30, 2013. Over the same period, all share classes underperformed the 14.42% return
of the S&P 500® Index4 and the 16.90% return of the MSCI EAFE® Index.5 The S&P 500® Index is the Fund’s broad-based securities-market index, and the MSCI EAFE® Index is the secondary benchmark of the Fund. All share classes outper-
formed the 0.90% return of the Barclays U.S. Aggregate Bond Index6 and the 9.09% return of the Retirement 2020 Composite Index7 for the six months ended April 30, 2013. The Barclays U.S. Aggregate Bond Index and the Retirement 2020 Com-
posite Index are additional benchmarks of the Fund. See page 22 for Fund returns with applicable sales charges.
Were there any changes to the Fund during the reporting period?
Effective February 28, 2013, the Fund’s Principal Investment Strategies were modified to broaden the investment ranges for each of the asset classes in which the Fund may invest by an additional ten percentage points. Also effective February 28, 2013, Poul Kristensen, CFA, was added as a portfolio manager. Please see the Prospectus dated February 28, 2013, for more information.
What factors affected the Fund’s relative performance during the reporting period?
The Fund invests primarily in mutual funds managed by New York Life Investments, mutual funds managed by an advisor not affiliated with New York Life Investments or exchange traded funds (“ETFs”), if a New York Life Investments managed mutual fund in a particular asset class is not available (collectively, “Underlying Funds”). The Underlying Funds may invest in fixed-income securities or in domestic or international stocks at various capitalization levels. The Fund’s primary benchmark, on the other hand, consists entirely of U.S. large-cap stocks. These differences—particularly the Fund’s substantial allocation to Underlying Funds that invest in fixed-income securities—
accounted for many of the challenges the Fund experienced in terms of relative performance.
Returns for the reporting period were slightly better than the Retirement 2020 Composite Index and better than those of the average peer fund. The Fund’s asset-allocation policy was largely a wash. We maintained a neutral blend at the start of the reporting period, then moved aggressively to overweight equities during the latter half of the fourth quarter. This proved to be a very profitable strategy, although the benefit was almost entirely offset by a heavy allocation to emerging-market stocks, an emphasis on large-cap stocks rather than small-cap stocks, and a bias toward U.S. equities over those of other developed nations. In the fixed-income portion of the Fund, a bias toward lower-quality bond offerings aided performance. Our decision to keep duration8 short in the fixed-income portion of the Fund had no meaningful impact on the Fund’s performance.
Performance of the Underlying Funds also influenced relative results. Relying on MainStay Large Cap Growth Fund more heavily than MainStay Cornerstone Growth Fund proved beneficial. Other positive contributors in the equity portion of the
Fund included MainStay MAP Fund and MainStay U.S. Small Cap Fund. All told, the performance of all Underlying Funds contributed positively—but not significantly—to relative performance.
How did you allocate the Fund’s assets during the reporting period and why?
We considered a variety of information, including the portfolio-level characteristics of the Underlying Funds, such as capitalization, style biases, sector exposures, credit quality and duration. We also examined the attributes of the Underlying Funds’ holdings, such as valuation metrics, earnings data and technical indicators. Finally, we evaluated the historical success of the managers responsible for the Underlying Funds. Generally speaking, we seek to invest in Underlying Funds that occupy attractively valued segments of the market, invest in fairly priced securities and are steered by individuals who have consistently demonstrated capable management in the past.
The Fund’s allocations to stocks and bonds varied over the course of the reporting period in response to the changing environment. We believed that equities presented a sizable valuation advantage over bonds and that corporate profit gains would help propel stock prices higher. For these reasons, we gave the Fund a decisive tilt in favor of stocks over bonds
| 1. | “New York Life Investments” is a service mark used by New York Life Investment Management LLC. |
| 2. | See footnote on page 22 for more information on Class R1 shares. |
| 3. | See footnote on page 23 for more information on Lipper Inc. |
| 4. | See footnote on page 23 for more information on the S&P 500® Index. |
| 5. | See footnote on page 23 for more information on the MSCI EAFE® Index. |
| 6. | See footnote on page 23 for more information on the Barclays U.S. Aggregate Bond Index. |
| 7. | See footnote on page 23 for more information on the Retirement 2020 Composite Index. |
| 8. | Duration is a measure of the price sensitivity of a fixed-income investment to changes in interest rates. Duration is expressed as a number of years and is considered a more accurate sensitivity gauge than average maturity. |
| | |
| 26 | | MainStay Retirement 2020 Fund |
throughout most of the reporting period. Within the equity portion of the Fund, we maintained a bias in favor of Underlying Funds that invest in U.S. stocks over Underlying Funds that invest in stocks traded in other developed markets. We were particularly concerned about countries that are likely to struggle with deleveraging issues even greater than those presented in the United States. Results were mixed, as Japan in particular experienced very strong returns on the back of aggressive fiscal and monetary policy changes. The Fund was also significantly overweight in emerging-market economies because we believed that these markets would benefit most from gradually strengthening global economic growth. During the reporting period, however, that posture detracted significantly from performance, as emerging-market stocks generally trailed stocks in developed markets by a wide margin.
In the fixed-income portion of the Fund, we continued to maintain a shorter duration than the Barclays U.S. Aggregate Bond Index. We also tilted the fixed-income portion of the Fund decidedly toward Underlying Funds that invest in corporate bonds over those that invest primarily in government-backed issues. This positioning reflected our opinion that high-grade bonds were very expensive and that issues from corporate borrowers deemed to be of lower quality represented a far more attractive proposition. Given ample liquidity and healthy corporate balance sheets, we believed that default rates were likely to remain low. We also believed that investors were likely to find the higher yields available from corporate debt quite attractive compared to the yields available on U.S. Treasury instruments.
How did the Fund’s allocations change over the course of the reporting period?
Position sizes naturally fluctuate with changing market conditions, and such changes do not always reflect an explicit change in our strategic or tactical point of view. That said, many of the most notable allocation changes during the reporting period were associated with the expanding list of eligible investments, as several new MainStay Funds became available. MainStay Short Duration High Yield Fund was one such product. The Fund selected this Underlying Fund as part of an ongoing effort to protect against a potential rise in interest rates. We quickly built the Fund’s position after the Underlying Fund’s launch in December 2012. The purchases were made with proceeds from MainStay High Yield Corporate Bond Fund and MainStay Floating Rate Fund.
MainStay Cornerstone Growth Fund was another new product. We established a position in this Underlying Fund using proceeds from MainStay Large Cap Growth Fund as we sought to widen strategy diversification within that portion of the market.
A new holding was established in MainStay High Yield Municipal Bond Fund, which further diversified sources of credit risk within the fixed-income portion of the Fund. We believed that high-yield municipal bonds would be attractive despite the inapplic-
ability of tax benefits usually associated with these types of instruments.
There were two other changes of note. First, we increased the Fund’s position in MainStay U.S. Small Cap Fund as we unwound the Fund’s previous large-cap bias. The increased allocation was funded from a mix of Underlying Equity Funds. Second, we increased the Fund’s position in MainStay Common Stock Fund, as the strategy employed in that Underlying Fund has proven very effective in the post–credit crisis environment.
During the reporting period, which Underlying Equity Funds had the highest total returns and which Underlying Equity Funds had the lowest total returns?
MainStay International Opportunities Fund (formerly MainStay 130/30 International Fund) generated the highest absolute return by a comfortable margin, followed by MainStay U.S. Small Cap Fund. Although none of the Underlying Equity Funds in which the Fund invested provided negative returns for the reporting period, the lowest absolute returns in the equity portion of the Fund came from MainStay Cornerstone Growth Fund and Vanguard FTSE Emerging Markets ETF.
Which Underlying Equity Funds made the strongest positive contributions to the Fund’s overall performance, and which Underlying Equity Funds were the greatest detractors?
Because contributions take weightings and total returns into account and position sizes may vary, the Underlying Funds with the highest (or lowest) returns may not always have the most significantly positive (or negative) contributions to performance.
During the reporting period, large positions in MainStay MAP Fund and MainStay Large Cap Growth Fund made the largest positive contributions to the Fund’s overall performance. Although none of the Underlying Equity Funds in which the Fund invested had negative total returns, the smallest contributions came from a new position being built in MainStay Cornerstone Growth Fund and from a small position in MainStay International Equity Fund.
What factors and risks affected the Fund’s Underlying Fixed Income Fund investments during the reporting period?
Monetary policy continued to play a significant role in fixed-income markets, as has been the case for several years. Faced with persistently sluggish economic growth, slow rates of job creation and the prospect of significant fiscal drag, the Federal Reserve elected to extend its large-scale asset purchase program indefinitely. This decision helped keep interest rates close to their all-time lows. During the reporting period, the Fund favored Underlying Fixed Income Funds that invest in higher-yielding corporate bonds over those that invest primarily in
government-backed issues. This strategy proved fortunate.
| | | | |
| mainstayinvestments.com | | | 27 | |
Credit performed quite well as default rates remained low and the comparatively higher yields of these bonds attracted many buyers.
During the reporting period, which fixed-income market segments were strong performers and which segments were particularly weak?
High-yield corporate bonds performed exceptionally well as spreads9 to U.S. Treasurys continued to contract. The lowest returns came from the most liquid, highest-quality and shortest-term debt instruments. Cash returned nothing, and returns on short-term U.S. government debt and AAA bonds were only slightly higher.
Which Underlying Fixed Income Funds made the strongest positive contributions to the Fund’s performance, and which Underlying Fixed Income Funds were the greatest detractors?
The largest contributions to the fixed-income portion of the Fund came from MainStay Floating Rate Fund and a much larger position in MainStay Intermediate Term Bond Fund. The contribution from positions in a variety of other Underlying Fixed Income Funds, including MainStay Money Market Fund and MainStay Indexed Bond Fund, was effectively zero.
| 9. | The terms “spread” and “yield spread” may refer to the difference in yield between a security or type of security and comparable U.S. Treasury issues. The terms may also refer to the difference in yield between two specific securities or types of securities at a given time. |
The opinions expressed are those of the portfolio managers as of the date of this report and are subject to change. There is no guarantee that any forecast made will come to pass. This material does not constitute investment advice and is not intended as an endorsement of any specific investment.
| | |
| 28 | | MainStay Retirement 2020 Fund |
Portfolio of Investments April 30, 2013 (Unaudited)
| | | | | | | | |
| | |
| | | Shares | | | Value | |
| Affiliated Investment Companies 87.9%† | |
Equity Funds 51.9% | |
MainStay Common Stock Fund Class I (a) | | | 560,270 | | | $ | 8,241,575 | |
MainStay Cornerstone Growth Fund Class I | | | 62,632 | | | | 1,869,569 | |
MainStay Epoch International Small Cap Fund Class I | | | 91,686 | | | | 1,853,894 | |
MainStay Epoch U.S. All Cap Fund Class I | | | 250,881 | | | | 6,312,156 | |
MainStay ICAP Equity Fund Class I | | | 137,883 | | | | 6,221,263 | |
MainStay ICAP International Fund Class I | | | 104,291 | | | | 3,382,153 | |
MainStay ICAP Select Equity Fund Class I | | | 13,448 | | | | 579,195 | |
MainStay International Equity Fund Class I | | | 114,850 | | | | 1,448,263 | |
MainStay Large Cap Growth Fund Class I | | | 533,769 | | | | 4,707,841 | |
MainStay MAP Fund Class I | | | 295,219 | | | | 11,755,617 | |
MainStay S&P 500 Index Fund Class I | | | 152,340 | | | | 5,653,334 | |
| | | | | | | | |
Total Equity Funds
(Cost $41,567,725) | | | | 52,024,860 | |
| | | | | | | | |
|
Fixed Income Funds 36.0% | |
MainStay Floating Rate Fund Class I | | | 491,896 | | | | 4,751,715 | |
MainStay High Yield Corporate Bond Fund Class I | | | 127,451 | | | | 792,745 | |
MainStay High Yield Municipal Bond Fund Class I | | | 80,638 | | | | 978,949 | |
MainStay Indexed Bond Fund Class I | | | 396,317 | | | | 4,494,240 | |
MainStay Intermediate Term Bond Fund Class I | | | 1,872,494 | | | | 20,840,858 | |
MainStay Money Market Fund Class A | | | 2,552,554 | | | | 2,552,554 | |
MainStay Short Duration High Yield Fund Class I | | | 154,056 | | | | 1,551,346 | |
MainStay Short Term Bond Fund Class I | | | 14,599 | | | | 140,441 | |
| | | | | | | | |
Total Fixed Income Funds
(Cost $35,219,907) | | | | 36,102,848 | |
| | | | | | | | |
Total Affiliated Investment Companies
(Cost $76,787,632) | | | | 88,127,708 | |
| | | | | | | | |
| | | | | | | | |
| | |
| | | Shares | | | Value | |
| Unaffiliated Investment Companies 10.5% | |
Equity Funds 8.1% | | | | | | | | |
iShares Russell 2000 Index ETF | | | 27,049 | | | $ | 2,546,393 | |
Vanguard Emerging Markets ETF | | | 126,917 | | | | 5,553,888 | |
| | | | | | | | |
Total Equity Funds
(Cost $7,446,392) | | | | 8,100,281 | |
| | | | | | | | |
| | |
Fixed Income Funds 2.4% | | | | | | | | |
iShares Barclays TIPS Bond Fund ETF | | | 10,521 | | | | 1,285,140 | |
Market Vectors Emerging Markets Local Currency Bond ETF | | | 41,921 | | | | 1,156,600 | |
| | | | | | | | |
Total Fixed Income Funds
(Cost $2,269,338) | | | | 2,441,740 | |
| | | | | | | | |
Total Unaffiliated Investment Companies
(Cost $9,715,730) | | | | 10,542,021 | |
| | | | | | | | |
Total Investments
(Cost $86,503,362) (b) | | | 98.4 | % | | | 98,669,729 | |
Other Assets, Less Liabilities | | | 1.6 | | | | 1,643,762 | |
Net Assets | | | 100.0 | % | | $ | 100,313,491 | |
| † | Percentages indicated are based on Fund net assets. |
| (a) | The Fund’s ownership exceeds 5% of the outstanding shares of the Underlying Fund’s share class. (See Note 3) |
| (b) | As of April 30, 2013, cost is $87,583,231 for federal income tax purposes and net unrealized appreciation is as follows: |
| | | | |
Gross unrealized appreciation | | $ | 12,194,686 | |
Gross unrealized depreciation | | | (1,108,188 | ) |
| | | | |
Net unrealized appreciation | | $ | 11,086,498 | |
| | | | |
The following abbreviations are used in the above portfolio:
ETF—Exchange Traded Fund
TIPS—Treasury Inflation Protected Security
| | | | | | |
The notes to the financial statements are an integral part of,
and should be read in conjunction with, the financial statements. | | mainstayinvestments.com | | | 29 | |
Portfolio of Investments April 30, 2013 (Unaudited) (continued)
The following is a summary of the fair valuations according to the inputs used as of April 30, 2013, for valuing the Fund’s assets.
Asset Valuation Inputs
| | | | | | | | | | | | | | | | |
Description | | Quoted
Prices in
Active
Markets for
Identical
Assets
(Level 1) | | | Significant
Other
Observable
Inputs
(Level 2) | | | Significant
Unobservable
Inputs
(Level 3) | | | Total | |
| Investments (a) | | | | | | | | | | | | | | | | |
| Affiliated Investment Companies | | | | | | | | | | | | | | | | |
Equity Funds | | $ | 52,024,860 | | | $ | — | | | $ | — | | | $ | 52,024,860 | |
Fixed Income Funds | | | 36,102,848 | | | | — | | | | — | | | | 36,102,848 | |
| | | | | | | | | | | | | | | | |
| Total Affiliated Investment Companies | | | 88,127,708 | | | | — | | | | — | | | | 88,127,708 | |
| | | | | | | | | | | | | | | | |
| Unaffiliated Investment Companies | | | | | | | | | | | | | | | | |
Equity Funds | | | 8,100,281 | | | | — | | | | — | | | | 8,100,281 | |
Fixed Income Funds | | | 2,441,740 | | | | — | | | | — | | | | 2,441,740 | |
| | | | | | | | | | | | | | | | |
| Total Unaffiliated Investment Companies | | | 10,542,021 | | | | — | | | | — | | | | 10,542,021 | |
| | | | | | | | | | | | | | | | |
| Total Investments | | $ | 98,669,729 | | | $ | — | | | $ | — | | | $ | 98,669,729 | |
| | | | | | | | | | | | | | | | |
| (a) | For a complete listing of investments, see the Portfolio of Investments. |
The Fund recognizes transfers between the levels as of the beginning of the period.
For the period ended April 30, 2013, the Fund did not have any transfers between Level 1 and Level 2 fair value measurements. (See Note 2)
As of April 30, 2013, the Fund did not hold any investments with significant unobservable inputs (Level 3). (See Note 2)
| | | | |
| 30 | | MainStay Retirement 2020 Fund | | The notes to the financial statements are an integral part of,
and should be read in conjunction with, the financial statements. |
Statement of Assets and Liabilities as of April 30, 2013 (Unaudited)
| | | | |
| Assets | |
Investment in affiliated investment companies, at value (identified cost $76,787,632) | | $ | 88,127,708 | |
Investments in unaffiliated investment companies, at value (identified cost $9,715,730) | | | 10,542,021 | |
Cash | | | 4,390 | |
Receivables: | | | | |
Fund shares sold | | | 1,684,496 | |
Manager (See Note 3) | | | 7,412 | |
Other assets | | | 31,746 | |
| | | | |
Total assets | | | 100,397,773 | |
| | | | |
|
| Liabilities | |
Payables: | | | | |
Fund shares redeemed | | | 29,093 | |
Transfer agent (See Note 3) | | | 19,681 | |
Professional fees | | | 14,854 | |
NYLIFE Distributors (See Note 3) | | | 10,333 | |
Shareholder communication | | | 6,580 | |
Custodian | | | 1,361 | |
Trustees | | | 256 | |
Accrued expenses | | | 2,124 | |
| | | | |
Total liabilities | | | 84,282 | |
| | | | |
Net assets | | $ | 100,313,491 | |
| | | | |
|
| Composition of Net Assets | |
Shares of beneficial interest outstanding (par value of $.001 per share) unlimited number of shares authorized | | $ | 9,927 | |
Additional paid-in capital | | | 86,582,008 | |
| | | | |
| | | 86,591,935 | |
Undistributed net investment income | | | 159,492 | |
Accumulated net realized gain (loss) on investments | | | 1,395,697 | |
Net unrealized appreciation (depreciation) on investments | | | 12,166,367 | |
| | | | |
Net assets | | $ | 100,313,491 | |
| | | | |
| | | | |
Investor Class | | | | |
Net assets applicable to outstanding shares | | $ | 4,877,696 | |
| | | | |
Shares of beneficial interest outstanding | | | 483,127 | |
| | | | |
Net asset value per share outstanding | | $ | 10.10 | |
Maximum sales charge (5.50% of offering price) | | | 0.59 | |
| | | | |
Maximum offering price per share outstanding | | $ | 10.69 | |
| | | | |
Class A | | | | |
Net assets applicable to outstanding shares | | $ | 14,830,525 | |
| | | | |
Shares of beneficial interest outstanding | | | 1,471,863 | |
| | | | |
Net asset value per share outstanding | | $ | 10.08 | |
Maximum sales charge (5.50% of offering price) | | | 0.59 | |
| | | | |
Maximum offering price per share outstanding | | $ | 10.67 | |
| | | | |
Class I | | | | |
Net assets applicable to outstanding shares | | $ | 49,781,684 | |
| | | | |
Shares of beneficial interest outstanding | | | 4,915,108 | |
| | | | |
Net asset value and offering price per share outstanding | | $ | 10.13 | |
| | | | |
Class R2 | | | | |
Net assets applicable to outstanding shares | | $ | 28,673,740 | |
| | | | |
Shares of beneficial interest outstanding | | | 2,842,715 | |
| | | | |
Net asset value and offering price per share outstanding | | $ | 10.09 | |
| | | | |
Class R3 | | | | |
Net assets applicable to outstanding shares | | $ | 2,149,846 | |
| | | | |
Shares of beneficial interest outstanding | | | 213,694 | |
| | | | |
Net asset value and offering price per share outstanding | | $ | 10.06 | |
| | | | |
| | | | | | |
The notes to the financial statements are an integral part of,
and should be read in conjunction with, the financial statements. | | mainstayinvestments.com | | | 31 | |
Statement of Operations for the six months ended April 30, 2013 (Unaudited)
| | | | |
| Investment Income (Loss) | |
Income | | | | |
Dividend distributions from affiliated investment companies | | $ | 1,163,358 | |
Dividend distributions from unaffiliated investment companies | | | 99,760 | |
| | | | |
Total income | | | 1,263,118 | |
| | | | |
Expenses | | | | |
Distribution/Service—Investor Class (See Note 3) | | | 5,316 | |
Distribution/Service—Class A (See Note 3) | | | 16,558 | |
Distribution/Service—Class R2 (See Note 3) | | | 32,462 | |
Distribution/Service—Class R3 (See Note 3) | | | 5,295 | |
Transfer agent (See Note 3) | | | 56,710 | |
Manager (See Note 3) | | | 45,479 | |
Registration | | | 34,442 | |
Professional fees | | | 14,284 | |
Shareholder service (See Note 3) | | | 14,044 | |
Shareholder communication | | | 8,825 | |
Custodian | | | 3,419 | |
Trustees | | | 1,066 | |
Miscellaneous | | | 4,483 | |
| | | | |
Total expenses before waiver/reimbursement | | | 242,383 | |
Expense waiver/reimbursement from Manager (See Note 3) | | | (109,736 | ) |
| | | | |
Net expenses | | | 132,647 | |
| | | | |
Net investment income (loss) | | | 1,130,471 | |
| | | | |
|
| Realized and Unrealized Gain (Loss) on Investments | |
Net realized gain (loss) on: | | | | |
Affiliated investment company transactions | | | 1,704,433 | |
Unaffiliated investment company transactions | | | (6,270 | ) |
Realized capital gain distributions from affiliated investment companies | | | 777,504 | |
| | | | |
Net realized gain (loss) on investments from affiliated and unaffiliated investment companies | | | 2,475,667 | |
| | | | |
Net change in unrealized appreciation (depreciation) on investments | | | 4,511,785 | |
| | | | |
Net realized and unrealized gain (loss) on investments | | | 6,987,452 | |
| | | | |
Net increase (decrease) in net assets resulting from operations | | $ | 8,117,923 | |
| | | | |
| | | | |
| 32 | | MainStay Retirement 2020 Fund | | The notes to the financial statements are an integral part of,
and should be read in conjunction with, the financial statements. |
Statements of Changes in Net Assets
for the six months ended April 30, 2013 (Unaudited) and the year ended October 31, 2012
| | | | | | | | |
| | | 2013 | | | 2012 | |
| Increase (Decrease) in Net Assets | |
Operations: | | | | | | | | |
Net investment income (loss) | | $ | 1,130,471 | | | $ | 1,940,582 | |
Net realized gain (loss) on investments from affiliated and unaffiliated investment companies transactions | | | 2,475,667 | | | | 1,578,848 | |
Net change in unrealized appreciation (depreciation) on investments | | | 4,511,785 | | | | 6,275,535 | |
| | | | |
Net increase (decrease) in net assets resulting from operations | | | 8,117,923 | | | | 9,794,965 | |
| | | | |
Dividends and distributions to shareholders: | | | | | | | | |
From net investment income: | | | | | | | | |
Investor Class | | | (93,935 | ) | | | (52,223 | ) |
Class A | | | (304,833 | ) | | | (256,478 | ) |
Class I | | | (1,131,918 | ) | | | (1,273,804 | ) |
Class R2 | | | (576,562 | ) | | | (370,717 | ) |
Class R3 | | | (42,842 | ) | | | (32,901 | ) |
| | | | |
| | | (2,150,090 | ) | | | (1,986,123 | ) |
| | | | |
From net realized gain on investments: | | | | | | | | |
Investor Class | | | (91,140 | ) | | | (170,656 | ) |
Class A | | | (287,860 | ) | | | (788,577 | ) |
Class I | | | (954,459 | ) | | | (3,598,046 | ) |
Class R2 | | | (567,796 | ) | | | (1,213,383 | ) |
Class R3 | | | (47,223 | ) | | | (119,177 | ) |
| | | | |
| | | (1,948,478 | ) | | | (5,889,839 | ) |
| | | | |
Total dividends and distributions to shareholders | | | (4,098,568 | ) | | | (7,875,962 | ) |
| | | | |
Capital share transactions: | | | | | | | | |
Net proceeds from sale of shares | | | 12,948,803 | | | | 25,441,565 | |
Net asset value of shares issued to shareholders in reinvestment of dividends and distributions | | | 4,093,040 | | | | 7,874,674 | |
Cost of shares redeemed | | | (16,499,707 | ) | | | (43,775,211 | ) |
| | | | |
Increase (decrease) in net assets derived from capital share transactions | | | 542,136 | | | | (10,458,972 | ) |
| | | | |
Net increase (decrease) in net assets | | | 4,561,491 | | | | (8,539,969 | ) |
|
| Net Assets | |
Beginning of period | | | 95,752,000 | | | | 104,291,969 | |
| | | | |
End of period | | $ | 100,313,491 | | | $ | 95,752,000 | |
| | | | |
Undistributed net investment income at end of period | | $ | 159,492 | | | $ | 1,179,111 | |
| | | | |
| | | | | | |
The notes to the financial statements are an integral part of,
and should be read in conjunction with, the financial statements. | | mainstayinvestments.com | | | 33 | |
Financial Highlights selected per share data and ratios
| | | | | | | | | | | | | | | | | | | | | | | | |
| | | Investor Class | |
| | | Six months
ended
April 30, | | | Year ended October 31, | | | February 28,
2008**
through
October 31, | |
| | | 2013* | | | 2012 | | | 2011 | | | 2010 | | | 2009 | | | 2008 | |
Net asset value at beginning of period | | $ | 9.67 | | | $ | 9.48 | | | $ | 9.54 | | | $ | 8.56 | | | $ | 7.43 | | | $ | 9.83 | |
| | | | | | | | | | | | | | | | | | | | | | | | |
Net investment income (loss) (a) | | | 0.11 | | | | 0.15 | | | | 0.16 | | | | 0.12 | | | | 0.18 | | | | 0.12 | |
Net realized and unrealized gain (loss) on investments | | | 0.77 | | | | 0.73 | | | | 0.12 | | | | 1.01 | | | | 1.13 | | | | (2.52 | ) |
| | | | | | | | | | | | | | | | | | | | | | | | |
Total from investment operations | | | 0.88 | | | | 0.88 | | | | 0.28 | | | | 1.13 | | | | 1.31 | | | | (2.40 | ) |
| | | | | | | | | | | | | | | | | | | | | | | | |
Less dividends and distributions: | | | | | | | | | | | | | | | | | | | | | | | | |
From net investment income | | | (0.23 | ) | | | (0.16 | ) | | | (0.19 | ) | | | (0.15 | ) | | | (0.16 | ) | | | — | |
From net realized gain on investments | | | (0.22 | ) | | | (0.53 | ) | | | (0.15 | ) | | | — | | | | (0.02 | ) | | | — | |
| | | | | | | | | | | | | | | | | | | | | | | | |
Total dividends and distributions | | | (0.45 | ) | | | (0.69 | ) | | | (0.34 | ) | | | (0.15 | ) | | | (0.18 | ) | | | — | |
| | | | | | | | | | | | | | | | | | | | | | | | |
Net asset value at end of period | | $ | 10.10 | | | $ | 9.67 | | | $ | 9.48 | | | $ | 9.54 | | | $ | 8.56 | | | $ | 7.43 | |
| | | | | | | | | | | | | | | | | | | | | | | | |
Total investment return (b) | | | 9.35 | %(c) | | | 10.08 | % | | | 2.92 | % | | | 13.33 | % | | | 17.99 | % | | | (24.42 | %)(c) |
Ratios (to average net assets)/Supplemental Data: | | | | | | | | | | | | | | | | | | | | | | | | |
Net investment income (loss) | | | 2.28 | %†† | | | 1.62 | % | | | 1.71 | % | | | 1.48 | % | | | 2.31 | % | | | 2.02 | % †† |
Net expenses (d) | | | 0.47 | %†† | | | 0.47 | % | | | 0.47 | % | | | 0.47 | % | | | 0.47 | % | | | 0.47 | % †† |
Expenses (before waiver/reimbursement) (d) | | | 0.79 | %†† | | | 0.81 | % | | | 0.88 | % | | | 1.16 | % | | | 1.31 | % | | | 1.48 | % †† |
Portfolio turnover rate | | | 29 | % | | | 95 | % | | | 97 | % | | | 73 | % | | | 68 | % | | | 134 | % |
Net assets at end of period (in 000’s) | | $ | 4,878 | | | $ | 3,803 | | | $ | 2,960 | | | $ | 1,926 | | | $ | 915 | | | $ | 342 | |
| ** | Commencement of operations. |
| (a) | Per share data based on average shares outstanding during the period. |
| (b) | Total investment return is calculated exclusive of sales charges and assumes the reinvestment of dividends and distributions. |
| (c) | Total investment return is not annualized. |
| (d) | In addition to the fees and expenses which the Fund bears directly, the Fund indirectly bears a pro-rata share of the fees and expenses of the Underlying Funds in which it invests. Such indirect expenses are not included in the above expense ratios. |
| | | | |
| 34 | | MainStay Retirement 2020 Fund | | The notes to the financial statements are an integral part of,
and should be read in conjunction with, the financial statements. |
Financial Highlights selected per share data and ratios
| | | | | | | | | | | | | | | | | | | | | | | | |
| | | Class A | |
| | | Six months
ended
April 30, | | | Year ended October 31, | |
| | | 2013* | | | 2012 | | | 2011 | | | 2010 | | | 2009 | | | 2008 | |
Net asset value at beginning of period | | $ | 9.65 | | | $ | 9.47 | | | $ | 9.53 | | | $ | 8.54 | | | $ | 7.44 | | | $ | 10.57 | |
| | | | | | | | | | | | | | | | | | | | | | | | |
Net investment income (loss) (a) | | | 0.12 | | | | 0.17 | | | | 0.18 | | | | 0.15 | | | | 0.19 | | | | 0.17 | |
Net realized and unrealized gain (loss) on investments | | | 0.76 | | | | 0.71 | | | | 0.11 | | | | 0.99 | | | | 1.11 | | | | (3.25 | ) |
| | | | | | | | | | | | | | | | | | | | | | | | |
Total from investment operations | | | 0.88 | | | | 0.88 | | | | 0.29 | | | | 1.14 | | | | 1.30 | | | | (3.08 | ) |
| | | | | | | | | | | | | | | | | | | | | | | | |
Less dividends and distributions: | | | | | | | | | | | | | | | | | | | | | | | | |
From net investment income | | | (0.23 | ) | | | (0.17 | ) | | | (0.20 | ) | | | (0.15 | ) | | | (0.18 | ) | | | (0.04 | ) |
From net realized gain on investments | | | (0.22 | ) | | | (0.53 | ) | | | (0.15 | ) | | | — | | | | (0.02 | ) | | | (0.01 | ) |
| | | | | | | | | | | | | | | | | | | | | | | | |
Total dividends and distributions | | | (0.45 | ) | | | (0.70 | ) | | | (0.35 | ) | | | (0.15 | ) | | | (0.20 | ) | | | (0.05 | ) |
| | | | | | | | | | | | | | | | | | | | | | | | |
Net asset value at end of period | | $ | 10.08 | | | $ | 9.65 | | | $ | 9.47 | | | $ | 9.53 | | | $ | 8.54 | | | $ | 7.44 | |
| | | | | | | | | | | | | | | | | | | | | | | | |
Total investment return (b) | | | 9.44 | %(c) | | | 10.11 | % | | | 3.01 | % | | | 13.55 | % | | | 17.97 | % | | | (29.25 | %) |
Ratios (to average net assets)/Supplemental Data: | | | | | | | | | | | | | | | | | | | | | | | | |
Net investment income (loss) | | | 2.42 | %†† | | | 1.82 | % | | | 1.87 | % | | | 1.67 | % | | | 2.48 | % | | | 1.79 | % |
Net expenses (d) | | | 0.37 | %†† | | | 0.37 | % | | | 0.37 | % | | | 0.37 | % | | | 0.37 | % | | | 0.38 | % |
Expenses (before waiver/reimbursement) (d) | | | 0.61 | %†† | | | 0.60 | % | | | 0.67 | % | | | 0.86 | % | | | 1.01 | % | | | 1.74 | % |
Portfolio turnover rate | | | 29 | % | | | 95 | % | | | 97 | % | | | 73 | % | | | 68 | % | | | 134 | % |
Net assets at end of period (in 000’s) | | $ | 14,831 | | | $ | 12,441 | | | $ | 14,032 | | | $ | 13,421 | | | $ | 11,026 | | | $ | 4,940 | |
| (a) | Per share data based on average shares outstanding during the period. |
| (b) | Total investment return is calculated exclusive of sales charges and assumes the reinvestment of dividends and distributions. |
| (c) | Total investment return is not annualized. |
| (d) | In addition to the fees and expenses which the Fund bears directly, the Fund indirectly bears a pro-rata share of the fees and expenses of the Underlying Funds in which it invests. Such indirect expenses are not included in the above expense ratios. |
| | | | | | |
The notes to the financial statements are an integral part of,
and should be read in conjunction with, the financial statements. | | mainstayinvestments.com | | | 35 | |
Financial Highlights selected per share data and ratios
| | | | | | | | | | | | | | | | | | | | | | | | |
| | | Class I | |
| | | Six months
ended
April 30, | | | Year ended October 31, | |
| | | 2013* | | | 2012 | | | 2011 | | | 2010 | | | 2009 | | | 2008 | |
Net asset value at beginning of period | | $ | 9.72 | | | $ | 9.52 | | | $ | 9.57 | | | $ | 8.58 | | | $ | 7.45 | | | $ | 10.57 | |
| | | | | | | | | | | | | | | | | | | | | | | | |
Net investment income (loss) (a) | | | 0.13 | | | | 0.19 | | | | 0.20 | | | | 0.17 | | | | 0.21 | | | | 0.19 | |
Net realized and unrealized gain (loss) on investments | | | 0.76 | | | | 0.73 | | | | 0.12 | | | | 0.99 | | | | 1.12 | | | | (3.24 | ) |
| | | | | | | | | | | | | | | | | | | | | | | | |
Total from investment operations | | | 0.89 | | | | 0.92 | | | | 0.32 | | | | 1.16 | | | | 1.33 | | | | (3.05 | ) |
| | | | | | | | | | | | | | | | | | | | | | | | |
Less dividends and distributions: | | | | | | | | | | | | | | | | | | | | | | | | |
From net investment income | | | (0.26 | ) | | | (0.19 | ) | | | (0.22 | ) | | | (0.17 | ) | | | (0.18 | ) | | | (0.06 | ) |
From net realized gain on investments | | | (0.22 | ) | | | (0.53 | ) | | | (0.15 | ) | | | — | | | | (0.02 | ) | | | (0.01 | ) |
| | | | | | | | | | | | | | | | | | | | | | | | |
Total dividends and distributions | | | (0.48 | ) | | | (0.72 | ) | | | (0.37 | ) | | | (0.17 | ) | | | (0.20 | ) | | | (0.07 | ) |
| | | | | | | | | | | | | | | | | | | | | | | | |
Net asset value at end of period | | $ | 10.13 | | | $ | 9.72 | | | $ | 9.52 | | | $ | 9.57 | | | $ | 8.58 | | | $ | 7.45 | |
| | | | | | | | | | | | | | | | | | | | | | | | |
Total investment return (b) | | | 9.47 | %(c) | | | 10.47 | % | | | 3.34 | % | | | 13.69 | % | | | 18.30 | % | | | (29.14 | %) |
Ratios (to average net assets)/Supplemental Data: | | | | | | | | | | | | | | | | | | | | | | | | |
Net investment income (loss) | | | 2.63 | %†† | | | 2.05 | % | | | 2.03 | % | | | 1.95 | % | | | 2.73 | % | | | 2.06 | % |
Net expenses (d) | | | 0.12 | %†† | | | 0.12 | % | | | 0.12 | % | | | 0.12 | % | | | 0.12 | % | | | 0.13 | % |
Expenses (before waiver/reimbursement) (d) | | | 0.36 | %†† | | | 0.35 | % | | | 0.42 | % | | | 0.61 | % | | | 0.76 | % | | | 1.45 | % |
Portfolio turnover rate | | | 29 | % | | | 95 | % | | | 97 | % | | | 73 | % | | | 68 | % | | | 134 | % |
Net assets at end of period (in 000’s) | | $ | 49,782 | | | $ | 52,164 | | | $ | 63,848 | | | $ | 47,125 | | | $ | 42,809 | | | $ | 19,743 | |
| (a) | Per share data based on average shares outstanding during the period. |
| (b) | Total investment return is calculated exclusive of sales charges and assumes the reinvestment of dividends and distributions. Class I shares are not subject to sales charges. |
| (c) | Total investment return is not annualized. |
| (d) | In addition to the fees and expenses which the Fund bears directly, the Fund indirectly bears a pro-rata share of the fees and expenses of the Underlying Funds in which it invests. Such indirect expenses are not included in the above expense ratios. |
| | | | |
| 36 | | MainStay Retirement 2020 Fund | | The notes to the financial statements are an integral part of,
and should be read in conjunction with, the financial statements. |
Financial Highlights selected per share data and ratios
| | | | | | | | | | | | | | | | | | | | |
| | | Class R2 | |
| | | Six months
ended
April 30, | | | Year ended October 31, | | | January 8,
2009**
through
October 31, | |
| | | 2013* | | | 2012 | | | 2011 | | | 2010 | | | 2009 | |
Net asset value at beginning of period | | $ | 9.66 | | | $ | 9.47 | | | $ | 9.52 | | | $ | 8.54 | | | $ | 7.21 | |
| | | | | | | | | | | | | | | | | | | | |
Net investment income (loss) (a) | | | 0.11 | | | | 0.15 | | | | 0.15 | | | | 0.14 | | | | 0.12 | |
Net realized and unrealized gain (loss) on investments | | | 0.76 | | | | 0.73 | | | | 0.13 | | | | 0.98 | | | | 1.21 | |
| | | | | | | | | | | | | | | | | | | | |
Total from investment operations | | | 0.87 | | | | 0.88 | | | | 0.28 | | | | 1.12 | | | | 1.33 | |
| | | | | | | | | | | | | | | | | | | | |
Less dividends and distributions: | | | | | | | | | | | | | | | | | | | | |
From net investment income | | | (0.22 | ) | | | (0.16 | ) | | | (0.18 | ) | | | (0.14 | ) | | | — | |
From net realized gain on investments | | | (0.22 | ) | | | (0.53 | ) | | | (0.15 | ) | | | — | | | | — | |
| | | | | | | | | | | | | | | | | | | | |
Total dividends and distributions | | | (0.44 | ) | | | (0.69 | ) | | | (0.33 | ) | | | (0.14 | ) | | | — | |
| | | | | | | | | | | | | | | | | | | | |
Net asset value at end of period | | $ | 10.09 | | | $ | 9.66 | | | $ | 9.47 | | | $ | 9.52 | | | $ | 8.54 | |
| | | | | | | | | | | | | | | | | | | | |
Total investment return (b) | | | 9.33 | %(c) | | | 9.98 | % | | | 3.08 | % | | | 13.29 | % | | | 18.45 | %(c)(d) |
Ratios (to average net assets)/Supplemental Data: | | | | | | | | | | | | | | | | | | | | |
Net investment income (loss) | | | 2.33 | %†† | | | 1.62 | % | | | 1.61 | % | | | 1.54 | % | | | 1.82 | %†† |
Net expenses (e) | | | 0.47 | %†† | | | 0.47 | % | | | 0.47 | % | | | 0.47 | % | | | 0.47 | %†† |
Expenses (before waiver/reimbursement) (e) | | | 0.71 | %†† | | | 0.70 | % | | | 0.77 | % | | | 0.96 | % | | | 1.09 | %†† |
Portfolio turnover rate | | | 29 | % | | | 95 | % | | | 97 | % | | | 73 | % | | | 68 | % |
Net assets at end of period (in 000’s) | | $ | 28,674 | | | $ | 25,259 | | | $ | 21,392 | | | $ | 1,718 | | | $ | 1,057 | |
| ** | Commencement of operations. |
| (a) | Per share data based on average shares outstanding during the period. |
| (b) | Total investment return is calculated exclusive of sales charges and assumes the reinvestment of dividends and distributions. Class R2 shares are not subject to sales charges. |
| (c) | Total investment return is not annualized. |
| (d) | Total investment return may reflect adjustments to conform to generally accepted accounting principles. |
| (e) | In addition to the fees and expenses which the Fund bears directly, the Fund indirectly bears a pro-rata share of the fees and expenses of the Underlying Funds in which it invests. Such indirect expenses are not included in the above expense ratios. |
| | | | | | |
The notes to the financial statements are an integral part of,
and should be read in conjunction with, the financial statements. | | mainstayinvestments.com | | | 37 | |
Financial Highlights selected per share data and ratios
| | | | | | | | | | | | | | | | | | | | | | | | |
| | | Class R3 | |
| | | Six months
ended
April 30, | | | Year ended October 31, | | | May 1,
2008**
through
October 31, | |
| | | 2013* | | | 2012 | | | 2011 | | | 2010 | | | 2009 | | | 2008 | |
Net asset value at beginning of period | | $ | 9.62 | | | $ | 9.45 | | | $ | 9.51 | | | $ | 8.54 | | | $ | 7.42 | | | $ | 9.98 | |
| | | | | | | | | | | | | | | | | | | | | | | | |
Net investment income (loss) (a) | | | 0.10 | | | | 0.13 | | | | 0.15 | | | | 0.11 | | | | 0.17 | | | | 0.10 | |
Net realized and unrealized gain (loss) on investments | | | 0.76 | | | | 0.72 | | | | 0.11 | | | | 0.99 | | | | 1.12 | | | | (2.66 | ) |
| | | | | | | | | | | | | | | | | | | | | | | | |
Total from investment operations | | | 0.86 | | | | 0.85 | | | | 0.26 | | | | 1.10 | | | | 1.29 | | | | (2.56 | ) |
| | | | | | | | | | | | | | | | | | | | | | | | |
Less dividends and distributions: | | | | | | | | | | | | | | | | | | | | | | | | |
From net investment income | | | (0.20 | ) | | | (0.15 | ) | | | (0.17 | ) | | | (0.13 | ) | | | (0.15 | ) | | | — | |
From net realized gain on investments | | | (0.22 | ) | | | (0.53 | ) | | | (0.15 | ) | | | — | | | | (0.02 | ) | | | — | |
| | | | | | | | | | | | | | | | | | | | | | | | |
Total dividends and distributions | | | (0.42 | ) | | | (0.68 | ) | | | (0.32 | ) | | | (0.13 | ) | | | (0.17 | ) | | | — | |
| | | | | | | | | | | | | | | | | | | | | | | | |
Net asset value at end of period | | $ | 10.06 | | | $ | 9.62 | | | $ | 9.45 | | | $ | 9.51 | | | $ | 8.54 | | | $ | 7.42 | |
| | | | | | | | | | | | | | | | | | | | | | | | |
Total investment return (b) | | | 9.20 | %(c) | | | 9.71 | % | | | 2.71 | % | | | 13.02 | % | | | 17.71 | % | | | (25.65 | %)(c) |
Ratios (to average net assets)/Supplemental Data: | | | | | | | | | | | | | | | | | | | | | | | | |
Net investment income (loss) | | | 2.12 | %†† | | | 1.41 | % | | | 1.52 | % | | | 1.33 | % | | | 2.31 | % | | | 2.61 | % †† |
Net expenses (d) | | | 0.72 | %†† | | | 0.72 | % | | | 0.72 | % | | | 0.72 | % | | | 0.72 | % | | | 0.73 | % †† |
Expenses (before waiver/reimbursement) (d) | | | 0.96 | %†† | | | 0.95 | % | | | 1.02 | % | | | 1.21 | % | | | 1.37 | % | | | 1.81 | % †† |
Portfolio turnover rate | | | 29 | % | | | 95 | % | | | 97 | % | | | 73 | % | | | 68 | % | | | 134 | % |
Net assets at end of period (in 000’s) | | $ | 2,150 | | | $ | 2,085 | | | $ | 2,060 | | | $ | 1,915 | | | $ | 1,713 | | | $ | 1,305 | |
| ** | Commencement of operations. |
| (a) | Per share data based on average shares outstanding during the period. |
| (b) | Total investment return is calculated exclusive of sales charges and assumes the reinvestment of dividends and distributions. Class R3 shares are not subject to sales charges. |
| (c) | Total investment return is not annualized. |
| (d) | In addition to the fees and expenses which the Fund bears directly, the Fund indirectly bears a pro-rata share of the fees and expenses of the Underlying Funds in which it invests. Such indirect expenses are not included in the above expense ratios. |
| | | | |
| 38 | | MainStay Retirement 2020 Fund | | The notes to the financial statements are an integral part of,
and should be read in conjunction with, the financial statements. |
MainStay Retirement 2030 Fund
Investment and Performance Comparison1 (Unaudited)
Performance data quoted represents past performance. Past performance is no guarantee of future results. Because of market volatility, current performance may be lower or higher than the figures shown. Investment return and principal value will fluctuate, and as a result, when shares are redeemed, they may be worth more or less than their original cost. The graph below depicts the historical performance of Class I shares of the Fund. Performance will vary from Class to Class based on differences in Class-specific expenses and sales charges. For performance information current to the most recent month-end, please call 800-MAINSTAY (624-6782) or visit mainstayinvestments.com.
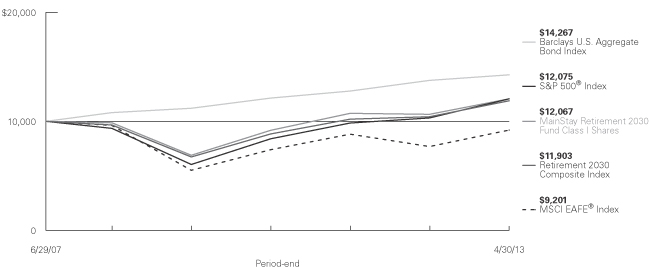
Average Annual Total Returns for the Period Ended April 30, 2013
| | | | | | | | | | | | | | | | | | | | | | | | |
| Class | | Sales Charge | | | | Six Months | | | One Year | | | Five Years | | | Since
Inception
(6/29/07) | | | Gross Expense Ratio2 | |
| Investor Class Shares3 | | Maximum 5.5% Initial Sales Charge | | With sales charges Excluding sales charges | |
| 5.31
11.44 | %
| |
| 6.71
12.92 | %
| |
| 2.58
3.74 | %
| |
| 1.93
2.93 | %
| |
| 1.70
1.70 | %
|
| Class A Shares | | Maximum 5.5% Initial Sales Charge | | With sales charges Excluding sales charges | |
| 5.38
11.51 |
| |
| 6.79
13.00 |
| |
| 2.67
3.84 |
| |
| 2.02
3.01 |
| |
| 1.41
1.41 |
|
| Class I Shares | | No Sales Charge | | | | | 11.73 | | | | 13.21 | | | | 4.10 | | | | 3.27 | | | | 1.16 | |
| Class R1 Shares4 | | No Sales Charge | | | | | 11.59 | | | | 13.17 | | | | 4.00 | | | | 3.16 | | | | 1.26 | |
| Class R2 Shares5 | | No Sales Charge | | | | | 11.53 | | | | 12.89 | | | | 3.73 | | | | 2.90 | | | | 1.51 | |
| Class R3 Shares6 | | No Sales Charge | | | | | 11.25 | | | | 12.61 | | | | 3.49 | | | | 2.66 | | | | 1.76 | |
| 1. | The performance table and graph do not reflect the deduction of taxes that a shareholder would pay on dividends, distributions or Fund share redemptions. Total returns reflect maximum applicable sales charges as indicated in the table above, changes in share price, and reinvestment of dividend and capital gain distributions. The graph assumes the initial investment amount shown above and reflects the deduction of all sales charges that would have applied for the period of investment. Performance figures reflect certain fee waivers and/or expense limitations, without which total returns may have been lower. For more information on share classes and current fee waivers and/or expense limitations, please refer to the notes to the financial statements. |
| 2. | The gross expense ratios presented reflect the Fund’s “Total Annual Fund Operating Expenses” from the most recent Prospectus and may differ from other expense ratios disclosed in this report. |
| 3. | Performance figures for Investor Class shares, first offered on February 28, 2008, include the historical performance of Class A shares through February 27, 2008, adjusted for differences in expenses and fees. Unadjusted, the performance shown for Investor Class shares would likely have been different. |
| 4. | Class R1 shares were first offered to public on June 29, 2007, although this class of shares has not yet commenced operations as of April 30, 2013. As a result, the performance for Class R1 shares include the historical performance of Class A shares through April 30, 2013, adjusted for differences in certain expenses and fees. Unadjusted, the performance shown for Class R1 shares would likely have been different. |
| 5. | Class R2 shares were first offered on June 29, 2007, although this class did not commence investment operations until January 8, 2009. Performance figures for Class R2 shares include the historical performance of Class A shares through January 7, 2009, adjusted for differences in certain expenses and fees. Unadjusted, the performance shown for Class R2 shares would likely have been different. |
| 6. | Class R3 shares were first offered on June 29, 2007, although this class did not commence investment operations until May 1, 2008. Performance figures for Class R3 shares include the historical performance of Class A shares through April 30, 2008, adjusted for differences in certain expenses and fees. Unadjusted, the performance shown for Class R3 shares would likely have been different. |
The footnotes on the next page are an integral part of the table and graph and should be carefully read in conjunction with them.
| | | | |
| mainstayinvestments.com | | | 39 | |
| | | | | | | | | | | | | | | | |
| Benchmark Performance | | Six
Months | | | One
Year | | | Five
Years | | | Since
Inception | |
S&P 500® Index7 | | | 14.42 | % | | | 16.89 | % | | | 5.21 | % | | | 3.29 | % |
MSCI EAFE® Index8 | | | 16.90 | | | | 19.39 | | | | –0.93 | | | | –1.42 | |
Barclays U.S. Aggregate Bond Index9 | | | 0.90 | | | | 3.68 | | | | 5.72 | | | | 6.28 | |
Retirement 2030 Composite Index10 | | | 11.47 | | | | 14.18 | | | | 4.22 | | | | 3.03 | |
Average Lipper Mixed-Asset Target 2030 Fund11 | | | 10.18 | | | | 11.93 | | | | 3.38 | | | | 1.98 | |
| 7. | “S&P 500®” is a trademark of The McGraw-Hill Companies, Inc. The S&P 500® Index is widely regarded as the standard index for measuring large-cap U.S. stock market performance. The S&P 500 Index is the Fund’s broad-based securities market index. Results assume reinvestment of all income and capital gains. An investment cannot be made directly in an index. |
| 8. | The MSCI EAFE® Index consists of international stocks representing the developed world outside of North America. The MSCI EAFE® Index is the Fund’s secondary benchmark. Results assume reinvestment of all income and capital gains. An investment cannot be made directly in an index. |
| 9. | The Barclays U.S. Aggregate Bond Index is a broad-based benchmark that measures the investment grade, U.S. dollar-denominated, fixed-rate taxable bond market, including Treasurys, government-related and corporate securities, mortgage-backed securities (agency fixed-rate and hybrid adjustable rate mortgage pass-throughs), asset-backed securities, and commercial mortgage-backed securities. The Fund has selected the |
| | Barclays U.S. Aggregate Bond Index as an additional benchmark. Results assume reinvestment of all income and capital gains. An investment cannot be made directly in an index. |
| 10. | The Retirement 2030 Composite Index consists of the S&P 500® Index, the MSCI EAFE® Index and the Barclays U.S. Aggregate Bond Index weighted according to the Fund’s current allocation, changing annually through the target retirement date. The Fund has selected the Retirement 2030 Composite Index as an additional benchmark. Total returns assume reinvestment of all dividends and capital gains. An investment cannot be made directly in an index. |
| 11. | The average Lipper mixed-asset target 2030 fund is representative of funds that seek to maximize assets for retirement or other purposes with an expected time horizon from January 1, 2026, to December 31, 2030. This benchmark is a product of Lipper Inc. Lipper Inc. is an independent monitor of fund performance. Results are based on average total returns of similar funds with all dividend and capital gain distributions reinvested. |
The footnotes on the preceding page are an integral part of the table and graph and should be carefully read in conjunction with them.
| | |
| 40 | | MainStay Retirement 2030 Fund |
Cost in Dollars of a $1,000 Investment in MainStay Retirement 2030 Fund (Unaudited)
The example below is intended to describe the fees and expenses borne by shareholders during the six-month period from November 1, 2012, to April 30, 2013, and the impact of those costs on your investment.
Example
As a shareholder of the Fund, you incur two types of costs: (1) transaction costs, including exchange fees and sales charges (loads) on purchases (as applicable), and (2) ongoing costs, including management fees, distribution and/or service (12b-1) fees, and other Fund expenses (as applicable). This example is intended to help you understand your ongoing costs (in dollars) of investing in the Fund and to compare these costs with the ongoing costs of investing in other mutual funds. The example is based on an investment of $1,000 made at the beginning of the six-month period and held for the entire period from November 1, 2012, to April 30, 2013.
This example illustrates your Fund’s ongoing costs in two ways:
Actual Expenses
The second and third data columns in the table below provide information about actual account values and actual expenses. You may use the information in these columns, together with the amount you invested, to estimate the expenses that you paid during the six months ended April 30, 2013. Simply divide your account value by $1,000 (for example, an $8,600 account value divided by $1,000 = 8.6), then
multiply the result by the number under the heading entitled “Expenses Paid During Period” to estimate the expenses you paid on your account during this period.
Hypothetical Example for Comparison Purposes
The fourth and fifth data columns in the table below provide information about hypothetical account values and hypothetical expenses based on the Fund’s actual expense ratio and an assumed rate of return of 5% per year before expenses, which is not the Fund’s actual return. The hypothetical account values and expenses may not be used to estimate the actual ending account balances or expenses you paid for the six-month period shown. You may use this information to compare the ongoing costs of investing in the Fund with the ongoing costs of investing in other Funds. To do so, compare this 5% hypothetical example with the 5% hypothetical examples that appear in the shareholder reports of the other Funds.
Please note that the expenses shown in the table are meant to highlight your ongoing costs only and do not reflect any transactional costs, such as exchange fees or sales charges (loads). Therefore, the fourth and fifth data columns of the table are useful in comparing ongoing costs only and will not help you determine the relative total costs of owning different funds. In addition, if these transactional costs were included, your costs would have been higher.
| | | | | | | | | | | | | | | | | | | | |
| | | | | | | | | | | | | | | | |
| Share Class | | Beginning
Account
Value
11/1/12 | | | Ending Account
Value (Based
on Actual
Returns and
Expenses)
4/30/13 | | | Expenses
Paid
During
Period1 | | | Ending Account
Value (Based
on Hypothetical
5% Annualized
Return and
Actual Expenses)
4/30/13 | | | Expenses
Paid
During
Period1 | |
| | | | | |
| Investor Class Shares | | $ | 1,000.00 | | | $ | 1,114.40 | | | $ | 2.46 | | | $ | 1,022.50 | | | $ | 2.36 | |
| | | | | |
| Class A Shares | | $ | 1,000.00 | | | $ | 1,115.10 | | | $ | 1.94 | | | $ | 1,023.00 | | | $ | 1.86 | |
| | | | | |
| Class I Shares | | $ | 1,000.00 | | | $ | 1,117.30 | | | $ | 0.63 | | | $ | 1,024.20 | | | $ | 0.60 | |
| | | | | |
| Class R2 Shares | | $ | 1,000.00 | | | $ | 1,115.30 | | | $ | 2.47 | | | $ | 1,022.50 | | | $ | 2.36 | |
| | | | | |
| Class R3 Shares | | $ | 1,000.00 | | | $ | 1,112.50 | | | $ | 3.77 | | | $ | 1,021.20 | | | $ | 3.61 | |
| 1. | Expenses are equal to the Fund’s annualized expense ratio of each class (0.47% for Investor Class, 0.37% for Class A, 0.12% for Class I, 0.47% for Class R2 and 0.72% for Class R3) multiplied by the average account value over the period, divided by 365 and multiplied by 181 (to reflect the six-month period). The table above represents the actual expenses incurred during the six-month period. In addition to the fees and expenses which the Fund bears directly, the Fund indirectly bears a pro rata share of the fees and expenses of the Underlying Funds in which it invests. Such indirect expenses are not included in the above-reported expense figures. |
| | | | |
| mainstayinvestments.com | | | 41 | |
Investment Objectives of Underlying Funds as of April 30, 2013 (Unaudited)
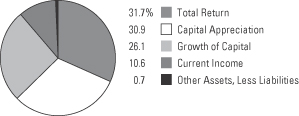
See Portfolio of Investments beginning on page 46 for specific holdings within these categories.
| | |
| 42 | | MainStay Retirement 2030 Fund |
Portfolio Management Discussion and Analysis (Unaudited)
Questions answered by portfolio managers Jae S. Yoon, CFA, Jonathan Swaney and Poul Kristensen, CFA, of New York Life Investments.1
How did MainStay Retirement 2030 Fund perform relative to its peers and its benchmark during the six months ended April 30, 2013?
Excluding all sales charges, MainStay Retirement 2030 Fund returned 11.44% for Investor Class shares and 11.51% for Class A shares for the six months ended April 30, 2013. Over the same period, Class I shares returned 11.73%, Class R1 shares2 returned 11.59%, Class R2 shares returned 11.53% and Class R3 shares returned 11.25%. All share classes outperformed the 10.18% return of the average Lipper3 mixed-asset target 2030 fund for the six months ended April 30, 2013. Over the same period, all share classes underperformed the 14.42% return of the S&P 500® Index4 and the 16.90% return of the MSCI EAFE® Index.5 The S&P 500® Index is the Fund’s broad-based securities-market index, and the MSCI EAFE® Index is the secondary benchmark of the Fund. All share
classes outperformed the 0.90% return of the Barclays U.S. Aggregate Bond Index6 for the six months ended April 30,
2013. Over the same period, Class A, Class I, Class R1 and Class R2 shares outperformed—and Investor Class and Class R3 shares underperformed—the 11.47% return of the Retirement 2030 Composite Index7 The Barclays U.S. Aggregate
Bond Index and the Retirement 2030 Composite Index are
additional benchmarks of the Fund. See page 39 for Fund returns with applicable sales charges.
Were there any changes to the Fund during the reporting period?
Effective February 28, 2013, the Fund’s Principal Investment Strategies were modified to broaden the investment ranges for each of the asset classes in which the Fund may invest by an additional ten percentage points. Also effective February 28, 2013, Poul Kristensen, CFA, was added as a portfolio manager. Please see the Prospectus dated February 28, 2013, for more information.
What factors affected the Fund’s relative performance during the reporting period?
The Fund invests primarily in mutual funds managed by New York Life Investments, mutual funds managed by an advisor not affiliated with New York Life Investments or exchange traded funds (“ETFs”), if a New York Life Investments managed mutual fund in a particular asset class is not available (collectively, “Underlying Funds”). The Underlying Funds may invest in fixed-income securities or in domestic or international stocks at
various capitalization levels. The Fund’s primary benchmark, on the other hand, consists entirely of U.S. large-cap stocks. These differences—particularly the Fund’s substantial allocation to Underlying Funds that invest in fixed-income securities—accounted for many of the challenges the Fund experienced in terms of relative performance.
During the reporting period, the Fund’s performance relative to the Retirement 2030 Composite Index varied by share class but was uniformly better than the average peer fund. The Fund’s asset-allocation policy was largely a wash. We maintained a neutral blend at the start of the reporting period, then moved aggressively to overweight equities during the latter half of the fourth quarter. This proved to be a very profitable strategy, although the benefit was more than offset by a heavy allocation to emerging-market stocks, an emphasis on large-cap stocks rather than small-cap stocks, and a bias toward U.S. equities over those of other developed nations. In the fixed-income portion of the Fund, a bias toward lower-quality bond offerings aided performance. Our decision to keep duration8 short in the fixed-income portion of the Fund had no meaningful impact on the Fund’s performance.
Performance of the Underlying Funds also influenced relative results. Relying on MainStay Large Cap Growth Fund more heavily than MainStay Cornerstone Growth Fund proved beneficial. Other positive contributors in the equity portion of the
Fund included MainStay MAP Fund and MainStay U.S. Small Cap Fund. All told, the performance of all Underlying Funds contributed positively—but not significantly—to relative performance.
How did you allocate the Fund’s assets during the reporting period and why?
We considered a variety of information, including the portfolio-level characteristics of the Underlying Funds, such as capitalization, style biases, sector exposures, credit quality and duration. We also examined the attributes of the Underlying Funds’ holdings, such as valuation metrics, earnings data and technical indicators. Finally, we evaluated the historical success of the managers responsible for the Underlying Funds. Generally speaking, we seek to invest in Underlying Funds that occupy attractively valued segments of the market, invest in fairly priced securities and are steered by individuals who have consistently demonstrated capable management in the past.
| 1. | “New York Life Investments” is a service mark used by New York Life Investment Management LLC. |
| 2. | See footnote on page 39 for more information on Class R1 shares. |
| 3. | See footnote on page 40 for more information on Lipper Inc. |
| 4. | See footnote on page 40 for more information on the S&P 500® Index. |
| 5. | See footnote on page 40 for more information on the MSCI EAFE® Index. |
| 6. | See footnote on page 40 for more information on the Barclays U.S. Aggregate Bond Index. |
| 7. | See footnote on page 40 for more information on the Retirement 2030 Composite Index. |
| 8. | Duration is a measure of the price sensitivity of a fixed-income investment to changes in interest rates. Duration is expressed as a number of years and is considered a more accurate sensitivity gauge than average maturity. |
| | | | |
| mainstayinvestments.com | | | 43 | |
The Fund’s allocations to stocks and bonds varied over the course of the reporting period in response to the changing environment. We believed that equities presented a sizable valuation advantage over bonds and that corporate profit gains would help propel stock prices higher. For these reasons, we gave the Fund a decisive tilt in favor of stocks over bonds throughout most of the reporting period. Within the equity portion of the Fund, we maintained a bias in favor of Underlying Funds that invest in U.S. stocks over Underlying Funds that invest in stocks traded in other developed markets. We were particularly concerned about countries that are likely to struggle with deleveraging issues even greater than those presented in the United States. Results were mixed, as Japan in particular experienced very strong returns on the back of aggressive fiscal and monetary policy changes. The Fund was also significantly overweight in emerging-market economies because we believed that these markets would benefit most from gradually strengthening global economic growth. During the reporting period, however, that posture detracted significantly from performance, as emerging-market stocks generally trailed stocks in developed markets by a wide margin.
In the fixed-income portion of the Fund, we continued to maintain a shorter duration than the Barclays U.S. Aggregate Bond Index. We also tilted the fixed-income portion of the Fund decidedly toward Underlying Funds that invest in corporate bonds over those that invest primarily in government-backed issues. This positioning reflected our opinion that high-grade bonds were very expensive and that issues from corporate borrowers deemed to be of lower quality represented a far more attractive proposition. Given ample liquidity and healthy corporate balance sheets, we believed that default rates were likely to remain low. We also believed that investors were likely to find the higher yields available from corporate debt quite attractive compared to the yields available on U.S. Treasury instruments.
How did the Fund’s allocations change over the course of the reporting period?
Position sizes naturally fluctuate with changing market conditions, and such changes do not always reflect an explicit change in our strategic or tactical point of view. That said, many of the most notable allocation changes during the reporting period were associated with the expanding list of eligible investments, as several new MainStay Funds became available. MainStay Short Duration High Yield Fund was one such product. The Fund selected this Underlying Fund as part of an ongoing effort to protect against a potential rise in interest rates. We quickly built the Fund’s position after the Underlying Fund’s launch in December 2012. The purchases were made with proceeds from MainStay High Yield Corporate Bond Fund and MainStay Floating Rate Fund.
MainStay Cornerstone Growth Fund was another new product. We established a position in this Underlying Fund using pro-
ceeds from MainStay Large Cap Growth Fund as we sought to widen strategy diversification within that portion of the market.
A new holding was established in MainStay High Yield Municipal Bond Fund, which further diversified sources of credit risk within the fixed-income portion of the Fund. We believed that high-yield municipal bonds would be attractive despite the inapplicability of tax benefits usually associated with these types of instruments.
There were two other changes of note. First, we increased the Fund’s position in MainStay U.S. Small Cap Fund as we unwound the Fund’s previous large-cap bias. The increased allocation was funded from a mix of Underlying Equity Funds. Second, we increased the Fund’s position in MainStay Common Stock Fund, as the strategy employed in that Underlying Fund has proven very effective in the post–credit crisis environment.
During the reporting period, which Underlying Equity Funds had the highest total returns and which Underlying Equity Funds had the lowest total returns?
MainStay International Opportunities Fund (formerly MainStay 130/30 International Fund) generated the highest absolute return by a comfortable margin, followed by MainStay U.S. Small Cap Fund. Although none of the Underlying Equity Funds in which the Fund invested provided negative returns for the reporting period, the lowest absolute returns in the equity portion of the Fund came from MainStay Cornerstone Growth Fund and Vanguard FTSE Emerging Markets ETF.
Which Underlying Equity Funds made the strongest positive contributions to the Fund’s overall performance, and which Underlying Equity Funds were the greatest detractors?
Because contributions take weightings and total returns into account and position sizes may vary, the Underlying Funds with the highest (or lowest) returns may not always have the most significantly positive (or negative) contributions to performance.
During the reporting period, large positions in MainStay MAP Fund and MainStay ICAP International Equity Fund made the largest positive contributions to the Fund’s overall performance. Although none of the Underlying Equity Funds in which the Fund invested had negative total returns, the smallest contributions came from a new position being built in MainStay Cornerstone Growth Fund and from a small position in MainStay International Equity Fund.
What factors and risks affected the Fund’s Underlying Fixed Income Fund investments during the reporting period?
Monetary policy continued to play a significant role in fixed-income markets, as has been the case for several years. Faced with persistently sluggish economic growth, slow rates of job creation and the prospect of significant fiscal drag, the Federal
| | |
| 44 | | MainStay Retirement 2030 Fund |
Reserve elected to extend its large-scale asset purchase program indefinitely. This decision helped keep interest rates close to their all-time lows. During the reporting period, the Fund favored Underlying Fixed Income Funds that invest in higher-yielding corporate bonds over those that invest primarily in government-backed issues. This strategy proved fortunate. Credit performed quite well as default rates remained low and the comparatively higher yields of these bonds attracted many buyers.
During the reporting period, which fixed-income market segments were strong performers and which segments were particularly weak?
High-yield corporate bonds performed exceptionally well as spreads9 to U.S. Treasurys continued to contract. The lowest returns came from the most liquid, highest-quality
and shortest-term debt instruments. Cash returned nothing, and returns on short-term U.S. government debt and AAA bonds were only slightly higher.
Which Underlying Fixed Income Funds made the strongest positive contributions to the Fund’s performance, and which Underlying Fixed Income Funds were the greatest detractors?
The largest contributions to the fixed-income portion of the Fund came from MainStay Floating Rate Fund and Market Vectors Emerging Market Bond ETF. The contribution from positions in a variety of other Underlying Fixed Income Funds, including MainStay Money Market Fund and MainStay Short Duration High Yield Fund, was effectively zero.
| 9. | The terms “spread” and “yield spread” may refer to the difference in yield between a security or type of security and comparable U.S. Treasury issues. The terms may also refer to the difference in yield between two specific securities or types of securities at a given time. |
The opinions expressed are those of the portfolio managers as of the date of this report and are subject to change. There is no guarantee that any forecast made will come to pass. This material does not constitute investment advice and is not intended as an endorsement of any specific investment.
| | | | |
| mainstayinvestments.com | | | 45 | |
Portfolio of Investments April 30, 2013 (Unaudited)
| | | | | | | | |
| | |
| | | Shares | | | Value | |
| | | | | | | | |
| Affiliated Investment Companies 86.2%† | |
Equity Funds 65.5% | |
MainStay Common Stock Fund Class I (a) | | | 951,300 | | | $ | 13,993,620 | |
MainStay Cornerstone Growth Fund Class I | | | 96,675 | | | | 2,885,742 | |
MainStay Epoch International Small Cap Fund Class I | | | 162,543 | | | | 3,286,620 | |
MainStay Epoch U.S. All Cap Fund Class I | | | 375,252 | | | | 9,441,330 | |
MainStay ICAP Equity Fund Class I | | | 194,641 | | | | 8,782,213 | |
MainStay ICAP International Fund Class I | | | 221,399 | | | | 7,179,975 | |
MainStay ICAP Select Equity Fund Class I | | | 17,487 | | | | 753,178 | |
MainStay International Equity Fund Class I | | | 240,473 | | | | 3,032,359 | |
MainStay Large Cap Growth Fund Class I | | | 799,068 | | | | 7,047,776 | |
MainStay MAP Fund Class I | | | 465,973 | | | | 18,555,050 | |
MainStay S&P 500 Index Fund Class I | | | 237,304 | | | | 8,806,353 | |
| | | | | | | | |
Total Equity Funds
(Cost $67,391,612) | | | | | | | 83,764,216 | |
| | | | | | | | |
| | |
Fixed Income Funds 20.7% | | | | | | | | |
MainStay Floating Rate Fund Class I | | | 700,598 | | | | 6,767,774 | |
MainStay High Yield Corporate Bond Fund Class I | | | 67,435 | | | | 419,447 | |
MainStay High Yield Municipal Bond Fund Class I | | | 103,734 | | | | 1,259,331 | |
MainStay Intermediate Term Bond Fund Class I | | | 1,144,408 | | | | 12,737,259 | |
MainStay Money Market Fund Class A | | | 3,169,049 | | | | 3,169,049 | |
MainStay Short Duration High Yield Fund Class I | | | 193,950 | | | | 1,953,079 | |
MainStay Short Term Bond Fund Class I | | | 16,852 | | | | 162,117 | |
| | | | | | | | |
Total Fixed Income Funds
(Cost $25,835,433) | | | | | | | 26,468,056 | |
| | | | | | | | |
Total Affiliated Investment Companies
(Cost $93,227,045) | | | | | | | 110,232,272 | |
| | | | | | | | |
| | | | | | | | |
| | |
| | | Shares | | | Value | |
| Unaffiliated Investment Companies 13.1% | |
Equity Funds 11.5% | | | | | | | | |
iShares Russell 2000 Index ETF | | | 69,795 | | | $ | 6,570,501 | |
Vanguard Emerging Markets ETF | | | 186,214 | | | | 8,148,725 | |
| | | | | | | | |
Total Equity Funds
(Cost $13,145,902) | | | | | | | 14,719,226 | |
| | | | | | | | |
| | |
Fixed Income Fund 1.6% | | | | | | | | |
Market Vectors Emerging Markets Local Currency Bond ETF | | | 75,861 | | | | 2,093,005 | |
| | | | | | | | |
Total Fixed Income Fund
(Cost $1,990,335) | | | | | | | 2,093,005 | |
| | | | | | | | |
Total Unaffiliated Investment Companies (Cost $15,136,237) | | | | | | | 16,812,231 | |
| | | | | | | | |
Total Investments
(Cost $108,363,282) (b) | | | 99.3 | % | | | 127,044,503 | |
Other Assets, Less Liabilities | | | 0.7 | | | | 904,595 | |
Net Assets | | | 100.0 | % | | $ | 127,949,098 | |
| † | Percentages indicated are based on Fund net assets. |
| (a) | The Fund’s ownership exceeds 5% of the outstanding shares of the Underlying Fund’s share class. (See Note 3) |
| (b) | As of April 30, 2013, cost is $110,592,070 for federal income tax purposes and net unrealized appreciation is as follows: |
| | | | |
Gross unrealized appreciation | | $ | 18,681,221 | |
Gross unrealized depreciation | | | (2,228,788 | ) |
| | | | |
Net unrealized appreciation | | $ | 16,452,433 | |
| | | | |
The following abbreviation is used in the above portfolio:
ETF—Exchange Traded Fund
| | | | |
| 46 | | MainStay Retirement 2030 Fund | | The notes to the financial statements are an integral part of,
and should be read in conjunction with, the financial statements. |
The following is a summary of the fair valuations according to the inputs used as of April 30, 2013, for valuing the Fund’s assets.
Asset Valuation Inputs
| | | | | | | | | | | | | | | | |
Description | | Quoted
Prices in
Active
Markets for
Identical
Assets
(Level 1) | | | Significant
Other
Observable
Inputs
(Level 2) | | | Significant
Unobservable
Inputs
(Level 3) | | | Total | |
| Investments (a) | | | | | | | | | | | | | | | | |
| Affiliated Investment Companies | | | | | | | | | | | | | | | | |
Equity Funds | | $ | 83,764,216 | | | $ | — | | | $ | — | | | $ | 83,764,216 | |
Fixed Income Funds | | | 26,468,056 | | | | — | | | | — | | | | 26,468,056 | |
| | | | | | | | | | | | | | | | |
| Total Affiliated Investment Companies | | | 110,232,272 | | | | — | | | | — | | | | 110,232,272 | |
| | | | | | | | | | | | | | | | |
| Unaffiliated Investment Companies | | | | | | | | | | | | | | | | |
Equity Funds | | | 14,719,226 | | | | — | | | | — | | | | 14,719,226 | |
Fixed Income Fund | | | 2,093,005 | | | | — | | | | — | | | | 2,093,005 | |
| | | | | | | | | | | | | | | | |
| Total Unaffiliated Investment Companies | | | 16,812,231 | | | | — | | | | — | | | | 16,812,231 | |
| | | | | | | | | | | | | | | | |
| Total Investments | | $ | 127,044,503 | | | $ | — | | | $ | — | | | $ | 127,044,503 | |
| | | | | | | | | | | | | | | | |
| (a) | For a complete listing of investments, see the Portfolio of Investments. |
The Fund recognizes transfers between the levels as of the beginning of the period.
For the period ended April 30, 2013, the Fund did not have any transfers between Level 1 and Level 2 fair value measurements. (See Note 2)
As of April 30, 2013, the Fund did not hold any investments with significant unobservable inputs (Level 3). (See Note 2)
| | | | | | |
The notes to the financial statements are an integral part of,
and should be read in conjunction with, the financial statements. | | mainstayinvestments.com | | | 47 | |
Statement of Assets and Liabilities as of April 30, 2013 (Unaudited)
| | | | |
| Assets | |
Investment in affiliated investment companies, at value (identified cost $93,227,045) | | $ | 110,232,272 | |
Investments in unaffiliated investment companies, at value (identified cost $15,136,237) | | | 16,812,231 | |
Cash | | | 7,409 | |
Receivables: | | | | |
Fund shares sold | | | 978,420 | |
Manager (See Note 3) | | | 10,919 | |
Other assets | | | 31,683 | |
| | | | |
Total assets | | | 128,072,934 | |
| | | | |
| |
| Liabilities | | | | |
Payables: | | | | |
Fund shares redeemed | | | 53,369 | |
Transfer agent (See Note 3) | | | 31,007 | |
Professional fees | | | 14,972 | |
NYLIFE Distributors (See Note 3) | | | 11,056 | |
Shareholder communication | | | 9,269 | |
Custodian | | | 1,455 | |
Trustees | | | 322 | |
Accrued expenses | | | 2,386 | |
| | | | |
Total liabilities | | | 123,836 | |
| | | | |
Net assets | | $ | 127,949,098 | |
| | | | |
| |
| Composition of Net Assets | | | | |
Shares of beneficial interest outstanding (par value of $.001 per share) unlimited number of shares authorized | | $ | 12,989 | |
Additional paid-in capital | | | 108,728,513 | |
| | | | |
| | | 108,741,502 | |
Undistributed net investment income | | | 107,818 | |
Accumulated net realized gain (loss) on investments | | | 418,557 | |
Net unrealized appreciation (depreciation) on investments | | | 18,681,221 | |
| | | | |
Net assets | | $ | 127,949,098 | |
| | | | |
| | | | |
Investor Class | | | | |
Net assets applicable to outstanding shares | | $ | 5,902,818 | |
| | | | |
Shares of beneficial interest outstanding | | | 601,124 | |
| | | | |
Net asset value per share outstanding | | $ | 9.82 | |
Maximum sales charge (5.50% of offering price) | | | 0.57 | |
| | | | |
Maximum offering price per share outstanding | | $ | 10.39 | |
| | | | |
Class A | | | | |
Net assets applicable to outstanding shares | | $ | 14,127,691 | |
| | | | |
Shares of beneficial interest outstanding | | | 1,441,659 | |
| | | | |
Net asset value per share outstanding | | $ | 9.80 | |
Maximum sales charge (5.50% of offering price) | | | 0.57 | |
| | | | |
Maximum offering price per share outstanding | | $ | 10.37 | |
| | | | |
Class I | | | | |
Net assets applicable to outstanding shares | | $ | 78,867,723 | |
| | | | |
Shares of beneficial interest outstanding | | | 7,982,484 | |
| | | | |
Net asset value and offering price per share outstanding | | $ | 9.88 | |
| | | | |
Class R2 | | | | |
Net assets applicable to outstanding shares | | $ | 21,748,707 | |
| | | | |
Shares of beneficial interest outstanding | | | 2,220,034 | |
| | | | |
Net asset value and offering price per share outstanding | | $ | 9.80 | |
| | | | |
Class R3 | | | | |
Net assets applicable to outstanding shares | | $ | 7,302,159 | |
| | | | |
Shares of beneficial interest outstanding | | | 744,091 | |
| | | | |
Net asset value and offering price per share outstanding | | $ | 9.81 | |
| | | | |
| | | | |
| 48 | | MainStay Retirement 2030 Fund | | The notes to the financial statements are an integral part of,
and should be read in conjunction with, the financial statements. |
Statement of Operations for the six months ended April 30, 2013 (Unaudited)
| | | | |
| Investment Income (Loss) | |
Income | | | | |
Dividend distributions from affiliated investment companies | | $ | 1,407,650 | |
Dividend distributions from unaffiliated investment companies | | | 175,018 | |
| | | | |
Total income | | | 1,582,668 | |
| | | | |
Expenses | | | | |
Transfer agent (See Note 3) | | | 90,250 | |
Distribution/Service—Investor Class (See Note 3) | | | 6,288 | |
Distribution/Service—Class A (See Note 3) | | | 15,880 | |
Distribution/Service—Class R2 (See Note 3) | | | 23,743 | |
Distribution/Service—Class R3 (See Note 3) | | | 17,135 | |
Manager (See Note 3) | | | 58,006 | |
Registration | | | 34,285 | |
Professional fees | | | 14,719 | |
Shareholder service (See Note 3) | | | 12,924 | |
Shareholder communication | | | 11,690 | |
Custodian | | | 3,524 | |
Trustees | | | 1,359 | |
Miscellaneous | | | 4,976 | |
| | | | |
Total expenses before waiver/reimbursement | | | 294,779 | |
Expense waiver/reimbursement from Manager (See Note 3) | | | (143,793 | ) |
| | | | |
Net expenses | | | 150,986 | |
| | | | |
Net investment income (loss) | | | 1,431,682 | |
| | | | |
|
| Realized and Unrealized Gain (Loss) on Investments | |
Net realized gain (loss) on: | | | | |
Affiliated investment company transactions | | | 1,796,612 | |
Unaffiliated investment company transactions | | | (95,010 | ) |
Realized capital gain distributions from affiliated investment companies | | | 945,778 | |
| | | | |
Net realized gain (loss) on investments from affiliated and unaffiliated investment companies | | | 2,647,380 | |
| | | | |
Net change in unrealized appreciation (depreciation) on investments | | | 8,526,759 | |
| | | | |
Net realized and unrealized gain (loss) on investments | | | 11,174,139 | |
| | | | |
Net increase (decrease) in net assets resulting from operations | | $ | 12,605,821 | |
| | | | |
| | | | | | |
The notes to the financial statements are an integral part of,
and should be read in conjunction with, the financial statements. | | mainstayinvestments.com | | | 49 | |
Statements of Changes in Net Assets
for the six months ended April 30, 2013 (Unaudited) and the year ended October 31, 2012
| | | | | | | | |
| | | 2013 | | | 2012 | |
| Increase (Decrease) in Net Assets | |
Operations: | | | | | | | | |
Net investment income (loss) | | $ | 1,431,682 | | | $ | 2,171,231 | |
Net realized gain (loss) on investments from affiliated and unaffiliated investment companies transactions | | | 2,647,380 | | | | 207,813 | |
Net change in unrealized appreciation (depreciation) on investments | | | 8,526,759 | | | | 10,870,200 | |
| | | | |
Net increase (decrease) in net assets resulting from operations | | | 12,605,821 | | | | 13,249,244 | |
| | | | |
Dividends and distributions to shareholders: | | | | | |
From net investment income: | | | | | | | | |
Investor Class | | | (95,143 | ) | | | (37,649 | ) |
Class A | | | (252,300 | ) | | | (192,901 | ) |
Class I | | | (1,595,374 | ) | | | (1,656,570 | ) |
Class R2 | | | (358,338 | ) | | | (201,066 | ) |
Class R3 | | | (114,083 | ) | | | (68,101 | ) |
| | | | |
| | | (2,415,238 | ) | | | (2,156,287 | ) |
| | | | |
From net realized gain on investments: | | | | | | | | |
Investor Class | | | (72,927 | ) | | | (203,972 | ) |
Class A | | | (189,164 | ) | | | (964,934 | ) |
Class I | | | (1,048,849 | ) | | | (7,280,971 | ) |
Class R2 | | | (282,263 | ) | | | (1,104,637 | ) |
Class R3 | | | (102,563 | ) | | | (432,560 | ) |
| | | | |
| | | (1,695,766 | ) | | | (9,987,074 | ) |
| | | | |
Total dividends and distributions to shareholders | | | (4,111,004 | ) | | | (12,143,361 | ) |
| | | | |
Capital share transactions: | | | | | | | | |
Net proceeds from sale of shares | | | 14,807,912 | | | | 33,159,608 | |
Net asset value of shares issued to shareholders in reinvestment of dividends and distributions | | | 4,107,671 | | | | 12,140,972 | |
Cost of shares redeemed | | | (21,128,794 | ) | | | (66,727,207 | ) |
| | | | |
Increase (decrease) in net assets derived from capital share transactions | | | (2,213,211 | ) | | | (21,426,627 | ) |
| | | | |
Net increase (decrease) in net assets | | | 6,281,606 | | | | (20,320,744 | ) |
| | |
| Net Assets | | | | | | | | |
Beginning of period | | | 121,667,492 | | | | 141,988,236 | |
| | | | |
End of period | | $ | 127,949,098 | | | $ | 121,667,492 | |
| | | | |
Undistributed net investment income at end of period | | $ | 107,818 | | | $ | 1,091,374 | |
| | | | |
| | | | |
| 50 | | MainStay Retirement 2030 Fund | | The notes to the financial statements are an integral part of,
and should be read in conjunction with, the financial statements. |
Financial Highlights selected per share data and ratios
| | | | | | | | | | | | | | | | | | | | | | | | |
| | | Investor Class | |
| | | Six months
ended
April 30, | | | Year ended October 31, | | | February 28,
2008**
through
October 31, | |
| | | 2013* | | | 2012 | | | 2011 | | | 2010 | | | 2009 | | | 2008 | |
Net asset value at beginning of period | | $ | 9.13 | | | $ | 9.03 | | | $ | 8.99 | | | $ | 7.97 | | | $ | 6.92 | | | $ | 9.60 | |
| | | | | | | | | | | | | | | | | | | | | | | | |
Net investment income (loss) (a) | | | 0.10 | | | | 0.11 | | | | 0.12 | | | | 0.09 | | | | 0.12 | | | | 0.07 | |
Net realized and unrealized gain (loss) on investments | | | 0.91 | | | | 0.74 | | | | 0.10 | | | | 1.04 | | | | 1.07 | | | | (2.75 | ) |
| | | | | | | | | | | | | | | | | | | | | | | | |
Total from investment operations | | | 1.01 | | | | 0.85 | | | | 0.22 | | | | 1.13 | | | | 1.19 | | | | (2.68 | ) |
| | | | | | | | | | | | | | | | | | | | | | | | |
Less dividends and distributions: | | | | | | | | | | | | | | | | | | | | | | | | |
From net investment income | | | (0.18 | ) | | | (0.12 | ) | | | (0.13 | ) | | | (0.11 | ) | | | (0.13 | ) | | | — | |
From net realized gain on investments | | | (0.14 | ) | | | (0.63 | ) | | | (0.05 | ) | | | — | | | | (0.01 | ) | | | — | |
| | | | | | | | | | | | | | | | | | | | | | | | |
Total dividends and distributions | | | (0.32 | ) | | | (0.75 | ) | | | (0.18 | ) | | | (0.11 | ) | | | (0.14 | ) | | | — | |
| | | | | | | | | | | | | | | | | | | | | | | | |
Net asset value at end of period | | $ | 9.82 | | | $ | 9.13 | | | $ | 9.03 | | | $ | 8.99 | | | $ | 7.97 | | | $ | 6.92 | |
| | | | | | | | | | | | | | | | | | | | | | | | |
Total investment return (b) | | | 11.44 | %(c) | | | 10.37 | % | | | 2.46 | % | | | 14.30 | % | | | 17.67 | % | | | (27.92 | %)(c) |
Ratios (to average net assets)/Supplemental Data: | | | | | | | | | | | | | | | | | | | | | | | | |
Net investment income (loss) | | | 2.21 | %†† | | | 1.20 | % | | | 1.33 | % | | | 1.05 | % | | | 1.75 | % | | | 1.26 | % †† |
Net expenses (d) | | | 0.47 | %†† | | | 0.47 | % | | | 0.47 | % | | | 0.47 | % | | | 0.47 | % | | | 0.46 | % †† |
Expenses (before waiver/reimbursement) (d) | | | 0.83 | %†† | | | 0.90 | % | | | 0.98 | % | | | 1.34 | % | | | 1.70 | % | | | 1.42 | % †† |
Portfolio turnover rate | | | 29 | % | | | 101 | % | | | 104 | % | | | 60 | % | | | 71 | % | | | 148 | % |
Net assets at end of period (in 000’s) | | $ | 5,903 | | | $ | 4,447 | | | $ | 2,768 | | | $ | 1,785 | | | $ | 606 | | | $ | 104 | |
| ** | Commencement of operations. |
| (a) | Per share data based on average shares outstanding during the period. |
| (b) | Total investment return is calculated exclusive of sales charges and assumes the reinvestment of dividends and distributions. |
| (c) | Total investment return is not annualized. |
| (d) | In addition to the fees and expenses which the Fund bears directly, the Fund indirectly bears a pro-rata share of the fees and expenses of the Underlying Funds in which it invests. Such indirect expenses are not included in the above expense ratios. |
| | | | | | |
The notes to the financial statements are an integral part of,
and should be read in conjunction with, the financial statements. | | mainstayinvestments.com | | | 51 | |
Financial Highlights selected per share data and ratios
| | | | | | | | | | | | | | | | | | | | | | | | |
| | | Class A | |
| | | Six months
ended
April 30, | | | Year ended October 31, | |
| | | 2013* | | | 2012 | | | 2011 | | | 2010 | | | 2009 | | | 2008 | |
Net asset value at beginning of period | | $ | 9.11 | | | $ | 9.01 | | | $ | 8.97 | | | $ | 7.95 | | | $ | 6.92 | | | $ | 10.59 | |
| | | | | | | | | | | | | | | | | | | | | | | | |
Net investment income (loss) (a) | | | 0.11 | | | | 0.13 | | | | 0.14 | | | | 0.10 | | | | 0.15 | | | | 0.11 | |
Net realized and unrealized gain (loss) on investments | | | 0.91 | | | | 0.73 | | | | 0.09 | | | | 1.04 | | | | 1.05 | | | | (3.69 | ) |
| | | | | | | | | | | | | | | | | | | | | | | | |
Total from investment operations | | | 1.02 | | | | 0.86 | | | | 0.23 | | | | 1.14 | | | | 1.20 | | | | (3.58 | ) |
| | | | | | | | | | | | | | | | | | | | | | | | |
Less dividends and distributions: | | | | | | | | | | | | | | | | | | | | | | | | |
From net investment income | | | (0.19 | ) | | | (0.13 | ) | | | (0.14 | ) | | | (0.12 | ) | | | (0.16 | ) | | | (0.08 | ) |
From net realized gain on investments | | | (0.14 | ) | | | (0.63 | ) | | | (0.05 | ) | | | — | | | | (0.01 | ) | | | (0.01 | ) |
| | | | | | | | | | | | | | | | | | | | | | | | |
Total dividends and distributions | | | (0.33 | ) | | | (0.76 | ) | | | (0.19 | ) | | | (0.12 | ) | | | (0.17 | ) | | | (0.09 | ) |
| | | | | | | | | | | | | | | | | | | | | | | | |
Net asset value at end of period | | $ | 9.80 | | | $ | 9.11 | | | $ | 9.01 | | | $ | 8.97 | | | $ | 7.95 | | | $ | 6.92 | |
| | | | | | | | | | | | | | | | | | | | | | | | |
Total investment return (b) | | | 11.51 | %(c) | | | 10.50 | % | | | 2.55 | % | | | 14.40 | % | | | 17.63 | % | | | (33.97 | %) |
Ratios (to average net assets)/Supplemental Data: | | | | | | | | | | | | | | | | | | | | | | | | |
Net investment income (loss) | | | 2.35 | %†† | | | 1.49 | % | | | 1.52 | % | | | 1.25 | % | | | 2.14 | % | | | 1.22 | % |
Net expenses (d) | | | 0.37 | %†† | | | 0.37 | % | | | 0.37 | % | | | 0.37 | % | | | 0.37 | % | | | 0.38 | % |
Expenses (before waiver/reimbursement) (d) | | | 0.62 | %†† | | | 0.61 | % | | | 0.65 | % | | | 0.89 | % | | | 1.01 | % | | | 1.76 | % |
Portfolio turnover rate | | | 29 | % | | | 101 | % | | | 104 | % | | | 60 | % | | | 71 | % | | | 148 | % |
Net assets at end of period (in 000’s) | | $ | 14,128 | | | $ | 11,725 | | | $ | 13,573 | | | $ | 12,733 | | | $ | 10,314 | | | $ | 4,784 | |
| (a) | Per share data based on average shares outstanding during the period. |
| (b) | Total investment return is calculated exclusive of sales charges and assumes the reinvestment of dividends and distributions. |
| (c) | Total investment return is not annualized. |
| (d) | In addition to the fees and expenses which the Fund bears directly, the Fund indirectly bears a pro-rata share of the fees and expenses of the Underlying Funds in which it invests. Such indirect expenses are not included in the above expense ratios. |
| | | | |
| 52 | | MainStay Retirement 2030 Fund | | The notes to the financial statements are an integral part of,
and should be read in conjunction with, the financial statements. |
Financial Highlights selected per share data and ratios
| | | | | | | | | | | | | | | | | | | | | | | | |
| | | Class I | |
| | | Six months
ended
April 30, | | | Year ended October 31, | |
| | | 2013* | | | 2012 | | | 2011 | | | 2010 | | | 2009 | | | 2008 | |
Net asset value at beginning of period | | $ | 9.19 | | | $ | 9.08 | | | $ | 9.04 | | | $ | 8.00 | | | $ | 6.94 | | | $ | 10.60 | |
| | | | | | | | | | | | | | | | | | | | | | | | |
Net investment income (loss) (a) | | | 0.12 | | | | 0.15 | | | | 0.15 | | | | 0.13 | | | | 0.17 | | | | 0.13 | |
Net realized and unrealized gain (loss) on investments | | | 0.93 | | | | 0.73 | | | | 0.10 | | | | 1.04 | | | | 1.04 | | | | (3.69 | ) |
| | | | | | | | | | | | | | | | | | | | | | | | |
Total from investment operations | | | 1.05 | | | | 0.88 | | | | 0.25 | | | | 1.17 | | | | 1.21 | | | | (3.56 | ) |
| | | | | | | | | | | | | | | | | | | | | | | | |
Less dividends and distributions: | | | | | | | | | | | | | | | | | | | | | | | | |
From net investment income | | | (0.22 | ) | | | (0.14 | ) | | | (0.16 | ) | | | (0.13 | ) | | | (0.14 | ) | | | (0.09 | ) |
From net realized gain on investments | | | (0.14 | ) | | | (0.63 | ) | | | (0.05 | ) | | | — | | | | (0.01 | ) | | | (0.01 | ) |
| | | | | | | | | | | | | | | | | | | | | | | | |
Total dividends and distributions | | | (0.36 | ) | | | (0.77 | ) | | | (0.21 | ) | | | (0.13 | ) | | | (0.15 | ) | | | (0.10 | ) |
| | | | | | | | | | | | | | | | | | | | | | | | |
Net asset value at end of period | | $ | 9.88 | | | $ | 9.19 | | | $ | 9.08 | | | $ | 9.04 | | | $ | 8.00 | | | $ | 6.94 | |
| | | | | | | | | | | | | | | | | | | | | | | | |
Total investment return (b) | | | 11.73 | %(c) | | | 10.64 | % | | | 2.85 | % | | | 14.77 | % | | | 17.96 | % | | | (33.86 | %) |
Ratios (to average net assets)/Supplemental Data: | | | | | | | | | | | | | | | | | | | | | | | | |
Net investment income (loss) | | | 2.60 | %†† | | | 1.73 | % | | | 1.58 | % | | | 1.52 | % | | | 2.37 | % | | | 1.49 | % |
Net expenses (d) | | | 0.12 | %†† | | | 0.12 | % | | | 0.12 | % | | | 0.12 | % | | | 0.12 | % | | | 0.13 | % |
Expenses (before waiver/reimbursement) (d) | | | 0.37 | %†† | | | 0.36 | % | | | 0.40 | % | | | 0.64 | % | | | 0.76 | % | | | 1.36 | % |
Portfolio turnover rate | | | 29 | % | | | 101 | % | | | 104 | % | | | 60 | % | | | 71 | % | | | 148 | % |
Net assets at end of period (in 000’s) | | $ | 78,868 | | | $ | 80,756 | | | $ | 104,015 | | | $ | 63,817 | | | $ | 50,513 | | | $ | 23,249 | |
| (a) | Per share data based on average shares outstanding during the period. |
| (b) | Total investment return is calculated exclusive of sales charges and assumes the reinvestment of dividends and distributions. Class I shares are not subject to sales charges. |
| (c) | Total investment return is not annualized. |
| (d) | In addition to the fees and expenses which the Fund bears directly, the Fund indirectly bears a pro-rata share of the fees and expenses of the Underlying Funds in which it invests. Such indirect expenses are not included in the above expense ratios. |
| | | | | | |
The notes to the financial statements are an integral part of,
and should be read in conjunction with, the financial statements. | | mainstayinvestments.com | | | 53 | |
Financial Highlights selected per share data and ratios
| | | | | | | | | | | | | | | | | | | | |
| | | Class R2 | |
| | | Six months
ended
April 30, | | | Year ended October 31, | | | January 8,
2009**
through
October 31, | |
| | | 2013* | | | 2012 | | | 2011 | | | 2010 | | | 2009 | |
Net asset value at beginning of period | | $ | 9.10 | | | $ | 9.00 | | | $ | 8.96 | | | $ | 7.94 | | | $ | 6.64 | |
| | | | | | | | | | | | | | | | | | | | |
Net investment income (loss) (a) | | | 0.11 | | | | 0.11 | | | | 0.11 | | | | 0.09 | | | | 0.08 | |
Net realized and unrealized gain (loss) on investments | | | 0.91 | | | | 0.74 | | | | 0.11 | | | | 1.03 | | | | 1.22 | |
| | | | | | | | | | | | | | | | | | | | |
Total from investment operations | | | 1.02 | | | | 0.85 | | | | 0.22 | | | | 1.12 | | | | 1.30 | |
| | | | | | | | | | | | | | | | | | | | |
Less dividends and distributions: | | | | | | | | | | | | | | | | | | | | |
From net investment income | | | (0.18 | ) | | | (0.12 | ) | | | (0.13 | ) | | | (0.10 | ) | | | — | |
From net realized gain on investments | | | (0.14 | ) | | | (0.63 | ) | | | (0.05 | ) | | | — | | | | — | |
| | | | | | | | | | | | | | | | | | | | |
Total dividends and distributions | | | (0.32 | ) | | | (0.75 | ) | | | (0.18 | ) | | | (0.10 | ) | | | — | |
| | | | | | | | | | | | | | | | | | | | |
Net asset value at end of period | | $ | 9.80 | | | $ | 9.10 | | | $ | 9.00 | | | $ | 8.96 | | | $ | 7.94 | |
| | | | | | | | | | | | | | | | | | | | |
Total investment return (b) | | | 11.53 | %(c) | | | 10.36 | % | | | 2.45 | % | | | 14.27 | % | | | 19.58 | %(c)(d) |
Ratios (to average net assets)/Supplemental Data: | | | | | | | | | | | | | | | | | | | | |
Net investment income (loss) | | | 2.27 | %†† | | | 1.27 | % | | | 1.22 | % | | | 1.10 | % | | | 1.34 | %†† |
Net expenses (e) | | | 0.47 | %†† | | | 0.47 | % | | | 0.47 | % | | | 0.47 | % | | | 0.47 | %†† |
Expenses (before waiver/reimbursement) (e) | | | 0.72 | %†† | | | 0.71 | % | | | 0.75 | % | | | 0.99 | % | | | 1.10 | %†† |
Portfolio turnover rate | | | 29 | % | | | 101 | % | | | 104 | % | | | 60 | % | | | 71 | % |
Net assets at end of period (in 000’s) | | $ | 21,749 | | | $ | 18,161 | | | $ | 15,517 | | | $ | 2,907 | | | $ | 1,540 | |
| ** | Commencement of operations. |
| (a) | Per share data based on average shares outstanding during the period. |
| (b) | Total investment return is calculated exclusive of sales charges and assumes the reinvestment of dividends and distributions. Class R2 shares are not subject to sales charges. |
| (c) | Total investment return is not annualized. |
| (d) | Total investment return may reflect adjustments to conform to generally accepted accounting principles. |
| (e) | In addition to the fees and expenses which the Fund bears directly, the Fund indirectly bears a pro-rata share of the fees and expenses of the Underlying Funds in which it invests. Such indirect expenses are not included in the above expense ratios. |
| | | | |
| 54 | | MainStay Retirement 2030 Fund | | The notes to the financial statements are an integral part of,
and should be read in conjunction with, the financial statements. |
Financial Highlights selected per share data and ratios
| | | | | | | | | | | | | | | | | | | | | | | | |
| | | Class R3 | |
| | | Six months
ended
April 30, | | | Year ended October 31, | | | May 1,
2008**
through
October 31, | |
| | | 2013* | | | 2012 | | | 2011 | | | 2010 | | | 2009 | | | 2008 | |
Net asset value at beginning of period | | $ | 9.10 | | | $ | 9.01 | | | $ | 8.97 | | | $ | 7.96 | | | $ | 6.92 | | | $ | 9.76 | |
| | | | | | | | | | | | | | | | | | | | | | | | |
Net investment income (loss) (a) | | | 0.10 | | | | 0.09 | | | | 0.11 | | | | 0.08 | | | | 0.14 | | | | 0.03 | |
Net realized and unrealized gain (loss) on investments | | | 0.91 | | | | 0.73 | | | | 0.09 | | | | 1.02 | | | | 1.03 | | | | (2.87 | ) |
| | | | | | | | | | | | | | | | | | | | | | | | |
Total from investment operations | | | 1.01 | | | | 0.82 | | | | 0.20 | | | | 1.10 | | | | 1.17 | | | | (2.84 | ) |
| | | | | | | | | | | | | | | | | | | | | | | | |
Less dividends and distributions: | | | | | | | | | | | | | | | | | | | | | | | | |
From net investment income | | | (0.16 | ) | | | (0.10 | ) | | | (0.11 | ) | | | (0.09 | ) | | | (0.12 | ) | | | — | |
From net realized gain on investments | | | (0.14 | ) | | | (0.63 | ) | | | (0.05 | ) | | | — | | | | (0.01 | ) | | | — | |
| | | | | | | | | | | | | | | | | | | | | | | | |
Total dividends and distributions | | | (0.30 | ) | | | (0.73 | ) | | | (0.16 | ) | | | (0.09 | ) | | | (0.13 | ) | | | — | |
| | | | | | | | | | | | | | | | | | | | | | | | |
Net asset value at end of period | | $ | 9.81 | | | $ | 9.10 | | | $ | 9.01 | | | $ | 8.97 | | | $ | 7.96 | | | $ | 6.92 | |
| | | | | | | | | | | | | | | | | | | | | | | | |
Total investment return (b) | | | 11.25 | %(c) | | | 10.15 | % | | | 2.23 | % | | | 13.97 | % | | | 17.28 | % | | | (29.10 | %)(c) |
Ratios (to average net assets)/Supplemental Data: | | | | | | | | | | | | | | | | | | | | | | | | |
Net investment income (loss) | | | 2.05 | %†† | | | 1.05 | % | | | 1.18 | % | | | 0.91 | % | | | 1.98 | % | | | 0.79 | % †† |
Net expenses (d) | | | 0.72 | %†† | | | 0.72 | % | | | 0.72 | % | | | 0.72 | % | | | 0.72 | % | | | 0.73 | % †† |
Expenses (before waiver/reimbursement) (d) | | | 0.97 | %†† | | | 0.96 | % | | | 1.00 | % | | | 1.24 | % | | | 1.36 | % | | | 1.69 | % †† |
Portfolio turnover rate | | | 29 | % | | | 101 | % | | | 104 | % | | | 60 | % | | | 71 | % | | | 148 | % |
Net assets at end of period (in 000’s) | | $ | 7,302 | | | $ | 6,579 | | | $ | 6,115 | | | $ | 5,946 | | | $ | 4,901 | | | $ | 3,695 | |
| ** | Commencement of operations. |
| (a) | Per share data based on average shares outstanding during the period. |
| (b) | Total investment return is calculated exclusive of sales charges and assumes the reinvestment of dividends and distributions. Class R3 shares are not subject to sales charges. |
| (c) | Total investment return is not annualized. |
| (d) | In addition to the fees and expenses which the Fund bears directly, the Fund indirectly bears a pro-rata share of the fees and expenses of the Underlying Funds in which it invests. Such indirect expenses are not included in the above expense ratios. |
| | | | | | |
The notes to the financial statements are an integral part of,
and should be read in conjunction with, the financial statements. | | mainstayinvestments.com | | | 55 | |
MainStay Retirement 2040 Fund
Investment and Performance Comparison1 (Unaudited)
Performance data quoted represents past performance. Past performance is no guarantee of future results. Because of market volatility, current performance may be lower or higher than the figures shown. Investment return and principal value will fluctuate, and as a result, when shares are redeemed, they may be worth more or less than their original cost. The graph below depicts the historical performance of Class I shares of the Fund. Performance will vary from class to class based on differences in class-specific expenses and sales charges. For performance information current to the most recent month-end, please call 800-MAINSTAY (624-6782) or visit mainstayinvestments.com.
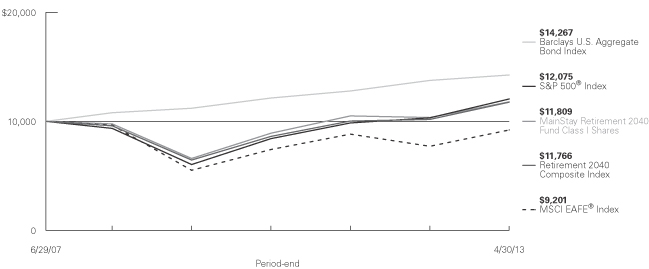
Average Annual Total Returns for the Period Ended April 30, 2013
| | | | | | | | | | | | | | | | | | | | | | | | |
| Class | | Sales Charge | | | | Six Months | | | One Year | | | Five Years | | | Since Inception (6/29/07) | | | Gross Expense Ratio2 | |
| Investor Class Shares3 | | Maximum 5.5% Initial Sales Charge | | With sales charges Excluding sales charges | |
| 6.62
12.82 | %
| |
| 7.58
13.84 | %
| |
| 2.36
3.52 | %
| |
| 1.59
2.57 | %
| |
| 1.81
1.81 | %
|
| Class A Shares | | Maximum 5.5% Initial Sales Charge | | With sales charges Excluding sales charges | |
| 6.61
12.81 |
| |
| 7.69
13.96 |
| |
| 2.43
3.60 |
| |
| 1.65
2.64 |
| |
| 1.55
1.55 |
|
| Class I Shares | | No Sales Charge | | | | | 12.88 | | | | 14.15 | | | | 3.84 | | | | 2.89 | | | | 1.30 | |
| Class R1 Shares4 | | No Sales Charge | | | | | 12.89 | | | | 14.13 | | | | 3.76 | | | | 2.79 | | | | 1.40 | |
| Class R2 Shares5 | | No Sales Charge | | | | | 12.78 | | | | 13.93 | | | | 3.54 | | | | 2.57 | | | | 1.65 | |
| Class R3 Shares6 | | No Sales Charge | | | | | 12.56 | | | | 13.58 | | | | 3.23 | | | | 2.28 | | | | 1.90 | |
| 1. | The performance table and graph do not reflect the deduction of taxes that a shareholder would pay on dividends, distributions or Fund share redemptions. Total returns reflect maximum applicable sales charges as indicated in the table above, changes in share price, and reinvestment of dividend and capital gain distributions. The graph assumes the initial investment amount shown above and reflects the deduction of all sales charges that would have applied for the period of investment. Performance figures reflect certain fee waivers and/or expense limitations, without which total returns may have been lower. For more information on share classes and current fee waivers and/or expense limitations, please refer to the notes to the financial statements. |
| 2. | The gross expense ratios presented reflect the Fund’s “Total Annual Fund Operating Expenses” from the most recent Prospectus and may differ from other expense ratios disclosed in this report. |
| 3. | Performance figures for Investor Class shares, first offered February 28, 2008, include the historical performance of Class A shares through February 27, 2008, adjusted for differences in certain expenses and fees. Unadjusted, the performance shown for Investor Class shares would likely have been different. |
| 4. | Class R1 shares were first offered the public on June 29, 2007, although this class of shares has not yet commenced operations as of April 30, 2013. As a result, the performance for Class R1 shares include the historical performance of Class A shares through April 30, 2013, adjusted differences in certain expenses and fees. Unadjusted, the performance shown for Class R1 would likely have been different. |
| 5. | Class R2 shares were first offered on June 29, 2007, although this class did not commence investment operations until January 8, 2009. Performance figures for Class R2 shares include the historical performance of Class A shares through January 7, 2009, adjusted for differences in certain expenses and fees. Unadjusted, the performance shown for Class R2 shares would likely have been different. |
| 6. | Class R3 shares were first offered on June 29, 2007, although this class did not commence investment operations until May 1, 2008. Performance figures for Class R3 shares include the historical performance of Class A shares through April 30, 2008, adjusted for differences in certain expenses and fees. Unadjusted, the performance shown for Class R3 shares would likely have been different. |
The footnotes on the next page are an integral part of the table and graph and should be carefully read in conjunction with them.
| | |
| 56 | | MainStay Retirement 2040 Fund |
| | | | | | | | | | | | | | | | |
| Benchmark Performance | | Six Months | | | One Year | | | Five
Years | | | Since
Inception | |
S&P 500® Index7 | | | 14.42 | % | | | 16.89 | % | | | 5.21 | % | | | 3.29 | % |
MSCI EAFE® Index8 | | | 16.90 | | | | 19.39 | | | | –0.93 | | | | –1.42 | |
Barclays U.S. Aggregate Bond Index9 | | | 0.90 | | | | 3.68 | | | | 5.72 | | | | 6.28 | |
Retirement 2040 Composite Index10 | | | 12.97 | | | | 15.61 | | | | 4.15 | | | | 2.82 | |
Average Lipper Mixed-Asset Target 2040 Fund11 | | | 11.55 | | | | 13.03 | | | | 3.24 | | | | 1.74 | |
| 7. | “S&P 500®” is a trademark of The McGraw-Hill Companies, Inc. The S&P 500® Index is widely regarded as the standard index for measuring large-cap U.S. stock market performance. The S&P 500 Index is the Fund’s broad-based securities market index. Results assume reinvestment of all income and capital gains. An investment cannot be made directly in an index. |
| 8. | The MSCI EAFE® Index consists of international stocks representing the developed world outside of North America. The MSCI EAFE® Index is the Fund’s secondary benchmark. Results assume reinvestment of all income and capital gains. An investment cannot be made directly in an index. |
| 9. | The Barclays U.S. Aggregate Bond Index is a broad-based benchmark that measures the investment grade, U.S. dollar-denominated, fixed-rate taxable bond market, including Treasurys, government-related and corporate securities, mortgage-backed securities (agency fixed-rate and hybrid adjustable rate mortgage pass-throughs), asset-backed securities, and commercial mortgage-backed securities. The Fund has selected the Barclays U.S. Aggregate Bond Index as an additional benchmark. Results |
| | assume reinvestment of all income and capital gains. An investment cannot be made directly in an index. |
| 10. | The Retirement 2040 Composite Index consists of the S&P 500® Index, the MSCI EAFE® Index and the Barclays U.S. Aggregate Bond Index weighted according to the Fund’s current allocation, changing annually through the target retirement date. The Fund has selected the Retirement 2040 Composite Index as an additional benchmark. Total returns assume reinvestment of all dividends and capital gains. An investment cannot be made directly in an index. |
| 11. | The average Lipper mixed-asset target 2040 fund is representative of funds that seek to maximize assets for retirement or other purposes with an expected time horizon from January 1, 2036, to December 31, 2040. This benchmark is a product of Lipper Inc. Lipper Inc. is an independent monitor of fund performance. Results are based on average total returns of similar funds with all dividend and capital gain distributions reinvested. |
The footnotes on the preceding page are an integral part of the table and graph and should be carefully read in conjunction with them.
| | | | |
| mainstayinvestments.com | | | 57 | |
Cost in Dollars of a $1,000 Investment in MainStay Retirement 2040 Fund (Unaudited)
The example below is intended to describe the fees and expenses borne by shareholders during the six-month period from November 1, 2012, to April 30, 2013, and the impact of those costs on your investment.
Example
As a shareholder of the Fund, you incur two types of costs: (1) transaction costs, including exchange fees and sales charges (loads) on purchases (as applicable), and (2) ongoing costs, including management fees, distribution and/or service (12b-1) fees, and other Fund expenses (as applicable). This example is intended to help you understand your ongoing costs (in dollars) of investing in the Fund and to compare these costs with the ongoing costs of investing in other mutual funds. The example is based on an investment of $1,000 made at the beginning of the six-month period and held for the entire period from November 1, 2012, to April 30, 2013.
This example illustrates your Fund’s ongoing costs in two ways:
Actual Expenses
The second and third data columns in the table below provide information about actual account values and actual expenses. You may use the information in these columns, together with the amount you invested, to estimate the expenses that you paid during the six months ended April 30, 2013. Simply divide your account value by $1,000 (for example, an $8,600 account value divided by $1,000 = 8.6), then
multiply the result by the number under the heading entitled ‘‘Expenses Paid During Period’’ to estimate the expenses you paid on your account during this period.
Hypothetical Example for Comparison Purposes
The fourth and fifth data columns in the table below provide information about hypothetical account values and hypothetical expenses based on the Fund’s actual expense ratio and an assumed rate of return of 5% per year before expenses, which is not the Fund’s actual return. The hypothetical account values and expenses may not be used to estimate the actual ending account balances or expenses you paid for the six-month period shown. You may use this information to compare the ongoing costs of investing in the Fund with the ongoing costs of investing in other Funds. To do so, compare this 5% hypothetical example with the 5% hypothetical examples that appear in the shareholder reports of the other Funds.
Please note that the expenses shown in the table are meant to highlight your ongoing costs only and do not reflect any transactional costs, such as exchange fees or sales charges (loads). Therefore, the fourth and fifth data columns of the table are useful in comparing ongoing costs only and will not help you determine the relative total costs of owning different funds. In addition, if these transactional costs were included, your costs would have been higher.
| | | | | | | | | | | | | | | | | | | | |
| | | | | | | | | | | | | | | | |
| Share Class | | Beginning
Account
Value
11/1/12 | | | Ending Account
Value (Based
on Actual
Returns and
Expenses)
4/30/13 | | | Expenses
Paid
During
Period1 | | | Ending Account
Value (Based
on Hypothetical
5% Annualized
Return and
Actual Expenses)
4/30/13 | | | Expenses
Paid
During
Period1 | |
| | | | | |
| Investor Class Shares | | $ | 1,000.00 | | | $ | 1,128.20 | | | $ | 2.48 | | | $ | 1,022.50 | | | $ | 2.36 | |
| | | | | |
| Class A Shares | | $ | 1,000.00 | | | $ | 1,128.10 | | | $ | 1.95 | | | $ | 1,023.00 | | | $ | 1.86 | |
| | | | | |
| Class I Shares | | $ | 1,000.00 | | | $ | 1,128.80 | | | $ | 0.63 | | | $ | 1,024.20 | | | $ | 0.60 | |
| | | | | |
| Class R2 Shares | | $ | 1,000.00 | | | $ | 1,127.80 | | | $ | 2.48 | | | $ | 1,022.50 | | | $ | 2.36 | |
| | | | | |
| Class R3 Shares | | $ | 1,000.00 | | | $ | 1,125.60 | | | $ | 3.79 | | | $ | 1,021.20 | | | $ | 3.61 | |
| 1. | Expenses are equal to the Fund’s annualized expense ratio of each class (0.47% for Investor Class, 0.37% for Class A, 0.12% for Class I, 0.47% for Class R2 and 0.72% for Class R3) multiplied by the average account value over the period, divided by 365 and multiplied by 181 (to reflect the six-month period). The table above represents the actual expenses incurred during the six-month period. In addition to the fees and expenses which the Fund bears directly, the Fund indirectly bears a pro rata share of the fees and expenses of the Underlying Funds in which it invests. Such indirect expenses are not included in the above-reported expense figures. |
| | |
| 58 | | MainStay Retirement 2040 Fund |
Investment Objectives of Underlying Funds as of April 30, 2013 (Unaudited)

See Portfolio of Investments beginning on page 63 for specific holdings within these categories.
| | | | |
| mainstayinvestments.com | | | 59 | |
Portfolio Management Discussion and Analysis (Unaudited)
Questions answered by portfolio managers Jae S. Yoon, CFA, Jonathan Swaney and Poul Kristensen, CFA, of New York Life Investments.1
How did MainStay Retirement 2040 Fund perform relative to its peers and its benchmark during the six months ended April 30, 2013?
Excluding all sales charges, MainStay Retirement 2040 Fund returned 12.82% for Investor Class shares and 12.81% for Class A shares for the six months ended April 30, 2013. Over the same period, Class I shares returned 12.88%, Class R1 shares2 returned 12.89%, Class R2 shares returned 12.78% and Class R3 shares returned 12.56%. All share classes outperformed the 11.55% return of the average Lipper3 mixed-asset target 2040 fund for the six months ended April 30, 2013. Over the same period, all share classes underperformed the 14.42% return of the S&P 500® Index4 and the 16.90% return of the MSCI EAFE® Index.5 The S&P 500® Index is the Fund’s broad-based securities-market index, and the MSCI EAFE® Index is the secondary benchmark of the Fund. All share classes outperformed the 0.90% return of the Barclays U.S. Aggregate Bond Index6 but underperformed the 12.97% return of the Retirement 2040 Composite Index7 for the six months ended April 30, 2013. The Barclays U.S. Aggregate Bond Index and the Retirement 2040 Composite Index are additional benchmarks of the Fund. See page 56 for Fund returns with applicable sales charges.
Were there any changes to the Fund during the reporting period?
Effective February 28, 2013, the Fund’s Principal Investment Strategies were modified to broaden the investment ranges for each of the asset classes in which the Fund may invest by an additional ten percentage points. Also effective February 28, 2013, Poul Kristensen, CFA, was added as a portfolio manager. Please see the Prospectus dated February 28, 2013, for more information.
What factors affected the Fund’s relative performance during the reporting period?
The Fund invests primarily in mutual funds managed by New York Life Investments, mutual funds managed by an advisor not affiliated with New York Life Investments or exchange traded funds (“ETFs”), if a New York Life Investments managed mutual fund in a particular asset class is not available (collectively, “Underlying Funds”). The Underlying Funds may invest in fixed-income securities or in domestic or international stocks at various capitalization levels. The Fund’s primary benchmark, on the other hand, consists entirely of U.S. large-cap stocks. These differences—particularly the Fund’s substantial allocation to
Underlying Funds that invest in fixed-income securities— accounted for many of the challenges the Fund experienced in terms of relative performance.
During the reporting period, the Fund underperformed the Retirement 2040 Composite Index but outperformed the average peer fund. The Fund’s asset-allocation policy was a net detractor. We maintained a neutral blend at the start of the reporting period, then moved aggressively to overweight equities during the latter half of the fourth quarter. This proved to be a very profitable strategy, but the benefit was more than offset by a heavy allocation to emerging-market stocks, an emphasis on large-cap stocks rather than small-cap stocks, and a bias toward U.S. equities over those of other developed nations. In the fixed-income portion of the Fund, a bias toward lower-quality bond offerings aided performance. Our decision to keep duration8 short in the fixed-income portion of the Fund had no meaningful impact on the Fund’s performance.
Performance of the Underlying Funds also affected relative results. Relying on MainStay Large Cap Growth Fund more heavily than MainStay Cornerstone Growth Fund proved beneficial. Other positive contributors in the equity portion of the Fund included MainStay MAP Fund and MainStay U.S. Small Cap Fund. A number of significant holdings fared less well, with MainStay International Equity Fund featuring prominently on that list. All told, the performance of all Underlying Funds presented a slight drag on the Fund’s relative return.
How did you allocate the Fund’s assets during the reporting period and why?
We considered a variety of information, including the portfolio-level characteristics of the Underlying Funds, such as capitalization, style biases, sector exposures, credit quality and duration. We also examined the attributes of the Underlying Funds’ holdings, such as valuation metrics, earnings data and technical indicators. Finally, we evaluated the historical success of the managers responsible for the Underlying Funds. Generally speaking, we seek to invest in Underlying Funds that occupy attractively valued segments of the market, invest in fairly priced securities and are steered by individuals who have consistently demonstrated capable management in the past.
The Fund’s allocations to stocks and bonds varied over the course of the reporting period in response to the changing environment. We believed that equities presented a sizable
| 1. | “New York Life Investments” is a service mark used by New York Life Investment Management LLC. |
| 2. | See footnote on page 56 for more information on Class R1 shares. |
| 3. | See footnote on page 57 for more information on Lipper Inc. |
| 4. | See footnote on page 57 for more information on the S&P 500® Index. |
| 5. | See footnote on page 57 for more information on the MSCI EAFE® Index. |
| 6. | See footnote on page 57 for more information on the Barclays U.S. Aggregate Bond Index. |
| 7. | See footnote on page 57 for more information on the Retirement 2040 Composite Index. |
| 8. | Duration is a measure of the price sensitivity of a fixed-income investment to changes in interest rates. Duration is expressed as a number of years and is considered a more accurate sensitivity gauge than average maturity. |
| | |
| 60 | | MainStay Retirement 2040 Fund |
valuation advantage over bonds and that corporate profit gains would help propel stock prices higher. For these reasons, we gave the Fund a decisive tilt in favor of stocks over bonds throughout most of the reporting period. Within the equity portion of the Fund, we maintained a bias in favor of Underlying Funds that invest in U.S. stocks over Underlying Funds that invest in stocks traded in other developed markets. We were particularly concerned about countries that are likely to struggle with deleveraging issues even greater than those presented in the United States. Results were mixed, as Japan in particular experienced very strong returns on the back of aggressive fiscal and monetary policy changes. The Fund was also significantly overweight in emerging-market economies because we believed that these markets would benefit most from gradually strengthening global economic growth. During the reporting period, however, that posture detracted significantly from performance, as emerging-market stocks generally trailed stocks in developed markets by a wide margin.
In the fixed-income portion of the Fund, we continued to maintain a shorter duration than the Barclays U.S. Aggregate Bond Index. We also tilted the fixed-income portion of the Fund decidedly toward Underlying Funds that invest in corporate bonds over those that invest primarily in government-backed issues. This positioning reflected our opinion that high-grade bonds were very expensive and that issues from corporate borrowers deemed to be of lower quality represented a far more attractive proposition. Given ample liquidity and healthy corporate balance sheets, we believed that default rates were likely to remain low. We also believed that investors were likely to find the higher yields available from corporate debt quite attractive compared to the yields available on U.S. Treasury instruments.
How did the Fund’s allocations change over the course of the reporting period?
Position sizes naturally fluctuate with changing market conditions, and such changes do not always reflect an explicit change in our strategic or tactical point of view. That said, many of the most notable allocation changes during the reporting period were associated with the expanding list of eligible investments, as several new MainStay Funds became available. MainStay Short Duration High Yield Fund was one such product. The Fund selected this Underlying Fund as part of an ongoing effort to protect against a potential rise in interest rates. We quickly built the Fund’s position after the Underlying Fund’s launch in December 2012. The purchases were made with proceeds from MainStay High Yield Corporate Bond Fund and MainStay Floating Rate Fund.
MainStay Cornerstone Growth Fund was another new product. We established a position in this Underlying Fund using proceeds from MainStay Large Cap Growth Fund as we sought to widen strategy diversification within that portion of the market.
A new holding was established in MainStay High Yield Municipal Bond Fund, which further diversified sources of credit risk within the fixed-income portion of the Fund. We believed that high-yield municipal bonds would be attractive despite the inapplicability of tax benefits usually associated with these types of instruments.
Also of note, we increased the Fund’s position in MainStay U.S. Small Cap Fund as we unwound the Fund’s previous large-cap bias. The increased allocation was funded from a mix of Underlying Equity Funds. We also increased the Fund’s position in MainStay Common Stock Fund, as the strategy employed in that Underlying Fund has proven very effective in the post–credit crisis environment. In addition, we increased the Fund’s allocation to Vanguard Emerging Markets ETF with the expectation that the developing world is poised to accelerate as global growth rebounds.
During the reporting period, which Underlying Equity Funds had the highest total returns and which Under-lying Equity Funds had the lowest total returns?
MainStay International Opportunities Fund (formerly MainStay 130/30 International Fund) generated the highest absolute return by a comfortable margin, followed by MainStay U.S. Small Cap Fund. Although none of the Underlying Equity Funds in which the Fund invested provided negative returns for the reporting period, the lowest absolute returns in the equity portion of the Fund came from MainStay Cornerstone Growth Fund and Vanguard FTSE Emerging Markets ETF.
Which Underlying Equity Funds made the strongest positive contributions to the Fund’s overall perfor-mance, and which Underlying Equity Funds were the greatest detractors?
Because contributions take weightings and total returns into account and position sizes may vary, the Underlying Funds with the highest (or lowest) returns may not always have the most significantly positive (or negative) contributions to performance.
During the reporting period, large positions in MainStay MAP Fund and MainStay ICAP International Equity Fund made the largest positive contributions to the Fund’s overall performance. Although none of the Underlying Equity Funds in which the Fund invested had negative total returns, the smallest contributions came from a new position being built in MainStay Cornerstone Growth Fund and from a small position in MainStay International Equity Fund.
What factors and risks affected the Fund’s Underlying Fixed Income Fund investments during the reporting period?
Monetary policy continued to play a significant role in fixed-income markets, as has been the case for several years. Faced with persistently sluggish economic growth, slow rates of job
| | | | |
| mainstayinvestments.com | | | 61 | |
creation and the prospect of significant fiscal drag, the Federal Reserve elected to extend its large-scale asset purchase program indefinitely. This decision helped keep interest rates close to their all-time lows. During the reporting period, the Fund favored Underlying Fixed Income Funds that invest in higher-yielding corporate bonds over those that invest primarily in government-backed issues. This strategy proved fortunate. Credit performed quite well as default rates remained low and the comparatively higher yields of these bonds attracted many buyers.
During the reporting period, which fixed-income market segments were strong performers and which segments were particularly weak?
High-yield corporate bonds performed exceptionally well as spreads9 to U.S. Treasurys continued to contract. The lowest
returns came from the most liquid, highest-quality and shortest-term debt instruments. Cash returned nothing, and returns on short-term U.S. government debt and AAA bonds were only slightly higher.
Which Underlying Fixed Income Funds made the strongest positive contributions to the Fund’s perfor-mance, and which Underlying Fixed Income Funds were the greatest detractors?
The largest contributions to the fixed-income portion of the Fund came from MainStay Floating Rate Fund and Market Vectors Emerging Market Bond ETF. The contribution from positions in a variety of other Underlying Fixed Income Funds, including MainStay Money Market Fund and MainStay Short Duration High Yield Fund, was effectively zero.
| 9. | The terms “spread” and “yield spread” may refer to the difference in yield between a security or type of security and comparable U.S. Treasury issues. The terms may also refer to the difference in yield between two specific securities or types of securities at a given time. |
The opinions expressed are those of the portfolio managers as of the date of this report and are subject to change. There is no guarantee that any forecast made will come to pass. This material does not constitute investment advice and is not intended as an endorsement of any specific investment.
| | |
| 62 | | MainStay Retirement 2040 Fund |
Portfolio of Investments April 30, 2013 (Unaudited)
| | | | | | | | |
| | |
| | | Shares | | | Value | |
| Affiliated Investment Companies 81.9%† | |
Equity Funds 71.0% | |
MainStay Common Stock Fund Class I (a) | | | 762,515 | | | $ | 11,216,593 | |
MainStay Cornerstone Growth Fund Class I | | | 74,954 | | | | 2,237,362 | |
MainStay Epoch International Small Cap Fund Class I | | | 131,598 | | | | 2,660,918 | |
MainStay Epoch U.S. All Cap Fund Class I | | | 260,443 | | | | 6,552,750 | |
MainStay ICAP Equity Fund Class I | | | 124,581 | | | | 5,621,113 | |
MainStay ICAP International Fund Class I | | | 190,569 | | | | 6,180,158 | |
MainStay ICAP Select Equity Fund Class I | | | 12,014 | | | | 517,423 | |
MainStay International Equity Fund Class I | | | 208,084 | | | | 2,623,942 | |
MainStay Large Cap Growth Fund Class I | | | 534,549 | | | | 4,714,724 | |
MainStay MAP Fund Class I | | | 356,355 | | | | 14,190,047 | |
MainStay S&P 500 Index Fund Class I | | | 181,497 | | | | 6,735,351 | |
| | | | | | | | |
Total Equity Funds
(Cost $51,849,624) | | | | | | | 63,250,381 | |
| | | | | | | | |
|
Fixed Income Funds 10.9% | |
MainStay Floating Rate Fund Class I | | | 316,655 | | | | 3,058,889 | |
MainStay High Yield Corporate Bond Fund Class I | | | 16,056 | | | | 99,870 | |
MainStay High Yield Municipal Bond Fund Class I | | | 47,464 | | | | 576,215 | |
MainStay Intermediate Term Bond Fund Class I | | | 343,934 | | | | 3,827,980 | |
MainStay Money Market Fund Class A | | | 1,776,965 | | | | 1,776,965 | |
MainStay Short Duration High Yield Fund Class I | | | 37,200 | | | | 374,599 | |
MainStay Short Term Bond Fund Class I | | | 5,244 | | | | 50,447 | |
| | | | | | | | |
Total Fixed Income Funds
(Cost $9,561,032) | | | | | | | 9,764,965 | |
| | | | | | | | |
Total Affiliated Investment Companies
(Cost $61,410,656) | | | | | | | 73,015,346 | |
| | | | | | | | |
| | | | | | | | |
| | |
| | | Shares | | | Value | |
| Unaffiliated Investment Companies 17.4% | |
Equity Funds 16.3% | | | | | | | | |
iShares Russell 2000 Index ETF | | | 88,712 | | | $ | 8,351,348 | |
Vanguard Emerging Markets ETF | | | 141,855 | | | | 6,207,575 | |
| | | | | | | | |
Total Equity Funds
(Cost $12,842,160) | | | | | | | 14,558,923 | |
| | | | | | | | |
| | |
Fixed Income Fund 1.1% | | | | | | | | |
Market Vectors Emerging Markets Local
Currency Bond ETF | | | 33,721 | | | | 930,362 | |
| | | | | | | | |
Total Fixed Income Fund
(Cost $884,105) | | | | | | | 930,362 | |
| | | | | | | | |
Total Unaffiliated Investment Companies
(Cost $13,726,265) | | | | | | | 15,489,285 | |
| | | | | | | | |
Total Investments
(Cost $75,136,921) (b) | | | 99.3 | % | | | 88,504,631 | |
Other Assets, Less Liabilities | | | 0.7 | | | | 611,146 | |
Net Assets | | | 100.0 | % | | $ | 89,115,777 | |
| † | Percentages indicated are based on Fund net assets. |
| (a) | The Fund’s ownership exceeds 5% of the outstanding shares of the Underlying Fund’s share class. (See Note 3) |
| (b) | As of April 30, 2013, cost is $76,608,940 for federal income tax purposes and net unrealized appreciation is as follows: |
| | | | |
Gross unrealized appreciation | | $ | 13,367,710 | |
Gross unrealized depreciation | | | (1,472,019 | ) |
| | | | |
Net unrealized appreciation | | $ | 11,895,691 | |
| | | | |
The following abbreviation is used in the above portfolio:
ETF—Exchange Traded Fund
| | | | | | |
The notes to the financial statements are an integral part of,
and should be read in conjunction with, the financial statements. | | mainstayinvestments.com | | | 63 | |
Portfolio of Investments April 30, 2013 (Unaudited) (continued)
The following is a summary of the fair valuations according to the inputs used as of April 30, 2013, for valuing the Fund’s assets.
Asset Valuation Inputs
| | | | | | | | | | | | | | | | |
Description | | Quoted
Prices in
Active
Markets for
Identical
Assets
(Level 1) | | | Significant
Other
Observable
Inputs
(Level 2) | | | Significant
Unobservable
Inputs
(Level 3) | | | Total | |
| Investments (a) | | | | | | | | | | | | | | | | |
| Affiliated Investment Companies | | | | | | | | | | | | | | | | |
Equity Funds | | $ | 63,250,381 | | | $ | — | | | $ | — | | | $ | 63,250,381 | |
Fixed Income Funds | | | 9,764,965 | | | | — | | | | — | | | | 9,764,965 | |
| | | | | | | | | | | | | | | | |
| Total Affiliated Investment Companies | | | 73,015,346 | | | | — | | | | — | | | | 73,015,346 | |
| | | | | | | | | | | | | | | | |
| Unaffiliated Investment Companies | | | | | | | | | | | | | | | | |
Equity Funds | | | 14,558,923 | | | | — | | | | — | | | | 14,558,923 | |
Fixed Income Fund | | | 930,362 | | | | — | | | | — | | | | 930,362 | |
| | | | | | | | | | | | | | | | |
| Total Unaffiliated Investment Companies | | | 15,489,285 | | | | — | | | | — | | | | 15,489,285 | |
| | | | | | | | | | | | | | | | |
| Total Investments | | $ | 88,504,631 | | | $ | — | | | $ | — | | | $ | 88,504,631 | |
| | | | | | | | | | | | | | | | |
| (a) | For a complete listing of investments, see the Portfolio of Investments. |
The Fund recognizes transfers between the levels as of the beginning of the period.
For the period ended April 30, 2013, the Fund did not have any transfers between Level 1 and Level 2 fair value measurements. (See Note 2)
As of April 30, 2013, the Fund did not hold any investments with significant unobservable inputs (Level 3). (See Note 2)
| | | | |
| 64 | | MainStay Retirement 2040 Fund | | The notes to the financial statements are an integral part of,
and should be read in conjunction with, the financial statements. |
Statement of Assets and Liabilities as of April 30, 2013 (Unaudited)
| | | | |
| Assets | |
Investment in affiliated investment companies, at value (identified cost $61,410,656) | | $ | 73,015,346 | |
Investments in unaffiliated investment companies, at value (identified cost $13,726,265) | | | 15,489,285 | |
Cash | | | 3,237 | |
Receivables: | | | | |
Fund shares sold | | | 657,649 | |
Manager (See Note 3) | | | 15,312 | |
Other assets | | | 31,290 | |
| | | | |
Total assets | | | 89,212,119 | |
| | | | |
|
| Liabilities | |
Payables: | | | | |
Fund shares redeemed | | | 33,954 | |
Transfer agent (See Note 3) | | | 30,889 | |
Professional fees | | | 14,788 | |
NYLIFE Distributors (See Note 3) | | | 7,947 | |
Shareholder communication | | | 5,513 | |
Custodian | | | 1,096 | |
Trustees | | | 180 | |
Accrued expenses | | | 1,975 | |
| | | | |
Total liabilities | | | 96,342 | |
| | | | |
Net assets | | $ | 89,115,777 | |
| | | | |
|
| Composition of Net Assets | |
Shares of beneficial interest outstanding (par value of $.001 per share) unlimited number of shares authorized | | $ | 9,067 | |
Additional paid-in capital | | | 75,714,623 | |
| | | | |
| | | 75,723,690 | |
Distributions in excess of net investment income | | | (6,849 | ) |
Accumulated net realized gain (loss) on investments | | | 31,226 | |
Net unrealized appreciation (depreciation) on investments | | | 13,367,710 | |
| | | | |
Net assets | | $ | 89,115,777 | |
| | | | |
| | | | |
Investor Class | | | | |
Net assets applicable to outstanding shares | | $ | 4,919,457 | |
| | | | |
Shares of beneficial interest outstanding | | | 501,609 | |
| | | | |
Net asset value per share outstanding | | $ | 9.81 | |
Maximum sales charge (5.50% of offering price) | | | 0.57 | |
| | | | |
Maximum offering price per share outstanding | | $ | 10.38 | |
| | | | |
Class A | | | | |
Net assets applicable to outstanding shares | | $ | 8,458,650 | |
| | | | |
Shares of beneficial interest outstanding | | | 865,764 | |
| | | | |
Net asset value per share outstanding | | $ | 9.77 | |
Maximum sales charge (5.50% of offering price) | | | 0.57 | |
| | | | |
Maximum offering price per share outstanding | | $ | 10.34 | |
| | | | |
Class I | | | | |
Net assets applicable to outstanding shares | | $ | 55,210,172 | |
| | | | |
Shares of beneficial interest outstanding | | | 5,602,619 | |
| | | | |
Net asset value and offering price per share outstanding | | $ | 9.85 | |
| | | | |
Class R2 | | | | |
Net assets applicable to outstanding shares | | $ | 14,098,501 | |
| | | | |
Shares of beneficial interest outstanding | | | 1,439,145 | |
| | | | |
Net asset value and offering price per share outstanding | | $ | 9.80 | |
| | | | |
Class R3 | | | | |
Net assets applicable to outstanding shares | | $ | 6,428,998 | |
| | | | |
Shares of beneficial interest outstanding | | | 657,996 | |
| | | | |
Net asset value and offering price per share outstanding | | $ | 9.77 | |
| | | | |
| | | | | | |
The notes to the financial statements are an integral part of,
and should be read in conjunction with, the financial statements. | | mainstayinvestments.com | | | 65 | |
Statement of Operations for the six months ended April 30, 2013 (Unaudited)
| | | | |
| Investment Income (Loss) | |
Income | | | | |
Dividend distributions from affiliated investment companies | | $ | 901,320 | |
Dividend distributions from unaffiliated investment companies | | | 148,885 | |
| | | | |
Total income | | | 1,050,205 | |
| | | | |
Expenses | | | | |
Transfer agent (See Note 3) | | | 92,522 | |
Distribution/Service—Investor Class (See Note 3) | | | 5,180 | |
Distribution/Service—Class A (See Note 3) | | | 8,980 | |
Distribution/Service—Class R2 (See Note 3) | | | 15,458 | |
Distribution/Service—Class R3 (See Note 3) | | | 14,928 | |
Manager (See Note 3) | | | 39,895 | |
Registration | | | 33,950 | |
Professional fees | | | 14,059 | |
Shareholder service (See Note 3) | | | 9,168 | |
Shareholder communication | | | 7,352 | |
Custodian | | | 3,354 | |
Trustees | | | 908 | |
Miscellaneous | | | 4,219 | |
| | | | |
Total expenses before waiver/reimbursement | | | 249,973 | |
Expense waiver/reimbursement from Manager (See Note 3) | | | (144,322 | ) |
| | | | |
Net expenses | | | 105,651 | |
| | | | |
Net investment income (loss) | | | 944,554 | |
| | | | |
|
| Realized and Unrealized Gain (Loss) on Investments | |
Net realized gain (loss) on: | | | | |
Affiliated investment company transactions | | | 915,761 | |
Unaffiliated investment company transactions | | | (40,084 | ) |
Realized capital gain distributions from affiliated investment companies | | | 627,610 | |
| | | | |
Net realized gain (loss) on investments from affiliated and unaffiliated investment companies | | | 1,503,287 | |
| | | | |
Net change in unrealized appreciation (depreciation) on investments | | | 7,221,788 | |
| | | | |
Net realized and unrealized gain (loss) on investments | | | 8,725,075 | |
| | | | |
Net increase (decrease) in net assets resulting from operations | | $ | 9,669,629 | |
| | | | |
| | | | |
| 66 | | MainStay Retirement 2040 Fund | | The notes to the financial statements are an integral part of,
and should be read in conjunction with, the financial statements. |
Statements of Changes in Net Assets
for the six months ended April 30, 2013 (Unaudited) and the year ended October 31, 2012
| | | | | | | | |
| | | 2013 | | | 2012 | |
| Increase (Decrease) in Net Assets | |
Operations: | | | | | | | | |
Net investment income (loss) | | $ | 944,554 | | | $ | 1,061,661 | |
Net realized gain (loss) on investments from affiliated and unaffiliated investment companies transactions | | | 1,503,287 | | | | (181,516 | ) |
Net change in unrealized appreciation (depreciation) on investments | | | 7,221,788 | | | | 7,255,456 | |
| | | | |
Net increase (decrease) in net assets resulting from operations | | | 9,669,629 | | | | 8,135,601 | |
| | | | |
Dividends and distributions to shareholders: | | | | | | | | |
From net investment income: | | | | | | | | |
Investor Class | | | (62,651 | ) | | | (25,228 | ) |
Class A | | | (115,534 | ) | | | (81,939 | ) |
Class I | | | (938,889 | ) | | | (785,950 | ) |
Class R2 | | | (190,596 | ) | | | (91,012 | ) |
Class R3 | | | (80,565 | ) | | | (41,287 | ) |
| | | | |
| | | (1,388,235 | ) | | | (1,025,416 | ) |
| | | | |
From net realized gain on investments: | | | | | | | | |
Investor Class | | | (46,956 | ) | | | (167,658 | ) |
Class A | | | (83,771 | ) | | | (499,035 | ) |
Class I | | | (585,597 | ) | | | (4,038,074 | ) |
Class R2 | | | (147,382 | ) | | | (643,300 | ) |
Class R3 | | | (72,841 | ) | | | (348,253 | ) |
| | | | |
| | | (936,547 | ) | | | (5,696,320 | ) |
| | | | |
Total dividends and distributions to shareholders | | | (2,324,782 | ) | | | (6,721,736 | ) |
| | | | |
Capital share transactions: | | | | | | | | |
Net proceeds from sale of shares | | | 11,178,321 | | | | 21,127,875 | |
Net asset value of shares issued to shareholders in reinvestment of dividends and distributions | | | 2,324,621 | | | | 6,721,660 | |
Cost of shares redeemed | | | (8,627,960 | ) | | | (36,058,922 | ) |
| | | | |
Increase (decrease) in net assets derived from capital share transactions | | | 4,874,982 | | | | (8,209,387 | ) |
| | | | |
Net increase (decrease) in net assets | | | 12,219,829 | | | | (6,795,522 | ) |
|
| Net Assets | |
Beginning of period | | | 76,895,948 | | | | 83,691,470 | |
| | | | |
End of period | | $ | 89,115,777 | | | $ | 76,895,948 | |
| | | | |
Undistributed (distributions excess of) net investment income at end of period | | $ | (6,849 | ) | | $ | 436,832 | |
| | | | |
| | | | | | |
The notes to the financial statements are an integral part of,
and should be read in conjunction with, the financial statements. | | mainstayinvestments.com | | | 67 | |
Financial Highlights selected per share data and ratios
| | | | | | | | | | | | | | | | | | | | | | | | |
| | | Investor Class | |
| | | Six months
ended
April 30, | | | Year ended October 31, | | | February 28,
2008**
through
October 31, | |
| | | 2013* | | | 2012 | | | 2011 | | | 2010 | | | 2009 | | | 2008 | |
Net asset value at beginning of period | | $ | 8.95 | | | $ | 8.79 | | | $ | 8.80 | | | $ | 7.75 | | | $ | 6.74 | | | $ | 9.56 | |
| | | | | | | | | | | | | | | | | | | | | | | | |
Net investment income (loss) (a) | | | 0.09 | | | | 0.08 | | | | 0.09 | | | | 0.06 | | | | 0.09 | | | | 0.06 | |
Net realized and unrealized gain (loss) on investments | | | 1.03 | | | | 0.76 | | | | 0.11 | (b) | | | 1.08 | | | | 1.04 | | | | (2.88 | ) |
| | | | | | | | | | | | | | | | | | | | | | | | |
Total from investment operations | | | 1.12 | | | | 0.84 | | | | 0.20 | | | | 1.14 | | | | 1.13 | | | | (2.82 | ) |
| | | | | | | | | | | | | | | | | | | | | | | | |
Less dividends and distributions: | | | | | | | | | | | | | | | | | | | | | | | | |
From net investment income | | | (0.15 | ) | | | (0.09 | ) | | | (0.11 | ) | | | (0.09 | ) | | | (0.12 | ) | | | — | |
From net realized gain on investments | | | (0.11 | ) | | | (0.59 | ) | | | (0.10 | ) | | | — | | | | — | | | | — | |
| | | | | | | | | | | | | | | | | | | | | | | | |
Total dividends and distributions | | | (0.26 | ) | | | (0.68 | ) | | | (0.21 | ) | | | (0.09 | ) | | | (0.12 | ) | | | — | |
| | | | | | | | | | | | | | | | | | | | | | | | |
Net asset value at end of period | | $ | 9.81 | | | $ | 8.95 | | | $ | 8.79 | | | $ | 8.80 | | | $ | 7.75 | | | $ | 6.74 | |
| | | | | | | | | | | | | | | | | | | | | | | | |
Total investment return (c) | | | 12.82 | %(d) | | | 10.44 | % | | | 2.20 | % | | | 14.76 | % | | | 17.20 | % | | | (29.50 | %)(d) |
Ratios (to average net assets)/Supplemental Data: | | | | | | | | | | | | | | | | | | | | | | | | |
Net investment income (loss) | | | 2.03 | %†† | | | 0.93 | % | | | 1.00 | % | | | 0.77 | % | | | 1.25 | % | | | 1.10 | % †† |
Net expenses (e) | | | 0.47 | %†† | | | 0.47 | % | | | 0.47 | % | | | 0.47 | % | | | 0.47 | % | | | 0.46 | % †† |
Expenses (before waiver/reimbursement) (e) | | | 0.92 | %†† | | | 1.01 | % | | | 1.13 | % | | | 1.60 | % | | | 1.94 | % | | | 1.93 | % †† |
Portfolio turnover rate | | | 25 | % | | | 96 | % | | | 111 | % | | | 65 | % | | | 75 | % | | | 145 | % |
Net assets at end of period (in 000’s) | | $ | 4,919 | | | $ | 3,518 | | | $ | 2,306 | | | $ | 1,337 | | | $ | 614 | | | $ | 81 | |
| ** | Commencement of operations. |
| (a) | Per share data based on average shares outstanding during the period. |
| (b) | The per share amount may differ with the change in aggregate gains (losses) as shown in the Statement of Operations due to the timing of purchases and sales of Fund shares in relation to fluctuating market values during the year. |
| (c) | Total investment return is calculated exclusive of sales charges and assumes the reinvestment of dividends and distributions. |
| (d) | Total investment return is not annualized. |
| (e) | In addition to the fees and expenses which the Fund bears directly, the Fund indirectly bears a pro-rata share of the fees and expenses of the Underlying Funds in which it invests. Such indirect expenses are not included in the above expense ratios. |
| | | | |
| 68 | | MainStay Retirement 2040 Fund | | The notes to the financial statements are an integral part of,
and should be read in conjunction with, the financial statements. |
Financial Highlights selected per share data and ratios
| | | | | | | | | | | | | | | | | | | | | | | | |
| | | Class A | |
| | | Six months
ended
April 30, | | | Year ended October 31, | |
| | | 2013* | | | 2012 | | | 2011 | | | 2010 | | | 2009 | | | 2008 | |
Net asset value at beginning of period | | $ | 8.92 | | | $ | 8.76 | | | $ | 8.77 | | | $ | 7.72 | | | $ | 6.75 | | | $ | 10.61 | |
| | | | | | | | | | | | | | | | | | | | | | | | |
Net investment income (loss) (a) | | | 0.10 | | | | 0.10 | | | | 0.11 | | | | 0.08 | | | | 0.12 | | | | 0.10 | |
Net realized and unrealized gain (loss) on investments | | | 1.02 | | | | 0.75 | | | | 0.10 | (b) | | | 1.06 | | | | 1.00 | | | | (3.91 | ) |
| | | | | | | | | | | | | | | | | | | | | | | | |
Total from investment operations | | | 1.12 | | | | 0.85 | | | | 0.21 | | | | 1.14 | | | | 1.12 | | | | (3.81 | ) |
| | | | | | | | | | | | | | | | | | | | | | | | |
Less dividends and distributions: | | | | | | | | | | | | | | | | | | | | | | | | |
From net investment income | | | (0.16 | ) | | | (0.10 | ) | | | (0.12 | ) | | | (0.09 | ) | | | (0.15 | ) | | | (0.04 | ) |
From net realized gain on investments | | | (0.11 | ) | | | (0.59 | ) | | | (0.10 | ) | | | — | | | | — | | | | (0.01 | ) |
| | | | | | | | | | | | | | | | | | | | | | | | |
Total dividends and distributions | | | (0.27 | ) | | | (0.69 | ) | | | (0.22 | ) | | | (0.09 | ) | | | (0.15 | ) | | | (0.05 | ) |
| | | | | | | | | | | | | | | | | | | | | | | | |
Net asset value at end of period | | $ | 9.77 | | | $ | 8.92 | | | $ | 8.76 | | | $ | 8.77 | | | $ | 7.72 | | | $ | 6.75 | |
| | | | | | | | | | | | | | | | | | | | | | | | |
Total investment return (c) | | | 12.81 | %(d) | | | 10.58 | % | | | 2.29 | % | | | 14.89 | % | | | 17.09 | % | | | (36.07 | %) |
Ratios (to average net assets)/Supplemental Data: | | | | | | | | | | | | | | | | | | | | | | | | |
Net investment income (loss) | | | 2.21 | %†† | | | 1.19 | % | | | 1.23 | % | | | 0.97 | % | | | 1.77 | % | | | 1.07 | % |
Net expenses (e) | | | 0.37 | %†† | | | 0.37 | % | | | 0.37 | % | | | 0.37 | % | | | 0.37 | % | | | 0.38 | % |
Expenses (before waiver/reimbursement) (e) | | | 0.73 | %†† | | | 0.75 | % | | | 0.79 | % | | | 1.02 | % | | | 1.19 | % | | | 2.57 | % |
Portfolio turnover rate | | | 25 | % | | | 96 | % | | | 111 | % | | | 65 | % | | | 75 | % | | | 145 | % |
Net assets at end of period (in 000’s) | | $ | 8,459 | | | $ | 6,517 | | | $ | 7,151 | | | $ | 6,826 | | | $ | 5,459 | | | $ | 2,364 | |
| (a) | Per share data based on average shares outstanding during the period. |
| (b) | The per share amount may differ with the change in aggregate gains (losses) as shown in the Statement of Operations due to the timing of purchases and sales of Fund shares in relation to fluctuating market values during the year. |
| (c) | Total investment return is calculated exclusive of sales charges and assumes the reinvestment of dividends and distributions. |
| (d) | Total investment return is not annualized. |
| (e) | In addition to the fees and expenses which the Fund bears directly, the Fund indirectly bears a pro-rata share of the fees and expenses of the Underlying Funds in which it invests. Such indirect expenses are not included in the above expense ratios. |
| | | | | | |
The notes to the financial statements are an integral part of,
and should be read in conjunction with, the financial statements. | | mainstayinvestments.com | | | 69 | |
Financial Highlights selected per share data and ratios
| | | | | | | | | | | | | | | | | | | | | | | | |
| | | Class I | |
| | | Six months
ended
April 30, | | | Year ended October 31, | |
| | | 2013* | | | 2012 | | | 2011 | | | 2010 | | | 2009 | | | 2008 | |
Net asset value at beginning of period | | $ | 9.01 | | | $ | 8.83 | | | $ | 8.84 | | | $ | 7.77 | | | $ | 6.76 | | | $ | 10.61 | |
| | | | | | | | | | | | | | | | | | | | | | | | |
Net investment income (loss) (a) | | | 0.12 | | | | 0.12 | | | | 0.11 | | | | 0.10 | | | | 0.14 | | | | 0.11 | |
Net realized and unrealized gain (loss) on investments | | | 1.01 | | | | 0.77 | | | | 0.12 | (b) | | | 1.08 | | | | 1.00 | | | | (3.90 | ) |
| | | | | | | | | | | | | | | | | | | | | | | | |
Total from investment operations | | | 1.13 | | | | 0.89 | | | | 0.23 | | | | 1.18 | | | | 1.14 | | | | (3.79 | ) |
| | | | | | | | | | | | | | | | | | | | | | | | |
Less dividends and distributions: | | | | | | | | | | | | | | | | | | | | | | | | |
From net investment income | | | (0.18 | ) | | | (0.12 | ) | | | (0.14 | ) | | | (0.11 | ) | | | (0.13 | ) | | | (0.05 | ) |
From net realized gain on investments | | | (0.11 | ) | | | (0.59 | ) | | | (0.10 | ) | | | — | | | | — | | | | (0.01 | ) |
| | | | | | | | | | | | | | | | | | | | | | | | |
Total dividends and distributions | | | (0.29 | ) | | | (0.71 | ) | | | (0.24 | ) | | | (0.11 | ) | | | (0.13 | ) | | | (0.06 | ) |
| | | | | | | | | | | | | | | | | | | | | | | | |
Net asset value at end of period | | $ | 9.85 | | | $ | 9.01 | | | $ | 8.83 | | | $ | 8.84 | | | $ | 7.77 | | | $ | 6.76 | |
| | | | | | | | | | | | | | | | | | | | | | | | |
Total investment return (c) | | | 12.88 | %(d) | | | 10.98 | % | | | 2.48 | % | | | 15.24 | % | | | 17.34 | % | | | (35.96 | %) |
Ratios (to average net assets)/Supplemental Data: | | | | | | | | | | | | | | | | | | | | | | | | |
Net investment income (loss) | | | 2.52 | %†† | | | 1.43 | % | | | 1.22 | % | | | 1.22 | % | | | 2.04 | % | | | 1.25 | % |
Net expenses (e) | | | 0.12 | %†† | | | 0.12 | % | | | 0.12 | % | | | 0.12 | % | | | 0.12 | % | | | 0.13 | % |
Expenses (before waiver/reimbursement) (e) | | | 0.48 | %†† | | | 0.50 | % | | | 0.54 | % | | | 0.77 | % | | | 0.94 | % | | | 2.02 | % |
Portfolio turnover rate | | | 25 | % | | | 96 | % | | | 111 | % | | | 65 | % | | | 75 | % | | | 145 | % |
Net assets at end of period (in 000’s) | | $ | 55,210 | | | $ | 49,750 | | | $ | 59,619 | | | $ | 33,551 | | | $ | 27,031 | | | $ | 11,263 | |
| (a) | Per share data based on average shares outstanding during the period. |
| (b) | The per share amount may differ with the change in aggregate gains (losses) as shown in the Statement of Operations due to the timing of purchases and sales of Fund shares in relation to fluctuating market values during the year. |
| (c) | Total investment return is calculated exclusive of sales charges and assumes the reinvestment of dividends and distributions. Class I shares are not subject to sales charges. |
| (d) | Total investment return is not annualized. |
| (e) | In addition to the fees and expenses which the Fund bears directly, the Fund indirectly bears a pro-rata share of the fees and expenses of the Underlying Funds in which it invests. Such indirect expenses are not included in the above expense ratios. |
| | | | |
| 70 | | MainStay Retirement 2040 Fund | | The notes to the financial statements are an integral part of,
and should be read in conjunction with, the financial statements. |
Financial Highlights selected per share data and ratios
| | | | | | | | | | | | | | | | | | | | |
| | | Class R2 | |
| | | Six months
ended
April 30, | | | Year ended October 31, | | | January 8,
2009**
through
October 31, | |
| | | 2013* | | | 2012 | | | 2011 | | | 2010 | | | 2009 | |
Net asset value at beginning of period | | $ | 8.94 | | | $ | 8.77 | | | $ | 8.78 | | | $ | 7.72 | | | $ | 6.43 | |
| | | | | | | | | | | | | | | | | | | | |
Net investment income (loss) (a) | | | 0.10 | | | | 0.08 | | | | 0.09 | | | | 0.06 | | | | 0.05 | |
Net realized and unrealized gain (loss) on investments | | | 1.02 | | | | 0.76 | | | | 0.11 | (b) | | | 1.08 | | | | 1.24 | |
| | | | | | | | | | | | | | | | | | | | |
Total from investment operations | | | 1.12 | | | | 0.84 | | | | 0.20 | | | | 1.14 | | | | 1.29 | |
| | | | | | | | | | | | | | | | | | | | |
Less dividends and distributions: | | | | | | | | | | | | | | | | | | | | |
From net investment income | | | (0.15 | ) | | | (0.08 | ) | | | (0.11 | ) | | | (0.08 | ) | | | — | |
From net realized gain on investments | | | (0.11 | ) | | | (0.59 | ) | | | (0.10 | ) | | | — | | | | — | |
| | | | | | | | | | | | | | | | | | | | |
Total dividends and distributions | | | (0.26 | ) | | | (0.67 | ) | | | (0.21 | ) | | | (0.08 | ) | | | — | |
| | | | | | | | | | | | | | | | | | | | |
Net asset value at end of period | | $ | 9.80 | | | $ | 8.94 | | | $ | 8.77 | | | $ | 8.78 | | | $ | 7.72 | |
| | | | | | | | | | | | | | | | | | | | |
Total investment return (c) | | | 12.78 | %(d) | | | 10.51 | % | | | 2.17 | % | | | 14.85 | % | | | 20.06 | %(d)(e) |
Ratios (to average net assets)/Supplemental Data: | | | | | | | | | | | | | | | | | | | | |
Net investment income (loss) | | | 2.14 | %†† | | | 0.98 | % | | | 0.97 | % | | | 0.78 | % | | | 0.91 | %†† |
Net expenses (f) | | | 0.47 | %†† | | | 0.47 | % | | | 0.47 | % | | | 0.47 | % | | | 0.47 | %†† |
Expenses (before waiver/reimbursement) (f) | | | 0.83 | %†† | | | 0.85 | % | | | 0.89 | % | | | 1.12 | % | | | 1.26 | %†† |
Portfolio turnover rate | | | 25 | % | | | 96 | % | | | 111 | % | | | 65 | % | | | 75 | % |
Net assets at end of period (in 000’s) | | $ | 14,099 | | | $ | 11,513 | | | $ | 9,559 | | | $ | 3,394 | | | $ | 1,425 | |
| ** | Commencement of operations. |
| (a) | Per share data based on average shares outstanding during the period. |
| (b) | The per share amount may differ with the change in aggregate gains (losses) as shown in the Statement of Operations due to the timing of purchases and sales of Fund shares in relation to fluctuating market values during the year. |
| (c) | Total investment return is calculated exclusive of sales charges and assumes the reinvestment of dividends and distributions. Class R2 shares are not subject to sales charges. |
| (d) | Total investment return is not annualized. |
| (e) | Total investment return may reflect adjustments to conform to generally accepted accounting principles. |
| (f) | In addition to the fees and expenses which the Fund bears directly, the Fund indirectly bears a pro-rata share of the fees and expenses of the Underlying Funds in which it invests. Such indirect expenses are not included in the above expense ratios. |
| | | | | | |
The notes to the financial statements are an integral part of,
and should be read in conjunction with, the financial statements. | | mainstayinvestments.com | | | 71 | |
Financial Highlights selected per share data and ratios
| | | | | | | | | | | | | | | | | | | | | | | | |
| | | Class R3 | |
| | | Six months
ended
April 30, | | | Year ended October 31, | | | May 1
2008**
through
October 31, | |
| | | 2013* | | | 2012 | | | 2011 | | | 2010 | | | 2009 | | | 2008 | |
Net asset value at beginning of period | | $ | 8.91 | | | $ | 8.75 | | | $ | 8.76 | | | $ | 7.72 | | | $ | 6.73 | | | $ | 9.71 | |
| | | | | | | | | | | | | | | | | | | | | | | | |
Net investment income (loss) (a) | | | 0.09 | | | | 0.07 | | | | 0.08 | | | | 0.05 | | | | 0.11 | | | | 0.04 | |
Net realized and unrealized gain (loss) on investments | | | 1.00 | | | | 0.75 | | | | 0.10 | (b) | | | 1.06 | | | | 0.99 | | | | (3.02 | ) |
| | | | | | | | | | | | | | | | | | | | | | | | |
Total from investment operations | | | 1.09 | | | | 0.82 | | | | 0.18 | | | | 1.11 | | | | 1.10 | | | | (2.98 | ) |
| | | | | | | | | | | | | | | | | | | | | | | | |
Less dividends and distributions: | | | | | | | | | | | | | | | | | | | | | | | | |
From net investment income | | | (0.12 | ) | | | (0.07 | ) | | | (0.09 | ) | | | (0.07 | ) | | | (0.11 | ) | | | — | |
From net realized gain on investments | | | (0.11 | ) | | | (0.59 | ) | | | (0.10 | ) | | | — | | | | — | | | | — | |
| | | | | | | | | | | | | | | | | | | | | | | | |
Total dividends and distributions | | | (0.23 | ) | | | (0.66 | ) | | | (0.19 | ) | | | (0.07 | ) | | | (0.11 | ) | | | — | |
| | | | | | | | | | | | | | | | | | | | | | | | |
Net asset value at end of period | | $ | 9.77 | | | $ | 8.91 | | | $ | 8.75 | | | $ | 8.76 | | | $ | 7.72 | | | $ | 6.73 | |
| | | | | | | | | | | | | | | | | | | | | | | | |
Total investment return (c) | | | 12.56 | %(d) | | | 10.23 | % | | | 1.98 | % | | | 14.47 | % | | | 16.77 | % | | | (30.69 | %)(d) |
Ratios (to average net assets)/Supplemental Data: | | | | | | | | | | | | | | | | | | | | | | | | |
Net investment income (loss) | | | 1.98 | %†† | | | 0.76 | % | | | 0.86 | % | | | 0.61 | % | | | 1.68 | % | | | 1.07 | % †† |
Net expenses (e) | | | 0.72 | %†† | | | 0.72 | % | | | 0.72 | % | | | 0.72 | % | | | 0.72 | % | | | 0.73 | % †† |
Expenses (before waiver/reimbursement) (e) | | | 1.08 | %†† | | | 1.10 | % | | | 1.14 | % | | | 1.37 | % | | | 1.55 | % | | | 2.08 | % †† |
Portfolio turnover rate | | | 25 | % | | | 96 | % | | | 111 | % | | | 65 | % | | | 75 | % | | | 145 | % |
Net assets at end of period (in 000’s) | | $ | 6,429 | | | $ | 5,597 | | | $ | 5,056 | | | $ | 4,628 | | | $ | 3,682 | | | $ | 2,767 | |
| ** | Commencement of operations. |
| (a) | Per share data based on average shares outstanding during the period. |
| (b) | The per share amount may differ with the change in aggregate gains (losses) as shown in the Statement of Operations due to the timing of purchases and sales of Fund shares in relation to fluctuating market values during the year. |
| (c) | Total investment return is calculated exclusive of sales charges and assumes the reinvestment of dividends and distributions. Class R3 shares are not subject to sales charges. |
| (d) | Total investment return is not annualized. |
| (e) | In addition to the fees and expenses which the Fund bears directly, the Fund indirectly bears a pro-rata share of the fees and expenses of the Underlying Funds in which it invests. Such indirect expenses are not included in the above expense ratios. |
| | | | |
| 72 | | MainStay Retirement 2040 Fund | | The notes to the financial statements are an integral part of,
and should be read in conjunction with, the financial statements. |
MainStay Retirement 2050 Fund
Investment and Performance Comparison1 (Unaudited)
Performance data quoted represents past performance. Past performance is no guarantee of future results. Because of market volatility, current performance may be lower or higher than the figures shown. Investment return and principal value will fluctuate, and as a result, when shares are redeemed, they may be worth more or less than their original cost. The graph below depicts the historical performance of Class I shares of the Fund. Performance will vary from class to class based on differences in class-specific expenses and sales charges. For performance information current to the most recent month-end, please call 800-MAINSTAY (624-6782) or visit mainstayinvestments.com.
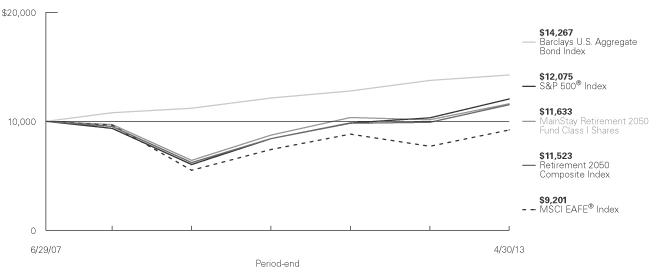
Average Annual Total Returns for the Period Ended April 30, 2013
| | | | | | | | | | | | | | | | | | | | | | | | |
| Class | | Sales Charge | | | | Six Months | | | One Year | | | Five Years | | | Since
Inception
(6/29/07) | | | Gross Expense Ratio2 | |
| Investor Class Shares3 | | Maximum 5.5% Initial Sales Charge | | With sales charges Excluding sales charges | |
| 6.95
13.17 | %
| |
| 7.93
14.21 | %
| |
| 2.14
3.30 | %
| |
| 1.28
2.26 | %
| |
| 2.07
2.07 | %
|
| Class A Shares | | Maximum 5.5% Initial Sales Charge | | With sales charges Excluding sales charges | |
| 7.12
13.36 |
| |
| 8.11
14.40 |
| |
| 2.26
3.42 |
| |
| 1.38
2.36 |
| |
| 1.65
1.65 |
|
| Class I Shares | | No Sales Charge | | | | | 13.43 | | | | 14.60 | | | | 3.66 | | | | 2.62 | | | | 1.40 | |
| Class R1 Shares4 | | No Sales Charge | | | | | 13.45 | | | | 14.57 | | | | 3.58 | | | | 2.51 | | | | 1.50 | |
| Class R2 Shares5 | | No Sales Charge | | | | | 13.22 | | | | 14.26 | | | | 3.32 | | | | 2.26 | | | | 1.75 | |
| Class R3 Shares6 | | No Sales Charge | | | | | 13.16 | | | | 13.94 | | | | 3.06 | | | | 2.00 | | | | 2.00 | |
| 1. | The performance table and graph do not reflect the deduction of taxes that a shareholder would pay on dividends, distributions or Fund share redemptions. Total returns reflect maximum applicable sales charges as indicated in the table above, changes in share price, and reinvestment of dividend and capital gain distributions. The graph assumes the initial investment amount shown above and reflects the deduction of all sales charges that would have applied for the period of investment. Performance figures reflect certain fee waivers and/or expense limitations, without which total returns may have been lower. For more information on share classes and current fee waivers and/or expense limitations, please refer to the notes to the financial statements. |
| 2. | The gross expense ratios presented reflect the Fund’s “Total Annual Fund Operating Expenses” from the most recent Prospectus and may differ from other expense ratios disclosed in this report. |
| 3. | Performance figures for Investor Class shares, first offered on February 28, 2008, include the historical performance of Class A shares through February 27, 2008, adjusted for differences in certain expenses and fees. Unadjusted, the performance shown for Investor Class shares would likely have been different. |
| 4. | Class R1 shares were first offered to the public on June 29, 2007, although this class of shares has not commenced operations as of April 30, 2013. As a result, the performance for Class R1 shares include the historical performance of Class A shares through April 30, 2013, adjusted for differences in certain expenses and fees. Unadjusted, the performance shown for Class R1 would likely have been different. |
| 5. | Class R2 shares were first offered on June 29, 2007, although this class did not commence investment operations until January 8, 2009. Performance figures for Class R2 shares include the historical performance of Class A shares through January 7, 2009, adjusted for differences in certain expenses and fees. Unadjusted, the performance shown for Class R2 shares would likely have been different. |
| 6. | Class R3 shares were first offered on June 29, 2007, although this class did not commence investment operations until May 1, 2008. Performance figures for Class R3 shares include the historical performance of Class A shares through April 30, 2008, adjusted for differences in certain expenses and fees. Unadjusted, the performance shown for Class R3 shares would likely have been different. |
The footnotes on the next page are an integral part of the table and graph and should be carefully read in conjunction with them.
| | | | |
| mainstayinvestments.com | | | 73 | |
| | | | | | | | | | | | | | | | |
| Benchmark Performance | | Six
Months | | | One
Year | | | Five
Years | | | Since
Inception | |
S&P 500® Index7 | | | 14.42 | % | | | 16.89 | % | | | 5.21 | % | | | 3.29 | % |
MSCI EAFE® Index8 | | | 16.90 | | | | 19.39 | | | | –0.93 | | | | –1.42 | |
Barclays U.S. Aggregate Bond Index9 | | | 0.90 | | | | 3.68 | | | | 5.72 | | | | 6.28 | |
Retirement 2050 Composite Index10 | | | 13.64 | | | | 16.25 | | | | 3.87 | | | | 2.46 | |
Average Lipper Mixed-Asset Target 2050+ Fund11 | | | 12.30 | | | | 13.68 | | | | 3.18 | | | | 1.52 | |
| 7. | “S&P 500®” is a trademark of The McGraw-Hill Companies, Inc. The S&P 500® Index is widely regarded as the standard index for measuring large-cap U.S. stock market performance. The S&P 500 Index is the Fund’s broad-based securities market index. Results assume reinvestment of all income and capital gains. An investment cannot be made directly in an index. |
| 8. | The MSCI EAFE® Index consists of international stocks representing the developed world outside of North America. The MSCI EAFE® Index is the Fund’s secondary benchmark. Results assume reinvestment of all income and capital gains. An investment cannot be made directly in an index. |
| 9. | The Barclays U.S. Aggregate Bond Index is a broad-based benchmark that measures the investment grade, U.S. dollar-denominated, fixed-rate taxable bond market, including Treasurys, government-related and corporate securities, mortgage-backed securities (agency fixed-rate and hybrid adjustable rate mortgage pass-throughs), asset-backed securities, and commercial mortgage-backed securities. The Fund has selected the |
| | Barclays U.S. Aggregate Bond Index as an additional benchmark. Results assume reinvestment of all income and capital gains. An investment cannot be made directly in an index. |
| 10. | The Retirement 2050 Composite Index consists of the S&P 500® Index, the MSCI EAFE® Index and the Barclays U.S. Aggregate Bond Index weighted according to the Fund’s current allocation, changing annually through the target retirement date. The Fund has selected the Retirement 2050 Composite Index as an additional benchmark. Total returns assume reinvestment of all dividends and capital gains. An investment cannot be made directly in an index. |
| 11. | The average Lipper mixed-asset target 2050+ fund is representative of funds that seek to maximize assets for retirement or other purposes with an expected time horizon exceeding December 31, 2045. This benchmark is a product of Lipper Inc. Lipper Inc. is an independent monitor of fund performance. Results are based on average total returns of similar funds with all dividend and capital gain distributions reinvested. |
The footnotes on the preceding page are an integral part of the table and graph and should be read in conjunction with them.
| | |
| 74 | | MainStay Retirement 2050 Fund |
Cost in Dollars of a $1,000 Investment in MainStay Retirement 2050 Fund (Unaudited)
The example below is intended to describe the fees and expenses borne by shareholders during the six-month period from November 1, 2012, to April 30, 2013, and the impact of those costs on your investment.
Example
As a shareholder of the Fund, you incur two types of costs: (1) transaction costs, including exchange fees and sales charges (loads) on purchases (as applicable), and (2) ongoing costs, including management fees, distribution and/or service (12b-1) fees, and other Fund expenses (as applicable). This example is intended to help you understand your ongoing costs (in dollars) of investing in the Fund and to compare these costs with the ongoing costs of investing in other mutual funds. The example is based on an investment of $1,000 made at the beginning of the six-month period and held for the entire period from November 1, 2012, to April 30, 2013.
This example illustrates your Fund’s ongoing costs in two ways:
Actual Expenses
The second and third data columns in the table below provide information about actual account values and actual expenses. You may use the information in these columns, together with the amount you invested, to estimate the expenses that you paid during the six months ended April 30, 2013. Simply divide your account value by $1,000 (for example, an $8,600 account value divided by $1,000 = 8.6), then
multiply the result by the number under the heading entitled ‘‘Expenses Paid During Period’’ to estimate the expenses you paid on your account during this period.
Hypothetical Example for Comparison Purposes
The fourth and fifth data columns in the table below provide information about hypothetical account values and hypothetical expenses based on the Fund’s actual expense ratio and an assumed rate of return of 5% per year before expenses, which is not the Fund’s actual return. The hypothetical account values and expenses may not be used to estimate the actual ending account balances or expenses you paid for the six-month period shown. You may use this information to compare the ongoing costs of investing in the Fund with the ongoing costs of investing in other Funds. To do so, compare this 5% hypothetical example with the 5% hypothetical examples that appear in the shareholder reports of the other Funds.
Please note that the expenses shown in the table are meant to highlight your ongoing costs only and do not reflect any transactional costs, such as exchange fees or sales charges (loads). Therefore, the fourth and fifth data columns of the table are useful in comparing ongoing costs only and will not help you determine the relative total costs of owning different funds. In addition, if these transactional costs were included, your costs would have been higher.
| | | | | | | | | | | | | | | | | | | | |
| | | | | | | | | | | | | | | | |
| Share Class | | Beginning
Account
Value
11/1/12 | | | Ending Account
Value (Based
on Actual
Returns and
Expenses)
4/30/13 | | | Expenses
Paid
During
Period1 | | | Ending Account
Value (Based
on Hypothetical
5% Annualized
Return and
Actual Expenses)
4/30/13 | | | Expenses
Paid
During
Period1 | |
| | | | | |
| Investor Class Shares | | $ | 1,000.00 | | | $ | 1,131.70 | | | $ | 2.48 | | | $ | 1,022.50 | | | $ | 2.36 | |
| | | | | |
| Class A Shares | | $ | 1,000.00 | | | $ | 1,133.60 | | | $ | 1.96 | | | $ | 1,023.00 | | | $ | 1.86 | |
| | | | | |
| Class I Shares | | $ | 1,000.00 | | | $ | 1,134.30 | | | $ | 0.64 | | | $ | 1,024.20 | | | $ | 0.60 | |
| | | | | |
| Class R2 Shares | | $ | 1,000.00 | | | $ | 1,132.20 | | | $ | 2.48 | | | $ | 1,022.50 | | | $ | 2.36 | |
| | | | | |
| Class R3 Shares | | $ | 1,000.00 | | | $ | 1,131.60 | | | $ | 3.81 | | | $ | 1,021.20 | | | $ | 3.61 | |
| 1. | Expenses are equal to the Fund’s annualized expense ratio of each class (0.47% for Investor Class, 0.37% for Class A, 0.12% for Class I, 0.47% for Class R2 and 0.72% for Class R3) multiplied by the average account value over the period, divided by 365 and multiplied by 181 (to reflect the six-month period). The table above represents the actual expenses incurred during the six-month period. In addition to the fees and expenses which the Fund bears directly, the Fund indirectly bears a pro rata share of the fees and expenses of the Underlying Funds in which it invests. Such indirect expenses are not included in the above-reported expense figures. |
| | | | |
| mainstayinvestments.com | | | 75 | |
Investment Objectives of Underlying Funds as of April 30, 2013 (Unaudited)
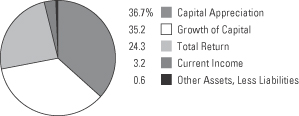
See Portfolio of Investments beginning on page 80 for specific holdings within these categories.
| | |
| 76 | | MainStay Retirement 2050 Fund |
Portfolio Management Discussion and Analysis (Unaudited)
Questions answered by portfolio managers Jae S. Yoon, CFA, Jonathan Swaney and Poul Kristensen, CFA, of New York Life Investments.1
How did MainStay Retirement 2050 Fund perform relative to its peers and its benchmark during the six months ended April 30, 2013?
Excluding all sales charges, MainStay Retirement 2050 Fund returned 13.17% for Investor Class shares and 13.36% for Class A shares for the six months ended April 30, 2013. Over the same period, Class I shares returned 13.43%, Class R1 shares2 returned 13.45%, Class R2 shares returned 13.22% and Class R3 shares returned 13.16%. All share classes outperformed the 12.30% return of the average Lipper3 mixed-asset target 2050+ fund for the six months ended April 30, 2013. Over the same period, all share classes underperformed the 14.42% return of the S&P 500® Index4 and the 16.90% return of the MSCI EAFE® Index.5 The S&P 500® Index is the Fund’s broad-based securities-market index, and the MSCI EAFE® Index is the secondary benchmark of the Fund. All
share classes outperformed the 0.90% return of the Barclays U.S. Aggregate Bond Index6 and underperformed the 13.64% return of the Retirement 2050 Composite Index7 for the six
months ended April 30, 2013. The Barclays U.S. Aggregate Bond Index and the Retirement 2050 Composite Index are
additional benchmarks of the Fund. See page 73 for Fund returns with applicable sales charges.
Were there any changes to the Fund during the reporting period?
Effective February 28, 2013, the Fund’s Principal Investment Strategies were modified to broaden the investment ranges for each of the asset classes in which the Fund may invest by an additional ten percentage points. Also effective February 28, 2013, Poul Kristensen, CFA, was added as a portfolio manager. Please see the Prospectus dated February 28, 2013, for more information.
What factors affected the Fund’s relative performance during the reporting period?
The Fund invests primarily in mutual funds managed by New York Life Investments, mutual funds managed by an advisor not affiliated with New York Life Investments or exchange traded funds (“ETFs”), if a New York Life Investments managed mutual fund in a particular asset class is not available (collectively, “Underlying Funds”). The Underlying Funds may invest in fixed-income securities or in domestic or international stocks at various capitalization levels. The Fund’s primary benchmark, on the other hand, consists entirely of U.S. large-cap stocks. These differences—particularly the Fund’s substantial allocation to
Underlying Funds that invest in fixed-income securities—accounted for many of the challenges the Fund experienced in terms of relative performance.
During the reporting period, the Fund underperformed the Retirement 2050 Composite Index but outperformed the average peer fund. The Fund’s asset-allocation policy was a net detractor. We maintained a neutral blend at the start of the reporting period, then moved aggressively to overweight equities during the latter half of the fourth quarter. This proved to be a very profitable strategy, but the benefit was more than offset by a heavy allocation to emerging-market stocks, an emphasis on large-cap stocks rather than small-cap stocks, and a bias toward U.S. equities over those of other developed nations. In the fixed-income portion of the Fund, a bias toward lower-quality bond offerings aided performance. Our decision to keep duration8 short in the fixed-income portion of the Fund had no meaningful impact on the Fund’s performance.
Performance of the Underlying Funds also affected relative results. Relying on MainStay Large Cap Growth Fund more
heavily than MainStay Cornerstone Growth Fund proved beneficial. Other positive contributors in the equity portion of the Fund included MainStay MAP Fund and MainStay U.S. Small Cap Fund. A number of significant holdings fared less well, with MainStay International Equity Fund featuring prominently on that list. All told, the performance of all Underlying Funds presented a drag on the Fund’s relative return.
How did you allocate the Fund’s assets during the reporting period and why?
We considered a variety of information, including the portfolio-level characteristics of the Underlying Funds, such as capitalization, style biases, sector exposures, credit quality and duration. We also examined the attributes of the Underlying Funds’ holdings, such as valuation metrics, earnings data and technical indicators. Finally, we evaluated the historical success of the managers responsible for the Underlying Funds. Generally speaking, we seek to invest in Underlying Funds that occupy attractively valued segments of the market, invest in fairly priced securities and are steered by individuals who have consistently demonstrated capable management in the past.
The Fund’s allocations to stocks and bonds varied over the course of the reporting period in response to the changing
| 1. | “New York Life Investments” is a service mark used by New York Life Investment Management LLC. |
| 2. | See footnote on page 73 for more information on Class R1 shares. |
| 3. | See footnote on page 74 for more information on Lipper Inc. |
| 4. | See footnote on page 74 for more information on the S&P 500® Index. |
| 5. | See footnote on page 74 for more information on the MSCI EAFE® Index. |
| 6. | See footnote on page 74 for more information on the Barclays U.S. Aggregate Bond Index. |
| 7. | See footnote on page 74 for more information on the Retirement 2050 Composite Index. |
| 8. | Duration is a measure of the price sensitivity of a fixed-income investment to changes in interest rates. Duration is expressed as a number of years and is considered a more accurate sensitivity gauge than average maturity. |
| | | | |
| mainstayinvestments.com | | | 77 | |
environment. We believed that equities presented a sizable valuation advantage over bonds and that corporate profit gains would help propel stock prices higher. For these reasons, we gave the Fund a decisive tilt in favor of stocks over bonds throughout most of the reporting period. Within the equity portion of the Fund, we maintained a bias in favor of Underlying Funds that invest in U.S. stocks over Underlying Funds that invest in stocks traded in other developed markets. We were particularly concerned about countries that are likely to struggle with deleveraging issues even greater than those presented in the United States. Results were mixed, as Japan in particular experienced very strong returns on the back of aggressive fiscal and monetary policy changes. The Fund was also significantly overweight in emerging-market economies because we believed that these markets would benefit most from gradually strengthening global economic growth. During the reporting period, however, that posture detracted significantly from performance, as emerging-market stocks generally trailed stocks in developed markets by a wide margin.
In the fixed-income portion of the Fund, we continued to maintain a shorter duration than the Barclays U.S. Aggregate Bond Index. We also tilted the fixed-income portion of the Fund decidedly toward Underlying Funds that invest in corporate bonds over those that invest primarily in government-backed issues. This positioning reflected our opinion that high-grade bonds were very expensive and that issues from corporate borrowers deemed to be of lower quality represented a far more attractive proposition. Given ample liquidity and healthy corporate balance sheets, we believed that default rates were likely to remain low. We also believed that investors were likely to find the higher yields available from corporate debt quite attractive compared to the yields available on U.S. Treasury instruments.
How did the Fund’s allocations change over the course of the reporting period?
Position sizes naturally fluctuate with changing market conditions, and such changes do not always reflect an explicit change in our strategic or tactical point of view.
A few of the more notable allocation changes during the reporting period were in positions new to the Fund. MainStay Cornerstone Growth Fund was a new product. We established a position in this Underlying Fund using proceeds from MainStay Large Cap Growth Fund as we sought to widen strategy diversification within that portion of the market. A new holding was established in MainStay High Yield Municipal Bond Fund, which further diversified sources of credit risk within the fixed-income portion of the Fund. We believed that high-yield municipal bonds would be attractive despite the inapplicability of tax benefits usually associated with these types of instruments.
Also of note, we increased the Fund’s position in MainStay U.S. Small Cap Fund as we unwound the Fund’s previous large-cap bias. The increased allocation was funded from a mix of Underlying Equity Funds. We also increased the Fund’s position in MainStay Common Stock Fund, as the strategy employed in that Underlying Fund has proven very effective in the post–credit crisis environment. In addition, we increased the Fund’s allocation to Vanguard Emerging Markets ETF with the expectation that the developing world is poised to accelerate as global growth rebounds.
During the reporting period, which Underlying Equity Funds had the highest total returns and which Under-lying Equity Funds had the lowest total returns?
MainStay International Opportunities Fund (formerly MainStay 130/30 International Fund) generated the highest absolute return by a comfortable margin, followed by MainStay U.S. Small Cap Fund. Although none of the Underlying Equity Funds in which the Fund invested provided negative returns for the reporting period, the lowest absolute returns in the equity portion of the Fund came from MainStay Cornerstone Growth Fund and Vanguard FTSE Emerging Markets ETF.
Which Underlying Equity Funds made the strongest positive contributions to the Fund’s overall performance, and which Underlying Equity Funds were the greatest detractors?
Because contributions take weightings and total returns into account and position sizes may vary, the Underlying Funds with the highest (or lowest) returns may not always have the most significantly positive (or negative) contributions to performance.
During the reporting period, large positions in MainStay MAP Fund and MainStay ICAP International Equity Fund made the largest positive contributions to the Fund’s overall performance. Although none of the Underlying Equity Funds in which the Fund invested had negative total returns, the smallest contributions came from a new position being built in MainStay Cornerstone Growth Fund and from a small position in MainStay International Equity Fund.
What factors and risks affected the Fund’s Underlying Fixed Income Fund investments during the reporting period?
Monetary policy continued to play a significant role in fixed-income markets, as has been the case for several years. Faced with persistently sluggish economic growth, slow rates of job creation and the prospect of significant fiscal drag, the Federal Reserve elected to extend its large-scale asset purchase program indefinitely. This decision helped keep interest rates close to their all-time lows. During the reporting period, the Fund favored Underlying Funds that invest in higher-yielding corporate bonds over those that invest primarily in government- backed issues. This strategy proved fortunate. Credit performed
| | |
| 78 | | MainStay Retirement 2050 Fund |
quite well as default rates remained low and the comparatively higher yields of these bonds attracted many buyers.
During the reporting period, which fixed-income market segments were strong performers and which segments were particularly weak?
High-yield corporate bonds performed exceptionally well as spreads9 to U.S. Treasurys continued to contract. The lowest returns came from the most liquid, highest-quality and shortest-term debt instruments. Cash returned nothing, and returns on short-term U.S. government debt and AAA bonds were only slightly higher.
Which Underlying Fixed Income Funds made the strongest positive contributions to the Fund’s perfor-mance, and which Underlying Fixed Income Funds were the greatest detractors?
The Fund is primarily an equity vehicle with only very small holdings in Underlying Fixed Income Funds. For this reason, no Underlying Fixed Income Funds made substantial contributions to the Fund’s return. The largest contributions to the fixed-income portion of the Fund came from MainStay Floating Rate Fund and Market Vectors Emerging Market Bond ETF. The contribution from positions in a variety of other Underlying Fixed Income Funds was effectively zero.
| 9. | The terms “spread” and “yield spread” may refer to the difference in yield between a security or type of security and comparable U.S. Treasury issues. The terms may also refer to the difference in yield between two specific securities or types of securities at a given time. |
The opinions expressed are those of the portfolio managers as of the date of this report and are subject to change. There is no guarantee that any forecast made will come to pass. This material does not constitute investment advice and is not intended as an endorsement of any specific investment.
| | | | |
| mainstayinvestments.com | | | 79 | |
Portfolio of Investments April 30, 2013 (Unaudited)
| | | | | | | | |
| | |
| | | Shares | | | Value | |
| | | | | | | | |
| Affiliated Investment Companies 80.9%† | |
Equity Funds 73.8% | |
MainStay Common Stock Fund Class I (a) | | | 482,401 | | | $ | 7,096,121 | |
MainStay Cornerstone Growth Fund Class I | | | 53,494 | | | | 1,596,807 | |
MainStay Epoch International Small Cap Fund Class I | | | 86,786 | | | | 1,754,810 | |
MainStay Epoch U.S. All Cap Fund Class I | | | 211,994 | | | | 5,333,768 | |
MainStay ICAP Equity Fund Class I | | | 52,548 | | | | 2,370,976 | |
MainStay ICAP International Fund Class I | | | 129,870 | | | | 4,211,690 | |
MainStay ICAP Select Equity Fund Class I | | | 5,464 | | | | 235,344 | |
MainStay International Equity Fund Class I | | | 140,377 | | | | 1,770,148 | |
MainStay Large Cap Growth Fund Class I | | | 319,324 | | | | 2,816,438 | |
MainStay MAP Fund Class I | | | 224,576 | | | | 8,942,612 | |
MainStay S&P 500 Index Fund Class I | | | 105,574 | | | | 3,917,867 | |
| | | | | | | | |
Total Equity Funds
(Cost $33,655,435) | | | | | | | 40,046,581 | |
| | | | | | | | |
| | |
Fixed Income Funds 7.1% | | | | | | | | |
MainStay Floating Rate Fund Class I | | | 70,709 | | | | 683,051 | |
MainStay High Yield Municipal Bond Fund Class I | | | 7,878 | | | | 95,642 | |
MainStay Intermediate Term Bond Fund Class I | | | 188,033 | | | | 2,092,806 | |
MainStay Money Market Fund Class A | | | 951,769 | | | | 951,769 | |
MainStay Short Term Bond Fund Class I | | | 1,644 | | | | 15,819 | |
| | | | | | | | |
Total Fixed Income Funds
(Cost $3,772,942) | | | | | | | 3,839,087 | |
| | | | | | | | |
Total Affiliated Investment Companies
(Cost $37,428,377) | | | | | | | 43,885,668 | |
| | | | | | | | |
| | | | | | | | |
| | |
| | | Shares | | | Value | |
| | | | | | | | |
| Unaffiliated Investment Companies 18.5% | |
Equity Funds 17.9% | | | | | | | | |
iShares Russell 2000 Index ETF | | | 61,673 | | | $ | 5,805,896 | |
Vanguard Emerging Markets ETF | | | 89,619 | | | | 3,921,728 | |
| | | | | | | | |
Total Equity Funds
(Cost $8,547,407) | | | | | | | 9,727,624 | |
| | | | | | | | |
| | |
Fixed Income Fund 0.6% | | | | | | | | |
Market Vectors Emerging Markets Local
Currency Bond ETF | | | 11,638 | | | | 321,092 | |
| | | | | | | | |
Total Fixed Income Fund
(Cost $304,210) | | | | | | | 321,092 | |
| | | | | | | | |
Total Unaffiliated Investment Companies
(Cost $8,851,617) | | | | | | | 10,048,716 | |
| | | | | | | | |
Total Investments
(Cost $46,279,994) (b) | | | 99.4 | % | | | 53,934,384 | |
Other Assets, Less Liabilities | | | 0.6 | | | | 337,516 | |
Net Assets | | | 100.0 | % | | $ | 54,271,900 | |
| † | Percentages indicated are based on Fund net assets. |
| (a) | The Fund’s ownership exceeds 5% of the outstanding shares of the Underlying Fund’s share class. (See Note 3) |
| (b) | As of April 30, 2013, cost is $47,314,747 for federal income tax purposes and net unrealized appreciation is as follows: |
| | | | |
Gross unrealized appreciation | | $ | 7,654,390 | |
Gross unrealized depreciation | | | (1,034,753 | ) |
| | | | |
Net unrealized appreciation | | $ | 6,619,637 | |
| | | | |
| The | following abbreviation is used in the above portfolio: |
| | | | |
| 80 | | MainStay Retirement 2050 Fund | | The notes to the financial statements are an integral part of,
and should be read in conjunction with, the financial statements. |
The following is a summary of the fair valuations according to the inputs used as of April 30, 2013, for valuing the Fund’s assets.
Asset Valuation Inputs
| | | | | | | | | | | | | | | | |
Description | | Quoted
Prices in
Active
Markets for
Identical
Assets
(Level 1) | | | Significant
Other
Observable
Inputs
(Level 2) | | | Significant
Unobservable
Inputs
(Level 3) | | | Total | |
| Investments (a) | | | | | | | | | | | | | | | | |
| Affiliated Investment Companies | | | | | | | | | | | | | | | | |
Equity Funds | | $ | 40,046,581 | | | $ | — | | | $ | — | | | $ | 40,046,581 | |
Fixed Income Funds | | | 3,839,087 | | | | — | | | | — | | | | 3,839,087 | |
| | | | | | | | | | | | | | | | |
| Total Affiliated Investment Companies | | | 43,885,668 | | | | — | | | | — | | | | 43,885,668 | |
| | | | | | | | | | | | | | | | |
| Unaffiliated Investment Companies | | | | | | | | | | | | | | | | |
Equity Funds | | | 9,727,624 | | | | — | | | | — | | | | 9,727,624 | |
Fixed Income Fund | | | 321,092 | | | | — | | | | — | | | | 321,092 | |
| | | | | | | | | | | | | | | | |
| Total Unaffiliated Investment Companies | | | 10,048,716 | | | | — | | | | — | | | | 10,048,716 | |
| | | | | | | | | | | | | | | | |
| Total Investments | | $ | 53,934,384 | | | $ | — | | | $ | — | | | $ | 53,934,384 | |
| | | | | | | | | | | | | | | | |
| (a) | For a complete listing of investments, see the Portfolio of Investments. |
The Fund recognizes transfers between the levels as of the beginning of the period.
For the period ended April 30, 2013, the Fund did not have any transfers between Level 1 and Level 2 fair value measurements. (See Note 2)
As of April 30, 2013, the Fund did not hold any investments with significant unobservable inputs (Level 3). (See Note 2)
| | | | | | |
The notes to the financial statements are an integral part of,
and should be read in conjunction with, the financial statements. | | mainstayinvestments.com | | | 81 | |
Statement of Assets and Liabilities as of April 30, 2013 (Unaudited)
| | | | |
| Assets | |
Investment in affiliated investment companies, at value (identified cost $37,428,377) | | $ | 43,885,668 | |
Investments in unaffiliated investment companies, at value (identified cost $8,851,617) | | | 10,048,716 | |
Cash | | | 1,118 | |
Receivables: | | | | |
Fund shares sold | | | 339,254 | |
Manager (See Note 3) | | | 13,411 | |
Other assets | | | 30,992 | |
| | | | |
Total assets | | | 54,319,159 | |
| | | | |
| |
| Liabilities | | | | |
Payables: | | | | |
Transfer agent (See Note 3) | | | 18,935 | |
Professional fees | | | 14,633 | |
NYLIFE Distributors (See Note 3) | | | 3,903 | |
Fund shares redeemed | | | 3,400 | |
Shareholder communication | | | 3,396 | |
Custodian | | | 1,234 | |
Trustees | | | 100 | |
Accrued expenses | | | 1,658 | |
| | | | |
Total liabilities | | | 47,259 | |
| | | | |
Net assets | | $ | 54,271,900 | |
| | | | |
| |
| Composition of Net Assets | | | | |
Shares of beneficial interest outstanding (par value of $.001 per share) unlimited number of shares authorized | | $ | 5,569 | |
Additional paid-in capital | | | 46,876,870 | |
| | | | |
| | | 46,882,439 | |
Distributions in excess of net investment income | | | (31,341 | ) |
Accumulated net realized gain (loss) on investments | | | (233,588 | ) |
Net unrealized appreciation (depreciation) on investments | | | 7,654,390 | |
| | | | |
Net assets | | $ | 54,271,900 | |
| | | | |
| | | | |
Investor Class | | | | |
Net assets applicable to outstanding shares | | $ | 2,460,448 | |
| | | | |
Shares of beneficial interest outstanding | | | 253,566 | |
| | | | |
Net asset value per share outstanding | | $ | 9.70 | |
Maximum sales charge (5.50% of offering price) | | | 0.56 | |
| | | | |
Maximum offering price per share outstanding | | $ | 10.26 | |
| | | | |
Class A | | | | |
Net assets applicable to outstanding shares | | $ | 3,073,801 | |
| | | | |
Shares of beneficial interest outstanding | | | 316,577 | |
| | | | |
Net asset value per share outstanding | | $ | 9.71 | |
Maximum sales charge (5.50% of offering price) | | | 0.57 | |
| | | | |
Maximum offering price per share outstanding | | $ | 10.28 | |
| | | �� | |
Class I | | | | |
Net assets applicable to outstanding shares | | $ | 38,996,166 | |
| | | | |
Shares of beneficial interest outstanding | | | 3,994,548 | |
| | | | |
Net asset value and offering price per share outstanding | | $ | 9.76 | |
| | | | |
Class R2 | | | | |
Net assets applicable to outstanding shares | | $ | 5,305,675 | |
| | | | |
Shares of beneficial interest outstanding | | | 545,728 | |
| | | | |
Net asset value and offering price per share outstanding | | $ | 9.72 | |
| | | | |
Class R3 | | | | |
Net assets applicable to outstanding shares | | $ | 4,435,810 | |
| | | | |
Shares of beneficial interest outstanding | | | 458,206 | |
| | | | |
Net asset value and offering price per share outstanding | | $ | 9.68 | |
| | | | |
| | | | |
| 82 | | MainStay Retirement 2050 Fund | | The notes to the financial statements are an integral part of,
and should be read in conjunction with, the financial statements. |
Statement of Operations for the six months ended April 30, 2013 (Unaudited)
| | | | |
| Investment Income (Loss) | |
Income | | | | |
Dividend distributions from affiliated investment companies | | $ | 530,058 | |
Dividend distributions from unaffiliated investment companies | | | 100,273 | |
| | | | |
Total income | | | 630,331 | |
| | | | |
Expenses | | | | |
Transfer agent (See Note 3) | | | 59,250 | |
Registration | | | 33,603 | |
Manager (See Note 3) | | | 24,191 | |
Distribution/Service—Investor Class (See Note 3) | | | 2,578 | |
Distribution/Service—Class A (See Note 3) | | | 3,385 | |
Distribution/Service—Class R2 (See Note 3) | | | 5,735 | |
Distribution/Service—Class R3 (See Note 3) | | | 10,126 | |
Professional fees | | | 13,510 | |
Shareholder communication | | | 4,501 | |
Shareholder service (See Note 3) | | | 4,319 | |
Custodian | | | 3,467 | |
Trustees | | | 547 | |
Miscellaneous | | | 3,651 | |
| | | | |
Total expenses before waiver/reimbursement | | | 168,863 | |
Expense waiver/reimbursement from Manager (See Note 3) | | | (111,452 | ) |
| | | | |
Net expenses | | | 57,411 | |
| | | | |
Net investment income (loss) | | | 572,920 | |
| | | | |
|
| Realized and Unrealized Gain (Loss) on Investments | |
Net realized gain (loss) on: | | | | |
Affiliated investment company transactions | | | 421,613 | |
Unaffiliated investment company transactions | | | (22,443 | ) |
Realized capital gain distributions from affiliated investment companies | | | 402,081 | |
| | | | |
Net realized gain (loss) on investments from affiliated and unaffiliated investment companies | | | 801,251 | |
| | | | |
Net change in unrealized appreciation (depreciation) on investments | | | 4,768,263 | |
| | | | |
Net realized and unrealized gain (loss) on investments | | | 5,569,514 | |
| | | | |
Net increase (decrease) in net assets resulting from operations | | $ | 6,142,434 | |
| | | | |
| | | | | | |
The notes to the financial statements are an integral part of,
and should be read in conjunction with, the financial statements. | | mainstayinvestments.com | | | 83 | |
Statements of Changes in Net Assets
for the six months ended April 30, 2013 (Unaudited) and the year ended October 31, 2012
| | | | | | | | |
| | | 2013 | | | 2012 | |
| Increase (Decrease) in Net Assets | |
Operations: | | | | | | | | |
Net investment income (loss) | | $ | 572,920 | | | $ | 538,465 | |
Net realized gain (loss) on investments from affiliated and unaffiliated investment companies transactions | | | 801,251 | | | | (434,269 | ) |
Net change in unrealized appreciation (depreciation) on investments | | | 4,768,263 | | | | 4,478,430 | |
| | | | |
Net increase (decrease) in net assets resulting from operations | | | 6,142,434 | | | | 4,582,626 | |
| | | | |
Dividends and distributions to shareholders: | | | | | | | | |
From net investment income: | | | | | | | | |
Investor Class | | | (28,617 | ) | | | (9,217 | ) |
Class A | | | (39,856 | ) | | | (21,834 | ) |
Class I | | | (607,881 | ) | | | (435,399 | ) |
Class R2 | | | (63,463 | ) | | | (24,473 | ) |
Class R3 | | | (48,340 | ) | | | (18,155 | ) |
| | | | |
| | | (788,157 | ) | | | (509,078 | ) |
| | | | |
From net realized gain on investments: | | | | | | | | |
Investor Class | | | (14,959 | ) | | | (75,616 | ) |
Class A | | | (19,903 | ) | | | (165,006 | ) |
Class I | | | (262,801 | ) | | | (2,596,742 | ) |
Class R2 | | | (34,247 | ) | | | (211,293 | ) |
Class R3 | | | (30,708 | ) | | | (208,448 | ) |
| | | | |
| | | (362,618 | ) | | | (3,257,105 | ) |
| | | | |
Total dividends and distributions to shareholders | | | (1,150,775 | ) | | | (3,766,183 | ) |
| | | | |
Capital share transactions: | | | | | | | | |
Net proceeds from sale of shares | | | 7,298,188 | | | | 14,484,390 | |
Net asset value of shares issued to shareholders in reinvestment of dividends and distributions | | | 1,150,743 | | | | 3,766,086 | |
Cost of shares redeemed | | | (4,634,992 | ) | | | (20,839,801 | ) |
| | | | |
Increase (decrease) in net assets derived from capital share transactions | | | 3,813,939 | | | | (2,589,325 | ) |
| | | | |
Net increase (decrease) in net assets | | | 8,805,598 | | | | (1,772,882 | ) |
|
| Net Assets | |
Beginning of period | | | 45,466,302 | | | | 47,239,184 | |
| | | | |
End of period | | $ | 54,271,900 | | | $ | 45,466,302 | |
| | | | |
Undistributed (distributions in excess of) net investment income at end of period | | $ | (31,341 | ) | | $ | 183,896 | |
| | | | |
| | | | |
| 84 | | MainStay Retirement 2050 Fund | | The notes to the financial statements are an integral part of,
and should be read in conjunction with, the financial statements. |
Financial Highlights selected per share data and ratios
| | | | | | | | | | | | | | | | | | | | | | | | |
| | | Investor Class | |
| | | Six months
ended
April 30, | | | Year ended October 31, | | | February 28,
2008**
through
October 31, | |
| | | 2013* | | | 2012 | | | 2011 | | | 2010 | | | 2009 | | | 2008 | |
Net asset value at beginning of period | | $ | 8.76 | | | $ | 8.58 | | | $ | 8.55 | | | $ | 7.50 | | | $ | 6.57 | | | $ | 9.46 | |
| | | | | | | | | | | | | | | | | | | | | | | | |
Net investment income (loss) (a) | | | 0.09 | | | | 0.06 | | | | 0.08 | | | | 0.04 | | | | 0.09 | | | | 0.05 | |
Net realized and unrealized gain (loss) on investments | | | 1.05 | | | | 0.77 | | | | 0.10 | (b) | | | 1.08 | | | | 0.99 | | | | (2.94 | ) |
| | | | | | | | | | | | | | | | | | | | | | | | |
Total from investment operations | | | 1.14 | | | | 0.83 | | | | 0.18 | | | | 1.12 | | | | 1.08 | | | | (2.89 | ) |
| | | | | | | | | | | | | | | | | | | | | | | | |
Less dividends and distributions: | | | | | | | | | | | | | | | | | | | | | | | | |
From net investment income | | | (0.13 | ) | | | (0.07 | ) | | | (0.09 | ) | | | (0.07 | ) | | | (0.11 | ) | | | — | |
From net realized gain on investments | | | (0.07 | ) | | | (0.58 | ) | | | (0.06 | ) | | | — | | | | (0.04 | ) | | | — | |
| | | | | | | | | | | | | | | | | | | | | | | | |
Total dividends and distributions | | | (0.20 | ) | | | (0.65 | ) | | | (0.15 | ) | | | (0.07 | ) | | | (0.15 | ) | | | — | |
| | | | | | | | | | | | | | | | | | | | | | | | |
Net asset value at end of period | | $ | 9.70 | | | $ | 8.76 | | | $ | 8.58 | | | $ | 8.55 | | | $ | 7.50 | | | $ | 6.57 | |
| | | | | | | | | | | | | | | | | | | | | | | | |
Total investment return (c) | | | 13.17 | %(d) | | | 10.69 | % | | | 2.10 | % | | | 15.08 | % | | | 16.92 | % | | | (30.55 | %)(d) |
Ratios (to average net assets)/Supplemental Data: | | | | | | | | | | | | | | | | | | | | | | | | |
Net investment income (loss) | | | 2.02 | %†† | | | 0.74 | % | | | 0.87 | % | | | 0.55 | % | | | 1.30 | % | | | 0.81 | % †† |
Net expenses (e) | | | 0.47 | %†† | | | 0.47 | % | | | 0.47 | % | | | 0.47 | % | | | 0.47 | % | | | 0.46 | % †† |
Expenses (before waiver/reimbursement) (e) | | | 1.12 | %†† | | | 1.27 | % | | | 1.51 | % | | | 2.17 | % | | | 2.31 | % | | | 2.86 | % †† |
Portfolio turnover rate | | | 23 | % | | | 102 | % | | | 139 | % | | | 70 | % | | | 67 | % | | | 138 | % |
Net assets at end of period (in 000’s) | | $ | 2,460 | | | $ | 1,793 | | | $ | 1,010 | | | $ | 650 | | | $ | 299 | | | $ | 80 | |
| ** | Commencement of operations. |
| (a) | Per share data based on average shares outstanding during the period. |
| (b) | The per share amount may differ with the change in aggregate gains (losses) as shown in the Statement of Operations due to the timing of purchases and sales of Fund shares in relation to fluctuating market values during the year. |
| (c) | Total investment return is calculated exclusive of sales charges and assumes the reinvestment of dividends and distributions. |
| (d) | Total investment return is not annualized. |
| (e) | In addition to the fees and expenses which the Fund bears directly, the Fund indirectly bears a pro-rata share of the fees and expenses of the Underlying Funds in which it invests. Such indirect expenses are not included in the above expense ratios. |
| | | | | | |
The notes to the financial statements are an integral part of,
and should be read in conjunction with, the financial statements. | | mainstayinvestments.com | | | 85 | |
Financial Highlights selected per share data and ratios
| | | | | | | | | | | | | | | | | | | | | | | | |
| | | Class A | |
| | | Six months
ended
April 30, | | | Year ended October 31, | |
| | | 2013* | | | 2012 | | | 2011 | | | 2010 | | | 2009 | | | 2008 | |
Net asset value at beginning of period | | $ | 8.77 | | | $ | 8.59 | | | $ | 8.55 | | | $ | 7.49 | | | $ | 6.58 | | | $ | 10.62 | |
| | | | | | | | | | | | | | | | | | | | | | | | |
Net investment income (loss) (a) | | | 0.10 | | | | 0.08 | | | | 0.10 | | | | 0.06 | | | | 0.11 | | | | 0.09 | |
Net realized and unrealized gain (loss) on investments | | | 1.05 | | | | 0.76 | | | | 0.10 | (b) | | | 1.08 | | | | 0.97 | | | | (4.05 | ) |
| | | | | | | | | | | | | | | | | | | | | | | | |
Total from investment operations | | | 1.15 | | | | 0.84 | | | | 0.20 | | | | 1.14 | | | | 1.08 | | | | (3.96 | ) |
| | | | | | | | | | | | | | | | | | | | | | | | |
Less dividends and distributions: | | | | | | | | | | | | | | | | | | | | | | | | |
From net investment income | | | (0.14 | ) | | | (0.08 | ) | | | (0.10 | ) | | | (0.08 | ) | | | (0.13 | ) | | | (0.07 | ) |
From net realized gain on investments | | | (0.07 | ) | | | (0.58 | ) | | | (0.06 | ) | | | — | | | | (0.04 | ) | | | (0.01 | ) |
| | | | | | | | | | | | | | | | | | | | | | | | |
Total dividends and distributions | | | (0.21 | ) | | | (0.66 | ) | | | (0.16 | ) | | | (0.08 | ) | | | (0.17 | ) | | | (0.08 | ) |
| | | | | | | | | | | | | | | | | | | | | | | | |
Net asset value at end of period | | $ | 9.71 | | | $ | 8.77 | | | $ | 8.59 | | | $ | 8.55 | | | $ | 7.49 | | | $ | 6.58 | |
| | | | | | | | | | | | | | | | | | | | | | | | |
Total investment return (c) | | | 13.36 | %(d) | | | 10.64 | % | | | 2.28 | % | | | 15.30 | % | | | 16.84 | % | | | (37.60 | %) |
Ratios (to average net assets)/Supplemental Data: | | | | | | | | | | | | | | | | | | | | | | | | |
Net investment income (loss) | | | 2.17 | %†† | | | 0.97 | % | | | 1.11 | % | | | 0.72 | % | | | 1.62 | % | | | 0.97 | % |
Net expenses (e) | | | 0.37 | %†† | | | 0.37 | % | | | 0.37 | % | | | 0.37 | % | | | 0.37 | % | | | 0.38 | % |
Expenses (before waiver/reimbursement) (e) | | | 0.83 | %†† | | | 0.85 | % | | | 0.91 | % | | | 1.29 | % | | | 1.58 | % | | | 3.52 | % |
Portfolio turnover rate | | | 23 | % | | | 102 | % | | | 139 | % | | | 70 | % | | | 67 | % | | | 138 | % |
Net assets at end of period (in 000’s) | | $ | 3,074 | | | $ | 2,432 | | | $ | 2,423 | | | $ | 2,224 | | | $ | 1,571 | | | $ | 721 | |
| (a) | Per share data based on average shares outstanding during the period. |
| (b) | The per share amount may differ with the change in aggregate gains (losses) as shown in the Statement of Operations due to the timing of purchases and sales of Fund shares in relation to fluctuating market values during the year. |
| (c) | Total investment return is calculated exclusive of sales charges and assumes the reinvestment of dividends and distributions. |
| (d) | Total investment return is not annualized. |
| (e) | In addition to the fees and expenses which the Fund bears directly, the Fund indirectly bears a pro-rata share of the fees and expenses of the Underlying Funds in which it invests. Such indirect expenses are not included in the above expense ratios. |
| | | | |
| 86 | | MainStay Retirement 2050 Fund | | The notes to the financial statements are an integral part of,
and should be read in conjunction with, the financial statements. |
Financial Highlights selected per share data and ratios
| | | | | | | | | | | | | | | | | | | | | | | | |
| | | Class I | |
| | | Six months
ended
April 30, | | | Year ended October 31, | |
| | | 2013* | | | 2012 | | | 2011 | | | 2010 | | | 2009 | | | 2008 | |
Net asset value at beginning of period | | $ | 8.83 | | | $ | 8.64 | | | $ | 8.60 | | | $ | 7.53 | | | $ | 6.59 | | | $ | 10.63 | |
| | | | | | | | | | | | | | | | | | | | | | | | |
Net investment income (loss) (a) | | | 0.11 | | | | 0.11 | | | | 0.08 | | | | 0.08 | | | | 0.13 | | | | 0.09 | |
Net realized and unrealized gain (loss) on investments | | | 1.05 | | | | 0.76 | | | | 0.14 | (b) | | | 1.08 | | | | 0.98 | | | | (4.03 | ) |
| | | | | | | | | | | | | | | | | | | | | | | | |
Total from investment operations | | | 1.16 | | | | 0.87 | | | | 0.22 | | | | 1.16 | | | | 1.11 | | | | (3.94 | ) |
| | | | | | | | | | | | | | | | | | | | | | | | |
Less dividends and distributions: | | | | | | | | | | | | | | | | | | | | | | | | |
From net investment income | | | (0.16 | ) | | | (0.10 | ) | | | (0.12 | ) | | | (0.09 | ) | | | (0.13 | ) | | | (0.09 | ) |
From net realized gain on investments | | | (0.07 | ) | | | (0.58 | ) | | | (0.06 | ) | | | — | | | | (0.04 | ) | | | (0.01 | ) |
| | | | | | | | | | | | | | | | | | | | | | | | |
Total dividends and distributions | | | (0.23 | ) | | | (0.68 | ) | | | (0.18 | ) | | | (0.09 | ) | | | (0.17 | ) | | | (0.10 | ) |
| | | | | | | | | | | | | | | | | | | | | | | | |
Net asset value at end of period | | $ | 9.76 | | | $ | 8.83 | | | $ | 8.64 | | | $ | 8.60 | | | $ | 7.53 | | | $ | 6.59 | |
| | | | | | | | | | | | | | | | | | | | | | | | |
Total investment return (c) | | | 13.43 | %(d) | | | 10.97 | % | | | 2.49 | % | | | 15.56 | % | | | 17.31 | % | | | (37.49 | %) |
Ratios (to average net assets)/Supplemental Data: | | | | | | | | | | | | | | | | | | | | | | | | |
Net investment income (loss) | | | 2.49 | %†† | | | 1.26 | % | | | 0.94 | % | | | 1.01 | % | | | 1.99 | % | | | 1.08 | % |
Net expenses (e) | | | 0.12 | %†† | | | 0.12 | % | | | 0.12 | % | | | 0.12 | % | | | 0.12 | % | | | 0.13 | % |
Expenses (before waiver/reimbursement) (e) | | | 0.58 | %†† | | | 0.60 | % | | | 0.66 | % | | | 1.04 | % | | | 1.34 | % | | | 3.18 | % |
Portfolio turnover rate | | | 23 | % | | | 102 | % | | | 139 | % | | | 70 | % | | | 67 | % | | | 138 | % |
Net assets at end of period (in 000’s) | | $ | 38,996 | | | $ | 33,346 | | | $ | 37,721 | | | $ | 17,917 | | | $ | 14,283 | | | $ | 7,191 | |
| (a) | Per share data based on average shares outstanding during the period. |
| (b) | The per share amount may differ with the change in aggregate gains (losses) as shown in the Statement of Operations due to the timing of purchases and sales of Fund shares in relation to fluctuating market values during the year. |
| (c) | Total investment return is calculated exclusive of sales charges and assumes the reinvestment of dividends and distributions. Class I shares are not subject to sales charges. |
| (d) | Total investment return is not annualized. |
| (e) | In addition to the fees and expenses which the Fund bears directly, the Fund indirectly bears a pro-rata share of the fees and expenses of the Underlying Funds in which it invests. Such indirect expenses are not included in the above expense ratios. |
| | | | | | |
The notes to the financial statements are an integral part of,
and should be read in conjunction with, the financial statements. | | mainstayinvestments.com | | | 87 | |
Financial Highlights selected per share data and ratios
| | | | | | | | | | | | | | | | | | | | |
| | | Class R2 | |
| | | Six months
ended
April 30, | | | Year ended October 31, | | | January 8,
2009**
through
October 31, | |
| | | 2013* | | | 2012 | | | 2011 | | | 2010 | | | 2009 | |
Net asset value at beginning of period | | $ | 8.78 | | | $ | 8.59 | | | $ | 8.55 | | | $ | 7.49 | | | $ | 6.22 | |
| | | | | | | | | | | | | | | | | | | | |
Net investment income (loss) (a) | | | 0.10 | | | | 0.07 | | | | 0.07 | | | | 0.04 | | | | 0.04 | |
Net realized and unrealized gain (loss) on investments | | | 1.04 | | | | 0.77 | | | | 0.12 | (b) | | | 1.09 | | | | 1.23 | |
| | | | | | | | | | | | | | | | | | | | |
Total from investment operations | | | 1.14 | | | | 0.84 | | | | 0.19 | | | | 1.13 | | | | 1.27 | |
| | | | | | | | | | | | | | | | | | | | |
Less dividends and distributions: | | | | | | | | | | | | | | | | | | | | |
From net investment income | | | (0.13 | ) | | | (0.07 | ) | | | (0.09 | ) | | | (0.07 | ) | | | — | |
From net realized gain on investments | | | (0.07 | ) | | | (0.58 | ) | | | (0.06 | ) | | | — | | | | — | |
| | | | | | | | | | | | | | | | | | | | |
Total dividends and distributions | | | (0.20 | ) | | | (0.65 | ) | | | (0.15 | ) | | | (0.07 | ) | | | — | |
| | | | | | | | | | | | | | | | | | | | |
Net asset value at end of period | | $ | 9.72 | | | $ | 8.78 | | | $ | 8.59 | | | $ | 8.55 | | | $ | 7.49 | |
| | | | | | | | | | | | | | | | | | | | |
Total investment return (c) | | | 13.22 | %(d) | | | 10.62 | % | | | 2.16 | % | | | 15.10 | % | | | 20.42 | %(d)(e) |
Ratios (to average net assets)/Supplemental Data: | | | | | | | | | | | | | | | | | | | | |
Net investment income (loss) | | | 2.16 | %†† | | | 0.79 | % | | | 0.84 | % | | | 0.47 | % | | | 0.66 | %†† |
Net expenses (f) | | | 0.47 | %†† | | | 0.47 | % | | | 0.47 | % | | | 0.47 | % | | | 0.47 | %†† |
Expenses (before waiver/reimbursement) (f) | | | 0.93 | %†† | | | 0.95 | % | | | 1.01 | % | | | 1.39 | % | | | 1.64 | %†† |
Portfolio turnover rate | | | 23 | % | | | 102 | % | | | 139 | % | | | 70 | % | | | 67 | % |
Net assets at end of period (in 000’s) | | $ | 5,306 | | | $ | 4,128 | | | $ | 3,065 | | | $ | 1,735 | | | $ | 419 | |
| ** | Commencement of operations. |
| (a) | Per share data based on average shares outstanding during the period. |
| (b) | The per share amount may differ with the change in aggregate gains (losses) as shown in the Statement of Operations due to the timing of purchases and sales of Fund shares in relation to fluctuating market values during the year. |
| (c) | Total investment return is calculated exclusive of sales charges and assumes the reinvestment of dividends and distributions. Class R2 shares are not subject to sales charges. |
| (d) | Total investment return is not annualized. |
| (e) | Total investment return may reflect adjustments to conform to generally accepted accounting principles. |
| (f) | In addition to the fees and expenses which the Fund bears directly, the Fund indirectly bears a pro-rata share of the fees and expenses of the Underlying Funds in which it invests. Such indirect expenses are not included in the above expense ratios. |
| | | | |
| 88 | | MainStay Retirement 2050 Fund | | The notes to the financial statements are an integral part of,
and should be read in conjunction with, the financial statements. |
Financial Highlights selected per share data and ratios
| | | | | | | | | | | | | | | | | | | | | | | | |
| | | Class R3 | |
| | | Six months
ended
April 30, | | | Year ended October 31, | | | May 1,
2008**
through
October 31, | |
| | | 2013* | | | 2012 | | | 2011 | | | 2010 | | | 2009 | | | 2008 | |
Net asset value at beginning of period | | $ | 8.73 | | | $ | 8.55 | | | $ | 8.52 | | | $ | 7.48 | | | $ | 6.56 | | | $ | 9.61 | |
| | | | | | | | | | | | | | | | | | | | | | | | |
Net investment income (loss) (a) | | | 0.09 | | | | 0.05 | | | | 0.06 | | | | 0.03 | | | | 0.10 | | | | 0.01 | |
Net realized and unrealized gain (loss) on investments | | | 1.04 | | | | 0.76 | | | | 0.10 | (b) | | | 1.07 | | | | 0.96 | | | | (3.06 | ) |
| | | | | | | | | | | | | | | | | | | | | | | | |
Total from investment operations | | | 1.13 | | | | 0.81 | | | | 0.16 | | | | 1.10 | | | | 1.06 | | | | (3.05 | ) |
| | | | | | | | | | | | | | | | | | | | | | | | |
Less dividends and distributions: | | | | | | | | | | | | | | | | | | | | | | | | |
From net investment income | | | (0.11 | ) | | | (0.05 | ) | | | (0.07 | ) | | | (0.06 | ) | | | (0.10 | ) | | | — | |
From net realized gain on investments | | | (0.07 | ) | | | (0.58 | ) | | | (0.06 | ) | | | — | | | | (0.04 | ) | | | — | |
| | | | | | | | | | | | | | | | | | | | | | | | |
Total dividends and distributions | | | (0.18 | ) | | | (0.63 | ) | | | (0.13 | ) | | | (0.06 | ) | | | (0.14 | ) | | | — | |
| | | | | | | | | | | | | | | | | | | | | | | | |
Net asset value at end of period | | $ | 9.68 | | | $ | 8.73 | | | $ | 8.55 | | | $ | 8.52 | | | $ | 7.48 | | | $ | 6.56 | |
| | | | | | | | | | | | | | | | | | | | | | | | |
Total investment return (c) | | | 13.16 | %(d) | | | 10.19 | % | | | 2.00 | % | | | 14.78 | % | | | 16.66 | % | | | (31.74 | %)(d) |
Ratios (to average net assets)/Supplemental Data: | | | | | | | | | | | | | | | | | | | | | | | | |
Net investment income (loss) | | | 1.89 | %†† | | | 0.56 | % | | | 0.68 | % | | | 0.39 | % | | | 1.49 | % | | | 0.28 | % †† |
Net expenses (e) | | | 0.72 | %†† | | | 0.72 | % | | | 0.72 | % | | | 0.72 | % | | | 0.72 | % | | | 0.73 | % †† |
Expenses (before waiver/reimbursement)(e) | | | 1.18 | %†† | | | 1.20 | % | | | 1.26 | % | | | 1.64 | % | | | 1.94 | % | | | 2.99 | % †† |
Portfolio turnover rate | | | 23 | % | | | 102 | % | | | 139 | % | | | 70 | % | | | 67 | % | | | 138 | % |
Net assets at end of period (in 000’s) | | $ | 4,436 | | | $ | 3,767 | | | $ | 3,020 | | | $ | 2,729 | | | $ | 2,149 | | | $ | 1,473 | |
| ** | Commencement of operations. |
| (a) | Per share data based on average shares outstanding during the period. |
| (b) | The per share amount may differ with the change in aggregate gains (losses) as shown in the Statement of Operations due to the timing of purchases and sales of Fund shares in relation to fluctuating market values during the year. |
| (c) | Total investment return is calculated exclusive of sales charges and assumes the reinvestment of dividends and distributions. Class R3 shares are not subject to sales charges. |
| (d) | Total investment return is not annualized. |
| (e) | In addition to the fees and expenses which the Fund bears directly, the Fund indirectly bears a pro-rata share of the fees and expenses of the Underlying Funds in which it invests. Such indirect expenses are not included in the above expense ratios. |
| | | | | | |
The notes to the financial statements are an integral part of,
and should be read in conjunction with, the financial statements. | | mainstayinvestments.com | | | 89 | |
Notes to Financial Statements (Unaudited)
Note 1–Organization and Business
MainStay Funds Trust (the “Trust”) was organized as a Delaware statutory trust on April 28, 2009 and is governed by a Declaration of Trust. The Trust is registered under the Investment Company Act of 1940, as amended (the “1940 Act”), as an open-end investment management company, and is comprised of thirty-three funds (collectively referred to as the “Funds” and each individually, referred to as a “Fund”). These financial statements and notes relate to the MainStay Retirement 2010 Fund, MainStay Retirement 2020 Fund, MainStay Retirement 2030 Fund, MainStay Retirement 2040 Fund and MainStay Retirement 2050 Fund (collectively referred to as the “Retirement Funds” and each individually referred to as a “Retirement Fund”). Each is a diversified fund. Each Retirement Fund is the successor of a series of Eclipse Funds Inc. with the same name (each a “Predecessor Fund”). The reorganizations of the Predecessor Funds with and into the respective Retirement Funds occurred on February 26, 2010. All information and references to periods prior to February 26, 2010 relate to the respective Predecessor Fund.
The Retirement Funds each currently offer six classes of shares. Class A and Class I shares commenced operations on June 29, 2007. Class R1 shares were first offered to the public on June 29, 2007, but have not commenced operations as of the date of this report. Class R2 and Class R3 shares were first offered to the public on June 29, 2007, but did not commence operations until January 8, 2009 and May 1, 2008, respectively. Investor Class shares commenced operations on February 28, 2008. Investor Class and Class A shares are offered at net asset value (“NAV”) per share plus an initial sales charge. No sales charge applies to investments of $1 million or more (and certain other qualified purchases) in Investor Class and Class A shares, but a contingent deferred sales charge (“CDSC”) is imposed on certain redemptions made within one year of the date of purchase. Class I, Class R1, Class R2 and Class R3 shares are offered at NAV and are not subject to a sales charge. Depending on eligibility, Investor Class shares may convert to Class A shares and Class A shares may convert to Investor Class shares. The six classes of shares have the same voting (except for issues that relate solely to one class), dividend, liquidation and other rights, and the same terms and conditions, except that Class R3 shares are subject to higher distribution and/or service fee rates than the Investor Class, Class A and Class R2 shares under a distribution plan pursuant to Rule 12b-1 under the 1940 Act. Class I and Class R1 shares are not subject to a distribution and/or service fee. Class R1, Class R2 and Class R3 shares are subject to a shareholder service fee. This is in addition to any fees paid under a distribution plan, where applicable.
The investment objective for each of the Retirement Funds is as follows:
Each Retirement Fund seeks to maximize total return over time consistent with its current investment allocation. Total return is defined as a combination of long-term growth of capital and current income. The years in the Funds’ names refer to the approximate year an investor in the Fund would plan to retire and likely would stop making new investments in the Retirement Fund.
The MainStay Retirement 2010 Fund is designed for an investor who has retired or is seeking to retire between 2010 and 2015, and who plans to withdraw the value of the investor’s account in the Fund gradually after retirement.
The MainStay Retirement 2020 Fund is designed for an investor who is seeking to retire between the years 2016 and 2025, and who plans to withdraw the value of the investor’s account in the Fund gradually after retirement.
The MainStay Retirement 2030 Fund is designed for an investor who is seeking to retire between the years 2026 and 2035, and who plans to withdraw the value of the investor’s account in the Fund gradually after retirement.
The MainStay Retirement 2040 Fund is designed for an investor who is seeking to retire between the years 2036 and 2045, and who plans to withdraw the value of the investor’s account in the Fund gradually after retirement.
The MainStay Retirement 2050 Fund is designed for an investor who is seeking to retire between the years 2046 and 2055, and who plans to withdraw the value of the investor’s account in the Fund gradually after retirement.
The Retirement Funds are “funds of funds,” meaning that they seek to achieve their investment objectives by investing primarily in mutual funds managed by New York Life Investment Management LLC (“New York Life Investments” or “Manager”) (“Affiliated Underlying Funds”), mutual funds managed by an advisor not affiliated with New York Life Investments or exchange traded funds (“ETFs”) (“Unaffiliated Underlying Funds”) if a New York Life Investments managed mutual fund in a particular asset class is not available (Affiliated Underlying Funds collectively with Unaffiliated Funds, the “Underlying Funds”).
Note 2–Significant Accounting Policies
The Retirement Funds prepare their financial statements in accordance with generally accepted accounting principles (“GAAP”) in the United States of America and follow the significant accounting policies described below.
(A) Securities Valuation. Investments are valued as of the close of regular trading on the New York Stock Exchange (“Exchange”) (generally 4:00 p.m. Eastern time) on each day the Retirement Funds are open for business (“valuation date”).
The Board of Trustees (the “Board”) has adopted procedures for the valuation of each Retirement Fund’s securities and has delegated the responsibility for valuation determination under those procedures to the Valuation Committee of the Retirement Funds (the “Valuation Committee”). The Board has authorized the Valuation Committee to appoint a Valuation Sub-Committee (the “Sub-Committee) to deal in the first instance with questions that arise or cannot be resolved under these procedures. The Sub-Committee meets (in person, via electronic mail or via teleconference) on an as-needed basis. The Valuation Committee meets at a later time, as necessary, to ensure that actions taken by the Sub-Committee were appropriate. The procedures recognize that, subject to the oversight of the Board and unless otherwise noted, the responsibility for day-to-day valuation of portfolio assets (including securities for which market prices are not readily available) rests with New York Life Investments, aided to whatever extent necessary by the portfolio managers of each Retirement Fund.
To assess the appropriateness of security valuations, the Manager or the Retirement Funds’ third party service provider who is subject to oversight by the Manager, regularly compares prior day prices, prices
| | |
| 90 | | MainStay Retirement Funds |
on comparable securities and the sale prices to the prior and current day prices and challenges prices exceeding certain tolerance levels with third party pricing services or broker sources. For those securities valued by recommendation, whether through a standardized fair valuation methodology or a fair valuation determination, the Valuation Committee reviews and affirms the reasonableness of the valuation based on such methodologies and determinations on a regular basis after considering all relevant information that is reasonably available.
“Fair value” is defined as the price that a Retirement Fund would receive upon selling an investment in an orderly transaction to an independent buyer in the principal or most advantageous market of the investment. Fair value measurements are determined within a framework that has established a three-tier hierarchy which maximizes the use of observable market data and minimizes the use of unobservable inputs to establish classification of fair value measurements for disclosure purposes. “Inputs” refers broadly to the assumptions that market participants would use in pricing the asset or liability, including assumptions about risk, such as the risk inherent in a particular valuation technique used to measure fair value using a pricing model and/or the risk inherent in the inputs for the valuation technique. Inputs may be observable or unobservable. Observable inputs reflect the assumptions market participants would use in pricing the asset or liability based on market data obtained from sources independent of the Retirement Funds. Unobservable inputs reflect each Retirement Fund’s own assumptions about the assumptions market participants would use in pricing the asset or liability developed based on the information available in the circumstances. The inputs or methodology used for valuing securities may not be an indication of the risks associated with investing in those securities. The three-tier hierarchy of inputs is summarized in the three broad Levels listed below.
| • | | Level 1—quoted prices in active markets for identical investments |
| • | | Level 2—other significant observable inputs (including quoted prices for similar investments in active markets, interest rates and yield curves, prepayment speeds, credit risks, etc.) |
| • | | Level 3—significant unobservable inputs (including each Retirement Fund’s own assumptions about the assumptions that market participants would use in determining the fair value of investments) |
The aggregate value by input level, as of April 30, 2013, for each Retirement Fund’s investments is included at the end of each Retirement Fund’s Portfolio of Investments.
The valuation techniques used by the Retirement Funds to measure fair value maximize the use of observable inputs and minimize the use of unobservable inputs. The Retirement Funds may utilize third party vendor evaluations, whose prices may be derived from one or more of the following standard inputs:
| | |
• Benchmark Yields | | • Reported Trades |
• Broker Dealer Quotes | | • Issuer Spreads |
• Two-sided markets | | • Benchmark securities |
• Bids/Offers | | • Reference Data (corporate actions or material event notices) |
• Industry and economic events | | • Comparable bonds |
• Equity and credit default swap curves | | • Monthly payment information |
Securities for which market values cannot be determined using the methodologies described above are valued by methods deemed in good faith by the Retirement Funds’ Valuation Committee, following the procedures established by the Board, to represent fair value. Under these procedures, the Retirement Funds primarily employ a market-based approach which may use related or comparable assets or liabilities, recent transactions, market multiples, book values, and other relevant information. The Retirement Funds may also use an income-based valuation approach in which the anticipated future cash flows of the investment are discounted to calculate fair value. Discounts may also be applied due to the nature or duration of any restrictions on the disposition of the investments. Due to the inherent uncertainty of valuations of such investments, the fair values may differ significantly from the values that would have been used had an active market existed. For the six-month period ended April 30, 2013, there have been no changes to the fair value methodologies.
Equity and non-equity securities which may be valued in this manner include, but are not limited to: (i) a security for which the trading has been halted or suspended; (ii) a debt security that has recently gone into default and for which there is not a current market quotation; (iii) a security of an issuer that has entered into a restructuring; (iv) a security that has been de-listed from a national exchange; (v) a security for which the market price is not available from a third party pricing source or, if so provided, does not, in the opinion of the Retirement Funds’ Manager reflect the security’s market value; and (vi) a security whose principal market has been temporarily closed at a time when, under normal conditions, it would be open. Securities for which market quotations or observable inputs are not readily available are generally categorized as Level 3 in the hierarchy. As of April 30, 2013, the Retirement Funds did not hold any securities that were fair valued in such a manner.
Investments in Underlying Funds are valued at their NAVs at the close of business each day. These securities are generally categorized as Level 1 in the hierarchy. Securities held by the Underlying Funds are valued using policies consistent with those used by the Underlying Funds, as described in the paragraphs below. The Retirement Funds’ other investments and securities held by the Affiliated Underlying Funds are valued using policies consistent with those used by the Underlying Funds, as described below.
Equity securities and Exchange Traded Funds are valued at the latest quoted sales prices as of the close of regular trading on the Exchange on each valuation date. Securities that are not traded on the valuation date are valued at the mean of the latest quoted bid and ask prices. Prices normally are taken from the principal market in which each security trades. Futures contracts are valued at the last posted settlement price on the market where such futures are primarily traded. Options contracts are valued at the last posted settlement price on the market where such options are principally traded. Investments in other mutual funds are valued at their respective NAVs as of the close of the Exchange on the valuation date.
Debt securities (other than convertible bonds and municipal debt securities) are valued at the evaluated bid prices (elevated mean prices in the case of convertible bonds and municipal debt securities) supplied by a pricing agent or broker selected by the affiliated Underlying Fund’s manager in consultation with the affiliated Underlying Fund’s subadvisor whose prices reflect broker/dealer supplied valuations and electronic
| | | | |
| mainstayinvestments.com | | | 91 | |
Notes to Financial Statements (Unaudited) (continued)
data processing techniques, if such prices are deemed by the affiliated Underlying Fund’s manager, in consultation with the affiliated Underlying Fund’s subadvisor, to be representative of market values, at the regular close of trading of the Exchange on each valuation date. Debt securities include corporate bonds, U.S. government and federal agency bonds, municipal bonds, foreign bonds, Yankee bonds, convertible bonds, asset-backed securities and mortgage-backed securities.
Temporary cash investments acquired over 60 days to maturity are valued using the latest bid prices or using valuations based on a matrix system (which considers such factors as security prices, yields, maturities, and ratings), both as furnished by independent pricing services. Other temporary cash investments which mature in 60 days or less (“Short-Term Investments”) are valued at amortized cost. The amortized cost method involves valuing a security at its cost on the date of purchase and thereafter assuming a constant amortization to maturity of the difference between such cost and the value on maturity date. Amortized cost approximates the current fair value of a security. Securities valued at amortized cost are not valued using a quoted price in an active market. These securities are generally categorized as Level 2 in the hierarchy.
Foreign currency forward contracts are valued at their fair market values determined on the basis of the mean between the last current bid and ask prices based on dealer or exchange quotations.
Loan assignments, participations and commitments are valued at the average of bid quotations obtained from a pricing service. The affiliated Underlying Funds have engaged an independent pricing service to provide market value quotations from dealers in loans.
(B) Income Taxes. Each Retirement Fund is treated as a separate entity for federal income tax purposes.
The Retirement Funds’ policy is to comply with the requirements of the Internal Revenue Code of 1986, as amended (the “Internal Revenue Code”), applicable to regulated investment companies and to distribute all of the taxable income to the shareholders of each Retirement Fund within the allowable time limits. Therefore, no federal, state and local income tax provision is required.
Management evaluates its tax positions to determine if the tax positions taken meet the minimum recognition threshold in connection with accounting for uncertainties in income tax positions taken or expected to be taken for the purposes of measuring and recognizing tax liabilities in the financial statements. Recognition of tax benefits of an uncertain tax position is required only when the position is “more likely than not” to be sustained assuming examination by taxing authorities. Management has analyzed the Retirement Funds’ tax positions taken on federal, state and local income tax returns for all open tax years (for up to three tax years), and has concluded that no provision for federal, state and local income tax is required in the Retirement Funds’ financial statements. The Retirement Funds’ federal, state and local income and federal excise tax returns for tax years for which the applicable statutes of limitations have not expired are subject to examination by the Internal Revenue Service and state and local departments of revenue.
(C) Dividends and Distributions to Shareholders. Dividends and distributions are recorded on the ex-dividend date. The Retirement Funds intend to declare and pay dividends of net investment income
and distributions of net realized capital gains, if any, at least annually. Unless the shareholder elects otherwise, all dividends and distributions are reinvested in the same class of shares of the respective Retirement Fund, at NAV. Dividends and distributions to shareholders are determined in accordance with federal income tax regulations and may differ from GAAP.
(D) Security Transactions and Investment Income. The Retirement Funds record security transactions on the trade date. Realized gains and losses on security transactions are determined using the identified cost method. Dividends and distributions received by the Retirement Funds from the Underlying Funds are recorded on the ex-dividend date.
Investment income and realized and unrealized gains and losses on investments of the Retirement Funds are allocated to separate classes of shares pro rata based upon their relative net assets on the date the income is earned or realized and unrealized gains and losses are incurred.
(E) Expenses. Expenses of the Trust are allocated to the individual Funds in proportion to the net assets of the respective Funds when the expenses are incurred, except where direct allocations of expenses can be made. Expenses (other than transfer agent expenses and fees incurred under the shareholder services plans and the distribution plans further discussed in Note 3(B)) are allocated to separate classes of shares pro rata based upon their relative net assets on the date the expenses are incurred. The expenses borne by the Retirement Funds, including those of related parties to the Retirement Funds, are shown in the Statement of Operations.
In addition, the Retirement Funds bear a pro rata share of the fees and expenses of the Underlying Funds in which they invest. Because the Underlying Funds have varied expense and fee levels and the Retirement Funds may own different proportions of the Underlying Funds at different times, the amount of fees and expenses incurred indirectly by each Retirement Fund may vary. These indirect expenses of the Underlying Funds are not included in the amounts shown on each Fund’s Statement of Operations.
(F) Use of Estimates. In preparing financial statements in conformity with GAAP, management makes estimates and assumptions that affect the reported amounts and disclosures in the financial statements. Actual results could differ from those estimates.
(G) Indemnifications. Under the Trust’s organizational documents, its officers and trustees are indemnified against certain liabilities that may arise out of performance of their duties to the Trust. Additionally, in the normal course of business, the Retirement Funds enter into contracts with third-party service providers that contain a variety of representations and warranties and which may provide general indemnifications. The Retirement Funds’ maximum exposure under these arrangements is unknown, as this would involve future claims that may be made against the Retirement Funds that have not yet occurred. Based on experience, management is of the view that the risk of loss in connection with these potential indemnification obligations is remote. However, there can be no assurance that material liabilities related to such obligations will not arise in the future, which could adversely impact the Retirement Funds.
| | |
| 92 | | MainStay Retirement Funds |
Note 3–Fees and Related Party Transactions
(A) Manager. New York Life Investments, a registered investment adviser and an indirect, wholly-owned subsidiary of New York Life Insurance Company (“New York Life”), serves as the Retirement Funds’ Manager, pursuant to an Amended and Restated Management Agreement (“Management Agreement”) and is responsible for the day-to-day portfolio management of the Retirement Funds. The Manager provides offices, conducts clerical, recordkeeping and bookkeeping services, and keeps most of the financial and accounting records required to be maintained by the Retirement Funds. Except for the portion of salaries and expenses that are the responsibility of the Retirement Funds, the Manager pays the salaries and expenses of all personnel affiliated with the Retirement Funds and certain operational expenses of the Retirement Funds. The Retirement Funds reimburse New York Life Investments in an amount equal to a portion of the salary of the Chief Compliance Officer (“CCO”) of the Retirement Funds.
Each Retirement Fund is contractually obligated to pay the Manager a monthly fee for services performed and facilities furnished at an annual rate of 0.10% of the average daily net assets of the respective Retirement Fund. The Manager has contractually agreed to waive this fee so that the effective management fee is 0.00%. These agreements will remain in effect until February 28, 2014, and shall renew automatically for one-year terms unless New York Life Investments provides written notice of termination prior to the start of the next term or upon approval of the Board.
New York Life Investments has contractually agreed to waive fees and/or reimburse the expenses so that Total Annual Fund Operating Expenses of each Retirement Fund does not exceed the following percentages of average daily net assets: Investor Class, 0.475%; Class A, 0.375%; Class I, 0.125%; Class R1, 0.225%; Class R2, 0.475% and Class R3, 0.725%. These agreements will remain in effect until February 28, 2014, and shall renew automatically for one-year terms unless New York Life Investments provides written notice of termination prior to the start of the next term or upon approval of the Board. Total Annual Fund Operating Expenses excludes expense reimbursement from transfer agent, taxes, interest, litigation, extraordinary expenses, brokerage and other transaction expenses relating to the purchase or sale of portfolio investments, and acquired (underlying) fund fees and expenses.
For the six-month period ended April 30, 2013, New York Life Investments earned fees from the Retirement Funds as follows:
| | | | |
| | | | |
MainStay Retirement 2010 Fund | | $ | 25,279 | |
MainStay Retirement 2020 Fund | | | 45,479 | |
MainStay Retirement 2030 Fund | | | 58,006 | |
MainStay Retirement 2040 Fund | | | 39,895 | |
MainStay Retirement 2050 Fund | | | 24,191 | |
For the six-month period ended April 30, 2013, New York Life Investments waived its fees and/or reimbursed expenses of the Retirement Funds as follows:
| | | | |
| | | | |
MainStay Retirement 2010 Fund | | $ | 97,637 | |
MainStay Retirement 2020 Fund | | | 109,736 | |
MainStay Retirement 2030 Fund | | | 143,793 | |
MainStay Retirement 2040 Fund | | | 144,322 | |
MainStay Retirement 2050 Fund | | | 111,452 | |
State Street Bank and Trust Company (“State Street”), 1 Lincoln Street, Boston, Massachusetts 02111, provides sub-administration and sub-accounting services to the Retirement Funds pursuant to an agreement with New York Life Investments. These services include calculating the daily NAVs of the Retirement Funds, maintaining the general ledger and sub-ledger accounts for the calculation of the Retirement Funds’ respective NAVs, and assisting New York Life Investments in conducting various aspects of the Retirement Funds’ administrative operations. For providing these services to the Retirement Funds, State Street is compensated by New York Life Investments.
(B) Distribution, Service and Shareholder Service Fees. The Trust, on behalf of the Retirement Funds, has entered into a distribution agreement with NYLIFE Distributors LLC (the “Distributor”), an indirect, wholly-owned subsidiary of New York Life. The Retirement Funds have adopted distribution plans (the “Plans”) in accordance with the provisions of Rule 12b-1 under the 1940 Act.
Pursuant to the Investor Class, Class A and Class R2 Plans, the Distributor receives a monthly distribution fee from the Investor Class, Class A and Class R2 shares at an annual rate of 0.25% of the average daily net assets of the Investor Class, Class A and Class R2 shares for distribution and/or service activities as designated by the Distributor. Pursuant to the Class R3 Plan, the Distributor receives a monthly distribution and/or service fee from the Class R3 shares at an annual rate of 0.50% (0.25% for distribution and 0.25% for service activities as designated by the Distributor) of the average daily net assets of the Class R3 shares. Class I and Class R1 shares are not subject to a distribution and/or service fee.
The Plans provide that the distribution and service fees are payable to the Distributor regardless of the amounts actually expended by the Distributor for distribution of the Retirement Funds’ shares and service activities.
In accordance with the Shareholder Services Plans for the Class R1, Class R2 and Class R3 shares, the Manager has agreed to provide, through its affiliates or independent third parties, various shareholder and administrative support services to shareholders of the Class R1, Class R2 and Class R3 shares. For its services, the Manager is entitled to a shareholder service fee accrued daily and paid monthly at an annual rate of 0.10% of the average daily net assets of the Class R1, Class R2 and Class R3 shares. This is in addition to any fees paid under a distribution plan, where applicable.
| | | | |
| mainstayinvestments.com | | | 93 | |
Notes to Financial Statements (Unaudited) (continued)
Shareholder service fees incurred by each Retirement Fund for the six-month period ended April 30, 2013, were as follows:
| | | | |
MainStay Retirement 2010 Fund | | | | |
Class R2 | | $ | 8,326 | |
Class R3 | | | 426 | |
| |
| | | | |
MainStay Retirement 2020 Fund | | | | |
Class R2 | | $ | 12,985 | |
Class R3 | | | 1,059 | |
| |
| | | | |
MainStay Retirement 2030 Fund | | | | |
Class R2 | | $ | 9,497 | |
Class R3 | | | 3,427 | |
| |
| | | | |
MainStay Retirement 2040 Fund | | | | |
Class R2 | | $ | 6,183 | |
Class R3 | | | 2,985 | |
| |
| | | | |
MainStay Retirement 2050 Fund | | | | |
Class R2 | | $ | 2,294 | |
Class R3 | | | 2,025 | |
(C) Sales Charges. The Retirement Funds were advised by the Distributor that the amount of sales charges retained on sales of Investor Class and Class A shares for the six-month period ended April 30, 2013 were as follows:
| | | | |
MainStay Retirement 2010 Fund | | | | |
Investor Class | | $ | 1,401 | |
Class A | | | 1,064 | |
| |
| | | | |
MainStay Retirement 2020 Fund | | | | |
Investor Class | | $ | 7,116 | |
Class A | | | 1,427 | |
| |
| | | | |
MainStay Retirement 2030 Fund | | | | |
Investor Class | | $ | 8,462 | |
Class A | | | 2,004 | |
| |
| | | | |
MainStay Retirement 2040 Fund | | | | |
Investor Class | | $ | 9,531 | |
Class A | | | 3,056 | |
| |
| | | | |
MainStay Retirement 2050 Fund | | | | |
Investor Class | | $ | 4,406 | |
Class A | | | 168 | |
(D) Transfer, Dividend Disbursing and Shareholder Servicing Agent. NYLIM Service Company LLC, an affiliate of New York Life Investments, is the Retirement Funds’ transfer, dividend
disbursing and shareholder servicing agent pursuant to an agreement between NYLIM Service Company LLC and the Trust. NYLIM Service Company LLC has entered into an agreement with Boston Financial Data Services, Inc. (“BFDS”) pursuant to which BFDS performs certain transfer agent services on behalf of NYLIM Service Company LLC. Transfer agent offset arrangements represent reimbursements of a portion of the transfer agency fees from Unaffiliated Underlying Funds. Transfer agent expenses incurred by the Retirement Funds for the six-month period ended April 30, 2013, were as follows:
| | | | |
MainStay Retirement 2010 Fund | | | | |
Investor Class | | $ | 2,203 | |
Class A | | | 5,682 | |
Class I | | | 21,066 | |
Class R2 | | | 13,910 | |
Class R3 | | | 713 | |
| |
| | | | |
MainStay Retirement 2020 Fund | | | | |
Investor Class | | $ | 6,154 | |
Class A | | | 7,721 | |
Class I | | | 26,444 | |
Class R2 | | | 15,153 | |
Class R3 | | | 1,238 | |
| |
| | | | |
MainStay Retirement 2030 Fund | | | | |
Investor Class | | $ | 8,943 | |
Class A | | | 9,308 | |
Class I | | | 53,062 | |
Class R2 | | | 13,916 | |
Class R3 | | | 5,021 | |
| |
| | | | |
MainStay Retirement 2040 Fund | | | | |
Investor Class | | $ | 8,481 | |
Class A | | | 7,981 | |
Class I | | | 55,686 | |
Class R2 | | | 13,740 | |
Class R3 | | | 6,634 | |
| |
| | | | |
MainStay Retirement 2050 Fund | | | | |
Investor Class | | $ | 5,388 | |
Class A | | | 3,145 | |
Class I | | | 40,671 | |
Class R2 | | | 5,335 | |
Class R3 | | | 4,711 | |
(E) Small Account Fee. Shareholders with small accounts adversely impact the cost of providing transfer agency services. In an effort to reduce total transfer agency expenses, the Retirement Funds have implemented a small account fee on certain types of accounts. Certain shareholders with an account balance of less than $1,000 are charged an annual per account fee of $20 (assessed semi-annually),
| | |
| 94 | | MainStay Retirement Funds |
the proceeds from which offset transfer agent fees as reflected in the Statement of Operations.
(F) Capital. As of April 30, 2013, the Retirement Funds held the following percentages of outstanding shares of affiliated investment companies:
| | | | |
MainStay Retirement 2010 Fund | | | | |
MainStay Common Stock Fund Class I | | | 4.74 | % |
MainStay Cornerstone Growth Fund Class I | | | 0.24 | |
MainStay Epoch International Small Cap Fund Class I | | | 0.54 | |
MainStay Epoch U.S. All Cap Fund Class I | | | 0.60 | |
MainStay Floating Rate Fund Class I | | | 0.40 | |
MainStay High Yield Corporate Bond Fund Class I | | | 0.02 | |
MainStay High Yield Municipal Bond Fund Class I | | | 0.13 | |
MainStay ICAP Equity Fund Class I | | | 0.33 | |
MainStay ICAP International Fund Class I | | | 0.15 | |
MainStay ICAP Select Equity Fund Class I | | | 0.01 | |
MainStay Indexed Bond Fund Class I | | | 1.94 | |
MainStay Intermediate Term Bond Fund Class I | | | 2.89 | |
MainStay International Equity Fund Class I | | | 0.28 | |
MainStay Large Cap Growth Fund Class I | | | 0.02 | |
MainStay MAP Fund Class I | | | 0.35 | |
MainStay Money Market Fund Class A | | | 0.47 | |
MainStay S&P 500 Index Fund Class I | | | 0.20 | |
MainStay Short Duration High Yield Fund Class I | | | 1.19 | |
MainStay Short Term Bond Fund Class I | | | 0.18 | |
| |
| | | | |
MainStay Retirement 2020 Fund | | | | |
MainStay Common Stock Fund Class I | | | 10.42 | % |
MainStay Cornerstone Growth Fund Class I | | | 0.44 | |
MainStay Epoch International Small Cap Fund Class I | | | 1.47 | |
MainStay Epoch U.S. All Cap Fund Class I | | | 1.32 | |
MainStay Floating Rate Fund Class I | | | 0.73 | |
MainStay High Yield Corporate Bond Fund Class I | | | 0.02 | |
MainStay High Yield Municipal Bond Fund Class I | | | 0.25 | |
MainStay ICAP Equity Fund Class I | | | 0.69 | |
MainStay ICAP International Fund Class I | | | 0.41 | |
MainStay ICAP Select Equity Fund Class I | | | 0.02 | |
MainStay Indexed Bond Fund Class I | | | 1.21 | |
MainStay Intermediate Term Bond Fund Class I | | | 2.76 | |
MainStay International Equity Fund Class I | | | 0.77 | |
MainStay Large Cap Growth Fund Class I | | | 0.04 | |
MainStay MAP Fund Class I | | | 0.79 | |
MainStay Money Market Fund Class A | | | 0.95 | |
MainStay S&P 500 Index Fund Class I | | | 0.45 | |
MainStay Short Duration High Yield Fund Class I | | | 2.08 | |
MainStay Short Term Bond Fund Class I | | | 0.27 | |
| |
| | | | |
| | | | |
MainStay Retirement 2030 Fund | | | | |
MainStay Common Stock Fund Class I | | | 17.69 | % |
MainStay Cornerstone Growth Fund Class I | | | 0.67 | |
MainStay Epoch International Small Cap Fund Class I | | | 2.61 | |
MainStay Epoch U.S. All Cap Fund Class I | | | 1.97 | |
MainStay Floating Rate Fund Class I | | | 1.04 | |
MainStay High Yield Corporate Bond Fund Class I | | | 0.01 | |
MainStay High Yield Municipal Bond Fund Class I | | | 0.32 | |
MainStay ICAP Equity Fund Class I | | | 0.97 | |
MainStay ICAP International Fund Class I | | | 0.87 | |
MainStay ICAP Select Equity Fund Class I | | | 0.02 | |
MainStay Intermediate Term Bond Fund Class I | | | 1.69 | |
MainStay International Equity Fund Class I | | | 1.62 | |
MainStay Large Cap Growth Fund Class I | | | 0.06 | |
MainStay MAP Fund Class I | | | 1.25 | |
MainStay Money Market Fund Class A | | | 1.18 | |
MainStay S&P 500 Index Fund Class I | | | 0.70 | |
MainStay Short Duration High Yield Fund Class I | | | 2.62 | |
MainStay Short Term Bond Fund Class I | | | 0.31 | |
| |
| | | | |
MainStay Retirement 2040 Fund | | | | |
MainStay Common Stock Fund Class I | | | 14.18 | % |
MainStay Cornerstone Growth Fund Class I | | | 0.52 | |
MainStay Epoch International Small Cap Fund Class I | | | 2.11 | |
MainStay Epoch U.S. All Cap Fund Class I | | | 1.37 | |
MainStay Floating Rate Fund Class I | | | 0.47 | |
MainStay High Yield Corporate Bond Fund Class I | | | 0.00 | ‡ |
MainStay High Yield Municipal Bond Fund Class I | | | 0.14 | |
MainStay ICAP Equity Fund Class I | | | 0.62 | |
MainStay ICAP International Fund Class I | | | 0.75 | |
MainStay ICAP Select Equity Fund Class I | | | 0.02 | |
MainStay Intermediate Term Bond Fund Class I | | | 0.51 | |
MainStay International Equity Fund Class I | | | 1.40 | |
MainStay Large Cap Growth Fund Class I | | | 0.04 | |
MainStay MAP Fund Class I | | | 0.96 | |
MainStay Money Market Fund Class A | | | 0.66 | |
MainStay S&P 500 Index Fund Class I | | | 0.54 | |
MainStay Short Duration High Yield Fund Class I | | | 0.50 | |
MainStay Short Term Bond Fund Class I | | | 0.10 | |
| ‡ | Less than one-tenth of a percent. |
| | | | |
| mainstayinvestments.com | | | 95 | |
Notes to Financial Statements (Unaudited) (continued)
| | | | |
MainStay Retirement 2050 Fund | | | | |
MainStay Common Stock Fund Class I | | | 8.97 | % |
MainStay Cornerstone Growth Fund Class I | | | 0.37 | |
MainStay Epoch International Small Cap Fund Class I | | | 1.39 | |
MainStay Epoch U.S. All Cap Fund Class I | | | 1.11 | |
MainStay Floating Rate Fund Class I | | | 0.11 | |
MainStay High Yield Municipal Bond Fund Class I | | | 0.02 | |
MainStay ICAP Equity Fund Class I | | | 0.26 | |
MainStay ICAP International Fund Class I | | | 0.51 | |
MainStay ICAP Select Equity Fund Class I | | | 0.01 | |
MainStay Intermediate Term Bond Fund Class I | | | 0.28 | |
MainStay International Equity Fund Class I | | | 0.95 | |
MainStay Large Cap Growth Fund Class I | | | 0.02 | |
MainStay MAP Fund Class I | | | 0.60 | |
MainStay Money Market Fund Class A | | | 0.35 | |
MainStay S&P 500 Index Fund Class I | | | 0.31 | |
MainStay Short Term Bond Fund Class I | | | 0.03 | |
Note 4–Federal Income Tax
The tax character of distributions paid during the year ended October 31, 2012, shown in the Statements of Changes in Net Assets was as follows:
| | | | | | | | | | | | |
| | | 2012 | |
| | | Tax Based
Distributions
from
Ordinary
Income | | | Tax Based
Distributions
from Long-Term
Capital Gains | | | Total | |
MainStay Retirement 2010 Fund | | $ | 2,461,178 | | | $ | 2,768,833 | | | $ | 5,230,011 | |
MainStay Retirement 2020 Fund | | | 3,079,626 | | | | 4,796,336 | | | | 7,875,962 | |
MainStay Retirement 2030 Fund | | | 4,125,538 | | | | 8,017,823 | | | | 12,143,361 | |
MainStay Retirement 2040 Fund | | | 2,129,793 | | | | 4,591,943 | | | | 6,721,736 | |
MainStay Retirement 2050 Fund | | | 1,423,721 | | | | 2,342,462 | | | | 3,766,183 | |
Note 5–Custodian
State Street is the custodian of the cash and the securities of the Retirement Funds. Custodial fees are charged to the Retirement Funds based on the market value of securities in the Retirement Funds and the number of certain cash transactions incurred by the Retirement Funds.
Note 6—Line of Credit
The Retirement Funds and certain affiliated funds maintain a line of credit with a syndicate of banks in order to secure a source of funds for temporary purposes to meet unanticipated or excessive redemption requests.
Effective August 29, 2012, under a second amended and restated credit agreement (the “Credit Agreement”), the aggregate commitment amount is $200,000,000 with an optional maximum amount of $250,000,000. The commitment fee is an annual rate of 0.08% of the average commitment amount payable quarterly, regardless of usage, to Bank of New York Mellon, which serves as the agent to the syndicate. The commitment fee is allocated among the Funds and certain affiliated funds based upon net assets and other factors. Interest on any revolving credit loan is charged based upon the Federal Funds Advances rate or the one month London InterBank Offered Rate, whichever is higher. The Credit Agreement expires on August 28, 2013, although the Fund, certain affiliated funds and the syndicate of banks may renew the Credit Agreement for an additional year on the same or different terms. There were no borrowings made or outstanding with respect to the Retirement Funds on the Credit Agreement during the six-month period ended April 30, 2013.
Note 7–Purchases and Sales of Securities (in 000’s)
During the six-month period ended April 30, 2013, purchases and sales of securities were as follows:
| | | | | | | | |
| | | Other | |
| | | Purchases | | | Sales | |
MainStay Retirement 2010 Fund | | $ | 16,357 | | | $ | 19,943 | |
MainStay Retirement 2020 Fund | | | 27,359 | | | | 30,517 | |
MainStay Retirement 2030 Fund | | | 34,650 | | | | 39,681 | |
MainStay Retirement 2040 Fund | | | 23,686 | | | | 20,156 | |
MainStay Retirement 2050 Fund | | | 14,773 | | | | 11,334 | |
Note 8–Capital Share Transactions
MainStay Retirement 2010 Fund
| | | | | | | | |
Investor Class | | Shares | | | Amount | |
Six-month period ended April 30, 2013: | | | | | | | | |
Shares sold | | | 26,608 | | | $ | 269,458 | |
Shares issued to shareholders in reinvestment of dividends and distributions | | | 5,331 | | | | 52,137 | |
Shares redeemed | | | (13,504 | ) | | | (136,411 | ) |
| | | | |
Net increase (decrease) in shares outstanding before conversion | | | 18,435 | | | | 185,184 | |
Shares converted from Investor Class (See Note 1) | | | (4,294 | ) | | | (43,713 | ) |
| | | | |
Net increase (decrease) | | | 14,141 | | | $ | 141,471 | |
| | | | |
Year ended October 31, 2012: | | | | | | | | |
Shares sold | | | 39,075 | | | $ | 384,518 | |
Shares issued to shareholders in reinvestment of dividends and distributions | | | 5,239 | | | | 48,461 | |
Shares redeemed | | | (7,758 | ) | | | (76,600 | ) |
| | | | |
Net increase (decrease) in shares outstanding before conversion | | | 36,556 | | | | 356,379 | |
Shares converted from Investor Class (See Note 1) | | | (44 | ) | | | (434 | ) |
| | | | |
Net increase (decrease) | | | 36,512 | | | $ | 355,945 | |
| | | | |
| | |
| | | | | | | | |
| | |
| 96 | | MainStay Retirement Funds |
| | | | | | | | |
Class A | | Shares | | | Amount | |
Six-month period ended April 30, 2013: | | | | | | | | |
Shares sold | | | 187,596 | | | $ | 1,884,599 | |
Shares issued to shareholders in reinvestment of dividends and distributions | | | 33,228 | | | | 323,970 | |
Shares redeemed | | | (52,916 | ) | | | (536,007 | ) |
| | | | |
Net increase (decrease) in shares outstanding before conversion | | | 167,908 | | | | 1,672,562 | |
Shares converted into Class A (See Note 1) | | | 4,307 | | | | 43,713 | |
| | | | |
Net increase (decrease) | | | 172,215 | | | $ | 1,716,275 | |
| | | | |
Year ended October 31, 2012: | | | | | | | | |
Shares sold | | | 194,782 | | | $ | 1,902,155 | |
Shares issued to shareholders in reinvestment of dividends and distributions | | | 55,930 | | | | 515,676 | |
Shares redeemed | | | (285,831 | ) | | | (2,812,106 | ) |
| | | | |
Net increase (decrease) in shares outstanding before conversion | | | (35,119 | ) | | | (394,275 | ) |
Shares converted into Class A (See Note 1) | | | 44 | | | | 434 | |
| | | | |
Net increase (decrease) | | | (35,075 | ) | | $ | (393,841 | ) |
| | | | |
| | |
| | | | | | | | |
Class I | | Shares | | | Amount | |
Six-month period ended April 30, 2013: | | | | | | | | |
Shares sold | | | 415,315 | | | $ | 4,213,385 | |
Shares issued to shareholders in reinvestment of dividends and distributions | | | 139,078 | | | | 1,364,360 | |
Shares redeemed | | | (994,079 | ) | | | (10,053,268 | ) |
| | | | |
Net increase (decrease) | | | (439,686 | ) | | $ | (4,475,523 | ) |
| | | | |
Year ended October 31, 2012: | | | | | | | | |
Shares sold | | | 1,049,855 | | | $ | 10,361,878 | |
Shares issued to shareholders in reinvestment of dividends and distributions | | | 372,327 | | | | 3,455,192 | |
Shares redeemed | | | (2,882,722 | ) | | | (28,244,104 | ) |
| | | | |
Net increase (decrease) | | | (1,460,540 | ) | | $ | (14,427,034 | ) |
| | | | |
| | |
| | | | | | | | |
Class R2 | | Shares | | | Amount | |
Six-month period ended April 30, 2013: | | | | | | | | |
Shares sold | | | 256,376 | | | $ | 2,619,411 | |
Shares issued to shareholders in reinvestment of dividends and distributions | | | 85,919 | | | | 839,433 | |
Shares redeemed | | | (130,757 | ) | | | (1,317,568 | ) |
| | | | |
Net increase (decrease) | | | 211,538 | | | $ | 2,141,276 | |
| | | | |
Year ended October 31, 2012: | | | | | | | | |
Shares sold | | | 323,088 | | | $ | 3,182,567 | |
Shares issued to shareholders in reinvestment of dividends and distributions | | | 124,841 | | | | 1,153,532 | |
Shares redeemed | | | (329,873 | ) | | | (3,275,067 | ) |
| | | | |
Net increase (decrease) | | | 118,056 | | | $ | 1,061,032 | |
| | | | |
| | |
| | | | | | | | |
| | | | | | | | |
Class R3 | | Shares | | | Amount | |
Six-month period ended April 30, 2013: | | | | | | | | |
Shares sold | | | 1,748 | | | $ | 17,617 | |
Shares issued to shareholders in reinvestment of dividends and distributions | | | 4,305 | | | | 42,057 | |
Shares redeemed | | | (7,699 | ) | | | (77,140 | ) |
| | | | |
Net increase (decrease) | | | (1,646 | ) | | $ | (17,466 | ) |
| | | | |
Year ended October 31, 2012: | | | | | | | | |
Shares sold | | | 14,950 | | | $ | 146,111 | |
Shares issued to shareholders in reinvestment of dividends and distributions | | | 5,879 | | | | 54,319 | |
Shares redeemed | | | (8,488 | ) | | | (82,864 | ) |
| | | | |
Net increase (decrease) | | | 12,341 | | | $ | 117,566 | |
| | | | |
MainStay Retirement 2020 Fund
| | | | | | | | |
Investor Class | | Shares | | | Amount | |
Six-month period ended April 30, 2013: | | | | | | | | |
Shares sold | | | 114,327 | | | $ | 1,119,953 | |
Shares issued to shareholders in reinvestment of dividends and distributions | | | 19,392 | | | | 183,063 | |
Shares redeemed | | | (37,908 | ) | | | (369,868 | ) |
| | | | |
Net increase (decrease) in shares outstanding before conversion | | | 95,811 | | | | 933,148 | |
Shares converted into Investor Class (See Note 1) | | | 872 | | | | 8,662 | |
Shares converted from Investor Class (See Note 1) | | | (6,754 | ) | | | (66,998 | ) |
| | | | |
Net increase (decrease) | | | 89,929 | | | $ | 874,812 | |
| | | | |
Year ended October 31, 2012: | | | | | | | | |
Shares sold | | | 148,691 | | | $ | 1,393,874 | |
Shares issued to shareholders in reinvestment of dividends and distributions | | | 25,393 | | | | 222,440 | |
Shares redeemed | | | (75,337 | ) | | | (709,003 | ) |
| | | | |
Net increase (decrease) in shares outstanding before conversion | | | 98,747 | | | | 907,311 | |
Shares converted into Investor Class (See Note 1) | | | 2,028 | | | | 19,474 | |
Shares converted from Investor Class (See Note 1) | | | (19,665 | ) | | | (188,657 | ) |
| | | | |
Net increase (decrease) | | | 81,110 | | | $ | 738,128 | |
| | | | |
| | |
| | | | | | | | |
| | | | |
| mainstayinvestments.com | | | 97 | |
Notes to Financial Statements (Unaudited) (continued)
| | | | | | | | |
Class A | | Shares | | | Amount | |
Six-month period ended April 30, 2013: | | | | | | | | |
Shares sold | | | 191,624 | | | $ | 1,885,988 | |
Shares issued to shareholders in reinvestment of dividends and distributions | | | 62,545 | | | | 589,177 | |
Shares redeemed | | | (76,886 | ) | | | (752,519 | ) |
| | | | |
Net increase (decrease) in shares outstanding before conversion | | | 177,283 | | | | 1,722,646 | |
Shares converted into Class A (See Note 1) | | | 6,768 | | | | 66,998 | |
Shares converted from Class A (See Note 1) | | | (874 | ) | | | (8,662 | ) |
| | | | |
Net increase (decrease) | | | 183,177 | | | $ | 1,780,982 | |
| | | | |
Year ended October 31, 2012: | | | | | | | | |
Shares sold | | | 376,142 | | | $ | 3,531,714 | |
Shares issued to shareholders in reinvestment of dividends and distributions | | | 119,474 | | | | 1,044,206 | |
Shares redeemed | | | (706,049 | ) | | | (6,618,259 | ) |
| | | | |
Net increase (decrease) in shares outstanding before conversion | | | (210,433 | ) | | | (2,042,339 | ) |
Shares converted into Class A (See Note 1) | | | 19,703 | | | | 188,657 | |
Shares converted from Class A (See Note 1) | | | (2,033 | ) | | | (19,474 | ) |
| | | | |
Net increase (decrease) | | | (192,763 | ) | | $ | (1,873,156 | ) |
| | | | |
| | |
| | | | | | | | |
Class I | | Shares | | | Amount | |
Six-month period ended April 30, 2013: | | | | | | | | |
Shares sold | | | 678,979 | | | $ | 6,677,732 | |
Shares issued to shareholders in reinvestment of dividends and distributions | | | 220,547 | | | | 2,086,377 | |
Shares redeemed | | | (1,352,573 | ) | | | (13,074,768 | ) |
| | | | |
Net increase (decrease) | | | (453,047 | ) | | $ | (4,310,659 | ) |
| | | | |
Year ended October 31, 2012: | | | | | | | | |
Shares sold | | | 1,764,328 | | | $ | 16,573,076 | |
Shares issued to shareholders in reinvestment of dividends and distributions | | | 554,880 | | | | 4,871,850 | |
Shares redeemed | | | (3,656,147 | ) | | | (33,987,126 | ) |
| | | | |
Net increase (decrease) | | | (1,336,939 | ) | | $ | (12,542,200 | ) |
| | | | |
| | |
| | | | | | | | |
Class R2 | | Shares | | | Amount | |
Six-month period ended April 30, 2013: | | | | | | | | |
Shares sold | | | 318,835 | | | $ | 3,158,958 | |
Shares issued to shareholders in reinvestment of dividends and distributions | | | 121,352 | | | | 1,144,358 | |
Shares redeemed | | | (212,510 | ) | | | (2,074,934 | ) |
| | | | |
Net increase (decrease) | | | 227,677 | | | $ | 2,228,382 | |
| | | | |
Year ended October 31, 2012: | | | | | | | | |
Shares sold | | | 395,548 | | | $ | 3,719,953 | |
Shares issued to shareholders in reinvestment of dividends and distributions | | | 181,040 | | | | 1,584,100 | |
Shares redeemed | | | (219,400 | ) | | | (2,067,397 | ) |
| | | | |
Net increase (decrease) | | | 357,188 | | | $ | 3,236,656 | |
| | | | |
| | |
| | | | | | | | |
| | | | | | | | |
Class R3 | | Shares | | | Amount | |
Six-month period ended April 30, 2013: | | | | | | | | |
Shares sold | | | 10,877 | | | $ | 106,172 | |
Shares issued to shareholders in reinvestment of dividends and distributions | | | 9,561 | | | | 90,065 | |
Shares redeemed | | | (23,368 | ) | | | (227,618 | ) |
| | | | |
Net increase (decrease) | | | (2,930 | ) | | $ | (31,381 | ) |
| | | | |
Year ended October 31, 2012: | | | | | | | | |
Shares sold | | | 23,666 | | | $ | 222,948 | |
Shares issued to shareholders in reinvestment of dividends and distributions | | | 17,420 | | | | 152,078 | |
Shares redeemed | | | (42,463 | ) | | | (393,426 | ) |
| | | | |
Net increase (decrease) | | | (1,377 | ) | | $ | (18,400 | ) |
| | | | |
MainStay Retirement 2030 Fund
| | | | | | | | |
Investor Class | | Shares | | | Amount | |
Six-month period ended April 30, 2013: | | | | | | | | |
Shares sold | | | 135,675 | | | $ | 1,279,159 | |
Shares issued to shareholders in reinvestment of dividends and distributions | | | 18,571 | | | | 168,070 | |
Shares redeemed | | | (31,083 | ) | | | (291,480 | ) |
| | | | |
Net increase (decrease) in shares outstanding before conversion | | | 123,163 | | | | 1,155,749 | |
Shares converted into Investor Class (See Note 1) | | | 4,000 | | | | 38,599 | |
Shares converted from Investor Class (See Note 1) | | | (13,333 | ) | | | (127,652 | ) |
| | | | |
Net increase (decrease) | | | 113,830 | | | $ | 1,066,696 | |
| | | | |
Year ended October 31, 2012: | | | | | | | | |
Shares sold | | | 238,539 | | | $ | 2,115,112 | |
Shares issued to shareholders in reinvestment of dividends and distributions | | | 29,425 | | | | 241,610 | |
Shares redeemed | | | (69,368 | ) | | | (621,735 | ) |
| | | | |
Net increase (decrease) in shares outstanding before conversion | | | 198,596 | | | | 1,734,987 | |
Shares converted into Investor Class (See Note 1) | | | 7,581 | | | | 69,882 | |
Shares converted from Investor Class (See Note 1) | | | (25,457 | ) | | | (232,018 | ) |
| | | | |
Net increase (decrease) | | | 180,720 | | | $ | 1,572,851 | |
| | | | |
| | |
| | | | | | | | |
| | |
| 98 | | MainStay Retirement Funds |
| | | | | | | | |
Class A | | Shares | | | Amount | |
Six-month period ended April 30, 2013: | | | | | | | | |
Shares sold | | | 184,565 | | | $ | 1,731,226 | |
Shares issued to shareholders in reinvestment of dividends and distributions | | | 48,520 | | | | 438,130 | |
Shares redeemed | | | (88,216 | ) | | | (814,856 | ) |
| | | | |
Net increase (decrease) in shares outstanding before conversion | | | 144,869 | | | | 1,354,500 | |
Shares converted into Class A (See Note 1) | | | 13,361 | | | | 127,652 | |
Shares converted from Class A (See Note 1) | | | (4,008 | ) | | | (38,599 | ) |
| | | | |
Net increase (decrease) | | | 154,222 | | | $ | 1,443,553 | |
| | | | |
Year ended October 31, 2012: | | | | | | | | |
Shares sold | | | 284,836 | | | $ | 2,524,739 | |
Shares issued to shareholders in reinvestment of dividends and distributions | | | 141,082 | | | | 1,155,457 | |
Shares redeemed | | | (662,868 | ) | | | (5,918,733 | ) |
| | | | |
Net increase (decrease) in shares outstanding before conversion | | | (236,950 | ) | | | (2,238,537 | ) |
Shares converted into Class A (See Note 1) | | | 25,513 | | | | 232,018 | |
Shares converted from Class A (See Note 1) | | | (7,598 | ) | | | (69,882 | ) |
| | | | |
Net increase (decrease) | | | (219,035 | ) | | $ | (2,076,401 | ) |
| | | | |
| | |
| | | | | | | | |
Class I | | Shares | | | Amount | |
Six-month period ended April 30, 2013: | | | | | | | | |
Shares sold | | | 930,699 | | | $ | 8,844,853 | |
Shares issued to shareholders in reinvestment of dividends and distributions | | | 290,574 | | | | 2,644,223 | |
Shares redeemed | | | (2,022,532 | ) | | | (18,546,396 | ) |
| | | | |
Net increase (decrease) | | | (801,259 | ) | | $ | (7,057,320 | ) |
| | | | |
Year ended October 31, 2012: | | | | | | | | |
Shares sold | | | 2,811,383 | | | $ | 24,999,378 | |
Shares issued to shareholders in reinvestment of dividends and distributions | | | 1,083,338 | | | | 8,937,540 | |
Shares redeemed | | | (6,560,799 | ) | | | (57,500,195 | ) |
| | | | |
Net increase (decrease) | | | (2,666,078 | ) | | $ | (23,563,277 | ) |
| | | | |
| | |
| | | | | | | | |
Class R2 | | Shares | | | Amount | |
Six-month period ended April 30, 2013: | | | | | | | | |
Shares sold | | | 284,630 | | | $ | 2,711,623 | |
Shares issued to shareholders in reinvestment of dividends and distributions | | | 70,941 | | | | 640,601 | |
Shares redeemed | | | (131,299 | ) | | | (1,213,555 | ) |
| | | | |
Net increase (decrease) | | | 224,272 | | | $ | 2,138,669 | |
| | | | |
Year ended October 31, 2012: | | | | | | | | |
Shares sold | | | 343,378 | | | $ | 3,033,543 | |
Shares issued to shareholders in reinvestment of dividends and distributions | | | 159,426 | | | | 1,305,703 | |
Shares redeemed | | | (231,313 | ) | | | (2,047,603 | ) |
| | | | |
Net increase (decrease) | | | 271,491 | | | $ | 2,291,643 | |
| | | | |
| | |
| | | | | | | | |
| | | | | | | | |
Class R3 | | Shares | | | Amount | |
Six-month period ended April 30, 2013: | | | | | | | | |
Shares sold | | | 25,505 | | | $ | 241,051 | |
Shares issued to shareholders in reinvestment of dividends and distributions | | | 23,939 | | | | 216,647 | |
Shares redeemed | | | (27,925 | ) | | | (262,507 | ) |
| | | | |
Net increase (decrease) | | | 21,519 | | | $ | 195,191 | |
| | | | |
Year ended October 31, 2012: | | | | | | | | |
Shares sold | | | 55,069 | | | $ | 486,836 | |
Shares issued to shareholders in reinvestment of dividends and distributions | | | 60,982 | | | | 500,662 | |
Shares redeemed | | | (72,286 | ) | | | (638,941 | ) |
| | | | |
Net increase (decrease) | | | 43,765 | | | $ | 348,557 | |
| | | | |
MainStay Retirement 2040 Fund
| | | | | | | | |
Investor Class | | Shares | | | Amount | |
Six-month period ended April 30, 2013: | | | | | | | | |
Shares sold | | | 144,708 | | | $ | 1,353,198 | |
Shares issued to shareholders in reinvestment of dividends and distributions | | | 12,219 | | | | 109,608 | |
Shares redeemed | | | (30,038 | ) | | | (276,632 | ) |
| | | | |
Net increase (decrease) in shares outstanding before conversion | | | 126,889 | | | | 1,186,174 | |
Shares converted into Investor Class (See Note 1) | | | 1,515 | | | | 14,587 | |
Shares converted from Investor Class (See Note 1) | | | (19,730 | ) | | | (189,998 | ) |
| | | | |
Net increase (decrease) | | | 108,674 | | | $ | 1,010,763 | |
| | | | |
Year ended October 31, 2012: | | | | | | | | |
Shares sold | | | 173,625 | | | $ | 1,506,164 | |
Shares issued to shareholders in reinvestment of dividends and distributions | | | 24,021 | | | | 192,885 | |
Shares redeemed | | | (65,564 | ) | | | (573,086 | ) |
| | | | |
Net increase (decrease) in shares outstanding before conversion | | | 132,082 | | | | 1,125,963 | |
Shares converted into Investor Class (See Note 1) | | | 2,232 | | | | 20,180 | |
Shares converted from Investor Class (See Note 1) | | | (3,910 | ) | | | (32,690 | ) |
| | | | |
Net increase (decrease) | | | 130,404 | | | $ | 1,113,453 | |
| | | | |
| | |
| | | | | | | | |
| | | | |
| mainstayinvestments.com | | | 99 | |
Notes to Financial Statements (Unaudited) (continued)
| | | | | | | | |
Class A | | Shares | | | Amount | |
Six-month period ended April 30, 2013: | | | | | | | | |
Shares sold | | | 130,186 | | | $ | 1,217,854 | |
Shares issued to shareholders in reinvestment of dividends and distributions | | | 22,301 | | | | 199,143 | |
Shares redeemed | | | (35,439 | ) | | | (326,288 | ) |
| | | | |
Net increase (decrease) in shares outstanding before conversion | | | 117,048 | | | | 1,090,709 | |
Shares converted into Class A (See Note 1) | | | 19,812 | | | | 189,998 | |
Shares converted from Class A (See Note 1) | | | (1,521 | ) | | | (14,587 | ) |
| | | | |
Net increase (decrease) | | | 135,339 | | | $ | 1,266,120 | |
| | | | |
Year ended October 31, 2012: | | | | | | | | |
Shares sold | | | 202,934 | | | $ | 1,750,331 | |
Shares issued to shareholders in reinvestment of dividends and distributions | | | 72,612 | | | | 580,899 | |
Shares redeemed | | | (363,466 | ) | | | (3,177,794 | ) |
| | | | |
Net increase (decrease) in shares outstanding before conversion | | | (87,920 | ) | | | (846,564 | ) |
Shares converted into Class A (See Note 1) | | | 3,929 | | | | 32,690 | |
Shares converted from Class A (See Note 1) | | | (2,240 | ) | | | (20,180 | ) |
| | | | |
Net increase (decrease) | | | (86,231 | ) | | $ | (834,054 | ) |
| | | | |
| | |
| | | | | | | | |
Class I | | Shares | | | Amount | |
Six-month period ended April 30, 2013: | | | | | | | | |
Shares sold | | | 665,847 | | | $ | 6,276,247 | |
Shares issued to shareholders in reinvestment of dividends and distributions | | | 169,387 | | | | 1,524,486 | |
Shares redeemed | | | (754,052 | ) | | | (6,892,201 | ) |
| | | | |
Net increase (decrease) | | | 81,182 | | | $ | 908,532 | |
| | | | |
Year ended October 31, 2012: | | | | | | | | |
Shares sold | | | 1,718,790 | | | $ | 14,983,792 | |
Shares issued to shareholders in reinvestment of dividends and distributions | | | 598,514 | | | | 4,824,024 | |
Shares redeemed | | | (3,544,526 | ) | | | (30,355,543 | ) |
| | | | |
Net increase (decrease) | | | (1,227,222 | ) | | $ | (10,547,727 | ) |
| | | | |
| | |
| | | | | | | | |
Class R2 | | Shares | | | Amount | |
Six-month period ended April 30, 2013: | | | | | | | | |
Shares sold | | | 214,496 | | | $ | 2,020,276 | |
Shares issued to shareholders in reinvestment of dividends and distributions | | | 37,721 | | | | 337,978 | |
Shares redeemed | | | (100,912 | ) | | | (934,906 | ) |
| | | | |
Net increase (decrease) | | | 151,305 | | | $ | 1,423,348 | |
| | | | |
Year ended October 31, 2012: | | | | | | | | |
Shares sold | | | 281,806 | | | $ | 2,449,822 | |
Shares issued to shareholders in reinvestment of dividends and distributions | | | 91,560 | | | | 734,313 | |
Shares redeemed | | | (175,743 | ) | | | (1,528,653 | ) |
| | | | |
Net increase (decrease) | | | 197,623 | | | $ | 1,655,482 | |
| | | | |
| | |
| | | | | | | | |
| | | | | | | | |
Class R3 | | Shares | | | Amount | |
Six-month period ended April 30, 2013: | | | | | | | | |
Shares sold | | | 34,029 | | | $ | 310,746 | |
Shares issued to shareholders in reinvestment of dividends and distributions | | | 17,159 | | | | 153,406 | |
Shares redeemed | | | (21,569 | ) | | | (197,933 | ) |
| | | | |
Net increase (decrease) | | | 29,619 | | | $ | 266,219 | |
| | | | |
Year ended October 31, 2012: | | | | | | | | |
Shares sold | | | 50,718 | | | $ | 437,766 | |
Shares issued to shareholders in reinvestment of dividends and distributions | | | 48,632 | | | | 389,539 | |
Shares redeemed | | | (49,056 | ) | | | (423,846 | ) |
| | | | |
Net increase (decrease) | | | 50,294 | | | $ | 403,459 | |
| | | | |
MainStay Retirement 2050 Fund
| | | | | | | | |
Investor Class | | Shares | | | Amount | |
Six-month period ended April 30, 2013: | | | | | | | | |
Shares sold | | | 64,090 | | | $ | 591,832 | |
Shares issued to shareholders in reinvestment of dividends and distributions | | | 4,927 | | | | 43,552 | |
Shares redeemed | | | (19,721 | ) | | | (181,182 | ) |
| | | | |
Net increase (decrease) in shares outstanding before conversion | | | 49,296 | | | | 454,202 | |
Shares converted from Investor Class (See Note 1) | | | (315 | ) | | | (2,998 | ) |
| | | | |
Net increase (decrease) | | | 48,981 | | | $ | 451,204 | |
| | | | |
Year ended October 31, 2012: | | | | | | | | |
Shares sold | | | 105,722 | | | $ | 896,953 | |
Shares issued to shareholders in reinvestment of dividends and distributions | | | 10,806 | | | | 84,833 | |
Shares redeemed | | | (24,976 | ) | | | (212,648 | ) |
| | | | |
Net increase (decrease) in shares outstanding before conversion | | | 91,552 | | | | 769,138 | |
Shares converted from Investor Class (See Note 1) | | | (4,668 | ) | | | (40,988 | ) |
| | | | |
Net increase (decrease) | | | 86,884 | | | $ | 728,150 | |
| | | | |
| | |
| | | | | | | | |
Class A | | Shares | | | Amount | |
Six-month period ended April 30, 2013: | | | | | | | | |
Shares sold | | | 56,168 | | | $ | 517,297 | |
Shares issued to shareholders in reinvestment of dividends and distributions | | | 6,751 | | | | 59,751 | |
Shares redeemed | | | (23,886 | ) | | | (220,926 | ) |
| | | | |
Net increase (decrease) in shares outstanding before conversion | | | 39,033 | | | | 356,122 | |
Shares converted into Class A (See Note 1) | | | 315 | | | | 2,998 | |
| | | | |
Net increase (decrease) | | | 39,348 | | | $ | 359,120 | |
| | | | |
Year ended October 31, 2012: | | | | | | | | |
Shares sold | | | 72,938 | | | $ | 619,226 | |
Shares issued to shareholders in reinvestment of dividends and distributions | | | 23,789 | | | | 186,743 | |
Shares redeemed | | | (106,216 | ) | | | (907,858 | ) |
| | | | |
Net increase (decrease) in shares outstanding before conversion | | | (9,489 | ) | | | (101,889 | ) |
Shares converted into Class A (See Note 1) | | | 4,668 | | | | 40,988 | |
| | | | |
Net increase (decrease) | | | (4,821 | ) | | $ | (60,901 | ) |
| | | | |
| | |
| 100 | | MainStay Retirement Funds |
| | | | | | | | |
Class I | | Shares | | | Amount | |
Six-month period ended April 30, 2013: | | | | | | | | |
Shares sold | | | 533,140 | | | $ | 4,940,948 | |
Shares issued to shareholders in reinvestment of dividends and distributions | | | 97,939 | | | | 870,682 | |
Shares redeemed | | | (413,468 | ) | | | (3,740,696 | ) |
| | | | |
Net increase (decrease) | | | 217,611 | | | $ | 2,070,934 | |
| | | | |
Year ended October 31, 2012: | | | | | | | | |
Shares sold | | | 1,305,238 | | | $ | 11,142,867 | |
Shares issued to shareholders in reinvestment of dividends and distributions | | | 384,302 | | | | 3,032,141 | |
Shares redeemed | | | (2,277,665 | ) | | | (19,023,853 | ) |
| | | | |
Net increase (decrease) | | | (588,125 | ) | | $ | (4,848,845 | ) |
| | | | |
| | |
| | | | | | | | |
Class R2 | | Shares | | | Amount | |
Six-month period ended April 30, 2013: | | | | | | | | |
Shares sold | | | 112,665 | | | $ | 1,035,778 | |
Shares issued to shareholders in reinvestment of dividends and distributions | | | 11,028 | | | | 97,710 | |
Shares redeemed | | | (48,250 | ) | | | (443,270 | ) |
| | | | |
Net increase (decrease) | | | 75,443 | | | $ | 690,218 | |
| | | | |
Year ended October 31, 2012: | | | | | | | | |
Shares sold | | | 153,793 | | | $ | 1,310,973 | |
Shares issued to shareholders in reinvestment of dividends and distributions | | | 29,958 | | | | 235,766 | |
Shares redeemed | | | (70,166 | ) | | | (601,166 | ) |
| | | | |
Net increase (decrease) | | | 113,585 | | | $ | 945,573 | |
| | | | |
| | |
| | | | | | | | |
| | | | | | | | |
Class R3 | | Shares | | | Amount | |
Six-month period ended April 30, 2013: | | | | | | | | |
Shares sold | | | 23,268 | | | $ | 212,333 | |
Shares issued to shareholders in reinvestment of dividends and distributions | | | 8,952 | | | | 79,048 | |
Shares redeemed | | | (5,410 | ) | | | (48,918 | ) |
| | | | |
Net increase (decrease) | | | 26,810 | | | $ | 242,463 | |
| | | | |
Year ended October 31, 2012: | | | | | | | | |
Shares sold | | | 60,657 | | | $ | 514,371 | |
Shares issued to shareholders in reinvestment of dividends and distributions | | | 28,903 | | | | 226,603 | |
Shares redeemed | | | (11,181 | ) | | | (94,276 | ) |
| | | | |
Net increase (decrease) | | | 78,379 | | | $ | 646,698 | |
| | | | |
| | |
| | | | | | | | |
Note 9–Subsequent Events
In connection with the preparation of the financial statements of the Retirement Funds as of and for the six-month period ended April 30, 2013, events and transactions subsequent to April 30, 2013, through the date the financial statements were issued have been evaluated by the Retirement Funds’ management for possible adjustment and/or disclosure. No subsequent events requiring financial statement adjustment or disclosure have been identified.
| | | | |
| mainstayinvestments.com | | | 101 | |
Board Consideration and Approval of Management Agreements (Unaudited)
Section 15(c) of the Investment Company Act of 1940, as amended (the “1940 Act”) requires that each mutual fund’s board of trustees, including a majority of the independent trustees, annually review and approve the fund’s investment advisory agreements. At its December 10-12, 2012 meeting, the Board of Trustees of the MainStay Group of Funds (“Board”) unanimously approved the Management Agreements with respect to the MainStay Retirement 2010 Fund, MainStay Retirement 2020 Fund, MainStay Retirement 2030 Fund, MainStay Retirement 2040 Fund and MainStay Retirement 2050 Fund (“Retirement Funds”) and New York Life Investment Management LLC (“New York Life Investments”).
In reaching its decision to approve the Agreements, the Board considered information furnished by New York Life Investments in connection with a contract review process that took place at various meetings of the Board and its Contracts Committee between September 2012 and December 2012, as well as other relevant information furnished to the Board throughout the year by New York Life Investments. Information requested by and furnished to the Board in connection with the contract review process included, among other items, reports on the Retirement Funds prepared by Strategic Insight Mutual Fund Research and Consulting, LLC (“Strategic Insight”), an independent third-party service provider engaged by the Board to report objectively on the Retirement Funds’ investment performance, management fees and ordinary operating expenses. The Board also considered information provided by New York Life Investments on the fees charged to other investment advisory clients (including institutional separate accounts) that follow investment strategies similar to the Retirement Funds, and the rationale for any differences in the Retirement Funds’ management fees and the fees charged to those other investment advisory clients. In addition, the Board requested and received information on the profitability of the Retirement Funds to New York Life Investments and its affiliates, and responses from New York Life Investments to a series of questions encompassing a variety of topics prepared on behalf of the Board by independent legal counsel to the Board and its independent trustees (the “Independent Trustees”). Information provided to the Board at its meetings throughout the year included, among other items, detailed investment performance reports on the Retirement Funds prepared by the Investment Consulting Group at New York Life Investments. The structure and format for this regular reporting was developed in consultation with the Board. The Board also received from New York Life Investments throughout the year, among other items, periodic reports on legal and compliance matters, portfolio turnover, and sales and marketing activity.
In determining to approve the Agreements, the members of the Board reviewed and evaluated all of the information and factors they believed to be relevant and appropriate in light of legal advice furnished to them by independent legal counsel and through the exercise of their own business judgment. The broad factors considered by the Board are discussed in greater detail below, and included, among other items: (i) the nature, scope and quality of the services provided to the Retirement Funds by New York Life Investments; (ii) the investment performance of the Retirement Funds and New York Life Investments; (iii) the costs of the services provided, and profits realized, by New York Life Investments from its relationship with the Retirement Funds; (iv) the extent to which economies of scale may be realized as the Retirement Funds grow, and the extent to which economies of scale may benefit Retirement Fund investors; and (v) the reasonableness of the Retirement Funds’ management fees and overall total ordinary operating expenses, particularly as
compared to similar funds and accounts managed by New York Life Investments and third-party “peer funds” identified by Strategic Insight.
While individual members of the Board may have weighed certain factors differently, the Board’s decision to approve the Agreements was based on a consideration of all the information provided to the Board, including information provided to the Board throughout the year and specifically in connection with the contract review process. The Board’s conclusions with respect to the Agreements also were based, in part, on the Board’s consideration of the Agreements in prior years. In addition to considering the above-referenced factors, the Board observed that in the marketplace there are a range of investment options available to shareholders of the Retirement Funds, and that the Retirement Funds’ shareholders, having had the opportunity to consider other investment options, have chosen to invest in the Retirement Funds. A more detailed discussion of the factors that figured prominently in the Board’s decisions to approve the Agreements is provided below.
Nature, Scope and Quality of Services to Be Provided by New York Life Investments
The Board examined the nature, scope and quality of the services that New York Life Investments provides to the Retirement Funds. The Board evaluated New York Life Investments’ experience in serving as manager of the Retirement Funds, noting that New York Life Investments manages other mutual funds, serves a variety of other investment advisory clients, including other pooled investment vehicles, and has experience with overseeing mutual fund service providers. The Board considered the experience of senior personnel at New York Life Investments providing management and administrative services to the Retirement Funds, as well as New York Life Investments’ reputation and financial condition. The Board also considered the full range of non-advisory services that New York Life Investments supplies to the Retirement Funds under the terms of the Agreements, including: (i) fund accounting services provided by New York Life Investments’ Fund Accounting and Administration Group; (ii) investment oversight and analytical services provided by New York Life Investments’ Investment Consulting Group; (iii) compliance services provided by New York Life Investments’ compliance department, including oversight and implementation of the Retirement Funds’ compliance program; and (iv) legal services provided by New York Life Investments’ Office of the General Counsel. Additional information about the non-advisory services provided by New York Life Investments is set forth in the Agreements. The Board also considered New York Life Investments’ willingness to invest in personnel that benefit the Retirement Funds, and noted that New York Life Investments is responsible for compensating the Retirement Funds’ officers. The Board also considered benefits to shareholders of being part of the MainStay Group of Funds, including the privilege of exchanging investments between the same class of shares without the imposition of a sales charge, as described more fully in the Retirement Funds’ prospectus.
The Board also examined the nature, scope and quality of the advisory services that New York Life Investments provides to the Retirement Funds. The Board evaluated New York Life Investments’ experience in serving as investment adviser to the Retirement Funds and managing other portfolios. It examined New York Life Investments’ track record and experience in providing investment advisory services, the experience of investment advisory, senior management and administrative
| | |
| 102 | | MainStay Retirement Funds |
personnel at New York Life Investments, and New York Life Investments’ overall legal and compliance environment. The Board also reviewed New York Life Investments’ willingness to invest in personnel that benefit the Retirement Funds. In this regard, the Board considered the experience of the Retirement Funds’ portfolio managers, the number of accounts managed by the portfolio managers and the method for compensating portfolio managers.
Based on these considerations, the Board concluded, within the context of its overall determinations regarding the Agreements, that the Retirement Funds should continue to benefit from the nature, scope and quality of these services as a result of New York Life Investments’ experience, personnel, operations and resources.
Investment Performance
In evaluating the Retirement Funds’ investment performance, the Board considered investment performance results in light of the Retirement Funds’ investment objectives, strategies and risks, as disclosed in the Retirement Funds’ prospectus. The Board particularly considered detailed investment reports on the Retirement Funds’ performance provided to the Board throughout the year by the Investment Consulting Group of New York Life Investments. These reports include, among other items, information on the Retirement Funds’ gross and net returns, the Retirement Funds’ investment performance relative to relevant investment categories and Retirement Fund benchmarks, the Retirement Funds’ risk-adjusted investment performance, and the Retirement Funds’ investment performance as compared to similar competitor funds, as appropriate. The Board also considered information provided by Strategic Insight showing the investment performance of the Retirement Funds as compared to peer funds.
In considering the Retirement Funds’ investment performance, the Board focused principally on the Retirement Funds’ long-term performance track record. The Board also gave weight to its ongoing discussions with senior management at New York Life Investments concerning the Retirement Funds’ investment performance, as well as discussions between the Retirement Funds’ portfolio managers and the Board that occur typically on an annual basis. In addition, the Board considered any specific actions that New York Life Investments had taken, or had agreed with the Board to take, to enhance Retirement Fund investment performance, and the results of those actions.
Because the Retirement Funds invest substantially all of their assets in other funds advised by New York Life Investments, the Board considered the rationale for the allocation among and selection of the underlying funds in which the Retirement Funds invest, including the investment performance of the underlying funds.
Based on these considerations, the Board concluded, within the context of its overall determinations regarding the Agreements, that the long-term investment performance of the Retirement Funds, along with ongoing efforts by New York Life Investments to enhance investment returns, supported a determination to approve the Agreements. The Retirement Funds disclose more information about investment performance in the Portfolio Management Discussion and Analysis, Investment and Performance Comparison and Financial Highlights sections of this Semiannual Report and in the Retirement Funds’ prospectus.
Costs of the Services Provided, and Profits Realized, by New York Life Investments
The Board considered the costs of the services provided by New York Life Investments under the Agreements, and the profits realized by New York Life Investments and its affiliates due to their relationships with the Retirement Funds.
The Board noted that the shareholders of the Retirement Funds indirectly pay the fees and expenses of the underlying funds in which the Retirement Funds invest. The Board considered that the Retirement Funds’ investments in underlying funds managed by New York Life Investments indirectly benefit New York Life Investments.
In evaluating the costs and profits of New York Life Investments and its affiliates, the Board considered, among other factors, New York Life Investments’ investments in personnel, systems, equipment and other resources necessary to manage the Retirement Funds. The Board acknowledged that New York Life Investments must be in a position to pay and retain experienced professional personnel to provide services to the Retirement Funds, and that the ability to maintain a strong financial position is important in order for New York Life Investments to continue to provide high-quality services to the Retirement Funds. The Board also noted that the Retirement Funds benefit from the allocation of certain fixed costs across the MainStay Group of Funds.
In addition, the Board noted the difficulty in obtaining reliable comparative data about mutual fund managers’ profitability, since such information generally is not publicly available and may be impacted by numerous factors, including the structure of a fund manager’s organization, the types of funds it manages, the methodology used to allocate certain fixed costs to specific funds, and the manager’s capital structure and costs of capital. While recognizing the difficulty in evaluating a manager’s profitability with respect to the Retirement Funds, and noting that other profitability methodologies may also be reasonable, the Board concluded that the profitability methodology presented by New York Life Investments to the Board, which was developed by New York Life Investments in consultation with an independent consultant, was reasonable in all material respects.
In considering the costs and profitability of the Retirement Funds, the Board also considered certain fall-out benefits that may be realized by New York Life Investments and its affiliates due to their relationships with the Retirement Funds. The Board further considered that, in addition to fees earned by New York Life Investments for managing the Retirement Funds, New York Life Investments’ affiliates also earn revenues from serving the Retirement Funds in various other capacities, including as the Retirement Funds’ transfer agent and distributor. The Board observed that information about these other revenues, and their impact on the profitability of the Retirement Funds to New York Life Investments and its affiliates, was furnished to the Board as part of the 15(c) process. The Board noted that, although it assessed the overall profitability of the Retirement Funds to New York Life Investments and its affiliates as part of the contract review process, when considering the reasonableness of the fees to be paid to New York Life Investments and its affiliates under the Agreements, the Board considered the profitability of New York Life Investments’ relationship with the Retirement Funds on a pre-tax basis, and without regard to distribution expenses.
| | | | |
| mainstayinvestments.com | | | 103 | |
Board Consideration and Approval of Management Agreements (Unaudited) (continued)
After evaluating the information presented to the Board, the Board concluded, within the context of its overall determinations regarding the Agreements, that any profits realized by New York Life Investments and its affiliates due to their relationships with the Retirement Funds supported the Board’s decision to approve the Agreements.
Extent to Which Economies of Scale May Be Realized as the Retirement Funds Grow
The Board also considered whether the Retirement Funds’ expense structures permitted economies of scale to be shared with Retirement Fund investors. The Board reviewed information from New York Life Investments showing how the Retirement Funds’ management fee schedules compared to fee schedules of other funds and accounts managed by New York Life Investments. The Board also reviewed information from Strategic Insight showing how the Retirement Funds’ management fee schedules hypothetically would compare with fees paid for similar services by peer funds at varying asset levels. While recognizing the difficulty of determining economies of scale with precision, the Board acknowledged that economies of scale may be shared with the Retirement Funds in a number of ways, including, for example, through the imposition of management fee breakpoints and by initially setting relatively lower management fees. The Board also noted that it separately considers economies of scale as part of its review of the management agreements of underlying funds in which the Retirement Funds invest.
Based on this information, the Board concluded, within the context of its overall determinations regarding the Agreements, that the Retirement Funds’ expense structures appropriately reflect economies of scale for the benefit of Retirement Fund investors. The Board noted, however, that it would continue to evaluate the reasonableness of the Retirement Funds’ expense structures as the Retirement Funds grow over time.
Management Fees and Total Ordinary Operating Expenses
The Board evaluated the reasonableness of the fees to be paid under the Agreements and the Retirement Funds’ expected total ordinary operating expenses.
In assessing the reasonableness of the Retirement Funds’ fees and expenses, the Board primarily considered comparative data provided by Strategic Insight on the fees and expenses charged by similar mutual funds managed by other investment advisers. The Board also considered the reasonableness of fees and expenses the Retirement Funds indirectly pay by investing in underlying funds that charge management fees. The Board considered New York Life Investments’ process for monitoring and disclosing potential conflicts in the selection of underlying funds. In addition, the Board considered information provided by New York Life Investments on fees charged to other investment advisory clients, including institutional separate accounts and other funds with similar investment objectives as the Retirement Funds. The Board particularly considered differences in the contractual management fee schedules of the retail MainStay Funds and similarly-managed MainStay VP Portfolios, taking into account New York Life Investments’ rationale for any differences in fee schedules. The Board also took into account explanations provided by New York Life Investments about the different scope of services provided to mutual funds as compared with other investment advisory clients. Additionally, the Board considered the impact of any expense limitation arrangements on the Retirement Funds’ net management fee and expenses.
The Board noted that, outside of the Retirement Funds’ management fees and fees charged under a share class’s Rule 12b-1 and/or shareholder services plans, a share class’s most significant “other expenses” are transfer agent fees. Transfer agent fees are charged to the Retirement Funds based on the number of shareholder accounts (a “per-account” fee) as compared with certain other fees (e.g., management fees), which are charged based on the Retirement Funds’ average net assets. The Board took into account information from New York Life Investments showing that the Retirement Funds’ transfer agent fee schedule is reasonable, including industry data showing that the per-account fees that NYLIM Service Company LLC, the Retirement Funds’ transfer agent, charges the Retirement Funds are within the range of per-account fees charged by transfer agents to other mutual funds. In addition, the Board considered NYLIM Service Company LLC’s profitability in connection with the transfer agent services it provides to the Retirement Funds.
The Board acknowledged that, because the Retirement Funds’ transfer agent fees are billed on a per-account basis, the impact of transfer agent fees on a share class’s expense ratio may be more significant in cases where the share class has a high number of accounts with limited assets (i.e., small accounts). The Board observed that transfer agent fees are a significant portion of total expenses of many Funds in the MainStay Group of Funds. The impact of transfer agent fees on the expense ratios of these MainStay Funds tend to be greater than for other open-end retail funds, because the MainStay Group of Funds generally has a significant number of small accounts relative to competitor funds. The Board acknowledged the role that the MainStay Group of Funds historically has played in serving the investment needs of New York Life Insurance Company (“New York Life”) policyholders, who often maintain smaller account balances than other fund investors. The Board discussed measures that it and New York Life Investments have taken in recent years to mitigate the effect of small accounts on the expense ratios of Fund share classes, including: (i) encouraging New York Life agents to consolidate multiple small accounts held by the same investor into one MainStay Retirement Fund account; (ii) increasing investment minimums from $500 to $1,000 in 2003; (iii) introducing Investor Class shares for certain MainStay Funds in early 2008 to consolidate smaller account investors; (iv) closing small accounts with balances below $250 in Investor Class shares or $750 in all other classes of shares; (v) no longer allowing an exception with no minimum investment amount with respect to AutoInvest accounts with subsequent monthly purchases of $100; (vi) since 2007, charging an annual $20.00 small account fee on certain accounts with balances below $1,000; and (vii) modifying the approach for billing transfer agent expenses to reduce the degree of subsidization by large accounts of smaller accounts.
After considering all of the factors outlined above, the Board concluded that the Retirement Funds’ management fees and total ordinary operating expenses were within a range that is competitive and, within the context of the Board’s overall conclusions regarding the Agreements, support a conclusion that these fees and expenses are reasonable.
Conclusion
On the basis of the information provided to it and its evaluation thereof, the Board, including the Independent Trustees, unanimously voted to approve the Agreements.
| | |
| 104 | | MainStay Retirement Funds |
Proxy Voting Policies and Procedures and Proxy Voting Record
A description of the policies and procedures that New York Life Investments uses to vote proxies related to the Retirement Funds’ securities is available without charge, upon request, (i) by visiting the Retirement Funds’ website at mainstayinvestments.com; and (ii) on the Securities and Exchange Commission’s (“SEC”) website at www.sec.gov.
The Retirement Funds are required to file with the SEC their proxy voting records for each Retirement Fund for the 12-month period ending June 30 on Form N-PX. The most recent Form N-PX is available free of charge upon request by calling 800-MAINSTAY (624-6782); visiting the MainStay Funds’ website at mainstayinvestments.com; or on the SEC’s website at www.sec.gov.
Shareholder Reports and Quarterly Portfolio Disclosure
Each Retirement Fund is required to file its complete schedule of portfolio holdings with the SEC for its first and third fiscal quarters on Form N-Q. Each Retirement Fund’s Form N-Q is available without charge, on the SEC’s website at www.sec.gov or by calling MainStay Investments at 800-MAINSTAY (624-6782). You also can obtain and review copies of Form N-Q by visiting the SEC’s Public Reference Room in Washington, DC (information on the operation of the Public Reference Room may be obtained by calling 1-800-SEC-0330).
| | | | |
| mainstayinvestments.com | | | 105 | |
This page intentionally left blank
MainStay Funds
MainStay offers a wide range of Funds for virtually any investment need. The full array of MainStay open-end offerings is listed here, with information about the manager, subadvisors, legal counsel and independent registered public accounting firms.
Equity
U.S. Equity Funds
MainStay Common Stock Fund
MainStay Cornerstone Growth Fund
MainStay Epoch U.S. All Cap Fund
MainStay Epoch U.S. Equity Yield Fund
MainStay ICAP Equity Fund
MainStay ICAP Select Equity Fund
MainStay Large Cap Growth Fund1
MainStay MAP Fund
MainStay S&P 500 Index Fund
MainStay U.S. Equity Opportunities Fund
MainStay U.S. Small Cap Fund
International/Global Equity Funds
MainStay Epoch Global Choice Fund
MainStay Epoch Global Equity Yield Fund
MainStay Epoch International Small Cap Fund
MainStay ICAP Global Fund
MainStay ICAP International Fund
MainStay International Equity Fund
MainStay International Opportunities Fund
Income
Taxable Bond Funds
MainStay Floating Rate Fund
MainStay Global High Income Fund
MainStay Government Fund
MainStay High Yield Corporate Bond Fund
MainStay High Yield Opportunities Fund
MainStay Indexed Bond Fund
MainStay Intermediate Term Bond Fund
MainStay Short Duration High Yield Fund
MainStay Short Term Bond Fund
MainStay Unconstrained Bond Fund
Municipal Bond Funds
MainStay California Tax Free Opportunities Fund2
MainStay High Yield Municipal Bond Fund
MainStay New York Tax Free Opportunities Fund3
MainStay Tax Free Bond Fund
Money Market Fund
MainStay Money Market Fund
Mixed Asset
MainStay Balanced Fund
MainStay Convertible Fund
MainStay Income Builder Fund
MainStay Marketfield Fund
Asset Allocation/Target Date
MainStay Conservative Allocation Fund
MainStay Growth Allocation Fund
MainStay Moderate Allocation Fund
MainStay Moderate Growth Allocation Fund
MainStay Retirement 2010 Fund
MainStay Retirement 2020 Fund
MainStay Retirement 2030 Fund
MainStay Retirement 2040 Fund
MainStay Retirement 2050 Fund
Manager
New York Life Investment Management LLC
New York, New York
Subadvisors
Cornerstone Capital Management Holdings LLC4
New York, New York
Cornerstone Capital Management LLC4
Bloomington, Minnesota
Epoch Investment Partners, Inc.
New York, New York
Institutional Capital LLC4
Chicago, Illinois
MacKay Shields LLC4
New York, New York
Marketfield Asset Management LLC
New York, New York
Markston International LLC
White Plains, New York
Winslow Capital Management LLC
Minneapolis, Minnesota
Legal Counsel
Dechert LLP
Independent Registered Public Accounting Firms
KPMG LLP
PricewaterhouseCoopers LLP
1. Effective January 13, 2012, the Fund was closed to new investors with certain exceptions.
2. This Fund is only registered for sale in AZ, CA, NV, OR, UT, and WA.
3. This Fund is only registered for sale in CT, DE, FL, MA, NJ, NY, and VT.
4. An affiliate of New York Life Investment Management LLC.
Not part of the Semiannual Report
For more information
800-MAINSTAY (624-6782)
mainstayinvestments.com
The MainStay Funds® are managed by New York Life Investment Management LLC and distributed through NYLIFE Distributors LLC, 169 Lackawanna Avenue, Parsippany, NJ 07054, a wholly owned subsidiary of New York Life Insurance Company. NYLIFE Distributors LLC is a Member FINRA/SIPC.
MainStay Investments® is a registered service mark and name under which New York Life Investment Management LLC does business. MainStay Investments, an indirect subsidiary of New York Life Insurance Company, New York, NY 10010, provides investment advisory products and services.
This report may be distributed only when preceded or accompanied by a current Fund prospectus.
©2013 NYLIFE Distributors LLC. All rights reserved.
| | | | | | | | |
| Not FDIC/NCUA Insured | | Not a Deposit | | May Lose Value | | No Bank Guarantee | | Not Insured by Any Government Agency |
| | |
| NYLIM-30082 MS175-13 | | MSRF10-06/13 NL0C1 |
MainStay Floating Rate Fund
Message from the President and Semiannual Report
Unaudited | April 30, 2013


This page intentionally left blank
Message from the President
The U.S. stock market advanced during the six months ended April 30, 2013, generally providing double-digit returns at all capitalization levels. Value stocks tended to outpace growth stocks among large- and mid-capitalization companies, while growth stocks tended to outpace value stocks among smaller companies.
The market’s advance, however, was far from uniform. Stocks declined in early November, both before and immediately after the U.S. presidential election. Following a sharp recovery, stocks climbed until mid-December, when a Congressional stalemate on the fiscal cliff led to a brief decline. Another dip occurred in late February as investors speculated that the Federal Open Market Committee (FOMC) might stop purchasing mortgage-backed securities sooner than expected. Stocks also dipped in mid-April, as consumer sentiment dropped after the Boston marathon bombing. Despite these setbacks, U.S. stocks continued to trend upward during the six-month reporting period.
International stock markets also advanced, with several regional differences. Accommodative action by the Bank of Japan helped lower the yen and lift Japanese stocks to their highest levels since 2008. In Europe, stocks did well until early February, bolstered by the promise of support for the euro. As the year progressed, however, economic contraction, rising unemployment and systematic banking concerns took a toll on investor enthusiasm. In China, manufacturing slowed as the nation sought to balance growth and inflation risks. On the Korean peninsula, tensions rose as North Korea continued to threaten its neighbors, which added an undercurrent of caution to the market.
During the six months ended April 30, 2013, the FOMC kept the federal funds rate in a range close to zero. The FOMC also continued its direct purchases of mortgage-backed securities and longer-term U.S. government securities. With short-term interest rates likely to remain at low levels, many bond investors pursued higher yields by lengthening maturities and assuming greater risk. As a result, bonds with higher risk profiles tended
to outperform higher-quality investment-grade bonds and U.S. Treasury securities. Cash and cash equivalents essentially returned zero.
With wide variations in the performance of various asset classes, some investors might be tempted to chase higher returns by shifting back and forth between stocks and bonds. Since no one can predict where the market will move next, however, we encourage investors to select an appropriate mix of investments for their risk tolerance and time horizon and to stick with that mix, making only minor adjustments over time.
At MainStay Funds, our portfolio managers use a similar approach. Careful security selection and thoughtful sell disciplines help them pursue the investment objectives of their respective Funds. Using the principal investment strategies outlined in the Prospectus, they focus primarily on providing long-term investment potential for our shareholders.
Has this approach proved successful? In its most recent rankings, Barron’s listed MainStay Funds as the #1 fund family over the past 10 years. We were also the only mutual fund family that has appeared in Barron’s top six for the past five consecutive years.
The pages that follow provide additional insight into the specific market events, investment decisions and securities that shaped your MainStay Fund(s) during the six months ended April 30, 2013. We encourage you to read the semiannual report(s) carefully and to evaluate your results with your long-term financial goals in mind.
Sincerely,

Stephen P. Fisher
President
The opinions expressed are as of the date of this report and are subject to change. There is no guarantee that any forecast made will come to pass. This material does not constitute investment advice and is not intended as an endorsement of any specific investment.
To qualify for the Lipper/Barron’s Fund Survey, a fund family must have at least three funds in Lipper’s general U.S.-stock category, one in world equity (which combines global and international funds), one mixed-equity fund (which holds stocks and bonds), two taxable-bond funds, and one tax-exempt fund. Fund loads and 12b-1 fees aren’t included in the calculation of returns because the aim is to measure the manager’s skill. Each fund’s return is measured against all funds in its Lipper category, resulting in a percentile ranking which is then weighted by asset size relative to the fund family’s other assets in its general classifications. Finally, the score is multiplied by the general classification weightings as determined by the entire Lipper universe of funds.
Source: Barron’s, 2/9/13. Overall, MainStay Funds ranked number 56 for the one-year period, 20 for the five-year period and one for the 10-year period ended December 31, 2012, out of 62, 53 and 46 fund families, respectively. MainStay ranked number three for the 10-year period in 2009, 2010 and 2011 from among 48, 46 and 45 fund families, respectively. MainStay ranked number six from among 48 fund families for the 10-year period in 2008. Past performance is no guarantee of future results, which will vary. For the most recent MainStay Funds performance, please visit our website at mainstayinvestments.com. All mutual funds are subject to market risk and will fluctuate in value.
Not part of the Semiannual Report
Table of Contents
Investors should refer to the Fund’s Summary Prospectus and/or Prospectus and consider the Fund’s investment objectives, strategies, risks, charges and expenses carefully before investing. The Summary Prospectus and/or Prospectus contain this and other information about the Fund. You may obtain copies of the Fund’s Summary Prospectus, Prospectus and Statement of Additional Information free of charge, upon request, by calling toll-free 800-MAINSTAY (624-6782), by writing to NYLIFE Distributors LLC, Attn: MainStay Marketing Department, 169 Lackawanna Avenue, Parsippany, New Jersey 07054 or by sending an e-mail to MainStayShareholderServices@nylim.com. These documents are also available via the MainStay Funds’ website at mainstayinvestments.com/documents. Please read the Summary Prospectus and/or Prospectus carefully before investing.
Investment and Performance Comparison1 (Unaudited)
Performance data quoted represents past performance. Past performance is no guarantee of future results. Because of market volatility, current performance may be lower or higher than the figures shown. Investment return and principal value will fluctuate, and as a result, when shares are redeemed, they may be worth more or less than their original cost. The graph below depicts the historical performance of Class I shares of the Fund. Performance will vary from class to class based on differences in class-specific expenses and sales charges. For performance information current to the most recent month-end, please call 800-MAINSTAY (624-6782) or visit mainstayinvestments.com.
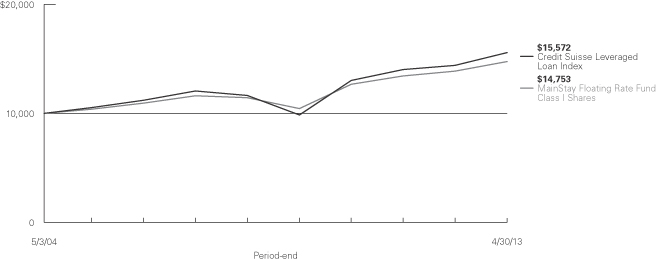
Average Annual Total Returns for the Period Ended April 30, 2013
| | | | | | | | | | | | | | | | | | | | | | | | |
| Class | | Sales Charge | | | | Six Months | | | One Year | | | Five Year | | | Since
Inception
(5/3/04) | | | Gross
Expense
Ratio2 | |
| Investor Class Shares3 | | Maximum 3% Initial Sales Charge | | With sales charges Excluding sales charges | |
| 0.23
3.33 | %
| |
| 2.90
6.08 | %
| |
| 4.27
4.90 | %
| |
| 3.73
4.08 | %
| |
| 1.06
1.06 | %
|
| Class A Shares | | Maximum 3% Initial Sales Charge | | With sales charges Excluding sales charges | |
| 0.26
3.36 |
| |
| 2.95
6.13 |
| |
| 4.37
5.01 |
| |
| 3.79
4.14 |
| |
| 0.99
0.99 |
|
| Class B Shares | | Maximum 3% CDSC
if Redeemed Within the First Four Years of Purchase | | With sales charges Excluding sales charges | |
| –0.05
2.95 |
| |
| 2.29
5.29 |
| |
| 4.12
4.12 |
| |
| 3.32
3.32 |
| |
| 1.81
1.81 |
|
| Class C Shares | | Maximum 1% CDSC
if Redeemed Within One Year of Purchase | | With sales charges Excluding sales charges | |
| 1.95
2.95 |
| |
| 4.29
5.29 |
| |
| 4.12
4.12 |
| |
| 3.32
3.32 |
| |
| 1.81
1.81 |
|
| Class I Shares | | No Sales Charge | | | | | 3.49 | | | | 6.40 | | | | 5.26 | | | | 4.41 | | | | 0.74 | |
| 1. | The performance table and graph do not reflect the deduction of taxes that a shareholder would pay on dividends, distributions or Fund share redemptions. Total returns reflect maximum applicable sales charges as indicated in the table above, changes in share price, and reinvestment of dividend and capital gain distributions. The graph assumes the initial investment amount shown above and reflects the deduction of all sales charges that would have applied for the period of investment. Performance figures reflect certain fee waivers and/or expense limitations, without which total returns may have been lower. For more information on share classes and current fee waivers and/or expense limitations, please refer to the notes to the financial statements. |
| 2. | The gross expense ratios presented reflect the Fund’s “Total Annual Fund Operating Expenses” from the most recent Prospectus and may differ from other expense ratios disclosed in this report. |
| 3. | Performance figures for Investor Class shares, first offered on February 28, 2008, include the historical performance of Class A shares through February 27, 2008, adjusted for differences in certain contractual fees and expenses. Unadjusted, the performance shown for Investor Class shares would likely have been different. |
The footnotes on the next page are an integral part of the table and graph and should be carefully read in conjunction with them.
| | | | |
| mainstayinvestments.com | | | 5 | |
| | | | | | | | | | | | | | | | |
| Benchmark Performance | | Six Months | | | One
Year | | | Five
Years | | | Since
Inception | |
Credit Suisse Leveraged Loan Index4 | | | 4.31 | % | | | 8.23 | % | | | 6.02 | % | | | 5.04 | % |
Average Lipper Loan Participation Fund5 | | | 3.97 | | | | 7.45 | | | | 5.08 | | | | 3.86 | |
| 4. | The Credit Suisse Leveraged Loan Index represents tradable, senior-secured, U.S. dollar-denominated non-investment-grade loans. Results assume reinvestment of all income and capital gains. The Credit Suisse Leveraged Loan Index is the Fund’s broad-based securities market index for comparison purposes. An investment cannot be made directly in an index. |
| 5. | The average Lipper loan participation fund is representative of funds that invest primarily in participation interests in collateralized senior corporate loans that have floating or variable rates. This benchmark is a product of Lipper Inc. Lipper Inc. is an independent monitor of fund performance. Results are based on average total returns of similar funds with all dividend and capital gain distributions reinvested. |
The footnotes on the preceding page are an integral part of the table and graph and should be carefully read in conjunction with them.
| | |
| 6 | | MainStay Floating Rate Fund |
Cost in Dollars of a $1,000 Investment in MainStay Floating Rate Fund (Unaudited)
The example below is intended to describe the fees and expenses borne by shareholders during the six-month period from November 1, 2012, to April 30, 2013, and the impact of those costs on your investment.
Example
As a shareholder of the Fund, you incur two types of costs: (1) transaction costs, including exchange fees and sales charges (loads) on purchases (as applicable), and (2) ongoing costs, including management fees, distribution and/or service (12b-1) fees, and other Fund expenses (as applicable). This example is intended to help you understand your ongoing costs (in dollars) of investing in the Fund and to compare these costs with the ongoing costs of investing in other mutual funds. The example is based on an investment of $1,000 made at the beginning of the six-month period and held for the entire period from November 1, 2012, to April 30, 2013.
This example illustrates your Fund’s ongoing costs in two ways:
Actual Expenses
The second and third data columns in the table below provide information about actual account values and actual expenses. You may use the information in these columns, together with the amount you invested, to estimate the expenses that you paid during the six months ended April 30, 2013. Simply divide your account value by $1,000 (for example, an $8,600 account value divided by $1,000 = 8.6), then
multiply the result by the number under the heading entitled ‘‘Expenses Paid During Period’’ to estimate the expenses you paid on your account during this period.
Hypothetical Example for Comparison Purposes
The fourth and fifth data columns in the table below provide information about hypothetical account values and hypothetical expenses based on the Fund’s actual expense ratio and an assumed rate of return of 5% per year before expenses, which is not the Fund’s actual return. The hypothetical account values and expenses may not be used to estimate the actual ending account balances or expenses you paid for the six-month period shown. You may use this information to compare the ongoing costs of investing in the Fund with the ongoing costs of investing in other Funds. To do so, compare this 5% hypothetical example with the 5% hypothetical examples that appear in the shareholder reports of the other Funds.
Please note that the expenses shown in the table are meant to highlight your ongoing costs only and do not reflect any transactional costs, such as exchange fees or sales charges (loads). Therefore, the fourth and fifth data columns of the table are useful in comparing ongoing costs only and will not help you determine the relative total costs of owning different funds. In addition, if these transactional costs were included, your costs would have been higher.
| | | | | | | | | | | | | | | | | | | | |
| | | | | | | | | | | | | | | | |
| Share Class | | Beginning
Account
Value
11/1/12 | | | Ending Account
Value (Based
on Actual
Returns and
Expenses)
4/30/13 | | | Expenses
Paid
During
Period1 | | | Ending Account
Value (Based
on Hypothetical
5% Annualized
Return and
Actual Expenses)
4/30/13 | | | Expenses
Paid
During
Period1 | |
| | | | | |
| Investor Class Shares | | $ | 1,000.00 | | | $ | 1,033.30 | | | $ | 5.29 | | | $ | 1,019.60 | | | $ | 5.26 | |
| | | | | |
| Class A Shares | | $ | 1,000.00 | | | $ | 1,033.60 | | | $ | 4.99 | | | $ | 1,019.90 | | | $ | 4.96 | |
| | | | | |
| Class B Shares | | $ | 1,000.00 | | | $ | 1,029.50 | | | $ | 9.06 | | | $ | 1,015.90 | | | $ | 9.00 | |
| | | | | |
| Class C Shares | | $ | 1,000.00 | | | $ | 1,029.50 | | | $ | 9.06 | | | $ | 1,015.90 | | | $ | 9.00 | |
| | | | | |
| Class I Shares | | $ | 1,000.00 | | | $ | 1,034.90 | | | $ | 3.68 | | | $ | 1,021.20 | | | $ | 3.66 | |
| 1. | Expenses are equal to the Fund’s annualized expense ratio of each class (1.05% for Investor Class, 0.99% for Class A, 1.80% for Class B and Class C and 0.73% for Class I) multiplied by the average account value over the period, divided by 365 and multiplied by 181 (to reflect the six-month period). The table above represents the actual expenses incurred during the six-month period. |
| | | | |
| mainstayinvestments.com | | | 7 | |
Portfolio Composition as of April 30, 2013 (Unaudited)
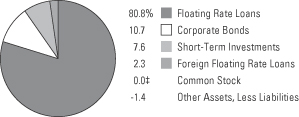
See Portfolio of Investments beginning on page 10 for specific holdings within these categories.
| ‡ | Less than one-tenth of a percent. |
Top Ten Holdings or Issuers Held as of April 30, 2013 (excluding short-term investments)
| 1. | Bausch & Lomb, Inc., 5.25%, due 5/17/19 |
| 2. | TransDigm, Inc., 3.75%–7.75%, due 12/15/18–10/15/20 |
| 3. | Neiman Marcus Group, Inc. (The), 4.00%, due 5/16/18 |
| 4. | MetroPCS Wireless, Inc., 4.734%–6.625%, due 11/3/16–4/1/21 |
| 5. | Calpine Corp., 4.00%, due 4/2/18 |
| 6. | Hertz Corp. (The), 3.00%–3.75%, due 3/9/18–3/11/18 |
| 7. | Silver II US Holdings LLC, 4.00%, due 12/13/19 |
| 8. | Univision Communications, Inc., 4.75%, due 3/2/20 |
| 9. | Michaels Stores, Inc., 3.75%, due 1/28/20 |
| 10. | Travelport LLC, 5.533%–5.534%, due 8/21/15 |
| | |
| 8 | | MainStay Floating Rate Fund |
Portfolio Management Discussion and Analysis (Unaudited)
Questions answered by portfolio managers Robert H. Dial, Mark A. Campellone and Arthur S. Torrey of New York Life Investments,1 the Fund’s Manager.
How did MainStay Floating Rate Fund perform relative to its peers and its benchmark during the six months ended April 30, 2013?
Excluding all sales charges, MainStay Floating Rate Fund returned 3.33% for Investor Class shares, 3.36% for Class A shares and 2.95% for Class B shares and Class C shares for the six months ended April 30, 2013. Over the same period, the Fund’s Class I shares returned 3.49%. All share classes underperformed the 3.97% return of the average Lipper2 loan participation fund and the 4.31% return of the Credit Suisse Leveraged Loan Index3 for the six months ended April 30, 2013. The Credit Suisse Leveraged Loan Index is the Fund’s broad-based securities-market index. See page 5 for Fund returns with applicable sales charges.
What factors affected the Fund’s relative performance during the reporting period?
The Fund underperformed the Credit Suisse Leveraged Loan Index for the six months ended April 30, 2013, largely because of an overweight position relative to the Index in credits rated BB4 and underweight positions relative to the Index in unrated credits, distressed credits and loans rated CCC5 and lower.
Strong demand for the floating-rate loan asset class during the reporting period, driven by mutual fund inflows and strong new issuance of collateralized loan obligations, provided substantial support for secondary prices and drove returns during the reporting period. Riskier credits (those rated CCC and below and distressed credits) experienced a strong price rally and thus outperformed less-risky credits (loans rated BB) during the reporting period.
What was the Fund’s duration6 strategy during the reporting period?
The Fund invested in floating-rate loans that had a weighted average effective duration of less than three months. Floating-rate loans mature, on average, in five to seven years, but loan maturity can be as long as nine years. The underlying interest rate contracts of the Fund’s loans, which are typically pegged to LIBOR,7 reset every 30, 60, 90 or 180 days. The Fund’s weighted average days-to-reset figure at April 30, 2013, was 57 days, which we consider to be a short duration. Since reset dates may vary for different loans, the actual period between a shift in interest rates and the time when the Fund would “catch up” may differ.
During the reporting period, which market segments made the strongest positive contributions to the Fund’s performance and which market segments were particularly weak?
As of April 30, 2013, the Fund benefited from a position in high-yield corporate bonds and from positive total returns from loans rated BB. The Fund’s positions in distressed credits, unrated credits and loans rated CCC or lower provided positive total returns, but an underweight position in these loans relative to the Credit Suisse Leveraged Loan Index detracted from the Fund’s relative performance.
How was the Fund positioned at the end of the reporting period?
As of April 30, 2013, the Fund was overweight relative to the Credit Suisse Leveraged Loan Index in credits rated BB. As of the same date, the Fund was underweight in distressed credits, unrated credits and loans rated CCC or lower.
| 1. | “New York Life Investments” is a service mark of New York Life Investment Management LLC. |
| 2. | See footnote on page 6 for more information on Lipper Inc. |
| 3. | See footnote on page 6 for more information on the Credit Suisse Leveraged Loan Index. |
| 4. | An obligation rated ‘BB’ by Standard & Poor’s (“S&P”) is deemed by S&P to be less vulnerable to nonpayment than other speculative issues. In the opinion of S&P, however, the obligor faces major ongoing uncertainties or exposure to adverse business, financial or economic conditions which could lead to the obligor’s inadequate capacity to meet its financial commitment on the obligation. When applied to Fund holdings, ratings are based solely on the creditworthiness of the bonds in the portfolio and are not meant to represent the security or safety of the Fund. |
| 5. | An obligation rated ‘CCC’ by S&P is deemed by S&P to be currently vulnerable to nonpayment and is dependent upon favorable business, financial and economic conditions for the obligor to meet its financial commitment on the obligation. It is the opinion of S&P that in the event of adverse business, financial or economic conditions, the obligor is not likely to have the capacity to meet its financial commitment on the obligation. When applied to Fund holdings, ratings are based solely on the creditworthiness of the bonds in the portfolio and are not meant to represent the security or safety of the Fund. |
| 6. | Duration is a measure of the price sensitivity of a fixed-income investment to changes in interest rates. Duration is expressed as a number of years and is considered a more accurate sensitivity gauge than average maturity. |
| 7. | London InterBank Offered Rate (LIBOR) is an interest rate that is widely used as a reference rate in bank, corporate and government lending agreements. |
The opinions expressed are those of the portfolio managers as of the date of this report and are subject to change. There is no guarantee that any forecast made will come to pass. This material does not constitute investment advice and is not intended as an endorsement of any specific investment.
| | | | |
| mainstayinvestments.com | | | 9 | |
Portfolio of Investments April 30, 2013 (Unaudited)
| | | | | | | | |
| | | Principal
Amount | | | Value | |
| | | | | | | | |
Long-Term Bonds 93.8%† Corporate Bonds 10.7% | | | | | | | | |
Aerospace & Defense 0.9% | | | | | | | | |
Oshkosh Corp.
8.25%, due 3/1/17 | | $ | 3,400,000 | | | $ | 3,706,000 | |
Spirit Aerosystems, Inc.
7.50%, due 10/1/17 | | | 865,000 | | | | 916,900 | |
¨TransDigm, Inc.
5.50%, due 10/15/20 (a) | | | 2,100,000 | | | | 2,241,750 | |
7.75%, due 12/15/18 | | | 5,000,000 | | | | 5,537,500 | |
| | | | | | | | |
| | | | | | | 12,402,150 | |
| | | | | | | | |
Automobile 0.1% | | | | | | | | |
Dana Holding Corp.
6.50%, due 2/15/19 | | | 800,000 | | | | 865,000 | |
| | | | | | | | |
| | |
Beverage, Food & Tobacco 0.4% | | | | | | | | |
Constellation Brands, Inc.
6.00%, due 5/1/22 | | | 1,800,000 | | | | 2,076,750 | |
Dole Food Co., Inc.
8.00%, due 10/1/16 (a) | | | 2,500,000 | | | | 2,600,000 | |
| | | | | | | | |
| | | | | | | 4,676,750 | |
| | | | | | | | |
Broadcasting & Entertainment 1.3% | | | | | | | | |
Cinemark USA, Inc.
5.125%, due 12/15/22 (a) | | | 1,200,000 | | | | 1,242,000 | |
Isle of Capri Casinos
5.875%, due 3/15/21 (a) | | | 4,800,000 | | | | 4,884,000 | |
National CineMedia LLC
6.00%, due 4/15/22 | | | 2,785,000 | | | | 3,035,650 | |
Scientific Games International, Inc.
6.25%, due 9/1/20 | | | 3,000,000 | | | | 3,082,500 | |
Sinclair Television Group, Inc.
8.375%, due 10/15/18 | | | 5,000,000 | | | | 5,575,000 | |
| | | | | | | | |
| | | | | | | 17,819,150 | |
| | | | | | | | |
Buildings & Real Estate 0.4% | | | | | | | | |
Building Materials Corp. of America
6.75%, due 5/1/21 (a) | | | 1,700,000 | | | | 1,882,750 | |
6.875%, due 8/15/18 (a) | | | 2,400,000 | | | | 2,592,000 | |
CBRE Services, Inc.
6.625%, due 10/15/20 | | | 800,000 | | | | 876,000 | |
| | | | | | | | |
| | | | | | | 5,350,750 | |
| | | | | | | | |
Chemicals, Plastics & Rubber 1.1% | |
Ashland, Inc.
3.875%, due 4/15/18 (a) | | | 3,000,000 | | | | 3,090,000 | |
Hexion U.S. Finance Corp. / Hexion Nova Scotia Finance ULC
8.875%, due 2/1/18 | | | 3,500,000 | | | | 3,710,000 | |
| | | | | | | | |
| | | Principal
Amount | | | Value | |
| | | | | | | | |
Chemicals, Plastics & Rubber (continued) | |
Huntsman International LLC
4.875%, due 11/15/20 (a) | | $ | 1,800,000 | | | $ | 1,885,500 | |
Ineos Finance PLC
8.375%, due 2/15/19 (a) | | | 2,000,000 | | | | 2,255,000 | |
Kraton Polymers LLC / Kraton Polymers Capital Corp.
6.75%, due 3/1/19 | | | 500,000 | | | | 523,750 | |
Nexeo Solutions LLC / Nexeo Solutions Finance Corp.
8.375%, due 3/1/18 | | | 3,000,000 | | | | 2,962,500 | |
| | | | | | | | |
| | | | | | | 14,426,750 | |
| | | | | | | | |
Commercial Services 0.1% | | | | | | | | |
United Rentals North America, Inc.
5.75%, due 7/15/18 | | | 1,200,000 | | | | 1,308,000 | |
| | | | | | | | |
| | |
Containers, Packaging & Glass 1.1% | | | | | | | | |
Ardagh Packaging Finance PLC / Ardagh MP Holdings USA, Inc.
4.875%, due 11/15/22 (a) | | | 390,000 | | | | 398,775 | |
7.00%, due 11/15/20 (a) | | | 3,130,000 | | | | 3,309,975 | |
Ball Corp.
5.00%, due 3/15/22 | | | 2,250,000 | | | | 2,390,625 | |
Berry Plastics Corp.
9.50%, due 5/15/18 | | | 3,000,000 | | | | 3,337,500 | |
Greif, Inc.
7.75%, due 8/1/19 | | | 1,350,000 | | | | 1,582,875 | |
Reynolds Group Issuer, Inc.
9.875%, due 8/15/19 | | | 1,100,000 | | | | 1,234,750 | |
Sealed Air Corp.
6.50%, due 12/1/20 (a) | | | 1,764,000 | | | | 1,971,270 | |
| | | | | | | | |
| | | | | | | 14,225,770 | |
| | | | | | | | |
Diversified Natural Resources, Precious Metals & Minerals 0.1% | |
Boise Paper Holdings LLC /
Boise Co-Issuer Co.
8.00%, due 4/1/20 | | | 1,300,000 | | | | 1,459,250 | |
| | | | | | | | |
|
Diversified/Conglomerate Service 0.2% | |
Fidelity National Information Services, Inc.
7.625%, due 7/15/17 | | | 900,000 | | | | 961,875 | |
Geo Group, Inc. (The)
7.75%, due 10/15/17 | | | 2,000,000 | | | | 2,130,000 | |
| | | | | | | | |
| | | | | | | 3,091,875 | |
| | | | | | | | |
Finance 0.2% | | | | | | | | |
Nationstar Mortgage LLC / Nationstar Capital Corp.
6.50%, due 7/1/21 (a) | | | 3,000,000 | | | | 3,146,250 | |
| | | | | | | | |
| † | Percentages indicated are based on Fund net assets. |
| ¨ | | Among the Fund’s 10 largest holdings or issuers held, as of April 30, 2013, excluding short-term investments. May be subject to change daily. |
| | | | |
| 10 | | MainStay Floating Rate Fund | | The notes to the financial statements are an integral part of,
and should be read in conjunction with, the financial statements. |
| | | | | | | | |
| | | Principal
Amount | | | Value | |
| | | | | | | | |
| Corporate Bonds (continued) | |
Forest Products & Paper 0.2% | | | | | | | | |
Sappi Papier Holding GmbH
6.625%, due 4/15/21 (a) | | $ | 2,500,000 | | | $ | 2,625,000 | |
| | | | | | | | |
|
Healthcare, Education & Childcare 0.1% | |
Grifols, Inc.
8.25%, due 2/1/18 | | | 1,385,000 | | | | 1,520,038 | |
| | | | | | | | |
|
Leisure, Amusement, Motion Pictures & Entertainment 0.5% | |
Royal Caribbean Cruises, Ltd.
7.25%, due 3/15/18 | | | 6,000,000 | | | | 6,922,500 | |
| | | | | | | | |
| | |
Machinery 0.9% | | | | | | | | |
Bombardier, Inc.
4.25%, due 1/15/16 (a) | | | 2,000,000 | | | | 2,087,500 | |
SPX Corp.
6.875%, due 9/1/17 | | | 6,000,000 | | | | 6,735,000 | |
Trinseo Materials Operating SCA /
Trinseo Materials Finance, Inc.
8.75%, due 2/1/19 (a) | | | 2,900,000 | | | | 2,900,000 | |
| | | | | | | | |
| | | | | | | 11,722,500 | |
| | | | | | | | |
Mining, Steel, Iron & Non-Precious Metals 0.5% | |
FMG Resources August 2006 Pty, Ltd.
6.00%, due 4/1/17 (a) | | | 2,000,000 | | | | 2,080,000 | |
6.375%, due 2/1/16 (a) | | | 4,000,000 | | | | 4,150,000 | |
| | | | | | | | |
| | | | | | | 6,230,000 | |
| | | | | | | | |
Oil & Gas 1.1% | | | | | | | | |
Basic Energy Services, Inc.
7.75%, due 10/15/22 | | | 3,000,000 | | | | 3,157,500 | |
Energy Transfer Equity, L.P.
7.50%, due 10/15/20 | | | 1,462,000 | | | | 1,710,540 | |
Exterran Partners LP / EXLP Finance Corp.
6.00%, due 4/1/21 (a) | | | 2,000,000 | | | | 2,040,000 | |
Forest Oil Corp.
7.25%, due 6/15/19 | | | 3,000,000 | | | | 3,037,500 | |
Inergy Midstream, L.P. / NRGM Finance Corp.
6.00%, due 12/15/20 (a) | | | 1,800,000 | | | | 1,899,000 | |
Oil States International, Inc.
5.125%, due 1/15/23 (a) | | | 2,400,000 | | | | 2,466,000 | |
| | | | | | | | |
| | | | | | | 14,310,540 | |
| | | | | | | | |
Pipelines 0.1% | | | | | | | | |
Genesis Energy, L.P. / Genesis Energy Finance Corp.
5.75%, due 2/15/21 (a) | | | 600,000 | | | | 631,500 | |
| | | | | | | | |
| | | | | | | | |
| | | Principal
Amount | | | Value | |
| | | | | | | | |
Software 0.3% | | | | | | | | |
First Data Corp.
6.75%, due 11/1/20 (a) | | $ | 4,235,000 | | | $ | 4,542,037 | |
| | | | | | | | |
| | |
Telecommunications 1.1% | | | | | | | | |
Crown Castle International Corp.
5.25%, due 1/15/23 | | | 3,000,000 | | | | 3,142,500 | |
GCI, Inc.
6.75%, due 6/1/21 | | | 1,750,000 | | | | 1,671,250 | |
Intelsat Luxembourg S.A.
7.75%, due 6/1/21 (a) | | | 1,200,000 | | | | 1,266,000 | |
¨MetroPCS Wireless, Inc.
6.25%, due 4/1/21 (a) | | | 3,100,000 | | | | 3,328,625 | |
6.625%, due 11/15/20 | | | 5,000,000 | | | | 5,412,500 | |
| | | | | | | | |
| | | | | | | 14,820,875 | |
| | | | | | | | |
Total Corporate Bonds
(Cost $133,276,919) | | | | | | | 142,096,685 | |
| | | | | | | | |
|
| Floating Rate Loans 80.8% (b) | |
Aerospace & Defense 2.6% | | | | | | | | |
Aeroflex, Inc.
Term Loan B
5.75%, due 5/9/18 | | | 5,687,379 | | | | 5,760,252 | |
Booz Allen Hamilton, Inc.
New Term Loan B
4.50%, due 7/31/19 | | | 6,467,401 | | | | 6,543,392 | |
Digitalglobe, Inc.
New Term Loan B
3.75%, due 1/31/20 | | | 1,200,000 | | | | 1,212,000 | |
SI Organization, Inc. (The)
New Term Loan B
4.50%, due 11/22/16 | | | 7,477,875 | | | | 7,365,707 | |
Six3 Systems, Inc.
Term Loan B
7.00%, due 10/4/19 (c) | | | 3,192,000 | | | | 3,197,586 | |
Spirit Aerosystems, Inc.
Term Loan B
3.75%, due 4/18/19 | | | 4,435,200 | | | | 4,468,464 | |
¨TransDigm, Inc.
Term Loan C
3.75%, due 2/28/20 | | | 6,243,073 | | | | 6,325,569 | |
| | | | | | | | |
| | | | | | | 34,872,970 | |
| | | | | | | | |
Automobile 4.9% | | | | | | | | |
Affinia Group Intermediate Holdings, Inc.
Term Loan B2
4.75%, due 4/30/20 | | | 1,225,000 | | | | 1,238,781 | |
Allison Transmission, Inc.
Term Loan B2
3.21%, due 8/7/17 | | | 8,683,862 | | | | 8,705,572 | |
| | | | | | |
The notes to the financial statements are an integral part of,
and should be read in conjunction with, the financial statements. | | mainstayinvestments.com | | | 11 | |
Portfolio of Investments April 30, 2013 (Unaudited) (continued)
| | | | | | | | |
| | | Principal
Amount | | | Value | |
| | | | | | | | |
| Floating Rate Loans (continued) | |
Automobile (continued) | | | | | | | | |
Capital Automotive L.P.
New Term Loan B
4.25%, due 3/27/19 | | $ | 6,972,734 | | | $ | 7,022,854 | |
Chrysler Group LLC
Term Loan B
6.00%, due 5/24/17 | | | 6,867,638 | | | | 6,964,891 | |
Federal-Mogul Corp.
Term Loan B
2.138%, due 12/29/14 | | | 2,206,074 | | | | 2,087,038 | |
Term Loan C
2.138%, due 12/28/15 | | | 3,542,640 | | | | 3,351,486 | |
Goodyear Tire & Rubber Co. (The)
New 2nd Lien Term Loan
4.75%, due 4/30/19 | | | 9,000,000 | | | | 9,084,303 | |
HHI Holdings LLC
Additional Term Loan
5.00%, due 10/5/18 | | | 4,310,532 | | | | 4,348,249 | |
KAR Auction Services, Inc.
Term Loan B
3.75%, due 5/19/17 | | | 5,013,991 | | | | 5,071,968 | |
Key Safety Systems, Inc.
1st Lien Term Loan
2.448%, due 3/8/14 | | | 1,941,310 | | | | 1,925,536 | |
Metaldyne Co. LLC
REFI Term Loan B
5.00%, due 12/18/18 | | | 6,234,375 | | | | 6,343,477 | |
Tomkins LLC
Term Loan B2
3.75%, due 9/29/16 | | | 5,400,043 | | | | 5,474,294 | |
Tower International, Inc.
Term Loan
5.75%, due 4/16/20 | | | 3,333,333 | | | | 3,383,333 | |
| | | | | | | | |
| | | | | | | 65,001,782 | |
| | | | | | | | |
Beverage, Food & Tobacco 1.7% | | | | | | | | |
American Seafoods Group LLC
New Term Loan B
4.25%, due 3/16/18 (c) | | | 2,617,926 | | | | 2,565,567 | |
Del Monte Foods Co.
Term Loan
4.00%, due 3/8/18 | | | 9,871,118 | | | | 9,936,929 | |
HJ Heinz Co.
Term Loan B2
TBD, due 3/27/20 (c)(d) | | | 2,100,000 | | | | 2,118,667 | |
Michael Foods Group, Inc.
Term Loan
4.25%, due 2/23/18 | | | 8,260,553 | | | | 8,379,299 | |
| | | | | | | | |
| | | | | | | 23,000,462 | |
| | | | | | | | |
| | | | | | | | |
| | | Principal
Amount | | | Value | |
| | | | | | | | |
Broadcasting & Entertainment 4.9% | | | | | | | | |
BBHI Acquisition LLC
Term Loan B
4.50%, due 12/14/17 | | $ | 7,453,987 | | | $ | 7,480,076 | |
Cequel Communications LLC
Term Loan B
3.50%, due 2/14/19 | | | 6,346,000 | | | | 6,389,629 | |
Charter Communications Operating LLC
Extended Term Loan C
3.45%, due 9/6/16 | | | 97,545 | | | | 97,679 | |
Cumulus Media Holdings, Inc.
1st Lien Term Loan
4.50%, due 9/17/18 | | | 6,298,585 | | | | 6,397,724 | |
Foxco Acquisition Sub LLC
New Term Loan B
5.50%, due 7/14/17 | | | 1,990,003 | | | | 2,022,341 | |
Hubbard Radio LLC
Term Loan B
4.50%, due 4/28/17 | | | 4,722,644 | | | | 4,799,387 | |
Mediacom Broadband LLC
Term Loan F
4.50%, due 10/23/17 | | | 1,906,100 | | | | 1,920,396 | |
¨Univision Communications, Inc.
Converted Extended Term Loan
4.75%, due 3/2/20 | | | 11,209,947 | | | | 11,317,966 | |
UPC Financing Partnership
USD Term Loan AH
3.25%, due 6/30/21 | | | 5,004,077 | | | | 4,988,440 | |
Weather Channel
REFI Term Loan B
3.50%, due 2/13/17 | | | 9,586,174 | | | | 9,710,795 | |
WideOpenWest Finance LLC
Term Loan B
4.75%, due 3/26/19 | | | 9,925,000 | | | | 10,054,382 | |
| | | | | | | | |
| | | | | | | 65,178,815 | |
| | | | | | | | |
Buildings & Real Estate 2.6% | | | | | | | | |
Armstrong World Industries, Inc.
New Term Loan B
3.50%, due 3/16/20 | | | 5,699,900 | | | | 5,723,651 | |
CB Richard Ellis Services, Inc.
New Term Loan B
2.954%, due 3/29/21 | | | 4,446,014 | | | | 4,462,686 | |
CPG International, Inc.
Term Loan
5.75%, due 9/18/19 | | | 5,223,750 | | | | 5,262,928 | |
Realogy Corp.
Letter of Credit
3.228%, due 10/10/13 | | | 224,827 | | | | 224,265 | |
Extended Term Loan
4.50%, due 3/5/20 | | | 10,450,000 | | | | 10,567,563 | |
| | | | |
| 12 | | MainStay Floating Rate Fund | | The notes to the financial statements are an integral part of,
and should be read in conjunction with, the financial statements. |
| | | | | | | | |
| | | Principal
Amount | | | Value | |
| | | | | | | | |
| Floating Rate Loans (continued) | |
Buildings & Real Estate (continued) | | | | | | | | |
Wilsonart International Holdings LLC
Term Loan B
4.00%, due 10/31/19 | | $ | 7,847,033 | | | $ | 7,866,651 | |
| | | | | | | | |
| | | | | | | 34,107,744 | |
| | | | | | | | |
Cargo Transport 0.4% | | | | | | | | |
Swift Transportation Co. Inc.
New Term Loan B2
4.00%, due 12/21/17 | | | 4,486,492 | | | | 4,556,594 | |
| | | | | | | | |
|
Chemicals, Plastics & Rubber 2.6% | |
AI Chem & Cy S.C.A.
Term Loan B1
4.50%, due 10/3/19 | | | 1,216,708 | | | | 1,231,157 | |
Term Loan B2
4.50%, due 10/3/19 | | | 631,292 | | | | 638,788 | |
2nd Lien Term Loan
8.25%, due 4/3/20 | | | 600,000 | | | | 613,875 | |
General Chemical Corp.
New Term Loan
5.002%, due 10/6/15 | | | 5,578,781 | | | | 5,627,595 | |
Ineos US Finance LLC
6 Year Term Loan
6.50%, due 5/4/18 | | | 7,750,000 | | | | 7,842,031 | |
U.S. Coatings Acquisition, Inc.
Term Loan
4.75%, due 2/3/20 | | | 9,360,000 | | | | 9,471,796 | |
Univar, Inc.
Term Loan B
5.00%, due 6/30/17 | | | 9,355,656 | | | | 9,401,134 | |
| | | | | | | | |
| | | | | | | 34,826,376 | |
| | | | | | | | |
Containers, Packaging & Glass 1.6% | |
Berlin Packaging LLC
1st Lien Term Loan
4.75%, due 3/25/19 | | | 2,750,000 | | | | 2,784,375 | |
New 2nd Lien Term Loan
8.75%, due 3/25/20 | | | 2,500,000 | | | | 2,543,750 | |
Berry Plastics Holding Corp.
Term Loan C
2.198%, due 4/3/15 | | | 986,877 | | | | 991,126 | |
BWAY Corp.
Term Loan B
4.50%, due 8/7/17 | | | 4,654,934 | | | | 4,715,061 | |
Reynolds Group Holdings, Inc.
New Dollar Term Loan
4.75%, due 9/28/18 | | | 10,062,930 | | | | 10,226,453 | |
| | | | | | | | |
| | | | | | | 21,260,765 | |
| | | | | | | | |
| | | | | | | | |
| | | Principal
Amount | | | Value | |
| | | | | | | | |
Diversified/Conglomerate Manufacturing 1.4% | |
Colfax Corp.
New Term Loan B
3.25%, due 1/11/19 | | $ | 5,049,844 | | | $ | 5,087,718 | |
Sensus USA, Inc.
1st Lien Term Loan
4.75%, due 5/9/17 | | | 2,058,000 | | | | 2,061,431 | |
Terex Corp.
REFI Term Loan B
4.50%, due 4/28/17 | | | 1,182,060 | | | | 1,192,403 | |
Veyance Technologies, Inc.
1st Lien Term Loan
5.25%, due 9/8/17 | | | 9,786,971 | | | | 9,839,987 | |
| | | | | | | | |
| | | | | | | 18,181,539 | |
| | | | | | | | |
Diversified/Conglomerate Service 8.1% | |
Acosta, Inc.
Term Loan D
5.00%, due 3/2/18 | | | 6,688,842 | | | | 6,782,907 | |
Advantage Sales & Marketing, Inc.
New 1st Lien Term Loan
4.25%, due 12/18/17 | | | 5,346,940 | | | | 5,400,409 | |
New 2nd Lien Term Loan
8.25%, due 6/17/18 | | | 1,542,857 | | | | 1,552,500 | |
Brickman Group Holdings, Inc.
New Term Loan B
5.50%, due 10/14/16 | | | 6,689,254 | | | | 6,756,146 | |
Brock Holdings III, Inc.
New Term Loan B
6.011%, due 3/16/17 | | | 5,141,961 | | | | 5,199,808 | |
New 2nd Lien Term Loan
10.00%, due 3/16/18 | | | 1,350,000 | | | | 1,361,812 | |
CCC Information Services, Inc.
Term Loan
5.25%, due 12/20/19 | | | 1,496,250 | | | | 1,518,694 | |
CompuCom Systems, Inc.
New Term Loan
6.50%, due 10/4/18 | | | 2,992,500 | | | | 2,994,993 | |
Crossmark Holdings, Inc.
New Term Loan
4.50%, due 12/20/19 | | | 2,992,500 | | | | 2,992,500 | |
2nd Lien Term Loan
8.75%, due 12/21/20 | | | 1,800,000 | | | | 1,809,000 | |
Dealer Computer Services, Inc.
New Term Loan B
3.75%, due 4/20/18 | | | 4,235,964 | | | | 4,246,554 | |
Emdeon Business Services LLC
Term Loan B2
3.75%, due 11/2/18 | | | 3,461,288 | | | | 3,491,574 | |
First Data Corp.
2018 Term Loan
4.199%, due 9/24/18 | | | 3,600,000 | | | | 3,584,999 | |
| | | | | | |
The notes to the financial statements are an integral part of,
and should be read in conjunction with, the financial statements. | | mainstayinvestments.com | | | 13 | |
Portfolio of Investments April 30, 2013 (Unaudited) (continued)
| | | | | | | | |
| | | Principal
Amount | | | Value | |
| | | | | | | | |
| Floating Rate Loans (continued) | |
Diversified/Conglomerate Service (continued) | |
First Data Corp. (continued) | | | | | | | | |
New 2017 Term Loan
4.20%, due 3/24/17 | | $ | 4,670,416 | | | $ | 4,660,201 | |
Genesys Telecom Holdings U.S., Inc.
Senior Debt B
4.00%, due 2/7/20 | | | 3,666,640 | | | | 3,688,412 | |
Sabre, Inc.
Term Loan B
5.25%, due 2/19/19 | | | 9,987,000 | | | | 10,126,718 | |
ServiceMaster Co.
New Term Loan
4.25%, due 1/31/17 | | | 1,097,250 | | | | 1,105,470 | |
Extended Term Loan
4.46%, due 1/31/17 | | | 10,209,890 | | | | 10,283,279 | |
Sophia, L. P.
New Term Loan B
4.50%, due 7/19/18 | | | 3,155,185 | | | | 3,193,641 | |
SunGard Data Systems, Inc.
Term Loan C
3.95%, due 2/28/17 | | | 2,522,010 | | | | 2,533,044 | |
Term Loan E
4.00%, due 3/8/20 | | | 7,800,000 | | | | 7,892,625 | |
¨Travelport LLC
Extended Delayed Draw Term Loan
5.533%, due 8/21/15 | | | 4,140,431 | | | | 4,130,080 | |
Extended Dollar Term Loan
5.533%, due 8/21/15 | | | 6,987,702 | | | | 6,970,233 | |
Tranche S Term Loan
5.534%, due 8/21/15 | | | 71,867 | | | | 71,687 | |
Verint Systems Inc.
New Term Loan B
4.00%, due 9/6/19 | | | 5,104,331 | | | | 5,144,742 | |
| | | | | | | | |
| | | | | | | 107,492,028 | |
| | | | | | | | |
Ecological 0.9% | | | | | | | | |
ADS Waste Holdings, Inc.
New Term Loan B
4.25%, due 10/9/19 | | | 10,224,375 | | | | 10,339,317 | |
Synagro Technologies, Inc.
Term Loan B
2.28%, due 4/2/14 | | | 847,955 | | | | 826,756 | |
2nd Lien Term Loan
5.031%, due 10/2/14 | | | 750,000 | | | | 300,000 | |
WCA Waste Systems, Inc.
Term Loan B
5.50%, due 3/22/18 | | | 990,000 | | | | 996,188 | |
| | | | | | | | |
| | | | | | | 12,462,261 | |
| | | | | | | | |
| | | | | | | | |
| | | Principal
Amount | | | Value | |
| | | | | | | | |
Electronics 1.5% | | | | | | | | |
Blue Coat Systems, Inc.
Term Loan
5.75%, due 2/15/18 | | $ | 4,471,225 | | | $ | 4,515,937 | |
Eagle Parent, Inc.
New Term Loan
4.50%, due 5/16/18 | | | 4,939,937 | | | | 5,014,036 | |
EIG Investors Corp.
New 1st Lien Term Loan
6.25%, due 11/8/19 | | | 3,491,250 | | | | 3,508,706 | |
Evertec, Inc.
New Term Loan B
3.50%, due 4/15/20 | | | 4,500,000 | | | | 4,492,971 | |
Sensata Technologies Finance Co. LLC
Term Loan
3.75%, due 5/11/18 | | | 2,841,178 | | | | 2,870,906 | |
| | | | | | | | |
| | | | | | | 20,402,556 | |
| | | | | | | | |
Finance 3.2% | | | | | | | | |
Avis Budget Car Rental LLC
New Term Loan
3.75%, due 3/15/19 | | | 7,588,322 | | | | 7,697,403 | |
Brand Energy & Infrastructure Services, Inc.
Term Loan 1 Canadian
6.25%, due 10/23/18 | | | 695,610 | | | | 705,175 | |
USD Term Loan B1
6.25%, due 10/23/18 | | | 2,898,375 | | | | 2,938,228 | |
Duff & Phelps Investment Management Co.
Term Loan B
4.50%, due 4/23/20 | | | 4,000,000 | | | | 4,040,000 | |
Harbourvest Partners LLC
Term Loan B
4.75%, due 11/21/17 | | | 4,492,902 | | | | 4,515,366 | |
¨Hertz Corp. (The) | | | | | | | | |
Term Loan B2
3.00%, due 3/11/18 | | | 6,630,453 | | | | 6,651,093 | |
New Synthetic LC
3.75%, due 3/9/18 | | | 5,250,000 | | | | 5,171,250 | |
Ocwen Financial Corp.
Term Loan
5.00%, due 2/15/18 | | | 3,600,000 | | | | 3,655,127 | |
Safe Guard Products International LLC
Term Loan
7.25%, due 12/21/18 | | | 4,688,250 | | | | 4,682,390 | |
SNL Financial LC
New Term Loan B
5.522%, due 10/23/18 | | | 1,987,727 | | | | 1,996,424 | |
| | | | | | | | |
| | | | | | | 42,052,456 | |
| | | | | | | | |
Grocery 0.4% | | | | | | | | |
Roundy’s Supermarkets, Inc.
Term Loan B
5.75%, due 2/13/19 | | | 4,748,299 | | | | 4,671,139 | |
| | | | | | | | |
| | | | |
| 14 | | MainStay Floating Rate Fund | | The notes to the financial statements are an integral part of,
and should be read in conjunction with, the financial statements. |
| | | | | | | | |
| | | Principal
Amount | | | Value | |
| | | | | | | | |
| Floating Rate Loans (continued) | |
Healthcare, Education & Childcare 10.2% | |
¨Bausch & Lomb, Inc.
Term Loan B
5.25%, due 5/17/19 | | $ | 14,440,875 | | | $ | 14,510,827 | |
Biomet, Inc.
Extended Term Loan B
3.971%, due 7/25/17 | | | 7,775,569 | | | | 7,872,764 | |
Community Health Systems, Inc.
Extended Term Loan
3.787%, due 1/25/17 | | | 7,772,777 | | | | 7,843,168 | |
DaVita, Inc.
New Term Loan B
4.50%, due 10/20/16 | | | 10,229,366 | | | | 10,322,074 | |
Emergency Medical Services Corp.
Term Loan
4.00%, due 5/25/18 | | | 6,285,265 | | | | 6,361,210 | |
Gentiva Health Services, Inc.
New Term Loan B
6.50%, due 8/17/16 | | | 4,995,004 | | | | 5,017,896 | |
Grifols, Inc.
New Term Loan B
4.25%, due 6/1/17 | | | 8,755,355 | | | | 8,855,420 | |
HCA, Inc. | | | | | | | | |
Extended Term Loan B4
2.948%, due 5/1/18 | | | 5,816,658 | | | | 5,828,291 | |
Extended Term Loan B2
3.534%, due 3/31/17 | | | 654,681 | | | | 655,495 | |
Hologic, Inc.
Term Loan B
4.50%, due 8/1/19 | | | 6,526,934 | | | | 6,610,805 | |
Iasis Healthcare LLC
Term Loan B2
4.50%, due 5/3/18 | | | 4,704,210 | | | | 4,765,953 | |
IMS Health, Inc.
Term Loan B1
3.75%, due 9/1/17 | | | 1,581,557 | | | | 1,593,023 | |
Kinetic Concepts, Inc.
Term Loan C1
5.50%, due 5/4/18 | | | 4,443,834 | | | | 4,519,748 | |
Par Pharmaceutical Companies, Inc
REFI Term Loan B
4.25%, due 9/30/19 | | | 2,238,764 | | | | 2,255,955 | |
Pharmaceutical Product Development, Inc.
New Term Loan B
4.25%, due 12/5/18 | | | 6,426,337 | | | | 6,513,659 | |
Quintiles Transnational Corp.
New Term Loan B
4.50%, due 6/8/18 | | | 8,338,251 | | | | 8,435,534 | |
RPI Finance Trust
New Term Loan Tranche 2
3.50%, due 5/9/18 | | | 9,252,633 | | | | 9,327,811 | |
| | | | | | | | |
| | | Principal
Amount | | | Value | |
| | | | | | | | |
Healthcare, Education & Childcare (continued) | |
Rural / Metro Corp.
Term Loan
5.75%, due 6/29/18 | | $ | 4,716,000 | | | $ | 4,744,296 | |
Select Medical Corp. | | | | | | | | |
New Term Loan B
5.50%, due 6/1/18 | | | 4,421,250 | | | | 4,461,262 | |
Incremental Term Loan B
5.501%, due 6/1/18 | | | 1,488,750 | | | | 1,499,916 | |
Universal Health Services, Inc.
New Term Loan B
3.75%, due 11/15/16 | | | 3,921,902 | | | | 3,954,583 | |
Vanguard Health Holding Co. II LLC
REFI Term Loan B
3.75%, due 1/29/16 | | | 6,323,468 | | | | 6,400,538 | |
Warner Chilcott Co. LLC
New Term Loan B2
4.25%, due 3/15/18 | | | 665,948 | | | | 675,098 | |
Warner Chilcott Corp. | | | | | | | | |
Incremental Term Loan B1
4.25%, due 3/15/18 | | | 818,096 | | | | 829,336 | |
New Term Loan B1
4.25%, due 3/15/18 | | | 1,879,354 | | | | 1,905,176 | |
| | | | | | | | |
| | | | | | | 135,759,838 | |
| | | | | | | | |
Home and Office Furnishings, Housewares & Durable Consumer Products 0.5% | |
Tempur-Pedic International Inc.
New Term Loan B
5.00%, due 12/12/19 | | | 5,985,000 | | | | 6,076,020 | |
| | | | | | | | |
| | |
Hotels, Motels, Inns & Gaming 2.7% | | | | | | | | |
Ameristar Casinos, Inc.
Term Loan B
4.00%, due 4/14/18 | | | 6,138,530 | | | | 6,172,636 | |
Caesars Entertainment Operating Co. | | | | | | | | |
Extended Term Loan B5
4.45%, due 1/26/18 | | | 3,832,264 | | | | 3,462,876 | |
Extended Term Loan B6
5.45%, due 1/26/18 | | | 1,437,099 | | | | 1,302,670 | |
Las Vegas Sands LLC | | | | | | | | |
Extended Delayed Draw Term Loan
2.70%, due 11/23/16 | | | 975,244 | | | | 975,854 | |
Extended Term Loan B
2.70%, due 11/23/16 | | | 3,581,480 | | | | 3,583,719 | |
MGM Resorts International
Term Loan B
4.25%, due 12/20/19 | | | 7,552,472 | | | | 7,662,609 | |
Penn National Gaming, Inc.
New Term Loan B
3.75%, due 7/16/18 | | | 3,194,405 | | | | 3,227,681 | |
| | | | | | |
The notes to the financial statements are an integral part of,
and should be read in conjunction with, the financial statements. | | mainstayinvestments.com | | | 15 | |
Portfolio of Investments April 30, 2013 (Unaudited) (continued)
| | | | | | | | |
| | | Principal
Amount | | | Value | |
| | | | | | | | |
| Floating Rate Loans (continued) | |
Hotels, Motels, Inns & Gaming (continued) | |
Scientific Games International, Inc.
Term Loan B1
3.205%, due 6/30/15 | | $ | 986,131 | | | $ | 986,871 | |
Station Casinos, Inc.
New Term Loan B
5.00%, due 3/1/20 | | | 8,820,000 | | | | 8,921,059 | |
| | | | | | | | |
| | | | | | | 36,295,975 | |
| | | | | | | | |
Insurance 1.7% | | | | | | | | |
Asurion LLC
New Term Loan B1
4.50%, due 5/24/19 | | | 9,304,727 | | | | 9,412,727 | |
Hub International, Ltd.
2017 Extended Term Loan
3.706%, due 6/13/17 | | | 4,459,640 | | | | 4,497,734 | |
Multiplan, Inc.
New Term Loan B
4.00%, due 8/25/17 | | | 8,047,042 | | | | 8,127,513 | |
| | | | | | | | |
| | | | | | | 22,037,974 | |
| | | | | | | | |
Leisure, Amusement, Motion Pictures & Entertainment 1.1% | |
Cedar Fair, L.P.
New Term Loan B
3.25%, due 3/6/20 | | | 2,000,000 | | | | 2,022,500 | |
Regal Cinemas, Inc.
Term Loan B
2.724%, due 8/23/17 | | | 3,796,390 | | | | 3,816,727 | |
SeaWorld Parks & Entertainment, Inc.
Term Loan B
4.00%, due 8/17/17 | | | 9,016,679 | | | | 9,082,691 | |
| | | | | | | | |
| | | | | | | 14,921,918 | |
| | | | | | | | |
Machinery (Non-Agriculture, Non-Construct & Non-Electronic) 2.6% | |
Alliance Laundry Systems LLC | | | | | | | | |
REFI Term Loan
4.50%, due 12/7/18 | | | 1,044,684 | | | | 1,055,130 | |
2nd Lien Term Loan
9.50%, due 12/10/19 | | | 1,534,091 | | | | 1,576,278 | |
Apex Tool Group, LLC
Term Loan B
4.50%, due 1/28/20 | | | 4,900,000 | | | | 4,961,250 | |
CPM Acquisition Corp.
1st Lien Term Loan
6.25%, due 8/29/17 | | | 2,985,000 | | | | 3,003,656 | |
2nd Lien Term Loan
10.25%, due 2/28/18 | | | 1,093,700 | | | | 1,099,169 | |
Generac Power Systems, Inc.
New Term Loan B
6.25%, due 5/30/18 | | | 5,074,222 | | | | 5,150,336 | |
| | | | | | | | |
| | | Principal
Amount | | | Value | |
| | | | | | | | |
Machinery (Non-Agriculture, Non-Construct & Non-Electronic) (continued) | |
Manitowoc Co., Inc. (The)
New Term Loan B
4.25%, due 11/13/17 | | $ | 245,167 | | | $ | 247,925 | |
Rexnord LLC
New Term Loan B
3.75%, due 4/2/18 | | | 5,957,405 | | | | 6,012,017 | |
¨Silver II US Holdings LLC
Term Loan
4.00%, due 12/13/19 | | | 11,366,640 | | | | 11,445,797 | |
| | | | | | | | |
| | | | | | | 34,551,558 | |
| | | | | | | | |
Metals & Mining 0.6% | | | | | | | | |
FMG America Finance, Inc.
Term Loan
5.25%, due 10/18/17 | | | 7,730,354 | | | | 7,850,607 | |
| | | | | | | | |
|
Mining, Steel, Iron & Non-Precious Metals 1.5% | |
Arch Coal, Inc.
Term Loan B
5.75%, due 5/16/18 | | | 3,970,008 | | | | 4,027,077 | |
Boomerang Tube LLC
Term Loan
11.00%, due 10/11/17 (c) | | | 3,450,000 | | | | 3,467,250 | |
JMC Steel Group, Inc.
Term Loan
4.75%, due 4/3/17 | | | 3,307,564 | | | | 3,340,639 | |
McJunkin Red Man Corp.
Term Loan B
6.25%, due 11/8/19 (c) | | | 4,117,621 | | | | 4,184,532 | |
SunCoke Energy, Inc.
Term Loan B
4.00%, due 7/26/18 | | | 242,672 | | | | 242,672 | |
Walter Energy, Inc.
Term Loan B
5.75%, due 4/2/18 | | | 5,030,633 | | | | 5,096,031 | |
| | | | | | | | |
| | | | | | | 20,358,201 | |
| | | | | | | | |
Oil & Gas 2.2% | | | | | | | | |
Chesapeake Energy Corp.
New Unsecured Term Loan
5.75%, due 12/1/17 | | | 9,166,700 | | | | 9,478,945 | |
Energy Transfer Equity, L.P.
New Term Loan B
3.75%, due 3/24/17 | | | 3,600,000 | | | | 3,613,500 | |
EP Energy LLC
Incremental Term Loan
4.50%, due 4/26/19 | | | 1,670,142 | | | | 1,695,195 | |
Frac Tech International LLC
Term Loan B
8.50%, due 5/6/16 | | | 5,147,089 | | | | 5,062,162 | |
| | | | |
| 16 | | MainStay Floating Rate Fund | | The notes to the financial statements are an integral part of,
and should be read in conjunction with, the financial statements. |
| | | | | | | | |
| | | Principal
Amount | | | Value | |
| | | | | | | | |
| Floating Rate Loans (continued) | |
Oil & Gas (continued) | | | | | | | | |
Philadelphia Energy Solutions LLC
Term Loan B
6.25%, due 3/19/18 | | $ | 2,500,000 | | | $ | 2,531,250 | |
Ruby Western Pipeline Holdings LLC
Term Loan B
3.50%, due 3/27/20 | | | 960,000 | | | | 967,800 | |
Samson Investment Co.
2nd Lien Term Loan
6.00%, due 9/25/18 | | | 5,700,000 | | | | 5,762,700 | |
| | | | | | | | |
| | | | | | | 29,111,552 | |
| | | | | | | | |
Personal & Nondurable Consumer Products (Manufacturing Only) 2.6% | |
ABC Supply Co., Inc.
Term Loan
3.50%, due 4/20/20 | | | 6,000,000 | | | | 6,043,698 | |
ACCO Brands Corp.
New Term Loan B
4.25%, due 4/30/19 | | | 4,756,889 | | | | 4,780,673 | |
Prestige Brands, Inc.
New Term Loan
3.75%, due 1/31/19 | | | 354,263 | | | | 359,488 | |
Serta Simmons Holdings LLC
Term Loan
5.00%, due 10/1/19 | | | 5,486,250 | | | | 5,557,769 | |
SRAM LLC
REFI Term Loan B
4.00%, due 3/27/20 | | | 4,981,715 | | | | 5,019,078 | |
Sun Products Corp. (The)
New Term Loan
5.50%, due 3/23/20 | | | 5,250,000 | | | | 5,291,564 | |
Visant Holding Corp.
Term Loan B
5.25%, due 12/22/16 | | | 6,885,091 | | | | 6,687,145 | |
| | | | | | | | |
| | | | | | | 33,739,415 | |
| | | | | | | | |
Personal Transportation 0.6% | | | | | | | | |
Orbitz Worldwide, Inc. | | | | | | | | |
Term Loan B
7.25%, due 9/25/17 | | | 1,100,000 | | | | 1,115,125 | |
Term Loan C
8.00%, due 3/25/19 | | | 1,100,000 | | | | 1,115,469 | |
United Airlines, Inc.
New Term Loan B
4.00%, due 3/22/19 | | | 5,000,000 | | | | 5,054,690 | |
| | | | | | | | |
| | | | | | | 7,285,284 | |
| | | | | | | | |
Personal, Food & Miscellaneous Services 1.2% | |
Aramark Corp. | | | | | | | | |
Extended Term Loan B
3.698%, due 7/26/16 | | | 6,293,323 | | | | 6,336,514 | |
Extended Letter of Credit
3.703%, due 7/26/16 | | | 414,866 | | | | 417,713 | |
| | | | | | | | |
| | | Principal
Amount | | | Value | |
| | | | | | | | |
Personal, Food & Miscellaneous Services (continued) | |
Aramark Corp. (continued) | | | | | | | | |
New Extended LC-3 Facility
3.703%, due 7/26/16 | | $ | 70,436 | | | $ | 70,964 | |
Extended Term Loan C
3.754%, due 7/26/16 | | | 48,249 | | | | 48,610 | |
Term Loan D
4.00%, due 9/9/19 | | | 1,800,000 | | | | 1,820,985 | |
Weight Watchers International, Inc.
Term Loan B2
3.75%, due 4/2/20 | | | 7,142,857 | | | | 7,117,857 | |
| | | | | | | | |
| | | | | | | 15,812,643 | |
| | | | | | | | |
Printing & Publishing 1.4% | | | | | | | | |
Dex Media East LLC
New Term Loan
2.75%, due 10/24/14 | | | 988,864 | | | | 709,510 | |
Getty Images, Inc.
Term Loan B
4.75%, due 10/18/19 | | | 8,977,500 | | | | 9,099,540 | |
Lamar Media Corp.
Term Loan B
4.00%, due 12/30/16 | | | 371,260 | | | | 372,807 | |
McGraw-Hill Global Education Holdings, LLC
Term Loan
9.00%, due 3/22/19 | | | 4,000,000 | | | | 3,981,000 | |
MediaNews Group
New Term Loan
8.50%, due 3/19/14 | | | 88,300 | | | | 88,742 | |
Penton Media, Inc.
New Term Loan B
6.00%, due 8/1/14 (c)(e) | | | 3,416,253 | | | | 3,294,549 | |
R.H. Donnelley, Inc.
New Term Loan
9.00%, due 10/24/14 | | | 1,852,048 | | | | 1,328,844 | |
| | | | | | | | |
| | | | | | | 18,874,992 | |
| | | | | | | | |
Retail Stores 5.8% | | | | | | | | |
BJ’s Wholesale Club, Inc.
Replacement Term Loan
4.25%, due 9/26/19 | | | 10,058,541 | | | | 10,138,174 | |
Collective Brands Finance, Inc.
Term Loan
7.25%, due 10/9/19 (c) | | | 2,089,513 | | | | 2,122,162 | |
Harbor Freight Tools USA, Inc.
Term Loan B
5.50%, due 11/14/17 | | | 4,300,800 | | | | 4,355,636 | |
Leslie’s Poolmart, Inc.
New Term Loan B
5.23%, due 10/16/19 (f) | | | 5,677,686 | | | | 5,652,747 | |
| | | | | | |
The notes to the financial statements are an integral part of,
and should be read in conjunction with, the financial statements. | | mainstayinvestments.com | | | 17 | |
Portfolio of Investments April 30, 2013 (Unaudited) (continued)
| | | | | | | | |
| | | Principal
Amount | | | Value | |
| | | | | | | | |
| Floating Rate Loans (continued) | |
Retail Stores (continued) | | | | | | | | |
¨Michaels Stores, Inc.
New Term Loan
3.75%, due 1/28/20 | | $ | 11,170,300 | | | $ | 11,264,052 | |
NBTY, Inc.
Term Loan B
2 3.50%, due 10/1/17 | | | 3,790,286 | | | | 3,829,769 | |
¨Neiman Marcus Group, Inc. (The)
Extended Term Loan
4.00%, due 5/16/18 | | | 13,722,181 | | | | 13,822,956 | |
Party City Holdings Inc.
REFI Term Loan B
4.25%, due 7/29/19 | | | 6,716,292 | | | | 6,768,061 | |
Petco Animal Supplies, Inc.
New Term Loan
4.00%, due 11/24/17 | | | 6,529,177 | | | | 6,613,515 | |
Pilot Travel Centers LLC
REFI Term Loan B
3.75%, due 3/30/18 | | | 4,056,063 | | | | 3,995,222 | |
Term Loan B2 4.25%, due 8/7/19 | | | 3,980,000 | | | | 3,930,250 | |
Yankee Candle Co., Inc. (The)
New Term Loan B
5.25%, due 4/2/19 | | | 4,517,455 | | | | 4,543,431 | |
| | | | | | | | |
| | | | | | | 77,035,975 | |
| | | | | | | | |
Telecommunications 5.1% | | | | | | | | |
Alcatel-Lucent USA Inc.
USD Term Loan C
7.25%, due 1/30/19 | | | 7,314,967 | | | | 7,492,128 | |
Avaya, Inc.
Term Loan B5
8.00%, due 3/30/18 | | | 4,487,020 | | | | 4,485,899 | |
Cricket Communications, Inc.
Term Loan C
4.75%, due 2/21/20 | | | 7,375,000 | | | | 7,408,187 | |
Crown Castle International Corp.
New Term Loan
3.25%, due 1/31/19 | | | 6,004,000 | | | | 6,028,394 | |
Level 3 Financing, Inc.
2016 Term Loan B
4.75%, due 2/1/16 | | | 2,686,500 | | | | 2,714,037 | |
2019 Term Loan B
5.25%, due 8/1/19 | | | 4,800,000 | | | | 4,846,800 | |
Light Tower Fiber LLC
1st Lien Term Loan
4.50%, due 3/27/20 | | | 6,000,000 | | | | 6,057,498 | |
2nd Lien Term Loan 8.00%, due 3/29/21 | | | 500,000 | | | | 510,000 | |
| | | | | | | | |
| | | Principal
Amount | | | Value | |
| | | | | | | | |
Telecommunications (continued) | | | | | | | | |
¨MetroPCS Wireless, Inc. | | | | | | | | |
Tranche B2 4.734%, due 11/3/16 | | $ | 2,977,386 | | | $ | 2,981,640 | |
Incremental Term Loan B3 4.876%, due 3/16/18 | | | 1,974,790 | | | | 1,975,284 | |
Syniverse Holdings, Inc.
Term Loan
5.00%, due 4/23/19 (f) | | | 6,177,320 | | | | 6,208,207 | |
Telesat LLC
Term Loan B
3.50%, due 3/28/19 | | | 10,520,500 | | | | 10,625,705 | |
Zayo Group LLC
New Term Loan B
4.50%, due 7/2/19 | | | 6,164,416 | | | | 6,228,951 | |
| | | | | | | | |
| | | | | | | 67,562,730 | |
| | | | | | | | |
Utilities 4.2% | | | | | | | | |
AES Corp.
REFI Term Loan B
3.75%, due 6/1/18 | | | 6,539,007 | | | | 6,630,278 | |
¨Calpine Corp. | | | | | | | | |
Term Loan B1 4.00%, due 4/2/18 | | | 3,952,116 | | | | 4,002,339 | |
Term Loan B2 4.00%, due 4/2/18 | | | 7,884,723 | | | | 7,984,922 | |
Covanta Energy Corp.
Term Loan
3.50%, due 3/28/19 | | | 2,673,000 | | | | 2,713,095 | |
Dynergy Holdings, Inc.
Term Loan B1
4.00%, due 4/23/20 | | | 3,736,154 | | | | 3,735,220 | |
Term Loan B2 4.00%, due 4/23/20 | | | 4,629,231 | | | | 4,628,074 | |
Equipower Resources Holdings LLC
REFI Term Loan B
5.50%, due 12/21/18 | | | 3,184,086 | | | | 3,231,848 | |
2nd Lien Term Loan 10.00%, due 6/21/19 | | | 900,000 | | | | 922,500 | |
Essential Power LLC
Term Loan B
4.25%, due 8/8/19 | | | 3,454,566 | | | | 3,493,430 | |
LSP Madison Funding LLC
Term Loan
5.50%, due 6/28/19 | | | 6,807,143 | | | | 6,895,071 | |
NRG Energy, Inc.
New Term Loan B
3.25%, due 7/2/18 | | | 6,872,891 | | | | 6,951,640 | |
Topaz Power Holdings, LLC
Term Loan
5.25%, due 2/26/20 | | | 3,591,000 | | | | 3,617,933 | |
| | | | |
| 18 | | MainStay Floating Rate Fund | | The notes to the financial statements are an integral part of,
and should be read in conjunction with, the financial statements. |
| | | | | | | | |
| | | Principal
Amount | | | Value | |
| | | | | | | | |
| Floating Rate Loans (continued) | |
Utilities (continued) | | | | | | | | |
TPF Generation Holdings LLC
Synthetic Letter of Credit
2.218%, due 12/13/13 | | $ | 8,196 | | | $ | 8,165 | |
2nd Lien Term Loan C 4.448%, due 12/15/14 | | | 1,308,843 | | | | 1,305,025 | |
| | | | | | | | |
| | | | | | | 56,119,540 | |
| | | | | | | | |
Total Floating Rate Loans
(Cost $1,059,782,015) | | | | | | | 1,071,461,709 | |
| | | | | | | | |
|
| Foreign Floating Rate Loans 2.3% (b) | |
Broadcasting & Entertainment 0.2% | | | | | | | | |
UPC Financing Partnership
Term Loan AF
4.00%, due 1/29/21 | | | 2,700,000 | | | | 2,723,625 | |
| | | | | | | | |
|
Healthcare, Education & Childcare 0.1% | |
WC Luxco S.A.R.L.
New Term Loan B3
4.25%, due 3/15/18 | | | 1,480,953 | | | | 1,501,301 | |
| | | | | | | | |
|
Leisure, Amusement, Motion Pictures & Entertainment 0.5% | |
Bombardier Recreational Products, Inc.
New Term Loan B
5.00%, due 1/30/19 | | | 6,000,000 | | | | 6,057,498 | |
| | | | | | | | |
|
Mining, Steel, Iron & Non-Precious Metals 0.6% | |
Novelis, Inc.
New Term Loan
3.75%, due 3/10/17 | | | 8,305,094 | | | | 8,433,823 | |
| | | | | | | | |
|
Printing & Publishing 0.1% | |
Yell Group PLC
New Term Loan B1
3.948%, due 7/31/14 (d)(g) | | | 2,651,780 | | | | 543,615 | |
| | | | | | | | |
| | |
Telecommunications 0.8% | | | | | | | | |
Intelsat Jackson Holdings, Ltd.
Term Loan B1
4.25%, due 4/2/18 | | | 10,793,412 | | | | 10,941,822 | |
| | | | | | | | |
Total Foreign Floating Rate Loans
(Cost $31,993,303) | | | | | | | 30,201,684 | |
| | | | | | | | |
Total Long-Term Bonds
(Cost $1,225,052,237) | | | | | | | 1,243,760,078 | |
| | | | | | | | |
| | |
| | | | | | | | |
| | | | | | | | |
| | |
| | | Shares | | | Value | |
| | | | | | | | |
| Common Stock 0.0%‡ | |
Beverage, Food & Tobacco 0.0%‡ | | | | | | | | |
Nellson Nutraceutical, Inc. (c)(h) | | | 379 | | | $ | 250,271 | |
| | | | | | | | |
Total Common Stock
(Cost $531,732) | | | | | | | 250,271 | |
| | | | | | | | |
| | |
| | | | | | | | |
| | | Principal
Amount | | | | |
| | | | | | | | |
| Short-Term Investments 7.6% | |
Other Commercial Paper 1.0% | | | | | | | | |
John Deere Bank S.A.
0.142%, due 5/7/13 (a)(j) | | $ | 12,920,000 | | | | 12,919,699 | |
| | | | | | | | |
Total Other Commercial Paper
(Cost $12,919,699) | | | | | | | 12,919,699 | |
| | | | | | | | |
| | |
Repurchase Agreement 0.1% | | | | | | | | |
State Street Bank and Trust Co.
0.01%, dated 4/30/13
due 5/1/13
Proceeds at Maturity $578,660 (Collateralized by a Federal National Mortgage Association security with a rate of 2.20% and a maturity date of 10/17/22, with a Principal Amount of $590,000 and a Market Value of $592,339) | | | 578,660 | | | | 578,660 | |
| | | | | | | | |
Total Repurchase Agreement
(Cost $578,660) | | | | | | | 578,660 | |
| | | | | | | | |
|
U.S. Government & Federal Agency 6.5% | |
United States Treasury Bills | | | | | | | | |
0.031%, due 5/23/13 (i) | | | 46,761,000 | | | | 46,760,114 | |
0.033%, due 5/9/13 (i) | | | 496,000 | | | | 495,996 | |
0.033%, due 5/16/13 (i) | | | 2,353,000 | | | | 2,352,968 | |
0.04%, due 5/9/13 (i) | | | 32,236,000 | | | | 32,235,721 | |
0.042%, due 6/20/13 (i) | | | 779,000 | | | | 778,956 | |
0.044%, due 5/16/13 (i) | | | 3,046,000 | | | | 3,045,945 | |
0.053%, due 5/16/13 (i) | | | 486,000 | | | | 485,989 | |
| | | | | | | | |
Total U.S. Government & Federal Agency
(Cost $86,155,689) | | | | | | | 86,155,689 | |
| | | | | | | | |
Total Short-Term Investments
(Cost $99,654,048) | | | | | | | 99,654,048 | |
| | | | | | | | |
Total Investments
(Cost $1,325,238,017) (j) | | | 101.4 | % | | | 1,343,664,397 | |
Other Assets, Less Liabilities | | | (1.4 | ) | | | (18,279,017 | ) |
| | | | | | | | |
Net Assets | | | 100.0 | % | | $ | 1,325,385,380 | |
| | | | | | | | |
| ‡ | Less than one-tenth of a percent. |
| | | | | | |
The notes to the financial statements are an integral part of,
and should be read in conjunction with, the financial statements. | | mainstayinvestments.com | | | 19 | |
Portfolio of Investments April 30, 2013 (Unaudited) (continued)
| (a) | May be sold to institutional investors only under Rule 144A or securities offered pursuant to Section 4(a)(2) of the Securities Act of 1933, as amended. |
| (b) | Floating Rate Loan—generally pays interest at rates which are periodically re-determined at a margin above the London InterBank Offered Rate or other short-term rates. The rate shown is the weighted average interest rate of all contracts within the floating rate loan facility as of April 30, 2013. |
| (c) | Illiquid security—The total market value of these securities as of April 30, 2013 is $21,200,584, which represents 1.6% of the Fund’s net assets. |
| (d) | Floating Rate Loan will settle after April 30, 2013, at which time the interest rate will be determined. |
| (e) | PIK (“Payment in Kind”)—interest or dividend payment is made with additional securities. |
| (f) | Security has additional commitments and contingencies. Principal amount and value excludes unfunded commitments. |
| (h) | Fair valued security—The total market value of this security as of April 30, 2013 is $250,271, which represents less than one-tenth of a percent of the Fund’s net assets. |
| (i) | Interest rate presented is yield to maturity. |
| (j) | As of April 30, 2013, cost is $1,327,154,243 for federal income tax purposes and net unrealized appreciation is as follows: |
| | | | |
Gross unrealized appreciation | | $ | 23,076,608 | |
Gross unrealized depreciation | | | (6,566,454 | ) |
| | | | |
Net unrealized appreciation | | $ | 16,510,154 | |
| | | | |
The following is a summary of the fair valuations according to the inputs used as of April 30, 2013, for valuing the Fund’s assets.
Asset Valuation Inputs
| | | | | | | | | | | | | | | | |
Description | | Quoted Prices in
Active
Markets for
Identical
Assets
(Level 1) | | | Significant Other Observable Inputs (Level 2) | | | Significant
Unobservable
Inputs (Level 3) | | | Total | |
| Investments in Securities (a) | | | | | | | | | | | | | | | | |
| Long-Term Bonds | | | | | | | | | | | | | | | | |
Corporate Bonds | | $ | — | | | $ | 142,096,685 | | | $ | — | | | $ | 142,096,685 | |
Floating Rate Loans (b) | | | — | | | | 1,016,031,337 | | | | 55,430,372 | | | | 1,071,461,709 | |
Foreign Floating Rate Loans | | | — | | | | 30,201,684 | | | | — | | | | 30,201,684 | |
| | | | | | | | | | | | | | | | |
| Total Long-Term Bonds | | | — | | | | 1,188,329,706 | | | | 55,430,372 | | | | 1,243,760,078 | |
| | | | | | | | | | | | | | | | |
| Common Stock (c) | | | — | | | | — | | | | 250,271 | | | | 250,271 | |
| Short-Term Investments | | | | | | | | | | | | | | | | |
Other Commercial Paper | | | — | | | | 12,919,699 | | | | — | | | | 12,919,699 | |
Repurchase Agreement | | | — | | | | 578,660 | | | | — | | | | 578,660 | |
U.S. Government & Federal Agency | | | — | | | | 86,155,689 | | | | — | | | | 86,155,689 | |
| | | | | | | | | | | | | | | | |
| Total Short-Term Investments | | | — | | | | 99,654,048 | | | | — | | | | 99,654,048 | |
| | | | | | | | | | | | | | | | |
| Total Investments in Securities | | $ | — | | | $ | 1,287,983,754 | | | $ | 55,680,643 | | | $ | 1,343,664,397 | |
| | | | | | | | | | | | | | | | |
| (a) | For a complete listing of investments and their industries, see the Portfolio of Investments. |
| (b) | Includes $55,430,372 of Level 3 securities which represent floating rate loans whose value was obtained from an independent pricing service which utilized a single broker quote to determine such value as referenced in the Portfolio of Investments. |
| (c) | The Level 3 security valued at $250,271 is held in Beverage, Food & Tobacco within the Common Stock section of the Portfolio of Investments. |
The Fund recognizes transfers between the levels as of the beginning of the period.
For the period ended April 30, 2013, the Fund did not have any transfers between Level 1 and Level 2 fair value measurements. (See Note 2)
During the six-month period ended April 30, 2013, securities with a total value of $5,277,194 transferred from Level 2 to Level 3. The transfer occurred as a result of certain floating rate loan valuations obtained from the independent pricing service which were derived based on single broker quote.
During the period ended April 30, 2013, securities with a total value of $2,007,500 transferred from Level 3 to Level 2. The transfer occurred as a result of certain floating rate loan valuations obtained from the independent pricing service which utilized the average of multiple bid quotations as of April 30, 2013. The fair value obtained for these loans from the independent pricing service as of October 31, 2012, utilized a single broker quote.
| | | | |
| 20 | | MainStay Floating Rate Fund | | The notes to the financial statements are an integral part of,
and should be read in conjunction with, the financial statements. |
The following is a reconciliation of investments in which significant unobservable inputs (Level 3) were used in determining value:
| | | | | | | | | | | | | | | | | | | | | | | | | | | | | | | | | | | | | | | | |
Investments in
Securities | | Balance as of October 31,
2012 | | | Accrued
Discounts
(Premiums) | | | Realized Gain (Loss) | | | Change in
Unrealized
Apprecia
tion
(Deprecia-
tion) | | | Purc
hases | | | Sales (b) | | | Transfers in to Level 3 | | | Transfers out of Level 3 | | | Balance as of April 30, 2013 | | | Change in
Unrealized
Apprecia-
tion
(Deprecia-
tion) from
Invest-
ments
Still Held
as of April 30,
2013 (a) | |
Long-Term
Bonds | | | | | | | | | | | | | | | | | | | | | | | | | | | | | | | | | | | | | | | | |
Floating
Rate Loans | | | | | | | | | | | | | | | | | | | | | | | | | | | | | | | | | | | | | | | | |
Aerospace
& Defense | | $ | 3,124,000 | | | $ | 2,272 | | | $ | 75 | | | $ | 79,239 | | | $ | — | | | $ | (8,000 | ) | | $ | — | | | $ | — | | | $ | 3,197,586 | | | $ | 79,123 | |
Automobile | | | — | | | | 1,507 | | | | 1,852 | | | | 215,974 | | | | 10,677,486 | | | | (205,093 | ) | | | — | | | | — | | | | 10,691,726 | | | | 215,974 | |
Beverage,
Food &
Tobacco | | | — | | | | 1,542 | | | | 81 | | | | (14,513 | ) | | | — | | | | (13,357 | ) | | | 2,591,814 | | | | — | | | | 2,565,567 | | | | (14,513 | ) |
Chemicals,
Plastics
& Rubber | | | 3,799,844 | | | | 1,271 | | | | 11,523 | | | | 125,024 | | | | — | | | | (3,937,662 | ) | | | — | | | | — | | | | — | | | | — | |
Containers,
Packaging
& Glass | | | — | | | | 484 | | | | — | | | | 128,853 | | | | 5,198,788 | | | | — | | | | — | | | | — | | | | 5,328,125 | | | | 128,853 | |
Diversified/
Conglome-
rate
Service | | | 13,509,070 | | | | (1,521 | ) | | | (33 | ) | | | (20,536 | ) | | | — | | | | (6,730,834 | ) | | | — | | | | — | | | | 6,756,146 | | | | (15,480 | ) |
Electronics | | | — | | | | 1,521 | | | | 83 | | | | 50,348 | | | | 3,465,504 | | | | (8,750 | ) | | | — | | | | — | | | | 3,508,706 | | | | 50,348 | |
Finance | | | 5,191,830 | | | | 8,429 | | | | 24,478 | | | | 185,967 | | | | 9,465,230 | | | | (3,670,678 | ) | | | — | | | | (2,007,500 | ) | | | 9,197,756 | | | | 190,515 | |
Healthcare,
Education &
Childcare | | | 2,607,531 | | | | 3,799 | | | | (648 | ) | | | 123,179 | | | | — | | | | (1,233,945 | ) | | | — | | | | — | | | | 1,499,916 | | | | (110 | ) |
Machinery | | | 1,099,168 | | | | 2,854 | | | | 3,354 | | | | 70,064 | | | | 2,901,363 | | | | (346,226 | ) | | | — | | | | — | | | | 3,730,577 | | | | 70,064 | |
Mining,
Steel,
Iron &
Non-
Precious
Metals | | | 6,625,002 | | | | 18,019 | | | | 76,766 | | | | 99,465 | | | | — | | | | (3,109,330 | ) | | | — | | | | — | | | | 3,709,922 | | | | 115,621 | |
Oil &
Gas | | | — | | | | 188 | | | | — | | | | 68,550 | | | | 2,462,512 | | | | — | | | | — | | | | — | | | | 2,531,250 | | | | 68,550 | |
Utilities | | | — | | | | 952 | | | | 59 | | | | 40,204 | | | | — | | | | (13,500 | ) | | | 2,685,380 | | | | — | | | | 2,713,095 | | | | 40,204 | |
Common
Stocks | | | | | | | | | | | | | | | | | | | | | | | — | | | | | | | | | | | | | | | | | |
Beverage,
Food &
Tobacco | | | 250,271 | | | | — | | | | — | | | | — | | | | — | | | | — | | | | — | | | | — | | | | 250,271 | | | | — | |
Leisure,
Amuse-
ment,
Motion
Pictures &
Entertain-
ment | | | 1,697,164 | | | | — | | | | 771,922 | | | | (432,809 | ) | | | — | | | | (2,036,277 | ) | | | — | | | | — | | | | — | | | | — | |
| | | | | | | | | | | | | | | | | | | | | | | | | | | | | | | | | | | | | | | | |
| Total | | $ | 37,903,880 | | | $ | 41,317 | | | $ | 889,512 | | | $ | 719,009 | | | $ | 34,170,883 | | | $ | (21,313,652 | ) | | $ | 5,277,194 | | | $ | (2,007,500 | ) | | $ | 55,680,643 | | | $ | 929,149 | |
| | | | | | | | | | | | | | | | | | | | | | | | | | | | | | | | | | | | | | | | |
| (a) | Included in “Net change in unrealized appreciation (depreciation) on investments” in the Statement of Operations. |
| (b) | Sales include principal reductions. |
| | | | | | |
The notes to the financial statements are an integral part of,
and should be read in conjunction with, the financial statements. | | mainstayinvestments.com | | | 21 | |
Statement of Assets and Liabilities as of April 30, 2013 (Unaudited)
| | | | |
| Assets | |
Investment in securities, at value
(identified cost $1,325,238,017) | | $ | 1,343,664,397 | |
Unrealized appreciation on unfunded commitments | | | 12,150 | |
Receivables: | | | | |
Investment securities sold | | | 14,330,768 | |
Dividends and interest | | | 6,478,350 | |
Fund shares sold | | | 4,052,868 | |
Other assets | | | 91,915 | |
| | | | |
Total assets | | | 1,368,630,448 | |
| | | | |
| |
| Liabilities | | | | |
Payables: | | | | |
Investment securities purchased | | | 38,193,201 | |
Fund shares redeemed | | | 3,151,049 | |
Manager (See Note 3) | | | 636,824 | |
NYLIFE Distributors (See Note 3) | | | 267,576 | |
Transfer agent (See Note 3) | | | 204,076 | |
Professional fees | | | 48,407 | |
Shareholder communication | | | 46,979 | |
Trustees | | | 2,237 | |
Custodian | | | 1,974 | |
Accrued expenses | | | 7,376 | |
Dividend payable | | | 685,369 | |
| | | | |
Total liabilities | | | 43,245,068 | |
| | | | |
Net assets | | $ | 1,325,385,380 | |
| | | | |
| |
| Composition of Net Assets | | | | |
Shares of beneficial interest outstanding (par value of $.001 per share) unlimited number of shares authorized | | $ | 137,154 | |
Additional paid-in capital | | | 1,373,107,430 | |
| | | | |
| | | 1,373,244,584 | |
Distributions in excess of net investment income | | | (399,011 | ) |
Accumulated net realized gain (loss) on investments | | | (65,898,723 | ) |
Net unrealized appreciation (depreciation) on investments | | | 18,426,380 | |
Net unrealized appreciation (depreciation) on unfunded commitments | | | 12,150 | |
| | | | |
Net assets | | $ | 1,325,385,380 | |
| | | | |
| | | | |
Investor Class | | | | |
Net assets applicable to outstanding shares | | $ | 27,935,824 | |
| | | | |
Shares of beneficial interest outstanding | | | 2,891,346 | |
| | | | |
Net asset value per share outstanding | | $ | 9.66 | |
Maximum sales charge (3.00% of offering price) | | | 0.30 | |
| | | | |
Maximum offering price per share outstanding | | $ | 9.96 | |
| | | | |
Class A | | | | |
Net assets applicable to outstanding shares | | $ | 435,084,696 | |
| | | | |
Shares of beneficial interest outstanding | | | 45,031,788 | |
| | | | |
Net asset value per share outstanding | | $ | 9.66 | |
Maximum sales charge (3.00% of offering price) | | | 0.30 | |
| | | | |
Maximum offering price per share outstanding | | $ | 9.96 | |
| | | | |
Class B | | | | |
Net assets applicable to outstanding shares | | $ | 12,242,969 | |
| | | | |
Shares of beneficial interest outstanding | | | 1,266,185 | |
| | | | |
Net asset value and offering price per share outstanding | | $ | 9.67 | |
| | | | |
Class C | | | | |
Net assets applicable to outstanding shares | | $ | 201,196,787 | |
| | | | |
Shares of beneficial interest outstanding | | | 20,816,473 | |
| | | | |
Net asset value and offering price per share outstanding | | $ | 9.67 | |
| | | | |
Class I | | | | |
Net assets applicable to outstanding shares | | $ | 648,925,104 | |
| | | | |
Shares of beneficial interest outstanding | | | 67,148,452 | |
| | | | |
Net asset value and offering price per share outstanding | | $ | 9.66 | |
| | | | |
| | | | |
| 22 | | MainStay Floating Rate Fund | | The notes to the financial statements are an integral part of,
and should be read in conjunction with, the financial statements. |
Statement of Operations for the six months ended April 30, 2013 (Unaudited)
| | | | |
| Investment Income (Loss) | |
Income | | | | |
Interest | | $ | 28,768,807 | |
Dividends | | | 58,063 | |
| | | | |
Total income | | | 28,826,870 | |
| | | | |
Expenses | | | | |
Manager (See Note 3) | | | 3,497,916 | |
Distribution/Service—Investor Class (See Note 3) | | | 33,367 | |
Distribution/Service—Class A (See Note 3) | | | 501,724 | |
Distribution/Service—Class B (See Note 3) | | | 58,499 | |
Distribution/Service—Class C (See Note 3) | | | 954,191 | |
Transfer agent (See Note 3) | | | 651,995 | |
Registration | | | 64,003 | |
Professional fees | | | 56,776 | |
Shareholder communication | | | 50,929 | |
Custodian | | | 17,554 | |
Trustees | | | 13,230 | |
Miscellaneous | | | 34,042 | |
| | | | |
Total expenses | | | 5,934,226 | |
| | | | |
Net investment income (loss) | | | 22,892,644 | |
| | | | |
|
| Realized and Unrealized Gain (Loss) on Investments | |
Net realized gain (loss) on investments | | | 2,043,734 | |
Net change in unrealized appreciation (depreciation) on investments and unfunded commitments | | | 14,006,456 | |
| | | | |
Net realized and unrealized gain (loss) on investments and unfunded commitments | | | 16,050,190 | |
| | | | |
Net increase (decrease) in net assets resulting from operations | | $ | 38,942,834 | |
| | | | |
| | | | | | |
The notes to the financial statements are an integral part of,
and should be read in conjunction with, the financial statements. | | mainstayinvestments.com | | | 23 | |
Statements of Changes in Net Assets
for the six months ended April 30, 2013 (Unaudited) and the year ended October 31, 2012
| | | | | | | | |
| | | 2013 | | | 2012 | |
| Increase (Decrease) in Net Assets | |
Operations: | | | | | | | | |
Net investment income (loss) | | $ | 22,892,644 | | | $ | 40,584,639 | |
Net realized gain (loss) on investments | | | 2,043,734 | | | | (3,378,690 | ) |
Net change in unrealized appreciation (depreciation) on investments and unfunded commitments | | | 14,006,456 | | | | 27,629,804 | |
| | | | |
Net increase (decrease) in net assets resulting from operations | | | 38,942,834 | | | | 64,835,753 | |
| | | | |
Dividends to shareholders: | | | | | | | | |
From net investment income: | | | | | | | | |
Investor Class | | | (518,310 | ) | | | (992,594 | ) |
Class A | | | (7,890,500 | ) | | | (16,047,712 | ) |
Class B | | | (183,112 | ) | | | (400,562 | ) |
Class C | | | (2,982,950 | ) | | | (5,778,869 | ) |
Class I | | | (11,317,772 | ) | | | (17,367,575 | ) |
| | | | |
Total dividends to shareholders | | | (22,892,644 | ) | | | (40,587,312 | ) |
| | | | |
Capital share transactions: | | | | | | | | |
Net proceeds from sale of shares | | | 364,118,496 | | | | 412,463,595 | |
Net asset value of shares issued to shareholders in reinvestment of dividends | | | 18,900,364 | | | | 31,404,002 | |
Cost of shares redeemed | | | (170,251,586 | ) | | | (437,610,104 | ) |
| | | | |
Increase (decrease) in net assets derived from capital share transactions | | | 212,767,274 | | | | 6,257,493 | |
| | | | |
Net increase (decrease) in net assets | | | 228,817,464 | | | | 30,505,934 | |
|
| Net Assets | |
Beginning of period | | | 1,096,567,916 | | | | 1,066,061,982 | |
| | | | |
End of period | | $ | 1,325,385,380 | | | $ | 1,096,567,916 | |
| | | | |
Distributions in excess of net investment income at end of period | | $ | (399,011 | ) | | $ | (399,011 | ) |
| | | | |
| | | | |
| 24 | | MainStay Floating Rate Fund | | The notes to the financial statements are an integral part of,
and should be read in conjunction with, the financial statements. |
Financial Highlights selected per share data and ratios
| | | | | | | | | | | | | | | | | | | | | | | | |
| | | Investor Class | |
| | | Six months
ended April 30, | | | Year ended October 31, | | | February 28,
2008** through
October 31, | |
| | | 2013* | | | 2012 | | | 2011 | | | 2010 | | | 2009 | | | 2008 | |
Net asset value at beginning of period | | $ | 9.53 | | | $ | 9.31 | | | $ | 9.42 | | | $ | 8.97 | | | $ | 7.61 | | | $ | 8.94 | |
| | | | | | | | | | | | | | | | | | | | | | | | |
Net investment income (loss) | | | 0.18 | | | | 0.36 | | | | 0.34 | | | | 0.32 | | | | 0.29 | | | | 0.28 | |
Net realized and unrealized gain (loss) on investments | | | 0.13 | | | | 0.22 | | | | (0.11 | ) | | | 0.45 | | | | 1.36 | | | | (1.33 | ) |
| | | | | | | | | | | | | | | | | | | | | | | | |
Total from investment operations | | | 0.31 | | | | 0.58 | | | | 0.23 | | | | 0.77 | | | | 1.65 | | | | (1.05 | ) |
| | | | | | | | | | | | | | | | | | | | | | | | |
Less dividends: | | | | | | | | | | | | | | | | | | | | | | | | |
From net investment income | | | (0.18 | ) | | | (0.36 | ) | | | (0.34 | ) | | | (0.32 | ) | | | (0.29 | ) | | | (0.28 | ) |
| | | | | | | | | | | | | | | | | | | | | | | | |
Redemption fee (a) | | | — | | | | — | | | | — | | | | 0.00 | ‡ | | | 0.00 | ‡ | | | 0.00 | ‡ |
| | | | | | | | | | | | | | | | | | | | | | | | |
Net asset value at end of period | | $ | 9.66 | | | $ | 9.53 | | | $ | 9.31 | | | $ | 9.42 | | | $ | 8.97 | | | $ | 7.61 | |
| | | | | | | | | | | | | | | | | | | | | | | | |
Total investment return (b) | | | 3.33 | %(c) | | | 6.35 | % | | | 2.45 | % | | | 8.76 | % | | | 22.32 | % | | | (12.19 | %)(c) |
Ratios (to average net assets)/Supplemental Data: | | | | | | | | | | | | | | | | | | | | | | | | |
Net investment income (loss) | | | 3.88 | %†† | | | 3.83 | % | | | 3.61 | % | | | 3.52 | % | | | 3.63 | % | | | 4.43 | % †† |
Net expenses | | | 1.05 | %†† | | | 1.06 | % | | | 1.06 | % | | | 1.10 | % | | | 1.19 | % | | | 1.05 | % †† |
Portfolio turnover rate | | | 24 | % | | | 47 | % | | | 38 | % | | | 10 | % | | | 17 | % | | | 10 | % |
Net assets at end of period (in 000’s) | | $ | 27,936 | | | $ | 26,406 | | | $ | 26,068 | | | $ | 23,245 | | | $ | 20,191 | | | $ | 14,586 | |
| ** | Commencement of operations. |
| ‡ | Less than one cent per share. |
| (a) | The redemption fee was discontinued as of April 1, 2010. |
| (b) | Total investment return is calculated exclusive of sales charges and assumes the reinvestment of dividends. |
| (c) | Total investment return is not annualized. |
| | | | | | | | | | | | | | | | | | | | | | | | |
| | | Class A | |
| | | Six months
ended April 30, | | | Year ended October 31, | |
| | | 2013* | | | 2012 | | | 2011 | | | 2010 | | | 2009 | | | 2008 | |
Net asset value at beginning of period | | $ | 9.53 | | | $ | 9.31 | | | $ | 9.42 | | | $ | 8.97 | | | $ | 7.61 | | | $ | 9.65 | |
| | | | | | | | | | | | | | | | | | | | | | | | |
Net investment income (loss) | | | 0.19 | | | | 0.37 | | | | 0.35 | | | | 0.33 | | | | 0.31 | | | | 0.46 | |
Net realized and unrealized gain (loss) on investments | | | 0.13 | | | | 0.22 | | | | (0.11 | ) | | | 0.45 | | | | 1.36 | | | | (2.03 | ) |
| | | | | | | | | | | | | | | | | | | | | | | | |
Total from investment operations | | | 0.32 | | | | 0.59 | | | | 0.24 | | | | 0.78 | | | | 1.67 | | | | (1.57 | ) |
| | | | | | | | | | | | | | | | | | | | | | | | |
Less dividends: | | | | | | | | | | | | | | | | | | | | | | | | |
From net investment income | | | (0.19 | ) | | | (0.37 | ) | | | (0.35 | ) | | | (0.33 | ) | | | (0.31 | ) | | | (0.47 | ) |
| | | | | | | | | | | | | | | | | | | | | | | | |
Redemption fee (a) | | | — | | | | — | | | | — | | | | 0.00 | ‡ | | | 0.00 | ‡ | | | 0.00 | ‡ |
| | | | | | | | | | | | | | | | | | | | | | | | |
Net asset value at end of period | | $ | 9.66 | | | $ | 9.53 | | | $ | 9.31 | | | $ | 9.42 | | | $ | 8.97 | | | $ | 7.61 | |
| | | | | | | | | | | | | | | | | | | | | | | | |
Total investment return (b) | | | 3.36 | %(c) | | | 6.42 | % | | | 2.53 | % | | | 8.87 | % | | | 22.53 | % | | | (16.91 | %) |
Ratios (to average net assets)/Supplemental Data: | | | | | | | | | | | | | | | | | | | | | | | | |
Net investment income (loss) | | | 3.93 | %†† | | | 3.90 | % | | | 3.69 | % | | | 3.62 | % | | | 3.80 | % | | | 5.36 | % |
Net expenses | | | 0.99 | %†† | | | 0.99 | % | | | 0.98 | % | | | 1.00 | % | | | 1.01 | % | | | 1.00 | % |
Portfolio turnover rate | | | 24 | % | | | 47 | % | | | 38 | % | | | 10 | % | | | 17 | % | | | 10 | % |
Net assets at end of period (in 000’s) | | $ | 435,085 | | | $ | 384,837 | | | $ | 453,282 | | | $ | 429,262 | | | $ | 338,350 | | | $ | 245,193 | |
| ‡ | Less than one cent per share. |
| (a) | The redemption fee was discontinued as of April 1, 2010. |
| (b) | Total investment return is calculated exclusive of sales charges and assumes the reinvestment of dividends. |
| (c) | Total investment return is not annualized. |
| | | | | | |
The notes to the financial statements are an integral part of,
and should be read in conjunction with, the financial statements. | | mainstayinvestments.com | | | 25 | |
Financial Highlights selected per share data and ratios
| | | | | | | | | | | | | | | | | | | | | | | | |
| | | Class B | |
| | | Six months
ended
April 30, | | | Year ended October 31, | |
| | | 2013* | | | 2012 | | | 2011 | | | 2010 | | | 2009 | | | 2008 | |
Net asset value at beginning of period | | $ | 9.54 | | | $ | 9.32 | | | $ | 9.43 | | | $ | 8.97 | | | $ | 7.61 | | | $ | 9.65 | |
| | | | | | | | | | | | | | | | | | | | | | | | |
Net investment income (loss) | | | 0.15 | | | | 0.29 | | | | 0.27 | | | | 0.25 | | | | 0.23 | | | | 0.39 | |
Net realized and unrealized gain (loss) on investments | | | 0.13 | | | | 0.22 | | | | (0.11 | ) | | | 0.46 | | | | 1.36 | | | | (2.03 | ) |
| | | | | | | | | | | | | | | | | | | | | | | | |
Total from investment operations | | | 0.28 | | | | 0.51 | | | | 0.16 | | | | 0.71 | | | | 1.59 | | | | (1.64 | ) |
| | | | | | | | | | | | | | | | | | | | | | | | |
Less dividends: | | | | | | | | | | | | | | | | | | | | | | | | |
From net investment income | | | (0.15 | ) | | | (0.29 | ) | | | (0.27 | ) | | | (0.25 | ) | | | (0.23 | ) | | | (0.40 | ) |
| | | | | | | | | | | | | | | | | | | | | | | | |
Redemption fee (a) | | | — | | | | — | | | | — | | | | 0.00 | ‡ | | | 0.00 | ‡ | | | 0.00 | ‡ |
| | | | | | | | | | | | | | | | | | | | | | | | |
Net asset value at end of period | | $ | 9.67 | | | $ | 9.54 | | | $ | 9.32 | | | $ | 9.43 | | | $ | 8.97 | | | $ | 7.61 | |
| | | | | | | | | | | | | | | | | | | | | | | | |
Total investment return (b) | | | 2.95 | %(c) | | | 5.68 | % | | | 1.59 | % | | | 8.06 | % | | | 21.41 | % | | | (17.66 | %) |
Ratios (to average net assets)/Supplemental Data: | | | | | | | | | | | | | | | | | | | | | | | | |
Net investment income (loss) | | | 3.13 | %†† | | | 3.08 | % | | | 2.86 | % | | | 2.76 | % | | | 2.95 | % | | | 4.51 | % |
Net expenses | | | 1.80 | %†† | | | 1.81 | % | | | 1.82 | % | | | 1.85 | % | | | 1.94 | % | | | 1.79 | % |
Portfolio turnover rate | | | 24 | % | | | 47 | % | | | 38 | % | | | 10 | % | | | 17 | % | | | 10 | % |
Net assets at end of period (in 000’s) | | $ | 12,243 | | | $ | 12,153 | | | $ | 14,508 | | | $ | 17,665 | | | $ | 20,289 | | | $ | 20,703 | |
| ‡ | Less than one cent per share. |
| (a) | The redemption fee was discontinued as of April 1, 2010. |
| (b) | Total investment return is calculated exclusive of sales charges and assumes the reinvestment of dividends. |
| (c) | Total investment return is not annualized. |
| | | | | | | | | | | | | | | | | | | | | | | | |
| | | Class C | |
| | | Six months
ended
April 30, | | | Year ended October 31, | |
| | | 2013* | | | 2012 | | | 2011 | | | 2010 | | | 2009 | | | 2008 | |
Net asset value at beginning of period | | $ | 9.54 | | | $ | 9.31 | | | $ | 9.43 | | | $ | 8.97 | | | $ | 7.61 | | | $ | 9.65 | |
| | | | | | | | | | | | | | | | | | | | | | | | |
Net investment income (loss) | | | 0.15 | | | | 0.29 | | | | 0.27 | | | | 0.25 | | | | 0.24 | | | | 0.39 | |
Net realized and unrealized gain (loss) on investments | | | 0.13 | | | | 0.23 | | | | (0.12 | ) | | | 0.46 | | | | 1.35 | | | | (2.03 | ) |
| | | | | | | | | | | | | | | | | | | | | | | | |
Total from investment operations | | | 0.28 | | | | 0.52 | | | | 0.15 | | | | 0.71 | | | | 1.59 | | | | (1.64 | ) |
| | | | | | | | | | | | | | | | | | | | | | | | |
Less dividends: | | | | | | | | | | | | | | | | | | | | | | | | |
From net investment income | | | (0.15 | ) | | | (0.29 | ) | | | (0.27 | ) | | | (0.25 | ) | | | (0.23 | ) | | | (0.40 | ) |
| | | | | | | | | | | | | | | | | | | | | | | | |
Redemption fee (a) | | | — | | | | — | | | | — | | | | 0.00 | ‡ | | | 0.00 | ‡ | | | 0.00 | ‡ |
| | | | | | | | | | | | | | | | | | | | | | | | |
Net asset value at end of period | | $ | 9.67 | | | $ | 9.54 | | | $ | 9.31 | | | $ | 9.43 | | | $ | 8.97 | | | $ | 7.61 | |
| | | | | | | | | | | | | | | | | | | | | | | | |
Total investment return (b) | | | 2.95 | %(c) | | | 5.67 | % | | | 1.59 | % | | | 8.06 | % | | | 21.41 | % | | | (17.66 | %) |
Ratios (to average net assets)/Supplemental Data: | | | | | | | | | | | | | | | | | | | | | | | | |
Net investment income (loss) | | | 3.13 | %†† | | | 3.09 | % | | | 2.87 | % | | | 2.76 | % | | | 2.89 | % | | | 4.52 | % |
Net expenses | | | 1.80 | %†† | | | 1.81 | % | | | 1.81 | % | | | 1.85 | % | | | 1.94 | % | | | 1.79 | % |
Portfolio turnover rate | | | 24 | % | | | 47 | % | | | 38 | % | | | 10 | % | | | 17 | % | | | 10 | % |
Net assets at end of period (in 000’s) | | $ | 201,197 | | | $ | 187,580 | | | $ | 197,230 | | | $ | 173,005 | | | $ | 132,105 | | | $ | 104,048 | |
| ‡ | Less than one cent per share. |
| (a) | The redemption fee was discontinued as of April 1, 2010. |
| (b) | Total investment return is calculated exclusive of sales charges and assumes the reinvestment of dividends. |
| (c) | Total investment return is not annualized. |
| | | | |
| 26 | | MainStay Floating Rate Fund | | The notes to the financial statements are an integral part of,
and should be read in conjunction with, the financial statements. |
Financial Highlights selected per share data and ratios
| | | | | | | | | | | | | | | | | | | | | | | | |
| | | Class I | |
| | | Six months
ended
April 30, | | | Year ended October 31, | |
| | | 2013* | | | 2012 | | | 2011 | | | 2010 | | | 2009 | | | 2008 | |
Net asset value at beginning of period | | $ | 9.53 | | | $ | 9.31 | | | $ | 9.43 | | | $ | 8.97 | | | $ | 7.61 | | | $ | 9.65 | |
| | | | | | | | | | | | | | | | | | | | | | | | |
Net investment income (loss) | | | 0.20 | | | | 0.39 | | | | 0.37 | | | | 0.36 | | | | 0.33 | | | | 0.50 | |
Net realized and unrealized gain (loss) on investments | | | 0.13 | | | | 0.22 | | | | (0.12 | ) | | | 0.46 | | | | 1.36 | | | | (2.04 | ) |
| | | | | | | | | | | | | | | | | | | | | | | | |
Total from investment operations | | | 0.33 | | | | 0.61 | | | | 0.25 | | | | 0.82 | | | | 1.69 | | | | (1.54 | ) |
| | | | | | | | | | | | | | | | | | | | | | | | |
Less dividends: | | | | | | | | | | | | | | | | | | | | | | | | |
From net investment income | | | (0.20 | ) | | | (0.39 | ) | | | (0.37 | ) | | | (0.36 | ) | | | (0.33 | ) | | | (0.50 | ) |
| | | | | | | | | | | | | | | | | | | | | | | | |
Redemption fee (a) | | | — | | | | — | | | | — | | | | 0.00 | ‡ | | | 0.00 | ‡ | | | 0.00 | ‡ |
| | | | | | | | | | | | | | | | | | | | | | | | |
Net asset value at end of period | | $ | 9.66 | | | $ | 9.53 | | | $ | 9.31 | | | $ | 9.43 | | | $ | 8.97 | | | $ | 7.61 | |
| | | | | | | | | | | | | | | | | | | | | | | | |
Total investment return (b) | | | 3.49 | %(c) | | | 6.69 | % | | | 2.67 | % | | | 9.26 | % | | | 22.84 | % | | | (16.67 | %) |
Ratios (to average net assets)/Supplemental Data: | | | | | | | | | | | | | | | | | | | | | | | | |
Net investment income (loss) | | | 4.17 | %†† | | | 4.14 | % | | | 3.94 | % | | | 3.87 | % | | | 3.97 | % | | | 5.33 | % |
Net expenses | | | 0.73 | %†† | | | 0.74 | % | | | 0.73 | % | | | 0.75 | % | | | 0.77 | % | | | 0.71 | % |
Portfolio turnover rate | | | 24 | % | | | 47 | % | | | 38 | % | | | 10 | % | | | 17 | % | | | 10 | % |
Net assets at end of period (in 000’s) | | $ | 648,925 | | | $ | 485,591 | | | $ | 374,973 | | | $ | 342,167 | | | $ | 212,257 | | | $ | 103,930 | |
| ‡ | Less than one cent per share. |
| (a) | The redemption fee was discontinued as of April 1, 2010. |
| (b) | Total investment return is calculated exclusive of sales charges and assumes the reinvestment of dividends. Class I shares are not subject to sales charges. |
| (c) | Total investment return is not annualized. |
| | | | | | |
The notes to the financial statements are an integral part of,
and should be read in conjunction with, the financial statements. | | mainstayinvestments.com | | | 27 | |
Notes to Financial Statements (Unaudited)
Note 1–Organization and Business
MainStay Funds Trust (the “Trust”) was organized as a Delaware statutory trust on April 28, 2009, and is governed by a Declaration of Trust. The Trust is registered under the Investment Company Act of 1940, as amended (the “1940 Act”), as an open-end investment management company, and is comprised of thirty-three funds (collectively referred to as the “Funds”). These financial statements and notes relate only to the MainStay Floating Rate Fund (the “Fund”), a diversified fund. The Fund is the successor of the MainStay Floating Rate Fund, a series of Eclipse Funds Inc. (the “Predecessor Fund”). The reorganization of the Predecessor Fund with and into the Fund occurred on February 26, 2010. All information and references to periods prior to February 26, 2010 relate to the Predecessor Fund.
The Fund currently offers five classes of shares. Class A, Class B, Class C and Class I shares commenced operations on May 3, 2004. Investor Class shares commenced operations on February 28, 2008. Investor Class and Class A shares are offered at net asset value (“NAV”) per share plus an initial sales charge. No sales charge applies to investments to $500,000 or more (and certain other qualified purchases) in Investor Class and Class A shares, but a contingent deferred sales charge (“CDSC”) is imposed on certain redemptions made within one year of the date of purchase. Class B and Class C shares are offered at NAV without an initial sales charge, although a declining CDSC may be imposed on redemptions made within four years of the date of purchase of Class B shares and a 1.00% CDSC may be imposed on redemptions made within one year of the date of purchase of Class C shares. Class I shares are offered at NAV and are not subject to a sales charge. Depending upon eligibility, Class B shares convert to Investor Class or Class A shares at the end of the calendar quarter four years after the date they were purchased. Additionally, depending upon eligibility, Investor Class shares may convert to Class A shares and Class A shares may convert to Investor Class shares. The five classes of shares have the same voting (except for issues that relate solely to one class), dividend, liquidation and other rights, and the same terms and conditions, except that Class B and Class C shares are subject to higher distribution and/or service fee rates than Investor Class and Class A shares under a distribution plan pursuant to Rule 12b-1 under the 1940 Act. Class I shares are not subject to a distribution and/or service fee.
The Fund’s investment objective is to seek high current income.
Note 2–Significant Accounting Policies
The Fund prepares its financial statements in accordance with generally accepted accounting principles (“GAAP”) in the United States of America and follows the significant accounting policies described below.
(A) Securities Valuation. Investments are valued as of the close of regular trading on the New York Stock Exchange (“Exchange”) (generally 4:00 p.m. Eastern time) on each day the Fund is open for business (“valuation date”).
The Board of Trustees (the “Board”) has adopted procedures for the valuation of the Fund’s securities and has delegated the responsibility for valuation determination under those procedures to the Valuation Committee of the Fund (the “Valuation Committee”). The Board has authorized the Valuation Committee to appoint a Valuation Sub-Committee (the “Sub-Committee”) to deal in the first instance with
questions that arise or cannot be resolved under these procedures. The Sub-Committee meets (in person, via electronic mail or via teleconference) on an as-needed basis. The Valuation Committee meets at a later time, as necessary, to ensure that actions taken by the Sub-Committee were appropriate. The procedures recognize that, subject to the oversight of the Board and unless otherwise noted, the responsibility for day-to-day valuation of portfolio assets (including securities for which market prices are not readily available) rests with New York Life Investment Management LLC (“New York Life Investments” or the “Manager”).
To assess the appropriateness of security valuations, the Manager or the Fund’s third party service provider who is subject to oversight by the Manager, regularly compares prior day prices, prices on comparable securities and the sale prices to the prior and current day prices and challenges prices exceeding certain tolerance levels with third party pricing services or broker sources. For those securities valued by recommendation, whether through a standardized fair valuation methodology or a fair valuation determination, the Valuation Committee reviews and affirms the reasonableness of the valuation based on such methodologies and determinations on a regular basis after considering all relevant information that is reasonably available.
“Fair value” is defined as the price that the Fund would receive upon selling an investment in an orderly transaction to an independent buyer in the principal or most advantageous market of the investment. Fair value measurements are determined within a framework that has established a three-tier hierarchy which maximizes the use of observable market data and minimizes the use of unobservable inputs to establish classification of fair value measurements for disclosure purposes. “Inputs” refers broadly to the assumptions that market participants would use in pricing the asset or liability, including assumptions about risk, such as the risk inherent in a particular valuation technique used to measure fair value using a pricing model and/or the risk inherent in the inputs for the valuation technique. Inputs may be observable or unobservable. Observable inputs reflect the assumptions market participants would use in pricing the asset or liability based on market data obtained from sources independent of the Fund. Unobservable inputs reflect the Fund’s own assumptions about the assumptions market participants would use in pricing the asset or liability developed based on the information available in the circumstances. The inputs or methodology used for valuing securities may not be an indication of the risks associated with investing in those securities. The three-tier hierarchy of inputs is summarized in the three broad Levels listed below.
| • | | Level 1—quoted prices in active markets for identical investments |
| • | | Level 2—other significant observable inputs (including quoted prices for similar investments in active markets, interest rates and yield curves, prepayment speeds, credit risks, etc.) |
| • | | Level 3—significant unobservable inputs (including the Fund’s own assumptions about the assumptions that market participants would use in determining the fair value of investments) |
The aggregate value by input level, as of April 30, 2013, for the Fund’s investments is included at the end of the Fund’s Portfolio of Investments.
| | |
| 28 | | MainStay Floating Rate Fund |
The valuation techniques used by the Fund to measure fair value maximize the use of observable inputs and minimize the use of unobservable inputs. The Fund may utilize third party vendor evaluations, whose prices may be derived from one or more of the following standard inputs:
| | |
• Benchmark Yields | | • Reported Trades |
• Broker Dealer Quotes | | • Issuer Spreads |
• Two-sided markets | | • Benchmark securities |
• Bids/Offers | | • Reference Data (corporate actions or material event notices) |
• Industry and economic events | | • Comparable bonds |
• Equity and credit default swap curves | | • Monthly payment information |
Securities for which market values cannot be determined using the methodologies described above are valued by methods deemed in good faith by the Fund’s Valuation Committee, following the procedures established by the Board, to represent fair value. Under these procedures, the Fund primarily employs a market-based approach which may use related or comparable assets or liabilities, recent transactions, market multiples, book values, and other relevant information. The Fund may also use an income-based valuation approach in which the anticipated future cash flows of the investment are discounted to calculate fair value. Discounts may also be applied due to the nature or duration of any restrictions on the disposition of the investments. Due to the inherent uncertainty of valuations of such investments, the fair values may differ significantly from the values that would have been used had an active market existed. For the six-month period ended April 30, 2013, there have been no changes to the fair value methodologies.
Equity and non-equity securities which may be valued in this manner include, but are not limited to: (i) a security for which the trading has been halted or suspended; (ii) a debt security that has recently gone into default and for which there is not a current market quotation; (iii) a security of an issuer that has entered into a restructuring; (iv) a security that has been de-listed from a national exchange; (v) a security for which the market price is not available from a third party pricing source or, if so provided, does not, in the opinion of the Fund’s Manager reflect the security’s market value; and (vi) a security whose principal market has been temporarily closed at a time when, under normal conditions, it would be open. Securities for which market quotations or observable inputs are not readily available are generally categorized as Level 3 in the hierarchy. As of April 30, 2013, the Fund held a security with a value of $250,271 that was fair valued in such a manner.
Equity securities and Exchange Traded Funds are valued at the latest quoted sales prices as of the close of regular trading on the Exchange on each valuation date. Securities that are not traded on the valuation date are valued at the mean of the latest quoted bid and ask prices. Prices normally are taken from the principal market in which each security trades. These securities are generally categorized as Level 1 in the hierarchy.
Debt securities (other than convertible bonds and municipal debt securities) are valued at the evaluated bid prices (evaluated mean prices in the case of convertible bonds and municipal debt securities) supplied by a pricing agent or broker selected by the Fund’s Manager whose prices reflect broker/dealer supplied valuations and electronic data processing
techniques, if such prices are deemed by the Fund’s Manager to be representative of market values, at the regular close of trading of the Exchange on each valuation date. Debt securities, including corporate bonds, U.S. government and federal agency bonds, municipal bonds, foreign bonds, Yankee bonds, convertible bonds, asset-backed securities and mortgage-backed securities are generally categorized as Level 2 in the hierarchy.
Temporary cash investments acquired over 60 days to maturity are valued using the latest bid prices or using valuations based on a matrix system (which considers such factors as security prices, yields, maturities, and ratings), both as furnished by independent pricing services. Other temporary cash investments which mature in 60 days or less (“Short-Term Investments”) are valued at amortized cost. The amortized cost method involves valuing a security at its cost on the date of purchase and thereafter assuming a constant amortization to maturity of the difference between such cost and the value on maturity date. Amortized cost approximates the current fair value of a security. Securities valued at amortized cost are not valued using a quoted price in an active market. These securities are generally categorized as Level 2 in the hierarchy.
Loan assignments, participations and commitments are valued at the average of bid quotations obtained from the engaged independent pricing service and are generally categorized as Level 2 in the hierarchy. Certain loan assignments, participations and commitments may be valued by single broker quotes obtained from the engaged independent pricing service with significant unobservable inputs and are generally categorized as Level 3 in the hierarchy. For these loan assignments, participations and commitments the Manager may consider additional factors such as liquidity of the Fund’s investments. For these loan assignments, participations and commitments, the Manager may consider additional factors such as liquidity of the Fund’s investments. As of April 30, 2013, the Fund held securities with a value of $55,430,372 that were valued by a single broker quote and/or deemed to be illiquid.
The valuation techniques and significant amounts of unobservable inputs used in the fair valuation measurement of the Fund’s Level 3 securities are outlined in the tables below. A significant increase or decrease in any of those inputs in isolation would result in a significantly higher or lower fair value measurement.
| | | | | | | | | | | | | | |
Asset
Class | | Fair Value
at 4/30/13 | | | Valuation
Technique | | Unobservable
Inputs | | | Range | |
Floating Rate Loans (18 positions) | | $ | 55,430,372 | | | Market Approach | | | Offered Quotes | | | $
$ | 98.00-
102.00 |
|
Common Stock (1 position) | | | 250,271 | | | Income Approach | |
| Estimated
Remaining Value |
| | $ | 92.5 M | |
| | | | | | | | | | | | | | |
| | $ | 55,680,643 | | | | | | | | | | | |
| | | | | | | | | | | | | | |
Generally, a security is considered illiquid if it cannot be sold or disposed of in the ordinary course of business at approximately the price at which it is valued. Its illiquidity might prevent the sale of such security at a time when the Manager might wish to sell, and these securities could have the effect of decreasing the overall level of the Fund’s liquidity. Further, the lack of an established secondary market may make it more
| | | | |
| mainstayinvestments.com | | | 29 | |
Notes to Financial Statements (Unaudited) (continued)
difficult to value illiquid securities, requiring the Fund to rely on judgments that may be somewhat subjective in determining value, which could vary from the amount that the Fund could realize upon disposition. Difficulty in selling illiquid securities may result in a loss or may be costly to the Fund. Under the supervision of the Board, the Manager determines the liquidity of the Fund’s investments; in doing so, the Manager may consider various factors, including (i) the frequency of trades and quotations, (ii) the number of dealers and prospective purchasers, (iii) dealer undertakings to make a market, and (iv) the nature of the security and the market in which it trades (e.g., the time needed to dispose of the security, the method of soliciting offers and the mechanics of transfer). Illiquid securities generally will be valued in good faith in such a manner as the Board deems appropriate to reflect their fair value.
(B) Income Taxes. The Fund’s policy is to comply with the requirements of the Internal Revenue Code of 1986, as amended (the “Internal Revenue Code”), applicable to regulated investment companies and to distribute all of the taxable income to the shareholders of the Fund within the allowable time limits. Therefore, no federal, state and local income tax provision is required.
Management evaluates its tax positions to determine if the tax positions taken meet the minimum recognition threshold in connection with accounting for uncertainties in income tax positions taken or expected to be taken for the purposes of measuring and recognizing tax liabilities in the financial statements. Recognition of tax benefits of an uncertain tax position is required only when the position is “more likely than not” to be sustained assuming examination by taxing authorities. Management has analyzed the Fund’s tax positions taken on federal, state and local income tax returns for all open tax years (for up to three tax years), and has concluded that no provision for federal, state and local income tax is required in the Fund’s financial statements. The Fund’s federal, state and local income and federal excise tax returns for tax years for which the applicable statutes of limitations have not expired are subject to examination by the Internal Revenue Service and state and local departments of revenue.
(C) Dividends and Distributions to Shareholders. Dividends and distributions are recorded on the ex-dividend date. The Fund intends to declare dividends of net investment income, if any, at least daily and intends to pay them at least monthly and intends to declare and pay distributions of net realized capital gains, if any, at least annually. Unless the shareholder elects otherwise, all dividends and distributions are reinvested in the same class of shares of the Fund, at NAV. Dividends and distributions to shareholders are determined in accordance with federal income tax regulations and may differ from GAAP.
(D) Security Transactions and Investment Income. The Fund records security transactions on the trade date. Realized gains and losses on security transactions are determined using the identified cost method. Dividend income is recognized on the ex-dividend date and interest income is accrued as earned using the effective interest rate method. Dividends and distributions received by the Fund from the Underlying Funds are recorded on the ex-dividend date. Discounts and premiums on Short-Term Investments are accreted and amortized, respectively, on the straight-line method.
Investment income and realized and unrealized gains and losses on investments of the Fund are allocated to separate classes of shares pro rata based upon their relative net assets on the date the income is earned or realized and unrealized gains and losses are incurred.
(E) Expenses. Expenses of the Trust are allocated to the individual Funds in proportion to the net assets of the respective Funds when the expenses are incurred, except where direct allocations of expenses can be made. Expenses (other than transfer agent expenses and fees incurred under the shareholder services plans and the distribution plans further discussed in Note 3(B)) are allocated to separate classes of shares pro rata based upon their relative net assets on the date the expenses are incurred. The expenses borne by the Fund, including those of related parties to the Fund, are shown in the Statement of Operations.
(F) Use of Estimates. In preparing financial statements in conformity with GAAP, management makes estimates and assumptions that affect the reported amounts and disclosures in the financial statements. Actual results could differ from those estimates.
(G) Repurchase Agreements. The Fund may enter into repurchase agreements to earn income. The Fund may enter into repurchase agreements only with financial institutions that are deemed by the Manager to be creditworthy, pursuant to guidelines established by the Fund’s Board. During the term of any repurchase agreement, the Manager will continue to monitor the creditworthiness of the seller. Under the 1940 Act, repurchase agreements are considered to be collateralized loans by a Fund to the seller secured by the securities transferred to the Fund.
When the Fund invests in repurchase agreements, the Fund’s custodian takes possession of the collateral pledged for investments in the repurchase agreement. The underlying collateral is valued daily on a mark-to-market basis to determine that the value, including accrued interest, exceeds the repurchase price. In the event of the seller’s default on the obligation to repurchase, the Fund has the right to liquidate the collateral and apply the proceeds in satisfaction of the obligation. Under certain circumstances, such as in the event of default or bankruptcy by the counterparty to the agreement, realization and/or retention of the collateral may be subject to legal proceedings and possible realized loss to the Fund.
(H) Loan Assignments, Participations and Commitments. The Fund invests in loan assignments and loan participations (“loans”). Loans are agreements to make money available (a “commitment”) to a borrower in a specified amount, at a specified rate and within a specified time. Such loans are typically senior, secured and collateralized in nature. The Fund records an investment when the borrower withdraws money and records interest as earned. These loans pay interest at rates that are periodically reset by reference to a base lending rate plus a spread. These base lending rates are generally the prime rate offered by a designated U.S. bank or the London InterBank Offered Rate.
The loans in which the Fund invests are generally readily marketable, but may be subject to some restrictions on resale. For example, the Fund may be contractually obligated to receive approval from the agent bank and/or borrower prior to the sale of these investments. The Fund assumes the credit risk of the borrower, the selling participant and any other persons interpositioned between the Fund and the borrower
| | |
| 30 | | MainStay Floating Rate Fund |
(“intermediate participants”). In the event that the borrower, selling participant or intermediate participants become insolvent or enters into bankruptcy, the Fund may incur certain costs and delays in realizing payment, or may suffer a loss of principal and/or interest.
Unfunded commitments represent the remaining obligation of the Fund to the borrower. At any point in time, up to the maturity date of the issue, the borrower may demand the unfunded portion. These unfunded amounts are marked to market and any unrealized gains and losses are recorded in the Statement of Assets and Liabilities. (See Note 5)
(I) Securities Lending. In order to realize additional income, the Fund may engage in securities lending, subject to the limitations set forth in the 1940 Act and relevant guidance by the staff of the Securities and Exchange Commission. In the event the Fund does engage in securities lending, the Fund will lend through its custodian, State Street Bank and Trust Company (“State Street”). State Street will manage the Fund’s cash collateral in accordance with the lending agreement between the Fund and State Street, and indemnify the Fund’s portfolio against counterparty risk. The loans will be collateralized by cash or securities at least equal at all times to the market value of the securities loaned. Collateral will consist of U.S. Government securities, cash equivalents or irrevocable letters of credit. The Fund may bear the risk of delay in recovery of, or loss of rights in, the securities loaned should the borrower of the securities experience financial difficulty. The Fund may also record realized gain or loss on securities deemed sold due to a borrower’s inability to return securities on loan. The Fund will receive compensation for lending its securities in the form of fees or the retention of a portion of the interest on the investment of any cash received as collateral. The Fund also will continue to receive interest and dividends on the securities loaned and any gain or loss in the market price of the securities loaned that may occur during the term of the loan will be for the account of the Fund.
Although the Fund and New York Life Investments have temporarily suspended securities lending, the Fund and New York Life Investments reserve the right to reinstitute lending when deemed appropriate. The Fund did not have any portfolio securities on loan as of April 30, 2013.
(J) Concentration of Risk. The ability of issuers of debt securities held by the Fund to meet their obligations may be affected by economic or political developments in a specific country, industry or region.
The Fund’s principal investments include floating rate loans, which are usually rated below investment grade and are generally considered speculative because they present a greater risk of loss, including default, than higher rated debt securities. These securities pay investors a higher interest rate because of the increased risk of loss. Although certain floating rate loans are collateralized, there is no guarantee that the value of the collateral will be sufficient to repay the loan. In a recession or serious credit event, the Fund’s NAV could go down and you could lose money.
(K) Indemnifications. Under the Trust’s organizational documents, its officers and trustees are indemnified against certain liabilities that may arise out of performance of their duties to the Trust. Additionally, in the normal course of business, the Fund enters into contracts with third-party service providers that contain a variety of representations and warranties and which may provide general indemnifications. The Fund’s maximum exposure under these arrangements is unknown, as this would involve future claims that may be made against the Fund that
have not yet occurred. Based on experience, management is of the view that the risk of loss in connection with these potential indemnification obligations is remote. However, there can be no assurance that material liabilities related to such obligations will not arise in the future, which could adversely impact the Fund.
Note 3–Fees and Related Party Transactions
(A) Manager. New York Life Investments, a registered investment adviser and an indirect, wholly-owned subsidiary of New York Life Insurance Company (“New York Life”), serves as the Fund’s Manager, pursuant to an Amended and Restated Management Agreement (“Management Agreement”). The Manager provides offices, conducts clerical, recordkeeping and bookkeeping services, and keeps most of the financial and accounting records required to be maintained by the Fund. Except for the portion of salaries and expenses that are the responsibility of the Fund, the Manager pays the salaries and expenses of all personnel affiliated with the Fund and certain operational expenses of the Fund. The Fund reimburses New York Life Investments in an amount equal to a portion of the salary of the Chief Compliance Officer (“CCO”) of the Fund. New York Life Investments is responsible for the day-to-day portfolio management of the Fund.
The Fund pays the Manager a monthly fee for services performed and facilities furnished at an annual rate of the Fund’s average daily net assets as follows: 0.60% up to $1 billion; 0.575% from $1 billion to $3 billion; and 0.565% in excess of $3 billion. The effective management fee rate was 0.60% for the six-month period ended April 30, 2013.
For the six-month period ended April 30, 2013, New York Life Investments earned fees from the Fund in the amount of $3,497,916.
State Street Bank, 1 Lincoln Street, Boston, Massachusetts 02111, provides sub-administration and sub-accounting services to the Fund pursuant to an agreement with New York Life Investments. These services include calculating the daily NAVs of the Fund, maintaining the general ledger and sub-ledger accounts for the calculation of the Fund’s respective NAVs, and assisting New York Life Investments in conducting various aspects of the Fund’s administrative operations. For providing these services to the Fund, State Street is compensated by New York Life Investments.
(B) Distribution and Service Fees. The Trust, on behalf of the Fund, has entered into a distribution agreement with NYLIFE Distributors LLC (the ‘‘Distributor’’), an indirect, wholly-owned subsidiary of New York Life. The Fund has adopted distribution plans (the ‘‘Plans’’) in accordance with the provisions of Rule 12b-1 under the 1940 Act.
Pursuant to the Investor Class and Class A Plans, the Distributor receives a monthly distribution fee from the Investor Class and Class A shares at an annual rate of 0.25% of the average daily net assets of the Investor Class and Class A shares for distribution and/or service activities as designated by the Distributor. Pursuant to the Class B and Class C Plans, Class B and Class C shares pay the Distributor a monthly distribution fee at an annual rate of 0.75% of the average daily net assets of the Class B and Class C shares along with a service fee at an annual rate of 0.25% of the average daily net assets of the Class B and Class C shares, for a total 12b-1 fee of 1.00%. Class I shares are not subject to a distribution and/or service fee.
| | | | |
| mainstayinvestments.com | | | 31 | |
Notes to Financial Statements (Unaudited) (continued)
The Plans provide that the distribution and service fees are payable to the Distributor regardless of the amounts actually expended by the Distributor for distribution of the Fund’s shares and service activities.
(C) Sales Charges. The Fund was advised by the Distributor that the amount of sales charges retained on sales of Investor Class and Class A shares were $7,851 and $51,607, respectively, for the six-month period ended April 30, 2013. The Fund was also advised that the Distributor retained CDSCs on redemptions of Investor Class, Class B and Class C shares of $30, $9,527 and $8,543, respectively, for the six-month period ended April 30, 2013.
(D) Transfer, Dividend Disbursing and Shareholder Servicing Agent. NYLIM Service Company LLC, an affiliate of New York Life Investments, is the Fund’s transfer, dividend disbursing and shareholder servicing agent pursuant to an agreement between NYLIM Service Company LLC and the Trust. NYLIM Service Company LLC has entered into an agreement with Boston Financial Data Services, Inc. (“BFDS”) pursuant to which BFDS performs certain transfer agent services on behalf of NYLIM Service Company LLC. Transfer agent expenses incurred by the Fund for the six-month period ended April 30, 2013, were as follows:
| | | | |
Investor Class | | $ | 21,497 | |
Class A | | | 199,270 | |
Class B | | | 9,414 | |
Class C | | | 153,431 | |
Class I | | | 268,383 | |
(E) Small Account Fee. Shareholders with small accounts adversely impact the cost of providing transfer agency services. In an effort to reduce total transfer agency expenses, the Fund has implemented a small account fee on certain types of accounts. Certain shareholders with an account balance of less than $1,000 are charged an annual per account fee of $20 (assessed semi-annually), the proceeds from which offset transfer agent fees as reflected in the Statement of Operations.
(F) Capital. As of April 30, 2013, New York Life and its affiliates beneficially held shares of the Fund with values and percentages of net assets as follows:
Note 4–Federal Income Tax
Under the Regulated Investment Company Modernization Act of 2010, the Fund is permitted to carry forward capital losses incurred in taxable years beginning after December 22, 2010, for an unlimited period. However, any losses incurred during those future years will be required to be utilized prior to the losses incurred in pre-enactment tax years. As a result of this ordering rule, pre-enactment capital loss carryforwards may be more likely to expire unused. Additionally, post-enactment capital losses that are carried forward will retain their character as either short-term or long-term capital losses rather than being considered all short-term as under previous law.
As of October 31, 2012, for federal income tax purposes, capital loss carryforwards of $65,030,876 were available as shown in the table
below, to the extent provided by the regulations to offset future realized gains of the Fund through the years indicated. To the extent that these capital loss carryforwards are used to offset future capital gains, it is probable that the capital gains so offset will not be distributed to shareholders. No capital gain distributions shall be made until any capital loss carryforwards have been fully utilized or expired.
| | | | | | | | |
Capital Loss
Available Through | | Short-Term
Capital Loss
Amounts (000’s) | | | Long-Term
Capital Loss
Amounts (000’s) | |
| 2013 | | $ | 3,166 | | | $ | — | |
| 2014 | | | 1,436 | | | | — | |
| 2015 | | | 14,042 | | | | — | |
| 2016 | | | 30,853 | | | | — | |
| 2017 | | | 7,484 | | | | — | |
| 2018 | | | 2,022 | | | | — | |
| 2019 | | | 3,796 | | | | — | |
| Unlimited | | | 2,232 | | | | 995 | |
| Total | | $ | 65,031 | | | $ | 995 | |
The tax character of distributions paid during the year ended October 31, 2012, shown in the Statements of Changes in Net Assets was as follows:
| | | | |
| | | 2012 | |
Distributions paid from:
Ordinary Income | | $ | 40,587,312 | |
Note 5–Commitments and Contingencies
As of April 30, 2013, the Fund held unfunded commitments pursuant to the following loan agreements:
| | | | | | | | |
Borrower | | Unfunded
Commitment | | | Unrealized
Appreciation | |
Leslie’s Poolmart, Inc. | | | | | | | | |
New Term Loan B due 10/16/19 | | $ | 91,277 | | | $ | 900 | |
Syniverse Holdings, Inc. | | | | | | | | |
Term Loan due 4/23/19 | | | 3,000,000 | | | | 11,250 | |
| | | | | | | | |
Total | | $ | 3,091,277 | | | $ | 12,150 | |
| | | | |
Commitments are available until maturity date.
Note 6–Custodian
State Street is the custodian of the cash and the securities of the Fund. Custodial fees are charged to the Fund based on the market value of securities in the Fund and the number of certain cash transactions incurred by the Fund.
Note 7–Line of Credit
The Fund and certain affiliated funds maintain a line of credit with a syndicate of banks in order to secure a source of funds for temporary purposes to meet unanticipated or excessive redemption requests.
Effective August 29, 2012, under a second amended and restated credit agreement (the “Credit Agreement”), the aggregate commitment amount is $200,000,000 with an optional maximum amount of $250,000,000. The commitment fee is an annual rate of 0.08% of the
| | |
| 32 | | MainStay Floating Rate Fund |
average commitment amount payable quarterly, regardless of usage, to Bank of New York Mellon, which serves as the agent to the syndicate. The commitment fee is allocated among the Fund and certain affiliated funds based upon net assets and other factors. Interest on any revolving credit loan is charged based upon the Federal Funds Advances rate or the one month London InterBank Offered Rate, whichever is higher. The Credit Agreement expires on August 28, 2013, although the Fund, certain affiliated funds and the syndicate of banks may renew the Credit Agreement for an additional year on the same or different terms. There were no borrowings made or outstanding with respect to the Fund on the Credit Agreement during the six-month period ended April 30, 2013.
Note 8–Purchases and Sales of Securities (in 000’s)
During the six-month period ended April 30, 2013, purchases and sales of securities, other than short-term securities, were $453,486 and $271,316, respectively.
Note 9–Capital Share Transactions
| | | | | | | | |
Investor Class | | Shares | | | Amount | |
| | | | | | | | |
Six-month period ended April 30, 2013: | | | | | | | | |
Shares sold | | | 428,066 | | | $ | 4,108,008 | |
Shares issued to shareholders in reinvestment of dividends | | | 51,588 | | | | 495,242 | |
Shares redeemed | | | (312,442 | ) | | | (2,997,368 | ) |
| | | | |
Net increase (decrease) in shares outstanding before conversion | | | 167,212 | | | | 1,605,882 | |
Shares converted into Investor Class (See Note 1) | | | 98,507 | | | | 946,508 | |
Shares converted from Investor Class (See Note 1) | | | (144,480 | ) | | | (1,386,761 | ) |
| | | | |
Net increase (decrease) | | | 121,239 | | | $ | 1,165,629 | |
| | | | |
Year ended October 31, 2012: | | | | | | | | |
Shares sold | | | 462,147 | | | $ | 4,353,923 | |
Shares issued to shareholders in reinvestment of dividends | | | 100,915 | | | | 950,351 | |
Shares redeemed | | | (524,249 | ) | | | (4,930,307 | ) |
| | | | |
Net increase (decrease) in shares outstanding before conversion | | | 38,813 | | | | 373,967 | |
Shares converted into Investor Class (See Note 1) | | | 225,892 | | | | 2,129,287 | |
Shares converted from Investor Class (See Note 1) | | | (294,951 | ) | | | (2,781,371 | ) |
| | | | |
Net increase (decrease) | | | (30,246 | ) | | $ | (278,117 | ) |
| | | | |
| | | | | | | | |
Class A | | Shares | | | Amount | |
| | | | | | | | |
Six-month period ended April 30, 2013: | | | | | | | | |
Shares sold | | | 9,901,929 | | | $ | 95,025,837 | |
Shares issued to shareholders in reinvestment of dividends | | | 657,324 | | | | 6,310,977 | |
Shares redeemed | | | (6,023,550 | ) | | | (57,768,819 | ) |
| | | | |
Net increase (decrease) in shares outstanding before conversion | | | 4,535,703 | | | | 43,567,995 | |
Shares converted into Class A (See Note 1) | | | 174,770 | | | | 1,677,169 | |
Shares converted from Class A (See Note 1) | | | (50,182 | ) | | | (483,255 | ) |
| | | | |
Net increase (decrease) | | | 4,660,291 | | | $ | 44,761,909 | |
| | | | |
Year ended October 31, 2012: | | | | | | | | |
Shares sold | | | 11,869,473 | | | $ | 111,850,091 | |
Shares issued to shareholders in reinvestment of dividends | | | 1,276,176 | | | | 12,013,913 | |
Shares redeemed | | | (21,784,353 | ) | | | (205,010,217 | ) |
| | | | | | | | |
Net increase (decrease) in shares outstanding before conversion | | | (8,638,704 | ) | | | (81,146,213 | ) |
Shares converted into Class A (See Note 1) | | | 419,124 | | | | 3,944,774 | |
Shares converted from Class A (See Note 1) | | | (105,345 | ) | | | (999,687 | ) |
| | | | |
Net increase (decrease) | | | (8,324,925 | ) | | $ | (78,201,126 | ) |
| | | | |
|
| |
Class B | | Shares | | | Amount | |
| | | | | | | | |
Six-month period ended April 30, 2013: | | | | | | | | |
Shares sold | | | 213,884 | | | $ | 2,056,572 | |
Shares issued to shareholders in reinvestment of dividends | | | 14,315 | | | | 137,528 | |
Shares redeemed | | | (157,474 | ) | | | (1,508,620 | ) |
| | | | |
Net increase (decrease) in shares outstanding before conversion | | | 70,725 | | | | 685,480 | |
Shares converted from Class B (See Note 1) | | | (78,534 | ) | | | (753,661 | ) |
| | | | |
Net increase (decrease) | | | (7,809 | ) | | $ | (68,181 | ) |
| | | | |
Year ended October 31, 2012: | | | | | | | | |
Shares sold | | | 205,344 | | | $ | 1,937,257 | |
Shares issued to shareholders in reinvestment of dividends | | | 32,049 | | | | 301,897 | |
Shares redeemed | | | (276,357 | ) | | | (2,598,530 | ) |
| | | | |
Net increase (decrease) in shares outstanding before conversion | | | (38,964 | ) | | | (359,376 | ) |
Shares converted from Class B (See Note 1) | | | (244,512 | ) | | | (2,293,003 | ) |
| | | | |
Net increase (decrease) | | | (283,476 | ) | | $ | (2,652,379 | ) |
| | | | |
|
| |
Class C | | Shares | | | Amount | |
| | | | | | | | |
Six-month period ended April 30, 2013: | | | | | | | | |
Shares sold | | | 2,841,064 | | | $ | 27,282,864 | |
Shares issued to shareholders in reinvestment of dividends | | | 239,104 | | | | 2,296,999 | |
Shares redeemed | | | (1,934,967 | ) | | | (18,566,801 | ) |
| | | | |
Net increase (decrease) | | | 1,145,201 | | | $ | 11,013,062 | |
| | | | |
Year ended October 31, 2012: | | | | | | | | |
Shares sold | | | 3,184,357 | | | $ | 30,038,594 | |
Shares issued to shareholders in reinvestment of dividends | | | 436,245 | | | | 4,109,928 | |
Shares redeemed | | | (5,130,659 | ) | | | (48,226,958 | ) |
| | | | |
Net increase (decrease) | | | (1,510,057 | ) | | $ | (14,078,436 | ) |
| | | | |
| | | | |
| mainstayinvestments.com | | | 33 | |
Notes to Financial Statements (Unaudited) (continued)
| | | | | | | | |
Class I | | Shares | | | Amount | |
| | | | | | | | |
Six-month period ended April 30, 2013: | | | | | | | | |
Shares sold | | | 24,545,063 | | | $ | 235,645,215 | |
Shares issued to shareholders in reinvestment of dividends | | | 1,005,595 | | | | 9,659,618 | |
Shares redeemed | | | (9,333,385 | ) | | | (89,409,978 | ) |
| | | | |
Net increase (decrease) | | | 16,217,273 | | | $ | 155,894,855 | |
| | | | |
Year ended October 31, 2012: | | | | | | | | |
Shares sold | | | 28,019,165 | | | $ | 264,283,730 | |
Shares issued to shareholders in reinvestment of dividends | | | 1,488,533 | | | | 14,027,913 | |
Shares redeemed | | | (18,851,395 | ) | | | (176,844,092 | ) |
| | | | |
Net increase (decrease) | | | 10,656,303 | | | $ | 101,467,551 | |
| | | | |
Note 10–Subsequent Events
In connection with the preparation of the financial statements of the Fund as of and for the six-month period ended April 30, 2013, events and transactions subsequent to April 30, 2013, through the date the financial statements were issued have been evaluated by the Fund’s management for possible adjustment and/or disclosure. No subsequent events requiring financial statement adjustment or disclosure have been identified.
| | |
| 34 | | MainStay Floating Rate Fund |
Board Consideration and Approval of Management Agreement (Unaudited)
Section 15(c) of the Investment Company Act of 1940, as amended (the “1940 Act”) requires that each mutual fund’s board of trustees, including a majority of the independent trustees, annually review and approve the fund’s investment advisory agreements. At its December 10-12, 2012 meeting, the Board of Trustees of the MainStay Group of Funds (“Board”) unanimously approved the Management Agreement with respect to the MainStay Floating Rate Fund (“Fund”) and New York Life Investment Management LLC (“New York Life Investments”).
In reaching its decision to approve the Agreement, the Board considered information furnished by New York Life Investments in connection with a contract review process that took place at various meetings of the Board and its Contracts Committee between September 2012 and December 2012, as well as other relevant information furnished to the Board throughout the year by New York Life Investments. Information requested by and furnished to the Board in connection with the contract review process included, among other items, reports on the Fund prepared by Strategic Insight Mutual Fund Research and Consulting, LLC (“Strategic Insight”), an independent third-party service provider engaged by the Board to report objectively on the Fund’s investment performance, management fees and ordinary operating expenses. The Board also considered information provided by New York Life Investments on the fees charged to other investment advisory clients (including institutional separate accounts) that follow investment strategies similar to the Fund, and the rationale for any differences in the Fund’s management fee and the fees charged to those other investment advisory clients. In addition, the Board requested and received information on the profitability of the Fund to New York Life Investments and its affiliates and responses from New York Life Investments to a series of questions encompassing a variety of topics prepared on behalf of the Board by independent legal counsel to the Board and its independent trustees (the “Independent Trustees”). Information provided to the Board at its meetings throughout the year included, among other items, detailed investment performance reports on the Fund prepared by the Investment Consulting Group at New York Life Investments. The structure and format for this regular reporting was developed in consultation with the Board. The Board also received from New York Life Investments throughout the year, among other items, periodic reports on legal and compliance matters, portfolio turnover, and sales and marketing activity.
In determining to approve the Agreement, the members of the Board reviewed and evaluated all of the information and factors they believed to be relevant and appropriate in light of legal advice furnished to them by independent legal counsel and through the exercise of their own business judgment. The broad factors considered by the Board are discussed in greater detail below, and included, among other items: (i) the nature, scope and quality of the services provided to the Fund by New York Life Investments; (ii) the investment performance of the Fund and New York Life Investments; (iii) the costs of the services provided, and profits realized, by New York Life Investments from its relationship with the Fund; (iv) the extent to which economies of scale may be realized as the Fund grows, and the extent to which economies of scale may benefit Fund investors; and (v) the reasonableness of the Fund’s management fee and overall total ordinary operating expenses, particularly as compared to similar funds and accounts managed by New York Life Investments and third-party “peer funds” identified by Strategic Insight.
While individual members of the Board may have weighed certain factors differently, the Board’s decision to approve the Agreement was based on a consideration of all the information provided to the Board, including information provided to the Board throughout the year and specifically in connection with the contract review process. The Board’s conclusions with respect to the Agreement also were based, in part, on the Board’s consideration of the Agreement in prior years. In addition to considering the above-referenced factors, the Board observed that in the marketplace there are a range of investment options available to shareholders of the Fund, and that the Fund’s shareholders, having had the opportunity to consider other investment options, have chosen to invest in the Fund. A more detailed discussion of the factors that figured prominently in the Board’s decisions to approve the Agreement is provided below.
Nature, Scope and Quality of Services to Be Provided by New York Life Investments
The Board examined the nature, scope and quality of the services that New York Life Investments provides to the Fund. The Board evaluated New York Life Investments’ experience in serving as manager of the Fund, noting that New York Life Investments manages other mutual funds, serves a variety of other investment advisory clients, including other pooled investment vehicles, and has experience with overseeing mutual fund service providers. The Board considered the experience of senior personnel at New York Life Investments providing management and administrative services to the Fund, as well as New York Life Investments’ reputation and financial condition. The Board also considered the full range of non-advisory services that New York Life Investments supplies to the Fund under the terms of the Agreement, including: (i) fund accounting services provided by New York Life Investments’ Fund Accounting and Administration Group; (ii) investment oversight and analytical services provided by New York Life Investments’ Investment Consulting Group; (iii) compliance services provided by New York Life Investments’ compliance department, including oversight and implementation of the Fund’s compliance program; and (iv) legal services provided by New York Life Investments’ Office of the General Counsel. Additional information about the non-advisory services provided by New York Life Investments is set forth in the Agreement. The Board also considered New York Life Investments’ willingness to invest in personnel that benefit the Fund, and noted that New York Life Investments is responsible for compensating the Fund’s officers. The Board also considered benefits to shareholders of being part of the MainStay Group of Funds, including the privilege of exchanging investments between the same class of shares without the imposition of a sales charge, as described more fully in the Fund’s prospectus.
The Board also examined the nature, scope and quality of the advisory services that New York Life Investments provides to the Fund. The Board evaluated New York Life Investments’ experience in serving as investment adviser to the Fund and managing other portfolios. It examined New York Life Investments’ track record and experience in providing investment advisory services, the experience of investment advisory, senior management and administrative personnel at New York Life Investments, and New York Life Investments’ overall legal and compliance environment. The Board also reviewed New York Life Investments’ willingness to invest in personnel that benefit the Fund. In
| | | | |
| mainstayinvestments.com | | | 35 | |
Board Consideration and Approval of Management Agreement (Unaudited) (continued)
this regard, the Board considered the experience of the Fund’s portfolio managers, the number of accounts managed by the portfolio managers and the method for compensating portfolio managers.
Based on these considerations, the Board concluded, within the context of its overall determinations regarding the Agreement, that the Fund should continue to benefit from the nature, scope and quality of these services as a result of New York Life Investments’ experience, personnel, operations and resources.
Investment Performance
In evaluating the Fund’s investment performance, the Board considered investment performance results in light of the Fund’s investment objective, strategies and risks, as disclosed in the Fund’s prospectus. The Board particularly considered detailed investment reports on the Fund’s performance provided to the Board throughout the year by the Investment Consulting Group of New York Life Investments. These reports include, among other items, information on the Fund’s gross and net returns, the Fund’s investment performance relative to relevant investment categories and Fund benchmarks, the Fund’s risk-adjusted investment performance, and the Fund’s investment performance as compared to similar competitor funds, as appropriate. The Board also considered information provided by Strategic Insight showing the investment performance of the Fund as compared to peer funds.
In considering the Fund’s investment performance, the Board focused principally on the Fund’s long-term performance track record. The Board also gave weight to its ongoing discussions with senior management at New York Life Investments concerning the Fund’s investment performance, as well as discussions between the Fund’s portfolio managers and the Board that occur typically on an annual basis. In addition, the Board considered any specific actions that New York Life Investments had taken, or had agreed with the Board to take, to enhance Fund investment performance, and the results of those actions. The Board noted that although the Fund’s investment performance over the prior one- and three-year periods was below that of peer funds, the Fund has been managed in a more conservative manner than many of its peers for floating rate bonds.
Based on these considerations, the Board concluded, within the context of its overall determinations regarding the Agreement, that the long-term investment performance of the Fund, along with ongoing efforts by New York Life Investments to enhance investment returns, supported a determination to approve the Agreement. The Fund discloses more information about investment performance in the Portfolio Management Discussion and Analysis, Investment and Performance Comparison and Financial Highlights sections of this Semiannual Report and in the Fund’s prospectus.
Costs of the Services Provided, and Profits Realized, by New York Life Investments
The Board considered the costs of the services provided by New York Life Investments under the Agreement, and the profits realized by New York Life Investments and its affiliates due to their relationships with the Fund.
In evaluating the costs and profits of New York Life Investments and its affiliates, the Board considered, among other factors, New York Life Investments’ investments in personnel, systems, equipment and other resources necessary to manage the Fund. The Board acknowledged that New York Life Investments must be in a position to pay and retain experienced professional personnel to provide services to the Fund, and that the ability to maintain a strong financial position is important in order for New York Life Investments to continue to provide high-quality services to the Fund. The Board also noted that the Fund benefits from the allocation of certain fixed costs across the MainStay Group of Funds.
In addition, the Board noted the difficulty in obtaining reliable comparative data about mutual fund managers’ profitability, since such information generally is not publicly available and may be impacted by numerous factors, including the structure of a fund manager’s organization, the types of funds it manages, the methodology used to allocate certain fixed costs to specific funds, and the manager’s capital structure and costs of capital. While recognizing the difficulty in evaluating a manager’s profitability with respect to the Fund, and noting that other profitability methodologies may also be reasonable, the Board concluded that the profitability methodology presented by New York Life Investments to the Board, which was developed by New York Life Investments in consultation with an independent consultant, was reasonable in all material respects.
In considering the costs and profitability of the Fund, the Board also considered certain fall-out benefits that may be realized by New York Life Investments and its affiliates due to their relationships with the Fund.
The Board further considered that, in addition to fees earned by New York Life Investments for managing the Fund, New York Life Investments’ affiliates also earn revenues from serving the Fund in various other capacities, including as the Fund’s transfer agent and distributor. The Board observed that information about these other revenues, and their impact on the profitability of the Fund to New York Life Investments and its affiliates, was furnished to the Board as part of the 15(c) process. The Board noted that, although it assessed the overall profitability of the Fund to New York Life Investments and its affiliates as part of the contract review process, when considering the reasonableness of the fees to be paid to New York Life Investments and its affiliates under the Agreement, the Board considered the profitability of New York Life Investments’ relationship with the Fund on a pre-tax basis, and without regard to distribution expenses.
After evaluating the information presented to the Board, the Board concluded, within the context of its overall determinations regarding the Agreement, that any profits realized by New York Life Investments and its affiliates due to their relationships with the Fund supported the Board’s decision to approve the Agreement.
Extent to Which Economies of Scale May Be Realized as the Fund Grows
The Board also considered whether the Fund’s expense structure permitted economies of scale to be shared with Fund investors. The Board reviewed information from New York Life Investments showing how the Fund’s management fee schedule compared to fee schedules of other funds and accounts managed by New York Life Investments.
| | |
| 36 | | MainStay Floating Rate Fund |
The Board also reviewed information from Strategic Insight showing how the Fund’s management fee schedule hypothetically would compare with fees paid for similar services by peer funds at varying asset levels. While recognizing the difficulty of determining economies of scale with precision, the Board acknowledged that economies of scale may be shared with the Fund in a number of ways, including, for example, through the imposition of management fee breakpoints and by initially setting relatively lower management fees.
Based on this information, the Board concluded, within the context of its overall determinations regarding the Agreement, that the Fund’s expense structure appropriately reflects economies of scale for the benefit of Fund investors. The Board noted, however, that it would continue to evaluate the reasonableness of the Fund’s expense structure as the Fund grows over time.
Management Fees and Total Ordinary Operating Expenses
The Board evaluated the reasonableness of the fees to be paid under the Agreement and the Fund’s expected total ordinary operating expenses.
In assessing the reasonableness of the Fund’s fees and expenses, the Board primarily considered comparative data provided by Strategic Insight on the fees and expenses charged by similar mutual funds managed by other investment advisers. In addition, the Board considered information provided by New York Life Investments on fees charged to other investment advisory clients, including institutional separate accounts and other funds with similar investment objectives as the Fund. The Board particularly considered differences in the contractual management fee schedules of the retail MainStay Funds and similarly-managed MainStay VP Portfolios, taking into account New York Life Investments’ rationale for any differences in fee schedules. The Board also took into account explanations provided by New York Life Investments about the different scope of services provided to mutual funds as compared with other investment advisory clients. Additionally, the Board considered the impact of any expense limitation arrangements on the Fund’s net management fee and expenses.
The Board noted that, outside of the Fund’s management fee and the fees charged under a share class’s Rule 12b-1 and/or shareholder services plans, a share class’s most significant “other expenses” are transfer agent fees. Transfer agent fees are charged to the Fund based on the number of shareholder accounts (a “per-account” fee) as compared with certain other fees (e.g., management fees), which are charged based on the Fund’s average net assets. The Board took into account information from New York Life Investments showing that the Fund’s transfer agent fee schedule is reasonable, including industry data showing that the per-account fees that NYLIM Service Company LLC, the Fund’s transfer agent, charges the Fund are within the range of per-account fees charged by transfer agents to other mutual funds. In addition, the Board considered NYLIM Service Company LLC’s profitability in connection with the transfer agent services it provides to the Fund.
The Board acknowledged that, because the Fund’s transfer agent fees are billed on a per-account basis, the impact of transfer agent fees on a share class’s expense ratio may be more significant in cases where the share class has a high number of accounts with limited assets (i.e.,
small accounts). The Board observed that transfer agent fees are a significant portion of total expenses of many Funds in the MainStay Group of Funds. The impact of transfer agent fees on the expense ratios of these MainStay Funds tend to be greater than for other open-end retail funds, because the MainStay Group of Funds generally has a significant number of small accounts relative to competitor funds. The Board acknowledged the role that the MainStay Group of Funds historically has played in serving the investment needs of New York Life Insurance Company (“New York Life”) policyholders, who often maintain smaller account balances than other fund investors. The Board discussed measures that it and New York Life Investments have taken in recent years to mitigate the effect of small accounts on the expense ratios of Fund share classes, including: (i) encouraging New York Life agents to consolidate multiple small accounts held by the same investor into one MainStay Asset Allocation Fund account; (ii) increasing investment minimums from $500 to $1,000 in 2003; (iii) introducing Investor Class shares for certain MainStay Funds in early 2008 to consolidate smaller account investors; (iv) closing small accounts with balances below $250 in Investor Class shares or $750 in all other classes of shares; (v) no longer allowing an exception with no minimum investment amount with respect to AutoInvest accounts with subsequent monthly purchases of $100; (vi) since 2007, charging an annual $20.00 small account fee on certain accounts with balances below $1,000; and (vii) modifying the approach for billing transfer agent expenses to reduce the degree of subsidization by large accounts of smaller accounts. In addition, the Board acknowledged New York Life Investments’ efforts to encourage intermediaries to consolidate small accounts in multiple Funds held by the same investor into a single Asset Allocation Fund account, if appropriate under the circumstances, in an effort to mitigate the effect of small accounts on the Funds in the MainStay Group of Funds.
After considering all of the factors outlined above, the Board concluded that the Fund’s management fees and total ordinary operating expenses were within a range that is competitive and, within the context of the Board’s overall conclusions regarding the Agreement, support a conclusion that these fees and expenses are reasonable.
Conclusion
On the basis of the information provided to it and its evaluation thereof, the Board, including the Independent Trustees, unanimously voted to approve the Agreement.
| | | | |
| mainstayinvestments.com | | | 37 | |
Proxy Voting Policies and Procedures and Proxy Voting Record
A description of the policies and procedures that New York Life Investments uses to vote proxies related to the Fund’s securities is available without charge, upon request, (i) by visiting the Fund’s website at mainstayinvestments.com; or (ii) on the SEC’s website at www.sec.gov.
The Fund is required to file with the SEC its proxy voting record for the 12-month period ending June 30 on Form N-PX. The Fund’s most recent Form N-PX is available free of charge upon request (i) by calling 800-MAINSTAY (624-6782); (ii) by visiting the Fund’s website at mainstayinvestments.com; or (iii) on the SEC’s website at www.sec.gov
Shareholder Reports and Quarterly Portfolio Disclosure
The Fund is required to file its complete schedule of portfolio holdings with the SEC for its first and third fiscal quarters on Form N-Q. The Fund’s Form N-Q is available without charge on the SEC’s website at www.sec.gov or by calling MainStay Investments at 800-MAINSTAY (624-6782). You also can obtain and review copies of Form N-Q by visiting the SEC’s Public Reference Room in Washington, DC (information on the operation of the Public Reference Room may be obtained by calling (1-800-SEC-0330).
| | |
| 38 | | MainStay Floating Rate Fund |
MainStay Funds
MainStay offers a wide range of Funds for virtually any investment need. The full array of MainStay open-end offerings is listed here, with information about the manager, subadvisors, legal counsel and independent registered public accounting firms.
Equity
U.S. Equity Funds
MainStay Common Stock Fund
MainStay Cornerstone Growth Fund
MainStay Epoch U.S. All Cap Fund
MainStay Epoch U.S. Equity Yield Fund
MainStay ICAP Equity Fund
MainStay ICAP Select Equity Fund
MainStay Large Cap Growth Fund1
MainStay MAP Fund
MainStay S&P 500 Index Fund
MainStay U.S. Equity Opportunities Fund
MainStay U.S. Small Cap Fund
International/Global Equity Funds
MainStay Epoch Global Choice Fund
MainStay Epoch Global Equity Yield Fund
MainStay Epoch International Small Cap Fund
MainStay ICAP Global Fund
MainStay ICAP International Fund
MainStay International Equity Fund
MainStay International Opportunities Fund
Income
Taxable Bond Funds
MainStay Floating Rate Fund
MainStay Global High Income Fund
MainStay Government Fund
MainStay High Yield Corporate Bond Fund
MainStay High Yield Opportunities Fund
MainStay Indexed Bond Fund
MainStay Intermediate Term Bond Fund
MainStay Short Duration High Yield Fund
MainStay Short Term Bond Fund
MainStay Unconstrained Bond Fund
Municipal Bond Funds
MainStay California Tax Free Opportunities Fund2
MainStay High Yield Municipal Bond Fund
MainStay New York Tax Free Opportunities Fund3
MainStay Tax Free Bond Fund
Money Market Fund
MainStay Money Market Fund
Mixed Asset
MainStay Balanced Fund
MainStay Convertible Fund
MainStay Income Builder Fund
MainStay Marketfield Fund
Asset Allocation/Target Date
MainStay Conservative Allocation Fund
MainStay Growth Allocation Fund
MainStay Moderate Allocation Fund
MainStay Moderate Growth Allocation Fund
MainStay Retirement 2010 Fund
MainStay Retirement 2020 Fund
MainStay Retirement 2030 Fund
MainStay Retirement 2040 Fund
MainStay Retirement 2050 Fund
Manager
New York Life Investment Management LLC
New York, New York
Subadvisors
Cornerstone Capital Management Holdings LLC4
New York, New York
Cornerstone Capital Management LLC4
Bloomington, Minnesota
Epoch Investment Partners, Inc.
New York, New York
Institutional Capital LLC4
Chicago, Illinois
MacKay Shields LLC4
New York, New York
Marketfield Asset Management LLC
New York, New York
Markston International LLC
White Plains, New York
Winslow Capital Management LLC
Minneapolis, Minnesota
Legal Counsel
Dechert LLP
Independent Registered Public Accounting Firms
KPMG LLP
PricewaterhouseCoopers LLP
1. Effective January 13, 2012, the Fund was closed to new investors with certain exceptions.
2. This Fund is only registered for sale in AZ, CA, NV, OR, UT, and WA.
3. This Fund is only registered for sale in CT, DE, FL, MA, NJ, NY, and VT.
4. An affiliate of New York Life Investment Management LLC.
Not part of the Semiannual Report
For more information
800-MAINSTAY (624-6782)
mainstayinvestments.com
The MainStay Funds® are managed by New York Life Investment Management LLC and distributed through NYLIFE Distributors LLC, 169 Lackawanna Avenue, Parsippany, NJ 07054, a wholly owned subsidiary of New York Life Insurance Company. NYLIFE Distributors LLC is a Member FINRA/SIPC.
MainStay Investments® is a registered service mark and name under which New York Life Investment Management LLC does business. MainStay Investments, an indirect subsidiary of New York Life Insurance Company, New York, NY 10010, provides investment advisory products and services.
This report may be distributed only when preceded or accompanied by a current Fund prospectus.
©2013 NYLIFE Distributors LLC. All rights reserved.
| | | | | | | | |
| Not FDIC/NCUA Insured | | Not a Deposit | | May Lose Value | | No Bank Guarantee | | Not Insured by Any Government Agency |
| | |
| NYLIM-30129 MS175-13 | | MSFR10-06/13 NL0A4 |
MainStay Asset Allocation Funds
Message from the President and Semiannual Report
Unaudited | April 30, 2013

MainStay Conservative Allocation Fund
MainStay Moderate Allocation Fund
MainStay Moderate Growth Allocation Fund
MainStay Growth Allocation Fund

This page intentionally left blank
Message from the President
The U.S. stock market advanced during the six months ended April 30, 2013, generally providing double-digit returns at all capitalization levels. Value stocks tended to outpace growth stocks among large- and mid-capitalization companies, while growth stocks tended to outpace value stocks among smaller companies.
The market’s advance, however, was far from uniform. Stocks declined in early November, both before and immediately after the U.S. presidential election. Following a sharp recovery, stocks climbed until mid-December, when a Congressional stalemate on the fiscal cliff led to a brief decline. Another dip occurred in late February as investors speculated that the Federal Open Market Committee (FOMC) might stop purchasing mortgage-backed securities sooner than expected. Stocks also dipped in mid-April, as consumer sentiment dropped after the Boston marathon bombing. Despite these setbacks, U.S. stocks continued to trend upward during the six-month reporting period.
International stock markets also advanced, with several regional differences. Accommodative action by the Bank of Japan helped lower the yen and lift Japanese stocks to their highest levels since 2008. In Europe, stocks did well until early February, bolstered by the promise of support for the euro. As the year progressed, however, economic contraction, rising unemployment and systematic banking concerns took a toll on investor enthusiasm. In China, manufacturing slowed as the nation sought to balance growth and inflation risks. On the Korean peninsula, tensions rose as North Korea continued to threaten its neighbors, which added an undercurrent of caution to the market.
During the six months ended April 30, 2013, the FOMC kept the federal funds rate in a range close to zero. The FOMC also continued its direct purchases of mortgage-backed securities and longer-term U.S. government securities. With short-term interest rates likely to remain at low levels, many bond investors pursued higher yields by lengthening maturities and assuming greater risk. As a result, bonds with higher risk profiles tended
to outperform higher-quality investment-grade bonds and U.S. Treasury securities. Cash and cash equivalents essentially returned zero.
With wide variations in the performance of various asset classes, some investors might be tempted to chase higher returns by shifting back and forth between stocks and bonds. Since no one can predict where the market will move next, however, we encourage investors to select an appropriate mix of investments for their risk tolerance and time horizon and to stick with that mix, making only minor adjustments over time.
At MainStay Funds, our portfolio managers use a similar approach. Careful security selection and thoughtful sell disciplines help them pursue the investment objectives of their respective Funds. Using the principal investment strategies outlined in the Prospectus, they focus primarily on providing long-term investment potential for our shareholders.
Has this approach proved successful? In its most recent rankings, Barron’s listed MainStay Funds as the #1 fund family over the past 10 years. We were also the only mutual fund family that has appeared in Barron’s top six for the past five consecutive years.
The pages that follow provide additional insight into the specific market events, investment decisions and securities that shaped your MainStay Fund(s) during the six months ended April 30, 2013. We encourage you to read the semiannual report(s) carefully and to evaluate your results with your long-term financial goals in mind.
Sincerely,

Stephen P. Fisher
President
The opinions expressed are as of the date of this report and are subject to change. There is no guarantee that any forecast made will come to pass. This material does not constitute investment advice and is not intended as an endorsement of any specific investment.
To qualify for the Lipper/Barron’s Fund Survey, a fund family must have at least three funds in Lipper’s general U.S.-stock category, one in world equity (which combines global and international funds), one mixed-equity fund (which holds stocks and bonds), two taxable-bond funds, and one tax-exempt fund. Fund loads and 12b-1 fees aren’t included in the calculation of returns because the aim is to measure the manager’s skill. Each fund’s return is measured against all funds in its Lipper category, resulting in a percentile ranking which is then weighted by asset size relative to the fund family’s other assets in its general classifications. Finally, the score is multiplied by the general classification weightings as determined by the entire Lipper universe of funds.
Source: Barron’s, 2/9/13. Overall, MainStay Funds ranked number 56 for the one-year period, 20 for the five-year period and one for the 10-year period ended December 31, 2012, out of 62, 53 and 46 fund families, respectively. MainStay ranked number three for the 10-year period in 2009, 2010 and 2011 from among 48, 46 and 45 fund families, respectively. MainStay ranked number six from among 48 fund families for the 10-year period in 2008. Past performance is no guarantee of future results, which will vary. For the most recent MainStay Funds performance, please visit our website at mainstayinvestments.com. All mutual funds are subject to market risk and will fluctuate in value.
Not part of the Semiannual Report
Table of Contents
Investors should refer to each Fund’s Summary Prospectus and/or Prospectus and consider each Fund’s investment objectives, strategies, risks, charges and expenses carefully before investing. The Summary Prospectus and/or Prospectus contain this and other information about each Fund. You may obtain copies of each Fund’s Summary Prospectus, Prospectus and Statement of Additional Information free of charge, upon request, by calling toll-free 800-MAINSTAY (624-6782), by writing to NYLIFE Distributors LLC, Attn: MainStay Marketing Department, 169 Lackawanna Avenue, Parsippany, New Jersey 07054 or by sending an e-mail to MainStayShareholderServices@nylim.com. These documents are also available via the MainStay Funds’ website at mainstayinvestments.com/documents. Please read each Fund’s Summary Prospectus and/or Prospectus carefully before investing.
MainStay Conservative Allocation Fund
Investment and Performance Comparison1 (Unaudited)
Performance data quoted represents past performance. Past performance is no guarantee of future results. Because of market volatility, current performance may be lower or higher than the figures shown. Investment return and principal value will fluctuate, and as a result, when shares are redeemed, they may be worth more or less than their original cost. The graph below depicts the historical performance of Class I shares of the Fund. Performance will vary from class to class based on differences in class-specific expenses and sales charges. For performance information current to the most recent month-end, please call 800-MAINSTAY (624-6782) or visit mainstayinvestments.com.
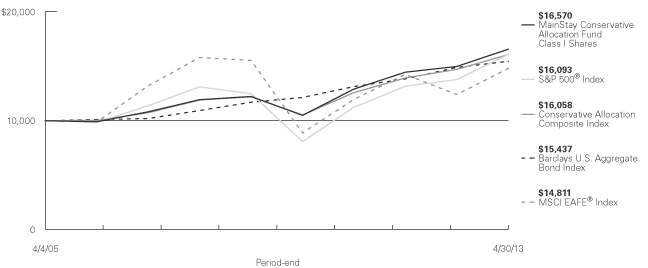
Average Annual Total Returns for the Period Ended April 30, 2013
| | | | | | | | | | | | | | | | | | | | | | | | |
| Class | | Sales Charge | | | | Six Months | | | One Year | | | Five Years | | | Since Inception (4/4/05) | | | Gross Expense Ratio2 | |
| Investor Class Shares3 | | Maximum 5.5% Initial Sales Charge | | With sales charges Excluding sales charges | |
| 1.66
7.58 | %
| |
| 4.15
10.21 | %
| |
| 4.70
5.89 | %
| |
| 5.33
6.07 | %
| |
| 1.42
1.42 | %
|
| Class A Shares | | Maximum 5.5% Initial Sales Charge | | With sales charges Excluding sales charges | |
| 1.75
7.67 |
| |
| 4.42
10.49 |
| |
| 4.80
6.00 |
| |
| 5.40
6.14 |
| |
| 1.24
1.24 |
|
| Class B Shares | | Maximum 5% CDSC if Redeemed Within the First Six Years of Purchase | | With sales charges Excluding sales charges | |
| 2.12
7.12 |
| |
| 4.44
9.44 |
| |
| 4.78
5.11 |
| |
| 5.29
5.29 |
| |
| 2.17
2.17 |
|
| Class C Shares | | Maximum 1% CDSC
if Redeemed Within
One Year of Purchase | | With sales charges Excluding sales charges | |
| 6.12
7.12 |
| |
| 8.44
9.44 |
| |
| 5.09
5.09 |
| |
| 5.29
5.29 |
| |
| 2.17
2.17 |
|
| Class I Shares | | No Sales Charge | | | | | 7.75 | | | | 10.69 | | | | 6.26 | | | | 6.45 | | | | 0.99 | |
| 1. | The performance table and graph do not reflect the deduction of taxes that a shareholder would pay on dividends, distributions or Fund share redemptions. Total returns reflect maximum applicable sales charges as indicated in the table above, changes in share price, and reinvestment of dividend and capital gain distributions. The graph assumes the initial investment amount shown above and reflects the deduction of all sales charges that would have applied for the period of investment. Performance figures reflect certain fee waivers and/or expense limitations, without which total returns may have been lower. For more information on share classes and current fee waivers |
| | and/or expense limitations, please refer to the notes to the financial statements. |
| 2. | The gross expense ratios presented reflect the Fund’s “Total Annual Fund Operating Expenses” from the most recent Prospectus and may differ from other expense ratios in this report. |
| 3. | Performance figures for Investor Class shares, first offered on February 28, 2008, include the historical performance of Class A shares through February 27, 2008, adjusted for differences in certain fees and expenses. Unadjusted, the performance shown for Investor Class shares would likely have been different. |
The footnotes on the next page are an integral part of the table and graph and should be carefully read in conjunction with them.
| | | | |
| mainstayinvestments.com | | | 5 | |
| | | | | | | | | | | | | | | | |
| Benchmark Performance | | Six
Months | | | One
Year | | | Five
Years | | | Since
Inception | |
S&P 500® Index4 | | | 14.42 | % | | | 16.89 | % | | | 5.21 | % | | | 6.07 | % |
MSCI EAFE® Index5 | | | 16.90 | | | | 19.39 | | | | –0.93 | | | | 4.99 | |
Barclays U.S. Aggregate Bond Index6 | | | 0.90 | | | | 3.68 | | | | 5.72 | | | | 5.53 | |
Conservative Allocation Composite Index7 | | | 6.29 | | | | 9.09 | | | | 5.69 | | | | 6.04 | |
Average Lipper Mixed-Asset Target Allocation Conservative Fund8 | | | 5.56 | | | | 8.44 | | | | 4.84 | | | | 5.03 | |
| 4. | “S&P 500®” is a trademark of The McGraw-Hill Companies, Inc. The S&P 500® Index is widely regarded as the standard index for measuring large-cap U.S. stock market performance. The S&P 500® Index is the Fund’s broad-based securities market index for comparison purposes. Results assume reinvestment of all income and capital gains. An investment cannot be made directly in an index. |
| 5. | The MSCI EAFE® Index consists of international stocks representing the developed world outside of North America. The MSCI EAFE® Index is the Fund’s secondary benchmark. Results assume reinvestment of all income and capital gains. An investment cannot be made directly in an index. |
| 6. | The Barclays U.S. Aggregate Bond Index is a broad-based benchmark that measures the investment grade, U.S. dollar-denominated, fixed-rate taxable bond market, including Treasurys, government-related and corporate securities, mortgage-backed securities (agency fixed-rate and hybrid adjustable rate mortgage pass-throughs), asset-backed securities, and commercial mortgage-backed securities. The Fund has selected the |
| | Barclays U.S. Aggregate Bond Index as an additional benchmark. Results assume reinvestment of all income and capital gains. An investment cannot be made directly in an index. |
| 7. | The Conservative Allocation Composite Index consists of the S&P 500® Index, the MSCI EAFE® Index and the Barclays U.S. Aggregate Bond Index weighted 35%, 5% and 60%, respectively. The Fund has selected the Conservative Allocation Composite Index as an additional benchmark. Total returns assume reinvestment of all dividends and capital gains. An investment cannot be made directly in an index. |
| 8. | The average Lipper mixed-asset target allocation conservative fund is representative of funds that, by portfolio practice, maintain a mix of between 20%-40% equity securities, with the remainder invested in bonds, cash, and cash equivalents. This benchmark is a product of Lipper Inc. Lipper Inc. is an independent monitor of fund performance. Results are based on average total returns of similar funds with all dividend and capital gain distributions reinvested. |
The footnotes on the preceding page are an integral part of the table and graph and should be carefully read in conjunction with them.
| | |
| 6 | | MainStay Conservative Allocation Fund |
Cost in Dollars of a $1,000 Investment in MainStay Conservative Allocation Fund (Unaudited)
The example below is intended to describe the fees and expenses borne by shareholders during the six-month period from November 1, 2012, to April 30, 2013, and the impact of those costs on your investment.
Example
As a shareholder of the Fund, you incur two types of costs: (1) transaction costs, including exchange fees and sales charges (loads) on purchases (as applicable), and (2) ongoing costs, including management fees, distribution and/or service (12b-1) fees, and other Fund expenses (as applicable). This example is intended to help you understand your ongoing costs (in dollars) of investing in the Fund and to compare these costs with the ongoing costs of investing in other mutual funds. The example is based on an investment of $1,000 made at the beginning of the six-month period and held for the entire period from November 1, 2012, to April 30, 2013.
This example illustrates your Fund’s ongoing costs in two ways:
Actual Expenses
The second and third data columns in the table below provide information about actual account values and actual expenses. You may use the information in these columns, together with the amount you invested, to estimate the expenses that you paid during the six months ended April 30, 2013. Simply divide your account value by $1,000 (for example, an $8,600 account value divided by $1,000 = 8.6), then
multiply the result by the number under the heading entitled “Expenses Paid During Period” to estimate the expenses you paid on your account during this period.
Hypothetical Example for Comparison Purposes
The fourth and fifth data columns in the table below provide information about hypothetical account values and hypothetical expenses based on the Fund’s actual expense ratio and an assumed rate of return of 5% per year before expenses, which is not the Fund’s actual return. The hypothetical account values and expenses may not be used to estimate the actual ending account balances or expenses you paid for the six-month period shown. You may use this information to compare the ongoing costs of investing in the Fund with the ongoing costs of investing in other Funds. To do so, compare this 5% hypothetical example with the 5% hypothetical examples that appear in the shareholder reports of the other Funds.
Please note that the expenses shown in the table are meant to highlight your ongoing costs only and do not reflect any transactional costs, such as exchange fees or sales charges (loads). Therefore, the fourth and fifth data columns of the table are useful in comparing ongoing costs only and will not help you determine the relative total costs of owning different funds. In addition, if these transactional costs were included, your costs would have been higher.
| | | | | | | | | | | | | | | | | | | | |
| | | | | | | | | | | | | | | | |
| Share Class | | Beginning
Account
Value
11/1/12 | | | Ending Account
Value (Based
on Actual
Returns and
Expenses)
4/30/13 | | | Expenses
Paid
During
Period1 | | | Ending Account
Value (Based
on Hypothetical
5% Annualized
Return and
Actual Expenses)
4/30/13 | | | Expenses
Paid
During
Period1 | |
| | | | | |
| Investor Class Shares | | $ | 1,000.00 | | | $ | 1,075.80 | | | $ | 2.73 | | | $ | 1,022.20 | | | $ | 2.66 | |
| | | | | |
| Class A Shares | | $ | 1,000.00 | | | $ | 1,076.70 | | | $ | 1.85 | | | $ | 1,023.00 | | | $ | 1.81 | |
| | | | | |
| Class B Shares | | $ | 1,000.00 | | | $ | 1,071.20 | | | $ | 6.57 | | | $ | 1,018.40 | | | $ | 6.41 | |
| | | | | |
| Class C Shares | | $ | 1,000.00 | | | $ | 1,071.20 | | | $ | 6.57 | | | $ | 1,018.40 | | | $ | 6.41 | |
| | | | | |
| Class I Shares | | $ | 1,000.00 | | | $ | 1,077.50 | | | $ | 0.57 | | | $ | 1,024.20 | | | $ | 0.55 | |
| 1. | Expenses are equal to the Fund’s annualized expense ratio of each class (0.53% for Investor Class, 0.36% for Class A, 1.28% for Class B and Class C and 0.11% for Class I) multiplied by the average account value over the period, divided by 365 and multiplied by 181 (to reflect the six-month period). The table above represents the actual expenses incurred during the six-month period. In addition to the fees and expenses which the Fund bears directly, the Fund indirectly bears a pro rata share of the fees and expenses of the Underlying Funds in which it invests. Such indirect expenses are not included in the above-reported expense figures. |
| | | | |
| mainstayinvestments.com | | | 7 | |
Investment Objectives of Underlying Funds as of April 30, 2013 (Unaudited)

See Portfolio of Investments on page 12 for specific holdings within these categories.
‡ Less than one-tenth of a percent.
| | |
| 8 | | MainStay Conservative Allocation Fund |
Portfolio Management Discussion and Analysis (Unaudited)
Questions answered by portfolio managers Jae S. Yoon, CFA, Jonathan Swaney and Poul Kristensen, CFA, of New York Life Investments.1
How did MainStay Conservative Allocation Fund perform relative to its peers and its benchmark during the six months ended April 30, 2013?
Excluding all sales charges, MainStay Conservative Allocation Fund returned 7.58% for Investor Class shares, 7.67% for Class A shares and 7.12% for Class B and Class C shares for the six months ended April 30, 2013. Over the same period, Class I shares returned 7.75%. All share classes outperformed the 5.56% return of the average Lipper2 mixed-asset target allocation conservative fund for the six months ended April 30, 2013. Over the same period, all share classes underperformed the 14.42% return of the S&P 500® Index3 and the 16.90% return of the MSCI EAFE® Index.4 The S&P 500® Index is the Fund’s broad-based securities-market index, and the MSCI EAFE® Index is the secondary benchmark of the Fund. All share classes outperformed the 0.90% return of the Barclays U.S. Aggregate Bond Index5 and the 6.29% return of the Conservative Allocation Composite Index6 for the six months ended April 30, 2013. The Barclays U.S. Aggregate Bond Index and the Conservative Allocation Composite Index are additional benchmarks of the Fund. See page 5 for Fund returns with applicable sales charges.
Were there any changes to the Fund during the reporting period?
Effective February 28, 2013, the Fund’s Principal Investment Strategies were modified to broaden the investment ranges for each of the asset classes in which the Fund may invest by an additional ten percentage points. Also effective February 28, 2013, Poul Kristensen, CFA, was added as a portfolio manager. For more information on these changes, please see the Prospectus dated February 28, 2013.
What factors affected the Fund’s relative performance during the reporting period?
The Fund is a “fund of funds,” meaning that it seeks to achieve its investment objective by investing primarily in other MainStay Funds (the “Underlying Funds”). The Underlying Funds may invest in fixed-income securities or in domestic or international stocks at various capitalization levels. The Fund’s primary benchmark, on the other hand, consists entirely of U.S. large-cap stocks. These differences—particularly the Fund’s substantial allocation to Underlying Funds that invest in fixed-income securities—accounted for many of the challenges the Fund experienced in terms of relative performance.
The Fund provided strong returns relative to its average peer fund and the Conservative Allocation Composite Index during the reporting period. Much of that strength was attributable to asset class decisions. We maintained a neutral blend at the start of the reporting period then moved aggressively to overweight equities during the latter half of the fourth quarter. This proved to be a very profitable strategy, although the benefit was mitigated somewhat by an emphasis on large-cap stocks rather than small-cap stocks and on U.S. equities over international offerings. In the fixed-income portion of the Fund, a bias toward lower-quality bond offerings aided performance. Our decision to keep duration7 short in the fixed-income portion of the Fund had no meaningful impact on the Fund’s performance.
Performance of the Underlying Funds also influenced relative results. On the plus side, significant holdings in MainStay U.S. Equity Opportunities Fund and MainStay International Opportunities Fund helped relative performance, as both were near the top of their respective peer groups. Relying on MainStay Large Cap Growth Fund more heavily than MainStay Cornerstone Growth Fund also proved beneficial.
Positions in MainStay Epoch Global Choice Fund and MainStay Marketfield Fund weighed on returns. Neither of these Underlying Funds performed particularly well in relation to the portion of the market to which they provided exposure. All told, the performance of all Underlying Funds contributed positively—but not significantly—to relative performance.
How did you allocate the Fund’s assets during the reporting period and why?
We considered a variety of information, including the portfolio-level characteristics of the Underlying Funds, such as capitalization, style biases, sector exposures, credit quality and duration. We also examined the attributes of the Underlying Funds’ holdings, such as valuation metrics, earnings data and technical indicators. Finally, we evaluated the historical success of the managers responsible for the Underlying Funds. Generally speaking, we seek to invest in Underlying Funds that occupy attractively valued segments of the market, invest in fairly priced securities and are steered by individuals who have consistently demonstrated capable management in the past.
The Fund’s allocations to stocks and bonds varied over the course of the reporting period in response to the changing environment. We believed that equities presented a sizable valuation advantage over bonds and that corporate profit gains
| 1. | “New York Life Investments” is a service mark used by New York Life Investment Management LLC. |
| 2. | See footnote on page 6 for more information on Lipper Inc. |
| 3. | See footnote on page 6 for more information on the S&P 500® Index. |
| 4. | See footnote on page 6 for more information on the MSCI EAFE® Index. |
| 5. | See footnote on page 6 for more information on the Barclays U.S. Aggregate Bond Index. |
| 6. | See footnote on page 6 for more information on the Conservative Allocation Composite Index. |
| 7. | Duration is a measure of the price sensitivity of a fixed-income investment to changes in interest rates. Duration is expressed as a number of years and is considered a more accurate sensitivity gauge than average maturity. |
| | | | |
| mainstayinvestments.com | | | 9 | |
would help propel stock prices higher. For these reasons, we gave the Fund a decisive tilt in favor of stocks over bonds throughout most of the reporting period. Within the equity portion of the Fund, we maintained a bias in favor of Underlying Funds that invest in U.S. stocks over Underlying Funds that invest in stocks traded in other developed markets. We were particularly concerned about countries that are likely to struggle with deleveraging issues even greater than those presented in the United States. Results were mixed, as Japan in particular experienced very strong returns on the back of aggressive fiscal and monetary policy changes.
In the fixed-income portion of the Fund, we continued to maintain a shorter duration than the Barclays U.S. Aggregate Bond Index. We also tilted the fixed-income portion of the Fund decidedly toward Underlying Funds that invest in corporate bonds over those that invest primarily in government-backed issues. This positioning reflected our opinion that high-grade bonds were very expensive and that issues from corporate borrowers deemed to be of lower quality represented a far more attractive proposition. Given ample liquidity and healthy corporate balance sheets, we believed that default rates were likely to remain low. We also believed that investors were likely to find the higher yields available from corporate debt quite attractive compared to the yields available on U.S. Treasury instruments.
How did the Fund’s allocations change over the course of the reporting period?
Position sizes naturally fluctuate with changing market conditions, and such changes do not always reflect an explicit change in our strategic or tactical point of view. That said, the most notable allocation changes during the reporting period were associated with the expanding list of eligible investments, as several new MainStay Funds became available.
MainStay Marketfield Fund, a global long/short and low-beta8 product, was the largest new position, established by using proceeds from a mix of other Underlying Equity Funds. MainStay Short Duration High Yield Fund was another new offering, which the Fund selected as part of an ongoing effort to protect against a potential rise in interest rates. We quickly built the Fund’s position after the Underlying Fund’s launch in December 2012. The purchases were made with proceeds from MainStay High Yield Corporate Bond Fund and MainStay Floating Rate Fund.
MainStay Cornerstone Growth Fund was another new product. We established a position in this Underlying Fund using proceeds from MainStay Large Cap Growth Fund as we sought to widen strategy diversification within that portion of the market.
A new holding was established in MainStay High Yield Municipal Bond Fund, which further diversified sources of credit risk within
the fixed-income portion of the Fund. We believed that high-yield municipal bonds would be attractive despite the inapplicability of tax benefits usually associated with these types of instruments. Funding for this investment came in large part from MainStay Unconstrained Bond Fund (formerly MainStay Flexible Bond Opportunities Fund).
There were two other changes of note. First, we increased the Fund’s position in MainStay U.S. Small Cap Fund as we unwound the Fund’s previous large-cap bias. Second, we increased the Fund’s position in MainStay Epoch Global Choice Fund when in our opinion the prospects for that Underlying Fund appeared compelling. In both cases, the increased allocation was funded from a mix of Underlying Equity Funds.
During the reporting period, which Underlying Equity Funds had the highest total returns and which Underlying Equity Funds had the lowest total returns?
MainStay International Opportunities Fund generated the highest absolute return by a comfortable margin, followed by MainStay U.S. Small Cap Fund. Although none of the Underlying Equity Funds in which the Fund invested provided negative returns for the reporting period, the lowest absolute returns in the equity portion of the Fund came from MainStay Cornerstone Growth Fund and MainStay International Equity Fund.
Which Underlying Equity Funds made the strongest positive contributions to the Fund’s overall performance, and which Underlying Equity Funds were the greatest detractors?
Because contributions take weightings and total returns into account and position sizes may vary, the Underlying Funds with the highest (or lowest) returns may not always have the most significantly positive (or negative) contributions to performance.
During the reporting period, large positions in MainStay MAP Fund and MainStay Large Cap Growth Fund made the largest positive contributions to the Fund’s overall performance. Although none of the Underlying Equity Funds in which the Fund invested had negative total returns, the smallest contributions came from a new position being built in MainStay Cornerstone Growth Fund and from a very small position in MainStay ICAP Select Equity Fund.
What factors and risks affected the Fund’s Underlying Fixed Income Fund investments during the reporting period?
Monetary policy continued to play a significant role in fixed-income markets, as has been the case for several years. Faced with persistently sluggish economic growth, slow rates of job creation and the prospect of significant fiscal drag, the Federal
| 8. | Beta is a measure of volatility in relation to the market as a whole. A beta higher than 1 indicates that a security or portfolio will tend to exhibit higher volatility than the market. A beta lower than 1 indicates that a security or portfolio will tend to exhibit lower volatility than the market. |
| | |
| 10 | | MainStay Conservative Allocation Fund |
Reserve elected to extend its large-scale asset purchase program indefinitely. This decision helped keep interest rates close to their all-time lows. During the reporting period, the Fund favored Underlying Funds that invest in higher-yielding corporate bonds over those that invest primarily in government-backed issues. This strategy proved fortunate. Credit performed quite well as default rates remained low and the comparatively higher yields of these bonds attracted many buyers.
During the reporting period, which fixed-income market segments were strong performers and which segments were particularly weak?
High-yield corporate bonds performed exceptionally well as spreads9 to U.S. Treasurys continued to contract. The lowest
returns came from the most liquid, highest-quality and shortest-term debt instruments. Cash returned nothing, and returns on short-term U.S. government debt and AAA bonds were only slightly higher.
Which Underlying Fixed Income Funds made the strongest positive contributions to the Fund’s performance, and which Underlying Fixed Income Funds were the greatest detractors?
The largest contribution to the fixed-income portion of the Fund came from a substantial position in MainStay Floating Rate Fund. This was followed by a much smaller position in MainStay Unconstrained Bond Fund. The contribution from positions in MainStay Money Market Fund and MainStay Indexed Bond Fund was effectively zero.
| 9. | The terms “spread” and “yield spread” may refer to the difference in yield between a security or type of security and comparable U.S. Treasury issues. The terms may also refer to the difference in yield between two specific securities or types of securities at a given time. |
The opinions expressed are those of the portfolio managers as of the date of this report and are subject to change. There is no guarantee that any forecast made will come to pass. This material does not constitute investment advice and is not intended as an endorsement of any specific investment.
| | | | |
| mainstayinvestments.com | | | 11 | |
Portfolio of Investments April 30, 2013 (Unaudited)
| | | | | | | | |
| | |
| | | Shares | | | Value | |
| Affiliated Investment Companies 100.0%† | |
Equity Funds 42.2% | |
MainStay Cornerstone Growth Fund Class I (a) | | | 180,209 | | | $ | 5,379,241 | |
MainStay Epoch Global Choice Fund Class I (a) | | | 552,771 | | | | 10,237,319 | |
MainStay Epoch U.S. All Cap Fund Class I | | | 625,729 | | | | 15,743,338 | |
MainStay ICAP Equity Fund Class I | | | 398,787 | | | | 17,993,280 | |
MainStay ICAP International Fund Class I | | | 93,465 | | | | 3,031,086 | |
MainStay ICAP Select Equity Fund Class I | | | 7,046 | | | | 303,454 | |
MainStay International Equity Fund Class I | | | 101,448 | | | | 1,279,261 | |
MainStay International Opportunities Fund Class I | | | 532,431 | | | | 4,355,289 | |
MainStay Large Cap Growth Fund Class I | | | 1,466,930 | | | | 12,938,324 | |
MainStay MAP Fund Class I | | | 740,168 | | | | 29,473,471 | |
MainStay Marketfield Fund Class I (b) | | | 397,155 | | | | 6,624,538 | |
MainStay S&P 500 Index Fund Class I | | | 22,060 | | | | 818,659 | |
MainStay U.S. Equity Opportunities Fund Class I | | | 2,911,923 | | | | 26,411,139 | |
MainStay U.S. Small Cap Fund Class I | | | 334,544 | | | | 6,991,978 | |
| | | | | | | | |
Total Equity Funds
(Cost $116,485,384) | | | | | | | 141,580,377 | |
| | | | | | | | |
Fixed Income Funds 57.8% | | | | | | | | |
MainStay Floating Rate Fund Class I (a) | | | 3,665,718 | | | | 35,410,839 | |
MainStay High Yield Corporate Bond Fund Class I | | | 1,331,219 | | | | 8,280,183 | |
MainStay High Yield Municipal Bond Fund Class I | | | 273,486 | | | | 3,320,115 | |
MainStay High Yield Opportunities Fund Class I | | | 245,948 | | | | 3,052,214 | |
MainStay Indexed Bond Fund Class I (a) | | | 3,658,550 | | | | 41,487,961 | |
| | | | | | | | |
| | |
| | | Shares | | | Value | |
Fixed Income Funds (continued) | | | | | | | | |
MainStay Intermediate Term Bond Fund Class I (a) | | | 6,755,695 | | | $ | 75,190,891 | |
MainStay Money Market Fund Class A | | | 8,805,281 | | | | 8,805,281 | |
MainStay Short Duration High Yield Fund Class I (a) | | | 553,727 | | | | 5,576,034 | |
MainStay Short Term Bond Fund Class I | | | 59,132 | | | | 568,845 | |
MainStay Unconstrained Bond Fund Class I (a) | | | 1,261,972 | | | | 11,938,254 | |
| | | | | | | | |
Total Fixed Income Funds
(Cost $186,713,639) | | | | | | | 193,630,617 | |
| | | | | | | | |
Total Investments
(Cost $303,199,023) (c) | | | 100.0 | % | | | 335,210,994 | |
Other Assets, Less Liabilities | | | (0.0 | )‡ | | | (86,256 | ) |
Net Assets | | | 100.0 | % | | $ | 335,124,738 | |
| † | Percentages indicated are based on Fund net assets. |
| ‡ | Less than one-tenth of a percent. |
| (a) | The Fund’s ownership exceeds 5% of the outstanding shares of the Underlying Fund’s share class. (See Note 3) |
| (b) | Non-income producing Underlying Fund. |
| (c) | As of April 30, 2013, cost is $305,260,950 for federal income tax purposes and net unrealized appreciation is as follows: |
| | | | |
Gross unrealized appreciation | | $ | 32,014,267 | |
Gross unrealized depreciation | | | (2,064,223 | ) |
| | | | |
Net unrealized appreciation | | $ | 29,950,044 | |
| | | | |
The following is a summary of the fair valuations according to the inputs used as of April 30, 2013, for valuing the Fund’s assets.
Asset Valuation Inputs
| | | | | | | | | | | | | | | | |
Description | | Quoted
Prices in
Active
Markets for
Identical
Assets (Level 1) | | | Significant
Other
Observable
Inputs
(Level 2) | | | Significant
Unobservable
Inputs
(Level 3) | | | Total | |
| Investments (a) | | | | | | | | | | | | | | | | |
| Affiliated Investment Companies | | | | | | | | | | | | | | | | |
Equity Funds | | $ | 141,580,377 | | | $ | — | | | $ | — | | | $ | 141,580,377 | |
Fixed Income Funds | | | 193,630,617 | | | | — | | | | — | | | | 193,630,617 | |
| | | | | | | | | | | | | | | | |
| Total Investments | | $ | 335,210,994 | | | $ | — | | | $ | — | | | $ | 335,210,994 | |
| | | | | | | | | | | | | | | | |
| (a) | For a complete listing of investments, see the Portfolio of Investments. |
The Fund recognizes transfers between the levels as of the beginning of the period.
For the period ended April 30, 2013, the Fund did not have any transfers between Level 1 and Level 2 fair value measurements. (See Note 2)
As of April 30, 2013, the Fund did not hold any investments with significant unobservable inputs (Level 3). (See Note 2)
| | | | |
| 12 | | MainStay Conservative Allocation Fund | | The notes to the financial statements are an integral part of,
and should be read in conjunction with, the financial statements. |
Statement of Assets and Liabilities as of April 30, 2013 (Unaudited)
| | | | |
| Assets | |
Investment in affiliated investment companies, at value (identified cost $303,199,023) | | $ | 335,210,994 | |
Receivables: | | | | |
Fund shares sold | | | 264,725 | |
Other assets | | | 58,281 | |
| | | | |
Total assets | | | 335,534,000 | |
| | | | |
| |
| Liabilities | | | | |
Payables: | | | | |
Fund shares redeemed | | | 195,453 | |
NYLIFE Distributors (See Note 3) | | | 114,166 | |
Transfer agent (See Note 3) | | | 59,384 | |
Shareholder communication | | | 17,796 | |
Professional fees | | | 16,040 | |
Custodian | | | 984 | |
Trustees | | | 734 | |
Accrued expenses | | | 4,705 | |
| | | | |
Total liabilities | | | 409,262 | |
| | | | |
Net assets | | $ | 335,124,738 | |
| | | | |
| |
| Composition of Net Assets | | | | |
Shares of beneficial interest outstanding (par value of $.001 per share) unlimited number of shares authorized | | $ | 27,788 | |
Additional paid-in capital | | | 298,836,529 | |
| | | | |
| | | 298,864,317 | |
Distributions in excess of net investment income | | | (1,101,174 | ) |
Accumulated net realized gain (loss) on investments | | | 5,349,624 | |
Net unrealized appreciation (depreciation) on investments | | | 32,011,971 | |
| | | | |
Net assets | | $ | 335,124,738 | |
| | | | |
| | | | |
Investor Class | | | | |
Net assets applicable to outstanding shares | | $ | 55,667,309 | |
| | | | |
Shares of beneficial interest outstanding | | | 4,612,858 | |
| | | | |
Net asset value per share outstanding | | $ | 12.07 | |
Maximum sales charge (5.50% of offering price) | | | 0.70 | |
| | | | |
Maximum offering price per share outstanding | | $ | 12.77 | |
| | | | |
Class A | | | | |
Net assets applicable to outstanding shares | | $ | 179,667,283 | |
| | | | |
Shares of beneficial interest outstanding | | | 14,889,415 | |
| | | | |
Net asset value per share outstanding | | $ | 12.07 | |
Maximum sales charge (5.50% of offering price) | | | 0.70 | |
| | | | |
Maximum offering price per share outstanding | | $ | 12.77 | |
| | | | |
Class B | | | | |
Net assets applicable to outstanding shares | | $ | 38,990,633 | |
| | | | |
Shares of beneficial interest outstanding | | | 3,243,153 | |
| | | | |
Net asset value and offering price per share outstanding | | $ | 12.02 | |
| | | | |
Class C | | | | |
Net assets applicable to outstanding shares | | $ | 42,996,549 | |
| | | | |
Shares of beneficial interest outstanding | | | 3,577,079 | |
| | | | |
Net asset value and offering price per share outstanding | | $ | 12.02 | |
| | | | |
Class I | | | | |
Net assets applicable to outstanding shares | | $ | 17,802,964 | |
| | | | |
Shares of beneficial interest outstanding | | | 1,465,536 | |
| | | | |
Net asset value and offering price per share outstanding | | $ | 12.15 | |
| | | | |
| | | | | | |
The notes to the financial statements are an integral part of,
and should be read in conjunction with, the financial statements. | | mainstayinvestments.com | | | 13 | |
Statement of Operations for the six months ended April 30, 2013 (Unaudited)
| | | | |
| Investment Income (Loss) | | | | |
Income | | | | |
Dividend distributions from affiliated investment companies | | $ | 4,386,107 | |
| | | | |
Expenses | | | | |
Distribution/Service—Investor Class (See Note 3) | | | 64,526 | |
Distribution/Service—Class A (See Note 3) | | | 211,134 | |
Distribution/Service—Class B (See Note 3) | | | 184,621 | |
Distribution/Service—Class C (See Note 3) | | | 198,353 | |
Transfer agent (See Note 3) | | | 180,778 | |
Registration | | | 39,666 | |
Shareholder communication | | | 25,552 | |
Professional fees | | | 17,668 | |
Trustees | | | 3,609 | |
Custodian | | | 2,568 | |
Miscellaneous | | | 8,143 | |
| | | | |
Total expenses | | | 936,618 | |
| | | | |
Net investment income (loss) | | | 3,449,489 | |
| | | | |
|
| Realized and Unrealized Gain (Loss) on Investments | |
Net realized gain (loss) on: | | | | |
Affiliated investment company transactions | | | 3,148,623 | |
Realized capital gain distributions from affiliated investment companies | | | 4,263,273 | |
| | | | |
Net realized gain (loss) on investments from affiliated investment companies | | | 7,411,896 | |
| | | | |
Net change in unrealized appreciation (depreciation) on investments | | | 12,215,935 | |
| | | | |
Net realized and unrealized gain (loss) on investments | | | 19,627,831 | |
| | | | |
Net increase (decrease) in net assets resulting from operations | | $ | 23,077,320 | |
| | | | |
| | | | |
| 14 | | MainStay Conservative Allocation Fund | | The notes to the financial statements are an integral part of,
and should be read in conjunction with, the financial statements. |
Statements of Changes in Net Assets
for the six months ended April 30, 2013 (Unaudited) and the year ended October 31, 2012
| | | | | | | | |
| | | 2013 | | | 2012 | |
| Increase (Decrease) in Net Assets | |
Operations: | | | | | | | | |
Net investment income (loss) | | $ | 3,449,489 | | | $ | 5,350,794 | |
Net realized gain (loss) on investments from affiliated investment companies transactions | | | 7,411,896 | | | | 4,700,839 | |
Net change in unrealized appreciation (depreciation) on investments | | | 12,215,935 | | | | 14,142,672 | |
| | | | |
Net increase (decrease) in net assets resulting from operations | | | 23,077,320 | | | | 24,194,305 | |
| | | | |
Dividends and distributions to shareholders: | | | | | | | | |
From net investment income: | | | | | | | | |
Investor Class | | | (828,538 | ) | | | (1,047,807 | ) |
Class A | | | (2,855,200 | ) | | | (3,834,388 | ) |
Class B | | | (452,837 | ) | | | (555,060 | ) |
Class C | | | (488,910 | ) | | | (542,159 | ) |
Class I | | | (305,805 | ) | | | (287,940 | ) |
| | | | |
| | | (4,931,290 | ) | | | (6,267,354 | ) |
| | | | |
From net realized gain on investments: | | | | | | | | |
Investor Class | | | (1,059,886 | ) | | | (428,222 | ) |
Class A | | | (2,384,434 | ) | | | (1,490,047 | ) |
Class B | | | (435,381 | ) | | | (342,898 | ) |
Class C | | | (535,657 | ) | | | (320,881 | ) |
Class I | | | (7,268 | ) | | | (93,798 | ) |
| | | | |
| | | (4,422,626 | ) | | | (2,675,846 | ) |
| | | | |
Total dividends and distributions to shareholders | | | (9,353,916 | ) | | | (8,943,200 | ) |
| | | | |
Capital share transactions: | | | | | | | | |
Net proceeds from sale of shares | | | 42,265,741 | | | | 77,688,499 | |
Net asset value of shares issued to shareholders in reinvestment of dividends and distributions | | | 8,586,906 | | | | 8,195,158 | |
Cost of shares redeemed | | | (32,318,646 | ) | | | (55,709,088 | ) |
| | | | |
Increase (decrease) in net assets derived from capital share transactions | | | 18,534,001 | | | | 30,174,569 | |
| | | | |
Net increase (decrease) in net assets | | | 32,257,405 | | | | 45,425,674 | |
| | |
| Net Assets | | | | | | | | |
Beginning of period | | | 302,867,333 | | | | 257,441,659 | |
| | | | |
End of period | | $ | 335,124,738 | | | $ | 302,867,333 | |
| | | | |
Undistributed (distributions in excess of) net investment income at end of period | | $ | (1,101,174 | ) | | $ | 380,627 | |
| | | | |
| | | | | | |
The notes to the financial statements are an integral part of,
and should be read in conjunction with, the financial statements. | | mainstayinvestments.com | | | 15 | |
Financial Highlights selected per share data and ratios
| | | | | | | | | | | | | | | | | | | | | | | | |
| | | Investor Class | |
| | | Six months
ended
April 30, | | | Year ended October 31, | | | February 28,
2008**
through
October 31, | |
| | | 2013* | | | 2012 | | | 2011 | | | 2010 | | | 2009 | | | 2008 | |
Net asset value at beginning of period | | $ | 11.57 | | | $ | 10.96 | | | $ | 10.81 | | | $ | 9.90 | | | $ | 8.76 | | | $ | 10.69 | |
| | | | | | | | | | | | | | | | | | | | | | | | |
Net investment income (loss) (a) | | | 0.13 | | | | 0.23 | | | | 0.24 | | | | 0.23 | | | | 0.27 | | | | 0.19 | |
Net realized and unrealized gain (loss) on investments | | | 0.73 | | | | 0.76 | | | | 0.20 | | | | 0.91 | | | | 1.25 | | | | (1.91 | ) |
| | | | | | | | | | | | | | | | | | | | | | | | |
Total from investment operations | | | 0.86 | | | | 0.99 | | | | 0.44 | | | | 1.14 | | | | 1.52 | | | | (1.72 | ) |
| | | | | | | | | | | | | | | | | | | | | | | | |
Less dividends and distributions: | | | | | | | | | | | | | | | | | | | | | | | | |
From net investment income | | | (0.19 | ) | | | (0.27 | ) | | | (0.29 | ) | | | (0.23 | ) | | | (0.27 | ) | | | (0.21 | ) |
From net realized gain on investments | | | (0.17 | ) | | | (0.11 | ) | | | — | | | | — | | | | (0.11 | ) | | | — | |
| | | | | | | | | | | | | | | | | | | | | | | | |
Total dividends and distributions | | | (0.36 | ) | | | (0.38 | ) | | | (0.29 | ) | | | (0.23 | ) | | | (0.38 | ) | | | (0.21 | ) |
| | | | | | | | | | | | | | | | | | | | | | | | |
Net asset value at end of period | | $ | 12.07 | | | $ | 11.57 | | | $ | 10.96 | | | $ | 10.81 | | | $ | 9.90 | | | $ | 8.76 | |
| | | | | | | | | | | | | | | | | | | | | | | | |
Total investment return (b) | | | 7.58 | %(c) | | | 9.24 | % | | | 4.06 | % | | | 11.70 | % | | | 18.01 | % | | | (16.36 | %)(c) |
Ratios (to average net assets)/Supplemental Data: | | | | | | | | | | | | | | | | | | | | | | | | |
Net investment income (loss) | | | 2.26 | %†† | | | 2.00 | % | | | 2.17 | % | | | 2.26 | % | | | 2.98 | % | | | 2.72 | % †† |
Net expenses (d) | | | 0.53 | %†† | | | 0.53 | % | | | 0.50 | % | | | 0.50 | % | | | 0.50 | % | | | 0.50 | % †† |
Expenses (before waiver/reimbursement) (d) | | | 0.53 | %†† | | | 0.55 | % | | | 0.57 | % | | | 0.63 | % | | | 0.74 | % | | | 0.62 | % †† |
Portfolio turnover rate | | | 22 | % | | | 62 | % | | | 55 | % | | | 32 | % | | | 36 | % | | | 35 | % |
Net assets at end of period (in 000’s) | | $ | 55,667 | | | $ | 49,050 | | | $ | 41,525 | | | $ | 34,979 | | | $ | 25,216 | | | $ | 17,140 | |
| ** | Commencement of operations. |
| (a) | Per share data based on average shares outstanding during the period. |
| (b) | Total investment return is calculated exclusive of sales charges and assumes the reinvestment of dividends and distributions. |
| (c) | Total investment return is not annualized. |
| (d) | In addition to the fees and expenses which the Fund bears directly, the Fund indirectly bears a pro-rata share of the fees and expenses of the Underlying Funds in which it invests. Such indirect expenses are not included in the above expense ratios. |
| | | | |
| 16 | | MainStay Conservative Allocation Fund | | The notes to the financial statements are an integral part of,
and should be read in conjunction with, the financial statements. |
Financial Highlights selected per share data and ratios
| | | | | | | | | | | | | | | | | | | | | | | | |
| | | Class A | |
| | | Six months
ended
April 30, | | | Year ended October 31, | |
| | | 2013* | | | 2012 | | | 2011 | | | 2010 | | | 2009 | | | 2008 | |
Net asset value at beginning of period | | $ | 11.57 | | | $ | 10.95 | | | $ | 10.80 | | | $ | 9.90 | | | $ | 8.76 | | | $ | 11.47 | |
| | | | | | | | | | | | | | | | | | | | | | | | |
Net investment income (loss) (a) | | | 0.14 | | | | 0.24 | | | | 0.25 | | | | 0.24 | | | | 0.27 | | | | 0.30 | |
Net realized and unrealized gain (loss) on investments | | | 0.73 | | | | 0.77 | | | | 0.20 | | | | 0.90 | | | | 1.25 | | | | (2.39 | ) |
| | | | | | | | | | | | | | | | | | | | | | | | |
Total from investment operations | | | 0.87 | | | | 1.01 | | | | 0.45 | | | | 1.14 | | | | 1.52 | | | | (2.09 | ) |
| | | | | | | | | | | | | | | | | | | | | | | | |
Less dividends and distributions: | | | | | | | | | | | | | | | | | | | | | | | | |
From net investment income | | | (0.20 | ) | | | (0.28 | ) | | | (0.30 | ) | | | (0.24 | ) | | | (0.27 | ) | | | (0.49 | ) |
From net realized gain on investments | | | (0.17 | ) | | | (0.11 | ) | | | — | | | | — | | | | (0.11 | ) | | | (0.13 | ) |
| | | | | | | | | | | | | | | | | | | | | | | | |
Total dividends and distributions | | | (0.37 | ) | | | (0.39 | ) | | | (0.30 | ) | | | (0.24 | ) | | | (0.38 | ) | | | (0.62 | ) |
| | | | | | | | | | | | | | | | | | | | | | | | |
Net asset value at end of period | | $ | 12.07 | | | $ | 11.57 | | | $ | 10.95 | | | $ | 10.80 | | | $ | 9.90 | | | $ | 8.76 | |
| | | | | | | | | | | | | | | | | | | | | | | | |
Total investment return (b) | | | 7.67 | %(c) | | | 9.41 | % | | | 4.28 | % | | | 11.68 | % | | | 18.05 | % | | | (19.14 | %) |
Ratios (to average net assets)/Supplemental Data: | | | | | | | | | | | | | | | | | | | | | | | | |
Net investment income (loss) | | | 2.43 | %†† | | | 2.16 | % | | | 2.27 | % | | | 2.35 | % | | | 3.06 | % | | | 2.91 | % |
Net expenses (d) | | | 0.36 | %†† | | | 0.37 | % | | | 0.39 | % | | | 0.42 | % | | | 0.47 | % | | | 0.49 | % |
Portfolio turnover rate | | | 22 | % | | | 62 | % | | | 55 | % | | | 32 | % | | | 36 | % | | | 35 | % |
Net assets at end of period (in 000’s) | | $ | 179,667 | | | $ | 164,116 | | | $ | 143,520 | | | $ | 121,439 | | | $ | 94,643 | | | $ | 84,434 | |
| (a) | Per share data based on average shares outstanding during the period. |
| (b) | Total investment return is calculated exclusive of sales charges and assumes the reinvestment of dividends and distributions. |
| (c) | Total investment return is not annualized. |
| (d) | In addition to the fees and expenses which the Fund bears directly, the Fund indirectly bears a pro-rata share of the fees and expenses of the Underlying Funds in which it invests. Such indirect expenses are not included in the above expense ratios. |
| | | | | | |
The notes to the financial statements are an integral part of,
and should be read in conjunction with, the financial statements. | | mainstayinvestments.com | | | 17 | |
Financial Highlights selected per share data and ratios
| | | | | | | | | | | | | | | | | | | | | | | | |
| | | Class B | |
| | | Six months
ended
April 30, | | | Year ended October 31, | |
| | | 2013* | | | 2012 | | | 2011 | | | 2010 | | | 2009 | | | 2008 | |
Net asset value at beginning of period | | $ | 11.53 | | | $ | 10.92 | | | $ | 10.76 | | | $ | 9.86 | | | $ | 8.73 | | | $ | 11.42 | |
| | | | | | | | | | | | | | | | | | | | | | | | |
Net investment income (loss) (a) | | | 0.09 | | | | 0.14 | | | | 0.15 | | | | 0.16 | | | | 0.20 | | | | 0.22 | |
Net realized and unrealized gain (loss) on investments | | | 0.72 | | | | 0.76 | | | | 0.21 | | | | 0.90 | | | | 1.24 | | | | (2.39 | ) |
| | | | | | | | | | | | | | | | | | | | | | | | |
Total from investment operations | | | 0.81 | | | | 0.90 | | | | 0.36 | | | | 1.06 | | | | 1.44 | | | | (2.17 | ) |
| | | | | | | | | | | | | | | | | | | | | | | | |
Less dividends and distributions: | | | | | | | | | | | | | | | | | | | | | | | | |
From net investment income | | | (0.15 | ) | | | (0.18 | ) | | | (0.20 | ) | | | (0.16 | ) | | | (0.20 | ) | | | (0.39 | ) |
From net realized gain on investments | | | (0.17 | ) | | | (0.11 | ) | | | — | | | | — | | | | (0.11 | ) | | | (0.13 | ) |
| | | | | | | | | | | | | | | | | | | | | | | | |
Total dividends and distributions | | | (0.32 | ) | | | (0.29 | ) | | | (0.20 | ) | | | (0.16 | ) | | | (0.31 | ) | | | (0.52 | ) |
| | | | | | | | | | | | | | | | | | | | | | | | |
Net asset value at end of period | | $ | 12.02 | | | $ | 11.53 | | | $ | 10.92 | | | $ | 10.76 | | | $ | 9.86 | | | $ | 8.73 | |
| | | | | | | | | | | | | | | | | | | | | | | | |
Total investment return (b) | | | 7.12 | %(c) | | | 8.46 | % | | | 3.30 | % | | | 10.92 | % | | | 17.09 | % | | | (19.78 | %) |
Ratios (to average net assets)/Supplemental Data: | | | | | | | | | | | | | | | | | | | | | | | | |
Net investment income (loss) | | | 1.53 | %†† | | | 1.27 | % | | | 1.41 | % | | | 1.51 | % | | | 2.25 | % | | | 2.11 | % |
Net expenses (d) | | | 1.28 | %†† | | | 1.28 | % | | | 1.25 | % | | | 1.25 | % | | | 1.25 | % | | | 1.25 | % |
Expenses (before waiver/reimbursement) (d) | | | 1.28 | %†† | | | 1.30 | % | | | 1.32 | % | | | 1.38 | % | | | 1.48 | % | | | 1.33 | % |
Portfolio turnover rate | | | 22 | % | | | 62 | % | | | 55 | % | | | 32 | % | | | 36 | % | | | 35 | % |
Net assets at end of period (in 000’s) | | $ | 38,991 | | | $ | 35,808 | | | $ | 33,580 | | | $ | 31,241 | | | $ | 27,417 | | | $ | 23,226 | |
| (a) | Per share data based on average shares outstanding during the period. |
| (b) | Total investment return is calculated exclusive of sales charges and assumes the reinvestment of dividends and distributions. |
| (c) | Total investment return is not annualized. |
| (d) | In addition to the fees and expenses which the Fund bears directly, the Fund indirectly bears a pro-rata share of the fees and expenses of the Underlying Funds in which it invests. Such indirect expenses are not included in the above expense ratios. |
| | | | |
| 18 | | MainStay Conservative Allocation Fund | | The notes to the financial statements are an integral part of,
and should be read in conjunction with, the financial statements. |
Financial Highlights selected per share data and ratios
| | | | | | | | | | | | | | | | | | | | | | | | |
| | | Class C | |
| | | Six months
ended
April 30, | | | Year ended October 31, | |
| | | 2013* | | | 2012 | | | 2011 | | | 2010 | | | 2009 | | | 2008 | |
Net asset value at beginning of period | | $ | 11.53 | | | $ | 10.92 | | | $ | 10.76 | | | $ | 9.86 | | | $ | 8.73 | | | $ | 11.42 | |
| | | | | | | | | | | | | | | | | | | | | | | | |
Net investment income (loss) (a) | | | 0.09 | | | | 0.14 | | | | 0.15 | | | | 0.16 | | | | 0.21 | | | | 0.22 | |
Net realized and unrealized gain (loss) on investments | | | 0.72 | | | | 0.76 | | | | 0.21 | | | | 0.90 | | | | 1.23 | | | | (2.39 | ) |
| | | | | | | | | | | | | | | | | | | | | | | | |
Total from investment operations | | | 0.81 | | | | 0.90 | | | | 0.36 | | | | 1.06 | | | | 1.44 | | | | (2.17 | ) |
| | | | | | | | | | | | | | | | | | | | | | | | |
Less dividends and distributions: | | | | | | | | | | | | | | | | | | | | | | | | |
From net investment income | | | (0.15 | ) | | | (0.18 | ) | | | (0.20 | ) | | | (0.16 | ) | | | (0.20 | ) | | | (0.39 | ) |
From net realized gain on investments | | | (0.17 | ) | | | (0.11 | ) | | | — | | | | — | | | | (0.11 | ) | | | (0.13 | ) |
| | | | | | | | | | | | | | | | | | | | | | | | |
Total dividends and distributions | | | (0.32 | ) | | | (0.29 | ) | | | (0.20 | ) | | | (0.16 | ) | | | (0.31 | ) | | | (0.52 | ) |
| | | | | | | | | | | | | | | | | | | | | | | | |
Net asset value at end of period | | $ | 12.02 | | | $ | 11.53 | | | $ | 10.92 | | | $ | 10.76 | | | $ | 9.86 | | | $ | 8.73 | |
| | | | | | | | | | | | | | | | | | | | | | | | |
Total investment return (b) | | | 7.12 | %(c) | | | 8.46 | % | | | 3.40 | % | | | 10.82 | % | | | 17.09 | % | | | (19.79 | %) |
Ratios (to average net assets)/Supplemental Data: | | | | | | | | | | | | | | | | | | | | | | | | |
Net investment income (loss) | | | 1.51 | %†† | | | 1.25 | % | | | 1.41 | % | | | 1.51 | % | | | 2.29 | % | | | 2.12 | % |
Net expenses (d) | | | 1.28 | %†† | | | 1.28 | % | | | 1.25 | % | | | 1.25 | % | | | 1.25 | % | | | 1.25 | % |
Expenses (before waiver/reimbursement) (d) | | | 1.28 | %†† | | | 1.30 | % | | | 1.32 | % | | | 1.38 | % | | | 1.48 | % | | | 1.33 | % |
Portfolio turnover rate | | | 22 | % | | | 62 | % | | | 55 | % | | | 32 | % | | | 36 | % | | | 35 | % |
Net assets at end of period (in 000’s) | | $ | 42,997 | | | $ | 37,977 | | | $ | 30,224 | | | $ | 26,375 | | | $ | 21,498 | | | $ | 18,846 | |
| (a) | Per share data based on average shares outstanding during the period. |
| (b) | Total investment return is calculated exclusive of sales charges and assumes the reinvestment of dividends and distributions. |
| (c) | Total investment return is not annualized. |
| (d) | In addition to the fees and expenses which the Fund bears directly, the Fund indirectly bears a pro-rata share of the fees and expenses of the Underlying Funds in which it invests. Such indirect expenses are not included in the above expense ratios. |
| | | | | | |
The notes to the financial statements are an integral part of,
and should be read in conjunction with, the financial statements. | | mainstayinvestments.com | | | 19 | |
Financial Highlights selected per share data and ratios
| | | | | | | | | | | | | | | | | | | | | | | | |
| | | Class I | |
| | | Six months
ended
April 30, | | | Year ended October 31, | |
| | | 2013* | | | 2012 | | | 2011 | | | 2010 | | | 2009 | | | 2008 | |
Net asset value at beginning of period | | $ | 11.64 | | | $ | 11.02 | | | $ | 10.87 | | | $ | 9.95 | | | $ | 8.81 | | | $ | 11.54 | |
| | | | | | | | | | | | | | | | | | | | | | | | |
Net investment income (loss) (a) | | | 0.15 | | | | 0.27 | | | | 0.28 | | | | 0.27 | | | | 0.30 | | | | 0.33 | |
Net realized and unrealized gain (loss) on investments | | | 0.74 | | | | 0.77 | | | | 0.20 | | | | 0.92 | | | | 1.24 | | | | (2.41 | ) |
| | | | | | | | | | | | | | | | | | | | | | | | |
Total from investment operations | | | 0.89 | | | | 1.04 | | | | 0.48 | | | | 1.19 | | | | 1.54 | | | | (2.08 | ) |
| | | | | | | | | | | | | | | | | | | | | | | | |
Less dividends and distributions: | | | | | | | | | | | | | | | | | | | | | | | | |
From net investment income | | | (0.21 | ) | | | (0.31 | ) | | | (0.33 | ) | | | (0.27 | ) | | | (0.29 | ) | | | (0.52 | ) |
From net realized gain on investments | | | (0.17 | ) | | | (0.11 | ) | | | — | | | | — | | | | (0.11 | ) | | | (0.13 | ) |
| | | | | | | | | | | | | | | | | | | | | | | | |
Total dividends and distributions | | | (0.38 | ) | | | (0.42 | ) | | | (0.33 | ) | | | (0.27 | ) | | | (0.40 | ) | | | (0.65 | ) |
| | | | | | | | | | | | | | | | | | | | | | | | |
Net asset value at end of period | | $ | 12.15 | | | $ | 11.64 | | | $ | 11.02 | | | $ | 10.87 | | | $ | 9.95 | | | $ | 8.81 | |
| | | | | | | | | | | | | | | | | | | | | | | | |
Total investment return (b) | | | 7.75 | %(c) | | | 9.81 | % | | | 4.42 | % | | | 12.10 | % | | | 18.23 | % | | | (18.90 | %) |
Ratios (to average net assets)/Supplemental Data: | | | | | | | | | | | | | | | | | | | | | | | | |
Net investment income (loss) | | | 2.64 | %†† | | | 2.41 | % | | | 2.49 | % | | | 2.58 | % | | | 3.37 | % | | | 3.16 | % |
Net expenses (d) | | | 0.11 | %†† | | | 0.12 | % | | | 0.14 | % | | | 0.17 | % | | | 0.22 | % | | | 0.23 | % |
Expenses (before waiver/reimbursement) (d) | | | 0.11 | %†† | | | 0.12 | % | | | 0.14 | % | | | 0.17 | % | | | 0.22 | % | | | 0.28 | % |
Portfolio turnover rate | | | 22 | % | | | 62 | % | | | 55 | % | | | 32 | % | | | 36 | % | | | 35 | % |
Net assets at end of period (in 000’s) | | $ | 17,803 | | | $ | 15,916 | | | $ | 8,593 | | | $ | 5,611 | | | $ | 1,041 | | | $ | 1,150 | |
| (a) | Per share data based on average shares outstanding during the period. |
| (b) | Total investment return is calculated exclusive of sales charges and assumes the reinvestment of dividends and distributions. Class I shares are not subject to sales charges. |
| (c) | Total investment return is not annualized. |
| (d) | In addition to the fees and expenses which the Fund bears directly, the Fund indirectly bears a pro-rata share of the fees and expenses of the Underlying Funds in which it invests. Such indirect expenses are not included in the above expense ratios. |
| | | | |
| 20 | | MainStay Conservative Allocation Fund | | The notes to the financial statements are an integral part of,
and should be read in conjunction with, the financial statements. |
MainStay Moderate Allocation Fund
Investment and Performance Comparison1 (Unaudited)
Performance data quoted represents past performance. Past performance is no guarantee of future results. Because of market volatility, current performance may be lower or higher than the figures shown. Investment return and principal value will fluctuate, and as a result, when shares are redeemed, they may be worth more or less than their original cost. The graph below depicts the historical performance of Class I shares of the Fund. Performance will vary from class to class based on differences in class-specific expenses and sales charges. For performance information current to the most recent month-end, please call 800-MAINSTAY (624-6782) or visit mainstayinvestments.com.
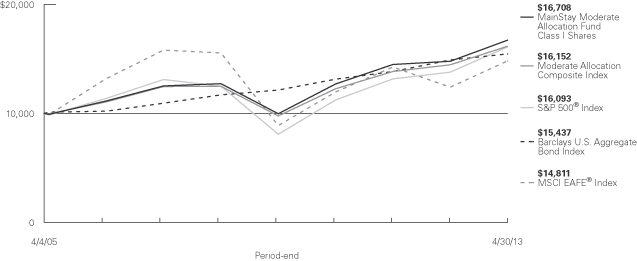
Average Annual Total Returns for the Period Ended April 30, 2013
| | | | | | | | | | | | | | | | | | | | | | | | |
| Class | | Sales Charge | | | | Six Months | | | One Year | | | Five Years | | | Since Inception (4/4/05) | | | Gross Expense Ratio2 | |
| Investor Class Shares3 | | Maximum 5.5% Initial Sales Charge | | With sales charges Excluding sales charges | |
| 4.40
10.48 | %
| |
| 6.54
12.74 | %
| |
| 4.06
5.24 | %
| |
| 5.48
6.22 | %
| |
| 1.56
1.56 | %
|
| Class A Shares | | Maximum 5.5% Initial Sales Charge | | With sales charges
Excluding sales charges | |
| 4.50
10.58 |
| |
| 6.73
12.94 |
| |
| 4.19
5.38 |
| |
| 5.54
6.28 |
| |
| 1.37
1.37 |
|
| Class B Shares | | Maximum 5% CDSC if Redeemed Within the First Six Years of Purchase | | With sales charges
Excluding sales charges | |
| 4.97
9.97 |
| |
| 6.86
11.86 |
| |
| 4.14
4.48 |
| |
| 5.41
5.41 |
| |
| 2.31
2.31 |
|
| Class C Shares | | Maximum 1% CDSC if Redeemed Within
One Year of Purchase | | With sales charges Excluding sales charges | |
| 8.97
9.97 |
| |
| 10.86
11.86 |
| |
| 4.45
4.45 |
| |
| 5.41
5.41 |
| |
| 2.31
2.31 |
|
| Class I Shares | | No Sales Charge | | | | | 10.62 | | | | 13.15 | | | | 5.63 | | | | 6.56 | | | | 1.12 | |
| 1. | The performance table and graph do not reflect the deduction of taxes that a shareholder would pay on dividends, distributions or Fund share redemptions. Total returns reflect maximum applicable sales charges as indicated in the table above, changes in share price, and reinvestment of dividend and capital gain distributions. The graph assumes the initial investment amount shown above and reflects the deduction of all sales charges that would have applied for the period of investment. Performance figures reflect certain fee waivers and/or expense limitations, without which total returns may have been lower. For more information on share classes and current fee waivers and/or expense limitations, please refer to the notes to the financial statements. |
| 2. | The gross expense ratios presented reflect the Fund’s “Total Annual Fund Operating Expenses” from the most recent Prospectus and may differ from other expense ratios disclosed in this report. |
| 3. | Performance figures for Investor Class shares, first offered on February 28, 2008, include the historical performance of Class A shares through February 27, 2008, adjusted for differences in certain fees and expenses. Unadjusted, the performance shown for the Investor Class shares would likely have been different. |
The footnotes on the next page are an integral part of the table and graph and should be carefully read in conjunction with them.
| | | | |
| mainstayinvestments.com | | | 21 | |
| | | | | | | | | | | | | | | | |
| Benchmark Performance | | Six
Months | | | One
Year | | | Five
Years | | | Since
Inception | |
S&P 500® Index4 | | | 14.42 | % | | | 16.89 | % | | | 5.21 | % | | | 6.07 | % |
MSCI EAFE® Index5 | | | 16.90 | | | | 19.39 | | | | –0.93 | | | | 4.99 | |
Barclays U.S. Aggregate Bond Index6 | | | 0.90 | | | | 3.68 | | | | 5.72 | | | | 5.53 | |
Moderate Allocation Composite Index7 | | | 9.12 | | | | 11.89 | | | | 5.29 | | | | 6.12 | |
Average Lipper Mixed-Asset Target Allocation Moderate Fund8 | | | 8.69 | | | | 11.00 | | | | 4.50 | | | | 5.34 | |
| 4. | “S&P 500®” is a trademark of The McGraw-Hill Companies, Inc. The S&P 500® Index is widely regarded as the standard index for measuring large-cap U.S. stock market performance. The S&P 500® Index is the Fund’s broad-based securities market index for comparison purposes. Results assume reinvestment of all income and capital gains. An investment cannot be made directly in an index. |
| 5. | The MSCI EAFE® Index consists of international stocks representing the developed world outside of North America. The MSCI EAFE® Index is the Fund’s secondary benchmark. Results assume reinvestment of all income and capital gains. An investment cannot be made directly in an index. |
| 6. | The Barclays U.S. Aggregate Bond Index is a broad-based benchmark that measures the investment grade, U.S. dollar-denominated, fixed-rate taxable bond market, including Treasurys, government-related and corporate securities, mortgage-backed securities (agency fixed-rate and hybrid adjustable rate mortgage pass-throughs), asset-backed securities, and commercial mortgage-backed securities. The Fund has selected the |
| | Barclays U.S. Aggregate Bond Index as an additional benchmark. Results assume reinvestment of all income and capital gains. An investment cannot be made directly in an index. |
| 7. | The Moderate Allocation Composite Index consists of the S&P 500® Index, the MSCI EAFE® Index and the Barclays U.S. Aggregate Bond Index weighted 50%, 10% and 40%, respectively. The Fund has selected the Moderate Allocation Composite Index as an additional benchmark. Total returns assume reinvestment of all dividends and capital gains. An investment cannot be made directly in an index. |
| 8. | The average Lipper mixed-asset target allocation moderate fund is representative of funds that, by portfolio practice, maintain a mix of between 40%-60% equity securities, with the remainder invested in bonds, cash, and cash equivalents. This benchmark is a product of Lipper Inc. Lipper Inc. is an independent monitor of fund performance. Results are based on average total returns of similar funds with all dividend and capital gain distributions reinvested. |
The footnotes on the preceding page are an integral part of the table and graph and should be carefully read in conjunction with them.
| | |
| 22 | | MainStay Moderate Allocation Fund |
Cost in Dollars of a $1,000 Investment in MainStay Moderate Allocation Fund (Unaudited)
The example below is intended to describe the fees and expenses borne by shareholders during the six-month period from November 1, 2012, to April 30, 2013, and the impact of those costs on your investment.
Example
As a shareholder of the Fund, you incur two types of costs: (1) transaction costs, including exchange fees and sales charges (loads) on purchases (as applicable), and (2) ongoing costs, including management fees, distribution and/or service (12b-1) fees, and other Fund expenses (as applicable). This example is intended to help you understand your ongoing costs (in dollars) of investing in the Fund and to compare these costs with the ongoing costs of investing in other mutual funds. The example is based on an investment of $1,000 made at the beginning of the six-month period and held for the entire period from November 1, 2012, to April 30, 2013.
This example illustrates your Fund’s ongoing costs in two ways:
Actual Expenses
The second and third data columns in the table below provide information about actual account values and actual expenses. You may use the information in these columns, together with the amount you invested, to estimate the expenses that you paid during the six months ended April 30, 2013. Simply divide your account value by $1,000 (for example, an $8,600 account value divided by $1,000 = 8.6), then
multiply the result by the number under the heading entitled “Expenses Paid During Period” to estimate the expenses you paid on your account during this period.
Hypothetical Example for Comparison Purposes
The fourth and fifth data columns in the table below provide information about hypothetical account values and hypothetical expenses based on the Fund’s actual expense ratio and an assumed rate of return of 5% per year before expenses, which is not the Fund’s actual return. The hypothetical account values and expenses may not be used to estimate the actual ending account balances or expenses you paid for the six-month period shown. You may use this information to compare the ongoing costs of investing in the Fund with the ongoing costs of investing in other Funds. To do so, compare this 5% hypothetical example with the 5% hypothetical examples that appear in the shareholder reports of the other Funds.
Please note that the expenses shown in the table are meant to highlight your ongoing costs only and do not reflect any transactional costs, such as exchange fees or sales charges (loads). Therefore, the fourth and fifth data columns of the table are useful in comparing ongoing costs only and will not help you determine the relative total costs of owning different funds. In addition, if these transactional costs were included, your costs would have been higher.
| | | | | | | | | | | | | | | | | | | | |
| | | | | | | | | | | | | | | | |
| Share Class | | Beginning
Account
Value
11/1/12 | | | Ending Account
Value (Based
on Actual
Returns and
Expenses)
4/30/13 | | | Expenses
Paid
During
Period1 | | | Ending Account
Value (Based
on Hypothetical
5% Annualized
Return and
Actual Expenses)
4/30/13 | | | Expenses
Paid
During
Period1 | |
| | | | | |
| Investor Class Shares | | $ | 1,000.00 | | | $ | 1,104.80 | | | $ | 2.77 | | | $ | 1,022.20 | | | $ | 2.66 | |
| | | | | |
| Class A Shares | | $ | 1,000.00 | | | $ | 1,105.80 | | | $ | 1.83 | | | $ | 1,023.10 | | | $ | 1.76 | |
| | | | | |
| Class B Shares | | $ | 1,000.00 | | | $ | 1,099.70 | | | $ | 6.66 | | | $ | 1,018.40 | | | $ | 6.41 | |
| | | | | |
| Class C Shares | | $ | 1,000.00 | | | $ | 1,099.70 | | | $ | 6.66 | | | $ | 1,018.40 | | | $ | 6.41 | |
| | | | | |
| Class I Shares | | $ | 1,000.00 | | | $ | 1,106.20 | | | $ | 0.52 | | | $ | 1,024.30 | | | $ | 0.50 | |
| 1. | Expenses are equal to the Fund’s annualized expense ratio of each class (0.53% for Investor Class, 0.35% for Class A, 1.28% for Class B and Class C and 0.10% for Class I) multiplied by the average account value over the period, divided by 365 and multiplied by 181 (to reflect the six-month period). The table above represents the actual expenses incurred during the six-month period. In addition to the fees and expenses which the Fund bears directly, the Fund indirectly bears a pro rata share of the fees and expenses of the Underlying Funds in which it invests. Such indirect expenses are not included in the above-reported expense figures. |
| | | | |
| mainstayinvestments.com | | | 23 | |
Investment Objectives of Underlying Funds as of April 30, 2013 (Unaudited)

See Portfolio of Investments on page 28 for specific holdings within these categories.
| | |
| 24 | | MainStay Moderate Allocation Fund |
Portfolio Management Discussion and Analysis (Unaudited)
Questions answered by portfolio managers Jae S. Yoon, CFA, Jonathan Swaney and Poul Kristensen, CFA, of New York Life Investments.1
How did MainStay Moderate Allocation Fund perform relative to its peers and its benchmark during the six months ended April 30, 2013?
Excluding all sales charges, MainStay Moderate Allocation Fund returned 10.48% for Investor Class shares, 10.58% for Class A shares and 9.97% for Class B and Class C shares for the six months ended April 30, 2013. Over the same period, Class I shares returned 10.62%. All share classes outperformed the 8.69% return of the average Lipper2 mixed-asset target allocation moderate fund for the six months ended April 30, 2013. Over the same period, all share classes underperformed the 14.42% return of the S&P 500® Index3 and the 16.90% return of the MSCI EAFE® Index.4 The S&P 500® Index is the Fund’s broad-based securities-market index, and the MSCI EAFE® Index is the secondary benchmark of the Fund. All share classes outperformed the 0.90% return of the Barclays U.S. Aggregate Bond Index5 and the 9.12% return of the Moderate Allocation Composite Index6 for the six months ended April 30, 2013. The Barclays U.S. Aggregate Bond Index and the Moderate Allocation Composite Index are additional benchmarks of the Fund. See page 21 for Fund returns with applicable sales charges.
Were there any changes to the Fund during the reporting period?
Effective February 28, 2013, the Fund’s Principal Investment Strategies were modified to broaden the investment ranges for each of the asset classes in which the Fund may invest by an additional ten percentage points. Also effective February 28, 2013, Poul Kristensen, CFA, was added as a portfolio manager. For more information on these changes, please see the Prospectus dated February 28, 2013.
What factors affected the Fund’s relative performance during the reporting period?
The Fund is a “fund of funds,” meaning that it seeks to achieve its investment objective by investing primarily in other MainStay Funds (the “Underlying Funds”). The Underlying Funds may invest in fixed-income securities or in domestic or international stocks at various capitalization levels. The Fund’s primary benchmark, on the other hand, consists entirely of U.S. large-cap stocks. These differences—particularly the Fund’s substantial allocation to Underlying Funds that invest in fixed-income securities—accounted for many of the challenges the Fund experienced in terms of relative performance.
The Fund provided strong returns relative to its average peer fund and the Moderate Allocation Composite Index during the reporting period. Much of that strength was attributable to asset class decisions. We maintained a neutral blend at the start of the reporting period then moved aggressively to overweight equities during the latter half of the fourth quarter. This proved to be a very profitable strategy, although the benefit was mitigated somewhat by an emphasis on large-cap stocks rather than small-cap stocks and on U.S. equities over international offerings. In the fixed-income portion of the Fund, a bias toward lower-quality bond offerings aided performance. Our decision to keep duration7 short in the fixed-income portion of the Fund had no meaningful impact on the Fund’s performance.
Performance of the Underlying Funds also influenced relative results. On the plus side, significant holdings in MainStay U.S. Equity Opportunities Fund and MainStay International Opportunities Fund helped relative performance, as both were near the top of their respective peer groups. Relying on MainStay Large Cap Growth Fund more heavily than MainStay Cornerstone Growth Fund also proved beneficial.
Positions in MainStay Epoch Global Choice Fund and MainStay Marketfield Fund weighed on returns. Neither of these Underlying Funds performed particularly well in relation to the portion of the market to which they provided exposure. All told, the performance of all Underlying Funds contributed positively—but not significantly—to relative performance.
How did you allocate the Fund’s assets during the reporting period and why?
We considered a variety of information, including the portfolio-level characteristics of the Underlying Funds, such as capitalization, style biases, sector exposures, credit quality and duration. We also examined the attributes of the Underlying Funds’ holdings, such as valuation metrics, earnings data and technical indicators. Finally, we evaluated the historical success of the managers responsible for the Underlying Funds. Generally speaking, we seek to invest in Underlying Funds that occupy attractively valued segments of the market, invest in fairly priced securities and are steered by individuals who have consistently demonstrated capable management in the past.
The Fund’s allocations to stocks and bonds varied over the course of the reporting period in response to the changing environment. We believed that equities presented a sizable
| 1. | “New York Life Investments” is a service mark used by New York Life Investment Management LLC. |
| 2. | See footnote on page 22 for more information on Lipper Inc. |
| 3. | See footnote on page 22 for more information on the S&P 500® Index. |
| 4. | See footnote on page 22 for more information on the MSCI EAFE® Index. |
| 5. | See footnote on page 22 for more information on the Barclays U.S. Aggregate Bond Index. |
| 6. | See footnote on page 22 for more information on the Moderate Allocation Composite Index. |
| 7. | Duration is a measure of the price sensitivity of a fixed-income investment to changes in interest rates. Duration is expressed as a number of years and is considered a more accurate sensitivity gauge than average maturity. |
| | | | |
| mainstayinvestments.com | | | 25 | |
valuation advantage over bonds and that corporate profit gains would help propel stock prices higher. For these reasons, we gave the Fund a decisive tilt in favor of stocks over bonds throughout most of the reporting period. Within the equity portion of the Fund, we maintained a bias in favor of Underlying Funds that invest in U.S. stocks over Underlying Funds that invest in stocks traded in other developed markets. We were particularly concerned about countries that are likely to struggle with deleveraging issues even greater than those presented in the United States. Results were mixed, as Japan in particular experienced very strong returns on the back of aggressive fiscal and monetary policy changes.
In the fixed-income portion of the Fund, we continued to maintain a shorter duration than the Barclays U.S. Aggregate Bond Index. We also tilted the fixed-income portion of the Fund decidedly toward Underlying Funds that invest in corporate bonds over those that invest primarily in government-backed issues. This positioning reflected our opinion that high-grade bonds were very expensive and that issues from corporate borrowers deemed to be of lower quality represented a far more attractive proposition. Given ample liquidity and healthy corporate balance sheets, we believed that default rates were likely to remain low. We also believed that investors were likely to find the higher yields available from corporate debt quite attractive compared to the yields available on U.S. Treasury instruments.
How did the Fund’s allocations change over the course of the reporting period?
Position sizes naturally fluctuate with changing market conditions, and such changes do not always reflect an explicit change in our strategic or tactical point of view. That said, the most notable allocation changes during the reporting period were associated with the expanding list of eligible investments, as several new MainStay Funds became available.
MainStay Marketfield Fund, a global long/short and low-beta8 product, was one of the largest new positions, established by using proceeds from a mix of other Underlying Equity Funds. MainStay Short Duration High Yield Fund was another new offering, which the Fund selected as part of an ongoing effort to protect against a potential rise in interest rates. We quickly built the Fund’s position after the Underlying Fund’s launch in December 2012. The purchases were made with proceeds from MainStay High Yield Corporate Bond Fund and MainStay Floating Rate Fund.
MainStay Cornerstone Growth Fund was another new product. We established a position in this Underlying Fund using proceeds from MainStay Large Cap Growth Fund as we sought to widen strategy diversification within that portion of the market.
A new holding was established in MainStay High Yield Municipal Bond Fund, which further diversified sources of credit risk within the fixed-income portion of the Fund. We believed that high-yield municipal bonds would be attractive despite the inapplicability of tax benefits usually associated with these types of instruments. Funding for this investment came in large part from MainStay Unconstrained Bond Fund (formerly MainStay Flexible Bond Opportunities Fund).
Also of note, we increased the Fund’s position in MainStay U.S. Small Cap Fund as we unwound the Fund’s previous large-cap bias. The increased allocation was funded from a mix of Underlying Equity Funds.
During the reporting period, which Underlying Equity Funds had the highest total returns and which Underlying Equity Funds had the lowest total returns?
MainStay International Opportunities Fund generated the highest absolute return by a comfortable margin, followed by MainStay U.S. Small Cap Fund. Although none of the Underlying Equity Funds in which the Fund invested provided negative returns for the reporting period, the lowest absolute returns in the equity portion of the Fund came from MainStay Cornerstone Growth Fund and MainStay International Equity Fund.
Which Underlying Equity Funds made the strongest positive contributions to the Fund’s overall performance, and which Underlying Equity Funds were the greatest detractors?
Because contributions take weightings and total returns into account and position sizes may vary, the Underlying Funds with the highest (or lowest) returns may not always have the most significantly positive (or negative) contributions to performance.
During the reporting period, large positions in MainStay MAP Fund and MainStay Large Cap Growth Fund made the largest positive contributions to the Fund’s overall performance. Although none of the Underlying Equity Funds in which the Fund invested had negative total returns, the smallest contributions came from a new position being built in MainStay Cornerstone Growth Fund and from a very small position in MainStay ICAP Select Equity Fund.
What factors and risks affected the Fund’s Underlying Fixed Income Fund investments during the reporting period?
Monetary policy continued to play a significant role in fixed-income markets, as has been the case for several years. Faced
with persistently sluggish economic growth, slow rates of job creation and the prospect of significant fiscal drag, the Federal Reserve elected to extend its large-scale asset purchase
| 8. | Beta is a measure of volatility in relation to the market as a whole. A beta higher than 1 indicates that a security or portfolio will tend to exhibit higher volatility than the market. A beta lower than 1 indicates that a security or portfolio will tend to exhibit lower volatility than the market. |
| | |
| 26 | | MainStay Moderate Allocation Fund |
program indefinitely. This decision helped keep interest rates close to their all-time lows. During the reporting period, the Fund favored Underlying Fixed Income Funds that invest in higher-yielding corporate bonds over those that invest primarily in government-backed issues. This strategy proved fortunate. Credit performed quite well as default rates remained low and the comparatively higher yields of these bonds attracted many buyers.
During the reporting period, which fixed-income market segments were strong performers and which segments were particularly weak?
High-yield corporate bonds performed exceptionally well as spreads9 to U.S. Treasurys continued to contract. The lowest returns came from the most liquid, highest-quality and shortest-term debt instruments. Cash returned nothing, and returns on short-term U.S. government debt and AAA bonds were only slightly higher.
Which Underlying Fixed Income Funds made the strongest positive contributions to the Fund’s performance, and which Underlying Fixed Income Funds were the greatest detractors?
The largest contribution to the fixed-income portion of the Fund came from a substantial position in MainStay Floating Rate Fund. This was followed by a much smaller position in MainStay Unconstrained Bond Fund. The contribution from positions in MainStay Money Market Fund and MainStay Indexed Bond Fund was effectively zero.
| 9. | The terms “spread” and “yield spread” may refer to the difference in yield between a security or type of security and comparable U.S. Treasury issues. The terms may also refer to the difference in yield between two specific securities or types of securities at a given time. |
The opinions expressed are those of the portfolio managers as of the date of this report and are subject to change. There is no guarantee that any forecast made will come to pass. This material does not constitute investment advice and is not intended as an endorsement of any specific investment.
| | | | |
| mainstayinvestments.com | | | 27 | |
Portfolio of Investments April 30, 2013 (Unaudited)
| | | | | | | | |
| | |
| | | Shares | | | Value | |
| Affiliated Investment Companies 100.1%† | |
Equity Funds 62.4% | |
MainStay Cornerstone Growth Fund Class I | | | 356,589 | | | $ | 10,644,168 | |
MainStay Epoch Global Choice Fund Class I (a) | | | 851,031 | | | | 15,761,087 | |
MainStay Epoch U.S. All Cap Fund Class I (a) | | | 1,457,850 | | | | 36,679,503 | |
MainStay ICAP Equity Fund Class I | | | 846,773 | | | | 38,206,400 | |
MainStay ICAP International Fund Class I | | | 429,529 | | | | 13,929,612 | |
MainStay ICAP Select Equity Fund Class I | | | 27,610 | | | | 1,189,160 | |
MainStay International Equity Fund Class I | | | 465,815 | | | | 5,873,924 | |
MainStay International Opportunities Fund Class I (a) | | | 2,466,715 | | | | 20,177,726 | |
MainStay Large Cap Growth Fund Class I | | | 3,545,434 | | | | 31,270,731 | |
MainStay MAP Fund Class I | | | 1,639,065 | | | | 65,267,582 | |
MainStay Marketfield Fund Class I (b) | | | 610,743 | | | | 10,187,197 | |
MainStay S&P 500 Index Fund Class I | | | 84,211 | | | | 3,125,081 | |
MainStay U.S. Equity Opportunities Fund Class I (a) | | | 6,467,597 | | | | 58,661,105 | |
MainStay U.S. Small Cap Fund Class I (a) | | | 627,292 | | | | 13,110,408 | |
| | | | | | | | |
Total Equity Funds
(Cost $255,481,863) | | | | | | | 324,083,684 | |
| | | | | | | | |
Fixed Income Funds 37.7% | | | | | | | | |
MainStay Floating Rate Fund Class I (a) | | | 4,350,411 | | | | 42,024,966 | |
MainStay High Yield Corporate Bond Fund Class I | | | 1,125,367 | | | | 6,999,785 | |
MainStay High Yield Municipal Bond Fund Class I | | | 417,396 | | | | 5,067,187 | |
MainStay High Yield Opportunities Fund Class I | | | 17,420 | | | | 216,179 | |
| | | | | | | | |
| | |
| | | Shares | | | Value | |
Fixed Income Funds (continued) | | | | | | | | |
MainStay Indexed Bond Fund Class I | | | 25,400 | | | $ | 288,032 | |
MainStay Intermediate Term Bond Fund Class I (a) | | | 9,195,882 | | | | 102,350,164 | |
MainStay Money Market Fund Class A | | | 13,209,959 | | | | 13,209,959 | |
MainStay Short Duration High Yield Fund Class I (a) | | | 644,928 | | | | 6,494,428 | |
MainStay Short Term Bond Fund Class I | | | 101,124 | | | | 972,809 | |
MainStay Unconstrained Bond Fund Class I (a) | | | 1,914,297 | | | | 18,109,249 | |
| | | | | | | | |
Total Fixed Income Funds
(Cost $187,805,394) | | | | | | | 195,732,758 | |
| | | | | | | | |
Total Investments
(Cost $443,287,257) (c) | | | 100.1 | % | | | 519,816,442 | |
Other Assets, Less Liabilities | | | (0.1 | ) | | | (368,096 | ) |
Net Assets | | | 100.0 | % | | $ | 519,448,346 | |
| † | Percentages indicated are based on Fund net assets. |
| (a) | The Fund’s ownership exceeds 5% of the outstanding shares of the Underlying Fund’s share class. (See Note 3) |
| (b) | Non-income producing Underlying Fund. |
| (c) | As of April 30, 2013, cost is $448,709,852 for federal income tax purposes and net unrealized appreciation is as follows: |
| | | | |
Gross unrealized appreciation | | $ | 76,529,188 | |
Gross unrealized depreciation | | | (5,422,598 | ) |
| | | | |
Net unrealized appreciation | | $ | 71,106,590 | |
| | | | |
The following is a summary of the fair valuations according to the inputs used as of April 30, 2013, for valuing the Fund’s assets.
Asset Valuation Inputs
| | | | | | | | | | | | | | | | |
Description | | Quoted
Prices in
Active
Markets for
Identical
Assets (Level 1) | | | Significant
Other
Observable
Inputs
(Level 2) | | | Significant
Unobservable
Inputs
(Level 3) | | | Total | |
| Investments (a) | | | | | | | | | | | | | | | | |
| Affiliated Investment Companies | | | | | | | | | | | | | | | | |
Equity Funds | | $ | 324,083,684 | | | $ | — | | | $ | — | | | $ | 324,083,684 | |
Fixed Income Funds | | | 195,732,758 | | | | — | | | | — | | | | 195,732,758 | |
| | | | | | | | | | | | | | | | |
| Total Investments | | $ | 519,816,442 | | | $ | — | | | $ | — | | | $ | 519,816,442 | |
| | | | | | | | | | | | | | | | |
| (a) | For a complete listing of investments, see the Portfolio of Investments. |
The Fund recognizes transfers between the levels as of the beginning of the period.
For the period ended April 30, 2013, the Fund did not have any transfers between Level 1 and Level 2 fair value measurements. (See Note 2)
As of April 30, 2013, the Fund did not hold any investments with significant unobservable inputs (Level 3). (See Note 2)
| | | | |
| 28 | | MainStay Moderate Allocation Fund | | The notes to the financial statements are an integral part of,
and should be read in conjunction with, the financial statements. |
Statement of Assets and Liabilities as of April 30, 2013 (Unaudited)
| | | | |
| Assets | | | | |
Investment in affiliated investment companies, at value (identified cost $443,287,257) | | $ | 519,816,442 | |
Receivables: | | | | |
Fund shares sold | | | 353,130 | |
Other assets | | | 58,113 | |
| | | | |
Total assets | | | 520,227,685 | |
| | | | |
| |
| Liabilities | | | | |
Payables: | | | | |
Fund shares redeemed | | | 433,285 | |
NYLIFE Distributors (See Note 3) | | | 181,935 | |
Transfer agent (See Note 3) | | | 112,085 | |
Shareholder communication | | | 26,367 | |
Professional fees | | | 17,003 | |
Custodian | | | 1,188 | |
Trustees | | | 1,122 | |
Accrued expenses | | | 6,354 | |
| | | | |
Total liabilities | | | 779,339 | |
| | | | |
Net assets | | $ | 519,448,346 | |
| | | | |
| |
| Composition of Net Assets | | | | |
Shares of beneficial interest outstanding (par value of $.001 per share) unlimited number of shares authorized | | $ | 40,280 | |
Additional paid-in capital | | | 442,510,800 | |
| | | | |
| | | 442,551,080 | |
Distributions in excess of net investment income | | | (967,731 | ) |
Accumulated net realized gain (loss) on investments | | | 1,335,812 | |
Net unrealized appreciation (depreciation) on investments | | | 76,529,185 | |
| | | | |
Net assets | | $ | 519,448,346 | |
| | | | |
| | | | |
Investor Class | | | | |
Net assets applicable to outstanding shares | | $ | 117,329,407 | |
| | | | |
Shares of beneficial interest outstanding | | | 9,076,823 | |
| | | | |
Net asset value per share outstanding | | $ | 12.93 | |
Maximum sales charge (5.50% of offering price) | | | 0.75 | |
| | | | |
Maximum offering price per share outstanding | | $ | 13.68 | |
| | | | |
Class A | | | | |
Net assets applicable to outstanding shares | | $ | 258,126,451 | |
| | | | |
Shares of beneficial interest outstanding | | | 19,969,870 | |
| | | | |
Net asset value per share outstanding | | $ | 12.93 | |
Maximum sales charge (5.50% of offering price) | | | 0.75 | |
| | | | |
Maximum offering price per share outstanding | | $ | 13.68 | |
| | | | |
Class B | | | | |
Net assets applicable to outstanding shares | | $ | 84,265,530 | |
| | | | |
Shares of beneficial interest outstanding | | | 6,582,345 | |
| | | | |
Net asset value and offering price per share outstanding | | $ | 12.80 | |
| | | | |
Class C | | | | |
Net assets applicable to outstanding shares | | $ | 46,788,132 | |
| | | | |
Shares of beneficial interest outstanding | | | 3,654,679 | |
| | | | |
Net asset value and offering price per share outstanding | | $ | 12.80 | |
| | | | |
Class I | | | | |
Net assets applicable to outstanding shares | | $ | 12,938,826 | |
| | | | |
Shares of beneficial interest outstanding | | | 996,596 | |
| | | | |
Net asset value and offering price per share outstanding | | $ | 12.98 | |
| | | | |
| | | | | | |
The notes to the financial statements are an integral part of,
and should be read in conjunction with, the financial statements. | | mainstayinvestments.com | | | 29 | |
Statement of Operations for the six months ended April 30, 2013 (Unaudited)
| | | | |
| Investment Income (Loss) | | | | |
Income | | | | |
Dividend distributions from affiliated investment companies | | $ | 6,294,948 | |
| | | | |
Expenses | | | | |
Distribution/Service—Investor Class (See Note 3) | | | 135,838 | |
Distribution/Service—Class A (See Note 3) | | | 297,420 | |
Distribution/Service—Class B (See Note 3) | | | 399,989 | |
Distribution/Service—Class C (See Note 3) | | | 218,956 | |
Transfer agent (See Note 3) | | | 331,564 | |
Registration | | | 39,643 | |
Shareholder communication | | | 38,601 | |
Professional fees | | | 20,503 | |
Trustees | | | 5,541 | |
Custodian | | | 2,480 | |
Miscellaneous | | | 11,049 | |
| | | | |
Total expenses | | | 1,501,584 | |
| | | | |
Net investment income (loss) | | | 4,793,364 | |
| | | | |
|
| Realized and Unrealized Gain (Loss) on Investments | |
Net realized gain (loss) on: | | | | |
Affiliated investment company transactions | | | 4,970,647 | |
Realized capital gain distributions from affiliated investment companies | | | 7,162,199 | |
| | | | |
Net realized gain (loss) on investments and investments from affiliated investment companies | | | 12,132,846 | |
| | | | |
Net change in unrealized appreciation (depreciation) on investments | | | 31,367,119 | |
| | | | |
Net realized and unrealized gain (loss) on investments | | | 43,499,965 | |
| | | | |
Net increase (decrease) in net assets resulting from operations | | $ | 48,293,329 | |
| | | | |
| | | | |
| 30 | | MainStay Moderate Allocation Fund | | The notes to the financial statements are an integral part of,
and should be read in conjunction with, the financial statements. |
Statements of Changes in Net Assets
for the six months ended April 30, 2013 (Unaudited) and the year ended October 31, 2012
| | | | | | | | |
| | | 2013 | | | 2012 | |
| Increase (Decrease) in Net Assets | |
Operations: | | | | | | | | |
Net investment income (loss) | | $ | 4,793,364 | | | $ | 6,560,825 | |
Net realized gain (loss) on investments and investments from affiliated investment companies transactions | | | 12,132,846 | | | | 7,026,439 | |
Net change in unrealized appreciation (depreciation) on investments | | | 31,367,119 | | | | 29,009,472 | |
| | | | |
Net increase (decrease) in net assets resulting from operations | | | 48,293,329 | | | | 42,596,736 | |
| | | | |
Dividends to shareholders: | | | | | | | | |
From net investment income: | | | | | | | | |
Investor Class | | | (2,260,705 | ) | | | (1,681,579 | ) |
Class A | | | (5,391,886 | ) | | | (4,127,248 | ) |
Class B | | | (1,130,940 | ) | | | (810,977 | ) |
Class C | | | (624,666 | ) | | | (434,349 | ) |
Class I | | | (323,100 | ) | | | (221,938 | ) |
| | | | |
Total dividends to shareholders | | | (9,731,297 | ) | | | (7,276,091 | ) |
| | | | |
Capital share transactions: | | | | | | | | |
Net proceeds from sale of shares | | | 48,477,474 | | | | 79,215,407 | |
Net asset value of shares issued to shareholders in reinvestment of dividends | | | 9,337,808 | | | | 6,951,917 | |
Cost of shares redeemed | | | (41,531,781 | ) | | | (77,604,432 | ) |
| | | | |
Increase (decrease) in net assets derived from capital share transactions | | | 16,283,501 | | | | 8,562,892 | |
| | | | |
Net increase (decrease) in net assets | | | 54,845,533 | | | | 43,883,537 | |
| | |
| Net Assets | | | | | | | | |
Beginning of period | | | 464,602,813 | | | | 420,719,276 | |
| | | | |
End of period | | $ | 519,448,346 | | | $ | 464,602,813 | |
| | | | |
Undistributed (distributions in excess of) net investment income at end of period | | $ | (967,731 | ) | | $ | 3,970,202 | |
| | | | |
| | | | | | |
The notes to the financial statements are an integral part of,
and should be read in conjunction with, the financial statements. | | mainstayinvestments.com | | | 31 | |
Financial Highlights selected per share data and ratios
| | | | | | | | | | | | | | | | | | | | | | | | |
| | | Investor Class | |
| | | Six months
ended
April 30, | | | Year ended October 31, | | | February 28,
2008**
through
October 31, | |
| | | 2013* | | | 2012 | | | 2011 | | | 2010 | | | 2009 | | | 2008 | |
Net asset value at beginning of period | | $ | 11.96 | | | $ | 11.06 | | | $ | 10.86 | | | $ | 9.84 | | | $ | 8.77 | | | $ | 11.12 | |
| | | | | | | | | | | | | | | | | | | | | | | | |
Net investment income (loss) (a) | | | 0.13 | | | | 0.18 | | | | 0.18 | | | | 0.17 | | | | 0.22 | | | | 0.14 | |
Net realized and unrealized gain (loss)
on investments | | | 1.10 | | | | 0.93 | | | | 0.23 | | | | 1.03 | | | | 1.22 | | | | (2.49 | ) |
| | | | | | | | | | | | | | | | | | | | | | | | |
Total from investment operations | | | 1.23 | | | | 1.11 | | | | 0.41 | | | | 1.20 | | | | 1.44 | | | | (2.35 | ) |
| | | | | | | | | | | | | | | | | | | | | | | | |
Less dividends and distributions: | | | | | | | | | | | | | | | | | | | | | | | | |
From net investment income | | | (0.26 | ) | | | (0.21 | ) | | | (0.21 | ) | | | (0.18 | ) | | | (0.26 | ) | | | — | |
From net realized gain on investments | | | — | | | | — | | | | — | | | | — | | | | (0.11 | ) | | | — | |
| | | | | | | | | | | | | | | | | | | | | | | | |
Total dividends and distributions | | | (0.26 | ) | | | (0.21 | ) | | | (0.21 | ) | | | (0.18 | ) | | | (0.37 | ) | | | — | |
| | | | | | | | | | | | | | | | | | | | | | | | |
Net asset value at end of period | | $ | 12.93 | | | $ | 11.96 | | | $ | 11.06 | | | $ | 10.86 | | | $ | 9.84 | | | $ | 8.77 | |
| | | | | | | | | | | | | | | | | | | | | | | | |
Total investment return (b) | | | 10.48 | %(c) | | | 10.19 | % | | | 3.73 | % | | | 12.49 | % | | | 17.12 | % | | | (21.13 | %)(c) |
Ratios (to average net assets)/Supplemental Data: | | | | | | | | | | | | | | | | | | | | | | | | |
Net investment income (loss) | | | 2.06 | %†† | | | 1.57 | % | | | 1.65 | % | | | 1.64 | % | | | 2.48 | % | | | 1.94 | % †† |
Net expenses (d) | | | 0.53 | %†† | | | 0.53 | % | | | 0.50 | % | | | 0.50 | % | | | 0.46 | % | | | 0.45 | % †† |
Expenses (before waiver/reimbursement) (d) | | | 0.53 | %†† | | | 0.54 | % | | | 0.56 | % | | | 0.60 | % | | | 0.73 | % | | | 0.61 | % †† |
Portfolio turnover rate | | | 20 | % | | | 64 | % | | | 60 | % | | | 41 | % | | | 35 | % | | | 40 | % |
Net assets at end of period (in 000’s) | | $ | 117,329 | | | $ | 102,910 | | | $ | 90,248 | | | $ | 78,993 | | | $ | 63,454 | | | $ | 46,290 | |
| ** | Commencement of operations. |
| (a) | Per share data based on average shares outstanding during the period. |
| (b) | Total investment return is calculated exclusive of sales charges and assumes the reinvestment of dividends and distributions. |
| (c) | Total investment return is not annualized. |
| (d) | In addition to the fees and expenses which the Fund bears directly, the Fund indirectly bears a pro-rata share of the fees and expenses of the Underlying Funds in which it invests. Such indirect expenses are not included in the above expense ratios. |
| | | | |
| 32 | | MainStay Moderate Allocation Fund | | The notes to the financial statements are an integral part of,
and should be read in conjunction with, the financial statements. |
Financial Highlights selected per share data and ratios
| | | | | | | | | | | | | | | | | | | | | | | | |
| | | Class A | |
| | | Six months
ended
April 30, | | | Year ended October 31, | |
| | | 2013* | | | 2012 | | | 2011 | | | 2010 | | | 2009 | | | 2008 | |
Net asset value at beginning of period | | $ | 11.97 | | | $ | 11.06 | | | $ | 10.87 | | | $ | 9.83 | | | $ | 8.76 | | | $ | 12.32 | |
| | | | | | | | | | | | | | | | | | | | | | | | |
Net investment income (loss) (a) | | | 0.14 | | | | 0.20 | | | | 0.20 | | | | 0.18 | | | | 0.22 | | | | 0.24 | |
Net realized and unrealized gain (loss) on investments | | | 1.10 | | | | 0.93 | | | | 0.22 | | | | 1.05 | | | | 1.22 | | | | (3.29 | ) |
| | | | | | | | | | | | | | | | | | | | | | | | |
Total from investment operations | | | 1.24 | | | | 1.13 | | | | 0.42 | | | | 1.23 | | | | 1.44 | | | | (3.05 | ) |
| | | | | | | | | | | | | | | | | | | | | | | | |
Less dividends and distributions: | | | | | | | | | | | | | | | | | | | | | | | | |
From net investment income | | | (0.28 | ) | | | (0.22 | ) | | | (0.23 | ) | | | (0.19 | ) | | | (0.26 | ) | | | (0.31 | ) |
From net realized gain on investments | | | — | | | | — | | | | — | | | | — | | | | (0.11 | ) | | | (0.20 | ) |
| | | | | | | | | | | | | | | | | | | | | | | | |
Total dividends and distributions | | | (0.28 | ) | | | (0.22 | ) | | | (0.23 | ) | | | (0.19 | ) | | | (0.37 | ) | | | (0.51 | ) |
| | | | | | | | | | | | | | | | | | | | | | | | |
Net asset value at end of period | | $ | 12.93 | | | $ | 11.97 | | | $ | 11.06 | | | $ | 10.87 | | | $ | 9.83 | | | $ | 8.76 | |
| | | | | | | | | | | | | | | | | | | | | | | | |
Total investment return (b) | | | 10.58 | %(c) | | | 10.43 | % | | | 3.85 | % | | | 12.65 | % | | | 17.14 | % | | | (25.78 | %) |
Ratios (to average net assets)/Supplemental Data: | | | | | | | | | | | | | | | | | | | | | | | | |
Net investment income (loss) | | | 2.26 | %†† | | | 1.75 | % | | | 1.79 | % | | | 1.76 | % | | | 2.56 | % | | | 2.17 | % |
Net expenses (d) | | | 0.35 | %†† | | | 0.35 | % | | | 0.36 | % | | | 0.38 | % | | | 0.43 | % | | | 0.46 | % |
Portfolio turnover rate | | | 20 | % | | | 64 | % | | | 60 | % | | | 41 | % | | | 35 | % | | | 40 | % |
Net assets at end of period (in 000’s) | | $ | 258,126 | | | $ | 229,051 | | | $ | 207,282 | | | $ | 210,071 | | | $ | 176,139 | | | $ | 146,133 | |
| (a) | Per share data based on average shares outstanding during the period. |
| (b) | Total investment return is calculated exclusive of sales charges and assumes the reinvestment of dividends and distributions. |
| (c) | Total investment return is not annualized. |
| (d) | In addition to the fees and expenses which the Fund bears directly, the Fund indirectly bears a pro-rata share of the fees and expenses of the Underlying Funds in which it invests. Such indirect expenses are not included in the above expense ratios. |
| | | | | | |
The notes to the financial statements are an integral part of,
and should be read in conjunction with, the financial statements. | | mainstayinvestments.com | | | 33 | |
Financial Highlights selected per share data and ratios
| | | | | | | | | | | | | | | | | | | | | | | | |
| | | Class B | |
| | | Six months
ended
April 30, | | | Year ended October 31, | |
| | | 2013* | | | 2012 | | | 2011 | | | 2010 | | | 2009 | | | 2008 | |
Net asset value at beginning of period | | $ | 11.81 | | | $ | 10.91 | | | $ | 10.72 | | | $ | 9.72 | | | $ | 8.65 | | | $ | 12.23 | |
| | | | | | | | | | | | | | | | | | | | | | | | |
Net investment income (loss) (a) | | | 0.08 | | | | 0.10 | | | | 0.10 | | | | 0.09 | | | | 0.15 | | | | 0.15 | |
Net realized and unrealized gain (loss) on investments | | | 1.08 | | | | 0.92 | | | | 0.22 | | | | 1.03 | | | | 1.21 | | | | (3.27 | ) |
| | | | | | | | | | | | | | | | | | | | | | | | |
Total from investment operations | | | 1.16 | | | | 1.02 | | | | 0.32 | | | | 1.12 | | | | 1.36 | | | | (3.12 | ) |
| | | | | | | | | | | | | | | | | | | | | | | | |
Less dividends and distributions: | | | | | | | | | | | | | | | | | | | | | | | | |
From net investment income | | | (0.17 | ) | | | (0.12 | ) | | | (0.13 | ) | | | (0.12 | ) | | | (0.18 | ) | | | (0.26 | ) |
From net realized gain on investments | | | — | | | | — | | | | — | | | | — | | | | (0.11 | ) | | | (0.20 | ) |
| | | | | | | | | | | | | | | | | | | | | | | | |
Total dividends and distributions | | | (0.17 | ) | | | (0.12 | ) | | | (0.13 | ) | | | (0.12 | ) | | | (0.29 | ) | | | (0.46 | ) |
| | | | | | | | | | | | | | | | | | | | | | | | |
Net asset value at end of period | | $ | 12.80 | | | $ | 11.81 | | | $ | 10.91 | | | $ | 10.72 | | | $ | 9.72 | | | $ | 8.65 | |
| | | | | | | | | | | | | | | | | | | | | | | | |
Total investment return (b) | | | 9.97 | %(c) | | | 9.47 | % | | | 2.94 | % | | | 11.71 | % | | | 16.34 | % | | | (26.41 | %) |
Ratios (to average net assets)/Supplemental Data: | | | | | | | | | | | | | | | | | | | | | | | | |
Net investment income (loss) | | | 1.34 | %†† | | | 0.84 | % | | | 0.90 | % | | | 0.89 | % | | | 1.77 | % | | | 1.38 | % |
Net expenses (d) | | | 1.28 | %†† | | | 1.28 | % | | | 1.25 | % | | | 1.25 | % | | | 1.21 | % | | | 1.22 | % |
Expenses (before waiver/reimbursement) (d) | | | 1.28 | %†† | | | 1.29 | % | | | 1.31 | % | | | 1.35 | % | | | 1.49 | % | | | 1.32 | % |
Portfolio turnover rate | | | 20 | % | | | 64 | % | | | 60 | % | | | 41 | % | | | 35 | % | | | 40 | % |
Net assets at end of period (in 000’s) | | $ | 84,266 | | | $ | 77,807 | | | $ | 73,686 | | | $ | 72,829 | | | $ | 67,726 | | | $ | 58,738 | |
| (a) | Per share data based on average shares outstanding during the period. |
| (b) | Total investment return is calculated exclusive of sales charges and assumes the reinvestment of dividends and distributions. |
| (c) | Total investment return is not annualized. |
| (d) | In addition to the fees and expenses which the Fund bears directly, the Fund indirectly bears a pro-rata share of the fees and expenses of the Underlying Funds in which it invests. Such indirect expenses are not included in the above expense ratios. |
| | | | |
| 34 | | MainStay Moderate Allocation Fund | | The notes to the financial statements are an integral part of,
and should be read in conjunction with, the financial statements. |
Financial Highlights selected per share data and ratios
| | | | | | | | | | | | | | | | | | | | | | | | |
| | | Class C | |
| | | Six months
ended
April 30, | | | Year ended October 31, | |
| | | 2013* | | | 2012 | | | 2011 | | | 2010 | | | 2009 | | | 2008 | |
Net asset value at beginning of period | | $ | 11.81 | | | $ | 10.91 | | | $ | 10.73 | | | $ | 9.72 | | | $ | 8.66 | | | $ | 12.23 | |
| | | | | | | | | | | | | | | | | | | | | | | | |
Net investment income (loss) (a) | | | 0.08 | | | | 0.09 | | | | 0.10 | | | | 0.09 | | | | 0.15 | | | | 0.15 | |
Net realized and unrealized gain (loss) on investments | | | 1.08 | | | | 0.93 | | | | 0.22 | | | | 1.04 | | | | 1.20 | | | | (3.26 | ) |
| | | | | | | | | | | | | | | | | | | | | | | | |
Total from investment operations | | | 1.16 | | | | 1.02 | | | | 0.32 | | | | 1.13 | | | | 1.35 | | | | (3.11 | ) |
| | | | | | | | | | | | | | | | | | | | | | | | |
Less dividends and distributions: | | | | | | | | | | | | | | | | | | | | | | | | |
From net investment income | | | (0.17 | ) | | | (0.12 | ) | | | (0.14 | ) | | | (0.12 | ) | | | (0.18 | ) | | | (0.26 | ) |
From net realized gain on investments | | | — | | | | — | | | | — | | | | — | | | | (0.11 | ) | | | (0.20 | ) |
| | | | | | | | | | | | | | | | | | | | | | | | |
Total dividends and distributions | | | (0.17 | ) | | | (0.12 | ) | | | (0.14 | ) | | | (0.12 | ) | | | (0.29 | ) | | | (0.46 | ) |
| | | | | | | | | | | | | | | | | | | | | | | | |
Net asset value at end of period | | $ | 12.80 | | | $ | 11.81 | | | $ | 10.91 | | | $ | 10.73 | | | $ | 9.72 | | | $ | 8.66 | |
| | | | | | | | | | | | | | | | | | | | | | | | |
Total investment return (b) | | | 9.97 | %(c) | | | 9.47 | % | | | 2.94 | % | | | 11.69 | % | | | 16.19 | % | | | (26.33 | %) |
Ratios (to average net assets)/Supplemental Data: | | | | | | | | | | | | | | | | | | | | | | | | |
Net investment income (loss) | | | 1.33 | %†† | | | 0.83 | % | | | 0.91 | % | | | 0.90 | % | | | 1.78 | % | | | 1.39 | % |
Net expenses (d) | | | 1.28 | %†† | | | 1.28 | % | | | 1.25 | % | | | 1.25 | % | | | 1.21 | % | | | 1.22 | % |
Expenses (before waiver/reimbursement) (d) | | | 1.28 | %†† | | | 1.29 | % | | | 1.31 | % | | | 1.35 | % | | | 1.49 | % | | | 1.32 | % |
Portfolio turnover rate | | | 20 | % | | | 64 | % | | | 60 | % | | | 41 | % | | | 35 | % | | | 40 | % |
Net assets at end of period (in 000’s) | | $ | 46,788 | | | $ | 42,203 | | | $ | 39,531 | | | $ | 37,895 | | | $ | 33,043 | | | $ | 27,005 | |
| (a) | Per share data based on average shares outstanding during the period. |
| (b) | Total investment return is calculated exclusive of sales charges and assumes the reinvestment of dividends and distributions. |
| (c) | Total investment return is not annualized. |
| (d) | In addition to the fees and expenses which the Fund bears directly, the Fund indirectly bears a pro-rata share of the fees and expenses of the Underlying Funds in which it invests. Such indirect expenses are not included in the above expense ratios. |
| | | | | | |
The notes to the financial statements are an integral part of,
and should be read in conjunction with, the financial statements. | | mainstayinvestments.com | | | 35 | |
Financial Highlights selected per share data and ratios
| | | | | | | | | | | | | | | | | | | | | | | | |
| | | Class I | |
| | | Six months
ended
April 30, | | | Year ended October 31, | |
| | | 2013* | | | 2012 | | | 2011 | | | 2010 | | | 2009 | | | 2008 | |
Net asset value at beginning of period | | $ | 12.04 | | | $ | 11.12 | | | $ | 10.92 | | | $ | 9.87 | | | $ | 8.80 | | | $ | 12.37 | |
| | | | | | | | | | | | | | | | | | | | | | | | |
Net investment income (loss) (a) | | | 0.16 | | | | 0.23 | | | | 0.23 | | | | 0.20 | | | | 0.25 | | | | 0.27 | |
Net realized and unrealized gain (loss) on investments | | | 1.09 | | | | 0.94 | | | | 0.22 | | | | 1.06 | | | | 1.21 | | | | (3.31 | ) |
| | | | | | | | | | | | | | | | | | | | | | | | |
Total from investment operations | | | 1.25 | | | | 1.17 | | | | 0.45 | | | | 1.26 | | | | 1.46 | | | | (3.04 | ) |
| | | | | | | | | | | | | | | | | | | | | | | | |
Less dividends and distributions: | | | | | | | | | | | | | | | | | | | | | | | | |
From net investment income | | | (0.31 | ) | | | (0.25 | ) | | | (0.25 | ) | | | (0.21 | ) | | | (0.28 | ) | | | (0.33 | ) |
From net realized gain on investments | | | — | | | | — | | | | — | | | | — | | | | (0.11 | ) | | | (0.20 | ) |
| | | | | | | | | | | | | | | | | | | | | | | | |
Total dividends and distributions | | | (0.31 | ) | | | (0.25 | ) | | | (0.25 | ) | | | (0.21 | ) | | | (0.39 | ) | | | (0.53 | ) |
| | | | | | | | | | | | | | | | | | | | | | | | |
Net asset value at end of period | | $ | 12.98 | | | $ | 12.04 | | | $ | 11.12 | | | $ | 10.92 | | | $ | 9.87 | | | $ | 8.80 | |
| | | | | | | | | | | | | | | | | | | | | | | | |
Total investment return (b) | | | 10.62 | %(c) | | | 10.75 | % | | | 4.16 | % | | | 12.94 | % | | | 17.40 | % | | | (25.54 | %) |
Ratios (to average net assets)/Supplemental Data: | | | | | | | | | | | | | | | | | | | | | | | | |
Net investment income (loss) | | | 2.53 | %†† | | | 1.99 | % | | | 2.05 | % | | | 1.93 | % | | | 2.81 | % | | | 2.52 | % |
Net expenses (d) | | | 0.10 | %†† | | | 0.10 | % | | | 0.11 | % | | | 0.13 | % | | | 0.18 | % | | | 0.19 | % |
Portfolio turnover rate | | | 20 | % | | | 64 | % | | | 60 | % | | | 41 | % | | | 35 | % | | | 40 | % |
Net assets at end of period (in 000’s) | | $ | 12,939 | | | $ | 12,631 | | | $ | 9,972 | | | $ | 8,806 | | | $ | 4,447 | | | $ | 5,358 | |
| (a) | Per share data based on average shares outstanding during the period. |
| (b) | Total investment return is calculated exclusive of sales charges and assumes the reinvestment of dividends and distributions. Class I shares are not subject to sales charges. |
| (c) | Total investment return is not annualized. |
| (d) | In addition to the fees and expenses which the Fund bears directly, the Fund indirectly bears a pro-rata share of the fees and expenses of the Underlying Funds in which it invests. Such indirect expenses are not included in the above expense ratios. |
| | | | |
| 36 | | MainStay Moderate Allocation Fund | | The notes to the financial statements are an integral part of,
and should be read in conjunction with, the financial statements. |
MainStay Moderate Growth Allocation Fund
Investment and Performance Comparison1 (Unaudited)
Performance data quoted represents past performance. Past performance is no guarantee of future results. Because of market volatility, current performance may be lower or higher than the figures shown. Investment return and principal value will fluctuate, and as a result, when shares are redeemed, they may be worth more or less than their original cost. The graph below depicts the historical performance of Class I shares of the Fund. Performance will vary from class to class based on differences in class-specific expenses and sales charges. For performance information current to the most recent month-end, please call 800-MAINSTAY (624-6782) or visit mainstayinvestments.com.
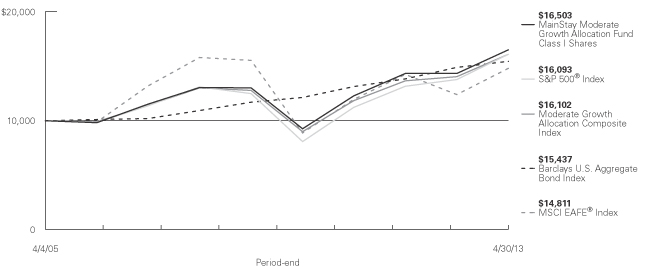
Average Annual Total Returns for the Period Ended April 30, 2013
| | | | | | | | | | | | | | | | | | | | | | | | |
| Class | | Sales Charge | | | | Six Months | | | One Year | | | Five Years | | | Since Inception (4/4/05) | | | Gross Expense Ratio2 | |
| Investor Class Shares3 | | Maximum 5.5% Initial Sales Charge | | With sales charges Excluding sales charges | |
| 7.25
13.49 | %
| |
| 8.45
14.76 | %
| |
| 3.34
4.51 | %
| |
| 5.28
6.02 | %
| |
| 1.74
1.74 | %
|
| Class A Shares | | Maximum 5.5% Initial Sales Charge | | With sales charges Excluding sales charges | |
| 7.42
13.67 |
| |
| 8.62
14.94 |
| |
| 3.44
4.62 |
| |
| 5.35
6.09 |
| |
| 1.54
1.54 |
|
| Class B Shares | | Maximum 5% CDSC if Redeemed Within the
First Six Years of Purchase | | With sales charges Excluding sales charges | |
| 8.11
13.11 |
| |
| 8.90
13.90 |
| |
| 3.38
3.73 |
| |
| 5.23
5.23 |
| |
| 2.49
2.49 |
|
| Class C Shares | | Maximum 1% CDSC if Redeemed Within
One Year of Purchase | | With sales charges Excluding sales charges | |
| 12.11
13.11 |
| |
| 12.90
13.90 |
| |
| 3.72
3.72 |
| |
| 5.23
5.23 |
| |
| 2.49
2.49 |
|
| Class I Shares | | No Sales Charge | | | | | 13.74 | | | | 15.29 | | | | 4.88 | | | | 6.40 | | | | 1.29 | |
| 1. | The performance table and graph do not reflect the deduction of taxes that a shareholder would pay on dividends, distributions or Fund share redemptions. Total returns reflect maximum applicable sales charges as indicated in the table above, changes in share price, and reinvestment of dividend and capital gain distributions. The graph assumes the initial investment amount shown above and reflects the deduction of all sales charges that would have applied for the period of investment. Performance figures reflect certain fee waivers and/or expense limitations, without which total returns may have been lower. For more information on share classes and current fee waivers and/or expense limitations, please refer to the notes to the financial statements. |
| 2. | The gross expense ratios presented reflect the Fund’s “Total Annual Fund Operating Expenses” from the most recent Prospectus and may differ from other expense ratios disclosed in this report. |
| 3. | Performance figures for Investor Class shares, first offered on February 28, 2008, include the historical performance of Class A shares through February 27, 2008, adjusted for differences in certain fees and expenses. Unadjusted, the performance shown for the Investor Class shares would likely have been different. |
The footnotes on the next page are an integral part of the table and graph and should be carefully read in conjunction with them.
| | | | |
| mainstayinvestments.com | | | 37 | |
| | | | | | | | | | | | | | | | |
| Benchmark Performance | | Six
Months | | | One
Year | | | Five
Years | | | Since
Inception | |
S&P 500® Index4 | | | 14.42 | % | | | 16.89 | % | | | 5.21 | % | | | 6.07 | % |
MSCI EAFE® Index5 | | | 16.90 | | | | 19.39 | | | | –0.93 | | | | 4.99 | |
Barclays U.S. Aggregate Bond Index6 | | | 0.90 | | | | 3.68 | | | | 5.72 | | | | 5.53 | |
Moderate Growth Allocation Composite Index7 | | | 12.01 | | | | 14.68 | | | | 4.74 | | | | 6.08 | |
Average Lipper Mixed-Asset Target Allocation Growth Fund8 | | | 10.39 | | | | 12.27 | | | | 4.06 | | | | 5.39 | |
| 4. | “S&P 500®” is a trademark of The McGraw-Hill Companies, Inc. The S&P 500® Index is widely regarded as the standard index for measuring large-cap U.S. stock market performance. The S&P 500® Index is the Fund’s broad-based securities market index for comparison purposes. Results assume reinvestment of all income and capital gains. An investment cannot be made directly in an index. |
| 5. | The MSCI EAFE® Index consists of international stocks representing the developed world outside of North America. The MSCI EAFE® Index is the Fund’s secondary benchmark. Results assume reinvestment of all income and capital gains. An investment cannot be made directly in an index. |
| 6. | The Barclays U.S. Aggregate Bond Index is a broad-based benchmark that measures the investment grade, U.S. dollar-denominated, fixed-rate taxable bond market, including Treasurys, government-related and corporate securities, mortgage-backed securities (agency fixed-rate and hybrid adjustable rate mortgage pass-throughs), asset-backed securities, and commercial mortgage-backed securities. The Fund has selected the |
| | Barclays U.S. Aggregate Bond Index as an additional benchmark. Results assume reinvestment of all income and capital gains. An investment cannot be made directly in an index. |
| 7. | The Moderate Growth Allocation Composite Index consists of the S&P 500® Index, the MSCI EAFE® Index and the Barclays U.S. Aggregate Bond Index weighted 65%, 15% and 20%, respectively. The Fund has selected the Moderate Growth Allocation Composite Index as an additional benchmark. Total returns assume reinvestment of all dividends and capital gains. An investment cannot be made directly in an index. |
| 8. | The average Lipper mixed-asset target allocation growth fund is representative of funds that, by portfolio practice, maintain a mix of between 60%-80% equity securities, with the remainder invested in bonds, cash, and cash equivalents. This benchmark is a product of Lipper Inc. Lipper Inc. is an independent monitor of fund performance. Results are based on average total returns of similar funds with all dividend and capital gain distributions reinvested. |
The footnotes on the preceding page are an integral part of the table and graph and should be carefully read in conjunction with them.
| | |
| 38 | | MainStay Moderate Growth Allocation Fund |
Cost in Dollars of a $1,000 Investment in MainStay Moderate Growth Allocation Fund (Unaudited)
The example below is intended to describe the fees and expenses borne by shareholders during the six-month period from November 1, 2012, to April 30, 2013, and the impact of those costs on your investment.
Example
As a shareholder of the Fund, you incur two types of costs: (1) transaction costs, including exchange fees and sales charges (loads) on purchases (as applicable), and (2) ongoing costs, including management fees, distribution and/or service (12b-1) fees, and other Fund expenses (as applicable). This example is intended to help you understand your ongoing costs (in dollars) of investing in the Fund and to compare these costs with the ongoing costs of investing in other mutual funds. The example is based on an investment of $1,000 made at the beginning of the six-month period and held for the entire period from November 1, 2012, to April 30, 2013.
This example illustrates your Fund’s ongoing costs in two ways:
Actual Expenses
The second and third data columns in the table below provide information about actual account values and actual expenses. You may use the information in these columns, together with the amount you invested, to estimate the expenses that you paid during the six months ended April 30, 2013. Simply divide your account value by $1,000 (for example, an $8,600 account value divided by $1,000 = 8.6), then
multiply the result by the number under the heading entitled “Expenses Paid During Period” to estimate the expenses you paid on your account during this period.
Hypothetical Example for Comparison Purposes
The fourth and fifth data columns in the table below provide information about hypothetical account values and hypothetical expenses based on the Fund’s actual expense ratio and an assumed rate of return of 5% per year before expenses, which is not the Fund’s actual return. The hypothetical account values and expenses may not be used to estimate the actual ending account balances or expenses you paid for the six-month period shown. You may use this information to compare the ongoing costs of investing in the Fund with the ongoing costs of investing in other Funds. To do so, compare this 5% hypothetical example with the 5% hypothetical examples that appear in the shareholder reports of the other Funds.
Please note that the expenses shown in the table are meant to highlight your ongoing costs only and do not reflect any transactional costs, such as exchange fees or sales charges (loads). Therefore, the fourth and fifth data columns of the table are useful in comparing ongoing costs only and will not help you determine the relative total costs of owning different funds. In addition, if these transactional costs were included, your costs would have been higher.
| | | | | | | | | | | | | | | | | | | | |
| | | | | | | | | | | | | | | | |
| Share Class | | Beginning
Account
Value
11/1/12 | | | Ending Account
Value (Based
on Actual
Returns and
Expenses)
4/30/13 | | | Expenses
Paid
During
Period1 | | | Ending Account
Value (Based
on Hypothetical
5% Annualized
Return and
Actual Expenses)
4/30/13 | | | Expenses
Paid
During
Period1 | |
| | | | | |
| Investor Class Shares | | $ | 1,000.00 | | | $ | 1,134.90 | | | $ | 2.91 | | | $ | 1,022.10 | | | $ | 2.76 | |
| | | | | |
| Class A Shares | | $ | 1,000.00 | | | $ | 1,136.70 | | | $ | 1.96 | | | $ | 1,023.00 | | | $ | 1.86 | |
| | | | | |
| Class B Shares | | $ | 1,000.00 | | | $ | 1,131.10 | | | $ | 6.87 | | | $ | 1,018.30 | | | $ | 6.51 | |
| | | | | |
| Class C Shares | | $ | 1,000.00 | | | $ | 1,131.10 | | | $ | 6.87 | | | $ | 1,018.30 | | | $ | 6.51 | |
| | | | | |
| Class I Shares | | $ | 1,000.00 | | | $ | 1,137.40 | | | $ | 0.64 | | | $ | 1,024.20 | | | $ | 0.60 | |
| 1. | Expenses are equal to the Fund’s annualized expense ratio of each class (0.55% for Investor Class, 0.37% for Class A, 1.30% for Class B and Class C and 0.12% for Class I) multiplied by the average account value over the period, divided by 365 and multiplied by 181 (to reflect the six-month period). The table above represents the actual expenses incurred during the six-month period. In addition to the fees and expenses which the Fund bears directly, the Fund indirectly bears a pro rata share of the fees and expenses of the Underlying Funds in which it invests. Such indirect expenses are not included in the above-reported expense figures. |
| | | | |
| mainstayinvestments.com | | | 39 | |
Investment Objectives of Underlying Funds as of April 30, 2013 (Unaudited)

See Portfolio of Investments on page 44 for specific holdings within these categories.
| | |
| 40 | | MainStay Moderate Growth Allocation Fund |
Portfolio Management Discussion and Analysis (Unaudited)
Questions answered by portfolio managers Jae S. Yoon, CFA, Jonathan Swaney and Poul Kristensen, CFA, of New York Life Investments.1
How did MainStay Moderate Growth Allocation Fund perform relative to its peers and its benchmark during the six months ended April 30, 2013?
Excluding all sales charges, MainStay Moderate Growth Allocation Fund returned 13.49% for Investor Class shares, 13.67% for Class A shares and 13.11% for Class B and Class C shares for the six months ended April 30, 2013. Over the same period, Class I shares returned 13.74%. All share classes outperformed the 10.39% return of the average Lipper2 mixed-asset target allocation growth fund for the six months ended April 30, 2013. Over the same period, all share classes underperformed the 14.42% return of the S&P 500® Index3 and the 16.90% return of the MSCI EAFE® Index.4 The S&P 500® Index is the Fund’s broad-based securities-market index, and the MSCI EAFE® Index is the secondary benchmark of the Fund. All share classes outperformed the 0.90% return of the Barclays U.S. Aggregate Bond Index5 and the 12.01% return of the Moderate Growth Allocation Composite Index6 for the six months ended April 30, 2013. The Barclays U.S. Aggregate Bond Index and the Moderate Growth Allocation Composite Index are additional benchmarks of the Fund. See page 37 for Fund returns with applicable sales charges.
Were there any changes to the Fund during the reporting period?
Effective February 28, 2013, the Fund’s Principal Investment Strategies were modified to broaden the investment ranges for each of the asset classes in which the Fund may invest by an additional ten percentage points. Also effective February 28, 2013, Poul Kristensen, CFA, was added as a portfolio manager. For more information on these changes, please see the Prospectus dated February 28, 2013.
What factors affected the Fund’s relative performance during the reporting period?
The Fund is a “fund of funds,” meaning that it seeks to achieve its investment objective by investing primarily in other MainStay Funds (the “Underlying Funds”). The Underlying Funds may invest in fixed-income securities or in domestic or international stocks at various capitalization levels. The Fund’s primary benchmark, on the other hand, consists entirely of U.S. large-cap stocks. These differences—particularly the Fund’s substantial allocation to Underlying Funds that invest in fixed-income securities—accounted for many of the challenges the Fund experienced in terms of relative performance.
The Fund provided strong returns relative to the average peer fund and the Moderate Growth Allocation Composite Index during the reporting period. Much of that strength was attributable to asset class decisions. We maintained a neutral blend at the start of the reporting period then moved aggressively to overweight equities during the latter half of the fourth quarter. This proved to be a very profitable strategy, although the benefit was mitigated somewhat by an emphasis on large-cap stocks rather than small-cap stocks and on U.S. equities over international offerings. In the fixed-income portion of the Fund, a bias toward lower-quality bond offerings aided performance. Our decision to keep duration7 short in the fixed-income portion of the Fund had no meaningful impact on the Fund’s performance.
Performance of the Underlying Funds also influenced relative results. On the plus side, significant holdings in MainStay U.S. Equity Opportunities Fund and MainStay International Opportunities Fund helped relative performance, as both were near the top of their respective peer groups. Relying on MainStay Large Cap Growth Fund more heavily than MainStay Cornerstone Growth Fund also proved beneficial.
Positions in MainStay Epoch Global Choice Fund and MainStay Marketfield Fund weighed on returns. Neither of these Underlying Funds performed particularly well in relation to the portion of the market to which they provided exposure. All told, the performance of all Underlying Funds contributed positively—but not significantly—to relative performance.
How did you allocate the Fund’s assets during the reporting period and why?
We considered a variety of information, including the portfolio-level characteristics of the Underlying Funds, such as capitalization, style biases, sector exposures, credit quality and duration. We also examined the attributes of the Underlying Funds’ holdings, such as valuation metrics, earnings data and technical indicators. Finally, we evaluated the historical success of the managers responsible for the Underlying Funds. Generally speaking, we seek to invest in Underlying Funds that occupy attractively valued segments of the market, invest in fairly priced securities and are steered by individuals who have consistently demonstrated capable management in the past.
The Fund’s allocations to stocks and bonds varied over the course of the reporting period in response to the changing
| 1. | “New York Life Investments” is a service mark used by New York Life Investment Management LLC. |
| 2. | See footnote on page 38 for more information on Lipper Inc. |
| 3. | See footnote on page 38 for more information on the S&P 500® Index. |
| 4. | See footnote on page 38 for more information on the MSCI EAFE® Index. |
| 5. | See footnote on page 38 for more information on the Barclays U.S. Aggregate Bond Index. |
| 6. | See footnote on page 38 for more information on the Moderate Growth Allocation Composite Index. |
| 7. | Duration is a measure of the price sensitivity of a fixed-income investment to changes in interest rates. Duration is expressed as a number of years and is considered a more accurate sensitivity gauge than average maturity. |
| | | | |
| mainstayinvestments.com | | | 41 | |
environment. We believed that equities presented a sizable valuation advantage over bonds and that corporate profit gains would help propel stock prices higher. For these reasons, we gave the Fund a decisive tilt in favor of stocks over bonds throughout most of the reporting period. Within the equity portion of the Fund, we maintained a bias in favor of Underlying Funds that invest in U.S. stocks over Underlying Funds that invest in stocks traded in other developed markets. We were particularly concerned about countries that are likely to struggle with deleveraging issues even greater than those presented in the United States. Results were mixed, as Japan in particular experienced very strong returns on the back of aggressive fiscal and monetary policy changes.
In the fixed-income portion of the Fund, we continued to maintain a shorter duration than the Barclays U.S. Aggregate Bond Index. We also tilted the fixed-income portion of the Fund decidedly toward Underlying Funds that invest in corporate bonds over those that invest primarily in government-backed issues. This positioning reflected our opinion that high-grade bonds were very expensive and that issues from corporate borrowers deemed to be of lower quality represented a far more attractive proposition. Given ample liquidity and healthy corporate balance sheets, we believed that default rates were likely to remain low. We also believed that investors were likely to find the higher yields available from corporate debt quite attractive compared to the yields available on U.S. Treasury instruments.
How did the Fund’s allocations change over the course of the reporting period?
Position sizes naturally fluctuate with changing market conditions, and such changes do not always reflect an explicit change in our strategic or tactical point of view. That said, the most notable allocation changes during the reporting period were associated with the expanding list of eligible investments, as several new MainStay Funds became available.
MainStay Marketfield Fund, a global long/short and low-beta8 product, was one of the largest new positions, established by using proceeds from a mix of other Underlying Equity Funds. MainStay Short Duration High Yield Fund was another new offering, which the Fund selected as part of an ongoing effort to protect against a potential rise in interest rates. We quickly built the Fund’s position after the Underlying Fund’s launch in December 2012. The purchases were made with proceeds from MainStay High Yield Corporate Bond Fund and MainStay Floating Rate Fund.
MainStay Cornerstone Growth Fund was another new product. We established a position in this Underlying Fund using proceeds from MainStay Large Cap Growth Fund as we sought to widen strategy diversification within that portion of the market.
A new holding was established in MainStay High Yield Municipal Bond Fund, which further diversified sources of credit risk within the fixed-income portion of the Fund. We believed that high-yield municipal bonds would be attractive despite the inapplicability of tax benefits usually associated with these types of instruments. Funding for this investment came in large part from MainStay Unconstrained Bond Fund (formerly MainStay Flexible Bond Opportunities Fund).
Also of note, we increased the Fund’s position in MainStay U.S. Small Cap Fund as we unwound the Fund’s previous large-cap bias. The increased allocation was funded from a mix of Underlying Equity Funds. Additionally, we shifted assets from MainStay Common Stock Fund to MainStay U.S. Equity Opportunities Fund (formerly known as MainStay 130/30 Core Fund).
During the reporting period, which Underlying Equity Funds had the highest total returns and which Underlying Equity Funds had the lowest total returns?
MainStay International Opportunities Fund generated the highest absolute return by a comfortable margin, followed by MainStay U.S. Small Cap Fund. Although none of the Underlying Equity Funds in which the Fund invested provided negative returns for the reporting period, the lowest absolute returns in the equity portion of the Fund came from MainStay Cornerstone Growth Fund and MainStay International Equity Fund.
Which Underlying Equity Funds made the strongest positive contributions to the Fund’s overall performance, and which Underlying Equity Funds were the greatest detractors?
Because contributions take weightings and total returns into account and position sizes may vary, the Underlying Funds with the highest (or lowest) returns may not always have the most significantly positive (or negative) contributions to performance.
During the reporting period, large positions in MainStay MAP Fund and MainStay Large Cap Growth Fund made the largest positive contributions to the Fund’s overall performance. Although none of the Underlying Equity Funds in which the Fund invested had negative total returns, the smallest contributions came from a new position being built in MainStay Cornerstone Growth Fund and from a very small position in MainStay ICAP Select Equity Fund.
What factors and risks affected the Fund’s Underlying Fixed Income Fund investments during the reporting period?
Monetary policy continued to play a significant role in fixed-income markets, as has been the case for several years. Faced with persistently sluggish economic growth, slow rates of job
| 8. | Beta is a measure of volatility in relation to the market as a whole. A beta higher than 1 indicates that a security or portfolio will tend to exhibit higher volatility than the market. A beta lower than 1 indicates that a security or portfolio will tend to exhibit lower volatility than the market. |
| | |
| 42 | | MainStay Moderate Growth Allocation Fund |
creation and the prospect of significant fiscal drag, the Federal Reserve elected to extend its large-scale asset purchase program indefinitely. This decision helped keep interest rates close to their all-time lows. During the reporting period, the Fund favored Underlying Fixed Income Funds that invest in higher-yielding corporate bonds over those that invest primarily in government-backed issues. This strategy proved fortunate. Credit performed quite well as default rates remained low and the comparatively higher yields of these bonds attracted many buyers.
During the reporting period, which fixed-income market segments were strong performers and which segments were particularly weak?
High-yield corporate bonds performed exceptionally well as spreads9 to U.S. Treasurys continued to contract. The lowest
returns came from the most liquid, highest-quality and shortest-term debt instruments. Cash returned nothing, and returns on short-term U.S. government debt and AAA bonds were only slightly higher.
Which Underlying Fixed Income Funds made the strongest positive contributions to the Fund’s performance, and which Underlying Fixed Income Funds were the greatest detractors?
The largest contribution to the fixed-income portion of the Fund came from a substantial position in MainStay Floating Rate Fund and a much smaller position in MainStay Unconstrained Bond Fund. The contribution from positions in MainStay Money Market Fund and MainStay Short Duration High Yield Fund was effectively zero.
| 9. | The terms “spread” and “yield spread” may refer to the difference in yield between a security or type of security and comparable U.S. Treasury issues. The terms may also refer to the difference in yield between two specific securities or types of securities at a given time. |
The opinions expressed are those of the portfolio managers as of the date of this report and are subject to change. There is no guarantee that any forecast made will come to pass. This material does not constitute investment advice and is not intended as an endorsement of any specific investment.
| | | | |
| mainstayinvestments.com | | | 43 | |
Portfolio of Investments April 30, 2013 (Unaudited)
| | | | | | | | |
| | |
| | | Shares | | | Value | |
| Affiliated Investment Companies 100.1%† | |
Equity Funds 82.3% | |
MainStay Common Stock Fund Class I | | | 177,403 | | | $ | 2,609,605 | |
MainStay Cornerstone Growth Fund Class I | | | 337,141 | | | | 10,063,652 | |
MainStay Epoch Global Choice Fund Class I (a) | | | 794,491 | | | | 14,713,965 | |
MainStay Epoch U.S. All Cap Fund Class I (a) | | | 1,318,450 | | | | 33,172,203 | |
MainStay ICAP Equity Fund Class I | | | 802,825 | | | | 36,223,477 | |
MainStay ICAP International Fund Class I | | | 666,271 | | | | 21,607,167 | |
MainStay ICAP Select Equity Fund Class I | | | 28,816 | | | | 1,241,126 | |
MainStay International Equity Fund Class I | | | 721,879 | | | | 9,102,900 | |
MainStay International Opportunities Fund Class I (a) | | | 3,915,764 | | | | 32,030,947 | |
MainStay Large Cap Growth Fund Class I | | | 4,038,892 | | | | 35,623,029 | |
MainStay MAP Fund Class I (a) | | | 1,947,786 | | | | 77,560,824 | |
MainStay Marketfield Fund Class I (b) | | | 568,608 | | | | 9,484,378 | |
MainStay S&P 500 Index Fund Class I | | | 80,001 | | | | 2,968,849 | |
MainStay U.S. Equity Opportunities Fund Class I (a) | | | 7,135,052 | | | | 64,714,922 | |
MainStay U.S. Small Cap Fund Class I (a) | | | 2,289,968 | | | | 47,860,328 | |
| | | | | | | | |
Total Equity Funds
(Cost $313,844,386) | | | | | | | 398,977,372 | |
| | | | | | | | |
Fixed Income Funds 17.8% | | | | | | | | |
MainStay Floating Rate Fund Class I (a) | | | 3,381,708 | | | | 32,667,301 | |
MainStay High Yield Corporate Bond Fund Class I | | | 844,946 | | | | 5,255,564 | |
MainStay High Yield Municipal Bond Fund Class I | | | 274,713 | | | | 3,335,019 | |
MainStay High Yield Opportunities Fund Class I | | | 14,655 | | | | 181,871 | |
| | | | | | | | |
| | |
| | | Shares | | | Value | |
Fixed Income Funds (continued) | | | | | | | | |
MainStay Intermediate Term Bond Fund Class I | | | 1,470,290 | | | $ | 16,364,329 | |
MainStay Money Market Fund Class A | | | 10,859,052 | | | | 10,859,052 | |
MainStay Short Duration High Yield Fund Class I (a) | | | 498,216 | | | | 5,017,031 | |
MainStay Short Term Bond Fund Class I | | | 32,294 | | | | 310,669 | |
MainStay Unconstrained Bond Fund Class I (a) | | | 1,284,070 | | | | 12,147,306 | |
| | | | | | | | |
Total Fixed Income Funds
(Cost $82,072,025) | | | | | | | 86,138,142 | |
| | | | | | | | |
Total Investments
(Cost $395,916,411) (c) | | | 100.1 | % | | | 485,115,514 | |
Other Assets, Less Liabilities | | | (0.1 | ) | | | (487,298 | ) |
Net Assets | | | 100.0 | % | | $ | 484,628,216 | |
| † | Percentages indicated are based on Fund net assets. |
| (a) | The Fund’s ownership exceeds 5% of the outstanding shares of the Underlying Fund’s share class. (See Note 3) |
| (b) | Non-income producing Underlying Fund. |
| (c) | As of April 30, 2013, cost is $402,999,627 for federal income tax purposes and net unrealized appreciation is as follows: |
| | | | |
Gross unrealized appreciation | | $ | 89,199,103 | |
Gross unrealized depreciation | | | (7,083,216 | ) |
| | | | |
Net unrealized appreciation | | $ | 82,115,887 | |
| | | | |
The following is a summary of the fair valuations according to the inputs used as of April 30, 2013, for valuing the Fund’s assets.
Asset Valuation Inputs
| | | | | | | | | | | | | | | | |
Description | | Quoted
Prices in
Active
Markets for
Identical
Assets
(Level 1) | | | Significant
Other
Observable
Inputs
(Level 2) | | | Significant
Unobservable
Inputs
(Level 3) | | | Total | |
| Investments (a) | | | | | | | | | | | | | | | | |
| Affiliated Investment Companies | | | | | | | | | | | | | | | | |
Equity Funds Fixed Income Funds | | $ | 398,977,372 | | | $ | — | | | $ | — | | | $ | 398,977,372 | |
| | | 86,138,142 | | | | — | | | | — | | | | 86,138,142 | |
| | | | | | | | | | | | | | | | |
| Total Investments | | $ | 485,115,514 | | | $ | — | | | $ | — | | | $ | 485,115,514 | |
| | | | | | | | | | | | | | | | |
| (a) | For a complete listing of investments, see the Portfolio of Investments. |
The Fund recognizes transfers between the levels as of the beginning of the period.
For the period ended April 30, 2013, the Fund did not have any transfers between Level 1 and Level 2 fair value measurements. (See Note 2)
As of April 30, 2013, the Fund did not hold any investments with significant unobservable inputs (Level 3). (See Note 2)
| | | | |
| 44 | | MainStay Moderate Growth Allocation Fund | | The notes to the financial statements are an integral part of,
and should be read in conjunction with, the financial statements. |
Statement of Assets and Liabilities as of April 30, 2013 (Unaudited)
| | | | |
| Assets | |
Investment in affiliated investment companies, at value (identified cost $395,916,411) | | $ | 485,115,514 | |
Receivables: | | | | |
Fund shares sold | | | 389,010 | |
Other assets | | | 56,103 | |
| | | | |
Total assets | | | 485,560,627 | |
| | | | |
|
| Liabilities | |
Payables: | | | | |
Fund shares redeemed | | | 567,461 | |
NYLIFE Distributors (See Note 3) | | | 178,450 | |
Transfer agent (See Note 3) | | | 133,537 | |
Shareholder communication | | | 26,996 | |
Professional fees | | | 16,879 | |
Custodian | | | 1,254 | |
Trustees | | | 1,030 | |
Manager (See Note 3) | | | 759 | |
Accrued expenses | | | 6,045 | |
| | | | |
Total liabilities | | | 932,411 | |
| | | | |
Net assets | | $ | 484,628,216 | |
| | | | |
|
| Composition of Net Assets | |
Shares of beneficial interest outstanding (par value of $.001 per share) unlimited number of shares authorized | | $ | 36,940 | |
Additional paid-in capital | | | 416,464,090 | |
| | | | |
| | | 416,501,030 | |
Distributions in excess of net investment income | | | (1,920,795 | ) |
Accumulated net realized gain (loss) on investments | | | (19,151,122 | ) |
Net unrealized appreciation (depreciation) on investments | | | 89,199,103 | |
| | | | |
Net assets | | $ | 484,628,216 | |
| | | | |
| | | | |
Investor Class | | | | |
Net assets applicable to outstanding shares | | $ | 151,830,221 | |
| | | | |
Shares of beneficial interest outstanding | | | 11,538,477 | |
| | | | |
Net asset value per share outstanding | | $ | 13.16 | |
Maximum sales charge (5.50% of offering price) | | | 0.77 | |
| | | | |
Maximum offering price per share outstanding | | $ | 13.93 | |
| | | | |
Class A | | | | |
Net assets applicable to outstanding shares | | $ | 196,723,190 | |
| | | | |
Shares of beneficial interest outstanding | | | 14,943,297 | |
| | | | |
Net asset value per share outstanding | | $ | 13.16 | |
Maximum sales charge (5.50% of offering price) | | | 0.77 | |
| | | | |
Maximum offering price per share outstanding | | $ | 13.93 | |
| | | | |
Class B | | | | |
Net assets applicable to outstanding shares | | $ | 102,200,157 | |
| | | | |
Shares of beneficial interest outstanding | | | 7,856,562 | |
| | | | |
Net asset value and offering price per share outstanding | | $ | 13.01 | |
| | | | |
Class C | | | | |
Net assets applicable to outstanding shares | | $ | 32,382,421 | |
| | | | |
Shares of beneficial interest outstanding | | | 2,489,490 | |
| | | | |
Net asset value and offering price per share outstanding | | $ | 13.01 | |
| | | | |
Class I | | | | |
Net assets applicable to outstanding shares | | $ | 1,492,227 | |
| | | | |
Shares of beneficial interest outstanding | | | 112,479 | |
| | | | |
Net asset value and offering price per share outstanding | | $ | 13.27 | |
| | | | |
| | | | | | |
The notes to the financial statements are an integral part of,
and should be read in conjunction with, the financial statements. | | mainstayinvestments.com | | | 45 | |
Statement of Operations for the six months ended April 30, 2013 (Unaudited)
| | | | |
| Investment Income (Loss) | |
Income | | | | |
Dividend distributions from affiliated investment companies | | $ | 5,184,752 | |
| | | | |
Expenses | | | | |
Distribution/Service—Investor Class (See Note 3) | | | 176,733 | |
Distribution/Service—Class A (See Note 3) | | | 226,202 | |
Distribution/Service—Class B (See Note 3) | | | 480,325 | |
Distribution/Service—Class C (See Note 3) | | | 148,498 | |
Transfer agent (See Note 3) | | | 391,993 | |
Shareholder communication | | | 38,890 | |
Registration | | | 36,891 | |
Professional fees | | | 19,897 | |
Trustees | | | 5,145 | |
Custodian | | | 2,428 | |
Miscellaneous | | | 10,513 | |
| | | | |
Total expenses before waiver/reimbursement | | | 1,537,515 | |
Expense waiver/reimbursement from Manager (See Note 3) | | | (245 | ) |
| | | | |
Net expenses | | | 1,537,270 | |
| | | | |
Net investment income (loss) | | | 3,647,482 | |
| | | | |
|
| Realized and Unrealized Gain (Loss) on Investments | |
Net realized gain (loss) on: | | | | |
Affiliated investment company transactions | | | 4,924,892 | |
Realized capital gain distributions from affiliated investment companies | | | 6,263,922 | |
| | | | |
Net realized gain (loss) on investments from affiliated investment companies | | | 11,188,814 | |
| | | | |
Net change in unrealized appreciation (depreciation) on investments | | | 42,405,381 | |
| | | | |
Net realized and unrealized gain (loss) on investments | | | 53,594,195 | |
| | | | |
Net increase (decrease) in net assets resulting from operations | | $ | 57,241,677 | |
| | | | |
| | | | |
| 46 | | MainStay Moderate Growth Allocation Fund | | The notes to the financial statements are an integral part of,
and should be read in conjunction with, the financial statements. |
Statements of Changes in Net Assets
for the six months ended April 30, 2013 (Unaudited) and the year ended October 31, 2012
| | | | | | | | |
| | | 2013 | | | 2012 | |
| Increase (Decrease) in Net Assets | |
Operations: | | | | | | | | |
Net investment income (loss) | | $ | 3,647,482 | | | $ | 3,578,787 | |
Net realized gain (loss) on investments from affiliated investment companies transactions | | | 11,188,814 | | | | 4,546,658 | |
Net change in unrealized appreciation (depreciation) on investments | | | 42,405,381 | | | | 31,935,057 | |
| | | | |
Net increase (decrease) in net assets resulting from operations | | | 57,241,677 | | | | 40,060,502 | |
| | | | |
Dividends to shareholders: | | | | | | | | |
From net investment income: | | | | | | | | |
Investor Class | | | (2,268,586 | ) | | | (1,342,279 | ) |
Class A | | | (3,203,126 | ) | | | (1,972,643 | ) |
Class B | | | (873,377 | ) | | | (295,031 | ) |
Class C | | | (265,950 | ) | | | (85,115 | ) |
Class I | | | (25,374 | ) | | | (18,643 | ) |
| | | | |
Total dividends to shareholders | | | (6,636,413 | ) | | | (3,713,711 | ) |
| | | | |
Capital share transactions: | | | | | | | | |
Net proceeds from sale of shares | | | 37,270,522 | | | | 62,669,267 | |
Net asset value of shares issued to shareholders in reinvestment of dividends | | | 6,473,609 | | | | 3,615,436 | |
Cost of shares redeemed | | | (39,887,910 | ) | | | (72,925,654 | ) |
| | | | |
Increase (decrease) in net assets derived from capital share transactions | | | 3,856,221 | | | | (6,640,951 | ) |
| | | | |
Net increase (decrease) in net assets | | | 54,461,485 | | | | 29,705,840 | |
| | |
| Net Assets | | | | | | | | |
Beginning of period | | | 430,166,731 | | | | 400,460,891 | |
| | | | |
End of period | | $ | 484,628,216 | | | $ | 430,166,731 | |
| | | | |
Undistributed (distributions in excess of) net investment income at end of period | | $ | (1,920,795 | ) | | $ | 1,068,136 | |
| | | | |
| | | | | | |
The notes to the financial statements are an integral part of,
and should be read in conjunction with, the financial statements. | | mainstayinvestments.com | | | 47 | |
Financial Highlights selected per share data and ratios
| | | | | | | | | | | | | | | | | | | | | | | | |
| | | Investor Class | |
| | | Six months
ended
April 30, | | | Year ended October 31, | | | February 28,
2008**
through
October 31, | |
| | | 2013* | | | 2012 | | | 2011 | | | 2010 | | | 2009 | | | 2008 | |
Net asset value at beginning of period | | $ | 11.79 | | | $ | 10.81 | | | $ | 10.58 | | | $ | 9.40 | | | $ | 8.36 | | | $ | 11.37 | |
| | | | | | | | | | | | | | | | | | | | | | | | |
Net investment income (loss) (a) | | | 0.11 | | | | 0.11 | | | | 0.12 | | | | 0.11 | | | | 0.17 | | | | 0.15 | |
Net realized and unrealized gain (loss) on investments | | | 1.46 | | | | 0.99 | | | | 0.25 | | | | 1.20 | | | | 1.17 | | | | (3.16 | ) |
| | | | | | | | | | | | | | | | | | | | | | | | |
Total from investment operations | | | 1.57 | | | | 1.10 | | | | 0.37 | | | | 1.31 | | | | 1.34 | | | | (3.01 | ) |
| | | | | | | | | | | | | | | | | | | | | | | | |
Less dividends and distributions: | | | | | | | | | | | | | | | | | | | | | | | | |
From net investment income | | | (0.20 | ) | | | (0.12 | ) | | | (0.14 | ) | | | (0.13 | ) | | | (0.19 | ) | | | — | |
From net realized gain on investments | | | — | | | | — | | | | — | | | | — | | | | (0.11 | ) | | | — | |
| | | | | | | | | | | | | | | | | | | | | | | | |
Total dividends and distributions | | | (0.20 | ) | | | (0.12 | ) | | | (0.14 | ) | | | (0.13 | ) | | | (0.30 | ) | | | — | |
| | | | | | | | | | | | | | | | | | | | | | | | |
Net asset value at end of period | | $ | 13.16 | | | $ | 11.79 | | | $ | 10.81 | | | $ | 10.58 | | | $ | 9.40 | | | $ | 8.36 | |
| | | | | | | | | | | | | | | | | | | | | | | | |
Total investment return (b) | | | 13.49 | %(c) | | | 10.29 | % | | | 3.47 | % | | | 14.02 | % | | | 16.87 | % | | | (26.47 | %)(c) |
Ratios (to average net assets)/Supplemental Data: | | | | | | | | | | | | | | | | | | | | | | | | |
Net investment income (loss) | | | 1.75 | %†† | | | 1.00 | % | | | 1.11 | % | | | 1.12 | % | | | 2.02 | % | | | 2.16 | % †† |
Net expenses (d) | | | 0.55 | %†† | | | 0.53 | % | | | 0.50 | % | | | 0.50 | % | | | 0.47 | % | | | 0.45 | % †† |
Expenses (before waiver/reimbursement) (d) | | | 0.55 | %†† | | | 0.57 | % | | | 0.58 | % | | | 0.65 | % | | | 0.79 | % | | | 0.67 | % †† |
Portfolio turnover rate | | | 20 | % | | | 62 | % | | | 55 | % | | | 54 | % | | | 36 | % | | | 40 | % |
Net assets at end of period (in 000’s) | | $ | 151,830 | | | $ | 133,413 | | | $ | 121,733 | | | $ | 109,893 | | | $ | 86,438 | | | $ | 61,901 | |
| ** | Commencement of operations. |
| (a) | Per share data based on average shares outstanding during the period. |
| (b) | Total investment return is calculated exclusive of sales charges and assumes the reinvestment of dividends and distributions. |
| (c) | Total investment return is not annualized. |
| (d) | In addition to the fees and expenses which the Fund bears directly, the Fund indirectly bears a pro-rata share of the fees and expenses of the Underlying Funds in which it invests. Such indirect expenses are not included in the above expense ratios. |
| | | | |
| 48 | | MainStay Moderate Growth Allocation Fund | | The notes to the financial statements are an integral part of,
and should be read in conjunction with, the financial statements. |
Financial Highlights selected per share data and ratios
| | | | | | | | | | | | | | | | | | | | | | | | |
| | | Class A | |
| | | Six months
ended
April 30, | | | Year ended October 31, | |
| | | 2013* | | | 2012 | | | 2011 | | | 2010 | | | 2009 | | | 2008 | |
Net asset value at beginning of period | | $ | 11.80 | | | $ | 10.82 | | | $ | 10.58 | | | $ | 9.40 | | | $ | 8.35 | | | $ | 13.10 | |
| | | | | | | | | | | | | | | | | | | | | | | | |
Net investment income (loss) (a) | | | 0.12 | | | | 0.13 | | | | 0.13 | | | | 0.12 | | | | 0.18 | | | | 0.15 | |
Net realized and unrealized gain (loss) on investments | | | 1.46 | | | | 0.98 | | | | 0.26 | | | | 1.19 | | | | 1.17 | | | | (4.28 | ) |
| | | | | | | | | | | | | | | | | | | | | | | | |
Total from investment operations | | | 1.58 | | | | 1.11 | | | | 0.39 | | | | 1.31 | | | | 1.35 | | | | (4.13 | ) |
| | | | | | | | | | | | | | | | | | | | | | | | |
Less dividends and distributions: | | | | | | | | | | | | | | | | | | | | | | | | |
From net investment income | | | (0.22 | ) | | | (0.13 | ) | | | (0.15 | ) | | | (0.13 | ) | | | (0.19 | ) | | | (0.36 | ) |
From net realized gain on investments | | | — | | | | — | | | | — | | | | — | | | | (0.11 | ) | | | (0.26 | ) |
| | | | | | | | | | | | | | | | | | | | | | | | |
Total dividends and distributions | | | (0.22 | ) | | | (0.13 | ) | | | (0.15 | ) | | | (0.13 | ) | | | (0.30 | ) | | | (0.62 | ) |
| | | | | | | | | | | | | | | | | | | | | | | | |
Net asset value at end of period | | $ | 13.16 | | | $ | 11.80 | | | $ | 10.82 | | | $ | 10.58 | | | $ | 9.40 | | | $ | 8.35 | |
| | | | | | | | | | | | | | | | | | | | | | | | |
Total investment return (b) | | | 13.67 | %(c) | | | 10.42 | % | | | 3.66 | % | | | 14.07 | % | | | 17.00 | % | | | (32.92 | %) |
Ratios (to average net assets)/Supplemental Data: | | | | | | | | | | | | | | | | | | | | | | | | |
Net investment income (loss) | | | 1.94 | %†† | | | 1.16 | % | | | 1.21 | % | | | 1.22 | % | | | 2.18 | % | | | 1.30 | % |
Net expenses (d) | | | 0.37 | %†† | | | 0.37 | % | | | 0.38 | % | | | 0.40 | % | | | 0.43 | % | | | 0.46 | % |
Expenses (before waiver/reimbursement) (d) | | | 0.37 | %†† | | | 0.37 | % | | | 0.38 | % | | | 0.40 | % | | | 0.43 | % | | | 0.49 | % |
Portfolio turnover rate | | | 20 | % | | | 62 | % | | | 55 | % | | | 54 | % | | | 36 | % | | | 40 | % |
Net assets at end of period (in 000’s) | | $ | 196,723 | | | $ | 174,089 | | | $ | 160,679 | | | $ | 159,791 | | | $ | 140,284 | | | $ | 127,086 | |
| (a) | Per share data based on average shares outstanding during the period. |
| (b) | Total investment return is calculated exclusive of sales charges and assumes the reinvestment of dividends and distributions. |
| (c) | Total investment return is not annualized. |
| (d) | In addition to the fees and expenses which the Fund bears directly, the Fund indirectly bears a pro-rata share of the fees and expenses of the Underlying Funds in which it invests. Such indirect expenses are not included in the above expense ratios. |
| | | | | | |
The notes to the financial statements are an integral part of,
and should be read in conjunction with, the financial statements. | | mainstayinvestments.com | | | 49 | |
Financial Highlights selected per share data and ratios
| | | | | | | | | | | | | | | | | | | | | | | | |
| | | Class B | |
| | | Six months
ended
April 30, | | | Year ended October 31, | |
| | | 2013* | | | 2012 | | | 2011 | | | 2010 | | | 2009 | | | 2008 | |
Net asset value at beginning of period | | $ | 11.61 | | | $ | 10.64 | | | $ | 10.42 | | | $ | 9.27 | | | $ | 8.23 | | | $ | 12.93 | |
| | | | | | | | | | | | | | | | | | | | | | | | |
Net investment income (loss) (a) | | | 0.06 | | | | 0.03 | | | | 0.04 | | | | 0.04 | | | | 0.11 | | | | 0.05 | |
Net realized and unrealized gain (loss) on investments | | | 1.45 | | | | 0.98 | | | | 0.24 | | | | 1.18 | | | | 1.16 | | | | (4.21 | ) |
| | | | | | | | | | | | | | | | | | | | | | | | |
Total from investment operations | | | 1.51 | | | | 1.01 | | | | 0.28 | | | | 1.22 | | | | 1.27 | | | | (4.16 | ) |
| | | | | | | | | | | | | | | | | | | | | | | | |
Less dividends and distributions: | | | | | | | | | | | | | | | | | | | | | | | | |
From net investment income | | | (0.11 | ) | | | (0.04 | ) | | | (0.06 | ) | | | (0.07 | ) | | | (0.12 | ) | | | (0.28 | ) |
From net realized gain on investments | | | — | | | | — | | | | — | | | | — | | | | (0.11 | ) | | | (0.26 | ) |
| | | | | | | | | | | | | | | | | | | | | | | | |
Total dividends and distributions | | | (0.11 | ) | | | (0.04 | ) | | | (0.06 | ) | | | (0.07 | ) | | | (0.23 | ) | | | (0.54 | ) |
| | | | | | | | | | | | | | | | | | | | | | | | |
Net asset value at end of period | | $ | 13.01 | | | $ | 11.61 | | | $ | 10.64 | | | $ | 10.42 | | | $ | 9.27 | | | $ | 8.23 | |
| | | | | | | | | | | | | | | | | | | | | | | | |
Total investment return (b) | | | 13.11 | %(c) | | | 9.38 | % | | | 2.79 | % | | | 13.17 | % | | | 16.06 | % | | | (33.42 | %) |
Ratios (to average net assets)/Supplemental Data: | | | | | | | | | | | | | | | | | | | | | | | | |
Net investment income (loss) | | | 1.02 | %†† | | | 0.27 | % | | | 0.36 | % | | | 0.39 | % | | | 1.35 | % | | | 0.48 | % |
Net expenses (d) | | | 1.30 | %†† | | | 1.28 | % | | | 1.25 | % | | | 1.25 | % | | | 1.21 | % | | | 1.22 | % |
Expenses (before waiver/reimbursement) (d) | | | 1.30 | %†† | | | 1.32 | % | | | 1.33 | % | | | 1.40 | % | | | 1.54 | % | | | 1.37 | % |
Portfolio turnover rate | | | 20 | % | | | 62 | % | | | 55 | % | | | 54 | % | | | 36 | % | | | 40 | % |
Net assets at end of period (in 000’s) | | $ | 102,200 | | | $ | 92,620 | | | $ | 90,887 | | | $ | 94,448 | | | $ | 87,220 | | | $ | 76,188 | |
| (a) | Per share data based on average shares outstanding during the period. |
| (b) | Total investment return is calculated exclusive of sales charges and assumes the reinvestment of dividends and distributions. |
| (c) | Total investment return is not annualized. |
| (d) | In addition to the fees and expenses which the Fund bears directly, the Fund indirectly bears a pro-rata share of the fees and expenses of the Underlying Funds in which it invests. Such indirect expenses are not included in the above expense ratios. |
| | | | |
| 50 | | MainStay Moderate Growth Allocation Fund | | The notes to the financial statements are an integral part of,
and should be read in conjunction with, the financial statements. |
Financial Highlights selected per share data and ratios
| | | | | | | | | | | | | | | | | | | | | | | | |
| | | Class C | |
| | | Six months
ended
April 30, | | | Year ended October 31, | |
| | | 2013* | | | 2012 | | | 2011 | | | 2010 | | | 2009 | | | 2008 | |
Net asset value at beginning of period | | $ | 11.61 | | | $ | 10.64 | | | $ | 10.42 | | | $ | 9.27 | | | $ | 8.23 | | | $ | 12.93 | |
| | | | | | | | | | | | | | | | | | | | | | | | |
Net investment income (loss) (a) | | | 0.06 | | | | 0.03 | | | | 0.04 | | | | 0.04 | | | | 0.11 | | | | 0.06 | |
Net realized and unrealized gain (loss) on investments | | | 1.45 | | | | 0.98 | | | | 0.24 | | | | 1.18 | | | | 1.16 | | | | (4.22 | ) |
| | | | | | | | | | | | | | | | | | | | | | | | |
Total from investment operations | | | 1.51 | | | | 1.01 | | | | 0.28 | | | | 1.22 | | | | 1.27 | | | | (4.16 | ) |
| | | | | | | | | | | | | | | | | | | | | | | | |
Less dividends and distributions: | | | | | | | | | | | | | | | | | | | | | | | | |
From net investment income | | | (0.11 | ) | | | (0.04 | ) | | | (0.06 | ) | | | (0.07 | ) | | | (0.12 | ) | | | (0.28 | ) |
From net realized gain on investments | | | — | | | | — | | | | — | | | | — | | | | (0.11 | ) | | | (0.26 | ) |
| | | | | | | | | | | | | | | | | | | | | | | | |
Total dividends and distributions | | | (0.11 | ) | | | (0.04 | ) | | | (0.06 | ) | | | (0.07 | ) | | | (0.23 | ) | | | (0.54 | ) |
| | | | | | | | | | | | | | | | | | | | | | | | |
Net asset value at end of period | | $ | 13.01 | | | $ | 11.61 | | | $ | 10.64 | | | $ | 10.42 | | | $ | 9.27 | | | $ | 8.23 | |
| | | | | | | | | | | | | | | | | | | | | | | | |
Total investment return (b) | | | 13.11 | %(c) | | | 9.37 | % | | | 2.79 | % | | | 13.16 | % | | | 16.07 | % | | | (33.42 | %) |
Ratios (to average net assets)/Supplemental Data: | | | | | | | | | | | | | | | | | | | | | | | | |
Net investment income (loss) | | | 1.02 | %†† | | | 0.25 | % | | | 0.36 | % | | | 0.37 | % | | | 1.39 | % | | | 0.50 | % |
Net expenses (d) | | | 1.30 | %†† | | | 1.28 | % | | | 1.25 | % | | | 1.25 | % | | | 1.21 | % | | | 1.22 | % |
Expenses (before waiver/reimbursement) (d) | | | 1.30 | %†† | | | 1.32 | % | | | 1.33 | % | | | 1.40 | % | | | 1.54 | % | | | 1.36 | % |
Portfolio turnover rate | | | 20 | % | | | 62 | % | | | 55 | % | | | 54 | % | | | 36 | % | | | 40 | % |
Net assets at end of period (in 000’s) | | $ | 32,382 | | | $ | 28,725 | | | $ | 26,065 | | | $ | 25,524 | | | $ | 21,968 | | | $ | 18,993 | |
| (a) | Per share data based on average shares outstanding during the period. |
| (b) | Total investment return is calculated exclusive of sales charges and assumes the reinvestment of dividends and distributions. |
| (c) | Total investment return is not annualized. |
| (d) | In addition to the fees and expenses which the Fund bears directly, the Fund indirectly bears a pro-rata share of the fees and expenses of the Underlying Funds in which it invests. Such indirect expenses are not included in the above expense ratios. |
| | | | | | |
The notes to the financial statements are an integral part of,
and should be read in conjunction with, the financial statements. | | mainstayinvestments.com | | | 51 | |
Financial Highlights selected per share data and ratios
| | | | | | | | | | | | | | | | | | | | | | | | |
| | | Class I | |
| | | Six months
ended
April 30, | | | Year ended October 31, | |
| | | 2013* | | | 2012 | | | 2011 | | | 2010 | | | 2009 | | | 2008 | |
Net asset value at beginning of period | | $ | 11.91 | | | $ | 10.91 | | | $ | 10.67 | | | $ | 9.48 | | | $ | 8.42 | | | $ | 13.20 | |
| | | | | | | | | | | | | | | | | | | | | | | | |
Net investment income (loss) (a) | | | 0.13 | | | | 0.16 | | | | 0.18 | | | | 0.15 | | | | 0.19 | | | | 0.17 | |
Net realized and unrealized gain (loss) on investments | | | 1.48 | | | | 1.00 | | | | 0.23 | | | | 1.19 | | | | 1.20 | | | | (4.30 | ) |
| | | | | | | | | | | | | | | | | | | | | | | | |
Total from investment operations | | | 1.61 | | | | 1.16 | | | | 0.41 | | | | 1.34 | | | | 1.39 | | | | (4.13 | ) |
| | | | | | | | | | | | | | | | | | | | | | | | |
Less dividends and distributions: | | | | | | | | | | | | | | | | | | | | | | | | |
From net investment income | | | (0.25 | ) | | | (0.16 | ) | | | (0.17 | ) | | | (0.15 | ) | | | (0.22 | ) | | | (0.39 | ) |
From net realized gain on investments | | | — | | | | — | | | | — | | | | — | | | | (0.11 | ) | | | (0.26 | ) |
| | | | | | | | | | | | | | | | | | | | | | | | |
Total dividends and distributions | | | (0.25 | ) | | | (0.16 | ) | | | (0.17 | ) | | | (0.15 | ) | | | (0.33 | ) | | | (0.65 | ) |
| | | | | | | | | | | | | | | | | | | | | | | | |
Net asset value at end of period | | $ | 13.27 | | | $ | 11.91 | | | $ | 10.91 | | | $ | 10.67 | | | $ | 9.48 | | | $ | 8.42 | |
| | | | | | | | | | | | | | | | | | | | | | | | |
Total investment return (b) | | | 13.74 | %(c) | | | 10.70 | % | | | 3.96 | % | | | 14.29 | % | | | 17.37 | % | | | (32.72 | %) |
Ratios (to average net assets)/Supplemental Data: | | | | | | | | | | | | | | | | | | | | | | | | |
Net investment income (loss) | | | 2.10 | %†† | | | 1.42 | % | | | 1.64 | % | | | 1.47 | % | | | 2.30 | % | | | 1.51 | % |
Net expenses (d) | | | 0.12 | %†† | | | 0.12 | % | | | 0.13 | % | | | 0.15 | % | | | 0.19 | % | | | 0.22 | % |
Expenses (before waiver/reimbursement) (d) | | | 0.12 | %†† | | | 0.12 | % | | | 0.13 | % | | | 0.15 | % | | | 0.19 | % | | | 0.26 | % |
Portfolio turnover rate | | | 20 | % | | | 62 | % | | | 55 | % | | | 54 | % | | | 36 | % | | | 40 | % |
Net assets at end of period (in 000’s) | | $ | 1,492 | | | $ | 1,321 | | | $ | 1,096 | | | $ | 840 | | | $ | 688 | | | $ | 532 | |
| (a) | Per share data based on average shares outstanding during the period. |
| (b) | Total investment return is calculated exclusive of sales charges and assumes the reinvestment of dividends and distributions. Class I shares are not subject to sales charges. |
| (c) | Total investment return is not annualized. |
| (d) | In addition to the fees and expenses which the Fund bears directly, the Fund indirectly bears a pro-rata share of the fees and expenses of the Underlying Funds in which it invests. Such indirect expenses are not included in the above expense ratios. |
| | | | |
| 52 | | MainStay Moderate Growth Allocation Fund | | The notes to the financial statements are an integral part of,
and should be read in conjunction with, the financial statements. |
MainStay Growth Allocation Fund
Investment and Performance Comparison1 (Unaudited)
Performance data quoted represents past performance. Past performance is no guarantee of future results. Because of market volatility, current performance may be lower or higher than the figures shown. Investment return and principal value will fluctuate, and as a result, when shares are redeemed, they may be worth more or less than their original cost. The graph below depicts the historical performance of Class I shares of the Fund. Performance will vary from class to class based on differences in class-specific expenses and sales charges. For performance information current to the most recent month-end, please call 800-MAINSTAY (624-6782) or visit mainstayinvestments.com.
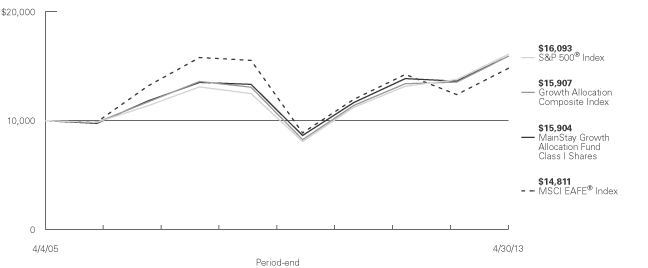
Average Annual Total Returns for the Period Ended April 30, 2013
| | | | | | | | | | | | | | | | | | | | | | | | |
| Class | | Sales Charge | | | | Six Months | | | One Year | | | Five Years | | | Since Inception (4/4/05) | | | Gross
Expence
Ratio2 | |
| Investor Class Shares3 | | Maximum 5.5% Initial Sales Charge | | With sales charges Excluding sales charges | |
| 9.45
15.82 | %
| |
| 9.83
16.22 | %
| |
| 2.06
3.22 | %
| |
| 4.80
5.54 | %
| |
| 1.90
1.90 | %
|
| Class A Shares | | Maximum 5.5% Initial Sales Charge | | With sales charges Excluding sales charges | |
| 9.56
15.94 |
| |
| 9.94
16.34 |
| |
| 2.14
3.30 |
| |
| 4.85
5.58 |
| |
| 1.69
1.69 |
|
| Class B Shares | | Maximum 5% CDSC if Redeemed Within the
First Six Years of Purchase | | With sales charges Excluding sales charges | |
| 10.45
15.45 |
| |
| 10.35
15.35 |
| |
| 2.10
2.47 |
| |
| 4.75
4.75 |
| |
| 2.65
2.65 |
|
| Class C Shares | | Maximum 1% CDSC if Redeemed Within
One Year of Purchase | | With sales charges Excluding sales charges | |
| 14.33
15.33 |
| |
| 14.23
15.23 |
| |
| 2.45
2.45 |
| |
| 4.76
4.76 |
| |
| 2.65
2.65 |
|
| Class I Shares | | No Sales Charge | | | | | 16.01 | | | | 16.61 | | | | 3.57 | | | | 5.91 | | | | 1.44 | |
| 1. | The performance table and graph do not reflect the deduction of taxes that a shareholder would pay on dividends, distributions or Fund share redemptions. Total returns reflect maximum applicable sales charges as indicated in the table above, changes in share price, and reinvestment of dividend and capital gain distributions. The graph assumes the initial investment amount shown above and reflects the deduction of all sales charges that would have applied for the period of investment. Performance figures reflect certain fee waivers and/or expense limitations, without which total returns may have been lower. For more information on share classes and current fee waivers and/or expense limitations, please refer to the notes to the financial statements. |
| 2. | The gross expense ratios presented reflect the Fund’s “Total Annual Fund Operating Expenses” from the most recent Prospectus and may differ from other expense ratios disclosed in this report. |
| 3. | Performance figures for Investor Class shares, first offered on February 28, 2008, include the historical performance of Class A shares through February 27, 2008, adjusted for differences in certain fees and expenses. Unadjusted, the performance shown for Investor Class shares would likely have been different. |
The footnotes on the next page are an integral part of the table and graph and should be carefully read in conjunction with them.
| | | | |
| mainstayinvestments.com | | | 53 | |
| | | | | | | | | | | | | | | | |
| Benchmark Performance | | Six
Months | | | One
Year | | | Five
Years | | | Since
Inception | |
S&P 500® Index4 | | | 14.42 | % | | | 16.89 | % | | | 5.21 | % | | | 6.07 | % |
MSCI EAFE® Index5 | | | 16.90 | | | | 19.39 | | | | –0.93 | | | | 4.99 | |
Growth Allocation Composite Index6 | | | 14.95 | | | | 17.46 | | | | 4.03 | | | | 5.92 | |
Average Lipper Multi-Cap Core Fund7 | | | 14.99 | | | | 15.56 | | | | 4.46 | | | | 5.63 | |
| 4. | “S&P 500®” is a trademark of The McGraw-Hill Companies, Inc. The S&P 500® Index is widely regarded as the standard index for measuring large-cap U.S. stock market performance. The S&P 500® Index is the Fund’s broad-based securities market index for comparison purposes. Results assume reinvestment of all income and capital gains. An investment cannot be made directly in an index. |
| 5. | The MSCI EAFE® Index consists of international stocks representing the developed world outside of North America. The MSCI EAFE® Index is the Fund’s secondary benchmark. Results assume reinvestment of all income and capital gains. An investment cannot be made directly in an index. |
| 6. | The Growth Allocation Composite Index consists of the S&P 500® Index and the MSCI EAFE® Index weighted 80% and 20%, respectively. The Fund has selected the Growth Allocation Composite Index as an additional |
| | benchmark. Total returns assume reinvestment of all dividends and capital gains. An investment cannot be made directly in an index. |
| 7. | The average Lipper multi-cap core fund is representative of funds that, by portfolio practice, invest in a variety of market-capitalization ranges without concentrating 75% of their equity assets in any one market-capitalization range over an extended period of time. Multi-cap core funds typically have an average price-to-earnings ratio, price-to-book ratio, and three-year sales-per-share growth value, compared to the S&P SuperComposite 1500 Index. This benchmark is a product of Lipper Inc. Lipper Inc. is an independent monitor of fund performance. Results are based on average total returns of similar funds with all dividend and capital gain distributions reinvested. |
The footnotes on the preceding page are an integral part of the table and graph and should be carefully read in conjunction with them.
| | |
| 54 | | MainStay Growth Allocation Fund |
Cost in Dollars of a $1,000 Investment in MainStay Growth Allocation Fund (Unaudited)
The example below is intended to describe the fees and expenses borne by shareholders during the six-month period from November 1, 2012, to April 30, 2013, and the impact of those costs on your investment.
Example
As a shareholder of the Fund, you incur two types of costs: (1) transaction costs, including exchange fees and sales charges (loads) on purchases (as applicable), and (2) ongoing costs, including management fees, distribution and/or service (12b-1) fees, and other Fund expenses (as applicable). This example is intended to help you understand your ongoing costs (in dollars) of investing in the Fund and to compare these costs with the ongoing costs of investing in other mutual funds. The example is based on an investment of $1,000 made at the beginning of the six-month period and held for the entire period from November 1, 2012, to April 30, 2013.
This example illustrates your Fund’s ongoing costs in two ways:
Actual Expenses
The second and third data columns in the table below provide information about actual account values and actual expenses. You may use the information in these columns, together with the amount you invested, to estimate the expenses that you paid during the six months ended April 30, 2013. Simply divide your account value by $1,000 (for example, an $8,600 account value divided by $1,000 = 8.6), then
multiply the result by the number under the heading entitled “Expenses Paid During Period” to estimate the expenses you paid on your account during this period.
Hypothetical Example for Comparison Purposes
The fourth and fifth data columns in the table below provide information about hypothetical account values and hypothetical expenses based on the Fund’s actual expense ratio and an assumed rate of return of 5% per year before expenses, which is not the Fund’s actual return. The hypothetical account values and expenses may not be used to estimate the actual ending account balances or expenses you paid for the six-month period shown. You may use this information to compare the ongoing costs of investing in the Fund with the ongoing costs of investing in other Funds. To do so, compare this 5% hypothetical example with the 5% hypothetical examples that appear in the shareholder reports of the other Funds.
Please note that the expenses shown in the table are meant to highlight your ongoing costs only and do not reflect any transactional costs, such as exchange fees or sales charges (loads). Therefore, the fourth and fifth data columns of the table are useful in comparing ongoing costs only and will not help you determine the relative total costs of owning different funds. In addition, if these transactional costs were included, your costs would have been higher.
| | | | | | | | | | | | | | | | | | | | |
| | | | | | | | | | | | | | | | |
| Share Class | | Beginning
Account
Value
11/1/12 | | | Ending Account
Value (Based
on Actual
Returns and
Expenses)
4/30/13 | | | Expenses
Paid
During
Period1 | | | Ending Account
Value (Based
on Hypothetical
5% Annualized
Return and
Actual Expenses)
4/30/13 | | | Expenses
Paid
During
Period1 | |
| | | | | |
| Investor Class Shares | | $ | 1,000.00 | | | $ | 1,158.20 | | | $ | 2.94 | | | $ | 1,022.10 | | | $ | 2.76 | |
| | | | | |
| Class A Shares | | $ | 1,000.00 | | | $ | 1,159.40 | | | $ | 2.20 | | | $ | 1,022.80 | | | $ | 2.06 | |
| | | | | |
| Class B Shares | | $ | 1,000.00 | | | $ | 1,154.50 | | | $ | 6.94 | | | $ | 1,018.30 | | | $ | 6.51 | |
| | | | | |
| Class C Shares | | $ | 1,000.00 | | | $ | 1,153.30 | | | $ | 6.94 | | | $ | 1,018.30 | | | $ | 6.51 | |
| | | | | |
| Class I Shares | | $ | 1,000.00 | | | $ | 1,160.10 | | | $ | 0.86 | | | $ | 1,024.00 | | | $ | 0.80 | |
| 1. | Expenses are equal to the Fund’s annualized expense ratio of each class (0.55% for Investor Class, 0.41% for Class A, 1.30% for Class B and Class C and 0.16% for Class I) multiplied by the average account value over the period, divided by 365 and multiplied by 181 (to reflect the six-month period). The table above represents the actual expenses incurred during the six-month period. In addition to the fees and expenses which the Fund bears directly, the Fund indirectly bears a pro rata share of the fees and expenses of the Underlying Funds in which it invests. Such indirect expenses are not included in the above-reported expense figures. |
| | | | |
| mainstayinvestments.com | | | 55 | |
Investment Objectives of Underlying Funds as of April 30, 2013 (Unaudited)
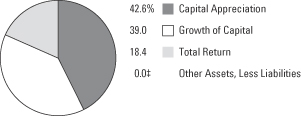
See Portfolio of Investments on page 59 for specific holdings within these categories.
| ‡ | Less than one-tenth of a percent. |
| | |
| 56 | | MainStay Growth Allocation Fund |
Portfolio Management Discussion and Analysis (Unaudited)
Questions answered by portfolio managers Jae S. Yoon, CFA, Jonathan Swaney and Poul Kristensen, CFA, of New York Life Investments.1
How did MainStay Growth Allocation Fund perform relative to its peers and its benchmark during the six months ended April 30, 2013?
Excluding all sales charges, MainStay Growth Allocation Fund returned 15.82% for Investor Class shares, 15.94% for Class A shares and 15.45% for Class B shares and 15.33% for Class C shares for the six months ended April 30, 2013. Over the same period, Class I shares returned 16.01%. All share classes outperformed the 14.99% return of the average Lipper2 multi-cap core fund for the six months ended April 30, 2013. Over the same period, all share classes outperformed the 14.42% return of the S&P 500® Index,3 which is the Fund’s broad-based securities-market index, and underperformed the 16.90% return of the MSCI EAFE® Index,4 which is the secondary benchmark of the Fund. All share classes outperformed the 14.95% return of the Growth Allocation Composite Index5 for the six months ended April 30, 2013. The Growth Allocation Composite Index is an additional benchmark of the Fund. See page 53 for Fund returns with applicable sales charges.
Were there any changes to the Fund during the reporting period?
Effective February 28, 2013, the Fund’s Principal Investment Strategies were modified to broaden the investment ranges for each of the asset classes in which the Fund may invest by an additional ten percentage points. Also effective February 28, 2013, Poul Kristensen, CFA, was added as a portfolio manager. For more information on these changes, please see the Prospectus dated February 28, 2013.
What factors affected the Fund’s relative performance during the reporting period?
The Fund is a “fund of funds,” meaning that it seeks to achieve its investment objective by investing primarily in other MainStay Funds (the “Underlying Funds”). The Underlying Funds may invest in domestic or international stocks at various capitalization levels, subject to limits outlined in the Prospectus. The Fund’s primary benchmark, on the other hand, consists entirely of U.S. large-cap stocks. These differences accounted for much of the Fund’s strong performance relative to the S&P 500® Index during the reporting period.
The Fund provided strong returns relative to its average peer fund and the Growth Allocation Composite Index during the reporting period, but asset class decisions deserve none of the credit. The Fund maintained an emphasis on large-cap stocks rather than small-cap stocks and on U.S. equities over inter
national offerings. Both of these strategies detracted modestly from relative performance.
The Fund’s strong relative performance resulted primarily from the performance of its Underlying Funds. Significant holdings in MainStay U.S. Equity Opportunities Fund and MainStay International Opportunities Fund substantially helped relative performance, as both were near the top of their respective peer groups. Relying on MainStay Large Cap Growth Fund more heavily than MainStay Cornerstone Growth Fund also proved beneficial. Other positive contributors included MainStay MAP Fund and MainStay U.S. Small Cap Fund.
Positions in MainStay Epoch Global Choice Fund and MainStay Marketfield Fund weighed on returns. Neither of these Underlying Funds performed particularly well in relation to the portion of the market to which they provided exposure.
How did you allocate the Fund’s assets during the reporting period and why?
We considered a variety of information, including the portfolio-level characteristics of the Underlying Funds, such as capitalization, style biases, sector exposures. We also examined the attributes of the Underlying Funds’ holdings, such as valuation metrics, earnings data and technical indicators. Finally, we evaluated the historical success of the managers responsible for the Underlying Funds. Generally speaking, we seek to invest in Underlying Funds that occupy attractively valued segments of the market, invest in fairly priced securities and are steered by individuals who have consistently demonstrated capable management in the past.
We maintained a bias in favor of Underlying Funds that invest in U.S. stocks over Underlying Funds that invest in stocks traded in other developed markets. We were particularly concerned about countries that are likely to struggle with deleveraging issues even greater than those presented in the United States. Results were mixed, as Japan in particular experienced very strong returns on the back of aggressive fiscal and monetary policy changes.
How did the Fund’s allocations change over the course of the reporting period?
Position sizes naturally fluctuate with changing market conditions, and such changes do not always reflect an explicit change in our strategic or tactical point of view. That said, the most notable allocation changes during the reporting period were associated with the expanding list of eligible investments, as several new MainStay Funds became available.
| 1. | “New York Life Investments” is a service mark used by New York Life Investment Management LLC. |
| 2. | See footnote on page 54 for more information on Lipper Inc. |
| 3. | See footnote on page 54 for more information on the S&P 500® Index. |
| 4. | See footnote on page 54 for more information on the MSCI EAFE® Index. |
| 5. | See footnote on page 54 for more information on the Growth Allocation Composite Index. |
| | | | |
| mainstayinvestments.com | | | 57 | |
MainStay Marketfield Fund, a global long/short and low-beta6 product, was one of the largest new positions, established by using proceeds from a mix of other Underlying Funds.
MainStay Cornerstone Growth Fund was another new product. We established a position in this Underlying Fund using proceeds from MainStay Large Cap Growth Fund as we sought to widen strategy diversification within that portion of the market.
Also of note, we increased the Fund’s position in MainStay U.S. Small Cap Fund as we unwound the Fund’s previous large-cap bias. The increased allocation was funded from a mix of Underlying Funds. Additionally, we shifted assets from MainStay Common Stock Fund to MainStay U.S. Equity Opportunities Fund (formerly MainStay 130/30 Core Fund).
During the reporting period, which Underlying Funds had the highest total returns and which Underlying Funds had the lowest total returns?
MainStay International Opportunities Fund generated the highest absolute return by a comfortable margin, followed by MainStay U.S. Small Cap Fund. Although none of the Underlying Funds in
which the Fund invested provided negative returns for the reporting period, the lowest absolute returns in the equity portion of the Fund came from MainStay Cornerstone Growth Fund and MainStay International Equity Fund.
Which Underlying Funds made the strongest positive contributions to the Fund’s overall performance, and which Underlying Equity Funds were the greatest detractors?
Because contributions take weightings and total returns into account and position sizes may vary, the Underlying Funds with the highest (or lowest) returns may not always have the most significantly positive (or negative) contributions to performance.
During the reporting period, a large position in MainStay MAP Fund made the largest positive contribution to the Fund’s performance, followed by a significantly smaller position in MainStay U.S. Small Cap Fund. Although none of the Underlying Equity Funds in which the Fund invested had negative total returns, the smallest contributions came from a new position being built in MainStay Cornerstone Growth Fund and from a very small position in MainStay ICAP Select Equity Fund.
| 6. | Beta is a measure of volatility in relation to the market as a whole. A beta higher than 1 indicates that a security or portfolio will tend to exhibit higher volatility than the market. A beta lower than 1 indicates that a security or portfolio will tend to exhibit lower volatility than the market. |
The opinions expressed are those of the portfolio managers as of the date of this report and are subject to change. There is no guarantee that any forecast made will come to pass. This material does not constitute investment advice and is not intended as an endorsement of any specific investment.
| | |
| 58 | | MainStay Growth Allocation Fund |
Portfolio of Investments April 30, 2013 (Unaudited)
| | | | | | | | |
| | |
| | | Shares | | | Value | |
| Affiliated Investment Companies 100.0%† | |
Equity Funds 100.0% | |
MainStay Common Stock Fund Class I | | | 176,765 | | | $ | 2,600,213 | |
MainStay Cornerstone Growth Fund Class I (a) | | | 189,872 | | | | 5,667,673 | |
MainStay Epoch Global Choice Fund Class I (a) | | | 408,749 | | | | 7,570,031 | |
MainStay Epoch U.S. All Cap Fund Class I | | | 695,469 | | | | 17,497,997 | |
MainStay ICAP Equity Fund Class I | | | 496,309 | | | | 22,393,453 | |
MainStay ICAP International Fund Class I | | | 455,087 | | | | 14,758,473 | |
MainStay ICAP Select Equity Fund Class I | | | 15,181 | | | | 653,862 | |
MainStay International Equity Fund Class I | | | 494,268 | | | | 6,232,716 | |
MainStay International Opportunities Fund Class I (a) | | | 2,607,497 | | | | 21,329,329 | |
MainStay Large Cap Growth Fund Class I | | | 2,542,591 | | | | 22,425,653 | |
MainStay MAP Fund Class I | | | 1,211,714 | | | | 48,250,456 | |
MainStay Marketfield Fund Class I (b) | | | 296,094 | | | | 4,938,843 | |
MainStay S&P 500 Index Fund Class I | | | 94,349 | | | | 3,501,275 | |
MainStay U.S. Equity Opportunities Fund Class I (a) | | | 4,416,793 | | | | 40,060,310 | |
MainStay U.S. Small Cap Fund Class I (a) | | | 1,623,941 | | | | 33,940,375 | |
| | | | | | | | |
Total Investments
(Cost $199,370,396) (c) | | | 100.0 | % | | | 251,820,659 | |
Other Assets, Less Liabilities | | | (0.0 | )‡ | | | (50,740 | ) |
Net Assets | | | 100.0 | % | | $ | 251,769,919 | |
| † | Percentages indicated are based on Fund net assets. |
| ‡ | Less than one-tenth of a percent. |
| (a) | The Fund’s ownership exceeds 5% of the outstanding shares of the Underlying Fund’s share class. (See Note 3) |
| (b) | Non-income producing Underlying Fund. |
| (c) | As of April 30, 2013, cost is $204,841,278 for federal income tax purposes and net unrealized appreciation is as follows: |
| | | | |
Gross unrealized appreciation | | $ | 52,450,263 | |
Gross unrealized depreciation | | | (5,470,882 | ) |
| | | | |
Net unrealized appreciation | | $ | 46,979,381 | |
| | | | |
The following is a summary of the fair valuations according to the inputs used as of April 30, 2013, for valuing the Fund’s assets.
Asset Valuation Inputs
| | | | | | | | | | | | | | | | |
Description | | Quoted
Prices in
Active
Markets for
Identical
Assets (Level 1) | | | Significant
Other
Observable
Inputs
(Level 2) | | | Significant
Unobservable
Inputs
(Level 3) | | | Total | |
| Investments (a) | | | | | | | | | | | | | | | | |
| Affiliated Investment Companies | | | | | | | | | | | | | | | | |
Equity Funds | | $ | 251,820,659 | | | $ | — | | | $ | — | | | $ | 251,820,659 | |
| | | | | | | | | | | | | | | | |
| Total Investments | | $ | 251,820,659 | | | $ | — | | | $ | — | | | $ | 251,820,659 | |
| | | | | | | | | | | | | | | | |
| (a) | For a complete listing of investments, see the Portfolio of Investments. |
The Fund recognizes transfers between the levels as of the beginning of the period.
For the period ended April 30, 2013, the Fund did not have any transfers between Level 1 and Level 2 fair value measurements. (See Note 2)
As of April 30, 2013, the Fund did not hold any investments with significant unobservable inputs (Level 3). (See Note 2)
| | | | | | |
The notes to the financial statements are an integral part of,
and should be read in conjunction with, the financial statements. | | mainstayinvestments.com | | | 59 | |
Statement of Assets and Liabilities as of April 30, 2013 (Unaudited)
| | | | |
| Assets | | | | |
Investment in affiliated investment companies, at value (identified cost $199,370,396) | | $ | 251,820,659 | |
Receivables: | | | | |
Fund shares sold | | | 217,807 | |
Manager (See Note 3) | | | 5,704 | |
Other assets | | | 49,911 | |
| | | | |
Total assets | | | 252,094,081 | |
| | | | |
| |
| Liabilities | | | | |
Payables: | | | | |
Fund shares redeemed | | | 107,933 | |
NYLIFE Distributors (See Note 3) | | | 93,409 | |
Transfer agent (See Note 3) | | | 84,016 | |
Shareholder communication | | | 17,975 | |
Professional fees | | | 15,537 | |
Custodian | | | 854 | |
Trustees | | | 510 | |
Accrued expenses | | | 3,928 | |
| | | | |
Total liabilities | | | 324,162 | |
| | | | |
Net assets | | $ | 251,769,919 | |
| | | | |
| |
| Composition of Net Assets | | | | |
Shares of beneficial interest outstanding (par value of $.001 per share) unlimited number of shares authorized | | $ | 19,160 | |
Additional paid-in capital | | | 219,755,022 | |
| | | | |
| | | 219,774,182 | |
Distributions in excess of net investment income | | | (661,974 | ) |
Accumulated net realized gain (loss) on investments | | | (19,792,552 | ) |
Net unrealized appreciation (depreciation) on investments | | | 52,450,263 | |
| | | | |
Net assets | | $ | 251,769,919 | |
| | | | |
| | | | |
Investor Class | | | | |
Net assets applicable to outstanding shares | | $ | 88,624,968 | |
| | | | |
Shares of beneficial interest outstanding | | | 6,706,329 | |
| | | | |
Net asset value per share outstanding | | $ | 13.22 | |
Maximum sales charge (5.50% of offering price) | | | 0.77 | |
| | | | |
Maximum offering price per share outstanding | | $ | 13.99 | |
| | | | |
Class A | | | | |
Net assets applicable to outstanding shares | | $ | 89,034,891 | |
| | | | |
Shares of beneficial interest outstanding | | | 6,732,179 | |
| | | | |
Net asset value per share outstanding | | $ | 13.23 | |
Maximum sales charge (5.50% of offering price) | | | 0.77 | |
| | | | |
Maximum offering price per share outstanding | | $ | 14.00 | |
| | | | |
Class B | | | | |
Net assets applicable to outstanding shares | | $ | 55,659,782 | |
| | | | |
Shares of beneficial interest outstanding | | | 4,302,117 | |
| | | | |
Net asset value and offering price per share outstanding | | $ | 12.94 | |
| | | | |
Class C | | | | |
Net assets applicable to outstanding shares | | $ | 16,286,076 | |
| | | | |
Shares of beneficial interest outstanding | | | 1,257,255 | |
| | | | |
Net asset value and offering price per share outstanding | | $ | 12.95 | |
| | | | |
Class I | | | | |
Net assets applicable to outstanding shares | | $ | 2,164,202 | |
| | | | |
Shares of beneficial interest outstanding | | | 161,771 | |
| | | | |
Net asset value and offering price per share outstanding | | $ | 13.38 | |
| | | | |
| | | | |
| 60 | | MainStay Growth Allocation Fund | | The notes to the financial statements are an integral part of,
and should be read in conjunction with, the financial statements. |
Statement of Operations for the six months ended April 30, 2013 (Unaudited)
| | | | |
| Investment Income (Loss) | | | | |
Income | | | | |
Dividend distributions from affiliated investment companies | | $ | 2,242,775 | |
| | | | |
Expenses | | | | |
Distribution/Service—Investor Class (See Note 3) | | | 101,806 | |
Distribution/Service—Class A (See Note 3) | | | 101,712 | |
Distribution/Service—Class B (See Note 3) | | | 259,259 | |
Distribution/Service—Class C (See Note 3) | | | 72,950 | |
Transfer agent (See Note 3) | | | 242,862 | |
Registration | | | 34,627 | |
Shareholder communication | | | 23,565 | |
Professional fees | | | 16,283 | |
Trustees | | | 2,639 | |
Custodian | | | 1,977 | |
Miscellaneous | | | 6,815 | |
| | | | |
Total expenses before waiver/reimbursement | | | 864,495 | |
Expense waiver/reimbursement from Manager (See Note 3) | | | (38,767 | ) |
| | | | |
Net expenses | | | 825,728 | |
| | | | |
Net investment income (loss) | | | 1,417,047 | |
| | | | |
|
| Realized and Unrealized Gain (Loss) on Investments | |
Net realized gain (loss) on: | | | | |
Affiliated investment company transactions | | | 2,294,751 | |
Realized capital gain distributions from affiliated investment companies | | | 3,290,422 | |
| | | | |
Net realized gain (loss) on investments from affiliated investment companies | | | 5,585,173 | |
| | | | |
Net change in unrealized appreciation (depreciation) on investments | | | 27,151,350 | |
| | | | |
Net realized and unrealized gain (loss) on investments | | | 32,736,523 | |
| | | | |
Net increase (decrease) in net assets resulting from operations | | $ | 34,153,570 | |
| | | | |
| | | | | | |
The notes to the financial statements are an integral part of,
and should be read in conjunction with, the financial statements. | | mainstayinvestments.com | | | 61 | |
Statements of Changes in Net Assets
for the six months ended April 30, 2013 (Unaudited) and the year ended October 31, 2012
| | | | | | | | |
| | | 2013 | | | 2012 | |
| Increase (Decrease) in Net Assets | |
Operations: | | | | | | | | |
Net investment income (loss) | | $ | 1,417,047 | | | $ | 351,998 | |
Net realized gain (loss) on investments from affiliated investment companies transactions | | | 5,585,173 | | | | 2,192,872 | |
Net change in unrealized appreciation (depreciation) on investments | | | 27,151,350 | | | | 17,974,206 | |
| | | | |
Net increase (decrease) in net assets resulting from operations | | | 34,153,570 | | | | 20,519,076 | |
| | | | |
Dividends to shareholders: | | | | | | | | |
From net investment income: | | | | | | | | |
Investor Class | | | (862,211 | ) | | | (233,930 | ) |
Class A | | | (952,757 | ) | | | (272,458 | ) |
Class B | | | (185,849 | ) | | | — | |
Class C | | | (51,032 | ) | | | — | |
Class I | | | (27,172 | ) | | | (10,992 | ) |
| | | | |
Total dividends to shareholders | | | (2,079,021 | ) | | | (517,380 | ) |
| | | | |
Capital share transactions: | | | | | | | | |
Net proceeds from sale of shares | | | 19,926,897 | | | | 32,215,206 | |
Net asset value of shares issued to shareholders in reinvestment of dividends | | | 2,012,481 | | | | 498,695 | |
Cost of shares redeemed | | | (21,368,837 | ) | | | (39,345,207 | ) |
| | | | |
Increase (decrease) in net assets derived from capital share transactions | | | 570,541 | | | | (6,631,306 | ) |
| | | | |
Net increase (decrease) in net assets | | | 32,645,090 | | | | 13,370,390 | |
|
| Net Assets | |
Beginning of period | | | 219,124,829 | | | | 205,754,439 | |
| | | | |
End of period | | $ | 251,769,919 | | | $ | 219,124,829 | |
| | | | |
Undistributed (distributions in excess of) net investment income at end of period | | $ | (661,974 | ) | | $ | — | |
| | | | |
| | | | |
| 62 | | MainStay Growth Allocation Fund | | The notes to the financial statements are an integral part of,
and should be read in conjunction with, the financial statements. |
Financial Highlights selected per share data and ratios
| | | | | | | | | | | | | | | | | | | | | | | | |
| | | Investor Class | |
| | | Six months
ended
April 30, | | | Year ended October 31, | | | February 28,
2008**
through
October 31, | |
| | | 2013* | | | 2012 | | | 2011 | | | 2010 | | | 2009 | | | 2008 | |
Net asset value at beginning of period | | $ | 11.54 | | | $ | 10.49 | | | $ | 10.22 | | | $ | 8.97 | | | $ | 8.09 | | | $ | 11.68 | |
| | | | | | | | | | | | | | | | | | | | | | | | |
Net investment income (loss) (a) | | | 0.08 | | | | 0.04 | | | | 0.05 | | | | 0.03 | | | | 0.10 | | | | 0.01 | |
Net realized and unrealized gain (loss)
on investments | | | 1.73 | | | | 1.04 | | | | 0.27 | | | | 1.27 | | | | 1.00 | | | | (3.60 | ) |
| | | | | | | | | | | | | | | | | | | | | | | | |
Total from investment operations | | | 1.81 | | | | 1.08 | | | | 0.32 | | | | 1.30 | | | | 1.10 | | | | (3.59 | ) |
| | | | | | | | | | | | | | | | | | | | | | | | |
Less dividends and distributions: | | | | | | | | | | | | | | | | | | | | | | | | |
From net investment income | | | (0.13 | ) | | | (0.03 | ) | | | (0.05 | ) | | | (0.05 | ) | | | (0.14 | ) | | | — | |
From net realized gain on investments | | | — | | | | — | | | | — | | | | — | | | | (0.08 | ) | | | — | |
| | | | | | | | | | | | | | | | | | | | | | | | |
Total dividends and distributions | | | (0.13 | ) | | | (0.03 | ) | | | (0.05 | ) | | | (0.05 | ) | | | (0.22 | ) | | | — | |
| | | | | | | | | | | | | | | | | | | | | | | | |
Net asset value at end of period | | $ | 13.22 | | | $ | 11.54 | | | $ | 10.49 | | | $ | 10.22 | | | $ | 8.97 | | | $ | 8.09 | |
| | | | | | | | | | | | | | | | | | | | | | | | |
Total investment return (b) | | | 15.82 | %(c) | | | 10.37 | % | | | 3.12 | % | | | 14.54 | % | | | 14.13 | % | | | (30.74 | %)(c) |
Ratios (to average net assets)/Supplemental Data: | | | | | | | | | | | | | | | | | | | | | | | | |
Net investment income (loss) | | | 1.37 | %†† | | | 0.35 | % | | | 0.50 | % | | | 0.35 | % | | | 1.30 | % | | | 0.19 | % †† |
Net expenses (d) | | | 0.55 | %†† | | | 0.53 | % | | | 0.50 | % | | | 0.50 | % | | | 0.50 | % | | | 0.50 | % †† |
Expenses (before waiver/reimbursement) (d) | | | 0.60 | %†† | | | 0.63 | % | | | 0.65 | % | | | 0.73 | % | | | 0.88 | % | | | 0.75 | % †† |
Portfolio turnover rate | | | 14 | % | | | 47 | % | | | 53 | % | | | 54 | % | | | 42 | % | | | 37 | % |
Net assets at end of period (in 000’s) | | $ | 88,625 | | | $ | 76,323 | | | $ | 71,730 | | | $ | 66,013 | | | $ | 54,578 | | | $ | 38,881 | |
| ** | Commencement of operations. |
| (a) | Per share data based on average shares outstanding during the period. |
| (b) | Total investment return is calculated exclusive of sales charges and assumes the reinvestment of dividends and distributions. |
| (c) | Total investment return is not annualized. |
| (d) | In addition to the fees and expenses which the Fund bears directly, the Fund indirectly bears a pro-rata share of the fees and expenses of the Underlying Funds in which it invests. Such indirect expenses are not included in the above expense ratios. |
| | | | | | |
The notes to the financial statements are an integral part of,
and should be read in conjunction with, the financial statements. | | mainstayinvestments.com | | | 63 | |
Financial Highlights selected per share data and ratios
| | | | | | | | | | | | | | | | | | | | | | | | |
| | | Class A | |
| | | Six months
ended
April 30, | | | Year ended October 31, | |
| | | 2013* | | | 2012 | | | 2011 | | | 2010 | | | 2009 | | | 2008 | |
Net asset value at beginning of period | | $ | 11.55 | | | $ | 10.50 | | | $ | 10.22 | | | $ | 8.97 | | | $ | 8.08 | | | $ | 13.78 | |
| | | | | | | | | | | | | | | | | | | | | | | | |
Net investment income (loss) (a) | | | 0.09 | | | | 0.05 | | | | 0.06 | | | | 0.04 | | | | 0.12 | | | | 0.07 | |
Net realized and unrealized gain (loss) on investments | | | 1.73 | | | | 1.04 | | | | 0.27 | | | | 1.26 | | | | 0.99 | | | | (5.11 | ) |
| | | | | | | | | | | | | | | | | | | | | | | | |
Total from investment operations | | | 1.82 | | | | 1.09 | | | | 0.33 | | | | 1.30 | | | | 1.11 | | | | (5.04 | ) |
| | | | | | | | | | | | | | | | | | | | | | | | |
Less dividends and distributions: | | | | | | | | | | | | | | | | | | | | | | | | |
From net investment income | | | (0.14 | ) | | | (0.04 | ) | | | (0.05 | ) | | | (0.05 | ) | | | (0.14 | ) | | | (0.32 | ) |
From net realized gain on investments | | | — | | | | — | | | | — | | | | — | | | | (0.08 | ) | | | (0.34 | ) |
| | | | | | | | | | | | | | | | | | | | | | | | |
Total dividends and distributions | | | (0.14 | ) | | | (0.04 | ) | | | (0.05 | ) | | | (0.05 | ) | | | (0.22 | ) | | | (0.66 | ) |
| | | | | | | | | | | | | | | | | | | | | | | | |
Net asset value at end of period | | $ | 13.23 | | | $ | 11.55 | | | $ | 10.50 | | | $ | 10.22 | | | $ | 8.97 | | | $ | 8.08 | |
| | | | | | | | | | | | | | | | | | | | | | | | �� |
Total investment return (b) | | | 15.94 | %(c) | | | 10.43 | % | | | 3.25 | % | | | 14.57 | % | | | 14.29 | % | | | (38.20 | %) |
Ratios (to average net assets)/Supplemental Data: | | | | | | | | | | | | | | | | | | | | | | | | |
Net investment income (loss) | | | 1.53 | %†† | | | 0.44 | % | | | 0.55 | % | | | 0.38 | % | | | 1.55 | % | | | 0.60 | % |
Net expenses (d) | | | 0.41 | %†† | | | 0.42 | % | | | 0.44 | % | | | 0.48 | % | | | 0.48 | % | | | 0.49 | % |
Expenses (before waiver/reimbursement) (d) | | | 0.41 | %†† | | | 0.42 | % | | | 0.44 | % | | | 0.48 | % | | | 0.52 | % | | | 0.57 | % |
Portfolio turnover rate | | | 14 | % | | | 47 | % | | | 53 | % | | | 54 | % | | | 42 | % | | | 37 | % |
Net assets at end of period (in 000’s) | | $ | 89,035 | | | $ | 77,775 | | | $ | 70,127 | | | $ | 71,983 | | | $ | 62,210 | | | $ | 58,165 | |
| (a) | Per share data based on average shares outstanding during the period. |
| (b) | Total investment return is calculated exclusive of sales charges and assumes the reinvestment of dividends and distributions. |
| (c) | Total investment return is not annualized. |
| (d) | In addition to the fees and expenses which the Fund bears directly, the Fund indirectly bears a pro-rata share of the fees and expenses of the Underlying Funds in which it invests. Such indirect expenses are not included in the above expense ratios. |
| | | | |
| 64 | | MainStay Growth Allocation Fund | | The notes to the financial statements are an integral part of,
and should be read in conjunction with, the financial statements. |
Financial Highlights selected per share data and ratios
| | | | | | | | | | | | | | | | | | | | | | | | |
| | | Class B | |
| | | Six months
ended
April 30, | | | Year ended October 31, | |
| | | 2013* | | | 2012 | | | 2011 | | | 2010 | | | 2009 | | | 2008 | |
Net asset value at beginning of period | | $ | 11.25 | | | $ | 10.27 | | | $ | 10.03 | | | $ | 8.82 | | | $ | 7.94 | | | $ | 13.56 | |
| | | | | | | | | | | | | | | | | | | | | | | | |
Net investment income (loss) (a) | | | 0.04 | | | | (0.04 | ) | | | (0.02 | ) | | | (0.04 | ) | | | 0.05 | | | | (0.03 | ) |
Net realized and unrealized gain (loss) on investments | | | 1.69 | | | | 1.02 | | | | 0.26 | | | | 1.25 | | | | 0.98 | | | | (5.01 | ) |
| | | | | | | | | | | | | | | | | | | | | | | | |
Total from investment operations | | | 1.73 | | | | 0.98 | | | | 0.24 | | | | 1.21 | | | | 1.03 | | | | (5.04 | ) |
| | | | | | | | | | | | | | | | | | | | | | | | |
Less dividends and distributions: | | | | | | | | | | | | | | | | | | | | | | | | |
From net investment income | | | (0.04 | ) | | | — | | | | — | | | | — | | | | (0.07 | ) | | | (0.24 | ) |
From net realized gain on investments | | | — | | | | — | | | | — | | | | — | | | | (0.08 | ) | | | (0.34 | ) |
| | | | | | | | | | | | | | | | | | | | | | | | |
Total dividends and distributions | | | (0.04 | ) | | | — | | | | — | | | | — | | | | (0.15 | ) | | | (0.58 | ) |
| | | | | | | | | | | | | | | | | | | | | | | | |
Net asset value at end of period | | $ | 12.94 | | | $ | 11.25 | | | $ | 10.27 | | | $ | 10.03 | | | $ | 8.82 | | | $ | 7.94 | |
| | | | | | | | | | | | | | | | | | | | | | | | |
Total investment return (b) | | | 15.45 | %(c) | | | 9.54 | % (d) | | | 2.49 | % | | | 13.72 | % | | | 13.32 | % | | | (38.65 | %) |
Ratios (to average net assets)/Supplemental Data: | | | | | | | | | | | | | | | | | | | | | | | | |
Net investment income (loss) | | | 0.66 | %†† | | | (0.38 | %) | | | (0.23 | %) | | | (0.38 | %) | | | 0.65 | % | | | (0.24 | %) |
Net expenses (e) | | | 1.30 | %†† | | | 1.28 | % | | | 1.25 | % | | | 1.25 | % | | | 1.25 | % | | | 1.25 | % |
Expenses (before waiver/reimbursement) (e) | | | 1.35 | %†† | | | 1.38 | % | | | 1.40 | % | | | 1.48 | % | | | 1.64 | % | | | 1.44 | % |
Portfolio turnover rate | | | 14 | % | | | 47 | % | | | 53 | % | | | 54 | % | | | 42 | % | | | 37 | % |
Net assets at end of period (in 000’s) | | $ | 55,660 | | | $ | 49,650 | | | $ | 49,874 | | | $ | 52,053 | | | $ | 49,206 | | | $ | 42,501 | |
| (a) | Per share data based on average shares outstanding during the period. |
| (b) | Total investment return is calculated exclusive of sales charges and assumes the reinvestment of dividends and distributions. |
| (c) | Total investment return is not annualized. |
| (d) | Total investment returns may reflect adjustments to conform to generally accepted accounting principles. |
| (e) | In addition to the fees and expenses which the Fund bears directly, the Fund indirectly bears a pro-rata share of the fees and expenses of the Underlying Funds in which it invests. Such indirect expenses are not included in the above expense ratios. |
| | | | | | |
The notes to the financial statements are an integral part of,
and should be read in conjunction with, the financial statements. | | mainstayinvestments.com | | | 65 | |
Financial Highlights selected per share data and ratios
| | | | | | | | | | | | | | | | | | | | | | | | |
| | | Class C | |
| | | Six months
ended
April 30, | | | Year ended October 31, | |
| | | 2013* | | | 2012 | | | 2011 | | | 2010 | | | 2009 | | | 2008 | |
Net asset value at beginning of period | | $ | 11.27 | | | $ | 10.29 | | | $ | 10.04 | | | $ | 8.84 | | | $ | 7.96 | | | $ | 13.58 | |
| | | | | | | | | | | | | | | | | | | | | | | | |
Net investment income (loss) (a) | | | 0.04 | | | | (0.05 | ) | | | (0.03 | ) | | | (0.04 | ) | | | 0.05 | | | | (0.02 | ) |
Net realized and unrealized gain (loss) on investments | | | 1.68 | | | | 1.03 | | | | 0.28 | | | | 1.24 | | | | 0.98 | | | | (5.02 | ) |
| | | | | | | | | | | | | | | | | | | | | | | | |
Total from investment operations | | | 1.72 | | | | 0.98 | | | | 0.25 | | | | 1.20 | | | | 1.03 | | | | (5.04 | ) |
| | | | | | | | | | | | | | | | | | | | | | | | |
Less dividends and distributions: | | | | | | | | | | | | | | | | | | | | | | | | |
From net investment income | | | (0.04 | ) | | | — | | | | — | | | | — | | | | (0.07 | ) | | | (0.24 | ) |
From net realized gain on investments | | | — | | | | — | | | | — | | | | — | | | | (0.08 | ) | | | (0.34 | ) |
| | | | | | | | | | | | | | | | | | | | | | | | |
Total dividends and distributions | | | (0.04 | ) | | | — | | | | — | | | | — | | | | (0.15 | ) | | | (0.58 | ) |
| | | | | | | | | | | | | | | | | | | | | | | | |
Net asset value at end of period | | $ | 12.95 | | | $ | 11.27 | | | $ | 10.29 | | | $ | 10.04 | | | $ | 8.84 | | | $ | 7.96 | |
| | | | | | | | | | | | | | | | | | | | | | | | |
Total investment return (b) | | | 15.33 | %(c) | | | 9.52 | % | | | 2.49 | % | | | 13.57 | % | | | 13.29 | % | | | (38.58 | %) |
Ratios (to average net assets)/Supplemental Data: | | | | | | | | | | | | | | | | | | | | | | | | |
Net investment income (loss) | | | 0.62 | %†† | | | (0.42 | %) | | | (0.27 | %) | | | (0.39 | %) | | | 0.61 | % | | | (0.21 | %) |
Net expenses (d) | | | 1.30 | %†† | | | 1.28 | % | | | 1.25 | % | | | 1.25 | % | | | 1.25 | % | | | 1.25 | % |
Expenses (before waiver/reimbursement) (d) | | | 1.35 | %†† | | | 1.38 | % | | | 1.40 | % | | | 1.48 | % | | | 1.64 | % | | | 1.44 | % |
Portfolio turnover rate | | | 14 | % | | | 47 | % | | | 53 | % | | | 54 | % | | | 42 | % | | | 37 | % |
Net assets at end of period (in 000’s) | | $ | 16,286 | | | $ | 13,557 | | | $ | 12,484 | | | $ | 11,599 | | | $ | 10,773 | | | $ | 8,682 | |
| (a) | Per share data based on average shares outstanding during the period. |
| (b) | Total investment return is calculated exclusive of sales charges and assumes the reinvestment of dividends and distributions. |
| (c) | Total investment return is not annualized. |
| (d) | In addition to the fees and expenses which the Fund bears directly, the Fund indirectly bears a pro-rata share of the fees and expenses of the Underlying Funds in which it invests. Such indirect expenses are not included in the above expense ratios. |
| | | | |
| 66 | | MainStay Growth Allocation Fund | | The notes to the financial statements are an integral part of,
and should be read in conjunction with, the financial statements. |
Financial Highlights selected per share data and ratios
| | | | | | | | | | | | | | | | | | | | | | | | |
| | | Class I | |
| | | Six months
ended
April 30, | | | Year ended October 31, | |
| | | 2013* | | | 2012 | | | 2011 | | | 2010 | | | 2009 | | | 2008 | |
Net asset value at beginning of period | | $ | 11.69 | | | $ | 10.62 | | | $ | 10.33 | | | $ | 9.06 | | | $ | 8.17 | | | $ | 13.91 | |
| | | | | | | | | | | | | | | | | | | | | | | | |
Net investment income (loss) (a) | | | 0.11 | | | | 0.07 | | | | 0.09 | | | | 0.06 | | | | 0.12 | | | | 0.07 | |
Net realized and unrealized gain (loss) on investments | | | 1.75 | | | | 1.07 | | | | 0.28 | | | | 1.28 | | | | 1.01 | | | | (5.12 | ) |
| | | | | | | | | | | | | | | | | | | | | | | | |
Total from investment operations | | | 1.86 | | | | 1.14 | | | | 0.37 | | | | 1.34 | | | | 1.13 | | | | (5.05 | ) |
| | | | | | | | | | | | | | | | | | | | | | | | |
Less dividends and distributions: | | | | | | | | | | | | | | | | | | | | | | | | |
From net investment income | | | (0.17 | ) | | | (0.07 | ) | | | (0.08 | ) | | | (0.07 | ) | | | (0.16 | ) | | | (0.35 | ) |
From net realized gain on investments | | | — | | | | — | | | | — | | | | — | | | | (0.08 | ) | | | (0.34 | ) |
| | | | | | | | | | | | | | | | | | | | | | | | |
Total dividends and distributions | | | (0.17 | ) | | | (0.07 | ) | | | (0.08 | ) | | | (0.07 | ) | | | (0.24 | ) | | | (0.69 | ) |
| | | | | | | | | | | | | | | | | | | | | | | | |
Net asset value at end of period | | $ | 13.38 | | | $ | 11.69 | | | $ | 10.62 | | | $ | 10.33 | | | $ | 9.06 | | | $ | 8.17 | |
| | | | | | | | | | | | | | | | | | | | | | | | |
Total investment return (b) | | | 16.01 | %(c) | | | 10.89 | % | | | 3.55 | % | | | 14.87 | % | | | 14.40 | % | | | (38.00 | %) |
Ratios (to average net assets)/Supplemental Data: | | | | | | | | | | | | | | | | | | | | | | | | |
Net investment income (loss) | | | 1.75 | %†† | | | 0.63 | % | | | 0.84 | % | | | 0.64 | % | | | 1.50 | % | | | 0.62 | % |
Net expenses (d) | | | 0.16 | %†† | | | 0.17 | % | | | 0.19 | % | | | 0.23 | % | | | 0.25 | % | | | 0.25 | % |
Expenses (before waiver/reimbursement) (d) | | | 0.16 | %†† | | | 0.17 | % | | | 0.19 | % | | | 0.23 | % | | | 0.27 | % | | | 0.28 | % |
Portfolio turnover rate | | | 14 | % | | | 47 | % | | | 53 | % | | | 54 | % | | | 42 | % | | | 37 | % |
Net assets at end of period (in 000’s) | | $ | 2,164 | | | $ | 1,820 | | | $ | 1,539 | | | $ | 1,478 | | | $ | 1,229 | | | $ | 849 | |
| (a) | Per share data based on average shares outstanding during the period. |
| (b) | Total investment return is calculated exclusive of sales charges and assumes the reinvestment of dividends and distributions. |
| (c) | Total investment return is not annualized. |
| (d) | In addition to the fees and expenses which the Fund bears directly, the Fund indirectly bears a pro-rata share of the fees and expenses of the Underlying Funds in which it invests. Such indirect expenses are not included in the above expense ratios. |
| | | | | | |
The notes to the financial statements are an integral part of,
and should be read in conjunction with, the financial statements. | | mainstayinvestments.com | | | 67 | |
Notes to Financial Statements (Unaudited)
Note 1–Organization and Business
MainStay Funds Trust (the “Trust”) was organized as a Delaware statutory trust on April 28, 2009 and is governed by a Declaration of Trust. The Trust is registered under the Investment Company Act of 1940, as amended (the “1940 Act”), as an open-end investment management company, and is comprised of thirty-three funds (collectively referred to as the “Funds” and each individually, referred to as a “Fund”). These financial statements and notes relate only to the MainStay Conservative Allocation Fund, MainStay Moderate Allocation Fund, MainStay Moderate Growth Allocation Fund and MainStay Growth Allocation Fund (collectively referred to as the “Allocation Funds” and each individually referred to as an “Allocation Fund”). Each is a diversified fund. Each Allocation Fund is the successor of a series of Eclipse Funds Inc. with the same name (collectively referred to as the “Predecessor Funds” and each individually referred to as a “Predecessor Fund”). The reorganizations of the Predecessor Funds with and into the respective Allocation Funds occurred on February 26, 2010. All information and references to periods prior to February 26, 2010 relate to the respective Predecessor Fund.
The Allocation Funds each currently offer five classes of shares. Class A, Class B, Class C and Class I shares commenced operations on April 4, 2005. Investor Class shares commenced operations on February 28, 2008. Investor Class and Class A shares are offered at net asset value (“NAV”) per share plus an initial sales charge. No sales charge applies to investments of $1 million or more (and certain other qualified purchases) in Investor Class and Class A shares, but a contingent deferred sales charge (“CDSC”) is imposed on certain redemptions made within one year of the date of purchase. Class B and Class C shares are offered at NAV without an initial sales charge, although a declining CDSC may be imposed on redemptions made within six years of the date of purchase of Class B shares and a 1.00% CDSC may be imposed on redemptions made within one year of the date of purchase of Class C shares. Class I shares are offered at NAV and are not subject to a sales charge. Depending upon eligibility, Class B shares convert to either Investor Class or Class A shares at the end of the calendar quarter eight years after the date they were purchased. Additionally, depending upon eligibility, Investor Class shares may convert to Class A shares and Class A shares may convert to Investor Class shares. The five classes of shares have the same voting (except for issues that relate solely to one class), dividend, liquidation and other rights, and the same terms and conditions, except that Class B and Class C shares are subject to higher distribution and/or service fee rates than Investor Class and Class A shares under a distribution plan pursuant to Rule 12b-1 under the 1940 Act. Class I shares are not subject to a distribution and/or service fee.
The investment objective for each of the Allocation Funds is as follows:
The MainStay Conservative Allocation Fund seeks current income and, secondarily, long-term growth of capital.
The MainStay Moderate Allocation Fund seeks long-term growth of capital and, secondarily, current income.
The MainStay Moderate Growth Allocation Fund seeks long-term growth of capital and, secondarily, current income.
The MainStay Growth Allocation Fund seeks long-term growth of capital.
The Allocation Funds are “funds-of-funds,” meaning that they seek to achieve their investment objectives by investing primarily in other MainStay Funds, for which New York Life Investment Management LLC (“New York Life Investments” or “Manager”) serves as Manager (the “Underlying Funds”).
Note 2–Significant Accounting Policies
The Allocation Funds prepare their financial statements in accordance with generally accepted accounting principles (“GAAP”) in the United States of America and follow the significant accounting policies described below.
(A) Securities Valuation. Investments are valued as of the close of regular trading on the New York Stock Exchange (“Exchange”) (generally 4:00 p.m. Eastern time) on each day the Allocation Funds are open for business (“valuation date”).
The Board of Trustees (the “Board”) has adopted procedures for the valuation of each Allocation Fund’s securities and has delegated the responsibility for valuation determination under those procedures to the Valuation Committee of the Allocation Funds (the “Valuation Committee”). The Board has authorized the Valuation Committee to appoint a Valuation Sub-Committee (the “Sub-Committee) to deal in the first instance with questions that arise or cannot be resolved under these procedures. The Sub-Committee meets (in person, via electronic mail or via teleconference) on an as-needed basis. The Valuation Committee meets at a later time, as necessary, to ensure that actions taken by the Sub-Committee were appropriate. The procedures recognize that, subject to the oversight of the Board and unless otherwise noted, the responsibility for day-to-day valuation of portfolio assets (including securities for which market prices are not readily available) rests with New York Life Investments, aided to whatever extent necessary by the portfolio managers of each Allocation Fund.
To assess the appropriateness of security valuations, the Manager or the Allocation Funds’ third party service provider who is subject to oversight by the Manager, regularly compares prior day prices, prices on comparable securities and the sale prices to the prior and current day prices and challenges prices exceeding certain tolerance levels with third party pricing services or broker sources. For those securities valued by recommendation, whether through a standardized fair valuation methodology or a fair valuation determination, the Valuation Committee reviews and affirms the reasonableness of the valuation based on such methodologies and determinations on a regular basis after considering all relevant information that is reasonably available.
“Fair value” is defined as the price that an Allocation Fund would receive upon selling an investment in an orderly transaction to an independent buyer in the principal or most advantageous market of the investment. Fair value measurements are determined within a framework that has established a three-tier hierarchy which maximizes the use of observable market data and minimizes the use of unobservable inputs to establish classification of fair value measurements for disclosure purposes. “Inputs” refers broadly to the assumptions that market participants would use in pricing the asset or liability, including assumptions about risk, such as the risk inherent in a particular valuation technique used to measure fair value using a pricing model and/or the risk inherent in the inputs for the valuation technique. Inputs may be
| | |
| 68 | | MainStay Asset Allocation Funds |
observable or unobservable. Observable inputs reflect the assumptions market participants would use in pricing the asset or liability based on market data obtained from sources independent of the Allocation Funds. Unobservable inputs reflect each Allocation Fund’s own assumptions about the assumptions market participants would use in pricing the asset or liability developed based on the information available in the circumstances. The inputs or methodology used for valuing securities may not be an indication of the risks associated with investing in those securities. The three-tier hierarchy of inputs is summarized in the three broad Levels listed below.
| • | | Level 1—quoted prices in active markets for identical investments |
| • | | Level 2—other significant observable inputs (including quoted prices for similar investments in active markets, interest rates and yield curves, prepayment speeds, credit risks, etc.) |
| • | | Level 3—significant unobservable inputs (including each Allocation Fund’s own assumptions about the assumptions that market participants would use in determining the fair value of investments) |
The aggregate value by input level, as of April 30, 2013, for each Allocation Fund’s investments is included at the end of each Allocation Fund’s Portfolio of Investments.
The valuation techniques used by the Allocation Funds to measure fair value maximize the use of observable inputs and minimize the use of unobservable inputs. The Allocation Funds may utilize third party vendor evaluations, whose prices may be derived from one or more of the following standard inputs:
| | |
• Benchmark Yields | | • Reported Trades |
• Broker Dealer Quotes | | • Issuer Spreads |
• Two-sided markets | | • Benchmark securities |
• Bids/Offers | | • Reference Data (corporate actions or material event notices) |
• Industry and economic events | | • Comparable bonds |
• Equity and credit default swap curves | | • Monthly payment information |
Securities for which market values cannot be determined using the methodologies described above are valued by methods deemed in good faith by the Allocation Funds’ Valuation Committee, following the procedures established by the Board, to represent fair value. Under these procedures, the Allocation Funds primarily employ a market-based approach which may use related or comparable assets or liabilities, recent transactions, market multiples, book values, and other relevant information. The Allocation Funds may also use an income-based valuation approach in which the anticipated future cash flows of the investment are discounted to calculate fair value. Discounts may also be applied due to the nature or duration of any restrictions on the disposition of the investments. Due to the inherent uncertainty of valuations of such investments, the fair values may differ significantly from the values that would have been used had an active market existed. For the six-month period ended April 30, 2013, there have been no changes to the fair value methodologies.
Equity and non-equity securities which may be valued in this manner include, but are not limited to: (i) a security for which the trading has been halted or suspended; (ii) a debt security that has recently gone into
default and for which there is not a current market quotation; (iii) a security of an issuer that has entered into a restructuring; (iv) a security that has been de-listed from a national exchange; (v) a security for which the market price is not available from a third party pricing source or, if so provided, does not, in the opinion of the Allocation Funds’ Manager reflect the security’s market value; and (vi) a security whose principal market has been temporarily closed at a time when, under normal conditions, it would be open. Securities for which market quotations or observable inputs are not readily available are generally categorized as Level 3 in the hierarchy. As of April 30, 2013, the Allocation Funds did not hold any securities that were fair valued in such a manner.
Investments in Underlying Funds are valued at their NAVs at the close of business each day. These securities are generally categorized as Level 1 in the hierarchy. Securities held by the Underlying Funds are valued using policies consistent with those used by the Underlying Funds, as described in the paragraphs below. The Allocation Funds’ other investments and securities held by the Affiliated Underlying Funds are valued using policies consistent with those used by the Underlying Funds, as described below.
Equity securities and Exchange Traded Funds are valued at the latest quoted sales prices as of the close of regular trading on the Exchange on each valuation date. Securities that are not traded on the valuation date are valued at the mean of the latest quoted bid and ask prices. Prices normally are taken from the principal market in which each security trades. Investments in other mutual funds are valued at their respective NAVs as of the close of the Exchange on the valuation date.
Debt securities (other than convertible bonds and municipal debt securities) are valued at the evaluated bid prices (elevated mean prices in the case of convertible bonds and municipal debt securities) supplied by a pricing agent or broker selected by the affiliated Underlying Fund’s manager in consultation with the affiliated Underlying Fund’s subadvisor whose prices reflect broker/dealer supplied valuations and electronic data processing techniques, if such prices are deemed by the affiliated Underlying Fund’s manager, in consultation with the affiliated Underlying Fund’s subadvisor, to be representative of market values, at the regular close of trading of the Exchange on each valuation date. Debt securities include corporate bonds, U.S. government and federal agency bonds, municipal bonds, foreign bonds, Yankee bonds, convertible bonds, asset-backed securities and mortgage-backed securities.
Temporary cash investments acquired over 60 days to maturity are valued using the latest bid prices or using valuations based on a matrix system (which considers such factors as security prices, yields, maturities, and ratings), both as furnished by independent pricing services. Other temporary cash investments which mature in 60 days or less (“Short-Term Investments”) are valued at amortized cost. The amortized cost method involves valuing a security at its cost on the date of purchase and thereafter assuming a constant amortization to maturity of the difference between such cost and the value on maturity date. Amortized cost approximates the current fair value of a security. Securities valued at amortized cost are not valued using a quoted price in an active market. These securities are generally categorized as Level 2 in the hierarchy.
Foreign currency forward contracts are valued at their fair market values determined on the basis of the mean between the last current bid and ask prices based on dealer or exchange quotations.
| | | | |
| mainstayinvestments.com | | | 69 | |
Notes to Financial Statements (Unaudited) (continued)
Loan assignments, participations and commitments are valued at the average of bid quotations obtained from a pricing service. The affiliated Underlying Funds have engaged an independent pricing service to provide market value quotations from dealers in loans.
(B) Income Taxes. Each Allocation Fund is treated as a separate entity for federal income tax purposes. The Allocation Funds’ policy is to comply with the requirements of the Internal Revenue Code of 1986, as amended (the “Internal Revenue Code”), applicable to regulated investment companies and to distribute all of the taxable income to the shareholders of each Allocation Fund within the allowable time limits. Therefore, no federal, state and local income tax provision is required.
Management evaluates its tax positions to determine if the tax positions taken meet the minimum recognition threshold in connection with accounting for uncertainties in income tax positions taken or expected to be taken for the purposes of measuring and recognizing tax liabilities in the financial statements. Recognition of tax benefits of an uncertain tax position is required only when the position is “more likely than not” to be sustained assuming examination by taxing authorities. Management has analyzed the Allocation Funds’ tax positions taken on federal, state and local income tax returns for all open tax years (for up to three tax years), and has concluded that no provision for federal, state and local income tax is required in the Allocation Funds’ financial statements. The Allocation Funds’ federal, state and local income and federal excise tax returns for tax years for which the applicable statutes of limitations have not expired are subject to examination by the Internal Revenue Service and state and local departments of revenue.
(C) Dividends and Distributions to Shareholders. Dividends and distributions are recorded on the ex-dividend date. The Conservative Allocation Fund intends to declare and pay dividends of net investment income, if any, at least quarterly and distributions of net realized capital gains, if any, at least annually. The other Allocation Funds intend to declare and pay dividends of net investment income and distributions of net realized capital gains, if any, at least annually. Unless the shareholder elects otherwise, all dividends and distributions are reinvested in the same class of shares of the respective Allocation Fund, at NAV. Dividends and distributions to shareholders are determined in accordance with federal income tax regulations and may differ from GAAP.
(D) Security Transactions and Investment Income. The Allocation Funds record security transactions on the trade date. Realized gains and losses on security transactions are determined using the identified cost method. Dividends and distributions received by the Allocation Funds from the Underlying Funds are recorded on the ex-dividend date.
Investment income and realized and unrealized gains and losses on investments of the Allocation Funds are allocated to separate classes of shares pro rata based upon their relative net assets on the date the income is earned or realized and unrealized gains and losses are incurred.
(E) Expenses. Expenses of the Trust are allocated to the individual Funds in proportion to the net assets of the respective Funds when the expenses are incurred, except where direct allocations of expenses can be made. Expenses (other than transfer agent expenses and fees incurred under the shareholder services plans and the distribution plans
further discussed in Note 3(B)) are allocated to separate classes of shares pro rata based upon their relative net assets on the date the expenses are incurred. The expenses borne by the Allocation Funds, including those of related parties to the Allocation Funds, are shown in the Statement of Operations.
In addition, the Allocation Funds bear a pro rata share of the fees and expenses of the Underlying Funds in which they invest. Because the Underlying Funds have varied expense and fee levels and the Allocation Funds may own different proportions of the Underlying Funds at different times, the amount of fees and expenses incurred indirectly by each Allocation Fund may vary. These indirect expenses of the Underlying Funds are not included in the amounts shown on each Allocation Fund’s Statement of Operations.
(F) Use of Estimates. In preparing financial statements in conformity with GAAP, management makes estimates and assumptions that affect the reported amounts and disclosures in the financial statements. Actual results could differ from those estimates.
(G) Indemnifications. Under the Trust’s organizational documents, its officers and trustees are indemnified against certain liabilities that may arise out of performance of their duties to the Trust. Additionally, in the normal course of business, the Allocation Funds enter into contracts with third-party service providers that contain a variety of representations and warranties and which may provide general indemnifications. The Allocation Funds’ maximum exposure under these arrangements is unknown, as this would involve future claims that may be made against the Allocation Funds that have not yet occurred. Based on experience, management is of the view that the risk of loss in connection with these potential indemnification obligations is remote. However, there can be no assurance that material liabilities related to such obligations will not arise in the future, which could adversely impact the Allocation Funds.
Note 3–Fees and Related Party Transactions
(A) Manager. New York Life Investments, a registered investment adviser and an indirect, wholly-owned subsidiary of New York Life Insurance Company (“New York Life”), serves as the Allocation Funds’ Manager, pursuant to an Amended and Restated Management Agreement (“Management Agreement”) and is responsible for the day-to-day portfolio management of the Allocation Funds. The Manager provides offices, conducts clerical, recordkeeping and bookkeeping services, and keeps most of the financial and accounting records required to be maintained by the Allocation Funds. Except for the portion of salaries and expenses that are the responsibility of the Allocation Funds, the Manager pays the salaries and expenses of all personnel affiliated with the Allocation Funds and certain operational expenses of the Allocation Funds. The Allocation Funds reimburse New York Life Investments in an amount equal to a portion of the salary of the Chief Compliance Officer (“CCO”) of the Allocation Funds.
The Allocation Funds do not pay any fees to the Manager in return for the services performed. The Allocation Funds do, however, indirectly pay a proportionate share of the management fees paid to the managers of the Underlying Funds in which the Allocation Funds invest.
New York Life Investments has contractually agreed to waive fees and/or reimburse expenses so that Total Annual Fund Operating Expenses of
| | |
| 70 | | MainStay Asset Allocation Funds |
a class do not exceed the following percentages of average daily net assets for each class:
| | | | | | | | | | | | | | | | | | | | |
| | | Investor
Class | | | Class A | | | Class B | | | Class C | | | Class I | |
MainStay Conservative Allocation Fund | | | 0.55 | % | | | 0.50 | % | | | 1.30 | % | | | 1.30 | % | | | 0.25 | % |
MainStay Moderate Allocation Fund | | | 0.55 | | | | 0.50 | | | | 1.30 | | | | 1.30 | | | | 0.25 | |
MainStay Moderate Growth Allocation Fund | | | 0.55 | | | | 0.50 | | | | 1.30 | | | | 1.30 | | | | 0.25 | |
MainStay Growth Allocation Fund | | | 0.55 | | | | 0.50 | | | | 1.30 | | | | 1.30 | | | | 0.25 | |
These agreements will remain in effect until February 28, 2014, and shall renew automatically for one-year terms unless New York Life Investments provides written notice of termination prior to the start of the next term or upon approval of the Board. Total Annual Fund Operating Expenses excludes taxes, interest, litigation, extraordinary expenses, brokerage and other transaction expenses relating to the purchase or sale of portfolio investments, and acquired (underlying) fund fees and expenses.
For the six-month period ended April 30, 2013, New York Life Investments waived fees and/or reimbursed expenses of the Allocation Funds as follows:
| | | | |
| | | Total | |
MainStay Conservative Allocation Fund | | $ | — | |
MainStay Moderate Allocation Fund | | | — | |
MainStay Moderate Growth Allocation Fund | | | 245 | |
MainStay Growth Allocation Fund | | | 38,767 | |
State Street Bank and Trust Company (“State Street”), 1 Lincoln Street, Boston, Massachusetts 02111, provides sub-administration and sub-accounting services to the Allocation Funds pursuant to an agreement with New York Life Investments. These services include calculating the daily NAVs of the Allocation Funds, maintaining the general ledger and sub-ledger accounts for the calculation of the Allocation Funds’ respective NAVs, and assisting New York Life Investments in conducting various aspects of the Allocation Funds’ administrative operations. For providing these services to the Allocation Funds, State Street is compensated by New York Life Investments.
(B) Distribution and Service Fees. The Trust, on behalf of the Allocation Funds, has entered into a distribution agreement with NYLIFE Distributors LLC (the “Distributor”), an indirect, wholly-owned subsidiary of New York Life. The Allocation Funds have adopted distribution plans (the “Plans”) in accordance with the provisions of Rule 12b-1 under the 1940 Act.
Pursuant to the Investor Class and Class A Plans, the Distributor receives a monthly distribution fee from the Investor Class and Class A shares at an annual rate of 0.25% of the average daily net assets of the Investor Class and Class A shares for distribution and/or service activities as designated by the Distributor. Pursuant to the Class B and Class C Plans, Class B and Class C shares pay the Distributor a monthly distribution fee at an annual rate of 0.75% of the average daily net assets of the Class B and Class C shares along with a service fee at an annual
rate of 0.25% of the average daily net assets of the Class B and Class C shares, for a total 12b-1 fee of 1.00%. Class I shares are not subject to a distribution and/or service fee.
The Plans provide that the distribution and service fees are payable to the Distributor regardless of the amounts actually expended by the Distributor for distribution of the Allocation Funds’ shares and service activities.
(C) Sales Charges. The Allocation Funds were advised by the Distributor that the amount of sales charges retained on sales of Investor Class and Class A shares for the six-month period ended April 30, 2013 were as follows:
| | | | |
MainStay Conservative Allocation Fund | |
Investor Class | | | 48,184 | |
Class A | | | 51,373 | |
| |
| | | | |
MainStay Moderate Allocation Fund | |
Investor Class | | | 82,488 | |
Class A | | | 50,978 | |
| |
| | | | |
MainStay Moderate Growth Allocation Fund | |
Investor Class | | | 95,912 | |
Class A | | | 40,420 | |
| |
| | | | |
MainStay Growth Allocation Fund | |
Investor Class | | | 49,479 | |
Class A | | | 15,080 | |
The Allocation Funds were also advised that the Distributor retained CDSCs on redemptions of Investor Class, Class A, Class B and Class C shares, for the six-month period ended April 30, 2013 were as follows:
| | | | |
MainStay Conservative Allocation Fund | |
Class A | | | 4,081 | |
Class B | | | 32,273 | |
Class C | | | 6,315 | |
| |
| | | | |
MainStay Moderate Allocation Fund | |
Class A | | | 3,657 | |
Class B | | | 60,263 | |
Class C | | | 3,359 | |
| |
| | | | |
MainStay Moderate Growth Allocation Fund | |
Class A | | | 387 | |
Class B | | | 60,713 | |
Class C | | | 3,175 | |
| |
| | | | |
MainStay Growth Allocation Fund | |
Investor Class | | | 1 | |
Class A | | | 169 | |
Class B | | | 40,558 | |
Class C | | | 1,089 | |
| | | | |
| mainstayinvestments.com | | | 71 | |
Notes to Financial Statements (Unaudited) (continued)
(D) Transfer, Dividend Disbursing and Shareholder Servicing Agent. NYLIM Service Company LLC, an affiliate of New York Life Investments, is the Allocation Funds’ transfer, dividend disbursing and shareholder servicing agent pursuant to an agreement between NYLIM Service Company LLC and the Trust. NYLIM Service Company LLC has entered into an agreement with Boston Financial Data Services, Inc. (“BFDS”) pursuant to which BFDS performs certain transfer agent services on behalf of NYLIM Service Company LLC. Transfer agent expenses incurred by the Allocation Funds for the six-month period ended April 30, 2013, were as follows:
| | | | |
MainStay Conservative Allocation Fund | |
Investor Class | | $ | 55,182 | |
Class A | | | 39,606 | |
Class B | | | 39,473 | |
Class C | | | 42,409 | |
Class I | | | 4,108 | |
| |
| | | | |
MainStay Moderate Allocation Fund | |
Investor Class | | $ | 125,443 | |
Class A | | | 59,950 | |
Class B | | | 92,362 | |
Class C | | | 50,560 | |
Class I | | | 3,249 | |
| |
| | | | |
MainStay Moderate Growth Allocation Fund | |
Investor Class | | $ | 176,377 | |
Class A | | | 58,252 | |
Class B | | | 119,872 | |
Class C | | | 37,062 | |
Class I | | | 430 | |
| |
| | | | |
MainStay Growth Allocation Fund | |
Investor Class | | $ | 113,230 | |
Class A | | | 36,355 | |
Class B | | | 72,113 | |
Class C | | | 20,281 | |
Class I | | | 883 | |
As of April 30, 2013, the Allocation Funds held the following percentages of outstanding shares of affiliated investment companies:
| | | | |
MainStay Conservative Allocation Fund | |
Mainstay Cornerstone Growth Fund Class I | | | 8.38 | % |
MainStay Epoch Global Choice Fund Class I | | | 6.77 | |
MainStay Epoch U.S. All Cap Fund Class I | | | 3.29 | |
MainStay Floating Rate Fund Class I | | | 5.46 | |
MainStay High Yield Corporate Bond Fund Class I | | | 0.25 | |
MainStay High Yield Municipal Bond Fund Class I | | | 0.83 | |
MainStay High Yield Opportunities Fund Class I | | | 0.57 | |
MainStay ICAP Equity Fund Class I | | | 1.99 | |
MainStay ICAP International Fund Class I | | | 0.37 | |
MainStay ICAP Select Equity Fund Class I | | | 0.01 | |
MainStay Indexed Bond Fund Class I | | | 11.18 | |
MainStay Intermediate Term Bond Fund Class I | | | 9.97 | |
MainStay International Equity Fund Class I | | | 0.68 | |
MainStay International Opportunities Fund Class I | | | 2.17 | |
MainStay Large Cap Growth Fund Class I | | | 0.10 | |
MainStay MAP Fund Class I | | | 1.98 | |
MainStay Marketfield Fund Class I | | | 1.11 | |
MainStay Money Market Fund Class A | | | 3.28 | |
MainStay S&P 500 Index Fund Class I | | | 0.07 | |
MainStay Short Duration High Yield Fund Class I | | | 7.49 | |
Mainstay Short Term Bond Fund Class I | | | 1.07 | |
MainStay U.S. Equity Opportunities Fund Class I | | | 4.76 | |
MainStay U.S. Small Cap Fund Class I | | | 3.26 | |
MainStay Unconstrained Bond Fund Class I | | | 10.21 | |
| | |
| 72 | | MainStay Asset Allocation Funds |
| | | | |
MainStay Moderate Allocation Fund | |
MainStay Cornerstone Growth Fund Class I | | | 2.49 | % |
MainStay Epoch Global Choice Fund Class I | | | 10.42 | |
MainStay Epoch U.S. All Cap Fund Class I | | | 7.66 | |
MainStay Floating Rate Fund Class I | | | 6.48 | |
MainStay High Yield Corporate Bond Fund Class I | | | 0.21 | |
MainStay High Yield Municipal Bond Fund Class I | | | 1.27 | |
MainStay High Yield Opportunities Fund Class I | | | 0.04 | |
MainStay ICAP Equity Fund Class I | | | 4.22 | |
MainStay ICAP International Fund Class I | | | 1.69 | |
MainStay ICAP Select Equity Fund Class I | | | 0.04 | |
MainStay Indexed Bond Fund Class I | | | 0.08 | |
MainStay Intermediate Term Bond Fund Class I | | | 13.57 | |
MainStay International Equity Fund Class I | | | 3.14 | |
MainStay International Opportunities Fund Class I | | | 10.04 | |
MainStay Large Cap Growth Fund Class I | | | 0.25 | |
MainStay Marketfield Fund Class I | | | 0.14 | |
MainStay MAP Fund Class I | | | 4.40 | |
MainStay Money Market Fund Class A | | | 4.92 | |
MainStay S&P 500 Index Fund Class I | | | 0.25 | |
MainStay Short Duration High Yield Class I | | | 8.72 | |
MainStay Short Term Bond Fund Class I | | | 1.84 | |
MainStay Unconstrained Bond Fund Class I | | | 15.48 | |
MainStay U.S. Equity Opportunities Fund Class I | | | 10.58 | |
MainStay U.S. Small Cap Fund Class I | | | 6.12 | |
| | | | |
MainStay Moderate Growth Allocation Fund | |
MainStay Common Stock Fund Class I | | | 3.30 | % |
MainStay Cornerstone Growth Fund Class I | | | 2.35 | |
MainStay Epoch Global Choice Fund Class I | | | 9.73 | |
MainStay Epoch U.S. All Cap Fund Class I | | | 6.92 | |
MainStay Floating Rate Fund Class I | | | 5.04 | |
MainStay High Yield Corporate Bond Fund Class I | | | 0.16 | |
MainStay High Yield Municipal Bond Fund Class I | | | 0.84 | |
MainStay High Yield Opportunities Fund Class I | | | 0.03 | |
MainStay ICAP Equity Fund Class I | | | 4.00 | |
MainStay ICAP International Fund Class I | | | 2.63 | |
MainStay ICAP Select Equity Fund Class I | | | 0.04 | |
MainStay Intermediate Term Bond Fund Class I | | | 2.17 | |
MainStay International Equity Fund Class I | | | 4.86 | |
MainStay International Opportunities Fund Class I | | | 15.94 | |
MainStay Large Cap Growth Fund Class I | | | 0.29 | |
MainStay MAP Fund Class I | | | 5.22 | |
MainStay Marketfield Fund Class I | | | 0.13 | |
MainStay Money Market Fund Class A | | | 4.04 | |
MainStay S&P 500 Index Fund Class I | | | 0.24 | |
MainStay Short Duration High Yield Fund Class I | | | 6.74 | |
MainStay Short Term Bond Fund Class I | | | 0.59 | |
MainStay Unconstrained Bond Fund Class I | | | 10.38 | |
MainStay U.S. Equity Opportunities Fund Class I | | | 11.67 | |
MainStay U.S. Small Cap Fund Class I | | | 22.35 | |
| |
| | | | |
MainStay Growth Allocation Fund | |
MainStay Common Stock Fund Class I | | | 3.29 | % |
MainStay Cornerstone Growth Fund Class I | | | 1.32 | |
MainStay Epoch Global Choice Fund Class I | | | 5.01 | |
MainStay Epoch U.S. All Cap Fund Class I | | | 3.65 | |
MainStay ICAP Equity Fund Class I | | | 2.47 | |
MainStay ICAP International Fund Class I | | | 1.79 | |
MainStay ICAP Select Equity Fund Class I | | | 0.02 | |
MainStay International Equity Fund Class I | | | 3.33 | |
MainStay International Opportunities Fund Class I | | | 10.62 | |
MainStay Large Cap Growth Fund Class I | | | 0.18 | |
MainStay MAP Fund Class I | | | 3.25 | |
MainStay Marketfield Fund Class I | | | 0.07 | |
MainStay S&P 500 Index Fund Class I | | | 0.28 | |
MainStay U.S. Equity Opportunities Fund Class I | | | 7.22 | |
MainStay U.S. Small Cap Fund Class I | | | 15.85 | |
(E) Small Account Fee. Shareholders with small accounts adversely impact the cost of providing transfer agency services. In an effort to reduce total transfer agency expenses, the Allocation Funds have implemented a small account fee on certain types of accounts. Certain shareholders with an account balance of less than $1,000 are charged an annual per account fee of $20 (assessed semi-annually),
| | | | |
| mainstayinvestments.com | | | 73 | |
Notes to Financial Statements (Unaudited) (continued)
the proceeds from which offset transfer agent fees as reflected in the Statement of Operations.
Note 4–Federal Income Tax
Under the Regulated Investment Company Modernization Act of 2010, the Allocation Funds are permitted to carry forward capital losses incurred in taxable years beginning after December 22, 2010, for an unlimited period. However, any losses incurred during those future years will be required to be utilized prior to the losses incurred in pre-enactment tax years. As a result of this ordering rule, pre-enactment capital loss carryforwards may be more likely to expire unused. Additionally, post-enactment capital losses that are carried forward will retain their character as either short-term or long-term capital losses rather than being considered all short-term as under previous law.
MainStay Moderate Allocation Fund
As of October 31, 2012, for federal income tax purposes, capital loss carryforwards of $5,374,439 were available as shown in the table below, to the extent provided by the regulations to offset future realized gains of the MainStay Moderate Allocation Fund through the years indicated. To the extent that these capital loss carryforwards are used to offset future capital gains, it is probable that the capital gains so offset will not be distributed to shareholders. No capital gain distributions shall be made until any capital loss carryforwards have been fully utilized or expired.
| | | | | | | | |
Capital Loss
Available Through | | Short-Term
Capital Loss
Amounts (000’s) | | | Long-Term
Capital Loss
Amounts (000’s) | |
| 2017 | | $ | 371 | | | $ | — | |
| 2018 | | | 5,003 | | | | — | |
| Total | | $ | 5,374 | | | $ | — | |
MainStay Moderate Growth Allocation Fund
As of October 31, 2012, for federal income tax purposes, capital loss carryforwards of $23,256,720 were available as shown in the table below, to the extent provided by the regulations to offset future realized gains of the MainStay Moderate Growth Allocation Fund through the years indicated. To the extent that these capital loss carryforwards are used to offset future capital gains, it is probable that the capital gains so offset will not be distributed to shareholders. No capital gain distributions shall be made until any capital loss carryforwards have been fully utilized or expired.
| | | | | | | | |
Capital Loss
Available Through | | Short-Term
Capital Loss
Amounts (000’s) | | | Long-Term
Capital Loss
Amounts (000’s) | |
| 2017 | | $ | 14,874 | | | $ | — | |
| 2018 | | | 8,383 | | | | — | |
| Total | | $ | 23,257 | | | $ | — | |
MainStay Growth Allocation Fund
As of October 31, 2012, for federal income tax purposes, capital loss carryforwards of $19,906,843 were available as shown in the table below, to the extent provided by the regulations to offset future realized
gains of the MainStay Growth Allocation Fund through the years indicated. To the extent that these capital loss carryforwards are used to offset future capital gains, it is probable that the capital gains so offset will not be distributed to shareholders. No capital gain distributions shall be made until any capital loss carryforwards have been fully utilized or expired.
| | | | | | | | |
Capital Loss
Available Through | | Short-Term
Capital Loss
Amounts (000’s) | | | Long-Term
Capital Loss
Amounts (000’s) | |
| 2017 | | $ | 9,820 | | | $ | — | |
| 2018 | | | 10,087 | | | | — | |
| Total | | $ | 19,907 | | | $ | — | |
The tax character of distributions paid during the year ended October 31, 2012, shown in the Statements of Changes in Net Assets was as follows:
| | | | | | | | | | | | |
| | | 2012 | |
| | | Tax Based
Distributions
from Ordinary
Income | | | Tax Based
Distributions
from Long-Term
Capital Gains | | | Total | |
MainStay Conservative Allocation Fund | | $ | 6,267,354 | | | $ | 2,675,846 | | | $ | 8,943,200 | |
MainStay Moderate Allocation Fund | | | 7,276,091 | | | | — | | | | 7,276,091 | |
MainStay Moderate Growth Allocation Fund | | | 3,713,711 | | | | — | | | | 3,713,711 | |
MainStay Growth Allocation Fund | | | 517,381 | | | | — | | | | 517,381 | |
Note 5–Custodian
State Street is the custodian of the cash and the securities of the Allocation Funds. Custodial fees are charged to the Allocation Funds based on the market value of securities in the Allocation Funds and the number of certain cash transactions incurred by the Allocation Funds.
Note 6–Line of Credit
The Allocation Funds and certain affiliated funds maintain a line of credit with a syndicate of banks in order to secure a source of funds for temporary purposes to meet unanticipated or excessive redemption requests.
Effective August 29, 2012, under a second amended and restated credit agreement (the “Credit Agreement”), the aggregate commitment amount is $200,000,000 with an optional maximum amount of $250,000,000. The commitment fee is an annual rate of 0.08% of the average commitment amount payable quarterly, regardless of usage, to Bank of New York Mellon, which serves as the agent to the syndicate. The commitment fee is allocated among the Funds and certain affiliated funds based upon net assets and other factors. Interest on any revolving credit loan is charged based upon the Federal Funds Advances rate or the one month London InterBank Offered Rate, whichever is higher. The Credit Agreement expires on August 28, 2013, although the Fund, certain affiliated funds and the syndicate of banks may renew the Credit
| | |
| 74 | | MainStay Asset Allocation Funds |
Agreement for an additional year on the same or different terms. There were no borrowings made or outstanding with respect to the Allocation Funds on the Credit Agreement during the six-month period ended April 30, 2013.
Note 7–Purchases and Sales of Securities (in 000’s)
During the six-month period ended April 30, 2013, purchases and sales of securities were as follows:
| | | | | | | | |
| | | Other | |
| | | Purchases | | | Sales | |
MainStay Conservative Allocation Fund | | $ | 85,243 | | | $ | 69,010 | |
MainStay Moderate Allocation Fund | | | 118,115 | | | | 99,871 | |
MainStay Moderate Growth Allocation Fund | | | 97,894 | | | | 90,859 | |
MainStay Growth Allocation Fund | | | 36,152 | | | | 32,891 | |
Note 8–Capital Share Transactions
MainStay Conservative Allocation Fund
| | | | | | | | |
Investor Class | | Shares | | | Amount | |
| | | | | | | | |
Six-month period ended April 30, 2013: | | | | | | | | |
Shares sold | | | 794,127 | | | $ | 9,331,185 | |
Shares issued to shareholders in reinvestment of dividends and distributions | | | 134,418 | | | | 1,544,368 | |
Shares redeemed | | | (480,969 | ) | | | (5,643,218 | ) |
| | | | | | | | |
Net increase (decrease) in shares outstanding before conversion | | | 447,576 | | | | 5,232,335 | |
Shares converted into Investor Class
(See Note 1) | | | 109,805 | | | | 1,304,894 | |
Shares converted from Investor Class
(See Note 1) | | | (183,081 | ) | | | (2,175,411 | ) |
| | | | | | | | |
Net increase (decrease) | | | 374,300 | | | $ | 4,361,818 | |
| | | | | | | | |
Year ended October 31, 2012: | | | | | | | | |
Shares sold | | | 1,390,417 | | | $ | 15,643,414 | |
Shares issued to shareholders in reinvestment of dividends and distributions | | | 133,883 | | | | 1,470,592 | |
Shares redeemed | | | (828,222 | ) | | | (9,297,347 | ) |
| | | | | | | | |
Net increase (decrease) in shares outstanding before conversion | | | 696,078 | | | | 7,816,659 | |
Shares converted into Investor Class
(See Note 1) | | | 239,889 | | | | 2,710,098 | |
Shares converted from Investor Class
(See Note 1) | | | (487,353 | ) | | | (5,525,100 | ) |
| | | | | | | | |
Net increase (decrease) | | | 448,614 | | | $ | 5,001,657 | |
| | | | | | | | |
| | | | | | | | |
Class A | | Shares | | | Amount | |
| | | | | | | | |
Six-month period ended April 30, 2013: | | | | | | | | |
Shares sold | | | 1,528,101 | | | $ | 17,947,948 | |
Shares issued to shareholders in reinvestment of dividends and distributions | | | 421,530 | | | | 4,840,757 | |
Shares redeemed | | | (1,428,219 | ) | | | (16,757,475 | ) |
| | | | | | | | |
Net increase (decrease) in shares outstanding before conversion | | | 521,412 | | | | 6,031,230 | |
Shares converted into Class A
(See Note 1) | | | 225,063 | | | | 2,672,084 | |
Shares converted from Class A
(See Note 1) | | | (41,547 | ) | | | (496,490 | ) |
| | | | | | | | |
Net increase (decrease) | | | 704,928 | | | $ | 8,206,824 | |
| | | | | | | | |
Year ended October 31, 2012: | | | | | | | | |
Shares sold | | | 3,161,904 | | | $ | 35,546,992 | |
Shares issued to shareholders in reinvestment of dividends and distributions | | | 433,900 | | | | 4,770,955 | |
Shares redeemed | | | (3,075,483 | ) | | | (34,415,273 | ) |
| | | | | | | | |
Net increase (decrease) in shares outstanding before conversion | | | 520,321 | | | | 5,902,674 | |
Shares converted into Class A (See Note 1) | | | 633,654 | | | | 7,174,713 | |
Shares converted from Class A (See Note 1) | | | (71,517 | ) | | | (828,571 | ) |
| | | | | | | | |
Net increase (decrease) | | | 1,082,458 | | | $ | 12,248,816 | |
| | | | | | | | |
| | |
| | | | | | | | |
Class B | | Shares | | | Amount | |
Six-month period ended April 30, 2013: | | | | | | | | |
Shares sold | | | 407,349 | | | $ | 4,770,507 | |
Shares issued to shareholders in reinvestment of dividends and distributions | | | 82,424 | | | | 941,491 | |
Shares redeemed | | | (242,230 | ) | | | (2,837,001 | ) |
| | | | | | | | |
Net increase (decrease) in shares outstanding before conversion | | | 247,543 | | | | 2,874,997 | |
Shares converted from Class B (See Note 1) | | | (110,731 | ) | | | (1,305,077 | ) |
| | | | | | | | |
Net increase (decrease) | | | 136,812 | | | $ | 1,569,920 | |
| | | | | | | | |
Year ended October 31, 2012: | | | | | | | | |
Shares sold | | | 729,734 | | | $ | 8,163,994 | |
Shares issued to shareholders in reinvestment of dividends and distributions | | | 79,234 | | | | 862,038 | |
Shares redeemed | | | (462,514 | ) | | | (5,155,214 | ) |
| | | | |
Net increase (decrease) in shares outstanding before conversion | | | 346,454 | | | | 3,870,818 | |
Shares converted from Class B (See Note 1) | | | (316,292 | ) | | | (3,531,140 | ) |
| | | | |
Net increase (decrease) | | | 30,162 | | | $ | 339,678 | |
| | | | |
| | |
| | | | | | | | |
Class C | | Shares | | | Amount | |
Six-month period ended April 30, 2013: | | | | | | | | |
Shares sold | | | 601,092 | | | $ | 7,039,854 | |
Shares issued to shareholders in reinvestment of dividends and distributions | | | 74,812 | | | | 854,580 | |
Shares redeemed | | | (393,595 | ) | | | (4,603,573 | ) |
| | | | |
Net increase (decrease) | | | 282,309 | | | $ | 3,290,861 | |
| | | | |
Year ended October 31, 2012: | | | | | | | | |
Shares sold | | | 1,009,977 | | | $ | 11,295,332 | |
Shares issued to shareholders in reinvestment of dividends and distributions | | | 66,571 | | | | 724,725 | |
Shares redeemed | | | (550,686 | ) | | | (6,158,571 | ) |
| | | | |
Net increase (decrease) | | | 525,862 | | | $ | 5,861,486 | |
| | | | |
| | | | |
| mainstayinvestments.com | | | 75 | |
Notes to Financial Statements (Unaudited) (continued)
| | | | | | | | |
Class I | | Shares | | | Amount | |
| | | | | | | | |
Six-month period ended April 30, 2013: | | | | | | | | |
Shares sold | | | 271,224 | | | $ | 3,176,247 | |
Shares issued to shareholders in reinvestment of dividends and distributions | | | 35,074 | | | | 405,710 | |
Shares redeemed | | | (207,540 | ) | | | (2,477,379 | ) |
| | | | |
Net increase (decrease) | | | 98,758 | | | $ | 1,104,578 | |
| | | | |
Year ended October 31, 2012: | | | | | | | | |
Shares sold | | | 613,921 | | | $ | 7,038,767 | |
Shares issued to shareholders in reinvestment of dividends and distributions | | | 33,090 | | | | 366,848 | |
Shares redeemed | | | (59,843 | ) | | | (682,683 | ) |
| | | | |
Net increase (decrease) | | | 587,168 | | | $ | 6,722,932 | |
| | | | |
MainStay Moderate Allocation Fund
| | | | | | | | |
Investor Class | | Shares | | | Amount | |
| | | | | | | | |
| | | | | | | | |
Six-month period ended April 30, 2013: | | | | | | | | |
Shares sold | | | 1,207,390 | | | $ | 14,961,338 | |
Shares issued to shareholders in reinvestment of dividends | | | 188,799 | | | | 2,256,146 | |
Shares redeemed | | | (713,249 | ) | | | (8,816,445 | ) |
| | | | |
Net increase (decrease) in shares outstanding before conversion | | | 682,940 | | | | 8,401,039 | |
Shares converted into Investor Class
(See Note 1) | | | 194,536 | | | | 2,437,849 | |
Shares converted from Investor Class
(See Note 1) | | | (403,124 | ) | | | (5,076,020 | ) |
| | | | |
Net increase (decrease) | | | 474,352 | | | $ | 5,762,868 | |
| | | | |
Year ended October 31, 2012: | | | | | | | | |
Shares sold | | | 2,019,610 | | | $ | 23,169,975 | |
Shares issued to shareholders in reinvestment of dividends | | | 154,921 | | | | 1,677,800 | |
Shares redeemed | | | (1,304,977 | ) | | | (14,954,921 | ) |
| | | | |
Net increase (decrease) in shares outstanding before conversion | | | 869,554 | | | | 9,892,854 | |
Shares converted into Investor Class
(See Note 1) | | | 421,678 | | | | 4,858,895 | |
Shares converted from Investor Class
(See Note 1) | | | (852,070 | ) | | | (9,938,120 | ) |
| | | | |
Net increase (decrease) | | | 439,162 | | | $ | 4,813,629 | |
| | | | |
| | | | | | | | |
Class A | | Shares | | | Amount | |
| | | | | | | | |
Six-month period ended April 30, 2013: | | | | | | | | |
Shares sold | | | 1,623,115 | | | $ | 20,130,750 | |
Shares issued to shareholders in reinvestment of dividends | | | 429,179 | | | | 5,124,343 | |
Shares redeemed | | | (1,672,558 | ) | | | (20,630,641 | ) |
| | | | | | | | |
Net increase (decrease) in shares outstanding before conversion | | | 379,736 | | | | 4,624,452 | |
Shares converted into Class A (See Note 1) | | | 505,622 | | | | 6,351,501 | |
Shares converted from Class A (See Note 1) | | | (46,780 | ) | | | (594,110 | ) |
| | | | | | | | |
Net increase (decrease) | | | 838,578 | | | $ | 10,381,843 | |
| | | | | | | | |
Year ended October 31, 2012: | | | | | | | | |
Shares sold | | | 2,729,636 | | | $ | 31,311,743 | |
Shares issued to shareholders in reinvestment of dividends | | | 358,722 | | | | 3,884,952 | |
Shares redeemed | | | (3,662,224 | ) | | | (41,989,066 | ) |
| | | | | | | | |
Net increase (decrease) in shares outstanding before conversion | | | (573,866 | ) | | | (6,792,371 | ) |
Shares converted into Class A (See Note 1) | | | 1,052,493 | | | | 12,242,546 | |
Shares converted from Class A (See Note 1) | | | (87,940 | ) | | | (1,050,787 | ) |
| | | | | | | | |
Net increase (decrease) | | | 390,687 | | | $ | 4,399,388 | |
| | | | | | | | |
| | |
| | | | | | | | |
Class B | | Shares | | | Amount | |
Six-month period ended April 30, 2013: | | | | | | | | |
Shares sold | | | 605,193 | | | $ | 7,427,047 | |
Shares issued to shareholders in reinvestment of dividends | | | 92,864 | | | | 1,101,391 | |
Shares redeemed | | | (453,026 | ) | | | (5,560,535 | ) |
| | | | | | | | |
Net increase (decrease) in shares outstanding before conversion | | | 245,031 | | | | 2,967,903 | |
Shares converted from Class B (See Note 1) | | | (253,217 | ) | | | (3,119,220 | ) |
| | | | | | | | |
Net increase (decrease) | | | (8,186 | ) | | $ | (151,317 | ) |
| | | | | | | | |
Year ended October 31, 2012: | | | | | | | | |
Shares sold | | | 1,229,444 | | | $ | 13,964,181 | |
Shares issued to shareholders in reinvestment of dividends | | | 73,169 | | | | 787,303 | |
Shares redeemed | | | (926,160 | ) | | | (10,511,592 | ) |
| | | | |
Net increase (decrease) in shares outstanding before conversion | | | 376,453 | | | | 4,239,892 | |
Shares converted from Class B (See Note 1) | | | (540,554 | ) | | | (6,112,534 | ) |
| | | | |
Net increase (decrease) | | | (164,101 | ) | | $ | (1,872,642 | ) |
| | | | |
| | |
| | | | | | | | |
Class C | | Shares | | | Amount | |
Six-month period ended April 30, 2013: | | | | | | | | |
Shares sold | | | 428,229 | | | $ | 5,257,021 | |
Shares issued to shareholders in reinvestment of dividends | | | 46,979 | | | | 557,176 | |
Shares redeemed | | | (394,923 | ) | | | (4,834,144 | ) |
| | | | |
Net increase (decrease) | | | 80,285 | | | $ | 980,053 | |
| | | | |
Year ended October 31, 2012: | | | | | | | | |
Shares sold | | | 713,225 | | | $ | 8,139,836 | |
Shares issued to shareholders in reinvestment of dividends | | | 36,026 | | | | 387,637 | |
Shares redeemed | | | (797,697 | ) | | | (9,078,975 | ) |
| | | | |
Net increase (decrease) | | | (48,446 | ) | | $ | (551,502 | ) |
| | | | |
| | |
| 76 | | MainStay Asset Allocation Funds |
| | | | | | | | |
Class I | | Shares | | | Amount | |
| | | | | | | | |
Six-month period ended April 30, 2013: | | | | | | | | |
Shares sold | | | 56,586 | | | $ | 701,318 | |
Shares issued to shareholders in reinvestment of dividends | | | 24,938 | | | | 298,752 | |
Shares redeemed | | | (134,222 | ) | | | (1,690,016 | ) |
| | | | |
Net increase (decrease) | | | (52,698 | ) | | $ | (689,946 | ) |
| | | | |
Year ended October 31, 2012: | | | | | | | | |
Shares sold | | | 225,714 | | | $ | 2,629,672 | |
Shares issued to shareholders in reinvestment of dividends | | | 19,726 | | | | 214,225 | |
Shares redeemed | | | (92,861 | ) | | | (1,069,878 | ) |
| | | | |
Net increase (decrease) | | | 152,579 | | | $ | 1,774,019 | |
| | | | |
MainStay Moderate Growth Allocation Fund
| | | | | | | | |
Investor Class | | Shares | | | Amount | |
| | | | | | | | |
Six-month period ended April 30, 2013: | | | | | | | | |
Shares sold | | | 1,221,429 | | | $ | 15,199,419 | |
Shares issued to shareholders in reinvestment of dividends | | | 190,076 | | | | 2,265,712 | |
Shares redeemed | | | (788,514 | ) | | | (9,776,637 | ) |
| | | | |
Net increase (decrease) in shares outstanding before conversion | | | 622,991 | | | | 7,688,494 | |
Shares converted into Investor Class (See Note 1) | | | 199,404 | | | | 2,522,827 | |
Shares converted from Investor Class (See Note 1) | | | (600,639 | ) | | | (7,658,642 | ) |
| | | | |
Net increase (decrease) | | | 221,756 | | | $ | 2,552,679 | |
| | | | |
Year ended October 31, 2012: | | | | | | | | |
Shares sold | | | 2,232,563 | | | $ | 25,262,352 | |
Shares issued to shareholders in reinvestment of dividends | | | 126,104 | | | | 1,340,481 | |
Shares redeemed | | | (1,785,936 | ) | | | (20,227,161 | ) |
| | | | |
Net increase (decrease) in shares outstanding before conversion | | | 572,731 | | | | 6,375,672 | |
Shares converted into Investor Class (See Note 1) | | | 466,118 | | | | 5,282,524 | |
Shares converted from Investor Class (See Note 1) | | | (982,109 | ) | | | (11,405,796 | ) |
| | | | |
Net increase (decrease) | | | 56,740 | | | $ | 252,400 | |
| | | | |
| | | | | | | | |
Class A | | Shares | | | Amount | |
| | | | | | | | |
Six-month period ended April 30, 2013: | | | | | | | | |
Shares sold | | | 902,664 | | | $ | 11,294,783 | |
Shares issued to shareholders in reinvestment of dividends | | | 257,563 | | | | 3,070,138 | |
Shares redeemed | | | (1,589,728 | ) | | | (19,751,511 | ) |
| | | | | | | | |
Net increase (decrease) in shares outstanding before conversion | | | (429,501 | ) | | | (5,386,590 | ) |
Shares converted into Class A (See Note 1) | | | 661,154 | | | | 8,421,648 | |
Shares converted from Class A (See Note 1) | | | (37,446 | ) | | | (483,430 | ) |
| | | | |
Net increase (decrease) | | | 194,207 | | | $ | 2,551,628 | |
| | | | |
Year ended October 31, 2012: | | | | | | | | |
Shares sold | | | 1,656,761 | | | $ | 18,767,293 | |
Shares issued to shareholders in reinvestment of dividends | | | 177,516 | | | | 1,886,997 | |
Shares redeemed | | | (3,062,557 | ) | | | (34,704,018 | ) |
| | | | | | | | |
Net increase (decrease) in shares outstanding before conversion | | | (1,228,280 | ) | | | (14,049,728 | ) |
Shares converted into Class A (See Note 1) | | | 1,198,925 | | | | 13,846,348 | |
Shares converted from Class A (See Note 1) | | | (72,953 | ) | | | (868,614 | ) |
| | | | |
Net increase (decrease) | | | (102,308 | ) | | $ | (1,071,994 | ) |
| | | | |
| | |
| | | | | | | | |
Class B | | Shares | | | Amount | |
Six-month period ended April 30, 2013: | | | | | | | | |
Shares sold | | | 550,153 | | | $ | 6,754,838 | |
Shares issued to shareholders in reinvestment of dividends | | | 73,284 | | | | 865,485 | |
Shares redeemed | | | (518,071 | ) | | | (6,322,563 | ) |
| | | | | | | | |
Net increase (decrease) in shares outstanding before conversion | | | 105,366 | | | | 1,297,760 | |
Shares converted from Class B (See Note 1) | | | (225,577 | ) | | | (2,802,403 | ) |
| | | | |
Net increase (decrease) | | | (120,211 | ) | | $ | (1,504,643 | ) |
| | | | |
Year ended October 31, 2012: | | | | | | | | |
Shares sold | | | 1,154,638 | | | $ | 12,920,872 | |
Shares issued to shareholders in reinvestment of dividends | | | 27,711 | | | | 292,081 | |
Shares redeemed | | | (1,125,792 | ) | | | (12,588,590 | ) |
| | | | | | | | |
Net increase (decrease) in shares outstanding before conversion | | | 56,557 | | | | 624,363 | |
Shares converted from Class B (See Note 1) | | | (618,303 | ) | | | (6,854,462 | ) |
| | | | |
Net increase (decrease) | | | (561,746 | ) | | $ | (6,230,099 | ) |
| | | | |
| | |
| | | | | | | | |
Class C | | Shares | | | Amount | |
Six-month period ended April 30, 2013: | | | | | | | | |
Shares sold | | | 299,740 | | | $ | 3,693,475 | |
Shares issued to shareholders in reinvestment of dividends | | | 20,933 | | | | 247,214 | |
Shares redeemed | | | (305,046 | ) | | | (3,708,344 | ) |
| | | | |
Net increase (decrease) | | | 15,627 | | | $ | 232,345 | |
| | | | |
Year ended October 31, 2012: | | | | | | | | |
Shares sold | | | 457,844 | | | $ | 5,134,928 | |
Shares issued to shareholders in reinvestment of dividends | | | 7,419 | | | | 78,192 | |
Shares redeemed | | | (440,205 | ) | | | (4,917,449 | ) |
| | | | |
Net increase (decrease) | | | 25,058 | | | $ | 295,671 | |
| | | | |
| | | | |
| mainstayinvestments.com | | | 77 | |
Notes to Financial Statements (Unaudited) (continued)
| | | | | | | | |
Class I | | Shares | | | Amount | |
| | | | | | | | |
Six-month period ended April 30, 2013: | | | | | | | | |
Shares sold | | | 26,390 | | | $ | 328,007 | |
Shares issued to shareholders in reinvestment of dividends | | | 2,088 | | | | 25,060 | |
Shares redeemed | | | (26,941 | ) | | | (328,855 | ) |
| | | | |
Net increase (decrease) | | | 1,537 | | | $ | 24,212 | |
| | | | |
Year ended October 31, 2012: | | | | | | | | |
Shares sold | | | 52,068 | | | $ | 583,822 | |
Shares issued to shareholders in reinvestment of dividends | | | 1,653 | | | | 17,685 | |
Shares redeemed | | | (43,217 | ) | | | (488,436 | ) |
| | | | |
Net increase (decrease) | | | 10,504 | | | $ | 113,071 | |
| | | | |
MainStay Growth Allocation Fund
| | | | | | | | |
Investor Class | | Shares | | | Amount | |
| | | | | | | | |
Six-month period ended April 30, 2013: | | | | | | | | |
Shares sold | | | 697,809 | | | $ | 8,640,053 | |
Shares issued to shareholders in reinvestment of dividends | | | 73,082 | | | | 860,901 | |
Shares redeemed | | | (502,403 | ) | | | (6,161,671 | ) |
| | | | |
Net increase (decrease) in shares outstanding before conversion | | | 268,488 | | | | 3,339,283 | |
Shares converted into Investor Class
(See Note 1) | | | 100,740 | | | | 1,262,720 | |
Shares converted from Investor Class
(See Note 1) | | | (279,471 | ) | | | (3,581,625 | ) |
| | | | |
Net increase (decrease) | | | 89,757 | | | $ | 1,020,378 | |
| | | | |
Year ended October 31, 2012: | | | | | | | | |
Shares sold | | | 1,188,537 | | | $ | 13,180,380 | |
Shares issued to shareholders in reinvestment of dividends | | | 22,501 | | | | 233,339 | |
Shares redeemed | | | (1,138,790 | ) | | | (12,617,381 | ) |
| | | | |
Net increase (decrease) in shares outstanding before conversion | | | 72,248 | | | | 796,338 | |
Shares converted into Investor Class
(See Note 1) | | | 267,906 | | | | 2,952,711 | |
Shares converted from Investor Class
(See Note 1) | | | (563,031 | ) | | | (6,414,574 | ) |
| | | | |
Net increase (decrease) | | | (222,877 | ) | | $ | (2,665,525 | ) |
| | | | |
| | | | | | | | |
Class A | | Shares | | | Amount | |
| | | | | | | | |
Six-month period ended April 30, 2013: | | | | | | | | |
Shares sold | | | 397,155 | | | $ | 4,939,906 | |
Shares issued to shareholders in reinvestment of dividends | | | 76,262 | | | | 898,363 | |
Shares redeemed | | | (778,595 | ) | | | (9,581,028 | ) |
| | | | | | | | |
Net increase (decrease) in shares outstanding before conversion | | | (305,178 | ) | | | (3,742,759 | ) |
Shares converted into Class A (See Note 1) | | | 312,673 | | | | 4,001,713 | |
Shares converted from Class A (See Note 1) | | | (9,416 | ) | | | (121,747 | ) |
| | | | |
Net increase (decrease) | | | (1,921 | ) | | $ | 137,207 | |
| | | | |
Year ended October 31, 2012: | | | | | | | | |
Shares sold | | | 785,724 | | | $ | 8,741,519 | |
Shares issued to shareholders in reinvestment of dividends | | | 24,675 | | | | 256,126 | |
Shares redeemed | | | (1,389,039 | ) | | | (15,395,414 | ) |
| | | | | | | | |
Net increase (decrease) in shares outstanding before conversion | | | (578,640 | ) | | | (6,397,769 | ) |
Shares converted into Class A (See Note 1) | | | 666,161 | | | | 7,570,926 | |
Shares converted from Class A (See Note 1) | | | (34,377 | ) | | | (403,662 | ) |
| | | | |
Net increase (decrease) | | | 53,144 | | | $ | 769,495 | |
| | | | |
| | |
| | | | | | | | |
Class B | | Shares | | | Amount | |
Six-month period ended April 30, 2013: | | | | | | | | |
Shares sold | | | 340,362 | | | $ | 4,109,461 | |
Shares issued to shareholders in reinvestment of dividends | | | 15,621 | | | | 180,574 | |
Shares redeemed | | | (338,725 | ) | | | (4,054,981 | ) |
| | | | | | | | |
Net increase (decrease) in shares outstanding before conversion | | | 17,258 | | | | 235,054 | |
Shares converted from Class B (See Note 1) | | | (127,633 | ) | | | (1,561,061 | ) |
| | | | |
Net increase (decrease) | | | (110,375 | ) | | $ | (1,326,007 | ) |
| | | | |
Year ended October 31, 2012: | | | | | | | | |
Shares sold | | | 659,827 | | | $ | 7,151,490 | |
Shares redeemed | | | (757,395 | ) | | | (8,204,964 | ) |
| | | | | | | | |
Net increase (decrease) in shares outstanding before conversion | | | (97,568 | ) | | | (1,053,474 | ) |
Shares converted from Class B (See Note 1) | | | (344,310 | ) | | | (3,705,401 | ) |
| | | | |
Net increase (decrease) | | | (441,878 | ) | | $ | (4,758,875 | ) |
| | | | |
| | |
| | | | | | | | |
Class C | | Shares | | | Amount | |
Six-month period ended April 30, 2013: | | | | | | | | |
Shares sold | | | 170,960 | | | $ | 2,080,991 | |
Shares issued to shareholders in reinvestment of dividends | | | 3,984 | | | | 46,097 | |
Shares redeemed | | | (120,892 | ) | | | (1,459,437 | ) |
| | | | |
Net increase (decrease) | | | 54,052 | | | $ | 667,651 | |
| | | | |
Year ended October 31, 2012: | | | | | | | | |
Shares sold | | | 210,896 | | | $ | 2,305,882 | |
Shares redeemed | | | (221,195 | ) | | | (2,386,826 | ) |
| | | | |
Net increase (decrease) | | | (10,299 | ) | | $ | (80,944 | ) |
| | | | |
| | |
| 78 | | MainStay Asset Allocation Funds |
| | | | | | | | |
Class I | | Shares | | | Amount | |
| | | | | | | | |
Six-month period ended April 30, 2013: | | | | | | | | |
Shares sold | | | 12,608 | | | $ | 156,486 | |
Shares issued to shareholders in reinvestment of dividends | | | 2,229 | | | | 26,546 | |
Shares redeemed | | | (8,718 | ) | | | (111,720 | ) |
| | | | |
Net increase (decrease) | | | 6,119 | | | $ | 71,312 | |
| | | | |
Year ended October 31, 2012: | | | | | | | | |
Shares sold | | | 73,714 | | | $ | 835,935 | |
Shares issued to shareholders in reinvestment of dividends | | | 881 | | | | 9,230 | |
Shares redeemed | | | (63,945 | ) | | | (740,622 | ) |
| | | | |
Net increase (decrease) | | | 10,650 | | | $ | 104,543 | |
| | | | |
Note 9–Subsequent Events
In connection with the preparation of the financial statements of the Allocation Funds as of and for the six-month period ended April 30, 2013, events and transactions subsequent to April 30, 2013, through the date the financial statements were issued have been evaluated by the Allocation Funds’ management for possible adjustment and/or disclosure. No subsequent events requiring financial statement adjustment or disclosure have been identified.
| | | | |
| mainstayinvestments.com | | | 79 | |
Board Consideration and Approval of Management Agreements (Unaudited)
Section 15(c) of the Investment Company Act of 1940, as amended (the “1940 Act”) requires that each mutual fund’s board of trustees, including a majority of the independent trustees, annually review and approve the fund’s investment advisory agreements. At its December 10-12, 2012 meeting, the Board of Trustees of the MainStay Group of Funds (“Board”) unanimously approved the Management Agreements with respect to the MainStay Conservative Allocation Fund, MainStay Growth Allocation Fund, MainStay Moderate Allocation Fund and MainStay Moderate Growth Allocation Fund (“Allocation Funds”) and New York Life Investment Management LLC (“New York Life Investments”).
In reaching its decision to approve the Agreements, the Board considered information furnished by New York Life Investments in connection with a contract review process that took place at various meetings of the Board and its Contracts Committee between September 2012 and December 2012, as well as other relevant information furnished to the Board throughout the year by New York Life Investments. Information requested by and furnished to the Board in connection with the contract review process included, among other items, reports on the Allocation Funds prepared by Strategic Insight Mutual Fund Research and Consulting, LLC (“Strategic Insight”), an independent third-party service provider engaged by the Board to report objectively on the Allocation Funds’ investment performance, management fees and ordinary operating expenses. The Board also considered information provided by New York Life Investments on the fees charged to other investment advisory clients (including institutional separate accounts) that follow investment strategies similar to the Allocation Funds, and the rationale for any differences in the Allocation Funds’ management fees and the fees charged to those other investment advisory clients. In addition, the Board requested and received information on the profitability of the Allocation Funds to New York Life Investments and its affiliates, and responses from New York Life Investments to a series of questions encompassing a variety of topics prepared on behalf of the Board by independent legal counsel to the Board and its independent trustees (the “Independent Trustees”). Information provided to the Board at its meetings throughout the year included, among other items, detailed investment performance reports on the Allocation Funds prepared by the Investment Consulting Group at New York Life Investments. The structure and format for this regular reporting was developed in consultation with the Board. The Board also received from New York Life Investments throughout the year, among other items, periodic reports on legal and compliance matters, portfolio turnover, and sales and marketing activity.
In determining to approve the Agreements, the members of the Board reviewed and evaluated all of the information and factors they believed to be relevant and appropriate in light of legal advice furnished to them by independent legal counsel and through the exercise of their own business judgment. The broad factors considered by the Board are discussed in greater detail below, and included, among other items: (i) the nature, scope and quality of the services provided to the Allocation Funds by New York Life Investments; (ii) the investment performance of the Allocation Funds and New York Life Investments; (iii) the costs of the services provided, and profits realized, by New York Life Investments from its relationship with the Allocation Funds; (iv) the extent to which economies of scale may be realized as the Allocation Funds grow, and the extent to which economies of scale may benefit Allocation Fund investors; and (v) the reasonableness of the Allocation
Funds’ management fees and overall total ordinary operating expenses, particularly as compared to similar funds and accounts managed by New York Life Investments and third-party “peer funds” identified by Strategic Insight.
While individual members of the Board may have weighed certain factors differently, the Board’s decision to approve the Agreements was based on a consideration of all the information provided to the Board, including information provided to the Board throughout the year and specifically in connection with the contract review process. The Board’s conclusions with respect to the Agreements also were based, in part, on the Board’s consideration of the Agreements in prior years. In addition to considering the above-referenced factors, the Board observed that in the marketplace there are a range of investment options available to shareholders of the Allocation Funds, and that the Allocation Funds’ shareholders, having had the opportunity to consider other investment options, have chosen to invest in the Allocation Funds. A more detailed discussion of the factors that figured prominently in the Board’s decisions to approve the Agreements is provided below.
Nature, Scope and Quality of Services to Be Provided by New York Life Investments
The Board examined the nature, scope and quality of the services that New York Life Investments provides to the Allocation Funds. The Board evaluated New York Life Investments’ experience in serving as manager of the Allocation Funds, noting that New York Life Investments manages other mutual funds, serves a variety of other investment advisory clients, including other pooled investment vehicles, and has experience with overseeing mutual fund service providers. The Board considered the experience of senior personnel at New York Life Investments providing management and administrative services to the Allocation Funds, as well as New York Life Investments’ reputation and financial condition. The Board also considered the full range of non-advisory services that New York Life Investments supplies to the Allocation Funds under the terms of the Agreements, including: (i) fund accounting services provided by New York Life Investments’ Fund Accounting and Administration Group; (ii) investment oversight and analytical services provided by New York Life Investments’ Investment Consulting Group; (iii) compliance services provided by New York Life Investments’ compliance department, including oversight and implementation of the Allocation Funds’ compliance program; and (iv) legal services provided by New York Life Investments’ Office of the General Counsel. Additional information about the non-advisory services provided by New York Life Investments is set forth in the Agreements. The Board also considered New York Life Investments’ willingness to invest in personnel that benefit the Allocation Funds, and noted that New York Life Investments is responsible for compensating the Allocation Funds’ officers. The Board also considered benefits to shareholders of being part of the MainStay Group of Funds, including the privilege of exchanging investments between the same class of shares without the imposition of a sales charge, as described more fully in the Allocation Funds’ prospectus.
The Board also examined the nature, scope and quality of the advisory services that New York Life Investments provides to the Allocation Funds. The Board evaluated New York Life Investments’ experience in serving as investment adviser to the Allocation Funds and managing other portfolios. It examined New York Life Investments’ track record and experience in
| | |
| 80 | | MainStay Asset Allocation Funds |
providing investment advisory services, the experience of investment advisory, senior management and administrative personnel at New York Life Investments, and New York Life Investments’ overall legal and compliance environment. The Board also reviewed New York Life Investments’ willingness to invest in personnel that benefit the Allocation Funds. In this regard, the Board considered the experience of the Allocation Funds’ portfolio managers, the number of accounts managed by the portfolio managers and the method for compensating portfolio managers.
Based on these considerations, the Board concluded, within the context of its overall determinations regarding the Agreements, that the Allocation Funds should continue to benefit from the nature, scope and quality of these services as a result of New York Life Investments’ experience, personnel, operations and resources.
Investment Performance
In evaluating the Allocation Funds’ investment performance, the Board considered investment performance results in light of the Allocation Funds’ investment objectives, strategies and risks, as disclosed in the Allocation Funds’ prospectus. The Board particularly considered detailed investment reports on the Allocation Funds’ performance provided to the Board throughout the year by the Investment Consulting Group of New York Life Investments. These reports include, among other items, information on the Allocation Funds’ gross and net returns, the Allocation Funds’ investment performance relative to relevant investment categories and Allocation Fund benchmarks, the Allocation Funds’ risk-adjusted investment performance, and the Allocation Funds’ investment performance as compared to similar competitor funds, as appropriate. The Board also considered information provided by Strategic Insight showing the investment performance of the Allocation Funds as compared to peer funds.
In considering the Allocation Funds’ investment performance, the Board focused principally on the Allocation Funds’ long-term performance track record. The Board also gave weight to its ongoing discussions with senior management at New York Life Investments concerning the Allocation Funds’ investment performance, as well as discussions between the Allocation Funds’ portfolio managers and the Board that occur typically on an annual basis. In addition, the Board considered any specific actions that New York Life Investments had taken, or had agreed with the Board to take, to enhance Allocation Fund investment performance, and the results of those actions.
Because the Allocation Funds invest substantially all of their assets in other funds advised by New York Life Investments, the Board considered the rationale for the allocation among and selection of the underlying funds in which the Allocation Funds invest, including the investment performance of the underlying funds.
Based on these considerations, the Board concluded, within the context of its overall determinations regarding the Agreements, that the long-term investment performance of the Allocation Funds, along with ongoing efforts by New York Life Investments to enhance investment returns, supported a determination to approve the Agreements. The Allocation Funds disclose more information about investment performance in the Portfolio Management Discussion and Analysis, Investment and Performance Comparison and Financial Highlights sections of this Semiannual Report and in the Allocation Funds’ prospectus.
Costs of the Services Provided, and Profits Realized, by New York Life Investments
The Board considered the costs of the services provided by New York Life Investments under the Agreements, and the profits realized by New York Life Investments and its affiliates due to their relationships with the Allocation Funds.
The Board noted that the Allocation Funds do not pay a management fee, but that shareholders of the Allocation Funds indirectly pay the fees and expenses of the underlying funds in which the Allocation Funds invest. The Board considered that the Allocation Funds’ investments in underlying funds managed by New York Life Investments indirectly benefit New York Life Investments.
In evaluating the costs and profits of New York Life Investments and its affiliates, the Board considered, among other factors, New York Life Investments’ investments in personnel, systems, equipment and other resources necessary to manage the Allocation Funds. The Board acknowledged that New York Life Investments must be in a position to pay and retain experienced professional personnel to provide services to the Allocation Funds, and that the ability to maintain a strong financial position is important in order for New York Life Investments to continue to provide high-quality services to the Allocation Funds. The Board also noted that the Allocation Funds benefit from the allocation of certain fixed costs across the MainStay Group of Funds.
In addition, the Board noted the difficulty in obtaining reliable comparative data about mutual fund managers’ profitability, since such information generally is not publicly available and may be impacted by numerous factors, including the structure of a fund manager’s organization, the types of funds it manages, the methodology used to allocate certain fixed costs to specific funds, and the manager’s capital structure and costs of capital. While recognizing the difficulty in evaluating a manager’s profitability with respect to the Allocation Funds, and noting that other profitability methodologies may also be reasonable, the Board concluded that the profitability methodology presented by New York Life Investments to the Board, which was developed by New York Life Investments in consultation with an independent consultant, was reasonable in all material respects.
In considering the costs and profitability of the Allocation Funds, the Board also considered certain fall-out benefits that may be realized by New York Life Investments and its affiliates due to their relationships with the Allocation Funds. The Board further considered that, in addition to fees earned by New York Life Investments for managing the Allocation Funds, New York Life Investments’ affiliates also earn revenues from serving the Allocation Funds in various other capacities, including as the Allocation Funds’ transfer agent and distributor. The Board observed that information about these other revenues, and their impact on the profitability of the Allocation Funds to New York Life Investments and its affiliates, was furnished to the Board as part of the 15(c) process. The Board noted that, although it assessed the overall profitability of the Allocation Funds to New York Life Investments and its affiliates as part of the contract review process, when considering the reasonableness of the fees to be paid to New York Life Investments and its affiliates under the Agreements, the Board considered the profitability of New York Life Investments’ relationship with the Allocation Funds on a pre-tax basis, and without regard to distribution expenses.
| | | | |
| mainstayinvestments.com | | | 81 | |
Board Consideration and Approval of Management Agreements (Unaudited) (continued)
After evaluating the information presented to the Board, the Board concluded, within the context of its overall determinations regarding the Agreements, that any profits realized by New York Life Investments and its affiliates due to their relationships with the Allocation Funds supported the Board’s decision to approve the Agreements.
Extent to Which Economies of Scale May Be Realized as the Allocation Funds Grow
The Board also considered whether the Allocation Funds’ expense structures permitted economies of scale to be shared with Allocation Fund investors. The Board reviewed information from New York Life Investments showing how the Allocation Funds’ management fee schedules compared to fee schedules of other funds and accounts managed by New York Life Investments. The Board also reviewed information from Strategic Insight showing how the Allocation Funds’ management fee schedules hypothetically would compare with fees paid for similar services by peer funds at varying asset levels. While recognizing the difficulty of determining economies of scale with precision, the Board acknowledged that economies of scale may be shared with the Allocation Funds in a number of ways, including, for example, through the imposition of management fee breakpoints and by initially setting relatively lower management fees. The Board noted that the Allocation Funds do not pay a management fee, and that the Board separately considers economies of scale as part of its review of the management agreements of underlying funds in which the Allocation Funds invest.
Based on this information, the Board concluded, within the context of its overall determinations regarding the Agreements, that the Allocation Funds’ expense structures appropriately reflect economies of scale for the benefit of Allocation Fund investors. The Board noted, however, that it would continue to evaluate the reasonableness of the Allocation Funds’ expense structures as the Allocation Funds grow over time.
Management Fees and Total Ordinary Operating Expenses
The Board evaluated the reasonableness of the fees to be paid under the Agreements and the Allocation Funds’ expected total ordinary operating expenses.
In assessing the reasonableness of the Allocation Funds’ fees and expenses, the Board primarily considered comparative data provided by Strategic Insight on the fees and expenses charged by similar mutual funds managed by other investment advisers. Because the Allocation Funds do not pay a management fee to New York Life Investments, the Board considered the reasonableness of fees and expenses the Allocation Funds indirectly pay by investing in underlying funds that charge management fees. The Board considered New York Life Investments’ process for monitoring and disclosing potential conflicts in the selection of underlying funds. In addition, the Board considered information provided by New York Life Investments on fees charged to other investment advisory clients, including institutional separate accounts and other funds with similar investment objectives as the Allocation Funds. The Board particularly considered differences in the contractual management fee schedules of the retail MainStay Funds and similarly-managed MainStay VP Portfolios, taking into account New York Life Investments’ rationale for any differences in fee schedules. The Board also took into account explanations provided by New York Life Investments about the different scope of services provided to mutual funds as compared with other investment advisory clients. Additionally, the Board considered the
impact of any expense limitation arrangements on the Allocation Funds’ net management fees and expenses.
The Board noted that, outside of the fees charged under a share class’s Rule 12b-1 and/or shareholder services plans, a share class’s most significant “other expenses” are transfer agent fees. Transfer agent fees are charged to the Allocation Funds based on the number of shareholder accounts (a “per-account” fee) as compared with certain other fees (e.g., management fees), which are charged based on the Allocation Funds’ average net assets. The Board took into account information from New York Life Investments showing that the Allocation Funds’ transfer agent fee schedule is reasonable, including industry data showing that the per-account fees that NYLIM Service Company LLC, the Allocation Funds’ transfer agent, charges the Allocation Funds are within the range of per-account fees charged by transfer agents to other mutual funds. In addition, the Board considered NYLIM Service Company LLC’s profitability in connection with the transfer agent services it provides to the Allocation Funds.
The Board acknowledged that, because the Allocation Funds’ transfer agent fees are billed on a per-account basis, the impact of transfer agent fees on a share class’s expense ratio may be more significant in cases where the share class has a high number of accounts with limited assets (i.e., small accounts). The Board observed that transfer agent fees are a significant portion of total expenses of many Funds in the MainStay Group of Funds. The impact of transfer agent fees on the expense ratios of these MainStay Funds tend to be greater than for other open-end retail funds, because the MainStay Group of Funds generally has a significant number of small accounts relative to competitor funds. The Board acknowledged the role that the MainStay Group of Funds historically has played in serving the investment needs of New York Life Insurance Company (“New York Life”) policyholders, who often maintain smaller account balances than other fund investors. The Board discussed measures that it and New York Life Investments have taken in recent years to mitigate the effect of small accounts on the expense ratios of Fund share classes, including: (i) encouraging New York Life agents to consolidate multiple small accounts held by the same investor into one MainStay Asset Allocation Fund account; (ii) increasing investment minimums from $500 to $1,000 in 2003; (iii) introducing Investor Class shares for certain MainStay Funds in early 2008 to consolidate smaller account investors; (iv) closing small accounts with balances below $250 in Investor Class shares or $750 in all other classes of shares; (v) no longer allowing an exception with no minimum investment amount with respect to AutoInvest accounts with subsequent monthly purchases of $100; (vi) since 2007, charging an annual $20.00 small account fee on certain accounts with balances below $1,000; and (vii) modifying the approach for billing transfer agent expenses to reduce the degree of subsidization by large accounts of smaller accounts.
After considering all of the factors outlined above, the Board concluded that the Allocation Funds’ management fees and total ordinary operating expenses were within a range that is competitive and, within the context of the Board’s overall conclusions regarding the Agreements, support a conclusion that these fees and expenses are reasonable.
Conclusion
On the basis of the information provided to it and its evaluation thereof, the Board, including the Independent Trustees, unanimously voted to approve the Agreements.
| | |
| 82 | | MainStay Asset Allocation Funds |
Proxy Voting Policies and Procedures and Proxy Voting Record
A description of the policies and procedures that New York Life Investments uses to vote proxies related to the Allocation Funds’ securities is available without charge, upon request, (i) by visiting the Allocation Funds’ website at mainstayinvestments.com; and (ii) on the Securities and Exchange Commission’s (“SEC”) website at www.sec.gov.
The MainStay Funds are required to file with the SEC their proxy voting records for each Allocation Fund for the 12-month period ending June 30 on Form N-PX. The most recent Form N-PX is available free of charge upon request by calling 800-MAINSTAY (624-6782); visiting the MainStay Funds’ website at mainstayinvestments.com; or on the SEC’s website at www.sec.gov.
Shareholder Reports and Quarterly Portfolio Disclosure
Each Allocation Fund is required to file its complete schedule of portfolio holdings with the SEC for its first and third fiscal quarters on Form N-Q. Each Allocation Fund’s Form N-Q is available without charge, on the SEC’s website at www.sec.gov or by calling MainStay Investments at 800-MAINSTAY (624-6782). You also can obtain and review copies of Form N-Q by visiting the SEC’s Public Reference Room in Washington, DC (information on the operation of the Public Reference Room may be obtained by calling 1-800-SEC-0330).
| | | | |
| mainstayinvestments.com | | | 83 | |
This page intentionally left blank
This page intentionally left blank
This page intentionally left blank
MainStay Funds
MainStay offers a wide range of Funds for virtually any investment need. The full array of MainStay open-end offerings is listed here, with information about the manager, subadvisors, legal counsel and independent registered public accounting firms.
Equity
U.S. Equity Funds
MainStay Common Stock Fund
MainStay Cornerstone Growth Fund
MainStay Epoch U.S. All Cap Fund
MainStay Epoch U.S. Equity Yield Fund
MainStay ICAP Equity Fund
MainStay ICAP Select Equity Fund
MainStay Large Cap Growth Fund1
MainStay MAP Fund
MainStay S&P 500 Index Fund
MainStay U.S. Equity Opportunities Fund
MainStay U.S. Small Cap Fund
International/Global Equity Funds
MainStay Epoch Global Choice Fund
MainStay Epoch Global Equity Yield Fund
MainStay Epoch International Small Cap Fund
MainStay ICAP Global Fund
MainStay ICAP International Fund
MainStay International Equity Fund
MainStay International Opportunities Fund
Income
Taxable Bond Funds
MainStay Floating Rate Fund
MainStay Global High Income Fund
MainStay Government Fund
MainStay High Yield Corporate Bond Fund
MainStay High Yield Opportunities Fund
MainStay Indexed Bond Fund
MainStay Intermediate Term Bond Fund
MainStay Short Duration High Yield Fund
MainStay Short Term Bond Fund
MainStay Unconstrained Bond Fund
Municipal Bond Funds
MainStay California Tax Free Opportunities Fund2
MainStay High Yield Municipal Bond Fund
MainStay New York Tax Free Opportunities Fund3
MainStay Tax Free Bond Fund
Money Market Fund
MainStay Money Market Fund
Mixed Asset
MainStay Balanced Fund
MainStay Convertible Fund
MainStay Income Builder Fund
MainStay Marketfield Fund
Asset Allocation/Target Date
MainStay Conservative Allocation Fund
MainStay Growth Allocation Fund
MainStay Moderate Allocation Fund
MainStay Moderate Growth Allocation Fund
MainStay Retirement 2010 Fund
MainStay Retirement 2020 Fund
MainStay Retirement 2030 Fund
MainStay Retirement 2040 Fund
MainStay Retirement 2050 Fund
Manager
New York Life Investment Management LLC
New York, New York
Subadvisors
Cornerstone Capital Management Holdings LLC4
New York, New York
Cornerstone Capital Management LLC4
Bloomington, Minnesota
Epoch Investment Partners, Inc.
New York, New York
Institutional Capital LLC4
Chicago, Illinois
MacKay Shields LLC4
New York, New York
Marketfield Asset Management LLC
New York, New York
Markston International LLC
White Plains, New York
Winslow Capital Management LLC
Minneapolis, Minnesota
Legal Counsel
Dechert LLP
Independent Registered Public Accounting Firms
KPMG LLP
PricewaterhouseCoopers LLP
1. Effective January 13, 2012, the Fund was closed to new investors with certain exceptions.
2. This Fund is only registered for sale in AZ, CA, NV, OR, UT, and WA.
3. This Fund is only registered for sale in CT, DE, FL, MA, NJ, NY, and VT.
4. An affiliate of New York Life Investment Management LLC.
Not part of the Semiannual Report
For more information
800-MAINSTAY (624-6782)
mainstayinvestments.com
The MainStay Funds® are managed by New York Life Investment Management LLC and distributed through NYLIFE Distributors LLC, 169 Lackawanna Avenue, Parsippany, NJ 07054, a wholly owned subsidiary of New York Life Insurance Company. NYLIFE Distributors LLC is a Member FINRA/SIPC.
MainStay Investments® is a registered service mark and name under which New York Life Investment Management LLC does business. MainStay Investments, an indirect subsidiary of New York Life Insurance Company, New York, NY 10010, provides investment advisory products and services.
This report may be distributed only when preceded or accompanied by a current Fund prospectus.
©2013 NYLIFE Distributors LLC. All rights reserved.
| | | | | | | | |
| Not FDIC/NCUA Insured | | Not a Deposit | | May Lose Value | | No Bank Guarantee | | Not Insured by Any Government Agency |
| | |
| NYLIM-30081 MS175-13 | | MSAA10-06/13 NL0A2 |
MainStay Indexed Bond Fund
Message from the President and Semiannual Report
Unaudited | April 30, 2013


This page intentionally left blank
Message from the President
The U.S. stock market advanced during the six months ended April 30, 2013, generally providing double-digit returns at all capitalization levels. Value stocks tended to outpace growth stocks among large- and mid-capitalization companies, while growth stocks tended to outpace value stocks among smaller companies.
The market’s advance, however, was far from uniform. Stocks declined in early November, both before and immediately after the U.S. presidential election. Following a sharp recovery, stocks climbed until mid-December, when a Congressional stalemate on the fiscal cliff led to a brief decline. Another dip occurred in late February as investors speculated that the Federal Open Market Committee (FOMC) might stop purchasing mortgage-backed securities sooner than expected. Stocks also dipped in mid-April, as consumer sentiment dropped after the Boston marathon bombing. Despite these setbacks, U.S. stocks continued to trend upward during the six-month reporting period.
International stock markets also advanced, with several regional differences. Accommodative action by the Bank of Japan helped lower the yen and lift Japanese stocks to their highest levels since 2008. In Europe, stocks did well until early February, bolstered by the promise of support for the euro. As the year progressed, however, economic contraction, rising unemployment and systematic banking concerns took a toll on investor enthusiasm. In China, manufacturing slowed as the nation sought to balance growth and inflation risks. On the Korean peninsula, tensions rose as North Korea continued to threaten its neighbors, which added an undercurrent of caution to the market.
During the six months ended April 30, 2013, the FOMC kept the federal funds rate in a range close to zero. The FOMC also continued its direct purchases of mortgage-backed securities and longer-term U.S. government securities. With short-term interest rates likely to remain at low levels, many bond investors pursued higher yields by lengthening maturities and assuming greater risk. As a result, bonds with higher risk profiles tended
to outperform higher-quality investment-grade bonds and U.S. Treasury securities. Cash and cash equivalents essentially returned zero.
With wide variations in the performance of various asset classes, some investors might be tempted to chase higher returns by shifting back and forth between stocks and bonds. Since no one can predict where the market will move next, however, we encourage investors to select an appropriate mix of investments for their risk tolerance and time horizon and to stick with that mix, making only minor adjustments over time.
At MainStay Funds, our portfolio managers use a similar approach. Careful security selection and thoughtful sell disciplines help them pursue the investment objectives of their respective Funds. Using the principal investment strategies outlined in the Prospectus, they focus primarily on providing long-term investment potential for our shareholders.
Has this approach proved successful? In its most recent rankings, Barron’s listed MainStay Funds as the #1 fund family over the past 10 years. We were also the only mutual fund family that has appeared in Barron’s top six for the past five consecutive years.
The pages that follow provide additional insight into the specific market events, investment decisions and securities that shaped your MainStay Fund(s) during the six months ended April 30, 2013. We encourage you to read the semiannual report(s) carefully and to evaluate your results with your long-term financial goals in mind.
Sincerely,

Stephen P. Fisher
President
The opinions expressed are as of the date of this report and are subject to change. There is no guarantee that any forecast made will come to pass. This material does not constitute investment advice and is not intended as an endorsement of any specific investment.
To qualify for the Lipper/Barron’s Fund Survey, a fund family must have at least three funds in Lipper’s general U.S.-stock category, one in world equity (which combines global and international funds), one mixed-equity fund (which holds stocks and bonds), two taxable-bond funds, and one tax-exempt fund. Fund loads and 12b-1 fees aren’t included in the calculation of returns because the aim is to measure the manager’s skill. Each fund’s return is measured against all funds in its Lipper category, resulting in a percentile ranking which is then weighted by asset size relative to the fund family’s other assets in its general classifications. Finally, the score is multiplied by the general classification weightings as determined by the entire Lipper universe of funds.
Source: Barron’s, 2/9/13. Overall, MainStay Funds ranked number 56 for the one-year period, 20 for the five-year period and one for the 10-year period ended December 31, 2012, out of 62, 53 and 46 fund families, respectively. MainStay ranked number three for the 10-year period in 2009, 2010 and 2011 from among 48, 46 and 45 fund families, respectively. MainStay ranked number six from among 48 fund families for the 10-year period in 2008. Past performance is no guarantee of future results, which will vary. For the most recent MainStay Funds performance, please visit our website at mainstayinvestments.com. All mutual funds are subject to market risk and will fluctuate in value.
Not part of the Semiannual Report
Table of Contents
Investors should refer to the Fund’s Summary Prospectus and/or Prospectus and consider the Fund’s investment objectives, strategies, risks, charges and expenses carefully before investing. The Summary Prospectus and/or Prospectus contain this and other information about the Fund. You may obtain copies of the Fund’s Summary Prospectus, Prospectus and Statement of Additional Information free of charge, upon request, by calling toll-free 800-MAINSTAY (624-6782), by writing to NYLIFE Distributors LLC, Attn: MainStay Marketing Department, 169 Lackawanna Avenue, Parsippany, New Jersey 07054 or by sending an e-mail to MainStayShareholderServices@nylim.com. These documents are also available via the MainStay Funds’ website at mainstayinvestments.com/documents. Please read the Summary Prospectus and/or Prospectus carefully before investing.
Investment and Performance Comparison1 (Unaudited)
Performance data quoted represents past performance. Past performance is no guarantee of future results. Because of market volatility, current performance may be lower or higher than the figures shown. Investment return and principal value will fluctuate, and as a result, when shares are redeemed, they may be worth more or less than their original cost. The graph below depicts the historical performance of Class I shares of the Fund. Performance will vary from class to class based on differences in class-specific expenses and sales charges. For performance information current to the most recent month-end, please call 800-MAINSTAY (624-6782) or visit mainstayinvestments.com.
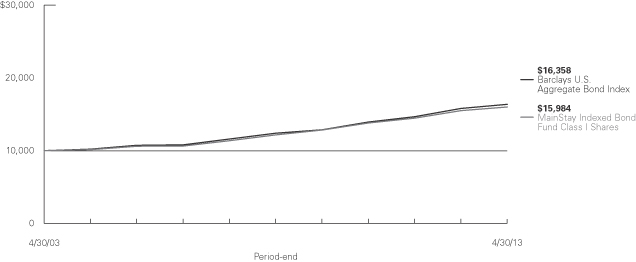
Average Annual Total Returns for the Period Ended April 30, 2013
| | | | | | | | | | | | | | | | | | | | | | | | |
| Class | | Sales Charge | | | | Six Months | | | One Year | | | Five Years | | | Ten Years | | | Gross
Expense
Ratio2 | |
| Investor Class Shares3 | | Maximum 3% Initial Sales Charge | | With sales charges Excluding sales charges | |
| –2.55
0.47 | %
| |
| –0.36
2.72 | %
| |
| 4.46
5.09 | %
| |
| 4.06
4.38 | %
| |
| 0.94
0.94 | %
|
| Class A Shares4 | | Maximum 3% Initial Sales Charge | | With sales charges Excluding sales charges | |
| –2.58
0.44 |
| |
| –0.35
2.73 |
| |
| 4.56
5.20 |
| |
| 4.11
4.43 |
| |
| 0.72
0.72 |
|
| Class I Shares | | No Sales Charge | | | | | 0.63 | | | | 3.14 | | | | 5.61 | | | | 4.80 | | | | 0.47 | |
| 1. | The performance table and graph do not reflect the deduction of taxes that a shareholder would pay on distributions or Fund share redemptions. Total returns reflect maximum applicable sales charges as indicated in the table above, changes in share price, and reinvestment of dividend and capital gain distributions. The graph assumes the initial investment amount shown above and reflects the deduction of all sales charges that would have applied for the period of investment. Performance figures reflect certain fee waivers and/or expense limitations, without which total returns may have been lower. For more information on share classes and current fee waivers and/or expense limitations, please refer to the notes to the financial statements. |
| 2. | The gross expense ratios presented reflect the Fund’s “Total Annual Fund Operating Expenses” from the most recent Prospectus and may differ from other expense ratios disclosed in this report. |
| 3. | Performance figures for Investor Class shares, first offered on February 28, 2008, include the historical performance of Class A shares through February 27, 2008, adjusted for differences in certain expenses and fees. Unadjusted, the performance shown for Investor Class shares would likely have been different. |
| 4. | Performance figures for Class A shares, first offered on January 2, 2004, include the historical performance of Class I shares through January 1, 2004, adjusted for differences in certain expenses and fees. Unadjusted, the performance shown for Class A shares would likely have been different. |
The footnotes on the next page are an integral part of the table and graph and should be carefully read in conjunction with them.
| | | | |
| mainstayinvestments.com | | | 5 | |
| | | | | | | | | | | | | | | | |
| Benchmark Performance | | Six
Months | | | One
Year | | | Five
Years | | | Ten
Years | |
Barclays U.S. Aggregate Bond Index5 | | | 0.90 | % | | | 3.68 | % | | | 5.72 | % | | | 5.04 | % |
Average Lipper Intermediate Investment Grade Debt Fund6 | | | 1.56 | | | | 5.52 | | | | 6.03 | | | | 4.81 | |
| 5. | The Barclays U.S. Aggregate Bond Index is a broad-based benchmark that measures the investment grade, U.S. dollar-denominated, fixed-rate taxable bond market, including Treasurys, government-related and corporate securities, mortgage-backed securities (agency fixed-rate and hybrid adjustable rate mortgage pass-throughs), asset-backed securities, and commercial mortgage-backed securities. The Barclays U.S. Aggregate Bond Index is the Fund’s broad-based securities market index for comparison purposes. Results assume reinvestment of all income and capital gains. An investment cannot be made directly in an Index. |
| 6. | The average Lipper intermediate investment grade debt fund is representative of funds that invest primarily in investment-grade debt issues (rated in the top four grades) with dollar-weighted average maturities of five to ten years. This benchmark is a product of Lipper Inc. Lipper Inc. is an independent monitor of fund performance. Results are based on average total returns of similar funds with all dividend and capital gain distributions reinvested. |
The footnotes on the preceding page are an integral part of the table and graph and should be carefully read in conjunction with them.
| | |
| 6 | | MainStay Indexed Bond Fund |
Cost in Dollars of a $1,000 Investment in MainStay Indexed Bond Fund (Unaudited)
The example below is intended to describe the fees and expenses borne by shareholders during the six-month period from November 1, 2012, to April 30, 2013, and the impact of those costs on your investment.
Example
As a shareholder of the Fund, you incur two types of costs: (1) transaction costs, including exchange fees and sales charges (loads) on purchases (as applicable), and (2) ongoing costs, including management fees, distribution and/or service (12b-1) fees, and other Fund expenses (as applicable). This example is intended to help you understand your ongoing costs (in dollars) of investing in the Fund and to compare these costs with the ongoing costs of investing in other mutual funds. The example is based on an investment of $1,000 made at the beginning of the six-month period and held for the entire period from November 1, 2012, to April 30, 2013.
This example illustrates your Fund’s ongoing costs in two ways:
Actual Expenses
The second and third data columns in the table below provide information about actual account values and actual expenses. You may use the information in these columns, together with the amount you invested, to estimate the expenses that you paid during the six months ended April 30, 2013. Simply divide your account value by $1,000 (for example, an $8,600 account value divided by $1,000 = 8.6), then
multiply the result by the number under the heading entitled “Expenses Paid During Period” to estimate the expenses you paid on your account during this period.
Hypothetical Example for Comparison Purposes
The fourth and fifth data columns in the table below provide information about hypothetical account values and hypothetical expenses based on the Fund’s actual expense ratio and an assumed rate of return of 5% per year before expenses, which is not the Fund’s actual return. The hypothetical account values and expenses may not be used to estimate the actual ending account balances or expenses you paid for the six-month period shown. You may use this information to compare the ongoing costs of investing in the Fund with the ongoing costs of investing in other Funds. To do so, compare this 5% hypothetical example with the 5% hypothetical examples that appear in the shareholder reports of the other Funds.
Please note that the expenses shown in the table are meant to highlight your ongoing costs only and do not reflect any transactional costs, such as exchange fees or sales charges (loads). Therefore, the fourth and fifth data columns of the table are useful in comparing ongoing costs only and will not help you determine the relative total costs of owning different funds. In addition, if these transactional costs were included, your costs would have been higher.
| | | | | | | | | | | | | | | | | | | | |
| | | | | | | | | | | | | | | | |
| Share Class | | Beginning
Account
Value
11/1/12 | | | Ending Account
Value (Based
on Actual
Returns and
Expenses)
4/30/13 | | | Expenses
Paid
During
Period1 | | | Ending Account
Value (Based
on Hypothetical
5% Annualized
Return and
Actual Expenses)
4/30/13 | | | Expenses
Paid
During
Period1 | |
| | | | | |
| Investor Class Shares | | $ | 1,000.00 | | | $ | 1,004.70 | | | $ | 4.57 | | | $ | 1,020.20 | | | $ | 4.61 | |
| | | | | |
| Class A Shares | | $ | 1,000.00 | | | $ | 1,004.40 | | | $ | 4.08 | | | $ | 1,020.70 | | | $ | 4.11 | |
| | | | | |
| Class I Shares | | $ | 1,000.00 | | | $ | 1,006.30 | | | $ | 2.14 | | | $ | 1,022.70 | | | $ | 2.16 | |
| 1. | Expenses are equal to the Fund’s annualized expense ratio of each class (0.92% for Investor Class, 0.82% for Class A and 0.43% for Class I) multiplied by the average account value over the period, divided by 365 and multiplied by 181 (to reflect the six-month period). The table above represents the actual expenses incurred during the six-month period. |
| | | | |
| mainstayinvestments.com | | | 7 | |
Portfolio Composition as of April 30, 2013 (Unaudited)
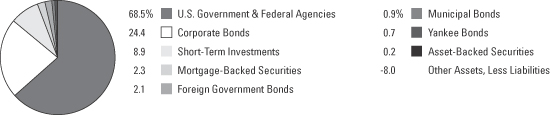
See Portfolio of Investments beginning on page 10 for specific holdings within these categories.
Top Ten Issuers Held as of April 30, 2013 (excluding short-term investments)
| 1. | United States Treasury Notes, 0.25%–3.375%, due 8/31/14–2/15/23 |
| 2. | Federal National Mortgage Association (Mortgage Pass-Through Securities), 2.308%–8.00%, due 6/1/15–10/1/42 |
| 3. | Federal Home Loan Mortgage Corporation (Mortgage Pass-Through Securities), 2.415%–8.00%, due 6/1/14–9/1/42 |
| 4. | Government National Mortgage Association (Mortgage Pass-Through Securities), 3.00%–8.50%, due 11/15/24–10/1/42 |
| 5. | United States Treasury Bonds, 2.75%–6.75%, due 8/15/26–11/15/42 |
| 6. | Federal Home Loan Mortgage Corporation, 0.53%–5.125%, due 1/15/15–1/13/22 |
| 7. | Federal National Mortgage Association, 1.00%–6.21%, due 9/16/14–8/6/38 |
| 8. | Bank of America Corp., 2.00%–5.70%, due 12/1/15–1/24/22 |
| 9. | Morgan Stanley Capital I, Inc., 5.646%–5.852%, due 10/15/42–3/12/44 |
| 10. | Goldman Sachs Group, Inc. (The), 3.625%–6.25%, due 9/1/17–1/22/23 |
| | |
| 8 | | MainStay Indexed Bond Fund |
Portfolio Management Discussion and Analysis (Unaudited)
Questions answered by portfolio managers Donald F. Serek, CFA, Thomas J. Girard and George S. Cherpelis of New York Life Investments,1 the Fund’s Manager.
How did MainStay Indexed Bond Fund perform relative to its peers and its benchmark during the six months ended April 30, 2013?
Excluding all sales charges, MainStay Indexed Bond Fund returned 0.47% for Investor Class shares and 0.44% for Class A shares for the six months ended April 30, 2013. Over the same period, Class I shares returned 0.63%. All share classes underperformed the 1.56% return of the average Lipper2 intermediate investment grade debt fund and the 0.90% return of the Barclays U.S. Aggregate Bond Index3 for the six months ended April 30, 2013. The Barclays U.S. Aggregate Bond Index is the Fund’s broad-based securities-market index. See page 5 for Fund returns with applicable sales charges.
What factors affected the Fund’s relative performance during the reporting period?
The Fund seeks to replicate the performance of the Barclays U.S. Aggregate Bond Index, the Fund’s primary benchmark. The Fund incurs operating expenses that the benchmark does not, which is the primary reason for the Fund’s underperformance of the benchmark.
During the reporting period, which credit-rating categories were strong positive performers and which credit rating categories were weak?
Generally speaking, lower-quality credit outperformed higherquality credit during the reporting period. Within the U.S. credit component of the Barclays U.S. Aggregate Bond Index, bonds rated BBB4 were the best-performers by rating category. These securities were followed by bonds rated A, whose spreads5 narrowed modestly. On average, credit rated AA modestly underperformed bonds rated BBB and A, as spreads widened slightly during the reporting period.
Which market sectors provided the strongest positive contributions to the Fund’s performance, and which market sectors detracted the most?
All broad sectors in the Barclays U.S. Aggregate Bond Index generated positive total returns during the reporting period. Among the broad sectors in the Index, commercial mortgage-backed securities were the best performers, followed by corporate securities. Within the corporate sector, financial institutions significantly outperformed industrials and utilities. The worst-performing sector was mortgage-backed securities, followed by U.S. agency securities and asset-backed securities.
| 1. | “New York Life Investments” is a service mark used by New York Life Investment Management LLC. |
| 2. | See footnote on page 6 for more information on Lipper Inc. |
| 3. | See footnote on page 6 for more information on the Barclays U.S. Aggregate Bond Index. |
| 4. | An obligation rated ‘AAA’ has the highest rating assigned by Standard & Poor’s (“S&P”), and in the opinion of S&P, the obligor’s capacity to meet its financial commitment on the obligation is extremely strong. An obligation rated ‘AA’ by S&P is deemed by S&P to differ from the highest-rated obligations only to a small degree. In the opinion of S&P, the obligor’s capacity to meet its financial commitment on the obligation is very strong. An obligation rated ‘A’ by S&P is deemed by S&P to be somewhat more susceptible to the adverse effects of changes in circumstances and economic conditions than obligations in higher-rated categories. In the opinion of S&P, however, the obligor’s capacity to meet its financial commitment on the obligation is still strong. An obligation rated ‘BBB’ by S&P is deemed by S&P to exhibit adequate protection parameters. It is the opinion of S&P, however, that adverse economic conditions or changing circumstances are more likely to lead to a weakened capacity of the obligor to meet its financial commitment on the obligation. When applied to Fund holdings, ratings are based solely on the creditworthiness of the bonds in the portfolio and are not meant to represent the security or safety of the Fund. |
| 5. | The terms “spread” and “yield spread” may refer to the difference in yield between a security or type of security and comparable U.S. Treasury issues. The terms may also refer to the difference in yield between two specific securities or types of securities at a given time. |
The opinions expressed are those of the portfolio managers as of the date of this report and are subject to change. There is no guarantee that any forecast made will come to pass. This material does not constitute investment advice and is not intended as an endorsement of any specific investment.
| | | | |
| mainstayinvestments.com | | | 9 | |
Portfolio of Investments April 30, 2013 (Unaudited)
| | | | | | | | |
| | | Principal
Amount | | | Value | |
| | | | | | | | |
Long-Term Bonds 99.1%† Asset-Backed Securities 0.2% | | | | | |
Home Equity 0.1% | | | | | | | | |
Equity One ABS, Inc.
Series 2003-4, Class AF6
4.833%, due 10/25/34 (a)(b) | | $ | 142,000 | | | $ | 144,266 | |
RAMP Trust
Series 2003-RZ5, Class A7
4.97%, due 9/25/33 (b) | | | 72,510 | | | | 75,728 | |
Saxon Asset Securities Trust
Series 2003-1, Class AF5
5.455%, due 6/25/33 (a)(b) | | | 96,707 | | | | 101,603 | |
| | | | | | | | |
| | | | | | | 321,597 | |
| | | | | | | | |
Other ABS 0.1% | | | | | | | | |
JPMorgan Mortgage Acquisition Trust
Series 2007-HE1, Class AF3
6.174%, due 3/25/47 (a)(b) | | | 500,000 | | | | 386,010 | |
| | | | | | | | |
Total Asset-Backed Securities
(Cost $805,790) | | | | | | | 707,607 | |
| | | | | | | | |
|
| Corporate Bonds 24.4% | |
Aerospace & Defense 0.4% | | | | | | | | |
Boeing Co. (The)
6.125%, due 2/15/33 | | | 250,000 | | | | 325,284 | |
General Dynamics Corp.
3.60%, due 11/15/42 | | | 250,000 | | | | 237,249 | |
L-3 Communications Corp.
5.20%, due 10/15/19 | | | 100,000 | | | | 113,642 | |
Lockheed Martin Corp. | | | | | | | | |
4.25%, due 11/15/19 | | | 250,000 | | | | 281,061 | |
4.85%, due 9/15/41 | | | 100,000 | | | | 108,064 | |
Northrop Grumman Corp.
5.05%, due 8/1/19 | | | 100,000 | | | | 117,959 | |
United Technologies Corp. | | | | | | | | |
3.10%, due 6/1/22 | | | 300,000 | | | | 319,178 | |
4.50%, due 4/15/20 | | | 200,000 | | | | 233,940 | |
4.50%, due 6/1/42 | | | 100,000 | | | | 110,526 | |
6.125%, due 2/1/19 | | | 125,000 | | | | 155,704 | |
| | | | | | | | |
| | | | | | | 2,002,607 | |
| | | | | | | | |
Agriculture 0.1% | | | | | | | | |
Archer-Daniels-Midland Co.
4.535%, due 3/26/42 | | | 216,000 | | | | 232,890 | |
Bunge, Ltd. Finance Corp.
5.35%, due 4/15/14 | | | 100,000 | | | | 104,252 | |
| | | | | | | | |
| | | | | | | 337,142 | |
| | | | | | | | |
| | | | | | | | |
| | | Principal
Amount | | | Value | |
| | | | | | | | |
Airlines 0.0%‡ | | | | | | | | |
Continental Airlines, Inc.
Series 1992-2, Class A1
7.256%, due 9/15/21 | | $ | 47,712 | | | $ | 52,244 | |
Southwest Airlines Co.
5.25%, due 10/1/14 | | | 75,000 | | | | 79,171 | |
| | | | | | | | |
| | | | | | | 131,415 | |
| | | | | | | | |
Apparel 0.0%‡ | | | | | | | | |
VF Corp.
6.45%, due 11/1/37 | | | 50,000 | | | | 64,808 | |
| | | | | | | | |
| | |
Auto Manufacturers 0.1% | | | | | | | | |
Daimler Finance N.A. LLC
8.50%, due 1/18/31 | | | 150,000 | | | | 237,580 | |
| | | | | | | | |
| | |
Auto Parts & Equipment 0.0%‡ | | | | | | | | |
Johnson Controls, Inc. | | | | | | | | |
5.50%, due 1/15/16 | | | 50,000 | | | | 55,753 | |
6.00%, due 1/15/36 | | | 50,000 | | | | 61,392 | |
| | | | | | | | |
| | | | | | | 117,145 | |
| | | | | | | | |
Banks 5.0% | | | | | | | | |
¨Bank of America Corp. | | | | | | | | |
2.00%, due 1/11/18 | | | 1,500,000 | | | | 1,504,803 | |
5.25%, due 12/1/15 | | | 200,000 | | | | 217,243 | |
5.42%, due 3/15/17 | | | 900,000 | | | | 997,730 | |
5.70%, due 1/24/22 | | | 325,000 | | | | 387,366 | |
Bank of New York Mellon Corp. (The)
2.95%, due 6/18/15 | | | 250,000 | | | | 262,652 | |
Bank of Nova Scotia
1.95%, due 1/30/17 (c) | | | 250,000 | | | | 260,850 | |
BB&T Corp.
3.375%, due 9/25/13 | | | 500,000 | | | | 506,105 | |
BNP Paribas S.A.
3.25%, due 3/3/23 | | | 250,000 | | | | 251,988 | |
Canadian Imperial Bank of Commerce
2.35%, due 12/11/15 | | | 100,000 | | | | 104,144 | |
Capital One Financial Corp. | | | | | | | | |
1.00%, due 11/6/15 | | | 250,000 | | | | 249,315 | |
5.25%, due 2/21/17 | | | 100,000 | | | | 112,897 | |
Citigroup, Inc. | | | | | | | | |
4.45%, due 1/10/17 | | | 100,000 | | | | 110,584 | |
4.50%, due 1/14/22 | | | 400,000 | | | | 451,660 | |
4.875%, due 5/7/15 | | | 350,000 | | | | 372,948 | |
5.875%, due 2/22/33 | | | 450,000 | | | | 501,392 | |
6.125%, due 11/21/17 | | | 500,000 | | | | 594,590 | |
Cooperatieve Centrale
Raiffeisen-Boerenleenbank B.A.
4.50%, due 1/11/21 | | | 300,000 | | | | 340,938 | |
| † | Percentages indicated are based on Fund net assets. |
| ¨ | | Among the Fund’s 10 largest issuers held, as of April 30, 2013, excluding short-term investments. May be subject to change daily. |
| | | | |
| 10 | | MainStay Indexed Bond Fund | | The notes to the financial statements are an integral part of,
and should be read in conjunction with, the financial statements. |
| | | | | | | | |
| | | Principal
Amount | | | Value | |
| | | | | | | | |
| Corporate Bonds (continued) | | | | | | | | |
Banks (continued) | | | | | | | | |
Deutsche Bank A.G.
6.00%, due 9/1/17 | | $ | 325,000 | | | $ | 387,288 | |
Export-Import Bank of Korea
5.875%, due 1/14/15 | | | 350,000 | | | | 376,410 | |
Fifth Third Bank
4.75%, due 2/1/15 | | | 250,000 | | | | 266,344 | |
¨Goldman Sachs Group, Inc. (The) | | | | | | | | |
3.625%, due 1/22/23 | | | 150,000 | | | | 155,602 | |
5.95%, due 1/18/18 | | | 1,000,000 | | | | 1,167,890 | |
6.00%, due 6/15/20 | | | 900,000 | | | | 1,084,309 | |
6.25%, due 9/1/17 | | | 200,000 | | | | 235,264 | |
HSBC Holdings PLC
4.00%, due 3/30/22 | | | 175,000 | | | | 193,853 | |
JPMorgan Chase & Co.
4.40%, due 7/22/20 | | | 1,250,000 | | | | 1,416,100 | |
JPMorgan Chase Bank N.A.
6.00%, due 10/1/17 | | | 785,000 | | | | 928,660 | |
KeyBank N.A.
5.80%, due 7/1/14 | | | 375,000 | | | | 397,114 | |
Korea Development Bank
4.375%, due 8/10/15 | | | 300,000 | | | | 320,831 | |
Kreditanstalt fuer Wiederaufbau | | | | | | | | |
4.50%, due 7/16/18 | | | 850,000 | | | | 1,001,470 | |
Series G 4.875%, due 1/17/17 | | | 850,000 | | | | 980,900 | |
Landwirtschaftliche Rentenbank | | | | | | | | |
3.125%, due 7/15/15 | | | 300,000 | | | | 317,760 | |
5.125%, due 2/1/17 | | | 475,000 | | | | 553,565 | |
Morgan Stanley | | | | | | | | |
5.50%, due 7/24/20 | | | 1,100,000 | | | | 1,283,215 | |
6.25%, due 8/28/17 | | | 300,000 | | | | 350,224 | |
Northern Trust Corp.
3.45%, due 11/4/20 | | | 100,000 | | | | 109,873 | |
PNC Bank N.A.
5.25%, due 1/15/17 | | | 175,000 | | | | 198,341 | |
PNC Funding Corp. | | | | | | | | |
3.625%, due 2/8/15 | | | 150,000 | | | | 157,728 | |
5.125%, due 2/8/20 | | | 100,000 | | | | 118,528 | |
Royal Bank of Scotland PLC (The) | | | | | | | | |
4.375%, due 3/16/16 | | | 200,000 | | | | 218,223 | |
5.00%, due 11/12/13 | | | 100,000 | | | | 101,600 | |
5.05%, due 1/8/15 | | | 100,000 | | | | 104,166 | |
State Street Bank & Trust Co.
5.25%, due 10/15/18 | | | 100,000 | | | | 118,643 | |
SunTrust Banks, Inc.
5.40%, due 4/1/20 | | | 15,000 | | | | 16,858 | |
U.S. Bancorp
2.875%, due 11/20/14 | | | 300,000 | | | | 311,247 | |
U.S. Bank N.A.
4.80%, due 4/15/15 | | | 100,000 | | | | 107,965 | |
| | | | | | | | |
| | | Principal
Amount | | | Value | |
| | | | | | | | |
Banks (continued) | | | | | | | | |
UBS A.G. | | | | | | | | |
5.875%, due 7/15/16 | | $ | 125,000 | | | $ | 140,360 | |
5.875%, due 12/20/17 | | | 200,000 | | | | 238,029 | |
7.75%, due 9/1/26 | | | 100,000 | | | | 131,293 | |
Wachovia Bank N.A. | | | | | | | | |
4.875%, due 2/1/15 | | | 575,000 | | | | 615,181 | |
5.60%, due 3/15/16 | | | 200,000 | | | | 225,278 | |
Wachovia Corp. | | | | | | | | |
5.25%, due 8/1/14 | | | 100,000 | | | | 105,574 | |
5.50%, due 8/1/35 | | | 125,000 | | | | 144,333 | |
Wells Fargo & Co.
4.60%, due 4/1/21 | | | 250,000 | | | | 289,118 | |
Wells Fargo Bank N.A.
5.95%, due 8/26/36 | | | 150,000 | | | | 188,982 | |
Westpac Banking Corp.
3.00%, due 12/9/15 | | | 300,000 | | | | 317,978 | |
| | | | | | | | |
| | | | | | | 22,603,302 | |
| | | | | | | | |
Beverages 0.4% | | | | | | | | |
Anheuser-Busch Cos. LLC
6.45%, due 9/1/37 | | | 300,000 | | | | 410,039 | |
Anheuser-Busch InBev Worldwide, Inc.
3.75%, due 7/15/42 | | | 200,000 | | | | 194,721 | |
Beam, Inc.
5.375%, due 1/15/16 | | | 18,000 | | | | 19,946 | |
Brown-Forman Corp.
3.75%, due 1/15/43 | | | 50,000 | | | | 50,334 | |
Coca-Cola Co. (The)
3.15%, due 11/15/20 | | | 275,000 | | | | 300,536 | |
Pepsi Bottling Group, Inc. (The)
7.00%, due 3/1/29 | | | 60,000 | | | | 84,071 | |
PepsiCo., Inc.
5.00%, due 6/1/18 | | | 500,000 | | | | 587,978 | |
| | | | | | | | |
| | | | | | | 1,647,625 | |
| | | | | | | | |
Biotechnology 0.3% | | | | | | | | |
Amgen, Inc. | | | | | | | | |
3.45%, due 10/1/20 | | | 150,000 | | | | 162,595 | |
4.85%, due 11/18/14 | | | 725,000 | | | | 771,852 | |
5.85%, due 6/1/17 | | | 150,000 | | | | 177,294 | |
6.40%, due 2/1/39 | | | 100,000 | | | | 130,031 | |
Genentech, Inc.
4.75%, due 7/15/15 | | | 100,000 | | | | 108,984 | |
| | | | | | | | |
| | | | | | | 1,350,756 | |
| | | | | | | | |
Building Materials 0.1% | | | | | | | | |
CRH America, Inc. | | | | | | | | |
4.125%, due 1/15/16 | | | 100,000 | | | | 106,349 | |
6.00%, due 9/30/16 | | | 100,000 | | | | 114,186 | |
Lafarge S.A. | | | | | | | | |
6.50%, due 7/15/16 | | | 50,000 | | | | 56,029 | |
7.125%, due 7/15/36 | | | 50,000 | | | | 53,563 | |
| | | | | | |
The notes to the financial statements are an integral part of,
and should be read in conjunction with, the financial statements. | | mainstayinvestments.com | | | 11 | |
Portfolio of Investments April 30, 2013 (Unaudited) (continued)
| | | | | | | | |
| | | Principal
Amount | | | Value | |
| | | | | | | | |
| Corporate Bonds (continued) | | | | | | | | |
Building Materials (continued) | | | | | | | | |
Vulcan Materials Co.
6.30%, due 6/15/13 | | $ | 150,000 | | | $ | 150,000 | |
| | | | | | | | |
| | | | | | | 480,127 | |
| | | | | | | | |
Chemicals 0.2% | | | | | | | | |
Dow Chemical Co. (The)
4.125%, due 11/15/21 | | | 350,000 | | | | 381,243 | |
E.I. du Pont de Nemours & Co.
3.625%, due 1/15/21 | | | 100,000 | | | | 111,126 | |
Eastman Chemical Co.
4.50%, due 1/15/21 | | | 50,000 | | | | 55,941 | |
Lubrizol Corp.
5.50%, due 10/1/14 | | | 100,000 | | | | 107,079 | |
Potash Corporation of Saskatchewan, Inc.
4.875%, due 3/30/20 | | | 150,000 | | | | 174,279 | |
Rohm & Haas Co.
7.85%, due 7/15/29 | | | 100,000 | | | | 141,077 | |
| | | | | | | | |
| | | | | | | 970,745 | |
| | | | | | | | |
Commercial Services 0.0%‡ | | | | | | | | |
R.R. Donnelley & Sons Co.
5.50%, due 5/15/15 | | | 9,000 | | | | 9,630 | |
Western Union Co. (The)
5.93%, due 10/1/16 | | | 130,000 | | | | 145,357 | |
| | | | | | | | |
| | | | | | | 154,987 | |
| | | | | | | | |
Computers 0.4% | | | | | | | | |
Hewlett-Packard Co. | | | | | | | | |
1.55%, due 5/30/14 | | | 750,000 | | | | 754,229 | |
2.20%, due 12/1/15 | | | 150,000 | | | | 153,253 | |
4.375%, due 9/15/21 | | | 150,000 | | | | 152,944 | |
HP Enterprise Services LLC
Series B
6.00%, due 8/1/13 | | | 100,000 | | | | 101,291 | |
International Business Machines Corp. | | | | | | | | |
5.70%, due 9/14/17 | | | 250,000 | | | | 299,360 | |
5.875%, due 11/29/32 | | | 100,000 | | | | 132,902 | |
6.50%, due 1/15/28 | | | 100,000 | | | | 136,395 | |
7.50%, due 6/15/13 | | | 100,000 | | | | 100,837 | |
| | | | | | | | |
| | | | | | | 1,831,211 | |
| | | | | | | | |
Cosmetics & Personal Care 0.1% | | | | | | | | |
Colgate-Palmolive Co.
3.15%, due 8/5/15 | | | 100,000 | | | | 105,794 | |
Procter & Gamble Co. (The) | | | | | | | | |
4.70%, due 2/15/19 | | | 125,000 | | | | 147,776 | |
5.55%, due 3/5/37 | | | 100,000 | | | | 131,367 | |
| | | | | | | | |
| | | | | | | 384,937 | |
| | | | | | | | |
Diversified Financial Services 0.4% | | | | | | | | |
General Electric Capital Corp. | | | | | | | | |
4.65%, due 10/17/21 | | | 150,000 | | | | 171,430 | |
5.875%, due 1/14/38 | | | 625,000 | | | | 757,385 | |
| | | | | | | | |
| | | Principal
Amount | | | Value | |
| | | | | | | | |
Diversified Financial Services (continued) | | | | | |
General Electric Capital Corp. (continued) | | | | | | | | |
Series A 6.75%, due 3/15/32 | | $ | 650,000 | | | $ | 850,139 | |
| | | | | | | | |
| | | | | | | 1,778,954 | |
| | | | | | | | |
Electric 1.9% | | | | | | | | |
Alliant Energy Corp.
4.00%, due 10/15/14 | | | 100,000 | | | | 104,602 | |
Appalachian Power Co.
Series H
5.95%, due 5/15/33 | | | 100,000 | | | | 119,422 | |
CenterPoint Energy Houston Electric LLC
Series K2
6.95%, due 3/15/33 | | | 100,000 | | | | 143,612 | |
Commonwealth Edison Co.
6.15%, due 9/15/17 | | | 150,000 | | | | 181,436 | |
Consolidated Edison Company of
New York, Inc.
6.30%, due 8/15/37 | | | 275,000 | | | | 377,860 | |
Constellation Energy Group, Inc.
7.60%, due 4/1/32 | | | 100,000 | | | | 136,035 | |
DTE Electric Co.
6.40%, due 10/1/13 | | | 275,000 | | | | 281,548 | |
Duke Energy Carolinas LLC
5.30%, due 2/15/40 | | | 200,000 | | | | 242,784 | |
Duke Energy Florida Inc.
6.35%, due 9/15/37 | | | 200,000 | | | | 272,647 | |
Duke Energy Indiana, Inc.
5.00%, due 9/15/13 | | | 100,000 | | | | 101,680 | |
Entergy Gulf States Louisiana LLC
3.95%, due 10/1/20 | | | 250,000 | | | | 275,715 | |
FirstEnergy Corp. | | | | | | | | |
4.25%, due 3/15/23 | | | 75,000 | | | | 77,470 | |
Series C 7.375%, due 11/15/31 | | | 200,000 | | | | 239,261 | |
Florida Power & Light Co. | | | | | | | | |
3.80%, due 12/15/42 | | | 300,000 | | | | 305,253 | |
5.55%, due 11/1/17 | | | 100,000 | | | | 119,714 | |
Georgia Power Co.
4.75%, due 9/1/40 | | | 250,000 | | | | 277,338 | |
Jersey Central Power & Light Co.
7.35%, due 2/1/19 | | | 35,000 | | | | 44,549 | |
Kentucky Utilities Co.
1.625%, due 11/1/15 | | | 100,000 | | | | 102,456 | |
Nevada Power Co.
6.50%, due 8/1/18 | | | 150,000 | | | | 186,845 | |
NextEra Energy Capital Holdings, Inc.
2.60%, due 9/1/15 | | | 300,000 | | | | 310,586 | |
Ohio Power Co.
Series G
6.60%, due 2/15/33 | | | 150,000 | | | | 197,989 | |
| | | | |
| 12 | | MainStay Indexed Bond Fund | | The notes to the financial statements are an integral part of,
and should be read in conjunction with, the financial statements. |
| | | | | | | | |
| | | Principal
Amount | | | Value | |
| | | | | | | | |
| Corporate Bonds (continued) | | | | | | | | |
Electric (continued) | | | | | |
Oncor Electric Delivery Co. LLC
7.00%, due 9/1/22 | | $ | 100,000 | | | $ | 133,728 | |
Pacific Gas & Electric Co. | | | | | | | | |
3.25%, due 9/15/21 | | | 175,000 | | | | 187,930 | |
5.625%, due 11/30/17 | | | 500,000 | | | | 598,992 | |
PacifiCorp
6.25%, due 10/15/37 | | | 350,000 | | | | 477,367 | |
Peco Energy Co.
5.95%, due 10/1/36 | | | 150,000 | | | | 198,808 | |
Pepco Holdings, Inc.
2.70%, due 10/1/15 | | | 200,000 | | | | 207,296 | |
PPL Electric Utilities Corp.
3.00%, due 9/15/21 | | | 200,000 | | | | 213,346 | |
PPL Energy Supply LLC
5.40%, due 8/15/14 | | | 100,000 | | | | 105,448 | |
Progress Energy, Inc.
5.625%, due 1/15/16 | | | 125,000 | | | | 140,296 | |
PSEG Power LLC | | | | | | | | |
5.125%, due 4/15/20 | | | 80,000 | | | | 92,355 | |
8.625%, due 4/15/31 | | | 50,000 | | | | 75,196 | |
Public Service Electric & Gas Co.
Series D
5.25%, due 7/1/35 | | | 100,000 | | | | 122,402 | |
Puget Sound Energy, Inc.
6.274%, due 3/15/37 | | | 100,000 | | | | 136,614 | |
San Diego Gas & Electric Co.
5.35%, due 5/15/35 | | | 175,000 | | | | 220,630 | |
Scottish Power, Ltd.
5.375%, due 3/15/15 | | | 100,000 | | | | 106,510 | |
South Carolina Electric & Gas Co.
6.05%, due 1/15/38 | | | 100,000 | | | | 131,371 | |
Southern California Edison Co.
4.50%, due 9/1/40 | | | 175,000 | | | | 197,570 | |
Union Electric Co. | | | | | | | | |
4.65%, due 10/1/13 | | | 100,000 | | | | 101,347 | |
5.40%, due 2/1/16 | | | 100,000 | | | | 112,205 | |
Virginia Electric and Power Co. | | | | | | | | |
6.00%, due 1/15/36 | | | 100,000 | | | | 133,586 | |
6.00%, due 5/15/37 | | | 175,000 | | | | 236,258 | |
Wisconsin Electric Power Co.
3.65%, due 12/15/42 | | | 250,000 | | | | 250,353 | |
Xcel Energy, Inc.
6.50%, due 7/1/36 | | | 150,000 | | | | 206,221 | |
| | | | | | | | |
| | | | | | | 8,484,631 | |
| | | | | | | | |
Electrical Components & Equipment 0.1% | | | | | |
Emerson Electric Co.
4.25%, due 11/15/20 | | | 300,000 | | | | 346,418 | |
| | | | | | | | |
| | | | | | | | |
| | | Principal
Amount | | | Value | |
| | | | | | | | |
Electronics 0.1% | | | | | | | | |
Honeywell International, Inc.
5.70%, due 3/15/37 | | $ | 100,000 | | | $ | 130,533 | |
Koninklijke Philips Electronics N.V.
6.875%, due 3/11/38 | | | 100,000 | | | | 138,846 | |
Thermo Fisher Scientific, Inc.
3.20%, due 3/1/16 | | | 250,000 | | | | 263,443 | |
| | | | | | | | |
| | | | | | | 532,822 | |
| | | | | | | | |
Environmental Controls 0.2% | | | | | | | | |
Republic Services, Inc.
5.00%, due 3/1/20 | | | 350,000 | | | | 406,385 | |
Waste Management, Inc. | | | | | | | | |
2.60%, due 9/1/16 | | | 100,000 | | | | 104,861 | |
5.00%, due 3/15/14 | | | 50,000 | | | | 51,912 | |
7.125%, due 12/15/17 | | | 100,000 | | | | 122,451 | |
7.75%, due 5/15/32 | | | 75,000 | | | | 107,628 | |
| | | | | | | | |
| | | | | | | 793,237 | |
| | | | | | | | |
Finance—Auto Loans 0.4% | | | | | | | | |
Ford Motor Credit Co. LLC | | | | | | | | |
4.25%, due 2/3/17 | | | 950,000 | | | | 1,022,975 | |
4.25%, due 9/20/22 | | | 300,000 | | | | 317,234 | |
Toyota Motor Credit Corp. | | | | | | | | |
2.80%, due 1/11/16 | | | 100,000 | | | | 105,644 | |
3.40%, due 9/15/21 | | | 200,000 | | | | 218,166 | |
| | | | | | | | |
| | | | | | | 1,664,019 | |
| | | | | | | | |
Finance—Consumer Loans 0.4% | | | | | | | | |
HSBC Finance Corp.
6.676%, due 1/15/21 | | | 1,000,000 | | | | 1,210,053 | |
SLM Corp.
5.625%, due 8/1/33 | | | 250,000 | | | | 237,500 | |
Springleaf Finance Corp.
Series I
5.40%, due 12/1/15 | | | 350,000 | | | | 365,312 | |
| | | | | | | | |
| | | | | | | 1,812,865 | |
| | | | | | | | |
Finance—Credit Card 0.2% | | | | | | | | |
American Express Co. | | | | | | | | |
5.50%, due 9/12/16 | | | 75,000 | | | | 85,562 | |
6.15%, due 8/28/17 | | | 625,000 | | | | 749,637 | |
| | | | | | | | |
| | | | | | | 835,199 | |
| | | | | | | | |
Finance—Investment Banker/Broker 0.4% | | | | | |
Bear Stearns Cos. LLC (The)
7.25%, due 2/1/18 | | | 400,000 | | | | 498,116 | |
BNP Paribas Home Loan Covered Bonds S.A. | | | | | |
2.20%, due 11/2/15 (c) | | | 250,000 | | | | 258,825 | |
Credit Suisse First Boston USA, Inc.
4.875%, due 1/15/15 | | | 875,000 | | | | 936,758 | |
Merrill Lynch & Co., Inc.
5.70%, due 5/2/17 | | | 100,000 | | | | 111,464 | |
| | | | | | | | |
| | | | | | | 1,805,163 | |
| | | | | | | | |
| | | | | | |
The notes to the financial statements are an integral part of,
and should be read in conjunction with, the financial statements. | | mainstayinvestments.com | | | 13 | |
Portfolio of Investments April 30, 2013 (Unaudited) (continued)
| | | | | | | | |
| | | Principal
Amount | | | Value | |
| | | | | | | | |
| Corporate Bonds (continued) | | | | | | | | |
Finance—Other Services 0.1% | | | | | | | | |
National Rural Utilities Cooperative Finance Corp. | | | | | |
5.45%, due 2/1/18 | | $ | 150,000 | | | $ | 178,793 | |
8.00%, due 3/1/32 | | | 75,000 | | | | 113,082 | |
| | | | | | | | |
| | | | | | | 291,875 | |
| | | | | | | | |
Food 0.6% | | | | | | | | |
ConAgra Foods, Inc.
7.00%, due 10/1/28 | | | 100,000 | | | | 132,272 | |
General Mills, Inc.
5.70%, due 2/15/17 | | | 300,000 | | | | 350,048 | |
Hershey Co. (The)
5.45%, due 9/1/16 | | | 100,000 | | | | 115,175 | |
Ingredion, Inc.
4.625%, due 11/1/20 | | | 50,000 | | | | 56,292 | |
Kellogg Co.
Series B
7.45%, due 4/1/31 | | | 75,000 | | | | 104,621 | |
Kraft Foods Group, Inc. | | | | | | | | |
3.50%, due 6/6/22 | | | 200,000 | | | | 213,235 | |
5.375%, due 2/10/20 | | | 130,000 | | | | 156,231 | |
6.125%, due 8/23/18 | | | 332,000 | | | | 404,751 | |
Kroger Co. (The)
6.40%, due 8/15/17 | | | 225,000 | | | | 268,727 | |
Mondelez International, Inc. | | | | | | | | |
5.375%, due 2/10/20 | | | 120,000 | | | | 143,545 | |
6.125%, due 2/1/18 | | | 118,000 | | | | 141,593 | |
6.50%, due 8/11/17 | | | 225,000 | | | | 271,608 | |
Safeway, Inc. | | | | | | | | |
5.00%, due 8/15/19 | | | 100,000 | | | | 112,113 | |
6.35%, due 8/15/17 | | | 100,000 | | | | 117,059 | |
Sysco Corp.
5.375%, due 9/21/35 | | | 100,000 | | | | 122,190 | |
Unilever Capital Corp.
5.90%, due 11/15/32 | | | 100,000 | | | | 136,303 | |
| | | | | | | | |
| | | | | | | 2,845,763 | |
| | | | | | | | |
Forest Products & Paper 0.1% | | | | | | | | |
Celulosa Arauco y Constitucion S.A.
5.625%, due 4/20/15 | | | 50,000 | | | | 53,064 | |
International Paper Co. | �� | | | | | | | |
4.75%, due 2/15/22 | | | 100,000 | | | | 113,855 | |
5.25%, due 4/1/16 | | | 150,000 | | | | 165,971 | |
5.30%, due 4/1/15 | | | 250,000 | | | | 270,391 | |
| | | | | | | | |
| | | | | | | 603,281 | |
| | | | | | | | |
Health Care—Products 0.3% | | | | | | | | |
Baxter International, Inc. | | | | | | | | |
4.625%, due 3/15/15 | | | 150,000 | | | | 160,867 | |
5.90%, due 9/1/16 | | | 100,000 | | | | 116,218 | |
Becton Dickinson and Co.
3.125%, due 11/8/21 | | | 100,000 | | | | 105,829 | |
CareFusion Corp.
5.125%, due 8/1/14 | | | 100,000 | | | | 105,265 | |
| | | | | | | | |
| | | Principal
Amount | | | Value | |
| | | | | | | | |
Health Care—Products (continued) | | | | | | | | |
Covidien International Finance S.A.
6.00%, due 10/15/17 | | $ | 150,000 | | | $ | 180,184 | |
Medtronic, Inc. | | | | | | | | |
2.75%, due 4/1/23 | | | 250,000 | | | | 254,150 | |
4.45%, due 3/15/20 | | | 200,000 | | | | 232,054 | |
Series B 4.75%, due 9/15/15 | | | 50,000 | | | | 54,731 | |
St. Jude Medical, Inc.
3.75%, due 7/15/14 | | | 150,000 | | | | 155,989 | |
| | | | | | | | |
| | | | | | | 1,365,287 | |
| | | | | | | | |
Health Care—Services 0.3% | | | | | | | | |
Aetna, Inc.
4.125%, due 6/1/21 | | | 175,000 | | | | 194,936 | |
CIGNA Corp.
5.125%, due 6/15/20 | | | 150,000 | | | | 175,255 | |
Laboratory Corporation of America Holdings
4.625%, due 11/15/20 | | | 100,000 | | | | 110,706 | |
Quest Diagnostics, Inc.
4.75%, due 1/30/20 | | | 100,000 | | | | 109,805 | |
UnitedHealth Group, Inc. | | | | | | | | |
2.875%, due 3/15/22 | | | 200,000 | | | | 205,390 | |
6.00%, due 6/15/17 | | | 330,000 | | | | 393,022 | |
WellPoint, Inc.
5.95%, due 12/15/34 | | | 250,000 | | | | 303,997 | |
| | | | | | | | |
| | | | | | | 1,493,111 | |
| | | | | | | | |
Home Builders 0.0%‡ | | | | | | | | |
MDC Holdings, Inc.
5.375%, due 7/1/15 | | | 50,000 | | | | 53,731 | |
Toll Brothers Finance Corp.
5.15%, due 5/15/15 | | | 50,000 | | | | 52,957 | |
| | | | | | | | |
| | | | | | | 106,688 | |
| | | | | | | | |
Household Products & Wares 0.0%‡ | | | | | | | | |
Kimberly-Clark Corp.
6.375%, due 1/1/28 | | | 100,000 | | | | 129,723 | |
| | | | | | | | |
| | |
Insurance 1.2% | | | | | | | | |
ACE INA Holdings, Inc. | | | | | | | | |
2.60%, due 11/23/15 | | | 100,000 | | | | 104,671 | |
5.70%, due 2/15/17 | | | 60,000 | | | | 70,058 | |
5.875%, due 6/15/14 | | | 105,000 | | | | 111,080 | |
AEGON Funding Co. LLC
5.75%, due 12/15/20 | | | 100,000 | | | | 120,829 | |
Allstate Corp. (The)
5.00%, due 8/15/14 | | | 525,000 | | | | 554,685 | |
American International Group, Inc. | | | | | | | | |
5.85%, due 1/16/18 | | | 300,000 | | | | 351,907 | |
6.25%, due 5/1/36 | | | 200,000 | | | | 256,530 | |
Assurant, Inc.
5.625%, due 2/15/14 | | | 100,000 | | | | 103,670 | |
| | | | |
| 14 | | MainStay Indexed Bond Fund | | The notes to the financial statements are an integral part of,
and should be read in conjunction with, the financial statements. |
| | | | | | | | |
| | | Principal
Amount | | | Value | |
| | | | | | | | |
| Corporate Bonds (continued) | | | | | | | | |
Insurance (continued) | | | | | | | | |
AXA S.A.
8.60%, due 12/15/30 | | $ | 105,000 | | | $ | 135,351 | |
Berkshire Hathaway, Inc.
3.00%, due 2/11/23 | | | 500,000 | | | | 517,806 | |
Chubb Corp. (The)
5.75%, due 5/15/18 | | | 100,000 | | | | 121,733 | |
Genworth Holdings, Inc. | | | | | | | | |
Class A 4.95%, due 10/1/15 | | | 75,000 | | | | 80,437 | |
5.75%, due 6/15/14 | | | 31,000 | | | | 32,666 | |
Hartford Financial Services Group, Inc.
5.50%, due 3/30/20 | | | 150,000 | | | | 179,278 | |
Lincoln National Corp. | | | | | | | | |
4.75%, due 2/15/14 | | | 150,000 | | | | 154,806 | |
4.85%, due 6/24/21 | | | 25,000 | | | | 28,678 | |
Marsh & McLennan Cos., Inc.
5.375%, due 7/15/14 | | | 100,000 | | | | 105,215 | |
MetLife, Inc. | | | | | | | | |
4.75%, due 2/8/21 | | | 400,000 | | | | 466,981 | |
5.70%, due 6/15/35 | | | 100,000 | | | | 120,620 | |
Metropolitan Life Global Funding I
5.125%, due 6/10/14 (c) | | | 220,000 | | | | 231,147 | |
Nationwide Financial Services, Inc.
5.10%, due 10/1/15 | | | 25,000 | | | | 26,871 | |
Principal Financial Group, Inc.
6.05%, due 10/15/36 | | | 100,000 | | | | 129,160 | |
Progressive Corp. (The)
6.25%, due 12/1/32 | | | 50,000 | | | | 65,721 | |
Protective Life Corp.
4.875%, due 11/1/14 | | | 100,000 | | | | 104,045 | |
Prudential Financial, Inc. | | | | | | | | |
Series B 5.10%, due 9/20/14 | | | 500,000 | | | | 530,162 | |
5.70%, due 12/14/36 | | | 200,000 | | | | 237,214 | |
Travelers Cos., Inc. (The) | | | | | | | | |
3.90%, due 11/1/20 | | | 200,000 | | | | 227,444 | |
6.75%, due 6/20/36 | | | 75,000 | | | | 106,618 | |
| | | | | | | | |
| | | | | | | 5,275,383 | |
| | | | | | | | |
Internet 0.0%‡ | | | | | | | | |
Symantec Corp.
2.75%, due 9/15/15 | | | 50,000 | | | | 51,706 | |
| | | | | | | | |
| | |
Iron & Steel 0.3% | | | | | | | | |
ArcelorMittal | | | | | | | | |
4.25%, due 2/25/15 | | | 100,000 | | | | 103,508 | |
5.375%, due 6/1/13 | | | 200,000 | | | | 200,560 | |
6.125%, due 6/1/18 | | | 300,000 | | | | 328,618 | |
Nucor Corp.
4.125%, due 9/15/22 | | | 50,000 | | | | 55,576 | |
| | | | | | | | |
| | | Principal
Amount | | | Value | |
| | | | | | | | |
Iron & Steel (continued) | | | | | | | | |
Vale Overseas, Ltd. | | | | | | | | |
4.375%, due 1/11/22 | | $ | 100,000 | | | $ | 105,238 | |
6.25%, due 1/23/17 | | | 600,000 | | | | 692,690 | |
| | | | | | | | |
| | | | | | | 1,486,190 | |
| | | | | | | | |
Machinery—Construction & Mining 0.1% | |
Caterpillar, Inc.
3.803%, due 8/15/42 | | | 342,000 | | | | 332,032 | |
| | | | | | | | |
| | |
Machinery—Diversified 0.1% | | | | | | | | |
Deere & Co. | | | | | | | | |
4.375%, due 10/16/19 | | | 100,000 | | | | 116,494 | |
7.125%, due 3/3/31 | | | 125,000 | | | | 181,313 | |
| | | | | | | | |
| | | | | | | 297,807 | |
| | | | | | | | |
Media 1.3% | | | | | | | | |
CBS Corp. | | | | | | | | |
3.375%, due 3/1/22 | | | 275,000 | | | | 286,876 | |
4.85%, due 7/1/42 | | | 100,000 | | | | 103,595 | |
Comcast Corp. | | | | | | | | |
5.65%, due 6/15/35 | | | 325,000 | | | | 396,057 | |
6.45%, due 3/15/37 | | | 250,000 | | | | 334,156 | |
COX Communications, Inc.
5.45%, due 12/15/14 | | | 32,000 | | | | 34,498 | |
DIRECTV Holdings LLC / DIRECTV Financing Co., Inc. | | | | | | | | |
3.80%, due 3/15/22 | | | 200,000 | | | | 210,062 | |
5.20%, due 3/15/20 | | | 250,000 | | | | 291,225 | |
Discovery Communications LLC | | | | | | | | |
3.70%, due 6/1/15 | | | 200,000 | | | | 211,582 | |
6.35%, due 6/1/40 | | | 105,000 | | | | 133,822 | |
Historic TW, Inc.
6.625%, due 5/15/29 | | | 250,000 | | | | 319,126 | |
NBC Universal Media LLC
5.15%, due 4/30/20 | | | 600,000 | | | | 726,886 | |
News America, Inc. | | | | | | | | |
4.50%, due 2/15/21 | | | 100,000 | | | | 115,017 | |
5.30%, due 12/15/14 | | | 300,000 | | | | 322,442 | |
6.40%, due 12/15/35 | | | 175,000 | | | | 222,396 | |
7.25%, due 5/18/18 | | | 100,000 | | | | 127,105 | |
Thomson Reuters Corp. | | | | | | | | |
5.70%, due 10/1/14 | | | 50,000 | | | | 53,503 | |
5.85%, due 4/15/40 | | | 105,000 | | | | 127,528 | |
Time Warner Cable, Inc. | | | | | | | | |
5.00%, due 2/1/20 | | | 250,000 | | | | 288,644 | |
6.55%, due 5/1/37 | | | 275,000 | | | | 331,910 | |
6.75%, due 7/1/18 | | | 250,000 | | | | 310,472 | |
Time Warner, Inc.
7.625%, due 4/15/31 | | | 375,000 | | | | 529,727 | |
Viacom, Inc.
4.375%, due 3/15/43 (c) | | | 354,000 | | | | 337,144 | |
| | | | | | | | |
| | | | | | | 5,813,773 | |
| | | | | | | | |
| | | | | | |
The notes to the financial statements are an integral part of,
and should be read in conjunction with, the financial statements. | | mainstayinvestments.com | | | 15 | |
Portfolio of Investments April 30, 2013 (Unaudited) (continued)
| | | | | | | | |
| | | Principal
Amount | | | Value | |
| | | | | | | | |
| Corporate Bonds (continued) | | | | | | | | |
Metal Fabricate & Hardware 0.0%‡ | | | | | | | | |
Precision Castparts Corp.
3.90%, due 1/15/43 | | $ | 125,000 | | | $ | 127,141 | |
| | | | | | | | |
| | |
Mining 0.4% | | | | | | | | |
Alcoa, Inc. | | | | | | | | |
5.72%, due 2/23/19 | | | 287,000 | | | | 309,586 | |
5.95%, due 2/1/37 | | | 100,000 | | | | 100,471 | |
Barrick Australia Finance Property, Ltd.
5.95%, due 10/15/39 | | | 150,000 | | | | 157,152 | |
Barrick Gold Finance Co.
4.875%, due 11/15/14 | | | 50,000 | | | | 53,066 | |
Freeport-McMoRan Copper & Gold, Inc.
3.875%, due 3/15/23 (c) | | | 150,000 | | | | 151,198 | |
Goldcorp, Inc.
2.125%, due 3/15/18 | | | 100,000 | | | | 100,031 | |
Newmont Mining Corp.
5.125%, due 10/1/19 | | | 150,000 | | | | 169,600 | |
Rio Tinto Alcan, Inc.
5.75%, due 6/1/35 | | | 50,000 | | | | 61,475 | |
Rio Tinto Finance USA PLC
3.50%, due 3/22/22 | | | 400,000 | | | | 417,875 | |
Rio Tinto Finance USA, Ltd.
3.75%, due 9/20/21 | | | 150,000 | | | | 160,286 | |
Teck Resources, Ltd.
3.75%, due 2/1/23 | | | 250,000 | | | | 249,483 | |
| | | | | | | | |
| | | | | | | 1,930,223 | |
| | | | | | | | |
Miscellaneous—Manufacturing 0.1% | | | | | | | | |
Cooper U.S., Inc.
2.375%, due 1/15/16 | | | 125,000 | | | | 129,370 | |
Danaher Corp. | | | | | | | | |
3.90%, due 6/23/21 | | | 50,000 | | | | 56,415 | |
5.625%, due 1/15/18 | | | 100,000 | | | | 119,010 | |
Dover Corp.
5.45%, due 3/15/18 | | | 100,000 | | | | 118,274 | |
Ingersoll-Rand PLC
4.75%, due 5/15/15 | | | 150,000 | | | | 159,381 | |
| | | | | | | | |
| | | | | | | 582,450 | |
| | | | | | | | |
Multi-National 0.8% | | | | | | | | |
European Investment Bank | | | | | | | | |
2.25%, due 3/15/16 | | | 1,100,000 | | | | 1,156,320 | |
2.75%, due 3/23/15 | | | 500,000 | | | | 522,650 | |
2.875%, due 9/15/20 | | | 725,000 | | | | 787,713 | |
International Bank for Reconstruction & Development | | | | | | | | |
(zero coupon), due 3/11/31 | | | 504,000 | | | | 267,516 | |
2.125%, due 3/15/16 | | | 750,000 | | | | 787,074 | |
| | | | | | | | |
| | | | | | | 3,521,273 | |
| | | | | | | | |
Office & Business Equipment 0.1% | | | | | | | | |
Pitney Bowes, Inc.
5.75%, due 9/15/17 | | | 100,000 | | | | 111,485 | |
| | | | | | | | |
| | | Principal
Amount | | | Value | |
| | | | | | | | |
Office & Business Equipment (continued) | | | | | |
Xerox Corp. | | | | | | | | |
6.35%, due 5/15/18 | | $ | 100,000 | | | $ | 118,216 | |
6.40%, due 3/15/16 | | | 160,000 | | | | 180,239 | |
| | | | | | | | |
| | | | | | | 409,940 | |
| | | | | | | | |
Oil & Gas 1.7% | | | | | | | | |
Anadarko Petroleum Corp. | | | | | | | | |
5.95%, due 9/15/16 | | | 475,000 | | | | 546,195 | |
6.45%, due 9/15/36 | | | 150,000 | | | | 191,704 | |
Apache Corp. | | | | | | | | |
3.625%, due 2/1/21 | | | 250,000 | | | | 272,906 | |
4.75%, due 4/15/43 | | | 100,000 | | | | 105,540 | |
Apache Finance Canada Corp.
4.375%, due 5/15/15 | | | 100,000 | | | | 107,299 | |
BP Capital Markets PLC | | | | | | | | |
4.50%, due 10/1/20 | | | 250,000 | | | | 289,767 | |
5.25%, due 11/7/13 | | | 250,000 | | | | 256,286 | |
Burlington Resources, Inc.
7.375%, due 3/1/29 | | | 104,000 | | | | 138,970 | |
Cenovus Energy, Inc.
6.75%, due 11/15/39 | | | 100,000 | | | | 134,036 | |
Chevron Corp.
4.95%, due 3/3/19 | | | 125,000 | | | | 149,477 | |
ConocoPhillips
5.90%, due 10/15/32 | | | 350,000 | | | | 449,725 | |
Devon Energy Corp. | | | | | | | | |
4.00%, due 7/15/21 | | | 200,000 | | | | 217,073 | |
7.95%, due 4/15/32 | | | 50,000 | | | | 71,095 | |
Encana Corp.
6.50%, due 2/1/38 | | | 125,000 | | | | 153,443 | |
EOG Resources, Inc.
4.10%, due 2/1/21 | | | 200,000 | | | | 228,217 | |
Hess Corp.
7.30%, due 8/15/31 | | | 100,000 | | | | 129,442 | |
Marathon Oil Corp.
6.80%, due 3/15/32 | | | 100,000 | | | | 128,999 | |
Marathon Petroleum Corp. | | | | | | | | |
3.50%, due 3/1/16 | | | 50,000 | | | | 53,465 | |
5.125%, due 3/1/21 | | | 100,000 | | | | 118,125 | |
Occidental Petroleum Corp.
3.125%, due 2/15/22 | | | 175,000 | | | | 186,478 | |
Pemex Project Funding Master Trust
6.625%, due 6/15/35 | | | 500,000 | | | | 628,889 | |
Petrobras International Finance Co. | | | | | | | | |
5.875%, due 3/1/18 | | | 475,000 | | | | 540,324 | |
7.75%, due 9/15/14 | | | 450,000 | | | | 487,800 | |
Phillips 66
5.875%, due 5/1/42 | | | 200,000 | | | | 246,470 | |
Shell International Finance B.V.
5.50%, due 3/25/40 | | | 275,000 | | | | 357,631 | |
Total Capital International S.A.
1.55%, due 6/28/17 | | | 250,000 | | | | 254,983 | |
| | | | |
| 16 | | MainStay Indexed Bond Fund | | The notes to the financial statements are an integral part of,
and should be read in conjunction with, the financial statements. |
| | | | | | | | |
| | | Principal
Amount | | | Value | |
| | | | | | | | |
| Corporate Bonds (continued) | | | | | | | | |
Oil & Gas (continued) | | | | | | | | |
Total Capital S.A.
2.30%, due 3/15/16 | | $ | 200,000 | | | $ | 208,903 | |
Transocean, Inc. | | | | | | | | |
6.00%, due 3/15/18 | | | 175,000 | | | | 202,306 | |
7.375%, due 4/15/18 | | | 100,000 | | | | 119,334 | |
Valero Energy Corp. | | | | | | | | |
4.50%, due 2/1/15 | | | 175,000 | | | | 186,000 | |
6.625%, due 6/15/37 | | | 100,000 | | | | 125,868 | |
7.50%, due 4/15/32 | | | 100,000 | | | | 132,570 | |
XTO Energy, Inc.
4.90%, due 2/1/14 | | | 75,000 | | | | 77,500 | |
| | | | | | | | |
| | | | | | | 7,496,820 | |
| | | | | | | | |
Oil & Gas Services 0.2% | | | | | | | | |
Baker Hughes, Inc.
5.125%, due 9/15/40 | | | 200,000 | | | | 242,052 | |
Halliburton Co.
6.15%, due 9/15/19 | | | 250,000 | | | | 316,028 | |
Weatherford International, Inc.
6.35%, due 6/15/17 | | | 225,000 | | | | 258,889 | |
| | | | | | | | |
| | | | | | | 816,969 | |
| | | | | | | | |
Pharmaceuticals 1.0% | | | | | | | | |
AbbVie, Inc.
4.40%, due 11/6/42 (c) | | | 200,000 | | | | 211,206 | |
Allergan, Inc.
5.75%, due 4/1/16 | | | 50,000 | | | | 57,017 | |
AstraZeneca PLC
6.45%, due 9/15/37 | | | 100,000 | | | | 134,257 | |
Bristol-Myers Squibb Co. | | | | | | | | |
5.875%, due 11/15/36 | | | 75,000 | | | | 97,373 | |
7.15%, due 6/15/23 | | | 50,000 | | | | 69,071 | |
Cardinal Health, Inc. | | | | | | | | |
4.00%, due 6/15/15 | | | 200,000 | | | | 212,703 | |
5.50%, due 6/15/13 | | | 50,000 | | | | 50,289 | |
Eli Lilly & Co. | | | | | | | | |
4.50%, due 3/15/18 | | | 100,000 | | | | 115,104 | |
7.125%, due 6/1/25 | | | 175,000 | | | | 248,667 | |
Express Scripts Holding Co.
2.75%, due 11/21/14 | | | 300,000 | | | | 308,706 | |
GlaxoSmithKline Capital, Inc.
6.375%, due 5/15/38 | | | 125,000 | | | | 171,629 | |
Johnson & Johnson
6.95%, due 9/1/29 | | | 100,000 | | | | 142,595 | |
McKesson Corp.
5.70%, due 3/1/17 | | | 50,000 | | | | 58,335 | |
Mead Johnson Nutrition Co.
3.50%, due 11/1/14 | | | 250,000 | | | | 259,017 | |
Medco Health Solutions, Inc.
2.75%, due 9/15/15 | | | 200,000 | | | | 208,399 | |
| | | | | | | | |
| | | Principal
Amount | | | Value | |
| | | | | | | | |
Pharmaceuticals (continued) | | | | | | | | |
Merck Sharp & Dohme Corp. | | | | | | | | |
4.75%, due 3/1/15 | | $ | 100,000 | | | $ | 107,797 | |
5.00%, due 6/30/19 | | | 250,000 | | | | 300,826 | |
Novartis Securities Investment, Ltd.
5.125%, due 2/10/19 | | | 450,000 | | | | 539,053 | |
Pfizer, Inc.
6.20%, due 3/15/19 | | | 300,000 | | | | 377,781 | |
Teva Pharmaceutical Finance II B.V. / Teva Pharmaceutical Finance III LLC
3.65%, due 11/10/21 | | | 100,000 | | | | 108,176 | |
Teva Pharmaceutical Finance LLC
3.00%, due 6/15/15 | | | 180,000 | | | | 188,484 | |
Wyeth LLC | | | | | | | | |
6.00%, due 2/15/36 | | | 200,000 | | | | 262,937 | |
6.45%, due 2/1/24 | | | 100,000 | | | | 135,268 | |
| | | | | | | | |
| | | | | | | 4,364,690 | |
| | | | | | | | |
Pipelines 0.6% | | | | | | | | |
Energy Transfer Partners, L.P. | | | | | | | | |
5.20%, due 2/1/22 | | | 200,000 | | | | 228,664 | |
5.95%, due 2/1/15 | | | 130,000 | | | | 140,576 | |
6.70%, due 7/1/18 | | | 100,000 | | | | 121,958 | |
Enterprise Products Operating LLC
Series B
6.875%, due 3/1/33 | | | 200,000 | | | | 261,171 | |
Kinder Morgan Energy Partners, L.P. | | | | | | | | |
5.00%, due 12/15/13 | | | 150,000 | | | | 154,159 | |
5.80%, due 3/15/35 | | | 300,000 | | | | 352,413 | |
ONEOK Partners, L.P.
6.15%, due 10/1/16 | | | 200,000 | | | | 230,969 | |
Plains All American Pipeline, L.P. / PAA Finance Corp.
6.65%, due 1/15/37 | | | 65,000 | | | | 86,129 | |
Spectra Energy Capital LLC | | | | | | | | |
6.20%, due 4/15/18 | | | 50,000 | | | | 60,511 | |
6.75%, due 2/15/32 | | | 125,000 | | | | 154,545 | |
Tennessee Gas Pipeline Co. LLC
7.50%, due 4/1/17 | | | 300,000 | | | | 367,761 | |
Williams Cos., Inc. (The)
8.75%, due 3/15/32 | | | 114,000 | | | | 159,134 | |
Williams Partners, L.P.
3.80%, due 2/15/15 | | | 300,000 | | | | 315,403 | |
| | | | | | | | |
| | | | | | | 2,633,393 | |
| | | | | | | | |
Real Estate 0.1% | | | | | | | | |
American Campus Communities Operating Partnership, L.P.
3.75%, due 4/15/23 | | | 250,000 | | | | 262,559 | |
Regency Centers, L.P.
5.25%, due 8/1/15 | | | 100,000 | | | | 108,450 | |
| | | | | | | | |
| | | | | | | 371,009 | |
| | | | | | | | |
| | | | | | |
The notes to the financial statements are an integral part of,
and should be read in conjunction with, the financial statements. | | mainstayinvestments.com | | | 17 | |
Portfolio of Investments April 30, 2013 (Unaudited) (continued)
| | | | | | | | |
| | | Principal
Amount | | | Value | |
| | | | | | | | |
| Corporate Bonds (continued) | | | | | | | | |
Real Estate Investment Trusts 0.3% | | | | | | | | |
Boston Properties, L.P.
4.125%, due 5/15/21 | | $ | 50,000 | | | $ | 55,400 | |
Camden Property Trust
5.00%, due 6/15/15 | | | 100,000 | | | | 108,025 | |
ERP Operating, L.P. | | | | | | | | |
5.125%, due 3/15/16 | | | 50,000 | | | | 55,726 | |
5.375%, due 8/1/16 | | | 50,000 | | | | 56,780 | |
Hospitality Properties Trust
5.125%, due 2/15/15 | | | 50,000 | | | | 52,189 | |
Kimco Realty Corp.
5.783%, due 3/15/16 | | | 50,000 | | | | 56,350 | |
Liberty Property, L.P.
5.125%, due 3/2/15 | | | 100,000 | | | | 106,596 | |
ProLogis, L.P.
6.625%, due 5/15/18 | | | 50,000 | | | | 60,734 | |
Simon Property Group, L.P. | | | | | | | | |
3.375%, due 3/15/22 | | | 400,000 | | | | 426,501 | |
5.25%, due 12/1/16 | | | 225,000 | | | | 256,185 | |
Weyerhaeuser Co.
7.375%, due 3/15/32 | | | 100,000 | | | | 136,569 | |
| | | | | | | | |
| | | | | | | 1,371,055 | |
| | | | | | | | |
Retail 0.7% | | | | | | | | |
Costco Wholesale Corp.
5.50%, due 3/15/17 | | | 100,000 | | | | 117,742 | |
CVS Caremark Corp. | | | | | | | | |
4.75%, due 5/18/20 | | | 250,000 | | | | 292,707 | |
4.875%, due 9/15/14 | | | 50,000 | | | | 52,982 | |
6.25%, due 6/1/27 | | | 175,000 | | | | 227,558 | |
Home Depot, Inc. (The)
5.875%, due 12/16/36 | | | 250,000 | | | | 323,821 | |
Lowe’s Cos., Inc. | | | | | | | | |
6.65%, due 9/15/37 | | | 100,000 | | | | 136,159 | |
6.875%, due 2/15/28 | | | 150,000 | | | | 200,675 | |
McDonald’s Corp.
5.80%, due 10/15/17 | | | 300,000 | | | | 361,822 | |
Target Corp. | | | | | | | | |
2.90%, due 1/15/22 | | | 100,000 | | | | 104,745 | |
6.50%, due 10/15/37 | | | 150,000 | | | | 206,634 | |
Wal-Mart Stores, Inc. | | | | | | | | |
5.00%, due 10/25/40 | | | 400,000 | | | | 471,374 | |
5.375%, due 4/5/17 | | | 200,000 | | | | 234,853 | |
6.50%, due 8/15/37 | | | 175,000 | | | | 244,881 | |
Yum! Brands, Inc.
6.25%, due 3/15/18 | | | 130,000 | | | | 155,643 | |
| | | | | | | | |
| | | | | | | 3,131,596 | |
| | | | | | | | |
Software 0.3% | | | | | | | | |
Fiserv, Inc.
3.50%, due 10/1/22 | | | 100,000 | | | | 101,928 | |
| | | | | | | | |
| | | Principal
Amount | | | Value | |
| | | | | | | | |
Software (continued) | | | | | | | | |
Microsoft Corp.
3.00%, due 10/1/20 | | $ | 300,000 | | | $ | 324,328 | |
Oracle Corp. | | | | | | | | |
5.00%, due 7/8/19 | | | 400,000 | | | | 476,916 | |
5.25%, due 1/15/16 | | | 200,000 | | | | 224,651 | |
| | | | | | | | |
| | | | | | | 1,127,823 | |
| | | | | | | | |
Sovereign 0.1% | | | | | | | | |
Svensk Exportkredit AB | | | | | | | | |
3.25%, due 9/16/14 | | | 300,000 | | | | 312,081 | |
5.125%, due 3/1/17 | | | 200,000 | | | | 231,960 | |
| | | | | | | | |
| | | | | | | 544,041 | |
| | | | | | | | |
Telecommunications 1.8% | | | | | | | | |
America Movil S.A.B. de C.V. | | | | | | | | |
3.125%, due 7/16/22 | | | 200,000 | | | | 203,525 | |
5.75%, due 1/15/15 | | | 675,000 | | | | 730,205 | |
AT&T, Inc. | | | | | | | | |
1.60%, due 2/15/17 | | | 350,000 | | | | 355,969 | |
4.35%, due 6/15/45 (c) | | | 666,000 | | | | 649,973 | |
5.55%, due 8/15/41 | | | 100,000 | | | | 115,427 | |
6.30%, due 1/15/38 | | | 300,000 | | | | 376,757 | |
BellSouth Corp. | | | | | | | | |
6.00%, due 11/15/34 | | | 6,000 | | | | 6,792 | |
6.875%, due 10/15/31 | | | 14,000 | | | | 17,135 | |
British Telecommunications PLC
9.625%, due 12/15/30 | | | 100,000 | | | | 161,004 | |
Cisco Systems, Inc. | | | | | | | | |
4.45%, due 1/15/20 | | | 250,000 | | | | 291,204 | |
5.50%, due 2/22/16 | | | 450,000 | | | | 511,216 | |
Deutsche Telekom International Finance B.V. | | | | | |
5.25%, due 7/22/13 | | | 100,000 | | | | 101,022 | |
5.75%, due 3/23/16 | | | 325,000 | | | | 366,286 | |
6.00%, due 7/8/19 | | | 250,000 | | | | 303,353 | |
Embarq Corp.
7.995%, due 6/1/36 | | | 200,000 | | | | 220,105 | |
France Telecom S.A.
8.50%, due 3/1/31 | | | 250,000 | | | | 376,582 | |
Harris Corp.
5.00%, due 10/1/15 | | | 50,000 | | | | 55,117 | |
Motorola Solutions, Inc.
7.50%, due 5/15/25 | | | 100,000 | | | | 133,453 | |
New Cingular Wireless Services, Inc.
8.75%, due 3/1/31 | | | 100,000 | | | | 159,397 | |
Qwest Corp.
6.75%, due 12/1/21 | | | 100,000 | | | | 117,691 | |
Rogers Communications, Inc.
6.80%, due 8/15/18 | | | 225,000 | | | | 283,500 | |
Telecom Italia Capital S.A. | | | | | | | | |
4.95%, due 9/30/14 | | | 150,000 | | | | 156,516 | |
6.00%, due 9/30/34 | | | 100,000 | | | | 96,927 | |
6.375%, due 11/15/33 | | | 175,000 | | | | 176,455 | |
| | | | |
| 18 | | MainStay Indexed Bond Fund | | The notes to the financial statements are an integral part of,
and should be read in conjunction with, the financial statements. |
| | | | | | | | |
| | | Principal
Amount | | | Value | |
| | | | | | | | |
| Corporate Bonds (continued) | | | | | | | | |
Telecommunications (continued) | | | | | | | | |
Telefonica Emisones S.A.U.
7.045%, due 6/20/36 | | $ | 100,000 | | | $ | 116,414 | |
Telefonica Europe B.V.
8.25%, due 9/15/30 | | | 200,000 | | | | 250,568 | |
Verizon Communications, Inc. | | | | | | | | |
1.25%, due 11/3/14 | | | 500,000 | | | | 505,214 | |
2.45%, due 11/1/22 | | | 100,000 | | | | 96,896 | |
5.85%, due 9/15/35 | | | 300,000 | | | | 354,266 | |
6.40%, due 2/15/38 | | | 175,000 | | | | 220,308 | |
7.75%, due 12/1/30 | | | 100,000 | | | | 139,153 | |
Vodafone Group PLC | | | | | | | | |
6.15%, due 2/27/37 | | | 125,000 | | | | 153,850 | |
7.875%, due 2/15/30 | | | 100,000 | | | | 143,144 | |
| | | | | | | | |
| | | | | | | 7,945,424 | |
| | | | | | | | |
Transportation 0.5% | | | | | | | | |
Burlington Northern Santa Fe LLC | | | | | | | | |
5.75%, due 5/1/40 | | | 300,000 | | | | 370,632 | |
6.15%, due 5/1/37 | | | 175,000 | | | | 226,216 | |
6.20%, due 8/15/36 | | | 50,000 | | | | 63,867 | |
Canadian Pacific Railway Co.
7.25%, due 5/15/19 | | | 125,000 | | | | 159,201 | |
CSX Corp.
5.60%, due 5/1/17 | | | 100,000 | | | | 116,566 | |
CSX Transportation, Inc.
7.875%, due 5/15/43 | | | 100,000 | | | | 151,869 | |
FedEx Corp.
8.00%, due 1/15/19 | | | 50,000 | | | | 65,742 | |
Norfolk Southern Corp. | | | | | | | | |
2.903%, due 2/15/23 (c) | | | 106,000 | | | | 107,753 | |
4.837%, due 10/1/41 | | | 128,000 | | | | 143,463 | |
Union Pacific Corp.
4.163%, due 7/15/22 | | | 309,000 | | | | 352,507 | |
United Parcel Service, Inc. | | | | | | | | |
5.50%, due 1/15/18 | | | 100,000 | | | | 119,703 | |
6.20%, due 1/15/38 | | | 300,000 | | | | 414,560 | |
| | | | | | | | |
| | | | | | | 2,292,079 | |
| | | | | | | | |
Water 0.1% | | | | | | | | |
American Water Capital Corp. | | | | | | | | |
4.30%, due 12/1/42 | | | 200,000 | | | | 212,681 | |
6.085%, due 10/15/17 | | | 100,000 | | | | 119,436 | |
| | | | | | | | |
| | | | | | | 332,117 | |
| | | | | | | | |
Total Corporate Bonds
(Cost $98,228,374) | | | | | | | 109,458,357 | |
| | | | | | | | |
| |
| Foreign Government Bonds 2.1% | | | | | |
Foreign Governments 2.1% | | | | | | | | |
Export Development Canada
3.125%, due 4/24/14 | | | 250,000 | | | | 257,000 | |
| | | | | | | | |
| | | Principal
Amount | | | Value | |
| | | | | | | | |
Foreign Governments (continued) | | | | | | | | |
Federal Republic of Brazil | | | | | | | | |
4.875%, due 1/22/21 | | $ | 750,000 | | | $ | 893,250 | |
6.00%, due 1/17/17 | | | 1,350,000 | | | | 1,578,150 | |
Poland Government International Bond | | | | | | | | |
3.00%, due 3/17/23 | | | 150,000 | | | | 149,735 | |
5.125%, due 4/21/21 | | | 200,000 | | | | 235,006 | |
Province of Manitoba Canada
1.30%, due 4/3/17 | | | 100,000 | | | | 102,190 | |
Province of Nova Scotia
2.375%, due 7/21/15 | | | 100,000 | | | | 104,179 | |
Province of Ontario | | | | | | | | |
2.95%, due 2/5/15 | | | 250,000 | | | | 261,228 | |
4.00%, due 10/7/19 | | | 225,000 | | | | 258,442 | |
4.10%, due 6/16/14 | | | 350,000 | | | | 364,930 | |
4.95%, due 11/28/16 | | | 350,000 | | | | 402,220 | |
Province of Quebec | | | | | | | | |
5.125%, due 11/14/16 | | | 385,000 | | | | 444,290 | |
Series NJ 7.50%, due 7/15/23 | | | 302,000 | | | | 430,229 | |
Republic of Italy
6.875%, due 9/27/23 | | | 750,000 | | | | 901,305 | |
Republic of Korea
5.75%, due 4/16/14 | | | 600,000 | | | | 625,132 | |
Republic of Peru
7.35%, due 7/21/25 | | | 275,000 | | | | 399,437 | |
Republic of Poland
5.25%, due 1/15/14 | | | 100,000 | | | | 103,140 | |
United Mexican States | | | | | | | | |
5.125%, due 1/15/20 | | | 1,300,000 | | | | 1,553,500 | |
5.625%, due 1/15/17 | | | 400,000 | | | | 461,200 | |
| | | | | | | | |
Total Foreign Government Bonds
(Cost $8,722,665) | | | | | | | 9,524,563 | |
| | | | | | | | |
|
| Mortgage-Backed Securities 2.3% | |
Commercial Mortgage Loans
(Collateralized Mortgage Obligations) 2.3% | |
Banc of America Commercial Mortgage, Inc. | | | | | |
Series 2005-4, Class A3 4.891%, due 7/10/45 | | | 964,174 | | | | 964,777 | |
Bear Stearns Commercial Mortgage Securities Trust
Series 2007-PW15, Class AAB
5.315%, due 2/11/44 | | | 1,065,361 | | | | 1,076,294 | |
CD 2007-CD4 Commercial Mortgage Trust
Series 2007-CD4, Class A4
5.322%, due 12/11/49 | | | 1,000,000 | | | | 1,138,727 | |
Commercial Mortgage Trust
Series 2006-GG7, Class A4
6.061%, due 7/10/38 (d) | | | 1,000,000 | | | | 1,132,583 | |
| | | | | | |
The notes to the financial statements are an integral part of,
and should be read in conjunction with, the financial statements. | | mainstayinvestments.com | | | 19 | |
Portfolio of Investments April 30, 2013 (Unaudited) (continued)
| | | | | | | | |
| | | Principal
Amount | | | Value | |
| | | | | | | | |
| Mortgage-Backed Securities (continued) | | | | | |
Commercial Mortgage Loans
(Collateralized Mortgage Obligations) (continued) | |
GS Mortgage Securities Trust
Series 2006-GG6, Class AM
5.622%, due 4/10/38 (e) | | $ | 1,200,000 | | | $ | 1,333,048 | |
JP Morgan Chase Commercial Mortgage Securities Corp. | | | | | | | | |
Series 2003-CB7, Class A4 4.879%, due 1/12/38 (e) | | | 427,822 | | | | 434,494 | |
Series 2007-CB18, Class A4 5.44%, due 6/12/47 | | | 1,245,000 | | | | 1,422,460 | |
¨Morgan Stanley Capital I, Inc. | | | | | | | | |
Series 2006-HQ8, Class AM 5.646%, due 3/12/44 (d) | | | 1,200,000 | | | | 1,336,124 | |
Series 2006-IQ11, Class A4 5.852%, due 10/15/42 (d) | | | 1,400,000 | | | | 1,553,451 | |
| | | | | | | | |
Total Mortgage-Backed Securities
(Cost $7,974,803) | | | | | | | 10,391,958 | |
| | | | | | | | |
| | |
| Municipal Bonds 0.9% | | | | | | | | |
Arizona 0.3% | | | | | | | | |
Salt River Project Agricultural Improvement and Power District Electric System Revenue
4.839%, due 1/1/41 | | | 1,000,000 | | | | 1,196,160 | |
| | | | | | | | |
| | |
Connecticut 0.1% | | | | | | | | |
State of Connecticut, Transportation & Infrastructure Revenue
5.459%, due 11/1/30 | | | 500,000 | | | | 626,635 | |
| | | | | | | | |
| | |
Kansas 0.3% | | | | | | | | |
Kansas State Department of Transportation, Highway Revenue
4.596%, due 9/1/35 | | | 1,000,000 | | | | 1,172,380 | |
| | | | | | | | |
| | |
Texas 0.2% | | | | | | | | |
Texas Transportation Commission
5.178%, due 4/1/30 | | | 900,000 | | | | 1,133,874 | |
| | | | | | | | |
Total Municipal Bonds
(Cost $3,625,792) | | | | | | | 4,129,049 | |
| | | | | | | | |
|
| U.S. Government & Federal Agencies 68.5% | |
Federal Home Loan Bank 0.5% | | | | | | | | |
3.625%, due 10/18/13 | | | 2,000,000 | | | | 2,032,288 | |
| | | | | | | | |
|
¨Federal Home Loan Mortgage Corporation 2.7% | |
0.53%, due 11/20/15 | | | 900,000 | | | | 900,184 | |
0.875%, due 3/7/18 | | | 1,000,000 | | | | 1,003,828 | |
2.375%, due 1/13/22 | | | 1,500,000 | | | | 1,577,194 | |
| | | | | | | | |
| | | Principal
Amount | | | Value | |
| | | | | | | | |
Federal Home Loan Mortgage Corporation (continued) | |
3.75%, due 3/27/19 | | $ | 1,100,000 | | | $ | 1,270,492 | |
4.50%, due 1/15/15 | | | 2,000,000 | | | | 2,144,938 | |
4.75%, due 1/19/16 | | | 2,000,000 | | | | 2,237,848 | |
5.125%, due 10/18/16 | | | 2,430,000 | | | | 2,818,817 | |
| | | | | | | | |
| | | | | | | 11,953,301 | |
| | | | | | | | |
¨ Federal Home Loan Mortgage Corporation
(Mortgage Pass-Through Securities) 8.4% | |
2.415%, due 12/1/41 (e) | | | 958,152 | | | | 992,627 | |
2.50%, due 4/1/27 TBA (f) | | | 1,400,000 | | | | 1,460,297 | |
3.00%, due 5/1/26 TBA (f) | | | 2,600,000 | | | | 2,743,406 | |
3.00%, due 9/1/42 TBA (f) | | | 3,300,000 | | | | 3,428,391 | |
3.50%, due 4/1/26 | | | 645,663 | | | | 683,187 | |
3.50%, due 5/1/26 | | | 251,237 | | | | 265,838 | |
3.50%, due 4/1/32 | | | 819,774 | | | | 881,297 | |
3.50%, due 4/1/41 | | | 275,627 | | | | 293,298 | |
3.50%, due 1/1/42 TBA (f) | | | 2,100,000 | | | | 2,226,656 | |
3.50%, due 3/1/42 | | | 437,026 | | | | 465,044 | |
3.50%, due 4/1/42 | | | 643,978 | | | | 685,264 | |
4.00%, due 7/1/23 | | | 643,683 | | | | 683,229 | |
4.00%, due 6/1/24 | | | 294,450 | | | | 312,541 | |
4.00%, due 4/1/26 | | | 281,459 | | | | 299,278 | |
4.00%, due 2/1/31 | | | 365,182 | | | | 393,670 | |
4.00%, due 7/1/39 | | | 865,324 | | | | 924,308 | |
4.00%, due 12/1/40 | | | 1,817,600 | | | | 1,941,495 | |
4.00%, due 2/1/41 | | | 367,944 | | | | 393,025 | |
4.00%, due 5/1/42 | | | 784,224 | | | | 841,601 | |
4.50%, due 4/1/20 | | | 493,598 | | | | 526,304 | |
4.50%, due 10/1/24 | | | 186,142 | | | | 198,651 | |
4.50%, due 5/1/25 | | | 317,251 | | | | 338,768 | |
4.50%, due 7/1/30 | | | 287,440 | | | | 309,349 | |
4.50%, due 6/1/34 | | | 127,099 | | | | 136,429 | |
4.50%, due 6/1/35 | | | 168,752 | | | | 181,034 | |
4.50%, due 8/1/35 | | | 220,912 | | | | 236,991 | |
4.50%, due 7/1/39 | | | 19,647 | | | | 21,040 | |
4.50%, due 8/1/39 | | | 390,787 | | | | 418,497 | |
4.50%, due 1/1/40 | | | 881,196 | | | | 943,680 | |
4.50%, due 8/1/40 | | | 2,064,797 | | | | 2,212,498 | |
4.50%, due 2/1/41 | | | 15,694 | | | | 16,848 | |
5.00%, due 1/1/25 | | | 497,549 | | | | 528,729 | |
5.00%, due 8/1/30 | | | 292,655 | | | | 324,535 | |
5.00%, due 8/1/35 | | | 1,686,322 | | | | 1,816,649 | |
5.00%, due 6/1/37 | | | 1,420,670 | | | | 1,525,139 | |
5.00%, due 3/1/40 | | | 367,305 | | | | 397,758 | |
5.00%, due 2/1/41 | | | 572,880 | | | | 621,094 | |
5.171%, due 4/1/39 (e) | | | 341,695 | | | | 367,599 | |
5.50%, due 2/1/18 | | | 96,181 | | | | 102,168 | |
5.50%, due 3/1/23 | | | 52,194 | | | | 56,144 | |
5.50%, due 6/1/23 | | | 127,281 | | | | 136,915 | |
5.50%, due 11/1/27 | | | 177,881 | | | | 192,685 | |
5.50%, due 9/1/35 | | | 229,140 | | | | 248,854 | |
5.50%, due 4/1/37 | | | 1,399,861 | | | | 1,511,549 | |
5.50%, due 11/1/37 | | | 163,547 | | | | 176,596 | |
| | | | |
| 20 | | MainStay Indexed Bond Fund | | The notes to the financial statements are an integral part of,
and should be read in conjunction with, the financial statements. |
| | | | | | | | |
| | | Principal
Amount | | | Value | |
| | | | | | | | |
| U.S. Government & Federal Agencies (continued) | |
Federal Home Loan Mortgage Corporation
(Mortgage Pass-Through Securities) (continued) | |
5.50%, due 4/1/38 | | $ | 237,395 | | | $ | 257,820 | |
5.50%, due 8/1/38 | | | 240,814 | | | | 260,027 | |
6.00%, due 8/1/17 | | | 85,708 | | | | 89,760 | |
6.00%, due 6/1/21 | | | 42,680 | | | | 46,888 | |
6.00%, due 9/1/21 | | | 79,402 | | | | 87,230 | |
6.00%, due 11/1/22 | | | 63,251 | | | | 69,814 | |
6.00%, due 4/1/36 | | | 251,565 | | | | 274,513 | |
6.00%, due 8/1/36 | | | 108,104 | | | | 117,965 | |
6.00%, due 2/1/37 | | | 385,517 | | | | 420,684 | |
6.00%, due 12/1/39 | | | 362,258 | | | | 394,851 | |
6.00%, due 5/1/40 | | | 887,796 | | | | 977,382 | |
6.098%, due 10/1/36 (e) | | | 163,192 | | | | 178,156 | |
6.50%, due 6/1/14 | | | 1,012 | | | | 1,023 | |
6.50%, due 4/1/17 | | | 3,074 | | | | 3,275 | |
6.50%, due 5/1/17 | | | 16,068 | | | | 17,066 | |
6.50%, due 11/1/25 | | | 13,382 | | | | 14,857 | |
6.50%, due 5/1/26 | | | 2,337 | | | | 2,417 | |
6.50%, due 3/1/27 | | | 6,663 | | | | 7,523 | |
6.50%, due 5/1/31 | | | 9,193 | | | | 10,673 | |
6.50%, due 8/1/31 | | | 4,777 | | | | 5,546 | |
6.50%, due 1/1/32 | | | 39,657 | | | | 45,132 | |
6.50%, due 3/1/32 | | | 37,437 | | | | 43,250 | |
6.50%, due 4/1/32 | | | 18,696 | | | | 21,599 | |
6.50%, due 7/1/32 | | | 27,747 | | | | 32,055 | |
6.50%, due 1/1/34 | | | 38,353 | | | | 40,891 | |
6.50%, due 1/1/37 | | | 160,012 | | | | 182,186 | |
6.50%, due 9/1/37 | | | 223,456 | | | | 254,593 | |
7.00%, due 4/1/26 | | | 4,481 | | | | 5,315 | |
7.00%, due 7/1/26 | | | 447 | | | | 530 | |
7.00%, due 12/1/27 | | | 6,205 | | | | 7,396 | |
7.00%, due 1/1/30 | | | 3,877 | | | | 4,603 | |
7.00%, due 3/1/31 | | | 30,863 | | | | 36,406 | |
7.00%, due 10/1/31 | | | 9,492 | | | | 11,198 | |
7.00%, due 3/1/32 | | | 38,613 | | | | 45,549 | |
7.00%, due 9/1/33 | | | 198,206 | | | | 231,186 | |
7.00%, due 11/1/36 | | | 60,890 | | | | 70,272 | |
7.00%, due 12/1/37 | | | 138,559 | | | | 160,023 | |
7.50%, due 1/1/16 | | | 1,527 | | | | 1,601 | |
7.50%, due 1/1/26 | | | 1,184 | | | | 1,416 | |
7.50%, due 2/1/32 | | | 27,171 | | | | 33,432 | |
8.00%, due 7/1/26 | | | 1,889 | | | | 2,043 | |
| | | | | | | | |
| | | | | | | 37,929,101 | |
| | | | | | | | |
¨ Federal National Mortgage Association 1.7% | |
1.00%, due 12/28/17 | | | 650,000 | | | | 650,846 | |
2.625%, due 11/20/14 | | | 500,000 | | | | 518,892 | |
3.00%, due 9/16/14 | | | 3,000,000 | | | | 3,117,582 | |
5.375%, due 6/12/17 | | | 2,100,000 | | | | 2,506,906 | |
6.21%, due 8/6/38 | | | 475,000 | | | | 711,616 | |
| | | | | | | | |
| | | | | | | 7,505,842 | |
| | | | | | | | |
| | | | | | | | |
| | | Principal
Amount | | | Value | |
| | | | | | | | |
¨ Federal National Mortgage Association
(Mortgage Pass-Through Securities) 13.7% | |
2.308%, due 12/1/41 (e) | | $ | 1,713,003 | | | $ | 1,789,659 | |
2.50%, due 8/1/27 TBA (f) | | | 3,100,000 | | | | 3,241,438 | |
3.00%, due 11/1/26 TBA (f) | | | 1,500,000 | | | | 1,584,141 | |
3.00%, due 10/1/42 TBA (f) | | | 5,800,000 | | | | 6,050,125 | |
3.467%, due 8/1/40 (e) | | | 414,873 | | | | 440,974 | |
3.50%, due 11/1/25 | | | 1,914,086 | | | | 2,034,429 | |
3.50%, due 5/1/31 | | | 548,603 | | | | 585,419 | |
3.50%, due 12/1/40 | | | 708,470 | | | | 755,572 | |
3.50%, due 1/1/41 | | | 395,107 | | | | 421,376 | |
3.50%, due 2/1/41 | | | 395,797 | | | | 422,112 | |
3.50%, due 12/1/41 | | | 1,013,485 | | | | 1,080,833 | |
3.50%, due 1/1/42 TBA (f) | | | 3,400,000 | | | | 3,614,094 | |
3.50%, due 3/1/42 | | | 759,564 | | | | 810,064 | |
4.00%, due 3/1/22 | | | 211,563 | | | | 228,294 | |
4.00%, due 2/1/25 | | | 741,058 | | | | 792,253 | |
4.00%, due 3/1/25 | | | 916,872 | | | | 982,504 | |
4.00%, due 6/1/30 | | | 140,369 | | | | 151,345 | |
4.00%, due 1/1/31 | | | 297,619 | | | | 320,891 | |
4.00%, due 6/1/39 | | | 970,099 | | | | 1,038,679 | |
4.00%, due 12/1/39 | | | 865,679 | | | | 926,634 | |
4.00%, due 7/1/40 | | | 561,163 | | | | 600,708 | |
4.00%, due 9/1/40 | | | 2,898,942 | | | | 3,103,878 | |
4.00%, due 3/1/41 | | | 1,086,409 | | | | 1,167,700 | |
4.00%, due 1/1/42 | | | 963,476 | | | | 1,032,039 | |
4.50%, due 5/1/19 | | | 11,623 | | | | 12,492 | |
4.50%, due 11/1/22 | | | 12,644 | | | | 13,597 | |
4.50%, due 2/1/23 | | | 60,096 | | | | 64,494 | |
4.50%, due 3/1/23 | | | 44,833 | | | | 48,114 | |
4.50%, due 6/1/23 | | | 450,157 | | | | 483,102 | |
4.50%, due 4/1/24 | | | 251,604 | | | | 273,084 | |
4.50%, due 3/1/30 | | | 362,377 | | | | 392,257 | |
4.50%, due 6/1/39 TBA (f) | | | 5,100,000 | | | | 5,494,453 | |
4.50%, due 3/1/40 | | | 2,047,157 | | | | 2,263,527 | |
4.50%, due 4/1/41 | | | 443,729 | | | | 473,850 | |
4.50%, due 7/1/41 | | | 1,730,043 | | | | 1,869,106 | |
5.00%, due 3/1/21 | | | 12,259 | | | | 13,169 | |
5.00%, due 6/1/22 | | | 120,357 | | | | 129,291 | |
5.00%, due 4/1/23 | | | 114,956 | | | | 123,435 | |
5.00%, due 7/1/23 | | | 102,411 | | | | 109,965 | |
5.00%, due 8/1/23 | | | 183,513 | | | | 197,536 | |
5.00%, due 1/1/24 | | | 145,240 | | | | 155,953 | |
5.00%, due 11/1/29 | | | 267,322 | | | | 289,619 | |
5.00%, due 7/1/30 | | | 197,222 | | | | 213,549 | |
5.00%, due 7/1/35 | | | 427,253 | | | | 465,016 | |
5.00%, due 11/1/35 | | | 287,634 | | | | 312,614 | |
5.00%, due 2/1/36 | | | 673,621 | | | | 732,121 | |
5.00%, due 7/1/36 | | | 378,085 | | | | 411,510 | |
5.00%, due 7/1/37 | | | 1,183,678 | | | | 1,289,804 | |
5.00%, due 8/1/38 | | | 553,120 | | | | 601,153 | |
5.00%, due 1/1/39 | | | 312,212 | | | | 347,230 | |
| | | | | | |
The notes to the financial statements are an integral part of,
and should be read in conjunction with, the financial statements. | | mainstayinvestments.com | | | 21 | |
Portfolio of Investments April 30, 2013 (Unaudited) (continued)
| | | | | | | | |
| | | Principal
Amount | | | Value | |
| | | | | | | | |
| U.S. Government & Federal Agencies (continued) | |
Federal National Mortgage Association
(Mortgage Pass-Through Securities) (continued) | |
5.00%, due 7/1/39 | | $ | 547,309 | | | $ | 592,617 | |
5.00%, due 9/1/40 | | | 192,395 | | | | 211,208 | |
5.50%, due 8/1/17 | | | 12,274 | | | | 13,127 | |
5.50%, due 7/1/22 | | | 214,571 | | | | 233,786 | |
5.50%, due 11/1/23 | | | 44,601 | | | | 48,595 | |
5.50%, due 4/1/30 | | | 266,033 | | | | 292,596 | |
5.50%, due 9/1/33 | | | 232,049 | | | | 255,059 | |
5.50%, due 12/1/34 | | | 479,383 | | | | 527,368 | |
5.50%, due 5/1/35 | | | 176,619 | | | | 193,194 | |
5.50%, due 6/1/35 | | | 74,641 | | | | 81,646 | |
5.50%, due 8/1/35 | | | 69,150 | | | | 75,639 | |
5.50%, due 4/1/36 | | | 166,529 | | | | 182,157 | |
5.50%, due 11/1/36 | | | 134,183 | | | | 146,105 | |
5.50%, due 3/1/37 | | | 691,506 | | | | 752,081 | |
5.50%, due 4/1/37 | | | 95,107 | | | | 103,438 | |
5.50%, due 8/1/37 | | | 965,312 | | | | 1,059,524 | |
5.50%, due 3/1/38 | | | 1,121,617 | | | | 1,219,868 | |
5.50%, due 12/1/38 | | | 290,829 | | | | 318,122 | |
5.50%, due 2/1/39 | | | 158,761 | | | | 173,660 | |
5.50%, due 7/1/40 | | | 272,326 | | | | 301,542 | |
6.00%, due 6/1/16 | | | 9,895 | | | | 10,475 | |
6.00%, due 7/1/16 | | | 6,562 | | | | 6,946 | |
6.00%, due 9/1/16 | | | 4,227 | | | | 4,475 | |
6.00%, due 9/1/17 | | | 5,040 | | | | 5,404 | |
6.00%, due 7/1/36 | | | 266,100 | | | | 291,538 | |
6.00%, due 12/1/36 | | | 85,163 | | | | 93,304 | |
6.00%, due 4/1/37 | | | 231,252 | | | | 253,359 | |
6.00%, due 7/1/37 | | | 546,659 | | | | 598,234 | |
6.00%, due 8/1/37 | | | 141,924 | | | | 155,314 | |
6.00%, due 12/1/37 | | | 314,131 | | | | 343,768 | |
6.00%, due 2/1/38 | | | 478,117 | | | | 523,225 | |
6.00%, due 1/1/39 | | | 953,775 | | | | 1,044,134 | |
6.50%, due 6/1/15 | | | 1,772 | | | | 1,800 | |
6.50%, due 7/1/32 | | | 4,850 | | | | 5,744 | |
6.50%, due 8/1/32 | | | 86,449 | | | | 101,458 | |
6.50%, due 8/1/35 | | | 110,899 | | | | 131,708 | |
6.50%, due 9/1/35 | | | 2,383 | | | | 2,830 | |
6.50%, due 7/1/36 | | | 229,505 | | | | 257,454 | |
6.50%, due 8/1/36 | | | 58,409 | | | | 65,092 | |
6.50%, due 9/1/36 | | | 130,509 | | | | 145,426 | |
6.50%, due 10/1/36 | | | 83,683 | | | | 95,897 | |
6.50%, due 11/1/36 | | | 73,998 | | | | 83,515 | |
6.50%, due 8/1/37 | | | 5,492 | | | | 6,274 | |
6.50%, due 10/1/37 | | | 4,062 | | | | 4,528 | |
6.50%, due 11/1/37 | | | 57,769 | | | | 64,903 | |
6.50%, due 12/1/37 | | | 75,850 | | | | 85,159 | |
6.50%, due 2/1/38 | | | 206,769 | | | | 239,124 | |
7.00%, due 9/1/37 | | | 56,299 | | | | 67,089 | |
7.00%, due 10/1/37 | | | 4,297 | | | | 4,862 | |
| | | | | | | | |
| | | Principal
Amount | | | Value | |
| | | | | | | | |
Federal National Mortgage Association
(Mortgage Pass-Through Securities) (continued) | |
7.00%, due 11/1/37 | | $ | 171,231 | | | $ | 204,048 | |
7.50%, due 7/1/30 | | | 9,546 | | | | 10,558 | |
7.50%, due 7/1/31 | | | 35,969 | | | | 41,890 | |
7.50%, due 8/1/31 | | | 458 | | | | 478 | |
8.00%, due 1/1/25 | | | 166 | | | | 171 | |
8.00%, due 6/1/25 | | | 169 | | | | 204 | |
8.00%, due 9/1/25 | | | 862 | | | | 1,008 | |
8.00%, due 9/1/26 | | | 4,572 | | | | 5,554 | |
8.00%, due 10/1/26 | | | 762 | | | | 812 | |
8.00%, due 11/1/26 | | | 912 | | | | 1,060 | |
8.00%, due 4/1/27 | | | 1,608 | | | | 1,919 | |
8.00%, due 6/1/27 | | | 17,385 | | | | 19,177 | |
8.00%, due 12/1/27 | | | 4,087 | | | | 4,132 | |
8.00%, due 1/1/28 | | | 28,348 | | | | 33,026 | |
| | | | | | | | |
| | | | | | | 61,753,610 | |
| | | | | | | | |
¨ Government National Mortgage Association
(Mortgage Pass-Through Securities) 7.4% | |
3.00%, due 9/1/42 TBA (f) | | | 900,000 | | | | 956,172 | |
3.00%, due 10/1/42 TBA (f) | | | 2,600,000 | | | | 2,762,906 | |
3.50%, due 11/1/41 TBA (f) | | | 1,700,000 | | | | 1,851,672 | |
3.50%, due 4/1/42 TBA (f) | | | 3,700,000 | | | | 4,011,032 | |
3.50%, due 4/15/42 | | | 408,088 | | | | 445,228 | |
4.00%, due 9/15/25 | | | 374,742 | | | | 404,557 | |
4.00%, due 8/1/40 TBA (f) | | | 400,000 | | | | 437,875 | |
4.00%, due 12/15/41 | | | 1,405,149 | | | | 1,540,434 | |
4.00%, due 1/20/42 | | | 3,247,214 | | | | 3,534,436 | |
4.50%, due 11/15/24 | | | 315,684 | | | | 342,832 | |
4.50%, due 4/15/39 | | | 1,330,262 | | | | 1,451,819 | |
4.50%, due 5/20/39 | | | 2,154,609 | | | | 2,365,678 | |
4.50%, due 10/20/39 | | | 309,939 | | | | 339,678 | |
4.50%, due 6/20/40 | | | 333,572 | | | | 369,335 | |
4.50%, due 7/15/40 | | | 289,514 | | | | 317,055 | |
4.50%, due 9/15/40 | | | 1,048,526 | | | | 1,161,705 | |
4.50%, due 10/20/40 | | | 320,650 | | | | 355,027 | |
4.50%, due 7/20/41 | | | 529,807 | | | | 584,288 | |
4.50%, due 9/20/41 | | | 346,940 | | | | 384,136 | |
5.00%, due 4/20/33 | | | 103,626 | | | | 114,252 | |
5.00%, due 8/15/33 | | | 46,484 | | | | 51,414 | |
5.00%, due 2/15/36 | | | 351,664 | | | | 385,447 | |
5.00%, due 6/20/36 | | | 9,202 | | | | 10,131 | |
5.00%, due 5/15/39 | | | 362,053 | | | | 396,381 | |
5.00%, due 8/15/39 | | | 630,422 | | | | 702,016 | |
5.00%, due 9/15/39 | | | 625,056 | | | | 685,884 | |
5.00%, due 5/15/40 | | | 133,394 | | | | 147,084 | |
5.00%, due 9/20/40 | | | 2,397,547 | | | | 2,649,554 | |
5.50%, due 3/15/33 | | | 652,790 | | | | 718,438 | |
5.50%, due 7/15/34 | | | 219,613 | | | | 240,742 | |
5.50%, due 7/20/34 | | | 100,896 | | | | 111,689 | |
5.50%, due 9/15/35 | | | 225,741 | | | | 247,921 | |
| | | | |
| 22 | | MainStay Indexed Bond Fund | | The notes to the financial statements are an integral part of,
and should be read in conjunction with, the financial statements. |
| | | | | | | | |
| | | Principal
Amount | | | Value | |
| | | | | | | | |
| U.S. Government & Federal Agencies (continued) | |
Government National Mortgage Association
(Mortgage Pass-Through Securities) (continued) | |
5.50%, due 12/20/35 | | $ | 214,291 | | | $ | 236,265 | |
5.50%, due 1/20/39 | | | 449,873 | | | | 493,755 | |
6.00%, due 3/20/29 | | | 28,282 | | | | 32,190 | |
6.00%, due 1/15/32 | | | 61,382 | | | | 70,101 | |
6.00%, due 12/15/32 | | | 18,531 | | | | 21,164 | |
6.00%, due 3/20/33 | | | 144,285 | | | | 170,680 | |
6.00%, due 2/15/34 | | | 148,569 | | | | 168,697 | |
6.00%, due 1/20/35 | | | 75,757 | | | | 89,873 | |
6.00%, due 6/15/35 | | | 48,555 | | | | 55,109 | |
6.00%, due 9/15/35 | | | 170,540 | | | | 194,231 | |
6.00%, due 9/20/40 | | | 552,915 | | | | 628,797 | |
6.50%, due 3/20/31 | | | 17,964 | | | | 21,734 | |
6.50%, due 1/15/32 | | | 25,517 | | | | 30,187 | |
6.50%, due 6/15/35 | | | 1,626 | | | | 1,862 | |
6.50%, due 1/15/36 | | | 149,965 | | | | 162,671 | |
6.50%, due 9/15/36 | | | 60,644 | | | | 70,539 | |
6.50%, due 9/15/37 | | | 89,311 | | | | 104,296 | |
6.50%, due 10/15/37 | | | 83,011 | | | | 96,005 | |
6.50%, due 11/15/38 | | | 328,495 | | | | 378,866 | |
7.00%, due 2/15/26 | | | 564 | | | | 670 | |
7.00%, due 6/15/29 | | | 547 | | | | 562 | |
7.00%, due 12/15/29 | | | 3,487 | | | | 4,285 | |
7.00%, due 5/15/31 | | | 2,317 | | | | 2,763 | |
7.00%, due 8/15/31 | | | 5,681 | | | | 6,777 | |
7.00%, due 8/20/31 | | | 26,780 | | | | 33,324 | |
7.00%, due 8/15/32 | | | 38,982 | | | | 45,371 | |
7.50%, due 3/15/26 | | | 1,706 | | | | 1,712 | |
7.50%, due 10/15/26 | | | 1,735 | | | | 1,828 | |
7.50%, due 11/15/26 | | | 1,230 | | | | 1,291 | |
7.50%, due 1/15/30 | | | 14,512 | | | | 15,710 | |
7.50%, due 10/15/30 | | | 7,036 | | | | 8,129 | |
7.50%, due 3/15/32 | | | 21,567 | | | | 26,855 | |
8.00%, due 6/15/26 | | | 190 | | | | 223 | |
8.00%, due 10/15/26 | | | 346 | | | | 401 | |
8.00%, due 11/15/26 | | | 1,547 | | | | 1,570 | |
8.00%, due 5/15/27 | | | 121 | | | | 124 | |
8.00%, due 7/15/27 | | | 651 | | | | 756 | |
8.00%, due 9/15/27 | | | 352 | | | | 409 | |
8.00%, due 11/15/30 | | | 19,341 | | | | 23,021 | |
8.50%, due 7/15/26 | | | 1,015 | | | | 1,200 | |
8.50%, due 11/15/26 | | | 5,717 | | | | 5,882 | |
| | | | | | | | |
| | | | | | | 33,286,703 | |
| | | | | | | | |
¨ United States Treasury Bonds 4.8% | | | | | | | | |
2.75%, due 8/15/42 | | | 2,175,000 | | | | 2,112,130 | |
2.75%, due 11/15/42 | | | 1,270,000 | | | | 1,231,900 | |
3.75%, due 8/15/41 | | | 1,860,000 | | | | 2,193,928 | |
4.25%, due 11/15/40 | | | 2,000,000 | | | | 2,560,312 | |
4.375%, due 5/15/41 | | | 800,000 | | | | 1,045,000 | |
4.75%, due 2/15/37 | | | 3,100,000 | | | | 4,231,016 | |
4.75%, due 2/15/41 | | | 2,755,000 | | | | 3,806,203 | |
| | | | | | | | |
| | | Principal
Amount | | | Value | |
| | | | | | | | |
United States Treasury Bonds (continued) | | | | | |
5.25%, due 11/15/28 | | $ | 1,900,000 | | | $ | 2,636,843 | |
6.75%, due 8/15/26 | | | 1,000,000 | | | | 1,547,188 | |
| | | | | | | | |
| | | | | | | 21,364,520 | |
| | | | | | | | |
¨ United States Treasury Notes 29.3% | | | | | | | | |
0.25%, due 8/31/14 | | | 1,000,000 | | | | 1,001,055 | |
0.25%, due 11/30/14 | | | 4,650,000 | | | | 4,654,176 | |
0.25%, due 2/28/15 | | | 2,800,000 | | | | 2,802,187 | |
0.25%, due 8/15/15 | | | 11,200,000 | | | | 11,200,874 | |
0.25%, due 9/15/15 | | | 10,000,000 | | | | 9,999,220 | |
0.25%, due 10/15/15 | | | 2,750,000 | | | | 2,749,142 | |
0.375%, due 11/15/15 | | | 5,300,000 | | | | 5,313,250 | |
0.375%, due 1/15/16 | | | 16,600,000 | | | | 16,637,616 | |
0.375%, due 3/15/16 | | | 5,600,000 | | | | 5,611,810 | |
0.625%, due 5/31/17 | | | 1,220,000 | | | | 1,226,005 | |
0.75%, due 6/30/17 | | | 6,750,000 | | | | 6,813,281 | |
0.75%, due 12/31/17 | | | 14,475,000 | | | | 14,565,469 | |
0.75%, due 2/28/18 | | | 3,900,000 | | | | 3,920,413 | |
1.00%, due 9/30/19 | | | 7,200,000 | | | | 7,209,562 | |
1.125%, due 12/31/19 | | | 1,000,000 | | | | 1,006,016 | |
1.125%, due 4/30/20 | | | 4,000,000 | | | | 4,003,752 | |
1.25%, due 9/30/15 | | | 4,695,000 | | | | 4,807,971 | |
1.375%, due 9/30/18 | | | 2,950,000 | | | | 3,046,565 | |
1.375%, due 1/31/20 | | | 1,000,000 | | | | 1,021,250 | |
1.875%, due 9/30/17 | | | 3,000,000 | | | | 3,172,500 | |
2.00%, due 2/15/23 | | | 8,345,000 | | | | 8,588,832 | |
2.25%, due 7/31/18 | | | 2,000,000 | | | | 2,157,656 | |
2.625%, due 11/15/20 | | | 3,236,000 | | | | 3,567,690 | |
3.375%, due 11/15/19 | | | 5,855,000 | | | | 6,752,003 | |
| | | | | | | | |
| | | | | | | 131,828,295 | |
| | | | | | | | |
Total U.S. Government & Federal Agencies
(Cost $298,586,043) | | | | | | | 307,653,660 | |
| | | | | | | | |
| | |
| Yankee Bonds 0.7% (g) | | | | | | | | |
Banks 0.0%‡ | | | | | | | | |
Westpac Banking Corp.
4.625%, due 6/1/18 | | | 50,000 | | | | 55,343 | |
| | | | | | | | |
| | |
Mining 0.0%‡ | | | | | | | | |
Xstrata Canada Corp.
5.50%, due 6/15/17 | | | 50,000 | | | | 56,716 | |
| | | | | | | | |
| | |
Multi-National 0.2% | | | | | | | | |
Inter-American Development Bank
6.80%, due 10/15/25 | | | 604,000 | | | | 867,154 | |
| | | | | | | | |
| | |
Oil & Gas 0.3% | | | | | | | | |
Canadian Natural Resources, Ltd. | | | | | | | | |
5.85%, due 2/1/35 | | | 155,000 | | | | 182,576 | |
6.50%, due 2/15/37 | | | 75,000 | | | | 95,443 | |
Encana Corp.
6.50%, due 8/15/34 | | | 85,000 | | | | 102,561 | |
| | | | | | |
The notes to the financial statements are an integral part of,
and should be read in conjunction with, the financial statements. | | mainstayinvestments.com | | | 23 | |
Portfolio of Investments April 30, 2013 (Unaudited) (continued)
| | | | | | | | |
| | | Principal
Amount | | | Value | |
| | | | | | | | |
| Yankee Bonds (continued) | | | | | | | | |
Oil & Gas (continued) | | | | | | | | |
Petro-Canada | | | | | | | | |
4.00%, due 7/15/13 | | $ | 100,000 | | | $ | 100,709 | |
6.05%, due 5/15/18 | | | 325,000 | | | | 392,432 | |
Statoil ASA
7.75%, due 6/15/23 | | | 125,000 | | | | 178,838 | |
Suncor Energy, Inc. | | | | | | | | |
6.10%, due 6/1/18 | | | 100,000 | | | | 121,273 | |
6.50%, due 6/15/38 | | | 100,000 | | | | 129,687 | |
Talisman Energy, Inc. | | | | | | | | |
5.125%, due 5/15/15 | | | 50,000 | | | | 53,553 | |
6.25%, due 2/1/38 | | | 55,000 | | | | 64,676 | |
| | | | | | | | |
| | | | | | | 1,421,748 | |
| | | | | | | | |
Oil & Gas Services 0.0%‡ | | | | | | | | |
Weatherford International, Ltd.
4.95%, due 10/15/13 | | | 100,000 | | | | 101,736 | |
| | | | | | | | |
| | |
Pipelines 0.2% | | | | | | | | |
TransCanada PipeLines, Ltd. | | | | | | | | |
4.875%, due 1/15/15 | | | 380,000 | | | | 407,358 | |
5.85%, due 3/15/36 | | | 150,000 | | | | 187,365 | |
| | | | | | | | |
| | | | | | | 594,723 | |
| | | | | | | | |
Transportation 0.0%‡ | | | | | | | | |
Canadian National Railway Co.
6.20%, due 6/1/36 | | | 100,000 | | | | 138,340 | |
| | | | | | | | |
| | |
Water 0.0%‡ | | | | | | | | |
United Utilities PLC
5.375%, due 2/1/19 | | | 100,000 | | | | 112,285 | |
| | | | | | | | |
Total Yankee Bonds
(Cost $2,782,827) | | | | | | | 3,348,045 | |
| | | | | | | | |
Total Long-Term Bonds
(Cost $420,726,294) | | | | | | | 445,213,239 | |
| | | | | | | | |
|
| Short-Term Investments 8.9% | |
Financial Company Commercial Paper 0.4% | | | | | |
PACCAR Financial Corp.
0.101%, due 5/13/13 | | | 2,000,000 | | | | 1,999,933 | |
| | | | | | | | |
Total Financial Company Commercial Paper
(Cost $1,999,933) | | | | | | | 1,999,933 | |
| | | | | | | | |
| | |
Other Commercial Paper 6.6% | | | | | | | | |
Henkel of America, Inc.
0.162%, due 5/3/13 (c)(h) | | | 4,000,000 | | | | 3,999,964 | |
John Deere Bank S.A.
0.122%, due 5/13/13 (c)(h) | | | 5,000,000 | | | | 4,999,800 | |
Kimberly-Clark Worldwide, Inc.
0.091%, due 5/15/13 (c)(h) | | | 5,000,000 | | | | 4,999,825 | |
| | | | | | | | |
| | | Principal
Amount | | | Value | |
| | | | | | | | |
Other Commercial Paper (continued) | | | | | | | | |
Oglethorpe Power Corp.
0.294%, due 5/16/13 (c)(h) | | $ | 5,000,000 | | | $ | 4,999,396 | |
Precision Castparts Corp.
0.122%, due 5/20/13 (c)(h) | | | 4,000,000 | | | | 3,999,746 | |
Province of Ontario
0.122%, due 5/15/13 (h) | | | 1,440,000 | | | | 1,439,933 | |
Southern Co.
0.203%, due 5/13/13 (c)(h) | | | 5,000,000 | | | | 4,999,667 | |
| | | | | | | | |
Total Other Commercial Paper
(Cost $29,438,331) | | | | | | | 29,438,331 | |
| | | | | | | | |
|
Repurchase Agreement 1.9% | |
TD Securities (U.S.A.) LLC
0.14%, dated 4/30/13
due 5/1/13
Proceeds at Maturity $8,568,033 (Collateralized by a Federal National Mortgage Association security with a rate of 4.00% and maturity date of 5/1/42, with a Principal Amount of $8,453,719 and a Market Value of $8,739,360) | | | 8,568,000 | | | | 8,568,000 | |
| | | | | | | | |
Total Repurchase Agreement
(Cost $8,568,000) | | | | | | | 8,568,000 | |
| | | | | | | | |
Total Short-Term Investments
(Cost $40,006,264) | | | | | | | 40,006,264 | |
| | | | | | | | |
Total Investments
(Cost $460,732,558) (i) | | | 108.0 | % | | | 485,219,503 | |
Other Assets, Less Liabilities | | | (8.0 | ) | | | (35,866,443 | ) |
Net Assets | | | 100.0 | % | | $ | 449,353,060 | |
| ‡ | Less than one-tenth of a percent. |
| (a) | Subprime mortgage investment and other asset-backed securities. The total market value of these securities as of April 30, 2013 is $631,879, which represents 0.1% of the Fund’s net assets. |
| (b) | Step coupon—Rate shown is the rate in effect as of April 30, 2013. |
| (c) | May be sold to institutional investors only under Rule 144A or securities offered pursuant to Section 4(a)(2) of the Securities Act of 1933, as amended. |
| (d) | Collateral strip rate—Bond whose interest is based on the weighted net interest rate of the collateral. Coupon rate adjusts periodically based on a predetermined schedule. Rate shown is the rate in effect as of April 30, 2013. |
| (e) | Floating rate—Rate shown is the rate in effect as of April 30, 2013. |
| (f) | TBA—Securities purchased on a forward commitment basis with an approximate principal amount and maturity date. The actual principal amount and maturity date will be determined upon settlement. The market value of these securities as of April 30, 2013 is $39,862,658, which represents 8.9% of the Fund’s net assets. All or a portion of these securities were acquired under a mortgage dollar roll agreement. |
| | | | |
| 24 | | MainStay Indexed Bond Fund | | The notes to the financial statements are an integral part of,
and should be read in conjunction with, the financial statements. |
| (g) | Yankee Bond—Dollar-denominated bond issued in the United States by a foreign bank or corporation. |
| (h) | Interest rate presented is yield to maturity. |
| (i) | As of April 30, 2013, cost is $460,740,263 for federal income tax purposes and net unrealized appreciation is as follows: |
| | | | |
Gross unrealized appreciation | | $ | 24,824,516 | |
Gross unrealized depreciation | | | (345,276 | ) |
| | | | |
Net unrealized appreciation | | $ | 24,479,240 | |
| | | | |
The following is a summary of the fair valuations according to the inputs used as of April 30, 2013, for valuing the Fund’s assets.
Asset Valuation Inputs
| | | | | | | | | | | | | | | | |
Description | | Quoted
Prices in
Active
Markets for
Identical
Assets
(Level 1) | | | Significant
Other
Observable
Inputs (Level 2) | | | Significant
Unobservable
Inputs
(Level 3) | | | Total | |
| Investments in Securities (a) | | | | | | | | | | | | | | | | |
| Long-Term Bonds | | | | | | | | | | | | | | | | |
Asset-Backed Securities | | $ | — | | | $ | 707,607 | | | $ | — | | | $ | 707,607 | |
Corporate Bonds | | | — | | | | 109,458,357 | | | | — | | | | 109,458,357 | |
Foreign Government Bonds | | | — | | | | 9,524,563 | | | | — | | | | 9,524,563 | |
Mortgage-Backed Securities | | | — | | | | 10,391,958 | | | | — | | | | 10,391,958 | |
Municipal Bonds | | | — | | | | 4,129,049 | | | | — | | | | 4,129,049 | |
U.S. Government & Federal Agencies | | | — | | | | 307,653,660 | | | | — | | | | 307,653,660 | |
Yankee Bonds | | | — | | | | 3,348,045 | | | | — | | | | 3,348,045 | |
| | | | | | | | | | | | | | | | |
| Total Long-Term Bonds | | | — | | | | 445,213,239 | | | | — | | | | 445,213,239 | |
| | | | | | | | | | | | | | | | |
| Short-Term Investments | | | | | | | | | | | | | | | | |
Financial Company Commercial Paper | | | — | | | | 1,999,933 | | | | — | | | | 1,999,933 | |
Other Commercial Paper | | | — | | | | 29,438,331 | | | | — | | | | 29,438,331 | |
Repurchase Agreement | | | — | | | | 8,568,000 | | | | — | | | | 8,568,000 | |
| | | | | | | | | | | | | | | | |
| Total Short-Term Investments | | | — | | | | 40,006,264 | | | | — | | | | 40,006,264 | |
| | | | | | | | | | | | | | | | |
| Total Investments in Securities | | $ | — | | | $ | 485,219,503 | | | $ | — | | | $ | 485,219,503 | |
| | | | | | | | | | | | | | | | |
| (a) | For a complete listing of investments and their industries, see the Portfolio of Investments. |
The Fund recognizes transfers between the levels as of the beginning of the period.
For the period ended April 30, 2013, the Fund did not have any transfers between Level 1 and Level 2 fair value measurements. (See Note 2)
As of April 30, 2013, the Fund did not hold any investments with significant unobservable inputs (Level 3). (See Note 2)
| | | | | | |
The notes to the financial statements are an integral part of,
and should be read in conjunction with, the financial statements. | | mainstayinvestments.com | | | 25 | |
Statement of Assets and Liabilities as of April 30, 2013 (Unaudited)
| | | | |
| Assets | |
Investment in securities, at value (identified cost $460,732,558) | | $ | 485,219,503 | |
Cash | | | 745 | |
Receivables: | | | | |
Investment securities sold | | | 25,238,924 | |
Interest | | | 2,483,503 | |
Fund shares sold | | | 525,468 | |
Other assets | | | 31,037 | |
| | | | |
Total assets | | | 513,499,180 | |
| | | | |
| |
| Liabilities | | | | |
Payables: | | | | |
Investment securities purchased | | | 63,382,548 | |
Fund shares redeemed | | | 409,280 | |
Transfer agent (See Note 3) | | | 150,501 | |
Manager (See Note 3) | | | 77,687 | |
Professional fees | | | 31,150 | |
Shareholder communication | | | 21,879 | |
NYLIFE Distributors (See Note 3) | | | 16,127 | |
Custodian | | | 13,185 | |
Trustees | | | 1,165 | |
Accrued expenses | | | 3,785 | |
Dividend payable | | | 38,813 | |
| | | | |
Total liabilities | | | 64,146,120 | |
| | | | |
Net assets | | $ | 449,353,060 | |
| | | | |
| |
| Composition of Net Assets | | | | |
Shares of beneficial interest outstanding (par value of $.001 per share) unlimited number of shares authorized | | $ | 39,613 | |
Additional paid-in capital | | | 423,964,264 | |
| | | | |
| | | 424,003,877 | |
Distributions in excess of net investment income | | | (47,107 | ) |
Accumulated net realized gain (loss) on investments | | | 909,345 | |
Net unrealized appreciation (depreciation) on investments | | | 24,486,945 | |
| | | | |
Net assets | | $ | 449,353,060 | |
| | | | |
| | | | |
Investor Class | | | | |
Net assets applicable to outstanding shares | | $ | 6,543,776 | |
| | | | |
Shares of beneficial interest outstanding | | | 574,722 | |
| | | | |
Net asset value per share outstanding | | $ | 11.39 | |
Maximum sales charge (3.00% of offering price) | | | 0.35 | |
| | | | |
Maximum offering price per share outstanding | | $ | 11.74 | |
| | | | |
Class A | | | | |
Net assets applicable to outstanding shares | | $ | 71,447,389 | |
| | | | |
Shares of beneficial interest outstanding | | | 6,304,010 | |
| | | | |
Net asset value per share outstanding | | $ | 11.33 | |
Maximum sales charge (3.00% of offering price) | | | 0.35 | |
| | | | |
Maximum offering price per share outstanding | | $ | 11.68 | |
| | | | |
Class I | | | | |
Net assets applicable to outstanding shares | | $ | 371,361,895 | |
| | | | |
Shares of beneficial interest outstanding | | | 32,734,687 | |
| | | | |
Net asset value and offering price per share outstanding | | $ | 11.34 | |
| | | | |
| | | | |
| 26 | | MainStay Indexed Bond Fund | | The notes to the financial statements are an integral part of,
and should be read in conjunction with, the financial statements. |
Statement of Operations for the six months ended April 30, 2013 (Unaudited)
| | | | |
| Investment Income (Loss) | |
Income | | | | |
Interest | | $ | 5,200,553 | |
| | | | |
Expenses | | | | |
Manager (See Note 3) | | | 707,868 | |
Transfer agent (See Note 3) | | | 421,153 | |
Distribution/Service—Investor Class (See Note 3) | | | 8,299 | |
Distribution/Service—Class A (See Note 3) | | | 91,321 | |
Custodian | | | 43,413 | |
Professional fees | | | 32,682 | |
Shareholder communication | | | 27,088 | |
Registration | | | 25,590 | |
Trustees | | | 5,308 | |
Miscellaneous | | | 10,194 | |
| | | | |
Total expenses before waiver/reimbursement | | | 1,372,916 | |
Expense waiver/reimbursement from Manager (See Note 3) | | | (251,570 | ) |
| | | | |
Net expenses | | | 1,121,346 | |
| | | | |
Net investment income (loss) | | | 4,079,207 | |
| | | | |
|
| Realized and Unrealized Gain (Loss) on Investments | |
Net realized gain (loss) on investments | | | 915,804 | |
Net change in unrealized appreciation (depreciation) on investments | | | (2,035,393 | ) |
| | | | |
Net realized and unrealized gain (loss) on investments | | | (1,119,589 | ) |
| | | | |
Net increase (decrease) in net assets resulting from operations | | $ | 2,959,618 | |
| | | | |
| | | | | | |
The notes to the financial statements are an integral part of,
and should be read in conjunction with, the financial statements. | | mainstayinvestments.com | | | 27 | |
Statements of Changes in Net Assets
for the six months ended April 30, 2013 (Unaudited) and the year ended October 31, 2012
| | | | | | | | |
| | | 2013 | | | 2012 | |
| Increase (Decrease) in Net Assets | |
Operations: | | | | | | | | |
Net investment income (loss) | | $ | 4,079,207 | | | $ | 10,549,870 | |
Net realized gain (loss) on investments | | | 915,804 | | | | 9,133,868 | |
Net change in unrealized appreciation (depreciation) on investments | | | (2,035,393 | ) | | | 2,569,072 | |
| | | | |
Net increase (decrease) in net assets resulting from operations | | | 2,959,618 | | | | 22,252,810 | |
| | | | |
Dividends and distributions to shareholders: | | | | | | | | |
From net investment income: | | | | | | | | |
Investor Class | | | (49,412 | ) | | | (119,595 | ) |
Class A | | | (585,045 | ) | | | (1,596,416 | ) |
Class I | | | (3,634,777 | ) | | | (9,019,452 | ) |
| | | | | | | | |
| | | (4,269,234 | ) | | | (10,735,463 | ) |
| | | | | | | | |
From net realized gain on investments: | | | | | | | | |
Investor Class | | | (135,295 | ) | | | (187,145 | ) |
Class A | | | (1,510,935 | ) | | | (2,432,468 | ) |
Class I | | | (7,232,446 | ) | | | (10,662,145 | ) |
| | | | | | | | |
| | | (8,878,676 | ) | | | (13,281,758 | ) |
| | | | | | | | |
Total dividends and distributions to shareholders | | | (13,147,910 | ) | | | (24,017,221 | ) |
| | | | |
Capital share transactions: | | | | | | | | |
Net proceeds from sale of shares | | | 59,979,459 | | | | 205,637,841 | |
Net asset value of shares issued to shareholders in reinvestment of dividends and distributions | | | 12,405,318 | | | | 22,602,447 | |
Cost of shares redeemed | | | (67,448,290 | ) | | | (238,126,622 | ) |
| | | | |
Increase (decrease) in net assets derived from capital share transactions | | | 4,936,487 | | | | (9,886,334 | ) |
| | | | |
Net increase (decrease) in net assets | | | (5,251,805 | ) | | | (11,650,745 | ) |
|
| Net Assets | |
Beginning of period | | | 454,604,865 | | | | 466,255,610 | |
| | | | |
End of period | | $ | 449,353,060 | | | $ | 454,604,865 | |
| | | | |
Undistributed (distributions in excess of) net investment income at end of period | | $ | (47,107 | ) | | $ | 142,920 | |
| | | | |
| | | | |
| 28 | | MainStay Indexed Bond Fund | | The notes to the financial statements are an integral part of,
and should be read in conjunction with, the financial statements. |
Financial Highlights selected per share data and ratios
| | | | | | | | | | | | | | | | | | | | | | | | |
| | | Investor Class | |
| | | Six months
ended
April 30, | | | Year ended October 31, | | | February 28,
2008**
through
October 31, | |
| | | 2013* | | | 2012 | | | 2011 | | | 2010 | | | 2009 | | | 2008 | |
Net asset value at beginning of period | | $ | 11.65 | | | $ | 11.71 | | | $ | 11.81 | | | $ | 11.38 | | | $ | 10.37 | | | $ | 10.97 | |
| | | | | | | | | | | | | | | | | | | | | | | | |
Net investment income (loss) | | | 0.08 | | | | 0.21 | | | | 0.28 | | | | 0.32 | | | | 0.40 | | | | 0.30 | |
Net realized and unrealized gain (loss) on investments | | | (0.03 | ) | | | 0.28 | | | | 0.15 | | | | 0.45 | | | | 1.02 | | | | (0.60 | ) |
| | | | | | | | | | | | | | | | | | | | | | | | |
Total from investment operations | | | 0.05 | | | | 0.49 | | | | 0.43 | | | | 0.77 | | | | 1.42 | | | | (0.30 | ) |
| | | | | | | | | | | | | | | | | | | | | | | | |
Less dividends and distributions: | | | | | | | | | | | | | | | | | | | | | | | | |
From net investment income | | | (0.08 | ) | | | (0.21 | ) | | | (0.28 | ) | | | (0.32 | ) | | | (0.41 | ) | | | (0.30 | ) |
From net realized gain on investments | | | (0.23 | ) | | | (0.34 | ) | | | (0.25 | ) | | | (0.02 | ) | | | — | | | | — | |
| | | | | | | | | | | | | | | | | | | | | | | | |
Total dividends and distributions | | | (0.31 | ) | | | (0.55 | ) | | | (0.53 | ) | | | (0.34 | ) | | | (0.41 | ) | | | (0.30 | ) |
| | | | | | | | | | | | | | | | | | | | | | | | |
Net asset value at end of period | | $ | 11.39 | | | $ | 11.65 | | | $ | 11.71 | | | $ | 11.81 | | | $ | 11.38 | | | $ | 10.37 | |
| | | | | | | | | | | | | | | | | | | | | | | | |
Total investment return (a) | | | 0.47 | %(b) | | | 4.33 | % | | | 3.88 | % | | | 6.88 | % | | | 13.87 | % | | | (2.76 | %)(b) |
Ratios (to average net assets)/Supplemental Data: | | | | | | | | | | | | | | | | | | | | | | | | |
Net investment income (loss) | | | 1.40 | %†† | | | 1.76 | % | | | 2.39 | % | | | 2.81 | % | | | 3.66 | % | | | 4.26 | % †† |
Net expenses | | | 0.92 | %†† | | | 0.92 | % | | | 0.92 | % | | | 0.92 | % | | | 0.92 | % | | | 0.92 | % †† |
Expenses (before waiver/reimbursement) | | | 1.03 | %†† | | | 1.04 | % | | | 1.10 | % | | | 1.15 | % | | | 1.28 | % | | | 1.27 | % †† |
Portfolio turnover rate (c) | | | 72 | % | | | 174 | % | | | 106 | % | | | 115 | % | | | 61 | % | | | 66 | % |
Net assets at end of period (in 000’s) | | $ | 6,544 | | | $ | 6,852 | | | $ | 6,326 | | | $ | 5,985 | | | $ | 4,279 | | | $ | 2,874 | |
| ** | Commencement of operations. |
| (a) | Total investment return is calculated exclusive of sales charges and assumes the reinvestment of dividends and distributions. |
| (b) | Total investment return is not annualized. |
| (c) | The portfolio turnover rates not including mortgage dollar rolls are 32%, 142%, 95%, 105%, 56% and 62% for the sixth months ended April 30, 2013, and for the years ended October 31, 2012, 2011, 2010, 2009 and 2008, respectively. |
| | | | | | |
The notes to the financial statements are an integral part of,
and should be read in conjunction with, the financial statements. | | mainstayinvestments.com | | | 29 | |
Financial Highlights selected per share data and ratios
| | | | | | | | | | | | | | | | | | | | | | | | |
| | | Class A | |
| | | Six months
ended
April 30, | | | Year ended October 31, | |
| | | 2013* | | | 2012 | | | 2011 | | | 2010 | | | 2009 | | | 2008 | |
Net asset value at beginning of period | | $ | 11.60 | | | $ | 11.66 | | | $ | 11.76 | | | $ | 11.33 | | | $ | 10.33 | | | $ | 10.70 | |
| | | | | | | | | | | | | | | | | | | | | | | | |
Net investment income (loss) | | | 0.09 | | | | 0.22 | | | | 0.29 | | | | 0.34 | | | | 0.41 | | | | 0.47 | |
Net realized and unrealized gain (loss) on investments | | | (0.04 | ) | | | 0.28 | | | | 0.16 | | | | 0.45 | | | | 1.01 | | | | (0.36 | ) |
| | | | | | | | | | | | | | | | | | | | | | | | |
Total from investment operations | | | 0.05 | | | | 0.50 | | | | 0.45 | | | | 0.79 | | | | 1.42 | | | | 0.11 | |
| | | | | | | | | | | | | | | | | | | | | | | | |
Less dividends and distributions: | | | | | | | | | | | | | | | | | | | | | | | | |
From net investment income | | | (0.09 | ) | | | (0.22 | ) | | | (0.30 | ) | | | (0.34 | ) | | | (0.42 | ) | | | (0.48 | ) |
From net realized gain on investments | | | (0.23 | ) | | | (0.34 | ) | | | (0.25 | ) | | | (0.02 | ) | | | — | | | | — | |
| | | | | | | | | | | | | | | | | | | | | | | | |
Total dividends and distributions | | | (0.32 | ) | | | (0.56 | ) | | | (0.55 | ) | | | (0.36 | ) | | | (0.42 | ) | | | (0.48 | ) |
| | | | | | | | | | | | | | | | | | | | | | | | |
Net asset value at end of period | | $ | 11.33 | | | $ | 11.60 | | | $ | 11.66 | | | $ | 11.76 | | | $ | 11.33 | | | $ | 10.33 | |
| | | | | | | | | | | | | | | | | | | | | | | | |
Total investment return (a) | | | 0.44 | %(b) | | | 4.46 | % | | | 4.05 | % | | | 7.04 | % | | | 13.93 | % | | | 0.88 | % |
Ratios (to average net assets)/Supplemental Data: | | | | | | | | | | | | | | | | | | | | | | | | |
Net investment income (loss) | | | 1.50 | %†† | | | 1.86 | % | | | 2.53 | % | | | 2.94 | % | | | 3.76 | % | | | 4.35 | % |
Net expenses | | | 0.82 | %†† | | | 0.82 | % | | | 0.78 | % | | | 0.80 | % | | | 0.82 | % | | | 0.82 | % |
Expenses (before waiver/reimbursement) | | | 0.82 | %†† | | | 0.82 | % | | | 0.78 | % | | | 0.80 | % | | | 0.88 | % | | | 0.88 | % |
Portfolio turnover rate (c) | | | 72 | % | | | 174 | % | | | 106 | % | | | 115 | % | | | 61 | % | | | 66 | % |
Net assets at end of period (in 000’s) | | $ | 71,447 | | | $ | 77,156 | | | $ | 82,180 | | | $ | 87,750 | | | $ | 77,595 | | | $ | 61,775 | |
| (a) | Total investment return is calculated exclusive of sales charges and assumes the reinvestment of dividends and distributions. |
| (b) | Total investment return is not annualized. |
| (c) | The portfolio turnover rates not including mortgage dollar rolls are 32%, 142%, 95%, 105%, 56% and 62% for the sixth months ended April 30, 2013, and for the years ended October 31, 2012, 2011, 2010, 2009 and 2008, respectively. |
| | | | |
| 30 | | MainStay Indexed Bond Fund | | The notes to the financial statements are an integral part of,
and should be read in conjunction with, the financial statements. |
Financial Highlights selected per share data and ratios
| | | | | | | | | | | | | | | | | | | | | | | | |
| | | Class I | |
| | | Six months
ended
April 30, | | | Year ended October 31, | |
| | | 2013* | | | 2012 | | | 2011 | | | 2010 | | | 2009 | | | 2008 | |
Net asset value at beginning of period | | $ | 11.61 | | | $ | 11.67 | | | $ | 11.77 | | | $ | 11.34 | | | $ | 10.33 | | | $ | 10.70 | |
| | | | | | | | | | | | | | | | | | | | | | | | |
Net investment income (loss) | | | 0.11 | | | | 0.26 | | | | 0.33 | | | | 0.38 | | | | 0.46 | | | | 0.51 | |
Net realized and unrealized gain (loss) on investments | | | (0.04 | ) | | | 0.28 | | | | 0.16 | | | | 0.45 | | | | 1.01 | | | | (0.37 | ) |
| | | | | | | | | | | | | | | | | | | | | | | | |
Total from investment operations | | | 0.07 | | | | 0.54 | | | | 0.49 | | | | 0.83 | | | | 1.47 | | | | 0.14 | |
| | | | | | | | | | | | | | | | | | | | | | | | |
Less dividends and distributions: | | | | | | | | | | | | | | | | | | | | | | | | |
From net investment income | | | (0.11 | ) | | | (0.26 | ) | | | (0.34 | ) | | | (0.38 | ) | | | (0.46 | ) | | | (0.51 | ) |
From net realized gain on investments | | | (0.23 | ) | | | (0.34 | ) | | | (0.25 | ) | | | (0.02 | ) | | | — | | | | — | |
| | | | | | | | | | | | | | | | | | | | | | | | |
Total dividends and distributions | | | (0.34 | ) | | | (0.60 | ) | | | (0.59 | ) | | | (0.40 | ) | | | (0.46 | ) | | | (0.51 | ) |
| | | | | | | | | | | | | | | | | | | | | | | | |
Net asset value at end of period | | $ | 11.34 | | | $ | 11.61 | | | $ | 11.67 | | | $ | 11.77 | | | $ | 11.34 | | | $ | 10.33 | |
| | | | | | | | | | | | | | | | | | | | | | | | |
Total investment return (a) | | | 0.63 | %(b) | | | 4.86 | % | | | 4.41 | % | | | 7.43 | % | | | 14.47 | % | | | 1.25 | % |
Ratios (to average net assets)/Supplemental Data: | | | | | | | | | | | | | | | | | | | | | | | | |
Net investment income (loss) | | | 1.89 | %†† | | | 2.25 | % | | | 2.88 | % | | | 3.31 | % | | | 4.15 | % | | | 4.74 | % |
Net expenses | | | 0.43 | %†† | | | 0.43 | % | | | 0.43 | % | | | 0.43 | % | | | 0.43 | % | | | 0.43 | % |
Expenses (before waiver/reimbursement) | | | 0.57 | %†† | | | 0.57 | % | | | 0.53 | % | | | 0.55 | % | | | 0.63 | % | | | 0.56 | % |
Portfolio turnover rate (c) | | | 72 | % | | | 174 | % | | | 106 | % | | | 115 | % | | | 61 | % | | | 66 | % |
Net assets at end of period (in 000’s) | | $ | 371,362 | | | $ | 370,596 | | | $ | 377,749 | | | $ | 523,050 | | | $ | 468,639 | | | $ | 381,086 | |
| (a) | Total investment return is calculated exclusive of sales charges and assumes the reinvestment of dividends and distributions. Class I shares are not subject to sales charges. |
| (b) | Total investment return is not annualized. |
| (c) | The portfolio turnover rates not including mortgage dollar rolls are 32%, 142%, 95%, 105%, 56% and 62% for the sixth months ended April 30, 2013, and for the years ended October 31, 2012, 2011, 2010, 2009 and 2008, respectively. |
| | | | | | |
The notes to the financial statements are an integral part of,
and should be read in conjunction with, the financial statements. | | mainstayinvestments.com | | | 31 | |
Notes to Financial Statements (Unaudited)
Note 1–Organization and Business
MainStay Funds Trust (the “Trust”) was organized as a Delaware statutory trust on April 28, 2009, and is governed by a Declaration of Trust. The Trust is registered under the Investment Company Act of 1940, as amended (the “1940 Act”), as an open-end investment management company, and is comprised of thirty-three funds (collectively referred to as the “Funds”). These financial statements and notes relate only to the MainStay Indexed Bond Fund (the “Fund”), a diversified fund. The Fund is the successor of the MainStay Indexed Bond Fund, a series of Eclipse Funds Inc. (the “Predecessor Fund”). The reorganization of the Predecessor Fund with and into the Fund occurred on February 26, 2010. All information and references to periods prior to February 26, 2010 relate to the Predecessor Fund.
The Fund currently offers three classes of shares. Class I shares commenced operations on January 2, 1991. Class A shares commenced operations on January 2, 2004. Investor Class shares commenced operations on February 28, 2008. Investor Class and Class A shares are offered at net asset value (“NAV”) per share plus an initial sales charge. No sales charge applies to investments of $1 million or more (and certain other qualified purchases) in Investor Class and Class A shares, but a contingent deferred sales charge (“CDSC”) is imposed on certain redemptions made within one year of the date of purchase. Class I shares are offered at NAV and are not subject to a sales charge. Depending upon eligibility, Investor Class shares may convert to Class A shares and Class A shares may convert to Investor Class shares. The three classes of shares have the same voting (except for issues that relate solely to one class), dividend, liquidation and other rights, and the same terms and conditions, except that Investor Class and Class A shares are subject to a distribution and/or service fee. Class I shares are not subject to a distribution and/or service fee.
The Fund’s investment objective is to seek investment results that correspond to the total return performance of fixed-income securities in the aggregate, as represented by the Fund’s primary benchmark index.
Note 2–Significant Accounting Policies
The Fund prepares its financial statements in accordance with generally accepted accounting principles (“GAAP”) in the United States of America and follows the significant accounting policies described below.
(A) Securities Valuation. Investments are valued as of the close of regular trading on the New York Stock Exchange (“Exchange”) (generally 4:00 p.m. Eastern time) on each day the Fund is open for business (“valuation date”).
The Board of Trustees (the “Board”) has adopted procedures for the valuation of the Fund’s securities and has delegated the responsibility for valuation determination under those procedures to the Valuation Committee of the Fund (the “Valuation Committee”). The Board has authorized the Valuation Committee to appoint a Valuation Sub-Committee (the “Sub-Committee”) to deal in the first instance with questions that arise or cannot be resolved under these procedures. The Sub-Committee meets (in person, via electronic mail or via teleconference) on an as-needed basis. The Valuation Committee meets at a later time, as necessary, to ensure that actions taken by the Sub-Committee were appropriate. The procedures recognize that, subject to the oversight of the Board and unless otherwise noted, the
responsibility for day-to-day valuation of portfolio assets (including securities for which market prices are not readily available) rests with New York Life Investment Management LLC (“New York Life Investments” or the “Manager”).
To assess the appropriateness of security valuations, the Manager or the Fund’s third party service provider who is subject to oversight by the Manager, regularly compares prior day prices, prices on comparable securities and the sale prices to the prior and current day prices and challenges prices exceeding certain tolerance levels with third party pricing services or broker sources. For those securities valued by recommendation, whether through a standardized fair valuation methodology or a fair valuation determination, the Valuation Committee reviews and affirms the reasonableness of the valuation based on such methodologies and determinations on a regular basis after considering all relevant information that is reasonably available.
“Fair value” is defined as the price that the Fund would receive upon selling an investment in an orderly transaction to an independent buyer in the principal or most advantageous market of the investment. Fair value measurements are determined within a framework that has established a three-tier hierarchy which maximizes the use of observable market data and minimizes the use of unobservable inputs to establish classification of fair value measurements for disclosure purposes. “Inputs” refers broadly to the assumptions that market participants would use in pricing the asset or liability, including assumptions about risk, such as the risk inherent in a particular valuation technique used to measure fair value using a pricing model and/or the risk inherent in the inputs for the valuation technique. Inputs may be observable or unobservable. Observable inputs reflect the assumptions market participants would use in pricing the asset or liability based on market data obtained from sources independent of the Fund. Unobservable inputs reflect the Fund’s own assumptions about the assumptions market participants would use in pricing the asset or liability developed based on the information available in the circumstances. The inputs or methodology used for valuing securities may not be an indication of the risks associated with investing in those securities. The three-tier hierarchy of inputs is summarized in the three broad Levels listed below.
| • | | Level 1—quoted prices in active markets for identical investments |
| • | | Level 2—other significant observable inputs (including quoted prices for similar investments in active markets, interest rates and yield curves, prepayment speeds, credit risks, etc.) |
| • | | Level 3—significant unobservable inputs (including the Fund’s own assumptions about the assumptions that market participants would use in determining the fair value of investments) |
The aggregate value by input level, as of April 30, 2013, for the Fund’s investments is included at the end of the Fund’s Portfolio of Investments.
The valuation techniques used by the Fund to measure fair value maximize the use of observable inputs and minimize the use of unobservable
| | |
| 32 | | MainStay Indexed Bond Fund |
inputs. The Fund may utilize third party vendor evaluations, whose prices may be derived from one or more of the following standard inputs:
| | |
• Benchmark Yields | | • Reported Trades |
• Broker Dealer Quotes | | • Issuer Spreads |
• Two-sided markets | | • Benchmark securities |
• Bids/Offers | | • Reference Data (corporate actions or material event notices) |
• Industry and economic events | | • Comparable bonds |
• Equity and credit default swap curves | | • Monthly payment information |
Securities for which market values cannot be determined using the methodologies described above are valued by methods deemed in good faith by the Fund’s Valuation Committee, following the procedures established by the Board, to represent fair value. Under these procedures, the Fund primarily employs a market-based approach which may use related or comparable assets or liabilities, recent transactions, market multiples, book values, and other relevant information. The Fund may also use an income-based valuation approach in which the anticipated future cash flows of the investment are discounted to calculate fair value. Discounts may also be applied due to the nature or duration of any restrictions on the disposition of the investments. Due to the inherent uncertainty of valuations of such investments, the fair values may differ significantly from the values that would have been used had an active market existed. For the six-month period ended April 30, 2013, there have been no changes to the fair value methodologies.
Equity and non-equity securities which may be valued in this manner include, but are not limited to: (i) a security for which the trading has been halted or suspended; (ii) a debt security that has recently gone into default and for which there is not a current market quotation; (iii) a security of an issuer that has entered into a restructuring; (iv) a security that has been de-listed from a national exchange; (v) a security for which the market price is not available from a third party pricing source or, if so provided, does not, in the opinion of the Fund’s Manager reflect the security’s market value; and (vi) a security whose principal market has been temporarily closed at a time when, under normal conditions, it would be open. Securities for which market quotations or observable inputs are not readily available are generally categorized as Level 3 in the hierarchy. As of April 30, 2013, the Fund did not hold any securities that were fair valued in such a manner.
Debt securities (other than convertible bonds and municipal debt securities) are valued at the evaluated bid prices (evaluated mean prices in the case of convertible bonds and municipal debt securities) supplied by a pricing agent or broker selected by the Fund’s Manager whose prices reflect broker/dealer supplied valuations and electronic data processing techniques, if such prices are deemed by the Fund’s Manager to be representative of market values, at the regular close of trading of the Exchange on each valuation date. Debt securities, including corporate bonds, U.S. government and federal agency bonds, municipal bonds, foreign bonds, Yankee bonds, convertible bonds, asset-backed securities and mortgage-backed securities are generally categorized as Level 2 in the hierarchy.
Temporary cash investments acquired over 60 days to maturity are valued using the latest bid prices or using valuations based on a matrix system (which considers such factors as security prices, yields, matur-
ities, and ratings), both as furnished by independent pricing services. Other temporary cash investments which mature in 60 days or less (“Short-Term Investments”) are valued at amortized cost. The amortized cost method involves valuing a security at its cost on the date of purchase and thereafter assuming a constant amortization to maturity of the difference between such cost and the value on maturity date. Amortized cost approximates the current fair value of a security. Securities valued at amortized cost are not valued using a quoted price in an active market. These securities are generally categorized as Level 2 in the hierarchy.
Generally, a security is considered illiquid if it cannot be sold or disposed of in the ordinary course of business at approximately the price at which it is valued. Its illiquidity might prevent the sale of such security at a time when the Manager might wish to sell, and these securities could have the effect of decreasing the overall level of a Fund’s liquidity. Further, the lack of an established secondary market may make it more difficult to value illiquid securities, requiring the Fund to rely on judgments that may be somewhat subjective in determining value, which could vary from the amount that a Fund could realize upon disposition. Difficulty in selling illiquid securities may result in a loss or may be costly to the Fund. Under the supervision of the Board, the Manager determines the liquidity of the Fund’s investments; in doing so, the Manager may consider various factors, including (i) the frequency of trades and quotations, (ii) the number of dealers and prospective purchasers, (iii) dealer undertakings to make a market, and (iv) the nature of the security and the market in which it trades (e.g., the time needed to dispose of the security, the method of soliciting offers and the mechanics of transfer). Illiquid securities generally will be valued in good faith in such a manner as the Board deems appropriate to reflect their fair value.
(B) Income Taxes. The Fund’s policy is to comply with the requirements of the Internal Revenue Code of 1986, as amended (the “Internal Revenue Code”), applicable to regulated investment companies and to distribute all of the taxable income to the shareholders of the Fund within the allowable time limits. Therefore, no federal, state and local income tax provision is required.
Management evaluates its tax positions to determine if the tax positions taken meet the minimum recognition threshold in connection with accounting for uncertainties in income tax positions taken or expected to be taken for the purposes of measuring and recognizing tax liabilities in the financial statements. Recognition of tax benefits of an uncertain tax position is required only when the position is “more likely than not” to be sustained assuming examination by taxing authorities. Management has analyzed the Fund’s tax positions taken on federal, state and local income tax returns for all open tax years (for up to three tax years), and has concluded that no provision for federal, state and local income tax is required in the Fund’s financial statements. The Fund’s federal, state and local income and federal excise tax returns for tax years for which the applicable statutes of limitations have not expired are subject to examination by the Internal Revenue Service and state and local departments of revenue.
(C) Dividends and Distributions to Shareholders. Dividends and distributions are recorded on the ex-dividend date. The Fund intends to declare and pay dividends of net investment income, if any, at least monthly and distributions of net realized capital and currency
| | | | |
| mainstayinvestments.com | | | 33 | |
Notes to Financial Statements (Unaudited) (continued)
gains, if any, at least annually. Unless the shareholder elects otherwise, all dividends and distributions are reinvested in the same class of shares of the Fund, at NAV. Dividends and distributions to shareholders are determined in accordance with federal income tax regulations and may differ from GAAP.
(D) Security Transactions and Investment Income. The Fund records security transactions on the trade date. Realized gains and losses on security transactions are determined using the identified cost method and include gains and losses from repayments of principal on mortgage-backed securities. Interest income is accrued as earned using the effective interest rate method. Discounts and premiums on securities purchased, other than Short-Term Investments, for the Fund are accreted and amortized, respectively, on the effective interest rate method over the life of the respective securities or, in the case of a callable security, over the period to the first date of call. Discounts and premiums on Short-Term Investments are accreted and amortized, respectively, on the straight-line method. Income from payment-in-kind securities is recorded daily based on the effective interest method of accrual.
Investment income and realized and unrealized gains and losses on investments of the Fund are allocated to separate classes of shares pro rata based upon their relative net assets on the date the income is earned or realized and unrealized gains and losses are incurred.
(E) Expenses. Expenses of the Trust are allocated to the individual Funds in proportion to the net assets of the respective Funds when the expenses are incurred, except where direct allocations of expenses can be made. Expenses (other than transfer agent expenses and fees incurred under the shareholder services plans and the distribution plans further discussed in Note 3(B)) are allocated to separate classes of shares pro rata based upon their relative net assets on the date the expenses are incurred. The expenses borne by the Fund, including those of related parties to the Fund, are shown in the Statement of Operations.
(F) Use of Estimates. In preparing financial statements in conformity with GAAP, management makes estimates and assumptions that affect the reported amounts and disclosures in the financial statements. Actual results could differ from those estimates.
(G) Repurchase Agreements. The Fund may enter into repurchase agreements to earn income. The Fund may enter into repurchase agreements only with financial institutions that are deemed by the Manager or Subadvisor to be creditworthy, pursuant to guidelines established by the Fund’s Board. During the term of any repurchase agreement, the Manager will continue to monitor the creditworthiness of the seller. Under the 1940 Act, repurchase agreements are considered to be collateralized loans by a Fund to the seller secured by the securities transferred to the Fund.
When the Fund invests in repurchase agreements, the Fund’s custodian takes possession of the collateral pledged for investments in the repurchase agreement. The underlying collateral is valued daily on a mark-to-market basis to determine that the value, including accrued interest, exceeds the repurchase price. In the event of the seller’s default on the obligation to repurchase, the Fund has the right to liquidate the collateral and apply the proceeds in satisfaction of the obligation. Under certain circumstances, such as in the event of default or
bankruptcy by the counterparty to the agreement, realization and/or retention of the collateral may be subject to legal proceedings and possible realized loss to the Fund.
(H) Dollar Rolls. The Fund may enter into dollar roll transactions in which it sells mortgage-backed securities (“MBS”) from its portfolio to a counterparty from whom it simultaneously agrees to buy a similar security on a delayed delivery basis. The dollar roll transactions of the Fund are classified as purchase and sale transactions. The securities sold in connection with the dollar rolls are removed from the portfolio and a realized gain or loss is recognized. The securities the Fund has agreed to acquire are included at market value in the Portfolio of Investments and liabilities for such purchase commitments are included as payables for investments purchased. During the roll period, the Fund foregoes principal and interest paid on the securities. The Fund is compensated by the difference between the current sales price and the forward price for the future as well as by the earnings on the cash proceeds of the initial sale. Dollar rolls may be renewed without physical delivery of the securities subject to the contract. The Fund maintains liquid assets from its portfolio having a value not less than the repurchase price, including accrued interest. Dollar roll transactions involve certain risks, including the risk that the MBS returned to the Fund at the end of the roll period, while substantially similar, could be inferior to what was initially sold to the counterparty.
(I) Securities Lending. In order to realize additional income, the Fund may engage in securities lending, subject to the limitations set forth in the 1940 Act and relevant guidance by the staff of the Securities and Exchange Commission. In the event the Fund does engage in securities lending, the Fund will lend through its custodian, State Street Bank and Trust Company (“State Street”). State Street will manage the Fund’s cash collateral in accordance with the lending agreement between the Fund and State Street, and indemnify the Fund’s portfolio against counterparty risk. The loans will be collateralized by cash or securities at least equal at all times to the market value of the securities loaned. Collateral will consist of U.S. Government securities, cash equivalents or irrevocable letters of credit. The Fund may bear the risk of delay in recovery of, or loss of rights in, the securities loaned should the borrower of the securities experience financial difficulty. The Fund may also record realized gain or loss on securities deemed sold due to a borrower’s inability to return securities on loan. The Fund will receive compensation for lending its securities in the form of fees or the retention of a portion of the interest on the investment of any cash received as collateral. The Fund also will continue to receive interest and dividends on the securities loaned and any gain or loss in the market price of the securities loaned that may occur during the term of the loan will be for the account of the Fund.
Although the Fund and New York Life Investments have temporarily suspended securities lending, the Fund and New York Life Investments reserve the right to reinstitute lending when deemed appropriate. The Fund did not have any portfolio securities on loan as of April 30, 2013.
(J) Concentration of Risk. The Fund may invest in foreign securities, which carry certain risks that are in addition to the usual risks inherent in domestic instruments. These risks include those resulting from currency fluctuations, future adverse political and economic developments and possible imposition of currency exchange blockages or other foreign governmental laws or restrictions. These risks are likely to
| | |
| 34 | | MainStay Indexed Bond Fund |
be greater in emerging markets than in developed markets. The ability of issuers of debt securities held by the Fund to meet their obligations may be affected by economic or political developments in a specific country, industry or region.
(K) Indemnifications. Under the Trust’s organizational documents, its officers and trustees are indemnified against certain liabilities that may arise out of performance of their duties to the Trust. Additionally, in the normal course of business, the Fund enters into contracts with third-party service providers that contain a variety of representations and warranties and which may provide general indemnifications. The Fund’s maximum exposure under these arrangements is unknown, as this would involve future claims that may be made against the Fund that have not yet occurred. Based on experience, management is of the view that the risk of loss in connection with these potential indemnification obligations is remote. However, there can be no assurance that material liabilities related to such obligations will not arise in the future, which could adversely impact the Fund.
Note 3–Fees and Related Party Transactions
(A) Manager. New York Life Investments, a registered investment adviser and an indirect, wholly-owned subsidiary of New York Life Insurance Company (“New York Life”), serves as the Fund’s Manager, pursuant to an Amended and Restated Management Agreement (“Management Agreement”). The Manager provides offices, conducts clerical, recordkeeping and bookkeeping services, and keeps most of the financial and accounting records required to be maintained by the Fund. Except for the portion of salaries and expenses that are the responsibility of the Fund, the Manager pays the salaries and expenses of all personnel affiliated with the Fund and certain operational expenses of the Fund. The Fund reimburses New York Life Investments in an amount equal to a portion of the salary of the Chief Compliance Officer (“CCO”) of the Fund. New York Life Investments is responsible for the day-to-day portfolio management of the Fund.
Effective February 28, 2013, the Fund pays the Manager a monthly fee for services performed and facilities furnished at an annual rate of the Fund’s average daily net assets as follows: 0.25% up to $1 billion and 0.20% in excess of $1 billion. The effective management fee rate (exclusive of any applicable waivers/reimbursements) was 0.32% for the six-month period ended April 30, 2013.
Prior to February 28, 2013, the Fund paid the Manager a monthly fee for services performed and facilities furnished at an annual rate of the Fund’s average daily net assets as follows: 0.35% up to $1 billion and 0.30% in excess of $1 billion.
New York Life Investments has contractually agreed to waive fees and/or reimburse expenses so that Total Annual Fund Operating Expenses do not exceed the following percentages of average daily net assets: Investor Class, 0.92%; Class A, 0.82%; and Class I, 0.43%. This agreement will remain in effect until February 28, 2014, and shall renew automatically for one-year terms unless New York Life Investments provides written notice of termination prior to the start of the next term or upon approval of the Board. Total Annual Fund Operating Expenses excludes taxes, interest, litigation, extraordinary expenses, brokerage and other transaction expenses relating to the purchase or sale of portfolio investments, and acquired (underlying) fees and expenses.
For the six-month period ended April 30, 2013, New York Life Investments earned fees from the Fund in the amount of $707,868 and waived its fees and/or reimbursed expenses in the amount of $251,570.
State Street, 1 Lincoln Street, Boston, Massachusetts 02111, provides sub-administration and sub-accounting services to the Fund pursuant to an agreement with New York Life Investments. These services include calculating the daily NAVs of the Fund, maintaining the general ledger and sub-ledger accounts for the calculation of the Fund’s respective NAVs, and assisting New York Life Investments in conducting various aspects of the Fund’s administrative operations. For providing these services to the Fund, State Street is compensated by New York Life Investments.
(B) Distribution and Service Fees. The Trust, on behalf of the Fund, has entered into a distribution agreement with NYLIFE Distributors LLC (the ‘‘Distributor’’), an indirect, wholly-owned subsidiary of New York Life. The Fund has adopted distribution plans (the ‘‘Plans’’) in accordance with the provisions of Rule 12b-1 under the 1940 Act.
Pursuant to the Investor Class and Class A Plans, the Distributor receives a monthly distribution fee from the Investor Class and Class A shares at an annual rate of 0.25% of the average daily net assets of the Investor Class and Class A shares for distribution and/or service activities as designated by the Distributor. Class I shares are not subject to a distribution and/or service fee.
The Plans provide that the distribution and service fees are payable to the Distributor regardless of the amounts actually expended by the Distributor for distribution of the Fund’s shares and service activities.
(C) Sales Charges. The Fund was advised by the Distributor that the amount of sales charges retained on sales of Investor Class and Class A shares were $1,158 and $3,511, respectively, for the six-month period ended April 30, 2013. The Fund was also advised that the Distributor retained CDSCs on redemptions of Class A shares of $492 for the six-month period ended April 30, 2013.
(D) Transfer, Dividend Disbursing and Shareholder Servicing Agent. NYLIM Service Company LLC, an affiliate of New York Life Investments, is the Fund’s transfer, dividend disbursing and shareholder servicing agent pursuant to an agreement between NYLIM Service Company LLC and the Trust. NYLIM Service Company LLC has entered into an agreement with Boston Financial Data Services, Inc. (“BFDS”) pursuant to which BFDS performs certain transfer agent services on behalf of NYLIM Service Company LLC. Transfer agent expenses incurred by the Fund for the six-month period ended April 30, 2013, were as follows:
| | | | |
Investor Class | | $ | 13,164 | |
Class A | | | 67,588 | |
Class I | | | 340,401 | |
(E) Small Account Fee. Shareholders with small accounts adversely impact the cost of providing transfer agency services. In an effort to reduce total transfer agency expenses, the Fund has implemented a small account fee on certain types of accounts. Certain shareholders with an account balance of less than $1,000 are charged an annual per account fee of $20 (assessed semi-annually), the pro-
| | | | |
| mainstayinvestments.com | | | 35 | |
Notes to Financial Statements (Unaudited) (continued)
ceeds from which offset transfer agent fees as reflected in the Statement of Operations.
(F) Capital. As of April 30, 2013, New York Life and its affiliates beneficially held shares of the Fund with values and percentages of net assets as follows:
| ‡ | Less than one-tenth of a percent. |
Note 4–Federal Income Tax
The tax character of distributions paid during the year ended October 31, 2012, shown in the Statements of Changes in Net Assets was as follows:
| | | | |
| | | 2012 | |
Distributions paid from: | | | | |
Ordinary Income | | $ | 14,028,486 | |
Long-Term Capital Gain | | | 9,988,735 | |
Total | | $ | 24,017,221 | |
Note 5–Custodian
State Street is the custodian of the cash and the securities of the Fund. Custodial fees are charged to the Fund based on the market value of securities in the Fund and the number of certain cash transactions incurred by the Fund.
Note 6–Line of Credit
The Fund and certain affiliated funds maintain a line of credit with a syndicate of banks in order to secure a source of funds for temporary purposes to meet unanticipated or excessive redemption requests.
Effective August 29, 2012, under a second amended and restated credit agreement (the “Credit Agreement”), the aggregate commitment amount is $200,000,000 with an optional maximum amount of $250,000,000. The commitment fee is an annual rate of 0.08% of the average commitment amount payable quarterly, regardless of usage, to Bank of New York Mellon, which serves as the agent to the syndicate. The commitment fee is allocated among the Fund and certain affiliated funds based upon net assets and other factors. Interest on any revolving credit loan is charged based upon the Federal Funds Advances rate or the one month London InterBank Offered Rate, whichever is higher. The Credit Agreement expires on August 28, 2013, although the Fund, certain affiliated funds and the syndicate of banks may renew the Credit Agreement for an additional year on the same or different terms. There were no borrowings made or outstanding with respect to the Fund on the Credit Agreement during the six-month period ended April 30, 2013.
Note 7–Purchases and Sales of Securities (in 000’s)
During the six-month period ended April 30, 2013, purchases and sales of U.S. government securities were $312,021 and $325,599, respectively. Purchases and sales of securities, other than U.S. government securities and short-term securities, were $9,631 and $7,338, respectively.
Note 8–Capital Share Transactions
| | | | | | | | |
Investor Class | | Shares | | | Amount | |
Six-month period ended April 30, 2013: | | | | | | | | |
Shares sold | | | 60,063 | | | $ | 684,547 | |
Shares issued to shareholders in reinvestment of dividends and distributions | | | 16,020 | | | | 182,470 | |
Shares redeemed | | | (95,465 | ) | | | (1,083,539 | ) |
| | | | | | | | |
Net increase (decrease) in shares outstanding before conversion | | | (19,382 | ) | | | (216,522 | ) |
Shares converted into Investor Class (See Note 1) | | | 13,984 | | | | 158,018 | |
Shares converted from Investor Class (See Note 1) | | | (8,163 | ) | | | (92,076 | ) |
| | | | | | | | |
Net increase (decrease) | | | (13,561 | ) | | $ | (150,580 | ) |
| | | | | | | | |
Year ended October 31, 2012: | | | | | | | | |
Shares sold | | | 188,582 | | | $ | 2,172,123 | |
Shares issued to shareholders in reinvestment of dividends and distributions | | | 26,452 | | | | 302,528 | |
Shares redeemed | | | (131,295 | ) | | | (1,512,704 | ) |
| | | | | | | | |
Net increase (decrease) in shares outstanding before conversion | | | 83,739 | | | | 961,947 | |
Shares converted into Investor Class (See Note 1) | | | 15,526 | | | | 177,533 | |
Shares converted from Investor Class (See Note 1) | | | (51,150 | ) | | | (585,154 | ) |
| | | | | | | | |
Net increase (decrease) | | | 48,115 | | | $ | 554,326 | |
| | | | | | | | |
| | |
| | | | | | | | |
Class A | | Shares | | | Amount | |
Six-month period ended April 30, 2013: | | | | | | | | |
Shares sold | | | 930,285 | | | $ | 10,523,198 | |
Shares issued to shareholders in reinvestment of dividends and distributions | | | 170,513 | | | | 1,932,082 | |
Shares redeemed | | | (1,444,449 | ) | | | (16,337,531 | ) |
| | | | | | | | |
Net increase (decrease) in shares outstanding before conversion | | | (343,651 | ) | | | (3,882,251 | ) |
Shares converted into Class A (See Note 1) | | | 8,199 | | | | 92,076 | |
Shares converted from Class A (See Note 1) | | | (14,059 | ) | | | (158,018 | ) |
| | | | | | | | |
Net increase (decrease) | | | (349,511 | ) | | $ | (3,948,193 | ) |
| | | | | | | | |
Year ended October 31, 2012: | | | | | | | | |
Shares sold | | | 2,620,518 | | | $ | 30,098,637 | |
Shares issued to shareholders in reinvestment of dividends and distributions | | | 309,314 | | | | 3,521,794 | |
Shares redeemed | | | (3,359,449 | ) | | | (38,612,342 | ) |
| | | | | | | | |
Net increase (decrease) in shares outstanding before conversion | | | (429,617 | ) | | | (4,991,911 | ) |
Shares converted into Class A (See Note 1) | | | 51,360 | | | | 585,154 | |
Shares converted from Class A (See Note 1) | | | (15,594 | ) | | | (177,533 | ) |
| | | | | | | | |
Net increase (decrease) | | | (393,851 | ) | | $ | (4,584,290 | ) |
| | | | | | | | |
| | |
| 36 | | MainStay Indexed Bond Fund |
| | | | | | | | |
Class I | | Shares | | | Amount | |
Six-month period ended April 30, 2013: | | | | | | | | |
Shares sold | | | 4,313,154 | | | $ | 48,771,714 | |
Shares issued to shareholders in reinvestment of dividends and distributions | | | 907,467 | | | | 10,290,766 | |
Shares redeemed | | | (4,414,082 | ) | | | (50,027,220 | ) |
| | | | | | | | |
Net increase (decrease) | | | 806,539 | | | $ | 9,035,260 | |
| | | | | | | | |
Year ended October 31, 2012: | | | | | | | | |
Shares sold | | | 15,129,097 | | | $ | 173,367,081 | |
Shares issued to shareholders in reinvestment of dividends and distributions | | | 1,645,906 | | | | 18,778,125 | |
Shares redeemed | | | (17,211,188 | ) | | | (198,001,576 | ) |
| | | | | | | | |
Net increase (decrease) | | | (436,185 | ) | | $ | (5,856,370 | ) |
| | | | | | | | |
Note 9–Subsequent Events
In connection with the preparation of the financial statements of the Fund as of and for the six-month period ended April 30, 2013, events and transactions subsequent to April 30, 2013, through the date the financial statements were issued have been evaluated by the Fund’s management for possible adjustment and/or disclosure. No subsequent events requiring financial statement adjustment or disclosure have been identified.
| | | | |
| mainstayinvestments.com | | | 37 | |
Board Consideration and Approval of Management Agreement (Unaudited)
Section 15(c) of the Investment Company Act of 1940, as amended (the “1940 Act”) requires that each mutual fund’s board of trustees, including a majority of the independent trustees, annually review and approve the fund’s investment advisory agreements. At its December 10-12, 2012 meeting, the Board of Trustees of the MainStay Group of Funds (“Board”) unanimously approved the Management Agreement with respect to the MainStay Indexed Bond Fund (“Fund”) and New York Life Investment Management LLC (“New York Life Investments”).
In reaching its decision to approve the Agreement, the Board considered information furnished by New York Life Investments in connection with a contract review process that took place at various meetings of the Board and its Contracts Committee between September 2012 and December 2012, as well as other relevant information furnished to the Board throughout the year by New York Life Investments. Information requested by and furnished to the Board in connection with the contract review process included, among other items, reports on the Fund prepared by Strategic Insight Mutual Fund Research and Consulting, LLC (“Strategic Insight”), an independent third-party service provider engaged by the Board to report objectively on the Fund’s investment performance, management fees and ordinary operating expenses. The Board also considered information provided by New York Life Investments on the fees charged to other investment advisory clients (including institutional separate accounts) that follow investment strategies similar to the Fund, and the rationale for any differences in the Fund’s management fee and the fees charged to those other investment advisory clients. In addition, the Board requested and received information on the profitability of the Fund to New York Life Investments and its affiliates and responses from New York Life Investments to a series of questions encompassing a variety of topics prepared on behalf of the Board by independent legal counsel to the Board and its independent trustees (the “Independent Trustees”). Information provided to the Board at its meetings throughout the year included, among other items, detailed investment performance reports on the Fund prepared by the Investment Consulting Group at New York Life Investments. The structure and format for this regular reporting was developed in consultation with the Board. The Board also received from New York Life Investments throughout the year, among other items, periodic reports on legal and compliance matters, portfolio turnover, and sales and marketing activity.
In determining to approve the Agreement, the members of the Board reviewed and evaluated all of the information and factors they believed to be relevant and appropriate in light of legal advice furnished to them by independent legal counsel and through the exercise of their own business judgment. The broad factors considered by the Board are discussed in greater detail below, and included, among other items: (i) the nature, scope and quality of the services provided to the Fund by New York Life Investments; (ii) the investment performance of the Fund and New York Life Investments; (iii) the costs of the services provided, and profits realized, by New York Life Investments from its relationship with the Fund; (iv) the extent to which economies of scale may be realized as the Fund grows, and the extent to which economies of scale may benefit Fund investors; and (v) the reasonableness of the Fund’s management fee and overall total ordinary operating expenses, particularly as compared to similar funds and accounts managed by New York Life Investments and third-party “peer funds” identified by Strategic Insight.
While individual members of the Board may have weighed certain factors differently, the Board’s decision to approve the Agreement was based on a consideration of all the information provided to the Board, including information provided to the Board throughout the year and specifically in connection with the contract review process. The Board’s conclusions with respect to the Agreement also were based, in part, on the Board’s consideration of the Agreement in prior years. In addition to considering the above-referenced factors, the Board observed that in the marketplace there are a range of investment options available to shareholders of the Fund, and that the Fund’s shareholders, having had the opportunity to consider other investment options, have chosen to invest in the Fund. A more detailed discussion of the factors that figured prominently in the Board’s decisions to approve the Agreement is provided below.
Nature, Scope and Quality of Services to Be Provided by New York Life Investments
The Board examined the nature, scope and quality of the services that New York Life Investments provides to the Fund. The Board evaluated New York Life Investments’ experience in serving as manager of the Fund, noting that New York Life Investments manages other mutual funds, serves a variety of other investment advisory clients, including other pooled investment vehicles, and has experience with overseeing mutual fund service providers. The Board considered the experience of senior personnel at New York Life Investments providing management and administrative services to the Fund, as well as New York Life Investments’ reputation and financial condition. The Board also considered the full range of non-advisory services that New York Life Investments supplies to the Fund under the terms of the Agreement, including: (i) fund accounting services provided by New York Life Investments’ Fund Accounting and Administration Group; (ii) investment oversight and analytical services provided by New York Life Investments’ Investment Consulting Group; (iii) compliance services provided by New York Life Investments’ compliance department, including oversight and implementation of the Fund’s compliance program; and (iv) legal services provided by New York Life Investments’ Office of the General Counsel. Additional information about the non-advisory services provided by New York Life Investments is set forth in the Agreement. The Board also considered New York Life Investments’ willingness to invest in personnel that benefit the Fund, and noted that New York Life Investments is responsible for compensating the Fund’s officers. The Board also considered benefits to shareholders of being part of the MainStay Group of Funds, including the privilege of exchanging investments between the same class of shares without the imposition of a sales charge, as described more fully in the Fund’s prospectus.
The Board also examined the nature, scope and quality of the advisory services that New York Life Investments provides to the Fund. The Board evaluated New York Life Investments’ experience in serving as investment adviser to the Fund and managing other portfolios. It examined New York Life Investments’ track record and experience in providing investment advisory services, the experience of investment advisory, senior management and administrative personnel at New York Life Investments, and New York Life Investments’ overall legal and compliance environment. The Board also reviewed New York Life Investments’ willingness to invest in personnel that benefit the Fund. In this regard, the Board considered the experience of the Fund’s portfolio
| | |
| 38 | | MainStay Indexed Bond Fund |
managers, the number of accounts managed by the portfolio managers and the method for compensating portfolio managers.
Based on these considerations, the Board concluded, within the context of its overall determinations regarding the Agreement, that the Fund should continue to benefit from the nature, scope and quality of these services as a result of New York Life Investments’ experience, personnel, operations and resources.
Investment Performance
In evaluating the Fund’s investment performance, the Board considered investment performance results in light of the Fund’s investment objective, strategies and risks, as disclosed in the Fund’s prospectus. The Board particularly considered detailed investment reports on the Fund’s performance provided to the Board throughout the year by the Investment Consulting Group of New York Life Investments. These reports include, among other items, information on the Fund’s gross and net returns, the Fund’s investment performance relative to relevant investment categories and Fund benchmarks, the Fund’s risk-adjusted investment performance, and the Fund’s investment performance as compared to similar competitor funds, as appropriate. The Board also considered information provided by Strategic Insight showing the investment performance of the Fund as compared to peer funds.
In considering the Fund’s investment performance, the Board focused principally on the Fund’s long-term performance track record. The Board also gave weight to its ongoing discussions with senior management at New York Life Investments concerning the Fund’s investment performance, as well as discussions between the Fund’s portfolio managers and the Board that occur typically on an annual basis. In addition, the Board considered any specific actions that New York Life Investments had taken, or had agreed with the Board to take, to enhance Fund investment performance, and the results of those actions.
Based on these considerations, the Board concluded, within the context of its overall determinations regarding the Agreement, that the long-term investment performance of the Fund, along with ongoing efforts by New York Life Investments to enhance investment returns, supported a determination to approve the Agreement. The Fund discloses more information about investment performance in the Portfolio Management Discussion and Analysis, Investment and Performance Comparison and Financial Highlights sections of this Semiannual Report and in the Fund’s prospectus.
Costs of the Services Provided, and Profits Realized, by New York Life Investments
The Board considered the costs of the services provided by New York Life Investments under the Agreement, and the profits realized by New York Life Investments and its affiliates due to their relationships with the Fund.
In evaluating the costs and profits of New York Life Investments and its affiliates, the Board considered, among other factors, New York Life Investments’ investments in personnel, systems, equipment and other resources necessary to manage the Fund. The Board acknowledged that New York Life Investments must be in a position to pay and retain experienced professional personnel to provide services to the Fund, and
that the ability to maintain a strong financial position is important in order for New York Life Investments to continue to provide high-quality services to the Fund. The Board also noted that the Fund benefits from the allocation of certain fixed costs across the MainStay Group of Funds.
In addition, the Board noted the difficulty in obtaining reliable comparative data about mutual fund managers’ profitability, since such information generally is not publicly available and may be impacted by numerous factors, including the structure of a fund manager’s organization, the types of funds it manages, the methodology used to allocate certain fixed costs to specific funds, and the manager’s capital structure and costs of capital. While recognizing the difficulty in evaluating a manager’s profitability with respect to the Fund, and noting that other profitability methodologies may also be reasonable, the Board concluded that the profitability methodology presented by New York Life Investments to the Board, which was developed by New York Life Investments in consultation with an independent consultant, was reasonable in all material respects.
In considering the costs and profitability of the Fund, the Board also considered certain fall-out benefits that may be realized by New York Life Investments and its affiliates due to their relationships with the Fund.
The Board further considered that, in addition to fees earned by New York Life Investments for managing the Fund, New York Life Investments’ affiliates also earn revenues from serving the Fund in various other capacities, including as the Fund’s transfer agent and distributor. The Board observed that information about these other revenues, and their impact on the profitability of the Fund to New York Life Investments and its affiliates, was furnished to the Board as part of the 15(c) process. The Board noted that, although it assessed the overall profitability of the Fund to New York Life Investments and its affiliates as part of the contract review process, when considering the reasonableness of the fees to be paid to New York Life Investments and its affiliates under the Agreement, the Board considered the profitability of New York Life Investments’ relationship with the Fund on a pre-tax basis, and without regard to distribution expenses.
After evaluating the information presented to the Board, the Board concluded, within the context of its overall determinations regarding the Agreement, that any profits realized by New York Life Investments and its affiliates due to their relationships with the Fund supported the Board’s decision to approve the Agreement.
Extent to Which Economies of Scale May Be Realized as the Fund Grows
The Board also considered whether the Fund’s expense structure permitted economies of scale to be shared with Fund investors. The Board reviewed information from New York Life Investments showing how the Fund’s management fee schedule compared to fee schedules of other funds and accounts managed by New York Life Investments. The Board also reviewed information from Strategic Insight showing how the Fund’s management fee schedule hypothetically would compare with fees paid for similar services by peer funds at varying asset levels. While recognizing the difficulty of determining economies of scale with precision, the Board acknowledged that economies of scale may be shared with the Fund in a number of ways, including, for example,
| | | | |
| mainstayinvestments.com | | | 39 | |
Board Consideration and Approval of Management Agreement (Unaudited) (continued)
through the imposition of management fee breakpoints and by initially setting relatively lower management fees.
Based on this information, the Board concluded, within the context of its overall determinations regarding the Agreement, that the Fund’s expense structure appropriately reflects economies of scale for the benefit of Fund investors. The Board noted, however, that it would continue to evaluate the reasonableness of the Fund’s expense structure as the Fund grows over time.
Management Fees and Total Ordinary Operating Expenses
The Board evaluated the reasonableness of the fees to be paid under the Agreement and the Fund’s expected total ordinary operating expenses.
In assessing the reasonableness of the Fund’s fees and expenses, the Board primarily considered comparative data provided by Strategic Insight on the fees and expenses charged by similar mutual funds managed by other investment advisers. In addition, the Board considered information provided by New York Life Investments on fees charged to other investment advisory clients, including institutional separate accounts and other funds with similar investment objectives as the Fund. The Board particularly considered differences in the contractual management fee schedules of the retail MainStay Funds and similarly-managed MainStay VP Portfolios, taking into account New York Life Investments’ rationale for any differences in fee schedules. The Board also took into account explanations provided by New York Life Investments about the different scope of services provided to mutual funds as compared with other investment advisory clients. Additionally, the Board considered the impact of any expense limitation arrangements on the Fund’s net management fee and expenses. In addition, at the request of the Board, New York Life Investments proposed, and the Board approved, lowering the Fund’s contractual management fee schedule. The Board also requested and received specific information from New York Life Investments regarding the profile of the Fund’s investors, the different components of the Fund’s expenses, and the resources necessary to manage the Fund.
The Board noted that, outside of the Fund’s management fee and the fees charged under a share class’s Rule 12b-1 and/or shareholder services plans, a share class’s most significant “other expenses” are transfer agent fees. Transfer agent fees are charged to the Fund based on the number of shareholder accounts (a “per-account” fee) as compared with certain other fees (e.g., management fees), which are charged based on the Fund’s average net assets. The Board took into account information from New York Life Investments showing that the Fund’s transfer agent fee schedule is reasonable, including industry data showing that the per-account fees that NYLIM Service Company LLC, the Fund’s transfer agent, charges the Fund are within the range of per-account fees charged by transfer agents to other mutual funds. In addition, the Board considered NYLIM Service Company LLC’s profitability in connection with the transfer agent services it provides to the Fund.
The Board acknowledged that, because the Fund’s transfer agent fees are billed on a per-account basis, the impact of transfer agent fees on a share class’s expense ratio may be more significant in cases where the share class has a high number of accounts with limited assets
(i.e., small accounts). The Board observed that transfer agent fees are a significant portion of total expenses of many Funds in the MainStay Group of Funds. The impact of transfer agent fees on the expense ratios of these MainStay Funds tend to be greater than for other open-end retail funds, because the MainStay Group of Funds generally has a significant number of small accounts relative to competitor funds. The Board acknowledged the role that the MainStay Group of Funds historically has played in serving the investment needs of New York Life Insurance Company (“New York Life”) policyholders, who often maintain smaller account balances than other fund investors. The Board discussed measures that it and New York Life Investments have taken in recent years to mitigate the effect of small accounts on the expense ratios of Fund share classes, including: (i) encouraging New York Life agents to consolidate multiple small accounts held by the same investor into one MainStay Asset Allocation Fund account; (ii) increasing investment minimums from $500 to $1,000 in 2003; (iii) introducing Investor Class shares for certain MainStay Funds in early 2008 to consolidate smaller account investors; (iv) closing small accounts with balances below $250 in Investor Class shares or $750 in all other classes of shares; (v) no longer allowing an exception with no minimum investment amount with respect to AutoInvest accounts with subsequent monthly purchases of $100; (vi) since 2007, charging an annual $20.00 small account fee on certain accounts with balances below $1,000; and (vii) modifying the approach for billing transfer agent expenses to reduce the degree of subsidization by large accounts of smaller accounts. In addition, the Board acknowledged New York Life Investments’ efforts to encourage intermediaries to consolidate small accounts in multiple Funds held by the same investor into a single Asset Allocation Fund account, if appropriate under the circumstances, in an effort to mitigate the effect of small accounts on the Funds in the MainStay Group of Funds.
After considering all of the factors outlined above, the Board concluded that the Fund’s management fees and total ordinary operating expenses were within a range that is competitive and, within the context of the Board’s overall conclusions regarding the Agreement, support a conclusion that these fees and expenses are reasonable.
Conclusion
On the basis of the information provided to it and its evaluation thereof, the Board, including the Independent Trustees, unanimously voted to approve the Agreement.
| | |
| 40 | | MainStay Indexed Bond Fund |
Proxy Voting Policies and Procedures and Proxy Voting Record
A description of the policies and procedures that New York Life Investments uses to vote proxies related to the Fund’s securities is available without charge, upon request, (i) by visiting the Fund’s website at mainstayinvestments.com; and (ii) on the SEC’s website at www.sec.gov.
The Fund is required to file with the SEC its proxy voting record for the 12-month period ending June 30 on Form N-PX. The Fund’s most recent Form N-PX is available free of charge upon request by calling 800-MAINSTAY (624-6782); visiting the Fund’s website at www.mainstayinvestments.com; or on the SEC’s website at www.sec.gov.
Shareholder Reports and Quarterly Portfolio Disclosure
The Fund is required to file its complete schedule of portfolio holdings with the SEC for its first and third fiscal quarters on Form N-Q. The Fund’s Form N-Q is available without charge, on the SEC’s website at www.sec.gov or by calling MainStay Investments at 800-MAINSTAY (624-6782). You also can obtain and review copies of Form N-Q by visiting the SEC’s Public Reference Room in Washington, DC (information on the operation of the Public Reference Room may be obtained by calling 1-800-SEC-0330).
| | | | |
| mainstayinvestments.com | | | 41 | |
This page intentionally left blank
MainStay Funds
MainStay offers a wide range of Funds for virtually any investment need. The full array of MainStay open-end offerings is listed here, with information about the manager, subadvisors, legal counsel and independent registered public accounting firms.
Equity
U.S. Equity Funds
MainStay Common Stock Fund
MainStay Cornerstone Growth Fund
MainStay Epoch U.S. All Cap Fund
MainStay Epoch U.S. Equity Yield Fund
MainStay ICAP Equity Fund
MainStay ICAP Select Equity Fund
MainStay Large Cap Growth Fund1
MainStay MAP Fund
MainStay S&P 500 Index Fund
MainStay U.S. Equity Opportunities Fund
MainStay U.S. Small Cap Fund
International/Global Equity Funds
MainStay Epoch Global Choice Fund
MainStay Epoch Global Equity Yield Fund
MainStay Epoch International Small Cap Fund
MainStay ICAP Global Fund
MainStay ICAP International Fund
MainStay International Equity Fund
MainStay International Opportunities Fund
Income
Taxable Bond Funds
MainStay Floating Rate Fund
MainStay Global High Income Fund
MainStay Government Fund
MainStay High Yield Corporate Bond Fund
MainStay High Yield Opportunities Fund
MainStay Indexed Bond Fund
MainStay Intermediate Term Bond Fund
MainStay Short Duration High Yield Fund
MainStay Short Term Bond Fund
MainStay Unconstrained Bond Fund
Municipal Bond Funds
MainStay California Tax Free Opportunities Fund2
MainStay High Yield Municipal Bond Fund
MainStay New York Tax Free Opportunities Fund3
MainStay Tax Free Bond Fund
Money Market Fund
MainStay Money Market Fund
Mixed Asset
MainStay Balanced Fund
MainStay Convertible Fund
MainStay Income Builder Fund
MainStay Marketfield Fund
Asset Allocation/Target Date
MainStay Conservative Allocation Fund
MainStay Growth Allocation Fund
MainStay Moderate Allocation Fund
MainStay Moderate Growth Allocation Fund
MainStay Retirement 2010 Fund
MainStay Retirement 2020 Fund
MainStay Retirement 2030 Fund
MainStay Retirement 2040 Fund
MainStay Retirement 2050 Fund
Manager
New York Life Investment Management LLC
New York, New York
Subadvisors
Cornerstone Capital Management Holdings LLC4
New York, New York
Cornerstone Capital Management LLC4
Bloomington, Minnesota
Epoch Investment Partners, Inc.
New York, New York
Institutional Capital LLC4
Chicago, Illinois
MacKay Shields LLC4
New York, New York
Marketfield Asset Management LLC
New York, New York
Markston International LLC
White Plains, New York
Winslow Capital Management LLC
Minneapolis, Minnesota
Legal Counsel
Dechert LLP
Independent Registered Public Accounting Firms
KPMG LLP
PricewaterhouseCoopers LLP
1. Effective January 13, 2012, the Fund was closed to new investors with certain exceptions.
2. This Fund is only registered for sale in AZ, CA, NV, OR, UT, and WA.
3. This Fund is only registered for sale in CT, DE, FL, MA, NJ, NY, and VT.
4. An affiliate of New York Life Investment Management LLC.
Not part of the Semiannual Report
For more information
800-MAINSTAY (624-6782)
mainstayinvestments.com
The MainStay Funds® are managed by New York Life Investment Management LLC and distributed through NYLIFE Distributors LLC, 169 Lackawanna Avenue, Parsippany, NJ 07054, a wholly owned subsidiary of New York Life Insurance Company. NYLIFE Distributors LLC is a Member FINRA/SIPC.
MainStay Investments® is a registered service mark and name under which New York Life Investment Management LLC does business. MainStay Investments, an indirect subsidiary of New York Life Insurance Company, New York, NY 10010, provides investment advisory products and services.
This report may be distributed only when preceded or accompanied by a current Fund prospectus.
©2013 NYLIFE Distributors LLC. All rights reserved.
| | | | | | | | |
| Not FDIC/NCUA Insured | | Not a Deposit | | May Lose Value | | No Bank Guarantee | | Not Insured by Any Government Agency |
| | |
| NYLIM-30131 MS175-13 | | MSIN10-06/13 NL0B3 |
MainStay Intermediate Term Bond Fund
Message from the President and Semiannual Report
Unaudited | April 30, 2013


This page intentionally left blank
Message from the President
The U.S. stock market advanced during the six months ended April 30, 2013, generally providing double-digit returns at all capitalization levels. Value stocks tended to outpace growth stocks among large- and mid-capitalization companies, while growth stocks tended to outpace value stocks among smaller companies.
The market’s advance, however, was far from uniform. Stocks declined in early November, both before and immediately after the U.S. presidential election. Following a sharp recovery, stocks climbed until mid-December, when a Congressional stalemate on the fiscal cliff led to a brief decline. Another dip occurred in late February as investors speculated that the Federal Open Market Committee (FOMC) might stop purchasing mortgage-backed securities sooner than expected. Stocks also dipped in mid-April, as consumer sentiment dropped after the Boston marathon bombing. Despite these setbacks, U.S. stocks continued to trend upward during the six-month reporting period.
International stock markets also advanced, with several regional differences. Accommodative action by the Bank of Japan helped lower the yen and lift Japanese stocks to their highest levels since 2008. In Europe, stocks did well until early February, bolstered by the promise of support for the euro. As the year progressed, however, economic contraction, rising unemployment and systematic banking concerns took a toll on investor enthusiasm. In China, manufacturing slowed as the nation sought to balance growth and inflation risks. On the Korean peninsula, tensions rose as North Korea continued to threaten its neighbors, which added an undercurrent of caution to the market.
During the six months ended April 30, 2013, the FOMC kept the federal funds rate in a range close to zero. The FOMC also continued its direct purchases of mortgage-backed securities and longer-term U.S. government securities. With short-term interest rates likely to remain at low levels, many bond investors pursued higher yields by lengthening maturities and assuming greater risk. As a result, bonds with higher risk profiles tended
to outperform higher-quality investment-grade bonds and U.S. Treasury securities. Cash and cash equivalents essentially returned zero.
With wide variations in the performance of various asset classes, some investors might be tempted to chase higher returns by shifting back and forth between stocks and bonds. Since no one can predict where the market will move next, however, we encourage investors to select an appropriate mix of investments for their risk tolerance and time horizon and to stick with that mix, making only minor adjustments over time.
At MainStay Funds, our portfolio managers use a similar approach. Careful security selection and thoughtful sell disciplines help them pursue the investment objectives of their respective Funds. Using the principal investment strategies outlined in the Prospectus, they focus primarily on providing long-term investment potential for our shareholders.
Has this approach proved successful? In its most recent rankings, Barron’s listed MainStay Funds as the #1 fund family over the past 10 years. We were also the only mutual fund family that has appeared in Barron’s top six for the past five consecutive years.
The pages that follow provide additional insight into the specific market events, investment decisions and securities that shaped your MainStay Fund(s) during the six months ended April 30, 2013. We encourage you to read the semiannual report(s) carefully and to evaluate your results with your long-term financial goals in mind.
Sincerely,

Stephen P. Fisher
President
The opinions expressed are as of the date of this report and are subject to change. There is no guarantee that any forecast made will come to pass. This material does not constitute investment advice and is not intended as an endorsement of any specific investment.
To qualify for the Lipper/Barron’s Fund Survey, a fund family must have at least three funds in Lipper’s general U.S.-stock category, one in world equity (which combines global and international funds), one mixed-equity fund (which holds stocks and bonds), two taxable-bond funds, and one tax-exempt fund. Fund loads and 12b-1 fees aren’t included in the calculation of returns because the aim is to measure the manager’s skill. Each fund’s return is measured against all funds in its Lipper category, resulting in a percentile ranking which is then weighted by asset size relative to the fund family’s other assets in its general classifications. Finally, the score is multiplied by the general classification weightings as determined by the entire Lipper universe of funds.
Source: Barron’s, 2/9/13. Overall, MainStay Funds ranked number 56 for the one-year period, 20 for the five-year period and one for the 10-year period ended December 31, 2012, out of 62, 53 and 46 fund families, respectively. MainStay ranked number three for the 10-year period in 2009, 2010 and 2011 from among 48, 46 and 45 fund families, respectively. MainStay ranked number six from among 48 fund families for the 10-year period in 2008. Past performance is no guarantee of future results, which will vary. For the most recent MainStay Funds performance, please visit our website at mainstayinvestments.com. All mutual funds are subject to market risk and will fluctuate in value.
Not part of the Semiannual Report
Table of Contents
Investors should refer to the Fund’s Summary Prospectus and/or Prospectus and consider the Fund’s investment objectives, strategies, risks, charges and expenses carefully before investing. The Summary Prospectus and/or Prospectus contain this and other information about the Fund. You may obtain copies of the Fund’s Summary Prospectus, Prospectus and Statement of Additional Information free of charge, upon request, by calling toll-free 800-MAINSTAY (624-6782), by writing to NYLIFE Distributors LLC, Attn: MainStay Marketing Department, 169 Lackawanna Avenue, Parsippany, New Jersey 07054 or by sending an e-mail to MainStayShareholderServices@nylim.com. These documents are also available via the MainStay Funds’ website at mainstayinvestments.com/documents. Please read the Summary Prospectus and/or Prospectus carefully before investing.
Investment and Performance Comparison1 (Unaudited)
Performance data quoted represents past performance. Past performance is no guarantee of future results. Because of market volatility, current performance may be lower or higher than the figures shown. Investment return and principal value will fluctuate, and as a result, when shares are redeemed, they may be worth more or less than their original cost. The graph below depicts the historical performance of Class I shares of the Fund. Performance will vary from class to class based on differences in class-specific expenses and sales charges. For performance information current to the most recent month-end, please call 800-MAINSTAY (624-6782) or visit mainstayinvestments.com.
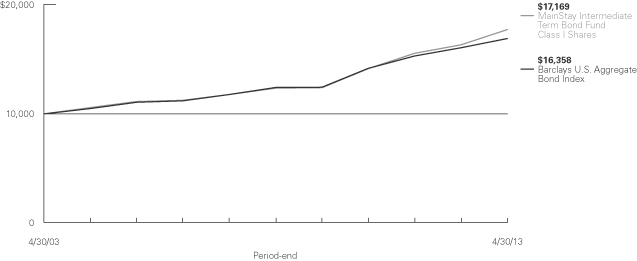
Average Annual Total Returns for the Period Ended April 30, 2013
| | | | | | | | | | | | | | | | | | | | | | | | |
| Class | | Sales Charge | | | | Six Months | | | One Year | | | Five Years | | | Ten Years | | | Gross
Expense
Ratio2 | |
| Investor Class Shares3 | | Maximum 4.5% Initial Sales Charge | | With sales charges Excluding sales charges | |
| –2.92
1.66 | %
| |
| 1.47
6.26 | %
| |
| 5.69
6.67 | %
| |
| 4.65
5.13 | %
| |
| 1.09
1.09 | %
|
| Class A Shares4 | | Maximum 4.5% Initial Sales Charge | | With sales charges Excluding sales charges | |
| –2.86
1.72 |
| |
| 1.52
6.31 |
| |
| 5.82
6.80 |
| |
| 4.71
5.19 |
| |
| 0.98
0.98 |
|
| Class B Shares4 | | Maximum 5% CDSC if Redeemed Within the First Six Years of Purchase | | With sales charges Excluding sales charges | |
| –3.71
1.29 |
| |
| 0.40
5.40 |
| |
| 5.54
5.86 |
| |
| 4.35
4.35 |
| |
| 1.84
1.84 |
|
| Class C Shares4 | | Maximum 1% CDSC if Redeemed Within One Year of Purchase | | With sales charges Excluding sales charges | |
| 0.20
1.19 |
| |
| 4.39
5.39 |
| |
| 5.86
5.86 |
| |
| 4.36
4.36 |
| |
| 1.84
1.84 |
|
| Class I Shares | | No Sales Charge | | | | | 1.86 | | | | 6.70 | | | | 7.15 | | | | 5.55 | | | | 0.73 | |
| Class R1 Shares5 | | No Sales Charge | | | | | 1.79 | | | | 6.57 | | | | 7.04 | | | | 5.45 | | | | 0.82 | |
| Class R2 Shares5 | | No Sales Charge | | | | | 1.67 | | | | 6.31 | | | | 6.77 | | | | 5.18 | | | | 1.07 | |
| 1. | The performance table and graph do not reflect the deduction of taxes that a shareholder would pay on dividends, distributions or Fund share redemptions. Total returns reflect maximum applicable sales charges as indicated in the table above, changes in share price, and reinvestment of dividend and capital gain distributions. The graph assumes the initial investment amount shown above and reflects the deduction of all sales charges that would have applied for the period of investment. Performance figures reflect certain fee waivers and/or expense limitations, without which total returns may have been lower. For more information on share classes and current fee waivers and/or expense limitations, please refer to the notes to the financial statements. |
| 2. | The gross expense ratios presented reflect the Fund’s “Total Annual Fund Operating Expenses” from the most recent Prospectus and may differ from other expense ratios disclosed in this report. |
| 3. | Performance figures for Investor Class shares, first offered on February 28, 2008, include the historical performance of Class A shares through February 27, 2008, adjusted for differences in certain fees and expenses. Unadjusted, the performance shown for Investor Class shares would likely have been different. |
| 4. | Performance figures for Class A, B and C shares, first offered on January 2, 2004, include the historical performance of Class I shares through January 1, 2004, adjusted for differences in certain expenses and fees. Unadjusted, the performance shown for Class A, B and C shares would likely have been different. |
| 5. | Performance figures for Class R1 and Class R2 shares, first offered on June 29, 2012, include the historical performance of Class I shares through June 28, 2012, adjusted for differences in certain fees and expenses. Unadjusted, the performance shown for Class R1 and Class R2 shares would likely have been different. |
The footnotes on the next page are an integral part of the table and graph and should be carefully read in conjunction with them.
| | | | |
| mainstayinvestments.com | | | 5 | |
| | | | | | | | | | | | | | | | |
| Benchmark Performance | | Six
Months | | | One
Year | | | Five
Years | | | Ten
Years | |
Barclays U.S. Aggregate Bond Index6 | | | 0.90 | % | | | 3.68 | % | | | 5.72 | % | | | 5.04 | % |
Average Lipper Intermediate Investment Grade Debt Fund7 | | | 1.56 | | | | 5.52 | | | | 6.03 | | | | 4.81 | |
| 6. | The Barclays U.S. Aggregate Bond Index is a broad-based benchmark that measures the investment grade, U.S. dollar-denominated, fixed-rate taxable bond market, including Treasurys, government-related and corporate securities, mortgage-backed securities (agency fixed-rate and hybrid adjustable rate mortgage pass-throughs), asset-backed securities, and commercial mortgage-backed securities. The Barclays U.S. Aggregate Bond Index is the Fund’s broad-based securities market index for comparison purposes. Results assume reinvestment of all income and capital gains. An investment cannot be made directly in an index. |
| 7. | The average Lipper intermediate investment grade debt fund is representative of funds that invest primarily in investment grade debt issues (rated in the top four grades) with dollar-weighted average maturities of five to ten years. This benchmark is a product of Lipper Inc. Lipper Inc. is an independent monitor of fund performance. Results are based on average total returns of similar funds with all dividend and capital gain distributions reinvested. |
The footnotes on the preceding page are an integral part of the table and graph and should be carefully read in conjunction with them.
| | |
| 6 | | MainStay Intermediate Term Bond Fund |
Cost in Dollars of a $1,000 Investment in MainStay Intermediate Term Bond Fund (Unaudited)
The example below is intended to describe the fees and expenses borne by shareholders during the six-month period from November 1, 2012, to April 30, 2013, and the impact of those costs on your investment.
Example
As a shareholder of the Fund, you incur two types of costs: (1) transaction costs, including exchange fees and sales charges (loads) on purchases (as applicable), and (2) ongoing costs, including management fees, distribution and/or service (12b-1) fees, and other Fund expenses (as applicable). This example is intended to help you understand your ongoing costs (in dollars) of investing in the Fund and to compare these costs with the ongoing costs of investing in other mutual funds. The example is based on an investment of $1,000 made at the beginning of the six-month period and held for the entire period from November 1, 2012, to April 30, 2013.
This example illustrates your Fund’s ongoing costs in two ways:
Actual Expenses
The second and third data columns in the table below provide information about actual account values and actual expenses. You may use the information in these columns, together with the amount you invested, to estimate the expenses that you paid during the six months ended April 30, 2013. Simply divide your account value by $1,000 (for example, an $8,600 account value divided by $1,000 = 8.6), then
multiply the result by the number under the heading entitled “Expenses Paid During Period” to estimate the expenses you paid on your account during this period.
Hypothetical Example for Comparison Purposes
The fourth and fifth data columns in the table below provide information about hypothetical account values and hypothetical expenses based on the Fund’s actual expense ratio and an assumed rate of return of 5% per year before expenses, which is not the Fund’s actual return. The hypothetical account values and expenses may not be used to estimate the actual ending account balances or expenses you paid for the six-month period shown. You may use this information to compare the ongoing costs of investing in the Fund with the ongoing costs of investing in other Funds. To do so, compare this 5% hypothetical example with the 5% hypothetical examples that appear in the shareholder reports of the other Funds.
Please note that the expenses shown in the table are meant to highlight your ongoing costs only and do not reflect any transactional costs, such as exchange fees or sales charges (loads). Therefore, the fourth and fifth data columns of the table are useful in comparing ongoing costs only and will not help you determine the relative total costs of owning different funds. In addition, if these transactional costs were included, your costs would have been higher.
| | | | | | | | | | | | | | | | | | | | |
| | | | | | | | | | | | | | | | |
| Share Class | | Beginning
Account
Value
11/1/12 | | | Ending Account
Value (Based
on Actual
Returns and
Expenses)
4/30/13 | | | Expenses
Paid
During
Period1 | | | Ending Account
Value (Based
on Hypothetical
5% Annualized
Return and
Actual Expenses)
4/30/13 | | | Expenses
Paid
During
Period1 | |
| | | | | |
| Investor Class Shares | | $ | 1,000.00 | | | $ | 1,016.60 | | | $ | 4.90 | | | $ | 1,019.90 | | | $ | 4.91 | |
| | | | | |
| Class A Shares | | $ | 1,000.00 | | | $ | 1,017.20 | | | $ | 4.40 | | | $ | 1,020.40 | | | $ | 4.41 | |
| | | | | |
| Class B Shares | | $ | 1,000.00 | | | $ | 1,012.90 | | | $ | 8.63 | | | $ | 1,016.20 | | | $ | 8.65 | |
| | | | | |
| Class C Shares | | $ | 1,000.00 | | | $ | 1,011.90 | | | $ | 8.63 | | | $ | 1,016.20 | | | $ | 8.65 | |
| | | | | |
| Class I Shares | | $ | 1,000.00 | | | $ | 1,018.60 | | | $ | 3.00 | | | $ | 1,021.80 | | | $ | 3.01 | |
| | | | | |
| Class R1 Shares | | $ | 1,000.00 | | | $ | 1,017.90 | | | $ | 3.65 | | | $ | 1,021.20 | | | $ | 3.66 | |
| | | | | |
| Class R2 Shares | | $ | 1,000.00 | | | $ | 1,016.70 | | | $ | 4.85 | | | $ | 1,020.00 | | | $ | 4.86 | |
| 1. | Expenses are equal to the Fund’s annualized expense ratio of each class (0.98% for Investor Class, 0.88% for Class A, 1.73% for Class B and Class C, 0.60% for Class I, 0.73% for Class R1 and 0.97% for Class R2) multiplied by the average account value over the period, divided by 365 and multiplied by 181 (to reflect the six-month period). The table above represents the actual expenses incurred during the six-month period. |
| | | | |
| mainstayinvestments.com | | | 7 | |
Portfolio Composition as of April 30, 2013 (Unaudited)
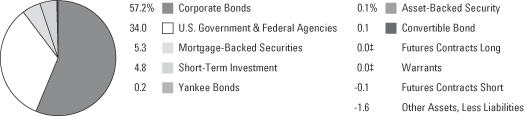
See Portfolio of Investments beginning on page 12 for specific holdings within these categories
| ‡ | Less than one-tenth of a percent. |
Top Ten Issuers Held as of April 30, 2013 (excluding short-term investment)
| 1. | Federal National Mortgage Association (Mortgage Pass-Through Securities), 3.50%–6.50%, due 2/1/17–5/1/43 |
| 2. | Federal Home Loan Mortgage Corporation (Mortgage Pass-Through Securities), 2.375%–6.50%, due 1/1/21–6/1/42 |
| 3. | United States Treasury Bonds, 2.75%–6.25%, due 5/15/30–11/15/42 |
| 4. | Government National Mortgage Association (Mortgage Pass-Through Securities), 4.00%–6.50%, due 7/15/28–11/20/40 |
| 5. | Morgan Stanley, 3.75%–6.00%, due 4/1/14–2/25/23 |
| 6. | Energy Transfer Partners, L.P., 5.20%–9.70%, due 4/15/14–6/1/41 |
| 7. | Countrywide Financial Corp., 6.25%, due 5/15/16 |
| 8. | Citigroup, Inc., 5.875%–8.50%, due 5/22/19–1/30/42 |
| 9. | CIT Group, Inc., 5.00%–6.625%, due 9/15/14–4/1/18 |
| 10. | AgriBank FCB, 9.125%, due 7/15/19 |
| | |
| 8 | | MainStay Intermediate Term Bond Fund |
Portfolio Management Discussion and Analysis
Questions answered by portfolio managers Dan Roberts, PhD, and Louis N. Cohen of MacKay Shields LLC, the Fund’s Subadvisor.
How did MainStay Intermediate Term Bond Fund perform relative to its peers and its benchmark during the six months ended April 30, 2013?
Excluding all sales charges, MainStay Intermediate Term Bond Fund returned 1.66% for Investor Class shares, 1.72% for Class A shares, 1.29% for Class B shares and 1.19% for Class C shares for the six months ended April 30, 2013. Over the same period, the Fund’s Class I shares returned 1.86%, Class R1 shares returned 1.79% and Class R2 shares returned 1.67%. With the exception of Class B and Class C shares, all shares classes outperformed the 1.56% return of the average Lipper1 intermediate investment grade debt fund for the six months ended April 30, 2013. Over the same period, all share classes outperformed the 0.90% return of the Barclays U.S. Aggregate Bond Index.2 The Barclays U.S. Aggregate Bond Index is the Fund’s broad-based securities-market index. See page 5 for Fund returns with applicable sales charges.
What factors affected the Fund’s relative performance during the reporting period?
The Fund’s allocation to spread3 product affects performance when the compensation demanded for credit risk or interest-rate risk rises or falls. In a stressed market where investors seek safe harbors, the market demands more compensation for risk, enabling defensively postured portfolios to outperform as prices for riskier assets fall. In a market with an appetite for risk, the risk premium for spread product falls, leading to tighter spreads, higher prices for risk assets and superior returns for aggressively-postured portfolios. Peer funds that were more defensively postured than the Fund—either through reduced commitments to credit risk or shorter portfolio durations—would have been disadvantaged during the period. Peer funds that were more aggressively postured—with larger commitments to credit-sensitive sectors such as high-yield corporate bonds or securitizations of non-conforming residential mortgages—would likely have had better performance than the Fund.
The Fund outperformed the Barclays U.S. Aggregate Bond Index during the reporting period for several reasons:
| • | | Overweight positions in credit-related sectors (investment-grade corporate bonds, high-yield corporate bonds and commercial mortgage-backed securities) gave the Fund a yield advantage relative to the Barclays U.S. Aggregate Bond Index. |
| • | | Corporate bonds (especially those rated below A)4 and commercial mortgage-backed securities posted strong performance during the reporting period for two reasons. First, the outlook for credit-related sectors aligns with the decision of the Federal Reserve’s monetary policymaking committee to maintain the federal funds rate in a range close to zero. Second, low interest rates sparked healthy demand for higher-yielding products. |
| • | | Within the investment-grade corporate bond sector, an emphasis on bonds rated BBB5 led to gains relative to the Index. |
| • | | The Fund’s underweight position in residential mortgages was a positive contributor to performance during the reporting period. Prices of agency mortgage pass-through securities6 weakened when the Federal Reserve commented that the pace of its mortgage purchase program depends on the strength of the economy. Economic releases exceeded expectations in January and February 2013, leading to the possibility of the Federal Reserve reducing its commitment to purchasing agency mortgage-backed securities. |
| • | | The Fund’s concentration of assets positioned toward the center of the U.S. Treasury yield curve7 contrasted with the more uniform yield curve distribution of the Barclays U.S. Aggregate Bond Index. During the reporting period, U.S. Treasury yields fell faster in the center of the curve than at the short end or the long end. The Fund’s yield curve posture aligned well with this trajectory. |
| 1. | See footnote on page 6 for more information on Lipper Inc. |
| 2. | See footnote on page 6 for more information on the Barclays U.S. Aggregate Bond Index. |
| 3. | The terms “spread” and “yield spread” may refer to the difference in yield between a security or type of security and comparable U.S. Treasury issues. The term may also refer to the difference in yield between two specific securities or types of securities at a given time. |
| 4. | An obligation rated ‘A’ by Standard & Poor’s (S&P) is deemed by S&P to be somewhat more susceptible to the adverse effects of changes in circumstances and economic conditions than obligations in higher-rated categories. In the opinion of S&P, however, the obligor’s capacity to meet its financial commitment on the obligation is still strong. When applied to Fund holdings ratings are based solely on the creditworthiness of the bonds in the portfolio and are not meant to represent the security or safety of the Fund. |
| 5. | An obligation rated ‘BBB’ by S&P is deemed by S&P to exhibit adequate protection parameters. It is the opinion of S&P, however, that adverse economic conditions or changing circumstances are more likely to lead to a weakened capacity of the obligor to meet its financial commitment on the obligation than would be the case for debt in higher-rated categories. When applied to Fund holdings ratings are based solely on the creditworthiness of the bonds in the portfolio and are not meant to represent the security or safety of the Fund. |
| 6. | Mortgage pass-through securities consist of a pool of residential mortgage loans in which homeowners’ monthly payments of principal, interest and prepayments pass from the original bank through a government agency or an investment bank to investors. |
| 7. | The yield curve is a line that plots the yields of various securities of similar quality—typically U.S. Treasury issues—across a range of maturities. The U.S. Treasury yield curve serves as a benchmark for other debt and is used in economic forecasting. |
| | | | |
| mainstayinvestments.com | | | 9 | |
During the reporting period, the Fund had a shorter duration8 than the Barclays U.S. Aggregate Bond Index. This positioning detracted from the Fund’s relative performance as U.S. Treasury yields declined.
What was the Fund’s duration strategy during the reporting period?
The Fund maintains an intermediate duration that seeks to track the duration of the Barclays U.S. Aggregate Index within 10%. At the end of the reporting period, the Fund had a duration of approximately 4.95 years, about a quarter of a year shorter than the Barclays U.S. Aggregate Bond Index. To keep the Fund nearly fully invested while maintaining a short duration posture, we executed the duration tilt with a short position in U.S. Treasury futures.
What specific factors, risks or market forces prompted significant decisions for the Fund during the reporting period?
We promoted credit risk as the principal driver of performance during the reporting period. We expected corporate bonds (both investment-grade and high-yield) and commercial mortgage-backed securities to have returns superior to those of government-related debt for three reasons. First, we believed that the prospects of the credit-related sectors were aligned with the decision of the Federal Reserve’s monetary policymaking committee to maintain the federal funds target rate in a range close to zero. Second, we felt that low interest rates would be likely to spark healthy demand for higher-yielding products. Third, improving profitability signaled that corporations were doing more with less: less leverage, less short-term debt and smaller funding gaps. In our opinion, these improving credit fundamentals supported a narrowing of spreads alongside a favorable balance of supply and demand for corporate bonds. The strong performance of the stock market also buoyed the returns of corporate bonds across the credit-quality spectrum.
During the reporting period, which market segments were the strongest contributors to the Fund’s performance and which market segments were particu- larly weak?
During the reporting period, an overweight position relative to the Barclays U.S. Aggregate Bond Index in moderate-quality corporate bonds was a strong contributor to performance. (Contributions take weightings and total returns into account.) The bonds that made up this position benefited from their respective yields and from spread tightening in relation to comparable-duration U.S. Treasury securities.
In the corporate bond sector, the better-performing industries were financials, utilities and basic materials. Financial companies, such as Citigroup, Regions Bank, Genworth Financial and Discover Bank benefited from restructurings, greater clarity on litigation issues and moderating losses from nonperforming loans. In utilities, companies like Allegheny, which derive revenue from nonregulated businesses like power generation, benefited as power prices stabilized. In basic materials, Cliffs Natural Materials performed well as it cut capital expenditures to rationalize capacity in light of a possible slowdown in larger developing economies like China. Reduced capital expenditures also served to strengthen the company’s balance sheet.
The Fund’s underweight position in residential mortgages relative to the Barclays U.S. Aggregate Bond Index was beneficial, as these securities generally lagged the Index. The high dollar prices at which agency mortgage pass-throughs were trading at the beginning of the period limited price appreciation. In addition, investors were worried about two emerging themes: the possibility of faster prepayment rates as new government policies lowered refinancing barriers and the tapering of the Federal Reserve’s agency mortgage purchase program.
Several of the Fund’s corporate bond holdings detracted from the Fund’s performance. Frontier Communications and Kraft Foods, for example, experienced volatile price action explained by disruptive reorganizations. An increasingly restrictive global regulatory environment weighed on the near-term outlook for some corporate issuers, such as Philip Morris International. Sectors with stable and recurring cash flows and high-quality assets approached tight spread levels. An example is the pipeline industry, where companies such Kinder Morgan, Oneok and Energy Transfer Partners underperformed as investors preferred to stretch for yield rather than look to stability.
Since the Barclays U.S. Aggregate Index does not contain high-yield securities, our exposure to high-yield corporate bonds—which outperformed the Index—enhanced relative returns during the reporting period. Because the Fund tends to be somewhat defensive, however, our high-yield holdings tended to underperform high-yield bonds in general and may have underperformed high-yield components in peer funds.
How did the Fund’s sector weightings change during the reporting period?
During the reporting period, we reallocated 2% of the Fund’s assets from securitized product to investment-grade corporate bonds. Other adjustments generally fell into three categories:
| 8. | Duration is a measure of the price sensitivity of a fixed-income investment to changes in interest rates. Duration is expressed as a number of years and is considered a more accurate sensitivity gauge than average maturity. |
| | |
| 10 | | MainStay Intermediate Term Bond Fund |
corporate-bond swaps to execute relative-value ideas, purchases of agency mortgage-backed securities to recycle mortgage principal payments, and mortgage dollar rolls.9
How was the Fund positioned at the end of the reporting period?
As of April 30, 2013, the Fund held overweight positions relative to the Barclays U.S. Aggregate Bond Index in high-yield
corporate bonds, investment-grade corporate bonds and commercial mortgage-backed securities. On the same date, the Fund held underweight positions relative to the Index in U.S. Treasury securities, agency debentures and agency mortgage-backed securities. The Fund benefited by emphasizing credit-sensitive and commercial sectors and deemphasizing lower-yielding sectors, such as U.S. Treasury securities, agency debentures and cash.
| 9. | A mortgage dollar roll is a transaction in which a Fund sells mortgage-related securities from its portfolio to a counterparty from whom it simultaneously agrees to buy a similar security on a delayed delivery basis. A Fund is required to segregate liquid assets having a value not less than the repurchase price. Mortgage dollar roll transactions involve certain risks, including the risk that the mortgage-backed security returned to the Fund at the end of the roll, while substantially similar, could be inferior to what was initially sold to the counterparty. |
The opinions expressed are those of the portfolio managers as of the date of this report and are subject to change. There is no guarantee that any forecast made will come to pass. This material does not constitute investment advice and is not intended as an endorsement of any specific investment.
| | | | |
| mainstayinvestments.com | | | 11 | |
Portfolio of Investments April 30, 2013 (Unaudited)
| | | | | | | | |
| | | Principal
Amount | | | Value | |
| | | | | | | | |
Long-Term Bonds 96.9%† Asset-Backed Security 0.1% | |
Utilities 0.1% | | | | | | | | |
Atlantic City Electric Transition Funding LLC Series 2002-1, Class A4
5.55%, due 10/20/23 | | $ | 675,000 | | | $ | 815,192 | |
| | | | | | | | |
Total Asset-Backed Security (Cost $674,797) | | | | | | | 815,192 | |
| | | | | | | | |
| | |
| Convertible Bond 0.1% | | | | | | | | |
Holding Company-Diversified 0.1% | | | | | | | | |
Icahn Enterprises, L.P.
4.00%, due 8/15/13 (a) | | | 1,200,000 | | | | 1,200,000 | |
| | | | | | | | |
Total Convertible Bond
(Cost $1,205,984) | | | | | | | 1,200,000 | |
| | | | | | | | |
| | |
| Corporate Bonds 57.2% | | | | | | | | |
Advertising 0.2% | | | | | | | | |
Lamar Media Corp. | | | | | | | | |
7.875%, due 4/15/18 | | | 170,000 | | | | 185,725 | |
9.75%, due 4/1/14 | | | 1,175,000 | | | | 1,263,125 | |
| | | | | | | | |
| | | | 1,448,850 | |
| | | | | | | | |
Aerospace & Defense 0.1% | | | | | | | | |
Alliant Techsystems, Inc.
6.875%, due 9/15/20 | | | 589,000 | | | | 639,801 | |
GenCorp, Inc.
7.125%, due 3/15/21 (b) | | | 595,000 | | | | 641,113 | |
| | | | | | | | |
| | | | 1,280,914 | |
| | | | | | | | |
Agriculture 1.7% | | | | | | | | |
Altria Group, Inc.
9.25%, due 8/6/19 | | | 470,000 | | | | 655,754 | |
Bunge, Ltd. Finance Corp. | | | | | | | | |
4.10%, due 3/15/16 | | | 2,200,000 | | | | 2,352,960 | |
5.10%, due 7/15/15 | | | 2,000,000 | | | | 2,156,056 | |
Cargill, Inc. | | | | | | | | |
4.307%, due 5/14/21 (b) | | | 3,000,000 | | | | 3,377,079 | |
6.00%, due 11/27/17 (b) | | | 1,050,000 | | | | 1,267,692 | |
7.35%, due 3/6/19 (b) | | | 540,000 | | | | 691,715 | |
Lorillard Tobacco Co.
8.125%, due 6/23/19 | | | 720,000 | | | | 921,816 | |
Philip Morris International, Inc.
4.375%, due 11/15/41 | | | 3,175,000 | | | | 3,330,909 | |
| | | | | | | | |
| | | | 14,753,981 | |
| | | | | | | | |
Apparel 0.2% | | | | | | | | |
VF Corp.
3.50%, due 9/1/21 | | | 1,360,000 | | | | 1,466,663 | |
| | | | | | | | |
| | | | | | | | |
| | | Principal
Amount | | | Value | |
| | | | | | | | |
Auto Manufacturers 0.7% | | | | | | | | |
Ford Motor Co. | | | | | | | | |
7.45%, due 7/16/31 | | $ | 2,095,000 | | | $ | 2,787,559 | |
9.215%, due 9/15/21 | | | 2,355,000 | | | | 3,165,895 | |
| | | | | | | | |
| | | | 5,953,454 | |
| | | | | | | | |
Auto Parts & Equipment 0.3% | | | | | | | | |
Continental Rubber of America Corp.
4.50%, due 9/15/19 (b) | | | 600,000 | | | | 622,800 | |
Schaeffler Finance B.V. | | | | | | | | |
7.75%, due 2/15/17 (b) | | | 885,000 | | | | 1,005,582 | |
8.50%, due 2/15/19 (b) | | | 625,000 | | | | 713,281 | |
| | | | | | | | |
| | | | 2,341,663 | |
| | | | | | | | |
Banks 8.9% | | | | | | | | |
¨AgriBank FCB
9.125%, due 7/15/19 | | | 5,795,000 | | | | 7,817,188 | |
Ally Financial, Inc. | | | | | | | | |
4.625%, due 6/26/15 | | | 527,000 | | | | 555,326 | |
5.50%, due 2/15/17 | | | 722,000 | | | | 786,926 | |
6.25%, due 12/1/17 | | | 53,000 | | | | 60,150 | |
7.50%, due 9/15/20 | | | 295,000 | | | | 364,325 | |
Banco Santander Mexico S.A. Institucion De Banca Multiple Grupo Financiero Santand
4.125%, due 11/9/22 (b) | | | 5,920,000 | | | | 5,964,400 | |
Bank of America Corp. | | | | | | | | |
3.30%, due 1/11/23 | | | 680,000 | | | | 688,724 | |
5.70%, due 1/24/22 | | | 415,000 | | | | 494,637 | |
5.75%, due 8/15/16 | | | 1,400,000 | | | | 1,561,351 | |
BBVA Bancomer S.A.
6.75%, due 9/30/22 (b) | | | 3,750,000 | | | | 4,312,500 | |
¨CIT Group, Inc. | |
5.00%, due 9/15/14 | | | 1,250,000 | | | | 1,310,493 | |
6.625%, due 4/1/18 (b) | | | 5,585,000 | | | | 6,520,487 | |
¨Citigroup, Inc. | |
5.875%, due 1/30/42 | | | 2,020,000 | | | | 2,533,304 | |
6.125%, due 8/25/36 | | | 4,579,000 | | | | 5,274,738 | |
8.50%, due 5/22/19 | | | 466,500 | | | | 627,541 | |
Discover Bank | | | | | | | | |
7.00%, due 4/15/20 | | | 3,550,000 | | | | 4,436,034 | |
8.70%, due 11/18/19 | | | 474,000 | | | | 636,801 | |
Fifth Third Bancorp
5.45%, due 1/15/17 | | | 1,477,000 | | | | 1,664,684 | |
Goldman Sachs Group, Inc. (The) | | | | | | | | |
3.625%, due 1/22/23 | | | 2,850,000 | | | | 2,956,433 | |
5.95%, due 1/18/18 | | | 1,000,000 | | | | 1,167,890 | |
JPMorgan Chase & Co. | | | | | | | | |
5.125%, due 9/15/14 | | | 2,140,000 | | | | 2,267,315 | |
5.15%, due 10/1/15 | | | 1,000,000 | | | | 1,087,320 | |
7.90%, due 12/31/49 (a) | | | 3,750,000 | | | | 4,367,467 | |
| † | Percentages indicated are based on Fund net assets. |
| ¨ | | Among the Fund’s 10 largest issuers held, as of April 30, 2013, excluding short-term investment. May be subject to change daily. |
| | | | |
| 12 | | MainStay Intermediate Term Bond Fund | | The notes to the financial statements are an integral part of,
and should be read in conjunction with, the financial statements. |
| | | | | | | | |
| | | Principal
Amount | | | Value | |
| | | | | | | | |
| Corporate Bonds (continued) | | | | | | | | |
Banks (continued) | | | | | | | | |
KeyBank N.A.
5.80%, due 7/1/14 | | $ | 3,765,000 | | | $ | 3,987,026 | |
¨Morgan Stanley | |
3.75%, due 2/25/23 | | | 2,830,000 | | | | 2,937,099 | |
4.75%, due 4/1/14 | | | 3,135,000 | | | | 3,234,129 | |
4.875%, due 11/1/22 | | | 3,820,000 | | | | 4,117,887 | |
5.625%, due 9/23/19 | | | 285,000 | | | | 332,010 | |
6.00%, due 5/13/14 | | | 1,490,000 | | | | 1,567,704 | |
6.00%, due 4/28/15 | | | 300,000 | | | | 326,931 | |
Regions Bank | | | | | | | | |
6.45%, due 6/26/37 | | | 1,985,000 | | | | 2,178,537 | |
7.50%, due 5/15/18 | | | 1,985,000 | | | | 2,462,430 | |
UBS A.G.
3.875%, due 1/15/15 | | | 215,000 | | | | 226,023 | |
| | | | | | | | |
| | | | | | | 78,825,810 | |
| | | | | | | | |
Beverages 0.6% | | | | | | | | |
Anheuser-Busch InBev Worldwide, Inc.
7.75%, due 1/15/19 | | | 2,000,000 | | | | 2,638,278 | |
Constellation Brands, Inc. | | | | | | | | |
7.25%, due 9/1/16 | | | 1,723,000 | | | | 1,981,450 | |
8.375%, due 12/15/14 | | | 1,061,000 | | | | 1,172,405 | |
| | | | | | | | |
| | | | | | | 5,792,133 | |
| | | | | | | | |
Building Materials 0.1% | | | | | | | | |
Texas Industries, Inc.
9.25%, due 8/15/20 | | | 400,000 | | | | 445,500 | |
USG Corp.
6.30%, due 11/15/16 | | | 630,000 | | | | 670,950 | |
| | | | | | | | |
| | | | | | | 1,116,450 | |
| | | | | | | | |
Chemicals 0.8% | | | | | | | | |
Dow Chemical Co. (The)
8.55%, due 5/15/19 | | | 1,015,000 | | | | 1,368,548 | |
NOVA Chemicals Corp.
8.625%, due 11/1/19 | | | 492,000 | | | | 556,575 | |
Olin Corp.
8.875%, due 8/15/19 | | | 170,000 | | | | 190,400 | |
Rhodia S.A.
6.875%, due 9/15/20 (b) | | | 3,880,000 | | | | 4,410,384 | |
Rockwood Specialties Group, Inc.
4.625%, due 10/15/20 | | | 585,000 | | | | 617,175 | |
| | | | | | | | |
| | | | | | | 7,143,082 | |
| | | | | | | | |
Coal 0.2% | | | | | | | | |
CONSOL Energy, Inc. | | | | | | | | |
6.375%, due 3/1/21 | | | 515,000 | | | | 538,175 | |
8.00%, due 4/1/17 | | | 805,000 | | | | 871,413 | |
Peabody Energy Corp.
7.375%, due 11/1/16 | | | 441,000 | | | | 504,945 | |
| | | | | | | | |
| | | | | | | 1,914,533 | |
| | | | | | | | |
| | | | | | | | |
| | | Principal
Amount | | | Value | |
| | | | | | | | |
Commercial Services 0.0%‡ | | | | | | | | |
PHH Corp.
9.25%, due 3/1/16 | | $ | 360,000 | | | $ | 422,100 | |
Quebecor World, Inc. (Litigation Recovery Trust—Escrow Shares)
9.75%, due 8/1/49 (b)(c)(d)(e) | | | 15,000 | | | | 240 | |
| | | | | | | | |
| | | | | | | 422,340 | |
| | | | | | | | |
Computers 0.5% | | | | | | | | |
Hewlett-Packard Co.
2.20%, due 12/1/15 | | | 4,000,000 | | | | 4,086,756 | |
iGATE Corp.
9.00%, due 5/1/16 | | | 310,000 | | | | 337,900 | |
SunGard Data Systems, Inc.
4.875%, due 1/15/14 | | | 10,000 | | | | 10,175 | |
| | | | | | | | |
| | | | | | | 4,434,831 | |
| | | | | | | | |
Diversified Financial Services 1.1% | | | | | | | | |
Alterra Finance LLC
6.25%, due 9/30/20 | | | 2,900,000 | | | | 3,444,463 | |
General Electric Capital Corp.
5.40%, due 2/15/17 | | | 2,985,000 | | | | 3,430,795 | |
TNK-BP Finance S.A.
7.25%, due 2/2/20 (b) | | | 2,770,000 | | | | 3,320,538 | |
| | | | | | | | |
| | | | | | | 10,195,796 | |
| | | | | | | | |
Electric 3.8% | | | | | | | | |
Abu Dhabi National Energy Co.
6.25%, due 9/16/19 (b) | | | 185,000 | | | | 222,231 | |
AES Corp. (The)
7.75%, due 10/15/15 | | | 620,000 | | | | 709,900 | |
Calpine Construction Finance Co., L.P. / CCFC Finance Corp.
8.00%, due 6/1/16 (b) | | | 1,286,000 | | | | 1,343,870 | |
Calpine Corp.
7.25%, due 10/15/17 (b) | | | 139,000 | | | | 147,166 | |
CMS Energy Corp.
6.25%, due 2/1/20 | | | 2,015,000 | | | | 2,477,698 | |
Duquesne Light Holdings, Inc.
5.90%, due 12/1/21 (b) | | | 3,000,000 | | | | 3,659,949 | |
FirstEnergy Corp.
2.75%, due 3/15/18 | | | 1,110,000 | | | | 1,131,411 | |
GenOn REMA LLC
Series C
9.681%, due 7/2/26 | | | 1,000 | | | | 1,100 | |
IPALCO Enterprises, Inc. | | | | | | | | |
5.00%, due 5/1/18 | | | 1,000,000 | | | | 1,080,000 | |
7.25%, due 4/1/16 (b) | | | 4,225,000 | | | | 4,742,563 | |
N.V. Energy, Inc.
6.25%, due 11/15/20 | | | 5,000,000 | | | | 6,173,785 | |
PPL Energy Supply LLC
4.60%, due 12/15/21 | | | 5,665,000 | | | | 6,113,963 | |
PPL WEM Holdings PLC
3.90%, due 5/1/16 (b) | | | 950,000 | | | | 1,014,846 | |
| | | | | | |
The notes to the financial statements are an integral part of,
and should be read in conjunction with, the financial statements. | | mainstayinvestments.com | | | 13 | |
Portfolio of Investments April 30, 2013 (Unaudited) (continued)
| | | | | | | | |
| | | Principal
Amount | | | Value | |
| | | | | | | | |
| Corporate Bonds (continued) | | | | | | | | |
Electric (continued) | | | | | | | | |
Public Service Co. of New Mexico
7.95%, due 5/15/18 | | $ | 604,000 | | | $ | 754,942 | |
Puget Energy, Inc.
6.50%, due 12/15/20 | | | 3,155,000 | | | | 3,690,217 | |
SP PowerAssets, Ltd.
5.00%, due 10/22/13 (b) | | | 305,000 | | | | 310,610 | |
| | | | | | | | |
| | | | | | | 33,574,251 | |
| | | | | | | | |
Engineering & Construction 0.4% | |
Mastec, Inc.
4.875%, due 3/15/23 | | | 3,605,000 | | | | 3,605,000 | |
| | | | | | | | |
|
Entertainment 0.2% | |
Affinity Gaming LLC / Affinity Gaming Finance Corp.
9.00%, due 5/15/18 (b) | | | 675,000 | | | | 734,063 | |
NAI Entertainment Holdings LLC
8.25%, due 12/15/17 (b) | | | 1,335,000 | | | | 1,448,475 | |
| | | | | | | | |
| | | | 2,182,538 | |
| | | | | | | | |
Finance—Auto Loans 0.5% | |
Ford Motor Credit Co. LLC | |
8.125%, due 1/15/20 | | | 2,580,000 | | | | 3,319,923 | |
12.00%, due 5/15/15 | | | 1,000,000 | | | | 1,204,512 | |
| | | | | | | | |
| | | | 4,524,435 | |
| | | | | | | | |
Finance—Consumer Loans 0.5% | |
SLM Corp.
6.00%, due 1/25/17 | | | 3,935,000 | | | | 4,259,637 | |
| | | | | | | | |
|
Finance—Credit Card 0.9% | |
Capital One Bank USA NA
3.375%, due 2/15/23 | | | 6,046,000 | | | | 6,151,938 | |
Discover Financial Services
3.85%, due 11/21/22 | | | 1,526,000 | | | | 1,597,440 | |
| | | | | | | | |
| | | | 7,749,378 | |
| | | | | | | | |
Finance—Investment Banker/Broker 0.6% | |
Bear Stearns Cos. LLC (The)
7.25%, due 2/1/18 | | | 275,000 | | | | 342,455 | |
Jefferies Group LLC | |
5.125%, due 1/20/23 | | | 1,190,000 | | | | 1,291,320 | |
6.45%, due 6/8/27 | | | 1,960,000 | | | | 2,197,425 | |
8.50%, due 7/15/19 | | | 800,000 | | | | 1,015,634 | |
Merrill Lynch & Co., Inc.
Series C
5.00%, due 2/3/14 | | | 800,000 | | | | 825,056 | |
| | | | | | | | |
| | | | 5,671,890 | |
| | | | | | | | |
Finance—Leasing Companies 1.1% | |
International Lease Finance Corp. | |
5.625%, due 9/20/13 | | | 1,010,000 | | | | 1,025,150 | |
5.75%, due 5/15/16 | | | 2,070,000 | | | | 2,251,504 | |
| | | | | | | | |
| | | Principal
Amount | | | Value | |
| | | | | | | | |
Finance—Leasing Companies (continued) | |
Kerry Group Financial Services
3.20%, due 4/9/23 (b) | | $ | 6,175,000 | | | $ | 6,177,519 | |
| | | | | | | | |
| | | | 9,454,173 | |
| | | | | | | | |
Finance—Mortgage Loan/Banker 1.1% | |
¨Countrywide Financial Corp.
6.25%, due 5/15/16 | | | 8,615,000 | | | | 9,612,350 | |
| | | | | | | | |
|
Finance—Other Services 0.4% | |
Icahn Enterprises, L.P. / Icahn Enterprises Finance Corp.
8.00%, due 1/15/18 | | | 2,990,000 | | | | 3,214,250 | |
| | | | | | | | |
|
Food 1.5% | |
Flowers Foods, Inc.
4.375%, due 4/1/22 | | | 5,335,000 | | | | 5,501,964 | |
Mondelez International, Inc. | |
6.125%, due 2/1/18 | | | 5,020,000 | | | | 6,023,684 | |
7.00%, due 8/11/37 | | | 1,260,000 | | | | 1,749,793 | |
| | | | | | | | |
| | | | 13,275,441 | |
| | | | | | | | |
Forest Products & Paper 0.1% | |
Georgia-Pacific Corp.
8.875%, due 5/15/31 | | | 50,000 | | | | 76,476 | |
Smurfit Kappa Acquisitions
4.875%, due 9/15/18 (b) | | | 365,000 | | | | 378,688 | |
| | | | | | | | |
| | | | 455,164 | |
| | | | | | | | |
Health Care—Services 2.0% | |
Centene Corp.
5.75%, due 6/1/17 | | | 785,000 | | | | 844,856 | |
CIGNA Corp.
4.375%, due 12/15/20 | | | 875,000 | | | | 985,859 | |
Coventry Health Care, Inc.
5.95%, due 3/15/17 | | | 1,635,000 | | | | 1,895,405 | |
Fresenius Medical Care U.S. Finance II, Inc.
5.625%, due 7/31/19 (b) | | | 2,690,000 | | | | 3,006,075 | |
Fresenius Medical Care U.S. Finance, Inc. | |
5.75%, due 2/15/21 (b) | | | 825,000 | | | | 938,438 | |
6.50%, due 9/15/18 (b) | | | 65,000 | | | | 75,238 | |
6.875%, due 7/15/17 | | | 1,250,000 | | | | 1,443,750 | |
HCA, Inc. | |
7.25%, due 9/15/20 | | | 83,000 | | | | 92,026 | |
7.875%, due 2/15/20 | | | 19,000 | | | | 21,066 | |
8.00%, due 10/1/18 | | | 75,000 | | | | 89,156 | |
8.50%, due 4/15/19 | | | 888,000 | | | | 979,020 | |
9.00%, due 12/15/14 | | | 220,000 | | | | 244,475 | |
Health Care Service Corp.
4.70%, due 1/15/21 (b) | | | 1,500,000 | | | | 1,671,372 | |
Roche Holdings, Inc.
6.00%, due 3/1/19 (b) | | | 1,775,000 | | | | 2,204,747 | |
| | | | |
| 14 | | MainStay Intermediate Term Bond Fund | | The notes to the financial statements are an integral part of,
and should be read in conjunction with, the financial statements. |
| | | | | | | | |
| | | Principal
Amount | | | Value | |
| | | | | | | | |
| Corporate Bonds (continued) | | | | | | | | |
Health Care—Services (continued) | |
WellPoint, Inc. | |
5.25%, due 1/15/16 | | $ | 1,895,000 | | | $ | 2,105,868 | |
5.875%, due 6/15/17 | | | 1,000,000 | | | | 1,179,795 | |
| | | | | | | | |
| | | | 17,777,146 | |
| | | | | | | | |
Home Builders 0.7% | |
NVR, Inc.
3.95%, due 9/15/22 | | | 6,420,000 | | | | 6,707,616 | |
| | | | | | | | |
|
Household Products & Wares 0.7% | |
Spectrum Brands, Inc.
9.50%, due 6/15/18 | | | 1,239,000 | | | | 1,392,326 | |
Tupperware Brands Corp.
4.75%, due 6/1/21 | | | 4,785,000 | | | | 5,135,592 | |
| | | | | | | | |
| | | | 6,527,918 | |
| | | | | | | | |
Insurance 2.6% | |
American International Group, Inc.
4.875%, due 9/15/16 | | | 2,750,000 | | | | 3,061,418 | |
Genworth Financial, Inc. | |
7.20%, due 2/15/21 | | | 480,000 | | | | 579,534 | |
8.625%, due 12/15/16 | | | 4,300,000 | | | | 5,258,956 | |
Hartford Financial Services Group, Inc.
6.10%, due 10/1/41 | | | 4,495,000 | | | | 5,665,381 | |
Liberty Mutual Group, Inc.
6.50%, due 5/1/42 (b) | | | 3,675,000 | | | | 4,323,248 | |
Markel Corp.
3.625%, due 3/30/23 | | | 1,640,000 | | | | 1,681,159 | |
St. Paul Travelers Cos., Inc. (The)
6.25%, due 6/20/16 | | | 1,200,000 | | | | 1,395,373 | |
Unum Group
7.125%, due 9/30/16 | | | 750,000 | | | | 882,583 | |
| | | | | | | | |
| | | | | | | 22,847,652 | |
| | | | | | | | |
Investment Management/Advisory Services 0.1% | |
Janus Capital Group, Inc.
6.70%, due 6/15/17 | | | 1,166,000 | | | | 1,350,067 | |
| | | | | | | | |
| | |
Iron & Steel 1.6% | | | | | | | | |
Cliffs Natural Resources, Inc.
4.875%, due 4/1/21 | | | 6,430,000 | | | | 6,492,782 | |
United States Steel Corp.
7.50%, due 3/15/22 | | | 3,600,000 | | | | 3,789,000 | |
Vale S.A.
5.625%, due 9/11/42 | | | 3,970,000 | | | | 4,147,360 | |
| | | | | | | | |
| | | | | | | 14,429,142 | |
| | | | | | | | |
Leisure Time 0.1% | | | | | | | | |
Brunswick Corp.
11.25%, due 11/1/16 (b) | | | 430,000 | | | | 472,467 | |
| | | | | | | | |
| | | | | | | | |
| | | Principal
Amount | | | Value | |
| | | | | | | | |
Lodging 2.0% | | | | | | | | |
Caesars Entertainment Operating Co., Inc.
9.00%, due 2/15/20 (b) | | $ | 1,530,000 | | | $ | 1,507,050 | |
Caesars Operating Escrow LLC / Caesars Escrow Corp.
9.00%, due 2/15/20 (b) | | | 5,925,000 | | | | 5,836,125 | |
Marriott International, Inc.
3.00%, due 3/1/19 | | | 2,850,000 | | | | 2,998,482 | |
Seminole Hard Rock Entertainment, Inc.
2.78%, due 3/15/14 (a)(b) | | | 10,000 | | | | 9,975 | |
Starwood Hotels & Resorts Worldwide, Inc. | | | | | | | | |
6.75%, due 5/15/18 | | | 856,000 | | | | 1,042,521 | |
7.375%, due 11/15/15 | | | 332,000 | | | | 381,552 | |
Wyndham Worldwide Corp. | | | | | | | | |
2.50%, due 3/1/18 | | | 1,735,000 | | | | 1,749,090 | |
2.95%, due 3/1/17 | | | 1,355,000 | | | | 1,394,873 | |
4.25%, due 3/1/22 | | | 2,370,000 | | | | 2,508,825 | |
| | | | | | | | |
| | | | | | | 17,428,493 | |
| | | | | | | | |
Media 1.8% | | | | | | | | |
DIRECTV Holdings LLC / DIRECTV Financing Co., Inc.
3.50%, due 3/1/16 | | | 5,000,000 | | | | 5,324,790 | |
DISH DBS Corp. | | | | | | | | |
4.625%, due 7/15/17 | | | 600,000 | | | | 609,000 | |
7.125%, due 2/1/16 | | | 955,000 | | | | 1,055,275 | |
NBC Universal Media LLC
5.15%, due 4/30/20 | | | 2,900,000 | | | | 3,513,283 | |
Nielsen Finance LLC / Nielsen Finance Co. | | | | | | | | |
4.50%, due 10/1/20 (b) | | | 900,000 | | | | 919,125 | |
7.75%, due 10/15/18 | | | 555,000 | | | | 618,131 | |
Time Warner, Inc.
7.70%, due 5/1/32 | | | 1,980,000 | | | | 2,817,895 | |
Videotron, Ltd. | | | | | | | | |
5.00%, due 7/15/22 | | | 165,000 | | | | 169,950 | |
6.375%, due 12/15/15 | | | 542,000 | | | | 548,775 | |
9.125%, due 4/15/18 | | | 272,000 | | | | 286,280 | |
| | | | | | | | |
| | | | | | | 15,862,504 | |
| | | | | | | | |
Mining 1.1% | | | | | | | | |
Alcoa, Inc.
5.90%, due 2/1/27 | | | 560,000 | | | | 588,258 | |
Anglo American Capital PLC
9.375%, due 4/8/19 (b) | | | 4,880,000 | | | | 6,502,702 | |
New Gold, Inc.
7.00%, due 4/15/20 (b) | | | 1,375,000 | | | | 1,457,500 | |
Rio Tinto Finance USA, Ltd.
3.75%, due 9/20/21 | | | 845,000 | | | | 902,946 | |
| | | | | | | | |
| | | | | | | 9,451,406 | |
| | | | | | | | |
Miscellaneous—Manufacturing 0.6% | | | | | | | | |
Siemens Financieringsmaatschappij N.V.
6.125%, due 8/17/26 (b) | | | 265,000 | | | | 352,037 | |
| | | | | | |
The notes to the financial statements are an integral part of,
and should be read in conjunction with, the financial statements. | | mainstayinvestments.com | | | 15 | |
Portfolio of Investments April 30, 2013 (Unaudited) (continued)
| | | | | | | | |
| | | Principal
Amount | | | Value | |
| | | | | | | | |
| Corporate Bonds (continued) | | | | | | | | |
Miscellaneous—Manufacturing (continued) | |
SPX Corp.
7.625%, due 12/15/14 | | $ | 1,100,000 | | | $ | 1,200,375 | |
Tyco Electronics Group S.A.
6.55%, due 10/1/17 | | | 2,945,000 | | | | 3,527,556 | |
| | | | | | | | |
| | | | | | | 5,079,968 | |
| | | | | | | | |
Office & Business Equipment 0.5% | | | | | | | | |
Xerox Corp.
4.25%, due 2/15/15 | | | 4,055,000 | | | | 4,276,865 | |
| | | | | | | | |
| | |
Oil & Gas 4.2% | | | | | | | | |
Calumet Specialty Products Partners, L.P. / Calumet Finance Corp.
9.375%, due 5/1/19 | | | 1,095,000 | | | | 1,226,400 | |
Chesapeake Energy Corp. | | | | | | | | |
6.50%, due 8/15/17 | | | 192,000 | | | | 215,040 | |
6.775%, due 3/15/19 | | | 225,000 | | | | 246,375 | |
9.50%, due 2/15/15 | | | 1,060,000 | | | | 1,197,800 | |
CNOOC Finance 2011, Ltd.
4.25%, due 1/26/21 (b) | | | 5,490,000 | | | | 6,029,019 | |
Concho Resources, Inc. | | | | | | | | |
7.00%, due 1/15/21 | | | 345,000 | | | | 388,125 | |
8.625%, due 10/1/17 | | | 391,000 | | | | 418,370 | |
ENI S.p.A.
4.15%, due 10/1/20 (b) | | | 2,900,000 | | | | 3,055,942 | |
Gazprom OAO Via Gaz Capital S.A.
4.95%, due 7/19/22 (b) | | | 3,800,000 | | | | 3,996,080 | |
HollyFrontier Corp.
9.875%, due 6/15/17 | | | 555,000 | | | | 587,201 | |
Marathon Petroleum Corp.
6.50%, due 3/1/41 | | | 3,480,000 | | | | 4,501,022 | |
PetroHawk Energy Corp. | |
6.25%, due 6/1/19 | | | 3,400,000 | | | | 3,829,250 | |
7.25%, due 8/15/18 | | | 2,000,000 | | | | 2,213,500 | |
Plains Exploration & Production Co. | |
6.75%, due 2/1/22 | | | 3,565,000 | | | | 4,028,450 | |
7.625%, due 4/1/20 | | | 500,000 | | | | 562,500 | |
Quicksilver Resources, Inc.
11.75%, due 1/1/16 | | | 143,000 | | | | 152,831 | |
Samson Investment Co.
9.75%, due 2/15/20 (b) | | | 3,245,000 | | | | 3,447,812 | |
Whiting Petroleum Corp.
7.00%, due 2/1/14 | | | 855,000 | | | | 889,200 | |
WPX Energy, Inc.
5.25%, due 1/15/17 | | | 715,000 | | | | 765,050 | |
| | | | | | | | |
| | | | 37,749,967 | |
| | | | | | | | |
Packaging & Containers 0.0%‡ | |
Greif, Inc.
6.75%, due 2/1/17 | | | 320,000 | | | | 360,800 | |
| | | | | | | | |
| | | | | | | | |
| | | Principal
Amount | | | Value | |
| | | | | | | | |
Pharmaceuticals 1.0% | |
Actavis, Inc.
1.875%, due 10/1/17 | | $ | 3,540,000 | | | $ | 3,532,077 | |
Cardinal Health, Inc.
4.625%, due 12/15/20 | | | 1,000,000 | | | | 1,137,232 | |
Mylan, Inc.
7.875%, due 7/15/20 (b) | | | 575,000 | | | | 672,107 | |
Valeant Pharmaceuticals International | |
6.75%, due 10/1/17 (b) | | | 483,000 | | | | 524,055 | |
6.875%, due 12/1/18 (b) | | | 325,000 | | | | 353,844 | |
7.00%, due 10/1/20 (b) | | | 17,000 | | | | 18,785 | |
Zoetis, Inc.
4.70%, due 2/1/43 (b) | | | 2,745,000 | | | | 2,897,301 | |
| | | | | | | | |
| | | | 9,135,401 | |
| | | | | | | | |
Pipelines 3.6% | |
Boardwalk Pipelines, L.P.
5.875%, due 11/15/16 | | | 2,445,000 | | | | 2,765,921 | |
Copano Energy LLC / Copano Energy Finance Corp. | | | | | | | | |
7.125%, due 4/1/21 | | | 628,000 | | | | 726,910 | |
7.75%, due 6/1/18 | | | 435,000 | | | | 454,575 | |
¨Energy Transfer Partners, L.P. | |
5.20%, due 2/1/22 | | | 5,000,000 | | | | 5,716,605 | |
6.05%, due 6/1/41 | | | 1,310,000 | | | | 1,494,189 | |
8.50%, due 4/15/14 | | | 237,000 | | | | 253,784 | |
9.70%, due 3/15/19 | | | 2,000,000 | | | | 2,728,972 | |
Kinder Morgan Energy Partners, L.P.
6.375%, due 3/1/41 | | | 4,185,000 | | | | 5,272,819 | |
Kinder Morgan Finance Co. LLC
6.00%, due 1/15/18 (b) | | | 3,720,000 | | | | 4,131,860 | |
MarkWest Energy Partners, L.P. / MarkWest Energy Finance Corp.
6.75%, due 11/1/20 | | | 738,000 | | | | 815,490 | |
ONEOK, Inc. | |
4.25%, due 2/1/22 | | | 3,590,000 | | | | 3,868,293 | |
6.00%, due 6/15/35 | | | 1,425,000 | | | | 1,634,729 | |
Panhandle Eastern Pipe Line Co., L.P.
8.125%, due 6/1/19 | | | 600,000 | | | | 744,481 | |
Plains All American Pipeline, L.P. / PAA Finance Corp.
5.75%, due 1/15/20 | | | 1,117,000 | | | | 1,355,363 | |
| | | | | | | | |
| | | | 31,963,991 | |
| | | | | | | | |
Real Estate Investment Trusts 1.8% | |
Alexandria Real Estate Equities, Inc.
4.60%, due 4/1/22 | | | 3,325,000 | | | | 3,668,117 | |
Health Care REIT, Inc.
5.25%, due 1/15/22 | | | 3,000,000 | | | | 3,482,205 | |
Host Hotels & Resorts, L.P. | |
5.25%, due 3/15/22 | | | 75,000 | | | | 83,625 | |
5.875%, due 6/15/19 | | | 35,000 | | | | 38,719 | |
Series Q
6.75%, due 6/1/16 | | | 930,000 | | | | 945,112 | |
| | | | |
| 16 | | MainStay Intermediate Term Bond Fund | | The notes to the financial statements are an integral part of,
and should be read in conjunction with, the financial statements. |
| | | | | | | | |
| | | Principal
Amount | | | Value | |
| | | | | | | | |
| Corporate Bonds (continued) | | | | | | | | |
Real Estate Investment Trusts (continued) | |
ProLogis, L.P.
7.375%, due 10/30/19 | | $ | 2,000,000 | | | $ | 2,522,342 | |
Ventas Realty, L.P. / Ventas Capital Corp.
4.00%, due 4/30/19 | | | 4,290,000 | | | | 4,721,986 | |
Weyerhaeuser Co.
7.375%, due 10/1/19 | | | 131,000 | | | | 165,698 | |
| | | | | | | | |
| | | | 15,627,804 | |
| | | | | | | | |
Retail 1.4% | |
AmeriGas Partners, L.P. / AmeriGas Finance Corp.
6.25%, due 8/20/19 | | | 532,000 | | | | 575,890 | |
CVS Caremark Corp. | |
5.75%, due 6/1/17 | | | 281,000 | | | | 332,247 | |
5.789%, due 1/10/26 (b)(e) | | | 82,422 | | | | 94,717 | |
L Brands, Inc.
8.50%, due 6/15/19 | | | 127,000 | | | | 157,480 | |
Macy’s Retail Holdings, Inc.
6.90%, due 4/1/29 | | | 1,988,000 | | | | 2,460,856 | |
Nordstrom, Inc.
7.00%, due 1/15/38 | | | 2,005,000 | | | | 2,861,905 | |
O’Reilly Automotive, Inc.
4.625%, due 9/15/21 | | | 3,955,000 | | | | 4,416,465 | |
Radio Systems Corp.
8.375%, due 11/1/19 (b) | | | 875,000 | | | | 951,563 | |
TJX Cos., Inc.
6.95%, due 4/15/19 | | | 330,000 | | | | 420,603 | |
| | | | | | | | |
| | | | 12,271,726 | |
| | | | | | | | |
Retail—Food 0.1% | |
Susser Holdings LLC / Susser Finance Corp.
8.50%, due 5/15/16 | | | 1,085,000 | | | | 1,135,859 | |
| | | | | | | | |
|
Savings & Loans 0.2% | |
Amsouth Bank
5.20%, due 4/1/15 | | | 1,435,000 | | | | 1,524,688 | |
| | | | | | | | |
|
Telecommunications 3.4% | |
American Tower Corp.
4.50%, due 1/15/18 | | | 2,750,000 | | | | 3,048,001 | |
AT&T, Inc.
3.875%, due 8/15/21 | | | 2,465,000 | | | | 2,735,605 | |
Cellco Partnership / Verizon Wireless Capital LLC
8.50%, due 11/15/18 | | | 1,500,000 | | | | 2,010,349 | |
Corning, Inc.
6.625%, due 5/15/19 | | | 500,000 | | | | 623,467 | |
Crown Castle International Corp. | | | | | | | | |
5.25%, due 1/15/23 | | | 126,000 | | | | 131,985 | |
7.125%, due 11/1/19 | | | 243,000 | | | | 266,693 | |
| | | | | | | | |
| | | Principal
Amount | | | Value | |
| | | | | | | | |
Telecommunications (continued) | |
Crown Castle Towers LLC
5.495%, due 1/15/37 (b) | | $ | 3,578,000 | | | $ | 4,095,203 | |
GCI, Inc.
8.625%, due 11/15/19 | | | 821,000 | | | | 874,365 | |
Hughes Satellite Systems Corp.
6.50%, due 6/15/19 | | | 1,051,000 | | | | 1,169,238 | |
Inmarsat Finance PLC
7.375%, due 12/1/17 (b) | | | 1,111,000 | | | | 1,179,049 | |
MetroPCS Wireless, Inc.
6.625%, due 11/15/20 | | | 1,000,000 | | | | 1,082,500 | |
Sable International Finance, Ltd.
7.75%, due 2/15/17 (b) | | | 730,000 | | | | 788,400 | |
SBA Telecommunications, Inc.
8.25%, due 8/15/19 | | | 696,000 | | | | 770,820 | |
SBA Tower Trust
2.933%, due 12/15/42 (b) | | | 3,225,000 | | | | 3,340,474 | |
Sprint Capital Corp. | | | | | | | | |
6.875%, due 11/15/28 | | | 515,000 | | | | 526,588 | |
8.75%, due 3/15/32 | | | 500,000 | | | | 591,250 | |
Sprint Nextel Corp.
9.125%, due 3/1/17 | | | 250,000 | | | | 294,375 | |
Telefonica Emisiones SAU | | | | | | | | |
4.57%, due 4/27/23 | | | 2,910,000 | | | | 2,986,306 | |
5.462%, due 2/16/21 | | | 785,000 | | | | 865,223 | |
tw telecom holdings, Inc.
8.00%, due 3/1/18 | | | 960,000 | | | | 1,041,600 | |
Virgin Media Finance PLC
8.375%, due 10/15/19 | | | 312,000 | | | | 352,170 | |
Virgin Media Secured Finance PLC
5.25%, due 1/15/21 | | | 1,160,000 | | | | 1,250,030 | |
| | | | | | | | |
| | | | | | | 30,023,691 | |
| | | | | | | | |
Textiles 0.6% | | | | | | | | |
Cintas Corp. No
2 2.85%, due 6/1/16 | | | 5,480,000 | | | | 5,754,422 | |
| | | | | | | | |
| | |
Transportation 0.1% | | | | | | | | |
Burlington Northern Santa Fe LLC
5.65%, due 5/1/17 | | | 455,000 | | | | 533,195 | |
Florida East Coast Railway Corp.
8.125%, due 2/1/17 | | | 725,000 | | | | 776,656 | |
| | | | | | | | |
| | | | | | | 1,309,851 | |
| | | | | | | | |
Trucking & Leasing 0.5% | | | | | | | | |
Penske Truck Leasing Co., L.P. / PTL Finance Corp.
3.75%, due 5/11/17 (b) | | | 4,398,000 | | | | 4,768,853 | |
| | | | | | | | |
Total Corporate Bonds
(Cost $467,179,334) | | | | 508,507,304 | |
| | | | | | | | |
| | | | | | |
The notes to the financial statements are an integral part of,
and should be read in conjunction with, the financial statements. | | mainstayinvestments.com | | | 17 | |
Portfolio of Investments April 30, 2013 (Unaudited) (continued)
| | | | | | | | |
| | | Principal
Amount | | | Value | |
| | | | | | | | |
| Mortgage-Backed Securities 5.3% | |
Commercial Mortgage Loans (Collateralized Mortgage Obligations) 5.3% | |
Banc of America Commercial Mortgage, Inc. Series 2007-2, Class A4
5.796%, due 4/10/49 (f) | | $ | 2,560,000 | | | $ | 2,963,013 | |
Bayview Commercial Asset Trust
Series 2006-4A, Class A1
0.43%, due 12/25/36 (a)(b)(d) | | | 153,767 | | | | 130,225 | |
Bear Stearns Commercial Mortgage Securities
Series 2007-PW16, Class A4
5.905%, due 6/11/40 (f) | | | 2,270,000 | | | | 2,650,568 | |
CD 2006-CD3 Mortgage Trust
Series 2006-CD3, Class A5
5.617%, due 10/15/48 | | | 3,390,000 | | | | 3,820,564 | |
CFCRE Commercial Mortgage Trust
Series 2011-C1, Class A2
3.759%, due 4/15/44 (b) | | | 1,340,000 | | | | 1,432,666 | |
Citigroup Commercial Mortgage Trust
Series 2008-C7, Class A4
6.34%, due 12/10/49 (f) | | | 1,300,000 | | | | 1,547,039 | |
Commercial Mortgage Loan Trust
Series 2011-C1, Class A2
6.206%, due 12/10/49 (f) | | | 4,926,000 | | | | 5,809,833 | |
Four Times Square Trust
Series 2006-4TS, Class A
5.401%, due 12/13/28 (b) | | | 2,470,000 | | | | 2,958,188 | |
Greenwich Capital Commercial Funding Corp.
Series 2005-GG5, Class A5
5.224%, due 4/10/37 (f) | | | 2,960,000 | | | | 3,230,301 | |
GS Mortgage Securities Corp. II | | | | | | | | |
Series 2006-GG6, Class A4
5.553%, due 4/10/38 (a) | | | 2,919,880 | | | | 3,241,274 | |
Series 2007-GG10, Class A4
5.982%, due 8/10/45 (f) | | | 3,095,000 | | | | 3,561,760 | |
JP Morgan Chase Commercial Mortgage Securities Corp. | | | | | | | | |
Series 2007-LDPX, Class A3
5.42%, due 1/15/49 | | | 3,565,000 | | | | 4,078,339 | |
Series 2007-CB18, Class A4
5.44%, due 6/12/47 | | | 2,260,000 | | | | 2,582,136 | |
LB-UBS Commercial Mortgage Trust
Series 2007-C6, Class A4
5.858%, due 7/15/40 (a) | | | 1,680,000 | | | | 1,929,524 | |
Morgan Stanley Capital I, Inc.
Series 2007-IQ15, Class A4
6.094%, due 6/11/49 (f) | | | 2,585,000 | | | | 3,012,657 | |
Timberstar Trust
Series 2006-1, Class A
5.668%, due 10/15/36 (b) | | | 160,000 | | | | 182,755 | |
| | | | | | | | |
| | | Principal
Amount | | | Value | |
| | | | | | | | |
Commercial Mortgage Loans
(Collateralized Mortgage Obligations) (continued) | |
Wachovia Bank Commercial Mortgage Trust Series 2007-C33, Class A4
6.122%, due 2/15/51 (f) | | $ | 3,065,000 | | | $ | 3,520,879 | |
| | | | | | | | |
| | | | 46,651,721 | |
| | | | | | | | |
Residential Mortgage (Collateralized Mortgage Obligation) 0.0%‡ | |
Mortgage Equity Conversion Asset Trust Series 2007-FF2, Class A
0.62%, due 2/25/42 (a)(b)(d) | | | 397,988 | | | | 333,315 | |
| | | | | | | | |
Total Mortgage-Backed Securities (Cost $39,977,957) | | | | | | | 46,985,036 | |
| | | | | | | | |
|
| U.S. Government & Federal Agencies 34.0% | |
Fannie Mae (Collateralized Mortgage Obligation) 0.0%‡ | |
Series 1991-66, Class J
8.125%, due 6/25/21 | | | 429 | | | | 491 | |
| | | | | | | | |
|
Federal Home Loan Mortgage Corporation 0.8% | |
2.00%, due 7/17/17 | | | 7,470,000 | | | | 7,501,120 | |
| | | | | | | | |
|
¨Federal Home Loan Mortgage Corporation
(Mortgage Pass-Through Securities) 7.7% | |
2.375%, due 6/1/35 (a) | | | 181,982 | | | | 195,009 | |
4.00%, due 8/1/31 | | | 3,904,583 | | | | 4,209,171 | |
4.00%, due 1/1/41 | | | 3,780,888 | | | | 4,201,660 | |
4.00%, due 2/1/41 | | | 6,952,022 | | | | 7,633,874 | |
4.00%, due 1/1/42 | | | 21,129,566 | | | | 23,335,788 | |
4.00%, due 6/1/42 | | | 7,285,087 | | | | 8,032,093 | |
4.50%, due 9/1/39 | | | 567,626 | | | | 633,596 | |
4.50%, due 1/1/40 | | | 4,606,358 | | | | 5,074,056 | |
4.50%, due 12/1/40 | | | 2,778,685 | | | | 3,101,626 | |
4.50%, due 5/1/41 | | | 3,021,447 | | | | 3,297,065 | |
4.50%, due 6/1/41 | | | 3,058,111 | | | | 3,337,073 | |
4.50%, due 8/1/41 | | | 2,851,452 | | | | 3,135,622 | |
5.00%, due 8/1/33 | | | 492,918 | | | | 532,707 | |
5.50%, due 1/1/21 | | | 185,089 | | | | 199,734 | |
5.50%, due 2/1/33 | | | 187,225 | | | | 204,035 | |
5.50%, due 7/1/34 | | | 487,168 | | | | 530,299 | |
5.50%, due 4/1/37 | | | 33,940 | | | | 36,770 | |
5.50%, due 5/1/37 | | | 24,987 | | | | 27,070 | |
5.50%, due 7/1/37 | | | 127,603 | | | | 137,784 | |
5.50%, due 1/1/38 | | | 141,648 | | | | 155,429 | |
6.00%, due 2/1/27 | | | 119,377 | | | | 130,453 | |
6.00%, due 3/1/36 | | | 226,970 | | | | 247,504 | |
6.50%, due 4/1/37 | | | 264,935 | | | | 301,850 | |
| | | | | | | | |
| | | | 68,690,268 | |
| | | | | | | | |
| | | | |
| 18 | | MainStay Intermediate Term Bond Fund | | The notes to the financial statements are an integral part of,
and should be read in conjunction with, the financial statements. |
| | | | | | | | |
| | | Principal
Amount | | | Value | |
| | | | | | | | |
| U.S. Government & Federal Agencies (continued) | |
¨Federal National Mortgage Association
(Mortgage Pass-Through Securities) 17.9% | |
3.50%, due 2/1/41 | | $ | 10,971,547 | | | $ | 11,700,984 | |
3.50%, due 3/1/41 | | | 1,037,025 | | | | 1,105,971 | |
3.50%, due 11/1/41 | | | 3,370,164 | | | | 3,632,142 | |
3.50%, due 1/1/42 | | | 2,715,534 | | | | 2,933,414 | |
3.50%, due 3/1/42 | | | 9,173,232 | | | | 9,842,971 | |
3.50%, due 10/1/42 | | | 4,353,187 | | | | 4,663,011 | |
3.50%, due 2/1/43 | | | 4,453,224 | | | | 4,799,392 | |
3.50%, due 3/1/43 | | | 7,304,373 | | | | 7,824,240 | |
3.50%, due 5/1/43 | | | 3,890,969 | | | | 4,165,009 | |
4.00%, due 9/1/31 | | | 3,178,239 | | | | 3,426,756 | |
4.00%, due 11/1/40 | | | 1,746,358 | | | | 1,938,577 | |
4.00%, due 1/1/41 | | | 5,124,056 | | | | 5,672,039 | |
4.00%, due 2/1/41 | | | 402,645 | | | | 445,706 | |
4.00%, due 3/1/41 | | | 4,603,916 | | | | 5,110,661 | |
4.00%, due 10/1/41 | | | 6,227,093 | | | | 6,912,499 | |
4.00%, due 2/1/42 | | | 3,694,630 | | | | 3,971,980 | |
4.00%, due 3/1/42 | | | 4,171,782 | | | | 4,599,675 | |
4.00%, due 9/1/42 | | | 3,464,127 | | | | 3,816,190 | |
4.50%, due 4/1/18 | | | 78,402 | | | | 84,312 | |
4.50%, due 7/1/18 | | | 400,774 | | | | 430,981 | |
4.50%, due 11/1/18 | | | 521,192 | | | | 560,475 | |
4.50%, due 3/1/21 TBA (g) | | | 9,770,000 | | | | 10,478,707 | |
4.50%, due 6/1/23 | | | 523,915 | | | | 562,257 | |
4.50%, due 6/1/39 | | | 6,919,597 | | | | 7,705,252 | |
4.50%, due 8/1/39 | | | 6,710,159 | | | | 7,505,352 | |
4.50%, due 9/1/39 | | | 1,262,594 | | | | 1,412,218 | |
4.50%, due 7/1/41 | | | 6,284,884 | | | | 6,949,154 | |
4.50%, due 8/1/41 | | | 3,532,558 | | | | 3,893,244 | |
5.00%, due 9/1/17 | | | 164,075 | | | | 176,562 | |
5.00%, due 9/1/20 | | | 73,176 | | | | 78,608 | |
5.00%, due 10/1/20 | | | 176,883 | | | | 190,013 | |
5.00%, due 12/1/20 | | | 317,700 | | | | 341,282 | |
5.00%, due 7/1/33 | | | 958,052 | | | | 1,043,949 | |
5.00%, due 10/1/33 | | | 408,831 | | | | 445,487 | |
5.00%, due 5/1/35 | | | 2,464,944 | | | | 2,678,946 | |
5.00%, due 6/1/35 | | | 4,367,210 | | | | 4,753,250 | |
5.00%, due 7/1/35 | | | 452,471 | | | | 491,766 | |
5.00%, due 1/1/36 | | | 528,654 | | | | 574,567 | |
5.00%, due 2/1/36 | | | 3,948,170 | | | | 4,291,043 | |
5.00%, due 5/1/36 | | | 1,439,857 | | | | 1,564,899 | |
5.00%, due 9/1/36 | | | 375,474 | | | | 408,082 | |
5.50%, due 2/1/17 | | | 122,158 | | | | 130,654 | |
5.50%, due 6/1/21 | | | 362,388 | | | | 394,840 | |
5.50%, due 6/1/33 | | | 2,394,423 | | | | 2,628,114 | |
5.50%, due 11/1/33 | | | 365,562 | | | | 401,240 | |
5.50%, due 12/1/33 | | | 277,138 | | | | 304,186 | |
5.50%, due 4/1/34 | | | 1,026,765 | | | | 1,130,805 | |
5.50%, due 5/1/34 | | | 1,283,553 | | | | 1,408,825 | |
5.50%, due 6/1/34 | | | 335,445 | | | | 369,023 | |
| | | | | | | | |
| | | Principal
Amount | | | Value | |
| | | | | | | | |
¨Federal National Mortgage Association
(Mortgage Pass-Through Securities) (continued) | |
5.50%, due 3/1/35 | | $ | 482,808 | | | $ | 531,136 | |
5.50%, due 4/1/36 | | | 1,052,493 | | | | 1,151,267 | |
5.50%, due 12/1/36 | | | 305,091 | | | | 332,197 | |
5.50%, due 1/1/37 | | | 837,893 | | | | 939,308 | |
5.50%, due 4/1/37 | | | 706,989 | | | | 768,920 | |
5.50%, due 7/1/37 | | | 852,101 | | | | 955,235 | |
5.50%, due 8/1/37 | | | 346,759 | | | | 379,302 | |
5.50%, due 9/1/37 | | | 11,026 | | | | 11,992 | |
6.00%, due 8/1/17 | | | 20,887 | | | | 22,395 | |
6.00%, due 1/1/33 | | | 130,205 | | | | 146,233 | |
6.00%, due 3/1/33 | | | 168,933 | | | | 189,727 | |
6.00%, due 8/1/34 | | | 6,190 | | | | 6,888 | |
6.00%, due 9/1/35 | | | 398,322 | | | | 441,589 | |
6.00%, due 6/1/36 | | | 200,273 | | | | 219,418 | |
6.00%, due 12/1/36 | | | 267,370 | | | | 296,353 | |
6.00%, due 4/1/37 | | | 161,684 | | | | 175,120 | |
6.00%, due 9/1/37 | | | 69,919 | | | | 76,516 | |
6.00%, due 10/1/37 | | | 678,840 | | | | 735,441 | |
6.00%, due 11/1/37 | | | 63,487 | | | | 69,476 | |
6.00%, due 1/1/38 | | | 7,397 | | | | 8,095 | |
6.00%, due 11/1/38 | | | 298,427 | | | | 326,583 | |
6.50%, due 6/1/31 | | | 47,577 | | | | 56,266 | |
6.50%, due 8/1/31 | | | 25,386 | | | | 28,564 | |
6.50%, due 10/1/31 | | | 20,519 | | | | 23,487 | |
6.50%, due 6/1/32 | | | 42,490 | | | | 50,322 | |
6.50%, due 6/1/36 | | | 15,372 | | | | 17,118 | |
6.50%, due 7/1/36 | | | 40,586 | | | | 46,608 | |
6.50%, due 8/1/36 | | | 5,225 | | | | 5,819 | |
6.50%, due 11/1/36 | | | 216,980 | | | | 244,886 | |
6.50%, due 2/1/37 | | | 56,349 | | | | 67,053 | |
6.50%, due 7/1/37 | | | 25,108 | | | | 29,020 | |
6.50%, due 8/1/37 | | | 92,585 | | | | 110,172 | |
6.50%, due 9/1/37 | | | 231,437 | | | | 259,907 | |
6.50%, due 3/1/38 | | | 200,911 | | | | 239,076 | |
| | | | | | | | |
| | | | 158,910,799 | |
| | | | | | | | |
Freddie Mac (Collateralized Mortgage Obligations) 0.3% | |
Series 2690, Class PG
5.00%, due 4/15/32 | | | 628,764 | | | | 647,401 | |
Series 2734, Class PG
5.00%, due 7/15/32 | | | 417,092 | | | | 423,731 | |
Series 3113, Class QD
5.00%, due 6/15/34 | | | 1,129,004 | | | | 1,161,678 | |
| | | | | | | | |
| | | | 2,232,810 | |
| | | | | | | | |
¨Government National Mortgage Association
(Mortgage Pass-Through Securities) 1.7% | |
4.00%, due 11/20/40 | | | 922,173 | | | | 1,011,238 | |
6.00%, due 2/15/29 | | | 24,553 | | | | 27,941 | |
6.00%, due 4/15/29 | | | 113,122 | | | | 128,436 | |
6.00%, due 8/15/32 | | | 246,105 | | | | 280,437 | |
| | | | | | |
The notes to the financial statements are an integral part of,
and should be read in conjunction with, the financial statements. | | mainstayinvestments.com | | | 19 | |
Portfolio of Investments April 30, 2013 (Unaudited) (continued)
| | | | | | | | |
| | | Principal
Amount | | | Value | |
| | | | | | | | |
| U.S. Government & Federal Agencies (continued) | |
¨Government National Mortgage Association
(Mortgage Pass-Through Securities) (continued) | |
6.00%, due 8/1/35 TBA (g) | | $ | 6,020,000 | | | $ | 6,797,191 | |
6.50%, due 7/15/28 | | | 27,182 | | | | 31,653 | |
6.50%, due 5/15/29 | | | 15,268 | | | | 18,401 | |
6.50%, due 9/1/32 TBA (g) | | | 6,030,000 | | | | 6,899,640 | |
| | | | | | | | |
| | | | 15,194,937 | |
| | | | | | | | |
¨United States Treasury Bonds 4.6% | |
2.75%, due 8/15/42 | | | 15,079,000 | | | | 14,643,126 | |
2.75%, due 11/15/42 | | | 5,355,000 | | | | 5,194,350 | |
3.00%, due 5/15/42 | | | 10,515,000 | | | | 10,766,372 | |
5.375%, due 2/15/31 | | | 6,105,000 | | | | 8,724,423 | |
6.25%, due 5/15/30 | | | 1,240,000 | | | | 1,920,063 | |
| | | | | | | | |
| | | | 41,248,334 | |
| | | | | | | | |
United States Treasury Notes 0.9% | | | | | |
2.00%, due 2/15/23 | | | 7,350,000 | | | | 7,564,760 | |
| | | | | | | | |
| |
United States Treasury Strip Principal 0.1% | | | | | |
(zero coupon), due 8/15/23 | | | 820,000 | | | | 678,916 | |
| | | | | | | | |
Total U.S. Government & Federal Agencies
(Cost $292,526,512) | | | | 302,022,435 | |
| | | | | | | | |
| | |
| Yankee Bonds 0.2% (h) | | | | | | | | |
Forest Products & Paper 0.1% | | | | | | | | |
Smurfit Kappa Treasury Funding Ltd. 7.50%, due 11/20/25 | | | 528,000 | | | | 586,080 | |
| | | | | | | | |
| | |
Insurance 0.1% | | | | | | | | |
Fairfax Financial Holdings, Ltd. | | | | | | | | |
7.75%, due 7/15/37 | | | 635,000 | | | | 730,879 | |
8.25%, due 10/1/15 | | | 438,000 | | | | 498,649 | |
8.30%, due 4/15/26 | | | 15,000 | | | | 19,022 | |
| | | | | | | | |
| | | | 1,248,550 | |
| | | | | | | | |
Total Yankee Bonds
(Cost $1,522,169) | | | | | | | 1,834,630 | |
| | | | | | | | |
Total Long-Term Bonds (Cost $803,086,753) | | | | | | | 861,364,597 | |
| | | | | | | | |
| | |
| | | | | | | | |
| | | | | | | | |
| | | Number of
Warrants | | | Value | |
| | | | | | | | |
| Warrants 0.0%‡ | | | | | | | | |
Media 0.0%‡ | | | | | | | | |
ION Media Networks, Inc. | | | | | | | | |
Second Lien Expires
12/18/39 (c)(d)(e)(i) | | | 1 | | | $ | 0 | (j) |
Unsecured Debt Expires 12/18/16 (c)(d)(e)(i) | | | 1 | | | | 0 | (j) |
| | | | | | | | |
Total Warrants (Cost $4) | | | | | | | 0 | (j) |
| | | | | | | | |
| | |
| | | | | | | | |
| | | Principal
Amount | | | | |
| | | | | | | | |
| Short-Term Investment 4.8% | | | | | |
Repurchase Agreement 4.8% | | | | | | | | |
State Street Bank and Trust Co.
0.01%, dated 4/30/13
due 5/1/13
Proceeds at Maturity $43,133,409 (Collateralized by a Federal Home Loan Mortgage Corp. security with a rate of 2.1% and a maturity date of 10/17/22, with a Principal Amount of $44,285,000 and a Market Value of $44,000,159) | | $ | 43,133,397 | | | | 43,133,397 | |
| | | | | | | | |
Total Short-Term Investment (Cost $43,133,397) | | | | | | | 43,133,397 | |
| | | | | | | | |
Total Investments
(Cost $846,220,154) (m) | | | 101.7 | % | | | 904,497,994 | |
Other Assets, Less Liabilities | | | (1.7 | ) | | | (15,525,557 | ) |
Net Assets | | | 100.0 | % | | $ | 888,972,437 | |
| | |
| | | | | | | | |
| | | | | | | | |
| | | Contracts
Long | | | Unrealized
Appreciation
(Depreciation) (k) | |
| Futures Contracts (0.1%) | | | | | | | | |
United States Treasury Bond Ultra Long June 2013 (l) | | | 25 | | | $ | 197,594 | |
United States Treasury Notes
June 2013 (2 Year) (l) | | | 41 | | | | 4,382 | |
| | | | | | | | |
Total Futures Contracts Long (Settlement Value $13,154,219) | | | | | | | 201,976 | |
| | | | | | | | |
| | |
| | | | | | | | |
| | | | |
| 20 | | MainStay Intermediate Term Bond Fund | | The notes to the financial statements are an integral part of,
and should be read in conjunction with, the financial statements. |
| | | | | | | | |
| | | Contracts
Short | | | Unrealized
Appreciation
(Depreciation) (k) | |
United States Treasury Notes
June 2013 (5 Year) (l) | | | (224 | ) | | $ | (236,810 | ) |
June 2013 (10 Year) (l) | | | (577 | ) | | | (1,081,958 | ) |
| | | | | | | | |
Total Futures Contracts Short
(Settlement Value $(104,867,859)) | | | | (1,318,768 | ) |
| | | | | | | | |
Total Futures Contracts
(Settlement Value $(91,713,640)) | | | $ | (1,116,792 | ) |
| | | | | | | | |
| ‡ | Less than one-tenth of a percent. |
| (a) | Floating rate—Rate shown is the rate in effect as of April 30, 2013. |
| (b) | May be sold to institutional investors only under Rule 144A or securities offered pursuant to Section 4(a)(2) of the Securities Act of 1933, as amended. |
| (c) | Non-income producing security. |
| (d) | Illiquid security—The total market value of these securities as of April 30, 2013 is $463,780, which represents 0.1% of the Fund’s net assets. |
| (e) | Fair valued security—The total market value of these securities as of April 30, 2013 is $94,957, which represents less than one-tenth of a percent of the Fund’s net assets. |
| (f) | Collateral strip rate—Bond whose interest is based on the weighted net interest rate of the collateral. Coupon rate adjusts periodically based on a predetermined schedule. Rate shown is the rate in effect as of April 30, 2013. |
| (g) | TBA—Securities purchased on a forward commitment basis with an approximate principal amount and maturity date. The actual principal amount and maturity date will be determined upon settlement. The market value of these securities as of April 30, 2013 is $24,175,538, which represents 2.7% of the Fund’s net assets. All or a portion of these securities were acquired under a mortgage dollar roll agreement. |
| (h) | Yankee Bond—Dollar-denominated bond issued in the United States by a foreign bank or corporation. |
| (k) | Represents the difference between the value of the contracts at the time they were opened and the value as of April 30, 2013. |
| (l) | As of April 30, 2013, cash in the amount of $766,352 is on deposit with the broker for futures transactions. |
| (m) | As of April 30, 2013, cost is $847,717,927 for federal income tax purposes and net unrealized appreciation is as follows: |
| | | | |
Gross unrealized appreciation | | $ | 58,944,758 | |
Gross unrealized depreciation | | | (2,164,691 | ) |
| | | | |
Net unrealized appreciation | | $ | 56,780,067 | |
| | | | |
The following is a summary of the fair valuations according to the inputs used as of April 30, 2013, for valuing the Fund’s assets and liabilities.
Asset Valuation Inputs
| | | | | | | | | | | | | | | | |
Description | | Quoted
Prices in
Active
Markets for
Identical
Assets (Level 1) | | | Significant
Other
Observable
Inputs (Level 2) | | | Significant
Unobservable
Inputs (Level 3) | | | Total | |
| Investments in Securities (a) | | | | | | | | | | | | | | | | |
| Long-Term Bonds | | | | | | | | | | | | | | | | |
Asset-Backed Security | | $ | — | | | $ | 815,192 | | | $ | — | | | $ | 815,192 | |
Convertible Bond | | | — | | | | 1,200,000 | | | | — | | | | 1,200,000 | |
Corporate Bonds (b) | | | — | | | | 508,412,347 | | | | 94,957 | | | | 508,507,304 | |
Mortgage-Backed Securities | | | — | | | | 46,985,036 | | | | — | | | | 46,985,036 | |
U.S. Government & Federal Agencies | | | — | | | | 302,022,435 | | | | — | | | | 302,022,435 | |
Yankee Bonds | | | — | | | | 1,834,630 | | | | — | | | | 1,834,630 | |
| | | | | | | | | | | | | | | | |
| Total Long-Term Bonds | | | — | | | | 861,269,640 | | | | 94,957 | | | | 861,364,597 | |
| | | | | | | | | | | | | | | | |
| Warrants (c) | | | — | | | | — | | | | 0 | (c) | | | 0 | (c) |
| Short-Term Investment | | | | | | | | | | | | | | | | |
Repurchase Agreement | | | — | | | | 43,133,397 | | | | — | | | | 43,133,397 | |
| | | | | | | | | | | | | | | | |
| Total Investments in Securities | | | — | | | | 904,403,037 | | | | 94,957 | | | | 904,497,994 | |
| | | | | | | | | | | | | | | | |
| Other Financial Instruments | | | | | | | | | | | | | | | | |
Futures Contracts Long (d) | | | 201,976 | | | | — | | | | — | | | | 201,976 | |
| | | | | | | | | | | | | | | | |
| Total Investments in Securities and Other Financial Instruments | | $ | 201,976 | | | $ | 904,403,037 | | | $ | 94,957 | | | $ | 904,699,970 | |
| | | | | | | | | | | | | | | | |
| | | | | | |
The notes to the financial statements are an integral part of,
and should be read in conjunction with, the financial statements. | | mainstayinvestments.com | | | 21 | |
Portfolio of Investments April 30, 2013 (Unaudited) (continued)
Liability Valuation Inputs
| | | | | | | | | | | | | | | | |
Description | | Quoted
Prices in
Active
Markets for
Identical
Assets (Level 1) | | | Significant
Other
Observable
Inputs
(Level 2) | | | Significant
Unobservable
Inputs
(Level 3) | | | Total | |
| Other Financial Instruments | | | | | | | | | | | | | | | | |
Futures Contracts Short (d) | | $ | (1,318,768 | ) | | $ | — | | | $ | — | | | $ | (1,318,768 | ) |
| | | | | | | | | | | | | | | | |
| Total Other Financial Instruments | | $ | (1,318,768 | ) | | $ | — | | | $ | — | | | $ | (1,318,768 | ) |
| | | | | | | | | | | | | | | | |
| (a) | For a complete listing of investments and their industries, see the Portfolio of Investments. |
| (b) | The Level 3 securities valued at $240 and $94,717 are Commercial Services and Retail, respectively, within the Corporate Bonds section of the Portfolio of Investments. |
| (c) | The Level 3 securities valued less than one dollar is held in Media within the Warrants section of the Portfolio of Investments. |
| (d) | The value listed for these securities reflects unrealized appreciation (depreciation) as shown on the Portfolio of Investments. |
The Fund recognizes transfers between the levels as of the beginning of the period.
For the period ended April 30, 2013, the Fund did not have any transfers between Level 1 and Level 2 fair value measurements. (See Note 2)
The following is a reconciliation of investments in which significant unobservable inputs (Level 3) were used in determining value:
| | | | | | | | | | | | | | | | | | | | | | | | | | | | | | | | | | | | | | | | |
Investments in Securities | | Balance
as of
October 31,
2012 | | | Accrued
Discounts
(Premiums) | | | Realized
Gain
(Loss) | | | Change in
Unrealized
Appreciation
(Depreciation) | | | Purchases | | | Sales | | | Transfers
into
Level 3 | | | Transfers
out of
Level 3 | | | Balance
as of
April 30,
2013 | | | Change in
Unrealized
Appreciation
(Depreciation)
from
Investments
Still Held at
April 30,
2013 (a) | |
| Long-Term Bonds | | | | | | | | | | | | | | | | | | | | | | | | | | | | | | | | | | | | | | | | |
Corporate Bonds | | | | | | | | | | | | | | | | | | | | | | | | | | | | | | | | | | | | | | | | |
Commercial Services | | $ | 240 | | | $ | — | | | $ | — | | | $ | — | | | $ | — | | | $ | — | | | $ | — | | | $ | — | | | $ | 240 | | | $ | — | |
Oil & Gas | | | 2,112,340 | | | | (4,229 | ) | | | 98,301 | | | | (71,412 | ) | | | — | | | | (2,135,000 | ) | | | — | | | | — | | | | — | | | | — | |
Retail | | | 94,731 | | | | (52 | ) | | | (53 | ) | | | 2,333 | | | | — | | | | (2,242 | ) | | | — | | | | — | | | | 94,717 | | | | 2,548 | |
Mortgage-Backed Securities | | | | | | | — | | | | | | | | | | | | | | | | | | | | | | | | | | | | | | | | — | |
Residential Mortgage (Collateralized Mortgage Obligation) | | | 327,863 | | | | — | | | | — | | | | — | | | | — | | | | — | | | | — | | | | (327,863 | ) | | | — | | | | — | |
| Warrants | | | | | | | — | | | | | | | | | | | | | | | | | | | | | | | | | | | | | | | | — | |
Media | | | 0 | (b) | | | — | | | | — | | | | — | | | | — | | | | — | | | | — | | | | — | | | | 0 | (b) | | | — | |
| | | | | | | | | | | | | | | | | | | | | | | | | | | | | | | | | | | | | | | | |
| Total | | $ | 2,535,174 | | | $ | (4,281 | ) | | $ | 98,248 | | | $ | (69,079 | ) | | $ | — | | | $ | (2,137,242 | ) | | $ | — | | | $ | (327,863 | ) | | $ | 94,957 | | | $ | 2,548 | |
| | | | | | | | | | | | | | | | | | | | | | | | | | | | | | | | | | | | | | | | |
| (a) | Included in “change in unrealized appreciation (depreciation) on investments” in the Statement of Operations. |
| | | | |
| 22 | | MainStay Intermediate Term Bond Fund | | The notes to the financial statements are an integral part of,
and should be read in conjunction with, the financial statements. |
Statement of Assets and Liabilities as of April 30, 2013 (Unaudited)
| | | | |
| Assets | |
Investment in securities, at value
(identified cost $846,220,154) | | $ | 904,497,994 | |
Cash collateral on deposit at broker | | | 766,352 | |
Cash | | | 148,125 | |
Receivables: | | | | |
Interest | | | 7,966,267 | |
Investment securities sold | | | 2,994,150 | |
Fund shares sold | | | 1,179,921 | |
Variation margin on futures contracts | | | 47,282 | |
Other assets | | | 62,998 | |
| | | | |
Total assets | | | 917,663,089 | |
| | | | |
|
| Liabilities | |
Payables: | | | | |
Investment securities purchased | | | 24,971,941 | |
Fund shares redeemed | | | 3,058,026 | |
Manager (See Note 3) | | | 346,992 | |
Transfer agent (See Note 3) | | | 135,245 | |
NYLIFE Distributors (See Note 3) | | | 58,773 | |
Professional fees | | | 34,419 | |
Shareholder communication | | | 14,008 | |
Custodian | | | 3,028 | |
Trustees | | | 1,966 | |
Accrued expenses | | | 4,194 | |
Dividend payable | | | 62,060 | |
| | | | |
Total liabilities | | | 28,690,652 | |
| | | | |
Net assets | | $ | 888,972,437 | |
| | | | |
|
| Composition of Net Assets | |
Shares of beneficial interest outstanding (par value of $.001 per share) unlimited number of shares authorized | | $ | 79,886 | |
Additional paid-in capital | | | 830,051,387 | |
| | | | |
| | | 830,131,273 | |
Distributions in excess of net investment income | | | (138,968 | ) |
Accumulated net realized gain (loss) on investments and futures transactions | | | 1,819,084 | |
Net unrealized appreciation (depreciation) on investments and futures contracts | | | 57,161,048 | |
| | | | |
Net assets | | $ | 888,972,437 | |
| | | | |
| | | | |
Investor Class | | | | |
Net assets applicable to outstanding shares | | $ | 9,676,438 | |
| | | | |
Shares of beneficial interest outstanding | | | 865,735 | |
| | | | |
Net asset value per share outstanding | | $ | 11.18 | |
Maximum sales charge (4.50% of offering price) | | | 0.53 | |
| | | | |
Maximum offering price per share outstanding | | $ | 11.71 | |
| | | | |
Class A | | | | |
Net assets applicable to outstanding shares | | $ | 74,655,856 | |
| | | | |
Shares of beneficial interest outstanding | | | 6,713,035 | |
| | | | |
Net asset value per share outstanding | | $ | 11.12 | |
Maximum sales charge (4.50% of offering price) | | | 0.52 | |
| | | | |
Maximum offering price per share outstanding | | $ | 11.64 | |
| | | | |
Class B | | | | |
Net assets applicable to outstanding shares | | $ | 10,405,651 | |
| | | | |
Shares of beneficial interest outstanding | | | 934,714 | |
| | | | |
Net asset value and offering price per share outstanding | | $ | 11.13 | |
| | | | |
Class C | | | | |
Net assets applicable to outstanding shares | | $ | 39,868,900 | |
| | | | |
Shares of beneficial interest outstanding | | | 3,577,420 | |
| | | | |
Net asset value and offering price per share outstanding | | $ | 11.14 | |
| | | | |
Class I | | | | |
Net assets applicable to outstanding shares | | $ | 754,312,875 | |
| | | | |
Shares of beneficial interest outstanding | | | 67,790,325 | |
| | | | |
Net asset value and offering price per share outstanding | | $ | 11.13 | |
| | | | |
Class R1 | | | | |
Net assets applicable to outstanding shares | | $ | 26,386 | |
| | | | |
Shares of beneficial interest outstanding | | | 2,371 | |
| | | | |
Net asset value and offering price per share outstanding | | $ | 11.13 | |
| | | | |
Class R2 | | | | |
Net assets applicable to outstanding shares | | $ | 26,331 | |
| | | | |
Shares of beneficial interest outstanding | | | 2,368 | |
| | | | |
Net asset value and offering price per share outstanding | | $ | 11.12 | |
| | | | |
| | | | | | |
The notes to the financial statements are an integral part of,
and should be read in conjunction with, the financial statements. | | mainstayinvestments.com | | | 23 | |
Statement of Operations for the six months ended April 30, 2013 (Unaudited)
| | | | |
| Investment Income (Loss) | | | | |
Income | | | | |
Interest | | $ | 17,032,672 | |
| | | | |
Expenses | | | | |
Manager (See Note 3) | | | 2,544,806 | |
Transfer agent (See Note 3) | | | 423,008 | |
Distribution/Service—Investor Class (See Note 3) | | | 11,416 | |
Distribution/Service—Class A (See Note 3) | | | 88,231 | |
Distribution/Service—Class B (See Note 3) | | | 52,107 | |
Distribution/Service—Class C (See Note 3) | | | 199,900 | |
Distribution/Service—Class R2 (See Note 3) | | | 33 | |
Registration | | | 52,596 | |
Professional fees | | | 38,652 | |
Shareholder communication | | | 24,984 | |
Custodian | | | 17,901 | |
Trustees | | | 10,008 | |
Shareholder service (See Note 3) | | | 25 | |
Miscellaneous | | | 16,469 | |
| | | | |
Total expenses before waiver/reimbursement | | | 3,480,136 | |
Expense waiver/reimbursement from Manager (See Note 3) | | | (488,558 | ) |
| | | | |
Net expenses | | | 2,991,578 | |
| | | | |
Net investment income (loss) | | | 14,041,094 | |
| | | | |
|
| Realized and Unrealized Gain (Loss) on Investments and Futures Contracts | |
Net realized gain (loss) on: | | | | |
Security transactions | | | 3,605,133 | |
Futures transactions | | | (322,480 | ) |
| | | | |
Net realized gain (loss) on investments and futures transactions | | | 3,282,653 | |
| | | | |
Net change in unrealized appreciation (depreciation) on: | | | | |
Investments | | | (720,758 | ) |
Futures contracts | | | (911,421 | ) |
| | | | |
Net change in unrealized appreciation (depreciation) on investments and futures contracts | | | (1,632,179 | ) |
| | | | |
Net realized and unrealized gain (loss) on investments and futures transactions | | | 1,650,474 | |
| | | | |
Net increase (decrease) in net assets resulting from operations | | $ | 15,691,568 | |
| | | | |
| | | | |
| 24 | | MainStay Intermediate Term Bond Fund | | The notes to the financial statements are an integral part of,
and should be read in conjunction with, the financial statements. |
Statements of Changes in Net Assets
for the six months ended April 30, 2013 (Unaudited) and the year ended October 31, 2012
| | | | | | | | |
| | | 2013 | | | 2012 | |
| Increase (Decrease) in Net Assets | |
Operations: | | | | | | | | |
Net investment income (loss) | | $ | 14,041,094 | | | $ | 26,612,401 | |
Net realized gain (loss) on investments and futures transactions | | | 3,282,653 | | | | 3,251,113 | |
Net change in unrealized appreciation (depreciation) on investments and futures contracts | | | (1,632,179 | ) | | | 33,869,888 | |
| | | | |
Net increase (decrease) in net assets resulting from operations | | | 15,691,568 | | | | 63,733,402 | |
| | | | |
Dividends and distributions to shareholders: | | | | | | | | |
From net investment income: | | | | | | | | |
Investor Class | | | (140,069 | ) | | | (228,542 | ) |
Class A | | | (1,120,733 | ) | | | (1,953,483 | ) |
Class B | | | (120,963 | ) | | | (218,923 | ) |
Class C | | | (461,087 | ) | | | (805,251 | ) |
Class I | | | (12,613,965 | ) | | | (23,880,504 | ) |
Class R1 | | | (430 | ) | | | (279 | ) |
Class R2 | | | (396 | ) | | | (258 | ) |
| | | | |
| | | (14,457,643 | ) | | | (27,087,240 | ) |
| | | | |
From net realized gain on investments: | | | | | | | | |
Investor Class | | | (27,493 | ) | | | (119,735 | ) |
Class A | | | (212,558 | ) | | | (939,806 | ) |
Class B | | | (32,496 | ) | | | (158,297 | ) |
Class C | | | (123,917 | ) | | | (528,535 | ) |
Class I | | | (2,259,296 | ) | | | (10,338,807 | ) |
Class R1 | | | (80 | ) | | | — | |
Class R2 | | | (80 | ) | | | — | |
| | | | |
| | | (2,655,920 | ) | | | (12,085,180 | ) |
| | | | |
Total dividends and distributions to shareholders | | | (17,113,563 | ) | | | (39,172,420 | ) |
| | | | |
Capital share transactions: | | | | | | | | |
Net proceeds from sale of shares | | | 120,698,793 | | | | 383,514,258 | |
Net asset value of shares issued to shareholders in reinvestment of dividends and distributions | | | 16,359,886 | | | | 36,272,589 | |
Cost of shares redeemed | | | (127,424,903 | ) | | | (185,332,897 | ) |
| | | | |
Increase (decrease) in net assets derived from capital share transactions | | | 9,633,776 | | | | 234,453,950 | |
| | | | |
Net increase (decrease) in net assets | | | 8,211,781 | | | | 259,014,932 | |
|
| Net Assets | |
Beginning of period | | | 880,760,656 | | | | 621,745,724 | |
| | | | |
End of period | | $ | 888,972,437 | | | $ | 880,760,656 | |
| | | | |
Undistributed (distributions in excess of) net investment income at end of period | | $ | (138,968 | ) | | $ | 277,581 | |
| | | | |
| | | | | | |
The notes to the financial statements are an integral part of,
and should be read in conjunction with, the financial statements. | | mainstayinvestments.com | | | 25 | |
Financial Highlights selected per share data and ratios
| | | | | | | | | | | | | | | | | | | | | | | | |
| | | Investor Class | |
| | | Six months
ended
April 30, | | | Year ended October 31, | | | February 28,
2008**
through
October 31, | |
| | | 2013* | | | 2012 | | | 2011 | | | 2010 | | | 2009 | | | 2008 | |
Net asset value at beginning of period | | $ | 11.20 | | | $ | 10.90 | | | $ | 10.94 | | | $ | 10.37 | | | $ | 9.39 | | | $ | 9.92 | |
| | | | | | | | | | | | | | | | | | | | | | | | |
Net investment income (loss) | | | 0.16 | (a) | | | 0.34 | | | | 0.38 | | | | 0.35 | | | | 0.30 | | | | 0.25 | |
Net realized and unrealized gain (loss) on investments | | | 0.02 | | | | 0.51 | | | | 0.09 | | | | 0.61 | | | | 0.96 | | | | (0.54 | ) |
Net realized and unrealized gain (loss) on foreign currency transactions | | | — | | | | — | | | | — | | | | (0.01 | ) | | | 0.01 | | | | — | |
| | | | | | | | | | | | | | | | | | | | | | | | |
Total from investment operations | | | 0.18 | | | | 0.85 | | | | 0.47 | | | | 0.95 | | | | 1.27 | | | | (0.29 | ) |
| | | | | | | | | | | | | | | | | | | | | | | | |
Less dividends and distributions: | | | | | | | | | | | | | | | | | | | | | | | | |
From net investment income | | | (0.17 | ) | | | (0.35 | ) | | | (0.43 | ) | | | (0.36 | ) | | | (0.29 | ) | | | (0.24 | ) |
From net realized gain on investments | | | (0.03 | ) | | | (0.20 | ) | | | (0.08 | ) | | | (0.02 | ) | | | — | | | | — | |
| | | | | | | | | | | | | | | | | | | | | | | | |
Total dividends and distributions | | | (0.20 | ) | | | (0.55 | ) | | | (0.51 | ) | | | (0.38 | ) | | | (0.29 | ) | | | (0.24 | ) |
| | | | | | | | | | | | | | | | | | | | | | | | |
Net asset value at end of period | | $ | 11.18 | | | $ | 11.20 | | | $ | 10.90 | | | $ | 10.94 | | | $ | 10.37 | | | $ | 9.39 | |
| | | | | | | | | | | | | | | | | | | | | | | | |
Total investment return (b) | | | 1.66 | %(c) | | | 8.14 | % | | | 4.51 | % | | | 9.33 | % | | | 13.72 | % | | | (2.98 | %)(c) |
Ratios (to average net assets)/Supplemental Data: | | | | | | | | | | | | | | | | | | | | | | | | |
Net investment income (loss) | | | 2.95 | %†† | | | 3.16 | % | | | 3.55 | % | | | 3.38 | % | | | 3.03 | % | | | 3.73 | %†† |
Net expenses | | | 0.98 | %†† | | | 1.00 | % | | | 1.03 | % | | | 1.07 | % | | | 1.17 | % | | | 1.20 | %†† |
Expenses (before waiver/reimbursement) | | | 1.07 | %†† | | | 1.09 | % | | | 1.13 | % | | | 1.17 | % | | | 1.25 | % | | | 1.34 | %†† |
Portfolio turnover rate | | | 32 | %(d) | | | 65 | %(d) | | | 104 | %(d) | | | 185 | %(d) | | | 246 | %(d) | | | 114 | %(d) |
Net assets at end of period (in 000’s) | | $ | 9,676 | | | $ | 8,670 | | | $ | 6,013 | | | $ | 4,608 | | | $ | 2,743 | | | $ | 1,727 | |
| ** | Commencement of operations. |
| (a) | Per share data based on average shares outstanding during the period. |
| (b) | Total investment return is calculated exclusive of sales charges and assumes the reinvestment of dividends and distributions. |
| (c) | Total investment return is not annualized. |
| (d) | The portfolio turnover rates not including mortgage dollar rolls were 21%, 38%, 65%, 79%, 130% and 92% for the six months ended April 30, 2013, and for the years ended October 31, 2012, 2011, 2010, 2009 and 2008, respectively. |
| | | | |
| 26 | | MainStay Intermediate Term Bond Fund | | The notes to the financial statements are an integral part of,
and should be read in conjunction with, the financial statements. |
Financial Highlights selected per share data and ratios
| | | | | | | | | | | | | | | | | | | | | | | | |
| | | Class A | |
| | | Six months
ended
April 30, | | | Year ended October 31, | |
| | | 2013* | | | 2012 | | | 2011 | | | 2010 | | | 2009 | | | 2008 | |
Net asset value at beginning of period | | $ | 11.14 | | | $ | 10.85 | | | $ | 10.89 | | | $ | 10.32 | | | $ | 9.35 | | | $ | 9.73 | |
| | | | | | | | | | | | | | | | | | | | | | | | |
Net investment income (loss) | | | 0.17 | (a) | | | 0.35 | | | | 0.39 | | | | 0.36 | | | | 0.34 | | | | 0.43 | |
Net realized and unrealized gain (loss) on investments | | | 0.01 | | | | 0.50 | | | | 0.09 | | | | 0.61 | | | | 0.93 | | | | (0.41 | ) |
Net realized and unrealized gain (loss) on foreign currency transactions | | | — | | | | — | | | | — | | | | (0.01 | ) | | | 0.01 | | | | — | |
| | | | | | | | | | | | | | | | | | | | | | | | |
Total from investment operations | | | 0.18 | | | | 0.85 | | | | 0.48 | | | | 0.96 | | | | 1.28 | | | | 0.02 | |
| | | | | | | | | | | | | | | | | | | | | | | | |
Less dividends and distributions: | | | | | | | | | | | | | | | | | | | | | | | | |
From net investment income | | | (0.17 | ) | | | (0.36 | ) | | | (0.44 | ) | | | (0.37 | ) | | | (0.31 | ) | | | (0.40 | ) |
From net realized gain on investments | | | (0.03 | ) | | | (0.20 | ) | | | (0.08 | ) | | | (0.02 | ) | | | — | | | | — | |
| | | | | | | | | | | | | | | | | | | | | | | | |
Total dividends and distributions | | | (0.20 | ) | | | (0.56 | ) | | | (0.52 | ) | | | (0.39 | ) | | | (0.31 | ) | | | (0.40 | ) |
| | | | | | | | | | | | | | | | | | | | | | | | |
Net asset value at end of period | | $ | 11.12 | | | $ | 11.14 | | | $ | 10.85 | | | $ | 10.89 | | | $ | 10.32 | | | $ | 9.35 | |
| | | | | | | | | | | | | | | | | | | | | | | | |
Total investment return (b) | | | 1.72 | %(c) | | | 8.20 | % | | | 4.63 | % | | | 9.48 | % | | | 13.89 | % | | | 0.07 | % |
Ratios (to average net assets)/Supplemental Data: | | | | | | | | | | | | | | | | | | | | | | | | |
Net investment income (loss) | | | 3.06 | %†† | | | 3.27 | % | | | 3.62 | % | | | 3.47 | % | | | 3.20 | % | | | 4.02 | % |
Net expenses | | | 0.88 | %†† | | | 0.89 | % | | | 0.93 | % | | | 0.96 | % | | | 1.00 | % | | | 1.03 | % |
Expenses (before waiver/reimbursement) | | | 0.97 | %†† | | | 0.98 | % | | | 1.03 | % | | | 1.06 | % | | | 1.08 | % | | | 1.16 | % |
Portfolio turnover rate | | | 32 | %(d) | | | 65 | %(d) | | | 104 | %(d) | | | 185 | %(d) | | | 246 | %(d) | | | 114 | %(d) |
Net assets at end of period (in 000’s) | | $ | 74,656 | | | $ | 66,161 | | | $ | 47,432 | | | $ | 35,837 | | | $ | 33,134 | | | $ | 16,211 | |
| (a) | Per share data based on average shares outstanding during the period. |
| (b) | Total investment return is calculated exclusive of sales charges and assumes the reinvestment of dividends and distributions. |
| (c) | Total investment return is not annualized. |
| (d) | The portfolio turnover rates not including mortgage dollar rolls were 21%, 38%, 65%, 79%, 130% and 92% for the six months ended April 30, 2013, and for the years ended October 31, 2012, 2011, 2010, 2009 and 2008, respectively. |
| | | | | | |
The notes to the financial statements are an integral part of,
and should be read in conjunction with, the financial statements. | | mainstayinvestments.com | | | 27 | |
Financial Highlights selected per share data and ratios
| | | | | | | | | | | | | | | | | | | | | | | | |
| | | Class B | |
| | | Six months
ended
April 30, | | | Year ended October 31, | |
| | | 2013* | | | 2012 | | | 2011 | | | 2010 | | | 2009 | | | 2008 | |
Net asset value at beginning of period | | $ | 11.15 | | | $ | 10.86 | | | $ | 10.90 | | | $ | 10.33 | | | $ | 9.36 | | | $ | 9.74 | |
| | | | | | | | | | | | | | | | | | | | | | | | |
Net investment income (loss) | | | 0.12 | (a) | | | 0.26 | | | | 0.30 | | | | 0.27 | | | | 0.23 | | | | 0.30 | |
Net realized and unrealized gain (loss) on investments | | | 0.02 | | | | 0.50 | | | | 0.09 | | | | 0.61 | | | | 0.95 | | | | (0.37 | ) |
Net realized and unrealized gain (loss) on foreign currency transactions | | | — | | | | — | | | | — | | | | (0.01 | ) | | | 0.01 | | | | — | |
| | | | | | | | | | | | | | | | | | | | | | | | |
Total from investment operations | | | 0.14 | | | | 0.76 | | | | 0.39 | | | | 0.87 | | | | 1.19 | | | | (0.07 | ) |
| | | | | | | | | | | | | | | | | | | | | | | | |
Less dividends and distributions: | | | | | | | | | | | | | | | | | | | | | | | | |
From net investment income | | | (0.13 | ) | | | (0.27 | ) | | | (0.35 | ) | | | (0.28 | ) | | | (0.22 | ) | | | (0.31 | ) |
From net realized gain on investments | | | (0.03 | ) | | | (0.20 | ) | | | (0.08 | ) | | | (0.02 | ) | | | — | | | | — | |
| | | | | | | | | | | | | | | | | | | | | | | | |
Total dividends and distributions | | | (0.16 | ) | | | (0.47 | ) | | | (0.43 | ) | | | (0.30 | ) | | | (0.22 | ) | | | (0.31 | ) |
| | | | | | | | | | | | | | | | | | | | | | | | |
Net asset value at end of period | | $ | 11.13 | | | $ | 11.15 | | | $ | 10.86 | | | $ | 10.90 | | | $ | 10.33 | | | $ | 9.36 | |
| | | | | | | | | | | | | | | | | | | | | | | | |
Total investment return (b) | | | 1.29 | %(c) | | | 7.27 | % | | | 3.74 | % | | | 8.55 | % | | | 12.82 | % | | | (0.79 | %) |
Ratios (to average net assets)/Supplemental Data: | | | | | | | | | | | | | | | | | | | | | | | | |
Net investment income (loss) | | | 2.21 | %†† | | | 2.41 | % | | | 2.81 | % | | | 2.62 | % | | | 2.29 | % | | | 3.13 | % |
Net expenses | | | 1.73 | %†† | | | 1.75 | % | | | 1.78 | % | | | 1.81 | % | | | 1.92 | % | | | 1.91 | % |
Expenses (before waiver/reimbursement) | | | 1.82 | %†† | | | 1.84 | % | | | 1.88 | % | | | 1.91 | % | | | 2.00 | % | | | 2.08 | % |
Portfolio turnover rate | | | 32 | %(d) | | | 65 | %(d) | | | 104 | %(d) | | | 185 | %(d) | | | 246 | %(d) | | | 114 | %(d) |
Net assets at end of period (in 000’s) | | $ | 10,406 | | | $ | 10,129 | | | $ | 7,815 | | | $ | 7,797 | | | $ | 6,065 | | | $ | 4,580 | |
| (a) | Per share data based on average shares outstanding during the period. |
| (b) | Total investment return is calculated exclusive of sales charges and assumes the reinvestment of dividends and distributions. |
| (c) | Total investment return is not annualized. |
| (d) | The portfolio turnover rates not including mortgage dollar rolls were 21%, 38%, 65%, 79%, 130% and 92% for the six months ended April 30, 2013, and for the years ended October 31, 2012, 2011, 2010, 2009 and 2008, respectively. |
| | | | |
| 28 | | MainStay Intermediate Term Bond Fund | | The notes to the financial statements are an integral part of,
and should be read in conjunction with, the financial statements. |
Financial Highlights selected per share data and ratios
| | | | | | | | | | | | | | | | | | | | | | | | |
| | | Class C | |
| | | Six months
ended
April 30, | | | Year ended October 31, | |
| | | 2013* | | | 2012 | | | 2011 | | | 2010 | | | 2009 | | | 2008 | |
Net asset value at beginning of period | | $ | 11.17 | | | $ | 10.87 | | | $ | 10.91 | | | $ | 10.34 | | | $ | 9.37 | | | $ | 9.75 | |
| | | | | | | | | | | | | | | | | | | | | | | | |
Net investment income (loss) | | | 0.12 | (a) | | | 0.26 | | | | 0.30 | | | | 0.27 | | | | 0.23 | | | | 0.30 | |
Net realized and unrealized gain (loss) on investments | | | 0.01 | | | | 0.51 | | | | 0.09 | | | | 0.61 | | | | 0.95 | | | | (0.37 | ) |
Net realized and unrealized gain (loss) on foreign currency transactions | | | — | | | | — | | | | — | | | | (0.01 | ) | | | 0.01 | | | | — | |
| | | | | | | | | | | | | | | | | | | | | | | | |
Total from investment operations | | | 0.13 | | | | 0.77 | | | | 0.39 | | | | 0.87 | | | | 1.19 | | | | (0.07 | ) |
| | | | | | | | | | | | | | | | | | | | | | | | |
Less dividends and distributions: | | | | | | | | | | | | | | | | | | | | | | | | |
From net investment income | | | (0.13 | ) | | | (0.27 | ) | | | (0.35 | ) | | | (0.28 | ) | | | (0.22 | ) | | | (0.31 | ) |
From net realized gain on investments | | | (0.03 | ) | | | (0.20 | ) | | | (0.08 | ) | | | (0.02 | ) | | | — | | | | — | |
| | | | | | | | | | | | | | | | | | | | | | | | |
Total dividends and distributions | | | (0.16 | ) | | | (0.47 | ) | | | (0.43 | ) | | | (0.30 | ) | | | (0.22 | ) | | | (0.31 | ) |
| | | | | | | | | | | | | | | | | | | | | | | | |
Net asset value at end of period | | $ | 11.14 | | | $ | 11.17 | | | $ | 10.87 | | | $ | 10.91 | | | $ | 10.34 | | | $ | 9.37 | |
| | | | | | | | | | | | | | | | | | | | | | | | |
Total investment return (b) | | | 1.19 | %(c) | | | 7.36 | % | | | 3.74 | % | | | 8.54 | % | | | 12.92 | % | | | (0.89 | %) |
Ratios (to average net assets)/Supplemental Data: | | | | | | | | | | | | | | | | | | | | | | | | |
Net investment income (loss) | | | 2.21 | %†† | | | 2.41 | % | | | 2.80 | % | | | 2.63 | % | | | 2.27 | % | | | 3.11 | % |
Net expenses | | | 1.73 | %†† | | | 1.75 | % | | | 1.78 | % | | | 1.81 | % | | | 1.92 | % | | | 1.92 | % |
Expenses (before waiver/reimbursement) | | | 1.82 | %†† | | | 1.84 | % | | | 1.88 | % | | | 1.91 | % | | | 2.00 | % | | | 2.08 | % |
Portfolio turnover rate | | | 32 | %(d) | | | 65 | %(d) | | | 104 | %(d) | | | 185 | %(d) | | | 246 | %(d) | | | 114 | %(d) |
Net assets at end of period (in 000’s) | | $ | 39,869 | | | $ | 39,141 | | | $ | 27,052 | | | $ | 22,850 | | | $ | 16,747 | | | $ | 7,106 | |
| (a) | Per share data based on average shares outstanding during the period. |
| (b) | Total investment return is calculated exclusive of sales charges and assumes the reinvestment of dividends and distributions. |
| (c) | Total investment return is not annualized. |
| (d) | The portfolio turnover rates not including mortgage dollar rolls were 21%, 38%, 65%, 79%, 130% and 92% for the six months ended April 30, 2013, and for the years ended October 31, 2012, 2011, 2010, 2009 and 2008, respectively. |
| | | | | | |
The notes to the financial statements are an integral part of,
and should be read in conjunction with, the financial statements. | | mainstayinvestments.com | | | 29 | |
Financial Highlights selected per share data and ratios
| | | | | | | | | | | | | | | | | | | | | | | | |
| | | Class I | |
| | | Six months
ended
April 30, | | | Year ended October 31, | |
| | | 2013* | | | 2012 | | | 2011 | | | 2010 | | | 2009 | | | 2008 | |
Net asset value at beginning of period | | $ | 11.15 | | | $ | 10.85 | | | $ | 10.89 | | | $ | 10.32 | | | $ | 9.35 | | | $ | 9.73 | |
| | | | | | | | | | | | | | | | | | | | | | | | |
Net investment income (loss) | | | 0.18 | (a) | | | 0.38 | | | | 0.43 | | | | 0.41 | | | | 0.34 | | | | 0.43 | |
Net realized and unrealized gain (loss) on investments | | | 0.02 | | | | 0.51 | | | | 0.09 | | | | 0.60 | | | | 0.96 | | | | (0.38 | ) |
Net realized and unrealized gain (loss) on foreign currency transactions | | | — | | | | — | | | | — | | | | (0.01 | ) | | | 0.01 | | | | — | |
| | | | | | | | | | | | | | | | | | | | | | | | |
Total from investment operations | | | 0.20 | | | | 0.89 | | | | 0.52 | | | | 1.00 | | | | 1.31 | | | | 0.05 | |
| | | | | | | | | | | | | | | | | | | | | | | | |
Less dividends and distributions: | | | | | | | | | | | | | | | | | | | | | | | | |
From net investment income | | | (0.19 | ) | | | (0.39 | ) | | | (0.48 | ) | | | (0.41 | ) | | | (0.34 | ) | | | (0.43 | ) |
From net realized gain on investments | | | (0.03 | ) | | | (0.20 | ) | | | (0.08 | ) | | | (0.02 | ) | | | — | | | | — | |
| | | | | | | | | | | | | | | | | | | | | | | | |
Total dividends and distributions | | | (0.22 | ) | | | (0.59 | ) | | | (0.56 | ) | | | (0.43 | ) | | | (0.34 | ) | | | (0.43 | ) |
| | | | | | | | | | | | | | | | | | | | | | | | |
Net asset value at end of period | | $ | 11.13 | | | $ | 11.15 | | | $ | 10.85 | | | $ | 10.89 | | | $ | 10.32 | | | $ | 9.35 | |
| | | | | | | | | | | | | | | | | | | | | | | | |
Total investment return (b) | | | 1.86 | %(c) | | | 8.61 | % | | | 4.97 | % | | | 9.88 | % | | | 14.22 | % | | | 0.39 | % |
Ratios (to average net assets)/Supplemental Data: | | | | | | | | | | | | | | | | | | | | | | | | |
Net investment income (loss) | | | 3.34 | %†† | | | 3.55 | % | | | 3.98 | % | | | 3.84 | % | | | 3.50 | % | | | 4.35 | % |
Net expenses | | | 0.60 | %†† | | | 0.60 | % | | | 0.60 | % | | | 0.59 | % | | | 0.66 | % | | | 0.70 | % |
Expenses (before waiver/reimbursement) | | | 0.72 | %†† | | | 0.73 | % | | | 0.78 | % | | | 0.81 | % | | | 0.83 | % | | | 0.78 | % |
Portfolio turnover rate | | | 32 | %(d) | | | 65 | %(d) | | | 104 | %(d) | | | 185 | %(d) | | | 246 | %(d) | | | 114 | %(d) |
Net assets at end of period (in 000’s) | | $ | 754,313 | | | $ | 756,608 | | | $ | 533,433 | | | $ | 486,383 | | | $ | 516,522 | | | $ | 133,090 | |
| (a) | Per share data based on average shares outstanding during the period. |
| (b) | Total investment return is calculated exclusive of sales charges and assumes the reinvestment of dividends and distributions. Class I shares are not subject to sales charges. |
| (c) | Total investment return is not annualized. |
| (d) | The portfolio turnover rates not including mortgage dollar rolls were 21%, 38%, 65%, 79%, 130% and 92% for the six months ended April 30, 2013, and for the years ended October 31, 2012, 2011, 2010, 2009 and 2008, respectively. |
| | | | |
| 30 | | MainStay Intermediate Term Bond Fund | | The notes to the financial statements are an integral part of,
and should be read in conjunction with, the financial statements. |
Financial Highlights selected per share data and ratios
| | | | | | | | |
| | | Class R1 | |
| | | Six months
ended
April 30, | | | June 29,
2012**
through
October 31, | |
| | | 2013* | | | 2012 | |
Net asset value at beginning of period | | $ | 11.15 | | | $ | 10.87 | |
| | | | | | | | |
Net investment income (loss) | | | 0.18 | (a) | | | 0.12 | |
Net realized and unrealized gain (loss) on investments | | | 0.01 | | | | 0.28 | |
| | | | | | | | |
Total from investment operations | | | 0.19 | | | | 0.40 | |
| | | | | | | | |
Less dividends and distributions: | | | | | | | | |
From net investment income | | | (0.18 | ) | | | (0.12 | ) |
From net realized gain on investments | | | (0.03 | ) | | | — | |
| | | | | | | | |
Total dividends and distributions | | | (0.21 | ) | | | (0.12 | ) |
| | | | | | | | |
Net asset value at end of period | | $ | 11.13 | | | $ | 11.15 | |
| | | | | | | | |
Total investment return (b) | | | 1.79 | %(c) | | | 3.70 | %(c) |
Ratios (to average net assets)/Supplemental Data: | | | | | | | | |
Net investment income (loss) | | | 3.22 | %†† | | | 3.36 | %†† |
Net expenses | | | 0.73 | %†† | | | 0.73 | %†† |
Expenses (before reimbursement/waiver) | | | 0.81 | %†† | | | 0.82 | %†† |
Portfolio turnover rate | | | 32 | %(d) | | | 65 | %(d) |
Net assets at end of period (in 000’s) | | $ | 26 | | | $ | 26 | |
| ** | Commencement of operations. |
| (a) | Per share data based on average shares outstanding during the period. |
| (b) | Total investment return is calculated exclusive of sales charges and assumes the reinvestment of dividends and distributions. Class R1 shares are not subject to sales charges. |
| (c) | Total investment return is not annualized. |
| (d) | The portfolio turnover rate not including mortgage dollar roll were 21% and 38% for the six months ended April 30, 2013, and for the period ended October 31, 2012, respectively. |
| | | | | | |
The notes to the financial statements are an integral part of,
and should be read in conjunction with, the financial statements. | | mainstayinvestments.com | | | 31 | |
Financial Highlights selected per share data and ratios
| | | | | | | | |
| | | Class R2 | |
| | | Six months
ended
April 30, | | | June 29,
2012**
through
October 31, | |
| | | 2013* | | | 2012 | |
Net asset value at beginning of period | | $ | 11.14 | | | $ | 10.86 | |
| | | | | | | | |
Net investment income (loss) | | | 0.16 | (a) | | | 0.11 | |
Net realized and unrealized gain (loss) on investments | | | 0.02 | | | | 0.28 | |
| | | | | | | | |
Total from investment operations | | | 0.18 | | | | 0.39 | |
| | | | | | | | |
Less dividends and distributions: | | | | | | | | |
From net investment income | | | (0.17 | ) | | | (0.11 | ) |
From net realized gain on investments | | | (0.03 | ) | | | — | |
| | | | | | | | |
Total dividends and distributions | | | (0.20 | ) | | | (0.11 | ) |
| | | | | | | | |
Net asset value at end of period | | $ | 11.12 | | | $ | 11.14 | |
| | | | | | | | |
Total investment return (b) | | | 1.67 | %(c) | | | 3.62 | %(c) |
Ratios (to average net assets)/Supplemental Data: | | | | | | | | |
Net investment income (loss) | | | 2.97 | %†† | | | 3.10 | %†† |
Net expenses | | | 0.97 | %†† | | | 0.98 | %†† |
Expenses (before waiver/reimbursement) | | | 1.07 | %†† | | | 1.07 | %†† |
Portfolio turnover rate | | | 32 | %(d) | | | 65 | %(d) |
Net assets at end of period (in 000’s) | | $ | 26 | | | $ | 26 | |
| ** | Commencement of operations. |
| (a) | Per share data based on average shares outstanding during the period. |
| (b) | Total investment return is calculated exclusive of sales charges and assumes the reinvestment of dividends and distributions. Class R2 shares are not subject to sales charges. |
| (c) | Total investment return is not annualized. |
| (d) | The portfolio turnover rate not including mortgage dollar roll were 21% and 38% for the six months ended April 30, 2013, and for the period ended October 31, 2012, respectively. |
| | | | |
| 32 | | MainStay Intermediate Term Bond Fund | | The notes to the financial statements are an integral part of,
and should be read in conjunction with, the financial statements. |
Notes to Financial Statements (Unaudited)
Note 1–Organization and Business
MainStay Funds Trust (the “Trust”) was organized as a Delaware statutory trust on April 28, 2009, and is governed by a Declaration of Trust. The Trust is registered under the Investment Company Act of 1940, as amended (the “1940 Act”), as an open-end investment management company, and is comprised of thirty-three funds (collectively referred to as the “Funds”). These financial statements and notes relate only to the MainStay Intermediate Term Bond Fund (the “Fund”), a diversified fund. The Fund is the successor of the MainStay Intermediate Term Bond Fund, a series of Eclipse Funds Inc. (the “Predecessor Fund”). The reorganization of the Predecessor Fund with and into the Fund occurred on February 26, 2010. All information and references to periods prior to February 26, 2010 relate to the Predecessor Fund.
The Fund currently offers seven classes of shares. Class I shares commenced operations on January 2, 1991. Class A, Class B, and Class C shares commenced operations on January 2, 2004. Investor Class shares commenced operations on February 28, 2008. Class R1 and Class R2 shares commenced operations on June 29, 2012. Investor Class and Class A shares are offered at net asset value (“NAV”) per share plus an initial sales charge. No sales charge applies to investments of $1 million or more (and certain other qualified purchases) in Investor Class and Class A shares, but a contingent deferred sales charge (“CDSC”) is imposed on certain redemptions of such shares made within one year of the date of purchase. Class B and Class C shares are offered at NAV without an initial sales charge, although a declining CDSC may be imposed on redemptions made within six years of the date of purchase of Class B shares and a 1.00% CDSC may be imposed on redemptions made within one year of the date of purchase of Class C shares. Class I, Class R1 and Class R2 shares are offered at NAV and are not subject to a sales charge. Depending upon eligibility, Class B shares convert to either Investor Class or Class A shares at the end of the calendar quarter eight years after the date they were purchased. Additionally, depending upon eligibility, Investor Class shares may convert to Class A shares and Class A shares may convert to Investor Class shares. The seven classes of shares have the same voting (except for issues that relate solely to one class), dividend, liquidation and other rights, and the same terms and conditions, except that Class B and Class C shares are subject to higher distribution and/or service fee rates than Investor Class, Class A and Class R2 shares under a distribution plan pursuant to Rule 12b-1 under the 1940 Act. Class I and Class R1 shares are not subject to a distribution and/or service fee. Class R1 and Class R2 shares are subject to a shareholder service fee. This is in addition to any fees paid under a distribution plan, where applicable.
The Fund’s investment objective is to seek total return.
Note 2–Significant Accounting Policies
The Fund prepares its financial statements in accordance with generally accepted accounting principles (“GAAP”) in the United States of America and follows the significant accounting policies described below.
(A) Securities Valuation. Investments are valued as of the close of regular trading on the New York Stock Exchange (“Exchange”) (generally 4:00 p.m. Eastern time) on each day the Fund is open for business (“valuation date”).
The Board of Trustees (the “Board”) has adopted procedures for the valuation of the Fund’s securities and has delegated the responsibility for valuation determination under those procedures to the Valuation Committee of the Fund (the “Valuation Committee”). The Board has authorized the Valuation Committee to appoint a Valuation Sub-Committee (the “Sub-Committee”) to deal in the first instance with questions that arise or cannot be resolved under these procedures. The Sub-Committee meets (in person, via electronic mail or via teleconference) on an as-needed basis. The Valuation Committee meets at a later time, as necessary, to ensure that actions taken by the Sub-Committee were appropriate. The procedures recognize that, subject to the oversight of the Board and unless otherwise noted, the responsibility for day-to-day valuation of portfolio assets (including securities for which market prices are not readily available) rests with New York Life Investment Management LLC (“New York Life Investments” or the “Manager”), aided to whatever extent necessary by the Subadvisor (as defined in Note 3(A)) of the Fund.
To assess the appropriateness of security valuations, the Manager or the Fund’s third party service provider who is subject to oversight by the Manager, regularly compares prior day prices, prices on comparable securities and the sale prices to the prior and current day prices and challenges prices exceeding certain tolerance levels with third party pricing services or broker sources. For those securities valued by recommendation, whether through a standardized fair valuation methodology or a fair valuation determination, the Valuation Committee reviews and affirms the reasonableness of the valuation based on such methodologies and determinations on a regular basis after considering all relevant information that is reasonably available.
“Fair value” is defined as the price that the Fund would receive upon selling an investment in an orderly transaction to an independent buyer in the principal or most advantageous market of the investment. Fair value measurements are determined within a framework that has established a three-tier hierarchy which maximizes the use of observable market data and minimizes the use of unobservable inputs to establish classification of fair value measurements for disclosure purposes. “Inputs” refers broadly to the assumptions that market participants would use in pricing the asset or liability, including assumptions about risk, such as the risk inherent in a particular valuation technique used to measure fair value using a pricing model and/or the risk inherent in the inputs for the valuation technique. Inputs may be observable or unobservable. Observable inputs reflect the assumptions market participants would use in pricing the asset or liability based on market data obtained from sources independent of the Fund. Unobservable inputs reflect the Fund’s own assumptions about the assumptions market participants would use in pricing the asset or liability developed based on the information available in the circumstances. The inputs or methodology used for valuing securities may not be an indication of the risks associated with investing in those securities. The three-tier hierarchy of inputs is summarized in the three broad Levels listed below.
| • | | Level 1—quoted prices in active markets for identical investments |
| • | | Level 2—other significant observable inputs (including quoted prices for similar investments in active markets, interest rates and yield curves, prepayment speeds, credit risks, etc.) |
| | | | |
| mainstayinvestments.com | | | 33 | |
Notes to Financial Statements (Unaudited) (continued)
| • | | Level 3—significant unobservable inputs (including the Fund’s own assumptions about the assumptions that market participants would use in determining the fair value of investments) |
The aggregate value by input level, as of April 30, 2013, for the Fund’s investments is included at the end of the Fund’s Portfolio of Investments.
The valuation techniques used by the Fund to measure fair value maximize the use of observable inputs and minimize the use of unobservable inputs. The Fund may utilize third party vendor evaluations, whose prices may be derived from one or more of the following standard inputs:
| | |
• Benchmark Yields | | • Reported Trades |
• Broker Dealer Quotes | | • Issuer Spreads |
• Two-sided markets | | • Benchmark securities |
• Bids/Offers | | • Reference Data (corporate actions or material event notices) |
• Industry and economic events | | • Comparable bonds |
• Equity and credit default swap curves | | • Monthly payment information |
Securities for which market values cannot be determined using the methodologies described above are valued by methods deemed in good faith by the Fund’s Valuation Committee, following the procedures established by the Board, to represent fair value. Under these procedures, the Fund primarily employs a market-based approach which may use related or comparable assets or liabilities, recent transactions, market multiples, book values, and other relevant information. The Fund may also use an income-based valuation approach in which the anticipated future cash flows of the investment are discounted to calculate fair value. Discounts may also be applied due to the nature or duration of any restrictions on the disposition of the investments. Due to the inherent uncertainty of valuations of such investments, the fair values may differ significantly from the values that would have been used had an active market existed. For the six-month period ended April 30, 2013, there have been no changes to the fair value methodologies.
Equity and non-equity securities which may be valued in this manner include, but are not limited to: (i) a security for which the trading has been halted or suspended; (ii) a debt security that has recently gone into default and for which there is not a current market quotation; (iii) a security of an issuer that has entered into a restructuring; (iv) a security that has been de-listed from a national exchange; (v) a security for which the market price is not available from a third party pricing source or, if so provided, does not, in the opinion of the Fund’s Manager or Subadvisor reflect the security’s market value; and (vi) a security whose principal market has been temporarily closed at a time when, under normal conditions, it would be open. Securities for which market quotations or observable inputs are not readily available are generally categorized as Level 3 in the hierarchy. As of April 30, 2013, the Fund held securities with a value of $94,957 that were fair valued.
Equity securities and Exchange Traded Funds are valued at the latest quoted sales prices as of the close of regular trading on the Exchange on each valuation date. Securities that are not traded on the valuation date are valued at the mean of the latest quoted bid and ask prices. Prices normally are taken from the principal market in which each secu-
rity trades. Futures contracts are valued at the last posted settlement price on the market where such futures are primarily traded. Investments in other mutual funds are valued at their respective NAVs as of the close of the Exchange on the valuation date. These securities are generally categorized as Level 1 in the hierarchy.
Debt securities (other than convertible bonds and municipal debt securities) are valued at the evaluated bid prices (evaluated mean prices in the case of convertible bonds and municipal debt securities) supplied by a pricing agent or broker selected by the Fund’s Manager in consultation with the Fund’s Subadvisor, whose prices reflect broker/dealer supplied valuations and electronic data processing techniques, if such prices are deemed by the Fund’s Manager, in consultation with the Fund’s Subadvisor to be representative of market values, at the regular close of trading of the Exchange on each valuation date. Debt securities, including corporate bonds, U.S. government and federal agency bonds, municipal bonds, foreign bonds, Yankee bonds, convertible bonds, asset-backed securities and mortgage-backed securities are generally categorized as Level 2 in the hierarchy.
Temporary cash investments acquired over 60 days to maturity are valued using the latest bid prices or using valuations based on a matrix system (which considers such factors as security prices, yields, maturities, and ratings), both as furnished by independent pricing services. Other temporary cash investments which mature in 60 days or less (“Short-Term Investments”) are valued at amortized cost. The amortized cost method involves valuing a security at its cost on the date of purchase and thereafter assuming a constant amortization to maturity of the difference between such cost and the value on maturity date. Amortized cost approximates the current fair value of a security. Securities valued at amortized cost are not valued using a quoted price in an active market. These securities are generally categorized as Level 2 in the hierarchy.
Foreign currency forward contracts are valued at their fair market values determined on the basis of the mean between the last current bid and ask prices based on dealer or exchange quotations and are generally categorized as Level 2 in the hierarchy.
Generally, a security is considered illiquid if it cannot be sold or disposed of in the ordinary course of business at approximately the price at which it is valued. Its illiquidity might prevent the sale of such security at a time when the Manager or Subadvisor might wish to sell, and these securities could have the effect of decreasing the overall level of a Fund’s liquidity. Further, the lack of an established secondary market may make it more difficult to value illiquid securities, requiring the Fund to rely on judgments that may be somewhat subjective in determining value, which could vary from the amount that the Fund could realize upon disposition. Difficulty in selling illiquid securities may result in a loss or may be costly to the Fund. Under the supervision of the Board, the Manager or Subadvisor determines the liquidity of the Fund’s investments; in doing so, the Manager or Subadvisor may consider various factors, including (i) the frequency of trades and quotations, (ii) the number of dealers and prospective purchasers, (iii) dealer undertakings to make a market, and (iv) the nature of the security and the market in which it trades (e.g., the time needed to dispose of the security, the method of soliciting offers and the mechanics of transfer). Illiquid securities generally will be valued in good faith in such a manner as the Board deems appropriate to reflect their fair value.
| | |
| 34 | | MainStay Intermediate Term Bond Fund |
(B) Income Taxes. The Fund’s policy is to comply with the requirements of the Internal Revenue Code of 1986, as amended (the “Internal Revenue Code”), applicable to regulated investment companies and to distribute all of the taxable income to the shareholders of the Fund within the allowable time limits. Therefore, no federal, state and local income tax provision is required.
Management evaluates its tax positions to determine if the tax positions taken meet the minimum recognition threshold in connection with accounting for uncertainties in income tax positions taken or expected to be taken for the purposes of measuring and recognizing tax liabilities in the financial statements. Recognition of tax benefits of an uncertain tax position is required only when the position is “more likely than not” to be sustained assuming examination by taxing authorities. Management has analyzed the Fund’s tax positions taken on federal, state and local income tax returns for all open tax years (for up to three tax years), and has concluded that no provision for federal, state and local income tax is required in the Fund’s financial statements. The Fund’s federal, state and local income and federal excise tax returns for tax years for which the applicable statutes of limitations have not expired are subject to examination by the Internal Revenue Service and state and local departments of revenue.
(C) Dividends and Distributions to Shareholders. Dividends and distributions are recorded on the ex-dividend date. The Fund intends to declare and pay dividends of net investment income, if any, at least monthly and distributions of net realized capital and currency gains, if any, at least annually. Unless the shareholder elects otherwise, all dividends and distributions are reinvested in the same class of shares of the Fund, at NAV. Dividends and distributions to shareholders are determined in accordance with federal income tax regulations and may differ from GAAP.
(D) Security Transactions and Investment Income. The Fund records security transactions on the trade date. Realized gains and losses on security transactions are determined using the identified cost method and include gains and losses from repayments of principal on mortgage-backed securities.
Interest income is accrued as earned using the effective interest rate method. Discounts and premiums on securities purchased, other than Short-Term Investments, for the Fund are accreted and amortized, respectively, on the effective interest rate method over the life of the respective securities or, in the case of a callable security, over the period to the first date of call. Discounts and premiums on Short-Term Investments are accreted and amortized, respectively, on the straight-line method. Income from payment-in-kind securities is recorded daily based on the effective interest method of accrual.
Investment income and realized and unrealized gains and losses on investments of the Fund are allocated to separate classes of shares pro rata based upon their relative net assets on the date the income is earned or realized and unrealized gains and losses are incurred.
(E) Expenses. Expenses of the Trust are allocated to the individual Funds in proportion to the net assets of the respective Funds when the expenses are incurred, except where direct allocations of expenses can be made. Expenses (other than transfer agent expenses and fees incurred under the shareholder services plans and the distribution plans further discussed in Note 3(B)) are allocated to separate classes of
shares pro rata based upon their relative net assets on the date the expenses are incurred. The expenses borne by the Fund, including those of related parties to the Fund, are shown in the Statement of Operations.
(F) Use of Estimates. In preparing financial statements in conformity with GAAP, management makes estimates and assumptions that affect the reported amounts and disclosures in the financial statements. Actual results could differ from those estimates.
(G) Repurchase Agreements. The Fund may enter into repurchase agreements to earn income. The Fund may enter into repurchase agreements only with financial institutions that are deemed by the Manager or Subadvisor to be creditworthy, pursuant to guidelines established by the Fund’s Board. During the term of any repurchase agreement, the Manager or Subadvisor will continue to monitor the creditworthiness of the seller. Under the 1940 Act, repurchase agreements are considered to be collateralized loans by a Fund to the seller secured by the securities transferred to the Fund.
When the Fund invests in repurchase agreements, the Fund’s custodian takes possession of the collateral pledged for investments in the repurchase agreement. The underlying collateral is valued daily on a mark-to-market basis to determine that the value, including accrued interest, exceeds the repurchase price. In the event of the seller’s default on the obligation to repurchase, the Fund has the right to liquidate the collateral and apply the proceeds in satisfaction of the obligation. Under certain circumstances, such as in the event of default or bankruptcy by the counterparty to the agreement, realization and/or retention of the collateral may be subject to legal proceedings and possible realized loss to the Fund.
(H) Futures Contracts. A futures contract is an agreement to purchase or sell a specified quantity of an underlying instrument at a specified future date and price, or to make or receive a cash payment based on the value of a financial instrument (e.g., foreign currency, interest rate, security, or securities index). The Fund is subject to equity price risk and/or interest rate risk in the normal course of investing in these transactions. During the period the futures contract is open, changes in the value of the contract are recognized as unrealized appreciation or depreciation by “marking-to-market” such contract on a daily basis to reflect the market value of the contract at the end of each day’s trading. The Fund agrees to receive from or pay to the broker an amount of cash equal to the daily fluctuation in the value of the contract. Such receipts or payments are known as “variation margin.” When the futures contract is closed, the Fund records a realized gain or loss equal to the difference between the proceeds from (or cost of) the closing transaction and the Fund’s basis in the contract.
The use of futures contracts involves, to varying degrees, elements of market risk in excess of the amount recognized in the Statement of Assets and Liabilities. The contract or notional amounts and variation margin reflect the extent of the Fund’s involvement in open futures positions. Risks arise from the possible imperfect correlation in movements in the price of futures contracts, interest rates and the underlying hedged assets, and the possible inability of counterparties to meet the terms of their contracts. However, the Fund’s activities in futures contracts have minimal counterparty risk as they are conducted through regulated exchanges that guarantee the futures against default by the
| | | | |
| mainstayinvestments.com | | | 35 | |
Notes to Financial Statements (Unaudited) (continued)
counterparty. In the event of a bankruptcy or insolvency of a futures commission merchant that holds margin on behalf of the Fund, the Fund may not be entitled to the return of all of the margin owed to the Fund, potentially resulting in a loss. The Fund may invest in futures contracts to help manage the duration and yield curve of the portfolio while minimizing the exposure to wider bid/ask spreads in traditional bonds. The Fund’s investment in futures contracts and other derivatives may increase the volatility of the Fund’s NAV and may result in a loss to the Fund.
(I) Foreign Currency Forward Contracts. The Fund may enter into foreign currency forward contracts, which are agreements to buy or sell currencies of different countries on a specified future date at a specified rate. The Fund is subject to foreign currency exchange rate risk in the normal course of investing in these transactions. During the period the forward contract is open, changes in the value of the contract are recognized as unrealized appreciation or depreciation by “marking-to-market” such contract on a daily basis to reflect the market value of the contract at the end of each day’s trading. Cash movement occurs on settlement date. When the forward contract is closed, the Fund records a realized gain or loss equal to the difference between the proceeds from (or cost of) the closing transaction and the Fund’s basis in the contract. The Fund may enter into foreign currency forward contracts to reduce currency risk versus the benchmark or for trade settlement.
The use of foreign currency forward contracts involves, to varying degrees, elements of market risk in excess of the amount recognized in the Statement of Assets and Liabilities. The contract amount reflects the extent of the Fund’s involvement in these financial instruments. Risks arise from the possible movements in the foreign exchange rates underlying these instruments. While the Fund may enter into forward contracts to reduce currency exchange risks, changes in currency exchange rates may result in poorer overall performance for the Fund than if it had not engaged in such transactions. Exchange rate movements can be large, depending on the currency, and can last for extended periods of time, affecting the value of the Fund’s assets. Moreover, there may be an imperfect correlation between the Fund’s holdings of securities denominated in a particular currency and the forward contracts entered into by the Fund. Such imperfect correlation may prevent the Fund from achieving the intended hedge or expose the Fund to the risk of currency exchange loss. The unrealized appreciation (depreciation) on forward contracts reflects the Fund’s exposure at valuation date to credit loss in the event of a counterparty’s failure to perform its obligations. As of April 30, 2013, the Fund did not hold any foreign currency forward contracts.
(J) Rights and Warrants. Rights are certificates that permit the holder to purchase a certain number of shares, or a fractional share, of a new stock from the issuer at a specific price. Warrants are instruments that entitle the holder to buy an equity security at a specific price for a specific period of time. The Fund may enter into rights and warrants when securities are acquired through a corporate action. With respect to warrants in international markets, the securities may be purchased only when the underlying security cannot be purchased due to the many restrictions an industry and/or country might place on foreign investors. These investments can provide a greater potential for profit or loss than an equivalent investment in the underlying security.
Prices of these investments do not necessarily move in tandem with the prices of the underlying securities.
There is risk involved in the purchase of rights and warrants in that these investments are speculative investments. The Fund could also lose the entire value of its investment in warrants, if such warrants are not exercised by the date of its expiration. The securities are sold as soon as the opportunity becomes available. The Fund is exposed to risk until the sale or exercise of each right or warrant is completed. As of April 30, 2013, the Fund did not hold any rights.
(K) Dollar Rolls. The Fund may enter into dollar roll transactions in which it sells mortgage-backed securities (“MBS”) from its portfolio to a counterparty from whom it simultaneously agrees to buy a similar security on a delayed delivery basis. The dollar roll transactions of the Fund are classified as purchase and sale transactions. The securities sold in connection with the dollar rolls are removed from the portfolio and a realized gain or loss is recognized. The securities the Fund has agreed to acquire are included at market value in the Portfolio of Investments and liabilities for such purchase commitments are included as payables for investments purchased. During the roll period, the Fund foregoes principal and interest paid on the securities. The Fund is compensated by the difference between the current sales price and the forward price for the future as well as by the earnings on the cash proceeds of the initial sale. Dollar rolls may be renewed without physical delivery of the securities subject to the contract. The Fund maintains liquid assets from its portfolio having a value not less than the repurchase price, including accrued interest. Dollar roll transactions involve certain risks, including the risk that the MBS returned to the Fund at the end of the roll period, while substantially similar, could be inferior to what was initially sold to the counterparty.
(L) Securities Lending. In order to realize additional income, the Fund may engage in securities lending, subject to the limitations set forth in the 1940 Act and relevant guidance by the staff of the Securities and Exchange Commission. In the event the Fund does engage in securities lending, the Fund will lend through its custodian, State Street Bank and Trust Company (“State Street”). State Street will manage the Fund’s cash collateral in accordance with the lending agreement between the Fund and State Street, and indemnify the Fund’s portfolio against counterparty risk. The loans will be collateralized by cash or securities at least equal at all times to the market value of the securities loaned. Collateral will consist of U.S. Government securities, cash equivalents or irrevocable letters of credit. The Fund may bear the risk of delay in recovery of, or loss of rights in, the securities loaned should the borrower of the securities experience financial difficulty. The Fund may also record realized gain or loss on securities deemed sold due to a borrower’s inability to return securities on loan. The Fund will receive compensation for lending its securities in the form of fees or the retention of a portion of the interest on the investment of any cash received as collateral. The Fund also will continue to receive interest and dividends on the securities loaned and any gain or loss in the market price of the securities loaned that may occur during the term of the loan will be for the account of the Fund.
Although the Fund and New York Life Investments have temporarily suspended securities lending, the Fund and New York Life Investments reserve the right to reinstitute lending when deemed appropriate. The Fund did not have any portfolio securities on loan as of April 30, 2013.
| | |
| 36 | | MainStay Intermediate Term Bond Fund |
(M) Restricted Securities. A restricted security is a security which has been purchased through a private offering and cannot be resold to the general public without prior registration under the Securities Act of 1933, as amended. The Fund may not have the right to demand that such securities be registered. Disposal of these securities may involve time-consuming negotiations and expenses and it may be difficult to obtain a prompt sale at an acceptable price. (See Note 5)
(N) Concentration of Risk. The Fund may invest in foreign securities, which carry certain risks that are in addition to the usual risks inherent in domestic instruments. These risks include those resulting from currency fluctuations, future adverse political and economic developments and possible imposition of currency exchange blockages or other foreign governmental laws or restrictions. These risks are likely to be greater in emerging markets than in developed markets. The ability of issuers of debt securities held by the Fund to meet their obligations may be affected by economic or political developments in a specific country, industry or region.
(O) Indemnifications. Under the Trust’s organizational documents, its officers and trustees are indemnified against certain liabilities that may arise out of performance of their duties to the Trust. Additionally, in the normal course of business, the Fund enters into contracts with third-party service providers that contain a variety of representations and warranties and which may provide general indemnifications. The Fund’s maximum exposure under these arrangements is unknown, as this would involve future claims that may be made against the Fund that have not yet occurred. Based on experience, management is of the view that the risk of loss in connection with these potential indemnification obligations is remote. However, there can be no assurance that material liabilities related to such obligations will not arise in the future, which could adversely impact the Fund.
(P) Quantitative Disclosure of Derivative Holdings. The following tables show additional disclosures about the Fund’s derivative and hedging activities, including how such activities are accounted for and their effect on the Fund’s financial positions, performance and cash flows. These derivatives are not accounted for as hedging instruments.
Fair value of derivatives instruments as of April 30, 2013:
Asset Derivatives
| | | | | | | | | | | | | | |
| | | Statement of
Assets and Liabilities
Location | | Equity
Contracts
Risk | | | Interest
Rate
Contracts
Risk | | | Total | |
Warrants | | Investments in securities, at value | | $ | 0 | (a) | | $ | — | | | $ | 0 | (a) |
Futures Contracts Long | | Net Assets—Net unrealized appreciation (depreciation) on investments and futures contracts | | $ | — | | | $ | 201,976 | | | $ | 201,976 | |
| | | | | | | | | | | | | | |
Total Fair Value | | $ | — | | | $ | 201,976 | | | $ | 201,976 | |
| | | | | | | | | | | | | | |
Liability Derivatives
| | | | | | | | | | | | | | |
| | | Statement of
Assets and Liabilities
Location | | Equity
Contracts
Risk | | | Interest
Rate
Contracts
Risk | | | Total | |
Futures Contracts Short | | Net Assets—Net unrealized appreciation (depreciation) on investments and futures contracts (b) | | $ | — | | | $ | (1,318,768 | ) | | $ | (1,318,768 | ) |
| | | | | | | | | | | | | | |
Total Fair Value | | $ | — | | | $ | (1,318,768 | ) | | $ | (1,318,768 | ) |
| | | | | | | | | | | | | | |
| (b) | Includes cumulative appreciation (depreciation) of futures contracts as reported in the Portfolio of Investments. Only current day’s variation margin is reported within the Statement of Assets and Liabilities. |
| | | | |
| mainstayinvestments.com | | | 37 | |
Notes to Financial Statements (Unaudifed) (continued)
The effect of derivative instruments on the Statement of Operations for the period ended April 30, 2013:
Realized Gain (Loss)
| | | | | | | | | | | | | | |
| | | Statement of
Operations
Location | | Equity
Contracts
Risk | | | Interest
Rate
Contracts
Risk | | | Total | |
Futures Contracts | | Net realized gain (loss) on futures transactions | | $ | — | | | $ | (322,480 | ) | | $ | (322,480 | ) |
| | | | | | | | | | | | | | |
Total Realized Gain (Loss) | | $ | — | | | $ | (322,480 | ) | | $ | (322,480 | ) |
| | | | | | | | | | | | | | |
Change in Unrealized Appreciation (Depreciation)
| | | | | | | | | | | | | | |
| | | Statement of
Operations
Location | | Equity
Contracts
Risk | | | Interest
Rate
Contracts
Risk | | | Total | |
Futures Contracts | | Net change in unrealized appreciation (depreciation) on futures contracts | | $ | — | | | $ | (911,421 | ) | | $ | (911,421 | ) |
| | | | | | | | | | | | | | |
Total Change in Unrealized Appreciation (Depreciation) | | $ | — | | | $ | (911,421 | ) | | $ | (911,421 | ) |
| | | | | | | | | | | | | | |
Number of Contracts, Notional Amounts or Shares/Units (1)
| | | | | | | | | | | | |
| | | Equity
Contracts
Risk | | | Interest
Rate
Contracts
Risk | | | Total | |
Warrants | | | 2 | | | | — | | | | — | |
Futures Contracts Long | | | — | | | | 32 | | | | 32 | |
Futures Contracts Short | | | — | | | | (1,056 | ) | | | (1,056 | ) |
| | | | | | | | | | | | |
| (1) | Amount disclosed represents the weighted average held during the period ended April 30, 2013. |
Note 3–Fees and Related Party Transactions
(A) Manager and Subadvisor. New York Life Investments, a registered investment adviser and an indirect, wholly-owned subsidiary of New York Life Insurance Company (“New York Life”), serves as the Fund’s Manager, pursuant to an Amended and Restated Management Agreement (“Management Agreement”). The Manager provides offices, conducts clerical, recordkeeping and bookkeeping services, and keeps most of the financial and accounting records required to be maintained by the Fund. Except for the portion of salaries and expenses that are the responsibility of the Fund, the Manager pays the salaries and expenses of all personnel affiliated with the Fund and certain operational expenses of the Fund. The Fund reimburses New York Life Investments in an amount equal to a portion of the salary of the Chief Compliance Officer (“CCO”) of the Fund. MacKay Shields LLC (“MacKay Shields” or the “Subadvisor”), a registered investment adviser and an indirect, wholly-owned subsidiary of New York Life, serves as Subadvisor to the Fund and is responsible for the day-to-day portfolio management of the Fund. Pursuant to the terms of an Amended and Restated Subadvisory Agreement (“Subadvisory Agreement”) between New York Life Investments and MacKay Shields, New York Life Investments pays for the services of the Subadvisor.
The Fund pays the Manager a monthly fee for services performed and facilities furnished at an annual rate of the Fund’s average daily net assets as follows: 0.60% up to $500 million; 0.575% from $500 million to $1 billion; and 0.55% in excess of $1 billion.
New York Life Investments has contractually agreed to waive a portion of its management fee so that it does not exceed 0.50% up to $1 billion; and 0.475% in excess of $1 billion. This agreement may only be amended or terminated prior to that date by action of the Board of Trustees of the Fund. The effective management fee rate (exclusive of any applicable waivers/reimbursements) was 0.59% for the six-month period ended April 30, 2013.
New York Life Investments has contractually agreed to waive fees and/or reimburse expenses so that Total Annual Fund Operating Expenses for Class I shares do not exceed 0.60% of its average daily net assets. This agreement will remain in effect until February 28, 2014, and shall renew automatically for one-year terms unless New York Life Investments provides written notice of termination prior to the start of the next term or upon approval of the Board. Total Annual Fund Operating Expenses excludes taxes, interest, litigation, extraordinary expenses, brokerage and other transaction expenses relating to the purchase or sale of portfolio investments, and acquired (underlying) fund fees and expenses.
For the six-month period ended April 30, 2013, New York Life Investments earned fees from the Fund in the amount of $2,544,806 and waived its fees and/or reimbursed expenses in the amount of $488,558.
State Street, 1 Lincoln Street, Boston, Massachusetts 02111, provides sub-administration and sub-accounting services to the Fund pursuant to an agreement with New York Life Investments. These services include calculating the daily NAVs of the Fund, maintaining the general ledger and sub-ledger accounts for the calculation of the Fund’s respective NAVs, and assisting New York Life Investments in conducting various
| | |
| 38 | | MainStay Intermediate Term Bond Fund |
aspects of the Fund’s administrative operations. For providing these services to the Fund, State Street is compensated by New York Life Investments.
(B) Distribution and Service Fees. The Trust, on behalf of the Fund, has entered into a distribution agreement with NYLIFE Distributors LLC (the “Distributor”), an indirect, wholly-owned subsidiary of New York Life. The Fund has adopted distribution plans (the “Plans”) in accordance with the provisions of Rule 12b-1 under the 1940 Act.
Pursuant to the Investor Class, Class A and Class R2 Plans, the Distributor receives a monthly distribution fee from the Investor Class, Class A and Class R2 shares at an annual rate of 0.25% of the average daily net assets of the Investor Class, Class A and Class R2 shares for distribution and/or service activities as designated by the Distributor. Pursuant to the Class B and Class C Plans, Class B and Class C shares pay the Distributor a monthly distribution fee at an annual rate of 0.75% of the average daily net assets of the Class B and Class C shares, along with a service fee at an annual rate of 0.25% of the average daily net assets of the Class B and Class C shares, for a total 12b-1 fee of 1.00%. Class I and Class R1 shares are not subject to a distribution and/or service fee.
The Plans provide that the distribution and service fees are payable to the Distributor regardless of the amounts actually expended by the Distributor for distribution of the Fund’s shares and service activities.
In accordance with the Shareholder Services Plans for the Class R1 and Class R2 shares, the Manager has agreed to provide, through its affiliates or independent third parties, various shareholder and administrative support services to shareholders of the Class R1 and Class R2 shares. For its services, the Manager is entitled to a Shareholder service fee accrued daily and paid monthly at an annual rate of 0.10% of the average daily net assets of the Class R1 and Class R2 shares. This is in addition to any fees paid under a distribution plan, where applicable.
Shareholder service fees incurred by the Fund for the six-month period ended April 30, 2013, were as follows:
(C) Sales Charges. The Fund was advised by the Distributor that the amount of sales charges retained on sales of Investor Class and Class A shares were $5,672 and $32,869, respectively, for the six-month period ended April 30, 2013. The Fund was also advised that the Distributor retained CDSCs on redemptions of Class A, Class B and Class C shares of $380, $6,248 and $6,878, respectively, for the six-month period ended April 30, 2013.
(D) Transfer, Dividend Disbursing and Shareholder Servicing Agent. NYLIM Service Company LLC, an affiliate of New York Life Investments, is the Fund’s transfer, dividend disbursing and shareholder servicing agent pursuant to an agreement between NYLIM Service Company LLC and the Trust. NYLIM Service Company LLC has entered into an agreement with Boston Financial Data Services, Inc. (“BFDS”) pursuant to which BFDS performs certain transfer agent services on behalf of NYLIM Service Company LLC. Transfer agent expenses
incurred by the Fund for the six-month period ended April 30, 2013, were as follows:
| | | | |
Investor Class | | $ | 8,883 | |
Class A | | | 32,060 | |
Class B | | | 10,121 | |
Class C | | | 38,821 | |
Class I | | | 333,099 | |
Class R1 | | | 12 | |
Class R2 | | | 12 | |
(E) Small Account Fee. Shareholders with small accounts adversely impact the cost of providing transfer agency services. In an effort to reduce total transfer agency expenses, the Fund has implemented a small account fee on certain types of accounts. Certain shareholders with an account balance of less than $1,000 are charged an annual per account fee of $20 (assessed semi-annually), the proceeds from which offset transfer agent fees as reflected in the Statement of Operations.
(F) Capital. As of April 30, 2013, New York Life and its affiliates beneficially held shares of the Fund with values and percentages of net assets as follows:
| | | | | | | | |
Class R1 | | $ | 26,319 | | | | 99.7 | % |
Class R2 | | | 26,272 | | | | 99.8 | |
Note 4–Federal Income Tax
The tax character of distributions paid during the year ended October 31, 2012, shown in the Statements of Changes in Net Assets was as follows:
| | | | |
| | | 2012 | |
Distributions paid from: | | | | |
Ordinary Income | | $ | 35,201,050 | |
Long-Term Capital Gain | | | 3,971,370 | |
Total | | $ | 39,172,420 | |
| | | | |
| mainstayinvestments.com | | | 39 | |
Notes to Financial Statements (Unaudifed) (continued)
Note 5–Restricted Securities
As of April 30, 2013, the Fund held the following restricted securities:
| | | | | | | | | | | | | | | | | | | | |
Security | | Date(s) of
Acquisition | | | Number of
Warrants | | | Cost | | | 4/30/2013
Value | | | Percent of
Net Assets | |
ION Media Networks, Inc. | | | | | | | | | | | | | | | | | | | | |
Warrant, Second Lien, Expires 12/18/39 | | | 12/20/10 | | | | 1 | | | $ | — | | | $ | 0(a) | | | | 0.00 | %‡ |
Warrant, Unsecured Debt, Expires 12/18/16 | | | 3/12/10 | | | | 1 | | | | 4 | | | | 0(a) | | | | 0.00 | ‡ |
Total | | | | | | | | | | $ | 4 | | | $ | 0(a) | | | | 0.00 | %‡ |
| ‡ | Less than one-tenth of a percent. |
Note 6–Custodian
State Street is the custodian of the cash and the securities of the Fund. Custodial fees are charged to the Fund based on the market value of securities in the Fund and the number of certain cash transactions incurred by the Fund.
Note 7–Line of Credit
The Fund and certain affiliated funds maintain a line of credit with a syndicate of banks in order to secure a source of funds for temporary purposes to meet unanticipated or excessive redemption requests.
Effective August 29, 2012, under a second amended and restated credit agreement (the “Credit Agreement”), the aggregate commitment amount is $200,000,000 with an optional maximum amount of $250,000,000. The commitment fee is an annual rate of 0.08% of the average commitment amount payable quarterly, regardless of usage, to Bank of New York Mellon, which serves as the agent to the syndicate. The commitment fee is allocated among the Fund and certain affiliated funds based upon net assets and other factors. Interest on any revolving credit loan is charged based upon the Federal Funds Advances rate or the one month London InterBank Offered Rate, whichever is higher. The Credit Agreement expires on August 28, 2013, although the Fund, certain affiliated funds and the syndicate of banks may renew the Credit Agreement for an additional year on the same or different terms. There were no borrowings made or outstanding with respect to the Fund on the Credit Agreement during the six-month period ended April 30, 2013.
Note 8–Purchases and Sales of Securities (in 000’s)
During the six-month period ended April 30, 2013, purchases and sales of U.S. government securities were $197,252 and $215,937, respectively. Purchases and sales of securities, other than U.S. government securities and short-term securities, were $72,631 and $58,391, respectively.
Note 9–Capital Share Transactions
| | | | | | | | |
Investor Class | | Shares | | | Amount | |
Six-month period ended April 30, 2013: | | | | | | | | |
Shares sold | | | 174,369 | | | $ | 1,940,770 | |
Shares issued to shareholders in reinvestment of dividends and distributions | | | 14,859 | | | | 165,238 | |
Shares redeemed | | | (106,323 | ) | | | (1,182,455 | ) |
| | | | | | | | |
Net increase (decrease) in shares outstanding before conversion | | | 82,905 | | | | 923,553 | |
Shares converted into Investor Class (See Note 1) | | | 51,373 | | | | 569,523 | |
Shares converted from Investor Class (See Note 1) | | | (42,773 | ) | | | (475,629 | ) |
| | | | | | | | |
Net increase (decrease) | | | 91,505 | | | $ | 1,017,447 | |
| | | | | | | | |
Year ended October 31, 2012: | | | | | | | | |
Shares sold | | | 378,236 | | | $ | 4,141,590 | |
Shares issued to shareholders in reinvestment of dividends and distributions | | | 31,742 | | | | 343,772 | |
Shares redeemed | | | (157,174 | ) | | | (1,712,211 | ) |
| | | | | | | | |
Net increase (decrease) in shares outstanding before conversion | | | 252,804 | | | | 2,773,151 | |
Shares converted into Investor Class (See Note 1) | | | 76,360 | | | | 832,262 | |
Shares converted from Investor Class (See Note 1) | | | (106,575 | ) | | | (1,159,817 | ) |
| | | | | | | | |
Net increase (decrease) | | | 222,589 | | | $ | 2,445,596 | |
| | | | | | | | |
| | |
| 40 | | MainStay Intermediate Term Bond Fund |
| | | | | | | | |
Class A | | Shares | | | Amount | |
Six-month period ended April 30, 2013: | | | | | | | | |
Shares sold | | | 1,446,282 | | | $ | 16,016,943 | |
Shares issued to shareholders in reinvestment of dividends and distributions | | | 101,576 | | | | 1,123,740 | |
Shares redeemed | | | (807,479 | ) | | | (8,938,623 | ) |
| | | | | | | | |
Net increase (decrease) in shares outstanding before conversion | | | 740,379 | | | | 8,202,060 | |
Shares converted into Class A
(See Note 1) | | | 64,832 | | | | 716,822 | |
Shares converted from Class A
(See Note 1) | | | (29,492 | ) | | | (325,589 | ) |
| | | | | | | | |
Net increase (decrease) | | | 775,719 | | | $ | 8,593,293 | |
| | | | | | | | |
Year ended October 31, 2012: | | | | | | | | |
Shares sold | | | 5,063,749 | | | $ | 55,276,791 | |
Shares issued to shareholders in reinvestment of dividends and distributions | | | 222,732 | | | | 2,400,189 | |
Shares redeemed | | | (3,857,183 | ) | | | (42,277,029 | ) |
| | | | | | | | |
Net increase (decrease) in shares outstanding before conversion | | | 1,429,298 | | | | 15,399,951 | |
Shares converted into Class A
(See Note 1) | | | 156,611 | | | | 1,692,432 | |
Shares converted from Class A
(See Note 1) | | | (21,155 | ) | | | (230,400 | ) |
| | | | | | | | |
Net increase (decrease) | | | 1,564,754 | | | $ | 16,861,983 | |
| | | | | | | | |
| | |
| | | | | | | | |
Class B | | Shares | | | Amount | |
Six-month period ended April 30, 2013: | | | | | | | | |
Shares sold | | | 184,302 | | | $ | 2,043,353 | |
Shares issued to shareholders in reinvestment of dividends and distributions | | | 12,288 | | | | 136,137 | |
Shares redeemed | | | (126,014 | ) | | | (1,395,189 | ) |
| | | | | | | | |
Net increase (decrease) in shares outstanding before conversion | | | 70,576 | | | | 784,301 | |
Shares converted from Class B
(See Note 1) | | | (43,961 | ) | | | (485,127 | ) |
| | | | | | | | |
Net increase (decrease) | | | 26,615 | | | $ | 299,174 | |
| | | | | | | | |
Year ended October 31, 2012: | | | | | | | | |
Shares sold | | | 457,424 | | | $ | 4,975,828 | |
Shares issued to shareholders in reinvestment of dividends and distributions | | | 30,582 | | | | 329,136 | |
Shares redeemed | | | (194,606 | ) | | | (2,112,100 | ) |
| | | | | | | | |
Net increase (decrease) in shares outstanding before conversion | | | 293,400 | | | | 3,192,864 | |
Shares converted from Class B
(See Note 1) | | | (105,030 | ) | | | (1,134,477 | ) |
| | | | | | | | |
Net increase (decrease) | | | 188,370 | | | $ | 2,058,387 | |
| | | | | | | | |
| | |
| | | | | | | | |
| | | | | | | | |
Class C | | Shares | | | Amount | |
Six-month period ended April 30, 2013: | | | | | | | | |
Shares sold | | | 576,641 | | | $ | 6,398,827 | |
Shares issued to shareholders in reinvestment of dividends and distributions | | | 41,295 | | | | 457,941 | |
Shares redeemed | | | (545,724 | ) | | | (6,048,786 | ) |
| | | | | | | | |
Net increase (decrease) | | | 72,212 | | | $ | 807,982 | |
| | | | | | | | |
Year ended October 31, 2012: | | | | | | | | |
Shares sold | | | 1,603,552 | | | $ | 17,474,383 | |
Shares issued to shareholders in reinvestment of dividends and distributions | | | 83,560 | | | | 901,826 | |
Shares redeemed | | | (670,301 | ) | | | (7,303,552 | ) |
| | | | | | | | |
Net increase (decrease) | | | 1,016,811 | | | $ | 11,072,657 | |
| | | | | | | | |
| | |
| | | | | | | | |
Class I | | Shares | | | Amount | |
Six-month period ended April 30, 2013: | | | | | | | | |
Shares sold | | | 8,520,676 | | | $ | 94,298,900 | |
Shares issued to shareholders in reinvestment of dividends and distributions | | | 1,307,840 | | | | 14,475,845 | |
Shares redeemed | | | (9,898,130 | ) | | | (109,859,850 | ) |
| | | | | | | | |
Net increase (decrease) | | | (69,614 | ) | | $ | (1,085,105 | ) |
| | | | | | | | |
Year ended October 31, 2012: | | | | | | | | |
Shares sold | | | 27,853,453 | | | $ | 301,595,666 | |
Shares issued to shareholders in reinvestment of dividends and distributions | | | 2,991,595 | | | | 32,297,129 | |
Shares redeemed | | | (12,128,789 | ) | | | (131,928,005 | ) |
| | | | | | | | |
Net increase (decrease) | | | 18,716,259 | | | $ | 201,964,790 | |
| | | | | | | | |
| | |
| | | | | | | | |
Class R1 | | Shares | | | Amount | |
Six-month period ended April 30, 2013: | | | | | | | | |
Shares issued to shareholders in reinvestment of dividends and distributions | | | 46 | | | | 509 | |
| | | | | | | | |
Net increase (decrease) | | | 46 | | | $ | 509 | |
| | | | | | | | |
Year ended October 31, 2012: | | | | | | | | |
Shares sold | | | 2,300 | | | $ | 25,000 | |
Shares issued to shareholders in reinvestment of dividends | | | 25 | | | | 279 | |
| | | | | | | | |
Net increase (decrease) | | | 2,325 | | | $ | 25,279 | |
| | | | | | | | |
| | |
| | | | | | | | |
Class R2 | | Shares | | | Amount | |
Six-month period ended April 30, 2013: | | | | | | | | |
Shares issued to shareholders in reinvestment of dividends and distributions | | | 43 | | | | 476 | |
| | | | | | | | |
Net increase (decrease) | | | 43 | | | $ | 476 | |
| | | | | | | | |
Year ended October 31, 2012: | | | | | | | | |
Shares sold | | | 2,301 | | | $ | 25,000 | |
Shares issued to shareholders in reinvestment of dividends | | | 24 | | | | 258 | |
| | | | | | | | |
Net increase (decrease) | | | 2,325 | | | $ | 25,258 | |
| | | | | | | | |
| | | | |
| mainstayinvestments.com | | | 41 | |
Notes to Financial Statements (Unaudited) (continued)
Note 10–Subsequent Events
In connection with the preparation of the financial statements of the Fund as of and for the six-month period ended April 30, 2013, events and transactions subsequent to April 30, 2013, through the date the financial statements were issued have been evaluated by the Fund’s management for possible adjustment and/or disclosure. No subsequent events requiring financial statement adjustment or disclosure have been identified.
| | |
| 42 | | MainStay Intermediate Term Bond Fund |
Board Consideration and Approval of Management Agreement and
Subadvisory Agreement (Unaudited)
Section 15(c) of the Investment Company Act of 1940, as amended (the “1940 Act”) requires that each mutual fund’s board of trustees, including a majority of the independent trustees, annually review and approve the fund’s investment advisory agreements. At its December 10-12, 2012 meeting, the Board of Trustees of the MainStay Group of Funds (“Board”) unanimously approved the Management Agreement with respect to the MainStay Intermediate Term Bond Fund (“Fund”) and New York Life Investment Management LLC (“New York Life Investments”), and the Subadvisory Agreement between New York Life Investments and MacKay Shields LLC (“MacKay Shields”) with respect to the Fund.
In reaching its decision to approve the Agreements, the Board considered information furnished by New York Life Investments and MacKay Shields in connection with a contract review process that took place at various meetings of the Board and its Contracts Committee between September 2012 and December 2012, as well as other relevant information furnished to the Board throughout the year by New York Life Investments and MacKay Shields. Information requested by and furnished to the Board in connection with the contract review process included, among other items, reports on the Fund prepared by Strategic Insight Mutual Fund Research and Consulting, LLC (“Strategic Insight”), an independent third-party service provider engaged by the Board to report objectively on the Fund’s investment performance, management and subadvisory fees and ordinary operating expenses. The Board also considered information provided by New York Life Investments and MacKay Shields on the fees charged to other investment advisory clients (including institutional separate accounts) that follow investment strategies similar to the Fund, and the rationale for any differences in the Fund’s management and subadvisory fees and the fees charged to those other investment advisory clients. In addition, the Board requested and received information on the profitability of the Fund to New York Life Investments and its affiliates, including MacKay Shields as subadvisor to the Fund, and responses from New York Life Investments and MacKay Shields to a series of questions encompassing a variety of topics prepared on behalf of the Board by independent legal counsel to the Board and its independent trustees (the “Independent Trustees”). Information provided to the Board at its meetings throughout the year included, among other items, detailed investment performance reports on the Fund prepared by the Investment Consulting Group at New York Life Investments. The structure and format for this regular reporting was developed in consultation with the Board. The Board also received from New York Life Investments throughout the year, among other items, periodic reports on legal and compliance matters, portfolio turnover, and sales and marketing activity.
In determining to approve the Agreements, the members of the Board reviewed and evaluated all of the information and factors they believed to be relevant and appropriate in light of legal advice furnished to them by independent legal counsel and through the exercise of their own business judgment. The broad factors considered by the Board are discussed in greater detail below, and included, among other items: (i) the nature, scope and quality of the services provided to the Fund by New York Life Investments and MacKay Shields; (ii) the investment performance of the Fund, New York Life Investments and MacKay Shields; (iii) the costs of the services provided, and profits realized, by New York Life Investments and MacKay Shields from their relationship
with the Fund; (iv) the extent to which economies of scale may be realized as the Fund grows, and the extent to which economies of scale may benefit Fund investors; and (v) the reasonableness of the Fund’s management and subadvisory fees and overall total ordinary operating expenses, particularly as compared to similar funds and accounts managed by New York Life Investments and MacKay Shields and third-party “peer funds” identified by Strategic Insight.
While individual members of the Board may have weighed certain factors differently, the Board’s decision to approve the Agreements was based on a consideration of all the information provided to the Board, including information provided to the Board throughout the year and specifically in connection with the contract review process. The Board’s conclusions with respect to the Agreements also were based, in part, on the Board’s consideration of the Agreements in prior years. In addition to considering the above-referenced factors, the Board observed that in the marketplace there are a range of investment options available to shareholders of the Fund, and that the Fund’s shareholders, having had the opportunity to consider other investment options, have chosen to invest in the Fund. A more detailed discussion of the factors that figured prominently in the Board’s decisions to approve the Agreements is provided below.
Nature, Scope and Quality of Services to Be Provided by New York Life Investments and MacKay Shields
The Board examined the nature, scope and quality of the services that New York Life Investments provides to the Fund. The Board evaluated New York Life Investments’ experience in serving as manager of the Fund, noting that New York Life Investments manages other mutual funds, serves a variety of other investment advisory clients, including other pooled investment vehicles, and has experience with overseeing mutual fund service providers, including subadvisors. The Board considered the experience of senior personnel at New York Life Investments providing management and administrative services to the Fund, as well as New York Life Investments’ reputation and financial condition. The Board also considered the full range of non-advisory services that New York Life Investments supplies to the Fund under the terms of the Management Agreement, including: (i) fund accounting services provided by New York Life Investments’ Fund Accounting and Administration Group; (ii) investment oversight and analytical services provided by New York Life Investments’ Investment Consulting Group; (iii) compliance services provided by New York Life Investments’ compliance department, including oversight and implementation of the Fund’s compliance program; and (iv) legal services provided by New York Life Investments’ Office of the General Counsel. Additional information about the non-advisory services provided by New York Life Investments is set forth in the Fund’s Management Agreement. The Board also considered New York Life Investments’ willingness to invest in personnel that benefit the Fund, and noted that New York Life Investments is responsible for compensating the Fund’s officers. The Board also considered benefits to shareholders of being part of the MainStay Group of Funds, including the privilege of exchanging investments between the same class of shares without the imposition of a sales charge, as described more fully in the Fund’s prospectus.
The Board also examined the nature, scope and quality of the advisory services that MacKay Shields provides to the Fund. The Board evaluated
| | | | |
| mainstayinvestments.com | | | 43 | |
Board Consideration and Approval of Management Agreement and
Subadvisory Agreement (Unaudited) (continued)
MacKay Shields’ experience in serving as subadvisor to the Fund and managing other portfolios. It examined MacKay Shields’ track record and experience in providing investment advisory services, the experience of investment advisory, senior management and administrative personnel at MacKay Shields, and MacKay Shields’ overall legal and compliance environment. The Board also reviewed MacKay Shields’ willingness to invest in personnel that benefit the Fund. In this regard, the Board considered the experience of the Fund’s portfolio managers, the number of accounts managed by the portfolio managers and the method for compensating portfolio managers.
Based on these considerations, the Board concluded, within the context of its overall determinations regarding the Agreements, that the Fund should continue to benefit from the nature, scope and quality of these services as a result of New York Life Investments’ and MacKay Shields’ experience, personnel, operations and resources.
Investment Performance
In evaluating the Fund’s investment performance, the Board considered investment performance results in light of the Fund’s investment objective, strategies and risks, as disclosed in the Fund’s prospectus. The Board particularly considered detailed investment reports on the Fund’s performance provided to the Board throughout the year by the Investment Consulting Group of New York Life Investments. These reports include, among other items, information on the Fund’s gross and net returns, the Fund’s investment performance relative to relevant investment categories and Fund benchmarks, the Fund’s risk-adjusted investment performance, and the Fund’s investment performance as compared to similar competitor funds, as appropriate. The Board also considered information provided by Strategic Insight showing the investment performance of the Fund as compared to peer funds.
In considering the Fund’s investment performance, the Board focused principally on the Fund’s long-term performance track record. The Board also gave weight to its ongoing discussions with senior management at New York Life Investments concerning the Fund’s investment performance, as well as discussions between the Fund’s portfolio managers and the Board that occur typically on an annual basis. In addition, the Board considered any specific actions that New York Life Investments or MacKay Shields had taken, or had agreed with the Board to take, to enhance Fund investment performance, and the results of those actions.
Based on these considerations, the Board concluded, within the context of its overall determinations regarding the Agreements, that the long-term investment performance of the Fund, along with ongoing efforts by New York Life Investments and MacKay Shields to enhance investment returns, supported a determination to approve the Agreements. The Fund discloses more information about investment performance in the Portfolio Management Discussion and Analysis, Investment and Performance Comparison and Financial Highlights sections of this Semiannual Report and in the Fund’s prospectus.
Costs of the Services Provided, and Profits Realized, by New York Life Investments and MacKay Shields
The Board considered the costs of the services provided by New York Life Investments and MacKay Shields under the Agreements, and the
profits realized by New York Life Investments and its affiliates, including MacKay Shields, due to their relationships with the Fund. Because MacKay Shields is an affiliate of New York Life Investments whose subadvisory fees are paid directly by New York Life Investments, the Board considered cost and profitability information for New York Life Investments and MacKay Shields in the aggregate.
In evaluating the costs and profits of New York Life Investments and its affiliates, including MacKay Shields, the Board considered, among other factors, each party’s investments in personnel, systems, equipment and other resources necessary to manage the Fund, and that New York Life Investments is responsible for paying the subadvisory fees for the Fund. The Board acknowledged that New York Life Investments and MacKay Shields must be in a position to pay and retain experienced professional personnel to provide services to the Fund, and that the ability to maintain a strong financial position is important in order for New York Life Investments and MacKay Shields to continue to provide high-quality services to the Fund. The Board also noted that the Fund benefits from the allocation of certain fixed costs across the MainStay Group of Funds.
In addition, the Board noted the difficulty in obtaining reliable comparative data about mutual fund managers’ profitability, since such information generally is not publicly available and may be impacted by numerous factors, including the structure of a fund manager’s organization, the types of funds it manages, the methodology used to allocate certain fixed costs to specific funds, and the manager’s capital structure and costs of capital. While recognizing the difficulty in evaluating a manager’s profitability with respect to the Fund, and noting that other profitability methodologies may also be reasonable, the Board concluded that the profitability methodology presented by New York Life Investments to the Board, which was developed by New York Life Investments in consultation with an independent consultant, was reasonable in all material respects.
In considering the costs and profitability of the Fund, the Board also considered certain fall-out benefits that may be realized by New York Life Investments and its affiliates due to their relationships with the Fund.
The Board further considered that, in addition to fees earned by New York Life Investments for managing the Fund, New York Life Investments’ affiliates also earn revenues from serving the Fund in various other capacities, including as the Fund’s transfer agent and distributor. The Board observed that information about these other revenues, and their impact on the profitability of the Fund to New York Life Investments and its affiliates, was furnished to the Board as part of the 15(c) process. The Board noted that, although it assessed the overall profitability of the Fund to New York Life Investments and its affiliates as part of the contract review process, when considering the reasonableness of the fees to be paid to New York Life Investments and its affiliates under the Agreements, the Board considered the profitability of New York Life Investments’ relationship with the Fund on a pre-tax basis, and without regard to distribution expenses.
After evaluating the information presented to the Board, the Board concluded, within the context of its overall determinations regarding the Agreements, that any profits realized by New York Life Investments and its affiliates, including MacKay Shields, due to their relationships with the Fund supported the Board’s decision to approve the Agreements.
| | |
| 44 | | MainStay Intermediate Term Bond Fund |
Extent to Which Economies of Scale May Be Realized as the Fund Grows
The Board also considered whether the Fund’s expense structure permitted economies of scale to be shared with Fund investors. The Board reviewed information from New York Life Investments showing how the Fund’s management fee schedule compared to fee schedules of other funds and accounts managed by New York Life Investments. The Board also reviewed information from Strategic Insight showing how the Fund’s management fee schedule hypothetically would compare with fees paid for similar services by peer funds at varying asset levels. While recognizing the difficulty of determining economies of scale with precision, the Board acknowledged that economies of scale may be shared with the Fund in a number of ways, including, for example, through the imposition of management fee breakpoints and by initially setting relatively lower management fees.
Based on this information, the Board concluded, within the context of its overall determinations regarding the Agreements, that the Fund’s expense structure appropriately reflects economies of scale for the benefit of Fund investors. The Board noted, however, that it would continue to evaluate the reasonableness of the Fund’s expense structure as the Fund grows over time.
Management and Subadvisory Fees and Total Ordinary Operating Expenses
The Board evaluated the reasonableness of the fees to be paid under the Agreements and the Fund’s expected total ordinary operating expenses. The Board primarily considered the reasonableness of the management fee paid by the Fund to New York Life Investments, since the fees paid to MacKay Shields are paid by New York Life Investments, not the Fund.
In assessing the reasonableness of the Fund’s fees and expenses, the Board primarily considered comparative data provided by Strategic Insight on the fees and expenses charged by similar mutual funds managed by other investment advisers. In addition, the Board considered information provided by New York Life Investments and MacKay Shields on fees charged to other investment advisory clients, including institutional separate accounts and other funds with similar investment objectives as the Fund. The Board particularly considered differences in the contractual management fee schedules of the retail MainStay Funds and similarly-managed MainStay VP Portfolios, taking into account New York Life Investments’ rationale for any differences in fee schedules. The Board also took into account explanations provided by New York Life Investments about the different scope of services provided to mutual funds as compared with other investment advisory clients. Additionally, the Board considered the impact of any expense limitation arrangements on the Fund’s net management fee and expenses.
The Board noted that, outside of the Fund’s management fee and the fees charged under a share class’s Rule 12b-1 and/or shareholder services plans, a share class’s most significant “other expenses” are transfer agent fees. Transfer agent fees are charged to the Fund based on the number of shareholder accounts (a “per-account” fee) as compared with certain other fees (e.g., management fees), which are charged based on the Fund’s average net assets. The Board took into account information from New York Life Investments showing that the
Fund’s transfer agent fee schedule is reasonable, including industry data showing that the per-account fees that NYLIM Service Company LLC, the Fund’s transfer agent, charges the Fund are within the range of per-account fees charged by transfer agents to other mutual funds. In addition, the Board considered NYLIM Service Company LLC’s profitability in connection with the transfer agent services it provides to the Fund.
The Board acknowledged that, because the Fund’s transfer agent fees are billed on a per-account basis, the impact of transfer agent fees on a share class’s expense ratio may be more significant in cases where the share class has a high number of accounts with limited assets (i.e., small accounts). The Board observed that transfer agent fees are a significant portion of total expenses of many Funds in the MainStay Group of Funds. The impact of transfer agent fees on the expense ratios of these MainStay Funds tend to be greater than for other open-end retail funds, because the MainStay Group of Funds generally has a significant number of small accounts relative to competitor funds. The Board acknowledged the role that the MainStay Group of Funds historically has played in serving the investment needs of New York Life Insurance Company (“New York Life”) policyholders, who often maintain smaller account balances than other fund investors. The Board discussed measures that it and New York Life Investments have taken in recent years to mitigate the effect of small accounts on the expense ratios of Fund share classes, including: (i) encouraging New York Life agents to consolidate multiple small accounts held by the same investor into one MainStay Asset Allocation Fund account; (ii) increasing investment minimums from $500 to $1,000 in 2003; (iii) introducing Investor Class shares for certain MainStay Funds in early 2008 to consolidate smaller account investors; (iv) closing small accounts with balances below $250 in Investor Class shares or $750 in all other classes of shares; (v) no longer allowing an exception with no minimum investment amount with respect to AutoInvest accounts with subsequent monthly purchases of $100; (vi) since 2007, charging an annual $20.00 small account fee on certain accounts with balances below $1,000; and (vii) modifying the approach for billing transfer agent expenses to reduce the degree of subsidization by large accounts of smaller accounts. In addition, the Board acknowledged New York Life Investments’ efforts to encourage intermediaries to consolidate small accounts in multiple Funds held by the same investor into a single Asset Allocation Fund account, if appropriate under the circumstances, in an effort to mitigate the effect of small accounts on the Funds in the MainStay Group of Funds.
After considering all of the factors outlined above, the Board concluded that the Fund’s management and subadvisory fees and total ordinary operating expenses were within a range that is competitive and, within the context of the Board’s overall conclusions regarding the Agreements, support a conclusion that these fees and expenses are reasonable.
Conclusion
On the basis of the information provided to it and its evaluation thereof, the Board, including the Independent Trustees, unanimously voted to approve the Agreements.
| | | | |
| mainstayinvestments.com | | | 45 | |
Proxy Voting Policies and Procedures
and Proxy Voting Record
A description of the policies and procedures that New York Life Investments uses to vote proxies related to the Fund’s securities is available without charge, upon request, (i) by visiting the Fund’s website at mainstayinvestments.com; and (ii) on the Securities and Exchange Commission’s (“SEC”) website at www.sec.gov.
The Fund is required to file with the SEC its proxy voting record for the 12-month period ending June 30 on Form N-PX. The Fund’s most recent Form N-PX is available free of charge upon request by calling 800-MAINSTAY (624-6782); visiting the Fund’s website at mainstayinvestments.com; or on the SEC’s website at www.sec.gov.
Shareholder Reports and Quarterly
Portfolio Disclosure
The Fund is required to file its complete schedule of portfolio holdings with the SEC for its first and third fiscal quarters on Form N-Q. The Fund’s Form N-Q is available without charge, on the SEC’s website at www.sec.gov or by calling MainStay Investments at 800-MAINSTAY (624-6782). You also can obtain and review copies of Form N-Q by visiting the SEC’s Public Reference Room in Washington, DC (information on the operation of the Public Reference Room may be obtained by calling 1-800-SEC-0330).
| | |
| 46 | | MainStay Intermediate Term Bond Fund |
MainStay Funds
MainStay offers a wide range of Funds for virtually any investment need. The full array of MainStay open-end offerings is listed here, with information about the manager, subadvisors, legal counsel and independent registered public accounting firms.
Equity
U.S. Equity Funds
MainStay Common Stock Fund
MainStay Cornerstone Growth Fund
MainStay Epoch U.S. All Cap Fund
MainStay Epoch U.S. Equity Yield Fund
MainStay ICAP Equity Fund
MainStay ICAP Select Equity Fund
MainStay Large Cap Growth Fund1
MainStay MAP Fund
MainStay S&P 500 Index Fund
MainStay U.S. Equity Opportunities Fund
MainStay U.S. Small Cap Fund
International/Global Equity Funds
MainStay Epoch Global Choice Fund
MainStay Epoch Global Equity Yield Fund
MainStay Epoch International Small Cap Fund
MainStay ICAP Global Fund
MainStay ICAP International Fund
MainStay International Equity Fund
MainStay International Opportunities Fund
Income
Taxable Bond Funds
MainStay Floating Rate Fund
MainStay Global High Income Fund
MainStay Government Fund
MainStay High Yield Corporate Bond Fund
MainStay High Yield Opportunities Fund
MainStay Indexed Bond Fund
MainStay Intermediate Term Bond Fund
MainStay Short Duration High Yield Fund
MainStay Short Term Bond Fund
MainStay Unconstrained Bond Fund
Municipal Bond Funds
MainStay California Tax Free Opportunities Fund2
MainStay High Yield Municipal Bond Fund
MainStay New York Tax Free Opportunities Fund3
MainStay Tax Free Bond Fund
Money Market Fund
MainStay Money Market Fund
Mixed Asset
MainStay Balanced Fund
MainStay Convertible Fund
MainStay Income Builder Fund
MainStay Marketfield Fund
Asset Allocation/Target Date
MainStay Conservative Allocation Fund
MainStay Growth Allocation Fund
MainStay Moderate Allocation Fund
MainStay Moderate Growth Allocation Fund
MainStay Retirement 2010 Fund
MainStay Retirement 2020 Fund
MainStay Retirement 2030 Fund
MainStay Retirement 2040 Fund
MainStay Retirement 2050 Fund
Manager
New York Life Investment Management LLC
New York, New York
Subadvisors
Cornerstone Capital Management Holdings LLC4
New York, New York
Cornerstone Capital Management LLC4
Bloomington, Minnesota
Epoch Investment Partners, Inc.
New York, New York
Institutional Capital LLC4
Chicago, Illinois
MacKay Shields LLC4
New York, New York
Marketfield Asset Management LLC
New York, New York
Markston International LLC
White Plains, New York
Winslow Capital Management LLC
Minneapolis, Minnesota
Legal Counsel
Dechert LLP
Independent Registered Public Accounting Firms
KPMG LLP
PricewaterhouseCoopers LLP
1. Effective January 13, 2012, the Fund was closed to new investors with certain exceptions.
2. This Fund is only registered for sale in AZ, CA, NV, OR, UT, and WA.
3. This Fund is only registered for sale in CT, DE, FL, MA, NJ, NY, and VT.
4. An affiliate of New York Life Investment Management LLC.
Not part of the Semiannual Report
For more information
800-MAINSTAY (624-6782)
mainstayinvestments.com
The MainStay Funds® are managed by New York Life Investment Management LLC and distributed through NYLIFE Distributors LLC, 169 Lackawanna Avenue, Parsippany, NJ 07054, a wholly owned subsidiary of New York Life Insurance Company. NYLIFE Distributors LLC is a Member FINRA/SIPC.
MainStay Investments® is a registered service mark and name under which New York Life Investment Management LLC does business. MainStay Investments, an indirect subsidiary of New York Life Insurance Company, New York, NY 10010, provides investment advisory products and services.
This report may be distributed only when preceded or accompanied by a current Fund prospectus.
©2013 NYLIFE Distributors LLC. All rights reserved.
| | | | | | | | |
| Not FDIC/NCUA Insured | | Not a Deposit | | May Lose Value | | No Bank Guarantee | | Not Insured by Any Government Agency |
| | |
| NYLIM-30291 MS175-13 | | MSIT10-06/13 NL0B4 |
MainStay Short Term Bond Fund
Message from the President and Semiannual Report
Unaudited | April 30, 2013


This page intentionally left blank
Message from the President
The U.S. stock market advanced during the six months ended April 30, 2013, generally providing double-digit returns at all capitalization levels. Value stocks tended to outpace growth stocks among large- and mid-capitalization companies, while growth stocks tended to outpace value stocks among smaller companies.
The market’s advance, however, was far from uniform. Stocks declined in early November, both before and immediately after the U.S. presidential election. Following a sharp recovery, stocks climbed until mid-December, when a Congressional stalemate on the fiscal cliff led to a brief decline. Another dip occurred in late February as investors speculated that the Federal Open Market Committee (FOMC) might stop purchasing mortgage-backed securities sooner than expected. Stocks also dipped in mid-April, as consumer sentiment dropped after the Boston marathon bombing. Despite these setbacks, U.S. stocks continued to trend upward during the six-month reporting period.
International stock markets also advanced, with several regional differences. Accommodative action by the Bank of Japan helped lower the yen and lift Japanese stocks to their highest levels since 2008. In Europe, stocks did well until early February, bolstered by the promise of support for the euro. As the year progressed, however, economic contraction, rising unemployment and systematic banking concerns took a toll on investor enthusiasm. In China, manufacturing slowed as the nation sought to balance growth and inflation risks. On the Korean peninsula, tensions rose as North Korea continued to threaten its neighbors, which added an undercurrent of caution to the market.
During the six months ended April 30, 2013, the FOMC kept the federal funds rate in a range close to zero. The FOMC also continued its direct purchases of mortgage-backed securities and longer-term U.S. government securities. With short-term interest rates likely to remain at low levels, many bond investors pursued higher yields by lengthening maturities and assuming greater risk. As a result, bonds with higher risk profiles tended
to outperform higher-quality investment-grade bonds and U.S. Treasury securities. Cash and cash equivalents essentially returned zero.
With wide variations in the performance of various asset classes, some investors might be tempted to chase higher returns by shifting back and forth between stocks and bonds. Since no one can predict where the market will move next, however, we encourage investors to select an appropriate mix of investments for their risk tolerance and time horizon and to stick with that mix, making only minor adjustments over time.
At MainStay Funds, our portfolio managers use a similar approach. Careful security selection and thoughtful sell disciplines help them pursue the investment objectives of their respective Funds. Using the principal investment strategies outlined in the Prospectus, they focus primarily on providing long-term investment potential for our shareholders.
Has this approach proved successful? In its most recent rankings, Barron’s listed MainStay Funds as the #1 fund family over the past 10 years. We were also the only mutual fund family that has appeared in Barron’s top six for the past five consecutive years.
The pages that follow provide additional insight into the specific market events, investment decisions and securities that shaped your MainStay Fund(s) during the six months ended April 30, 2013. We encourage you to read the semiannual report(s) carefully and to evaluate your results with your long-term financial goals in mind.
Sincerely,

Stephen P. Fisher
President
The opinions expressed are as of the date of this report and are subject to change. There is no guarantee that any forecast made will come to pass. This material does not constitute investment advice and is not intended as an endorsement of any specific investment.
To qualify for the Lipper/Barron’s Fund Survey, a fund family must have at least three funds in Lipper’s general U.S.-stock category, one in world equity (which combines global and international funds), one mixed-equity fund (which holds stocks and bonds), two taxable-bond funds, and one tax-exempt fund. Fund loads and 12b-1 fees aren’t included in the calculation of returns because the aim is to measure the manager’s skill. Each fund’s return is measured against all funds in its Lipper category, resulting in a percentile ranking which is then weighted by asset size relative to the fund family’s other assets in its general classifications. Finally, the score is multiplied by the general classification weightings as determined by the entire Lipper universe of funds.
Source: Barron’s, 2/9/13. Overall, MainStay Funds ranked number 56 for the one-year period, 20 for the five-year period and one for the 10-year period ended December 31, 2012, out of 62, 53 and 46 fund families, respectively. MainStay ranked number three for the 10-year period in 2009, 2010 and 2011 from among 48, 46 and 45 fund families, respectively. MainStay ranked number six from among 48 fund families for the 10-year period in 2008. Past performance is no guarantee of future results, which will vary. For the most recent MainStay Funds performance, please visit our website at mainstayinvestments.com. All mutual funds are subject to market risk and will fluctuate in value.
Not part of the Semiannual Report
Table of Contents
Investors should refer to the Fund’s Summary Prospectus and/or Prospectus and consider the Fund’s investment objectives, strategies, risks, charges and expenses carefully before investing. The Summary Prospectus and/or Prospectus contain this and other information about the Fund. You may obtain copies of the Fund’s Summary Prospectus, Prospectus and Statement of Additional Information free of charge, upon request, by calling toll-free 800-MAINSTAY (624-6782), by writing to NYLIFE Distributors LLC, Attn: MainStay Marketing Department, 169 Lackawanna Avenue, Parsippany, New Jersey 07054 or by sending an e-mail to MainStayShareholderServices@nylim.com. These documents are also available via the MainStay Funds’ website at mainstayinvestments.com/documents. Please read the Summary Prospectus and/or Prospectus carefully before investing.
Investment and Performance Comparison1 (Unaudited)
Performance data quoted represents past performance. Past performance is no guarantee of future results. Because of market volatility, current performance may be lower or higher than the figures shown. Investment return and principal value will fluctuate, and as a result, when shares are redeemed, they may be worth more or less than their original cost. The graph below depicts the historical performance of Class I shares of the Fund. Performance will vary from class to class based on differences in class-specific expenses and sales charges. For performance information current to the most recent month-end, please call 800-MAINSTAY (624-6782) or visit mainstayinvestments.com.
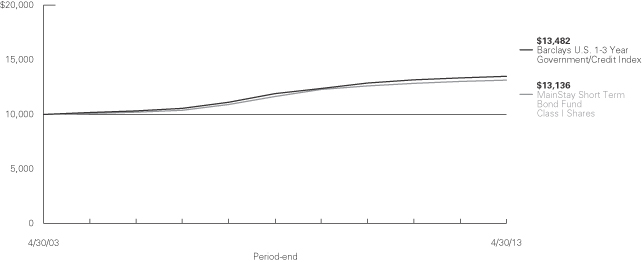
Average Annual Total Returns for the Period Ended April 30, 2013
| | | | | | | | | | | | | | | | | | | | | | | | |
| Class | | Sales Charge | | | | Six Months | | | One Year | | | Five Years | | | Ten Years | | | Gross
Expense
Ratio2 | |
| Investor Class Shares3 | | Maximum 3% Initial Sales Charge | | With sales charges Excluding sales charges | |
| –3.02
–0.02 | %
| |
| –2.56
0.45 | %
| |
| 1.26
1.88 | %
| |
| 1.98
2.29 | %
| |
| 1.44
1.44 | %
|
| Class A Shares4 | | Maximum 3% Initial Sales Charge | | With sales charges Excluding sales charges | |
| –2.87
0.14 |
| |
| –2.25
0.77 |
| |
| 1.59
2.21 |
| |
| 2.14
2.45 |
| |
| 1.10
1.10 |
|
| Class I Shares | | No Sales Charge | | | | | 0.26 | | | | 1.02 | | | | 2.48 | | | | 2.77 | | | | 0.85 | |
| 1. | The performance table and graph do not reflect the deduction of taxes that a shareholder would pay on dividends, distributions or Fund share redemptions. Total returns reflect maximum applicable sales charges as indicated in the table above, changes in share price, and reinvestment of dividend and capital gain distributions. The graph assumes the initial investment amount shown above and reflect the deduction of all sales charges that would have applied for the periods of investment. Performance figures reflect certain fee waivers and/or expense limitations, without which total returns may have been lower. For more information on share classes and current fee waivers and/or expense limitations, please refer to the notes to the financial statements. |
| 2. | The gross expense ratios presented reflect the Fund’s “Total Annual Fund Operating Expenses” from the most recent Prospectus and may differ from other expense ratios disclosed in this report. |
| 3. | Performance figures for Investor Class shares, first offered on February 28, 2008, include the historical performance of Class A shares through February 27, 2008, adjusted for differences in certain expenses and fees. Unadjusted, the performance shown for Investor Class shares would likely have been different. |
| 4. | Performance figures for Class A shares, first offered on January 2, 2004, include the historical performance of Class I shares through January 1, 2004, adjusted for differences in certain expenses and fees. Unadjusted, the performance shown for Class A shares would likely have been different. |
The footnotes on the next page are an integral part of the table and graph and should be carefully read in conjunction with them.
| | | | |
| mainstayinvestments.com | | | 5 | |
| | | | | | | | | | | | | | | | |
| Benchmark Performance | | Six
Months | | | One
Year | | | Five
Years | | | Ten
Years | |
Barclays U.S. 1-3 Year Government/Credit Index5 | �� | | 0.48 | % | | | 1.04 | % | | | 2.52 | % | | | 3.03 | % |
Average Lipper Short U.S. Government Fund6 | | | 0.03 | | | | 0.49 | | | | 2.07 | | | | 2.42 | |
| 5. | The Barclays U.S. 1-3 Year Government/Credit Index includes investment grade corporate debt issues as well as debt issues of U.S. government agencies and the U.S. Treasury, with maturities of one to three years. The Barclays U.S. 1-3 Year Government/Credit Index is the Fund’s broad-based securities-market index for comparison purposes. Total returns assume reinvestment of all dividends and capital gains. An investment cannot be made directly in an index. |
| 6. | The average Lipper short U.S. government fund is representative of funds that invest primarily in securities issued or guaranteed by the U.S. government, its agencies, or its instrumentalities, with dollar-weighted average maturities of less than three years. This benchmark is a product of Lipper Inc. Lipper Inc. is an independent monitor of fund performance. Results are based on average total returns of similar funds with all dividend and capital gain distributions reinvested. |
The footnotes on the preceding page are an integral part of the table and graph and should be carefully read in conjunction with them.
| | |
| 6 | | MainStay Short Term Bond Fund |
Cost in Dollars of a $1,000 Investment in MainStay Short Term Bond Fund (Unaudited)
The example below is intended to describe the fees and expenses borne by shareholders during the six-month period from November 1, 2012, to April 30, 2013, and the impact of those costs on your investment.
Example
As a shareholder of the Fund, you incur two types of costs: (1) transaction costs, including exchange fees and sales charges (loads) on purchases (as applicable), and (2) ongoing costs, including management fees, distribution and/or service (12b-1) fees, and other Fund expenses (as applicable). This example is intended to help you understand your ongoing costs (in dollars) of investing in the Fund and to compare these costs with the ongoing costs of investing in other mutual funds. The example is based on an investment of $1,000 made at the beginning of the six-month period and held for the entire period from November 1, 2012, to April 30, 2013.
This example illustrates your Fund’s ongoing costs in two ways:
Actual Expenses
The second and third data columns in the table below provide information about actual account values and actual expenses. You may use the information in these columns, together with the amount you invested, to estimate the expenses that you paid during the six months ended April 30, 2013. Simply divide your account value by $1,000 (for example, an $8,600 account value divided by $1,000 = 8.6), then
multiply the result by the number under the heading entitled “Expenses Paid During Period” to estimate the expenses you paid on your account during this period.
Hypothetical Example for Comparison Purposes
The fourth and fifth data columns in the table below provide information about hypothetical account values and hypothetical expenses based on the Fund’s actual expense ratio and an assumed rate of return of 5% per year before expenses, which is not the Fund’s actual return. The hypothetical account values and expenses may not be used to estimate the actual ending account balances or expenses you paid for the six-month period shown. You may use this information to compare the ongoing costs of investing in the Fund with the ongoing costs of investing in other Funds. To do so, compare this 5% hypothetical example with the 5% hypothetical examples that appear in the shareholder reports of the other Funds.
Please note that the expenses shown in the table are meant to highlight your ongoing costs only and do not reflect any transactional costs, such as exchange fees or sales charges (loads). Therefore, the fourth and fifth data columns of the table are useful in comparing ongoing costs only and will not help you determine the relative total costs of owning different funds. In addition, if these transactional costs were included, your costs would have been higher.
| | | | | | | | | | | | | | | | | | | | |
| | | | | | | | | | | | | | | | |
| Share Class | | Beginning
Account
Value
11/1/12 | | | Ending Account
Value (Based
on Actual
Returns and
Expenses)
4/30/13 | | | Expenses
Paid
During
Period1 | | | Ending Account
Value (Based
on Hypothetical
5% Annualized
Return and
Actual Expenses)
4/30/13 | | | Expenses
Paid
During
Period1 | |
| | | | | |
| Investor Class Shares | | $ | 1,000.00 | | | $ | 999.80 | | | $ | 6.10 | | | $ | 1,018.70 | | | $ | 6.16 | |
| | | | | |
| Class A Shares | | $ | 1,000.00 | | | $ | 1,001.40 | | | $ | 4.52 | | | $ | 1,020.30 | | | $ | 4.56 | |
| | | | | |
| Class I Shares | | $ | 1,000.00 | | | $ | 1,002.60 | | | $ | 3.28 | | | $ | 1,021.50 | | | $ | 3.31 | |
| 1. | Expenses are equal to the Fund’s annualized expense ratio of each class (1.23% for Investor Class, 0.91% for Class A and 0.66% for Class I) multiplied by the average account value over the period, divided by 365 and multiplied by 181 (to reflect the six-month period). The table above represents the actual expenses incurred during the six-month period. |
| | | | |
| mainstayinvestments.com | | | 7 | |
Portfolio Composition as of April 30, 2013 (Unaudited)
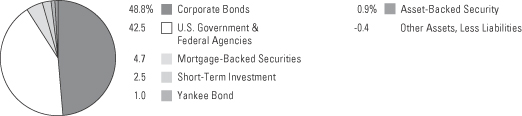
See Portfolio of Investments beginning on page 11 for specific holdings within these categories.
Top Ten Issuers Held as of April 30, 2013 (excluding short-term investment)
| 1. | United States Treasury Notes, 0.25%–2.25%, due 7/15/13–6/15/15 |
| 2. | Federal National Mortgage Association, 0.50%–0.75%, due 11/28/14–11/6/15 |
| 3. | St. Jude Medical, Inc., 2.20%, due 9/15/13 |
| 4. | JPMorgan Chase & Co., 3.45%, due 3/1/16 |
| 5. | Total Capital S.A., 3.125%, due 10/2/15 |
| 6. | PNC Funding Corp., 3.625%, due 2/8/15 |
| 7. | Hartford Financial Services Group, Inc., 4.75%, due 3/1/14 |
| 8. | Hutchison Whampoa International, Ltd., 4.625%, due 9/11/15 |
| 9. | General Electric Capital Corp., 3.75%, due 11/14/14 |
| 10. | DaimlerChrysler North America LLC, 6.50%, due 11/15/13 |
| | |
| 8 | | MainStay Short Term Bond Fund |
Portfolio Management Discussion and Analysis
Questions answered by portfolio managers Dan Roberts, PhD, Louis N. Cohen and Claude Athaide, PhD, CFA, of MacKay Shields LLC, the Fund’s Subadvisor.
How did MainStay Short Term Bond Fund perform relative to its peers and its benchmark during the six months ended April 30, 2013?
Excluding all sales charges, MainStay Short Term Bond Fund returned –0.02% for Investor Class shares and 0.14% for Class A shares for the six months ended April 30, 2013. Over the same period, Class I shares returned 0.26%. Class A and Class I shares outperformed—and Investor Class shares underperformed—the 0.03% return of the average Lipper1 short U.S. government fund. All share classes underperformed the 0.48% return of the Barclays U.S. 1–3 Year Government/Credit Index2 for the six months ended April 30, 2013. The Barclays U.S. 1–3 Year Government/Credit Index is the Fund’s broad-based securities-market index. See page 5 for Fund returns with applicable sales charges.
What factors affected the Fund’s relative performance during the reporting period?
Positions in U.S. Treasury securities and agency securities detracted from the Fund’s performance relative to the average peer fund and the Barclays U.S. 1–3 Year Government/Credit Index. An overweight position in corporate bonds, however, was an important driver of the Fund’s relative results. Corporate bond spreads3 compressed as investors continued to hunt for yield during a reporting period when the Federal Reserve’s policies remained highly accommodative. The Fund was overweight relative to the Index in lower-quality investment-grade corporate bonds, which outperformed their higher-quality counterparts. Within the Fund’s overweight position in corporate bonds, U.S. banks were a key area of focus. The upward trend in balance-sheet improvement led us to an overweight position in select domestic money-center banks. Asset quality continues to improve, while the number of problem assets declines. In addition, U.S. bank reserves strengthened as the level of capital peaked.
How did the Fund’s duration4 positioning affect the Fund’s performance during the reporting period?
At the end of the reporting period, the Fund had a slightly shorter duration than the Barclays U.S. 1–3 Year Government/Credit Index. This positioning did not have a significant impact on performance.
What specific factors, risks or market forces prompted decisions for the Fund during the reporting period?
We slightly increased the Fund’s exposure to corporate bonds during the reporting period while reducing the Fund’s weightings in government and agency securities. We increased the Fund’s exposure to corporate bonds because we expected investment-grade corporate bonds to generate higher returns than government-related debt. Our reasoning involved three factors. First, we believed that the prospects for credit-related sectors were aligned with the decision of the Federal Open Market Committee (FOMC) to maintain the federal funds rate in a near-zero range. Second, the low interest-rate environment sparked healthy demand for higher-spread product. Third, improving profitability signaled that corporations were doing more with less: less leverage, less short-term debt and smaller funding gaps.
During the reporting period, which market segments were particularly strong and which ones were weak?
The Fund held underweight positions relative to the Barclays U.S. 1–3 Year Government/Credit Index in U.S. Treasury securities and agency securities, which helped relative performance. The Fund’s overweight position in corporate bonds had a positive impact on performance during the reporting period. Corporate-bond spreads compressed as investors reached for yield. The spread represents the premium (or compensation) for credit risk and liquidity risk. Lower-quality investment-grade bonds (those rated BBB and A),5 among which the Fund was overweight relative to the benchmark, outperformed higher-quality bonds. From a sector perspective our positions in financial bonds continued to perform well for the Fund.
The Fund benefited from its higher-beta6 bias, which remained intact during the reporting period. Our primary emphasis in the corporate-bond market is on senior and junior subordinated debt of large domestic banks, as well as select health and life insurers and real estate investment trusts (“REITs”). The capital-base strength of large U.S. banks (Tier 1) is an important factor for a creditor.
| 1. | See footnote on page 6 for more information on Lipper Inc. |
| 2. | See footnote on page 6 for more information on the Barclays U.S. 1–3 Year Government/Credit Index. |
| 3. | The terms “spread” and “yield spread” may refer to the difference in yield between a security or type of security and comparable U.S. Treasury issues. The terms may also refer to the difference in yield between two specific securities or types of securities at a given time. |
| 4. | Duration is a measure of the price sensitivity of a fixed-income investment to changes in interest rates. Duration is expressed as a number of years and is considered a more accurate sensitivity gauge than average maturity. |
| 5. | An obligation rated ‘BBB’ by S&P is deemed by S&P to exhibit adequate protection parameters. It is the opinion of S&P, however, that adverse economic conditions or changing circumstances are more likely to lead to a weakened capacity of the obligor to meet its financial commitment on the obligation. When applied to Fund holdings, ratings are based solely on the creditworthiness of the bonds in the portfolio and are not meant to represent the security or safety of the Fund. |
| 6. | Beta is a measure of volatility in relation to the market as a whole. A beta higher than 1 indicates that a security or portfolio will tend to exhibit higher volatility than the market. A beta lower than 1 indicates that a security or portfolio will tend to exhibit lower volatility than the market. |
| | | | |
| mainstayinvestments.com | | | 9 | |
Did the Fund make any significant purchases or sales during the reporting period?
The Fund remains invested in natural gas pipeline distributors and operators, seeking to benefit from their resilient cash-flow streams. This positioning is consistent with our longer-term approach to investing and our view that it is still too early to reduce the Fund’s beta in this market. During the reporting period, we added ConcoPhilips to the Fund.
We also favored positive free-cash-flow-generating consumer cyclical sectors (restaurants, lodging, retailers and homebuilders) and non-cyclical sectors (food & beverage, health care) that have benefited from improving trends in consumer spending and consumer confidence. We also added Pfizer to the Fund during the reporting period.
We sold the Fund’s position in U.S. Bank because we believed that the potential for further spread tightening relative to U.S. Treasury securities was limited. We sold Vodafone and Verizon because we were concerned that a potential deal involving
Verizon Wireless, a jointly owned subsidiary, might cause spreads to widen.
How did the Fund’s weightings change during the reporting period?
The overall risk composition of the Fund remained intact, consistent with our longer-term approach to investing. The Fund remained overweight in investment-grade corporate bonds relative to the Barclays U.S. 1–3 Year Government/Credit Index.
How was the Fund positioned at the end of the reporting period?
As of April 30, 2103, the Fund held overweight positions relative to the Barclays U.S. 1–3 Year Government/Credit Index in investment-grade corporate bonds and commercial mortgage-backed securities. Offsetting these overweight sector positions were underweight positions relative to the Index in U.S. Treasury securities and agency debentures.
The opinions expressed are those of the portfolio managers as of the date of this report and are subject to change. There is no guarantee that any forecast made will come to pass. This material does not constitute investment advice and is not intended as an endorsement of any specific investment.
| | |
| 10 | | MainStay Short Term Bond Fund |
Portfolio of Investments April 30, 2013 (Unaudited)
| | | | | | | | |
| | | Principal
Amount | | | Value | |
| | | | | | | | |
Long-Term Bonds 97.9%† Asset-Backed Security 0.9% | |
Automobile 0.9% | |
Hertz Vehicle Financing LLC | | | | | | | | |
Series 2009-2A, Class A2
5.29%, due 3/25/16 (a) | | $ | 700,000 | | | $ | 754,138 | |
| | | | | | | | |
Total Asset-Backed Security
(Cost $747,718) | | | | | | | 754,138 | |
| | | | | | | | |
| | |
| Corporate Bonds 48.8% | | | | | | | | |
Aerospace & Defense 0.3% | | | | | | | | |
United Technologies Corp.
1.20%, due 6/1/15 | | | 275,000 | | | | 279,197 | |
| | | | | | | | |
| | |
Agriculture 1.9% | | | | | | | | |
Philip Morris International, Inc.
6.875%, due 3/17/14 | | | 1,070,000 | | | | 1,131,125 | |
Reynolds American, Inc.
1.05%, due 10/30/15 | | | 420,000 | | | | 420,505 | |
| | | | | | | | |
| | | | | | | 1,551,630 | |
| | | | | | | | |
Auto Manufacturers 1.4% | | | | | | | | |
¨DaimlerChrysler North America LLC
6.50%, due 11/15/13 | | | 1,117,000 | | | | 1,152,888 | |
| | | | | | | | |
| | |
Banks 13.3% | | | | | | | | |
Bank of America Corp. | | | | | | | | |
2.00%, due 1/11/18 | | | 305,000 | | | | 305,977 | |
6.50%, due 8/1/16 | | | 645,000 | | | | 743,950 | |
Barclays Bank PLC
5.00%, due 9/22/16 | | | 640,000 | | | | 721,410 | |
BB&T Corp.
1.60%, due 8/15/17 | | | 915,000 | | | | 927,376 | |
Capital One Financial Corp.
6.75%, due 9/15/17 | | | 440,000 | | | | 533,368 | |
Citigroup, Inc.
2.65%, due 3/2/15 | | | 835,000 | | | | 859,754 | |
Discover Bank / Greenwood DE
2.00%, due 2/21/18 | | | 340,000 | | | | 343,454 | |
Goldman Sachs Group, Inc. (The)
3.625%, due 2/7/16 | | | 975,000 | | | | 1,038,243 | |
¨JPMorgan Chase & Co.
3.45%, due 3/1/16 | | | 1,235,000 | | | | 1,317,786 | |
KeyCorp
6.50%, due 5/14/13 | | | 625,000 | | | | 626,210 | |
Morgan Stanley
4.00%, due 7/24/15 | | | 895,000 | | | | 944,554 | |
¨PNC Funding Corp.
3.625%, due 2/8/15 | | | 1,240,000 | | | | 1,303,889 | |
| | | | | | | | |
| | | Principal
Amount | | | Value | |
| | | | | | | | |
Banks (continued) | | | | | | | | |
Royal Bank of Scotland Group PLC
2.55%, due 9/18/15 | | $ | 565,000 | | | $ | 581,983 | |
Wells Fargo & Co.
5.00%, due 11/15/14 | | | 780,000 | | | | 828,082 | |
| | | | | | | | |
| | | | | | | 11,076,036 | |
| | | | | | | | |
Beverages 2.8% | | | | | | | | |
Coca-Cola Co. (The)
0.75%, due 3/13/15 | | | 785,000 | | | | 790,659 | |
PepsiCo., Inc. | | | | | | | | |
0.75%, due 3/5/15 | | | 560,000 | | | | 562,446 | |
0.80%, due 8/25/14 | | | 375,000 | | | | 376,905 | |
SABMiller Holdings, Inc.
1.85%, due 1/15/15 (a) | | | 585,000 | | | | 596,237 | |
| | | | | | | | |
| | | | | | | 2,326,247 | |
| | | | | | | | |
Computers & Peripherals 1.0% | | | | | | | | |
Apple, Inc.
1.00%, due 5/3/18 | | | 875,000 | | | | 871,771 | |
| | | | | | | | |
| | |
Diversified Financial Services 1.5% | | | | | | | | |
¨General Electric Capital Corp.
3.75%, due 11/14/14 | | | 1,220,000 | | | | 1,278,825 | |
| | | | | | | | |
| | |
Electric 1.3% | | | | | | | | |
Great Plains Energy, Inc.
2.75%, due 8/15/13 | | | 1,085,000 | | | | 1,091,233 | |
| | | | | | | | |
| | |
Finance—Commercial 1.0% | | | | | | | | |
Caterpillar Financial Services Corp. 1.25%, due 11/6/17 | | | 790,000 | | | | 795,964 | |
| | | | | | | | |
| | |
Finance—Other Services 1.3% | | | | | | | | |
Private Export Funding Corp.
1.375%, due 2/15/17 | | | 1,020,000 | | | | 1,049,975 | |
| | | | | | | | |
| | |
Food 0.7% | | | | | | | | |
Kellogg Co.
1.125%, due 5/15/15 | | | 305,000 | | | | 307,977 | |
Kraft Foods Group, Inc.
1.625%, due 6/4/15 | | | 290,000 | | | | 294,933 | |
| | | | | | | | |
| | | | | | | 602,910 | |
| | | | | | | | |
Health Care—Products 1.6% | | | | | | | | |
¨St. Jude Medical, Inc.
2.20%, due 9/15/13 | | | 1,310,000 | | | | 1,318,574 | |
| | | | | | | | |
|
Health Care—Services 0.7% | |
UnitedHealth Group, Inc.
0.85%, due 10/15/15 | | | 535,000 | | | | 538,757 | |
| | | | | | | | |
| † | Percentages indicated are based on Fund net assets. |
| ¨ | | Among the Fund’s 10 largest issuers held, as of April 30, 2013, excluding short-term investment. May be subject to change daily. |
| | | | | | |
The notes to the financial statements are an integral part of,
and should be read in conjunction with, the financial statements. | | mainstayinvestments.com | | | 11 | |
Portfolio of Investments April 30, 2013 (Unaudited) (continued)
| | | | | | | | |
| | | Principal
Amount | | | Value | |
| | | | | | | | |
| Corporate Bonds (continued) | |
Holding Company—Diversified 1.5% | |
¨Hutchison Whampoa International, Ltd.
4.625%, due 9/11/15 (a) | | $ | 1,195,000 | | | $ | 1,285,100 | |
| | | | | | | | |
|
Insurance 2.6% | |
¨Hartford Financial Services Group, Inc.
4.75%, due 3/1/14 | | | 1,250,000 | | | | 1,289,152 | |
MetLife, Inc.
2.375%, due 2/6/14 | | | 890,000 | | | | 903,190 | |
| | | | | | | | |
| | | | | | | 2,192,342 | |
| | | | | | | | |
Media 1.1% | |
NBC Universal Media LLC
2.10%, due 4/1/14 | | | 875,000 | | | | 887,808 | |
| | | | | | | | |
|
Mining 1.0% | |
Anglo American Capital PLC
9.375%, due 4/8/14 (a) | | | 750,000 | | | | 807,591 | |
| | | | | | | | |
|
Miscellaneous—Manufacturing 0.8% | |
3M Co.
1.375%, due 9/29/16 | | | 660,000 | | | | 677,036 | |
| | | | | | | | |
|
Office Equipment/Supplies 0.5% | |
Xerox Corp.
8.25%, due 5/15/14 | | | 385,000 | | | | 413,992 | |
| | | | | | | | |
|
Oil & Gas 4.6% | |
BP Capital Markets PLC
5.25%, due 11/7/13 | | | 425,000 | | | | 435,687 | |
Chevron Corp.
1.104%, due 12/5/17 | | | 445,000 | | | | 447,073 | |
ConocoPhillips Co.
1.05%, due 12/15/17 | | | 455,000 | | | | 455,643 | |
PetroHawk Energy Corp.
7.25%, due 8/15/18 | | | 805,000 | | | | 890,934 | |
Phillips 66
2.95%, due 5/1/17 | | | 285,000 | | | | 303,384 | |
¨Total Capital S.A.
3.125%, due 10/2/15 | | | 1,235,000 | | | | 1,306,297 | |
| | | | | | | | |
| | | | | | | 3,839,018 | |
| | | | | | | | |
Pharmaceuticals 1.6% | |
Pfizer, Inc.
5.35%, due 3/15/15 | | | 750,000 | | | | 815,863 | |
Sanofi
1.20%, due 9/30/14 | | | 510,000 | | | | 516,005 | |
| | | | | | | | |
| | | | | | | 1,331,868 | |
| | | | | | | | |
| | | | | | | | |
| | | Principal
Amount | | | Value | |
| | | | | | | | |
Pipelines 0.6% | |
DCP Midstream LLC
9.70%, due 12/1/13 (a) | | $ | 510,000 | | | $ | 535,125 | |
| | | | | | | | |
|
Retail 1.1% | |
Costco Wholesale Corp.
0.65%, due 12/7/15 | | | 940,000 | | | | 944,576 | |
| | | | | | | | |
|
Semiconductors 1.1% | |
Intel Corp.
1.35%, due 12/15/17 | | | 910,000 | | | | 916,191 | |
| | | | | | | | |
|
Software 0.9% | |
Oracle Corp.
1.20%, due 10/15/17 | | | 730,000 | | | | 734,493 | |
| | | | | | | | |
|
Telecommunications 2.6% | |
BellSouth Corp.
5.20%, due 9/15/14 | | | 540,000 | | | | 573,288 | |
Telefonica Emisiones S.A.U
4.949%, due 1/15/15 | | | 785,000 | | | | 826,605 | |
Verizon Communications, Inc.
0.70%, due 11/2/15 | | | 800,000 | | | | 797,612 | |
| | | | | | | | |
| | | | | | | 2,197,505 | |
| | | | | | | | |
Total Corporate Bonds
(Cost $39,844,723) | | | | | | | 40,696,652 | |
| | | | | | | | |
|
| Mortgage-Backed Securities 4.7% | |
Commercial Mortgage Loans
(Collateralized Mortgage Obligations) 4.7% | |
Banc of America Commercial Mortgage, Inc. | | | | | | | | |
Series 2007-1, Class AAB
5.422%, due 1/15/49 | | | 657,555 | | | | 683,825 | |
Bear Stearns Commercial Mortgage
Securities Trust | | | | | | | | |
Series 2004-T16, Class A6
4.75%, due 2/13/46 (b) | | | 200,000 | | | | 209,042 | |
Series 2005-PW10, Class A4
5.405%, due 12/11/40 (b) | | | 400,000 | | | | 440,332 | |
GE Capital Commercial Mortgage Corp. | | | | | | | | |
Series 2004-C2, Class A4
4.893%, due 3/10/40 | | | 500,000 | | | | 512,998 | |
LB-UBS Commercial Mortgage Trust
Series 2004-C1, Class A4
4.568%, due 1/15/31 | | | 770,885 | | | | 788,472 | |
RBSCF Trust | | | | | | | | |
Series 2010-MB1, Class A1
2.367%, due 4/15/24 (a) | | | 475,853 | | | | 483,152 | |
Series 2010-MB1, Class A2
3.686%, due 4/15/24 (a) | | | 450,000 | | | | 472,809 | |
| | | | |
| 12 | | MainStay Short Term Bond Fund | | The notes to the financial statements are an integral part of,
and should be read in conjunction with, the financial statements. |
| | | | | | | | |
| | | Principal
Amount | | | Value | |
| | | | | | | | |
| Mortgage-Backed Securities (continued) | |
Commercial Mortgage Loans
(Collateralized Mortgage Obligations) (continued) | |
Wachovia Bank Commercial Mortgage Trust
Series 2004-C14, Class A4
5.088%, due 8/15/41 (b) | | $ | 310,000 | | | $ | 322,414 | |
| | | | | | | | |
Total Mortgage-Backed Securities
(Cost $3,929,229) | | | | | | | 3,913,044 | |
| | | | | | | | |
|
| U.S. Government & Federal Agencies 42.5% | |
Federal Home Loan Mortgage Corporation 1.0% | |
1.00%, due 8/20/14 | | | 825,000 | | | | 833,468 | |
| | | | | | | | |
|
¨Federal National Mortgage Association 2.7% | |
0.50%, due 11/6/15 | | | 870,000 | | | | 870,504 | |
0.75%, due 11/28/14 | | | 1,350,000 | | | | 1,355,296 | |
| | | | | | | | |
| | | | | | | 2,225,800 | |
| | | | | | | | |
Federal National Mortgage Association
(Mortgage Pass-Through Security) 0.1% | |
4.50%, due 11/1/18 | | | 117,300 | | | | 126,141 | |
| | | | | | | | |
|
¨United States Treasury Notes 38.7% | |
0.25%, due 9/15/14 | | | 10,185,000 | | | | 10,194,553 | |
0.375%, due 3/15/15 | | | 6,050,000 | | | | 6,068,434 | |
0.375%, due 6/15/15 | | | 5,885,000 | | | | 5,902,931 | |
1.00%, due 7/15/13 | | | 2,175,000 | | | | 2,179,248 | |
1.25%, due 3/15/14 | | | 5,100,000 | | | | 5,149,608 | |
2.25%, due 5/31/14 | | | 2,710,000 | | | | 2,771,398 | |
| | | | | | | | |
| | | | | | | 32,266,172 | |
| | | | | | | | |
Total U.S. Government & Federal Agencies
(Cost $35,310,384) | | | | 35,451,581 | |
| | | | | | | | |
|
| Yankee Bond 1.0% (c) | |
Oil & Gas 1.0% | |
EnCana Corp.
4.75%, due 10/15/13 | | | 850,000 | | | | 865,641 | |
| | | | | | | | |
Total Yankee Bond
(Cost $861,606) | | | | | | | 865,641 | |
| | | | | | | | |
Total Long-Term Bonds
(Cost $80,693,660) | | | | | | | 81,681,056 | |
| | | | | | | | |
| | | | | | | | |
| | | Principal
Amount | | | Value | |
| | | | | | | | |
| Short-Term Investment 2.5% | |
Repurchase Agreement 2.5% | |
State Street Bank and Trust Co.
0.01%, dated 4/30/13
due 5/1/13
Proceeds at Maturity $2,065,675 (Collateralized by a Federal Home Lone Mortgage Corp. security with a rate of 2.00% and a maturity date of 11/2/22, with a Principal Amount of $2,110,000 and a Market Value of $2,109,238) | | $ | 2,065,675 | | | $ | 2,065,675 | |
| | | | | | | | |
Total Short-Term Investment
(Cost $2,065,675) | | | | | | | 2,065,675 | |
| | | | | | | | |
Total Investments
(Cost $82,759,335) (d) | | | 100.4 | % | | | 83,746,731 | |
Other Assets, Less Liabilities | | | (0.4 | ) | | | (336,492 | ) |
Net Assets | | | 100.0 | % | | $ | 83,410,239 | |
| (a) | May be sold to institutional investors only under Rule 144A or securities offered pursuant to Section 4(a)(2) of the Securities Act of 1933, as amended. |
| (b) | Floating rate—Rate shown is the rate in effect as of April 30, 2013. |
| (c) | Yankee Bond—Dollar-denominated bond issued in the United States by a foreign bank or corporation. |
| (d) | As of April 30, 2013, cost is $82,759,335 for federal income tax purposes and net unrealized appreciation is as follows: |
| | | | |
Gross unrealized appreciation | | $ | 1,037,332 | |
Gross unrealized depreciation | | | (49,936 | ) |
| | | | |
Net unrealized appreciation | | $ | 987,396 | |
| | | | |
| | | | | | |
The notes to the financial statements are an integral part of,
and should be read in conjunction with, the financial statements. | | mainstayinvestments.com | | | 13 | |
Portfolio of Investments April 30, 2013 (Unaudited) (continued)
The following is a summary of the fair valuations according to the inputs used as of April 30, 2013, for valuing the Fund’s assets.
Asset Valuation Inputs
| | | | | | | | | | | | | | | | |
Description | | Quoted
Prices in
Active
Markets for
Identical
Assets
(Level 1) | | | Significant
Other
Observable
Inputs (Level 2) | | | Significant
Unobservable
Inputs
(Level 3) | | | Total | |
| Investments in Securities (a) | | | | | | | | | | | | | | | | |
| Long-Term Bonds | | | | | | | | | | | | | | | | |
Asset-Backed Security | | $ | — | | | $ | 754,138 | | | $ | — | | | $ | 754,138 | |
Corporate Bonds | | | — | | | | 40,696,652 | | | | — | | | | 40,696,652 | |
Mortgage-Backed Securities | | | — | | | | 3,913,044 | | | | — | | | | 3,913,044 | |
U.S. Government & Federal Agencies | | | — | | | | 35,451,581 | | | | — | | | | 35,451,581 | |
Yankee Bond | | | — | | | | 865,641 | | | | — | | | | 865,641 | |
| | | | | | | | | | | | | | | | |
| Total Long-Term Bonds | | | — | | | | 81,681,056 | | | | — | | | | 81,681,056 | |
| | | | | | | | | | | | | | | | |
| Short-Term Investment | | | | | | | | | | | | | | | | |
Repurchase Agreement | | | — | | | | 2,065,675 | | | | — | | | | 2,065,675 | |
| | | | | | | | | | | | | | | | |
| Total Investments in Securities | | $ | — | | | $ | 83,746,731 | | | $ | — | | | $ | 83,746,731 | |
| | | | | | | | | | | | | | | | |
| (a) | For a complete listing of investments and their industries, see the Portfolio of Investments. |
The Fund recognizes transfers between the levels as of the beginning of the period.
For the period ended April 30, 2013, the Fund did not have any transfers between Level 1 and Level 2 fair value measurements. (See Note 2)
As of April 30, 2013, the Fund did not hold any investments with significant unobservable inputs (Level 3). (See Note 2)
| | | | |
| 14 | | MainStay Short Term Bond Fund | | The notes to the financial statements are an integral part of,
and should be read in conjunction with, the financial statements. |
Statement of Assets and Liabilities as of April 30, 2013 (Unaudited)
| | | | |
| Assets | |
Investment in securities, at value
(identified cost $82,759,335) | | $ | 83,746,731 | |
Receivables: | | | | |
Fund shares sold | | | 412,346 | |
Interest | | | 401,752 | |
Other assets | | | 30,876 | |
| | | | |
Total assets | | | 84,591,705 | |
| | | | |
| |
| Liabilities | | | | |
Payables: | | | | |
Investment securities purchased | | | 871,771 | |
Fund shares redeemed | | | 214,072 | |
Professional fees | | | 24,507 | |
Manager (See Note 3) | | | 22,192 | |
Transfer agent (See Note 3) | | | 21,098 | |
Shareholder communication | | | 12,325 | |
NYLIFE Distributors (See Note 3) | | | 6,507 | |
Custodian | | | 927 | |
Trustees | | | 247 | |
Accrued expenses | | | 2,081 | |
Dividend payable | | | 5,739 | |
| | | | |
Total liabilities | | | 1,181,466 | |
| | | | |
Net assets | | $ | 83,410,239 | |
| | | | |
| |
| Composition of Net Assets | | | | |
Shares of beneficial interest outstanding (par value of $.001 per share) unlimited number of shares authorized | | $ | 8,669 | |
Additional paid-in capital | | | 82,341,423 | |
| | | | |
| | | 82,350,092 | |
Distributions in excess of net investment income | | | (6,610 | ) |
Accumulated net realized gain (loss) on investments | | | 79,361 | |
Net unrealized appreciation (depreciation) on investments | | | 987,396 | |
| | | | |
Net assets | | $ | 83,410,239 | |
| | | | |
| | | | |
Investor Class | | | | |
Net assets applicable to outstanding shares | | $ | 4,075,289 | |
| | | | |
Shares of beneficial interest outstanding | | | 422,269 | |
| | | | |
Net asset value per share outstanding | | $ | 9.65 | |
Maximum sales charge (3.00% of offering price) | | | 0.30 | |
| | | | |
Maximum offering price per share outstanding | | $ | 9.95 | |
| | | | |
Class A | | | | |
Net assets applicable to outstanding shares | | $ | 26,416,978 | |
| | | | |
Shares of beneficial interest outstanding | | | 2,745,441 | |
| | | | |
Net asset value per share outstanding | | $ | 9.62 | |
Maximum sales charge (3.00% of offering price) | | | 0.30 | |
| | | | |
Maximum offering price per share outstanding | | $ | 9.92 | |
| | | | |
Class I | | | | |
Net assets applicable to outstanding shares | | $ | 52,917,972 | |
| | | | |
Shares of beneficial interest outstanding | | | 5,500,797 | |
| | | | |
Net asset value and offering price per share outstanding | | $ | 9.62 | |
| | | | |
| | | | | | |
The notes to the financial statements are an integral part of,
and should be read in conjunction with, the financial statements. | | mainstayinvestments.com | | | 15 | |
Statement of Operations for the six months ended April 30, 2013 (Unaudited)
| | | | |
| Investment Income (Loss) | | | | |
Income | | | | |
Interest | | $ | 673,625 | |
| | | | |
Expenses | | | | |
Manager (See Note 3) | | | 250,501 | |
Transfer agent (See Note 3) | | | 60,904 | |
Distribution/Service—Investor Class (See Note 3) | | | 5,302 | |
Distribution/Service—Class A (See Note 3) | | | 36,311 | |
Registration | | | 24,604 | |
Professional fees | | | 23,959 | |
Shareholder communication | | | 14,655 | |
Custodian | | | 3,004 | |
Trustees | | | 989 | |
Miscellaneous | | | 3,827 | |
| | | | |
Total expenses before waiver/reimbursement | | | 424,056 | |
Expense waiver/reimbursement from Manager (See Note 3) | | | (101,606 | ) |
| | | | |
Net expenses | | | 322,450 | |
| | | | |
Net investment income (loss) | | | 351,175 | |
| | | | |
|
| Realized and Unrealized Gain (Loss) on Investments | |
Net realized gain (loss) on investments | | | 79,421 | |
Net change in unrealized appreciation (depreciation)
on investments | | | (268,344 | ) |
| | | | |
Net realized and unrealized gain (loss) on investments | | | (188,923 | ) |
| | | | |
Net increase (decrease) in net assets resulting from operations | | $ | 162,252 | |
| | | | |
| | | | |
| 16 | | MainStay Short Term Bond Fund | | The notes to the financial statements are an integral part of,
and should be read in conjunction with, the financial statements. |
Statements of Changes in Net Assets
for the six months ended April 30, 2013 (Unaudited) and the year ended October 31, 2012
| | | | | | | | |
| | | 2013 | | | 2012 | |
| Increase (Decrease) in Net Assets | |
Operations: | | | | | | | | |
Net investment income (loss) | | $ | 351,175 | | | $ | 817,874 | |
Net realized gain (loss) on investments | | | 79,421 | | | | 359,400 | |
Net change in unrealized appreciation (depreciation) on investments | | | (268,344 | ) | | | (7,140 | ) |
| | | | |
Net increase (decrease) in net assets resulting from operations | | | 162,252 | | | | 1,170,134 | |
| | | | |
Dividends and distributions to shareholders: | | | | | | | | |
From net investment income: | | | | | | | | |
Investor Class | | | (7,970 | ) | | | (18,510 | ) |
Class A | | | (101,363 | ) | | | (250,805 | ) |
Class I | | | (241,248 | ) | | | (549,320 | ) |
| | | | |
| | | (350,581 | ) | | | (818,635 | ) |
| | | | |
From net realized gain on investments: | | | | | | | | |
Investor Class | | | (17,969 | ) | | | (18,951 | ) |
Class A | | | (126,883 | ) | | | (141,099 | ) |
Class I | | | (212,374 | ) | | | (245,785 | ) |
| | | | |
| | | (357,226 | ) | | | (405,835 | ) |
| | | | |
Total dividends and distributions
to shareholders | | | (707,807 | ) | | | (1,224,470 | ) |
| | | | |
Capital share transactions: | | | | | | | | |
Net proceeds from sale of shares | | | 23,615,408 | | | | 54,026,156 | |
Net asset value of shares issued to shareholders in reinvestment of dividends and distributions | | | 614,935 | | | | 1,093,274 | |
Cost of shares redeemed | | | (27,561,469 | ) | | | (51,787,872 | ) |
| | | | |
Increase (decrease) in net assets derived from capital
share transactions | | | (3,331,126 | ) | | | 3,331,558 | |
| | | | |
Net increase (decrease) in net assets | | | (3,876,681 | ) | | | 3,277,222 | |
|
| Net Assets | |
Beginning of period | | | 87,286,920 | | | | 84,009,698 | |
| | | | |
End of period | | $ | 83,410,239 | | | $ | 87,286,920 | |
| | | | |
Distributions in excess of net investment income at end of period | | $ | (6,610 | ) | | $ | (7,204 | ) |
| | | | |
| | | | | | |
The notes to the financial statements are an integral part of,
and should be read in conjunction with, the financial statements. | | mainstayinvestments.com | | | 17 | |
Financial Highlights selected per share data and ratios
| | | | | | | | | | | | | | | | | | | | | | | | |
| | | Investor Class | |
| | | Six months
ended
April 30, | | | Year ended October 31, | | | February 28,
2008**
through
October 31, | |
| | | 2013* | | | 2012 | | | 2011 | | | 2010 | | | 2009 | | | 2008 | |
Net asset value at beginning of period | | $ | 9.71 | | | $ | 9.72 | | | $ | 9.81 | | | $ | 9.81 | | | $ | 9.32 | | | $ | 9.44 | |
| | | | | | | | | | | | | | | | | | | | | | | | |
Net investment income (loss) | | | 0.02 | | | | 0.04 | | | | 0.08 | | | | 0.05 | | | | 0.10 | | | | 0.13 | (a) |
Net realized and unrealized gain (loss) on investments | | | (0.02 | ) | | | 0.03 | | | | (0.06 | ) | | | 0.13 | | | | 0.49 | | | | (0.11 | ) |
| | | | | | | | | | | | | | | | | | | | | | | | |
Total from investment operations | | | — | | | | 0.07 | | | | 0.02 | | | | 0.18 | | | | 0.59 | | | | 0.02 | |
| | | | | | | | | | | | | | | | | | | | | | | | |
Less dividends and distributions: | | | | | | | | | | | | | | | | | | | | | | | | |
From net investment income | | | (0.02 | ) | | | (0.04 | ) | | | (0.09 | ) | | | (0.06 | ) | | | (0.10 | ) | | | (0.14 | ) |
From net realized gain on investments | | | (0.04 | ) | | | (0.04 | ) | | | (0.02 | ) | | | (0.12 | ) | | | — | | | | — | |
| | | | | | | | | | | | | | | | | | | | | | | | |
Total dividends and distributions | | | (0.06 | ) | | | (0.08 | ) | | | (0.11 | ) | | | (0.18 | ) | | | (0.10 | ) | | | (0.14 | ) |
| | | | | | | | | | | | | | | | | | | | | | | | |
Net asset value at end of period | | $ | 9.65 | | | $ | 9.71 | | | $ | 9.72 | | | $ | 9.81 | | | $ | 9.81 | | | $ | 9.32 | |
| | | | | | | | | | | | | | | | | | | | | | | | |
Total investment return (b) | | | (0.02 | %)(c) | | | 0.79 | % | | | 0.13 | % | | | 1.83 | % | | | 6.31 | % | | | 0.20 | %(c) |
Ratios (to average net assets)/Supplemental Data: | | | | | | | | | | | | | | | | | | | | | | | | |
Net investment income (loss) | | | 0.38 | % †† | | | 0.44 | % | | | 0.83 | % | | | 0.63 | % | | | 1.00 | % | | | 2.10 | %†† |
Net expenses | | | 1.23 | % †† | | | 1.27 | % | | | 1.33 | % | | | 1.38 | % | | | 1.11 | % | | | 1.00 | %†† |
Expenses (before waiver/reimbursement) | | | 1.47 | % †† | | | 1.44 | % | | | 1.55 | % | | | 1.60 | % | | | 1.62 | % | | | 2.09 | %†† |
Portfolio turnover rate | | | 19 | % | | | 60 | % | | | 39 | % | | | 68 | %(d) | | | 193 | %(d) | | | 252 | %(d) |
Net assets at end of period (in 000’s) | | $ | 4,075 | | | $ | 4,356 | | | $ | 4,128 | | | $ | 4,119 | | | $ | 3,180 | | | $ | 2,266 | |
| ** | Commencement of operations. |
| (a) | Per share data based on average shares outstanding during the period. |
| (b) | Total investment return is calculated exclusive of sales charges and assumes the reinvestment of dividends and distributions. |
| (c) | Total investment return is not annualized. |
| (d) | The portfolio turnover rates not including mortgage dollar rolls were 52%, 131% and 237% for the years ended October 31, 2010, 2009 and 2008, respectively. |
| | | | |
| 18 | | MainStay Short Term Bond Fund | | The notes to the financial statements are an integral part of,
and should be read in conjunction with, the financial statements. |
Financial Highlights selected per share data and ratios
| | | | | | | | | | | | | | | | | | | | | | | | |
| | | Class A | |
| | | Six months
ended
April 30, | | | Year ended October 31, | |
| | | 2013* | | | 2012 | | | 2011 | | | 2010 | | | 2009 | | | 2008 | |
Net asset value at beginning of period | | $ | 9.68 | | | $ | 9.69 | | | $ | 9.78 | | | $ | 9.79 | | | $ | 9.29 | | | $ | 9.19 | |
| | | | | | | | | | | | | | | | | | | | | | | | |
Net investment income (loss) | | | 0.03 | | | | 0.09 | | | | 0.11 | | | | 0.11 | | | | 0.10 | | | | 0.24 | (a) |
Net realized and unrealized gain (loss) on investments | | | (0.02 | ) | | | 0.02 | | | | (0.06 | ) | | | 0.11 | | | | 0.51 | | | | 0.11 | |
| | | | | | | | | | | | | | | | | | | | | | | | |
Total from investment operations | | | 0.01 | | | | 0.11 | | | | 0.05 | | | | 0.22 | | | | 0.61 | | | | 0.35 | |
| | | | | | | | | | | | | | | | | | | | | | | | |
Less dividends and distributions: | | | | | | | | | | | | | | | | | | | | | | | | |
From net investment income | | | (0.03 | ) | | | (0.08 | ) | | | (0.12 | ) | | | (0.11 | ) | | | (0.11 | ) | | | (0.25 | ) |
From net realized gain on investments | | | (0.04 | ) | | | (0.04 | ) | | | (0.02 | ) | | | (0.12 | ) | | | — | | | | — | |
| | | | | | | | | | | | | | | | | | | | | | | | |
Total dividends and distributions | | | (0.07 | ) | | | (0.12 | ) | | | (0.14 | ) | | | (0.23 | ) | | | (0.11 | ) | | | (0.25 | ) |
| | | | | | | | | | | | | | | | | | | | | | | | |
Net asset value at end of period | | $ | 9.62 | | | $ | 9.68 | | | $ | 9.69 | | | $ | 9.78 | | | $ | 9.79 | | | $ | 9.29 | |
| | | | | | | | | | | | | | | | | | | | | | | | |
Total investment return (b) | | | 0.14 | %(c) | | | 1.13 | % | | | 0.53 | % | | | 2.19 | % | | | 6.65 | % | | | 3.87 | % |
Ratios (to average net assets)/Supplemental Data: | | | | | | | | | | | | | | | | | | | | | | | | |
Net investment income (loss) | | | 0.71 | %†† | | | 0.77 | % | | | 1.23 | % | | | 1.03 | % | | | 1.14 | % | | | 2.55 | % |
Net expenses | | | 0.91 | %†† | | | 0.93 | % | | | 0.93 | % | | | 0.93 | % | | | 0.91 | % | | | 0.90 | % |
Expenses (before waiver/reimbursement) | | | 1.15 | %†† | | | 1.10 | % | | | 1.15 | % | | | 1.15 | % | | | 1.16 | % | | | 1.32 | % |
Portfolio turnover rate | | | 19 | % | | | 60 | % | | | 39 | % | | | 68 | %(d) | | | 193 | %(d) | | | 252 | %(d) |
Net assets at end of period (in 000’s) | | $ | 26,417 | | | $ | 31,422 | | | $ | 31,689 | | | $ | 36,665 | | | $ | 54,902 | | | $ | 20,313 | |
| (a) | Per share data based on average shares outstanding during the period. |
| (b) | Total investment return is calculated exclusive of sales charges and assumes the reinvestment of dividends and distributions. |
| (c) | Total investment return is not annualized. |
| (d) | The portfolio turnover rates not including mortgage dollar rolls were 52%, 131% and 237% for the years ended October 31, 2010, 2009 and 2008, respectively. |
| | | | | | |
The notes to the financial statements are an integral part of,
and should be read in conjunction with, the financial statements. | | mainstayinvestments.com | | | 19 | |
Financial Highlights selected per share data and ratios
| | | | | | | | | | | | | | | | | | | | | | | | |
| | | Class I | |
| | | Six months
ended
April 30, | | | Year ended October 31, | |
| | | 2013* | | | 2012 | | | 2011 | | | 2010 | | | 2009 | | | 2008 | |
Net asset value at beginning of period | | $ | 9.68 | | | $ | 9.69 | | | $ | 9.78 | | | $ | 9.78 | | | $ | 9.29 | | | $ | 9.19 | |
| | | | | | | | | | | | | | | | | | | | | | | | |
Net investment income (loss) | | | 0.05 | | | | 0.10 | | | | 0.14 | | | | 0.13 | | | | 0.15 | | | | 0.29 | (a) |
Net realized and unrealized gain (loss) on investments | | | (0.02 | ) | | | 0.03 | | | | (0.06 | ) | | | 0.12 | | | | 0.48 | | | | 0.09 | |
| | | | | | | | | | | | | | | | | | | | | | | | |
Total from investment operations | | | 0.03 | | | | 0.13 | | | | 0.08 | | | | 0.25 | | | | 0.63 | | | | 0.38 | |
| | | | | | | | | | | | | | | | | | | | | | | | |
Less dividends and distributions: | | | | | | | | | | | | | | | | | | | | | | | | |
From net investment income | | | (0.05 | ) | | | (0.10 | ) | | | (0.15 | ) | | | (0.13 | ) | | | (0.14 | ) | | | (0.28 | ) |
From net realized gain on investments | | | (0.04 | ) | | | (0.04 | ) | | | (0.02 | ) | | | (0.12 | ) | | | — | | | | — | |
| | | | | | | | | | | | | | | | | | | | | | | | |
Total dividends and distributions | | | (0.09 | ) | | | (0.14 | ) | | | (0.17 | ) | | | (0.25 | ) | | | (0.14 | ) | | | (0.28 | ) |
| | | | | | | | | | | | | | | | | | | | | | | | |
Net asset value at end of period | | $ | 9.62 | | | $ | 9.68 | | | $ | 9.69 | | | $ | 9.78 | | | $ | 9.78 | | | $ | 9.29 | |
| | | | | | | | | | | | | | | | | | | | | | | | |
Total investment return (b) | | | 0.26 | %(c) | | | 1.39 | % | | | 0.78 | % | | | 2.55 | % | | | 6.83 | % | | | 4.17 | % |
Ratios (to average net assets)/Supplemental Data: | | | | | | | | | | | | | | | | | | | | | | | | |
Net investment income (loss) | | | 0.96 | %†† | | | 1.03 | % | | | 1.48 | % | | | 1.32 | % | | | 1.43 | % | | | 3.15 | % |
Net expenses | | | 0.66 | %†† | | | 0.68 | % | | | 0.68 | % | | | 0.68 | % | | | 0.63 | % | | | 0.60 | % |
Expenses (before waiver/reimbursement) | | | 0.90 | %†† | | | 0.85 | % | | | 0.90 | % | | | 0.90 | % | | | 0.91 | % | | | 0.91 | % |
Portfolio turnover rate | | | 19 | % | | | 60 | % | | | 39 | % | | | 68 | %(d) | | | 193 | %(d) | | | 252 | %(d) |
Net assets at end of period (in 000’s) | | $ | 52,918 | | | $ | 51,509 | | | $ | 48,193 | | | $ | 76,456 | | | $ | 79,237 | | | $ | 36,701 | |
| (a) | Per share data based on average shares outstanding during the period. |
| (b) | Total investment return is calculated exclusive of sales charges and assumes the reinvestment of dividends and distributions. Class I shares are not subject to sales charges. |
| (c) | Total investment return is not annualized. |
| (d) | The portfolio turnover rates not including mortgage dollar rolls were 52%, 131% and 237% for the years ended October 31, 2010, 2009 and 2008, respectively. |
| | | | |
| 20 | | MainStay Short Term Bond Fund | | The notes to the financial statements are an integral part of,
and should be read in conjunction with, the financial statements. |
Notes to Financial Statements (Unaudited)
Note 1–Organization and Business
MainStay Funds Trust (the “Trust”) was organized as a Delaware statutory trust on April 28, 2009, and is governed by a Declaration of Trust. The Trust is registered under the Investment Company Act of 1940, as amended (the “1940 Act”), as an open-end investment management company, and is comprised of thirty-three funds (collectively referred to as the “Funds”). These financial statements and notes relate only to the MainStay Short Term Bond Fund (the “Fund”), a diversified fund. The Fund is the successor of the Mainstay Short Term Bond Fund, a series of Eclipse Funds Inc. (the “Predecessor Fund”). The reorganization of the Predecessor Fund with and into the Fund occurred on February 26, 2010. All information and references to periods prior to February 26, 2010 relate to the Predecessor Fund.
The Fund currently offers three classes of shares. Class I shares commenced operations on January 2, 1991. Class A shares commenced operations on January 2, 2004. Investor Class shares commenced operations on February 28, 2008. Investor Class and Class A shares are offered at net asset value (“NAV”) per share plus an initial sales charge. No sales charge applies to investments of $1 million or more (and certain other qualified purchases) in Investor Class and Class A shares, but a contingent deferred sales charge (“CDSC”) is imposed on certain redemptions made within one year of the date of purchase. Class I shares are offered at NAV and are not subject to a sales charge. Depending upon eligibility, Investor Class shares may convert to Class A shares and Class A shares may convert to Investor Class shares. The three classes of shares have the same voting (except for issues that relate solely to one class), dividend, liquidation and other rights, and the same terms and conditions, except that Investor Class and Class A shares are subject to a distribution and/or service fee. Class I shares are not subject to a distribution and/or service fee.
The Fund’s investment objective is to seek total return.
Note 2–Significant Accounting Policies
The Fund prepares its financial statements in accordance with generally accepted accounting principles (“GAAP”) in the United States of America and follows the significant accounting policies described below.
(A) Securities Valuation. Investments are valued as of the close of regular trading on the New York Stock Exchange (“Exchange”) (generally 4:00 p.m. Eastern time) on each day the Fund is open for business (“valuation date”).
The Board of Trustees (the “Board”) has adopted procedures for the valuation of the Fund’s securities and has delegated the responsibility for valuation determination under those procedures to the Valuation Committee of the Fund (the “Valuation Committee”). The Board has authorized the Valuation Committee to appoint a Valuation Sub-Committee (the “Sub-Committee”) to deal in the first instance with questions that arise or cannot be resolved under these procedures. The Sub-Committee meets (in person, via electronic mail or via teleconference) on an as-needed basis. The Valuation Committee meets at a later time, as necessary, to ensure that actions taken by the Sub-Committee were appropriate. The procedures recognize that, subject to the oversight of the Board and unless otherwise noted, the responsibility for day-to-day valuation of portfolio assets (including securities for which market prices are not readily available) rests with New York Life
Investment Management LLC ( “New York Life Investments” or the “Manager”), aided to whatever extent necessary by the Subadvisor (as defined in Note 3(A)) of the Fund.
To assess the appropriateness of security valuations, the Manager or the Fund’s third party service provider who is subject to oversight by the Manager, regularly compares prior day prices, prices on comparable securities and the sale prices to the prior and current day prices and challenges prices exceeding certain tolerance levels with third party pricing services or broker sources. For those securities valued by recommendation, whether through a standardized fair valuation methodology or a fair valuation determination, the Valuation Committee reviews and affirms the reasonableness of the valuation based on such methodologies and determinations on a regular basis after considering all relevant information that is reasonably available.
“Fair value” is defined as the price that the Fund would receive upon selling an investment in an orderly transaction to an independent buyer in the principal or most advantageous market of the investment. Fair value measurements are determined within a framework that has established a three-tier hierarchy which maximizes the use of observable market data and minimizes the use of unobservable inputs to establish classification of fair value measurements for disclosure purposes. “Inputs” refers broadly to the assumptions that market participants would use in pricing the asset or liability, including assumptions about risk, such as the risk inherent in a particular valuation technique used to measure fair value using a pricing model and/or the risk inherent in the inputs for the valuation technique. Inputs may be observable or unobservable. Observable inputs reflect the assumptions market participants would use in pricing the asset or liability based on market data obtained from sources independent of the Fund. Unobservable inputs reflect the Fund’s own assumptions about the assumptions market participants would use in pricing the asset or liability developed based on the information available in the circumstances. The inputs or methodology used for valuing securities may not be an indication of the risks associated with investing in those securities. The three-tier hierarchy of inputs is summarized in the three broad Levels listed below.
| • | | Level 1—quoted prices in active markets for identical investments |
| • | | Level 2—other significant observable inputs (including quoted prices for similar investments in active markets, interest rates and yield curves, prepayment speeds, credit risks, etc.) |
| • | | Level 3—significant unobservable inputs (including the Fund’s own assumptions about the assumptions that market participants would use in determining the fair value of investments) |
The aggregate value by input level, as of April 30, 2013, for the Fund’s investments is included at the end of the Fund’s Portfolio of Investments.
The valuation techniques used by the Fund to measure fair value maximize the use of observable inputs and minimize the use of unobservable
| | | | |
| mainstayinvestments.com | | | 21 | |
Notes to Financial Statements (Unaudited) (continued)
inputs. The Fund may utilize third party vendor evaluations, whose prices may be derived from one or more of the following standard inputs:
| | |
• Benchmark Yields | | • Reported Trades |
• Broker Dealer Quotes | | • Issuer Spreads |
• Two-sided markets | | • Benchmark securities |
• Bids/Offers | | • Reference Data (corporate actions or material event notices) |
• Industry and economic events | | • Comparable bonds |
• Equity and credit default swap curves | | • Monthly payment information |
Securities for which market values cannot be determined using the methodologies described above are valued by methods deemed in good faith by the Fund’s Valuation Committee, following the procedures established by the Board, to represent fair value. Under these procedures, the Fund primarily employs a market-based approach which may use related or comparable assets or liabilities, recent transactions, market multiples, book values, and other relevant information. The Fund may also use an income-based valuation approach in which the anticipated future cash flows of the investment are discounted to calculate fair value. Discounts may also be applied due to the nature or duration of any restrictions on the disposition of the investments. Due to the inherent uncertainty of valuations of such investments, the fair values may differ significantly from the values that would have been used had an active market existed. For the six-month period ended April 30, 2013, there have been no changes to the fair value methodologies.
Equity and non-equity securities which may be valued in this manner include, but are not limited to: (i) a security for which the trading has been halted or suspended; (ii) a debt security that has recently gone into default and for which there is not a current market quotation; (iii) a security of an issuer that has entered into a restructuring; (iv) a security that has been de-listed from a national exchange; (v) a security for which the market price is not available from a third party pricing source or, if so provided, does not, in the opinion of the Fund’s Manager or Subadvisor reflect the security’s market value; and (vi) a security whose principal market has been temporarily closed at a time when, under normal conditions, it would be open. Securities for which market quotations or observable inputs are not readily available are generally categorized as Level 3 in the hierarchy. As of April 30, 2013, the Fund did not hold any securities that were fair valued in such a manner.
Debt securities (other than convertible bonds and municipal debt securities) are valued at the evaluated bid prices (evaluated mean prices in the case of convertible bonds and municipal debt securities) supplied by a pricing agent or broker selected by the Fund’s Manager in consultation with the Fund’s Subadvisor, whose prices reflect broker/dealer supplied valuations and electronic data processing techniques, if such prices are deemed by the Fund’s Manager, in consultation with the Fund’s Subadvisor to be representative of market values, at the regular close of trading of the Exchange on each valuation date. Debt securities, including corporate bonds, U.S. government and federal agency bonds, municipal bonds, foreign bonds, Yankee bonds, convertible bonds, asset-backed securities and mortgage-backed securities are generally categorized as Level 2 in the hierarchy.
Investments in other mutual funds are valued at their respective NAVs as of the close of the Exchange on the valuation date. These securities are generally categorized as Level 1 in the hierarchy.
Temporary cash investments acquired over 60 days to maturity are valued using the latest bid prices or using valuations based on a matrix system (which considers such factors as security prices, yields, maturities, and ratings), both as furnished by independent pricing services. Other temporary cash investments which mature in 60 days or less (“Short-Term Investments”) are valued at amortized cost. The amortized cost method involves valuing a security at its cost on the date of purchase and thereafter assuming a constant amortization to maturity of the difference between such cost and the value on maturity date. Amortized cost approximates the current fair value of a security. Securities valued at amortized cost are not valued using a quoted price in an active market. These securities are generally categorized as Level 2 in the hierarchy.
(B) Income Taxes. The Fund’s policy is to comply with the requirements of the Internal Revenue Code of 1986, as amended (the “Internal Revenue Code”), applicable to regulated investment companies and to distribute all of the taxable income to the shareholders of the Fund within the allowable time limits. Therefore, no federal, state and local income tax provision is required.
Management evaluates its tax positions to determine if the tax positions taken meet the minimum recognition threshold in connection with accounting for uncertainties in income tax positions taken or expected to be taken for the purposes of measuring and recognizing tax liabilities in the financial statements. Recognition of tax benefits of an uncertain tax position is required only when the position is “more likely than not” to be sustained assuming examination by taxing authorities. Management has analyzed the Fund’s tax positions taken on federal, state and local income tax returns for all open tax years (for up to three tax years), and has concluded that no provision for federal, state and local income tax is required in the Fund’s financial statements. The Fund’s federal, state and local income and federal excise tax returns for tax years for which the applicable statutes of limitations have not expired are subject to examination by the Internal Revenue Service and state and local departments of revenue.
(C) Dividends and Distributions to Shareholders. Dividends and distributions are recorded on the ex-dividend date. The Fund intends to declare and pay dividends of net investment income, if any, at least monthly and distributions of net realized capital and currency gains, if any, at least annually. Unless the shareholder elects otherwise, all dividends and distributions are reinvested in the same class of shares of the Fund, at NAV. Dividends and distributions to shareholders are determined in accordance with federal income tax regulations and may differ from GAAP.
(D) Security Transactions and Investment Income. The Fund records security transactions on the trade date. Realized gains and losses on security transactions are determined using the identified cost method and include gains and losses from repayments of principal on mortgage-backed securities. Interest income is accrued as earned using the effective interest rate method. Discounts and premiums on securities purchased, other than Short-Term Investments, for the Fund are accreted and amortized, respectively, on the effective interest rate method over the life of the respective securities or, in the case of a callable security, over the period to the first date of call. Discounts and premiums on Short-Term Investments are accreted and amortized, respectively, on the straight-line method. Income from payment-in-kind
| | |
| 22 | | MainStay Short Term Bond Fund |
securities is recorded daily based on the effective interest method of accrual.
Investment income and realized and unrealized gains and losses on investments of the Fund are allocated to separate classes of shares pro rata based upon their relative net assets on the date the income is earned or realized and unrealized gains and losses are incurred.
(E) Expenses. Expenses of the Trust are allocated to the individual Funds in proportion to the net assets of the respective Funds when the expenses are incurred, except where direct allocations of expenses can be made. Expenses (other than transfer agent expenses and fees incurred under the shareholder services plans and the distribution plans further discussed in Note 3(B)) are allocated to separate classes of shares pro rata based upon their relative net assets on the date the expenses are incurred. The expenses borne by the Fund, including those of related parties to the Fund, are shown in the Statement of Operations.
(F) Use of Estimates. In preparing financial statements in conformity with GAAP, management makes estimates and assumptions that affect the reported amounts and disclosures in the financial statements. Actual results could differ from those estimates.
(G) Repurchase Agreements. The Fund may enter into repurchase agreements to earn income. The Fund may enter into repurchase agreements only with financial institutions that are deemed by the Manager or Subadvisor to be creditworthy, pursuant to guidelines established by the Fund’s Board. During the term of any repurchase agreement, the Manager will continue to monitor the creditworthiness of the seller. Under the 1940 Act, repurchase agreements are considered to be collateralized loans by a Fund to the seller secured by the securities transferred to the Fund.
When the Fund invests in repurchase agreements, the Fund’s custodian takes possession of the collateral pledged for investments in the repurchase agreement. The underlying collateral is valued daily on a mark-to-market basis to determine that the value, including accrued interest, exceeds the repurchase price. In the event of the seller’s default on the obligation to repurchase, the Fund has the right to liquidate the collateral and apply the proceeds in satisfaction of the obligation. Under certain circumstances, such as in the event of default or bankruptcy by the counterparty to the agreement, realization and/or retention of the collateral may be subject to legal proceedings and possible realized loss to the Fund.
(H) Dollar Rolls. The Fund may enter into dollar roll transactions in which it sells mortgage-backed securities (“MBS”) from its portfolio to a counterparty from whom it simultaneously agrees to buy a similar security on a delayed delivery basis. The dollar roll transactions of the Fund are classified as purchase and sale transactions. The securities sold in connection with the dollar rolls are removed from the portfolio and a realized gain or loss is recognized. The securities the Fund has agreed to acquire are included at market value in the Portfolio of Investments and liabilities for such purchase commitments are included as payables for investments purchased. During the roll period, the Fund foregoes principal and interest paid on the securities. The Fund is compensated by the difference between the current sales price and the forward price for the future as well as by the earnings on the cash proceeds of the initial sale. Dollar rolls may be renewed without physical delivery of the
securities subject to the contract. The Fund maintains liquid assets from its portfolio having a value not less than the repurchase price, including accrued interest. Dollar roll transactions involve certain risks, including the risk that the MBS returned to the Fund at the end of the roll period, while substantially similar, could be inferior to what was initially sold to the counterparty.
(I) Securities Lending. In order to realize additional income, the Fund may engage in securities lending, subject to the limitations set forth in the 1940 Act and relevant guidance by the staff of the Securities and Exchange Commission. In the event the Fund does engage in securities lending, the Fund will lend through its custodian, State Street Bank and Trust Company (“State Street”). State Street will manage the Fund’s cash collateral in accordance with the lending agreement between the Fund and State Street, and indemnify the Fund’s portfolio against counterparty risk. The loans will be collateralized by cash or securities at least equal at all times to the market value of the securities loaned. Collateral will consist of U.S. Government securities, cash equivalents or irrevocable letters of credit. The Fund may bear the risk of delay in recovery of, or loss of rights in, the securities loaned should the borrower of the securities experience financial difficulty. The Fund may also record realized gain or loss on securities deemed sold due to a borrower’s inability to return securities on loan. The Fund will receive compensation for lending its securities in the form of fees or the retention of a portion of the interest on the investment of any cash received as collateral. The Fund also will continue to receive interest and dividends on the securities loaned and any gain or loss in the market price of the securities loaned that may occur during the term of the loan will be for the account of the Fund.
Although the Fund and New York Life Investments have temporarily suspended securities lending, the Fund and New York Life Investments reserve the right to reinstitute lending when deemed appropriate. The Fund did not have any portfolio securities on loan as of April 30, 2013.
(J) Concentration of Risk. The ability of issuers of debt securities held by the Fund to meet their obligations may be affected by economic or political developments in a specific country, industry or region.
(K) Indemnifications. Under the Trust’s organizational documents, its officers and trustees are indemnified against certain liabilities that may arise out of performance of their duties to the Trust. Additionally, in the normal course of business, the Fund enters into contracts with third-party service providers that contain a variety of representations and warranties and which may provide general indemnifications. The Fund’s maximum exposure under these arrangements is unknown, as this would involve future claims that may be made against the Fund that have not yet occurred. Based on experience, management is of the view that the risk of loss in connection with these potential indemnification obligations is remote. However, there can be no assurance that material liabilities related to such obligations will not arise in the future, which could adversely impact the Fund.
Note 3–Fees and Related Party Transactions
(A) Manager and Subadvisor. New York Life Investments, a registered investment adviser and an indirect, wholly-owned subsidiary of New York Life Insurance Company (“New York Life”), serves as the Fund’s Manager, pursuant to an Amended and Restated Management
| | | | |
| mainstayinvestments.com | | | 23 | |
Notes to Financial Statements (Unaudited) (continued)
Agreement (“Management Agreement”). The Manager provides offices, conducts clerical, recordkeeping and bookkeeping services, and keeps most of the financial and accounting records required to be maintained by the Fund. Except for the portion of salaries and expenses that are the responsibility of the Fund, the Manager pays the salaries and expenses of all personnel affiliated with the Fund and certain operational expenses of the Fund. The Fund reimburses New York Life Investments in an amount equal to a portion of the salary of the Chief Compliance Officer (“CCO”) of the Fund. MacKay Shields LLC (“MacKay Shields” or the ‘‘Subadvisor’’), a registered investment adviser and an indirect, wholly-owned subsidiary of New York Life, serves as Subadvisor to the Fund and is responsible for the day-to-day portfolio management of the Fund. Pursuant to the terms of an Amended and Restated Subadvisory Agreement (“Subadvisory Agreement”) between New York Life Investments and MacKay Shields, New York Life Investments pays for the services of the Subadvisor.
The Fund pays the Manager a monthly fee for services performed and facilities furnished at an annual rate of the Fund’s average daily net assets as follows: 0.60% up to $500 million and 0.575% in excess of $500 million. New York Life Investments has contractually agreed to waive a portion of its management fee so that the management fee does not exceed 0.50% on assets up to $500 million; and 0.475% on assets in excess of $500 million. This agreement will remain in effect until February 28, 2014, and shall renew automatically for one-year terms unless New York Life Investments provides written notice of termination prior to the start of the next term or upon approval of the Board. The effective management fee rate (exclusive of any applicable waivers/reimbursements) was 0.60% for the six-month period ended April 30, 2013.
Effective February 28, 2013, New York Life Investments had contractually agreed to waive fees and/or reimburse expenses so that Total Annual Fund Operating Expenses for Class A shares do not exceed 0.86% of its average daily net assets. New York Life Investments will apply an equivalent waiver or reimbursement, in an equal number of basis points, to the other share classes. This agreement will remain in effect until February 28, 2014 and shall renew automatically for one-year terms unless New York Life Investments provides written notice of termination prior to the start of the next term or upon approval of the Board. Total Annual Fund Operating Expenses excludes taxes, interest, litigation, extraordinary expenses, brokerage and other transaction expenses relating to the purchase or sale of portfolio investments, and acquired (underlying) fund fees and expenses.
Prior to February 28, 2013, New York Life Investments had contractually agreed to waive fees and/or reimburse expenses so that Total Annual Fund Operating Expenses for Class A shares did not exceed 0.93% of its average daily net assets. New York Life Investments will apply an equivalent waiver or reimbursement, in an equal number of basis points, to the other share classes.
For the six-month period ended April 30, 2013, New York Life Investments earned fees from the Fund in the amount of $250,501 and waived its fees and/or reimbursed expenses in the amount of $101,606.
State Street, 1 Lincoln Street, Boston, Massachusetts 02111, provides sub-administration and sub-accounting services to the Fund pursuant to
an agreement with New York Life Investments. These services include calculating the daily NAVs of the Fund, maintaining the general ledger and sub-ledger accounts for the calculation of the Fund’s respective NAVs, and assisting New York Life Investments in conducting various aspects of the Fund’s administrative operations. For providing these services to the Fund, State Street is compensated by New York Life Investments.
(B) Distribution and Service Fees. The Trust, on behalf of the Fund, has entered into a distribution agreement with NYLIFE Distributors LLC (the “Distributor”), an indirect, wholly-owned subsidiary of New York Life. The Fund has adopted distribution plans (the “Plans”) in accordance with the provisions of Rule 12b-1 under the 1940 Act.
Pursuant to the Investor Class and Class A Plans, the Distributor receives a monthly distribution fee from the Investor Class and Class A shares at an annual rate of 0.25% of the average daily net assets of the Investor Class and Class A shares for distribution and/or service activities as designated by the Distributor. Class I shares are not subject to a distribution and/or service fee.
The Plans provide that the distribution and service fees are payable to the Distributor regardless of the amounts actually expended by the Distributor for distribution of the Fund’s shares and service activities.
(C) Sales Charges. The Fund was advised by the Distributor that the amount of sales charges retained on sales of Investor Class and Class A shares were $1,014 and $3,462, respectively, for the six-month period ended April 30, 2013. The Fund was also advised that the Distributor retained CDSCs on redemptions of Class A shares of $5,993 for the six-month period ended April 30, 2013.
(D) Transfer, Dividend Disbursing and Shareholder Servicing Agent. NYLIM Service Company LLC, an affiliate of New York Life Investments, is the Fund’s transfer, dividend disbursing and shareholder servicing agent pursuant to an agreement between NYLIM Service Company LLC and the Trust. NYLIM Service Company LLC has entered into an agreement with Boston Financial Data Services, Inc. (“BFDS”) pursuant to which BFDS performs certain transfer agent services on behalf of NYLIM Service Company LLC. Transfer agent expenses incurred by the Fund for the six-month period ended April 30, 2013, were as follows:
| | | | |
Investor Class | | $ | 9,623 | |
Class A | | | 18,812 | |
Class I | | | 32,469 | |
(E) Small Account Fee. Shareholders with small accounts adversely impact the cost of providing transfer agency services. In an effort to reduce total transfer agency expenses, the Fund has implemented a small account fee on certain types of accounts. Certain shareholders with an account balance of less than $1,000 are charged an annual per account fee of $20 (assessed semi-annually), the proceeds from which offset transfer agent fees as reflected in the Statement of Operations.
| | |
| 24 | | MainStay Short Term Bond Fund |
Note 4–Federal Income Tax
The tax character of distributions paid during the year ended October 31, 2012, shown in the Statements of Changes in Net Assets was as follows:
| | | | |
| | | 2012 | |
Distributions paid from: | | | | |
Ordinary Income | | $ | 961,624 | |
Long-Term Capital Gain | | | 262,846 | |
Total | | $ | 1,224,470 | |
Note 5–Custodian
State Street is the custodian of the cash and the securities of the Fund. Custodial fees are charged to the Fund based on the market value of securities in the Fund and the number of certain cash transactions incurred by the Fund.
Note 6–Line of Credit
The Fund and certain affiliated funds maintain a line of credit with a syndicate of banks in order to secure a source of funds for temporary purposes to meet unanticipated or excessive redemption requests.
Effective August 29, 2012, under a second amended and restated credit agreement (the “Credit Agreement”), the aggregate commitment amount is $200,000,000 with an optional maximum amount of $250,000,000. The commitment fee is an annual rate of 0.08% of the average commitment amount payable quarterly, regardless of usage, to Bank of New York Mellon, which serves as the agent to the syndicate. The commitment fee is allocated among the Fund and certain affiliated funds based upon net assets and other factors. Interest on any revolving credit loan is charged based upon the Federal Funds Advances rate or the one month London InterBank Offered Rate, whichever is higher. The Credit Agreement expires on August 28, 2013, although the Fund, certain affiliated funds and the syndicate of banks may renew the Credit Agreement for an additional year on the same or different terms. There were no borrowings made or outstanding with respect to the Fund on the Credit Agreement during the six-month six-month period ended April 30, 2013.
Note 7–Purchases and Sales of Securities (in 000’s)
During the six-month period ended April 30, 2013, purchases and sales of U.S. government securities were $8,866 and $12,942, respectively. Purchases and sales of securities, other than U.S. government securities and short-term securities, were $6,674 and $6,043, respectively.
Note 8–Capital Share Transactions
| | | | | | | | |
Investor Class | | Shares | | | Amount | |
Six-month period ended April 30, 2013: | | | | | | | | |
Shares sold | | | 94,358 | | | $ | 911,573 | |
Shares issued to shareholders in reinvestment of dividends and distributions | | | 2,673 | | | | 25,832 | |
Shares redeemed | | | (127,879 | ) | | | (1,234,696 | ) |
| | | | | | | | |
Net increase (decrease) in shares outstanding before conversion | | | (30,848 | ) | | | (297,300 | ) |
Shares converted into Investor Class
(See Note 1) | | | 10,630 | | | | 102,581 | |
Shares converted from Investor Class
(See Note 1) | | | (6,015 | ) | | | (58,093 | ) |
| | | | | | | | |
Net increase (decrease) | | | (26,233 | ) | | $ | (252,812 | ) |
| | | | | | | | |
Year ended October 31, 2012: | | | | | | | | |
Shares sold | | | 142,557 | | | $ | 1,380,240 | |
Shares issued to shareholders in reinvestment of dividends and distributions | | | 3,871 | | | | 37,397 | |
Shares redeemed | | | (135,227 | ) | | | (1,309,079 | ) |
| | | | | | | | |
Net increase (decrease) in shares outstanding before conversion | | | 11,201 | | | | 108,558 | |
Shares converted into Investor Class
(See Note 1) | | | 17,446 | | | | 169,041 | |
Shares converted from Investor Class
(See Note 1) | | | (4,850 | ) | | | (46,701 | ) |
| | | | | | | | |
Net increase (decrease) | | | 23,797 | | | $ | 230,898 | |
| | | | | | | | |
| | |
| | | | | | | | |
Class A | | Shares | | | Amount | |
Six-month period ended April 30, 2013: | | | | | | | | |
Shares sold | | | 599,189 | | | $ | 5,769,635 | |
Shares issued to shareholders in reinvestment of dividends and distributions | | | 17,200 | | | | 165,644 | |
Shares redeemed | | | (1,111,396 | ) | | | (10,701,916 | ) |
| | | | | | | | |
Net increase (decrease) in shares outstanding before conversion | | | (495,007 | ) | | | (4,766,637 | ) |
Shares converted into Class A
(See Note 1) | | | 6,034 | | | | 58,093 | |
Shares converted from Class A
(See Note 1) | | | (10,663 | ) | | | (102,581 | ) |
| | | | | | | | |
Net increase (decrease) | | | (499,636 | ) | | $ | (4,811,125 | ) |
| | | | | | | | |
Year ended October 31, 2012: | | | | | | | | |
Shares sold | | | 2,316,804 | | | $ | 22,339,918 | |
Shares issued to shareholders in reinvestment of dividends and distributions | | | 33,843 | | | | 326,094 | |
Shares redeemed | | | (2,362,701 | ) | | | (22,818,629 | ) |
| | | | | | | | |
Net increase (decrease) in shares outstanding before conversion | | | (12,054 | ) | | | (152,617 | ) |
Shares converted into Class A (See Note 1) | | | 4,865 | | | | 46,701 | |
Shares converted from Class A (See Note 1) | | | (17,487 | ) | | | (169,041 | ) |
| | | | | | | | |
Net increase (decrease) | | | (24,676 | ) | | $ | (274,957 | ) |
| | | | | | | | |
| | | | |
| mainstayinvestments.com | | | 25 | |
Notes to Financial Statements (Unaudited) (continued)
| | | | | | | | |
Class I | | Shares | | | Amount | |
Six-month period ended April 30, 2013: | | | | | | | | |
Shares sold | | | 1,757,903 | | | $ | 16,934,200 | |
Shares issued to shareholders in reinvestment of dividends and distributions | | | 43,976 | | | | 423,468 | |
Shares redeemed | | | (1,621,584 | ) | | | (15,624,857 | ) |
| | | | | | | | |
Net increase (decrease) | | | 180,295 | | | $ | 1,732,811 | |
| | | | | | | | |
Year ended October 31, 2012: | | | | | | | | |
Shares sold | | | 3,135,776 | | | $ | 30,305,998 | |
Shares issued to shareholders in reinvestment of dividends and distributions | | | 75,715 | | | | 729,783 | |
Shares redeemed | | | (2,864,506 | ) | | | (27,660,164 | ) |
| | | | | | | | |
Net increase (decrease) | | | 346,985 | | | $ | 3,375,617 | |
| | | | | | | | |
Note 9–Subsequent Events
In connection with the preparation of the financial statements of the Fund as of and for the six-month period ended April 30, 2013, events and transactions subsequent to April 30, 2013, through the date the financial statements were issued have been evaluated by the Fund’s management for possible adjustment and/or disclosure. No subsequent events requiring financial statement adjustment or disclosure have been identified.
| | |
| 26 | | MainStay Short Term Bond Fund |
Board Consideration and Approval of Management Agreement and
Subadvisory Agreement (Unaudited)
Section 15(c) of the Investment Company Act of 1940, as amended (the “1940 Act”) requires that each mutual fund’s board of trustees, including a majority of the independent trustees, annually review and approve the fund’s investment advisory agreements. At its December 10-12, 2012 meeting, the Board of Trustees of the MainStay Group of Funds (“Board”) unanimously approved the Management Agreement with respect to the MainStay Short Term Bond Fund (“Fund”) and New York Life Investment Management LLC (“New York Life Investments”), and the Subadvisory Agreement between New York Life Investments and MacKay Shields LLC (“MacKay Shields”) with respect to the Fund.
In reaching its decision to approve the Agreements, the Board considered information furnished by New York Life Investments and MacKay Shields in connection with a contract review process that took place at various meetings of the Board and its Contracts Committee between September 2012 and December 2012, as well as other relevant information furnished to the Board throughout the year by New York Life Investments and MacKay Shields. Information requested by and furnished to the Board in connection with the contract review process included, among other items, reports on the Fund prepared by Strategic Insight Mutual Fund Research and Consulting, LLC (“Strategic Insight”), an independent third-party service provider engaged by the Board to report objectively on the Fund’s investment performance, management and subadvisory fees and ordinary operating expenses. The Board also considered information provided by New York Life Investments and MacKay Shields on the fees charged to other investment advisory clients (including institutional separate accounts) that follow investment strategies similar to the Fund, and the rationale for any differences in the Fund’s management and subadvisory fees and the fees charged to those other investment advisory clients. In addition, the Board requested and received information on the profitability of the Fund to New York Life Investments and its affiliates, including MacKay Shields as subadvisor to the Fund, and responses from New York Life Investments and MacKay Shields to a series of questions encompassing a variety of topics prepared on behalf of the Board by independent legal counsel to the Board and its independent trustees (the “Independent Trustees”). Information provided to the Board at its meetings throughout the year included, among other items, detailed investment performance reports on the Fund prepared by the Investment Consulting Group at New York Life Investments. The structure and format for this regular reporting was developed in consultation with the Board. The Board also received from New York Life Investments throughout the year, among other items, periodic reports on legal and compliance matters, portfolio turnover, and sales and marketing activity.
In determining to approve the Agreements, the members of the Board reviewed and evaluated all of the information and factors they believed to be relevant and appropriate in light of legal advice furnished to them by independent legal counsel and through the exercise of their own business judgment. The broad factors considered by the Board are discussed in greater detail below, and included, among other items: (i) the nature, scope and quality of the services provided to the Fund by New York Life Investments and MacKay Shields; (ii) the investment performance of the Fund, New York Life Investments and MacKay Shields; (iii) the costs of the services provided, and profits realized, by New York Life Investments and MacKay Shields from their relationship with the Fund; (iv) the extent to which economies of scale may be realized as the Fund grows, and the extent to which economies of scale
may benefit Fund investors; and (v) the reasonableness of the Fund’s management and subadvisory fees and overall total ordinary operating expenses, particularly as compared to similar funds and accounts managed by New York Life Investments and MacKay Shields and third-party “peer funds” identified by Strategic Insight.
While individual members of the Board may have weighed certain factors differently, the Board’s decision to approve the Agreements was based on a consideration of all the information provided to the Board, including information provided to the Board throughout the year and specifically in connection with the contract review process. The Board’s conclusions with respect to the Agreements also were based, in part, on the Board’s consideration of the Agreements in prior years. In addition to considering the above-referenced factors, the Board observed that in the marketplace there are a range of investment options available to shareholders of the Fund, and that the Fund’s shareholders, having had the opportunity to consider other investment options, have chosen to invest in the Fund. A more detailed discussion of the factors that figured prominently in the Board’s decisions to approve the Agreements is provided below.
Nature, Scope and Quality of Services to Be Provided by New York Life Investments and MacKay Shields
The Board examined the nature, scope and quality of the services that New York Life Investments provides to the Fund. The Board evaluated New York Life Investments’ experience in serving as manager of the Fund, noting that New York Life Investments manages other mutual funds, serves a variety of other investment advisory clients, including other pooled investment vehicles, and has experience with overseeing mutual fund service providers, including subadvisors. The Board considered the experience of senior personnel at New York Life Investments providing management and administrative services to the Fund, as well as New York Life Investments’ reputation and financial condition. The Board also considered the full range of non-advisory services that New York Life Investments supplies to the Fund under the terms of the Management Agreement, including: (i) fund accounting services provided by New York Life Investments’ Fund Accounting and Administration Group; (ii) investment oversight and analytical services provided by New York Life Investments’ Investment Consulting Group; (iii) compliance services provided by New York Life Investments’ compliance department, including oversight and implementation of the Fund’s compliance program; and (iv) legal services provided by New York Life Investments’ Office of the General Counsel. Additional information about the non-advisory services provided by New York Life Investments is set forth in the Fund’s Management Agreement. The Board also considered New York Life Investments’ willingness to invest in personnel that benefit the Fund, and noted that New York Life Investments is responsible for compensating the Fund’s officers. The Board also considered benefits to shareholders of being part of the MainStay Group of Funds, including the privilege of exchanging investments between the same class of shares without the imposition of a sales charge, as described more fully in the Fund’s prospectus.
The Board also examined the nature, scope and quality of the advisory services that MacKay Shields provides to the Fund. The Board evaluated MacKay Shields’ experience in serving as subadvisor to the Fund and managing other portfolios. It examined MacKay Shields’ track record
| | | | |
| mainstayinvestments.com | | | 27 | |
Board Consideration and Approval of Management Agreement and
Subadvisory Agreement (Unaudited) (continued)
and experience in providing investment advisory services, the experience of investment advisory, senior management and administrative personnel atMacKay Shields, and MacKay Shields’ overall legal and compliance environment. The Board also reviewed MacKay Shields’ willingness to invest in personnel that benefit the Fund. In this regard, the Board considered the experience of the Fund’s portfolio managers, the number of accounts managed by the portfolio managers and the method for compensating portfolio managers.
Based on these considerations, the Board concluded, within the context of its overall determinations regarding the Agreements, that the Fund should continue to benefit from the nature, scope and quality of these services as a result of New York Life Investments’ and MacKay Shields’ experience, personnel, operations and resources.
Investment Performance
In evaluating the Fund’s investment performance, the Board considered investment performance results in light of the Fund’s investment objective, strategies and risks, as disclosed in the Fund’s prospectus. The Board particularly considered detailed investment reports on the Fund’s performance provided to the Board throughout the year by the Investment Consulting Group of New York Life Investments. These reports include, among other items, information on the Fund’s gross and net returns, the Fund’s investment performance relative to relevant investment categories and Fund benchmarks, the Fund’s risk-adjusted investment performance, and the Fund’s investment performance as compared to similar competitor funds, as appropriate. The Board also considered information provided by Strategic Insight showing the investment performance of the Fund as compared to peer funds.
In considering the Fund’s investment performance, the Board focused principally on the Fund’s long-term performance track record. The Board also gave weight to its ongoing discussions with senior management at New York Life Investments concerning the Fund’s investment performance, as well as discussions between the Fund’s portfolio managers and the Board that occur typically on an annual basis. In addition, the Board considered any specific actions that New York Life Investments or MacKay Shields had taken, or had agreed with the Board to take, to enhance Fund investment performance, and the results of those actions.
Based on these considerations, the Board concluded, within the context of its overall determinations regarding the Agreements, that the long-term investment performance of the Fund, along with ongoing efforts by New York Life Investments and MacKay Shields to enhance investment returns, supported a determination to approve the Agreements. The Fund discloses more information about investment performance in the Portfolio Management Discussion and Analysis, Investment and Performance Comparison and Financial Highlights sections of this Semiannual Report and in the Fund’s prospectus.
Costs of the Services Provided, and Profits Realized, by New York Life Investments and MacKay Shields
The Board considered the costs of the services provided by New York Life Investments and MacKay Shields under the Agreements, and the profits realized by New York Life Investments and its affiliates, including MacKay Shields, due to their relationships with the Fund. Because
MacKay Shields is an affiliate of New York Life Investments whose subadvisory fees are paid directly by New York Life Investments, the Board considered cost and profitability information for New York Life Investments and MacKay Shields in the aggregate.
In evaluating the costs and profits of New York Life Investments and its affiliates, including MacKay Shields, the Board considered, among other factors, each party’s investments in personnel, systems, equipment and other resources necessary to manage the Fund, and that New York Life Investments is responsible for paying the subadvisory fees for the Fund. The Board acknowledged that New York Life Investments and MacKay Shields must be in a position to pay and retain experienced professional personnel to provide services to the Fund, and that the ability to maintain a strong financial position is important in order for New York Life Investments and MacKay Shields to continue to provide high-quality services to the Fund. The Board also noted that the Fund benefits from the allocation of certain fixed costs across the MainStay Group of Funds.
In addition, the Board noted the difficulty in obtaining reliable comparative data about mutual fund managers’ profitability, since such information generally is not publicly available and may be impacted by numerous factors, including the structure of a fund manager’s organization, the types of funds it manages, the methodology used to allocate certain fixed costs to specific funds, and the manager’s capital structure and costs of capital. While recognizing the difficulty in evaluating a manager’s profitability with respect to the Fund, and noting that other profitability methodologies may also be reasonable, the Board concluded that the profitability methodology presented by New York Life Investments to the Board, which was developed by New York Life Investments in consultation with an independent consultant, was reasonable in all material respects.
In considering the costs and profitability of the Fund, the Board also considered certain fall-out benefits that may be realized by New York Life Investments and its affiliates due to their relationships with the Fund.
The Board further considered that, in addition to fees earned by New York Life Investments for managing the Fund, New York Life Investments’ affiliates also earn revenues from serving the Fund in various other capacities, including as the Fund’s transfer agent and distributor. The Board observed that information about these other revenues, and their impact on the profitability of the Fund to New York Life Investments and its affiliates, was furnished to the Board as part of the 15(c) process. The Board noted that, although it assessed the overall profitability of the Fund to New York Life Investments and its affiliates as part of the contract review process, when considering the reasonableness of the fees to be paid to New York Life Investments and its affiliates under the Agreements, the Board considered the profitability of New York Life Investments’ relationship with the Fund on a pre-tax basis, and without regard to distribution expenses.
After evaluating the information presented to the Board, the Board concluded, within the context of its overall determinations regarding the Agreements, that any profits realized by New York Life Investments and its affiliates, including MacKay Shields, due to their relationships with the Fund supported the Board’s decision to approve the Agreements.
| | |
| 28 | | MainStay Short Term Bond Fund |
Extent to Which Economies of Scale May Be Realized as the Fund Grows
The Board also considered whether the Fund’s expense structure permitted economies of scale to be shared with Fund investors. The Board reviewed information from New York Life Investments showing how the Fund’s management fee schedule compared to fee schedules of other funds and accounts managed by New York Life Investments. The Board also reviewed information from Strategic Insight showing how the Fund’s management fee schedule hypothetically would compare with fees paid for similar services by peer funds at varying asset levels. While recognizing the difficulty of determining economies of scale with precision, the Board acknowledged that economies of scale may be shared with the Fund in a number of ways, including, for example, through the imposition of management fee breakpoints and by initially setting relatively lower management fees.
Based on this information, the Board concluded, within the context of its overall determinations regarding the Agreements, that the Fund’s expense structure appropriately reflects economies of scale for the benefit of Fund investors. The Board noted, however, that it would continue to evaluate the reasonableness of the Fund’s expense structure as the Fund grows over time.
Management and Subadvisory Fees and Total Ordinary Operating Expenses
The Board evaluated the reasonableness of the fees to be paid under the Agreements and the Fund’s expected total ordinary operating expenses. The Board primarily considered the reasonableness of the management fee paid by the Fund to New York Life Investments, since the fees paid to MacKay Shields are paid by New York Life Investments, not the Fund.
In assessing the reasonableness of the Fund’s fees and expenses, the Board primarily considered comparative data provided by Strategic Insight on the fees and expenses charged by similar mutual funds managed by other investment advisers. In addition, the Board considered information provided by New York Life Investments and MacKay Shields on fees charged to other investment advisory clients, including institutional separate accounts and other funds with similar investment objectives as the Fund. The Board particularly considered differences in the contractual management fee schedules of the retail MainStay Funds and similarly-managed MainStay VP Portfolios, taking into account New York Life Investments’ rationale for any differences in fee schedules. The Board also took into account explanations provided by New York Life Investments about the different scope of services provided to mutual funds as compared with other investment advisory clients. Additionally, the Board considered the impact of any expense limitation arrangements on the Fund’s net management fee and expenses. In addition, the Board negotiated a modification of the Fund’s contractual expense limitation arrangements to increase the subsidization of the Fund’s expenses by New York Life Investments.
The Board noted that, outside of the Fund’s management fee and the fees charged under a share class’s Rule 12b-1 and/or shareholder services plans, a share class’s most significant “other expenses” are transfer agent fees. Transfer agent fees are charged to the Fund based on the number of shareholder accounts (a “per-account” fee) as compared with certain other fees (e.g., management fees), which are
charged based on the Fund’s average net assets. The Board took into account information from New York Life Investments showing that the Fund’s transfer agent fee schedule is reasonable, including industry data showing that the per-account fees that NYLIM Service Company LLC, the Fund’s transfer agent, charges the Fund are within the range of per-account fees charged by transfer agents to other mutual funds. In addition, the Board considered NYLIM Service Company LLC’s profitability in connection with the transfer agent services it provides to the Fund.
The Board acknowledged that, because the Fund’s transfer agent fees are billed on a per-account basis, the impact of transfer agent fees on a share class’s expense ratio may be more significant in cases where the share class has a high number of accounts with limited assets (i.e., small accounts). The Board observed that transfer agent fees are a significant portion of total expenses of many Funds in the MainStay Group of Funds. The impact of transfer agent fees on the expense ratios of these MainStay Funds tend to be greater than for other open-end retail funds, because the MainStay Group of Funds generally has a significant number of small accounts relative to competitor funds. The Board acknowledged the role that the MainStay Group of Funds historically has played in serving the investment needs of New York Life Insurance Company (“New York Life”) policyholders, who often maintain smaller account balances than other fund investors. The Board discussed measures that it and New York Life Investments have taken in recent years to mitigate the effect of small accounts on the expense ratios of Fund share classes, including: (i) encouraging New York Life agents to consolidate multiple small accounts held by the same investor into one MainStay Asset Allocation Fund account; (ii) increasing investment minimums from $500 to $1,000 in 2003; (iii) introducing Investor Class shares for certain MainStay Funds in early 2008 to consolidate smaller account investors; (iv) closing small accounts with balances below $250 in Investor Class shares or $750 in all other classes of shares; (v) no longer allowing an exception with no minimum investment amount with respect to AutoInvest accounts with subsequent monthly purchases of $100; (vi) since 2007, charging an annual $20.00 small account fee on certain accounts with balances below $1,000; and (vii) modifying the approach for billing transfer agent expenses to reduce the degree of subsidization by large accounts of smaller accounts. In addition, the Board acknowledged New York Life Investments’ efforts to encourage intermediaries to consolidate small accounts in multiple Funds held by the same investor into a single Asset Allocation Fund account, if appropriate under the circumstances, in an effort to mitigate the effect of small accounts on the Funds in the MainStay Group of Funds.
After considering all of the factors outlined above, the Board concluded that the Fund’s management and subadvisory fees and total ordinary operating expenses were within a range that is competitive and, within the context of the Board’s overall conclusions regarding the Agreements, support a conclusion that these fees and expenses are reasonable.
Conclusion
On the basis of the information provided to it and its evaluation thereof, the Board, including the Independent Trustees, unanimously voted to approve the Agreements.
| | | | |
| mainstayinvestments.com | | | 29 | |
Proxy Voting Policies and Procedures and Proxy Voting Record
A description of the policies and procedures that New York Life Investments uses to vote proxies related to the Fund’s securities is available without charge, upon request, (i) by visiting the Fund’s website at mainstayinvestments.com; and (ii) on the Securities and Exchange Commission’s (SEC) website at www.sec.gov.
The Fund is required to file with the SEC its proxy voting record for the 12-month period ending June 30 on Form N-PX. The Fund’s most recent Form N-PX is available free of charge upon request by calling 800-MAINSTAY (624-6782); visiting the Fund’s website at mainstayinvestments.com; or on the SEC’s website at www.sec.gov.
Shareholder Reports and Quarterly Portfolio Disclosure
The Fund is required to file its complete schedule of portfolio holdings with the SEC for its first and third fiscal quarters on Form N-Q. The Fund’s Form N-Q is available without charge, on the SEC’s website at www.sec.gov or by calling MainStay Investments at
800-MAINSTAY (624-6782). You also can obtain and review copies of Form N-Q by visiting the SEC’s Public Reference Room in Washington, DC (information on the operation of the Public Reference Room may be obtained by calling 1-800-SEC-0330).
| | |
| 30 | | MainStay Short Term Bond Fund |
MainStay Funds
MainStay offers a wide range of Funds for virtually any investment need. The full array of MainStay open-end offerings is listed here, with information about the manager, subadvisors, legal counsel and independent registered public accounting firms.
Equity
U.S. Equity Funds
MainStay Common Stock Fund
MainStay Cornerstone Growth Fund
MainStay Epoch U.S. All Cap Fund
MainStay Epoch U.S. Equity Yield Fund
MainStay ICAP Equity Fund
MainStay ICAP Select Equity Fund
MainStay Large Cap Growth Fund1
MainStay MAP Fund
MainStay S&P 500 Index Fund
MainStay U.S. Equity Opportunities Fund
MainStay U.S. Small Cap Fund
International/Global Equity Funds
MainStay Epoch Global Choice Fund
MainStay Epoch Global Equity Yield Fund
MainStay Epoch International Small Cap Fund
MainStay ICAP Global Fund
MainStay ICAP International Fund
MainStay International Equity Fund
MainStay International Opportunities Fund
Income
Taxable Bond Funds
MainStay Floating Rate Fund
MainStay Global High Income Fund
MainStay Government Fund
MainStay High Yield Corporate Bond Fund
MainStay High Yield Opportunities Fund
MainStay Indexed Bond Fund
MainStay Intermediate Term Bond Fund
MainStay Short Duration High Yield Fund
MainStay Short Term Bond Fund
MainStay Unconstrained Bond Fund
Municipal Bond Funds
MainStay California Tax Free Opportunities Fund2
MainStay High Yield Municipal Bond Fund
MainStay New York Tax Free Opportunities Fund3
MainStay Tax Free Bond Fund
Money Market Fund
MainStay Money Market Fund
Mixed Asset
MainStay Balanced Fund
MainStay Convertible Fund
MainStay Income Builder Fund
MainStay Marketfield Fund
Asset Allocation/Target Date
MainStay Conservative Allocation Fund
MainStay Growth Allocation Fund
MainStay Moderate Allocation Fund
MainStay Moderate Growth Allocation Fund
MainStay Retirement 2010 Fund
MainStay Retirement 2020 Fund
MainStay Retirement 2030 Fund
MainStay Retirement 2040 Fund
MainStay Retirement 2050 Fund
Manager
New York Life Investment Management LLC
New York, New York
Subadvisors
Cornerstone Capital Management Holdings LLC4
New York, New York
Cornerstone Capital Management LLC4
Bloomington, Minnesota
Epoch Investment Partners, Inc.
New York, New York
Institutional Capital LLC4
Chicago, Illinois
MacKay Shields LLC4
New York, New York
Marketfield Asset Management LLC
New York, New York
Markston International LLC
White Plains, New York
Winslow Capital Management LLC
Minneapolis, Minnesota
Legal Counsel
Dechert LLP
Independent Registered Public Accounting Firms
KPMG LLP
PricewaterhouseCoopers LLP
1. Effective January 13, 2012, the Fund was closed to new investors with certain exceptions.
2. This Fund is only registered for sale in AZ, CA, NV, OR, UT, and WA.
3. This Fund is only registered for sale in CT, DE, FL, MA, NJ, NY, and VT.
4. An affiliate of New York Life Investment Management LLC.
Not part of the Semiannual Report
For more information
800-MAINSTAY (624-6782)
mainstayinvestments.com
The MainStay Funds® are managed by New York Life Investment Management LLC and distributed through NYLIFE Distributors LLC, 169 Lackawanna Avenue, Parsippany, NJ 07054, a wholly owned subsidiary of New York Life Insurance Company. NYLIFE Distributors LLC is a Member FINRA/SIPC.
MainStay Investments® is a registered service mark and name under which New York Life Investment Management LLC does business. MainStay Investments, an indirect subsidiary of New York Life Insurance Company, New York, NY 10010, provides investment advisory products and services.
This report may be distributed only when preceded or accompanied by a current Fund prospectus.
©2013 NYLIFE Distributors LLC. All rights reserved.
| | | | | | | | |
| Not FDIC/NCUA Insured | | Not a Deposit | | May Lose Value | | No Bank Guarantee | | Not Insured by Any Government Agency |
| | |
| NYLIM-30290 MS175-13 | | MSSB10-06/13 NL0B5 |
MainStay U.S. Equity Opportunities Fund
Message from the President and Semiannual Report
Unaudited | April 30, 2013


This page intentionally left blank
Message from the President
The U.S. stock market advanced during the six months ended April 30, 2013, generally providing double-digit returns at all capitalization levels. Value stocks tended to outpace growth stocks among large- and mid-capitalization companies, while growth stocks tended to outpace value stocks among smaller companies.
The market’s advance, however, was far from uniform. Stocks declined in early November, both before and immediately after the U.S. presidential election. Following a sharp recovery, stocks climbed until mid-December, when a Congressional stalemate on the fiscal cliff led to a brief decline. Another dip occurred in late February as investors speculated that the Federal Open Market Committee (FOMC) might stop purchasing mortgage-backed securities sooner than expected. Stocks also dipped in mid-April, as consumer sentiment dropped after the Boston marathon bombing. Despite these setbacks, U.S. stocks continued to trend upward during the six-month reporting period.
International stock markets also advanced, with several regional differences. Accommodative action by the Bank of Japan helped lower the yen and lift Japanese stocks to their highest levels since 2008. In Europe, stocks did well until early February, bolstered by the promise of support for the euro. As the year progressed, however, economic contraction, rising unemployment and systematic banking concerns took a toll on investor enthusiasm. In China, manufacturing slowed as the nation sought to balance growth and inflation risks. On the Korean peninsula, tensions rose as North Korea continued to threaten its neighbors, which added an undercurrent of caution to the market.
During the six months ended April 30, 2013, the FOMC kept the federal funds rate in a range close to zero. The FOMC also continued its direct purchases of mortgage-backed securities and longer-term U.S. government securities. With short-term interest rates likely to remain at low levels, many bond investors pursued higher yields by lengthening maturities and assuming greater risk. As a result, bonds with higher risk profiles tended
to outperform higher-quality investment-grade bonds and U.S. Treasury securities. Cash and cash equivalents essentially returned zero.
With wide variations in the performance of various asset classes, some investors might be tempted to chase higher returns by shifting back and forth between stocks and bonds. Since no one can predict where the market will move next, however, we encourage investors to select an appropriate mix of investments for their risk tolerance and time horizon and to stick with that mix, making only minor adjustments over time.
At MainStay Funds, our portfolio managers use a similar approach. Careful security selection and thoughtful sell disciplines help them pursue the investment objectives of their respective Funds. Using the principal investment strategies outlined in the Prospectus, they focus primarily on providing long-term investment potential for our shareholders.
Has this approach proved successful? In its most recent rankings, Barron’s listed MainStay Funds as the #1 fund family over the past 10 years. We were also the only mutual fund family that has appeared in Barron’s top six for the past five consecutive years.
The pages that follow provide additional insight into the specific market events, investment decisions and securities that shaped your MainStay Fund(s) during the six months ended April 30, 2013. We encourage you to read the semiannual report(s) carefully and to evaluate your results with your long-term financial goals in mind.
Sincerely,

Stephen P. Fisher
President
The opinions expressed are as of the date of this report and are subject to change. There is no guarantee that any forecast made will come to pass. This material does not constitute investment advice and is not intended as an endorsement of any specific investment.
To qualify for the Lipper/Barron’s Fund Survey, a fund family must have at least three funds in Lipper’s general U.S.-stock category, one in world equity (which combines global and international funds), one mixed-equity fund (which holds stocks and bonds), two taxable-bond funds, and one tax-exempt fund. Fund loads and 12b-1 fees aren’t included in the calculation of returns because the aim is to measure the manager’s skill. Each fund’s return is measured against all funds in its Lipper category, resulting in a percentile ranking which is then weighted by asset size relative to the fund family’s other assets in its general classifications. Finally, the score is multiplied by the general classification weightings as determined by the entire Lipper universe of funds.
Source: Barron’s, 2/9/13. Overall, MainStay Funds ranked number 56 for the one-year period, 20 for the five-year period and one for the 10-year period ended December 31, 2012, out of 62, 53 and 46 fund families, respectively. MainStay ranked number three for the 10-year period in 2009, 2010 and 2011 from among 48, 46 and 45 fund families, respectively. MainStay ranked number six from among 48 fund families for the 10-year period in 2008. Past performance is no guarantee of future results, which will vary. For the most recent MainStay Funds performance, please visit our website at mainstayinvestments.com. All mutual funds are subject to market risk and will fluctuate in value.
Not part of the Semiannual Report
Table of Contents
Investors should refer to each Fund’s Summary Prospectus and/or Prospectus and consider each Fund’s investment objectives, strategies, risks, charges and expenses carefully before investing. The Summary Prospectus and/or Prospectus contain this and other information.
You may obtain copies of each Fund’s Summary Prospectus, Prospectus and Statement of Additional Information free of charge, upon request, by calling toll-free 800-MAINSTAY (624-6782), by writing to NYLIFE Distributors LLC, Attn: MainStay Marketing Department, 169 Lackawanna Avenue, Parsippany, New Jersey 07054 or by sending an e-mail to MainStayShareholderServices@nylim.com. These documents are also available via the MainStay Funds’ website at mainstayinvestments.com/documents. Please read each Fund’s
Summary Prospectus and/or Prospectus carefully before investing.
Investment and Performance Comparison1 (Unaudited)
Performance data quoted represents past performance. Past performance is no guarantee of future results. Because of market volatility, current performance may be lower or higher than the figures shown. Investment return and principal value will fluctuate, and as a result, when shares are redeemed, they may be worth more or less than their original cost. The graph below depicts the historical performance of Class I shares of the Fund. Performance will vary from class to class based on differences in class-specific expenses and sales charges. For performance information current to the most recent month-end, please call 800-MAINSTAY (624-6782) or visit mainstayinvestments.com.
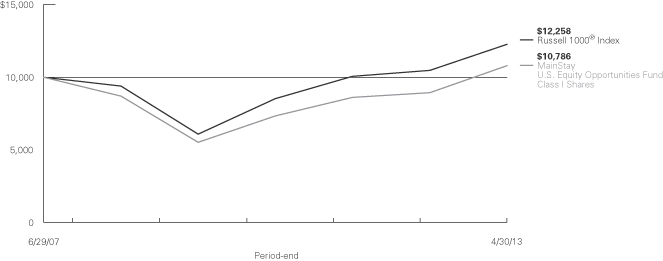
Average Annual Total Returns for the Period Ended April 30, 2013
| | | | | | | | | | | | | | | | | | | | | | | | |
| Class | | Sales Charge | | | | Six Months | | | One Year | | | Five Years | | | Since
Inception
(6/29/07) | | | Gross
Expense
Ratio2 | |
| Investor Class Shares3 | | Maximum 5.5% Initial Sales Charge | | With sales charges Excluding sales charges | |
| 10.43
16.86 | %
| |
| 13.45
20.06 | %
| |
| 2.74
3.91 | %
| |
| –0.11
0.86 | %
| |
| 2.63
2.63 | %
|
| Class A Shares | | Maximum 5.5% Initial Sales Charge | | With sales charges Excluding sales charges | |
| 10.62
17.06 |
| |
| 13.92
20.55 |
| |
| 2.98
4.15 |
| |
| 0.10
1.07 |
| |
| 2.37
2.37 |
|
| Class C Shares | | Maximum 1% CDSC if Redeemed Within One Year of Purchase | | With sales charges Excluding sales charges | |
| 15.37
16.37 |
| |
| 18.22
19.22 |
| |
| 3.14
3.14 |
| |
| 0.10
0.10 |
| |
| 3.38
3.38 |
|
| Class I Shares | | No Sales Charge | | | | | 17.19 | | | | 20.82 | | | | 4.42 | | | | 1.30 | | | | 2.14 | |
| 1. | The performance table and graph do not reflect the deduction of taxes that a shareholder would pay on dividends, distributions or Fund share redemptions. Total returns reflect maximum applicable sales charges as indicated in the table above, changes in share price, and reinvestment of dividends and capital gain distributions. The graph assumes the initial investment amount shown above and reflects the deduction of all sales charges that would have applied for the period of investment. Performance figures reflect certain fee waivers and/or expense limitations, without which total returns may have been lower. For more information on share classes and current fee waivers and/or expense limitations, please refer to the notes to the financial statements. |
| 2. | The gross expense ratios presented reflect the Fund’s “Total Annual Fund Operating Expenses” from the most recent Prospectus and may differ from other expense ratios disclosed in this report. |
| 3. | Performance figures for Investor Class shares, first offered on February 28, 2008, include the historical performance of Class A shares through February 27, 2008, adjusted for differences in certain expenses and fees. Unadjusted, the performance shown for Investor Class shares would likely have been different. |
The footnotes on the next page are an integral part of the table and graph and should be carefully read in conjunction with them.
| | | | |
| mainstayinvestments.com | | | 5 | |
| | | | | | | | | | | | | | |
| Benchmark Performance | | Six Months | | One
Year | | | Five
Years | | | Since
Inception | |
Russell 1000® Index4 | | 15.05% | | | 17.17 | % | | | 5.49 | % | | | 3.55 | % |
Average Lipper Extended U.S. Large-Cap Core Fund5 | | 14.51 | | | 16.77 | | | | 2.51 | | | | 1.78 | |
| 4. | The Russell 1000® Index measures the performance of the large-cap segment of the U.S. equity universe. It is a subset of the Russell 3000® Index and includes approximately 1,000 of the largest securities based on a combination of their market cap and current index membership. The Russell 1000® Index represents approximately 92% of the U.S. market. The Russell 1000® Index is the Fund’s broad-based securities market index for comparison purposes. Total returns assume reinvestment of all dividends and capital gains. An investment cannot be made directly in an index. |
| 5. | The average Lipper extended U.S. large-cap core fund is representative of funds that combine long and short stock selection to invest in a diversified portfolio of U.S. large-cap equities, with a target net exposure of 100% long. Typical strategies vary between 110% long and 10% short to 160% long and 60% short. This benchmark is a product of Lipper Inc. Lipper Inc. is an independent monitor of fund performance. Results are based on average total returns of similar funds with all dividend and capital gain distributions reinvested. |
The footnotes on the preceding page are an integral part of the table and graph and should be carefully read in conjunction with them.
| | |
| 6 | | MainStay U.S. Equity Opportunities Fund |
Cost in Dollars of a $1,000 Investment in MainStay U.S. Equity Opportunities Fund (Unaudited)
The example below is intended to describe the fees and expenses borne by shareholders during the six-month period from November 1, 2012, to April 30, 2013, and the impact of those costs on your investment.
Example
As a shareholder of the Fund, you incur two types of costs: (1) transaction costs, including exchange fees and sales charges (loads) on purchases (as applicable), and (2) ongoing costs, including management fees, distribution and/or service (12b-1) fees, and other Fund expenses (as applicable). This example is intended to help you understand your ongoing costs (in dollars) of investing in the Fund and to compare these costs with the ongoing costs of investing in other mutual funds. The example is based on an investment of $1,000 made at the beginning of the six-month period and held for the entire period from November 1, 2012, to April 30, 2013.
This example illustrates your Fund’s ongoing costs in two ways:
Actual Expenses
The second and third data columns in the table below provide information about actual account values and actual expenses. You may use the information in these columns, together with the amount you invested, to estimate the expenses that you paid during the six months ended April 30, 2013. Simply divide your account value by $1,000 (for example, an $8,600 account value divided by $1,000 = 8.6), then
multiply the result by the number under the heading entitled “Expenses Paid During Period” to estimate the expenses you paid on your account during this period.
Hypothetical Example for Comparison Purposes
The fourth and fifth data columns in the table below provide information about hypothetical account values and hypothetical expenses based on the Fund’s actual expense ratio and an assumed rate of return of 5% per year before expenses, which is not the Fund’s actual return. The hypothetical account values and expenses may not be used to estimate the actual ending account balances or expenses you paid for the six-month period shown. You may use this information to compare the ongoing costs of investing in the Fund with the ongoing costs of investing in other Funds. To do so, compare this 5% hypothetical example with the 5% hypothetical examples that appear in the shareholder reports of the other Funds.
Please note that the expenses shown in the table are meant to highlight your ongoing costs only and do not reflect any transactional costs, such as exchange fees or sales charges (loads). Therefore, the fourth and fifth data columns of the table are useful in comparing ongoing costs only and will not help you determine the relative total costs of owning different funds. In addition, if these transactional costs were included, your costs would have been higher.
| | | | | | | | | | | | | | | | | | | | |
| | | | | | | | | | | | | | | | |
| Share Class | | Beginning
Account
Value
11/1/12 | | | Ending Account
Value (Based
on Actual
Returns and
Expenses)
4/30/13 | | | Expenses
Paid
During
Period1 | | | Ending Account
Value (Based
on Hypothetical
5% Annualized
Return and
Actual Expenses)
4/30/13 | | | Expenses
Paid
During
Period1 | |
| | | | | |
| Investor Class Shares | | $ | 1,000.00 | | | $ | 1,168.60 | | | $ | 14.41 | | | $ | 1,011.50 | | | $ | 13.37 | |
| | | | | |
| Class A Shares | | $ | 1,000.00 | | | $ | 1,170.60 | | | $ | 12.92 | | | $ | 1,012.90 | | | $ | 11.98 | |
| | | | | |
| Class C Shares | | $ | 1,000.00 | | | $ | 1,163.70 | | | $ | 18.51 | | | $ | 1,007.70 | | | $ | 17.17 | |
| | | | | |
| Class I Shares | | $ | 1,000.00 | | | $ | 1,171.90 | | | $ | 11.79 | | | $ | 1,013.90 | | | $ | 10.94 | |
| 1. | Expenses are equal to the Fund’s annualized expense ratio of each class (2.68% for Investor Class, 2.40% for Class A, 3.45% for Class C and 2.19% for Class I) multiplied by the average account value over the period, divided by 365 and multiplied by 181 (to reflect the six-month period). The table above represents the actual expenses incurred during the six-month period. |
| | | | |
| mainstayinvestments.com | | | 7 | |
Industry Composition as of April 30, 2013 (Unaudited)
| | | | |
| Oil, Gas & Consumable Fuels | | | 11.4 | % |
| Insurance | | | 5.9 | |
| IT Services | | | 5.6 | |
| Media | | | 5.4 | |
| Specialty Retail | | | 5.4 | |
| Biotechnology | | | 5.1 | |
| Software | | | 5.0 | |
| Pharmaceuticals | | | 4.8 | |
| Computers & Peripherals | | | 4.6 | |
| Food & Staples Retailing | | | 4.3 | |
| Food Products | | | 4.2 | |
| Internet Software & Services | | | 4.1 | |
| Commercial Banks | | | 3.4 | |
| Diversified Financial Services | | | 3.4 | |
| Diversified Telecommunication Services | | | 3.4 | |
| Chemicals | | | 3.0 | |
| Health Care Providers & Services | | | 3.0 | |
| Capital Markets | | | 2.9 | |
| Aerospace & Defense | | | 2.6 | |
| Communications Equipment | | | 2.0 | |
| Hotels, Restaurants & Leisure | | | 2.0 | |
| Airlines | | | 1.9 | |
| Electronic Equipment & Instruments | | | 1.9 | |
| Machinery | | | 1.9 | |
| Real Estate Investment Trusts | | | 1.9 | |
| Household Durables | | | 1.8 | |
| Semiconductors & Semiconductor Equipment | | | 1.8 | |
| Health Care Equipment & Supplies | | | 1.7 | |
| Beverages | | | 1.6 | |
| Internet & Catalog Retail | | | 1.6 | |
| Professional Services | | | 1.6 | |
| Road & Rail | | | 1.6 | |
| Wireless Telecommunication Services | | | 1.5 | |
| | | | |
| Personal Products | | | 1.4 | % |
| Textiles, Apparel & Luxury Goods | | | 1.4 | |
| Energy Equipment & Services | | | 1.2 | |
| Household Products | | | 1.2 | |
| Trading Companies & Distributors | | | 1.2 | |
| Commercial Services & Supplies | | | 1.1 | |
| Industrial Conglomerates | | | 1.0 | |
| Life Sciences Tools & Services | | | 1.0 | |
| Metals & Mining | | | 1.0 | |
| Independent Power Producers & Energy Traders | | | 0.9 | |
| Automobiles | | | 0.8 | |
| Exchange Traded Fund | | | 0.7 | |
| Electric Utilities | | | 0.6 | |
| Multiline Retail | | | 0.6 | |
| Diversified Consumer Services | | | 0.5 | |
| Paper & Forest Products | | | 0.5 | |
| Tobacco | | | 0.5 | |
| Construction & Engineering | | | 0.4 | |
| Auto Components | | | 0.3 | |
| Construction Materials | | | 0.3 | |
| Electrical Equipment | | | 0.3 | |
| Air Freight & Logistics | | | 0.2 | |
| Gas Utilities | | | 0.1 | |
| Building Products | | | 0.0 | ‡ |
| Consumer Finance | | | 0.0 | ‡ |
| Containers & Packaging | | | 0.0 | ‡ |
| Health Care Technology | | | 0.0 | ‡ |
| Multi-Utilities | | | 0.0 | ‡ |
| Short-Term Investment | | | 0.1 | |
| Other Assets, Less Liabilities | | | –0.1 | |
| Investments Sold Short | | | –29.5 | |
| | | | |
| | | 100.0 | % |
| | | | |
See Portfolio of Investments beginning on page 12 for specific holdings within these categories.
| ‡ | Less than one-tenth of a percent. |
| | |
| 8 | | MainStay U.S. Equity Opportunities Fund |
Top Ten Holdings as of April 30, 2013 (excluding short-term investment)
| 6. | International Business Machines Corp. |
| 10. | Verizon Communications, Inc. |
Top Five Short Positions as of April 30, 2013
| | | | |
| mainstayinvestments.com | | | 9 | |
Portfolio Management Discussion and Analysis (Unaudited)
Questions answered by Mona Patni, CFA, and Andrew Ver Planck, CFA, of Cornerstone Capital Management Holdings LLC, the Fund’s Subadvisor.
How did MainStay U.S. Equity Opportunities Fund perform relative to its peers and its benchmark during the six months ended April 30, 2013?
Excluding all sales charges, MainStay U.S. Equity Opportunities Fund returned 16.86% for Investor Class shares, 17.06% for Class A shares and 16.37% for Class C shares for the six months ended April 30, 2013. Over the same period, the Fund’s Class I shares returned 17.19%. All share classes outperformed the 14.51% return of the average Lipper1 extended U.S. large-cap core fund and the 15.05% return of the Russell 1000® Index2 for the six months ended April 30, 2013. The Russell 1000® Index is the Fund’s broad-based securities-market index. See page 5 for Fund returns with applicable sales charges.
Were there any changes to the Fund during the reporting period?
Effective January 25, 2013, Madison Square Investors LLC, the Subadvisor to the Fund, changed its name to Cornerstone Capital Management Holdings LLC. Effective February 28, 2013, the Fund changed its name from “MainStay 130/30 Core Fund” to “MainStay U.S. Equity Opportunities Fund.” Also effective February 28, 2013, changes were made to the Fund’s Principal Investment Strategy and Investment Process, Principal Risks and Non-Fundamental Investment Policy. In addition, effective February 28, 2013, Andrew Ver Planck was added as a portfolio manager of the Fund. For more information on these changes, please refer to the Prospectus dated February 28, 2013.
What factors affected the Fund’s relative performance during the reporting period?
The Fund outperformed the Russell 1000® Index during the reporting period. The Fund’s stock selection model performed well, with valuation factors contributing positively to the model’s performance. In addition, the model was successful at identifying both winning and losing stocks. In contrast, the model’s momentum factors detracted from performance during the reporting period.
During the reporting period, which sectors were the strongest positive contributors to the Fund’s relative performance and which sectors were particularly weak?
Health care, industrials and materials made the strongest sector contributions to the Fund’s performance relative to the Russell 1000® Index. (Contributions take weightings and total returns into account.) Favorable stock selection helped the Fund’s performance in all three sectors. An overweight position in health care and an underweight position in materials also contributed positively to the Fund’s relative performance.
Consumer discretionary, telecommunication services and information technology were the most substantial sector detractors from the Fund’s performance relative to the Russell 1000® Index. In all three cases, stock selection detracted from results.
During the reporting period, which individual stocks made the strongest positive contributions to the Fund’s absolute performance and which stocks detracted the most?
The strongest contributions to absolute performance came from metals & mining company Allied Nevada Gold, biotechnology company Gilead Sciences and diversified financial services company Bank of America.
A short position in Allied Nevada Gold contributed to the Fund’s absolute performance. The company’s shares have fallen fairly steadily since November 2012. In mid-January 2013, the precious-metals miner gave disappointing 2013 guidance. The company’s full quarterly report in late February added to investor pessimism, as the company increased estimates for capital expenditures. The company then announced a share sale which caused the stock to further decline.
An overweight position in Gilead Sciences was beneficial as the company extended its impressive rally, which began last year. The stock’s advance was helped by overwhelmingly positive results for the company’s experimental hepatitis C drug.
An overweight position in Bank of America aided performance as the company began to regain the confidence of investors and consumers. Since the beginning of 2013, Bank of America’s progress in resolving legacy legal issues relating back to the financial crisis has been nothing short of extraordinary. Business also improved in the first quarter of 2013 compared to the first quarter of 2012, with double-digit growth on the bank’s top and bottom lines.
The most substantial negative contributions came from computers & peripherals company Apple, food products company Green Mountain Coffee Roasters and liquefied natural gas company Cheniere Energy.
Although Apple, in which the Fund has an overweight position, has a robust product pipeline and ample opportunity to gain share in its various end markets, short product life cycles and intense competition have hurt the company’s performance.
A short position in Green Mountain Coffee Roasters was not rewarded as the company’s shares have rallied sharply since November 2012. The company’s earnings and revenue figures
| 1. | See footnote on page 6 for more information on Lipper Inc. |
| 2. | See footnote on page 6 for more information on the Russell 1000® Index. |
| | |
| 10 | | MainStay U.S. Equity Opportunities Fund |
have displayed consistent growth, which has resulted in higher prices for its shares.
A short position in Cheniere Energy was a drag on the Fund’s relative performance. The company’s share price rallied, as investors were excited about Chiniere Energy’s plans to ship gas procured locally at relatively low prices to regions where it can be sold at much higher prices.
Did the Fund make any significant purchases or sales during the reporting period?
Among the Fund’s purchases during the reporting period were shares of airline company Delta Airlines and food products company Green Mountain Coffee Roasters. Delta Air Lines has improved its profile through its acquisition of Northwest Airlines and a recent investment in Virgin Atlantic. Green Mountain Coffee Roasters has displayed consistent growth in earnings and revenues, resulting in higher share prices.
During the reporting period, we sold the Fund’s position in media company Virgin Media after news was released that the company would be acquired by Liberty Global for $16 billion in
cash and stock. We trimmed the Fund’s position in energy equipment & services company Diamond Offshore. The company has seen a declining trend in profitability, mostly because of its aging fleet of offshore rigs.
How did the Fund’s sector weightings change during the reporting period?
The sectors that saw the most substantial weighting increases relative to the Russell 1000® Index during the reporting period were industrials and consumer staples. Over the same period, the largest sector reductions were in health care and information technology.
How was the Fund positioned at the end of April 2013?
As of April 30, 2013, the Fund’s most substantially overweight sectors relative to the Russell 1000® Index were consumer staples and telecommunication services. As of the same date, the Fund’s most substantially underweight sectors relative to the Index were utilities and information technology.
The opinions expressed are those of the portfolio managers as of the date of this report and are subject to change. There is no guarantee that any forecast made will come to pass. This material does not constitute investment advice and is not intended as an endorsement of any specific investment.
| | | | |
| mainstayinvestments.com | | | 11 | |
Portfolio of Investments April 30, 2013 (Unaudited)
| | | | | | | | |
| | |
| | | Shares | | | Value | |
| | | | | | | | |
| Common Stocks 128.8%† | | | | | | | | |
Aerospace & Defense 2.6% | |
Boeing Co. (The) | | | 25,287 | | | $ | 2,311,484 | |
Engility Holdings, Inc. (a) | | | 40,454 | | | | 969,278 | |
Honeywell International, Inc. | | | 7 | | | | 515 | |
Huntington Ingalls Industries, Inc. | | | 52,950 | | | | 2,801,055 | |
Spirit AeroSystems Holdings, Inc. Class A (a) | | | 173,300 | | | | 3,464,267 | |
Textron, Inc. (b) | | | 29,981 | | | | 772,011 | |
United Technologies Corp. (b) | | | 47,048 | | | | 4,295,012 | |
| | | | | | | | |
| | | | | | | 14,613,622 | |
| | | | | | | | |
Air Freight & Logistics 0.2% | |
FedEx Corp. (b) | | | 12,031 | | | | 1,131,034 | |
United Parcel Service, Inc. Class B | | | 676 | | | | 58,028 | |
| | | | | | | | |
| | | | | | | 1,189,062 | |
| | | | | | | | |
Airlines 1.9% | |
Delta Air Lines, Inc. (a)(b) | | | 208,710 | | | | 3,577,289 | |
Republic Airways Holdings, Inc. (a) | | | 46,900 | | | | 524,811 | |
SkyWest, Inc. | | | 26,600 | | | | 380,646 | |
Southwest Airlines Co. | | | 179,770 | | | | 2,462,849 | |
United Continental Holdings, Inc. (a)(b) | | | 113,629 | | | | 3,670,217 | |
| | | | | | | | |
| | | | | | | 10,615,812 | |
| | | | | | | | |
Auto Components 0.3% | |
Cooper Tire & Rubber Co. | | | 15,500 | | | | 385,795 | |
Delphi Automotive PLC | | | 956 | | | | 44,177 | |
Goodyear Tire & Rubber Co. (The) (a)(b) | | | 92,669 | | | | 1,157,899 | |
| | | | | | | | |
| | | | | | | 1,587,871 | |
| | | | | | | | |
Automobiles 0.8% | |
General Motors Co. (a) | | | 138,128 | | | | 4,259,868 | |
| | | | | | | | |
|
Beverages 1.6% | |
Coca-Cola Co. (The) (b) | | | 99,889 | | | | 4,228,301 | |
Constellation Brands, Inc. Class A (a)(b) | | | 105 | | | | 5,182 | |
PepsiCo., Inc. (b) | | | 56,284 | | | | 4,641,742 | |
| | | | | | | | |
| | | | | | | 8,875,225 | |
| | | | | | | | |
Biotechnology 5.1% | |
Acorda Therapeutics, Inc. (a) | | | 48,600 | | | | 1,923,102 | |
Alkermes PLC (a) | | | 21,100 | | | | 645,871 | |
Amgen, Inc. (b) | | | 58,227 | | | | 6,067,836 | |
Array BioPharma, Inc. (a) | | | 296,791 | | | | 1,765,906 | |
Astex Pharmaceuticals (a) | | | 64,800 | | | | 445,824 | |
Biogen Idec, Inc. (a) | | | 2,418 | | | | 529,373 | |
Celgene Corp. (a)(b) | | | 27,583 | | | | 3,256,725 | |
Cubist Pharmaceuticals, Inc. (a) | | | 7,500 | | | | 344,400 | |
Dendreon Corp. (a) | | | 5,900 | | | | 27,789 | |
Emergent BioSolutions, Inc. (a) | | | 106,200 | | | | 1,629,108 | |
Gilead Sciences, Inc. (a)(b) | | | 108,738 | | | | 5,506,492 | |
Myriad Genetics, Inc. (a) | | | 85,802 | | | | 2,389,586 | |
| | | | | | | | |
| | |
| | | Shares | | | Value | |
| | | | | | | | |
Biotechnology (continued) | |
Spectrum Pharmaceuticals, Inc. | | | 55,600 | | | $ | 411,996 | |
United Therapeutics Corp. (a)(b) | | | 34,118 | | | | 2,278,400 | |
Vertex Pharmaceuticals, Inc. (a) | | | 11,658 | | | | 895,567 | |
| | | | | | | | |
| | | | | | | 28,117,975 | |
| | | | | | | | |
Building Products 0.0%‡ | |
Masco Corp. (b) | | | 2,025 | | | | 39,366 | |
| | | | | | | | |
|
Capital Markets 2.9% | |
American Capital Ltd. (a) | | | 126,873 | | | | 1,919,589 | |
Bank of New York Mellon Corp. | | | 136,134 | | | | 3,841,701 | |
Charles Schwab Corp. (The) (b) | | | 57,847 | | | | 981,085 | |
Janus Capital Group, Inc. | | | 3,124 | | | | 27,866 | |
Lazard, Ltd. Class A | | | 98,540 | | | | 3,340,506 | |
LPL Financial Holdings, Inc. | | | 30,200 | | | | 1,043,712 | |
Northern Trust Corp. | | | 15,271 | | | | 823,412 | |
State Street Corp. | | | 69,727 | | | | 4,076,938 | |
Waddell & Reed Financial, Inc. Class A | | | 2,218 | | | | 95,086 | |
| | | | | | | | |
| | | | | | | 16,149,895 | |
| | | | | | | | |
Chemicals 3.0% | |
Axiall Corp. | | | 57 | | | | 2,990 | |
CF Industries Holdings, Inc. | | | 13,678 | | | | 2,551,084 | |
Huntsman Corp. (b) | | | 152,693 | | | | 2,879,790 | |
Kraton Performance Polymers, Inc. (a) | | | 47,200 | | | | 1,071,912 | |
LyondellBasell Industries, N.V. Class A | | | 63,793 | | | | 3,872,235 | |
NewMarket Corp. | | | 83 | | | | 22,302 | |
OM Group, Inc. (a) | | | 66,800 | | | | 1,634,596 | |
PPG Industries, Inc. | | | 21,761 | | | | 3,201,913 | |
Sherwin-Williams Co. (The) | | | 961 | | | | 175,969 | |
W.R. Grace & Co. (a) | | | 18,407 | | | | 1,419,364 | |
Westlake Chemical Corp. | | | 353 | | | | 29,348 | |
| | | | | | | | |
| | | | | | | 16,861,503 | |
| | | | | | | | |
Commercial Banks 3.4% | |
Banco Latinoamericano de Exportaciones S.A. Class E | | | 30,300 | | | | 687,507 | |
CapitalSource, Inc. | | | 3,581 | | | | 32,050 | |
Cardinal Financial Corp. | | | 91,800 | | | | 1,399,950 | |
Comerica, Inc. (b) | | | 9,528 | | | | 345,390 | |
Fifth Third Bancorp | | | 122,110 | | | | 2,079,533 | |
First Republic Bank | | | 87,069 | | | | 3,306,881 | |
Huntington Bancshares, Inc. | | | 308,502 | | | | 2,211,959 | |
KeyCorp | | | 276,681 | | | | 2,758,510 | |
PNC Financial Services Group, Inc. (b) | | | 17,825 | | | | 1,209,961 | |
Regions Financial Corp. | | | 9,842 | | | | 83,559 | |
SunTrust Banks, Inc. | | | 48,690 | | | | 1,424,182 | |
SVB Financial Group (a) | | | 4,965 | | | | 353,061 | |
Wells Fargo & Co. | | | 81,967 | | | | 3,113,107 | |
| | | | | | | | |
| | | | | | | 19,005,650 | |
| | | | | | | | |
| † | Percentages indicated are based on Fund net assets. |
| ¨ | | Among the Fund’s 10 largest holdings, as of April 30, 2013, excluding short-term investment. May be subject to change daily. |
| | | | |
| 12 | | MainStay U.S. Equity Opportunities Fund | | The notes to the financial statements are an integral part of,
and should be read in conjunction with, the financial statements. |
| | | | | | | | |
| | |
| | | Shares | | | Value | |
| | | | | | | | |
| Common Stocks (continued) | |
Commercial Services & Supplies 1.1% | |
ADT Corp. (The) (a) | | | 16,299 | | | $ | 711,288 | |
Avery Dennison Corp. | | | 77,605 | | | | 3,216,727 | |
Tyco International, Ltd. | | | 16,048 | | | | 515,462 | |
Viad Corp. | | | 58,400 | | | | 1,521,320 | |
| | | | | | | | |
| | | | | | | 5,964,797 | |
| | | | | | | | |
Communications Equipment 2.0% | |
Brocade Communications Systems, Inc. (a) | | | 310,143 | | | | 1,805,032 | |
Cisco Systems, Inc. (b) | | | 270,925 | | | | 5,667,751 | |
EchoStar Corp. Class A (a) | | | 19,619 | | | | 770,438 | |
Harris Corp. | | | 4,903 | | | | 226,519 | |
Polycom, Inc. (a) | | | 116,770 | | | | 1,226,085 | |
QUALCOMM, Inc. (b) | | | 8,676 | | | | 534,615 | |
Riverbed Technology, Inc. (a) | | | 1,613 | | | | 23,969 | |
Tellabs, Inc. | | | 370,800 | | | | 767,556 | |
| | | | | | | | |
| | | | | | | 11,021,965 | |
| | | | | | | | |
Computers & Peripherals 4.6% | |
¨Apple, Inc. (b) | | | 36,010 | | | | 15,943,428 | |
Cray, Inc. (a) | | | 57,200 | | | | 1,210,352 | |
EMC Corp. (a)(b) | | | 2,086 | | | | 46,789 | |
Hewlett-Packard Co. | | | 67,204 | | | | 1,384,402 | |
Lexmark International, Inc. Class A | | | 5,700 | | | | 172,767 | |
NetApp, Inc. (a) | | | 40,763 | | | | 1,422,221 | |
Silicon Graphics International Corp. (a) | | | 118,900 | | | | 1,545,700 | |
Western Digital Corp. | | | 71,492 | | | | 3,952,078 | |
| | | | | | | | |
| | | | | | | 25,677,737 | |
| | | | | | | | |
Construction & Engineering 0.4% | |
AECOM Technology Corp. (a) | | | 72,178 | | | | 2,098,214 | |
Chicago Bridge & Iron Co. N.V. (b) | | | 710 | | | | 38,191 | |
| | | | | | | | |
| | | | | | | 2,136,405 | |
| | | | | | | | |
Construction Materials 0.3% | |
Headwaters, Inc. (a) | | | 145,500 | | | | 1,580,130 | |
| | | | | | | | |
|
Consumer Finance 0.0%‡ | |
American Express Co. (b) | | | 888 | | | | 60,748 | |
Discover Financial Services (b) | | | 986 | | | | 43,128 | |
| | | | | | | | |
| | | | | | | 103,876 | |
| | | | | | | | |
Containers & Packaging 0.0%‡ | |
Greif, Inc. Class A | | | 386 | | | | 18,594 | |
| | | | | | | | |
|
Diversified Consumer Services 0.5% | |
Apollo Group, Inc. Class A (a) | | | 1,596 | | | | 29,319 | |
DeVry, Inc. | | | 103,300 | | | | 2,893,433 | |
| | | | | | | | |
| | | | | | | 2,922,752 | |
| | | | | | | | |
Diversified Financial Services 3.4% | |
Bank of America Corp. (b) | | | 356,983 | | | | 4,394,461 | |
Citigroup, Inc. | | | 33,668 | | | | 1,570,949 | |
| | | | | | | | |
| | |
| | | Shares | | | Value | |
| | | | | | | | |
Diversified Financial Services (continued) | |
Interactive Brokers Group, Inc. Class A | | | 121,817 | | | $ | 1,834,564 | |
¨JPMorgan Chase & Co. (b) | | | 193,119 | | | | 9,464,762 | |
Leucadia National Corp. | | | 61,200 | | | | 1,890,468 | |
| | | | | | | | |
| | | | | | | 19,155,204 | |
| | | | | | | | |
Diversified Telecommunication Services 3.4% | |
¨AT&T, Inc. (b) | | | 235,569 | | | | 8,824,415 | |
¨Verizon Communications, Inc. (b) | | | 150,438 | | | | 8,110,112 | |
Vonage Holdings Corp. (a) | | | 562,100 | | | | 1,714,405 | |
| | | | | | | | |
| | | | | | | 18,648,932 | |
| | | | | | | | |
Electric Utilities 0.6% | |
American Electric Power Co., Inc. | | | 18,700 | | | | 961,741 | |
Edison International | | | 25,400 | | | | 1,366,520 | |
Exelon Corp. | | | 17,950 | | | | 673,305 | |
Southern Co. | | | 1,306 | | | | 62,988 | |
| | | | | | | | |
| | | | | | | 3,064,554 | |
| | | | | | | | |
Electrical Equipment 0.3% | |
Emerson Electric Co. | | | 1,027 | | | | 57,009 | |
General Cable Corp. (a) | | | 44,034 | | | | 1,518,292 | |
Rockwell Automation, Inc. | | | 205 | | | | 17,380 | |
| | | | | | | | |
| | | | | | | 1,592,681 | |
| | | | | | | | |
Electronic Equipment & Instruments 1.9% | |
Arrow Electronics, Inc. (a) | | | 3,800 | | | | 149,074 | |
Avnet, Inc. (a) | | | 40,321 | | | | 1,320,512 | |
Corning, Inc. | | | 44,164 | | | | 640,378 | |
Itron, Inc. (a)(b) | | | 306 | | | | 12,133 | |
Jabil Circuit, Inc. | | | 183,641 | | | | 3,268,810 | |
Plexus Corp. (a) | | | 15,700 | | | | 423,429 | |
Power-One, Inc. (a) | | | 383,200 | | | | 2,421,824 | |
Sanmina Corp. (a) | | | 142,200 | | | | 1,794,564 | |
Vishay Intertechnology, Inc. (a) | | | 32,796 | | | | 460,456 | |
| | | | | | | | |
| | | | | | | 10,491,180 | |
| | | | | | | | |
Energy Equipment & Services 1.2% | |
C&J Energy Services, Inc. (a) | | | 19,600 | | | | 387,884 | |
Diamond Offshore Drilling, Inc. | | | 475 | | | | 32,823 | |
Halliburton Co. (b) | | | 13,914 | | | | 595,102 | |
Helmerich & Payne, Inc. (b) | | | 22,731 | | | | 1,332,491 | |
Key Energy Services, Inc. (a) | | | 2,900 | | | | 17,226 | |
Nabors Industries, Ltd. | | | 99,437 | | | | 1,470,673 | |
Pioneer Energy Services Corp. (a) | | | 141,500 | | | | 997,575 | |
RPC, Inc. (b) | | | 2,267 | | | | 30,015 | |
Schlumberger, Ltd. | | | 11,279 | | | | 839,496 | |
Unit Corp. (a) | | | 28,463 | | | | 1,196,300 | |
| | | | | | | | |
| | | | | | | 6,899,585 | |
| | | | | | | | |
Food & Staples Retailing 4.3% | |
Costco Wholesale Corp. (b) | | | 24,751 | | | | 2,683,751 | |
CVS Caremark Corp. (b) | | | 82,066 | | | | 4,774,600 | |
Kroger Co. (The) (b) | | | 101,727 | | | | 3,497,374 | |
Rite Aid Corp. (a) | | | 487,800 | | | | 1,292,670 | |
| | | | | | |
The notes to the financial statements are an integral part of,
and should be read in conjunction with, the financial statements. | | mainstayinvestments.com | | | 13 | |
Portfolio of Investments April 30, 2013 (Unaudited) (continued)
| | | | | | | | |
| | |
| | | Shares | | | Value | |
| | | | | | | | |
| Common Stocks (continued) | |
Food & Staples Retailing (continued) | |
Safeway, Inc. | | | 65,293 | | | $ | 1,470,398 | |
Wal-Mart Stores, Inc. (b) | | | 76,002 | | | | 5,906,875 | |
Walgreen Co. (b) | | | 92,605 | | | | 4,584,874 | |
| | | | | | | | |
| | | | | | | 24,210,542 | |
| | | | | | | | |
Food Products 4.2% | |
Archer-Daniels-Midland Co. | | | 101,100 | | | | 3,431,334 | |
Chiquita Brands International, Inc. (a) | | | 192,200 | | | | 1,658,686 | |
Dean Foods Co. (a)(b) | | | 180,007 | | | | 3,445,334 | |
Ingredion, Inc. | | | 38,973 | | | | 2,806,446 | |
Kraft Foods Group, Inc. | | | 676 | | | | 34,807 | |
Mondelez International, Inc. Class A | | | 117,555 | | | | 3,697,105 | |
Pilgrim’s Pride Corp. (a) | | | 180,000 | | | | 1,762,200 | |
Smithfield Foods, Inc. (a) | | | 114,121 | | | | 2,921,498 | |
Tyson Foods, Inc. Class A | | | 145,093 | | | | 3,573,640 | |
| | | | | | | | |
| | | | | | | 23,331,050 | |
| | | | | | | | |
Gas Utilities 0.1% | |
ONEOK, Inc. (b) | | | 12,335 | | | | 633,526 | |
| | | | | | | | |
|
Health Care Equipment & Supplies 1.7% | |
Abbott Laboratories | | | 142,783 | | | | 5,271,548 | |
Boston Scientific Corp. (a) | | | 223,727 | | | | 1,675,715 | |
Hill-Rom Holdings, Inc. (b) | | | 26,146 | | | | 890,794 | |
NuVasive, Inc. (a) | | | 77,800 | | | | 1,631,466 | |
ResMed, Inc. (b) | | | 277 | | | | 13,302 | |
St. Jude Medical, Inc. | | | 976 | | | | 40,231 | |
Zimmer Holdings, Inc. | | | 349 | | | | 26,681 | |
| | | | | | | | |
| | | | | | | 9,549,737 | |
| | | | | | | | |
Health Care Providers & Services 3.0% | |
Amedisys, Inc. (a) | | | 100,600 | | | | 1,010,024 | |
AmerisourceBergen Corp. (b) | | | 806 | | | | 43,621 | |
Centene Corp. (a) | | | 35,000 | | | | 1,617,000 | |
Cigna Corp. | | | 2,891 | | | | 191,298 | |
Community Health Systems, Inc. | | | 9,039 | | | | 411,907 | |
Coventry Health Care, Inc. | | | 56 | | | | 2,775 | |
Gentiva Health Services, Inc. (a) | | | 65,900 | | | | 691,291 | |
HCA Holdings, Inc. (b) | | | 1,071 | | | | 42,722 | |
Health Management Associates, Inc. Class A (a) | | | 3,151 | | | | 36,205 | |
Humana, Inc. | | | 32,666 | | | | 2,420,877 | |
Kindred Healthcare, Inc. (a) | | | 144,500 | | | | 1,515,805 | |
Magellan Health Services, Inc. (a) | | | 15,600 | | | | 798,096 | |
McKesson Corp. (b) | | | 12,938 | | | | 1,369,099 | |
Molina Healthcare, Inc. (a) | | | 49,000 | | | | 1,626,800 | |
Omnicare, Inc. (b) | | | 899 | | | | 39,349 | |
Tenet Healthcare Corp. (a) | | | 703 | | | | 31,888 | |
UnitedHealth Group, Inc. (b) | | | 8,371 | | | | 501,674 | |
Vanguard Health Systems, Inc. (a) | | | 2,900 | | | | 42,427 | |
WellPoint, Inc. | | | 57,462 | | | | 4,190,129 | |
| | | | | | | | |
| | | | | | | 16,582,987 | |
| | | | | | | | |
| | | | | | | | |
| | |
| | | Shares | | | Value | |
| | | | | | | | |
Health Care Technology 0.0%‡ | |
Allscripts Healthcare Solutions, Inc. (a) | | | 3,097 | | | $ | 42,862 | |
| | | | | | | | |
|
Hotels, Restaurants & Leisure 2.0% | |
Brinker International, Inc. (b) | | | 66,343 | | | | 2,580,743 | |
Darden Restaurants, Inc. | | | 739 | | | | 38,154 | |
International Game Technology | | | 170,640 | | | | 2,892,348 | |
Marriott International, Inc. Class A (b) | | | 23,665 | | | | 1,019,015 | |
Marriott Vacations Worldwide Corp. (a) | | | 33,400 | | | | 1,519,032 | |
McDonald’s Corp. (b) | | | 2,141 | | | | 218,682 | |
MGM Resorts International (a) | | | 60,628 | | | | 856,067 | |
Red Robin Gourmet Burgers, Inc. (a) | | | 5,000 | | | | 241,850 | |
Royal Caribbean Cruises, Ltd. | | | 8,909 | | | | 325,446 | |
Starwood Hotels & Resorts Worldwide, Inc. | | | 616 | | | | 39,744 | |
Wyndham Worldwide Corp. (b) | | | 20,865 | | | | 1,253,569 | |
Wynn Resorts, Ltd. | | | 293 | | | | 40,229 | |
| | | | | | | | |
| | | | | | | 11,024,879 | |
| | | | | | | | |
Household Durables 1.8% | |
Jarden Corp. (a) | | | 39,691 | | | | 1,786,492 | |
La-Z-Boy, Inc. | | | 45,200 | | | | 816,312 | |
Mohawk Industries, Inc. (a) | | | 5,100 | | | | 565,488 | |
NACCO Industries, Inc. Class A | | | 6,600 | | | | 382,932 | |
PulteGroup, Inc. (a) | | | 139,203 | | | | 2,921,871 | |
Tempur-Pedic International, Inc. (a) | | | 915 | | | | 44,377 | |
Whirlpool Corp. | | | 30,168 | | | | 3,447,599 | |
| | | | | | | | |
| | | | | | | 9,965,071 | |
| | | | | | | | |
Household Products 1.2% | |
Energizer Holdings, Inc. | | | 23,365 | | | | 2,256,825 | |
Procter & Gamble Co. (The) (b) | | | 56,159 | | | | 4,311,327 | |
| | | | | | | | |
| | | | | | | 6,568,152 | |
| | | | | | | | |
Independent Power Producers & Energy Traders 0.9% | |
AES Corp. (The) (b) | | | 181,454 | | | | 2,514,952 | |
NRG Energy, Inc. | | | 88,695 | | | | 2,471,930 | |
| | | | | | | | |
| | | | | | | 4,986,882 | |
| | | | | | | | |
Industrial Conglomerates 1.0% | |
3M Co. | | | 3,143 | | | | 329,103 | |
General Electric Co. (b) | | | 224,385 | | | | 5,001,542 | |
| | | | | | | | |
| | | | | | | 5,330,645 | |
| | | | | | | | |
Insurance 5.9% | |
Aflac, Inc. (b) | | | 50,838 | | | | 2,767,621 | |
Allied World Assurance Co. Holdings A.G. | | | 7,228 | | | | 656,375 | |
Allstate Corp. (The) (b) | | | 75,153 | | | | 3,702,037 | |
American International Group, Inc. (a)(b) | | | 104,226 | | | | 4,317,041 | |
Assurant, Inc. | | | 51,451 | | | | 2,445,981 | |
Axis Capital Holdings, Ltd. | | | 407 | | | | 18,164 | |
Berkshire Hathaway, Inc. Class B (a)(b) | | | 32,689 | | | | 3,475,494 | |
Everest Re Group, Ltd. | | | 271 | | | | 36,582 | |
Fidelity National Financial, Inc. Class A | | | 109,071 | | | | 2,928,556 | |
Hartford Financial Services Group, Inc. (The) | | | 41,515 | | | | 1,166,156 | |
| | | | |
| 14 | | MainStay U.S. Equity Opportunities Fund | | The notes to the financial statements are an integral part of,
and should be read in conjunction with, the financial statements. |
| | | | | | | | |
| | |
| | | Shares | | | Value | |
| | | | | | | | |
| Common Stocks (continued) | |
Insurance (continued) | |
MetLife, Inc. (b) | | | 14,681 | | | $ | 572,412 | |
Principal Financial Group, Inc. (b) | | | 2,471 | | | | 89,203 | |
Protective Life Corp. | | | 66,231 | | | | 2,520,752 | |
Prudential Financial, Inc. (b) | | | 37,654 | | | | 2,275,055 | |
Reinsurance Group of America, Inc. | | | 4,291 | | | | 268,402 | |
StanCorp Financial Group, Inc. | | | 766 | | | | 33,076 | |
Stewart Information Services Corp. | | | 64,400 | | | | 1,743,308 | |
Travelers Companies, Inc. (The) (b) | | | 45,811 | | | | 3,912,718 | |
| | | | | | | | |
| | | | | | | 32,928,933 | |
| | | | | | | | |
Internet & Catalog Retail 1.6% | |
Amazon.com, Inc. (a) | | | 14,423 | | | | 3,660,702 | |
Expedia, Inc. | | | 53,892 | | | | 3,009,329 | |
Groupon, Inc. (a) | | | 70,387 | | | | 429,361 | |
Liberty Interactive Corp. Class A (a) | | | 78,317 | | | | 1,667,369 | |
Priceline.com, Inc. (a) | | | 72 | | | | 50,111 | |
| | | | | | | | |
| | | | | | | 8,816,872 | |
| | | | | | | | |
Internet Software & Services 4.1% | |
Akamai Technologies, Inc. (a) | | | 351 | | | | 15,413 | |
AOL, Inc. (a)(b) | | | 90,000 | | | | 3,477,600 | |
Digital River, Inc. (a) | | | 55,200 | | | | 799,296 | |
EarthLink, Inc. | | | 147,100 | | | | 836,999 | |
eBay, Inc. (a) | | | 41,057 | | | | 2,150,976 | |
¨Google, Inc. Class A (a)(b) | | | 12,594 | | | | 10,384,635 | |
IAC / InterActiveCorp | | | 75,589 | | | | 3,557,974 | |
United Online, Inc. | | | 253,400 | | | | 1,723,120 | |
VeriSign, Inc. (a) | | | 872 | | | | 40,173 | |
Yahoo!, Inc. (a) | | | 2,070 | | | | 51,191 | |
| | | | | | | | |
| | | | | | | 23,037,377 | |
| | | | | | | | |
IT Services 5.6% | |
Accenture PLC Class A | | | 55,589 | | | | 4,527,168 | |
Booz Allen Hamilton Holding Corp. (b) | | | 183,414 | | | | 2,786,059 | |
Broadridge Financial Solutions, Inc. | | | 214 | | | | 5,389 | |
Computer Sciences Corp. | | | 72,744 | | | | 3,408,057 | |
CoreLogic, Inc. (a) | | | 130,051 | | | | 3,547,791 | |
Gartner, Inc. (a) | | | 119 | | | | 6,884 | |
Global Cash Access Holdings, Inc. (a) | | | 224,500 | | | | 1,600,685 | |
Global Payments, Inc. | | | 376 | | | | 17,446 | |
¨International Business Machines Corp. (b) | | | 48,907 | | | | 9,905,624 | |
Jack Henry & Associates, Inc. | | | 451 | | | | 20,926 | |
Lender Processing Services, Inc. | | | 131,445 | | | | 3,646,284 | |
NeuStar, Inc. Class A (a)(b) | | | 679 | | | | 29,788 | |
Total System Services, Inc. (b) | | | 20,420 | | | | 482,320 | |
VeriFone Systems, Inc. (a) | | | 32,100 | | | | 689,508 | |
Visa, Inc. Class A | | | 17 | | | | 2,864 | |
Western Union Co. | | | 36,831 | | | | 545,467 | |
| | | | | | | | |
| | | | | | | 31,222,260 | |
| | | | | | | | |
| | | | | | | | |
| | |
| | | Shares | | | Value | |
| | | | | | | | |
Life Sciences Tools & Services 1.0% | |
Agilent Technologies, Inc. (b) | | | 63,648 | | | $ | 2,637,573 | |
Bruker Corp. (a) | | | 112,200 | | | | 1,993,794 | |
Cambrex Corp. (a) | | | 49,000 | | | | 612,010 | |
Charles River Laboratories
International, Inc. (a)(b) | | | 766 | | | | 33,314 | |
Covance, Inc. (a)(b) | | | 129 | | | | 9,618 | |
| | | | | | | | |
| | | | | | | 5,286,309 | |
| | | | | | | | |
Machinery 1.9% | |
Cummins, Inc. (b) | | | 10,460 | | | | 1,112,840 | |
Gardner Denver, Inc. | | | 470 | | | | 35,292 | |
Greenbrier Cos., Inc. (a) | | | 72,400 | | | | 1,633,344 | |
Ingersoll-Rand PLC | | | 40,784 | | | | 2,194,179 | |
Oshkosh Corp. (a) | | | 83,601 | | | | 3,282,175 | |
Terex Corp. (a) | | | 51,830 | | | | 1,482,338 | |
Timken Co. | | | 12,031 | | | | 632,470 | |
Toro Co. (The) | | | 681 | | | | 30,652 | |
Wabash National Corp. (a) | | | 28,700 | | | | 270,641 | |
WABCO Holdings, Inc. (a) | | | 517 | | | | 37,343 | |
| | | | | | | | |
| | | | | | | 10,711,274 | |
| | | | | | | | |
Media 5.4% | |
Cablevision Systems Corp. Class A | | | 163,768 | | | | 2,433,593 | |
Carmike Cinemas, Inc. (a) | | | 51,600 | | | | 906,096 | |
Charter Communications, Inc. Class A (a)(b) | | | 188 | | | | 18,939 | |
Cinemark Holdings, Inc. | | | 96,472 | | | | 2,980,020 | |
Comcast Corp. Class A (b) | | | 168,560 | | | | 6,961,528 | |
DIRECTV Class A (a)(b) | | | 76,266 | | | | 4,313,605 | |
DISH Network Corp. Class A | | | 45,304 | | | | 1,775,464 | |
EW Scripps Co. Class A (a) | | | 8,800 | | | | 122,232 | |
Gannett Co., Inc. (b) | | | 1,775 | | | | 35,784 | |
LIN TV Corp. Class A (a) | | | 111,100 | | | | 1,367,641 | |
Live Nation Entertainment, Inc. (a) | | | 5,200 | | | | 65,676 | |
News Corp. Class A | | | 26,721 | | | | 827,549 | |
Omnicom Group, Inc. (b) | | | 54 | | | | 3,228 | |
Regal Entertainment Group Class A (b) | | | 2,002 | | | | 35,916 | |
Scholastic Corp. | | | 40,400 | | | | 1,108,980 | |
Time Warner Cable, Inc. | | | 31,610 | | | | 2,967,863 | |
Viacom, Inc. Class B | | | 23,402 | | | | 1,497,494 | |
Virgin Media, Inc. | | | 957 | | | | 46,682 | |
Walt Disney Co. (The) (b) | | | 11,475 | | | | 721,089 | |
Washington Post Co. (The) Class B | | | 4,344 | | | | 1,925,869 | |
| | | | | | | | |
| | | | | | | 30,115,248 | |
| | | | | | | | |
Metals & Mining 1.0% | |
Coeur d’Alene Mines Corp. (a) | | | 10,600 | | | | 161,544 | |
Reliance Steel & Aluminum Co. | | | 2,400 | | | | 156,168 | |
Schnitzer Steel Industries, Inc. Class A | | | 28,400 | | | | 696,652 | |
Steel Dynamics, Inc. (b) | | | 169,099 | | | | 2,543,249 | |
SunCoke Energy, Inc. (a) | | | 49,900 | | | | 754,987 | |
United States Steel Corp. | | | 80,034 | | | | 1,424,605 | |
| | | | | | | | |
| | | | | | | 5,737,205 | |
| | | | | | | | |
| | | | | | |
The notes to the financial statements are an integral part of,
and should be read in conjunction with, the financial statements. | | mainstayinvestments.com | | | 15 | |
Portfolio of Investments April 30, 2013 (Unaudited) (continued)
| | | | | | | | |
| | |
| | | Shares | | | Value | |
| | | | | | | | |
| Common Stocks (continued) | |
Multi-Utilities 0.0%‡ | |
Public Service Enterprise Group, Inc. | | | 3,401 | | | $ | 124,511 | |
| | | | | | | | |
| | |
Multiline Retail 0.6% | | | | | | | | |
Dillard’s, Inc. Class A | | | 27,709 | | | | 2,283,498 | |
Kohl’s Corp. | | | 812 | | | | 38,213 | |
Macy’s, Inc. | | | 24,978 | | | | 1,114,019 | |
| | | | | | | | |
| | | | | | | 3,435,730 | |
| | | | | | | | |
Oil, Gas & Consumable Fuels 11.4% | |
Alon USA Energy, Inc. | | | 41,000 | | | | 680,600 | |
¨Chevron Corp. (b) | | | 82,759 | | | | 10,097,426 | |
ConocoPhillips (b) | | | 65,398 | | | | 3,953,309 | |
CVR Energy, Inc. | | | 32,200 | | | | 1,586,494 | |
Delek US Holdings, Inc. | | | 27,700 | | | | 999,693 | |
EOG Resources, Inc. | | | 6,963 | | | | 843,637 | |
EXCO Resources, Inc. | | | 1,964 | | | | 14,259 | |
¨Exxon Mobil Corp. (b) | | | 187,745 | | | | 16,707,428 | |
Green Plains Renewable Energy, Inc. (a) | | | 71,700 | | | | 896,967 | |
Hess Corp. | | | 19,603 | | | | 1,414,944 | |
HollyFrontier Corp. (b) | | | 43,456 | | | | 2,148,899 | |
Marathon Oil Corp. (b) | | | 8,523 | | | | 278,446 | |
Marathon Petroleum Corp. (b) | | | 49,966 | | | | 3,915,336 | |
Murphy Oil Corp. (b) | | | 57,834 | | | | 3,590,913 | |
Occidental Petroleum Corp. (b) | | | 9,366 | | | | 836,009 | |
Phillips 66 (b) | | | 72,692 | | | | 4,430,577 | |
Rentech, Inc. | | | 515,100 | | | | 1,066,257 | |
Targa Resources Corp. | | | 6,300 | | | | 414,288 | |
Tesoro Corp. (b) | | | 64,479 | | | | 3,443,179 | |
VAALCO Energy, Inc. (a) | | | 117,900 | | | | 792,288 | |
Valero Energy Corp. (b) | | | 95,759 | | | | 3,861,003 | |
Western Refining, Inc. | | | 44,100 | | | | 1,363,131 | |
WPX Energy, Inc. (a) | | | 6,104 | | | | 95,405 | |
| | | | | | | | |
| | | | | | | 63,430,488 | |
| | | | | | | | |
Paper & Forest Products 0.5% | |
Domtar Corp. (b) | | | 27,291 | | | | 1,896,997 | |
International Paper Co. (b) | | | 17,371 | | | | 816,090 | |
| | | | | | | | |
| | | | | | | 2,713,087 | |
| | | | | | | | |
Personal Products 1.4% | |
Avon Products, Inc. | | | 166,600 | | | | 3,858,456 | |
Herbalife, Ltd. | | | 50,238 | | | | 1,994,951 | |
Nu Skin Enterprises, Inc. Class A | | | 39,212 | | | | 1,989,225 | |
| | | | | | | | |
| | | | | | | 7,842,632 | |
| | | | | | | | |
Pharmaceuticals 4.8% | |
AbbVie, Inc. | | | 252 | | | | 11,604 | |
Bristol-Myers Squibb Co. | | | 5,279 | | | | 209,682 | |
Eli Lilly & Co. (b) | | | 86,761 | | | | 4,804,824 | |
Forest Laboratories, Inc. (a) | | | 45,770 | | | | 1,712,256 | |
Hi-Tech Pharmacal Co., Inc. | | | 24,900 | | | | 823,194 | |
Impax Laboratories, Inc. (a) | | | 100,300 | | | | 1,755,250 | |
| | | | | | | | |
| | |
| | | Shares | | | Value | |
| | | | | | | | |
Pharmaceuticals (continued) | | | | | | | | |
¨Johnson & Johnson (b) | | | 98,492 | | | $ | 8,394,473 | |
Medicines Co. (The) (a) | | | 23,200 | | | | 783,232 | |
Merck & Co., Inc. (b) | | | 45,296 | | | | 2,128,912 | |
Pfizer, Inc. (b) | | | 164,211 | | | | 4,773,614 | |
Warner Chilcott PLC Class A | | | 91,476 | | | | 1,315,425 | |
| | | | | | | | |
| | | | | | | 26,712,466 | |
| | | | | | | | |
Professional Services 1.6% | |
Barrett Business Services, Inc. | | | 21,900 | | | | 1,159,386 | |
Insperity, Inc. | | | 47,600 | | | | 1,315,188 | |
Kelly Services, Inc. Class A | | | 41,200 | | | | 701,224 | |
ManpowerGroup, Inc. | | | 60,460 | | | | 3,214,054 | |
Robert Half International, Inc. (b) | | | 80,654 | | | | 2,647,064 | |
| | | | | | | | |
| | | | | | | 9,036,916 | |
| | | | | | | | |
Real Estate Investment Trusts 1.9% | |
American Tower Corp. | | | 42,600 | | | | 3,577,974 | |
CBL & Associates Properties, Inc. | | | 33,313 | | | | 804,176 | |
Corrections Corporation of America | | | 88,900 | | | | 3,218,180 | |
GEO Group, Inc. (The) | | | 43,400 | | | | 1,625,330 | |
Hospitality Properties Trust | | | 8,235 | | | | 242,191 | |
Host Hotels & Resorts, Inc. | | | 5,300 | | | | 96,831 | |
Public Storage (b) | | | 1,558 | | | | 257,070 | |
Weyerhaeuser Co. | | | 18,300 | | | | 558,333 | |
| | | | | | | | |
| | | | | | | 10,380,085 | |
| | | | | | | | |
Road & Rail 1.6% | |
Arkansas Best Corp. | | | 102,000 | | | | 1,072,020 | |
Con-way, Inc. (b) | | | 93,958 | | | | 3,175,781 | |
Hertz Global Holdings, Inc. (a) | | | 119,760 | | | | 2,883,821 | |
Union Pacific Corp. (b) | | | 12,541 | | | | 1,855,566 | |
| | | | | | | | |
| | | | | | | 8,987,188 | |
| | | | | | | | |
Semiconductors & Semiconductor Equipment 1.8% | |
Cypress Semiconductor Corp. (a)(b) | | | 1,523 | | | | 15,367 | |
Intel Corp. (b) | | | 208,432 | | | | 4,991,946 | |
Lam Research Corp. (a) | | | 2,037 | | | | 94,150 | |
Marvell Technology Group, Ltd. | | | 174,381 | | | | 1,876,340 | |
Micron Technology, Inc. (a) | | | 338,340 | | | | 3,187,163 | |
| | | | | | | | |
| | | | | | | 10,164,966 | |
| | | | | | | | |
Software 5.0% | |
Activision Blizzard, Inc. | | | 114,815 | | | | 1,716,484 | |
Autodesk, Inc. (a)(b) | | | 5,518 | | | | 217,299 | |
AVG Technologies N.V. (a) | | | 23,200 | | | | 378,624 | |
BMC Software, Inc. (a)(b) | | | 822 | | | | 37,385 | |
CA, Inc. (b) | | | 105,202 | | | | 2,837,298 | |
Cadence Design Systems, Inc. (a) | | | 841 | | | | 11,606 | |
Electronic Arts, Inc. (a) | | | 65,709 | | | | 1,157,135 | |
¨Microsoft Corp. (b) | | | 340,408 | | | | 11,267,505 | |
Oracle Corp. (b) | | | 200,162 | | | | 6,561,310 | |
Rovi Corp. (a) | | | 1,810 | | | | 42,336 | |
Symantec Corp. (a) | | | 142,628 | | | | 3,465,860 | |
| | | | |
| 16 | | MainStay U.S. Equity Opportunities Fund | | The notes to the financial statements are an integral part of,
and should be read in conjunction with, the financial statements. |
| | | | | | | | |
| | |
| | | Shares | | | Value | |
| | | | | | | | |
| Common Stocks (continued) | |
Software (continued) | |
Synopsys, Inc. (a)(b) | | | 1,028 | | | $ | 36,566 | |
Zynga, Inc. Class A (a) | | | 1,926 | | | | 6,144 | |
| | | | | | | | |
| | | | 27,735,552 | |
| | | | | | | | |
Specialty Retail 5.4% | | | | | |
Abercrombie & Fitch Co. Class A | | | 70,739 | | | | 3,505,825 | |
Advance Auto Parts, Inc. | | | 40,424 | | | | 3,390,765 | |
American Eagle Outfitters, Inc. | | | 114,852 | | | | 2,233,871 | |
Ascena Retail Group, Inc. (a) | | | 1,389 | | | | 25,697 | |
Bed Bath & Beyond, Inc. (a) | | | 121 | | | | 8,325 | |
Best Buy Co., Inc. | | | 51,000 | | | | 1,325,490 | |
Big 5 Sporting Goods Corp. | | | 51,800 | | | | 870,240 | |
Brown Shoe Co., Inc. | | | 67,800 | | | | 1,146,498 | |
Chico’s FAS, Inc. (b) | | | 1,773 | | | | 32,393 | |
DSW, Inc. Class A | | | 445 | | | | 29,423 | |
Foot Locker, Inc. (b) | | | 8,144 | | | | 283,981 | |
GameStop Corp. Class A | | | 115,704 | | | | 4,038,070 | |
Gap, Inc. (The) | | | 4,304 | | | | 163,509 | |
hhgregg, Inc. (a) | | | 120,700 | | | | 1,630,657 | |
Home Depot, Inc. (The) (b) | | | 48,641 | | | | 3,567,817 | |
Lowe’s Companies, Inc. (b) | | | 105,316 | | | | 4,046,241 | |
O’Reilly Automotive, Inc. (a)(b) | | | 394 | | | | 42,284 | |
Office Depot, Inc. (a) | | | 406,800 | | | | 1,570,248 | |
Pep Boys-Manny Moe & Jack (The) (a) | | | 38,200 | | | | 443,120 | |
PetSmart, Inc. | | | 496 | | | | 33,847 | |
Ross Stores, Inc. | | | 163 | | | | 10,769 | |
Sears Hometown and Outlet Stores, Inc. (a) | | | 38,064 | | | | 1,698,035 | |
TJX Cos., Inc. (b) | | | 1,051 | | | | 51,257 | |
| | | | | | | | |
| | | | 30,148,362 | |
| | | | | | | | |
Textiles, Apparel & Luxury Goods 1.4% | |
Carter’s, Inc. (a) | | | 27,155 | | | | 1,775,666 | |
Fossil, Inc. (a) | | | 2,400 | | | | 235,488 | |
Hanesbrands, Inc. (a) | | | 70,064 | | | | 3,514,410 | |
PVH Corp. | | | 19,988 | | | | 2,306,815 | |
| | | | | | | | |
| | | | 7,832,379 | |
| | | | | | | | |
Tobacco 0.5% | |
Philip Morris International, Inc. (b) | | | 30,170 | | | | 2,883,950 | |
| | | | | | | | |
|
Trading Companies & Distributors 1.2% | |
MRC Global, Inc. (a) | | | 105,373 | | | | 3,155,921 | |
Rush Enterprises, Inc. Class A (a) | | | 36,000 | | | | 824,040 | |
WESCO International, Inc. (a) | | | 36,516 | | | | 2,617,832 | |
| | | | | | | | |
| | | | 6,597,793 | |
| | | | | | | | |
Wireless Telecommunication Services 1.5% | |
Clearwire Corp. Class A (a) | | | 148 | | | | 497 | |
MetroPCS Communications, Inc. (a) | | | 307,594 | | | | 3,641,913 | |
Sprint Nextel Corp. (a) | | | 3,998 | | | | 28,186 | |
| | | | | | | | |
| | |
| | | Shares | | | Value | |
| | | | | | | | |
Wireless Telecommunication Services (continued) | |
Telephone & Data Systems, Inc. | | | 153,548 | | | $ | 3,445,617 | |
United States Cellular Corp. (a) | | | 34,193 | | | | 1,314,379 | |
| | | | | | | | |
| | | | | | | 8,430,592 | |
| | | | | | | | |
Total Common Stocks
(Cost $609,793,008) | | | | | | | 717,132,749 | |
| | | | | | | | |
|
| Exchange Traded Fund 0.7% (c) | |
S&P 500 Index—SPDR Trust Series 1 | | | 22,634 | | | | 3,614,197 | |
| | | | | | | | |
Total Exchange Traded Fund
(Cost $3,555,052) | | | | | | | 3,614,197 | |
| | | | | | | | |
| | |
| | | | | | | | |
| | | Principal
Amount | | | | |
| Short-Term Investment 0.1% | | | | | | | | |
Repurchase Agreement 0.1% | | | | | | | | |
State Street Bank and Trust Co.
0.01%, dated 4/30/13
due 5/1/13
Proceeds at Maturity $675,538 (Collateralized by a Federal National Mortgage Association security with a rate of 2.08% and a maturity date of 11/2/22, with a Principal Amount of $685,000 and a Market Value of $692,257) | | $ | 675,538 | | | | 675,538 | |
| | | | | | | | |
Total Short-Term Investment
(Cost $675,538) | | | | | | | 675,538 | |
| | | | | | | | |
Total Investments, Before Investments Sold Short
(Cost $614,023,598) (d) | | | 129.6 | % | | | 721,422,484 | |
| | | | | | | | |
| | |
| | | | | | | | |
| | |
Shares | | | | |
Investments Sold Short (29.5%) Common Stocks Sold Short (29.5%) | | | | | |
Aerospace & Defense (0.2%) | | | | | | | | |
Exelis, Inc. | | | (48,372 | ) | | | (540,315 | ) |
KEYW Holding Corp. (The) (a) | | | (57,200 | ) | | | (777,348 | ) |
| | | | | | | | |
| | | | | | | (1,317,663 | ) |
| | | | | | | | |
Air Freight & Logistics (0.3%) | |
UTI Worldwide, Inc. | | | (1,113 | ) | | | (16,350 | ) |
XPO Logistics, Inc. (a) | | | (93,600 | ) | | | (1,526,616 | ) |
| | | | | | | | |
| | | | | | | (1,542,966 | ) |
| | | | | | | | |
Auto Components (0.0%)‡ | |
Gentex Corp. | | | (1,189 | ) | | | (26,752 | ) |
| | | | | | | | |
| | |
Automobiles (0.3%) | | | | | | | | |
Tesla Motors, Inc. (a) | | | (31,679 | ) | | | (1,710,349 | ) |
| | | | | | | | |
| | | | | | |
The notes to the financial statements are an integral part of,
and should be read in conjunction with, the financial statements. | | mainstayinvestments.com | | | 17 | |
Portfolio of Investments April 30, 2013 (Unaudited) (continued)
| | | | | | | | |
| | |
| | | Shares | | | Value | |
| | | | | | | | |
| Common Stocks Sold Short (continued) | |
Beverages (0.1%) | | | | | | | | |
Monster Beverage Corp. (a) | | | (9,854 | ) | | $ | (555,766 | ) |
| | | | | | | | |
|
Biotechnology (2.0%) | |
Arena Pharmaceuticals, Inc. (a) | | | (88,700 | ) | | | (730,888 | ) |
ARIAD Pharmaceuticals, Inc. (a) | | | (154,000 | ) | | | (2,751,980 | ) |
Clovis Oncology, Inc. (a) | | | (10,400 | ) | | | (389,168 | ) |
Dynavax Technologies Corp. (a) | | | (355,900 | ) | | | (836,365 | ) |
Incyte Corp., Ltd. (a) | | | (23,165 | ) | | | (513,105 | ) |
Keryx Biopharmaceuticals, Inc. (a) | | | (110,500 | ) | | | (900,575 | ) |
MannKind Corp. (a) | | | (234,200 | ) | | | (925,090 | ) |
Orexigen Therapeutics, Inc. (a) | | | (137,100 | ) | | | (833,568 | ) |
Sunesis Pharmaceuticals, Inc. (a) | | | (61,100 | ) | | | (343,993 | ) |
Synta Pharmaceuticals Corp. (a) | | | (172,400 | ) | | | (1,767,100 | ) |
Threshold Pharmaceuticals, Inc. (a) | | | (253,000 | ) | | | (1,219,460 | ) |
ZIOPHARM Oncology, Inc. (a) | | | (64,800 | ) | | | (108,864 | ) |
| | | | | | | | |
| | | | | | | (11,320,156 | ) |
| | | | | | | | |
Chemicals (0.3%) | | | | | | | | |
Zoltek Cos., Inc. (a) | | | (127,700 | ) | | | (1,686,917 | ) |
| | | | | | | | |
| | |
Commercial Banks (0.4%) | | | | | | | | |
First Citizens BancShares, Inc. Class A | | | (10 | ) | | | (1,864 | ) |
First Horizon National Corp. | | | (2,351 | ) | | | (24,451 | ) |
Fulton Financial Corp. | | | (1,981 | ) | | | (21,910 | ) |
Synovus Financial Corp. | | | (9,406 | ) | | | (25,302 | ) |
TCF Financial Corp. | | | (151,113 | ) | | | (2,198,694 | ) |
Valley National Bancorp | | | (2,513 | ) | | | (22,592 | ) |
| | | | | | | | |
| | | | | | | (2,294,813 | ) |
| | | | | | | | |
Commercial Services & Supplies (0.2%) | |
ACCO Brands Corp. (a) | | | (125,400 | ) | | | (846,450 | ) |
| | | | | | | | |
| | |
Communications Equipment (0.9%) | | | | | | | | |
Palo Alto Networks, Inc. (a) | | | (45,356 | ) | | | (2,453,760 | ) |
Procera Networks, Inc. (a) | | | (70,400 | ) | | | (780,736 | ) |
Ruckus Wireless, Inc. (a) | | | (18,200 | ) | | | (351,260 | ) |
Sonus Networks, Inc. (a) | | | (651,400 | ) | | | (1,367,940 | ) |
| | | | | | | | |
| | | | | | | (4,953,696 | ) |
| | | | | | | | |
Computers & Peripherals (1.6%) | |
3D Systems Corp. (a) | | | (37,800 | ) | | | (1,445,472 | ) |
Fusion-io, Inc. (a) | | | (203,702 | ) | | | (3,825,524 | ) |
NCR Corp. (a) | | | (1,127 | ) | | | (30,733 | ) |
SanDisk Corp. (a) | | | (596 | ) | | | (31,254 | ) |
Stratasys, Ltd. (a) | | | (42,004 | ) | | | (3,488,432 | ) |
| | | | | | | | |
| | | | | | | (8,821,415 | ) |
| | | | | | | | |
Construction & Engineering (0.0%)‡ | |
Great Lakes Dredge & Dock Corp. | | | (12,500 | ) | | | (86,500 | ) |
Quanta Services, Inc. (a) | | | (1,038 | ) | | | (28,524 | ) |
| | | | | | | | |
| | | | | | | (115,024 | ) |
| | | | | | | | |
| | | | | | | | |
| | |
| | | Shares | | | Value | |
| | | | | | | | |
Containers & Packaging (0.0%)‡ | |
Sealed Air Corp. | | | (1,665 | ) | | $ | (36,830 | ) |
| | | | | | | | |
|
Distributors (0.0%)‡ | |
LKQ Corp. (a) | | | (205 | ) | | | (4,936 | ) |
| | | | | | | | |
|
Diversified Consumer Services (0.0%)‡ | |
ITT Educational Services, Inc. (a) | | | (803 | ) | | | (14,703 | ) |
Strayer Education, Inc. | | | (3,600 | ) | | | (170,496 | ) |
| | | | | | | | |
| | | | | | | (185,199 | ) |
| | | | | | | | |
Diversified Financial Services (0.0%)‡ | |
NYSE Euronext | | | (246 | ) | | | (9,547 | ) |
| | | | | | | | |
|
Diversified Telecommunication Services (0.3%) | |
8x8, Inc. (a) | | | (181,100 | ) | | | (1,309,353 | ) |
Cincinnati Bell, Inc. (a) | | | (128,500 | ) | | | (452,320 | ) |
Level 3 Communications, Inc. (a) | | | (3,331 | ) | | | (67,053 | ) |
| | | | | | | | |
| | | | | | | (1,828,726 | ) |
| | | | | | | | |
Electrical Equipment (0.5%) | |
Babcock & Wilcox Co. (The) | | | (553 | ) | | | (15,042 | ) |
GrafTech International, Ltd. (a) | | | (2,590 | ) | | | (18,596 | ) |
Polypore International, Inc. (a) | | | (41,642 | ) | | | (1,746,049 | ) |
SolarCity Corp. (a) | | | (41,000 | ) | | | (1,107,820 | ) |
| | | | | | | | |
| | | | | | | (2,887,507 | ) |
| | | | | | | | |
Electronic Equipment & Instruments (1.0%) | |
FARO Technologies, Inc. (a) | | | (15,100 | ) | | | (585,729 | ) |
Ingram Micro, Inc. Class A (a) | | | (1,390 | ) | | | (24,756 | ) |
InvenSense, Inc. (a) | | | (153,800 | ) | | | (1,433,416 | ) |
IPG Photonics Corp. | | | (29,479 | ) | | | (1,877,223 | ) |
National Instruments Corp. | | | (919 | ) | | | (25,116 | ) |
RealD, Inc. (a) | | | (9,700 | ) | | | (145,209 | ) |
Universal Display Corp. (a) | | | (52,000 | ) | | | (1,634,880 | ) |
| | | | | | | | |
| | | | | | | (5,726,329 | ) |
| | | | | | | | |
Energy Equipment & Services (0.3%) | |
CARBO Ceramics, Inc. | | | (5,976 | ) | | | (422,204 | ) |
Era Group, Inc. (a) | | | (3,018 | ) | | | (68,961 | ) |
FMC Technologies, Inc. (a) | | | (639 | ) | | | (34,698 | ) |
GeoSpace Technologies Corp. (a) | | | (9,900 | ) | | | (835,263 | ) |
Heckmann Corp. (a) | | | (90,200 | ) | | | (332,838 | ) |
Rowan Cos. PLC Class A (a) | | | (875 | ) | | | (28,464 | ) |
SEACOR Holdings, Inc. | | | (97 | ) | | | (6,995 | ) |
| | | | | | | | |
| | | | | | | (1,729,423 | ) |
| | | | | | | | |
Food & Staples Retailing (0.5%) | |
Fresh Market, Inc. (The) (a) | | | (67,298 | ) | | | (2,754,507 | ) |
| | | | | | | | |
|
Food Products (0.3%) | |
Annie’s, Inc. (a) | | | (41,600 | ) | | | (1,572,064 | ) |
Bunge, Ltd. | | | (57 | ) | | | (4,116 | ) |
| | | | |
| 18 | | MainStay U.S. Equity Opportunities Fund | | The notes to the financial statements are an integral part of,
and should be read in conjunction with, the financial statements. |
| | | | | | | | |
| | |
| | | Shares | | | Value | |
| | | | | | | | |
| Common Stocks Sold Short (continued) | |
Food Products (continued) | |
Mead Johnson Nutrition Co. | | | (342 | ) | | $ | (27,733 | ) |
| | | | | | | | |
| | | | | | | (1,603,913 | ) |
| | | | | | | | |
Health Care Equipment & Supplies (0.9%) | |
ABIOMED, Inc. (a) | | | (43,800 | ) | | | (808,986 | ) |
Accuray, Inc. (a) | | | (121,700 | ) | | | (535,480 | ) |
Antares Pharma, Inc. (a) | | | (454,600 | ) | | | (1,722,934 | ) |
Endologix, Inc. (a) | | | (30,500 | ) | | | (458,110 | ) |
Intuitive Surgical, Inc. (a) | | | (119 | ) | | | (58,583 | ) |
MAKO Surgical Corp. (a) | | | (140,100 | ) | | | (1,483,659 | ) |
| | | | | | | | |
| | | | | | | (5,067,752 | ) |
| | | | | | | | |
Health Care Providers & Services (0.3%) | |
Accretive Health, Inc. (a) | | | (71,600 | ) | | | (754,664 | ) |
Catamaran Corp. (a) | | | (1,046 | ) | | | (60,385 | ) |
ExamWorks Group, Inc. (a) | | | (44,200 | ) | | | (800,020 | ) |
Health Net, Inc. (a) | | | (947 | ) | | | (27,842 | ) |
| | | | | | | | |
| | | | | | | (1,642,911 | ) |
| | | | | | | | |
Health Care Technology (0.2%) | |
Greenway Medical Technologies (a) | | | (16,300 | ) | | | (219,561 | ) |
Vocera Communications, Inc. (a) | | | (37,700 | ) | | | (746,460 | ) |
| | | | | | | | |
| | | | | | | (966,021 | ) |
| | | | | | | | |
Hotels, Restaurants & Leisure (0.7%) | |
Boyd Gaming Corp. (a) | | | (93,800 | ) | | | (1,125,600 | ) |
Caesars Entertainment Corp. (a) | | | (73,600 | ) | | | (1,170,976 | ) |
Chipotle Mexican Grill, Inc. (a) | | | (3,042 | ) | | | (1,104,824 | ) |
Chuy’s Holdings, Inc. (a) | | | (12,500 | ) | | | (408,750 | ) |
Dunkin’ Brands Group, Inc. | | | (723 | ) | | | (28,060 | ) |
Hyatt Hotels Corp. Class A (a) | | | (293 | ) | | | (12,505 | ) |
| | | | | | | | |
| | | | | | | (3,850,715 | ) |
| | | | | | | | |
Household Durables (0.2%) | |
Beazer Homes USA, Inc. (a) | | | (3,700 | ) | | | (59,792 | ) |
D.R. Horton, Inc. | | | (27,686 | ) | | | (722,051 | ) |
Hovnanian Enterprises, Inc. Class A (a) | | | (6,000 | ) | | | (32,700 | ) |
Lennar Corp. Class A | | | (479 | ) | | | (19,744 | ) |
M/I Homes, Inc. (a) | | | (8,900 | ) | | | (218,940 | ) |
Toll Brothers, Inc. (a) | | | (913 | ) | | | (31,325 | ) |
Zagg, Inc. (a) | | | (7,100 | ) | | | (48,067 | ) |
| | | | | | | | |
| | | | | | | (1,132,619 | ) |
| | | | | | | | |
Insurance (0.8%) | |
Assured Guaranty, Ltd. | | | (149,081 | ) | | | (3,075,541 | ) |
Kemper Corp. | | | (35 | ) | | | (1,115 | ) |
MBIA, Inc. (a) | | | (122,431 | ) | | | (1,158,197 | ) |
Old Republic International Corp. | | | (2,181 | ) | | | (29,444 | ) |
| | | | | | | | |
| | | | | | | (4,264,297 | ) |
| | | | | | | | |
Internet & Catalog Retail (0.1%) | |
TripAdvisor, Inc. (a) | | | (9,711 | ) | | | (510,604 | ) |
| | | | | | | | |
| | | | | | | | |
| | |
| | | Shares | | | Value | |
| | | | | | | | |
Internet Software & Services (2.2%) | |
Angie’s List, Inc. (a) | | | (80,400 | ) | | $ | (1,948,896 | ) |
Bazaarvoice, Inc. (a) | | | (225,100 | ) | | | (1,631,975 | ) |
Demandware, Inc. (a) | | | (62,500 | ) | | | (1,706,250 | ) |
ExactTarget, Inc. (a) | | | (62,800 | ) | | | (1,229,624 | ) |
Facebook, Inc. Class A (a) | | | (971 | ) | | | (26,955 | ) |
Liquidity Services, Inc. (a) | | | (44,400 | ) | | | (1,460,760 | ) |
Millennial Media, Inc. (a) | | | (241,000 | ) | | | (1,670,130 | ) |
Trulia, Inc. (a) | | | (25,400 | ) | | | (738,124 | ) |
Yelp, Inc. (a) | | | (63,600 | ) | | | (1,655,508 | ) |
| | | | | | | | |
| | | | | | | (12,068,222 | ) |
| | | | | | | | |
IT Services (0.3%) | |
Higher One Holdings, Inc. (a) | | | (42,400 | ) | | | (418,064 | ) |
ServiceSource International, Inc. (a) | | | (232,900 | ) | | | (1,490,560 | ) |
| | | | | | | | |
| | | | | | | (1,908,624 | ) |
| | | | | | | | |
Life Sciences Tools & Services (0.2%) | |
Sequenom, Inc. (a) | | | (291,300 | ) | | | (1,098,201 | ) |
| | | | | | | | |
|
Machinery (0.3%) | |
Colfax Corp. (a) | | | (604 | ) | | | (28,188 | ) |
Proto Labs, Inc. (a) | | | (33,000 | ) | | | (1,685,640 | ) |
SPX Corp. | | | (427 | ) | | | (31,816 | ) |
| | | | | | | | |
| | | | | | | (1,745,644 | ) |
| | | | | | | | |
Marine (0.0%)‡ | |
Kirby Corp. (a) | | | (444 | ) | | | (33,251 | ) |
Matson, Inc. | | | (975 | ) | | | (22,952 | ) |
| | | | | | | | |
| | | | | | | (56,203 | ) |
| | | | | | | | |
Media (1.0%) | |
DreamWorks Animation SKG, Inc. Class A (a) | | | (113,675 | ) | | | (2,191,654 | ) |
Liberty Media Corp.—Class A (a) | | | (219 | ) | | | (25,159 | ) |
Pandora Media, Inc. (a) | | | (232,847 | ) | | | (3,243,558 | ) |
Starz—Liberty Capital (a) | | | (221 | ) | | | (5,167 | ) |
| | | | | | | | |
| | | | | | | (5,465,538 | ) |
| | | | | | | | |
Metals & Mining (2.1%) | |
Allied Nevada Gold Corp. (a) | | | (194,936 | ) | | | (2,085,815 | ) |
Carpenter Technology Corp. | | | (446 | ) | | | (20,052 | ) |
Cliffs Natural Resources, Inc. | | | (646 | ) | | | (13,786 | ) |
Compass Minerals International, Inc. | | | (19 | ) | | | (1,644 | ) |
Gold Resource Corp. | | | (144,100 | ) | | | (1,475,584 | ) |
McEwen Mining, Inc. (a) | | | (440,400 | ) | | | (1,026,132 | ) |
Molycorp, Inc. (a) | | | (573,422 | ) | | | (3,348,785 | ) |
Royal Gold, Inc. | | | (29,465 | ) | | | (1,637,665 | ) |
Tahoe Resources, Inc. (a) | | | (102,515 | ) | | | (1,779,660 | ) |
| | | | | | | | |
| | | | | | | (11,389,123 | ) |
| | | | | | | | |
Multiline Retail (0.7%) | |
Family Dollar Stores, Inc. | | | (445 | ) | | | (27,310 | ) |
J.C. Penney Co., Inc. | | | (120,044 | ) | | | (1,971,123 | ) |
Sears Holdings Corp. (a) | | | (36,407 | ) | | | (1,869,135 | ) |
| | | | | | | | |
| | | | | | | (3,867,568 | ) |
| | | | | | | | |
| | | | | | |
The notes to the financial statements are an integral part of,
and should be read in conjunction with, the financial statements. | | mainstayinvestments.com | | | 19 | |
Portfolio of Investments April 30, 2013 (Unaudited) (continued)
| | | | | | | | |
| | |
| | | Shares | | | Value | |
| | | | | | | | |
| Common Stocks Sold Short (continued) | |
Oil, Gas & Consumable Fuels (2.9%) | |
Cabot Oil & Gas Corp. | | | (93 | ) | | $ | (6,329 | ) |
Clean Energy Fuels Corp. (a) | | | (109,400 | ) | | | (1,442,986 | ) |
Cobalt International Energy, Inc. (a) | | | (69,842 | ) | | | (1,951,385 | ) |
Golar LNG, Ltd. | | | (50,410 | ) | | | (1,684,702 | ) |
Halcon Resources Corp. (a) | | | (219,500 | ) | | | (1,435,530 | ) |
Kosmos Energy, Ltd. (a) | | | (751 | ) | | | (8,253 | ) |
Magnum Hunter Resources Corp. (a) | | | (438,400 | ) | | | (1,192,448 | ) |
Nordic American Tanker Shipping | | | (86,200 | ) | | | (768,042 | ) |
Quicksilver Resources, Inc. (a) | | | (77,300 | ) | | | (194,796 | ) |
Range Resources Corp. | | | (11,730 | ) | | | (862,390 | ) |
Sanchez Energy Corp. (a) | | | (84,300 | ) | | | (1,526,673 | ) |
SandRidge Energy, Inc. (a) | | | (4,669 | ) | | | (23,999 | ) |
Solazyme, Inc. (a) | | | (198,000 | ) | | | (1,801,800 | ) |
Teekay Corp. | | | (58,776 | ) | | | (2,092,426 | ) |
Triangle Petroleum Corp. (a) | | | (171,000 | ) | | | (938,790 | ) |
World Fuel Services Corp. | | | (712 | ) | | | (28,871 | ) |
| | | | | | | | |
| | | | | | | (15,959,420 | ) |
| | | | | | | | |
Personal Products (0.1%) | |
Star Scientific, Inc. (a) | | | (378,500 | ) | | | (469,340 | ) |
| | | | | | | | |
|
Pharmaceuticals (0.7%) | |
AVANIR Pharmaceuticals, Inc. Class A (a) | | | (180,600 | ) | | | (576,114 | ) |
Pacira Pharmaceuticals Inc. (a) | | | (55,200 | ) | | | (1,593,624 | ) |
Repros Therapeutics, Inc. (a) | | | (46,500 | ) | | | (945,810 | ) |
Vivus, Inc. (a) | | | (73,300 | ) | | | (974,157 | ) |
| | | | | | | | |
| | | | | | | (4,089,705 | ) |
| | | | | | | | |
Professional Services (0.1%) | |
Acacia Research Corp. (a) | | | (23,500 | ) | | | (559,770 | ) |
| | | | | | | | |
|
Real Estate Management & Development (0.4%) | |
Alexander & Baldwin, Inc. (a) | | | (2,563 | ) | | | (87,296 | ) |
St. Joe Co. (The) (a) | | | (102,400 | ) | | | (2,003,968 | ) |
| | | | | | | | |
| | | | | | | (2,091,264 | ) |
| | | | | | | | |
Semiconductors & Semiconductor Equipment (0.3%) | |
Advanced Micro Devices, Inc. (a) | | | (573,694 | ) | | | (1,617,817 | ) |
Freescale Semiconductor, Ltd. (a) | | | (8,871 | ) | | | (137,323 | ) |
Silicon Laboratories, Inc. (a) | | | (220 | ) | | | (8,736 | ) |
Skyworks Solutions, Inc. (a) | | | (642 | ) | | | (14,169 | ) |
| | | | | | | | |
| | | | | | | (1,778,045 | ) |
| | | | | | | | |
Software (3.0%) | |
Concur Technologies, Inc. (a) | | | (32,622 | ) | | | (2,384,995 | ) |
Fortinet, Inc. (a) | | | (1,115 | ) | | | (20,025 | ) |
Glu Mobile, Inc. (a) | | | (132,400 | ) | | | (407,792 | ) |
Informatica Corp. (a) | | | (953 | ) | | | (31,382 | ) |
Jive Software, Inc. (a) | | | (105,200 | ) | | | (1,429,668 | ) |
MICROS Systems, Inc. (a) | | | (135 | ) | | | (5,725 | ) |
NetSuite, Inc. (a) | | | (28,556 | ) | | | (2,511,786 | ) |
ServiceNow, Inc. (a) | | | (77,721 | ) | | | (3,183,452 | ) |
Splunk, Inc. (a) | | | (71,530 | ) | | | (2,918,424 | ) |
| | | | | | | | |
| | |
| | | Shares | | | Value | |
| | | | | | | | |
Software (continued) | |
Tangoe, Inc. (a) | | | (48,600 | ) | | $ | (624,996 | ) |
VirnetX Holding Corp. (a) | | | (20,300 | ) | | | (414,526 | ) |
Workday, Inc. Class A (a) | | | (47,710 | ) | | | (2,989,032 | ) |
| | | | | | | | |
| | | | | | | (16,921,803 | ) |
| | | | | | | | |
Specialty Retail (2.6%) | |
Aaron’s, Inc. | | | (857 | ) | | | (24,605 | ) |
Bebe Stores, Inc. | | | (125,600 | ) | | | (710,896 | ) |
CarMax, Inc. (a) | | | (717 | ) | | | (33,011 | ) |
Five Below, Inc. (a) | | | (38,500 | ) | | | (1,385,615 | ) |
Francesca’s Holdings Corp. (a) | | | (55,700 | ) | | | (1,590,792 | ) |
GNC Holdings, Inc. Class A | | | (55,846 | ) | | | (2,531,499 | ) |
Mattress Firm Holding Corp. (a) | | | (20,600 | ) | | | (789,392 | ) |
Sally Beauty Holdings, Inc. (a) | | | (41,701 | ) | | | (1,253,532 | ) |
Tiffany & Co. | | | (35,362 | ) | | | (2,605,472 | ) |
Tractor Supply Co. | | | (319 | ) | | | (34,187 | ) |
Ulta Salon Cosmetics & Fragrance, Inc. (a) | | | (17,619 | ) | | | (1,544,305 | ) |
Zumiez, Inc. (a) | | | (62,500 | ) | | | (1,810,625 | ) |
| | | | | | | | |
| | | | | | | (14,313,931 | ) |
| | | | | | | | |
Textiles, Apparel & Luxury Goods (0.1%) | |
Deckers Outdoor Corp. (a) | | | (5,165 | ) | | | (284,695 | ) |
Michael Kors Holdings, Ltd. (a) | | | (573 | ) | | | (32,627 | ) |
Under Armour, Inc. Class A (a) | | | (605 | ) | | | (34,533 | ) |
| | | | | | | | |
| | | | | | | (351,855 | ) |
| | | | | | | | |
Thrifts & Mortgage Finance (0.1%) | |
TFS Financial Corp. (a) | | | (58,044 | ) | | | (630,938 | ) |
| | | | | | | | |
Total Investments Sold Short
(Proceeds $157,904,062) | | | (29.5 | )% | | | (164,158,997 | ) |
| | | | | | | | |
Total Investments,
Net of Investments Sold Short
(Cost $456,119,536) | | | 100.1 | | | | 557,263,487 | |
Other Assets, Less Liabilities | | | (0.1 | ) | | | (454,576 | ) |
Net Assets | | | 100.0 | % | | $ | 556,808,911 | |
| ‡ | Less than one-tenth of a percent. |
| (a) | Non-income producing security. |
| (b) | Represents a security, or a portion thereof, which is maintained in a segregated account at the Fund’s custodian as collateral for securities sold short (See Note 2(I)). |
| (c) | Exchange Traded Fund—An investment vehicle that represents a basket of securities that is traded on an exchange. |
| (d) | As of April 30, 2013, cost is $620,734,123 for federal income tax purposes and net unrealized appreciation is as follows: |
| | | | |
Gross unrealized appreciation | | $ | 112,147,289 | |
Gross unrealized depreciation | | | (11,458,928 | ) |
| | | | |
Net unrealized appreciation | | $ | 100,688,361 | |
| | | | |
The following abbreviation is used in the above portfolio:
SPDR—Standard & Poor’s Depositary Receipt
| | | | |
| 20 | | MainStay U.S. Equity Opportunities Fund | | The notes to the financial statements are an integral part of,
and should be read in conjunction with, the financial statements. |
The following is a summary of the fair valuations according to the inputs used as of April 30, 2013, for valuing the Fund’s assets and liabilities.
Asset Valuation Inputs
| | | | | | | | | | | | | | | | |
Description | | Quoted
Prices in
Active
Markets for
Identical
Assets
(Level 1) | | | Significant
Other
Observable
Inputs (Level 2) | | | Significant
Unobservable
Inputs
(Level 3) | | | Total | |
| Investments in Securities (a) | | | | | | | | | | | | | | | | |
| Common Stocks | | $ | 717,132,749 | | | $ | — | | | $ | — | | | $ | 717,132,749 | |
| Exchange Traded Fund | | | 3,614,197 | | | | — | | | | — | | | | 3,614,197 | |
| Short-Term Investment | | | | | | | | | | | | | | | | |
Repurchase Agreement | | | — | | | | 675,538 | | | | — | | | | 675,538 | |
| | | | | | | | | | | | | | | | |
| Total Investments in Securities | | $ | 720,746,946 | | | $ | 675,538 | | | $ | — | | | $ | 721,422,484 | |
| | | | | | | | | | | | | | | | |
Liability Valuation Inputs
| | | | | | | | | | | | | | | | |
Description | | Quoted
Prices in
Active
Markets for
Identical
Assets
(Level 1) | | | Significant
Other
Observable
Inputs
(Level 2) | | | Significant
Unobservable
Inputs
(Level 3) | | | Total | |
| Investments in Securities Sold Short (a) | | | | | | | | | | | | | | | | |
| Common Stocks Sold Short | | $ | (164,158,997 | ) | | $ | — | | | $ | — | | | $ | (164,158,997 | ) |
| | | | | | | | | | | | | | | | |
| Total Investments in Securities Sold Short | | $ | (164,158,997 | ) | | $ | — | | | $ | — | | | $ | (164,158,997 | ) |
| | | | | | | | | | | | | | | | |
| (a) | For a complete listing of investments and their industries, see the Portfolio of Investments. |
The Fund recognizes transfers between the levels as of the beginning of the period.
For the period ended April 30, 2013, the Fund did not have any transfers between Level 1 and Level 2 fair value measurements. (See Note 2)
As of April 30, 2013, the Fund did not hold any investments with significant unobservable inputs (Level 3). (See Note 2)
| | | | | | |
The notes to the financial statements are an integral part of,
and should be read in conjunction with, the financial statements. | | mainstayinvestments.com | | | 21 | |
Statement of Assets and Liabilities as of April 30, 2013 (Unaudited)
| | | | |
| Assets | |
Investment in securities before investments sold short, at value (identified cost $614,023,598) | | $ | 721,422,484 | |
Receivables: | | | | |
Dividends and interest | | | 924,353 | |
Fund shares sold | | | 375,338 | |
Investment securities sold | | | 2,037 | |
Other assets | | | 31,306 | |
| | | | |
Total assets | | | 722,755,518 | |
| | | | |
|
| Liabilities | |
Investments sold short (proceeds $157,904,062) | | | 164,158,997 | |
Payables: | | | | |
Investment securities purchased | | | 788,513 | |
Broker fees and charges on short sales | | | 474,057 | |
Manager (See Note 3) | | | 451,753 | |
Professional fees | | | 30,221 | |
Dividends on investments sold short | | | 15,425 | |
Custodian | | | 12,880 | |
Shareholder communication | | | 7,335 | |
Transfer agent (See Note 3) | | | 2,267 | |
Trustees | | | 957 | |
NYLIFE Distributors (See Note 3) | | | 798 | |
Accrued expenses | | | 3,404 | |
| | | | |
Total liabilities | | | 165,946,607 | |
| | | | |
Net assets | | $ | 556,808,911 | |
| | | | |
|
| Composition of Net Assets | |
Shares of beneficial interest outstanding (par value of $.001 per share) unlimited number of shares authorized | | $ | 61,406 | |
Additional paid-in capital | | | 431,202,319 | |
| | | | |
| | | 431,263,725 | |
Undistributed net investment income | | | 1,258,249 | |
Accumulated net realized gain (loss) on investments, investments sold short and foreign currency transactions | | | 23,142,986 | |
Net unrealized appreciation (depreciation) on investments | | | 107,398,886 | |
Net unrealized (appreciation) depreciation on investments sold short | | | (6,254,935 | ) |
| | | | |
Net assets | | $ | 556,808,911 | |
| | | | |
| | | | |
Investor Class | | | | |
Net assets applicable to outstanding shares | | $ | 279,839 | |
| | | | |
Shares of beneficial interest outstanding | | | 31,050 | |
| | | | |
Net asset value per share outstanding | | $ | 9.01 | |
Maximum sales charge (5.50% of offering price) | | | 0.52 | |
| | | | |
Maximum offering price per share outstanding | | $ | 9.53 | |
| | | | |
Class A | | | | |
Net assets applicable to outstanding shares | | $ | 1,574,074 | |
| | | | |
Shares of beneficial interest outstanding | | | 173,985 | |
| | | | |
Net asset value per share outstanding | | $ | 9.05 | |
Maximum sales charge (5.50% of offering price) | | | 0.53 | |
| | | | |
Maximum offering price per share outstanding | | $ | 9.58 | |
| | | | |
Class C | | | | |
Net assets applicable to outstanding shares | | $ | 579,597 | |
| | | | |
Shares of beneficial interest outstanding | | | 67,289 | |
| | | | |
Net asset value and offering price per share outstanding | | $ | 8.61 | |
| | | | |
Class I | | | | |
Net assets applicable to outstanding shares | | $ | 554,375,401 | |
| | | | |
Shares of beneficial interest outstanding | | | 61,133,658 | |
| | | | |
Net asset value and offering price per share outstanding | | $ | 9.07 | |
| | | | |
| | | | |
| 22 | | MainStay U.S. Equity Opportunities Fund | | The notes to the financial statements are an integral part of,
and should be read in conjunction with, the financial statements. |
Statement of Operations for the six months ended April 30, 2013 (Unaudited)
| | | | |
| Investment Income (Loss) | |
Income | | | | |
Dividends (a) | | $ | 8,039,878 | |
Interest | | | 47 | |
| | | | |
Total income | | | 8,039,925 | |
| | | | |
Expenses | | | | |
Manager (See Note 3) | | | 2,532,524 | |
Broker fees and charges on short sales | | | 2,083,593 | |
Dividends on investments sold short | | | 797,941 | |
Professional fees | | | 32,102 | |
Registration | | | 28,504 | |
Custodian | | | 26,929 | |
Shareholder communication | | | 13,338 | |
Transfer agent (See Note 3) | | | 6,465 | |
Trustees | | | 5,578 | |
Distribution/Service—Investor Class (See Note 3) | | | 233 | |
Distribution/Service—Class A (See Note 3) | | | 1,015 | |
Distribution/Service—Class C (See Note 3) | | | 2,408 | |
Miscellaneous | | | 10,108 | |
| | | | |
Total expenses | | | 5,540,738 | |
| | | | |
Net investment income (loss) | | | 2,499,187 | |
| | | | |
|
| Realized and Unrealized Gain (Loss) on Investments and Foreign Currency Transactions | |
Net realized gain (loss) on: | | | | |
Security transactions | | | 52,252,566 | |
Investments sold short | | | (19,253,940 | ) |
Foreign currency transactions | | | 50 | |
| | | | |
Net realized gain (loss) on investments, investments sold short and foreign currency transactions | | | 32,998,676 | |
| | | | |
Net change in unrealized appreciation (depreciation) on: | | | | |
Investments | | | 53,560,146 | |
Investments sold short | | | (7,035,050 | ) |
| | | | |
Net change in unrealized appreciation (depreciation) on investments and investments sold short | | | 46,525,096 | |
| | | | |
Net realized and unrealized gain (loss) on investments, investments sold short and foreign currency transactions | | | 79,523,772 | |
| | | | |
Net increase (decrease) in net assets resulting from operations | | $ | 82,022,959 | |
| | | | |
| (a) | Dividends recorded net of foreign withholding taxes in the amount of $29,717. |
| | | | | | |
The notes to the financial statements are an integral part of,
and should be read in conjunction with, the financial statements. | | mainstayinvestments.com | | | 23 | |
Statements of Changes in Net Assets
for the six months ended April 30, 2013 (Unaudited) and the year ended October 31, 2012
| | | | | | | | |
| | | 2013 | | | 2012 | |
| Increase (Decrease) in Net Assets | |
Operations: | | | | | | | | |
Net investment income (loss) | | $ | 2,499,187 | | | $ | 3,079,220 | |
Net realized gain (loss) on investments, investments sold short and foreign currency transactions | | | 32,998,676 | | | | 28,956,871 | |
Net change in unrealized appreciation (depreciation) on investments and investments sold short | | | 46,525,096 | | | | 31,172,872 | |
| | | | |
Net increase (decrease) in net assets resulting from operations | | | 82,022,959 | | | | 63,208,963 | |
| | | | |
Dividends and distributions to shareholders: | | | | | | | | |
From net investment income: | | | | | | | | |
Investor Class | | | (266 | ) | | | (77 | ) |
Class A | | | (2,407 | ) | | | (1,309 | ) |
Class C | | | (264 | ) | | | — | |
Class I | | | (3,087,094 | ) | | | (2,078,617 | ) |
| | | | |
| | | (3,090,031 | ) | | | (2,080,003 | ) |
| | | | |
From net realized gain on investments: | | | | | | | | |
Investor Class | | | (9,908 | ) | | | (9,851 | ) |
Class A | | | (38,224 | ) | | | (33,873 | ) |
Class C | | | (29,995 | ) | | | (31,382 | ) |
Class I | | | (29,628,713 | ) | | | (31,251,231 | ) |
| | | | |
| | | (29,706,840 | ) | | | (31,326,337 | ) |
| | | | |
Total dividends and distributions to shareholders | | | (32,796,871 | ) | | | (33,406,340 | ) |
| | | | |
Capital share transactions: | | | | | | | | |
Net proceeds from sale of shares | | | 50,485,644 | | | | 154,915,178 | |
Net asset value of shares issued to shareholders in reinvestment of dividends and distributions | | | 32,743,732 | | | | 33,374,949 | |
Cost of shares redeemed | | | (38,114,192 | ) | | | (137,495,197 | ) |
| | | | |
Increase (decrease) in net assets derived from capital share transactions | | | 45,115,184 | | | | 50,794,930 | |
| | | | |
Net increase (decrease) in net assets | | | 94,341,272 | | | | 80,597,553 | |
|
| Net Assets | |
Beginning of period | | | 462,467,639 | | | | 381,870,086 | |
| | | | |
End of period | | $ | 556,808,911 | | | $ | 462,467,639 | |
| | | | |
Undistributed net investment income at end of period | | $ | 1,258,249 | | | $ | 1,849,093 | |
| | | | |
| | | | |
| 24 | | MainStay U.S. Equity Opportunities Fund | | The notes to the financial statements are an integral part of,
and should be read in conjunction with, the financial statements. |
Statement of Cash Flows
for the six months ended April 30, 2013 (Unaudited)
| | | | |
| Cash flows used in operating activities: | |
Net increase in net assets resulting from operations | | $ | 82,022,959 | |
Adjustments to reconcile net increase in net assets resulting from operations to net cash provided by operating activities: | | | | |
Investments purchased | | | (425,042,406 | ) |
Investments sold | | | 427,407,722 | |
Purchases to cover securities sold short | | | (207,363,313 | ) |
Securities sold short | | | 190,017,907 | |
Purchase of short term investments, net | | | (592,420 | ) |
Decrease in investment securities sold receivable | | | 35,113 | |
Decrease in dividends and interest receivable | | | 101,119 | |
Increase in other assets | | | (12,080 | ) |
Decrease in investment securities purchased payable | | | (110,219 | ) |
Increase in broker fees and charges payable on short sales | | | 105,747 | |
Decrease in dividends payable for securities sold short | | | (35,823 | ) |
Increase in professional fees payable | | | 11,310 | |
Increase in custodian payable | | | 3,085 | |
Decrease in shareholder communication payable | | | (2,781 | ) |
Decrease in due to Trustees | | | (578 | ) |
Increase in due to manager | | | 45,017 | |
Decrease in due to transfer agent | | | (862 | ) |
Increase in due to NYLIFE Distributors | | | 237 | |
Decrease in accrued expenses | | | (1,347 | ) |
Net change in unrealized (appreciation) depreciation on investments | | | (53,560,146 | ) |
Net realized (gain) loss from investments | | | (52,252,566 | ) |
Net change in unrealized (appreciation) depreciation on securities sold short | | | 7,035,050 | |
Net realized (gain) loss from securities sold short | | | 19,253,940 | |
| | | | |
Net cash used in operating activities | | | (12,935,335 | ) |
| | | | |
|
| Cash flows from financing activities: | |
Proceeds from shares sold | | | 51,101,665 | |
Payment on shares redeemed | | | (38,114,192 | ) |
Cash distributions paid | | | (53,139 | ) |
| | | | |
Net cash from financing activities | | | 12,934,334 | |
| | | | |
Net decrease in cash: | | | (1,001 | ) |
| | | | |
Cash at beginning of period | | | 1,001 | |
| | | | |
Cash at end of period | | $ | — | |
| | | | |
Non cash financing activities not included herein consist of all reinvestment of dividends and distributions of $32,743,732.
| | | | | | |
The notes to the financial statements are an integral part of,
and should be read in conjunction with, the financial statements. | | mainstayinvestments.com | | | 25 | |
Financial Highlights selected per share data and ratios
| | | | | | | | | | | | | | | | | | | | | | | | |
| | | Investor Class | |
| | | Six months
ended
April 30, | | | Year ended October 31, | | | February 28,
2008**
through
October 31, | |
| | | 2013* | | | 2012 | | | 2011 | | | 2010 | | | 2009 | | | 2008 | |
Net asset value at beginning of period | | $ | 8.25 | | | $ | 7.85 | | | $ | 7.28 | | | $ | 6.40 | | | $ | 6.00 | | | $ | 8.68 | |
| | | | | | | | | | | | | | | | | | | | | | | | |
Net investment income (loss) (a) | | | 0.02 | | | | 0.02 | | | | 0.01 | | | | (0.01 | ) | | | 0.02 | | | | (0.02 | ) |
Net realized and unrealized gain (loss) on investments | | | 1.28 | | | | 1.01 | | | | 0.56 | | | | 0.90 | | | | 0.38 | | | | (2.66 | ) |
| | | | | | | | | | | | | | | | | | | | | | | | |
Total from investment operations | | | 1.30 | | | | 1.03 | | | | 0.57 | | | | 0.89 | | | | 0.40 | | | | (2.68 | ) |
| | | | | | | | | | | | | | | | | | | | | | | | |
Less dividends and distributions: | | | | | | | | | | | | | | | | | | | | | | | | |
From net investment income | | | (0.01 | ) | | | (0.00 | )‡ | | | (0.00 | )‡ | | | (0.01 | ) | | | — | | | | — | |
From net realized gain on investments | | | (0.53 | ) | | | (0.63 | ) | | | — | | | | — | | | | — | | | | — | |
| | | | | | | | | | | | | | | | | | | | | | | | |
Total dividends and distributions | | | (0.54 | ) | | | (0.63 | ) | | | (0.00 | )‡ | | | (0.01 | ) | | | — | | | | — | |
| | | | | | | | | | | | | | | | | | | | | | | | |
Net asset value at end of period | | $ | 9.01 | | | $ | 8.25 | | | $ | 7.85 | | | $ | 7.28 | | | $ | 6.40 | | | $ | 6.00 | |
| | | | | | | | | | | | | | | | | | | | | | | | |
Total investment return (b) | | | 16.86 | %(d) | | | 14.31 | % | | | 7.86 | % | | | 13.88 | % | | | 6.67 | %(c) | | | (30.76 | %)(d) |
Ratios (to average net assets)/Supplemental Data: | | | | | | | | | | | | | | | | | | | | | | | | |
Net investment income (loss) | | | 0.40 | %†† | | | 0.19 | % | | | 0.10 | % | | | (0.16 | %) | | | 0.38 | % | | | (0.37 | %)†† |
Net expenses (excluding short sale expenses) | | | 1.56 | %†† | | | 1.54 | % | | | 1.58 | % | | | 1.58 | % | | | 1.60 | % | | | 1.59 | % †† |
Expenses (including short sales expenses, before waiver/reimbursement) | | | 2.68 | %†† | | | 2.61 | % | | | 2.27 | % | | | 2.50 | % | | | 2.57 | % | | | 2.59 | % †† |
Short sale expenses | | | 1.12 | %†† | | | 1.07 | % | | | 0.69 | % | | | 0.92 | % | | | 0.87 | % | | | 0.82 | % †† |
Portfolio turnover rate | | | 63 | % | | | 140 | % | | | 145 | % | | | 117 | % | | | 163 | % | | | 244 | % |
Net assets at end of period (in 000’s) | | $ | 280 | | | $ | 151 | | | $ | 121 | | | $ | 81 | | | $ | 53 | | | $ | 41 | |
| ** | Commencement of operations. |
| ‡ | Less than one cent per share. |
| (a) | Per share data based on average shares outstanding during the period. |
| (b) | Total investment return is calculated exclusive of sales charges and assumes the reinvestment of dividends and distributions. |
| (c) | Total investment return may reflect adjustments to conform to generally accepted accounting principles. |
| (d) | Total investment return is not annualized. |
| | | | |
| 26 | | MainStay U.S. Equity Opportunities Fund | | The notes to the financial statements are an integral part of,
and should be read in conjunction with, the financial statements. |
Financial Highlights selected per share data and ratios
| | | | | | | | | | | | | | | | | | | | | | | | |
| | | Class A | |
| | | Six months
ended
April 30, | | | Year ended October 31, | |
| | | 2013* | | | 2012 | | | 2011 | | | 2010 | | | 2009 | | | 2008 | |
Net asset value at beginning of period | | $ | 8.29 | | | $ | 7.89 | | | $ | 7.31 | | | $ | 6.41 | | | $ | 6.00 | | | $ | 9.64 | |
| | | | | | | | | | | | | | | | | | | | | | | | |
Net investment income (loss) (a) | | | 0.02 | | | | 0.02 | | | | 0.03 | | | | 0.00 | ‡ | | | 0.05 | | | | (0.02 | ) |
Net realized and unrealized gain (loss) on investments | | | 1.30 | | | | 1.03 | | | | 0.56 | | | | 0.92 | | | | 0.37 | | | | (3.61 | ) |
| | | | | | | | | | | | | | | | | | | | | | | | |
Total from investment operations | | | 1.32 | | | | 1.05 | | | | 0.59 | | | | 0.92 | | | | 0.42 | | | | (3.63 | ) |
| | | | | | | | | | | | | | | | | | | | | | | | |
Less dividends and distributions: | | | | | | | | | | | | | | | | | | | | | | | | |
From net investment income | | | (0.03 | ) | | | (0.02 | ) | | | (0.01 | ) | | | (0.02 | ) | | | (0.01 | ) | | | (0.01 | ) |
From net realized gain on investments | | | (0.53 | ) | | | (0.63 | ) | | | — | | | | — | | | | — | | | | — | |
| | | | | | | | | | | | | | | | | | | | | | | | |
Total dividends and distributions | | | (0.56 | ) | | | (0.65 | ) | | | (0.01 | ) | | | (0.02 | ) | | | (0.01 | ) | | | (0.01 | ) |
| | | | | | | | | | | | | | | | | | | | | | | | |
Net asset value at end of period | | $ | 9.05 | | | $ | 8.29 | | | $ | 7.89 | | | $ | 7.31 | | | $ | 6.41 | | | $ | 6.00 | |
| | | | | | | | | | | | | | | | | | | | | | | | |
Total investment return (b) | | | 17.06 | %(c) | | | 14.54 | % | | | 8.05 | % | | | 14.31 | % | | | 6.77 | % | | | (37.57 | %) |
Ratios (to average net assets)/Supplemental Data: | | | | | | | | | | | | | | | | | | | | | | | | |
Net investment income (loss) | | | 0.58 | %†† | | | 0.31 | % | | | 0.33 | % | | | 0.07 | % | | | 0.83 | % | | | (0.20 | %) |
Net expenses (excluding short sale expenses) | | | 1.30 | %†† | | | 1.30 | % | | | 1.34 | % | | | 1.34 | % | | | 1.46 | % | | | 1.50 | % |
Expenses (including short sales expenses, before waiver/reimbursement) | | | 2.40 | %†† | | | 2.35 | % | | | 2.03 | % | | | 2.29 | % | | | 2.40 | % | | | 2.60 | % |
Short sale expenses | | | 1.10 | %†† | | | 1.05 | % | | | 0.69 | % | | | 0.95 | % | | | 0.94 | % | | | 0.85 | % |
Portfolio turnover rate | | | 63 | % | | | 140 | % | | | 145 | % | | | 117 | % | | | 163 | % | | | 244 | % |
Net assets at end of period (in 000’s) | | $ | 1,574 | | | $ | 500 | | | $ | 417 | | | $ | 229 | | | $ | 138 | | | $ | 390 | |
| ‡ | Less than one cent per share. |
| (a) | Per share data based on average shares outstanding during the period. |
| (b) | Total investment return is calculated exclusive of sales charges and assumes the reinvestment of dividends and distributions. |
| (c) | Total investment return is not annualized. |
| | | | | | |
The notes to the financial statements are an integral part of,
and should be read in conjunction with, the financial statements. | | mainstayinvestments.com | | | 27 | |
Financial Highlights selected per share data and ratios
| | | | | | | | | | | | | | | | | | | | | | | | |
| | | Class C | |
| | | Six months
ended
April 30, | | | Year ended October 31, | |
| | | 2013* | | | 2012 | | | 2011 | | | 2010 | | | 2009 | | | 2008 | |
Net asset value at beginning of period | | $ | 7.93 | | | $ | 7.62 | | | $ | 7.12 | | | $ | 6.30 | | | $ | 5.95 | | | $ | 9.61 | |
| | | | | | | | | | | | | | | | | | | | | | | | |
Net investment income (loss) (a) | | | (0.01 | ) | | | (0.04 | ) | | | (0.05 | ) | | | (0.06 | ) | | | (0.02 | ) | | | (0.09 | ) |
Net realized and unrealized gain (loss) on investments | | | 1.22 | | | | 0.98 | | | | 0.55 | | | | 0.88 | | | | 0.37 | | | | (3.57 | ) |
| | | | | | | | | | | | | | | | | | | | | | | | |
Total from investment operations | | | 1.21 | | | | 0.94 | | | | 0.50 | | | | 0.82 | | | | 0.35 | | | | (3.66 | ) |
| | | | | | | | | | | | | | | | | | | | | | | | |
Less dividends and distributions: | | | | | | | | | | | | | | | | | | | | | | | | |
From net investment income | | | (0.00 | )‡ | | | — | | | | (0.00 | )‡ | | | — | | | | — | | | | — | |
From net realized gain on investments | | | (0.53 | ) | | | (0.63 | ) | | | — | | | | — | | | | — | | | | — | |
| | | | | | | | | | | | | | | | | | | | | | | | |
Total dividends and distributions | | | (0.53 | ) | | | (0.63 | ) | | | (0.00 | )‡ | | | — | | | | — | | | | — | |
| | | | | | | | | | | | | | | | | | | | | | | | |
Net asset value at end of period | | $ | 8.61 | | | $ | 7.93 | | | $ | 7.62 | | | $ | 7.12 | | | $ | 6.30 | | | $ | 5.95 | |
| | | | | | | | | | | | | | | | | | | | | | | | |
Total investment return (b) | | | 16.37 | % (c) | | | 13.42 | % | | | 7.05 | % | | | 13.02 | % | | | 5.88 | % | | | (38.15 | %) |
Ratios (to average net assets)/Supplemental Data: | | | | | | | | | | | | | | | | | | | | | | | | |
Net investment income (loss) | | | (0.28 | %)†† | | | (0.56 | %) | | | (0.63 | %) | | | (0.87 | %) | | | (0.41 | %) | | | (1.12 | %) |
Net expenses (excluding short sale expenses) | | | 2.31 | % †† | | | 2.30 | % | | | 2.32 | % | | | 2.34 | % | | | 2.35 | % | | | 2.33 | % |
Expenses (including short sales expenses, before waiver/reimbursement) | | | 3.45 | % †† | | | 3.36 | % | | | 3.02 | % | | | 3.23 | % | | | 3.31 | % | | | 3.41 | % |
Short sale expenses | | | 1.14 | % †† | | | 1.06 | % | | | 0.70 | % | | | 0.89 | % | | | 0.86 | % | | | 0.81 | % |
Portfolio turnover rate | | | 63 | % | | | 140 | % | | | 145 | % | | | 117 | % | | | 163 | % | | | 244 | % |
Net assets at end of period (in 000’s) | | $ | 580 | | | $ | 451 | | | $ | 379 | | | $ | 289 | | | $ | 370 | | | $ | 228 | |
| ‡ | Less than one cent per share. |
| (a) | Per share data based on average shares outstanding during the period. |
| (b) | Total investment return is calculated exclusive of sales charges and assumes the reinvestment of dividends and distributions. |
| (c) | Total investment return is not annualized. |
| | | | |
| 28 | | MainStay U.S. Equity Opportunities Fund | | The notes to the financial statements are an integral part of,
and should be read in conjunction with, the financial statements. |
Financial Highlights selected per share data and ratios
| | | | | | | | | | | | | | | | | | | | | | | | |
| | | Class I | |
| | | Six months
ended
April 30, | | | Year ended October 31, | |
| | | 2013* | | | 2012 | | | 2011 | | | 2010 | | | 2009 | | | 2008 | |
Net asset value at beginning of period | | $ | 8.32 | | | $ | 7.92 | | | $ | 7.33 | | | $ | 6.43 | | | $ | 6.02 | | | $ | 9.65 | |
| | | | | | | | | | | | | | | | | | | | | | | | |
Net investment income (loss) (a) | | | 0.04 | | | | 0.05 | | | | 0.05 | | | | 0.02 | | | | 0.04 | | | | 0.01 | |
Net realized and unrealized gain (loss) on investments | | | 1.29 | | | | 1.02 | | | | 0.57 | | | | 0.91 | | | | 0.38 | | | | (3.62 | ) |
| | | | | | | | | | | | | | | | | | | | | | | | |
Total from investment operations | | | 1.33 | | | | 1.07 | | | | 0.62 | | | | 0.93 | | | | 0.42 | | | | (3.61 | ) |
| | | | | | | | | | | | | | | | | | | | | | | | |
Less dividends and distributions: | | | | | | | | | | | | | | | | | | | | | | | | |
From net investment income | | | (0.05 | ) | | | (0.04 | ) | | | (0.03 | ) | | | (0.03 | ) | | | (0.01 | ) | | | (0.02 | ) |
From net realized gain on investments | | | (0.53 | ) | | | (0.63 | ) | | | — | | | | — | | | | — | | | | — | |
| | | | | | | | | | | | | | | | | | | | | | | | |
Total dividends and distributions | | | (0.58 | ) | | | (0.67 | ) | | | (0.03 | ) | | | (0.03 | ) | | | (0.01 | ) | | | (0.02 | ) |
| | | | | | | | | | | | | | | | | | | | | | | | |
Net asset value at end of period | | $ | 9.07 | | | $ | 8.32 | | | $ | 7.92 | | | $ | 7.33 | | | $ | 6.43 | | | $ | 6.02 | |
| | | | | | | | | | | | | | | | | | | | | | | | |
Total investment return (b) | | | 17.19 | %(c) | | | 14.76 | % | | | 8.42 | % | | | 14.53 | % | | | 7.05 | % | | | (37.48 | %) |
Ratios (to average net assets)/Supplemental Data: | | | | | | | | | | | | | | | | | | | | | | | | |
Net investment income (loss) | | | 0.99 | %†† | | | 0.69 | % | | | 0.61 | % | | | 0.33 | % | | | 0.69 | % | | | 0.07 | % |
Net expenses (excluding short sale expenses) | | | 1.05 | %†† | | | 1.06 | % | | | 1.09 | % | | | 1.09 | % | | | 1.22 | % | | | 1.25 | % |
Expenses (including short sales expenses, before waiver/reimbursement) | | | 2.19 | %†† | | | 2.12 | % | | | 1.79 | % | | | 2.01 | % | | | 2.08 | % | | | 2.16 | % |
Short sale expenses | | | 1.14 | %†† | | | 1.06 | % | | | 0.70 | % | | | 0.92 | % | | | 0.86 | % | | | 0.81 | % |
Portfolio turnover rate | | | 63 | % | | | 140 | % | | | 145 | % | | | 117 | % | | | 163 | % | | | 244 | % |
Net assets at end of period (in 000’s) | | $ | 554,375 | | | $ | 461,366 | | | $ | 380,953 | | | $ | 334,987 | | | $ | 189,845 | | | $ | 84,861 | |
| (a) | Per share data based on average shares outstanding during the period. |
| (b) | Total investment return is calculated exclusive of sales charges and assumes the reinvestment of dividends and distributions. Class I shares are not subject to sales charges. |
| (c) | Total investment return is not annualized. |
| | | | | | |
The notes to the financial statements are an integral part of,
and should be read in conjunction with, the financial statements. | | mainstayinvestments.com | | | 29 | |
Notes to Financial Statements (Unaudited)
Note 1–Organization and Business
MainStay Funds Trust (the “Trust”) was organized as a Delaware statutory trust on April 28, 2009, and is governed by a Declaration of Trust. The Trust is registered under the Investment Company Act of 1940, as amended (the “1940 Act”), as an open-end investment management company, and is comprised of thirty-three funds (collectively referred to as the “Funds”). At a meeting of the Board of Trustees (“Board”) of the Trust on December 10-12, 2012, the Board approved a change to the name of the MainStay 130/30 Core Fund, and modifications to its principal investment strategies. Accordingly, effective February 28, 2013, the MainStay 130/30 Core Fund’s name changed to MainStay U.S. Equity Opportunities Fund (the “Fund”). The Fund is the successor of a series of Eclipse Funds Inc., the MainStay 130/30 Core Fund, (the “Predecessor Fund”). The reorganization of the Predecessor Fund with and into the Fund occurred on February 26, 2010. All information and references to periods prior to February 26, 2010 relate to the Predecessor Fund. These financial statements and notes relate only to the MainStay U.S. Equity Opportunities Fund (formerly known as MainStay 130/30 Core Fund) (the “Fund”), a diversified fund.
The Fund currently offers four classes of shares. Class A, Class C and Class I shares commenced operations on June 29, 2007. Investor Class shares commenced operations on February 28, 2008.
Investor Class and Class A shares are offered at net asset value (“NAV”) per share plus an initial sales charge. No sales charge applies to investments of $1 million or more (and certain other qualified purchases) in Investor Class and Class A shares, but a contingent deferred sales charge (“CDSC”) is imposed on certain redemptions within one year of the date of purchase. Class C shares are offered at NAV without an initial sales charge, although a 1.00% CDSC may be imposed on redemptions made within one year of the date of purchase. Class I shares are offered at NAV without imposition of a front-end sales charge or a CDSC. Depending upon eligibility, Investor Class shares may convert to Class A shares and Class A shares may convert to Investor Class shares. The four classes of shares have the same voting (except for issues that relate solely to one class), dividend, liquidation and other rights, and the same terms and conditions, except that Class C shares are subject to higher distribution and/or service fee rates than Investor Class and Class A shares under a distribution plan pursuant to Rule 12b-1 under the 1940 Act. Class I shares are not subject to a distribution and/or service fee.
The Fund’s investment objective is to seek long-term growth of capital.
Note 2–Significant Accounting Policies
The Fund prepares its financial statements in accordance with generally accepted accounting principles (“GAAP”) in the United States of America and follows the significant accounting policies described below.
(A) Securities Valuation. Investments are valued as of the close of regular trading on the New York Stock Exchange (“Exchange”) (generally 4:00 p.m. Eastern time) on each day the Fund is open for business (“valuation date”).
The Board of Trustees (the “Board”) has adopted procedures for the valuation of the Fund’s securities and has delegated the responsibility for valuation determination under those procedures to the Valuation
Committee of the Fund (the “Valuation Committee”). The Board has authorized the Valuation Committee to appoint a Valuation Sub-Committee (the “Sub-Committee”) to deal in the first instance with questions that arise or cannot be resolved under these procedures. The Sub-Committee meets (in person, via electronic mail or via teleconference) on an as-needed basis. The Valuation Committee meets at a later time, as necessary, to ensure that actions taken by the Sub-Committee were appropriate. The procedures recognize that, subject to the oversight of the Board and unless otherwise noted, the responsibility for day-to-day valuation of portfolio assets (including securities for which market prices are not readily available) rests with New York Life Investment Management LLC ( “New York Life Investments” or the “Manager”), aided to whatever extent necessary by the Subadvisor (as defined in Note 3(A)) of the Fund.
To assess the appropriateness of security valuations, the Manager or the Fund’s third party service provider who is subject to oversight by the Manager, regularly compares prior day prices, prices on comparable securities and the sale prices to the prior and current day prices and challenges prices exceeding certain tolerance levels with third party pricing services or broker sources. For those securities valued by recommendation, whether through a standardized fair valuation methodology or a fair valuation determination, the Valuation Committee reviews and affirms the reasonableness of the valuation based on such methodologies and determinations on a regular basis after considering all relevant information that is reasonably available.
“Fair value” is defined as the price that the Fund would receive upon selling an investment in an orderly transaction to an independent buyer in the principal or most advantageous market of the investment. Fair value measurements are determined within a framework that has established a three-tier hierarchy which maximizes the use of observable market data and minimizes the use of unobservable inputs to establish classification of fair value measurements for disclosure purposes. “Inputs” refers broadly to the assumptions that market participants would use in pricing the asset or liability, including assumptions about risk, such as the risk inherent in a particular valuation technique used to measure fair value using a pricing model and/or the risk inherent in the inputs for the valuation technique. Inputs may be observable or unobservable. Observable inputs reflect the assumptions market participants would use in pricing the asset or liability based on market data obtained from sources independent of the Fund. Unobservable inputs reflect the Fund’s own assumptions about the assumptions market participants would use in pricing the asset or liability developed based on the information available in the circumstances. The inputs or methodology used for valuing securities may not be an indication of the risks associated with investing in those securities. The three-tier hierarchy of inputs is summarized in the three broad Levels listed below.
| • | | Level 1—quoted prices in active markets for identical investments |
| • | | Level 2—other significant observable inputs (including quoted prices for similar investments in active markets, interest rates and yield curves, prepayment speeds, credit risks, etc.) |
| • | | Level 3—significant unobservable inputs (including the Fund’s own assumptions about the assumptions that market participants would use in determining the fair value of investments) |
| | |
| 30 | | MainStay U.S. Equity Opportunities Fund |
The aggregate value by input level, as of April 30, 2013, for the Fund’s investments is included at the end of the Fund’s Portfolio of Investments.
The valuation techniques used by the Fund to measure fair value maximize the use of observable inputs and minimize the use of unobservable inputs. The Fund may utilize third party vendor evaluations, whose prices may be derived from one or more of the following standard inputs:
| | |
• Benchmark Yields | | • Reported Trades |
• Broker Dealer Quotes | | • Issuer Spreads |
• Two-sided markets | | • Benchmark securities |
• Bids/Offers | | • Reference Data (corporate actions or material event notices) |
• Industry and economic events | | • Comparable bonds |
• Equity and credit default swap curves | | • Monthly payment information |
Securities for which market values cannot be determined using the methodologies described above are valued by methods deemed in good faith by the Fund’s Valuation Committee, following the procedures established by the Board, to represent fair value. Under these procedures, the Fund primarily employs a market-based approach which may use related or comparable assets or liabilities, recent transactions, market multiples, book values, and other relevant information. The Fund may also use an income-based valuation approach in which the anticipated future cash flows of the investment are discounted to calculate fair value. Discounts may also be applied due to the nature or duration of any restrictions on the disposition of the investments. Due to the inherent uncertainty of valuations of such investments, the fair values may differ significantly from the values that would have been used had an active market existed. For the six-month period ended April 30, 2013, there have been no changes to the fair value methodologies.
Equity and non-equity securities which may be valued in this manner include, but are not limited to: (i) a security for which the trading has been halted or suspended; (ii) a debt security that has recently gone into default and for which there is not a current market quotation; (iii) a security of an issuer that has entered into a restructuring; (iv) a security that has been de-listed from a national exchange; (v) a security for which the market price is not available from a third party pricing source or, if so provided, does not, in the opinion of the Fund’s Manager or Subadvisor reflect the security’s market value; and (vi) a security whose principal market has been temporarily closed at a time when, under normal conditions, it would be open. Securities for which market quotations or observable inputs are not readily available are generally categorized as Level 3 in the hierarchy. As of April 30, 2013, the Fund did not hold any securities that were fair valued in such a manner.
Certain events may occur between the time that foreign markets close, on which securities held by the Fund principally trade, and the time at which the Fund’s NAV is calculated. These events may include, but are not limited to, situations relating to a single issuer in a market sector, significant fluctuations in U.S. or foreign markets, natural disasters, armed conflicts, governmental actions or other developments not tied directly to the securities markets. Should the Manager or Subadvisor conclude that such events may have affected the accuracy of the last price of such securities reported on the local foreign market, the
Manager or Subadvisor may, pursuant to procedures adopted by the Board, adjust the value of the local price to reflect the estimated impact on the price of such securities as a result of such events. In this instance, securities are generally categorized as Level 3 in the hierarchy. Additionally, foreign equity securities are also fair valued whenever the movement of a particular index exceeds certain thresholds. In such cases, the securities are fair valued by applying factors provided by a third party vendor in accordance with the Fund’s policies and procedures and are generally categorized as Level 2 in the hierarchy. As of April 30, 2013, certain foreign equity securities held by the Fund were not fair valued in such a manner.
Equity securities and Exchange Traded Funds are valued at the latest quoted sales prices as of the close of regular trading on the Exchange on each valuation date. Securities that are not traded on the valuation date are valued at the mean of the latest quoted bid and ask prices. Prices normally are taken from the principal market in which each security trades. Options contracts are valued at the last posted settlement price on the market where such options are principally traded. Investments in other mutual funds are valued at their respective NAVs as of the close of the Exchange on the valuation date. These securities are generally categorized as Level 1 in the hierarchy.
Temporary cash investments acquired over 60 days to maturity are valued using the latest bid prices or using valuations based on a matrix system (which considers such factors as security prices, yields, maturities, and ratings), both as furnished by independent pricing services. Other temporary cash investments which mature in 60 days or less (“Short-Term Investments”) are valued at amortized cost. The amortized cost method involves valuing a security at its cost on the date of purchase and thereafter assuming a constant amortization to maturity of the difference between such cost and the value on maturity date. Amortized cost approximates the current fair value of a security. Securities valued at amortized cost are not valued using a quoted price in an active market. These securities are generally categorized as Level 2 in the hierarchy.
Foreign currency forward contracts are valued at their fair market values determined on the basis of the mean between the last current bid and ask prices based on dealer or exchange quotations and are generally categorized as Level 2 in the hierarchy.
Generally, a security is considered illiquid if it cannot be sold or disposed of in the ordinary course of business at approximately the price at which it is valued. Its illiquidity might prevent the sale of such security at a time when the Manager or Subadvisor might wish to sell, and these securities could have the effect of decreasing the overall level of a Fund’s liquidity. Further, the lack of an established secondary market may make it more difficult to value illiquid securities, requiring the Fund to rely on judgments that may be somewhat subjective in determining value, which could vary from the amount that the Fund could realize upon disposition. Difficulty in selling illiquid securities may result in a loss or may be costly to the Fund. Under the supervision of the Board, the Manager or Subadvisor determines the liquidity of the Fund’s investments; in doing so, the Manager or Subadvisor may consider various factors, including (i) the frequency of trades and quotations, (ii) the number of dealers and prospective purchasers, (iii) dealer undertakings to make a market, and (iv) the nature of the security and the
| | | | |
| mainstayinvestments.com | | | 31 | |
Notes to Financial Statements (Unaudited) (continued)
market in which it trades (e.g., the time needed to dispose of the security, the method of soliciting offers and the mechanics of transfer). Illiquid securities generally will be valued in good faith in such a manner as the Board deems appropriate to reflect their fair value.
(B) Income Taxes. The Fund’s policy is to comply with the requirements of the Internal Revenue Code of 1986, as amended (the “Internal Revenue Code”), applicable to regulated investment companies and to distribute all of the taxable income to the shareholders of the Fund within the allowable time limits. Therefore, no federal, state and local income tax provision is required.
Management evaluates its tax positions to determine if the tax positions taken meet the minimum recognition threshold in connection with accounting for uncertainties in income tax positions taken or expected to be taken for the purposes of measuring and recognizing tax liabilities in the financial statements. Recognition of tax benefits of an uncertain tax position is required only when the position is “more likely than not” to be sustained assuming examination by taxing authorities. Management has analyzed the Fund’s tax positions taken on federal, state and local income tax returns for all open tax years (for up to three tax years), and has concluded that no provision for federal, state and local income tax is required in the Fund’s financial statements. The Fund’s federal, state and local income and federal excise tax returns for tax years for which the applicable statutes of limitations have not expired are subject to examination by the Internal Revenue Service and state and local departments of revenue.
(C) Foreign Taxes. Investment income received by the Fund from foreign sources may be subject to foreign income taxes. These foreign income taxes are generally withheld at the source, a portion of which may be recoverable. The Fund will accrue such taxes and recoveries as applicable, based upon its current interpretation of tax rules and regulations that exist in the markets in which it invests.
The Fund may be subject to taxation on realized capital gains, repatriation proceeds and other transaction-based taxes imposed by certain countries in which it invests. The Fund will accrue such taxes as applicable based upon its current interpretation of tax rules and regulations that exist in the market in which it invests. Capital gains taxes relating to positions still held are reflected as a liability on the Statement of Assets and Liabilities, as well as an adjustment to the Fund’s net unrealized appreciation (depreciation). Taxes related to capital gains realized during the six-month period ended April 30, 2013, if any, are reflected as part of net realized gain (loss) in the Statement of Operations. Changes in tax liabilities related to capital gains taxes on unrealized investment gains, if any, are reflected as part of the change in net unrealized appreciation (depreciation) on investments in the Statement Operations. Transaction-based charges are generally assessed as a percentage of the transaction amount.
(D) Dividends and Distributions to Shareholders. Dividends and distributions are recorded on the ex-dividend date. The Fund intends to declare and pay dividends of net investment income and distributions of net realized capital gains, if any, at least annually. Unless the shareholder elects otherwise, all dividends and distributions are reinvested in the same class of shares of the Fund, at NAV. Dividends and distributions to shareholders are determined in accordance with federal income tax regulations and may differ from GAAP.
(E) Security Transactions and Investment Income. The Fund records security transactions on the trade date. Realized gains and losses on security transactions are determined using the identified cost method. Dividend income is recognized on the ex-dividend date and interest income is accrued as earned using the effective interest rate method. Discounts and premiums on Short-Term Investments are accreted and amortized, respectively, on the straight-line method.
Investment income and realized and unrealized gains and losses on investments of the Fund are allocated to separate classes of shares pro rata based upon their relative net assets on the date the income is earned or realized and unrealized gains and losses are incurred.
(F) Expenses. Expenses of the Trust are allocated to the individual Funds in proportion to the net assets of the respective Funds when the expenses are incurred, except where direct allocations of expenses can be made. Expenses (other than transfer agent expenses and fees incurred under the shareholder services plans and the distribution plans further discussed in Note 3(B)) are allocated to separate classes of shares pro rata based upon their relative net assets on the date the expenses are incurred. The expenses borne by the Fund, including those of related parties to the Fund, are shown in the Statement of Operations.
(G) Use of Estimates. In preparing financial statements in conformity with GAAP, management makes estimates and assumptions that affect the reported amounts and disclosures in the financial statements. Actual results could differ from those estimates.
(H) Repurchase Agreements. The Fund may enter into repurchase agreements to earn income. The Fund may enter into repurchase agreements only with financial institutions that are deemed by the Manager or Subadvisor to be creditworthy, pursuant to guidelines established by the Fund’s Board. During the term of any repurchase agreement, the Manager or Subadvisor will continue to monitor the creditworthiness of the seller. Under the 1940 Act, repurchase agreements are considered to be collateralized loans by a Fund to the seller secured by the securities transferred to the Fund.
When the Fund invests in repurchase agreements, the Fund’s custodian takes possession of the collateral pledged for investments in the repurchase agreement. The underlying collateral is valued daily on a mark-to-market basis to determine that the value, including accrued interest, exceeds the repurchase price. In the event of the seller’s default on the obligation to repurchase, the Fund has the right to liquidate the collateral and apply the proceeds in satisfaction of the obligation. Under certain circumstances, such as in the event of default or bankruptcy by the counterparty to the agreement, realization and/or retention of the collateral may be subject to legal proceedings and possible realized loss to the Fund.
(I) Securities Sold Short. The Fund typically engages in short sales as part of its investment strategies. When the Fund enters into a short sale, it must segregate the cash proceeds from the security sold short or other securities, as collateral for its obligation to deliver the security upon conclusion of the sale. During the period a short position is open, depending on the nature and type of security, short positions held are reflected as liabilities and are marked to market in accordance with the valuation methodologies previously detailed (See Note 2(A)). Liabilities for securities sold short are closed out by purchasing the
| | |
| 32 | | MainStay U.S. Equity Opportunities Fund |
applicable securities for delivery to the counterparty broker. A gain, limited to the price at which the Fund sold the security short, or a loss, unlimited as to dollar amount, will be recognized upon termination of a short sale if the market price on the date the short position is closed out is less or greater, respectively, than the proceeds originally received. Any such gain or loss may be offset, completely or in part, by the change in the value of the hedged investments. Dividends declared on short positions existing on the record date are recorded on the ex-dividend date as a dividend expense on the Statement of Operations.
(J) Foreign Currency Forward Contracts. The Fund may enter into foreign currency forward contracts, which are agreements to buy or sell currencies of different countries on a specified future date at a specified rate. The Fund is subject to foreign currency exchange rate risk in the normal course of investing in these transactions. During the period the forward contract is open, changes in the value of the contract are recognized as unrealized appreciation or depreciation by ‘‘marking-to-market’’ such contract on a daily basis to reflect the market value of the contract at the end of each day’s trading. Cash movement occurs on settlement date. When the forward contract is closed, the Fund records a realized gain or loss equal to the difference between the proceeds from (or cost of) the closing transaction and the Fund’s basis in the contract. The Fund may enter into foreign currency forward contracts primarily to hedge its foreign currency denominated investments and receivables and payables against adverse movements in future foreign exchange rates or to try to enhance the Fund’s returns.
The use of foreign currency forward contracts involves, to varying degrees, elements of market risk in excess of the amount recognized in the Statement of Assets and Liabilities. The contract amount reflects the extent of the Fund’s involvement in these financial instruments. Risks arise from the possible movements in the foreign exchange rates underlying these instruments. While the Fund may enter into forward contracts to reduce currency exchange risks, changes in currency exchange rates may result in poorer overall performance for the Fund than if it had not engaged in such transactions. Exchange rate movements can be large, depending on the currency, and can last for extended periods of time, affecting the value of the Fund’s assets. Moreover, there may be an imperfect correlation between the Fund’s holdings of securities denominated in a particular currency and the forward contracts entered into by the Fund. Such imperfect correlation may prevent the Fund from achieving the intended hedge or expose the Fund to the risk of currency exchange loss. The unrealized appreciation (depreciation) on forward contracts reflects the Fund’s exposure at valuation date to credit loss in the event of a counterparty’s failure to perform its obligations. As of April 30, 2013, the Fund did not hold any foreign currency forward contracts.
(K) Foreign Currency Transactions. The books and records of the Fund are kept in U.S. dollars. Prices of securities denominated in foreign currency amounts are translated into U.S. dollars at the mean between the buying and selling rates last quoted by any major U.S. bank at the following dates:
(i) market value of investment securities, other assets and liabilities—at the valuation date, and
(ii) purchases and sales of investment securities, income and expenses—at the date of such transactions.
The assets and liabilities that are denominated in foreign currency amounts are presented at the exchange rates and market values at the close of the period. The realized and unrealized changes in net assets arising from fluctuations in exchange rates and market prices of securities are not separately presented.
Net realized gain (loss) on foreign currency transactions represents net gains and losses on foreign currency forward contracts, net currency gains or losses realized as a result of differences between the amounts of securities sale proceeds or purchase cost, dividends, interest and withholding taxes as recorded on the Fund’s books, and the U.S. dollar equivalent amount actually received or paid. Net currency gains or losses from valuing such foreign currency denominated assets and liabilities, other than investments at valuation date exchange rates, are reflected in unrealized foreign exchange gains or losses.
(L) Rights and Warrants. Rights are certificates that permit the holder to purchase a certain number of shares, or a fractional share, of a new stock from the issuer at a specific price. Warrants are instruments that entitle the holder to buy an equity security at a specific price for a specific period of time. The Fund may enter into rights and warrants when securities are acquired through a corporate action. With respect to warrants in international markets, the securities may be purchased only when the underlying security cannot be purchased due to the many restrictions an industry and/or country might place on foreign investors. These investments can provide a greater potential for profit or loss than an equivalent investment in the underlying security. Prices of these investments do not necessarily move in tandem with the prices of the underlying securities.
There is risk involved in the purchase of rights and warrants in that these investments are speculative investments. The Fund could also lose the entire value of its investment in warrants, if such warrants are not exercised by the date of its expiration. The securities are sold as soon as the opportunity becomes available. The Fund is exposed to risk until the sale or exercise of each right or warrant is completed. As of April 30, 2013, the Fund did not hold any rights or warrants.
(M) Securities Lending. In order to realize additional income, the Fund may engage in securities lending, subject to the limitations set forth in the 1940 Act and relevant guidance by the staff of the Securities and Exchange Commission. In the event the Fund does engage in securities lending, the Fund will lend through its custodian, State Street Bank and Trust Company (“State Street”). State Street will manage the Fund’s cash collateral in accordance with the lending agreement between the Fund and State Street, and indemnify the Fund’s portfolio against counterparty risk. The loans will be collateralized by cash or securities at least equal at all times to the market value of the securities loaned. Collateral will consist of U.S. Government securities, cash equivalents or irrevocable letters of credit. The Fund may bear the risk of delay in recovery of, or loss of rights in, the securities loaned should the borrower of the securities experience financial difficulty. The Fund may also record realized gain or loss on securities deemed sold due to a borrower’s inability to return securities on loan. The Fund will receive compensation for lending its securities in the form of fees or the retention of a portion of the interest on the investment of any cash received as collateral. The Fund also will continue to receive interest and dividends on the securities loaned and any gain or loss in the market price of the securities loaned that may occur during the term of the loan will be for the account of the Fund.
| | | | |
| mainstayinvestments.com | | | 33 | |
Notes to Financial Statements (Unaudited) (continued)
Although the Fund and New York Life Investments have temporarily suspended securities lending, the Fund and New York Life Investments reserve the right to reinstitute lending when deemed appropriate. The Fund did not have any portfolio securities on loan as of April 30, 2013.
(N) Statement of Cash Flows. The cash amount shown in the Statement of Cash Flows is the amount included in the Fund’s Statement of Assets and Liabilities and represents the cash on hand at its custodian and does not include any Short-Term Investments or deposit at brokers for securities sold short or restricted cash. Cash may include domestic and foreign currency.
(O) Indemnifications. Under the Trust’s organizational documents, its officers and trustees are indemnified against certain liabilities that may arise out of performance of their duties to the Trust. Additionally, in the normal course of business, the Fund enters into contracts with third-party service providers that contain a variety of representations and warranties and which may provide general indemnifications. The Fund’s maximum exposure under these arrangements is unknown, as this would involve future claims that may be made against the Fund that have not yet occurred. Based on experience, management is of the view that the risk of loss in connection with these potential indemnification obligations is remote. However, there can be no assurance that material liabilities related to such obligations will not arise in the future, which could adversely impact the Fund.
(P) Quantitative Disclosure of Derivative Holdings. The following tables show additional disclosures about the Fund’s derivative and hedging activities, including how such activities are accounted for and their effect on the Fund’s financial positions, performance and cash flows. These derivatives are not accounted for as hedging instruments.
Fair value of derivatives instruments as of April 30, 2013:
Realized Gain (Loss)
| | | | | | | | | | |
| | | Statement of
Operations
Location | | Equity
Contracts
Risk | | | Total | |
Warrants | | Net realized gain (loss) on investments/security transactions | | $ | 36,584 | | | $ | 36,584 | |
| | | | | | |
Total Realized Gain (Loss) | | | | $ | 36,584 | | | $ | 36,584 | |
| | | | | | |
Change in Unrealized Appreciation (Depreciation)
| | | | | | | | | | |
| | | Statement of
Operations
Location | | Equity
Contracts
Risk | | | Total | |
Warrants | | Net change in unrealized appreciation (depreciation) on investments | | $ | (22,637 | ) | | $ | (22,637 | ) |
| | | | | | |
Total Change in Unrealized Appreciation (Depreciation) | | | | $ | (22,637 | ) | | $ | (22,637 | ) |
| | | | | | |
Number of Contracts, Notional Amounts or Shares/Units (1)
| | | | | | | | |
| | | Equity
Contracts
Risk | | | Total | |
Warrants | | | 7,765 | | | | 7,765 | |
| | | | |
| (1) | Amount disclosed represents the weighted average held during the period ended April 30, 2013. |
Note 3–Fees and Related Party Transactions
(A) Manager and Subadvisor. New York Life Investments, a registered investment adviser and an indirect, wholly-owned subsidiary of New York Life Insurance Company (“New York Life”), serves as the Fund’s Manager, pursuant to an Amended and Restated Management Agreement (“Management Agreement”). The Manager provides offices, conducts clerical, recordkeeping and bookkeeping services, and keeps most of the financial and accounting records required to be maintained by the Fund. Except for the portion of salaries and expenses that are the responsibility of the Fund, the Manager pays the salaries and expenses of all personnel affiliated with the Fund and certain operational expenses of the Fund. The Fund reimburses New York Life Investments in an amount equal to a portion of the salary of the Chief Compliance Officer (“CCO”) of the Fund. Cornerstone Capital Management Holdings LLC (“Cornerstone Holdings” or “Subadvisor”), a registered investment adviser and an indirect, wholly-owned subsidiary of New York Life, serves as Subadvisor to and is responsible for the day-to-day portfolio management of the Funds. Pursuant to the terms of a Subadvisory Agreement (“Subadvisory Agreement”) between New York Life Investments and Cornerstone Holdings, New York Life Investments pays for the Subadvisor’s services. Effective January 25, 2013, Madison Square Investors LLC changed its name to Cornerstone Capital Management Holdings LLC.
The Fund pays the Manager a monthly fee for services performed and facilities furnished at 1.00% annual rate of average daily net assets of the Fund.
New York Life Investments has contractually agreed to waive fees and/or reimburse expenses so that Total Annual Fund Operating Expenses do not exceed the percentages of average daily net assets for Class A shares of 1.50%. Total Annual Fund Operating Expenses excludes taxes, interest, litigation, extraordinary expenses, brokerage and other transaction expenses relating to the purchase or sale of portfolio investments, and acquired (underlying) fund fees and expenses. New York Life Investments will apply an equivalent waiver or reimbursement, in an equal number of basis points, to the other share classes of the Fund. This agreement will remain in effect until February 28, 2014 and shall renew automatically for one-year terms unless New York Life Investments provides written notice of termination prior to the start of the next term or upon approval of the Board.
Additionally, New York Life Investments has agreed to voluntarily waive fees and/or reimburse expenses of the appropriate class of the Fund so that Total Annual Fund Operating Expenses do not exceed the following percentages of: 1.60% for Investor Class and 2.35% for Class C, respectively. These voluntary waivers or reimbursements may be discontinued at any time without notice.
| | |
| 34 | | MainStay U.S. Equity Opportunities Fund |
For the six-month period ended April 30, 2013, New York Life Investments earned fees from the Fund in the amount of $2,532,524.
State Street, 1 Lincoln Street, Boston, Massachusetts 02111, provides sub-administration and sub-accounting services to the Fund pursuant to an agreement with New York Life Investments. These services include calculating the daily NAVs of the Fund, maintaining the general ledger and sub-ledger accounts for the calculation of the Fund’s respective NAVs, and assisting New York Life Investments in conducting various aspects of the Fund’s administrative operations. For providing these services to the Fund, State Street is compensated by New York Life Investments.
(B) Distribution and Service Fees. The Trust, on behalf of the Fund, has entered into a distribution agreement with NYLIFE Distributors LLC (the “Distributor”), an indirect, wholly-owned subsidiary of New York Life. The Fund has adopted distribution plans (the “Plans”) in accordance with the provisions of Rule 12b-1 under the 1940 Act.
Pursuant to the Investor Class and Class A Plans, the Distributor receives a monthly distribution fee from Investor Class and Class A shares at an annual rate of 0.25% of the average daily net assets of the Investor Class and Class A shares for distribution and/or service activities as designated by the Distributor. Pursuant to the Class C Plan, Class C shares pay the Distributor a monthly distribution fee at an annual rate of 0.75% of the average daily net assets of the Class C shares, along with a service fee at an annual rate of 0.25% of the average daily net assets of the Class C shares, for a total 12b-1 fee of 1.00%. Class I shares are not subject to a distribution and/or service fee.
The Plans provide that the distribution and service fees are payable to the Distributor regardless of the amounts actually expended by the Distributor for distribution of the Fund’s shares and service activities.
(C) Sales Charges. The Fund was advised by the Distributor that the amount of sales charges retained on sales of Investor Class and Class A shares were $271 and $1,459, respectively, for the six-month period ended April 30, 2013.
(D) Transfer, Dividend Disbursing and Shareholder Servicing Agent. NYLIM Service Company LLC, an affiliate of New York Life Investments, is the Fund’s transfer, dividend disbursing and shareholder servicing agent pursuant to an agreement between NYLIM Service Company LLC and the Trust. NYLIM Service Company LLC has entered into an agreement with Boston Financial Data Services, Inc. (��BFDS”) pursuant to which BFDS performs certain transfer agent services on behalf of NYLIM Service Company LLC. Transfer agent expenses incurred by the Fund for the six-month period ended April 30, 2013, were as follows:
| | | | |
Investor Class | | $ | 245 | |
Class A | | | 9 | |
Class C | | | 640 | |
Class I | | | 5,571 | |
(E) Small Account Fee. Shareholders with small accounts adversely impact the cost of providing transfer agency services. In an effort to reduce total transfer agency expenses, the Fund has implemented a small account fee on certain types of accounts. Certain
shareholders with an account balance of less than $1,000 are charged an annual per account fee of $20 (assessed semi-annually), the proceeds from which offset transfer agent fees as reflected in the Statement of Operations.
(F) Capital. As of April 30, 2013, New York Life and its affiliates beneficially held shares of the Fund with values and percentages of net assets as follows:
| | | | | | | | |
Investor Class | | $ | 30,244 | | | | 10.8 | % |
Class A | | | 26,476 | | | | 1.7 | |
Class C | | | 25,149 | | | | 4.3 | |
Class I | | | 26,665,758 | | | | 4.8 | |
Note 4–Federal Income Tax
The tax character of distributions paid during the year ended October 31, 2012, shown in the Statements of Changes in Net Assets was as follows:
| | | | |
| | | 2012 | |
Distributions paid from: | | | | |
Ordinary Income | | $ | 2,634,363 | |
Long-Term Capital Gain | | | 30,771,977 | |
Total | | $ | 33,406,340 | |
Note 5–Custodian
State Street is the custodian of the cash and the securities of the Fund. Custodial fees are charged to the Fund based on the market value of securities in the Fund and the number of certain cash transactions incurred by the Fund.
Note 6–Line of Credit
The Fund and certain affiliated funds maintain a line of credit with a syndicate of banks in order to secure a source of funds for temporary purposes to meet unanticipated or excessive redemption requests.
Effective August 29, 2012, under a second amended and restated credit agreement (the “Credit Agreement”), the aggregate commitment amount is $200,000,000 with an optional maximum amount of $250,000,000. The commitment fee is an annual rate of 0.08% of the average commitment amount payable quarterly, regardless of usage, to Bank of New York Mellon, which serves as the agent to the syndicate. The commitment fee is allocated among the Fund and certain affiliated funds based upon net assets and other factors. Interest on any revolving credit loan is charged based upon the Federal Funds Advances rate or the one month London InterBank Offered Rate, whichever is higher. The Credit Agreement expires on August 28, 2013, although the Fund, certain affiliated funds and the syndicate of banks may renew the Credit Agreement for an additional year on the same or different terms. There were no borrowings made or outstanding with respect to the Fund on the Credit Agreement during the six-month period ended April 30, 2013.
| | | | |
| mainstayinvestments.com | | | 35 | |
Notes to Financial Statements (Unaudited) (continued)
Note 7–Purchases and Sales of Securities (in 000’s)
During the six-month period ended April 30, 2013, purchases and sales of securities, other than short-term securities, were $424,828 and $426,335, respectively.
Note 8–Capital Share Transactions
| | | | | | | | |
Investor Class | | Shares | | | Amount | |
Six-month period ended April 30, 2013: | | | | | | | | |
Shares sold | | | 11,628 | | | $ | 100,678 | |
Shares issued to shareholders in reinvestment of dividends and distributions | | | 1,318 | | | | 10,174 | |
Shares redeemed | | | (182 | ) | | | (1,568 | ) |
| | | | |
Net increase (decrease) | | | 12,764 | | | $ | 109,284 | |
| | | | |
Year ended October 31, 2012: | | | | | | | | |
Shares sold | | | 6,281 | | | $ | 49,206 | |
Shares issued to shareholders in reinvestment of dividends and distributions | | | 1,368 | | | | 9,929 | |
Shares redeemed | | | (2,705 | ) | | | (21,154 | ) |
| | | | |
Net increase (decrease) in shares outstanding before conversion | | | 4,944 | | | | 37,981 | |
Shares converted from Investor Class (See Note 1) | | | (2,084 | ) | | | (15,816 | ) |
| | | | |
Net increase (decrease) | | | 2,860 | | | $ | 22,165 | |
| | | | |
| | |
| | | | | | | | |
Class A | | Shares | | | Amount | |
Six-month period ended April 30, 2013: | | | | | | | | |
Shares sold | | | 204,773 | | | $ | 1,742,941 | |
Shares issued to shareholders in reinvestment of dividends and distributions | | | 3,512 | | | | 27,185 | |
Shares redeemed | | | (94,643 | ) | | | (785,461 | ) |
| | | | |
Net increase (decrease) | | | 113,642 | | | $ | 984,665 | |
| | | | |
Year ended October 31, 2012: | | | | | | | | |
Shares sold | | | 72,044 | | | $ | 572,952 | |
Shares issued to shareholders in reinvestment of dividends and distributions | | | 3,986 | | | | 29,018 | |
Shares redeemed | | | (70,619 | ) | | | (570,116 | ) |
| | | | |
Net increase (decrease) in shares outstanding before conversion | | | 5,411 | | | | 31,854 | |
Shares converted into Class A (See Note 1) | | | 2,078 | | | | 15,816 | |
| | | | |
Net increase (decrease) | | | 7,489 | | | $ | 47,670 | |
| | | | |
| | |
| | | | | | | | |
| | | | | | | | |
Class C | | Shares | | | Amount | |
Six-month period ended April 30, 2013: | | | | | | | | |
Shares sold | | | 13,250 | | | $ | 107,643 | |
Shares issued to shareholders in reinvestment of dividends and distributions | | | 1,228 | | | | 9,086 | |
Shares redeemed | | | (4,065 | ) | | | (31,390 | ) |
| | | | |
Net increase (decrease) | | | 10,413 | | | $ | 85,339 | |
| | | | |
Year ended October 31, 2012: | | | | | | | | |
Shares sold | | | 19,174 | | | $ | 149,939 | |
Shares issued to shareholders in reinvestment of dividends and distributions | | | 1,331 | | | | 9,357 | |
Shares redeemed | | | (13,303 | ) | | | (104,987 | ) |
| | | | |
Net increase (decrease) | | | 7,202 | | | $ | 54,309 | |
| | | | |
| | |
| | | | | | | | |
Class I | | Shares | | | Amount | |
Six-month period ended April 30, 2013: | | | | | | | | |
Shares sold | | | 5,805,161 | | | $ | 48,534,382 | |
Shares issued to shareholders in reinvestment of dividends and distributions | | | 4,219,230 | | | | 32,697,287 | |
Shares redeemed | | | (4,337,892 | ) | | | (37,295,773 | ) |
| | | | |
Net increase (decrease) | | | 5,686,499 | | | $ | 43,935,896 | |
| | | | |
Year ended October 31, 2012: | | | | | | | | |
Shares sold | | | 19,893,100 | | | $ | 154,143,081 | |
Shares issued to shareholders in reinvestment of dividends and distributions | | | 4,571,556 | | | | 33,326,645 | |
Shares redeemed | | | (17,135,296 | ) | | | (136,798,940 | ) |
| | | | |
Net increase (decrease) | | | 7,329,360 | | | $ | 50,670,786 | |
| | | | |
Note 9–Litigation
The Fund has been named as a defendant and a putative member of the proposed defendant group of shareholders in the case now entitled Kirschner v. FitzSimons, et al. (In re Tribune Company), No. 12-2652 (S.D.N.Y.) (the “FitzSimons action”) as a result of its ownership of shares in the Tribune Company (“Tribune”) in 2007 when Tribune effected a leveraged buyout transaction (“LBO”) by which Tribune converted to a privately-held company. In its complaint, which was served on the Fund in October 2012, the plaintiff asserts claims against certain insiders, shareholders, professional advisers, and others involved in the LBO. Separately, the complaint also seeks to recover proceeds received by shareholders through the LBO from a putative defendant class comprised of former Tribune shareholders other than the insiders, major shareholders and certain other defendants. The sole claim and cause of action brought against the Fund either as a named defendant or as a member of the putative defendant class is for fraudulent conveyance pursuant to United States Bankruptcy Code Section 548(a)(1)(A).
In June 2011, certain Tribune creditors filed numerous additional actions asserting state law constructive fraudulent conveyance claims (the “SLCFC actions”) against specifically-named former Tribune shareholders and, in some cases, putative defendant classes comprised of former Tribune shareholders. One of the SLCFC actions, entitled Deutsche Bank Trust Co. Americas v. Blackrock Institutional Trust Co., No. 11-9319 (S.D.N.Y.) (the “Deutsche Bank action”), named the Fund as a defendant.
| | |
| 36 | | MainStay U.S. Equity Opportunities Fund |
The FitzSimons and Deutsche Bank actions have been consolidated with the majority of the other Tribune LBO-related lawsuits in a multidistrict litigation proceeding entitled In re Tribune Co. Fraudulent Conveyance Litig., No. 11-md-2296 (S.D.N.Y.) (the “MDL Proceeding”). On November 6, 2012, the defendants moved to dismiss the SLCFC actions, including the Deutsche Bank action. Oral arguments on this motion were held on May 23, 2013. The Court has not yet issued a decision on the motion.
On May 17, 2013, the plaintiff in the FitzSimons action requested leave of the Court to file a Fifth Amended Complaint. The Court has not yet ruled on this matter.
These lawsuits do not allege any misconduct on the part of the Fund. The value of the proceeds received by the Fund in connection with the LBO and the Fund’s cost basis in shares of Tribune was as follows:
| | | | | | | | |
Portfolio | | Proceeds | | | Cost Basis | |
MainStay U.S. Equity Opportunities Fund | | $ | 45,424 | | | $ | 44,515 | |
At this stage of the proceedings, management is not able to assess with any reasonable certainty the probable outcome of the pending litigation or the effect, if any, on the Fund’s net asset values.
Note 10–Subsequent Events
In connection with the preparation of the financial statements of the Fund as of and for the six-month period ended April 30, 2013, events and transactions subsequent to April 30, 2013, through the date the financial statements were issued have been evaluated by the Fund’s management for possible adjustment and/or disclosure. No subsequent events requiring financial statement adjustment or disclosure have been identified.
| | | | |
| mainstayinvestments.com | | | 37 | |
Board Consideration and Approval of Management Agreement and
Subadvisory Agreement (Unaudited)
Section 15(c) of the Investment Company Act of 1940, as amended (the “1940 Act”) requires that each mutual fund’s board of trustees, including a majority of the independent trustees, annually review and approve the fund’s investment advisory agreements. At its December 10-12, 2012 meeting, the Board of Trustees of the MainStay Group of Funds (“Board”) unanimously approved the Management Agreement with respect to the MainStay 130/30 Core Fund, which subsequently changed its name to MainStay U.S. Equity Opportunities Fund (“Fund”), and New York Life Investment Management LLC (“New York Life Investments��), and the Subadvisory Agreement between New York Life Investments and Madison Square Investors LLC, which subsequently changed its name to Cornerstone Capital Management Holdings LLC (“Cornerstone Holdings”), with respect to the Fund.
In reaching its decision to approve the Agreements, the Board considered information furnished by New York Life Investments and Cornerstone Holdings in connection with a contract review process that took place at various meetings of the Board and its Contracts Committee between September 2012 and December 2012, as well as other relevant information furnished to the Board throughout the year by New York Life Investments and Cornerstone Holdings. Information requested by and furnished to the Board in connection with the contract review process included, among other items, reports on the Fund prepared by Strategic Insight Mutual Fund Research and Consulting, LLC (“Strategic Insight”), an independent third-party service provider engaged by the Board to report objectively on the Fund’s investment performance, management and subadvisory fees and ordinary operating expenses. The Board also considered information provided by New York Life Investments and Cornerstone Holdings on the fees charged to other investment advisory clients (including institutional separate accounts) that follow investment strategies similar to the Fund, and the rationale for any differences in the Fund’s management and subadvisory fees and the fees charged to those other investment advisory clients. In addition, the Board requested and received information on the profitability of the Fund to New York Life Investments and its affiliates, including Cornerstone Holdings as subadvisor to the Fund, and responses from New York Life Investments and Cornerstone Holdings to a series of questions encompassing a variety of topics prepared on behalf of the Board by independent legal counsel to the Board and its independent trustees (the “Independent Trustees”). Information provided to the Board at its meetings throughout the year included, among other items, detailed investment performance reports on the Fund prepared by the Investment Consulting Group at New York Life Investments. The structure and format for this regular reporting was developed in consultation with the Board. The Board also received from New York Life Investments throughout the year, among other items, periodic reports on legal and compliance matters, portfolio turnover, and sales and marketing activity.
In determining to approve the Agreements, the members of the Board reviewed and evaluated all of the information and factors they believed to be relevant and appropriate in light of legal advice furnished to them by independent legal counsel and through the exercise of their own business judgment. The broad factors considered by the Board are discussed in greater detail below, and included, among other items: (i) the nature, scope and quality of the services provided to the Fund by New York Life Investments and Cornerstone Holdings; (ii) the investment performance of the Fund, New York Life Investments and Cornerstone Holdings; (iii) the costs of the services provided, and profits realized, by
New York Life Investments and Cornerstone Holdings from their relationship with the Fund; (iv) the extent to which economies of scale may be realized as the Fund grows, and the extent to which economies of scale may benefit Fund investors; and (v) the reasonableness of the Fund’s management and subadvisory fees and overall total ordinary operating expenses, particularly as compared to similar funds and accounts managed by New York Life Investments and Cornerstone Holdings and third-party “peer funds” identified by Strategic Insight.
While individual members of the Board may have weighed certain factors differently, the Board’s decision to approve the Agreements was based on a consideration of all the information provided to the Board, including information provided to the Board throughout the year and specifically in connection with the contract review process. The Board’s conclusions with respect to the Agreements also were based, in part, on the Board’s consideration of the Agreements in prior years. In addition to considering the above-referenced factors, the Board observed that in the marketplace there are a range of investment options available to shareholders of the Fund, and that the Fund’s shareholders, having had the opportunity to consider other investment options, have chosen to invest in the Fund. A more detailed discussion of the factors that figured prominently in the Board’s decisions to approve the Agreements is provided below.
Nature, Scope and Quality of Services to Be Provided by New York Life Investments and Cornerstone Holdings
The Board examined the nature, scope and quality of the services that New York Life Investments provides to the Fund. The Board evaluated New York Life Investments’ experience in serving as manager of the Fund, noting that New York Life Investments manages other mutual funds, serves a variety of other investment advisory clients, including other pooled investment vehicles, and has experience with overseeing mutual fund service providers, including subadvisors. The Board considered the experience of senior personnel at New York Life Investments providing management and administrative services to the Fund, as well as New York Life Investments’ reputation and financial condition. The Board also considered the full range of non-advisory services that New York Life Investments supplies to the Fund under the terms of the Management Agreement, including: (i) fund accounting services provided by New York Life Investments’ Fund Accounting and Administration Group; (ii) investment oversight and analytical services provided by New York Life Investments’ Investment Consulting Group; (iii) compliance services provided by New York Life Investments’ compliance department, including oversight and implementation of the Fund’s compliance program; and (iv) legal services provided by New York Life Investments’ Office of the General Counsel. Additional information about the non-advisory services provided by New York Life Investments is set forth in the Fund’s Management Agreement. The Board also considered New York Life Investments’ willingness to invest in personnel that benefit the Fund, and noted that New York Life Investments is responsible for compensating the Fund’s officers. The Board also considered benefits to shareholders of being part of the MainStay Group of Funds, including the privilege of exchanging investments between the same class of shares without the imposition of a sales charge, as described more fully in the Fund’s prospectus.
| | |
| 38 | | MainStay U.S. Equity Opportunities Fund |
The Board also examined the nature, scope and quality of the advisory services that Cornerstone Holdings provides to the Fund. The Board evaluated Cornerstone Holdings’ experience in serving as subadvisor to the Fund and managing other portfolios. It examined Cornerstone Holdings’ track record and experience in providing investment advisory services, the experience of investment advisory, senior management and administrative personnel at Cornerstone Holdings, and Cornerstone Holdings’ overall legal and compliance environment. The Board also reviewed Cornerstone Holdings’ willingness to invest in personnel that benefit the Fund. In this regard, the Board considered the experience of the Fund’s portfolio managers, the number of accounts managed by the portfolio managers and the method for compensating portfolio managers.
Based on these considerations, the Board concluded, within the context of its overall determinations regarding the Agreements, that the Fund should continue to benefit from the nature, scope and quality of these services as a result of New York Life Investments’ and Cornerstone Holdings’ experience, personnel, operations and resources.
Investment Performance
In evaluating the Fund’s investment performance, the Board considered investment performance results in light of the Fund’s investment objective, strategies and risks, as disclosed in the Fund’s prospectus. The Board particularly considered detailed investment reports on the Fund’s performance provided to the Board throughout the year by the Investment Consulting Group of New York Life Investments. These reports include, among other items, information on the Fund’s gross and net returns, the Fund’s investment performance relative to relevant investment categories and Fund benchmarks, the Fund’s risk-adjusted investment performance, and the Fund’s investment performance as compared to similar competitor funds, as appropriate. The Board also considered information provided by Strategic Insight showing the investment performance of the Fund as compared to peer funds.
In considering the Fund’s investment performance, the Board focused principally on the Fund’s long-term performance track record. The Board also gave weight to its ongoing discussions with senior management at New York Life Investments concerning the Fund’s investment performance, as well as discussions between the Fund’s portfolio managers and the Board that occur typically on an annual basis. In addition, the Board considered any specific actions that New York Life Investments or Cornerstone Holdings had taken, or had agreed with the Board to take, to enhance Fund investment performance, and the results of those actions.
Based on these considerations, the Board concluded, within the context of its overall determinations regarding the Agreements, that the long-term investment performance of the Fund, along with ongoing efforts by New York Life Investments and Cornerstone Holdings to enhance investment returns, supported a determination to approve the Agreements. The Fund discloses more information about investment performance in the Portfolio Management Discussion and Analysis, Investment and Performance Comparison and Financial Highlights sections of this Semiannual Report and in the Fund’s prospectus.
Costs of the Services Provided, and Profits Realized, by New York Life Investments and Cornerstone Holdings
The Board considered the costs of the services provided by New York Life Investments and Cornerstone Holdings under the Agreements, and the profits realized by New York Life Investments and its affiliates, including Cornerstone Holdings, due to their relationships with the Fund. Because Cornerstone Holdings is an affiliate of New York Life Investments whose subadvisory fees are paid directly by New York Life Investments, the Board considered cost and profitability information for New York Life Investments and Cornerstone Holdings in the aggregate.
In evaluating the costs and profits of New York Life Investments and its affiliates, including Cornerstone Holdings, the Board considered, among other factors, each party’s investments in personnel, systems, equipment and other resources necessary to manage the Fund, and that New York Life Investments is responsible for paying the subadvisory fees for the Fund. The Board acknowledged that New York Life Investments and Cornerstone Holdings must be in a position to pay and retain experienced professional personnel to provide services to the Fund, and that the ability to maintain a strong financial position is important in order for New York Life Investments and Cornerstone Holdings to continue to provide high-quality services to the Fund. The Board also noted that the Fund benefits from the allocation of certain fixed costs across the MainStay Group of Funds.
In addition, the Board noted the difficulty in obtaining reliable comparative data about mutual fund managers’ profitability, since such information generally is not publicly available and may be impacted by numerous factors, including the structure of a fund manager’s organization, the types of funds it manages, the methodology used to allocate certain fixed costs to specific funds, and the manager’s capital structure and costs of capital. While recognizing the difficulty in evaluating a manager’s profitability with respect to the Fund, and noting that other profitability methodologies may also be reasonable, the Board concluded that the profitability methodology presented by New York Life Investments to the Board, which was developed by New York Life Investments in consultation with an independent consultant, was reasonable in all material respects.
In considering the costs and profitability of the Fund, the Board also considered certain fall-out benefits that may be realized by New York Life Investments and its affiliates due to their relationships with the Fund. The Board recognized, for example, the benefits to Cornerstone Holdings from legally permitted “soft-dollar” arrangements by which brokers provide research and other services to Cornerstone Holdings in exchange for commissions paid by the Fund with respect to trades on the Fund’s portfolio securities.
The Board further considered that, in addition to fees earned by New York Life Investments for managing the Fund, New York Life Investments’ affiliates also earn revenues from serving the Fund in various other capacities, including as the Fund’s transfer agent and distributor. The Board observed that information about these other revenues, and their impact on the profitability of the Fund to New York Life Investments and its affiliates, was furnished to the Board as part of the 15(c) process. The Board noted that, although it assessed the overall profitability of the Fund to New York Life Investments and its affiliates as part of the contract review process, when considering the reasonableness of the
| | | | |
| mainstayinvestments.com | | | 39 | |
Board Consideration and Approval of Management Agreement and
Subadvisory Agreement (Unaudited) (continued)
fees to be paid to New York Life Investments and its affiliates under the Agreements, the Board considered the profitability of New York Life Investments’ relationship with the Fund on a pre-tax basis, and without regard to distribution expenses.
After evaluating the information presented to the Board, the Board concluded, within the context of its overall determinations regarding the Agreements, that any profits realized by New York Life Investments and its affiliates, including Cornerstone Holdings, due to their relationships with the Fund supported the Board’s decision to approve the Agreements.
Extent to Which Economies of Scale May Be Realized as the Fund Grows
The Board also considered whether the Fund’s expense structure permitted economies of scale to be shared with Fund investors. The Board reviewed information from New York Life Investments showing how the Fund’s management fee schedule compared to fee schedules of other funds and accounts managed by New York Life Investments. The Board also reviewed information from Strategic Insight showing how the Fund’s management fee schedule hypothetically would compare with fees paid for similar services by peer funds at varying asset levels. While recognizing the difficulty of determining economies of scale with precision, the Board acknowledged that economies of scale may be shared with the Fund in a number of ways, including, for example, through the imposition of management fee breakpoints and by initially setting relatively lower management fees.
Based on this information, the Board concluded, within the context of its overall determinations regarding the Agreements, that the Fund’s expense structure appropriately reflects economies of scale for the benefit of Fund investors. The Board noted, however, that it would continue to evaluate the reasonableness of the Fund’s expense structure as the Fund grows over time.
Management and Subadvisory Fees and Total Ordinary Operating Expenses
The Board evaluated the reasonableness of the fees to be paid under the Agreements and the Fund’s expected total ordinary operating expenses. The Board primarily considered the reasonableness of the management fee paid by the Fund to New York Life Investments, since the fees paid to Cornerstone Holdings are paid by New York Life Investments, not the Fund.
In assessing the reasonableness of the Fund’s fees and expenses, the Board primarily considered comparative data provided by Strategic Insight on the fees and expenses charged by similar mutual funds managed by other investment advisers. In addition, the Board considered information provided by New York Life Investments and Cornerstone Holdings on fees charged to other investment advisory clients, including institutional separate accounts and other funds with similar investment objectives as the Fund. The Board particularly considered differences in the contractual management fee schedules of the retail MainStay Funds and similarly-managed MainStay VP Portfolios, taking into account New York Life Investments’ rationale for any differences in fee schedules. The Board also took into account explanations provided by New York Life Investments about the different scope of services
provided to mutual funds as compared with other investment advisory clients. Additionally, the Board considered the impact of any expense limitation arrangements on the Fund’s net management fee and expenses.
The Board noted that, outside of the Fund’s management fee and the fees charged under a share class’s Rule 12b-1 and/or shareholder services plans, a share class’s most significant “other expenses” are transfer agent fees. Transfer agent fees are charged to the Fund based on the number of shareholder accounts (a “per-account” fee) as compared with certain other fees (e.g., management fees), which are charged based on the Fund’s average net assets. The Board took into account information from New York Life Investments showing that the Fund’s transfer agent fee schedule is reasonable, including industry data showing that the per-account fees that NYLIM Service Company LLC, the Fund’s transfer agent, charges the Fund are within the range of per-account fees charged by transfer agents to other mutual funds. In addition, the Board considered NYLIM Service Company LLC’s profitability in connection with the transfer agent services it provides to the Fund.
The Board acknowledged that, because the Fund’s transfer agent fees are billed on a per-account basis, the impact of transfer agent fees on a share class’s expense ratio may be more significant in cases where the share class has a high number of accounts with limited assets (i.e., small accounts). The Board observed that transfer agent fees are a significant portion of total expenses of many Funds in the MainStay Group of Funds. The impact of transfer agent fees on the expense ratios of these MainStay Funds tend to be greater than for other open-end retail funds, because the MainStay Group of Funds generally has a significant number of small accounts relative to competitor funds. The Board acknowledged the role that the MainStay Group of Funds historically has played in serving the investment needs of New York Life Insurance Company (“New York Life”) policyholders, who often maintain smaller account balances than other fund investors. The Board discussed measures that it and New York Life Investments have taken in recent years to mitigate the effect of small accounts on the expense ratios of Fund share classes, including: (i) encouraging New York Life agents to consolidate multiple small accounts held by the same investor into one MainStay Asset Allocation Fund account; (ii) increasing investment minimums from $500 to $1,000 in 2003; (iii) introducing Investor Class shares for certain MainStay Funds in early 2008 to consolidate smaller account investors; (iv) closing small accounts with balances below $250 in Investor Class shares or $750 in all other classes of shares; (v) no longer allowing an exception with no minimum investment amount with respect to AutoInvest accounts with subsequent monthly purchases of $100; (vi) since 2007, charging an annual $20.00 small account fee on certain accounts with balances below $1,000; and (vii) modifying the approach for billing transfer agent expenses to reduce the degree of subsidization by large accounts of smaller accounts. In addition, the Board acknowledged New York Life Investments’ efforts to encourage intermediaries to consolidate small accounts in multiple Funds held by the same investor into a single Asset Allocation Fund account, if appropriate under the circumstances, in an effort to mitigate the effect of small accounts on the Funds in the MainStay Group of Funds.
| | |
| 40 | | MainStay U.S. Equity Opportunities Fund |
After considering all of the factors outlined above, the Board concluded that the Fund’s management and subadvisory fees and total ordinary operating expenses were within a range that is competitive and, within the context of the Board’s overall conclusions regarding the Agreements, support a conclusion that these fees and expenses are reasonable.
Conclusion
On the basis of the information provided to it and its evaluation thereof, the Board, including the Independent Trustees, unanimously voted to approve the Agreements.
| | | | |
| mainstayinvestments.com | | | 41 | |
Proxy Voting Policies and Procedures
and Proxy Voting Record
A description of the policies and procedures that New York Life Investments uses to vote proxies related to the Fund’s securities is available without charge, upon request, (i) by visiting the MainStay Funds’ website at mainstayinvestments.com; and (ii) on the Securities and Exchange Commission’s (“SEC”) website at www.sec.gov.
The Fund is required to file with the SEC their proxy voting records for the Fund for the 12-month period ending June 30 on Form N-PX. The most recent Form N-PX is available free of charge upon request by calling 800-MAINSTAY (624-6782); visiting the MainStay Funds’ website at mainstayinvestments.com; or on the SEC’s website at www.sec.gov.
Shareholder Reports and Quarterly Portfolio Disclosure
The Fund is required to file its complete schedule of portfolio holdings with the SEC for its first and third fiscal quarters on Form N-Q. The Fund’s Form N-Q is available without charge, on the SEC’s website at www.sec.gov or by calling MainStay Investments at 800-MAINSTAY (624-6782). You also can obtain and review copies of Form N-Q by visiting the SEC’s Public Reference Room in Washington, DC (information on the operation of the Public Reference Room may be obtained by calling 1-800-SEC-0330).
| | |
| 42 | | MainStay U.S. Equity Opportunities Fund |
MainStay Funds
MainStay offers a wide range of Funds for virtually any investment need. The full array of MainStay open-end offerings is listed here, with information about the manager, subadvisors, legal counsel and independent registered public accounting firms.
Equity
U.S. Equity Funds
MainStay Common Stock Fund
MainStay Cornerstone Growth Fund
MainStay Epoch U.S. All Cap Fund
MainStay Epoch U.S. Equity Yield Fund
MainStay ICAP Equity Fund
MainStay ICAP Select Equity Fund
MainStay Large Cap Growth Fund1
MainStay MAP Fund
MainStay S&P 500 Index Fund
MainStay U.S. Equity Opportunities Fund
MainStay U.S. Small Cap Fund
International/Global Equity Funds
MainStay Epoch Global Choice Fund
MainStay Epoch Global Equity Yield Fund
MainStay Epoch International Small Cap Fund
MainStay ICAP Global Fund
MainStay ICAP International Fund
MainStay International Equity Fund
MainStay International Opportunities Fund
Income
Taxable Bond Funds
MainStay Floating Rate Fund
MainStay Global High Income Fund
MainStay Government Fund
MainStay High Yield Corporate Bond Fund
MainStay High Yield Opportunities Fund
MainStay Indexed Bond Fund
MainStay Intermediate Term Bond Fund
MainStay Short Duration High Yield Fund
MainStay Short Term Bond Fund
MainStay Unconstrained Bond Fund
Municipal Bond Funds
MainStay California Tax Free Opportunities Fund2
MainStay High Yield Municipal Bond Fund
MainStay New York Tax Free Opportunities Fund3
MainStay Tax Free Bond Fund
Money Market Fund
MainStay Money Market Fund
Mixed Asset
MainStay Balanced Fund
MainStay Convertible Fund
MainStay Income Builder Fund
MainStay Marketfield Fund
Asset Allocation/Target Date
MainStay Conservative Allocation Fund
MainStay Growth Allocation Fund
MainStay Moderate Allocation Fund
MainStay Moderate Growth Allocation Fund
MainStay Retirement 2010 Fund
MainStay Retirement 2020 Fund
MainStay Retirement 2030 Fund
MainStay Retirement 2040 Fund
MainStay Retirement 2050 Fund
Manager
New York Life Investment Management LLC
New York, New York
Subadvisors
Cornerstone Capital Management Holdings LLC4
New York, New York
Cornerstone Capital Management LLC4
Bloomington, Minnesota
Epoch Investment Partners, Inc.
New York, New York
Institutional Capital LLC4
Chicago, Illinois
MacKay Shields LLC4
New York, New York
Marketfield Asset Management LLC
New York, New York
Markston International LLC
White Plains, New York
Winslow Capital Management LLC
Minneapolis, Minnesota
Legal Counsel
Dechert LLP
Independent Registered Public Accounting Firms
KPMG LLP
PricewaterhouseCoopers LLP
1. Effective January 13, 2012, the Fund was closed to new investors with certain exceptions.
2. This Fund is only registered for sale in AZ, CA, NV, OR, UT, and WA.
3. This Fund is only registered for sale in CT, DE, FL, MA, NJ, NY, and VT.
4. An affiliate of New York Life Investment Management LLC.
Not part of the Semiannual Report
For more information
800-MAINSTAY (624-6782)
mainstayinvestments.com
The MainStay Funds® are managed by New York Life Investment Management LLC and distributed through NYLIFE Distributors LLC, 169 Lackawanna Avenue, Parsippany, NJ 07054, a wholly owned subsidiary of New York Life Insurance Company. NYLIFE Distributors LLC is a Member FINRA/SIPC.
MainStay Investments® is a registered service mark and name under which New York Life Investment Management LLC does business. MainStay Investments, an indirect subsidiary of New York Life Insurance Company, New York, NY 10010, provides investment advisory products and services.
This report may be distributed only when preceded or accompanied by a current Fund prospectus.
©2013 NYLIFE Distributors LLC. All rights reserved.
| | | | | | | | |
| Not FDIC/NCUA Insured | | Not a Deposit | | May Lose Value | | No Bank Guarantee | | Not Insured by Any Government Agency |
| | |
| NYLIM-30046 MS175-13 | | MSUER10-06/13 NL0C2 |
MainStay International Opportunities Fund
Message from the President and Semiannual Report
Unaudited | April 30, 2013


This page intentionally left blank
Message from the President
The U.S. stock market advanced during the six months ended April 30, 2013, generally providing double-digit returns at all capitalization levels. Value stocks tended to outpace growth stocks among large- and mid-capitalization companies, while growth stocks tended to outpace value stocks among smaller companies.
The market’s advance, however, was far from uniform. Stocks declined in early November, both before and immediately after the U.S. presidential election. Following a sharp recovery, stocks climbed until mid-December, when a Congressional stalemate on the fiscal cliff led to a brief decline. Another dip occurred in late February as investors speculated that the Federal Open Market Committee (FOMC) might stop purchasing mortgage-backed securities sooner than expected. Stocks also dipped in mid-April, as consumer sentiment dropped after the Boston marathon bombing. Despite these setbacks, U.S. stocks continued to trend upward during the six-month reporting period.
International stock markets also advanced, with several regional differences. Accommodative action by the Bank of Japan helped lower the yen and lift Japanese stocks to their highest levels since 2008. In Europe, stocks did well until early February, bolstered by the promise of support for the euro. As the year progressed, however, economic contraction, rising unemployment and systematic banking concerns took a toll on investor enthusiasm. In China, manufacturing slowed as the nation sought to balance growth and inflation risks. On the Korean peninsula, tensions rose as North Korea continued to threaten its neighbors, which added an undercurrent of caution to the market.
During the six months ended April 30, 2013, the FOMC kept the federal funds rate in a range close to zero. The FOMC also continued its direct purchases of mortgage-backed securities and longer-term U.S. government securities. With short-term interest rates likely to remain at low levels, many bond investors pursued higher yields by lengthening maturities and assuming greater risk. As a result, bonds with higher risk profiles tended
to outperform higher-quality investment-grade bonds and U.S. Treasury securities. Cash and cash equivalents essentially returned zero.
With wide variations in the performance of various asset classes, some investors might be tempted to chase higher returns by shifting back and forth between stocks and bonds. Since no one can predict where the market will move next, however, we encourage investors to select an appropriate mix of investments for their risk tolerance and time horizon and to stick with that mix, making only minor adjustments over time.
At MainStay Funds, our portfolio managers use a similar approach. Careful security selection and thoughtful sell disciplines help them pursue the investment objectives of their respective Funds. Using the principal investment strategies outlined in the Prospectus, they focus primarily on providing long-term investment potential for our shareholders.
Has this approach proved successful? In its most recent rankings, Barron’s listed MainStay Funds as the #1 fund family over the past 10 years. We were also the only mutual fund family that has appeared in Barron’s top six for the past five consecutive years.
The pages that follow provide additional insight into the specific market events, investment decisions and securities that shaped your MainStay Fund(s) during the six months ended April 30, 2013. We encourage you to read the semiannual report(s) carefully and to evaluate your results with your long-term financial goals in mind.
Sincerely,

Stephen P. Fisher
President
The opinions expressed are as of the date of this report and are subject to change. There is no guarantee that any forecast made will come to pass. This material does not constitute investment advice and is not intended as an endorsement of any specific investment.
To qualify for the Lipper/Barron’s Fund Survey, a fund family must have at least three funds in Lipper’s general U.S.-stock category, one in world equity (which combines global and international funds), one mixed-equity fund (which holds stocks and bonds), two taxable-bond funds, and one tax-exempt fund. Fund loads and 12b-1 fees aren’t included in the calculation of returns because the aim is to measure the manager’s skill. Each fund’s return is measured against all funds in its Lipper category, resulting in a percentile ranking which is then weighted by asset size relative to the fund family’s other assets in its general classifications. Finally, the score is multiplied by the general classification weightings as determined by the entire Lipper universe of funds.
Source: Barron’s, 2/9/13. Overall, MainStay Funds ranked number 56 for the one-year period, 20 for the five-year period and one for the 10-year period ended December 31, 2012, out of 62, 53 and 46 fund families, respectively. MainStay ranked number three for the 10-year period in 2009, 2010 and 2011 from among 48, 46 and 45 fund families, respectively. MainStay ranked number six from among 48 fund families for the 10-year period in 2008. Past performance is no guarantee of future results, which will vary. For the most recent MainStay Funds performance, please visit our website at mainstayinvestments.com. All mutual funds are subject to market risk and will fluctuate in value.
Not part of the Semiannual Report
Table of Contents
Investors should refer to each Fund’s Summary Prospectus and/or Prospectus and consider each Fund’s investment objectives, strategies, risks, charges and expenses carefully before investing. The Summary Prospectus and/or Prospectus contain this and other information.
You may obtain copies of each Fund’s Summary Prospectus, Prospectus and Statement of Additional Information free of charge, upon request, by calling toll-free 800-MAINSTAY (624-6782), by writing to NYLIFE Distributors LLC, Attn: MainStay Marketing Department, 169 Lackawanna Avenue, Parsippany, New Jersey 07054 or by sending an e-mail to MainStayShareholderServices@nylim.com. These documents are also available via the MainStay Funds’ website at mainstayinvestments.com/documents. Please read each Fund’s
Summary Prospectus and/or Prospectus carefully before investing.
Investment and Performance Comparison1 (Unaudited)
Performance data quoted represents past performance. Past performance is no guarantee of future results. Because of market volatility, current performance may be lower or higher than the figures shown. Investment return and principal value will fluctuate, and as a result, when shares are redeemed, they may be worth more or less than their original cost. The graph below depicts the historical performance of Class I shares of the Fund. Performance will vary from class to class based on differences in class-specific expenses and sales charges. For performance information current to the most recent month-end, please call 800-MAINSTAY (624-6782) or visit mainstayinvestments.com.
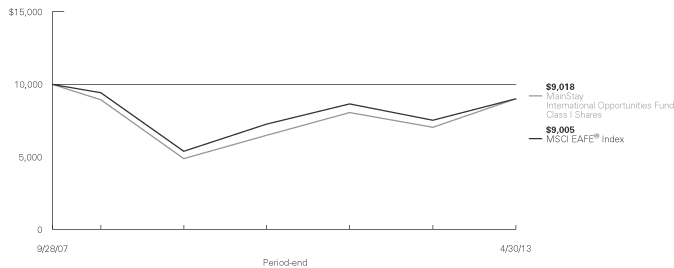
Average Annual Total Returns for the Period Ended April 30, 2013
| | | | | | | | | | | | | | | | | | | | | | | | |
| Class | | Sales Charge | | | | Six Months | | | One Year | | | Five Years | | | Since
Inception
(9/28/07) | | | Gross
Expense
Ratio2 | |
| Investor Class Shares3 | | Maximum 5.5% Initial Sales Charge | | With sales charges Excluding sales charges | |
| 15.46
22.18 | %
| |
| 20.43
27.44 | %
| |
| –1.28
–0.15 | %
| |
| –3.11
–2.13 | %
| |
| 3.42
3.42 | %
|
| Class A Shares | | Maximum 5.5% Initial Sales Charge | | With sales charges Excluding sales charges | |
| 15.69
22.42 |
| |
| 20.85
27.88 |
| |
| –1.13
–0.01 |
| |
| –3.00
–2.02 |
| |
| 3.24
3.24 |
|
| Class C Shares | | Maximum 1% CDSC If Redeemed Within One Year of Purchase | | With sales charges Excluding sales charges | |
| 20.85
21.85 |
| |
| 25.62
26.62 |
| |
| –0.91
–0.91 |
| |
| –2.89
–2.89 |
| |
| 4.19
4.19 |
|
| Class I Shares | | No Sales Charge | | | | | 22.53 | | | | 27.98 | | | | 0.18 | | | | –1.83 | | | | 2.98 | |
| 1. | The performance table and graph do not reflect the deduction of taxes that a shareholder would pay on dividends, distributions or Fund share redemptions. Total returns reflect maximum applicable sales charges as indicated in the table above, changes in share price, and reinvestment of dividends and capital gain distributions. The graph assumes the initial investment amount shown above and reflects the deduction of all sales charges that would have applied for the period of investment. Performance figures reflect certain fee waivers and/or expense limitations, without which total returns may have been lower. For more information on share classes and current fee waivers and/or expense limitations, please refer to the notes to the financial statements. |
| 2. | The gross expenses ratios presented reflect the Fund’s “Total Annual Fund Operating Expenses” from the most recent Prospectus and may differ from other expense ratios disclosed in this report. |
| 3. | Performance figures for Investor Class shares, first offered on February 28, 2008, include the historical performance of Class A shares through February 27, 2008, adjusted for differences in certain expenses and fees. Unadjusted, the performance shown for Investor Class shares would likely have been different. |
The footnotes on the next page are an integral part of the table and graph and should be carefully read in conjunction with them.
| | | | |
| mainstayinvestments.com | | | 5 | |
| | | | | | | | | | | | | | | | |
| Benchmark Performance | | Six
Months | | | One
Year | | | Five
Years | | | Since
Inception | |
MSCI EAFE Index4 | | | 16.90 | % | | | 19.39 | % | | | –0.93 | % | | | –1.86 | % |
Average Lipper International Multi-Cap Core Fund5 | | | 14.20 | | | | 16.47 | | | | –1.07 | | | | –2.25 | |
| 4. | The MSCI EAFE® Index consists of international stocks representing the developed world outside of North America. The MSCI EAFE® Index is the Fund’s broad-based securities market index for comparison purposes. Results assume reinvestment of all income and capital gains. An investment cannot be made directly in an index. |
| 5. | The average Lipper international multi-cap core fund is representative of funds that, by portfolio practice, invest in a variety of market capitalization ranges without concentrating 75% of their equity assets in any one market |
| | capitalization range over an extended period of time. International multi-cap core funds typically have an average price-to-cash flow ratio, price-to-book ratio, and three-year sales-per-share growth value compared to the S&P/Citigroup World ex-U.S. BMI. This benchmark is a product of Lipper Inc. Lipper Inc. is an independent monitor of fund performance. Results are based on average total returns of similar funds with all dividend and capital gain distributions reinvested. |
The footnotes on the preceding page are an integral part of the table and graph and should be carefully read in conjunction with them.
| | |
| 6 | | MainStay International Opportunities Fund |
Cost in Dollars of a $1,000 Investment in MainStay International Opportunities Fund (Unaudited)
The example below is intended to describe the fees and expenses borne by shareholders during the six-month period from November 1, 2012, to April 30, 2013, and the impact of those costs on your investment.
Example
As a shareholder of the Fund, you incur two types of costs: (1) transaction costs, including exchange fees and sales charges (loads) on purchases (as applicable), and (2) ongoing costs, including management fees, distribution and/or service (12b-1) fees, and other Fund expenses (as applicable). This example is intended to help you understand your ongoing costs (in dollars) of investing in the Fund and to compare these costs with the ongoing costs of investing in other mutual funds. The example is based on an investment of $1,000 made at the beginning of the six-month period and held for the entire period from November 1, 2012, to April 30, 2013.
This example illustrates your Fund’s ongoing costs in two ways:
Actual Expenses
The second and third data columns in the table below provide information about actual account values and actual expenses. You may use the information in these columns, together with the amount you invested, to estimate the expenses that you paid during the six months ended April 30, 2013. Simply divide your account value by $1,000 (for example, an $8,600 account value divided by $1,000 = 8.6), then
multiply the result by the number under the heading entitled “Expenses Paid During Period” to estimate the expenses you paid on your account during this period.
Hypothetical Example for Comparison Purposes
The fourth and fifth data columns in the table below provide information about hypothetical account values and hypothetical expenses based on the Fund’s actual expense ratio and an assumed rate of return of 5% per year before expenses, which is not the Fund’s actual return. The hypothetical account values and expenses may not be used to estimate the actual ending account balances or expenses you paid for the six-month period shown. You may use this information to compare the ongoing costs of investing in the Fund with the ongoing costs of investing in other Funds. To do so, compare this 5% hypothetical example with the 5% hypothetical examples that appear in the shareholder reports of the other Funds.
Please note that the expenses shown in the table are meant to highlight your ongoing costs only and do not reflect any transactional costs, such as exchange fees or sales charges (loads). Therefore, the fourth and fifth data columns of the table are useful in comparing ongoing costs only and will not help you determine the relative total costs of owning different funds. In addition, if these transactional costs were included, your costs would have been higher.
| | | | | | | | | | | | | | | | | | | | |
| | | | | | | | | | | | | | | | |
| Share Class | | Beginning
Account
Value
11/1/12 | | | Ending Account
Value (Based
on Actual
Returns and
Expenses)
4/30/13 | | | Expenses
Paid
During
Period1 | | | Ending Account
Value (Based
on Hypothetical
5% Annualized
Return and
Actual Expenses)
4/30/13 | | | Expenses
Paid
During
Period1 | |
| | | | | |
| Investor Class Shares | | $ | 1,000.00 | | | $ | 1,221.80 | | | $ | 15.70 | | | $ | 1,010.70 | | | $ | 14.21 | |
| | | | | |
| Class A Shares | | $ | 1,000.00 | | | $ | 1,224.20 | | | $ | 15.00 | | | $ | 1,011.30 | | | $ | 13.56 | |
| | | | | |
| Class C Shares | | $ | 1,000.00 | | | $ | 1,218.50 | | | $ | 19.86 | | | $ | 1,006.90 | | | $ | 17.96 | |
| | | | | |
| Class I Shares | | $ | 1,000.00 | | | $ | 1,225.30 | | | $ | 13.57 | | | $ | 1,012.60 | | | $ | 12.28 | |
| 1. | Expenses are equal to the Fund’s annualized expense ratio of each class (2.85% for Investor Class, 2.72% for Class A, 3.61% for Class C and 2.46% for Class I) multiplied by the average account value over the period, divided by 365 and multiplied by 181 (to reflect the six-month period). The table above represents the actual expenses incurred during the six-month period. |
| | | | |
| mainstayinvestments.com | | | 7 | |
Country Composition as of April 30, 2013 (Unaudited)
| | | | |
| Japan | | | 32.0 | % |
| United Kingdom | | | 17.5 | |
| Australia | | | 12.3 | |
| France | | | 10.5 | |
| Germany | | | 8.9 | |
| Switzerland | | | 7.2 | |
| Netherlands | | | 5.2 | |
| China | | | 5.0 | |
| Hong Kong | | | 3.7 | |
| Spain | | | 3.4 | |
| Belgium | | | 3.2 | |
| Italy | | | 3.2 | |
| Norway | | | 2.6 | |
| Israel | | | 2.1 | |
| Republic of Korea | | | 1.7 | |
| Denmark | | | 1.6 | |
| Sweden | | | 1.5 | |
| Brazil | | | 1.4 | |
| United States | | | 1.3 | |
| | | | |
| India | | | 1.2 | % |
| Austria | | | 0.9 | |
| Taiwan | | | 0.7 | |
| Finland | | | 0.6 | |
| Thailand | | | 0.6 | |
| Cambodia | | | 0.5 | |
| Turkey | | | 0.4 | |
| Egypt | | | 0.3 | |
| New Zealand | | | 0.3 | |
| Greece | | | 0.2 | |
| Ireland | | | 0.2 | |
| Indonesia | | | 0.1 | |
| Singapore | | | 0.1 | |
| South Africa | | | 0.1 | |
| Malaysia | | | 0.0 | ‡ |
| Other Assets, Less Liabilities | | | 1.4 | |
| Investments Sold Short | | | (31.9 | ) |
| | | | |
| | | 100.0 | % |
| | | | |
See Portfolio of Investments beginning on page 11 for specific holdings within these categories.
| ‡ | Less than one-tenth of a percent. |
Top Ten Holdings as of April 30, 2013 (excluding short-term investment)
| 2. | Roche Holding A.G., Genusscheine |
| 6. | Royal Dutch Shell PLC Class A |
| 7. | WisdomTree Japan Hedged Equity Fund |
Top Five Short Positions as of April 30, 2013
| 1. | iShares MSCI EAFE Index Fund |
| | |
| 8 | | MainStay International Opportunities Fund |
Portfolio Management Discussion and Analysis (Unaudited)
Questions answered by Andrew Ver Planck, CFA, of Cornerstone Capital Management Holdings LLC, the Fund’s Subadvisor.
How did MainStay International Opportunities Fund perform relative to its peers and its benchmark during the six months ended April 30, 2013?
Excluding all sales charges, MainStay International Opportunities Fund returned 22.18% for Investor Class shares, 22.42% for Class A shares and 21.85% for Class C shares for the six months ended April 30, 2013. Over the same period, the Fund’s Class I shares returned 22.53%. All share classes outperformed the 14.20% return of the average Lipper1 international multi-cap core fund and the 16.90% return of the MSCI EAFE® Index2 for the six months ended April 30, 2013. The MSCI EAFE® Index is the Fund’s broad-based securities-market index. See page 5 for Fund returns with applicable sales charges.
Were there any changes to the Fund during the reporting period?
Effective January 25, 2013, Madison Square Investors LLC, the Subadvisor to the Fund changed its name to Cornerstone Capital Management Holdings LLC. Effective February 28, 2013, the Fund changed its name from “MainStay 130/30 International Fund” to “MainStay International Opportunities Fund.” Also effective February 28, 2013, changes were made to the Fund’s Principal Investment Strategy and Principal Risks. For more information on these changes, please refer to the Prospectus dated February 28, 2013.
What factors affected the Fund’s relative performance during the reporting period?
Favorable stock selection was responsible for most of the Fund’s outperformance relative to the MSCI EAFE® Index. The Fund may sell securities short and may invest in securities of companies with market capitalizations outside of the range of the MSCI EAFE® Index. (The securities of smaller companies are sometimes less efficient, which may offer opportunities for gain.) By employing these strategies, the Fund seeks to produce returns that exceed those of the MSCI EAFE® Index.
During the reporting period, which sectors and countries were the strongest positive contributors to the Fund’s relative performance and which sectors and countries were particularly weak?
The sectors that made the strongest positive contributions to the Fund’s performance relative to the MSCI EAFE® Index were materials, financials and energy. (Contributions take weightings and total returns into account.) The sectors that detracted the
most from the Fund’s relative performance were industrials, information technology and telecommunication services.
Regionally, the Fund experienced favorable stock selection in Europe and the Pacific Rim, which contributed positively to performance relative to the MSCI EAFE® Index. Unfavorable stock selection in Japan made it the only underperforming region relative to the Index. An overweight allocation in emerging markets also provided a positive contribution, while the impact of allocations to other regions relative to the MSCI EAFE® Index was minor.
During the reporting period, the countries that made the strongest positive contributions to the Fund’s relative performance were Australia, the U.K. and France. The countries that detracted the most from the Fund’s relative performance were Japan, Italy and Singapore.
During the reporting period, which individual stocks made the strongest positive contributions to the Fund’s absolute performance and which stocks detracted the most?
The stocks that made the strongest positive contributions to the Fund’s absolute performance during the reporting period were long positions in Japanese asset management company SBI Holdings, Japenese automobile manufacturer Toyota Motor Corp., and Swiss pharmaceutical company Roche Holding AG.
During the reporting period, the stocks that detracted the most from the Fund’s absolute performance included short positions in Japanese Internet software company GungHo Online Entertainment, Japanese consumer finance company Orient Corp., and British Internet retail company Ocado Group PLC.
Did the Fund make any significant purchases or sales during the reporting period?
The Fund initiated a large long position in U.K. Bank Standard Chartered as part of a pair trade when exiting a position in Barclays. Japanese homebuilder Daiwa House Industry was another large long position the Fund initiated to gain exposure to Japan.
After accumulating a long position in Japanese asset management company SBI Holdings over several Fund rebalancings, the Fund realized gains and exited the position after the security had more than doubled in value. The Fund also exited a large position in major U.K. bank Barclays after the company posted a large loss in the first quarter of 2013.
| 1. | See footnote on page 6 for more information on Lipper Inc. |
| 2. | See footnote on page 6 for more information on the MSCI EAFE® Index. |
| | | | |
| mainstayinvestments.com | | | 9 | |
How did the Fund’s sector and country weightings change during the reporting period?
The Fund increased its sector weightings relative to the MSCI EAFE® Index in the information technology sector. Over the same period, the Fund decreased its relative sector weightings in the energy and telecommunication services sectors.
During the reporting period, the Fund increased its country weightings relative to the MSCI EAFE® Index in Japan and Spain. Over the same period, the Fund decreased its relative weightings in the Netherlands, Australia and Norway.
The Fund is managed and constructed on a bottom-up basis, so all weighting changes reflect our individual stock selection
criteria. They are not the result of top-down evaluations of economies, sectors or regions.
How was the Fund positioned at the end of April 2013?
As of April 30, 2013, the Fund held overweight positions relative to the MSCI EAFE® Index in the financials, consumer discretionary and information technology sectors. As of the same date, the Fund held underweight positions relative to the Index in the consumer staples, industrials and materials sectors.
As of April 30, 2013, the also Fund held overweight positions relative to the MSCI EAFE® Index in Belgium, China and South Korea. As of the same date, the Fund held underweight positions relative to the Index in the U.K., Switzerland and Sweden.
The opinions expressed are those of the portfolio managers as of the date of this report and are subject to change. There is no guarantee that any forecast made will come to pass. This material does not constitute investment advice and is not intended as an endorsement of any specific investment.
| | |
| 10 | | MainStay International Opportunities Fund |
Portfolio of Investments April 30, 2013 (Unaudited)
| | | | | | | | |
| | |
| | | Shares | | | Value | |
| | | | | | | | |
| Common Stocks 127.9%† | |
Australia 12.3% | |
Alumina, Ltd. (Metals & Mining) (a) | | | 247,574 | | | $ | 247,677 | |
Arrium, Ltd. (Metals & Mining) | | | 906,019 | | | | 798,380 | |
Australia & New Zealand Banking Group, Ltd. (Commercial Banks) | | | 50,722 | | | | 1,674,259 | |
Automotive Holdings Group, Ltd. (Specialty Retail) | | | 15,822 | | | | 66,759 | |
BC Iron, Ltd. (Metals & Mining) | | | 51,167 | | | | 182,474 | |
BGP Holdings PLC (Diversified Financial Services) (a)(b)(c) | | | 106,339 | | | | 11 | |
BHP Billiton, Ltd. (Metals & Mining) | | | 48,963 | | | | 1,659,850 | |
Billabong International, Ltd. (Textiles, Apparel & Luxury Goods) (a) | | | 55,914 | | | | 27,534 | |
Caltex Australia, Ltd. (Oil, Gas & Consumable Fuels) | | | 14,155 | | | | 316,089 | |
Challenger, Ltd. (Diversified Financial Services) | | | 267,124 | | | | 1,163,096 | |
Codan, Ltd. (Communications Equipment) | | | 40,195 | | | | 141,262 | |
Commonwealth Bank of Australia (Commercial Banks) | | | 8,429 | | | | 641,831 | |
Credit Corp. Group, Ltd. (Commercial Services & Supplies) | | | 15,546 | | | | 143,276 | |
CSL, Ltd. (Biotechnology) | | | 28,841 | | | | 1,882,471 | |
Decmil Group, Ltd. (Construction & Engineering) | | | 86,140 | | | | 166,547 | |
Emeco Holdings, Ltd. (Trading Companies & Distributors) | | | 272,492 | | | | 129,947 | |
Flight Centre, Ltd. (Hotels, Restaurants & Leisure) | | | 22,028 | | | | 871,667 | |
Forge Group, Ltd. (Construction & Engineering) | | | 43,554 | | | | 260,981 | |
Grange Resources, Ltd. (Metals & Mining) | | | 133,210 | | | | 22,786 | |
JB Hi-Fi, Ltd. (Specialty Retail) | | | 72,208 | | | | 1,197,729 | |
Macquarie Group, Ltd. (Capital Markets) | | | 39,364 | | | | 1,599,292 | |
Mount Gibson Iron, Ltd. (Metals & Mining) | | | 10,533 | | | | 5,405 | |
Myer Holdings, Ltd. (Multiline Retail) | | | 368,952 | | | | 1,227,801 | |
National Australia Bank, Ltd. (Commercial Banks) | | | 19,689 | | | | 693,994 | |
Newcrest Mining, Ltd. (Metals & Mining) | | | 46,685 | | | | 813,576 | |
NRW Holdings, Ltd. (Construction & Engineering) | | | 171,356 | | | | 230,938 | |
OZ Minerals, Ltd. (Metals & Mining) | | | 24,571 | | | | 109,533 | |
Premier Investments, Ltd. (Specialty Retail) | | | 35,153 | | | | 315,233 | |
Primary Health Care, Ltd. (Health Care Providers & Services) | | | 120,765 | | | | 659,789 | |
Resolute Mining, Ltd. (Metals & Mining) | | | 130,862 | | | | 129,560 | |
Sigma Pharmaceuticals, Ltd. (Health Care Providers & Services) | | | 873,235 | | | | 660,856 | |
Suncorp-Group, Ltd. (Insurance) | | | 128,686 | | | | 1,731,646 | |
TABCORP Holdings, Ltd. (Hotels, Restaurants & Leisure) | | | 95,417 | | | | 341,270 | |
Telstra Corp., Ltd. (Diversified Telecommunication Services) | | | 342,479 | | | | 1,768,139 | |
Wesfarmers, Ltd. (Food & Staples Retailing) | | | 6,529 | | | | 293,555 | |
Westpac Banking Corp. (Commercial Banks) | | | 42,628 | | | | 1,493,705 | |
| | | | | | | | |
| | |
| | | Shares | | | Value | |
| | | | | | | | |
Australia (continued) | |
Woodside Petroleum, Ltd. (Oil, Gas & Consumable Fuels) | | | 1,961 | | | $ | 76,358 | |
Woolworths, Ltd. (Food & Staples Retailing) | | | 2,552 | | | | 96,328 | |
WorleyParsons, Ltd. (Energy Equipment & Services) | | | 43,770 | | | | 1,033,220 | |
| | | | | | | | |
| | | | | | | 24,874,824 | |
| | | | | | | | |
Austria 0.9% | |
Andritz A.G. (Machinery) | | | 4,817 | | | | 313,889 | |
OMV A.G. (Oil, Gas & Consumable Fuels) (d) | | | 32,348 | | | | 1,519,780 | |
Raiffeisen International A.G. (Commercial Banks) (d) | | | 841 | | | | 29,677 | |
| | | | | | | | |
| | | | | | | 1,863,346 | |
| | | | | | | | |
Belgium 3.2% | |
Ageas (Insurance) (d) | | | 14,532 | | | | 532,417 | |
Anheuser-Busch InBev N.V. (Beverages) (d) | | | 18,037 | | | | 1,716,215 | |
Barco N.V. (Electronic Equipment, Instruments & Components) | | | 9,690 | | | | 862,022 | |
Delhaize Group S.A. (Food & Staples Retailing) | | | 26,466 | | | | 1,659,419 | |
KBC Groep N.V. (Commercial Banks) (d) | | | 41,825 | | | | 1,641,427 | |
| | | | | | | | |
| | | | | | | 6,411,500 | |
| | | | | | | | |
Brazil 1.0% | |
Banco do Brasil S.A. (Commercial Banks) | | | 44,500 | | | | 558,933 | |
Brookfield Incorporacoes S.A. (Household Durables) | | | 359,600 | | | | 393,614 | |
JBS S.A. (Food Products) | | | 174,300 | | | | 556,680 | |
Marfrig Alimentos S.A. (Food Products) (a) | | | 130,300 | | | | 443,505 | |
| | | | | | | | |
| | | | | | | 1,952,732 | |
| | | | | | | | |
Cambodia 0.5% | |
NagaCorp, Ltd. (Hotels, Restaurants & Leisure) | | | 1,352,000 | | | | 1,076,701 | |
| | | | | | | | |
|
China 5.0% | |
Agricultural Bank of China, Ltd. Class H (Commercial Banks) | | | 492,000 | | | | 235,851 | |
Anton Oilfield Services Group (Energy Equipment & Services) | | | 122,000 | | | | 97,472 | |
Bank of Communications Co., Ltd. Class H (Commercial Banks) | | | 440,000 | | | | 349,839 | |
BYD Electronic International Co., Ltd. (Communications Equipment) | | | 274,000 | | | | 144,412 | |
Chaowei Power Holdings, Ltd. (Auto Components) | | | 168,000 | | | | 79,019 | |
China Citic Bank Corp., Ltd. Class H (Commercial Banks) | | | 258,000 | | | | 145,288 | |
China Construction Bank Corp. Class H (Commercial Banks) | | | 922,000 | | | | 772,279 | |
China Hongqiao Group, Ltd. (Metals & Mining) | | | 253,000 | | | | 146,711 | |
China Petroleum & Chemical Corp. Class H (Oil, Gas & Consumable Fuels) | | | 562,000 | | | | 614,857 | |
| † | Percentages indicated are based on Fund net assets. |
| ¨ | | Among the Fund’s 10 largest holdings, as of April 30, 2013, excluding short-term investment. May be subject to change daily. |
| | | | | | |
The notes to the financial statements are an integral part of,
and should be read in conjunction with, the financial statements. | | mainstayinvestments.com | | | 11 | |
Portfolio of Investments April 30, 2013 (Unaudited) (continued)
| | | | | | | | |
| | |
| | | Shares | | | Value | |
| | | | | | | | |
| Common Stocks (continued) | |
China (continued) | |
China Railway Construction Corp., Ltd. Class H (Construction & Engineering) | | | 638,500 | | | $ | 644,247 | |
China Unicom Hong Kong, Ltd. (Diversified Telecommunication Services) | | | 428,000 | | | | 613,308 | |
Chongqing Rural Commercial Bank Class H (Commercial Banks) | | | 1,092,000 | | | | 593,834 | |
CITIC Telecom International Holdings, Ltd. (Diversified Telecommunication Services) | | | 220,000 | | | | 79,947 | |
CNOOC, Ltd. (Oil, Gas & Consumable Fuels) | | | 350,000 | | | | 651,276 | |
CSPC Pharmaceutical Group, Ltd. (Pharmaceuticals) (a) | | | 364,000 | | | | 175,430 | |
Guotai Junan International Holdings, Ltd. (Capital Markets) | | | 693,000 | | | | 292,019 | |
Huaneng Power International, Inc. Class H (Independent Power Producers & Energy Traders) | | | 534,000 | | | | 617,253 | |
Kingsoft Corp., Ltd. (Software) | | | 27,000 | | | | 31,070 | |
NAM TAI Electronics, Inc. (Electronic Equipment, Instruments & Components) | | | 45,300 | | | | 342,468 | |
Prince Frog International Holdings, Ltd. (Personal Products) | | | 515,000 | | | | 321,869 | |
Sinofert Holdings, Ltd. (Chemicals) | | | 1,552,000 | | | | 335,993 | |
Sunny Optical Technology Group Co., Ltd. (Leisure Equipment & Products) | | | 466,000 | | | | 617,318 | |
TCL Multimedia Technology Holdings, Ltd. Class M (Household Durables) | | | 754,000 | | | | 682,085 | |
Tiangong International Co., Ltd. (Metals & Mining) | | | 742,000 | | | | 209,401 | |
Weiqiao Textile Co. Class H (Textiles, Apparel & Luxury Goods) | | | 142,500 | | | | 78,410 | |
Yangzijiang Shipbuilding Holdings, Ltd. (Machinery) | | | 1,412,000 | | | | 1,089,064 | |
Yashili International Holdings, Ltd. (Food Products) | | | 540,000 | | | | 201,800 | |
| | | | | | | | |
| | | | 10,162,520 | |
| | | | | | | | |
Denmark 1.6% | |
A.P. Moeller—Maersk A/S, Class A (Marine) | | | 17 | | | | 116,214 | |
GN Store Nord A/S (Health Care Equipment & Supplies) | | | 48,457 | | | | 885,067 | |
Novo-Nordisk A/S Class B (Pharmaceuticals) (d) | | | 10,849 | | | | 1,902,997 | |
Pandora A/S (Textiles, Apparel & Luxury Goods) (d) | | | 14,035 | | | | 428,406 | |
| | | | | | | | |
| | | | 3,332,684 | |
| | | | | | | | |
Egypt 0.3% | |
Commercial International Bank Egypt S.A.E. (Commercial Banks) | | | 117,867 | | | | 519,453 | |
| | | | | | | | |
| | | | | | | | |
| | |
| | | Shares | | | Value | |
| | | | | | | | |
Finland 0.6% | |
Metso Oyj (Machinery) | | | 27,043 | | | $ | 1,110,810 | |
Tieto Oyj (IT Services) | | | 9,989 | | | | 213,900 | |
| | | | | | | | |
| | | | 1,324,710 | |
| | | | | | | | |
France 10.5% | |
Air France-KLM (Airlines) (a) | | | 115,036 | | | | 1,165,919 | |
¨BNP Paribas S.A. (Commercial Banks) (d) | | | 40,701 | | | | 2,267,867 | |
Bouygues S.A. (Construction & Engineering) (d) | | | 51,885 | | | | 1,447,912 | |
CNP Assurances (Insurance) | | | 6,397 | | | | 90,606 | |
Derichebourg S.A. (Commercial Services & Supplies) (a) | | | 27,606 | | | | 111,576 | |
Eiffage S.A. (Construction & Engineering) (d) | | | 12,864 | | | | 569,395 | |
European Aeronautic Defence and Space Co. N.V. (Aerospace & Defense) | | | 32,289 | | | | 1,705,386 | |
France Telecom S.A. (Diversified Telecommunication Services) (d) | | | 128,148 | | | | 1,371,043 | |
Maurel & Prom Nigeria S.A. (Oil, Gas & Consumable Fuels) (a) | | | 17,379 | | | | 80,792 | |
Natixis (Commercial Banks) | | | 364,442 | | | | 1,598,240 | |
Nexity S.A. (Household Durables) | | | 5,941 | | | | 213,595 | |
Plastic Omnium S.A. (Auto Components) (d) | | | 24,211 | | | | 1,181,965 | |
Renault S.A. (Automobiles) (d) | | | 23,865 | | | | 1,644,367 | |
Sanofi (Pharmaceuticals) (d) | | | 19,934 | | | | 2,184,699 | |
Teleperformance (Professional Services) (d) | | | 26,715 | | | | 1,175,794 | |
¨Total S.A. (Oil, Gas & Consumable Fuels) (d) | | | 59,439 | | | | 2,995,708 | |
UbiSoft Entertainment S.A. (Software) (a)(d) | | | 104,186 | | | | 1,162,150 | |
Unibail-Rodamco S.E. (Real Estate Investment Trusts) | | | 1,390 | | | | 363,366 | |
| | | | | | | | |
| | | | 21,330,380 | |
| | | | | | | | |
Germany 8.2% | |
¨Allianz S.E. (Insurance) (d) | | | 16,463 | | | | 2,429,351 | |
BASF S.E. (Chemicals) (d) | | | 11,497 | | | | 1,073,798 | |
Bayer A.G. (Pharmaceuticals) (d) | | | 15,981 | | | | 1,667,279 | |
Continental A.G. (Auto Components) (d) | | | 12,453 | | | | 1,478,623 | |
Deutsche Lufthansa A.G. (Airlines) (d) | | | 69,801 | | | | 1,395,413 | |
Deutsche Post A.G. Registered (Air Freight & Logistics) | | | 16,840 | | | | 399,638 | |
Duerr A.G. (Machinery) (d) | | | 10,188 | | | | 1,158,968 | |
Hannover Rueckversicherung S.E. (Insurance) (d) | | | 17,519 | | | | 1,479,354 | |
Metro A.G. (Food & Staples Retailing) | | | 16,647 | | | | 519,033 | |
Muenchener Rueckversicherungs-Gesellschaft A.G. Registered (Insurance) (d) | | | 9,263 | | | | 1,852,405 | |
Siemens A.G. (Industrial Conglomerates) | | | 2,551 | | | | 266,412 | |
SMA Solar Technology A.G. (Semiconductors & Semiconductor Equipment) | | | 17,490 | | | | 433,029 | |
Suedzucker A.G. (Food Products) (d) | | | 31,150 | | | | 1,255,714 | |
Volkswagen A.G. (Automobiles) | | | 3,050 | | | | 592,865 | |
Wincor Nixdorf A.G. (Computers & Peripherals) | | | 10,159 | | | | 534,621 | |
| | | | | | | | |
| | | | | | | 16,536,503 | |
| | | | | | | | |
| | | | |
| 12 | | MainStay International Opportunities Fund | | The notes to the financial statements are an integral part of,
and should be read in conjunction with, the financial statements. |
| | | | | | | | |
| | |
| | | Shares | | | Value | |
| | | | | | | | |
| Common Stocks (continued) | |
Greece 0.2% | |
Motor Oil Hellas Corinth Refineries S.A. (Oil, Gas & Consumable Fuels) | | | 10,986 | | | $ | 121,242 | |
OPAP S.A. (Hotels, Restaurants & Leisure) | | | 23,864 | | | | 235,394 | |
| | | | | | | | |
| | | | | | | 356,636 | |
| | | | | | | | |
Hong Kong 3.7% | |
AMVIG Holdings, Ltd. (Containers & Packaging) | | | 76,000 | | | | 29,381 | |
Bosideng International Holdings, Ltd. (Textiles, Apparel & Luxury Goods) | | | 398,000 | | | | 105,140 | |
Chaoda Modern Agriculture Holdings, Ltd. (Food Products) (a)(b)(c) | | | 38,000 | | | | 1,812 | |
Cheung Kong Holdings, Ltd. (Real Estate Management & Development) | | | 6,000 | | | | 90,462 | |
China All Access Holdings, Ltd. (Communications Equipment) | | | 532,000 | | | | 163,847 | |
China Green Holdings, Ltd. (Food Products) (a) | | | 327,000 | | | | 45,509 | |
Hopewell Holdings, Ltd. (Industrial Conglomerates) (d) | | | 320,500 | | | | 1,234,892 | |
Hutchison Whampoa, Ltd. (Industrial Conglomerates) | | | 15,000 | | | | 162,658 | |
Ju Teng International Holdings, Ltd. (Electronic Equipment, Instruments & Components) | | | 944,000 | | | | 614,318 | |
MGM China Holdings, Ltd. (Hotels, Restaurants & Leisure) | | | 628,400 | | | | 1,481,894 | |
NetDragon Websoft, Inc. (Software) | | | 255,500 | | | | 375,341 | |
New World Development, Ltd. (Real Estate Management & Development) | | | 115,000 | | | | 199,764 | |
Orient Overseas International, Ltd. (Marine) (d) | | | 188,000 | | | | 1,116,834 | |
Real Nutriceutical Group, Ltd. (Personal Products) | | | 229,000 | | | | 60,790 | |
Sun Hung Kai Properties, Ltd. (Real Estate Management & Development) | | | 33,000 | | | | 477,555 | |
Tianneng Power International, Ltd. (Auto Components) | | | 418,000 | | | | 264,477 | |
Wharf Holdings, Ltd. (The) (Real Estate Management & Development) | | | 77,000 | | | | 688,125 | |
Wheelock & Co, Ltd. (Real Estate Management & Development) | | | 81,000 | | | | 452,485 | |
| | | | | | | | |
| | | | | | | 7,565,284 | |
| | | | | | | | |
India 1.2% | |
Aurobindo Pharma, Ltd. (Pharmaceuticals) | | | 187,610 | | | | 661,641 | |
Karnataka Bank, Ltd. (Commercial Banks) | | | 238,090 | | | | 660,686 | |
Power Finance Corp., Ltd. (Diversified Financial Services) | | | 138,913 | | | | 502,923 | |
Rural Electrification Corp., Ltd. (Diversified Financial Services) | | | 82,919 | | | | 345,374 | |
Vedanta Resources PLC (Metals & Mining) (d) | | | 12,400 | | | | 232,872 | |
| | | | | | | | |
| | | | | | | 2,403,496 | |
| | | | | | | | |
Indonesia 0.1% | |
Malindo Feedmill Tbk PT (Food Products) | | | 694,500 | | | | 200,010 | |
| | | | | | | | |
| | | | | | | | |
| | |
| | | Shares | | | Value | |
| | | | | | | | |
Ireland 0.2% | |
Greencore Group PLC (Food Products) | | | 75,270 | | | $ | 124,520 | |
United Drug PLC (Health Care Providers & Services) | | | 52,468 | | | | 246,867 | |
| | | | | | | | |
| | | | | | | 371,387 | |
| | | | | | | | |
Israel 2.1% | |
Bank Hapoalim BM (Commercial Banks) (a) | | | 156,804 | | | | 728,253 | |
Bezeq-The Israeli Telecommunication Corp., Ltd. (Diversified Telecommunication Services) | | | 720,263 | | | | 1,044,733 | |
Delek Group, Ltd. (Oil, Gas & Consumable Fuels) | | | 3,887 | | | | 1,022,438 | |
Israel Corp., Ltd. (The) (Chemicals) | | | 609 | | | | 391,561 | |
Mizrahi Tefahot Bank, Ltd. (Commercial Banks) (a) | | | 56,877 | | | | 581,304 | |
Teva Pharmaceutical Industries, Ltd. (Pharmaceuticals) | | | 11,830 | | | | 462,970 | |
| | | | | | | | |
| | | | | | | 4,231,259 | |
| | | | | | | | |
Italy 3.2% | |
Astaldi S.p.A. (Construction & Engineering) | | | 16,941 | | | | 117,018 | |
Autostrada Torino-Milano S.p.A. (Transportation Infrastructure) | | | 809 | | | | 9,642 | |
Banca Carige S.p.A (Commercial Banks) | | | 213,579 | | | | 155,263 | |
Credito Emiliano S.p.A (Commercial Banks) | | | 51,754 | | | | 295,803 | |
Enel S.p.A. (Electric Utilities) | | | 408,318 | | | | 1,578,789 | |
ENI S.p.A. (Oil, Gas & Consumable Fuels) (d) | | | 90,617 | | | | 2,167,180 | |
Fiat Industrial S.p.A (Machinery) | | | 125,553 | | | | 1,417,024 | |
Safilo Group S.p.A. (Textiles, Apparel & Luxury Goods) (a) | | | 24,434 | | | | 400,621 | |
Telecom Italia S.p.A. (Diversified Telecommunication Services) | | | 461,348 | | | | 320,798 | |
| | | | | | | | |
| | | | | | | 6,462,138 | |
| | | | | | | | |
Japan 32.0% | |
Accordia Golf Co., Ltd. (Hotels, Restaurants & Leisure) | | | 732 | | | | 831,229 | |
Aida Engineering, Ltd. (Machinery) | | | 32,500 | | | | 268,375 | |
Aisan Industry Co., Ltd. (Auto Components) | | | 9,000 | | | | 86,321 | |
AOKI Holdings, Inc. (Specialty Retail) (d) | | | 14,500 | | | | 446,966 | |
AOYAMA TRADING Co., Ltd. (Specialty Retail) (d) | | | 35,000 | | | | 1,045,853 | |
Astellas Pharma, Inc. (Pharmaceuticals) | | | 20,400 | | | | 1,186,521 | |
Chubu Electric Power Co., Inc. (Electric Utilities) | | | 25,700 | | | | 332,438 | |
Cocokara Fine, Inc. (Food & Staples Retailing) | | | 2,300 | | | | 86,824 | |
COMSYS Holdings Corp. (Construction & Engineering) (d) | | | 89,100 | | | | 1,179,043 | |
Cosmo Oil Co., Ltd. (Oil, Gas & Consumable Fuels) (a) | | | 183,000 | | | | 435,513 | |
Dainippon Sumitomo Pharma Co., Ltd. (Pharmaceuticals) | | | 45,900 | | | | 842,807 | |
Daiwa House Industry Co., Ltd. (Real Estate Management & Development) | | | 73,000 | | | | 1,648,931 | |
Daiwa Securities Group, Inc. (Capital Markets) (d) | | | 189,000 | | | | 1,673,150 | |
EDION Corp. (Specialty Retail) (d) | | | 253,300 | | | | 1,184,847 | |
| | | | | | |
The notes to the financial statements are an integral part of,
and should be read in conjunction with, the financial statements. | | mainstayinvestments.com | | | 13 | |
Portfolio of Investments April 30, 2013 (Unaudited) (continued)
| | | | | | | | |
| | |
| | | Shares | | | Value | |
| | | | | | | | |
| Common Stocks (continued) | |
Japan (continued) | |
Fuji Heavy Industries, Ltd. (Automobiles) (d) | | | 92,000 | | | $ | 1,736,472 | |
Fuji Soft, Inc. (Software) | | | 14,100 | | | | 376,347 | |
Fujimi, Inc. (Chemicals) | | | 7,200 | | | | 96,236 | |
Funai Electric Co., Ltd. (Household Durables) | | | 33,100 | | | | 409,824 | |
Furukawa-Sky Aluminum Corp. (Metals & Mining) (d) | | | 42,000 | | | | 129,682 | |
Geo Holdings Corp. (Specialty Retail) | | | 105 | | | | 125,373 | |
Gulliver International Co., Ltd. (Specialty Retail) | | | 14,100 | | | | 113,107 | |
Hitachi Medical Corp. (Health Care Equipment & Supplies) | | | 5,000 | | | | 79,653 | |
Hosiden Corp. (Electronic Equipment & Instruments) | | | 17,700 | | | | 100,951 | |
Idemitsu Kosan Co., Ltd. (Oil, Gas & Consumable Fuels) (d) | | | 15,600 | | | | 1,317,003 | |
IT Holdings Corp. (IT Services) (d) | | | 81,000 | | | | 1,216,433 | |
Jaccs Co., Ltd. (Consumer Finance) (d) | | | 181,000 | | | | 1,243,986 | |
Japan Airlines Co., Ltd. (Airlines) (d) | | | 24,600 | | | | 1,246,592 | |
Japan Petroleum Exploration Co., Ltd. (Oil, Gas & Consumable Fuels) (d) | | | 17,200 | | | | 680,166 | |
JFE Holdings, Inc. (Metals & Mining) (d) | | | 68,600 | | | | 1,483,395 | |
JVC Kenwood Corp. (Household Durables) (d) | | | 21,200 | | | | 54,802 | |
JX Holdings, Inc. (Oil, Gas & Consumable Fuels) (d) | | | 260,600 | | | | 1,411,466 | |
Kamei Corp. (Trading Companies & Distributors) | | | 23,200 | | | | 234,654 | |
Kanamoto Co., Ltd. (Trading Companies & Distributors) | | | 52,000 | | | | 1,201,251 | |
Kandenko Co., Ltd. (Construction & Engineering) | | | 79,000 | | | | 358,188 | |
Kanematsu Corp. (Trading Companies & Distributors) (a) | | | 454,000 | | | | 628,712 | |
KDDI Corp. (Wireless Telecommunication Services) (d) | | | 38,600 | | | | 1,853,085 | |
Keihin Corp. (Auto Components) | | | 10,800 | | | | 176,372 | |
Komori Corp. (Machinery) | | | 95,700 | | | | 1,183,918 | |
Kyowa Exeo Corp. (Construction & Engineering) | | | 37,700 | | | | 444,348 | |
Maeda Corp. (Construction & Engineering) | | | 32,000 | | | | 152,967 | |
Makino Milling Machine Co., Ltd. (Machinery) | | | 150,000 | | | | 889,368 | |
Medipal Holdings Corp. (Health Care Providers & Services) (d) | | | 88,400 | | | | 1,386,507 | |
Mitsuba Corp. (Auto Components) | | | 10,000 | | | | 118,582 | |
Mitsubishi Materials Corp. (Metals & Mining) | | | 319,000 | | | | 912,971 | |
Mitsubishi UFJ Financial Group, Inc. (Commercial Banks) (d) | | | 300,600 | | | | 2,044,395 | |
Mitsui Fudosan Co., Ltd. (Real Estate Management & Development) | | | 19,000 | | | | 645,125 | |
Mitsumi Electric Co., Ltd. (Electronic Equipment, Instruments & Components) (a) | | | 34,100 | | | | 194,837 | |
NEC Networks & System Integration Corp. (IT Services) | | | 50,200 | | | | 1,099,935 | |
Nichii Gakkan Co. (Health Care Providers & Services) | | | 16,200 | | | | 164,684 | |
| | | | | | | | |
| | |
| | | Shares | | | Value | |
| | | | | | | | |
Japan (continued) | |
Nippo Corp. (Construction & Engineering) (d) | | | 91,000 | | | $ | 1,361,009 | |
Nippon Seiki Co., Ltd. (Auto Components) | | | 6,000 | | | | 79,089 | |
Nippon Signal Co., Ltd. (Electrical Equipment) | | | 55,100 | | | | 443,694 | |
Nippon Synthetic Chemical Industry Co., Ltd. (The) (Chemicals) | | | 10,000 | | | | 95,912 | |
Nippon Telegraph & Telephone Corp. (Diversified Telecommunication Services) (d) | | | 36,600 | | | | 1,811,509 | |
Nishi-Nippon City Bank, Ltd. (The) (Commercial Banks) (d) | | | 202,000 | | | | 673,437 | |
Nishimatsu Construction Co., Ltd. (Construction & Engineering) | | | 457,000 | | | | 871,950 | |
Nomura Holdings, Inc. (Capital Markets) (d) | | | 181,900 | | | | 1,479,681 | |
Pocket Card Co., Ltd. (Consumer Finance) | | | 15,600 | | | | 140,982 | |
RICOH Co., Ltd. (Office Electronics) (d) | | | 120,000 | | | | 1,336,821 | |
Riso Kagaku Corp. (Office Electronics) (d) | | | 3,700 | | | | 70,785 | |
Sakai Chemical Industry Co., Ltd. (Chemicals) | | | 17,000 | | | | 53,362 | |
Seiko Epson Corp. (Computers & Peripherals) (d) | | | 123,400 | | | | 1,413,939 | |
Shima Seiki Manufacturing, Ltd. (Machinery) | | | 5,100 | | | | 110,282 | |
Shinko Electric Industries Co., Ltd. (Semiconductors & Semiconductor Equipment) | | | 141,600 | | | | 1,438,006 | |
Shionogi & Co., Ltd. (Pharmaceuticals) | | | 68,000 | | | | 1,672,709 | |
Showa Corp. (Auto Components) (d) | | | 68,900 | | | | 998,674 | |
Sintokogio, Ltd. (Machinery) | | | 3,700 | | | | 33,476 | |
SKY Perfect JSAT Holdings, Inc. (Media) (d) | | | 835 | | | | 419,706 | |
Sojitz Corp. (Trading Companies & Distributors) | | | 880,800 | | | | 1,382,391 | |
Sony Corp. (Household Durables) | | | 15,200 | | | | 251,501 | |
Sumitomo Metal Mining Co., Ltd. (Metals & Mining) (d) | | | 90,000 | | | | 1,252,808 | |
Sumitomo Mitsui Financial Group, Inc. (Commercial Banks) (d) | | | 45,276 | | | | 2,138,749 | |
Suzuken Co., Ltd. (Health Care Providers & Services) | | | 800 | | | | 31,102 | |
Token Corp. (Household Durables) | | | 780 | | | | 50,168 | |
Tokuyama Corp. (Chemicals) | | | 446,000 | | | | 1,198,666 | |
Topy Industries, Ltd. (Metals & Mining) | | | 158,000 | | | | 367,913 | |
Tosoh Corp. (Chemicals) | | | 423,000 | | | | 1,392,860 | |
Toyo Seikan Group Holdings, Ltd. (Containers & Packaging) | | | 42,800 | | | | 585,682 | |
Toyoda Gosei Co., Ltd. (Auto Components) | | | 8,400 | | | | 217,658 | |
¨Toyota Motor Corp. (Automobiles) (d) | | | 66,400 | | | | 3,841,576 | |
TS Tech Co., Ltd. (Auto Components) | | | 2,500 | | | | 75,883 | |
Universal Entertainment Corp. (Leisure Equipment & Products) | | | 21,300 | | | | 534,221 | |
Yellow Hat, Ltd. (Specialty Retail) | | | 13,300 | | | | 266,314 | |
| | | | | | | | |
| | | | 64,852,720 | |
| | | | | | | | |
Malaysia 0.0%‡ | |
JCY International Bhd (Computers & Peripherals) | | | 375,100 | | | | 61,027 | |
| | | | | | | | |
|
Netherlands 5.2% | |
Aegon N.V. (Insurance) | | | 231,366 | | | | 1,526,839 | |
Heineken Holding N.V. (Beverages) | | | 21,794 | | | | 1,310,516 | |
| | | | |
| 14 | | MainStay International Opportunities Fund | | The notes to the financial statements are an integral part of,
and should be read in conjunction with, the financial statements. |
| | | | | | | | |
| | |
| | | Shares | | | Value | |
| | | | | | | | |
| Common Stocks (continued) | |
Netherlands (continued) | |
Koninklijke Ahold N.V. (Food & Staples Retailing) (d) | | | 98,730 | | | $ | 1,557,670 | |
Koninklijke Philips Electronics N.V. (Industrial Conglomerates) (d) | | | 6,073 | | | | 167,715 | |
¨Royal Dutch Shell PLC Class A (Oil, Gas & Consumable Fuels) (d) | | | 87,980 | | | | 2,995,669 | |
Royal Dutch Shell PLC Class B (Oil, Gas & Consumable Fuels) (d) | | | 54,017 | | | | 1,890,431 | |
Unilever N.V., CVA (Food Products) (d) | | | 25,376 | | | | 1,080,100 | |
| | | | | | | | |
| | | | 10,528,940 | |
| | | | | | | | |
New Zealand 0.3% | |
Chorus, Ltd. (Diversified Telecommunication Services) | | | 60,631 | | | | 142,917 | |
Telecom Corp. of New Zealand, Ltd. (Diversified Telecommunication Services) | | | 193,324 | | | | 431,669 | |
| | | | | | | | |
| | | | 574,586 | |
| | | | | | | | |
Norway 2.6% | |
DnB NOR ASA (Commercial Banks) (d) | | | 102,060 | | | | 1,668,110 | |
Kvaerner ASA (Energy Equipment & Services) | | | 143,392 | | | | 241,453 | |
Marine Harvest ASA (Food Products) (a) | | | 1,095,106 | | | | 1,139,449 | |
SpareBank 1 SMN (Commercial Banks) | | | 28,746 | | | | 244,265 | |
StatoilHydro ASA (Oil, Gas & Consumable Fuels) (d) | | | 28,762 | | | | 701,780 | |
Vard Holdings, Ltd. (Machinery) | | | 397,000 | | | | 331,988 | |
Yara International ASA (Chemicals) (d) | | | 19,359 | | | | 906,430 | |
| | | | | | | | |
| | | | 5,233,475 | |
| | | | | | | | |
Republic of Korea 1.5% | |
Chong Kun Dang Pharm Corp. (Pharmaceuticals) | | | 9,685 | | | | 539,082 | |
Hankook Tire Worldwide Co., Ltd. (Diversified Financial Services) | | | 17,570 | | | | 319,078 | |
Hyundai Mobis (Auto Components) | | | 749 | | | | 170,026 | |
Partron Co., Ltd. (Electronic Equipment, Instruments & Components) | | | 30,795 | | | | 651,524 | |
Samsung Electronics Co., Ltd. (Semiconductors & Semiconductor Equipment) | | | 235 | | | | 324,344 | |
SK Holdings Co., Ltd. (Industrial Conglomerates) | | | 3,999 | | | | 575,539 | |
Sungwoo Hitech Co., Ltd. (Auto Components) | | | 28,327 | | | | 393,538 | |
| | | | | | | | |
| | | | 2,973,131 | |
| | | | | | | | |
Singapore 0.1% | |
Hutchison Port Holdings Trust (Transportation Infrastructure) | | | 347,000 | | | | 288,010 | |
| | | | | | | | |
|
South Africa 0.1% | |
Steinhoff International Holdings, Ltd. (Household Durables) (a) | | | 41,078 | | | | 109,636 | |
| | | | | | | | |
| | | | | | | | |
| | |
| | | Shares | | | Value | |
| | | | | | | | |
Spain 3.4% | |
Abengoa S.A. (Construction & Engineering) | | | 67,247 | | | $ | 179,779 | |
Banco Santander S.A. (Commercial Banks) | | | 28,007 | | | | 202,529 | |
Distribuidora Internacional de Alimentacion S.A. (Food & Staples Retailing) | | | 55,564 | | | | 431,001 | |
Gamesa Corp. Tecnologica S.A. (Electrical Equipment) | | | 312,658 | | | | 1,223,324 | |
Gas Natural SDG S.A. (Gas Utilities) | | | 79,162 | | | | 1,657,614 | |
Grupo Catalana Occidente S.A. (Insurance) | | | 15,444 | | | | 349,830 | |
Mapfre S.A. (Insurance) | | | 265,263 | | | | 972,907 | |
Repsol, S.A. (Oil, Gas & Consumable Fuels) (d) | | | 77,245 | | | | 1,810,756 | �� |
| | | | | | | | |
| | | | 6,827,740 | |
| | | | | | | | |
Sweden 1.5% | |
Boliden AB (Metals & Mining) (d) | | | 5,299 | | | | 83,887 | |
Nordea Bank AB (Commercial Banks) (d) | | | 35,002 | | | | 419,362 | |
SAS AB (Airlines) (a) | | | 50,331 | | | | 109,110 | |
Skandinaviska Enskilda Banken AB Class A (Commercial Banks) | | | 35,805 | | | | 367,384 | |
Svenska Cellulosa AB Class B (Household Products) | | | 3,259 | | | | 84,630 | |
Swedbank AB Class A (Commercial Banks) (d) | | | 70,525 | | | | 1,735,635 | |
Telefonaktiebolaget LM Ericsson Class B (Communications Equipment) | | | 27,475 | | | | 342,958 | |
| | | | | | | | |
| | | | 3,142,966 | |
| | | | | | | | |
Switzerland 7.2% | |
EMS-Chemie Holding A.G. (Chemicals) | | | 1,825 | | | | 527,499 | |
GAM Holding A.G. (Capital Markets) (a) | | | 48,826 | | | | 861,203 | |
Holcim, Ltd. (Construction Materials) (a) | | | 5,347 | | | | 416,638 | |
Implenia A.G. Registered (Construction & Engineering) (a) | | | 3,251 | | | | 178,494 | |
Kudelski S.A. (Electronic Equipment, Instruments & Components) (a) | | | 9,325 | | | | 117,340 | |
¨Nestle S.A. Registered (Food Products) (d) | | | 66,547 | | | | 4,752,335 | |
Novartis A.G. (Pharmaceuticals) (d) | | | 19,463 | | | | 1,445,386 | |
¨Roche Holding A.G., Genusscheine (Pharmaceuticals) (d) | | | 16,127 | | | | 4,030,883 | |
Swiss Life Holding A.G. Registered (Insurance) (a) | | | 6,796 | | | | 1,074,438 | |
Syngenta A.G. (Chemicals) | | | 1,596 | | | | 682,136 | |
UBS A.G. (Capital Markets) (a) | | | 33,810 | | | | 603,620 | |
| | | | | | | | |
| | | | 14,689,972 | |
| | | | | | | | |
Taiwan 0.7% | |
Shin Zu Shing Co., Ltd. (Machinery) | | | 26,000 | | | | 66,515 | |
TPK Holding Co., Ltd. (Electronic Equipment, Instruments & Components) | | | 29,000 | | | | 588,608 | |
Vanguard International Semiconductor Corp. (Semiconductors & Semiconductor Equipment) | | | 618,000 | | | | 673,242 | |
| | | | | | | | |
| | | | 1,328,365 | |
| | | | | | | | |
| | | | | | |
The notes to the financial statements are an integral part of,
and should be read in conjunction with, the financial statements. | | mainstayinvestments.com | | | 15 | |
Portfolio of Investments April 30, 2013 (Unaudited) (continued)
| | | | | | | | |
| | |
| | | Shares | | | Value | |
| | | | | | | | |
| Common Stocks (continued) | |
Thailand 0.6% | |
Airports of Thailand PCL (Transportation Infrastructure) | | | 103,400 | | | $ | 509,073 | |
PTT Global Chemical PCL (Chemicals) | | | 223,400 | | | | 555,646 | |
Thai Oil PCL (Oil, Gas & Consumable Fuels) | | | 92,500 | | | | 208,007 | |
| | | | | | | | |
| | | | 1,272,726 | |
| | | | | | | | |
Turkey 0.4% | |
Kardemir Karabuk Demir Celik Sanayi ve Ticaret AS Class D (Metals & Mining) | | | 18,136 | | | | 20,435 | |
Turk Hava Yollari (Airlines) (a) | | | 139,853 | | | | 581,957 | |
Turkiye Vakiflar Bankasi Tao Class D (Commercial Banks) | | | 49,141 | | | | 175,430 | |
| | | | | | | | |
| | | | 777,822 | |
| | | | | | | | |
United Kingdom 17.5% | |
Ashtead Group PLC (Trading Companies & Distributors) | | | 9,631 | | | | 87,892 | |
Associated British Foods PLC (Food Products) | | | 35,209 | | | | 1,058,288 | |
¨AstraZeneca PLC (Pharmaceuticals) (d) | | | 44,735 | | | | 2,322,673 | |
BAE Systems PLC (Aerospace & Defense) | | | 155,818 | | | | 908,860 | |
Barratt Developments PLC (Household Durables) (a) | | | 260,345 | | | | 1,258,514 | |
Beazley PLC (Insurance) | | | 52,462 | | | | 182,949 | |
BHP Billiton PLC (Metals & Mining) (d) | | | 31,827 | | | | 885,443 | |
Bodycote PLC (Machinery) | | | 40,463 | | | | 325,265 | |
BP PLC (Oil, Gas & Consumable Fuels) | | | 289,973 | | | | 2,100,803 | |
British American Tobacco PLC (Tobacco) (d) | | | 23,323 | | | | 1,291,918 | |
British Sky Broadcasting Group PLC (Media) | | | 37,590 | | | | 492,815 | |
Computacenter PLC (IT Services) | | | 5,167 | | | | 35,941 | |
CSR PLC (Semiconductors & Semiconductor Equipment) | | | 78,514 | | | | 601,261 | |
Diageo PLC (Beverages) (d) | | | 17,963 | | | | 548,011 | |
Enquest PLC (Oil, Gas & Consumable Fuels) (a) | | | 192,108 | | | | 384,652 | |
Enterprise Inns PLC (Hotels, Restaurants & Leisure) (a) | | | 35,086 | | | | 53,384 | |
Eurasian Natural Resources Corp. PLC (Metals & Mining) | | | 41,063 | | | | 175,027 | |
Ferrexpo PLC (Metals & Mining) | | | 463,047 | | | | 1,278,869 | |
GlaxoSmithKline PLC (Pharmaceuticals) (d) | | | 48,995 | | | | 1,263,746 | |
Halfords Group PLC (Specialty Retail) | | | 105,981 | | | | 567,629 | |
Home Retail Group PLC (Internet & Catalog Retail) | | | 484,068 | | | | 1,171,502 | |
HSBC Holdings PLC (Commercial Banks) (d) | | | 183,985 | | | | 2,010,554 | |
Interserve PLC (Construction & Engineering) | | | 17,901 | | | | 131,469 | |
ITV PLC (Media) | | | 678,329 | | | | 1,326,586 | |
J Sainsbury PLC (Food & Staples Retailing) | | | 40,838 | | | | 241,754 | |
Kazakhmys PLC (Metals & Mining) | | | 60,138 | | | | 323,497 | |
Keller Group PLC (Construction & Engineering) | | | 6,688 | | | | 89,292 | |
Marston’s PLC (Hotels, Restaurants & Leisure) | | | 74,235 | | | | 166,973 | |
Micro Focus International PLC (Software) | | | 55,982 | | | | 582,195 | |
National Grid PLC (Multi-Utilities) (d) | | | 37,834 | | | | 481,616 | |
| | | | | | | | |
| | |
| | | Shares | | | Value | |
| | | | | | | | |
United Kingdom (continued) | |
Next PLC (Multiline Retail) (d) | | | 17,765 | | | $ | 1,202,877 | |
Pace PLC (Communications Equipment) | | | 303,182 | | | | 1,169,363 | |
Persimmon PLC (Household Durables) (d) | | | 50,133 | | | | 841,040 | |
Persimmon PLC (Household Durables) (c) | | | 50,133 | | | | 58,406 | |
Playtech, Ltd. (Software) | | | 58,049 | | | | 552,745 | |
Reckitt Benckiser Group PLC (Household Products) | | | 598 | | | | 43,621 | |
Rio Tinto PLC (Metals & Mining) (d) | | | 45,303 | | | | 2,054,141 | |
Standard Chartered PLC (Commercial Banks) (d) | | | 51,328 | | | | 1,289,240 | |
Tesco PLC (Food & Staples Retailing) | | | 21,418 | | | | 121,817 | |
Trinity Mirror PLC (Media) (a) | | | 33,473 | | | | 46,796 | |
TUI Travel PLC (Hotels, Restaurants & Leisure) | | | 277,775 | | | | 1,356,147 | |
¨Vodafone Group PLC (Wireless Telecommunication Services) (d) | | | 1,190,675 | | | | 3,628,787 | |
WH Smith PLC (Specialty Retail) | | | 61,373 | | | | 704,993 | |
| | | | | | | | |
| | | | 35,419,351 | |
| | | | | | | | |
Total Common Stocks
(Cost $217,945,724) | | | | | | | 259,056,030 | |
| | | | | | | | |
| | |
| Convertible Preferred Stocks 0.6% | | | | | | | | |
Brazil 0.3% | | | | | | | | |
Cia Energetica De Sao Paulo
5.53% Class B (Independent Power Producers & Energy Traders) | | | 57,700 | | | | 611,391 | |
| | | | | | | | |
|
Germany 0.1% | |
Bayerische Motoren Werke A.G.
4.40% (Automobiles) | | | 2,768 | | | | 192,400 | |
| | | | | | | | |
|
Republic of Korea 0.2% | |
Hyundai Motor Co.
2.46% (Automobiles) | | | 178 | | | | 12,655 | |
Samsung Electronics Co., Ltd.
0.93% (Semiconductors & Semiconductor Equipment) | | | 359 | | | | 283,927 | |
| | | | | | | | |
| | | | 296,582 | |
| | | | | | | | |
Total Convertible Preferred Stocks
(Cost $896,463) | | | | | | | 1,100,373 | |
| | | | | | | | |
| | |
| Preferred Stocks 0.7% | | | | | | | | |
Brazil 0.1% | | | | | | | | |
Banco do Estado do Rio Grande do Sul S.A. Class B
5.24% (Commercial Banks) | | | 20,200 | | | | 172,645 | |
| | | | | | | | |
|
Germany 0.6% | |
Jungheinrich A.G.
2.38% (Machinery) | | | 6,452 | | | | 266,167 | |
| | | | |
| 16 | | MainStay International Opportunities Fund | | The notes to the financial statements are an integral part of,
and should be read in conjunction with, the financial statements. |
| | | | | | | | |
| | |
| | | Shares | | | Value | |
| | | | | | | | |
| Preferred Stocks (continued) | |
Germany (continued) | |
ProSiebenSat.1 Media A.G.
5.47% (Media) (d) | | | 14,888 | | | $ | 570,165 | |
Volkswagen A.G.
2.33% (Automobiles) | | | 2,215 | | | | 448,933 | |
| | | | | | | | |
| | | | 1,285,265 | |
| | | | | | | | |
Total Preferred Stocks
(Cost $1,166,281) | | | | | | | 1,457,910 | |
| | | | | | | | |
| | |
| Rights 0.0%‡ | | | | | | | | |
Spain 0.0%‡ | | | | | | | | |
Banco Santander S.A. (Commercial Banks) (a)(c) | | | 28,007 | | | | 5,533 | |
| | | | | | | | |
Total Rights
(Cost $5,504) | | | | | | | 5,533 | |
| | | | | | | | |
| |
| Unaffiliated Investment Company 1.3% | | | | | |
United States 1.3% | | | | | | | | |
¨WisdomTree Japan Hedged Equity Fund (Capital Markets) | | | 55,459 | | | | 2,637,630 | |
| | | | | | | | |
Total Unaffiliated Investment Company
(Cost $2,665,294) | | | | 2,637,630 | |
| | | | | | | | |
| | |
| | | | | | | | |
| | | Number of
Warrants | | | | |
| Warrants 0.0%‡ | | | | | | | | |
France 0.0%‡ | | | | | | | | |
UBISOFT Entertainment
Strike Price €7.00
Expires 10/10/13 (Software) (a) | | | 27,575 | | | | 5,411 | |
| | | | | | | | |
| | |
Spain 0.0%‡ | | | | | | | | |
Promotora de Informaciones S.A. Strike Price €2.00
Expires 6/5/14 (Media) (a) | | | 85,100 | | | | 1,121 | |
| | | | | | | | |
Total Warrants
(Cost $0) | | | | | | | 6,532 | |
| | | | | | | | |
Total Investments, Before Investments Sold Short
(Cost $222,679,266) (f) | | | 130.5 | % | | | 264,264,008 | |
| | | | | | | | |
| | |
| | | | | | | | |
| | | Shares | | | | |
Investments Sold Short (31.9%) Common Stocks Sold Short (30.9%) | | | | | |
Australia (4.3%) | | | | | | | | |
Acrux, Ltd. (Pharmaceuticals) | | | (77,429 | ) | | | (324,293 | ) |
Alkane Resources, Ltd. (Metals & Mining) (a) | | | (40,011 | ) | | | (22,814 | ) |
| | | | | | | | |
| | |
| | | Shares | | | Value | |
| | | | | | | | |
Australia (continued) | | | | | | | | |
Aquila Resources, Ltd. (Oil, Gas & Consumable Fuels) (a) | | | (147,350 | ) | | $ | (282,602 | ) |
Ausenco, Ltd. (Construction & Engineering) | | | (1,851 | ) | | | (5,315 | ) |
Bandanna Energy, Ltd. (Oil, Gas & Consumable Fuels) (a) | | | (325,537 | ) | | | (45,560 | ) |
Bathurst Resources, Ltd. (Metals & Mining) (a) | | | (616,482 | ) | | | (108,648 | ) |
Beadell Resources, Ltd. (Metals & Mining) (a) | | | (1,417,567 | ) | | | (1,036,062 | ) |
Buru Energy, Ltd. (Oil, Gas & Consumable Fuels) (a) | | | (345,669 | ) | | | (666,541 | ) |
Clough, Ltd. (Construction & Engineering) | | | (31,818 | ) | | | (38,923 | ) |
Coalspur Mines, Ltd. (Oil, Gas & Consumable Fuels) (a) | | | (322,941 | ) | | | (152,331 | ) |
Cockatoo Coal, Ltd. (Oil, Gas & Consumable Fuels) (a) | | | (447,395 | ) | | | (29,220 | ) |
Cudeco, Ltd. (Metals & Mining) (a) | | | (86,072 | ) | | | (336,400 | ) |
Discovery Metals, Ltd. (Metals & Mining) (a)(b)(c) | | | (225,035 | ) | | | (79,320 | ) |
Energy World Corp, Ltd. (Independent Power Producers & Energy Traders) (a) | | | (392,946 | ) | | | (130,358 | ) |
Gindalbie Metals, Ltd. (Metals & Mining) (a) | | | (347,720 | ) | | | (64,887 | ) |
Karoon Gas Australia, Ltd. (Oil, Gas & Consumable Fuels) (a) | | | (42,297 | ) | | | (183,290 | ) |
Linc Energy, Ltd. (Oil, Gas & Consumable Fuels) (a) | | | (346,856 | ) | | | (690,405 | ) |
Lynas Corp, Ltd. (Metals & Mining) (a) | | | (1,074,952 | ) | | | (562,774 | ) |
Macquarie Atlas Roads Group (Transportation Infrastructure) | | | (221,278 | ) | | | (385,390 | ) |
Maverick Drilling & Exploration, Ltd. (Oil, Gas & Consumable Fuels) (a) | | | (152,004 | ) | | | (100,065 | ) |
Mirabela Nickel, Ltd. (Metals & Mining) (a) | | | (194,035 | ) | | | (28,162 | ) |
Paladin Energy, Ltd. (Oil, Gas & Consumable Fuels) (a) | | | (1,146,117 | ) | | | (897,076 | ) |
Papillon Resources, Ltd. (Metals & Mining) (a) | | | (133,927 | ) | | | (140,231 | ) |
SAI Global, Ltd. (Professional Services) | | | (79,403 | ) | | | (290,579 | ) |
Sandfire Resources NL (Metals & Mining) (a) | | | (183,678 | ) | | | (1,068,251 | ) |
Senex Energy, Ltd. (Oil, Gas & Consumable Fuels) (a) | | | (942,267 | ) | | | (669,141 | ) |
Sirius Resources NL (Metals & Mining) (a) | | | (119,588 | ) | | | (380,609 | ) |
Virgin Australia Holdings, Ltd. (Airlines) (a) | | | (169,734 | ) | | | (80,063 | ) |
Virgin Australia International Holdings Pvt, Ltd. (Airlines) (a)(b)(c) | | | (444,108 | ) | | | (4,604 | ) |
| | | | | | | | |
| | | | | | | (8,803,914 | ) |
| | | | | | | | |
Austria (0.3%) | | | | | | | | |
Intercell A.G. (Biotechnology) (a) | | | (21,065 | ) | | | (44,387 | ) |
Schoeller-Bleckmann Oilfield Equipment A.G. (Energy Equipment & Services) | | | (1,470 | ) | | | (143,761 | ) |
Wienerberger A.G. (Building Products) | | | (38,956 | ) | | | (479,684 | ) |
| | | | | | | | |
| | | | | | | (667,832 | ) |
| | | | | | | | |
Belgium (0.1%) | | | | | | | | |
D’ieteren S.A. (Distributors) | | | (3,743 | ) | | | (172,527 | ) |
| | | | | | | | |
| | | | | | |
The notes to the financial statements are an integral part of,
and should be read in conjunction with, the financial statements. | | mainstayinvestments.com | | | 17 | |
Portfolio of Investments April 30, 2013 (Unaudited) (continued)
| | | | | | | | |
| | |
| | | Shares | | | Value | |
| | | | | | | | |
Common Stocks Sold Short (continued) | | | | | |
Bermuda (0.1%) | | | | | | | | |
Golden Ocean Group, Ltd. (Marine) (a) | | | (238,217 | ) | | $ | (229,273 | ) |
| | | | | | | | |
| | |
China (2.9%) | | | | | | | | |
Beijing Enterprises Water Group, Ltd. (Water Utilities) | | | (1,096,000 | ) | | | (333,313 | ) |
Boshiwa International Holding, Ltd. (Specialty Retail) (a)(b)(c) | | | (86,000 | ) | | | (18,618 | ) |
Brilliance China Automotive Holdings, Ltd. (Automobiles) (a) | | | (324,000 | ) | | | (396,642 | ) |
China Dongxiang Group Co. (Textiles, Apparel & Luxury Goods) | | | (2,477,000 | ) | | | (427,721 | ) |
China Everbright International, Ltd. (Commercial Services & Supplies) | | | (66,000 | ) | | | (51,030 | ) |
China Foods, Ltd. (Food Products) | | | (624,000 | ) | | | (318,427 | ) |
China Lilang, Ltd. (Textiles, Apparel & Luxury Goods) | | | (548,000 | ) | | | (336,844 | ) |
China Modern Dairy Holdings, Ltd. (Food Products) (a) | | | (271,000 | ) | | | (93,940 | ) |
China Singyes Solar Technologies Holdings, Ltd. (Construction & Engineering) | | | (478,000 | ) | | | (416,394 | ) |
China Suntien Green Energy Corp., Ltd. Class H (Oil, Gas & Consumable Fuels) | | | (572,000 | ) | | | (165,110 | ) |
Daphne International Holdings, Ltd. (Textiles, Apparel & Luxury Goods) | | | (292,000 | ) | | | (303,659 | ) |
First Tractor Co., Ltd. Class H (Machinery) (a) | | | (468,000 | ) | | | (347,375 | ) |
Goodbaby International Holdings, Ltd. (Leisure Equipment & Products) | | | (340,000 | ) | | | (164,301 | ) |
Hidili Industry International Development, Ltd. (Oil, Gas & Consumable Fuels) | | | (243,000 | ) | | | (54,799 | ) |
Hollysys Automation Technologies, Ltd. (Electronic Equipment, Instruments & Components) (a) | | | (25,500 | ) | | | (307,020 | ) |
Huaneng Renewables Corp., Ltd. Class H (Independent Power Producers & Energy Traders) (a) | | | (78,000 | ) | | | (26,536 | ) |
Hunan Nonferrous Metal Corp., Ltd. Class H (Metals & Mining) (a) | | | (758,000 | ) | | | (217,823 | ) |
Kingdee International Software Group Co., Ltd. (Software) (a) | | | (1,866,000 | ) | | | (305,383 | ) |
Microport Scientific Corp. (Health Care Equipment & Supplies) | | | (143,000 | ) | | | (91,032 | ) |
Midas Holdings, Ltd. (Metals & Mining) | | | (295,000 | ) | | | (118,556 | ) |
MIE Holdings Corp. (Oil, Gas & Consumable Fuels) | | | (372,000 | ) | | | (86,287 | ) |
Sany Heavy Equipment International Holdings Co., Ltd. (Machinery) | | | (656,000 | ) | | | (263,748 | ) |
Sinopec Kantons Holdings, Ltd. (Oil, Gas & Consumable Fuels) | | | (312,000 | ) | | | (282,644 | ) |
Vinda International Holdings, Ltd. (Household Products) | | | (277,000 | ) | | | (361,949 | ) |
| | | | | | | | |
| | |
| | | Shares | | | Value | |
| | | | | | | | |
China (continued) | | | | | | | | |
West China Cement, Ltd. (Construction Materials) | | | (656,000 | ) | | $ | (115,812 | ) |
ZTE Corp. Class H (Communications Equipment) | | | (132,200 | ) | | | (223,168 | ) |
| | | | | | | | |
| | | | | | | (5,828,131 | ) |
| | | | | | | | |
Finland (0.6%) | | | | | | | | |
M-real Oyj Class B (Paper & Forest Products) | | | (33,471 | ) | | | (104,028 | ) |
Outokumpu Oyj (Metals & Mining) (a) | | | (1,451,337 | ) | | | (1,008,231 | ) |
Talvivaara Mining Co. PLC (Metals & Mining) (a) | | | (69,031 | ) | | | (15,012 | ) |
| | | | | | | | |
| | | | | | | (1,127,271 | ) |
| | | | | | | | |
France (0.7%) | | | | | | | | |
Alcatel-Lucent (Communications Equipment) (a) | | | (798,776 | ) | | | (1,095,078 | ) |
Artprice.com (Media) (a) | | | (11,013 | ) | | | (344,750 | ) |
Carmat (Health Care Equipment & Supplies) (a) | | | (251 | ) | | | (33,882 | ) |
| | | | | | | | |
| | | | | | | (1,473,710 | ) |
| | | | | | | | |
Germany (1.9%) | | | | | | | | |
Aixtron A.G. (Semiconductors & Semiconductor Equipment) | | | (76,364 | ) | | | (1,089,147 | ) |
Delticom A.G. (Specialty Retail) | | | (15,216 | ) | | | (747,444 | ) |
Morphosys A.G. (Life Sciences Tools & Services) (a) | | | (21,306 | ) | | | (967,613 | ) |
Rhoen Klinikum A.G. (Health Care Providers & Services) | | | (1,140 | ) | | | (24,352 | ) |
SGL Carbon S.E. (Electrical Equipment) | | | (28,830 | ) | | | (984,502 | ) |
| | | | | | | | |
| | | | | | | (3,813,058 | ) |
| | | | | | | | |
Greece (0.0%)‡ | | | | | | | | |
Marfin Investment Group Holdings S.A. (Diversified Financial Services) (a) | | | (116,168 | ) | | | (51,251 | ) |
| | | | | | | | |
| | |
Hong Kong (1.2%) | | | | | | | | |
Ajisen China Holdings, Ltd. (Hotels, Restaurants & Leisure) | | | (482,000 | ) | | | (347,829 | ) |
China Precious Metal Resources Holdings Co., Ltd. (Metals & Mining) (a) | | | (1,044,000 | ) | | | (177,584 | ) |
Comba Telecom Systems Holdings, Ltd. (Communications Equipment) | | | (711,000 | ) | | | (242,798 | ) |
Esprit Holdings, Ltd. (Specialty Retail) | | | (844,000 | ) | | | (1,183,317 | ) |
Hengdeli Holdings, Ltd. (Specialty Retail) | | | (992,000 | ) | | | (290,180 | ) |
Shenzhou International Group Holdings, Ltd. (Textiles, Apparel & Luxury Goods) | | | (97,000 | ) | | | (284,370 | ) |
| | | | | | | | |
| | | | | | | (2,526,078 | ) |
| | | | | | | | |
Italy (0.7%) | | | | | | | | |
Geox S.p.A. (Textiles, Apparel & Luxury Goods) | | | (18,616 | ) | | | (56,388 | ) |
RCS MediaGroup S.p.A. (Media) (a) | | | (14,378 | ) | | | (13,946 | ) |
Telecom Italia Media S.p.A. (Media) (a) | | | (365,022 | ) | | | (50,860 | ) |
| | | | |
| 18 | | MainStay International Opportunities Fund | | The notes to the financial statements are an integral part of,
and should be read in conjunction with, the financial statements. |
| | | | | | | | |
| | |
| | | Shares | | | Value | |
| | | | | | | | |
Common Stocks Sold Short (continued) | | | | | |
Italy (continued) | | | | | | | | |
Trevi Finanziaria S.p.A. (Construction & Engineering) | | | (33,406 | ) | | $ | (255,165 | ) |
Yoox S.p.A. (Internet & Catalog Retail) (a) | | | (59,334 | ) | | | (1,114,275 | ) |
| | | | | | | | |
| | | | | | | (1,490,634 | ) |
| | | | | | | | |
Japan (10.0%) | | | | | | | | |
3-d Matrix, Ltd. (Biotechnology) (a) | | | (5,200 | ) | | | (479,007 | ) |
Akebono Brake Industry Co., Ltd. (Auto Components) | | | (109,300 | ) | | | (524,721 | ) |
Aplus Financial Co., Ltd. (Consumer Finance) (a) | | | (187,000 | ) | | | (404,749 | ) |
Asahi Co., Ltd. (Specialty Retail) | | | (36,900 | ) | | | (619,637 | ) |
Atom Corp. (Hotels, Restaurants & Leisure) | | | (9,900 | ) | | | (58,089 | ) |
Bit-isle, Inc. (IT Services) | | | (9,100 | ) | | | (129,847 | ) |
Clarion Co., Ltd. (Household Durables) (a) | | | (214,000 | ) | | | (302,939 | ) |
Cookpad, Inc. (Media) | | | (14,800 | ) | | | (562,487 | ) |
Cosel Co., Ltd. (Electrical Equipment) | | | (17,300 | ) | | | (198,581 | ) |
Daiichi Chuo KK (Marine) (a) | | | (42,000 | ) | | | (54,285 | ) |
Dainippon Screen Manufacturing Co., Ltd. (Semiconductors & Semiconductor Equipment) (a) | | | (130,000 | ) | | | (669,436 | ) |
Digital Garage, Inc. (IT Services) | | | (121 | ) | | | (443,114 | ) |
Dr Ci:Labo Co., Ltd. (Personal Products) | | | (238 | ) | | | (722,899 | ) |
Dwango Co., Ltd. (Software) | | | (94 | ) | | | (474,411 | ) |
Endo Lighting Corp. (Electrical Equipment) | | | (6,300 | ) | | | (255,270 | ) |
Fudo Tetra Corp. (Construction & Engineering) (a) | | | (50,000 | ) | | | (98,990 | ) |
Fujiya Co., Ltd. (Food Products) | | | (133,000 | ) | | | (275,591 | ) |
GMO Payment Gateway, Inc. (IT Services) | | | (4,800 | ) | | | (108,324 | ) |
Harmonic Drive Systems, Inc. (Machinery) | | | (2,800 | ) | | | (57,416 | ) |
Iino Kaiun Kaisha, Ltd. (Marine) | | | (45,700 | ) | | | (317,371 | ) |
Japan Bridge Corp. (Construction & Engineering) (a) | | | (152,800 | ) | | | (322,889 | ) |
Japan Drilling Co., Ltd. (Energy Equipment & Services) | | | (13,400 | ) | | | (887,973 | ) |
Kusuri No Aoki Co., Ltd. (Food & Staples Retailing) | | | (4,300 | ) | | | (313,618 | ) |
Maruwa Co., Ltd. / Aichi (Electronic Equipment, Instruments & Components) | | | (7,000 | ) | | | (213,048 | ) |
Matsuya Co., Ltd. (Multiline Retail) (a) | | | (15,900 | ) | | | (312,503 | ) |
Melco Holdings, Inc. (Computers & Peripherals) | | | (15,200 | ) | | | (250,410 | ) |
MISUMI Group, Inc. (Trading Companies & Distributors) | | | (8,200 | ) | | | (249,907 | ) |
MonotaRO Co., Ltd. (Trading Companies & Distributors) | | | (15,000 | ) | | | (381,136 | ) |
Nihon M&A Center, Inc. (Professional Services) | | | (800 | ) | | | (42,181 | ) |
Nitto Boseki Co., Ltd. (Building Products) (a) | | | (175,000 | ) | | | (615,736 | ) |
Orient Corp. (Consumer Finance) (a) | | | (110,500 | ) | | | (381,992 | ) |
OSAKA Titanium Technologies Co. (Metals & Mining) | | | (39,000 | ) | | | (774,919 | ) |
OSG Corp. (Machinery) | | | (34,600 | ) | | | (525,646 | ) |
| | | | | | | | |
| | |
| | | Shares | | | Value | |
| | | | | | | | |
Japan (continued) | | | | | | | | |
Pioneer Corp. (Household Durables) (a) | | | (100,000 | ) | | $ | (205,160 | ) |
Sanken Electric Co., Ltd. (Semiconductors & Semiconductor Equipment) | | | (52,000 | ) | | | (243,237 | ) |
Seiko Holdings Corp. (Textiles, Apparel & Luxury Goods) | | | (81,000 | ) | | | (474,442 | ) |
Senshu Ikeda Holdings, Inc. (Commercial Banks) | | | (135,780 | ) | | | (717,307 | ) |
Seria Co., Ltd. (Multiline Retail) | | | (5,900 | ) | | | (144,043 | ) |
Shin Nippon Biomedical Laboratories, Ltd. (Life Sciences Tools & Services) (a) | | | (25,700 | ) | | | (611,622 | ) |
Start Today Co., Ltd. (Internet & Catalog Retail) | | | (55,400 | ) | | | (837,663 | ) |
Sumitomo Mitsui Construction Co., Ltd. (Construction & Engineering) (a) | | | (920,300 | ) | | | (934,602 | ) |
Toho Titanium Co., Ltd. (Metals & Mining) | | | (95,300 | ) | | | (817,262 | ) |
Tokyotokeiba Co., Ltd. (Hotels, Restaurants & Leisure) | | | (177,000 | ) | | | (920,542 | ) |
Topcon Corp. (Electronic Equipment & Instruments) | | | (40,900 | ) | | | (456,053 | ) |
Toyo Tanso Co., Ltd. (Electrical Equipment) | | | (18,000 | ) | | | (392,922 | ) |
Weathernews, Inc. (Professional Services) | | | (22,200 | ) | | | (543,585 | ) |
Yomiuri Land Co., Ltd. (Hotels, Restaurants & Leisure) | | | (59,000 | ) | | | (605,221 | ) |
Yumeshin Holdings Co., Ltd. (Construction & Engineering) | | | (10,000 | ) | | | (65,959 | ) |
Zuiko Corp. (Machinery) | | | (3,300 | ) | | | (260,656 | ) |
| | | | | | | | |
| | | | | | | (20,259,398 | ) |
| | | | | | | | |
Mongolia (0.2%) | | | | | | | | |
Mongolian Mining Corp. (Metals & Mining) (a) | | | (1,177,000 | ) | | | (345,813 | ) |
| | | | | | | | |
| | |
Netherlands (1.8%) | | | | | | | | |
PostNL N.V. (Air Freight & Logistics) (a) | | | (550,526 | ) | | | (1,252,827 | ) |
Royal Imtech N.V. (Construction & Engineering) (a) | | | (102,272 | ) | | | (1,136,759 | ) |
SBM Offshore N.V. (Energy Equipment & Services) (a) | | | (81,322 | ) | | | (1,308,726 | ) |
| | | | | | | | |
| | | | | | | (3,698,312 | ) |
| | | | | | | | |
Norway (1.0%) | | | | | | | | |
Algeta ASA (Biotechnology) (a) | | | (22,908 | ) | | | (776,643 | ) |
Archer, Ltd. (Energy Equipment & Services) (a) | | | (495,359 | ) | | | (323,854 | ) |
BW Offshore, Ltd. (Energy Equipment & Services) | | | (92,284 | ) | | | (87,059 | ) |
Det Norske Oljeselskap ASA (Oil, Gas & Consumable Fuels) (a) | | | (42,950 | ) | | | (608,890 | ) |
ElectroMagnetic GeoServices AS (Energy Equipment & Services) (a) | | | (118,162 | ) | | | (171,101 | ) |
Opera Software ASA (Internet Software & Services) | | | (3,161 | ) | | | (21,488 | ) |
| | | | | | | | |
| | | | | | | (1,989,035 | ) |
| | | | | | | | |
| | | | | | |
The notes to the financial statements are an integral part of,
and should be read in conjunction with, the financial statements. | | mainstayinvestments.com | | | 19 | |
Portfolio of Investments April 30, 2013 (Unaudited) (continued)
| | | | | | | | |
| | |
| | | Shares | | | Value | |
| | | | | | | | |
Common Stocks Sold Short (continued) | | | | | |
Singapore (0.7%) | | | | | | | | |
Dyna-mac Holdings, Ltd. (Energy Equipment & Services) | | | (511,000 | ) | | $ | (182,544 | ) |
Tiger Airways Holdings, Ltd. (Airlines) (a) | | | (73,000 | ) | | | (39,117 | ) |
Yoma Strategic Holdings, Ltd. (Construction & Engineering) (a) | | | (1,713,000 | ) | | | (1,126,516 | ) |
| | | | | | | | |
| | | | | | | (1,348,177 | ) |
| | | | | | | | |
Spain (1.1%) | | | | | | | | |
Fomento de Construcciones y Contratas S.A. (Construction & Engineering) | | | (52,039 | ) | | | (539,422 | ) |
Jazztel PLC (Diversified Telecommunication Services) (a) | | | (149,801 | ) | | | (1,126,472 | ) |
NH Hoteles S.A. (Hotels, Restaurants & Leisure) (a) | | | (87,259 | ) | | | (304,527 | ) |
Promotora de Informaciones S.A. Class A (Media) (a) | | | (289,214 | ) | | | (85,698 | ) |
Zeltia S.A. (Biotechnology) (a) | | | (109,274 | ) | | | (220,899 | ) |
| | | | | | | | |
| | | | | | | (2,277,018 | ) |
| | | | | | | | |
Sweden (0.1%) | | | | | | | | |
Active Biotech AB (Biotechnology) (a) | | | (256 | ) | | | (2,241 | ) |
CDON Group AB (Internet & Catalog Retail) (a) | | | (23,815 | ) | | | (110,972 | ) |
| | | | | | | | |
| | | | | | | (113,213 | ) |
| | | | | | | | |
Switzerland (0.5%) | | | | | | | | |
Panalpina Welttransport Holding A.G. (Air Freight & Logistics) | | | (3,444 | ) | | | (335,214 | ) |
Rieter Holding A.G. Registered (Machinery) (a) | | | (3,802 | ) | | | (634,621 | ) |
| | | | | | | | |
| | | | | | | (969,835 | ) |
| | | | | | | | |
United Arab Emirates (0.4%) | | | | | | | | |
Lamprell PLC (Energy Equipment & Services) | | | (338,601 | ) | | | (760,021 | ) |
| | | | | | | | |
| | |
United Kingdom (2.3%) | | | | | | | | |
APR Energy PLC (Independent Power Producers & Energy Traders) | | | (10,391 | ) | | | (133,969 | ) |
Bumi PLC (Oil, Gas & Consumable Fuels) (a)(b)(c) | | | (131,608 | ) | | | (530,095 | ) |
Carpetright PLC (Specialty Retail) (a) | | | (1,129 | ) | | | (11,013 | ) |
Chemring Group PLC (Aerospace & Defense) | | | (83,405 | ) | | | (351,229 | ) |
Imagination Technologies Group PLC (Semiconductors & Semiconductor Equipment) (a) | | | (130,035 | ) | | | (859,265 | ) |
London Mining PLC (Metals & Mining) (a) | | | (64,665 | ) | | | (115,263 | ) |
Ocado Group PLC (Internet & Catalog Retail) (a) | | | (503,272 | ) | | | (1,328,988 | ) |
Ophir Energy PLC (Oil, Gas & Consumable Fuels) (a) | | | (156,781 | ) | | | (990,947 | ) |
Petra Diamonds, Ltd. (Metals & Mining) (a) | | | (133,945 | ) | | | (228,870 | ) |
SDL PLC (Software) | | | (20,777 | ) | | | (117,445 | ) |
| | | | | | | | |
| | |
| | | Shares | | | Value | |
| | | | | | | | |
United Kingdom (continued) | | | | | | | | |
SuperGroup PLC (Specialty Retail) (a) | | | (294 | ) | | $ | (3,163 | ) |
| | | | | | | | |
| | | | | | | (4,670,247 | ) |
| | | | | | | | |
Total Common Stocks Sold Short
(Proceeds $66,027,673) | | | | (62,614,748 | ) |
| | | | | | | | |
|
| Exchange Traded Fund Sold Short (1.0%)(e) | |
United States (1.0%) | | | | | | | | |
iShares MSCI EAFE Index Fund (Capital Markets) | | | (31,865 | ) | | | (1,973,718 | ) |
| | | | | | | | |
Total Exchange Traded Fund Sold Short
(Proceeds $1,922,649) | | | | | | | (1,973,718 | ) |
| | | | | | | | |
|
| Rights Sold Short (0.0%)‡ | |
Singapore (0.0%)‡ | | | | | | | | |
Tiger Airways (Airlines) (a)(b)(c) | | | (37,500 | ) | | | (3 | ) |
| | | | | | | | |
Total Rights Sold Short
(Proceeds $0) | | | | | | | (3 | ) |
| | | | | | | | |
Total Investments Sold Short
(Proceeds $67,950,322) | | | (31.9 | )% | | | (64,588,469 | ) |
| | | | | | | | |
Total Investments, Net of Investments Sold Short
(Cost $154,728,944) | | | 98.6 | | | | 199,675,539 | |
Other Assets, Less Liabilities | | | 1.4 | | | | 2,881,380 | |
Net Assets | | | 100.0 | % | | $ | 202,556,919 | |
| ‡ | Less than one-tenth of a percent. |
| (a) | Non-income producing security. |
| (b) | Illiquid security—The total market value of these securities as of April 30, 2013 is $(630,817), which represents (0.3)% of the Fund’s net assets. |
| (c) | Fair valued security. The total market value of these securities as of April 30, 2013 is $(566,878), which represents (0.3)% of the Fund’s net assets. |
| (d) | Represents a security, or a portion thereof, which is maintained in a segregated account at the Fund’s custodian as collateral for securities sold short (See Note 2(J)). |
| (e) | Exchange Traded Fund—An investment vehicle that represents a basket of securities that is traded on an exchange. |
| (f) | As of April 30, 2013, cost is $225,697,407 for federal income tax purposes and net unrealized appreciation is as follows: |
| | | | |
Gross unrealized appreciation | | $ | 47,128,741 | |
Gross unrealized depreciation | | | (8,562,140 | ) |
| | | | |
Net unrealized appreciation | | $ | 38,566,601 | |
| | | | |
The following abbreviation is used in the above portfolio:
€—Euro
| | | | |
| 20 | | MainStay International Opportunities Fund | | The notes to the financial statements are an integral part of,
and should be read in conjunction with, the financial statements. |
The following is a summary of the fair valuations according to the inputs used as of April 30, 2013, for valuing the Fund’s assets and liabilities.
Asset Valuation Inputs
| | | | | | | | | | | | | | | | |
Description | | Quoted
Prices in
Active
Markets for
Identical
Assets (Level 1) | | | Significant
Other
Observable
Inputs
(Level 2) | | | Significant
Unobservable
Inputs (Level 3) | | | Total | |
| Investments in Securities (a) | | | | | | | | | | | | | | | | |
| Common Stocks (b) | | $ | 258,995,801 | | | $ | — | | | $ | 60,229 | | | $ | 259,056,030 | |
| Convertible Preferred Stocks | | | 1,100,373 | | | | — | | | | — | | | | 1,100,373 | |
| Preferred Stocks | | | 1,457,910 | | | | — | | | | — | | | | 1,457,910 | |
| Rights (c) | | | — | | | | — | | | | 5,533 | | | | 5,533 | |
| Unaffiliated Investment Company | | | 2,637,630 | | | | — | | | | — | | | | 2,637,630 | |
| Warrants | | | 6,532 | | | | — | | | | — | | | | 6,532 | |
| | | | | | | | | | | | | | | | |
| Total Investments in Securities | | $ | 264,198,246 | | | $ | — | | | $ | 65,762 | | | $ | 264,264,008 | |
| | | | | | | | | | | | | | | | |
Liability Valuation Inputs
| | | | | | | | | | | | | | | | |
Description | | Quoted
Prices in
Active
Markets for
Identical
Assets (Level 1) | | | Significant
Other
Observable
Inputs
(Level 2) | | | Significant
Unobservable
Inputs (Level 3) | | | Total | |
| Investments in Securities Sold Short (a) | | | | | | | | | | | | | | | | |
| Common Stocks Sold Short (d) | | $ | (61,982,111 | ) | | $ | — | | | $ | (632,637 | ) | | $ | (62,614,748 | ) |
| Exchange Traded Funds Sold Short | | | (1,973,718 | ) | | | — | | | | — | | | | (1,973,718 | ) |
| Rights Sold Short (e) | | | — | | | | — | | | | (3 | ) | | | (3 | ) |
| | | | | | | | | | | | | | | | |
| Total Investments in Securities Sold Short | | $ | (63,955,829 | ) | | $ | — | | | $ | (632,640 | ) | | $ | (64,588,469 | ) |
| | | | | | | | | | | | | | | | |
| (a) | For a complete listing of investments and their industries, see the Portfolio of Investments. |
| (b) | The Level 3 securities valued at $11, $1,812 and $58,406 are held in Australia, Hong Kong and United Kingdom, respectively, within the Common Stocks section of the Portfolio of Investments. |
| (c) | The Level 3 security valued at $5,533 is held in Spain, within the Rights section of the Portfolio of Investments. |
| (d) | The Level 3 securities valued at $(83,924), $(18,618) and $(530,095) are held in Australia, China and United Kingdom, respectively, within the Common Stocks Sold Short section of the Portfolio of Investments. |
| (e) | The Level 3 security valued at $(3) is held in Singapore, within the Rights Sold Short section of the Portfolio of Investments. |
The Fund recognizes transfers between the levels as of the beginning of the period.
During the six-month period ended April 30, 2013, a foreign equity security with a total value of $(683,227) was transferred from level 1 to level 3. The transfer occurred as a result of the foreign equity security being valued by methods deemed in good faith by the Fund’s Valuation Committee utilizing significant unobservable inputs as of April 30, 2013.
During the six-month period ended April 30, 2013, a foreign equity security with a total value of $(417,251) was transferred from level 3 to level 1. The transfer occurred as a result of the foreign equity security being valued by an independent pricing service as of April 30, 2013.
| | | | | | |
The notes to the financial statements are an integral part of,
and should be read in conjunction with, the financial statements. | | mainstayinvestments.com | | | 21 | |
Portfolio of Investments April 30, 2013 (Unaudited) (continued)
The following is a reconciliation of investments in which significant unobservable inputs (Level 3) were used in determining value:
| | | | | | | | | | | | | | | | | | | | | | | | | | | | | | | | | | | | | | | | |
Investments in
Securities | | Balance
as of
October 31,
2012 | | | Accrued
Discounts
(Premiums) | | | Realized
Gain
(Loss) | | | Change in
Unrealized
Appreciation
(Depreciation) | | | Purchases | | | Sales | | | Transfers
in to
Level 3 | | | Transfers
out of
Level 3 | | | Balance
as of
April 30,
2013 | | | Change in
Unrealized
Appreciation
(Depreciation)
from
Investments
Still Held at
April 30,
2013 (a) | |
| Common Stocks | | | | | | | | | | | | | | | | | | | | | | | | | | | | | | | | | | | | | | | | |
Australia | | $ | 11 | | | $ | — | | | $ | — | | | $ | — | | | $ | — | | | $ | — | | | $ | — | | | $ | — | | | $ | 11 | | | $ | — | |
Hong Kong | | | 829 | | | | — | | | | — | | | | 983 | | | | — | | | | — | | | | — | | | | — | | | | 1,812 | | | | 983 | |
United Kingdom | | | — | | | | — | | | | — | | | | 1,132 | | | | 57,274 | | | | — | | | | — | | | | — | | | | 58,406 | | | | 1,132 | |
| Rights | | | | | | | | | | | | | | | | | | | | | | | | | | | | | | | | | | | | | | | | |
Spain | | | — | | | | — | | | | — | | | | 29 | | | | 5,504 | | | | — | | | | — | | | | — | | | | 5,533 | | | | 29 | |
| Common Stocks Sold Short | | | | | | | | | | | | | | | | | | | | | | | | | | | | | | | | | | | | | | | | |
Australia | | | (421,861 | ) | | | — | | | | (102,495 | ) | | | 417,790 | | | | 386,110 | | | | (97,492 | ) | | | (683,227 | ) | | | 417,251 | | | | (83,924 | ) | | | 417,790 | |
China | | | (18,642 | ) | | | — | | | | — | | | | 24 | | | | — | | | | — | | | | — | | | | — | | | | (18,618 | ) | | | 24 | |
United Kingdom | | | — | | | | — | | | | — | | | | 122,509 | | | | — | | | | (652,604 | ) | | | — | | | | — | | | | (530,095 | ) | | | 122,509 | |
Rights Sold Short | | | | | | | | | | | | | | | | | | | | | | | | | | | | | | | | | | | | | | | | |
Singapore | | | — | | | | — | | | | — | | | | (3 | ) | | | — | | | | — | | | | — | | | | — | | | | (3 | ) | | | (3 | ) |
| | | | | | | | | | | | | | | | | | | | | | | | | | | | | | | | | | | | | | | | |
| Total | | $ | (439,663 | ) | | $ | — | | | $ | (102,495 | ) | | $ | 542,464 | | | $ | 448,888 | | | $ | (750,096 | ) | | $ | (683,227 | ) | | $ | 417,251 | | | $ | (566,878 | ) | | $ | 542,464 | |
| | | | | | | | | | | | | | | | | | | | | | | | | | | | | | | | | | | | | | | | |
| (a) | Included in “Net change in unrealized appreciation (depreciation) on investments” in the Statement of Operations. |
| | | | |
| 22 | | MainStay International Opportunities Fund | | The notes to the financial statements are an integral part of,
and should be read in conjunction with, the financial statements. |
The table below sets forth the diversification of MainStay International Opportunities Fund investments by industry.
Industry Diversification (Unaudited)
| | | | | | | | |
| | | Value | | | Percent † | |
Aerospace & Defense | | $ | 2,614,246 | | | | 1.3 | % |
Air Freight & Logistics | | | 399,638 | | | | 0.2 | |
Airlines | | | 4,498,991 | | | | 2.2 | |
Auto Components | | | 5,320,227 | | | | 2.6 | |
Automobiles | | | 8,469,268 | | | | 4.2 | |
Beverages | | | 3,574,742 | | | | 1.8 | |
Biotechnology | | | 1,882,471 | | | | 0.9 | |
Capital Markets | | | 9,146,595 | | | | 4.5 | |
Chemicals | | | 7,310,099 | | | | 3.6 | |
Commercial Banks | | | 28,785,054 | | | | 14.2 | |
Commercial Services & Supplies | | | 254,852 | | | | 0.1 | |
Communications Equipment | | | 1,961,842 | | | | 1.0 | |
Computers & Peripherals | | | 2,009,587 | | | | 1.0 | |
Construction & Engineering | | | 8,383,577 | | | | 4.1 | |
Construction Materials | | | 416,638 | | | | 0.2 | |
Consumer Finance | | | 1,384,968 | | | | 0.7 | |
Containers & Packaging | | | 615,063 | | | | 0.3 | |
Diversified Financial Services | | | 2,330,482 | | | | 1.1 | |
Diversified Telecommunication Services | | | 7,584,063 | | | | 3.7 | |
Electric Utilities | | | 1,911,227 | | | | 0.9 | |
Electrical Equipment | | | 1,667,018 | | | | 0.8 | |
Electronic Equipment & Instruments | | | 100,951 | | | | 0.0 | ‡ |
Electronic Equipment,
Instruments & Components | | | 3,371,117 | | | | 1.7 | |
Energy Equipment & Services | | | 1,372,145 | | | | 0.7 | |
Food & Staples Retailing | | | 5,007,401 | | | | 2.5 | |
Food Products | | | 10,859,722 | | | | 5.4 | |
Gas Utilities | | | 1,657,614 | | | | 0.8 | |
Health Care Equipment & Supplies | | | 964,720 | | | | 0.5 | |
Health Care Providers & Services | | | 3,149,805 | | | | 1.6 | |
Hotels, Restaurants & Leisure | | | 6,414,659 | | | | 3.2 | |
Household Durables | | | 4,323,185 | | | | 2.1 | |
Household Products | | | 128,251 | | | | 0.1 | |
Independent Power Producers & Energy Traders | | | 1,228,644 | | | | 0.6 | |
Industrial Conglomerates | | | 2,407,216 | | | | 1.2 | |
Insurance | | | 12,222,742 | | | | 6.0 | |
Internet & Catalog Retail | | | 1,171,502 | | | | 0.6 | |
IT Services | | | 2,566,209 | | | | 1.3 | |
Leisure Equipment & Products | | | 1,151,539 | | | | 0.6 | |
Machinery | | | 8,565,109 | | | | 4.2 | |
Marine | | | 1,233,048 | | | | 0.6 | |
Media | | | 2,857,189 | | | | 1.4 | |
Metals & Mining | | | 13,526,293 | | | | 6.7 | |
Multi-Utilities | | | 481,616 | | | | 0.2 | |
Multiline Retail | | | 2,430,678 | | | | 1.2 | |
Office Electronics | | | 1,407,606 | | | | 0.7 | |
Oil, Gas & Consumable Fuels | | | 23,501,966 | | | | 11.6 | |
Personal Products | | | 382,659 | | | | 0.2 | |
| | | | | | | | |
| | | Value | | | Percent † | |
Pharmaceuticals | | $ | 20,358,823 | | | | 10.1 | % |
Professional Services | | | 1,175,794 | | | | 0.6 | |
Real Estate Investment Trusts | | | 363,366 | | | | 0.2 | |
Real Estate Management & Development | | | 4,202,447 | | | | 2.1 | |
Semiconductors & Semiconductor Equipment | | | 3,753,809 | | | | 1.9 | |
Software | | | 3,085,259 | | | | 1.5 | |
Specialty Retail | | | 6,034,803 | | | | 3.0 | |
Textiles, Apparel & Luxury Goods | | | 1,040,111 | | | | 0.5 | |
Tobacco | | | 1,291,918 | | | | 0.6 | |
Trading Companies & Distributors | | | 3,664,847 | | | | 1.8 | |
Transportation Infrastructure | | | 806,725 | | | | 0.4 | |
Wireless Telecommunication Services | | | 5,481,872 | | | | 2.7 | |
| | | | | | | | |
| | | 264,264,008 | | | | 130.5 | |
Other Assets, Less Liabilities* | | | (61,707,089 | ) | | | –30.5 | |
| | | | | | | | |
Net Assets | | $ | 202,556,919 | | | | 100.0 | % |
| | | | | | | | |
| † | Percentages indicated are based on Fund net assets. |
| ‡ | Less than one-tenth of a percent. |
| * | Includes investments sold short (details on following page). |
| | | | | | |
The notes to the financial statements are an integral part of,
and should be read in conjunction with, the financial statements. | | mainstayinvestments.com | | | 23 | |
Portfolio of Investments April 30, 2013 (Unaudited) (continued)
The table below sets forth the diversification of MainStay International Opportunities Fund investments sold short by industry.
| | | | | | | | |
| | | Value | | | Percent † | |
Aerospace & Defense | | $ | (351,229 | ) | | | (0.2 | )% |
Air Freight & Logistics | | | (1,588,041 | ) | | | (0.8 | ) |
Airlines | | | (123,787 | ) | | | (0.1 | ) |
Auto Components | | | (524,721 | ) | | | (0.3 | ) |
Automobiles | | | (396,642 | ) | | | (0.2 | ) |
Biotechnology | | | (1,523,177 | ) | | | (0.7 | ) |
Building Products | | | (1,095,420 | ) | | | (0.5 | ) |
Capital Markets | | | (1,973,718 | ) | | | (1.0 | ) |
Commercial Banks | | | (717,307 | ) | | | (0.3 | ) |
Commercial Services & Supplies | | | (51,030 | ) | | | (0.0 | )‡ |
Communications Equipment | | | (1,561,044 | ) | | | (0.8 | ) |
Computers & Peripherals | | | (250,410 | ) | | | (0.1 | ) |
Construction & Engineering | | | (4,940,934 | ) | | | (2.4 | ) |
Construction Materials | | | (115,812 | ) | | | (0.1 | ) |
Consumer Finance | | | (786,741 | ) | | | (0.4 | ) |
Distributors | | | (172,527 | ) | | | (0.1 | ) |
Diversified Financial Services | | | (51,251 | ) | | | (0.0 | )‡ |
Diversified Telecommunication Services | | | (1,126,472 | ) | | | (0.6 | ) |
Electrical Equipment | | | (1,831,275 | ) | | | (0.9 | ) |
Electronic Equipment & Instruments | | | (456,053 | ) | | | (0.2 | ) |
Electronic Equipment, Instruments & Components | | | (520,068 | ) | | | (0.3 | ) |
Energy Equipment & Services | | | (3,865,039 | ) | | | (1.9 | ) |
Food & Staples Retailing | | | (313,618 | ) | | | (0.2 | ) |
Food Products | | | (687,958 | ) | | | (0.3 | ) |
Health Care Equipment & Supplies | | | (124,914 | ) | | | (0.1 | ) |
Health Care Providers & Services | | | (24,352 | ) | | | (0.0 | )‡ |
Hotels, Restaurants & Leisure | | | (2,236,208 | ) | | | (1.1 | ) |
Household Durables | | | (508,099 | ) | | | (0.2 | ) |
Household Products | | | (361,949 | ) | | | (0.2 | ) |
Independent Power Producers & Energy Traders | | | (290,863 | ) | | | (0.1 | ) |
Internet & Catalog Retail | | | (3,391,898 | ) | | | (1.7 | ) |
Internet Software & Services | | | (21,488 | ) | | | (0.0 | )‡ |
IT Services | | | (681,285 | ) | | | (0.3 | ) |
Leisure Equipment & Products | | | (164,301 | ) | | | (0.1 | ) |
Life Sciences Tools & Services | | | (1,579,235 | ) | | | (0.8 | ) |
Machinery | | | (2,089,462 | ) | | | (1.0 | ) |
Marine | | | (600,929 | ) | | | (0.3 | ) |
Media | | | (1,057,741 | ) | | | (0.5 | ) |
Metals & Mining | | | (7,647,491 | ) | | | (3.8 | ) |
Multiline Retail | | | (456,546 | ) | | | (0.2 | ) |
Oil, Gas & Consumable Fuels | | | (6,435,003 | ) | | | (3.2 | ) |
Paper & Forest Products | | | (104,028 | ) | | | (0.1 | ) |
Personal Products | | | (722,899 | ) | | | (0.4 | ) |
Pharmaceuticals | | | (324,293 | ) | | | (0.2 | ) |
Professional Services | | | (876,345 | ) | | | (0.4 | ) |
Semiconductors & Semiconductor Equipment | | | (2,861,085 | ) | | | (1.4 | ) |
Software | | | (897,239 | ) | | | (0.4 | ) |
Specialty Retail | | | (2,873,372 | ) | | | (1.4 | ) |
Textiles, Apparel & Luxury Goods | | | (1,883,424 | ) | | | (0.9 | ) |
Trading Companies & Distributors | | | (631,043 | ) | | | (0.3 | ) |
| | | | | | | | |
| | | Value | | | Percent † | |
Transportation Infrastructure | | $ | (385,390 | ) | | | (0.2 | )% |
Water Utilities | | | (333,313 | ) | | | (0.2 | ) |
| | | | | | | | |
| | $ | (64,588,469 | ) | | | (31.9 | )% |
| | | | | | | | |
| † | Percentages indicated are based on Fund net assets. |
| ‡ | Less than one-tenth of a percent. |
| | | | |
| 24 | | MainStay International Opportunities Fund | | The notes to the financial statements are an integral part of,
and should be read in conjunction with, the financial statements. |
Statement of Assets and Liabilities as of April 30, 2013 (Unaudited)
| | | | |
| Assets | |
Investment in securities before investments sold short, at value
(identified cost $222,679,266) | | $ | 264,264,008 | |
Cash denominated in foreign currencies (identified cost $952,774) | | | 957,298 | |
Receivables: | | | | |
Investment securities sold | | | 2,672,757 | |
Dividends and interest | | | 1,442,705 | |
Fund shares sold | | | 304,969 | |
Other assets | | | 35,448 | |
| | | | |
Total assets | | | 269,677,185 | |
| | | | |
| |
| Liabilities | | | | |
Investments sold short (proceeds $67,950,322) | | | 64,588,469 | |
Due to custodian | | | 1,988,963 | |
Payables: | | | | |
Manager (See Note 3) | | | 177,319 | |
Dividends on investments sold short | | | 138,850 | |
Broker fees and charges on short sales | | | 121,039 | |
Custodian | | | 33,457 | |
Professional fees | | | 32,440 | |
Foreign capital gains tax (See Note 2(C)) | | | 30,875 | |
Shareholder communication | | | 4,920 | |
Transfer agent (See Note 3) | | | 2,149 | |
NYLIFE Distributors (See Note 3) | | | 388 | |
Trustees | | | 350 | |
Accrued expenses | | | 1,047 | |
| | | | |
Total liabilities | | | 67,120,266 | |
| | | | |
Net assets | | $ | 202,556,919 | |
| | | | |
| |
| Composition of Net Assets | | | | |
Shares of beneficial interest outstanding (par value of $.001 per share) unlimited number of shares authorized | | $ | 24,749 | |
Additional paid-in capital | | | 178,020,860 | |
| | | | |
| | | 178,045,609 | |
Undistributed net investment income | | | 585,396 | |
Accumulated net realized gain (loss) on investments, investments sold short, futures transactions and foreign currency transactions (a) | | | (20,987,102 | ) |
Net unrealized appreciation (depreciation) on investments (b) | | | 41,558,089 | |
Net unrealized (appreciation) depreciation on investments sold short | | | 3,361,853 | |
Net unrealized appreciation (depreciation) on translation of other assets and liabilities in foreign currencies | | | (6,926 | ) |
| | | | |
Net assets | | $ | 202,556,919 | |
| | | | |
| | | | |
Investor Class | | | | |
Net assets applicable to outstanding shares | | $ | 376,830 | |
| | | | |
Shares of beneficial interest outstanding | | | 46,272 | |
| | | | |
Net asset value per share outstanding | | $ | 8.14 | |
Maximum sales charge (5.50% of offering price) | | | 0.47 | |
| | | | |
Maximum offering price per share outstanding | | $ | 8.61 | |
| | | | |
Class A | | | | |
Net assets applicable to outstanding shares | | $ | 890,480 | |
| | | | |
Shares of beneficial interest outstanding | | | 109,141 | |
| | | | |
Net asset value per share outstanding | | $ | 8.16 | |
Maximum sales charge (5.50% of offering price) | | | 0.47 | |
| | | | |
Maximum offering price per share outstanding | | $ | 8.63 | |
| | | | |
Class C | | | | |
Net assets applicable to outstanding shares | | $ | 263,528 | |
| | | | |
Shares of beneficial interest outstanding | | | 32,953 | |
| | | | |
Net asset value and offering price per share outstanding | | $ | 8.00 | |
| | | | |
Class I | | | | |
Net assets applicable to outstanding shares | | $ | 201,026,081 | |
| | | | |
Shares of beneficial interest outstanding | | | 24,560,516 | |
| | | | |
Net asset value and offering price per share outstanding | | $ | 8.18 | |
| | | | |
| (a) | Realized gain (loss) on security transactions net of foreign capital gains tax of $52,847. |
| (b) | Unrealized appreciation(depreciation) on investments net of foreign capital gains tax of $26,653. |
| | | | | | |
The notes to the financial statements are an integral part of,
and should be read in conjunction with, the financial statements. | | mainstayinvestments.com | | | 25 | |
Statement of Operations for the six months ended April 30, 2013 (Unaudited)
| | | | |
| Investment Income (Loss) | |
Income | | | | |
Dividends (a) | | $ | 3,737,077 | |
Interest (b) | | | 25 | |
| | | | |
Total income | | | 3,737,102 | |
| | | | |
Expenses | | | | |
Manager (See Note 3) | | | 1,034,640 | |
Broker fees and charges on short sales | | | 889,131 | |
Dividends on investments sold short | | | 188,600 | |
Custodian | | | 127,341 | |
Professional fees | | | 29,435 | |
Registration | | | 28,181 | |
Transfer agent (See Note 3) | | | 6,117 | |
Shareholder communication | | | 3,165 | |
Trustees | | | 2,159 | |
Distribution/Service—Investor Class (See Note 3) | | | 334 | |
Distribution/Service—Class A (See Note 3) | | | 680 | |
Distribution/Service—Class C (See Note 3) | | | 898 | |
Miscellaneous | | | 9,581 | |
| | | | |
Total expenses before waiver/reimbursement | | | 2,320,262 | |
Expense waiver/reimbursement from Manager (See Note 3) | | | (271 | ) |
| | | | |
Net expenses | | | 2,319,991 | |
| | | | |
Net investment income (loss) | | | 1,417,111 | |
| | | | |
|
| Realized and Unrealized Gain (Loss) on Investments, Futures Contracts and Foreign Currency Transactions | |
Net realized gain (loss) on: | | | | |
Security transactions (c) | | | 17,591,915 | |
Investments sold short | | | (6,359,047 | ) |
Futures transactions | | | 294,234 | |
Foreign currency transactions | | | (77,114 | ) |
| | | | |
Net realized gain (loss) on investments, investments sold short, futures transactions and foreign currency transactions | | | 11,449,988 | |
| | | | |
Net change in unrealized appreciation (depreciation) on: | | | | |
Investments (d) | | | 26,385,129 | |
Investments sold short | | | (541,178 | ) |
Translation of other assets and liabilities in foreign currencies | | | 7,582 | |
| | | | |
Net change in unrealized appreciation (depreciation) on investments, investments sold short and foreign currency transactions | | | 25,851,533 | |
| | | | |
Net realized and unrealized gain (loss) on investments, investments sold short, futures transactions and foreign currency transactions | | | 37,301,521 | |
| | | | |
Net increase (decrease) in net assets resulting from operations | | $ | 38,718,632 | |
| | | | |
| (a) | Dividends recorded net of foreign withholding taxes in the amount of $309,271. |
| (b) | Interest recorded net of foreign withholding taxes in the amount of $26. |
| (c) | Realized gain (loss) on security transactions net of foreign capital gains tax of $52,847. |
| (d) | Unrealized appreciation (depreciation) on investments net of foreign capital gains tax of $26,653. |
| | | | |
| 26 | | MainStay International Opportunities Fund | | The notes to the financial statements are an integral part of,
and should be read in conjunction with, the financial statements. |
Statements of Changes in Net Assets
for the six months ended April 30, 2013 (Unaudited) and the year ended October 31, 2012
| | | | | | | | |
| | | 2013 | | | 2012 | |
| Increase (Decrease) in Net Assets | |
Operations: | | | | | | | | |
Net investment income (loss) | | $ | 1,417,111 | | | $ | 2,471,445 | |
Net realized gain (loss) on investments, futures transactions, investments sold short and foreign currency transactions | | | 11,449,988 | | | | 1,654,569 | |
Net change in unrealized appreciation (depreciation) on investments, investments sold short and foreign currency transactions | | | 25,851,533 | | | | 12,007,894 | |
| | | | |
Net increase (decrease) in net assets resulting from operations | | | 38,718,632 | | | | 16,133,908 | |
| | | | |
Dividends to shareholders: | | | | | | | | |
From net investment income: | | | | | | | | |
Investor Class | | | (4,294 | ) | | | (4,623 | ) |
Class A | | | (10,611 | ) | | | (2,480 | ) |
Class C | | | (1,866 | ) | | | (1,815 | ) |
Class I | | | (3,488,247 | ) | | | (3,876,098 | ) |
| | | | |
Total dividends to shareholders | | | (3,505,018 | ) | | | (3,885,016 | ) |
| | | | |
Capital share transactions: | | | | | | | | |
Net proceeds from sale of shares | | | 21,188,764 | | | | 58,300,388 | |
Net asset value of shares issued to shareholders in reinvestment of dividends | | | 3,503,968 | | | | 3,884,172 | |
Cost of shares redeemed | | | (29,544,922 | ) | | | (45,412,006 | ) |
| | | | |
Increase (decrease) in net assets derived from capital share transactions | | | (4,852,190 | ) | | | 16,772,554 | |
| | | | |
Net increase (decrease) in net assets | | | 30,361,424 | | | | 29,021,446 | |
|
| Net Assets | |
Beginning of period | | | 172,195,495 | | | | 143,174,049 | |
| | | | |
End of period | | $ | 202,556,919 | | | $ | 172,195,495 | |
| | | | |
Undistributed net investment income at end of period | | $ | 585,396 | | | $ | 2,673,303 | |
| | | | |
| | | | | | |
The notes to the financial statements are an integral part of,
and should be read in conjunction with, the financial statements. | | mainstayinvestments.com | | | 27 | |
Statement of Cash Flows
for the six months ended April 30, 2013 (Unaudited)
| | | | |
| Cash flows used in operating activities: | |
Net increase in net assets resulting from operations | | $ | 38,718,632 | |
Adjustments to reconcile net increase in net assets resulting from operations to net cash provided by operating activities: | | | | |
Investments purchased | | | (178,991,365 | ) |
Investments sold | | | 188,923,252 | |
Purchases to cover securities sold short | | | (71,527,547 | ) |
Securities sold short | | | 69,633,855 | |
Sale of short term investments, net | | | 548,941 | |
Increase in investment securities sold receivable | | | (2,672,757 | ) |
Increase in dividends and interest receivable | | | (492,348 | ) |
Increase in other assets | | | (17,394 | ) |
Decrease in broker fees and charges payable on short sales | | | (21,527 | ) |
Increase in dividends payable for securities sold short | | | 60,254 | |
Increase in cash due to custodian | | | 1,988,963 | |
Increase in professional fees payable | | | 15,251 | |
Decrease in custodian payable | | | (2,463 | ) |
Decrease in shareholder communication payable | | | (3,062 | ) |
Decrease in due to Trustees | | | (170 | ) |
Increase in due to manager | | | 18,278 | |
Decrease in due to transfer agent | | | (833 | ) |
Increase in due to NYLIFE Distributors | | | 149 | |
Increase in foreign capital gains tax payable | | | 11,673 | |
Decrease in accrued expenses | | | (2,898 | ) |
Net change in unrealized (appreciation) depreciation on investments | | | (26,392,580 | ) |
Net realized (gain) loss from investments | | | (17,644,762 | ) |
Net change in unrealized (appreciation) depreciation on securities sold short | | | 541,178 | |
Net realized (gain) loss from securities sold short | | | 6,359,047 | |
| | | | |
Net cash provided by operating activities | | | 9,049,767 | |
| | | | |
| |
| Cash flows from financing activities: | | | | |
Proceeds from shares sold | | | 20,985,942 | |
Payment on shares redeemed | | | (29,544,922 | ) |
Cash distributions paid | | | (1,050 | ) |
| | | | |
Net cash used in financing activities | | | (8,560,030 | ) |
| | | | |
Net increase in cash: | | | 489,737 | |
Cash at beginning of period | | | 467,561 | |
| | | | |
Cash at end of period | | $ | 957,298 | |
| | | | |
Non-cash financing activities not included herein consist of all reinvestment of dividends and distributions of $3,503,968.
| | | | |
| 28 | | MainStay International Opportunities Fund | | The notes to the financial statements are an integral part of,
and should be read in conjunction with, the financial statements. |
Financial Highlights selected per share data and ratios
| | | | | | | | | | | | | | | | | | | | | | | | |
| | | Investor Class | |
| | | Six months
ended
April 30, | | | Year ended October 31, | | | February 28,
2008**
through
October 31, | |
| | | 2013* | | | 2012 | | | 2011 | | | 2010 | | | 2009 | | | 2008 | |
Net asset value at beginning of period | | $ | 6.78 | | | $ | 6.35 | | | $ | 6.77 | | | $ | 6.31 | | | $ | 5.20 | | | $ | 8.74 | |
| | | | | | | | | | | | | | | | | | | | | | | | |
Net investment income (loss) (a) | | | 0.05 | | | | 0.09 | | | | 0.10 | | | | 0.07 | | | | 0.07 | | | | 0.04 | |
Net realized and unrealized gain (loss) on investments | | | 1.43 | | | | 0.48 | | | | (0.37 | ) | | | 0.52 | | | | 1.04 | | | | (3.58 | ) |
Net realized and unrealized gain (loss) on foreign currency transactions | | | (0.00 | )‡ | | | (0.00 | )‡ | | | (0.01 | ) | | | — | | | | — | | | | — | |
| | | | | | | | | | | | | | | | | | | | | | | | |
Total from investment operations | | | 1.48 | | | | 0.57 | | | | (0.28 | ) | | | 0.59 | | | | 1.11 | | | | (3.54 | ) |
| | | | | | | | | | | | | | | | | | | | | | | | |
Less dividends: | | | | | | | | | | | | | | | | | | | | | | | | |
From net investment income | | | (0.12 | ) | | | (0.14 | ) | | | (0.14 | ) | | | (0.13 | ) | | | — | | | | — | |
| | | | | | | | | | | | | | | | | | | | | | | | |
Net asset value at end of period | | $ | 8.14 | | | $ | 6.78 | | | $ | 6.35 | | | $ | 6.77 | | | $ | 6.31 | | | $ | 5.20 | |
| | | | | | | | | | | | | | | | | | | | | | | | |
Total investment return (b) | | | 22.18 | %(c) | | | 9.26 | % | | | (4.32 | %) | | | 9.57 | % | | | 21.35 | % | | | (40.50 | %)(c) |
Ratios (to average net assets)/Supplemental Data: | | | | | | | | | | | | | | | | | | | | | | | | |
Net investment income (loss) | | | 1.41 | %†† | | | 1.43 | % | | | 1.52 | % | | | 1.06 | % | | | 1.37 | % | | | 0.82 | % †† |
Net expenses (excluding short sale expenses) | | | 1.70 | %†† | | | 1.70 | % | | | 1.70 | % | | | 1.70 | % | | | 1.70 | % | | | 1.70 | % †† |
Expenses (including short sales expenses, before waiver/reimbursement) | | | 2.97 | %†† | | | 3.37 | % | | | 3.09 | % | | | 3.06 | % | | | 3.28 | % | | | 3.40 | % †† |
Short sale expenses | | | 1.15 | %†† | | | 1.59 | % | | | 1.27 | % | | | 1.18 | % | | | 1.37 | % | | | 1.19 | % †† |
Portfolio turnover rate | | | 71 | % | | | 162 | % | | | 157 | % | | | 160 | % | | | 143 | % | | | 204 | % |
Net assets at end of period (in 000’s) | | $ | 377 | | | $ | 238 | | | $ | 226 | | | $ | 186 | | | $ | 111 | | | $ | 90 | |
| ** | Commencement of operations. |
| ‡ | Less than one cent per share. |
| (a) | Per share data based on average shares outstanding during the period. |
| (b) | Total investment return is calculated exclusive of sales charges and assumes the reinvestment of dividends and distributions. |
| (c) | Total investment return is not annualized. |
| | | | | | |
The notes to the financial statements are an integral part of,
and should be read in conjunction with, the financial statements. | | mainstayinvestments.com | | | 29 | |
Financial Highlights selected per share data and ratios
| | | | | | | | | | | | | | | | | | | | | | | | |
| | | Class A | |
| | | Six months
ended
April 30, | | | Year ended October 31, | |
| | | 2013* | | | 2012 | | | 2011 | | | 2010 | | | 2009 | | | 2008 | |
Net asset value at beginning of period | | $ | 6.79 | | | $ | 6.36 | | | $ | 6.77 | | | $ | 6.31 | | | $ | 5.19 | | | $ | 10.32 | |
| | | | | | | | | | | | | | | | | | | | | | | | |
Net investment income (loss) (a) | | | 0.05 | | | | 0.10 | | | | 0.12 | | | | 0.05 | | | | 0.07 | | | | 0.08 | |
Net realized and unrealized gain (loss) on investments | | | 1.45 | | | | 0.48 | | | | (0.38 | ) | | | 0.55 | | | | 1.05 | | | | (5.17 | ) |
Net realized and unrealized gain (loss) on foreign currency transactions | | | (0.00 | )‡ | | | (0.00 | )‡ | | | (0.01 | ) | | | — | | | | — | | | | — | |
| | | | | | | | | | | | | | | | | | | | | | | | |
Total from investment operations | | | 1.50 | | | | 0.58 | | | | (0.27 | ) | | | 0.60 | | | | 1.12 | | | | (5.09 | ) |
| | | | | | | | | | | | | | | | | | | | | | | | |
Less dividends and distributions: | | | | | | | | | | | | | | | | | | | | | | | | |
From net investment income | | | (0.13 | ) | | | (0.15 | ) | | | (0.14 | ) | | | (0.14 | ) | | | — | | | | (0.02 | ) |
From net realized gain on investments | | | — | | | | — | | | | — | | | | — | | | | — | | | | (0.02 | ) |
| | | | | | | | | | | | | | | | | | | | | | | | |
Total dividends and distributions | | | (0.13 | ) | | | (0.15 | ) | | | (0.14 | ) | | | (0.14 | ) | | | — | | | | (0.04 | ) |
| | | | | | | | | | | | | | | | | | | | | | | | |
Net asset value at end of period | | $ | 8.16 | | | $ | 6.79 | | | $ | 6.36 | | | $ | 6.77 | | | $ | 6.31 | | | $ | 5.19 | |
| | | | | | | | | | | | | | | | | | | | | | | | |
Total investment return (b) | | | 22.42 | %(c) | | | 9.37 | % | | | (4.08 | %) | | | 9.49 | % | | | 21.58 | %(d) | | | (49.50 | %) |
Ratios (to average net assets)/Supplemental Data: | | | | | | | | | | | | | | | | | | | | | | | | |
Net investment income (loss) | | | 1.39 | %†† | | | 1.64 | % | | | 1.77 | % | | | 0.88 | % | | | 1.27 | % | | | 0.96 | % |
Net expenses (excluding short sale expenses) | | | 1.57 | %†† | | | 1.58 | % | | | 1.60 | % | | | 1.60 | % | | | 1.60 | % | | | 1.60 | % |
Expenses (including short sales expenses, before waiver/reimbursement) | | | 2.72 | %†† | | | 3.19 | % | | | 2.91 | % | | | 2.87 | % | | | 3.13 | % | | | 3.11 | % |
Short sale expenses | | | 1.15 | %†† | | | 1.61 | % | | | 1.28 | % | | | 1.15 | % | | | 1.32 | % | | | 1.05 | % |
Portfolio turnover rate | | | 71 | % | | | 162 | % | | | 157 | % | | | 160 | % | | | 143 | % | | | 204 | % |
Net assets at end of period (in 000’s) | | $ | 890 | | | $ | 394 | | | $ | 110 | | | $ | 75 | | | $ | 97 | | | $ | 61 | |
| ‡ | Less than one cent per share. |
| (a) | Per share data based on average shares outstanding during the period. |
| (b) | Total investment return is calculated exclusive of sales charges and assumes the reinvestment of dividends and distributions. |
| (c) | Total investment return is not annualized. |
| (d) | Total investment return may reflect adjustments to conform to generally accepted accounting principles. |
| | | | |
| 30 | | MainStay International Opportunities Fund | | The notes to the financial statements are an integral part of,
and should be read in conjunction with, the financial statements. |
Financial Highlights selected per share data and ratios
| | | | | | | | | | | | | | | | | | | | | | | | |
| | | Class C | |
| | | Six months
ended
April 30, | | | Year ended October 31, | |
| | | 2013* | | | 2012 | | | 2011 | | | 2010 | | | 2009 | | | 2008 | |
Net asset value at beginning of period | | $ | 6.64 | | | $ | 6.22 | | | $ | 6.64 | | | $ | 6.20 | | | $ | 5.15 | | | $ | 10.32 | |
| | | | | | | | | | | | | | | | | | | | | | | | |
Net investment income (loss) (a) | | | 0.02 | | | | 0.04 | | | | 0.06 | | | | 0.02 | | | | 0.02 | | | | (0.01 | ) |
Net realized and unrealized gain (loss) on investments | | | 1.42 | | | | 0.47 | | | | (0.38 | ) | | | 0.52 | | | | 1.03 | | | | (5.13 | ) |
Net realized and unrealized gain (loss) on foreign currency transactions | | | (0.00 | )‡ | | | (0.00 | )‡ | | | (0.01 | ) | | | — | | | | — | | | | — | |
| | | | | | | | | | | | | | | | | | | | | | | | |
Total from investment operations | | | 1.44 | | | | 0.51 | | | | (0.33 | ) | | | 0.54 | | | | 1.05 | | | | (5.14 | ) |
| | | | | | | | | | | | | | | | | | | | | | | | |
Less dividends and distributions: | | | | | | | | | | | | | | | | | | | | | | | | |
From net investment income | | | (0.08 | ) | | | (0.09 | ) | | | (0.09 | ) | | | (0.10 | ) | | | — | | | | (0.01 | ) |
From net realized gain on investments | | | — | | | | — | | | | — | | | | — | | | | — | | | | (0.02 | ) |
| | | | | | | | | | | | | | | | | | | | | | | | |
Total dividends and distributions | | | (0.08 | ) | | | (0.09 | ) | | | (0.09 | ) | | | (0.10 | ) | | | — | | | | (0.03 | ) |
| | | | | | | | | | | | | | | | | | | | | | | | |
Net asset value at end of period | | $ | 8.00 | | | $ | 6.64 | | | $ | 6.22 | | | $ | 6.64 | | | $ | 6.20 | | | $ | 5.15 | |
| | | | | | | | | | | | | | | | | | | | | | | | |
Total investment return (b) | | | 21.85 | %(c) | | | 8.41 | % | | | (5.06 | %) | | | 8.84 | % | | | 20.39 | % | | | (49.90 | %) |
Ratios (to average net assets)/Supplemental Data: | | | | | | | | | | | | | | | | | | | | | | | | |
Net investment income (loss) | | | 0.67 | %†† | | | 0.71 | % | | | 0.88 | % | | | 0.33 | % | | | 0.36 | % | | | (0.08 | %) |
Net expenses (excluding short sale expenses) | | | 2.45 | %†† | | | 2.45 | % | | | 2.45 | % | | | 2.45 | % | | | 2.45 | % | | | 2.41 | % |
Expenses (including short sales expenses, before waiver/reimbursement) | | | 3.74 | %†† | | | 4.14 | % | | | 3.85 | % | | | 3.81 | % | | | 3.98 | % | | | 3.94 | % |
Short sale expenses | | | 1.16 | %†† | | | 1.60 | % | | | 1.28 | % | | | 1.19 | % | | | 1.32 | % | | | 1.01 | % |
Portfolio turnover rate | | | 71 | % | | | 162 | % | | | 157 | % | | | 160 | % | | | 143 | % | | | 204 | % |
Net assets at end of period (in 000’s) | | $ | 264 | | | $ | 159 | | | $ | 121 | | | $ | 100 | | | $ | 69 | | | $ | 44 | |
| ‡ | Less than one cent per share. |
| (a) | Per share data based on average shares outstanding during the period. |
| (b) | Total investment return is calculated exclusive of sales charges and assumes the reinvestment of dividends and distributions. |
| (c) | Total investment return is not annualized. |
| | | | | | |
The notes to the financial statements are an integral part of,
and should be read in conjunction with, the financial statements. | | mainstayinvestments.com | | | 31 | |
Financial Highlights selected per share data and ratios
| | | | | | | | | | | | | | | | | | | | | | | | |
| | | Class I | |
| | | Six months
ended
April 30, | | | Year ended October 31, | |
| | | 2013* | | | 2012 | | | 2011 | | | 2010 | | | 2009 | | | 2008 | |
Net asset value at beginning of period | | $ | 6.82 | | | $ | 6.38 | | | $ | 6.80 | | | $ | 6.34 | | | $ | 5.21 | | | $ | 10.32 | |
| | | | | | | | | | | | | | | | | | | | | | | | |
Net investment income (loss) (a) | | | 0.05 | | | | 0.11 | | | | 0.13 | | | | 0.09 | | | | 0.09 | | | | 0.22 | |
Net realized and unrealized gain (loss) on investments | | | 1.45 | | | | 0.50 | | | | (0.38 | ) | | | 0.52 | | | | 1.04 | | | | (5.29 | ) |
Net realized and unrealized gain (loss) on foreign currency transactions | | | (0.00 | )‡ | | | (0.00 | )‡ | | | (0.01 | ) | | | — | | | | — | | | | — | |
| | | | | | | | | | | | | | | | | | | | | | | | |
Total from investment operations | | | 1.50 | | | | 0.61 | | | | (0.26 | ) | | | 0.61 | | | | 1.13 | | | | (5.07 | ) |
| | | | | | | | | | | | | | | | | | | | | | | | |
Less dividends and distributions: | | | | | | | | | | | | | | | | | | | | | | | | |
From net investment income | | | (0.14 | ) | | | (0.17 | ) | | | (0.16 | ) | | | (0.15 | ) | | | — | | | | (0.02 | ) |
From net realized gain on investments | | | — | | | | — | | | | — | | | | — | | | | — | | | | (0.02 | ) |
| | | | | | | | | | | | | | | | | | | | | | | | |
Total dividends and distributions | | | (0.14 | ) | | | (0.17 | ) | | | (0.16 | ) | | | (0.15 | ) | | | — | | | | (0.04 | ) |
| | | | | | | | | | | | | | | | | | | | | | | | |
Net asset value at end of period | | $ | 8.18 | | | $ | 6.82 | | | $ | 6.38 | | | $ | 6.80 | | | $ | 6.34 | | | $ | 5.21 | |
| | | | | | | | | | | | | | | | | | | | | | | | |
Total investment return (b) | | | 22.53 | %(c) | | | 9.46 | % | | | (3.87 | %) | | | 9.83 | % | | | 21.69 | % | | | (49.29 | %) |
Ratios (to average net assets)/Supplemental Data: | | | | | | | | | | | | | | | | | | | | | | | | |
Net investment income (loss) | | | 1.51 | %†† | | | 1.70 | % | | | 1.92 | % | | | 1.37 | % | | | 1.74 | % | | | 2.80 | % |
Net expenses (excluding short sale expenses) | | | 1.32 | %†† | | | 1.34 | % | | | 1.35 | % | | | 1.35 | % | | | 1.35 | % | | | 1.35 | % |
Expenses (including short sales expenses, before waiver/reimbursement) | | | 2.46 | %†† | | | 2.93 | % | | | 2.65 | % | | | 2.65 | % | | | 2.92 | % | | | 2.73 | % |
Short sale expenses | | | 1.14 | %†† | | | 1.59 | % | | | 1.27 | % | | | 1.18 | % | | | 1.36 | % | | | 0.98 | % |
Portfolio turnover rate | | | 71 | % | | | 162 | % | | | 157 | % | | | 160 | % | | | 143 | % | | | 204 | % |
Net assets at end of period (in 000’s) | | $ | 201,026 | | | $ | 171,404 | | | $ | 142,717 | | | $ | 126,402 | | | $ | 111,823 | | | $ | 75,912 | |
| ‡ | Less than one cent per share. |
| (a) | Per share data based on average shares outstanding during the period. |
| (b) | Total investment return is calculated exclusive of sales charges and assumes the reinvestment of dividends and distributions. Class I shares are not subject to sales charges. |
| (c) | Total investment return is not annualized. |
| | | | |
| 32 | | MainStay International Opportunities Fund | | The notes to the financial statements are an integral part of,
and should be read in conjunction with, the financial statements. |
Notes to Financial Statements (Unaudited)
Note 1–Organization and Business
MainStay Funds Trust (the “Trust”) was organized as a Delaware statutory trust on April 28, 2009, and is governed by a Declaration of Trust. The Trust is registered under the Investment Company Act of 1940, as amended (the “1940 Act”), as an open-end investment management company, and is comprised of thirty-three funds (collectively referred to as the “Funds”). At a meeting of the Board of Trustees (“Board”) of the Trust on December 10-12, 2012, the Board approved a change to the name of the Fund, and modifications to its principal investment strategies. Accordingly, effective February 28, 2013, the 130/30 International Fund’s name changed to MainStay International Opportunities Fund (the “Fund”). The Fund is the successor of a series of Eclipse Funds Inc., the MainStay 130/30 International Fund (“Predecessor Fund”). The reorganizations of the Predecessor Fund with and into the Fund occurred on February 26, 2010. All information and references to periods prior to February 26, 2010 relate to the Predecessor Fund. These financial statements and notes relate only to the Fund, a diversified fund.
The Fund currently offers four classes of shares. Class A, Class C and Class I shares commenced operations on September 28, 2007. Investor Class shares commenced operations on February 28, 2008.
Investor Class and Class A shares are offered at net asset value (“NAV”) per share plus an initial sales charge. No sales charge applies to investments of $1 million or more (and certain other qualified purchases) in Investor Class and Class A shares, but a contingent deferred sales charge (“CDSC”) is imposed on certain redemptions within one year of the date of purchase. Class C shares are offered at NAV without an initial sales charge, although a 1.00% CDSC may be imposed on redemptions made within one year of the date of purchase. Class I shares are offered at NAV without imposition of a front-end sales charge or a CDSC. Depending upon eligibility, Investor Class shares may convert to Class A shares and Class A shares may convert to Investor Class shares. The four classes of shares have the same voting (except for issues that relate solely to one class), dividend, liquidation and other rights, and the same terms and conditions, except that Class C shares are subject to higher distribution and/or service fee rates than Investor Class and Class A shares under a distribution plan pursuant to Rule 12b-1 under the 1940 Act. Class I shares are not subject to a distribution and/or service fee.
The Fund’s investment objective is to seek long-term growth of capital.
Note 2–Significant Accounting Policies
The Fund prepares its financial statements in accordance with generally accepted accounting principles (“GAAP”) in the United States of America and follows the significant accounting policies described below.
(A) Securities Valuation. Investments are valued as of the close of regular trading on the New York Stock Exchange (“Exchange”) (generally 4:00 p.m. Eastern time) on each day the Fund is open for business (“valuation date”).
The Board of Trustees (the “Board”) has adopted procedures for the valuation of the Fund’s securities and has delegated the responsibility
for valuation determination under those procedures to the Valuation Committee of the Fund (the “Valuation Committee”). The Board has authorized the Valuation Committee to appoint a Valuation Sub-Committee (the “Sub-Committee”) to deal in the first instance with questions that arise or cannot be resolved under these procedures. The Sub-Committee meets (in person, via electronic mail or via teleconference) on an as-needed basis. The Valuation Committee meets at a later time, as necessary, to ensure that actions taken by the Sub-Committee were appropriate. The procedures recognize that, subject to the oversight of the Board and unless otherwise noted, the responsibility for day-to-day valuation of portfolio assets (including securities for which market prices are not readily available) rests with New York Life Investment Management LLC ( “New York Life Investments” or the “Manager”), aided to whatever extent necessary by the Subadvisor (as defined in Note 3(A)) of the Fund.
To assess the appropriateness of security valuations, the Manager or the Fund’s third party service provider who is subject to oversight by the Manager, regularly compares prior day prices, prices on comparable securities and the sale prices to the prior and current day prices and challenges prices exceeding certain tolerance levels with third party pricing services or broker sources. For those securities valued by recommendation, whether through a standardized fair valuation methodology or a fair valuation determination, the Valuation Committee reviews and affirms the reasonableness of the valuation based on such methodologies and determinations on a regular basis after considering all relevant information that is reasonably available.
“Fair value” is defined as the price that the Fund would receive upon selling an investment in an orderly transaction to an independent buyer in the principal or most advantageous market of the investment. Fair value measurements are determined within a framework that has established a three-tier hierarchy which maximizes the use of observable market data and minimizes the use of unobservable inputs to establish classification of fair value measurements for disclosure purposes. “Inputs” refers broadly to the assumptions that market participants would use in pricing the asset or liability, including assumptions about risk, such as the risk inherent in a particular valuation technique used to measure fair value using a pricing model and/or the risk inherent in the inputs for the valuation technique. Inputs may be observable or unobservable. Observable inputs reflect the assumptions market participants would use in pricing the asset or liability based on market data obtained from sources independent of the Fund. Unobservable inputs reflect the Fund’s own assumptions about the assumptions market participants would use in pricing the asset or liability developed based on the information available in the circumstances. The inputs or methodology used for valuing securities may not be an indication of the risks associated with investing in those securities. The three-tier hierarchy of inputs is summarized in the three broad Levels listed below.
| • | | Level 1—quoted prices in active markets for identical investments |
| • | | Level 2—other significant observable inputs (including quoted prices for similar investments in active markets, interest rates and yield curves, prepayment speeds, credit risks, etc.) |
| • | | Level 3—significant unobservable inputs (including the Fund’s own assumptions about the assumptions that market participants would use in determining the fair value of investments) |
| | | | |
| mainstayinvestments.com | | | 33 | |
Notes to Financial Statements (Unaudited) (continued)
The aggregate value by input level, as of April 30, 2013, for the Fund’s investments is included at the end of the Fund’s Portfolio of Investments.
The valuation techniques used by the Fund to measure fair value maximize the use of observable inputs and minimize the use of unobservable inputs. The Fund may utilize third party vendor evaluations, whose prices may be derived from one or more of the following standard inputs:
| | |
• Benchmark Yields | | • Reported Trades |
• Broker Dealer Quotes | | • Issuer Spreads |
• Two-sided markets | | • Benchmark securities |
• Bids/Offers | | • Reference Data (corporate actions or material event notices) |
• Industry and economic events | | • Comparable bonds |
• Equity and credit default swap curves | | • Monthly payment information |
Securities for which market values cannot be determined using the methodologies described above are valued by methods deemed in good faith by the Fund’s Valuation Committee, following the procedures established by the Board, to represent fair value. Under these procedures, the Fund primarily employs a market-based approach which may use related or comparable assets or liabilities, recent transactions, market multiples, book values, and other relevant information. The Fund may also use an income-based valuation approach in which the anticipated future cash flows of the investment are discounted to calculate fair value. Discounts may also be applied due to the nature or duration of any restrictions on the disposition of the investments. Due to the inherent uncertainty of valuations of such investments, the fair values may differ significantly from the values that would have been used had an active market existed. For the six-month period ended April 30, 2013, there have been no changes to the fair value methodologies.
Equity and non-equity securities which may be valued in this manner include, but are not limited to: (i) a security for which the trading has been halted or suspended; (ii) a debt security that has recently gone into default and for which there is not a current market quotation; (iii) a security of an issuer that has entered into a restructuring; (iv) a security that has been de-listed from a national exchange; (v) a security for which the market price is not available from a third party pricing source or, if so provided, does not, in the opinion of the Fund’s Manager or Subadvisor reflect the security’s market value; and (vi) a security whose principal market has been temporarily closed at a time when, under normal conditions, it would be open. Securities for which market quotations or observable inputs are not readily available are generally categorized as Level 3 in the hierarchy. As of April 30, 2013, the Fund held securities with a value of $(566,878) that were fair valued in such a manner.
Certain events may occur between the time that foreign markets close, on which securities held by the Fund principally trade, and the time at which the Fund’s NAV is calculated. These events may include, but are not limited to, situations relating to a single issuer in a market sector, significant fluctuations in U.S. or foreign markets, natural disasters, armed conflicts, governmental actions or other developments not tied directly to the securities markets. Should the Manager or Subadvisor conclude that such events may have affected the accuracy of the last
price of such securities reported on the local foreign market, the Manager or Subadvisor may, pursuant to procedures adopted by the Board, adjust the value of the local price to reflect the estimated impact on the price of such securities as a result of such events. In this instance, securities are generally categorized as Level 3 in the hierarchy. Additionally, foreign equity securities are also fair valued whenever the movement of a particular index exceeds certain thresholds. In such cases, the securities are fair valued by applying factors provided by a third party vendor in accordance with the Fund’s policies and procedures and are generally categorized as Level 2 in the hierarchy. As of April 30, 2013, certain foreign equity securities held by the Fund were not fair valued in such a manner.
Equity securities and Exchange Traded Funds are valued at the latest quoted sales prices as of the close of regular trading on the Exchange on each valuation date. Securities that are not traded on the valuation date are valued at the mean of the latest quoted bid and ask prices. Prices normally are taken from the principal market in which each security trades. Options contracts are valued at the last posted settlement price on the market where such options are principally traded. Investments in other mutual funds are valued at their respective NAVs as of the close of the Exchange on the valuation date. These securities are generally categorized as Level 1 in the hierarchy.
Temporary cash investments acquired over 60 days to maturity are valued using the latest bid prices or using valuations based on a matrix system (which considers such factors as security prices, yields, maturities, and ratings), both as furnished by independent pricing services. Other temporary cash investments which mature in 60 days or less (“Short-Term Investments”) are valued at amortized cost. The amortized cost method involves valuing a security at its cost on the date of purchase and thereafter assuming a constant amortization to maturity of the difference between such cost and the value on maturity date. Amortized cost approximates the current fair value of a security. Securities valued at amortized cost are not valued using a quoted price in an active market. These securities are generally categorized as Level 2 in the hierarchy.
Foreign currency forward contracts are valued at their fair market values determined on the basis of the mean between the last current bid and ask prices based on dealer or exchange quotations and are generally categorized as Level 2 in the hierarchy.
Generally, a security is considered illiquid if it cannot be sold or disposed of in the ordinary course of business at approximately the price at which it is valued. Its illiquidity might prevent the sale of such security at a time when the Manager or Subadvisor might wish to sell, and these securities could have the effect of decreasing the overall level of a Fund’s liquidity. Further, the lack of an established secondary market may make it more difficult to value illiquid securities, requiring the Fund to rely on judgments that may be somewhat subjective in determining value, which could vary from the amount that the Fund could realize upon disposition. Difficulty in selling illiquid securities may result in a loss or may be costly to the Fund. Under the supervision of the Board, the Manager or Subadvisor determines the liquidity of the Fund’s investments; in doing so, the Manager or Subadvisor may consider various factors, including (i) the frequency of trades and quotations, (ii) the number of dealers and prospective purchasers, (iii) dealer undertakings to make a market, and (iv) the nature of the security and the
| | |
| 34 | | MainStay International Opportunities Fund |
market in which it trades (e.g., the time needed to dispose of the security, the method of soliciting offers and the mechanics of transfer). Illiquid securities generally will be valued in good faith in such a manner as the Board deems appropriate to reflect their fair value.
(B) Income Taxes. The Fund’s policy is to comply with the requirements of the Internal Revenue Code of 1986, as amended (the “Internal Revenue Code”), applicable to regulated investment companies and to distribute all of the taxable income to the shareholders of the Fund within the allowable time limits. Therefore, no federal, state and local income tax provision is required.
Management evaluates its tax positions to determine if the tax positions taken meet the minimum recognition threshold in connection with accounting for uncertainties in income tax positions taken or expected to be taken for the purposes of measuring and recognizing tax liabilities in the financial statements. Recognition of tax benefits of an uncertain tax position is required only when the position is “more likely than not” to be sustained assuming examination by taxing authorities. Management has analyzed the Fund’s tax positions taken on federal, state and local income tax returns for all open tax years (for up to three tax years), and has concluded that no provision for federal, state and local income tax is required in the Fund’s financial statements. The Fund’s federal, state and local income and federal excise tax returns for tax years for which the applicable statutes of limitations have not expired are subject to examination by the Internal Revenue Service and state and local departments of revenue.
(C) Foreign Taxes. Investment income received by the Fund from foreign sources may be subject to foreign income taxes. These foreign income taxes are generally withheld at the source, a portion of which may be recoverable. The Fund will accrue such taxes and recoveries as applicable, based upon its current interpretation of tax rules and regulations that exist in the markets in which it invests.
The Fund may be subject to taxation on realized capital gains, repatriation proceeds and other transaction-based taxes imposed by certain countries in which it invests. The Fund will accrue such taxes as applicable based upon its current interpretation of tax rules and regulations that exist in the market in which it invests. Capital gains taxes relating to positions still held are reflected as a liability on the Statement of Assets and Liabilities, as well as an adjustment to the Fund’s net unrealized appreciation (depreciation). Taxes related to capital gains realized during the six-month period ended April 30, 2013, if any, are reflected as part of net realized gain (loss) in the Statement of Operations. Changes in tax liabilities related to capital gains taxes on unrealized investment gains, if any, are reflected as part of the change in net unrealized appreciation (depreciation) on investments in the Statement Operations. Transaction-based charges are generally assessed as a percentage of the transaction amount.
(D) Dividends and Distributions to Shareholders. Dividends and distributions are recorded on the ex-dividend date. The Fund intends to declare and pay dividends of net investment income and distributions of net realized capital gains, if any, at least annually. Unless the shareholder elects otherwise, all dividends and distributions are reinvested in the same class of shares of the Fund, at NAV. Dividends and distributions to shareholders are determined in accordance with federal income tax regulations and may differ from GAAP.
(E) Security Transactions and Investment Income. The Fund records security transactions on the trade date. Realized gains and losses on security transactions are determined using the identified cost method. Dividend income is recognized on the ex-dividend date and interest income is accrued as earned using the effective interest rate method. Discounts and premiums on Short-Term Investments are accreted and amortized, respectively, on the straight-line method.
Investment income and realized and unrealized gains and losses on investments of the Fund are allocated to separate classes of shares pro rata based upon their relative net assets on the date the income is earned or realized and unrealized gains and losses are incurred.
(F) Expenses. Expenses of the Trust are allocated to the individual Funds in proportion to the net assets of the respective Funds when the expenses are incurred, except where direct allocations of expenses can be made. Expenses (other than transfer agent expenses and fees incurred under the shareholder services plans and the distribution plans further discussed in Note 3(B)) are allocated to separate classes of shares pro rata based upon their relative net assets on the date the expenses are incurred. The expenses borne by the Fund, including those of related parties to the Fund, are shown in the Statement of Operations.
(G) Use of Estimates. In preparing financial statements in conformity with GAAP, management makes estimates and assumptions that affect the reported amounts and disclosures in the financial statements. Actual results could differ from those estimates.
(H) Repurchase Agreements. The Fund may enter into repurchase agreements to earn income. The Fund may enter into repurchase agreements only with financial institutions that are deemed by the Manager or Subadvisor to be creditworthy, pursuant to guidelines established by the Fund’s Board. During the term of any repurchase agreement, the Manager or subadvisor will continue to monitor the creditworthiness of the seller. Under the 1940 Act, repurchase agreements are considered to be collateralized loans by a Fund to the seller secured by the securities transferred to the Fund.
When the Fund invests in repurchase agreements, the Fund’s custodian takes possession of the collateral pledged for investments in the repurchase agreement. The underlying collateral is valued daily on a mark-to-market basis to determine that the value, including accrued interest, exceeds the repurchase price. In the event of the seller’s default on the obligation to repurchase, the Fund has the right to liquidate the collateral and apply the proceeds in satisfaction of the obligation. Under certain circumstances, such as in the event of default or bankruptcy by the counterparty to the agreement, realization and/or retention of the collateral may be subject to legal proceedings and possible realized loss to the Fund.
(I) Futures Contracts. A futures contract is an agreement to purchase or sell a specified quantity of an underlying instrument at a specified future date and price, or to make or receive a cash payment based on the value of a financial instrument (e.g., foreign currency, interest rate, security, or securities index). The Fund is subject to equity price risk in the normal course of investment in these transactions. The Fund enters into futures contracts for market exposure. During the period the futures contract is open, changes in the value of the contract are recognized as unrealized appreciation or depreciation by “marking-to-market”
| | | | |
| mainstayinvestments.com | | | 35 | |
Notes to Financial Statements (Unaudited) (continued)
such contract on a daily basis to reflect the market value of the contract at the end of each day’s trading. The Fund agrees to receive from or pay to the broker an amount of cash equal to the daily fluctuation in the value of the contract. Such receipts or payments are known as “variation margin.” When the futures contract is closed, the Fund records a realized gain or loss equal to the difference between the proceeds from (or cost of) the closing transaction and the Fund’s basis in the contract.
The use of futures contracts involves, to varying degrees, elements of market risk in excess of the amount recognized in the Statement of Assets and Liabilities. The contract or notional amounts and variation margin reflect the extent of the Fund’s involvement in open futures positions. Risks arise from the possible imperfect correlation in movements in the price of futures contracts, interest rates and the underlying hedged assets, and the possible inability of counterparties to meet the terms of their contracts. However, the Fund’s activities in futures contracts have minimal counterparty risk as they are conducted through regulated exchanges that guarantee the futures against default by the counterparty. In the event of a bankruptcy or insolvency of a futures commission merchant that holds margin on behalf of the Fund, the Fund may not be entitled to the return of all of the margin owed to the Fund, potentially resulting in a loss. The Fund’s investment in futures contracts and other derivatives may increase the volatility of the Fund’s NAV and may result in a loss to the Fund. The Fund had no open futures contracts as of April 30, 2013.
(J) Securities Sold Short. The Fund typically engages in short sales as part of its investment strategies. When the Fund enters into a short sale, it must segregate the cash proceeds from the security sold short or other securities, as collateral for its obligation to deliver the security upon conclusion of the sale. During the period a short position is open, depending on the nature and type of security, short positions held are reflected as liabilities and are marked to market in accordance with the valuation methodologies previously detailed (See Note 2(A)). Liabilities for securities sold short are closed out by purchasing the applicable securities for delivery to the counterparty broker. A gain, limited to the price at which the Fund sold the security short, or a loss, unlimited as to dollar amount, will be recognized upon termination of a short sale if the market price on the date the short position is closed out is less or greater, respectively, than the proceeds originally received. Any such gain or loss may be offset, completely or in part, by the change in the value of the hedged investments. Dividends declared on short positions existing on the record date are recorded on the ex-dividend date as a dividend expense on the Statement of Operations.
(K) Foreign Currency Transactions. The books and records of the Fund are kept in U.S. dollars. Prices of securities denominated in foreign currency amounts are translated into U.S. dollars at the mean between the buying and selling rates last quoted by any major U.S. bank at the following dates:
| (i) | market value of investment securities, other assets and liabilities—at the valuation date, and |
| (ii) | purchases and sales of investment securities, income and expenses—at the date of such transactions. |
The assets and liabilities that are denominated in foreign currency amounts are presented at the exchange rates and market values at the close of the period. The realized and unrealized changes in net assets
arising from fluctuations in exchange rates and market prices of securities are not separately presented.
Net realized gain (loss) on foreign currency transactions represents net gains and losses on foreign currency forward contracts, net currency gains or losses realized as a result of differences between the amounts of securities sale proceeds or purchase cost, dividends, interest and withholding taxes as recorded on the Fund’s books, and the U.S. dollar equivalent amount actually received or paid. Net currency gains or losses from valuing such foreign currency denominated assets and liabilities, other than investments at valuation date exchange rates, are reflected in unrealized foreign exchange gains or losses.
(L) Rights and Warrants. Rights are certificates that permit the holder to purchase a certain number of shares, or a fractional share, of a new stock from the issuer at a specific price. Warrants are instruments that entitle the holder to buy an equity security at a specific price for a specific period of time. The Fund may enter into rights and warrants when securities are acquired through a corporate action. With respect to warrants in international markets, the securities may be purchased only when the underlying security cannot be purchased due to the many restrictions an industry and/or country might place on foreign investors. These investments can provide a greater potential for profit or loss than an equivalent investment in the underlying security. Prices of these investments do not necessarily move in tandem with the prices of the underlying securities.
There is risk involved in the purchase of rights and warrants in that these investments are speculative investments. The Fund could also lose the entire value of its investment in warrants, if such warrants are not exercised by the date of its expiration. The securities are sold as soon as the opportunity becomes available. The Fund is exposed to risk until the sale or exercise of each right or warrant is completed.
(M) Securities Lending. In order to realize additional income, the Fund may engage in securities lending, subject to the limitations set forth in the 1940 Act and relevant guidance by the staff of the Securities and Exchange Commission. In the event the Fund does engage in securities lending, the Fund will lend through its custodian, State Street Bank and Trust Company (“State Street”). State Street will manage the Fund’s cash collateral in accordance with the lending agreement between the Fund and State Street, and indemnify the Fund’s portfolio against counterparty risk. The loans will be collateralized by cash or securities at least equal at all times to the market value of the securities loaned. Collateral will consist of U.S. Government securities, cash equivalents or irrevocable letters of credit. The Fund may bear the risk of delay in recovery of, or loss of rights in, the securities loaned should the borrower of the securities experience financial difficulty. The Fund may also record realized gain or loss on securities deemed sold due to a borrower’s inability to return securities on loan. The Fund will receive compensation for lending its securities in the form of fees or the retention of a portion of the interest on the investment of any cash received as collateral. The Fund also will continue to receive interest and dividends on the securities loaned and any gain or loss in the market price of the securities loaned that may occur during the term of the loan will be for the account of the Fund.
Although the Fund and New York Life Investments have temporarily suspended securities lending, the Fund and New York Life Investments
| | |
| 36 | | MainStay International Opportunities Fund |
reserve the right to reinstitute lending when deemed appropriate. The Fund did not have any portfolio securities on loan as of April 30, 2013.
(N) Statement of Cash Flows. The cash amount shown in the Statement of Cash Flows is the amount included in the Fund’s Statement of Assets and Liabilities and represents the cash on hand at its custodian and does not include any Short-Term Investments or deposit at brokers for securities sold short or restricted cash. Cash may include domestic and foreign currency.
(O) Concentration of Risk. The Fund may invest in foreign securities, which carry certain risks that are in addition to the usual risks inherent in domestic instruments. These risks include those resulting from currency fluctuations, future adverse political and economic developments and possible imposition of currency exchange blockages or other foreign governmental laws or restrictions. These risks are likely to be greater in emerging markets than in developed markets. The ability of issuers of debt securities held by the Fund to meet its obligations may be affected by economic or political developments in a specific country, industry or region.
(P) Indemnifications. Under the Trust’s organizational documents, its officers and trustees are indemnified against certain liabilities that may arise out of performance of their duties to the Trust. Additionally, in the normal course of business, the Fund enters into contracts with third-party service providers that contain a variety of representations and warranties and which may provide general indemnifications. The Fund’s maximum exposure under these arrangements is unknown, as this would involve future claims that may be made against the Fund that have not yet occurred. Based on experience, management is of the view that the risk of loss in connection with these potential indemnification obligations is remote. However, there can be no assurance that material liabilities related to such obligations will not arise in the future, which could adversely impact the Fund.
(Q) Quantitative Disclosure of Derivative Holdings. The following tables show additional disclosures about the Fund’s derivative and hedging activities, including how such activities are accounted for and their effect on the Fund’s financial positions, performance and cash flows. These derivatives are not accounted for as hedging instruments.
Fair value of derivatives instruments as of April 30, 2013:
Asset Derivatives
| | | | | | | | | | |
| | | Statement of
Assets and
Liabilities
Location | | Equity
Contracts
Risk | | | Total | |
Rights | | Investments in securities, at value | | $ | 5,533 | | | $ | 5,533 | |
Warrants | | Investments in securities, at value | | | 6,532 | | | | 6,532 | |
| | | | | | | | | | |
Total Fair Value | | $ | 12,065 | | | $ | 12,065 | |
| | | | | | | | | | |
Liability Derivatives
| | | | | | | | | | |
| | | Statement of
Assets and
Liabilities
Location | | Equity
Contracts
Risk | | | Total | |
Rights Sold Short | | Investments in securities, at value | | $ | (3 | ) | | $ | (3 | ) |
| | | | | | | | | | |
Total Fair Value | | $ | (3 | ) | | $ | (3 | ) |
| | | | | | | | | | |
The effect of derivative instruments on the Statement of Operations for the period ended April 30, 2013:
Realized Gain (Loss)
| | | | | | | | | | |
| | | Statement of
Operations
Location | | Equity
Contracts
Risk | | | Total | |
Rights | | Net realized gain (loss) on
security transactions | | $ | 30,450 | | | $ | 30,450 | |
Rights Sold Short | | Net realized gain (loss) on investments sold short | | | (74,913 | ) | | | (74,913 | ) |
Futures Contracts | | Net realized gain (loss) on futures transactions | | | 294,234 | | | | 294,234 | |
| | | | | | | | | | |
Total Realized Gain (Loss) | | $ | 249,771 | | | $ | 249,771 | |
| | | | | | | | | | |
Change in Unrealized Appreciation (Depreciation)
| | | | | | | | | | |
| | | Statement of
Operations
Location | | Equity
Contracts
Risk | | | Total | |
Rights | | Net change in unrealized appreciation (depreciation) on investments | | $ | 29 | | | $ | 29 | |
Warrants | | Net change in unrealized appreciation (depreciation) on investments | | | 2,570 | | | | 2,570 | |
Rights Sold Short | | Net change in unrealized appreciation (depreciation) on investments | | | (3 | ) | | | (3 | ) |
| | | | | | | | | | |
Total Change in Unrealized Appreciation (Depreciation) | | $ | 2,596 | | | $ | 2,596 | |
| | | | | | | | | | |
| | | | |
| mainstayinvestments.com | | | 37 | |
Notes to Financial Statements (Unaudited) (continued)
Number of Contracts, Notional Amounts or Shares/Units (1)
| | | | | | |
| | | Equity
Contracts
Risk | | Total | |
Rights | | 57,129 | | | 57,129 | |
Warrants | | 112,675 | | | 112,675 | |
Rights Sold Short | | (54,643) | | | (54,643 | ) |
| | | | | | |
| (1) | Amount disclosed represents the weighted average held during the period ended April 30, 2013. |
Note 3–Fees and Related Party Transactions
(A) Manager and Subadvisor. New York Life Investments, a registered investment adviser and an indirect, wholly-owned subsidiary of New York Life Insurance Company (“New York Life”), serves as the Fund’s Manager, pursuant to an Amended and Restated Management Agreement (“Management Agreement”). The Manager provides offices, conducts clerical, recordkeeping and bookkeeping services, and keeps most of the financial and accounting records required to be maintained by the Fund. Except for the portion of salaries and expenses that are the responsibility of the Fund, the Manager pays the salaries and expenses of all personnel affiliated with the Fund and certain operational expenses of the Fund. The Fund reimburses New York Life Investments in an amount equal to a portion of the salary of the Chief Compliance Officer (“CCO”) of the Fund. Cornerstone Capital Management Holdings LLC (“Cornerstone Holdings” or “Subadvisor”), a registered investment adviser and an indirect, wholly-owned subsidiary of New York Life, serves as Subadvisor to and is responsible for the day-to-day portfolio management of the Funds. Pursuant to the terms of a Subadvisory Agreement (“Subadvisory Agreement”) between New York Life Investments and Cornerstone Holdings, New York Life Investments pays for the Subadvisor’s services. Effective January 25, 2013, Madison Square Investors LLC changed its name to Cornerstone Capital Management Holdings LLC.
The Fund pays the Manager a monthly fee for services performed and facilities furnished at 1.10% annual rate of average daily net assets of the Fund.
New York Life Investments has contractually agreed to waive fees and/or reimburse expenses so that Total Annual Fund Operating Expenses do not exceed the percentages of average daily net assets for Class A shares of 1.60%. Total Annual Fund Operating Expenses excludes taxes, interest, litigation, extraordinary expenses, brokerage and other transaction expenses relating to the purchase or sale of portfolio investments, and acquired (underlying) fund fees and expenses.
New York Life Investments will apply an equivalent waiver or reimbursement, in an equal number of basis points, to the other share classes of the Fund. This agreement will remain in effect until February 28, 2014 and shall renew automatically for one-year terms unless New York Life Investments provides written notice of termination prior to the start of the next term or upon approval of the Board.
Additionally, New York Life Investments has agreed to voluntarily waive fees and/or reimburse expenses of the appropriate class of the Fund so that Total Annual Fund Operating Expenses do not exceed the following percentages of: 1.70% for Investor Class and 2.45% for Class C, respectively. These voluntary waivers or reimbursements may be discontinued at any time without notice.
For the six-month period ended April 30, 2013, New York Life Investments earned fees from the Fund in the amount of $1,034,640 and waived its fees and/or reimbursed expenses in the amount of $271.
State Street, 1 Lincoln Street, Boston, Massachusetts 02111, provides sub-administration and sub-accounting services to the Fund pursuant to an agreement with New York Life Investments. These services include calculating the daily NAVs of the Fund, maintaining the general ledger and sub-ledger accounts for the calculation of the Fund’s respective NAVs, and assisting New York Life Investments in conducting various aspects of the Fund’s administrative operations. For providing these services to the Fund, State Street is compensated by New York Life Investments.
(B) Distribution and Service Fees. The Trust, on behalf of the Fund, has entered into a distribution agreement with NYLIFE Distributors LLC (the ‘‘Distributor’’), an indirect, wholly-owned subsidiary of New York Life. The Fund has adopted distribution plans (the ‘‘Plans’’) in accordance with the provisions of Rule 12b-1 under the 1940 Act.
Pursuant to the Investor Class and Class A Plans, the Distributor receives a monthly distribution fee from Investor Class and Class A shares at an annual rate of 0.25% of the average daily net assets of the Investor Class and Class A shares for distribution and/or service activities as designated by the Distributor. Pursuant to the Class C Plan, Class C shares pay the Distributor a monthly distribution fee at an annual rate of 0.75% of the average daily net assets of the Class C shares, along with a service fee at an annual rate of 0.25% of the average daily net assets of the Class C shares, for a total 12b-1 fee of 1.00%. Class I shares are not subject to a distribution and/or service fee.
The Plans provide that the distribution and service fees are payable to the Distributor regardless of the amounts actually expended by the Distributor for distribution of the Fund’s shares and service activities.
(C) Sales Charges. The Fund was advised by the Distributor that the amount of sales charges retained on sales of Investor Class and Class A shares were $452 and $66, respectively, for the six-month period ended April 30, 2013.
The Fund was also advised that the Distributor retained CDSCs on redemptions of Class C shares of $5 for the six-month period ended April 30, 2013.
(D) Transfer, Dividend Disbursing and Shareholder Servicing Agent. NYLIM Service Company LLC, an affiliate of New York Life Investments, is the Fund’s transfer, dividend disbursing and shareholder servicing agent pursuant to an agreement between NYLIM Service Company LLC and the Trust. NYLIM Service Company LLC has entered into an agreement with Boston Financial Data Services, Inc. (“BFDS”) pursuant to which BFDS performs certain transfer agent services on behalf of NYLIM Service Company LLC. Transfer agent expenses incurred by the Fund for the six-month period ended April 30, 2013, were as follows:
| | | | |
Investor Class | | $ | 345 | |
Class A | | | 16 | |
Class C | | | 231 | |
Class I | | | 5,525 | |
| | |
| 38 | | MainStay International Opportunities Fund |
(E) Small Account Fee. Shareholders with small accounts adversely impact the cost of providing transfer agency services. In an effort to reduce total transfer agency expenses, the Fund has implemented a small account fee on certain types of accounts. Certain shareholders with an account balance of less than $1,000 are charged an annual per account fee of $20 (assessed semi-annually), the proceeds from which offset transfer agent fees as reflected in the Statement of Operations.
(F) Capital. As of April 30, 2013, New York Life and its affiliates beneficially held shares of the Fund with values and percentages of net assets as follows:
| | | | | | | | |
Investor Class | | $ | 25,262 | | | | 6.7 | % |
Class A | | | 22,307 | | | | 2.5 | |
Class C | | | 21,221 | | | | 8.1 | |
Note 4–Federal Income Tax
Under the Regulated Investment Company Modernization Act of 2010, the Fund is permitted to carry forward capital losses incurred in taxable years beginning after December 22, 2010, for an unlimited period. However, any losses incurred during those future years will be required to be utilized prior to the losses incurred in pre-enactment tax years. As a result of this ordering rule, pre-enactment capital loss carryforwards may be more likely to expire unused. Additionally, post-enactment capital losses that are carried forward will retain their character as either short-term or long-term capital losses rather than being considered all short-term as under previous law.
As of October 31, 2012, for federal income tax purposes, capital loss carryforwards of $29,968,732 were available as shown in the table below, to the extent provided by the regulations to offset future realized gains of the Fund through the years indicated. To the extent that these capital loss carryforwards are used to offset future capital gains, it is probable that the capital gains so offset will not be distributed to shareholders. No capital gain distributions shall be made until any capital loss carryforwards have been fully utilized or expired.
| | | | | | | | |
Capital Loss
Available Through | | Short-Term
Capital Loss
Amounts (000’s) | | | Long-Term
Capital Loss
Amounts (000’s) | |
| 2015 | | $ | 1,097 | | | $ | — | |
| 2016 | | | 28,872 | | | | — | |
| Total | | $ | 29,969 | | | $ | — | |
The tax character of distributions paid during the year ended October 31, 2012, shown in the Statements of Changes in Net Assets was as follows:
| | | | |
| | | 2012 | |
Distributions paid from: | | | | |
Ordinary Income | | $ | 3,885,016 | |
Note 5–Custodian
State Street is the custodian of the cash and the securities of the Fund. Custodial fees are charged to the Fund based on the market value of securities in the Fund and the number of certain cash transactions incurred by the Fund.
Note 6–Line of Credit
The Fund and certain affiliated funds maintain a line of credit with a syndicate of banks in order to secure a source of funds for temporary purposes to meet unanticipated or excessive redemption requests.
Effective August 29, 2012, under a second amended and restated credit agreement (the “Credit Agreement”), the aggregate commitment amount is $200,000,000 with an optional maximum amount of $250,000,000. The commitment fee is an annual rate of 0.08% of the average commitment amount payable quarterly, regardless of usage, to Bank of New York Mellon, which serves as the agent to the syndicate. The commitment fee is allocated among the Fund and certain affiliated funds based upon net assets and other factors. Interest on any revolving credit loan is charged based upon the Federal Funds Advances rate or the one month London InterBank Offered Rate, whichever is higher. The Credit Agreement expires on August 28, 2013, although the Fund, certain affiliated funds and the syndicate of banks may renew the Credit Agreement for an additional year on the same or different terms. There were no borrowings made or outstanding with respect to the Fund on the Credit Agreement during the six-month period ended April 30, 2013.
Note 7–Purchases and Sales of Securities (in 000’s)
During the six-month period ended April 30, 2013, purchases and sales of securities, other than short-term securities, were $178,608 and $187,315, respectively.
Note 8–Capital Share Transactions
| | | | | | | | |
Investor Class | | Shares | | | Amount | |
Six-month period ended April 30, 2013: | | | | | | | | |
Shares sold | | | 16,095 | | | $ | 121,424 | |
Shares issued to shareholders in reinvestment of dividends | | | 617 | | | | 4,294 | |
Shares redeemed | | | (3,854 | ) | | | (27,042 | ) |
| | | | | | | | |
Net increase (decrease) in shares outstanding before conversion | | | 12,858 | | | | 98,676 | |
Shares converted into Investor Class (See Note 1) | | | 466 | | | | 3,505 | |
Shares converted from Investor Class (See Note 1) | | | (2,242 | ) | | | (16,947 | ) |
| | | | | | | | |
Net increase (decrease) | | | 11,082 | | | $ | 85,234 | |
| | | | | | | | |
Year ended October 31, 2012: | | | | | | | | |
Shares sold | | | 7,536 | | | $ | 47,537 | |
Shares issued to shareholders in reinvestment of dividends | | | 755 | | | | 4,592 | |
Shares redeemed | | | (5,229 | ) | | | (32,718 | ) |
| | | | | | | | |
Net increase (decrease) in shares outstanding before conversion | | | 3,062 | | | | 19,411 | |
Shares converted into Investor Class (See Note 1) | | | 2,203 | | | | 14,626 | |
Shares converted from Investor Class (See Note 1) | | | (5,655 | ) | | | (35,870 | ) |
| | | | | | | | |
Net increase (decrease) | | | (390 | ) | | $ | (1,833 | ) |
| | | | | | | | |
| | |
| | | | | | | | |
| | | | |
| mainstayinvestments.com | | | 39 | |
Notes to Financial Statements (Unaudited) (continued)
| | | | | | | | |
Class A | | Shares | | | Amount | |
Six-month period ended April 30, 2013: | | | | | | | | |
Shares sold | | | 51,691 | | | $ | 395,661 | |
Shares issued to shareholders in reinvestment of dividends | | | 1,451 | | | | 10,117 | |
Shares redeemed | | | (3,826 | ) | | | (30,047 | ) |
| | | | | | | | |
Net increase (decrease) in shares outstanding before conversion | | | 49,316 | | | | 375,731 | |
Shares converted into Class A (See Note 1) | | | 2,236 | | | | 16,947 | |
Shares converted from Class A (See Note 1) | | | (465 | ) | | | (3,505 | ) |
| | | | | | | | |
Net increase (decrease) | | | 51,087 | | | $ | 389,173 | |
| | | | | | | | |
Year ended October 31, 2012: | | | | | | | | |
Shares sold | | | 43,622 | | | $ | 292,363 | |
Shares issued to shareholders in reinvestment of dividends | | | 398 | | | | 2,424 | |
Shares redeemed | | | (6,647 | ) | | | (43,742 | ) |
| | | | | | | | |
Net increase (decrease) in shares outstanding before conversion | | | 37,373 | | | | 251,045 | |
Shares converted into Class A (See Note 1) | | | 5,650 | | | | 35,870 | |
Shares converted from Class A (See Note 1) | | | (2,199 | ) | | | (14,626 | ) |
| | | | | | | | |
Net increase (decrease) | | | 40,824 | | | $ | 272,289 | |
| | | | | | | | |
| | |
| | | | | | | | |
Class C | | Shares | | | Amount | |
Six-month period ended April 30, 2013: | | | | | | | | |
Shares sold | | | 10,619 | | | $ | 79,717 | |
Shares issued to shareholders in reinvestment of dividends | | | 254 | | | | 1,743 | |
Shares redeemed | | | (1,845 | ) | | | (13,132 | ) |
| | | | | | | | |
Net increase (decrease) | | | 9,028 | | | $ | 68,328 | |
| | | | | | | | |
Year ended October 31, 2012: | | | | | | | | |
Shares sold | | | 5,799 | | | $ | 36,536 | |
Shares issued to shareholders in reinvestment of dividends | | | 278 | | | | 1,670 | |
Shares redeemed | | | (1,675 | ) | | | (10,861 | ) |
| | | | | | | | |
Net increase (decrease) | | | 4,402 | | | $ | 27,345 | |
| | | | | | | | |
| | |
| | | | | | | | |
| | | | | | | | |
Class I | | Shares | | | Amount | |
Six-month period ended April 30, 2013: | | | | | | | | |
Shares sold | | | 2,815,270 | | | $ | 20,591,962 | |
Shares issued to shareholders in reinvestment of dividends | | | 499,686 | | | | 3,487,814 | |
Shares redeemed | | | (3,904,699 | ) | | | (29,474,701 | ) |
| | | | | | | | |
Net increase (decrease) | | | (589,743 | ) | | $ | (5,394,925 | ) |
| | | | | | | | |
Year ended October 31, 2012: | | | | | | | | |
Shares sold | | | 9,339,744 | | | $ | 57,923,952 | |
Shares issued to shareholders in reinvestment of dividends | | | 635,326 | | | | 3,875,486 | |
Shares redeemed | | | (7,176,794 | ) | | | (45,324,685 | ) |
| | | | | | | | |
Net increase (decrease) | | | 2,798,276 | | | $ | 16,474,753 | |
| | | | | | | | |
Note 9–Subsequent Events
In connection with the preparation of the financial statements of the Fund as of and for the six-month period ended April 30, 2013, events and transactions subsequent to April 30, 2013, through the date the financial statements were issued have been evaluated by the Fund’s management for possible adjustment and/or disclosure. No subsequent events requiring financial statement adjustment or disclosure have been identified.
| | |
| 40 | | MainStay International Opportunities Fund |
Board Consideration and Approval of Management Agreement and
Subadvisory Agreement (Unaudited)
Section 15(c) of the Investment Company Act of 1940, as amended (the “1940 Act”) requires that each mutual fund’s board of trustees, including a majority of the independent trustees, annually review and approve the fund’s investment advisory agreements. At its December 10-12, 2012 meeting, the Board of Trustees of the MainStay Group of Funds (“Board”) unanimously approved the Management Agreement with respect to the MainStay 130/30 International Fund, which subsequently changed its name to MainStay International Opportunities Fund (“Fund”), and New York Life Investment Management LLC (“New York Life Investments”), and the Subadvisory Agreement between New York Life Investments and Madison Square Investors LLC, which subsequently changed its name to Cornerstone Capital Management Holdings LLC (“Cornerstone Holdings”), with respect to the Fund.
In reaching its decision to approve the Agreements, the Board considered information furnished by New York Life Investments and Cornerstone Holdings in connection with a contract review process that took place at various meetings of the Board and its Contracts Committee between September 2012 and December 2012, as well as other relevant information furnished to the Board throughout the year by New York Life Investments and Cornerstone Holdings. Information requested by and furnished to the Board in connection with the contract review process included, among other items, reports on the Fund prepared by Strategic Insight Mutual Fund Research and Consulting, LLC (“Strategic Insight”), an independent third-party service provider engaged by the Board to report objectively on the Fund’s investment performance, management and subadvisory fees and ordinary operating expenses. The Board also considered information provided by New York Life Investments and Cornerstone Holdings on the fees charged to other investment advisory clients (including institutional separate accounts) that follow investment strategies similar to the Fund, and the rationale for any differences in the Fund’s management and subadvisory fees and the fees charged to those other investment advisory clients. In addition, the Board requested and received information on the profitability of the Fund to New York Life Investments and its affiliates, including Cornerstone Holdings as subadvisor to the Fund, and responses from New York Life Investments and Cornerstone Holdings to a series of questions encompassing a variety of topics prepared on behalf of the Board by independent legal counsel to the Board and its independent trustees (the “Independent Trustees”). Information provided to the Board at its meetings throughout the year included, among other items, detailed investment performance reports on the Fund prepared by the Investment Consulting Group at New York Life Investments. The structure and format for this regular reporting was developed in consultation with the Board. The Board also received from New York Life Investments throughout the year, among other items, periodic reports on legal and compliance matters, portfolio turnover, and sales and marketing activity.
In determining to approve the Agreements, the members of the Board reviewed and evaluated all of the information and factors they believed to be relevant and appropriate in light of legal advice furnished to them by independent legal counsel and through the exercise of their own business judgment. The broad factors considered by the Board are discussed in greater detail below, and included, among other items: (i) the nature, scope and quality of the services provided to the Fund by New York Life Investments and Cornerstone Holdings; (ii) the investment performance of the Fund, New York Life Investments and Cornerstone Holdings; (iii) the costs of the services provided, and profits realized, by
New York Life Investments and Cornerstone Holdings from their relationship with the Fund; (iv) the extent to which economies of scale may be realized as the Fund grows, and the extent to which economies of scale may benefit Fund investors; and (v) the reasonableness of the Fund’s management and subadvisory fees and overall total ordinary operating expenses, particularly as compared to similar funds and accounts managed by New York Life Investments and Cornerstone Holdings and third-party “peer funds” identified by Strategic Insight.
While individual members of the Board may have weighed certain factors differently, the Board’s decision to approve the Agreements was based on a consideration of all the information provided to the Board, including information provided to the Board throughout the year and specifically in connection with the contract review process. The Board’s conclusions with respect to the Agreements also were based, in part, on the Board’s consideration of the Agreements in prior years. In addition to considering the above-referenced factors, the Board observed that in the marketplace there are a range of investment options available to shareholders of the Fund, and that the Fund’s shareholders, having had the opportunity to consider other investment options, have chosen to invest in the Fund. A more detailed discussion of the factors that figured prominently in the Board’s decisions to approve the Agreements is provided below.
Nature, Scope and Quality of Services to Be Provided by New York Life Investments and Cornerstone Holdings
The Board examined the nature, scope and quality of the services that New York Life Investments provides to the Fund. The Board evaluated New York Life Investments’ experience in serving as manager of the Fund, noting that New York Life Investments manages other mutual funds, serves a variety of other investment advisory clients, including other pooled investment vehicles, and has experience with overseeing mutual fund service providers, including subadvisors. The Board considered the experience of senior personnel at New York Life Investments providing management and administrative services to the Fund, as well as New York Life Investments’ reputation and financial condition. The Board also considered the full range of non-advisory services that New York Life Investments supplies to the Fund under the terms of the Management Agreement, including: (i) fund accounting services provided by New York Life Investments’ Fund Accounting and Administration Group; (ii) investment oversight and analytical services provided by New York Life Investments’ Investment Consulting Group; (iii) compliance services provided by New York Life Investments’ compliance department, including oversight and implementation of the Fund’s compliance program; and (iv) legal services provided by New York Life Investments’ Office of the General Counsel. Additional information about the non-advisory services provided by New York Life Investments is set forth in the Fund’s Management Agreement. The Board also considered New York Life Investments’ willingness to invest in personnel that benefit the Fund, and noted that New York Life Investments is responsible for compensating the Fund’s officers. The Board also considered benefits to shareholders of being part of the MainStay Group of Funds, including the privilege of exchanging investments between the same class of shares without the imposition of a sales charge, as described more fully in the Fund’s prospectus.
| | | | |
| mainstayinvestments.com | | | 41 | |
Board Consideration and Approval of Management Agreement and
Subadvisory Agreement (Unaudited) (continued)
The Board also examined the nature, scope and quality of the advisory services that Cornerstone Holdings provides to the Fund. The Board evaluated Cornerstone Holdings’ experience in serving as subadvisor to the Fund and managing other portfolios. It examined Cornerstone Holdings’ track record and experience in providing investment advisory services, the experience of investment advisory, senior management and administrative personnel at Cornerstone Holdings, and Cornerstone Holdings’ overall legal and compliance environment. The Board also reviewed Cornerstone Holdings’ willingness to invest in personnel that benefit the Fund. In this regard, the Board considered the experience of the Fund’s portfolio managers, the number of accounts managed by the portfolio managers and the method for compensating portfolio managers.
Based on these considerations, the Board concluded, within the context of its overall determinations regarding the Agreements, that the Fund should continue to benefit from the nature, scope and quality of these services as a result of New York Life Investments’ and Cornerstone Holdings’ experience, personnel, operations and resources.
Investment Performance
In evaluating the Fund’s investment performance, the Board considered investment performance results in light of the Fund’s investment objective, strategies and risks, as disclosed in the Fund’s prospectus. The Board particularly considered detailed investment reports on the Fund’s performance provided to the Board throughout the year by the Investment Consulting Group of New York Life Investments. These reports include, among other items, information on the Fund’s gross and net returns, the Fund’s investment performance relative to relevant investment categories and Fund benchmarks, the Fund’s risk-adjusted investment performance, and the Fund’s investment performance as compared to similar competitor funds, as appropriate. The Board also considered information provided by Strategic Insight showing the investment performance of the Fund as compared to peer funds.
In considering the Fund’s investment performance, the Board focused principally on the Fund’s long-term performance track record. The Board also gave weight to its ongoing discussions with senior management at New York Life Investments concerning the Fund’s investment performance, as well as discussions between the Fund’s portfolio managers and the Board that occur typically on an annual basis. In addition, the Board considered any specific actions that New York Life Investments or Cornerstone Holdings had taken, or had agreed with the Board to take, to enhance Fund investment performance, and the results of those actions.
Based on these considerations, the Board concluded, within the context of its overall determinations regarding the Agreements, that the long-term investment performance of the Fund, along with ongoing efforts by New York Life Investments and Cornerstone Holdings to enhance investment returns, supported a determination to approve the Agreements. The Fund discloses more information about investment performance in the Portfolio Management Discussion and Analysis, Investment and Performance Comparison and Financial Highlights sections of this Semiannual Report and in the Fund’s prospectus.
Costs of the Services Provided, and Profits Realized, by New York Life Investments and Cornerstone Holdings
The Board considered the costs of the services provided by New York Life Investments and Cornerstone Holdings under the Agreements, and the profits realized by New York Life Investments and its affiliates, including Cornerstone Holdings, due to their relationships with the Fund. Because Cornerstone Holdings is an affiliate of New York Life Investments whose subadvisory fees are paid directly by New York Life Investments, the Board considered cost and profitability information for New York Life Investments and Cornerstone Holdings in the aggregate.
In evaluating the costs and profits of New York Life Investments and its affiliates, including Cornerstone Holdings, the Board considered, among other factors, each party’s investments in personnel, systems, equipment and other resources necessary to manage the Fund, and that New York Life Investments is responsible for paying the subadvisory fees for the Fund. The Board acknowledged that New York Life Investments and Cornerstone Holdings must be in a position to pay and retain experienced professional personnel to provide services to the Fund, and that the ability to maintain a strong financial position is important in order for New York Life Investments and Cornerstone Holdings to continue to provide high-quality services to the Fund. The Board also noted that the Fund benefits from the allocation of certain fixed costs across the MainStay Group of Funds.
In addition, the Board noted the difficulty in obtaining reliable comparative data about mutual fund managers’ profitability, since such information generally is not publicly available and may be impacted by numerous factors, including the structure of a fund manager’s organization, the types of funds it manages, the methodology used to allocate certain fixed costs to specific funds, and the manager’s capital structure and costs of capital. While recognizing the difficulty in evaluating a manager’s profitability with respect to the Fund, and noting that other profitability methodologies may also be reasonable, the Board concluded that the profitability methodology presented by New York Life Investments to the Board, which was developed by New York Life Investments in consultation with an independent consultant, was reasonable in all material respects.
In considering the costs and profitability of the Fund, the Board also considered certain fall-out benefits that may be realized by New York Life Investments and its affiliates due to their relationships with the Fund. The Board recognized, for example, the benefits to Cornerstone Holdings from legally permitted “soft-dollar” arrangements by which brokers provide research and other services to Cornerstone Holdings in exchange for commissions paid by the Fund with respect to trades on the Fund’s portfolio securities.
The Board further considered that, in addition to fees earned by New York Life Investments for managing the Fund, New York Life Investments’ affiliates also earn revenues from serving the Fund in various other capacities, including as the Fund’s transfer agent and distributor. The Board observed that information about these other revenues, and their impact on the profitability of the Fund to New York Life Investments and its affiliates, was furnished to the Board as part of the 15(c) process. The Board noted that, although it assessed the overall profitability of the Fund to New York Life Investments and its affiliates as part of the contract review process, when considering the reasonableness of the fees to be paid to New York Life Investments and its affiliates under the
| | |
| 42 | | MainStay International Opportunities Fund |
Agreements, the Board considered the profitability of New York Life Investments’ relationship with the Fund on a pre-tax basis, and without regard to distribution expenses.
After evaluating the information presented to the Board, the Board concluded, within the context of its overall determinations regarding the Agreements, that any profits realized by New York Life Investments and its affiliates, including Cornerstone Holdings, due to their relationships with the Fund supported the Board’s decision to approve the Agreements.
Extent to Which Economies of Scale May Be Realized as the Fund Grows
The Board also considered whether the Fund’s expense structure permitted economies of scale to be shared with Fund investors. The Board reviewed information from New York Life Investments showing how the Fund’s management fee schedule compared to fee schedules of other funds and accounts managed by New York Life Investments. The Board also reviewed information from Strategic Insight showing how the Fund’s management fee schedule hypothetically would compare with fees paid for similar services by peer funds at varying asset levels. While recognizing the difficulty of determining economies of scale with precision, the Board acknowledged that economies of scale may be shared with the Fund in a number of ways, including, for example, through the imposition of management fee breakpoints and by initially setting relatively lower management fees.
Based on this information, the Board concluded, within the context of its overall determinations regarding the Agreements, that the Fund’s expense structure appropriately reflects economies of scale for the benefit of Fund investors. The Board noted, however, that it would continue to evaluate the reasonableness of the Fund’s expense structure as the Fund grows over time.
Management and Subadvisory Fees and Total Ordinary Operating Expenses
The Board evaluated the reasonableness of the fees to be paid under the Agreements and the Fund’s expected total ordinary operating expenses. The Board primarily considered the reasonableness of the management fee paid by the Fund to New York Life Investments, since the fees paid to Cornerstone Holdings are paid by New York Life Investments, not the Fund.
In assessing the reasonableness of the Fund’s fees and expenses, the Board primarily considered comparative data provided by Strategic Insight on the fees and expenses charged by similar mutual funds managed by other investment advisers. In addition, the Board considered information provided by New York Life Investments and Cornerstone Holdings on fees charged to other investment advisory clients, including institutional separate accounts and other funds with similar investment objectives as the Fund. The Board particularly considered differences in the contractual management fee schedules of the retail MainStay Funds and similarly-managed MainStay VP Portfolios, taking into account New York Life Investments’ rationale for any differences in fee schedules. The Board also took into account explanations provided by New York Life Investments about the different scope of services provided to mutual funds as compared with other investment advisory
clients. Additionally, the Board considered the impact of any expense limitation arrangements on the Fund’s net management fee and expenses.
The Board noted that, outside of the Fund’s management fee and the fees charged under a share class’s Rule 12b-1 and/or shareholder services plans, a share class’s most significant “other expenses” are transfer agent fees. Transfer agent fees are charged to the Fund based on the number of shareholder accounts (a “per-account” fee) as compared with certain other fees (e.g., management fees), which are charged based on the Fund’s average net assets. The Board took into account information from New York Life Investments showing that the Fund’s transfer agent fee schedule is reasonable, including industry data showing that the per-account fees that NYLIM Service Company LLC, the Fund’s transfer agent, charges the Fund are within the range of per-account fees charged by transfer agents to other mutual funds. In addition, the Board considered NYLIM Service Company LLC’s profitability in connection with the transfer agent services it provides to the Fund.
The Board acknowledged that, because the Fund’s transfer agent fees are billed on a per-account basis, the impact of transfer agent fees on a share class’s expense ratio may be more significant in cases where the share class has a high number of accounts with limited assets (i.e., small accounts). The Board observed that transfer agent fees are a significant portion of total expenses of many Funds in the MainStay Group of Funds. The impact of transfer agent fees on the expense ratios of these MainStay Funds tend to be greater than for other open-end retail funds, because the MainStay Group of Funds generally has a significant number of small accounts relative to competitor funds. The Board acknowledged the role that the MainStay Group of Funds historically has played in serving the investment needs of New York Life Insurance Company (“New York Life”) policyholders, who often maintain smaller account balances than other fund investors. The Board discussed measures that it and New York Life Investments have taken in recent years to mitigate the effect of small accounts on the expense ratios of Fund share classes, including: (i) encouraging New York Life agents to consolidate multiple small accounts held by the same investor into one MainStay Asset Allocation Fund account; (ii) increasing investment minimums from $500 to $1,000 in 2003; (iii) introducing Investor Class shares for certain MainStay Funds in early 2008 to consolidate smaller account investors; (iv) closing small accounts with balances below $250 in Investor Class shares or $750 in all other classes of shares; (v) no longer allowing an exception with no minimum investment amount with respect to AutoInvest accounts with subsequent monthly purchases of $100; (vi) since 2007, charging an annual $20.00 small account fee on certain accounts with balances below $1,000; and (vii) modifying the approach for billing transfer agent expenses to reduce the degree of subsidization by large accounts of smaller accounts. In addition, the Board acknowledged New York Life Investments’ efforts to encourage intermediaries to consolidate small accounts in multiple Funds held by the same investor into a single Asset Allocation Fund account, if appropriate under the circumstances, in an effort to mitigate the effect of small accounts on the Funds in the MainStay Group of Funds.
After considering all of the factors outlined above, the Board concluded that the Fund’s management and subadvisory fees and total ordinary
| | | | |
| mainstayinvestments.com | | | 43 | |
Board Consideration and Approval of Management Agreement and
Subadvisory Agreement (Unaudited) (continued)
operating expenses were within a range that is competitive and, within the context of the Board’s overall conclusions regarding the Agreements, support a conclusion that these fees and expenses are reasonable.
Conclusion
On the basis of the information provided to it and its evaluation thereof, the Board, including the Independent Trustees, unanimously voted to approve the Agreements.
| | |
| 44 | | MainStay International Opportunities Fund |
Proxy Voting Policies and Procedures
and Proxy Voting Record
A description of the policies and procedures that New York Life Investments uses to vote proxies related to the 130/30 Funds’ securities is available without charge, upon request, (i) by visiting the MainStay Funds’ website at mainstayinvestments.com; and (ii) on the Securities and Exchange Commission’s (“SEC”) website at www.sec.gov.
The Fund is required to file with the SEC its proxy voting records for the Fund for the 12-month period ending June 30 on Form N-PX. The most recent Form N-PX is available free of charge upon request by calling 800-MAINSTAY (624-6782); visiting the MainStay Funds’ website at mainstayinvestments.com; or on the SEC’s website at www.sec.gov.
Shareholder Reports and Quarterly Portfolio Disclosure
The Fund is required to file its complete schedule of portfolio holdings with the SEC for its first and third fiscal quarters on Form N-Q. The Fund’s Form N-Q is available without charge, on the SEC’s website at www.sec.gov or by calling MainStay Investments at 800-MAINSTAY (624-6782). You also can obtain and review copies of Form N-Q by visiting the SEC’s Public Reference Room in Washington, DC (information on the operation of the Public Reference Room may be obtained by calling 1-800-SEC-0330).
| | | | |
| mainstayinvestments.com | | | 45 | |
This page intentionally left blank
MainStay Funds
MainStay offers a wide range of Funds for virtually any investment need. The full array of MainStay open-end offerings is listed here, with information about the manager, subadvisors, legal counsel and independent registered public accounting firms.
Equity
U.S. Equity Funds
MainStay Common Stock Fund
MainStay Cornerstone Growth Fund
MainStay Epoch U.S. All Cap Fund
MainStay Epoch U.S. Equity Yield Fund
MainStay ICAP Equity Fund
MainStay ICAP Select Equity Fund
MainStay Large Cap Growth Fund1
MainStay MAP Fund
MainStay S&P 500 Index Fund
MainStay U.S. Equity Opportunities Fund
MainStay U.S. Small Cap Fund
International/Global Equity Funds
MainStay Epoch Global Choice Fund
MainStay Epoch Global Equity Yield Fund
MainStay Epoch International Small Cap Fund
MainStay ICAP Global Fund
MainStay ICAP International Fund
MainStay International Equity Fund
MainStay International Opportunities Fund
Income
Taxable Bond Funds
MainStay Floating Rate Fund
MainStay Global High Income Fund
MainStay Government Fund
MainStay High Yield Corporate Bond Fund
MainStay High Yield Opportunities Fund
MainStay Indexed Bond Fund
MainStay Intermediate Term Bond Fund
MainStay Short Duration High Yield Fund
MainStay Short Term Bond Fund
MainStay Unconstrained Bond Fund
Municipal Bond Funds
MainStay California Tax Free Opportunities Fund2
MainStay High Yield Municipal Bond Fund
MainStay New York Tax Free Opportunities Fund3
MainStay Tax Free Bond Fund
Money Market Fund
MainStay Money Market Fund
Mixed Asset
MainStay Balanced Fund
MainStay Convertible Fund
MainStay Income Builder Fund
MainStay Marketfield Fund
Asset Allocation/Target Date
MainStay Conservative Allocation Fund
MainStay Growth Allocation Fund
MainStay Moderate Allocation Fund
MainStay Moderate Growth Allocation Fund
MainStay Retirement 2010 Fund
MainStay Retirement 2020 Fund
MainStay Retirement 2030 Fund
MainStay Retirement 2040 Fund
MainStay Retirement 2050 Fund
Manager
New York Life Investment Management LLC
New York, New York
Subadvisors
Cornerstone Capital Management Holdings LLC4
New York, New York
Cornerstone Capital Management LLC4
Bloomington, Minnesota
Epoch Investment Partners, Inc.
New York, New York
Institutional Capital LLC4
Chicago, Illinois
MacKay Shields LLC4
New York, New York
Marketfield Asset Management LLC
New York, New York
Markston International LLC
White Plains, New York
Winslow Capital Management LLC
Minneapolis, Minnesota
Legal Counsel
Dechert LLP
Independent Registered Public Accounting Firms
KPMG LLP
PricewaterhouseCoopers LLP
1. Effective January 13, 2012, the Fund was closed to new investors with certain exceptions.
2. This Fund is only registered for sale in AZ, CA, NV, OR, UT, and WA.
3. This Fund is only registered for sale in CT, DE, FL, MA, NJ, NY, and VT.
4. An affiliate of New York Life Investment Management LLC.
Not part of the Semiannual Report
For more information
800-MAINSTAY (624-6782)
mainstayinvestments.com
The MainStay Funds® are managed by New York Life Investment Management LLC and distributed through NYLIFE Distributors LLC, 169 Lackawanna Avenue, Parsippany, NJ 07054, a wholly owned subsidiary of New York Life Insurance Company. NYLIFE Distributors LLC is a Member FINRA/SIPC.
MainStay Investments® is a registered service mark and name under which New York Life Investment Management LLC does business. MainStay Investments, an indirect subsidiary of New York Life Insurance Company, New York, NY 10010, provides investment advisory products and services.
This report may be distributed only when preceded or accompanied by a current Fund prospectus.
©2013 NYLIFE Distributors LLC. All rights reserved.
| | | | | | | | |
| Not FDIC/NCUA Insured | | Not a Deposit | | May Lose Value | | No Bank Guarantee | | Not Insured by Any Government Agency |
| | |
| NYLIM-30045 MS175-13 | | MSIR10-06/13 NL0C4 |
MainStay Balanced Fund
Message from the President and Semiannual Report
Unaudited | April 30, 2013


This page intentionally left blank
Message from the President
The U.S. stock market advanced during the six months ended April 30, 2013, generally providing double-digit returns at all capitalization levels. Value stocks tended to outpace growth stocks among large- and mid-capitalization companies, while growth stocks tended to outpace value stocks among smaller companies.
The market’s advance, however, was far from uniform. Stocks declined in early November, both before and immediately after the U.S. presidential election. Following a sharp recovery, stocks climbed until mid-December, when a Congressional stalemate on the fiscal cliff led to a brief decline. Another dip occurred in late February as investors speculated that the Federal Open Market Committee (FOMC) might stop purchasing mortgage-backed securities sooner than expected. Stocks also dipped in mid-April, as consumer sentiment dropped after the Boston marathon bombing. Despite these setbacks, U.S. stocks continued to trend upward during the six-month reporting period.
International stock markets also advanced, with several regional differences. Accommodative action by the Bank of Japan helped lower the yen and lift Japanese stocks to their highest levels since 2008. In Europe, stocks did well until early February, bolstered by the promise of support for the euro. As the year progressed, however, economic contraction, rising unemployment and systematic banking concerns took a toll on investor enthusiasm. In China, manufacturing slowed as the nation sought to balance growth and inflation risks. On the Korean peninsula, tensions rose as North Korea continued to threaten its neighbors, which added an undercurrent of caution to the market.
During the six months ended April 30, 2013, the FOMC kept the federal funds rate in a range close to zero. The FOMC also continued its direct purchases of mortgage-backed securities and longer-term U.S. government securities. With short-term interest rates likely to remain at low levels, many bond investors pursued higher yields by lengthening maturities and assuming greater risk. As a result, bonds with higher risk profiles tended
to outperform higher-quality investment-grade bonds and U.S. Treasury securities. Cash and cash equivalents essentially returned zero.
With wide variations in the performance of various asset classes, some investors might be tempted to chase higher returns by shifting back and forth between stocks and bonds. Since no one can predict where the market will move next, however, we encourage investors to select an appropriate mix of investments for their risk tolerance and time horizon and to stick with that mix, making only minor adjustments over time.
At MainStay Funds, our portfolio managers use a similar approach. Careful security selection and thoughtful sell disciplines help them pursue the investment objectives of their respective Funds. Using the principal investment strategies outlined in the Prospectus, they focus primarily on providing long-term investment potential for our shareholders.
Has this approach proved successful? In its most recent rankings, Barron’s listed MainStay Funds as the #1 fund family over the past 10 years. We were also the only mutual fund family that has appeared in Barron’s top six for the past five consecutive years.
The pages that follow provide additional insight into the specific market events, investment decisions and securities that shaped your MainStay Fund(s) during the six months ended April 30, 2013. We encourage you to read the semiannual report(s) carefully and to evaluate your results with your long-term financial goals in mind.
Sincerely,

Stephen P. Fisher
President
The opinions expressed are as of the date of this report and are subject to change. There is no guarantee that any forecast made will come to pass. This material does not constitute investment advice and is not intended as an endorsement of any specific investment.
To qualify for the Lipper/Barron’s Fund Survey, a fund family must have at least three funds in Lipper’s general U.S.-stock category, one in world equity (which combines global and international funds), one mixed-equity fund (which holds stocks and bonds), two taxable-bond funds, and one tax-exempt fund. Fund loads and 12b-1 fees aren’t included in the calculation of returns because the aim is to measure the manager’s skill. Each fund’s return is measured against all funds in its Lipper category, resulting in a percentile ranking which is then weighted by asset size relative to the fund family’s other assets in its general classifications. Finally, the score is multiplied by the general classification weightings as determined by the entire Lipper universe of funds.
Source: Barron’s, 2/9/13. Overall, MainStay Funds ranked number 56 for the one-year period, 20 for the five-year period and one for the 10-year period ended December 31, 2012, out of 62, 53 and 46 fund families, respectively. MainStay ranked number three for the 10-year period in 2009, 2010 and 2011 from among 48, 46 and 45 fund families, respectively. MainStay ranked number six from among 48 fund families for the 10-year period in 2008. Past performance is no guarantee of future results, which will vary. For the most recent MainStay Funds performance, please visit our website at mainstayinvestments.com. All mutual funds are subject to market risk and will fluctuate in value.
Not part of the Semiannual Report
Table of Contents
Investors should refer to the Fund’s Summary Prospectus and/or Prospectus and consider the Fund’s investment objectives, strategies, risks, charges and expenses carefully before investing. The Summary Prospectus and/or Prospectus contain this and other information about the Fund. You may obtain copies of the Fund’s Summary Prospectus, Prospectus and Statement of Additional Information free of charge, upon request, by calling toll-free 800-MAINSTAY (624-6782), by writing to NYLIFE Distributors LLC, Attn: MainStay Marketing Department, 169 Lackawanna Avenue, Parsippany, New Jersey 07054 or by sending an e-mail to MainStayShareholderServices@nylim.com. These documents are also available via the MainStay Funds’ website at mainstayinvestments.com/documents. Please read the Summary Prospectus and/or Prospectus carefully before investing.
Investment and Performance Comparison1 (Unaudited)
Performance data quoted represents past performance. Past performance is no guarantee of future results. Because of market volatility, current performance may be lower or higher than the figures shown. Investment return and principal value will fluctuate, and as a result, when shares are redeemed, they may be worth more or less than their original cost. The graph below depicts the historical performance of Class I shares of the Fund. Performance will vary from class to class based on differences in class-specific expenses and sales charges. For performance information current to the most recent month-end, please call 800-MAINSTAY (624-6782) or visit mainstayinvestments.com.
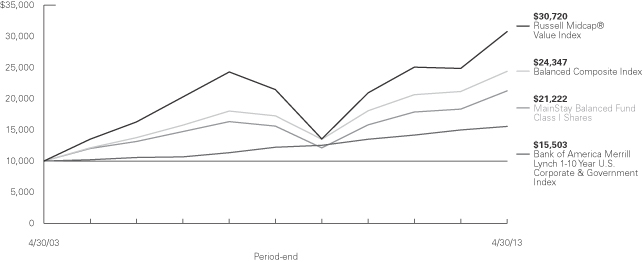
Average Annual Total Returns for the Period Ended April 30, 2013
| | | | | | | | | | | | | | | | | | | | | | | | |
| Class | | Sales Charge | | | | Six Months | | | One Year | | | Five Years | | | Ten Years | | | Gross
Expense
Ratio2 | |
| Investor Class Shares3 | | Maximum 5.5% Initial Sales Charge | | With sales charges Excluding sales charges | |
| 6.35
12.54 | %
| |
| 9.21
15.57 | %
| |
| 4.69
5.88 | %
| |
| 6.75
7.36 | %
| |
| 1.40
1.40 | %
|
| Class A Shares4 | | Maximum 5.5% Initial Sales Charge | | With sales charges Excluding sales charges | |
| 6.42
12.62 |
| |
| 9.39
15.76 |
| |
| 4.88
6.08 |
| |
| 6.85
7.45 |
| |
| 1.21
1.21 |
|
Class B Shares4 | | Maximum 5% CDSC | | With sales charges | | | 7.09 | | | | 9.66 | | | | 4.76 | | | | 6.56 | | | | 2.15 | |
| | | if Redeemed Within the First Six Years of Purchase | | Excluding sales charges | | | 12.09 | | | | 14.66 | | | | 5.09 | | | | 6.56 | | | | 2.15 | |
| Class C Shares5 | | Maximum 1% CDSC | | With sales charges | | | 11.09 | | | | 13.71 | | | | 5.09 | | | | 6.56 | | | | 2.15 | |
| | | if Redeemed Within One Year of Purchase | | Excluding sales charges | | | 12.09 | | | | 14.71 | | | | 5.09 | | | | 6.56 | | | | 2.15 | |
| Class I Shares | | No Sales Charge | | | | | 12.77 | | | | 16.05 | | | | 6.36 | | | | 7.81 | | | | 0.96 | |
| Class R1 Shares4 | | No Sales Charge | | | | | 12.69 | | | | 15.96 | | | | 6.26 | | | | 7.70 | | | | 1.06 | |
| Class R2 Shares4 | | No Sales Charge | | | | | 12.53 | | | | 15.65 | | | | 5.99 | | | | 7.43 | | | | 1.31 | |
| Class R3 Shares6 | | No Sales Charge | | | | | 12.43 | | | | 15.37 | | | | 5.74 | | | | 7.17 | | | | 1.56 | |
| 1. | The performance table and graph do not reflect the deduction of taxes that a shareholder would pay on distributions or Fund share redemptions. Total returns reflect maximum applicable sales charges as indicated in the table above, changes in share price, and reinvestment of dividend and capital gain distributions. The graph assumes the initial investment amount shown above and reflects the deduction of all sales charges that would have applied for the period of investment. Performance figures reflect certain fee waivers and/or expense limitations, without which total returns may have been lower. For more information on share classes and current fee waivers and/or expense limitations, please refer to the notes to the financial statements. |
| 2. | The gross expense ratios presented reflect the Fund’s “Total Annual Fund Operating Expenses” from the most recent Prospectus and may differ from other expense ratios disclosed in this report. |
| 3. | Performance figures for Investor Class shares, first offered on February 28, 2008, include the historical performance of Class A shares through February 27, 2008, adjusted for differences in certain expenses and fees. |
| | Unadjusted, the performance shown for Investor Class shares would likely have been different. |
| 4. | Performance figures for Class A, B, R1 and R2 shares, first offered on January 2, 2004, include the historical performance of Class I shares through January 1, 2004, adjusted for differences in certain expenses and fees. Unadjusted, the performance shown for Class A, B, R1 and R2 shares would likely have been different. |
| 5. | Performance figures for Class C shares, first offered on January 2, 2004, include the historical performance of L Class shares (which were redesignated as Class C shares on January 2, 2004) through January 1, 2004, and the historical performance of Class I shares through December 29, 2002, adjusted for differences in certain expenses and fees. Unadjusted, the performance shown for Class C shares would likely have been different. |
| 6. | Performance figures for Class R3 shares, first offered on April 28, 2006, include the historical performance of Class I shares through April 27, 2006, |
The footnotes on the next page are an integral part of the table and graph and should be carefully read in conjunction with them.
| | | | |
| mainstayinvestments.com | | | 5 | |
| | | | | | | | | | | | | | | | |
| Benchmark Performance | | Six
Months | | | One
Year | | | Five
Years | | | Ten
Years | |
Russell Midcap® Value Index7 | | | 19.89 | % | | | 23.66 | % | | | 7.49 | % | | | 11.88 | % |
Balanced Composite Index8 | | | 12.15 | | | | 15.40 | | | | 7.16 | | | | 9.31 | |
Bank of America Merrill Lynch 1-10 Year U.S. Corporate & Government Index9 | | | 1.21 | | | | 3.54 | | | | 4.95 | | | | 4.48 | |
Average Lipper Mixed-Asset Target Allocation Growth Fund10 | | | 10.39 | | | | 12.27 | | | | 4.06 | | | | 6.97 | |
| | adjusted for differences in certain expenses and fees. Unadjusted, the performance shown for Class R3 shares would likely have been different. |
| 7. | The Russell Midcap® Value Index measures the performance of the mid-cap value segment of the U.S. equity universe. It includes those Russell Midcap® Index companies with lower price-to-book ratios and lower forecasted growth values. The Russell Midcap® Value Index is the Fund’s broad-based securities market index for comparison purposes. Total returns assume reinvestment of all dividends and capital gains. An investment cannot be made directly in an index. |
| 8. | The Balanced Composite Index consists of the Russell Midcap® Value Index and the Bank of America Merrill Lynch 1-10 Year U.S. Corporate & Government Index weighted 60%/40%, respectively. The Balanced Composite Index is the Fund’s secondary benchmark. Total returns assume reinvestment of all income and capital gains. An investment cannot be made directly in an index. |
| 9. | The Bank of America Merrill Lynch 1-10 Year U.S. Corporate & Government Index is a market capitalization-weighted index including U.S. government and fixed coupon domestic investment grade corporate bonds. The Fund has selected the Bank of America Merrill Lynch 1-10 Year U.S. Corporate & Government Index as an additional benchmark. Total returns assume reinvestment of all income and capital gains. An investment cannot be made directly in an index. |
| 10. | The average Lipper mixed-asset target allocation growth fund is representative of funds that, by portfolio practice, maintain a mix of between 60%-80% equity securities, with the remainder invested in bonds, cash, and cash equivalents. This benchmark is a product of Lipper Inc. Lipper Inc. is an independent monitor of fund performance. Results are based on average total returns of similar funds with all dividend and capital gain distributions reinvested. |
The footnotes on the preceding page are an integral part of the table and graph and should be carefully read in conjunction with them.
Cost in Dollars of a $1,000 Investment in MainStay Balanced Fund (Unaudited)
The example below is intended to describe the fees and expenses borne by shareholders during the six-month period from November 1, 2012, to April 30, 2013, and the impact of those costs on your investment.
Example
As a shareholder of the Fund, you incur two types of costs: (1) transaction costs, including exchange fees and sales charges (loads) on purchases (as applicable), and (2) ongoing costs, including management fees, distribution and/or service (12b-1) fees, and other Fund expenses (as applicable). This example is intended to help you understand your ongoing costs (in dollars) of investing in the Fund and to compare these costs with the ongoing costs of investing in other mutual funds. The example is based on an investment of $1,000 made at the beginning of the six-month period and held for the entire period from November 1, 2012, to April 30, 2013.
This example illustrates your Fund’s ongoing costs in two ways:
Actual Expenses
The second and third data columns in the table below provide information about actual account values and actual expenses. You may use the information in these columns, together with the amount you invested, to estimate the expenses that you paid during the six months ended April 30, 2013. Simply divide your account value by $1,000 (for example, an $8,600 account value divided by $1,000 = 8.6), then
multiply the result by the number under the heading entitled “Expenses Paid During Period” to estimate the expenses you paid on your account during this period.
Hypothetical Example for Comparison Purposes
The fourth and fifth data columns in the table below provide information about hypothetical account values and hypothetical expenses based on the Fund’s actual expense ratio and an assumed rate of return of 5% per year before expenses, which is not the Fund’s actual return. The hypothetical account values and expenses may not be used to estimate the actual ending account balances or expenses you paid for the six-month period shown. You may use this information to compare the ongoing costs of investing in the Fund with the ongoing costs of investing in other Funds. To do so, compare this 5% hypothetical example with the 5% hypothetical examples that appear in the shareholder reports of the other Funds.
Please note that the expenses shown in the table are meant to highlight your ongoing costs only and do not reflect any transactional costs, such as exchange fees or sales charges (loads). Therefore, the fourth and fifth data columns of the table are useful in comparing ongoing costs only and will not help you determine the relative total costs of owning different funds. In addition, if these transactional costs were included, your costs would have been higher.
| | | | | | | | | | | | | | | | | | | | |
| | | | | | | | | | | | | | | | |
| Share Class | | Beginning
Account
Value
11/1/12 | | | Ending Account
Value (Based
on Actual
Returns and
Expenses)
4/30/13 | | | Expenses
Paid
During
Period1 | | | Ending Account
Value (Based
on Hypothetical
5% Annualized
Return and
Actual Expenses)
4/30/13 | | | Expenses
Paid
During
Period1 | |
| | | | | |
| Investor Class Shares | | $ | 1,000.00 | | | $ | 1,125.40 | | | $ | 7.17 | | | $ | 1,018.10 | | | $ | 6.81 | |
| | | | | |
| Class A Shares | | $ | 1,000.00 | | | $ | 1,126.20 | | | $ | 6.17 | | | $ | 1,019.00 | | | $ | 5.86 | |
| | | | | |
| Class B Shares | | $ | 1,000.00 | | | $ | 1,120.90 | | | $ | 11.10 | | | $ | 1,014.30 | | | $ | 10.54 | |
| | | | | |
| Class C Shares | | $ | 1,000.00 | | | $ | 1,120.90 | | | $ | 11.10 | | | $ | 1,014.30 | | | $ | 10.54 | |
| | | | | |
| Class I Shares | | $ | 1,000.00 | | | $ | 1,127.70 | | | $ | 4.85 | | | $ | 1,020.20 | | | $ | 4.61 | |
| | | | | |
| Class R1 Shares | | $ | 1,000.00 | | | $ | 1,126.90 | | | $ | 5.38 | | | $ | 1,019.70 | | | $ | 5.11 | |
| | | | | |
| Class R2 Shares | | $ | 1,000.00 | | | $ | 1,125.30 | | | $ | 6.69 | | | $ | 1,018.50 | | | $ | 6.36 | |
| | | | | |
| Class R3 Shares | | $ | 1,000.00 | | | $ | 1,124.30 | | | $ | 8.01 | | | $ | 1,017.30 | | | $ | 7.60 | |
| 1. | Expenses are equal to the Fund’s annualized expense ratio of each class (1.36% for Investor Class, 1.17% for Class A, 2.11% for Class B and Class C, 0.92% for Class I, 1.02% for Class R1, 1.27% for Class R2 and 1.52% for Class R3) multiplied by the average account value over the period, divided by 365 and multiplied by 181 (to reflect the six-month period). The table above represents the actual expenses incurred during the six-month period. |
| | | | |
| mainstayinvestments.com | | | 7 | |
Portfolio Composition as of April 30, 2013 (Unaudited)
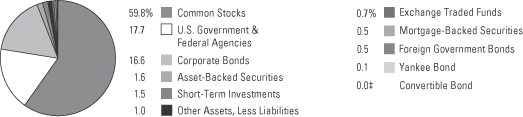
See Portfolio of Investments beginning on page 12 for specific holdings within these categories.
| ‡ | Less than one-tenth of a percent. |
Top Ten Holdings or Issuers Held as of April 30, 2013 (excluding short-term investments)
| 1. | United States Treasury Notes, 0.25%–2.25%, due 1/31/15–11/15/22 |
| 2. | Federal National Mortgage Association, 0.375%–2.75%, due 3/13/14–12/28/17 |
| 3. | Federal Home Loan Mortgage Corporation, 0.50%–1.75%, due 11/25/14–5/30/19 |
| 7. | Goldman Sachs Group, Inc. (The) |
| 8. | Marathon Petroleum Corp. |
Portfolio Management Discussion and Analysis (Unaudited)
Questions answered by portfolio managers Jae S. Yoon, CFA, Thomas J. Girard, Donald F. Serek, CFA, and George S. Cherpelis of New York Life Investments,1 the Fund’s Manager, and Andrew Ver Planck, CFA, of Cornerstone Capital Management Holdings LLC, the Fund’s Subadvisor.
How did MainStay Balanced Fund perform relative to its peers and its benchmark during the six months ended April 30, 2013?
Excluding all sales charges, MainStay Balanced Fund returned 12.54% for Investor Class shares, 12.62% for Class A shares and 12.09% for Class B shares and Class C shares for the six months ended April 30, 2013. Over the same period, Class I shares returned 12.77%, Class R1 shares returned 12.69%, Class R2 shares returned 12.53% and Class R3 shares returned 12.43%. All share classes outperformed the 10.39% return of the average Lipper2 mixed-asset target allocation growth fund for the six months ended April 30, 2013. All share classes underperformed the 19.89% return of the Russell Midcap® Value Index3 for the same period. The Russell Midcap® Value Index is the Fund’s broad-based securities-market index. All share classes outperformed the 1.21% return of the Bank of America Merrill Lynch 1–10 Year U.S. Corporate & Government Index.4 Investor Class, Class A, Class I, Class R1, Class R2 and Class R3 shares outperformed—and Class B and Class C shares underperformed—the 12.15% return of the Balanced Composite Index.5 The Bank of America Merrill Lynch 1–10 Year U.S. Corporate & Government Index is an additional benchmark for the Fund and the Balanced Composite Index is a secondary benchmark for the Fund. See page 5 for Fund returns with applicable sales charges.
Were there any changes to the Fund during the reporting period?
Effective January 25, 2013, Madison Square Investors LLC, the Subadvisor to the Fund, changed its name to Cornerstone Capital Management Holdings LLC.
What factors affected the Fund’s relative performance during the reporting period?
The Fund invests in a mix of stocks and bonds, while the Russell Midcap® Value Index consists entirely of mid-cap value stocks. The Fund has a sizable allocation to bonds, which underperformed the Russell Midcap® Value Index during the reporting period. It is not surprising, therefore, that all share classes of the Fund trailed the Index.
The equity portion of the Fund, however, outperformed the Russell Midcap® Value Index during the reporting period, driven primarily by strong performance of the underlying quantitative stock-selection model. Valuation factors based on cash flow and on revenue contributed positively to the Fund’s performance relative to the Russell Midcap® Value Index. While the model for
the equity portion of the Fund was successful in identifying both winners and losers, it was especially effective in predicting stocks that would subsequently outperform the Index. Since the model’s sell recommendations are constrained because shorting is not allowed, that the model’s high-conviction buy recommendations proved successful was important for the relative performance of the equity portion of the Fund.
In the fixed-income portion of the Fund, we maintained overweight positions relative to the Bank of America Merrill Lynch 1–10 Year U.S. Corporate & Government Index in spread assets, with corporate bonds as the most substantially overweight sector. The Fund held modest positions in asset-backed securities and commercial mortgage-backed securities during the reporting period. These sectors performed well, resulting in positive excess performance relative to this Index. The Fund’s positioning in mortgage-backed securities had a negligible impact on performance during the reporting period. The Fund’s underweight position in U.S. Treasury securities relative to the Bank of America Merrill Lynch 1–10 Year U.S. Corporate & Government Index detracted from performance, as U.S. Treasury yields moved lower, generating positive returns.
During the reporting period, which equity sectors were the strongest positive contributors to the Fund’s relative performance and which equity sectors were particularly weak?
The equity sectors that provided the strongest positive contributions to the Fund’s relative performance were health care, energy and information technology. (Contributions take weightings and total returns into account.) In health care, our model correctly identified several hospital management companies whose share prices appreciated. Utilization rates at these companies went up as the economy and legislative environment improved. Within energy, the Fund benefited from avoiding coal producers such as Peabody Energy and Consol Energy, and oil and gas drillers such as Chesapeake Energy, which performed poorly. Instead, the model favored refiners that tend to be less sensitive to falling oil and gas prices. The Fund also made some profitable stock selections in information technology, where investments in turnaround companies such as Hewlett-Packard and Dell were rewarded.
In the equity portion of the Fund, major detractors from relative performance included the telecommunication services, consumer discretionary and industrials sectors. In telecommunication services, stock selection hurt relative results. Specifically, the Fund did not invest in Sprint Nextel, whose share price appreciated
| 1. | “New York Life Investments” is a service mark used by New York Life Investment Management LLC. |
| 2. | See footnote on page 6 for more information on Lipper Inc. |
| 3. | See footnote on page 6 for more information on the Russell Midcap® Value Index. |
| 4. | See footnote on page 6 for more information on the Bank of America Merrill Lynch 1–10 Year U.S. Corporate & Government Index. |
| 5. | See footnote on page 6 for more information on the Balanced Composite Index. |
| | | | |
| mainstayinvestments.com | | | 9 | |
following takeover bids by Dish Network and Softbank. Some unfortunate stock selections in the consumer discretionary sector, especially in the specialty retail industry, also detracted from the Fund’s relative performance. In industrials, an overweight position in office supply company Pitney Bowes hurt performance relative to the Russell Midcap® Value Index.
During the reporting period, which individual stocks made the strongest positive contributions to absolute performance in the equity portion of the Fund and which stocks detracted the most?
In the equity portion of the Fund, the strongest individual contributors to absolute performance were energy refiners Marathon Petroleum and Valero Energy and semiconductor devices manufacturer Micron Technology. The Fund held an overweight position in each, and each had stellar share-price performance during the reporting period. Marathon Petroleum and Valero Energy participated in the refiner-led rally that started in 2012, each returning more than 40% during the reporting period. Micron Technology delivered strong financial results that exceeded analysts’ estimates, citing increased shipments and margins.
The stocks that detracted the most from absolute performance in the equity portion of the Fund included metals & mining companies Newmont Mining and Freeport-McMoRan Copper & Gold and oilfield equipment manufacturer National Oilwell Varco. The equity portion of the Fund held overweight positions in all three companies. Newmont Mining is the largest U.S. gold producer, and Freeport-McMoRan Copper & Gold mainly mines copper. Both stocks were hurt by falling metals prices and widespread concerns about global economic growth. On April 15, 2013, gold futures tumbled more than 9% to settle at $1,361 per ounce in New York, the biggest drop since 1980. National Oilwell Varco is the biggest maker of oilfield equipment in the United States. The company’s profit margins and earnings were affected by weakness in the North American land market.
Did the equity portion of the Fund make any significant purchases or sales during the reporting period?
The equity portion of the Fund purchased shares of two health care real estate investment trusts (REITs)—HCP and Health Care REIT. Both REITs invest in health care-related real estate properties, including senior housing, nursing homes and hospitals. The Fund’s quantitative model was initially negative on both stocks, based on valuation and management signals, but the Fund brought them to a neutral position relative to the Russell Midcap® Value Index when the model’s momentum readings detected improving trends in the commercial real estate market.
In the equity portion of the Fund, we sold positions in fertilizer company CF Industries and in oil and gas driller Diamond Offshore Drilling. CF Industries delivered strong fourth-quarter
financial results in February 2013, but its share price was under pressure in 2013 because of investor concerns about the company’s capital allocation policy and a low growth outlook for the chemicals industry in general. The model regarded the stock as inexpensive from a valuation perspective, but the return expectation was reduced because of a poor credit-quality score and deteriorating price trend. Diamond Offshore Drilling is the largest U.S. offshore rig contractor. In February 2013, the company reported better-than-expected fourth-quarter earnings, but it also forecast more downtime for its vessels in 2013 because of maintenance and other work. Guided by its model, the Fund began selling the position in February 2013, completely selling out by March on worsening sentiment and price trends.
How did the Fund’s equity sector weightings change during the reporting period?
The Fund’s equity weightings increased in the consumer staples, industrials and health care sectors. In consumer staples, the Fund moved from an overweight position to a more significantly overweight position, in part by accumulating positions in the food products and food retailers industries. In industrials, the Fund moved from an underweight position to an overweight position through purchases in road & rail, machinery and airline stocks. The Fund’s exposure to health care increased because of share purchases among HMOs and health care equipment companies.
During the reporting period, the equity portion of the Fund reduced its weightings in the financials, telecommunication services and materials sectors. In financials, the Fund moved from an underweight position relative to the Russell Midcap® Value Index to one that was more significantly underweight. In telecommunication services, the Fund moved from an overweight position to one that was relatively neutral to the Index. In materials, an underweight position relative to the Russell Midcap® Value Index became more substantially underweight during the reporting period.
How was the equity portion of the Fund positioned at the end of the reporting period?
As of April 30, 2013, the equity portion of the Fund’s most significantly overweight positions relative to the Russell Midcap® Value Index were in the consumer staples, health care and consumer discretionary sectors. As of the same date, the equity portion of the Fund was most significantly underweight relative to the Index in the financials and utilities sectors.
What was the duration6 strategy of the fixed-income portion of the Fund during the reporting period?
The duration of the fixed-income portion of the Fund varied during the reporting period but remained close to the duration of
| | |
| 10 | | MainStay Balanced Fund |
the Bank of America Merrill Lynch 1–10 Year U.S. Corporate & Government Index. Overall, the Fund’s duration positioning detracted modestly from performance, as rates moved lower during the reporting period and the fixed income portion of the Fund was underweight in the U.S. Treasury sector relative to the Bank of America Merrill Lynch 1–10 Year U.S. Corporate & Government Index.
What specific factors, risks or market forces prompted significant decisions for the fixed-income portion of the Fund during the reporting period?
There were no significant sector allocation changes within the fixed-income portion of the Fund during the reporting period. The Fund maintained its core overweight position relative to the Bank of America Merrill Lynch 1–10 Year U.S. Corporate & Government Index in investment-grade corporate bonds and also maintained modest allocations to asset-backed securities and commercial mortgage-backed securities. We made slight modifications among mortgage-backed securities during the reporting period on the basis of valuations. For example, rich valuations among mortgage-backed securities led us to reduce the Fund’s position in the sector about midway through the reporting period. Toward the latter part of the reporting period, we added to the Fund’s mortgage-backed securities positions when we believed that lower valuations would offer value.
During the reporting period, which fixed-income market segments were the strongest contributors to the Fund’s performance and which market segments were particularly weak?
An overweight position in investment-grade corporate bonds made the strongest positive contribution to the performance of the fixed-income portion of the Fund. An underweight position in U.S. Treasury securities detracted from performance, as U.S. Treasury yields moved lower during the reporting period.
Did the fixed-income portion of the Fund make any significant purchases or sales during the reporting period?
The fixed-income portion of the Fund did not make any significant purchases or sales during the reporting period, as there were no major asset-allocation shifts within the Fund. Adjustments within the mortgage-backed securities sector were modest.
How did sector weightings change in the fixed-income portion of the Fund during the reporting period?
Overall, the fixed-income portion of the Fund did not materially modify sector weightings during the reporting period. Within the investment-grade corporate bond sector, the fixed-income portion of the Fund maintained overweight allocations to the financials, industrials and utilities subsectors throughout the reporting period.
How was the fixed-income portion of the Fund positioned at the end of the reporting period?
As of April 30, 2013, the fixed-income portion of the Fund held overweight allocations relative to the Bank of America Merrill Lynch 1-10 Year U.S. Corporate & Government Index in spread7 assets, or non-U.S. Treasury securities. The fixed-income portion of the Fund had its largest overweight allocation to the corporate bond sector.
As of the same date, the fixed-income portion of the Fund held an underweight position relative to the Bank of America Merrill Lynch 1–10 Year U.S. Corporate & Government Index in U.S. Treasury securities. As of April 30, 2013, the duration of the fixed-income portion of the Fund was relatively neutral to that of the Index.
| 6. | Duration is a measure of the price sensitivity of a fixed-income investment to changes in interest rates. Duration is expressed as a number of years and is considered to be a more accurate sensitivity gauge than average maturity. |
| 7. | The terms “spread” and “yield spread” may refer to the difference in yield between a security or type of security and comparable U.S. Treasury issues. The term may also refer to the difference in yield between two specific securities or types of securities at a given time. |
The opinions expressed are those of the portfolio managers as of the date of this report and are subject to change. There is no guarantee that any forecast made will come to pass. This material does not constitute investment advice and is not intended as an endorsement of any specific investment.
| | | | |
| mainstayinvestments.com | | | 11 | |
Portfolio of Investments April 30, 2013 (Unaudited)
| | | | | | | | |
| | | Principal
Amount | | | Value | |
| | | | | | | | |
Long-Term Bonds 37.0%† Asset-Backed Securities 1.6% | |
Automobile 0.6% | |
Ally Auto Receivables Trust
Series 2012-1, Class A3
0.93%, due 2/16/16 | | $ | 300,000 | | | $ | 301,327 | |
Ford Credit Auto Owner Trust
Series 2012-A, Class A3
0.84%, due 8/15/16 | | | 500,000 | | | | 501,882 | |
Huntington Auto Trust
Series 2012-2, Class A3
0.51%, due 4/17/17 | | | 700,000 | | | | 700,858 | |
Hyundai Auto Receivables Trust
Series 2012-A, Class A3
0.72%, due 3/15/16 | | | 469,000 | | | | 470,099 | |
Mercedes-Benz Auto Receivables Trust
Series 2012-1, Class A3
0.47%, due 10/17/16 | | | 900,000 | | | | 900,423 | |
USAA Auto Owner Trust
Series 2012-1, Class A3
0.43%, due 8/15/16 | | | 400,000 | | | | 399,579 | |
Volkswagen Auto Loan Enhanced Trust
Series 2012-1, Class A3
0.85%, due 8/22/16 | | | 500,000 | | | | 502,642 | |
| | | | | | | | |
| | | | | | | 3,776,810 | |
| | | | | | | | |
Credit Cards 0.0%‡ | |
Discover Card Master Trust
Series 2012-A1, Class A1
0.81%, due 8/15/17 | | | 300,000 | | | | 301,886 | |
| | | | | | | | |
|
Other ABS 1.0% | |
Ballyrock CDO, Ltd.
Series 2013-1A, Class A
1.458%, due 5/20/25 (a)(b)(c) | | | 1,000,000 | | | | 997,000 | |
Carlyle Global Market Strategies
Series 2013-2A, Class A1
1.464%, due 4/18/25 (a)(b)(c) | | | 500,000 | | | | 499,975 | |
CNH Equipment Trust
Series 2012-C, Class A3
0.57%, due 12/15/17 | | | 500,000 | | | | 500,907 | |
Dryden XXII Senior Loan Fund
Series 2013-26A, Class A
1.425%, due 7/15/25 (a)(b)(c) | | | 820,000 | | | | 817,893 | |
John Deere Owner Trust | | | | | | | | |
Series 2012-B, Class A3 0.53%, due 7/15/16 | | | 500,000 | | | | 500,456 | |
Series 2012-A, Class A3 0.75%, due 3/15/16 | | | 600,000 | | | | 601,809 | |
| | | | | | | | |
| | | Principal
Amount | | | Value | |
| | | | | | | | |
Other ABS (continued) | |
Nomad CLO, Ltd.
Series 2013-1A, Class A1
1.48%, due 1/15/25 (a)(b)(c) | | $ | 800,000 | | | $ | 801,880 | |
Race Point CLO, Ltd.
Series 2013-8A, Class A
1.539%, due 2/20/25 (a)(b)(c) | | | 780,000 | | | | 783,643 | |
Sheridan Square CLO, Ltd.
Series 2013-1A, Class A2
1.447%, due 4/15/25 (a)(b)(c) | | | 800,000 | | | | 800,264 | |
| | | | | | | | |
| | | | | | | 6,303,827 | |
| | | | | | | | |
Total Asset-Backed Securities
(Cost $10,368,647) | | | | | | | 10,382,523 | |
| | | | | | | | |
|
| Convertible Bond 0.0%‡ | |
Internet 0.0%‡ | |
At Home Corp.
4.75%, due 12/31/49 (c)(d)(e)(k) | | | 177,810 | | | | 18 | |
| | | | | | | | |
Total Convertible Bond
(Cost $13,325) | | | | | | | 18 | |
| | | | | | | | |
|
| Corporate Bonds 16.6% | |
Aerospace & Defense 0.4% | |
BAE Systems PLC
3.50%, due 10/11/16 (a) | | | 350,000 | | | | 369,656 | |
General Dynamics Corp. | | | | | | | | |
2.25%, due 7/15/16 | | | 200,000 | | | | 209,675 | |
2.25%, due 11/15/22 | | | 700,000 | | | | 686,694 | |
Northrop Grumman Corp.
1.85%, due 11/15/15 | | | 250,000 | | | | 255,549 | |
United Technologies Corp.
1.80%, due 6/1/17 | | | 950,000 | | | | 981,139 | |
| | | | | | | | |
| | | | | | | 2,502,713 | |
| | | | | | | | |
Auto Manufacturers 0.1% | |
Daimler Finance North America LLC
3.875%, due 9/15/21 (a) | | | 500,000 | | | | 547,843 | |
Volkswagen International Finance N.V.
1.15%, due 11/20/15 (a) | | | 250,000 | | | | 251,827 | |
| | | | | | | | |
| | | | | | | 799,670 | |
| | | | | | | | |
Banks 4.8% | |
Abbey National Treasury Services PLC
4.00%, due 4/27/16 | | | 850,000 | | | | 913,112 | |
American Express Bank FSB
6.00%, due 9/13/17 | | | 625,000 | | | | 747,437 | |
| † | Percentages indicated are based on Fund net assets. |
| ¨ | | Among the Fund’s 10 largest holdings or issuers held, as of April 30, 2013, excluding short-term investments. May be subject to change daily. |
| | | | |
| 12 | | MainStay Balanced Fund | | The notes to the financial statements are an integral part of,
and should be read in conjunction with, the financial statements. |
| | | | | | | | |
| | | Principal
Amount | | | Value | |
| | | | | | | | |
| Corporate Bonds (continued) | |
Banks (continued) | |
¨Bank of America Corp. | | | | | | | | |
2.00%, due 1/11/18 | | $ | 1,275,000 | | | $ | 1,279,083 | |
3.30%, due 1/11/23 | | | 1,000,000 | | | | 1,012,829 | |
5.65%, due 5/1/18 | | | 925,000 | | | | 1,073,829 | |
Bank of Montreal
1.95%, due 1/30/18 (a) | | | 800,000 | | | | 834,720 | |
BB&T Corp.
1.45%, due 1/12/18 | | | 300,000 | | | | 301,226 | |
BNP Paribas S.A.
3.25%, due 3/3/23 | | | 750,000 | | | | 755,963 | |
Capital One Financial Corp. | | | | | | | | |
1.00%, due 11/6/15 | | | 775,000 | | | | 772,877 | |
2.15%, due 3/23/15 | | | 425,000 | | | | 434,032 | |
¨Citigroup, Inc. | | | | | | | | |
3.375%, due 3/1/23 | | | 100,000 | | | | 103,556 | |
4.587%, due 12/15/15 | | | 490,000 | | | | 533,934 | |
5.375%, due 8/9/20 | | | 700,000 | | | | 834,737 | |
5.50%, due 10/15/14 | | | 1,225,000 | | | | 1,304,868 | |
6.00%, due 8/15/17 | | | 400,000 | | | | 470,789 | |
6.01%, due 1/15/15 | | | 100,000 | | | | 108,333 | |
Commonwealth Bank of Australia
1.95%, due 3/16/15 | | | 400,000 | | | | 409,720 | |
Cooperatieve Centrale Raiffeisen-Boerenleenbank B.A. | | | | | | | | |
3.375%, due 1/19/17 | | | 250,000 | | | | 269,225 | |
3.875%, due 2/8/22 | | | 550,000 | | | | 597,349 | |
3.95%, due 11/9/22 | | | 1,400,000 | | | | 1,443,169 | |
Credit Agricole S.A.
1.625%, due 4/15/16 (a) | | | 675,000 | | | | 675,506 | |
Export-Import Bank of Korea
1.75%, due 2/27/18 | | | 200,000 | | | | 199,374 | |
¨Goldman Sachs Group, Inc. (The) | | | | | | | | |
2.375%, due 1/22/18 | | | 1,150,000 | | | | 1,172,022 | |
3.625%, due 2/7/16 | | | 225,000 | | | | 239,595 | |
3.625%, due 1/22/23 | | | 300,000 | | | | 311,204 | |
5.375%, due 3/15/20 | | | 450,000 | | | | 525,042 | |
6.00%, due 6/15/20 | | | 175,000 | | | | 210,838 | |
HSBC Bank PLC | | | | | | | | |
3.50%, due 6/28/15 (a) | | | 900,000 | | | | 952,132 | |
4.125%, due 8/12/20 (a) | | | 900,000 | | | | 1,005,360 | |
¨JPMorgan Chase & Co. | | | | | | | | |
3.375%, due 5/1/23 | | | 1,300,000 | | | | 1,296,717 | |
4.50%, due 1/24/22 | | | 750,000 | | | | 847,134 | |
KeyCorp
6.50%, due 5/14/13 | | | 950,000 | | | | 951,839 | |
Korea Development Bank (The) | | | | | | | | |
1.50%, due 1/22/18 | | | 200,000 | | | | 196,599 | |
3.875%, due 5/4/17 | | | 400,000 | | | | 432,592 | |
Landwirtschaftliche Rentenbank
2.50%, due 2/15/16 | | | 350,000 | | | | 369,530 | |
| | | | | | | | |
| | | Principal
Amount | | | Value | |
| | | | | | | | |
Banks (continued) | |
Morgan Stanley | | | | | | | | |
4.875%, due 11/1/22 | | $ | 400,000 | | | $ | 431,192 | |
5.50%, due 1/26/20 | | | 300,000 | | | | 349,061 | |
5.625%, due 9/23/19 | | | 600,000 | | | | 698,968 | |
Royal Bank of Scotland Group PLC
2.55%, due 9/18/15 | | | 1,325,000 | | | | 1,364,828 | |
Skandinaviska Enskilda Banken AB
1.75%, due 3/19/18 (a) | | | 1,200,000 | | | | 1,211,339 | |
Societe Generale S.A.
2.75%, due 10/12/17 | | | 350,000 | | | | 363,401 | |
Svenska Handelsbanken AB
2.875%, due 4/4/17 | | | 600,000 | | | | 637,980 | |
Swedbank AB
1.75%, due 3/12/18 (a) | | | 500,000 | | | | 504,055 | |
UBS A.G.
2.25%, due 1/28/14 | | | 523,000 | | | | 529,563 | |
Wachovia Bank
4.80%, due 11/1/14 | | | 1,165,000 | | | | 1,237,129 | |
Wells Fargo & Co.
3.45%, due 2/13/23 | | | 650,000 | | | | 663,255 | |
Westpac Banking Corp.
1.125%, due 9/25/15 | | | 350,000 | | | | 353,600 | |
| | | | | | | | |
| | | | | | | 31,930,643 | |
| | | | | | | | |
Beverages 0.3% | |
Anheuser-Busch InBev Worldwide, Inc. | | | | | | | | |
1.375%, due 7/15/17 | | | 800,000 | | | | 810,718 | |
4.375%, due 2/15/21 | | | 300,000 | | | | 347,247 | |
Diageo Capital PLC
1.50%, due 5/11/17 | | | 250,000 | | | | 254,836 | |
SABMiller Holdings, Inc.
2.45%, due 1/15/17 (a) | | | 575,000 | | | | 602,253 | |
| | | | | | | | |
| | | | | | | 2,015,054 | |
| | | | | | | | |
Building Materials 0.0%‡ | |
CRH America, Inc.
4.125%, due 1/15/16 | | | 250,000 | | | | 265,873 | |
| | | | | | | | |
| | |
Chemicals 0.3% | | | | | | | | |
Dow Chemical Co. (The) | | | | | | | | |
3.00%, due 11/15/22 | | | 425,000 | | | | 425,172 | |
5.70%, due 5/15/18 | | | 500,000 | | | | 592,160 | |
Eastman Chemical Co.
2.40%, due 6/1/17 | | | 250,000 | | | | 259,088 | |
Ecolab, Inc. | | | | | | | | |
1.45%, due 12/8/17 | | | 375,000 | | | | 373,705 | |
4.35%, due 12/8/21 | | | 525,000 | | | | 591,269 | |
| | | | | | | | |
| | | | | | | 2,241,394 | |
| | | | | | | | |
Communications Equipment 0.1% | |
Apple, Inc.
2.40%, due 5/3/23 | | | 675,000 | | | | 674,102 | |
| | | | | | | | |
| | | | | | |
The notes to the financial statements are an integral part of,
and should be read in conjunction with, the financial statements. | | mainstayinvestments.com | | | 13 | |
Portfolio of Investments April 30, 2013 (Unaudited) (continued)
| | | | | | | | |
| | | Principal
Amount | | | Value | |
| | | | | | | | |
| Corporate Bonds (continued) | |
Computers 0.3% | | | | | | | | |
¨Hewlett-Packard Co. | | | | | | | | |
2.35%, due 3/15/15 | | $ | 975,000 | | | $ | 996,158 | |
4.65%, due 12/9/21 | | | 725,000 | | | | 750,171 | |
| | | | | | | | |
| | | | | | | 1,746,329 | |
| | | | | | | | |
Cosmetics & Personal Care 0.0%‡ | |
Procter & Gamble Co. (The)
1.45%, due 8/15/16 | | | 150,000 | | | | 154,099 | |
| | | | | | | | |
|
Diversified Financial Services 0.4% | |
General Electric Capital Corp. | | | | | | | | |
1.625%, due 4/2/18 | | | 450,000 | | | | 453,336 | |
2.10%, due 12/11/19 | | | 525,000 | | | | 538,463 | |
2.30%, due 4/27/17 | | | 775,000 | | | | 806,278 | |
6.00%, due 8/7/19 | | | 750,000 | | | | 918,867 | |
| | | | | | | | |
| | | | | | | 2,716,944 | |
| | | | | | | | |
Electric 1.5% | |
American Electric Power Co., Inc.
1.65%, due 12/15/17 | | | 600,000 | | | | 605,927 | |
Commonwealth Edison Co.
1.95%, due 9/1/16 | | | 350,000 | | | | 362,745 | |
Entergy Louisiana LLC | | | | | | | | |
1.875%, due 12/15/14 | | | 150,000 | | | | 152,996 | |
3.30%, due 12/1/22 | | | 150,000 | | | | 153,783 | |
Entergy Mississippi, Inc.
3.10%, due 7/1/23 | | | 150,000 | | | | 153,750 | |
FirstEnergy Corp.
4.25%, due 3/15/23 | | | 875,000 | | | | 903,821 | |
GDF Suez
1.625%, due 10/10/17 (a) | | | 275,000 | | | | 279,241 | |
Great Plains Energy, Inc. | | | | | | | | |
2.75%, due 8/15/13 | | | 1,100,000 | | | | 1,106,319 | |
4.85%, due 6/1/21 | | | 210,000 | | | | 237,279 | |
5.292%, due 6/15/22 (f) | | | 190,000 | | | | 219,178 | |
Hydro-Quebec
2.00%, due 6/30/16 | | | 550,000 | | | | 572,275 | |
Kansas City Power & Light Co.
7.15%, due 4/1/19 | | | 1,000,000 | | | | 1,306,688 | |
NextEra Energy Capital Holdings, Inc.
1.20%, due 6/1/15 | | | 250,000 | | | | 251,999 | |
Niagara Mohawk Power Corp.
2.721%, due 11/28/22 (a) | | | 325,000 | | | | 325,160 | |
NiSource Finance Corp.
4.45%, due 12/1/21 | | | 400,000 | | | | 446,995 | |
NSTAR Electric Co.
2.375%, due 10/15/22 | | | 400,000 | | | | 399,998 | |
Pepco Holdings, Inc.
2.70%, due 10/1/15 | | | 500,000 | | | | 518,241 | |
| | | | | | | | |
| | | Principal
Amount | | | Value | |
| | | | | | | | |
Electric (continued) | |
PPL Capital Funding, Inc. | | | | | | | | |
3.50%, due 12/1/22 | | $ | 400,000 | | | $ | 409,986 | |
4.20%, due 6/15/22 | | | 300,000 | | | | 322,200 | |
Progress Energy, Inc.
6.05%, due 3/15/14 | | | 737,000 | | | | 771,094 | |
Westar Energy, Inc.
6.00%, due 7/1/14 | | | 400,000 | | | | 424,174 | |
| | | | | | | | |
| | | | | | | 9,923,849 | |
| | | | | | | | |
Finance—Auto Loans 0.3% | |
Ford Motor Credit Co. LLC | | | | | | | | |
3.00%, due 6/12/17 | | | 375,000 | | | | 388,693 | |
4.25%, due 9/20/22 | | | 1,300,000 | | | | 1,374,682 | |
| | | | | | | | |
| | | | | | | 1,763,375 | |
| | | | | | | | |
Finance—Commercial 0.1% | |
Caterpillar Financial Services Corp.
2.05%, due 8/1/16 | | | 725,000 | | | | 753,774 | |
| | | | | | | | |
|
Finance—Consumer Loans 0.2% | |
John Deere Capital Corp. | | | | | | | | |
1.25%, due 12/2/14 | | | 150,000 | | | | 152,076 | |
1.70%, due 1/15/20 | | | 675,000 | | | | 672,657 | |
2.80%, due 9/18/17 | | | 150,000 | | | | 160,676 | |
5.75%, due 9/10/18 | | | 150,000 | | | | 182,859 | |
| | | | | | | | |
| | | | | | | 1,168,268 | |
| | | | | | | | |
Finance—Investment Banker/Broker 0.1% | |
BNP Paribas Home Loan Covered Bonds S.A.
2.20%, due 11/2/15 (a) | | | 400,000 | | | | 414,120 | |
| | | | | | | | |
|
Finance—Leasing Companies 0.0%‡ | |
Boeing Capital Corp.
2.90%, due 8/15/18 | | | 200,000 | | | | 217,426 | |
| | | | | | | | |
|
Finance—Other Services 0.0%‡ | |
National Rural Utilities Cooperative Finance Corp.
3.05%, due 2/15/22 | | | 225,000 | | | | 238,992 | |
| | | | | | | | |
| | |
Food 0.8% | | | | | | | | |
ConAgra Foods, Inc.
1.90%, due 1/25/18 | | | 1,050,000 | | | | 1,069,187 | |
General Mills, Inc.
3.15%, due 12/15/21 | | | 675,000 | | | | 717,121 | |
Ingredion, Inc. | | | | | | | | |
1.80%, due 9/25/17 | | | 250,000 | | | | 251,285 | |
4.625%, due 11/1/20 | | | 650,000 | | | | 731,798 | |
Kellogg Co.
1.75%, due 5/17/17 | | | 225,000 | | | | 230,061 | |
| | | | |
| 14 | | MainStay Balanced Fund | | The notes to the financial statements are an integral part of,
and should be read in conjunction with, the financial statements. |
| | | | | | | | |
| | | Principal
Amount | | | Value | |
| | | | | | | | |
| Corporate Bonds (continued) | |
Food (continued) | | | | | | | | |
Mondelez International, Inc.
4.125%, due 2/9/16 | | $ | 1,425,000 | | | $ | 1,550,772 | |
Safeway, Inc.
3.40%, due 12/1/16 | | | 750,000 | | | | 789,313 | |
Unilever Capital Corp.
0.85%, due 8/2/17 | | | 225,000 | | | | 224,505 | |
| | | | | | | | |
| | | | | | | 5,564,042 | |
| | | | | | | | |
Forest Products & Paper 0.1% | |
International Paper Co.
4.75%, due 2/15/22 | | | 600,000 | | | | 683,130 | |
| | | | | | | | |
|
Gas 0.0%‡ | |
Sempra Energy
2.30%, due 4/1/17 | | | 200,000 | | | | 208,552 | |
| | | | | | | | |
|
Hand & Machine Tools 0.0%‡ | |
Stanley Black & Decker, Inc.
3.40%, due 12/1/21 | | | 175,000 | | | | 185,088 | |
| | | | | | | | |
|
Health Care—Products 0.2% | |
Becton Dickinson and Co.
3.125%, due 11/8/21 | | | 600,000 | | | | 634,976 | |
CR Bard, Inc.
1.375%, due 1/15/18 | | | 225,000 | | | | 225,478 | |
Zimmer Holdings, Inc.
1.40%, due 11/30/14 | | | 325,000 | | | | 328,347 | |
| | | | | | | | |
| | | | | | | 1,188,801 | |
| | | | | | | | |
Health Care—Services 0.1% | |
Aetna, Inc.
1.75%, due 5/15/17 | | | 150,000 | | | | 152,894 | |
WellPoint, Inc.
1.875%, due 1/15/18 | | | 575,000 | | | | 584,261 | |
| | | | | | | | |
| | | | | | | 737,155 | |
| | | | | | | | |
Insurance 0.9% | |
AON Corp.
3.125%, due 5/27/16 | | | 300,000 | | | | 317,727 | |
Assurant, Inc.
2.50%, due 3/15/18 | | | 750,000 | | | | 755,554 | |
ING U.S., Inc.
2.90%, due 2/15/18 (a) | | | 760,000 | | | | 777,820 | |
Markel Corp.
3.625%, due 3/30/23 | | | 525,000 | | | | 538,176 | |
MetLife, Inc.
1.756%, due 12/15/17 | | | 350,000 | | | | 357,794 | |
Metropolitan Life Global Funding I | | | | | | | | |
1.50%, due 1/10/18 (a) | | | 525,000 | | | | 529,086 | |
5.125%, due 6/10/14 (a) | | | 750,000 | | | | 788,002 | |
| | | | | | | | |
| | | Principal
Amount | | | Value | |
| | | | | | | | |
Insurance (continued) | |
Nationwide Financial Services, Inc.
5.375%, due 3/25/21 (a) | | $ | 250,000 | | | $ | 281,621 | |
Principal Financial Group, Inc.
8.875%, due 5/15/19 | | | 450,000 | | | | 614,629 | |
Prudential Financial, Inc.
4.50%, due 11/16/21 | | | 450,000 | | | | 508,634 | |
QBE Insurance Group, Ltd.
2.40%, due 5/1/18 (a) | | | 325,000 | | | | 327,090 | |
| | | | | | | | |
| | | | | | | 5,796,133 | |
| | | | | | | | |
Iron & Steel 0.2% | |
ArcelorMittal
4.25%, due 2/25/15 (f) | | | 250,000 | | | | 258,768 | |
Carpenter Technology Corp.
4.45%, due 3/1/23 | | | 350,000 | | | | 364,545 | |
Reliance Steel & Aluminum Co.
4.50%, due 4/15/23 | | | 550,000 | | | | 560,625 | |
| | | | | | | | |
| | | | | | | 1,183,938 | |
| | | | | | | | |
Lodging 0.1% | |
Wyndham Worldwide Corp.
3.90%, due 3/1/23 | | | 600,000 | | | | 611,777 | |
| | | | | | | | |
|
Machinery—Diversified 0.1% | |
Roper Industries, Inc.
6.625%, due 8/15/13 | | | 450,000 | | | | 457,512 | |
| | | | | | | | |
|
Media 0.2% | |
COX Communications, Inc.
5.45%, due 12/15/14 | | | 192,000 | | | | 206,987 | |
DIRECTV Holdings LLC / DIRECTV Financing Co., Inc.
3.50%, due 3/1/16 | | | 300,000 | | | | 319,487 | |
Reed Elsevier Capital, Inc.
7.75%, due 1/15/14 | | | 150,000 | | | | 157,303 | |
Time Warner Cable, Inc.
6.75%, due 7/1/18 | | | 325,000 | | | | 403,614 | |
Viacom, Inc.
1.25%, due 2/27/15 | | | 400,000 | | | | 402,942 | |
| | | | | | | | |
| | | | | | | 1,490,333 | |
| | | | | | | | |
Metal Fabricate & Hardware 0.0%‡ | |
Precision Castparts Corp.
2.50%, due 1/15/23 | | | 285,000 | | | | 285,355 | |
| | | | | | | | |
|
Metals & Mining 0.1% | |
Barrick Gold Corp. | | | | | | | | |
2.50%, due 5/1/18 (a) | | | 425,000 | | | | 427,029 | |
4.10%, due 5/1/23 (a) | | | 500,000 | | | | 501,018 | |
| | | | | | | | |
| | | | | | | 928,047 | |
| | | | | | | | |
| | | | | | |
The notes to the financial statements are an integral part of,
and should be read in conjunction with, the financial statements. | | mainstayinvestments.com | | | 15 | |
Portfolio of Investments April 30, 2013 (Unaudited) (continued)
| | | | | | | | |
| | | Principal
Amount | | | Value | |
| | | | | | | | |
| Corporate Bonds (continued) | |
Mining 0.6% | |
BHP Billiton Finance USA, Ltd.
1.875%, due 11/21/16 | | $ | 450,000 | | | $ | 464,847 | |
Freeport-McMoRan Copper & Gold, Inc. | | | | | | | | |
2.375%, due 3/15/18 (a) | | | 625,000 | | | | 629,492 | |
3.875%, due 3/15/23 (a) | | | 500,000 | | | | 503,994 | |
Goldcorp, Inc.
2.125%, due 3/15/18 | | | 700,000 | | | | 700,219 | |
Rio Tinto Finance USA, Ltd. | | | | | | | | |
2.25%, due 9/20/16 | | | 475,000 | | | | 493,430 | |
3.50%, due 11/2/20 | | | 100,000 | | | | 106,340 | |
Teck Resources, Ltd.
3.75%, due 2/1/23 | | | 825,000 | | | | 823,296 | |
| | | | | | | | |
| | | | | | | 3,721,618 | |
| | | | | | | | |
Miscellaneous—Manufacturing 0.1% | |
Eaton Corp.
1.50%, due 11/2/17 (a) | | | 400,000 | | | | 402,470 | |
General Electric Co.
2.70%, due 10/9/22 | | | 200,000 | | | | 205,975 | |
Tyco Electronics Group S.A.
1.60%, due 2/3/15 | | | 200,000 | | | | 202,561 | |
| | | | | | | | |
| | | | | | | 811,006 | |
| | | | | | | | |
Oil & Gas 0.7% | |
BP Capital Markets PLC
1.846%, due 5/5/17 | | | 225,000 | | | | 231,935 | |
Marathon Oil Corp.
0.90%, due 11/1/15 | | | 800,000 | | | | 801,754 | |
Petrobras International Finance Co.
2.875%, due 2/6/15 | | | 625,000 | | | | 638,119 | |
Petroleos Mexicanos
3.50%, due 1/30/23 (a) | | | 300,000 | | | | 305,250 | |
Phillips 66
2.95%, due 5/1/17 | | | 375,000 | | | | 399,190 | |
Shell International Finance B.V. | | | | | | | | |
1.125%, due 8/21/17 | | | 475,000 | | | | 480,946 | |
2.25%, due 1/6/23 | | | 450,000 | | | | 447,467 | |
Statoil ASA | | | | | | | | |
2.45%, due 1/17/23 | | | 250,000 | | | | 251,176 | |
3.125%, due 8/17/17 | | | 125,000 | | | | 136,079 | |
Total Capital International S.A. | | | | | | | | |
1.55%, due 6/28/17 | | | 200,000 | | | | 203,987 | |
2.875%, due 2/17/22 | | | 425,000 | | | | 445,009 | |
| | | | | | | | |
| | | | | | | 4,340,912 | |
| | | | | | | | |
Oil & Gas Services 0.0%‡ | |
Cameron International Corp.
1.60%, due 4/30/15 | | | 125,000 | | | | 126,201 | |
| | | | | | | | |
| | | | | | | | |
| | | Principal
Amount | | | Value | |
| | | | | | | | |
Packaging & Containers 0.1% | | | | | | | | |
Bemis Co., Inc.
5.65%, due 8/1/14 | | $ | 775,000 | | | $ | 819,734 | |
| | | | | | | | |
| | |
Pharmaceuticals 0.7% | | | | | | | | |
AbbVie, Inc.
1.75%, due 11/6/17 (a) | | | 850,000 | | | | 862,655 | |
Express Scripts Holding Co.
2.10%, due 2/12/15 | | | 725,000 | | | | 740,397 | |
Merck & Co., Inc.
2.40%, due 9/15/22 | | | 500,000 | | | | 504,297 | |
Novartis Securities Investment, Ltd.
5.125%, due 2/10/19 | | | 500,000 | | | | 598,948 | |
Sanofi | | | | | | | | |
1.25%, due 4/10/18 | | | 450,000 | | | | 451,980 | |
4.00%, due 3/29/21 | | | 475,000 | | | | 538,550 | |
Teva Pharmaceutical Finance Co. B.V.
2.40%, due 11/10/16 | | | 300,000 | | | | 315,256 | |
Teva Pharmaceutical Finance IV B.V.
3.65%, due 11/10/21 | | | 375,000 | | | | 405,660 | |
| | | | | | | | |
| | | | | | | 4,417,743 | |
| | | | | | | | |
Pipelines 0.5% | | | | | | | | |
Energy Transfer Partners, L.P.
5.20%, due 2/1/22 | | | 500,000 | | | | 571,660 | |
Enterprise Products Operating LLC
1.25%, due 8/13/15 | | | 250,000 | | | | 252,019 | |
ONEOK Partners, L.P.
2.00%, due 10/1/17 | | | 225,000 | | | | 228,740 | |
Plains All American Pipeline, L.P. / PAA Finance Corp.
8.75%, due 5/1/19 | | | 800,000 | | | | 1,088,577 | |
Texas Eastern Transmission, L.P.
2.80%, due 10/15/22 (a) | | | 525,000 | | | | 529,470 | |
Williams Cos., Inc. (The)
3.70%, due 1/15/23 | | | 450,000 | | | | 454,550 | |
| | | | | | | | |
| | | | | | | 3,125,016 | |
| | | | | | | | |
Real Estate 0.1% | | | | | | | | |
American Campus Communities Operating Partnership, L.P.
3.75%, due 4/15/23 | | | 350,000 | | | | 367,583 | |
WEA Finance LLC / WT Finance Aust Pty, Ltd.
5.75%, due 9/2/15 (a) | | | 250,000 | | | | 276,910 | |
| | | | | | | | |
| | | | | | | 644,493 | |
| | | | | | | | |
Real Estate Investment Trusts 0.9% | | | | | | | | |
Brandywine Operating Partnership, L.P.
5.70%, due 5/1/17 | | | 1,275,000 | | | | 1,445,900 | |
DDR Corp.
4.75%, due 4/15/18 | | | 800,000 | | | | 896,050 | |
Hospitality Properties Trust
6.30%, due 6/15/16 | | | 600,000 | | | | 666,121 | |
| | | | |
| 16 | | MainStay Balanced Fund | | The notes to the financial statements are an integral part of,
and should be read in conjunction with, the financial statements. |
| | | | | | | | |
| | | Principal
Amount | | | Value | |
| | | | | | | | |
| Corporate Bonds (continued) | |
Real Estate Investment Trusts (continued) | |
National Retail Properties, Inc.
6.25%, due 6/15/14 | | $ | 225,000 | | | $ | 237,275 | |
ProLogis, L.P.
6.625%, due 5/15/18 | | | 1,550,000 | | | | 1,882,749 | |
Realty Income Corp.
2.00%, due 1/31/18 | | | 475,000 | | | | 479,679 | |
| | | | | | | | |
| | | | | | | 5,607,774 | |
| | | | | | | | |
Retail 0.2% | | | | | | | | |
Costco Wholesale Corp.
1.70%, due 12/15/19 | | | 400,000 | | | | 403,304 | |
Dollar General Corp.
1.875%, due 4/15/18 | | | 625,000 | | | | 628,449 | |
Home Depot, Inc. (The)
4.40%, due 4/1/21 | | | 500,000 | | | | 583,213 | |
| | | | | | | | |
| | | | | | | 1,614,966 | |
| | | | | | | | |
Semiconductors 0.1% | | | | | | | | |
Samsung Electronics America, Inc.
1.75%, due 4/10/17 (a) | | | 525,000 | | | | 533,670 | |
| | | | | | | | |
| | |
Software 0.1% | | | | | | | | |
Fiserv, Inc.
4.75%, due 6/15/21 | | | 500,000 | | | | 556,698 | |
| | | | | | | | |
| | |
Telecommunications 0.6% | | | | | | | | |
America Movil S.A.B. de C.V.
3.125%, due 7/16/22 | | | 400,000 | | | | 407,051 | |
AT&T, Inc. | | | | | | | | |
1.70%, due 6/1/17 | | | 300,000 | | | | 305,014 | |
2.40%, due 8/15/16 | | | 275,000 | | | | 286,876 | |
2.625%, due 12/1/22 | | | 725,000 | | | | 718,313 | |
Cellco Partnership / Verizon Wireless Capital LLC
5.55%, due 2/1/14 | | | 450,000 | | | | 465,875 | |
France Telecom S.A.
2.75%, due 9/14/16 | | | 325,000 | | | | 340,371 | |
Telefonica Emisiones SAU
3.192%, due 4/27/18 | | | 575,000 | | | | 581,990 | |
Verizon Communications, Inc.
2.00%, due 11/1/16 | | | 300,000 | | | | 310,193 | |
Vivendi S.A.
2.40%, due 4/10/15 (a) | | | 350,000 | | | | 356,587 | |
Vodafone Group PLC
1.25%, due 9/26/17 | | | 350,000 | | | | 347,945 | |
| | | | | | | | |
| | | | | | | 4,120,215 | |
| | | | | | | | |
Textiles 0.1% | |
Mohawk Industries, Inc.
3.85%, due 2/1/23 | | | 300,000 | | | | 313,228 | |
| | | | | | | | |
| | | | | | | | |
| | | Principal
Amount | | | Value | |
| | | | | | | | |
Transportation 0.1% | | | | | | | | |
Burlington Northern Santa Fe LLC
4.70%, due 10/1/19 | | $ | 400,000 | | | $ | 468,403 | |
| | | | | | | | |
Total Corporate Bonds
(Cost $105,514,619) | | | | | | | 110,068,165 | |
| | | | | | | | |
|
| Foreign Government Bonds 0.5% | |
Regional (State & Province) 0.3% | |
Province of Manitoba Canada
2.625%, due 7/15/15 | | | 200,000 | | | | 209,680 | |
Province of Ontario
1.10%, due 10/25/17 | | | 950,000 | | | | 955,415 | |
Province of Quebec
3.50%, due 7/29/20 | | | 400,000 | | | | 446,760 | |
| | | | | | | | |
| | | | | | | 1,611,855 | |
| | | | | | | | |
Sovereign 0.2% | | | | | | | | |
Italy Government International Bond
4.75%, due 1/25/16 | | | 500,000 | | | | 530,700 | |
Poland Government International Bond
5.00%, due 3/23/22 | | | 150,000 | | | | 175,133 | |
Romanian Government International Bond
4.375%, due 8/22/23 (a) | | | 750,000 | | | | 776,212 | |
| | | | | | | | |
| | | | | | | 1,482,045 | |
| | | | | | | | |
Total Foreign Government Bonds
(Cost $3,013,346) | | | | | | | 3,093,900 | |
| | | | | | | | |
|
| Mortgage-Backed Securities 0.5% | |
Commercial Mortgage Loans (Collateralized Mortgage Obligations) 0.3% | |
JP Morgan Chase Commercial Mortgage Securities Corp. | | | | | | | | |
Series 2012-C6, Class A2
2.206%, due 5/15/45 | | | 500,000 | | | | 520,925 | |
Series 2006-CB15, Class A4
5.814%, due 6/12/43 (b) | | | 450,000 | | | | 504,546 | |
LB-UBS Commercial Mortgage Trust
Series 2006-C7, Class A3
5.347%, due 11/15/38 | | | 600,000 | | | | 682,033 | |
Morgan Stanley Capital I, Inc.
Series 2007-T25, Class A3
5.514%, due 11/12/49 (b) | | | 600,000 | | | | 689,000 | |
Wachovia Bank Commercial Mortgage Trust
Series 2006-C29, Class A4
5.308%, due 11/15/48 | | | 100,000 | | | | 113,132 | |
| | | | | | | | |
| | | | | | | 2,509,636 | |
| | | | | | | | |
Whole Loan Collateral (Collateralized Mortgage Obligations) 0.2% | |
Fosse Master Issuer PLC
Series 2011-1A, Class A5
1.777%, due 10/18/54 (a)(b) | | | 365,000 | | | | 374,857 | |
Holmes Master Issuer PLC
Series Reg S
1.927%, due 10/15/54 (a)(b) | | | 595,000 | | | | 606,496 | |
| | | | | | |
The notes to the financial statements are an integral part of,
and should be read in conjunction with, the financial statements. | | mainstayinvestments.com | | | 17 | |
Portfolio of Investments April 30, 2013 (Unaudited) (continued)
| | | | | | | | |
| | | Principal
Amount | | | Value | |
| | | | | | | | |
| Mortgage-Backed Securities (continued) | |
Whole Loan Collateral (Collateralized Mortgage Obligations) (continued) | |
Permanent Master Issuer PLC
Series 2011-2A, Class 1A2
1.827%, due 7/15/42 (a)(b) | | $ | 250,000 | | | $ | 254,495 | |
| | | | | | | | |
| | | | | | | 1,235,848 | |
| | | | | | | | |
Total Mortgage-Backed Securities
(Cost $3,679,553) | | | | | | | 3,745,484 | |
| | | | | | | | |
|
| U.S. Government & Federal Agencies 17.7% | |
Federal Home Loan Bank 0.2% | |
1.375%, due 5/28/14 | | | 1,000,000 | | | | 1,012,946 | |
| | | | | | | | |
|
¨Federal Home Loan Mortgage Corporation 1.0% | |
0.50%, due 4/17/15 | | | 1,400,000 | | | | 1,406,710 | |
0.53%, due 11/20/15 | | | 500,000 | | | | 500,102 | |
0.60%, due 5/22/15 | | | 600,000 | | | | 600,147 | |
0.75%, due 11/25/14 | | | 875,000 | | | | 882,523 | |
0.75%, due 1/12/18 | | | 625,000 | | | | 624,744 | |
0.875%, due 3/7/18 | | | 600,000 | | | | 602,297 | |
1.00%, due 9/27/17 | | | 225,000 | | | | 225,604 | |
1.75%, due 9/10/15 | | | 1,000,000 | | | | 1,033,376 | |
1.75%, due 5/30/19 | | | 1,000,000 | | | | 1,036,869 | |
| | | | | | | | |
| | | | | | | 6,912,372 | |
| | | | | | | | |
¨Federal National Mortgage Association 1.3% | |
0.375%, due 3/16/15 | | | 1,250,000 | | | | 1,252,802 | |
0.60%, due 3/4/16 | | | 350,000 | | | | 350,292 | |
0.70%, due 9/6/16 | | | 450,000 | | | | 450,557 | |
0.75%, due 12/19/14 | | | 450,000 | | | | 453,765 | |
0.875%, due 12/20/17 | | | 500,000 | | | | 503,295 | |
1.00%, due 12/28/17 | | | 300,000 | | | | 300,390 | |
1.25%, due 9/28/16 | | | 1,000,000 | | | | 1,025,618 | |
1.25%, due 1/30/17 | | | 750,000 | | | | 769,713 | |
1.375%, due 11/15/16 | | | 2,900,000 | | | | 2,991,437 | |
2.75%, due 3/13/14 | | | 400,000 | | | | 409,004 | |
| | | | | | | | |
| | | | | | | 8,506,873 | |
| | | | | | | | |
Federal National Mortgage Association
(Mortgage Pass-Through Security) 0.4% | |
3.50%, due 2/1/42 TBA (g) | | | 2,300,000 | | | | 2,444,828 | |
| | | | | | | | |
|
¨United States Treasury Notes 14.8% | |
0.25%, due 1/31/15 | | | 2,135,000 | | | | 2,137,086 | |
0.25%, due 5/15/15 | | | 4,610,000 | | | | 4,612,522 | |
0.25%, due 8/15/15 | | | 500,000 | | | | 500,039 | |
0.25%, due 9/15/15 | | | 5,020,000 | | | | 5,019,608 | |
0.25%, due 12/15/15 | | | 7,170,000 | | | | 7,163,841 | |
0.25%, due 4/15/16 | | | 4,100,000 | | | | 4,092,952 | |
0.375%, due 4/15/15 | | | 5,375,000 | | | | 5,391,378 | |
0.375%, due 11/15/15 | | | 1,805,000 | | | | 1,809,512 | |
| | | | | | | | |
| | | Principal
Amount | | | Value | |
| | | | | | | | |
¨United States Treasury Notes (continued) | |
0.375%, due 1/15/16 | | $ | 1,200,000 | | | $ | 1,202,719 | |
0.375%, due 2/15/16 | | | 7,850,000 | | | | 7,867,176 | |
0.375%, due 3/15/16 | | | 4,275,000 | | | | 4,284,016 | |
0.625%, due 4/30/18 | | | 2,000,000 | | | | 1,994,844 | |
0.75%, due 12/31/17 | | | 9,975,000 | | | | 10,037,344 | |
0.75%, due 2/28/18 | | | 2,100,000 | | | | 2,110,991 | |
0.875%, due 1/31/18 | | | 8,840,000 | | | | 8,940,829 | |
1.00%, due 8/31/19 | | | 500,000 | | | | 501,133 | |
1.00%, due 9/30/19 | | | 700,000 | | | | 700,930 | |
1.00%, due 11/30/19 | | | 225,000 | | | | 224,842 | |
1.125%, due 4/30/20 | | | 1,300,000 | | | | 1,301,219 | |
1.25%, due 2/29/20 | | | 7,400,000 | | | | 7,487,298 | |
1.375%, due 9/30/18 | | | 1,760,000 | | | | 1,817,612 | |
1.50%, due 8/31/18 | | | 6,500,000 | | | | 6,758,479 | |
1.625%, due 11/15/22 | | | 5,600 | | | | 5,592 | |
2.25%, due 7/31/18 | | | 11,055,000 | | | | 11,926,443 | |
| | | | | | | | |
| | | | | | | 97,888,405 | |
| | | | | | | | |
Total U.S. Government & Federal Agencies
(Cost $115,119,253) | | | | | | | 116,765,424 | |
| | | | | | | | |
|
| Yankee Bond 0.1% (h) | |
Transportation 0.1% | |
Canadian National Railway Co.
1.45%, due 12/15/16 | | | 400,000 | | | | 407,982 | |
| | | | | | | | |
Total Yankee Bond
(Cost $397,796) | | | | | | | 407,982 | |
| | | | | | | | |
Total Long-Term Bonds
(Cost $238,106,539) | | | | | | | 244,463,496 | |
| | | | | | | | |
| | |
| | | | | | | | |
| | |
| | | Shares | | | | |
| Common Stocks 59.8% | |
Aerospace & Defense 1.3% | |
Boeing Co. (The) | | | 16,756 | | | | 1,531,666 | |
General Dynamics Corp. | | | 21,867 | | | | 1,617,283 | |
Lockheed Martin Corp. | | | 11,621 | | | | 1,151,525 | |
Northrop Grumman Corp. | | | 20,653 | | | | 1,564,258 | |
Raytheon Co. | | | 22,654 | | | | 1,390,503 | |
Spirit AeroSystems Holdings, Inc. Class A (i) | | | 68,868 | | | | 1,376,671 | |
| | | | | | | | |
| | | | | | | 8,631,906 | |
| | | | | | | | |
Agriculture 0.8% | | | | | | | | |
Altria Group, Inc. | | | 31,840 | | | | 1,162,479 | |
Archer-Daniels-Midland Co. | | | 45,221 | | | | 1,534,801 | |
Philip Morris International, Inc. | | | 12,043 | | | | 1,151,190 | |
Reynolds American, Inc. | | | 24,539 | | | | 1,163,639 | |
| | | | | | | | |
| | | | | | | 5,012,109 | |
| | | | | | | | |
| | | | |
| 18 | | MainStay Balanced Fund | | The notes to the financial statements are an integral part of,
and should be read in conjunction with, the financial statements. |
| | | | | | | | |
| | |
| | | Shares | | | Value | |
| | | | | | | | |
| Common Stocks (continued) | |
Airlines 0.6% | | | | | | | | |
Copa Holdings S.A. Class A | | | 10,505 | | | $ | 1,319,218 | |
Delta Air Lines, Inc. (i) | | | 53,978 | | | | 925,183 | |
Southwest Airlines Co. | | | 138,592 | | | | 1,898,710 | |
| | | | | | | | |
| | | | | | | 4,143,111 | |
| | | | | | | | |
| | |
Apparel 0.0%‡ | | | | | | | | |
Deckers Outdoor Corp. (i) | | | 5,853 | | | | 322,617 | |
| | | | | | | | |
| | |
Auto Manufacturers 0.6% | | | | | | | | |
Ford Motor Co. | | | 113,179 | | | | 1,551,684 | |
General Motors Co. (i) | | | 43,949 | | | | 1,355,387 | |
Oshkosh Corp. (i) | | | 24,665 | | | | 968,348 | |
| | | | | | | | |
| | | | | | | 3,875,419 | |
| | | | | | | | |
Auto Parts & Equipment 0.2% | | | | | | | | |
Johnson Controls, Inc. | | | 34,326 | | | | 1,201,753 | |
Lear Corp. | | | 1,804 | | | | 104,235 | |
| | | | | | | | |
| | | | | | | 1,305,988 | |
| | | | | | | | |
Banks 3.7% | | | | | | | | |
¨Bank of America Corp. | | | 96,525 | | | | 1,188,223 | |
Bank of New York Mellon Corp. | | | 54,046 | | | | 1,525,178 | |
BB&T Corp. | | | 37,726 | | | | 1,160,829 | |
Capital One Financial Corp. | | | 24,126 | | | | 1,394,000 | |
CIT Group, Inc. (i) | | | 43,813 | | | | 1,862,491 | |
¨Citigroup, Inc. | | | 24,490 | | | | 1,142,703 | |
Fifth Third Bancorp | | | 79,162 | | | | 1,348,129 | |
First Republic Bank | | | 39,038 | | | | 1,482,663 | |
¨Goldman Sachs Group, Inc. (The) | | | 7,966 | | | | 1,163,594 | |
Huntington Bancshares, Inc. | | | 197,913 | | | | 1,419,036 | |
¨JPMorgan Chase & Co. | | | 30,939 | | | | 1,516,320 | |
KeyCorp | | | 111,593 | | | | 1,112,582 | |
Morgan Stanley | | | 54,370 | | | | 1,204,296 | |
Northern Trust Corp. | | | 14,768 | | | | 796,291 | |
PNC Financial Services Group, Inc. | | | 16,926 | | | | 1,148,937 | |
Regions Financial Corp. | | | 19,284 | | | | 163,721 | |
State Street Corp. | | | 25,536 | | | | 1,493,090 | |
SunTrust Banks, Inc. | | | 31,632 | | | | 925,236 | |
U.S. Bancorp | | | 34,219 | | | | 1,138,808 | |
Wells Fargo & Co. | | | 30,445 | | | | 1,156,301 | |
| | | | | | | | |
| | | | | | | 24,342,428 | |
| | | | | | | | |
Beverages 0.5% | | | | | | | | |
Coca-Cola Enterprises, Inc. | | | 36,241 | | | | 1,327,508 | |
Constellation Brands, Inc. Class A (i) | | | 11,827 | | | | 583,662 | |
Green Mountain Coffee Roasters, Inc. (i) | | | 22,773 | | | | 1,307,170 | |
| | | | | | | | |
| | | | | | | 3,218,340 | |
| | | | | | | | |
Biotechnology 0.1% | | | | | | | | |
Charles River Laboratories International, Inc. (i) | | | 9,026 | | | | 392,541 | |
| | | | | | | | |
| | | | | | | | |
| | |
| | | Shares | | | Value | |
| | | | | | | | |
Chemicals 1.0% | | | | | | | | |
Air Products & Chemicals, Inc. | | | 13,013 | | | $ | 1,131,611 | |
Dow Chemical Co. (The) | | | 36,589 | | | | 1,240,733 | |
Huntsman Corp. | | | 39,349 | | | | 742,122 | |
LyondellBasell Industries, N.V., Class A | | | 25,856 | | | | 1,569,459 | |
Mosaic Co. (The) | | | 19,241 | | | | 1,185,053 | |
W.R. Grace & Co. (i) | | | 2,149 | | | | 165,709 | |
Westlake Chemical Corp. | | | 3,099 | | | | 257,651 | |
| | | | | | | | |
| | | | | | | 6,292,338 | |
| | | | | | | | |
Coal 0.1% | | | | | | | | |
Alpha Natural Resources, Inc. (i) | | | 47,328 | | | | 351,174 | |
| | | | | | | | |
| | |
Commercial Services 1.6% | | | | | | | | |
ADT Corp. (The) (i) | | | 33,052 | | | | 1,442,389 | |
Booz Allen Hamilton Holding Corp. | | | 68,110 | | | | 1,034,591 | |
CoreLogic, Inc. (i) | | | 53,524 | | | | 1,460,135 | |
DeVry, Inc. | | | 43,867 | | | | 1,228,715 | |
H&R Block, Inc. | | | 11,945 | | | | 331,354 | |
Hertz Global Holdings, Inc. (i) | | | 61,033 | | | | 1,469,675 | |
ManpowerGroup, Inc. | | | 27,995 | | | | 1,488,214 | |
R.R. Donnelley & Sons Co. | | | 76,338 | | | | 939,721 | |
Service Corp. International | | | 52,950 | | | | 893,796 | |
Total System Services, Inc. | | | 17,834 | | | | 421,239 | |
| | | | | | | | |
| | | | | | | 10,709,829 | |
| | | | | | | | |
Computers 1.7% | | | | | | | | |
Brocade Communications Systems, Inc. (i) | | | 241,785 | | | | 1,407,189 | |
Computer Sciences Corp. | | | 37,624 | | | | 1,762,684 | |
Dell, Inc. | | | 103,443 | | | | 1,386,136 | |
¨Hewlett-Packard Co. | | | 71,402 | | | | 1,470,881 | |
Lexmark International, Inc. Class A | | | 49,242 | | | | 1,492,525 | |
NetApp, Inc. (i) | | | 44,102 | | | | 1,538,719 | |
Western Digital Corp. | | | 34,141 | | | | 1,887,315 | |
| | | | | | | | |
| | | | | | | 10,945,449 | |
| | | | | | | | |
Cosmetics & Personal Care 0.5% | | | | | | | | |
Avon Products, Inc. | | | 22,552 | | | | 522,304 | |
Colgate-Palmolive Co. | | | 10,742 | | | | 1,282,702 | |
Procter & Gamble Co. (The) | | | 15,946 | | | | 1,224,175 | |
| | | | | | | | |
| | | | | | | 3,029,181 | |
| | | | | | | | |
Electric 3.8% | | | | | | | | |
AES Corp. (The) | | | 144,241 | | | | 1,999,180 | |
Ameren Corp. | | | 30,317 | | | | 1,098,991 | |
American Electric Power Co., Inc. | | | 25,740 | | | | 1,323,808 | |
CMS Energy Corp. | | | 15,231 | | | | 456,016 | |
Consolidated Edison, Inc. | | | 20,729 | | | | 1,319,401 | |
Dominion Resources, Inc. | | | 18,465 | | | | 1,138,921 | |
DTE Energy Co. | | | 31,114 | | | | 2,267,588 | |
Duke Energy Corp. | | | 15,077 | | | | 1,133,790 | |
Edison International | | | 37,260 | | | | 2,004,588 | |
Entergy Corp. | | | 8,541 | | | | 608,376 | |
Exelon Corp. | | | 34,933 | | | | 1,310,337 | |
| | | | | | |
The notes to the financial statements are an integral part of,
and should be read in conjunction with, the financial statements. | | mainstayinvestments.com | | | 19 | |
Portfolio of Investments April 30, 2013 (Unaudited) (continued)
| | | | | | | | |
| | |
| | | Shares | | | Value | |
| | | | | | | | |
| Common Stocks (continued) | |
Electric (continued) | | | | | | | | |
FirstEnergy Corp. | | | 24,210 | | | $ | 1,128,186 | |
NextEra Energy, Inc. | | | 14,004 | | | | 1,148,748 | |
NRG Energy, Inc. | | | 3,880 | | | | 108,136 | |
NV Energy, Inc. | | | 6,021 | | | | 130,234 | |
OGE Energy Corp. | | | 2,994 | | | | 216,856 | |
PG&E Corp. | | | 27,261 | | | | 1,320,523 | |
Pinnacle West Capital Corp. | | | 19,179 | | | | 1,168,001 | |
PPL Corp. | | | 28,171 | | | | 940,348 | |
Public Service Enterprise Group, Inc. | | | 35,999 | | | | 1,317,923 | |
Southern Co. | | | 23,067 | | | | 1,112,521 | |
Wisconsin Energy Corp. | | | 16,153 | | | | 725,916 | |
Xcel Energy, Inc. | | | 42,507 | | | | 1,351,298 | |
| | | | | | | | |
| | | | | | | 25,329,686 | |
| | | | | | | | |
Electrical Components & Equipment 0.5% | |
Emerson Electric Co. | | | 23,886 | | | | 1,325,912 | |
Energizer Holdings, Inc. | | | 17,292 | | | | 1,670,234 | |
| | | | | | | | |
| | | | | | | 2,996,146 | |
| | | | | | | | |
Electronics 0.7% | | | | | | | | |
Avnet, Inc. (i) | | | 14,633 | | | | 479,231 | |
AVX Corp. | | | 6,060 | | | | 68,538 | |
Thermo Fisher Scientific, Inc. | | | 15,904 | | | | 1,283,135 | |
Tyco International, Ltd. | | | 41,245 | | | | 1,324,789 | |
Vishay Intertechnology, Inc. (i) | | | 101,246 | | | | 1,421,494 | |
| | | | | | | | |
| | | | | | | 4,577,187 | |
| | | | | | | | |
Engineering & Construction 0.3% | | | | | | | | |
AECOM Technology Corp. (i) | | | 46,749 | | | | 1,358,993 | |
Engility Holdings, Inc. (i) | | | 36,462 | | | | 873,630 | |
| | | | | | | | |
| | | | | | | 2,232,623 | |
| | | | | | | | |
Entertainment 0.2% | | | | | | | | |
International Game Technology | | | 3,891 | | | | 65,953 | |
Regal Entertainment Group Class A | | | 73,562 | | | | 1,319,702 | |
| | | | | | | | |
| | | | | | | 1,385,655 | |
| | | | | | | | |
Environmental Controls 0.2% | | | | | | | | |
Covanta Holding Corp. | | | 6,158 | | | | 123,160 | |
Waste Management, Inc. | | | 33,394 | | | | 1,368,486 | |
| | | | | | | | |
| | | | | | | 1,491,646 | |
| | | | | | | | |
Finance—Credit Card 0.4% | | | | | | | | |
American Express Co. | | | 16,978 | | | | 1,161,465 | |
Discover Financial Services | | | 33,913 | | | | 1,483,355 | |
| | | | | | | | |
| | | | | | | 2,644,820 | |
| | | | | | | | |
Finance—Investment Banker/Broker 0.4% | |
Charles Schwab Corp. (The) | | | 77,708 | | | | 1,317,928 | |
Interactive Brokers Group, Inc. Class A | | | 71,659 | | | | 1,079,184 | |
Raymond James Financial, Inc. | | | 3,037 | | | | 125,793 | |
| | | | | | | | |
| | | | | | | 2,522,905 | |
| | | | | | | | |
| | | | | | | | |
| | |
| | | Shares | | | Value | |
| | | | | | | | |
Finance—Other Services 0.3% | | | | | | | | |
CME Group, Inc. | | | 18,866 | | | $ | 1,148,185 | |
NASDAQ OMX Group, Inc. (The) | | | 23,662 | | | | 697,556 | |
| | | | | | | | |
| | | | | | | 1,845,741 | |
| | | | | | | | |
Food 2.6% | | | | | | | | |
Campbell Soup Co. | | | 2,422 | | | | 112,405 | |
ConAgra Foods, Inc. | | | 29,226 | | | | 1,033,724 | |
Dean Foods Co. (i) | | | 65,664 | | | | 1,256,809 | |
General Mills, Inc. | | | 28,941 | | | | 1,459,205 | |
Hillshire Brands Co. | | | 10,801 | | | | 387,864 | |
Ingredion, Inc. | | | 21,169 | | | | 1,524,380 | |
J.M. Smucker Co. (The) | | | 12,971 | | | | 1,338,996 | |
Kellogg Co. | | | 19,625 | | | | 1,276,410 | |
Kraft Foods Group, Inc. | | | 28,809 | | | | 1,483,375 | |
Mondelez International, Inc. Class A | | | 42,313 | | | | 1,330,744 | |
Safeway, Inc. | | | 63,728 | | | | 1,435,155 | |
Smithfield Foods, Inc. (i) | | | 52,985 | | | | 1,356,416 | |
Sysco Corp. | | | 32,269 | | | | 1,124,897 | |
Tyson Foods, Inc. Class A | | | 72,658 | | | | 1,789,567 | |
WhiteWave Foods Co. Class A (i) | | | 8,497 | | | | 143,684 | |
| | | | | | | | |
| | | | | | | 17,053,631 | |
| | | | | | | | |
Forest Products & Paper 0.2% | | | | | | | | |
International Paper Co. | | | 34,551 | | | | 1,623,206 | |
| | | | | | | | |
| | |
Gas 0.4% | | | | | | | | |
CenterPoint Energy, Inc. | | | 60,071 | | | | 1,482,552 | |
Sempra Energy | | | 5,138 | | | | 425,683 | |
UGI Corp. | | | 24,385 | | | | 999,298 | |
| | | | | | | | |
| | | | | | | 2,907,533 | |
| | | | | | | | |
Hand & Machine Tools 0.2% | | | | | | | | |
Regal-Beloit Corp. | | | 18,103 | | | | 1,423,258 | |
| | | | | | | | |
| | |
Health Care—Products 1.9% | | | | | | | | |
Baxter International, Inc. | | | 18,485 | | | | 1,291,547 | |
Becton, Dickinson & Co. | | | 15,408 | | | | 1,452,974 | |
Boston Scientific Corp. (i) | | | 272,237 | | | | 2,039,055 | |
CareFusion Corp. (i) | | | 52,506 | | | | 1,755,801 | |
Covidien PLC | | | 19,297 | | | | 1,231,921 | |
Hill-Rom Holdings, Inc. | | | 38,162 | | | | 1,300,179 | |
Medtronic, Inc. | | | 27,924 | | | | 1,303,492 | |
St. Jude Medical, Inc. | | | 19,533 | | | | 805,150 | |
Stryker Corp. | | | 19,994 | | | | 1,311,207 | |
| | | | | | | | |
| | | | | | | 12,491,326 | |
| | | | | | | | |
Health Care—Services 2.7% | | | | | | | | |
Aetna, Inc. | | | 26,634 | | | | 1,529,857 | |
Cigna Corp. | | | 41,900 | | | | 2,772,523 | |
Community Health Systems, Inc. | | | 34,117 | | | | 1,554,712 | |
Covance, Inc. (i) | | | 20,148 | | | | 1,502,235 | |
HCA Holdings, Inc. | | | 35,340 | | | | 1,409,713 | |
| | | | |
| 20 | | MainStay Balanced Fund | | The notes to the financial statements are an integral part of,
and should be read in conjunction with, the financial statements. |
| | | | | | | | |
| | |
| | | Shares | | | Value | |
| | | | | | | | |
| Common Stocks (continued) | |
Health Care—Services (continued) | |
Health Management Associates, Inc. Class A (i) | | | 121,722 | | | $ | 1,398,586 | |
Humana, Inc. | | | 26,781 | | | | 1,984,740 | |
LifePoint Hospitals, Inc. (i) | | | 23,393 | | | | 1,122,864 | |
Tenet Healthcare Corp. (i) | | | 26,922 | | | | 1,221,182 | |
UnitedHealth Group, Inc. | | | 24,175 | | | | 1,448,808 | |
Universal Health Services, Inc. Class B | | | 2,189 | | | | 145,765 | |
WellPoint, Inc. | | | 21,481 | | | | 1,566,394 | |
| | | | | | | | |
| | | | | | | 17,657,379 | |
| | | | | | | | |
Holding Company—Diversified 0.3% | | | | | | | | |
Leucadia National Corp. | | | 63,689 | | | | 1,967,353 | |
| | | | | | | | |
| | |
Home Builders 0.3% | | | | | | | | |
PulteGroup, Inc. (i) | | | 85,563 | | | | 1,795,967 | |
| | | | | | | | |
| | |
Home Furnishing 0.1% | | | | | | | | |
Whirlpool Corp. | | | 6,488 | | | | 741,449 | |
| | | | | | | | |
| | |
Household Products & Wares 0.5% | | | | | | | | |
Avery Dennison Corp. | | | 36,263 | | | | 1,503,101 | |
Jarden Corp. (i) | | | 2,291 | | | | 103,118 | |
Kimberly-Clark Corp. | | | 14,236 | | | | 1,469,013 | |
| | | | | | | | |
| | | | | | | 3,075,232 | |
| | | | | | | | |
Insurance 5.7% | | | | | | | | |
ACE, Ltd. | | | 16,334 | | | | 1,456,013 | |
Aflac, Inc. | | | 29,510 | | | | 1,606,524 | |
Alleghany Corp. (i) | | | 3,476 | | | | 1,368,640 | |
Allied World Assurance Co. Holdings A.G. | | | 14,169 | | | | 1,286,687 | |
Allstate Corp. (The) | | | 29,789 | | | | 1,467,406 | |
American Financial Group, Inc. | | | 21,199 | | | | 1,023,276 | |
American International Group, Inc. (i) | | | 37,638 | | | | 1,558,966 | |
American National Insurance Co. | | | 3,971 | | | | 373,393 | |
Aon PLC | | | 4,980 | | | | 300,543 | |
Arch Capital Group, Ltd. (i) | | | 3,605 | | | | 191,281 | |
Aspen Insurance Holdings, Ltd. | | | 31,520 | | | | 1,203,749 | |
Assurant, Inc. | | | 32,526 | | | | 1,546,286 | |
Axis Capital Holdings, Ltd. | | | 36,404 | | | | 1,624,710 | |
Berkshire Hathaway, Inc. Class B (i) | | | 12,365 | | | | 1,314,647 | |
Chubb Corp. (The) | | | 14,655 | | | | 1,290,666 | |
CNA Financial Corp. | | | 7,171 | | | | 241,734 | |
Everest Re Group, Ltd. | | | 8,181 | | | | 1,104,353 | |
Fidelity National Financial, Inc. Class A | | | 64,885 | | | | 1,742,162 | |
Genworth Financial, Inc. Class A (i) | | | 81,626 | | | | 818,709 | |
Hartford Financial Services Group, Inc. (The) | | | 31,613 | | | | 888,009 | |
HCC Insurance Holdings, Inc. | | | 1,541 | | | | 65,647 | |
Lincoln National Corp. | | | 30,174 | | | | 1,026,218 | |
Loews Corp. | | | 25,680 | | | | 1,147,126 | |
Marsh & McLennan Cos., Inc. | | | 34,422 | | | | 1,308,380 | |
MBIA, Inc. (i) | | | 27,982 | | | | 264,710 | |
| | | | | | | | |
| | |
| | | Shares | | | Value | |
| | | | | | | | |
Insurance (continued) | | | | | | | | |
MetLife, Inc. | | | 31,079 | | | $ | 1,211,770 | |
PartnerRe, Ltd. | | | 17,664 | | | | 1,666,422 | |
Principal Financial Group, Inc. | | | 11,237 | | | | 405,656 | |
Progressive Corp. (The) | | | 3,117 | | | | 78,829 | |
Protective Life Corp. | | | 39,317 | | | | 1,496,405 | |
Prudential Financial, Inc. | | | 23,195 | | | | 1,401,442 | |
Reinsurance Group of America, Inc. | | | 9,664 | | | | 604,483 | |
RenaissanceRe Holdings, Ltd. | | | 12,517 | | | | 1,175,221 | |
StanCorp Financial Group, Inc. | | | 8,150 | | | | 351,917 | |
Travelers Companies, Inc. (The) | | | 17,158 | | | | 1,465,465 | |
Validus Holdings, Ltd. | | | 37,590 | | | | 1,451,350 | |
W.R. Berkley Corp. | | | 4,126 | | | | 179,151 | |
White Mountains Insurance Group, Ltd. | | | 304 | | | | 175,806 | |
| | | | | | | | |
| | | | | | | 37,883,752 | |
| | | | | | | | |
Internet 1.2% | | | | | | | | |
AOL, Inc. (i) | | | 36,694 | | | | 1,417,856 | |
Expedia, Inc. | | | 18,886 | | | | 1,054,594 | |
Liberty Interactive Corp. Class A (i) | | | 87,677 | | | | 1,866,643 | |
Symantec Corp. (i) | | | 104,023 | | | | 2,527,759 | |
VeriSign, Inc. (i) | | | 3,414 | | | | 157,283 | |
Yahoo!, Inc. (i) | | | 47,471 | | | | 1,173,958 | |
| | | | | | | | |
| | | | | | | 8,198,093 | |
| | | | | | | | |
Investment Company 0.2% | | | | | | | | |
American Capital Ltd. (i) | | | 106,632 | | | | 1,613,342 | |
| | | | | | | | |
| |
Investment Management/Advisory Services 0.5% | | | | | |
Ameriprise Financial, Inc. | | | 3,005 | | | | 223,963 | |
BlackRock, Inc. | | | 5,882 | | | | 1,567,553 | |
Franklin Resources, Inc. | | | 9,970 | | | | 1,541,960 | |
| | | | | | | | |
| | | | | | | 3,333,476 | |
| | | | | | | | |
Iron & Steel 0.0%‡ | | | | | | | | |
Nucor Corp. | | | 312 | | | | 13,609 | |
| | | | | | | | |
| | |
Leisure Time 0.2% | | | | | | | | |
Carnival Corp. | | | 38,282 | | | | 1,321,112 | |
| | | | | | | | |
| | |
Lodging 0.1% | | | | | | | | |
MGM Resorts International (i) | | | 36,880 | | | | 520,746 | |
| | | | | | | | |
| | |
Machinery—Construction & Mining 0.1% | | | | | | | | |
Terex Corp. (i) | | | 26,288 | | | | 751,837 | |
| | | | | | | | |
| | |
Media 1.8% | | | | | | | | |
Cablevision Systems Corp. Class A | | | 94,298 | | | | 1,401,268 | |
CBS Corp. Class B | | | 28,486 | | | | 1,304,089 | |
Comcast Corp. Class A | | | 36,085 | | | | 1,490,311 | |
DISH Network Corp. Class A | | | 25,334 | | | | 992,839 | |
Gannett Co., Inc. | | | 1,915 | | | | 38,606 | |
| | | | | | |
The notes to the financial statements are an integral part of,
and should be read in conjunction with, the financial statements. | | mainstayinvestments.com | | | 21 | |
Portfolio of Investments April 30, 2013 (Unaudited) (continued)
| | | | | | | | |
| | |
| | | Shares | | | Value | |
| | | | | | | | |
| Common Stocks (continued) | |
Media (continued) | | | | | | | | |
Liberty Media Corp. Class A (i) | | | 1,404 | | | $ | 161,292 | |
News Corp. Class A | | | 47,406 | | | | 1,468,164 | |
Thomson Reuters Corp. | | | 39,628 | | | | 1,327,142 | |
Time Warner, Inc. | | | 24,680 | | | | 1,475,370 | |
Walt Disney Co. (The) | | | 18,407 | | | | 1,156,696 | |
Washington Post Co. (The) Class B | | | 2,984 | | | | 1,322,927 | |
| | | | | | | | |
| | | | | | | 12,138,704 | |
| | | | | | | | |
Metal Fabricate & Hardware 0.1% | | | | | | | | |
Timken Co. | | | 18,685 | | | | 982,270 | |
| | | | | | | | |
| | |
Mining 0.6% | | | | | | | | |
Freeport-McMoRan Copper & Gold, Inc. | | | 39,366 | | | | 1,197,907 | |
Newmont Mining Corp. | | | 33,696 | | | | 1,091,751 | |
Southern Copper Corp. | | | 40,445 | | | | 1,348,032 | |
| | | | | | | | |
| | | | | | | 3,637,690 | |
| | | | | | | | |
Miscellaneous—Manufacturing 1.3% | | | | | | | | |
3M Co. | | | 12,131 | | | | 1,270,237 | |
Carlisle Companies, Inc. | | | 11,575 | | | | 750,870 | |
Danaher Corp. | | | 21,940 | | | | 1,337,024 | |
Eaton Corp. PLC | | | 11,408 | | | | 700,565 | |
General Electric Co. | | | 48,710 | | | | 1,085,746 | |
Illinois Tool Works, Inc. | | | 21,052 | | | | 1,359,117 | |
ITT Corp. | | | 47,631 | | | | 1,314,616 | |
Trinity Industries, Inc. | | | 25,507 | | | | 1,076,650 | |
| | | | | | | | |
| | | | | | | 8,894,825 | |
| | | | | | | | |
Office & Business Equipment 0.3% | | | | | | | | |
Pitney Bowes, Inc. | | | 82,544 | | | | 1,128,376 | |
Xerox Corp. | | | 134,612 | | | | 1,154,971 | |
| | | | | | | | |
| | | | | | | 2,283,347 | |
| | | | | | | | |
Oil & Gas 4.1% | | | | | | | | |
Anadarko Petroleum Corp. | | | 17,894 | | | | 1,516,695 | |
Apache Corp. | | | 15,592 | | | | 1,151,937 | |
Chevron Corp. | | | 11,018 | | | | 1,344,306 | |
ConocoPhillips | | | 22,220 | | | | 1,343,199 | |
Devon Energy Corp. | | | 20,795 | | | | 1,144,973 | |
Exxon Mobil Corp. | | | 14,704 | | | | 1,308,509 | |
Hess Corp. | | | 21,532 | | | | 1,554,180 | |
HollyFrontier Corp. | | | 40,592 | | | | 2,007,274 | |
Marathon Oil Corp. | | | 36,673 | | | | 1,198,107 | |
¨Marathon Petroleum Corp. | | | 41,750 | | | | 3,271,530 | |
Murphy Oil Corp. | | | 25,939 | | | | 1,610,553 | |
Noble Energy, Inc. | | | 889 | | | | 100,715 | |
Occidental Petroleum Corp. | | | 13,818 | | | | 1,233,395 | |
Patterson-UTI Energy, Inc. | | | 62,790 | | | | 1,324,241 | |
PBF Energy, Inc. | | | 12,041 | | | | 366,648 | |
Phillips 66 | | | 25,214 | | | | 1,536,793 | |
Tesoro Corp. | | | 32,863 | | | | 1,754,884 | |
Unit Corp. (i) | | | 3,641 | | | | 153,031 | |
| | | | | | | | |
| | |
| | | Shares | | | Value | |
| | | | | | | | |
Oil & Gas (continued) | | | | | | | | |
Valero Energy Corp. | | | 73,080 | | | $ | 2,946,586 | |
| | | | | | | | |
| | | | | | | 26,867,556 | |
| | | | | | | | |
Oil & Gas Services 0.7% | | | | | | | | |
Baker Hughes, Inc. | | | 24,759 | | | | 1,123,811 | |
Halliburton Co. | | | 33,774 | | | | 1,444,514 | |
MRC Global, Inc. (i) | | | 6,822 | | | | 204,319 | |
National Oilwell Varco, Inc. | | | 17,090 | | | | 1,114,610 | |
RPC, Inc. | | | 68,760 | | | | 910,382 | |
| | | | | | | | |
| | | | | | | 4,797,636 | |
| | | | | | | | |
Packaging & Containers 0.5% | | | | | | | | |
Greif, Inc. Class A | | | 24,674 | | | | 1,188,547 | |
Packaging Corporation of America | | | 7,340 | | | | 349,090 | |
Sealed Air Corp. | | | 67,104 | | | | 1,484,340 | |
| | | | | | | | |
| | | | | | | 3,021,977 | |
| | | | | | | | |
Pharmaceuticals 1.9% | | | | | | | | |
Abbott Laboratories | | | 29,941 | | | | 1,105,422 | |
AbbVie, Inc. | | | 34,098 | | | | 1,570,213 | |
Bristol-Myers Squibb Co. | | | 35,586 | | | | 1,413,476 | |
Cardinal Health, Inc. | | | 33,794 | | | | 1,494,371 | |
Eli Lilly & Co. | | | 25,635 | | | | 1,419,666 | |
Endo Health Solutions, Inc. (i) | | | 16,451 | | | | 602,765 | |
Johnson & Johnson | | | 15,311 | | | | 1,304,956 | |
Merck & Co., Inc. | | | 23,716 | | | | 1,114,652 | |
Omnicare, Inc. | | | 23,856 | | | | 1,044,177 | |
Pfizer, Inc. | | | 41,636 | | | | 1,210,358 | |
| | | | | | | | |
| | | | | | | 12,280,056 | |
| | | | | | | | |
Pipelines 0.2% | | | | | | | | |
Spectra Energy Corp. | | | 36,264 | | | | 1,143,404 | |
| | | | | | | | |
| | |
Real Estate Investment Trusts 3.9% | | | | | | | | |
Annaly Capital Management, Inc. | | | 66,834 | | | | 1,065,334 | |
AvalonBay Communities, Inc. | | | 263 | | | | 34,989 | |
BioMed Realty Trust, Inc. | | | 4,715 | | | | 106,135 | |
Boston Properties, Inc. | | | 1,402 | | | | 153,421 | |
Brandywine Realty Trust | | | 3,425 | | | | 51,135 | |
CBL & Associates Properties, Inc. | | | 61,957 | | | | 1,495,642 | |
Chimera Investment Corp. | | | 74,150 | | | | 244,695 | |
Corporate Office Properties Trust | | | 22,372 | | | | 648,564 | |
Corrections Corporation of America | | | 24,281 | | | | 878,972 | |
DDR Corp. | | | 20,525 | | | | 376,428 | |
Equity Lifestyle Properties, Inc. | | | 4,991 | | | | 405,519 | |
Equity Residential | | | 19,091 | | | | 1,108,423 | |
Extra Space Storage, Inc. | | | 133 | | | | 5,796 | |
General Growth Properties, Inc. | | | 22,912 | | | | 520,561 | |
HCP, Inc. | | | 57,818 | | | | 3,081,699 | |
Health Care REIT, Inc. | | | 38,319 | | | | 2,872,775 | |
Hospitality Properties Trust | | | 50,380 | | | | 1,481,676 | |
Host Hotels & Resorts, Inc. | | | 100,625 | | | | 1,838,419 | |
Jones Lang LaSalle, Inc. | | | 4,697 | | | | 465,097 | |
| | | | |
| 22 | | MainStay Balanced Fund | | The notes to the financial statements are an integral part of,
and should be read in conjunction with, the financial statements. |
| | | | | | | | |
| | |
| | | Shares | | | Value | |
| | | | | | | | |
| Common Stocks (continued) | |
Real Estate Investment Trusts (continued) | |
Kimco Realty Corp. | | | 9,954 | | | $ | 236,706 | |
Liberty Property Trust | | | 10,215 | | | | 439,143 | |
National Retail Properties, Inc. | | | 5,251 | | | | 208,360 | |
Piedmont Office Realty Trust, Inc. Class A | | | 48,895 | | | | 1,003,325 | |
ProLogis, Inc. | | | 9,502 | | | | 398,609 | |
Rayonier, Inc. | | | 2,037 | | | | 121,039 | |
Regency Centers Corp. | | | 2,815 | | | | 158,372 | |
Senior Housing Properties Trust | | | 36,959 | | | | 1,050,744 | |
Simon Property Group, Inc. | | | 6,386 | | | | 1,137,155 | |
Taubman Centers, Inc. | | | 3,302 | | | | 282,354 | |
¨Ventas, Inc. | | | 39,611 | | | | 3,154,224 | |
Vornado Realty Trust | | | 3,844 | | | | 336,581 | |
Weingarten Realty Investors | | | 3,066 | | | | 104,459 | |
| | | | | | | | |
| | | | | | | 25,466,351 | |
| | | | | | | | |
Retail 2.8% | | | | | | | | |
Abercrombie & Fitch Co. Class A | | | 31,259 | | | | 1,549,196 | |
American Eagle Outfitters, Inc. | | | 65,426 | | | | 1,272,536 | |
Best Buy Co., Inc. | | | 72,397 | | | | 1,881,598 | |
CVS Caremark Corp. | | | 25,374 | | | | 1,476,259 | |
Dillard’s, Inc. Class A | | | 16,964 | | | | 1,398,003 | |
GameStop Corp. Class A | | | 51,056 | | | | 1,781,854 | |
Lowe’s Companies, Inc. | | | 38,666 | | | | 1,485,548 | |
Macy’s, Inc. | | | 35,696 | | | | 1,592,042 | |
Sears Hometown and Outlet Stores, Inc. (i) | | | 13,350 | | | | 595,544 | |
Staples, Inc. | | | 84,500 | | | | 1,118,780 | |
Target Corp. | | | 18,651 | | | | 1,316,015 | |
Wal-Mart Stores, Inc. | | | 16,506 | | | | 1,282,846 | |
Walgreen Co. | | | 29,624 | | | | 1,466,684 | |
| | | | | | | | |
| | | | | | | 18,216,905 | |
| | | | | | | | |
Savings & Loans 0.1% | | | | | | | | |
Capitol Federal Financial, Inc. | | | 83,538 | | | | 989,090 | |
| | | | | | | | |
| | |
Semiconductors 1.0% | | | | | | | | |
Applied Materials, Inc. | | | 45,678 | | | | 662,788 | |
Broadcom Corp. Class A | | | 39,764 | | | | 1,431,504 | |
Intel Corp. | | | 57,268 | | | | 1,371,569 | |
Marvell Technology Group, Ltd. | | | 52,199 | | | | 561,661 | |
Micron Technology, Inc. (i) | | | 154,061 | | | | 1,451,255 | |
Rovi Corp. (i) | | | 1,757 | | | | 41,096 | |
Texas Instruments, Inc. | | | 37,548 | | | | 1,359,613 | |
| | | | | | | | |
| | | | | | | 6,879,486 | |
| | | | | | | | |
Shipbuilding 0.1% | | | | | | | | |
Huntington Ingalls Industries, Inc. | | | 8,156 | | | | 431,452 | |
| | | | | | | | |
| | | | | | | | |
| | |
| | | Shares | | | Value | |
| | | | | | | | |
Software 0.9% | | | | | | | | |
Activision Blizzard, Inc. | | | 116,054 | | | $ | 1,735,007 | |
Adobe Systems, Inc. (i) | | | 28,646 | | | | 1,291,362 | |
Allscripts Healthcare Solutions, Inc. (i) | | | 3,298 | | | | 45,644 | |
CA, Inc. | | | 71,368 | | | | 1,924,795 | |
Electronic Arts, Inc. (i) | | | 61,917 | | | | 1,090,359 | |
| | | | | | | | |
| | | | | | | 6,087,167 | |
| | | | | | | | |
Telecommunications 1.6% | | | | | | | | |
Amdocs, Ltd. | | | 21,761 | | | | 776,868 | |
AT&T, Inc. | | | 33,747 | | | | 1,264,163 | |
CenturyLink, Inc. | | | 29,965 | | | | 1,125,785 | |
Cisco Systems, Inc. | | | 70,118 | | | | 1,466,868 | |
Corning, Inc. | | | 110,493 | | | | 1,602,148 | |
EchoStar Corp. Class A (i) | | | 10,664 | | | | 418,775 | |
Harris Corp. | | | 440 | | | | 20,328 | |
MetroPCS Communications, Inc. (i) | | | 113,715 | | | | 1,346,386 | |
Polycom, Inc. (i) | | | 97,719 | | | | 1,026,049 | |
Sprint Nextel Corp. (i) | | | 109,833 | | | | 774,323 | |
Telephone & Data Systems, Inc. | | | 39,554 | | | | 887,592 | |
United States Cellular Corp. (i) | | | 4,956 | | | | 190,509 | |
| | | | | | | | |
| | | | | | | 10,899,794 | |
| | | | | | | | |
Textiles 0.1% | | | | | | | | |
Mohawk Industries, Inc. (i) | | | 7,148 | | | | 792,570 | |
| | | | | | | | |
| | |
Transportation 1.0% | | | | | | | | |
Con-way, Inc. | | | 34,442 | | | | 1,164,140 | |
CSX Corp. | | | 53,604 | | | | 1,318,122 | |
FedEx Corp. | | | 15,707 | | | | 1,476,615 | |
Norfolk Southern Corp. | | | 19,537 | | | | 1,512,555 | |
Ryder System, Inc. | | | 23,843 | | | | 1,384,563 | |
| | | | | | | | |
| | | | | | | 6,855,995 | |
| | | | | | | | |
Water 0.1% | | | | | | | | |
American Water Works Co., Inc. | | | 10,536 | | | | 441,248 | |
| | | | | | | | |
Total Common Stocks
(Cost $310,651,605) | | | | | | | 395,078,663 | |
| | | | | | | | |
|
| Exchange Traded Funds 0.7% (j) | |
S&P 500 Index—SPDR Trust Series 1 | | | 18,201 | | | | 2,906,336 | |
S&P Midcap 400 Index—Midcap SPDR Trust Series 1 | | | 9,149 | | | | 1,930,164 | |
| | | | | | | | |
Total Exchange Traded Funds
(Cost $4,495,750) | | | | | | | 4,836,500 | |
| | | | | | | | |
| | |
| | | | | | | | |
| | | | | | |
The notes to the financial statements are an integral part of,
and should be read in conjunction with, the financial statements. | | mainstayinvestments.com | | | 23 | |
Portfolio of Investments April 30, 2013 (Unaudited) (continued)
| | | | | | | | |
| | | Principal
Amount | | | Value | |
| | | | | | | | |
| Short-Term Investments 1.5% | |
Repurchase Agreements 1.5% | |
State Street Bank and Trust Co.
0.01%, dated 4/30/13
due 5/1/13
Proceeds at Maturity $1,732,307 (Collateralized by Government Agency securities with rates between 2.08% and 2.10% and maturity dates between 10/17/22 and 11/2/22, with a Principal Amount of $1,770,000 and a Market Value of $1,771,044) | | $ | 1,732,306 | | | $ | 1,732,306 | |
TD Securities (U.S.A.) LLC
0.14%, dated 4/30/13
due 5/1/13
Proceeds at Maturity $8,153,032 (Collateralized by a Federal National Mortgage Association security with a rate of 4.00% and maturity date of 5/1/42, with a Principal Amount of $8,044,255 and a Market Value of $8,316,061) | | | 8,153,000 | | | | 8,153,000 | |
| | | | | | | | |
Total Short-Term Investments
(Cost $9,885,306) | | | | | | | 9,885,306 | |
| | | | | | | | |
Total Investments
(Cost $563,139,200) (l) | | | 99.0 | % | | | 654,263,965 | |
Other Assets, Less Liabilities | | | 1.0 | | | | 6,464,205 | |
Net Assets | | | 100.0 | % | | $ | 660,728,170 | |
| ‡ | Less than one-tenth of a percent. |
| (a) | May be sold to institutional investors only under Rule 144A or securities offered pursuant to Section 4(a)(2) of the Securities Act of 1933, as amended. |
| (b) | Floating rate—Rate shown is the rate in effect as of April 30, 2013. |
| (c) | Fair valued security—The total market value of these securities as of April 30, 2013 is $4,700,673, which represents 0.7% of the Fund’s net assets. |
| (e) | Illiquid security—The total market value of this security as of April 30, 2013 is $18, which represents less than one-tenth of a percent of the Fund’s net assets. |
| (f) | Step coupon—Rate shown is the rate in effect as of April 30, 2013. |
| (g) | TBA—Securities purchased on a forward commitment basis with an approximate principal amount and maturity date. The actual principal amount and maturity date will be determined upon settlement. The market value of these securities as of April 30, 2013 is $2,444,828, which represents 0.4% of the Fund’s net assets. All or a portion of these securities were acquired under a mortgage dollar roll agreement. |
| (h) | Yankee Bond—Dollar-denominated bond issued in the United States by a foreign bank or corporation. |
| (i) | Non-income producing security. |
| (j) | Exchange Traded Fund—An investment vehicle that represents a basket of securities that is traded on an exchange. |
| (l) | As of April 30, 2013, cost is $569,211,482 for federal income tax purposes and net unrealized appreciation is as follows: |
| | | | |
Gross unrealized appreciation | | $ | 92,627,279 | |
Gross unrealized depreciation | | | (7,574,796 | ) |
| | | | |
Net unrealized appreciation | | $ | 85,052,483 | |
| | | | |
The following abbreviation is used in the above portfolio:
| SPDR—Standard | & Poor’s Depositary Receipt |
| | | | |
| 24 | | MainStay Balanced Fund | | The notes to the financial statements are an integral part of,
and should be read in conjunction with, the financial statements. |
The following is a summary of the fair valuations according to the inputs used as of April 30, 2013, for valuing the Fund’s assets.
Asset Valuation Inputs
| | | | | | | | | | | | | | | | |
Description | | Quoted
Prices in
Active
Markets for
Identical
Assets (Level 1) | | | Significant
Other
Observable
Inputs (Level 2) | | | Significant
Unobservable
Inputs (Level 3) | | | Total | |
| Investments in Securities (a) | | | | | | | | | | | | | | | | |
| Long-Term Bonds | | | | | | | | | | | | | | | | |
Asset-Backed Securities (b) | | $ | — | | | $ | 5,681,868 | | | $ | 4,700,655 | | | $ | 10,382,523 | |
Convertible Bond (c) | | | — | | | | — | | | | 18 | | | | 18 | |
Corporate Bonds | | | — | | | | 110,068,165 | | | | — | | | | 110,068,165 | |
Foreign Government Bonds | | | — | | | | 3,093,900 | | | | — | | | | 3,093,900 | |
Mortgage-Backed Securities | | | — | | | | 3,745,484 | | | | — | | | | 3,745,484 | |
U.S. Government & Federal Agencies | | | — | | | | 116,765,424 | | | | — | | | | 116,765,424 | |
Yankee Bond | | | — | | | | 407,982 | | | | — | | | | 407,982 | |
| | | | | | | | | | | | | | | | |
| Total Long-Term Bonds | | | — | | | | 239,762,823 | | | | 4,700,673 | | | | 244,463,496 | |
| | | | | | | | | | | | | | | | |
| Common Stocks | | | 395,078,663 | | | | — | | | | — | | | | 395,078,663 | |
| Exchange Traded Funds | | | 4,836,500 | | | | — | | | | — | | | | 4,836,500 | |
| Short-Term Investments | | | | | | | | | | | | | | | | |
Repurchase Agreements | | | — | | | | 9,885,306 | | | | — | | | | 9,885,306 | |
| | | | | | | | | | | | | | | | |
| Total Investments in Securities | | $ | 399,915,163 | | | $ | 249,648,129 | | | $ | 4,700,673 | | | $ | 654,263,965 | |
| | | | | | | | | | | | | | | | |
| (a) | For a complete listing of investments and their industries, see the Portfolio of Investments. |
| (b) | The Level 3 securities valued at $4,700,655 are held in Other ABS within the Asset-Backed Securities section of the Portfolio of Investments. |
| (c) | The Level 3 security valued at $18 is held in Internet within the Convertible Bond section of the Portfolio of Investments. |
The Fund recognizes transfers between the levels as of the beginning of the period.
For the period ended April 30, 2013, the Fund did not have any transfers between Level 1 and Level 2 fair value measurements. (See Note 2)
The following is a reconciliation of investments in which significant unobservable inputs (Level 3) were used in determining value:
| | | | | | | | | | | | | | | | | | | | | | | | | | | | | | | | | | | | | | | | |
Investments in Securities | | Balance
as of
October 31,
2012 | | | Accrued
Discounts
(Premiums) | | | Realized
Gain
(Loss) | | | Change in
Unrealized
Appreciation
(Depreciation) | | | Purchases | | | Sales | | | Transfers
into
Level 3 | | | Transfers
out of
Level 3 | | | Balance
as of
April 30,
2013 | | | Change in
Unrealized
Appreciation
(Depreciation)
from
Investments
Still Held at
April 30,
2013 (a) | |
| Asset-Backed Securities | | | | | | | | | | | | | | | | | | | | | | | | | | | | | | | | | | | | | | | | |
Other ABS | | $ | — | | | $ | — | | | $ | — | | | $ | 655 | | | $ | 4,700,000 | | | $ | — | | | $ | — | | | $ | — | | | $ | 4,700,655 | | | $ | 655 | |
| Convertible Bond | | | | | | | | | | | | | | | | | | | | | | | | | | | | | | | | | | | | | | | | |
Internet | | | 18 | | | | — | | | | — | | | | — | | | | — | | | | — | | | | — | | | | — | | | | 18 | | | | — | |
| | | | | | | | | | | | | | | | | | | | | | | | | | | | | | | | | | | | | | | | |
Total | | $ | 18 | | | $ | — | | | $ | — | | | $ | 655 | | | $ | 4,700,000 | | | $ | — | | | $ | — | | | $ | — | | | $ | 4,700,673 | | | $ | 655 | |
| | | | | | | | | | | | | | | | | | | | | | | | | | | | | | | | | | | | | | | | |
| (a) | Included in “Net change in unrealized appreciation (depreciation) on investments” in the Statement of Operations. |
| | | | | | |
The notes to the financial statements are an integral part of,
and should be read in conjunction with, the financial statements. | | mainstayinvestments.com | | | 25 | |
Statement of Assets and Liabilities as of April 30, 2013 (Unaudited)
| | | | |
| Assets | | | | |
Investment in securities, at value
(identified cost $563,139,200) | | $ | 654,263,965 | |
Cash | | | 674 | |
Receivables: | | | | |
Investment securities sold | | | 41,997,974 | |
Dividends and interest | | | 1,641,222 | |
Fund shares sold | | | 692,823 | |
Other assets | | | 65,924 | |
| | | | |
Total assets | | | 698,662,582 | |
| | | | |
| |
| Liabilities | | | | |
Payables: | | | | |
Investment securities purchased | | | 34,202,025 | |
Fund shares redeemed | | | 2,831,477 | |
Manager (See Note 3) | | | 379,810 | |
Transfer agent (See Note 3) | | | 212,557 | |
NYLIFE Distributors (See Note 3) | | | 142,153 | |
Shareholder communication | | | 94,921 | |
Professional fees | | | 58,198 | |
Custodian | | | 7,835 | |
Trustees | | | 1,322 | |
Accrued expenses | | | 4,114 | |
| | | | |
Total liabilities | | | 37,934,412 | |
| | | | |
Net assets | | $ | 660,728,170 | |
| | | | |
| |
| Composition of Net Assets | | | | |
Shares of beneficial interest outstanding (par value of $.01 per share) unlimited number of shares authorized | | $ | 207,952 | |
Additional paid-in capital | | | 571,688,662 | |
| | | | |
| | | 571,896,614 | |
Undistributed net investment income | | | 182,238 | |
Accumulated net realized gain (loss) on investments | | | (2,475,447 | ) |
Net unrealized appreciation (depreciation) on investments | | | 91,124,765 | |
| | | | |
Net assets | | $ | 660,728,170 | |
| | | | |
| | | | |
Investor Class | | | | |
Net assets applicable to outstanding shares | | $ | 68,546,877 | |
| | | | |
Shares of beneficial interest outstanding | | | 2,157,143 | |
| | | | |
Net asset value per share outstanding | | $ | 31.78 | |
Maximum sales charge (5.50% of offering price) | | | 1.85 | |
| | | | |
Maximum offering price per share outstanding | | $ | 33.63 | |
| | | | |
Class A | | | | |
Net assets applicable to outstanding shares | | $ | 161,505,543 | |
| | | | |
Shares of beneficial interest outstanding | | | 5,084,934 | |
| | | | |
Net asset value per share outstanding | | $ | 31.76 | |
Maximum sales charge (5.50% of offering price) | | | 1.85 | |
| | | | |
Maximum offering price per share outstanding | | $ | 33.61 | |
| | | | |
Class B | | | | |
Net assets applicable to outstanding shares | | $ | 46,346,158 | |
| | | | |
Shares of beneficial interest outstanding | | | 1,462,734 | |
| | | | |
Net asset value and offering price per share outstanding | | $ | 31.68 | |
| | | | |
Class C | | | | |
Net assets applicable to outstanding shares | | $ | 58,782,678 | |
| | | | |
Shares of beneficial interest outstanding | | | 1,855,938 | |
| | | | |
Net asset value and offering price per share outstanding | | $ | 31.67 | |
| | | | |
Class I | | | | |
Net assets applicable to outstanding shares | | $ | 264,949,527 | |
| | | | |
Shares of beneficial interest outstanding | | | 8,326,283 | |
| | | | |
Net asset value and offering price per share outstanding | | $ | 31.82 | |
| | | | |
Class R1 | | | | |
Net assets applicable to outstanding shares | | $ | 10,147,946 | |
| | | | |
Shares of beneficial interest outstanding | | | 319,310 | |
| | | | |
Net asset value and offering price per share outstanding | | $ | 31.78 | |
| | | | |
Class R2 | | | | |
Net assets applicable to outstanding shares | | $ | 49,357,412 | |
| | | | |
Shares of beneficial interest outstanding | | | 1,554,423 | |
| | | | |
Net asset value and offering price per share outstanding | | $ | 31.75 | |
| | | | |
Class R3 | | | | |
Net assets applicable to outstanding shares | | $ | 1,092,029 | |
| | | | |
Shares of beneficial interest outstanding | | | 34,394 | |
| | | | |
Net asset value and offering price per share outstanding | | $ | 31.75 | |
| | | | |
| | | | |
| 26 | | MainStay Balanced Fund | | The notes to the financial statements are an integral part of,
and should be read in conjunction with, the financial statements. |
Statement of Operations for the six months ended April 30, 2013 (Unaudited)
| | | | |
| Investment Income (Loss) | | | | |
Income | | | | |
Dividends (a) | | $ | 5,351,923 | |
Interest (b) | | | 1,980,662 | |
| | | | |
Total income | | | 7,332,585 | |
| | | | |
Expenses | | | | |
Manager (See Note 3) | | | 2,137,637 | |
Distribution/Service—Investor Class (See Note 3) | | | 80,586 | |
Distribution/Service—Class A (See Note 3) | | | 183,860 | |
Distribution/Service—Class B (See Note 3) | | | 238,910 | |
Distribution/Service—Class C (See Note 3) | | | 272,954 | |
Distribution/Service—Class R2 (See Note 3) | | | 56,644 | |
Distribution/Service—Class R3 (See Note 3) | | | 1,974 | |
Transfer agent (See Note 3) | | | 621,334 | |
Shareholder communication | | | 72,826 | |
Registration | | | 54,089 | |
Custodian | | | 32,353 | |
Professional fees | | | 30,802 | |
Shareholder service (See Note 3) | | | 28,059 | |
Trustees | | | 6,969 | |
Miscellaneous | | | 18,595 | |
| | | | |
Total expenses | | | 3,837,592 | |
| | | | |
Net investment income (loss) | | | 3,494,993 | |
| | | | |
|
| Realized and Unrealized Gain (Loss) on Investments | |
Net realized gain (loss) on investments | | | 25,330,619 | |
Net change in unrealized appreciation (depreciation) on investments | | | 44,243,027 | |
| | | | |
Net realized and unrealized gain (loss) on investments | | | 69,573,646 | |
| | | | |
Net increase (decrease) in net assets resulting from operations | | $ | 73,068,639 | |
| | | | |
| (a) | Dividends recorded net of foreign withholding taxes in the amount of $19,070. |
| (b) | Interest recorded net of foreign withholding taxes in the amount of $10. |
| | | | | | |
The notes to the financial statements are an integral part of,
and should be read in conjunction with, the financial statements. | | mainstayinvestments.com | | | 27 | |
Statements of Changes in Net Assets
for the six months ended April 30, 2013 (Unaudited) and the year ended October 31, 2012
| | | | | | | | |
| | | 2013 | | | 2012 | |
| Increase (Decrease) in Net Assets | |
Operations: | | | | | | | | |
Net investment income (loss) | | $ | 3,494,993 | | | $ | 6,057,469 | �� |
Net realized gain (loss) on investments | | | 25,330,619 | | | | 22,087,606 | |
Net change in unrealized appreciation (depreciation) on investments | | | 44,243,027 | | | | 28,801,475 | |
| | | | | | | | |
Net increase (decrease) in net assets resulting from operations | | | 73,068,639 | | | | 56,946,550 | |
| | | | | | | | |
Dividends to shareholders: | | | | | | | | |
From net investment income: | | | | | | | | |
Investor Class | | | (320,242 | ) | | | (527,396 | ) |
Class A | | | (876,257 | ) | | | (1,484,562 | ) |
Class B | | | (63,741 | ) | | | (70,889 | ) |
Class C | | | (68,264 | ) | | | (68,931 | ) |
Class I | | | (1,736,449 | ) | | | (2,912,254 | ) |
Class R1 | | | (66,500 | ) | | | (239,793 | ) |
Class R2 | | | (254,834 | ) | | | (421,762 | ) |
Class R3 | | | (2,521 | ) | | | (2,042 | ) |
| | | | | | | | |
Total dividends to shareholders | | | (3,388,808 | ) | | | (5,727,629 | ) |
| | | | | | | | |
Capital share transactions: | | | | | | | | |
Net proceeds from sale of shares | | | 66,013,570 | | | | 95,025,871 | |
Net asset value of shares issued to shareholders in reinvestment of dividends | | | 3,267,732 | | | | 5,496,336 | |
Cost of shares redeemed | | | (66,383,325 | ) | | | (143,506,971 | ) |
| | | | | | | | |
Increase (decrease) in net assets derived from capital share transactions | | | 2,897,977 | | | | (42,984,764 | ) |
| | | | | | | | |
Net increase (decrease) in net assets | | | 72,577,808 | | | | 8,234,157 | |
| | |
| Net Assets | | | | | | | | |
Beginning of period | | | 588,150,362 | | | | 579,916,205 | |
| | | | | | | | |
End of period | | $ | 660,728,170 | | | $ | 588,150,362 | |
| | | | | | | | |
Undistributed net investment income at
end of period | | $ | 182,238 | | | $ | 76,053 | |
| | | | | | | | |
| | | | |
| 28 | | MainStay Balanced Fund | | The notes to the financial statements are an integral part of,
and should be read in conjunction with, the financial statements. |
Financial Highlights selected per share data and ratios
| | | | | | | | | | | | | | | | | | | | | | | | |
| | | Investor Class | |
| | | Six months
ended
April 30, | | | Year ended October 31, | | | February 28,
2008**
through
October 31, | |
| | | 2013* | | | 2012 | | | 2011 | | | 2010 | | | 2009 | | | 2008 | |
Net asset value at beginning of period | | $ | 28.39 | | | $ | 26.05 | | | $ | 24.95 | | | $ | 22.09 | | | $ | 19.41 | | | $ | 25.29 | |
| | | | | | | | | | | | | | | | | | | | | | | | |
Net investment income (loss) (a) | | | 0.15 | | | | 0.26 | | | | 0.29 | | | | 0.30 | | | | 0.22 | | | | 0.29 | |
Net realized and unrealized gain (loss) on investments | | | 3.39 | | | | 2.32 | | | | 1.11 | | | | 2.86 | | | | 2.71 | | | | (5.82 | ) |
| | | | | | | | | | | | | | | | | | | | | | | | |
Total from investment operations | | | 3.54 | | | | 2.58 | | | | 1.40 | | | | 3.16 | | | | 2.93 | | | | (5.53 | ) |
| | | | | | | | | | | | | | | | | | | | | | | | |
Less dividends: | | | | | | | | | | | | | | | | | | | | | | | | |
From net investment income | | | (0.15 | ) | | | (0.24 | ) | | | (0.30 | ) | | | (0.30 | ) | | | (0.25 | ) | | | (0.35 | ) |
| | | | | | | | | | | | | | | | | | | | | | | | |
Net asset value at end of period | | $ | 31.78 | | | $ | 28.39 | | | $ | 26.05 | | | $ | 24.95 | | | $ | 22.09 | | | $ | 19.41 | |
| | | | | | | | | | | | | | | | | | | | | | | | |
Total investment return (b) | | | 12.54 | %(c) | | | 9.92 | % | | | 5.62 | % | | | 14.37 | % | | | 15.30 | % | | | (22.12 | %)(c) |
Ratios (to average net assets)/Supplemental Data: | | | | | | | | | | | | | | | | | | | | | | | | |
Net investment income (loss) | | | 1.04 | %†† | | | 0.94 | % | | | 1.12 | % | | | 1.28 | % | | | 1.11 | % | | | 1.81 | % †† |
Net expenses | | | 1.36 | %†† | | | 1.39 | % | | | 1.38 | % | | | 1.44 | % | | | 1.48 | % | | | 1.38 | % †† |
Expenses (before waiver/reimbursement) | | | 1.36 | %†† | | | 1.39 | % | | | 1.38 | % | | | 1.44 | % | | | 1.53 | % | | | 1.38 | % †† |
Portfolio turnover rate | | | 77 | %(d) | | | 209 | %(d) | | | 221 | %(d) | | | 123 | % | | | 162 | % | | | 69 | % |
Net assets at end of period (in 000’s) | | $ | 68,547 | | | $ | 61,579 | | | $ | 58,345 | | | $ | 59,469 | | | $ | 54,956 | | | $ | 49,971 | |
| ** | Commencement of operations. |
| (a) | Per share data based on average shares outstanding during the period. |
| (b) | Total investment return is calculated exclusive of sales charges and assumes the reinvestment of dividends and distributions. |
| (c) | Total investment return is not annualized. |
| (d) | The portfolio turnover rates not including mortgage dollar rolls were 74%, 202% and 218% for the six months ended April 30, 2013 and for the years ended October 31, 2012 and 2011, respectively. |
| | | | | | |
The notes to the financial statements are an integral part of,
and should be read in conjunction with, the financial statements. | | mainstayinvestments.com | | | 29 | |
Financial Highlights selected per share data and ratios
| | | | | | | | | | | | | | | | | | | | | | | | |
| | | Class A | |
| | | Six months
ended
April 30, | | | Year ended October 31, | |
| | | 2013* | | | 2012 | | | 2011 | | | 2010 | | | 2009 | | | 2008 | |
Net asset value at beginning of period | | $ | 28.37 | | | $ | 26.03 | | | $ | 24.94 | | | $ | 22.09 | | | $ | 19.41 | | | $ | 28.42 | |
| | | | | | | | | | | | | | | | | | | | | | | | |
Net investment income (loss) (a) | | | 0.18 | | | | 0.31 | | | | 0.34 | | | | 0.35 | | | | 0.27 | | | | 0.46 | |
Net realized and unrealized gain (loss) on investments | | | 3.39 | | | | 2.32 | | | | 1.10 | | | | 2.84 | | | | 2.70 | | | | (7.26 | ) |
| | | | | | | | | | | | | | | | | | | | | | | | |
Total from investment operations | | | 3.57 | | | | 2.63 | | | | 1.44 | | | | 3.19 | | | | 2.97 | | | | (6.80 | ) |
| | | | | | | | | | | | | | | | | | | | | | | | |
Less dividends and distributions: | | | | | | | | | | | | | | | | | | | | | | | | |
From net investment income | | | (0.18 | ) | | | (0.29 | ) | | | (0.35 | ) | | | (0.34 | ) | | | (0.29 | ) | | | (0.46 | ) |
From net realized gain on investments | | | — | | | | — | | | | — | | | | — | | | | — | | | | (1.75 | ) |
| | | | | | | | | | | | | | | | | | | | | | | | |
Total dividends and distributions | | | (0.18 | ) | | | (0.29 | ) | | | (0.35 | ) | | | (0.34 | ) | | | (0.29 | ) | | | (2.21 | ) |
| | | | | | | | | | | | | | | | | | | | | | | | |
Net asset value at end of period | | $ | 31.76 | | | $ | 28.37 | | | $ | 26.03 | | | $ | 24.94 | | | $ | 22.09 | | | $ | 19.41 | |
| | | | | | | | | | | | | | | | | | | | | | | | |
Total investment return (b) | | | 12.62 | %(c) | | | 10.17 | % | | | 5.79 | % | | | 14.54 | % | | | 15.52 | % | | | (25.84 | %) |
Ratios (to average net assets)/Supplemental Data: | | | | | | | | | | | | | | | | | | | | | | | | |
Net investment income (loss) | | | 1.22 | %†† | | | 1.13 | % | | | 1.31 | % | | | 1.47 | % | | | 1.36 | % | | | 1.87 | % |
Net expenses | | | 1.17 | %†† | | | 1.20 | % | | | 1.19 | % | | | 1.25 | % | | | 1.27 | % | | | 1.29 | % |
Expenses (before waiver/reimbursement) | | | 1.17 | %†† | | | 1.20 | % | | | 1.19 | % | | | 1.25 | % | | | 1.31 | % | | | 1.29 | % |
Portfolio turnover rate | | | 77 | %(d) | | | 209 | %(d) | | | 221 | %(d) | | | 123 | % | | | 162 | % | | | 69 | % |
Net assets at end of period (in 000’s) | | $ | 161,506 | | | $ | 140,585 | | | $ | 133,436 | | | $ | 152,963 | | | $ | 154,728 | | | $ | 173,834 | |
| (a) | Per share data based on average shares outstanding during the period. |
| (b) | Total investment return is calculated exclusive of sales charges and assumes the reinvestment of dividends and distributions. |
| (c) | Total investment return is not annualized. |
| (d) | The portfolio turnover rates not including mortgage dollar rolls were 74%, 202% and 218% for the six months ended April 30, 2013 and for the years ended October 31, 2012 and 2011, respectively. |
| | | | |
| 30 | | MainStay Balanced Fund | | The notes to the financial statements are an integral part of,
and should be read in conjunction with, the financial statements. |
Financial Highlights selected per share data and ratios
| | | | | | | | | | | | | | | | | | | | | | | | |
| | | Class B | |
| | | Six months
ended
April 30, | | | Year ended October 31, | |
| | | 2013* | | | 2012 | | | 2011 | | | 2010 | | | 2009 | | | 2008 | |
Net asset value at beginning of period | | $ | 28.30 | | | $ | 25.97 | | | $ | 24.87 | | | $ | 22.02 | | | $ | 19.35 | | | $ | 28.34 | |
| | | | | | | | | | | | | | | | | | | | | | | | |
Net investment income (loss) (a) | | | 0.05 | | | | 0.05 | | | | 0.10 | | | | 0.13 | | | | 0.08 | | | | 0.26 | |
Net realized and unrealized gain (loss) on investments | | | 3.37 | | | | 2.31 | | | | 1.10 | | | | 2.84 | | | | 2.69 | | | | (7.25 | ) |
| | | | | | | | | | | | | | | | | | | | | | | | |
Total from investment operations | | | 3.42 | | | | 2.36 | | | | 1.20 | | | | 2.97 | | | | 2.77 | | | | (6.99 | ) |
| | | | | | | | | | | | | | | | | | | | | | | | |
Less dividends and distributions: | | | | | | | | | | | | | | | | | | | | | | | | |
From net investment income | | | (0.04 | ) | | | (0.03 | ) | | | (0.10 | ) | | | (0.12 | ) | | | (0.10 | ) | | | (0.25 | ) |
From net realized gain on investments | | | — | | | | — | | | | — | | | | — | | | | — | | | | (1.75 | ) |
| | | | | | | | | | | | | | | | | | | | | | | | |
Total dividends and distributions | | | (0.04 | ) | | | (0.03 | ) | | | (0.10 | ) | | | (0.12 | ) | | | (0.10 | ) | | | (2.00 | ) |
| | | | | | | | | | | | | | | | | | | | | | | | |
Net asset value at end of period | | $ | 31.68 | | | $ | 28.30 | | | $ | 25.97 | | | $ | 24.87 | | | $ | 22.02 | | | $ | 19.35 | |
| | | | | | | | | | | | | | | | | | | | | | | | |
Total investment return (b) | | | 12.09 | %(c) | | | 9.11 | % | | | 4.83 | % | | | 13.50 | % | | | 14.42 | % | | | (26.47 | %) |
Ratios (to average net assets)/Supplemental Data: | | | | | | | | | | | | | | | | | | | | | | | | |
Net investment income (loss) | | | 0.32 | %†† | | | 0.19 | % | | | 0.37 | % | | | 0.53 | % | | | 0.39 | % | | | 1.06 | % |
Net expenses | | | 2.11 | %†† | | | 2.14 | % | | | 2.13 | % | | | 2.19 | % | | | 2.23 | % | | | 2.10 | % |
Expenses (before waiver/reimbursement) | | | 2.11 | %†† | | | 2.14 | % | | | 2.13 | % | | | 2.19 | % | | | 2.28 | % | | | 2.10 | % |
Portfolio turnover rate | | | 77 | %(d) | | | 209 | %(d) | | | 221 | %(d) | | | 123 | % | | | 162 | % | | | 69 | % |
Net assets at end of period (in 000’s) | | $ | 46,346 | | | $ | 49,835 | | | $ | 61,438 | | | $ | 70,778 | | | $ | 74,932 | | | $ | 81,144 | |
| (a) | Per share data based on average shares outstanding during the period. |
| (b) | Total investment return is calculated exclusive of sales charges and assumes the reinvestment of dividends and distributions. |
| (c) | Total investment return is not annualized. |
| (d) | The portfolio turnover rates not including mortgage dollar rolls were 74%, 202% and 218% for the six months ended April 30, 2013 and for the years ended October 31, 2012 and 2011, respectively. |
| | | | | | |
The notes to the financial statements are an integral part of,
and should be read in conjunction with, the financial statements. | | mainstayinvestments.com | | | 31 | |
Financial Highlights selected per share data and ratios
| | | | | | | | | | | | | | | | | | | | | | | | |
| | | Class C | |
| | | Six months
ended
April 30, | | | Year ended October 31, | |
| | | 2013* | | | 2012 | | | 2011 | | | 2010 | | | 2009 | | | 2008 | |
Net asset value at beginning of period | | $ | 28.29 | | | $ | 25.96 | | | $ | 24.86 | | | $ | 22.01 | | | $ | 19.34 | | | $ | 28.33 | |
| | | | | | | | | | | | | | | | | | | | | | | | |
Net investment income (loss) (a) | | | 0.04 | | | | 0.05 | | | | 0.10 | | | | 0.13 | | | | 0.08 | | | | 0.26 | |
Net realized and unrealized gain (loss) on investments | | | 3.38 | | | | 2.31 | | | | 1.10 | | | | 2.84 | | | | 2.69 | | | | (7.25 | ) |
| | | | | | | | | | | | | | | | | | | | | | | | |
Total from investment operations | | | 3.42 | | | | 2.36 | | | | 1.20 | | | | 2.97 | | | | 2.77 | | | | (6.99 | ) |
| | | | | | | | | | | | | | | | | | | | | | | | |
Less dividends and distributions: | | | | | | | | | | | | | | | | | | | | | | | | |
From net investment income | | | (0.04 | ) | | | (0.03 | ) | | | (0.10 | ) | | | (0.12 | ) | | | (0.10 | ) | | | (0.25 | ) |
From net realized gain on investments | | | — | | | | — | | | | — | | | | — | | | | — | | | | (1.75 | ) |
| | | | | | | | | | | | | | | | | | | | | | | | |
Total dividends and distributions | | | (0.04 | ) | | | (0.03 | ) | | | (0.10 | ) | | | (0.12 | ) | | | (0.10 | ) | | | (2.00 | ) |
| | | | | | | | | | | | | | | | | | | | | | | | |
Net asset value at end of period | | $ | 31.67 | | | $ | 28.29 | | | $ | 25.96 | | | $ | 24.86 | | | $ | 22.01 | | | $ | 19.34 | |
| | | | | | | | | | | | | | | | | | | | | | | | |
Total investment return (b) | | | 12.09 | %(c) | | | 9.11 | % | | | 4.83 | % | | | 13.51 | % | | | 14.43 | % | | | (26.48 | %) |
Ratios (to average net assets)/Supplemental Data: | | | | | | | | | | | | | | | | | | | | | | | | |
Net investment income (loss) | | | 0.29 | %†† | | | 0.19 | % | | | 0.37 | % | | | 0.53 | % | | | 0.40 | % | | | 1.06 | % |
Net expenses | | | 2.11 | %†† | | | 2.14 | % | | | 2.13 | % | | | 2.19 | % | | | 2.23 | % | | | 2.10 | % |
Expenses (before waiver/reimbursement) | | | 2.11 | %†† | | | 2.14 | % | | | 2.13 | % | | | 2.19 | % | | | 2.28 | % | | | 2.10 | % |
Portfolio turnover rate | | | 77 | %(d) | | | 209 | %(d) | | | 221 | %(d) | | | 123 | % | | | 162 | % | | | 69 | % |
Net assets at end of period (in 000’s) | | $ | 58,783 | | | $ | 52,876 | | | $ | 56,010 | | | $ | 62,892 | | | $ | 66,407 | | | $ | 79,423 | |
| (a) | Per share data based on average shares outstanding during the period. |
| (b) | Total investment return is calculated exclusive of sales charges and assumes the reinvestment of dividends and distributions. |
| (c) | Total investment return is not annualized. |
| (d) | The portfolio turnover rates not including mortgage dollar rolls were 74%, 202% and 218% for the six months ended April 30, 2013 and for the years ended October 31, 2012 and 2011, respectively. |
| | | | |
| 32 | | MainStay Balanced Fund | | The notes to the financial statements are an integral part of,
and should be read in conjunction with, the financial statements. |
Financial Highlights selected per share data and ratios
| | | | | | | | | | | | | | | | | | | | | | | | |
| | | Class I | |
| | | Six months
ended
April 30, | | | Year ended October 31, | |
| | | 2013* | | | 2012 | | | 2011 | | | 2010 | | | 2009 | | | 2008 | |
Net asset value at beginning of period | | $ | 28.42 | | | $ | 26.08 | | | $ | 24.99 | | | $ | 22.12 | | | $ | 19.44 | | | $ | 28.47 | |
| | | | | | | | | | | | | | | | | | | | | | | | |
Net investment income (loss) (a) | | | 0.22 | | | | 0.38 | | | | 0.41 | | | | 0.41 | | | | 0.33 | | | | 0.55 | |
Net realized and unrealized gain (loss) on investments | | | 3.39 | | | | 2.32 | | | | 1.10 | | | | 2.86 | | | | 2.71 | | | | (7.28 | ) |
| | | | | | | | | | | | | | | | | | | | | | | | |
Total from investment operations | | | 3.61 | | | | 2.70 | | | | 1.51 | | | | 3.27 | | | | 3.04 | | | | (6.73 | ) |
| | | | | | | | | | | | | | | | | | | | | | | | |
Less dividends and distributions: | | | | | | | | | | | | | | | | | | | | | | | | |
From net investment income | | | (0.21 | ) | | | (0.36 | ) | | | (0.42 | ) | | | (0.40 | ) | | | (0.36 | ) | | | (0.55 | ) |
From net realized gain on investments | | | — | | | | — | | | | — | | | | — | | | | — | | | | (1.75 | ) |
| | | | | | | | | | | | | | | | | | | | | | | | |
Total dividends and distributions | | | (0.21 | ) | | | (0.36 | ) | | | (0.42 | ) | | | (0.40 | ) | | | (0.36 | ) | | | (2.30 | ) |
| | | | | | | | | | | | | | | | | | | | | | | | |
Net asset value at end of period | | $ | 31.82 | | | $ | 28.42 | | | $ | 26.08 | | | $ | 24.99 | | | $ | 22.12 | | | $ | 19.44 | |
| | | | | | | | | | | | | | | | | | | | | | | | |
Total investment return (b) | | | 12.77 | %(c) | | | 10.43 | % | | | 6.04 | % | | | 14.90 | % | | | 15.89 | % | | | (25.62 | %) |
Ratios (to average net assets)/Supplemental Data: | | | | | | | | | | | | | | | | | | | | | | | | |
Net investment income (loss) | | | 1.47 | %†† | | | 1.38 | % | | | 1.56 | % | | | 1.73 | % | | | 1.65 | % | | | 2.22 | % |
Net expenses | | | 0.92 | %†† | | | 0.95 | % | | | 0.94 | % | | | 1.00 | % | | | 0.96 | % | | | 0.94 | % |
Expenses (before waiver/reimbursement) | | | 0.92 | %†† | | | 0.95 | % | | | 0.94 | % | | | 1.00 | % | | | 1.06 | % | | | 1.01 | % |
Portfolio turnover rate | | | 77 | %(d) | | | 209 | %(d) | | | 221 | %(d) | | | 123 | % | | | 162 | % | | | 69 | % |
Net assets at end of period (in 000’s) | | $ | 264,950 | | | $ | 227,707 | | | $ | 208,772 | | | $ | 219,406 | | | $ | 208,393 | | | $ | 199,126 | |
| (a) | Per share data based on average shares outstanding during the period. |
| (b) | Total investment return is calculated exclusive of sales charges and assumes the reinvestment of dividends and distributions. Class I shares are not subject to sales charges. |
| (c) | Total investment return is not annualized. |
| (d) | The portfolio turnover rates not including mortgage dollar rolls were 74%, 202% and 218% for the six months ended April 30, 2013 and for the years ended October 31, 2012 and 2011, respectively. |
| | | | | | |
The notes to the financial statements are an integral part of,
and should be read in conjunction with, the financial statements. | | mainstayinvestments.com | | | 33 | |
Financial Highlights selected per share data and ratios
| | | | | | | | | | | | | | | | | | | | | | | | |
| | | Class R1 | |
| | | Six months
ended
April 30, | | | Year ended October 31, | |
| | | 2013* | | | 2012 | | | 2011 | | | 2010 | | | 2009 | | | 2008 | |
Net asset value at beginning of period | | $ | 28.39 | | | $ | 26.05 | | | $ | 24.96 | | | $ | 22.10 | | | $ | 19.42 | | | $ | 28.44 | |
| | | | | | | | | | | | | | | | | | | | | | | | |
Net investment income (loss) (a) | | | 0.20 | | | | 0.35 | | | | 0.38 | | | | 0.39 | | | | 0.30 | | | | 0.53 | |
Net realized and unrealized gain (loss) on investments | | | 3.39 | | | | 2.32 | | | | 1.10 | | | | 2.85 | | | | 2.72 | | | | (7.28 | ) |
| | | | | | | | | | | | | | | | | | | | | | | | |
Total from investment operations | | | 3.59 | | | | 2.67 | | | | 1.48 | | | | 3.24 | | | | 3.02 | | | | (6.75 | ) |
| | | | | | | | | | | | | | | | | | | | | | | | |
Less dividends and distributions: | | | | | | | | | | | | | | | | | | | | | | | | |
From net investment income | | | (0.20 | ) | | | (0.33 | ) | | | (0.39 | ) | | | (0.38 | ) | | | (0.34 | ) | | | (0.52 | ) |
From net realized gain on investments | | | — | | | | — | | | | — | | | | — | | | | — | | | | (1.75 | ) |
| | | | | | | | | | | | | | | | | | | | | | | | |
Total dividends and distributions | | | (0.20 | ) | | | (0.33 | ) | | | (0.39 | ) | | | (0.38 | ) | | | (0.34 | ) | | | (2.27 | ) |
| | | | | | | | | | | | | | | | | | | | | | | | |
Net asset value at end of period | | $ | 31.78 | | | $ | 28.39 | | | $ | 26.05 | | | $ | 24.96 | | | $ | 22.10 | | | $ | 19.42 | |
| | | | | | | | | | | | | | | | | | | | | | | | |
Total investment return (b) | | | 12.69 | %(c) | | | 10.33 | % | | | 5.94 | % | | | 14.75 | % | | | 15.80 | % | | | (25.69 | %) |
Ratios (to average net assets)/Supplemental Data: | | | | | | | | | | | | | | | | | | | | | | | | |
Net investment income (loss) | | | 1.38 | %†† | | | 1.28 | % | | | 1.46 | % | | | 1.64 | % | | | 1.53 | % | | | 2.13 | % |
Net expenses | | | 1.02 | %†† | | | 1.05 | % | | | 1.04 | % | | | 1.10 | % | | | 1.06 | % | | | 1.04 | % |
Expenses (before reimbursement/waiver) | | | 1.02 | %†† | | | 1.05 | % | | | 1.04 | % | | | 1.10 | % | | | 1.16 | % | | | 1.11 | % |
Portfolio turnover rate | | | 77 | %(d) | | | 209 | %(d) | | | 221 | %(d) | | | 123 | % | | | 162 | % | | | 69 | % |
Net assets at end of period (in 000’s) | | $ | 10,148 | | | $ | 9,441 | | | $ | 20,337 | | | $ | 19,660 | | | $ | 31,039 | | | $ | 25,038 | |
| (a) | Per share data based on average shares outstanding during the period. |
| (b) | Total investment return is calculated exclusive of sales charges and assumes the reinvestment of dividends and distributions. Class R1 shares are not subject to sales charges. |
| (c) | Total investment return is not annualized. |
| (d) | The portfolio turnover rates not including mortgage dollar rolls were 74%, 202% and 218% for the six months ended April 30, 2013 and for the years ended October 31, 2012 and 2011, respectively. |
| | | | |
| 34 | | MainStay Balanced Fund | | The notes to the financial statements are an integral part of,
and should be read in conjunction with, the financial statements. |
Financial Highlights selected per share data and ratios
| | | | | | | | | | | | | | | | | | | | | | | | |
| | | Class R2 | |
| | | Six months
ended
April 30, | | | Year ended October 31, | |
| | | 2013* | | | 2012 | | | 2011 | | | 2010 | | | 2009 | | | 2008 | |
Net asset value at beginning of period | | $ | 28.37 | | | $ | 26.03 | | | $ | 24.94 | | | $ | 22.08 | | | $ | 19.41 | | | $ | 28.42 | |
| | | | | | | | | | | | | | | | | | | | | | | | |
Net investment income (loss) (a) | | | 0.17 | | | | 0.28 | | | | 0.31 | | | | 0.33 | | | | 0.26 | | | | 0.46 | |
Net realized and unrealized gain (loss) on investments | | | 3.37 | | | | 2.33 | | | | 1.10 | | | | 2.85 | | | | 2.70 | | | | (7.26 | ) |
| | | | | | | | | | | | | | | | | | | | | | | | |
Total from investment operations | | | 3.54 | | | | 2.61 | | | | 1.41 | | | | 3.18 | | | | 2.96 | | | | (6.80 | ) |
| | | | | | | | | | | | | | | | | | | | | | | | |
Less dividends and distributions: | | | | | | | | | | | | | | | | | | | | | | | | |
From net investment income | | | (0.16 | ) | | | (0.27 | ) | | | (0.32 | ) | | | (0.32 | ) | | | (0.29 | ) | | | (0.46 | ) |
From net realized gain on investments | | | — | | | | — | | | | — | | | | — | | | | — | | | | (1.75 | ) |
| | | | | | | | | | | | | | | | | | | | | | | | |
Total dividends and distributions | | | (0.16 | ) | | | (0.27 | ) | | | (0.32 | ) | | | (0.32 | ) | | | (0.29 | ) | | | (2.21 | ) |
| | | | | | | | | | | | | | | | | | | | | | | | |
Net asset value at end of period | | $ | 31.75 | | | $ | 28.37 | | | $ | 26.03 | | | $ | 24.94 | | | $ | 22.08 | | | $ | 19.41 | |
| | | | | | | | | | | | | | | | | | | | | | | | |
Total investment return (b) | | | 12.53 | %(c) | | | 10.06 | % | | | 5.68 | % | | | 14.47 | % | | | 15.45 | % | | | (25.86 | %) |
Ratios (to average net assets)/Supplemental Data: | | | | | | | | | | | | | | | | | | | | | | | | |
Net investment income (loss) | | | 1.15 | %†† | | | 1.03 | % | | | 1.21 | % | | | 1.38 | % | | | 1.30 | % | | | 1.87 | % |
Net expenses | | | 1.27 | %†† | | | 1.30 | % | | | 1.29 | % | | | 1.35 | % | | | 1.31 | % | | | 1.29 | % |
Expenses (before waiver/reimbursement) | | | 1.27 | %†† | | | 1.30 | % | | | 1.29 | % | | | 1.35 | % | | | 1.41 | % | | | 1.36 | % |
Portfolio turnover rate | | | 77 | %(d) | | | 209 | %(d) | | | 221 | %(d) | | | 123 | % | | | 162 | % | | | 69 | % |
Net assets at end of period (in 000’s) | | $ | 49,357 | | | $ | 45,799 | | | $ | 41,344 | | | $ | 41,429 | | | $ | 60,425 | | | $ | 54,849 | |
| (a) | Per share data based on average shares outstanding during the period. |
| (b) | Total investment return is calculated exclusive of sales charges and assumes the reinvestment of dividends and distributions. Class R2 shares are not subject to sales charges. |
| (c) | Total investment return is not annualized. |
| (d) | The portfolio turnover rates not including mortgage dollar rolls were 74%, 202% and 218% for the six months ended April 30, 2013 and for the years ended October 31, 2012 and 2011, respectively. |
| | | | | | |
The notes to the financial statements are an integral part of,
and should be read in conjunction with, the financial statements. | | mainstayinvestments.com | | | 35 | |
Financial Highlights selected per share data and ratios
| | | | | | | | | | | | | | | | | | | | | | | | |
| | | Class R3 | |
| | | Six months
ended
April 30, | | | Year ended October 31, | |
| | | 2013* | | | 2012 | | | 2011 | | | 2010 | | | 2009 | | | 2008 | |
Net asset value at beginning of period | | $ | 28.36 | | | $ | 26.03 | | | $ | 24.93 | | | $ | 22.08 | | | $ | 19.41 | | | $ | 28.41 | |
| | | | | | | | | | | | | | | | | | | | | | | | |
Net investment income (loss) (a) | | | 0.09 | | | | 0.21 | | | | 0.24 | | | | 0.27 | | | | 0.20 | | | | 0.40 | |
Net realized and unrealized gain (loss) on investments | | | 3.43 | | | | 2.32 | | | | 1.12 | | | | 2.84 | | | | 2.71 | | | | (7.26 | ) |
| | | | | | | | | | | | | | | | | | | | | | | | |
Total from investment operations | | | 3.52 | | | | 2.53 | | | | 1.36 | | | | 3.11 | | | | 2.91 | | | | (6.86 | ) |
| | | | | | | | | | | | | | | | | | | | | | | | |
Less dividends and distributions: | | | | | | | | | | | | | | | | | | | | | | | | |
From net investment income | | | (0.13 | ) | | | (0.20 | ) | | | (0.26 | ) | | | (0.26 | ) | | | (0.24 | ) | | | (0.39 | ) |
From net realized gain on investments | | | — | | | | — | | | | — | | | | — | | | | — | | | | (1.75 | ) |
| | | | | | | | | | | | | | | | | | | | | | | | |
Total dividends and distributions | | | (0.13 | ) | | | (0.20 | ) | | | (0.26 | ) | | | (0.26 | ) | | | (0.24 | ) | | | (2.14 | ) |
| | | | | | | | | | | | | | | | | | | | | | | | |
Net asset value at end of period | | $ | 31.75 | | | $ | 28.36 | | | $ | 26.03 | | | $ | 24.93 | | | $ | 22.08 | | | $ | 19.41 | |
| | | | | | | | | | | | | | | | | | | | | | | | |
Total investment return (b) | | | 12.43 | %(c) | | | 9.76 | % | | | 5.47 | % | | | 14.16 | % | | | 15.17 | % | | | (26.02 | %) |
Ratios (to average net assets)/Supplemental Data: | | | | | | | | | | | | | | | | | | | | | | | | |
Net investment income (loss) | | | 0.63 | %†† | | | 0.77 | % | | | 0.92 | % | | | 1.12 | % | | | 0.98 | % | | | 1.62 | % |
Net expenses | | | 1.52 | %†† | | | 1.55 | % | | | 1.54 | % | | | 1.59 | % | | | 1.56 | % | | | 1.54 | % |
Expenses (before waiver/reimbursement) | | | 1.52 | %†† | | | 1.55 | % | | | 1.54 | % | | | 1.59 | % | | | 1.65 | % | | | 1.61 | % |
Portfolio turnover rate | | | 77 | %(d) | | | 209 | %(d) | | | 221 | %(d) | | | 123 | % | | | 162 | % | | | 69 | % |
Net assets at end of period (in 000’s) | | $ | 1,092 | | | $ | 329 | | | $ | 234 | | | $ | 168 | | | $ | 88 | | | $ | 45 | |
| (a) | Per share data based on average shares outstanding during the period. |
| (b) | Total investment return is calculated exclusive of sales charges and assumes the reinvestment of dividends and distributions. Class R3 shares are not subject to sales charges. |
| (c) | Total investment return is not annualized. |
| (d) | The portfolio turnover rates not including mortgage dollar rolls were 74%, 202% and 218% for the six months ended April 30, 2013 and for the years ended October 31, 2012 and 2011, respectively. |
| | | | |
| 36 | | MainStay Balanced Fund | | The notes to the financial statements are an integral part of,
and should be read in conjunction with, the financial statements. |
Notes to Financial Statements (Unaudited)
Note 1–Organization and Business
MainStay Funds Trust (the “Trust”) was organized as a Delaware statutory trust on April 28, 2009, and is governed by a Declaration of Trust. The Trust is registered under the Investment Company Act of 1940, as amended (the “1940 Act”), as an open-end investment management company, and is comprised of thirty-three funds (collectively referred to as the “Funds”). These financial statements and notes relate only to the MainStay Balanced Fund (the “Fund”), a diversified fund. The Fund is the successor of the MainStay Balanced Fund, a series of Eclipse Funds (the “Predecessor Fund”). The reorganization of the Predecessor Fund with and into the Fund occurred on May 25, 2012. All information and references to periods prior to May 25, 2012 relate to the Predecessor Fund.
The Fund currently offers eight classes of shares. Class I shares commenced operations on May 1, 1989. Class C shares commenced operations on December 30, 2002. Class A, Class B, Class R1 and Class R2 shares commenced operations on January 2, 2004. Class R3 shares commenced operations on April 28, 2006. Investor Class shares commenced operations on February 28, 2008. Investor Class and Class A shares are offered at net asset value (“NAV”) per share plus an initial sales charge. No sales charge applies to investments of $1 million or more (and certain other qualified purchases) in Investor Class and Class A shares, but a contingent deferred sales charge (“CDSC”) is imposed on certain redemptions made within one year of the date of purchase. Class B and Class C shares are offered at NAV without an initial sales charge, although a declining CDSC may be imposed on redemptions made within six years of the date of purchase of Class B shares and a 1.00% CDSC may be imposed on redemptions made within one year of the date of purchase of Class C shares. Class I, Class R1, Class R2 and Class R3 shares are offered at NAV and are not subject to a sales charge. Depending upon eligibility, Class B shares convert to either Investor Class or Class A shares at the end of the calendar quarter eight years after the date they were purchased. Additionally, depending upon eligibility, Investor Class shares may convert to Class A shares and Class A shares may convert to Investor Class shares. The eight classes of shares have the same voting (except for issues that relate solely to one class), dividend, liquidation and other rights, and the same terms and conditions, except that Class B and Class C shares are subject to higher distribution and/or service fee rates than Investor Class, Class A, Class R2 and Class R3 shares under a distribution plan pursuant to Rule 12b-1 under the 1940 Act. Class I and Class R1 shares are not subject to a distribution and/or service fee. Class R1, Class R2 and Class R3 shares are subject to a shareholder service fee. This is in addition to any fees paid under a distribution plan, where applicable.
The Fund’s investment objective is to seek total return.
Note 2–Significant Accounting Policies
The Fund prepares its financial statements in accordance with generally accepted accounting principles (“GAAP”) in the United States of America and follows the significant accounting policies described below.
(A) Securities Valuation. Investments are valued as of the close of regular trading on the New York Stock Exchange (“Exchange”) (generally 4:00 p.m. Eastern time) on each day the Fund is open for business (“valuation date”).
The Board of Trustees (the “Board”) has adopted procedures for the valuation of the Fund’s securities and has delegated the responsibility for valuation determination under those procedures to the Valuation Committee of the Fund (the “Valuation Committee”). The Board has authorized the Valuation Committee to appoint a Valuation Sub-Committee (the “Sub-Committee”) to deal in the first instance with questions that arise or cannot be resolved under these procedures. The Sub-Committee meets (in person, via electronic mail or via teleconference) on an as-needed basis. The Valuation Committee meets at a later time, as necessary, to ensure that actions taken by the Sub-Committee were appropriate. The procedures recognize that, subject to the oversight of the Board and unless otherwise noted, the responsibility for day-to-day valuation of portfolio assets (including securities for which market prices are not readily available) rests with New York Life Investment Management LLC ( “New York Life Investments” or the “Manager”), aided to whatever extent necessary by the Subadvisor (as defined in Note 3(A)) of the Fund.
To assess the appropriateness of security valuations, the Manager or the Fund’s third party service provider who is subject to oversight by the Manager, regularly compares prior day prices, prices on comparable securities and the sale prices to the prior and current day prices and challenges prices exceeding certain tolerance levels with third party pricing services or broker sources. For those securities valued by recommendation, whether through a standardized fair valuation methodology or a fair valuation determination, the Valuation Committee reviews and affirms the reasonableness of the valuation based on such methodologies and determinations on a regular basis after considering all relevant information that is reasonably available.
“Fair value” is defined as the price that the Fund would receive upon selling an investment in an orderly transaction to an independent buyer in the principal or most advantageous market of the investment. Fair value measurements are determined within a framework that has established a three-tier hierarchy which maximizes the use of observable market data and minimizes the use of unobservable inputs to establish classification of fair value measurements for disclosure purposes. “Inputs” refers broadly to the assumptions that market participants would use in pricing the asset or liability, including assumptions about risk, such as the risk inherent in a particular valuation technique used to measure fair value using a pricing model and/or the risk inherent in the inputs for the valuation technique. Inputs may be observable or unobservable. Observable inputs reflect the assumptions market participants would use in pricing the asset or liability based on market data obtained from sources independent of the Fund. Unobservable inputs reflect the Fund’s own assumptions about the assumptions market participants would use in pricing the asset or liability developed based on the information available in the circumstances. The inputs or methodology used for valuing securities may not be an indication of the risks associated with investing in those securities. The three-tier hierarchy of inputs is summarized in the three broad Levels listed below.
| • | | Level 1—quoted prices in active markets for identical investments |
| • | | Level 2—other significant observable inputs (including quoted prices for similar investments in active markets, interest rates and yield curves, prepayment speeds, credit risks, etc.) |
| | | | |
| mainstayinvestments.com | | | 37 | |
Notes to Financial Statements (Unaudited) (continued)
| • | | Level 3—significant unobservable inputs (including the Fund’s own assumptions about the assumptions that market participants would use in determining the fair value of investments) |
The aggregate value by input level, as of April 30, 2013, for the Fund’s investments is included at the end of the Fund’s Portfolio of Investments.
The valuation techniques used by the Fund to measure fair value maximize the use of observable inputs and minimize the use of unobservable inputs. The Fund may utilize third party vendor evaluations, whose prices may be derived from one or more of the following standard inputs:
| | |
• Benchmark Yields | | • Reported Trades |
• Broker Dealer Quotes | | • Issuer Spreads |
• Two-sided markets | | • Benchmark securities |
• Bids/Offers | | • Reference Data (corporate actions or material event notices) |
• Industry and economic events | | • Comparable bonds |
• Equity and credit default swap curves | | • Monthly payment information |
Securities for which market values cannot be determined using the methodologies described above are valued by methods deemed in good faith by the Fund’s Valuation Committee, following the procedures established by the Board, to represent fair value. Under these procedures, the Fund primarily employs a market-based approach which may use related or comparable assets or liabilities, recent transactions, market multiples, book values, and other relevant information. The Fund may also use an income-based valuation approach in which the anticipated future cash flows of the investment are discounted to calculate fair value. Discounts may also be applied due to the nature or duration of any restrictions on the disposition of the investments. Due to the inherent uncertainty of valuations of such investments, the fair values may differ significantly from the values that would have been used had an active market existed. For the six-month period ended April 30, 2013, there have been no changes to the fair value methodologies.
Equity and non-equity securities which may be valued in this manner include, but are not limited to: (i) a security for which the trading has been halted or suspended; (ii) a debt security that has recently gone into default and for which there is not a current market quotation; (iii) a security of an issuer that has entered into a restructuring; (iv) a security that has been de-listed from a national exchange; (v) a security for which the market price is not available from a third party pricing source or, if so provided, does not, in the opinion of the Fund’s Manager or Subadvisor reflect the security’s market value; and (vi) a security whose principal market has been temporarily closed at a time when, under normal conditions, it would be open. Securities for which market quotations or observable inputs are not readily available are generally categorized as Level 3 in the hierarchy. As of April 30, 2013, the Fund held securities with a value of $4,700,673 that were fair valued in such a manner.
Certain events may occur between the time that foreign markets close, on which securities held by the Fund principally trade, and the time at which the Fund’s NAV is calculated. These events may include, but are not limited to, situations relating to a single issuer in a market sector, significant fluctuations in U.S. or foreign markets, natural disasters,
armed conflicts, governmental actions or other developments not tied directly to the securities markets. Should the Manager or Subadvisor conclude that such events may have affected the accuracy of the last price of such securities reported on the local foreign market, the Manager or Subadvisor may, pursuant to procedures adopted by the Board, adjust the value of the local price to reflect the estimated impact on the price of such securities as a result of such events. In this instance, securities are generally categorized as Level 3 in the hierarchy. Additionally, foreign equity securities are also fair valued whenever the movement of a particular index exceeds certain thresholds. In such cases, the securities are fair valued by applying factors provided by a third party vendor in accordance with the Fund’s policies and procedures and are generally categorized as Level 2 in the hierarchy. As of April 30, 2013, certain foreign equity securities held by the Fund were not fair valued in such a manner.
Equity securities and Exchange Traded Funds are valued at the latest quoted sales prices as of the close of regular trading on the Exchange on each valuation date. Securities that are not traded on the valuation date are valued at the mean of the latest quoted bid and ask prices. Prices normally are taken from the principal market in which each security trades. Futures contracts are valued at the last posted settlement price on the market where such futures are primarily traded. Investments in other mutual funds are valued at their respective NAVs as of the close of the Exchange on the valuation date. These securities are generally categorized as Level 1 in the hierarchy.
Debt securities (other than convertible bonds and municipal debt securities) are valued at the evaluated bid prices (evaluated mean prices in the case of convertible bonds and municipal debt securities) supplied by a pricing agent or broker selected by the Fund’s Manager in consultation with the Fund’s Subadvisor, whose prices reflect broker/dealer supplied valuations and electronic data processing techniques, if such prices are deemed by the Fund’s Manager, in consultation with the Fund’s Subadvisor to be representative of market values, at the regular close of trading of the Exchange on each valuation date. Debt securities, including corporate bonds, U.S. government and federal agency bonds, municipal bonds, foreign bonds, Yankee bonds, convertible bonds, asset-backed securities and mortgage-backed securities are generally categorized as Level 2 in the hierarchy.
Temporary cash investments acquired over 60 days to maturity are valued using the latest bid prices or using valuations based on a matrix system (which considers such factors as security prices, yields, maturities, and ratings), both as furnished by independent pricing services. Other temporary cash investments which mature in 60 days or less (“Short-Term Investments”) are valued at amortized cost. The amortized cost method involves valuing a security at its cost on the date of purchase and thereafter assuming a constant amortization to maturity of the difference between such cost and the value on maturity date. Amortized cost approximates the current fair value of a security. Securities valued at amortized cost are not valued using a quoted price in an active market. These securities are generally categorized as Level 2 in the hierarchy.
Generally, a security is considered illiquid if it cannot be sold or disposed of in the ordinary course of business at approximately the price at which it is valued. Its illiquidity might prevent the sale of such security at a time when the Manager or Subadvisor might wish to sell, and these
| | |
| 38 | | MainStay Balanced Fund |
securities could have the effect of decreasing the overall level of a Fund’s liquidity. Further, the lack of an established secondary market may make it more difficult to value illiquid securities, requiring the Fund to rely on judgments that may be somewhat subjective in determining value, which could vary from the amount that the Fund could realize upon disposition. Difficulty in selling illiquid securities may result in a loss or may be costly to the Fund. Under the supervision of the Board, the Manager or Subadvisor determines the liquidity of the Fund’s investments; in doing so, the Manager or Subadvisor may consider various factors, including (i) the frequency of trades and quotations, (ii) the number of dealers and prospective purchasers, (iii) dealer undertakings to make a market, and (iv) the nature of the security and the market in which it trades (e.g., the time needed to dispose of the security, the method of soliciting offers and the mechanics of transfer). Illiquid securities generally will be valued in good faith in such a manner as the Board deems appropriate to reflect their fair value.
(B) Income Taxes. The Fund’s policy is to comply with the requirements of the Internal Revenue Code of 1986, as amended (the “Internal Revenue Code”), applicable to regulated investment companies and to distribute all of the taxable income to the shareholders of the Fund within the allowable time limits. Therefore, no federal, state and local income tax provision is required.
Management evaluates its tax positions to determine if the tax positions taken meet the minimum recognition threshold in connection with accounting for uncertainties in income tax positions taken or expected to be taken for the purposes of measuring and recognizing tax liabilities in the financial statements. Recognition of tax benefits of an uncertain tax position is required only when the position is “more likely than not” to be sustained assuming examination by taxing authorities. Management has analyzed the Fund’s tax positions taken on federal, state and local income tax returns for all open tax years (for up to three tax years), and has concluded that no provision for federal, state and local income tax is required in the Fund’s financial statements. The Fund’s federal, state and local income and federal excise tax returns for tax years for which the applicable statutes of limitations have not expired are subject to examination by the Internal Revenue Service and state and local departments of revenue.
(C) Dividends and Distributions to Shareholders. Dividends and distributions are recorded on the ex-dividend date. The Fund intends to declare and pay dividends of net investment income, if any, at least quarterly and distributions of net realized capital and currency gains, if any, at least annually. Unless the shareholder elects otherwise, all dividends and distributions are reinvested in the same class of shares of the Fund, at NAV. Dividends and distributions to shareholders are determined in accordance with federal income tax regulations and may differ from GAAP.
(D) Security Transactions and Investment Income. The Fund records security transactions on the trade date. Realized gains and losses on security transactions are determined using the identified cost method and include gains and losses from repayments of principal on mortgage-backed securities. Dividend income is recognized on the ex-dividend date and interest income is accrued as earned using the effective interest rate method. Discounts and premiums on securities purchased, other than Short-Term Investments, for the Fund are accreted and amortized, respectively, on the effective interest rate
method over the life of the respective securities or, in the case of a callable security, over the period to the first date of call. Discounts and premiums on Short-Term Investments are accreted and amortized, respectively, on the straight-line method.
Investment income and realized and unrealized gains and losses on investments of the Fund are allocated to separate classes of shares pro rata based upon their relative net assets on the date the income is earned or realized and unrealized gains and losses are incurred.
(E) Expenses. Expenses of the Trust are allocated to the individual Funds in proportion to the net assets of the respective Funds when the expenses are incurred, except where direct allocations of expenses can be made. Expenses (other than transfer agent expenses and fees incurred under the shareholder services plans and the distribution plans further discussed in Note 3(B)) are allocated to separate classes of shares pro rata based upon their relative net assets on the date the expenses are incurred. The expenses borne by the Fund, including those of related parties to the Fund, are shown in the Statement of Operations.
(F) Use of Estimates. In preparing financial statements in conformity with GAAP, management makes estimates and assumptions that affect the reported amounts and disclosures in the financial statements. Actual results could differ from those estimates.
(G) Repurchase Agreements. The Fund may enter into repurchase agreements to earn income. The Fund may enter into repurchase agreements only with financial institutions that are deemed by the Manager or Subadvisor to be creditworthy, pursuant to guidelines established by the Fund’s Board. During the term of any repurchase agreement, the Manager or Subadvisor will continue to monitor the creditworthiness of the seller. Under the 1940 Act, repurchase agreements are considered to be collateralized loans by a Fund to the seller secured by the securities transferred to the Fund.
When the Fund invests in repurchase agreements, the Fund’s custodian takes possession of the collateral pledged for investments in the repurchase agreement. The underlying collateral is valued daily on a mark-to-market basis to determine that the value, including accrued interest, exceeds the repurchase price. In the event of the seller’s default on the obligation to repurchase, the Fund has the right to liquidate the collateral and apply the proceeds in satisfaction of the obligation. Under certain circumstances, such as in the event of default or bankruptcy by the counterparty to the agreement, realization and/or retention of the collateral may be subject to legal proceedings and possible realized loss to the Fund.
(H) Securities Lending. In order to realize additional income, the Fund may engage in securities lending, subject to the limitations set forth in the 1940 Act and relevant guidance by the staff of the Securities and Exchange Commission. In the event the Fund does engage in securities lending, the Fund will lend through its custodian, State Street Bank and Trust Company (“State Street”). State Street will manage the Fund’s cash collateral in accordance with the lending agreement between the Fund and State Street, and indemnify the Fund’s portfolio against counterparty risk. The loans will be collateralized by cash or securities at least equal at all times to the market value of the securities loaned. Collateral will consist of U.S. Government securities, cash equivalents or irrevocable letters of credit. The Fund may bear the risk of delay in recovery of, or loss of rights in, the securities loaned should the bor-
| | | | |
| mainstayinvestments.com | | | 39 | |
Notes to Financial Statements (Unaudited) (continued)
rower of the securities experience financial difficulty. The Fund may also record realized gain or loss on securities deemed sold due to a borrower’s inability to return securities on loan. The Fund will receive compensation for lending its securities in the form of fees or the retention of a portion of the interest on the investment of any cash received as collateral. The Fund also will continue to receive interest and dividends on the securities loaned and any gain or loss in the market price of the securities loaned that may occur during the term of the loan will be for the account of the Fund.
Although the Fund and New York Life Investments have temporarily suspended securities lending, the Fund and New York Life Investments reserve the right to reinstitute lending when deemed appropriate. The Fund did not have any portfolio securities on loan as of April 30, 2013.
(I) Dollar Rolls. The Fund may enter into dollar roll transactions in which it sells mortgage-backed securities (“MBS”) from its portfolio to a counterparty from whom it simultaneously agrees to buy a similar security on a delayed delivery basis. The dollar roll transactions of the Fund are classified as purchase and sale transactions. The securities sold in connection with the dollar rolls are removed from the portfolio and a realized gain or loss is recognized. The securities the Fund has agreed to acquire are included at market value in the Portfolio of Investments and liabilities for such purchase commitments are included as payables for investments purchased. During the roll period, the Fund foregoes principal and interest paid on the securities. The Fund is compensated by the difference between the current sales price and the forward price for the future as well as by the earnings on the cash proceeds of the initial sale. Dollar rolls may be renewed without physical delivery of the securities subject to the contract. The Fund maintains liquid assets from its portfolio having a value not less than the repurchase price, including accrued interest. Dollar roll transactions involve certain risks, including the risk that the MBS returned to the Fund at the end of the roll period, while substantially similar, could be inferior to what was initially sold to the counterparty.
(J) Restricted Securities. A restricted security is a security which has been purchased through a private offering and cannot be resold to the general public without prior registration under the Securities Act of 1933, as amended. The Fund may not have the right to demand that such securities be registered. Disposal of these securities may involve time-consuming negotiations and expenses and it may be difficult to obtain a prompt sale at an acceptable price. (See Note 5)
(K) Concentration of Risk. The ability of issuers of debt securities held by the Fund to meet their obligations may be affected by economic or political developments in a specific country, industry or region.
(L) Indemnifications. Under the Trust’s organizational documents, its officers and trustees are indemnified against certain liabilities that may arise out of performance of their duties to the Trust. Additionally, in the normal course of business, the Fund enters into contracts with third-party service providers that contain a variety of representations and warranties and which may provide general indemnifications. The Fund’s maximum exposure under these arrangements is unknown, as this would involve future claims that may be made against the Fund that have not yet occurred. Based on experience, management is of the view that the risk of loss in connection with these potential indemnification obligations is remote. However, there can be no assurance that material
liabilities related to such obligations will not arise in the future, which could adversely impact the Fund.
Note 3–Fees and Related Party Transactions
(A) Manager and Subadvisor. New York Life Investments, a registered investment adviser and an indirect, wholly-owned subsidiary of New York Life Insurance Company (“New York Life”), serves as the Fund’s Manager, pursuant to an Amended and Restated Management Agreement (“Management Agreement”). The Manager provides offices, conducts clerical, recordkeeping and bookkeeping services, and keeps most of the financial and accounting records required to be maintained by the Fund. Except for the portion of salaries and expenses that are the responsibility of the Fund, the Manager pays the salaries and expenses of all personnel affiliated with the Fund and certain operational expenses of the Fund. The Fund reimburses New York Life Investments in an amount equal to a portion of the salary of the Chief Compliance Officer (“CCO”) of the Fund. New York Life Investments is also responsible for the day-to-day portfolio management of the fixed-income portion of the Fund. Cornerstone Capital Management Holdings LLC (“Cornerstone Holdings” or “Subadvisor”), a registered investment adviser and an indirect, wholly-owned subsidiary of New York Life, serves as Subadvisor to the equity portion of the Fund and is responsible for the day-to-day portfolio management of the equity portion of the Fund. Pursuant to the terms of a Subadvisory Agreement (“Subadvisory Agreement”) between New York Life Investments and Cornerstone Holdings, New York Life Investments pays for the services of the Subadvisor. Effective January 25, 2013, Madison Square Investors LLC changed its name to Cornerstone Capital Management Holdings LLC.
The Fund pays the Manager a monthly fee for services performed and facilities furnished at an annual rate of the Fund’s average daily net assets as follows: 0.70% up to $1 billion; 0.65% from $1 billion to $2 billion; and 0.60% in excess of $2 billion. The effective management fee rate (exclusive of any applicable waivers/reimbursements) was 0.70% for the six-month period ended April 30, 2013.
For the six-month period ended April 30, 2013, New York Life Investments earned fees from the Fund in the amount of $2,137,637.
State Street, 1 Lincoln Street, Boston, Massachusetts 02111, provides sub-administration and sub-accounting services to the Fund pursuant to an agreement with New York Life Investments. These services include calculating the daily NAVs of the Fund, maintaining the general ledger and sub-ledger accounts for the calculation of the Fund’s respective NAVs, and assisting New York Life Investments in conducting various aspects of the Fund’s administrative operations. For providing these services to the Fund, State Street is compensated by New York Life Investments.
(B) Distribution, Service and Shareholder Service Fees. The Trust, on behalf of the Fund, has entered into a distribution agreement with NYLIFE Distributors LLC (the ‘‘Distributor’’), an indirect, wholly-owned subsidiary of New York Life. The Fund has adopted distribution plans (the ‘‘Plans’’) in accordance with the provisions of Rule 12b-1 under the 1940 Act.
Pursuant to the Investor Class, Class A and Class R2 Plans, the Distributor receives a monthly distribution fee from the Investor Class, Class A and Class R2 shares, at an annual rate of 0.25% of the average daily net assets of the Investor Class, Class A and Class R2 shares for distribution and/or service activities as designated by the Distributor. Pursuant to the
| | |
| 40 | | MainStay Balanced Fund |
Class B and Class C Plans, Class B and Class C shares pay the Distributor a monthly distribution fee at an annual rate of 0.75% of the average daily net assets of the Class B and Class C shares, along with a service fee at an annual rate of 0.25% of the average daily net assets of the Class B and Class C shares, for a total 12b-1 fee of 1.00%. Pursuant to the Class R3 Plan, the Distributor receives a monthly distribution and/or service fee from the Class R3 shares at an annual rate of 0.50% of the average daily net assets of the Class R3 shares. Class I and Class R1 shares are not subject to a distribution and/or service fee.
The Plans provide that the distribution and service fees are payable to the Distributor regardless of the amounts actually expended by the Distributor for distribution of the Fund’s shares and service activities.
In accordance with the Shareholder Services Plans for the Class R1, Class R2 and Class R3 shares, the Manager has agreed to provide, through its affiliates or independent third parties, various shareholder and administrative support services to shareholders of the Class R1, Class R2 and Class R3 shares. For its services, the Manager is entitled to a Shareholder Service Fee accrued daily and paid monthly at an annual rate of 0.10% of the average daily net assets of the Class R1, Class R2 and Class R3 shares. This is in addition to any fees paid under a distribution plan, where applicable.
Shareholder Service Fees incurred by the Fund for the six-month period ended April 30, 2013, were as follows:
| | | | |
Class R1 | | $ | 5,007 | |
Class R2 | | | 22,657 | |
Class R3 | | | 395 | |
(C) Sales Charges. The Fund was advised by the Distributor that the amount of sales charges retained on sales of Investor Class and Class A shares were $15,283 and $16,188, respectively, for the six-month period ended April 30, 2013. The Fund was also advised that the Distributor retained CDSCs on redemptions of Investor Class, Class A, Class B and Class C shares of $3, $11, $20,810 and $1,895, respectively, for the six-month period ended April 30, 2013.
(D) Transfer, Dividend Disbursing and Shareholder Servicing Agent. NYLIM Service Company LLC, an affiliate of New York Life Investments, is the Fund’s transfer, dividend disbursing and shareholder servicing agent pursuant to an agreement between NYLIM Service Company LLC and the Trust. NYLIM Service Company LLC has entered into an agreement with Boston Financial Data Services, Inc. (“BFDS”) pursuant to which BFDS performs certain transfer agent services on behalf of NYLIM Service Company LLC. Transfer agent expenses incurred by the Fund for the six-month period ended April 30, 2013, were as follows:
| | | | |
Investor Class | | $ | 110,642 | |
Class A | | | 110,992 | |
Class B | | | 82,105 | |
Class C | | | 93,707 | |
Class I | | | 181,603 | |
Class R1 | | | 7,480 | |
Class R2 | | | 34,214 | |
Class R3 | | | 591 | |
(E) Small Account Fee. Shareholders with small accounts adversely impact the cost of providing transfer agency services. In an effort to reduce total transfer agency expenses, the Fund has implemented a small account fee on certain types of accounts. Certain shareholders with an account balance of less than $1,000 are charged an annual per account fee of $20 (assessed semi-annually), the proceeds from which offset transfer agent fees as reflected in the Statement of Operations.
(F) Capital. As of April 30, 2013, New York Life and its affiliates beneficially held shares of the Fund with values and percentages of net assets as follows:
Note 4–Federal Income Tax
Under the Regulated Investment Company Modernization Act of 2010, the Fund is permitted to carry forward capital losses incurred in taxable years beginning after December 22, 2010, for an unlimited period. However, any losses incurred during those future years will be required to be utilized prior to the losses incurred in pre-enactment tax years. As a result of this ordering rule, pre-enactment capital loss carryforwards may be more likely to expire unused. Additionally, post-enactment capital losses that are carried forward will retain their character as either short-term or long-term capital losses rather than being considered all short-term as under previous law.
As of October 31, 2012, for federal income tax purposes, capital loss carryforwards of $21,713,820 were available as shown in the table below, to the extent provided by the regulations to offset future realized gains of the Fund through the years indicated. To the extent that these capital loss carryforwards are used to offset future capital gains, it is probable that the capital gains so offset will not be distributed to shareholders. No capital gain distributions shall be made until any capital loss carryforwards have been fully utilized or expired.
| | | | | | | | |
Capital Loss
Available Through | | Short-Term Capital Loss
Amounts (000’s) | | | Long-Term Capital Loss
Amounts (000’s) | |
2017 | | $ | 21,714 | | | $ | — | |
Total | | $ | 21,714 | | | $ | — | |
The tax character of distributions paid during the year ended October 31, 2012, shown in the Statements of Changes in Net Assets was as follows:
| | | | |
| | | 2012 | |
Distributions paid from: | | | | |
Ordinary Income | | $ | 5,727,629 | |
| | | | |
| mainstayinvestments.com | | | 41 | |
Notes to Financial Statements (Unaudited) (continued)
Note 5–Restricted Securities
As of April 30, 2013, the Fund held the following restricted security:
| | | | | | | | | | | | | | | | | | | | |
Security | | Date of
Acquisition | | | Principal Amount | | | Cost | | | 4/30/13
Value | | | Percent of
Net Assets | |
At Home Corp.
Convertible Bond 4.75%, due 12/31/49 | | | 2/27/01 | | | $ | 177,810 | | | $ | 13,325 | | | $ | 18 | | | | 0.0 | %‡ |
| ‡ | Less than one-tenth of a percent. |
Note 6–Custodian
State Street is the custodian of the cash and the securities of the Fund. Custodial fees are charged to the Fund based on the market value of securities in the Fund and the number of certain cash transactions incurred by the Fund.
Note 7–Line of Credit
The Fund and certain affiliated funds maintain a line of credit with a syndicate of banks in order to secure a source of funds for temporary purposes to meet unanticipated or excessive redemption requests.
Effective August 29, 2012, under a second amended and restated credit agreement (the “Credit Agreement”), the aggregate commitment amount is $200,000,000 with an optional maximum amount of $250,000,000. The commitment fee is an annual rate of 0.08% of the average commitment amount payable quarterly, regardless of usage, to Bank of New York Mellon, which serves as the agent to the syndicate. The commitment fee is allocated among the Fund and certain affiliated funds based upon net assets and other factors. Interest on any revolving credit loan is charged based upon the Federal Funds Advances rate or the one month London InterBank Offered Rate, whichever is higher. The Credit Agreement expires on August 28, 2013, although the Fund, certain affiliated funds and the syndicate of banks may renew the Credit Agreement for an additional year on the same or different terms. There were no borrowings made or outstanding with respect to the Fund on the Credit Agreement during the six-month period ended April 30, 2013.
Note 8–Purchases and Sales of Securities (in 000’s)
During the six-month period ended April 30, 2013, purchases and sales of U.S. government securities were $153,634 and $151,945, respectively. Purchases and sales of securities, other than U.S. government securities and short-term securities, were $319,518 and $331,405, respectively.
Note 9–Capital Share Transactions
| | | | | | | | |
Investor Class | | Shares | | | Amount | |
Six-month period ended April 30, 2013: | | | | | | | | |
Shares sold | | | 105,023 | | | $ | 3,169,430 | |
Shares issued to shareholders in reinvestment
of dividends | | | 10,749 | | | | 318,435 | |
Shares redeemed | | | (148,153 | ) | | | (4,424,084 | ) |
| | | | | | | | |
Net increase (decrease) in shares outstanding before conversion | | | (32,381 | ) | | | (936,219 | ) |
Shares converted into Investor Class (See Note 1) | | | 138,667 | | | | 4,201,800 | |
Shares converted from Investor Class (See Note 1) | | | (118,545 | ) | | | (3,667,166 | ) |
| | | | | | | | |
Net increase (decrease) | | | (12,259 | ) | | $ | (401,585 | ) |
| | | | | | | | |
Year ended October 31, 2012: | | | | | | | | |
Shares sold | | | 166,653 | | | $ | 4,554,715 | |
Shares issued to shareholders in reinvestment
of dividends | | | 19,287 | | | | 524,085 | |
Shares redeemed | | | (298,565 | ) | | | (8,113,179 | ) |
| | | | | | | | |
Net increase (decrease) in shares outstanding before conversion | | | (112,625 | ) | | | (3,034,379 | ) |
Shares converted into Investor Class (See Note 1) | | | 236,299 | | | | 6,477,189 | |
Shares converted from Investor Class (See Note 1) | | | (194,364 | ) | | | (5,374,184 | ) |
| | | | | | | | |
Net increase (decrease) | | | (70,690 | ) | | $ | (1,931,374 | ) |
| | | | | | | | |
| | |
| | | | | | | | |
Class A | | Shares | | | Amount | |
Six-month period ended April 30, 2013: | | | | | | | | |
Shares sold | | | 370,914 | | | $ | 11,189,434 | |
Shares issued to shareholders in reinvestment
of dividends | | | 27,029 | | | | 802,448 | |
Shares redeemed | | | (443,928 | ) | | | (13,212,012 | ) |
| | | | | | | | |
Net increase (decrease) in shares outstanding before conversion | | | (45,985 | ) | | | (1,220,130 | ) |
Shares converted into Class A (See Note 1) | | | 185,991 | | | | 5,705,570 | |
Shares converted from Class A (See Note 1) | | | (10,291 | ) | | | (322,927 | ) |
| | | | | | | | |
Net increase (decrease) | | | 129,715 | | | $ | 4,162,513 | |
| | | | | | | | |
Year ended October 31, 2012: | | | | | | | | |
Shares sold | | | 469,433 | | | $ | 12,673,705 | |
Shares issued to shareholders in reinvestment
of dividends | | | 48,773 | | | | 1,324,376 | |
Shares redeemed | | | (994,634 | ) | | | (27,113,827 | ) |
| | | | | | | | |
Net increase (decrease) in shares outstanding before conversion | | | (476,428 | ) | | | (13,115,746 | ) |
Shares converted into Class A (See Note 1) | | | 333,932 | | | | 9,210,487 | |
Shares converted from Class A (See Note 1) | | | (27,817 | ) | | | (784,462 | ) |
| | | | | | | | |
Net increase (decrease) | | | (170,313 | ) | | $ | (4,689,721 | ) |
| | | | | | | | |
| | |
| 42 | | MainStay Balanced Fund |
| | | | | | | | |
Class B | | Shares | | | Amount | |
Six-month period ended April 30, 2013: | | | | | | | | |
Shares sold | | | 78,167 | | | $ | 2,348,942 | |
Shares issued to shareholders in reinvestment
of dividends | | | 2,105 | | | | 60,110 | |
Shares redeemed | | | (181,972 | ) | | | (5,434,675 | ) |
| | | | | | | | |
Net increase (decrease) in shares outstanding before conversion | | | (101,700 | ) | | | (3,025,623 | ) |
Shares converted from Class B (See Note 1) | | | (196,307 | ) | | | (5,917,277 | ) |
| | | | | | | | |
Net increase (decrease) | | | (298,007 | ) | | $ | (8,942,900 | ) |
| | | | | | | | |
Year ended October 31, 2012: | | | | | | | | |
Shares sold | | | 146,594 | | | $ | 3,990,432 | |
Shares issued to shareholders in reinvestment
of dividends | | | 2,460 | | | | 65,968 | |
Shares redeemed | | | (405,093 | ) | | | (11,026,553 | ) |
| | | | | | | | |
Net increase (decrease) in shares outstanding before conversion | | | (256,039 | ) | | | (6,970,153 | ) |
Shares converted from Class B (See Note 1) | | | (349,231 | ) | | | (9,529,030 | ) |
| | | | | | | | |
Net increase (decrease) | | | (605,270 | ) | | $ | (16,499,183 | ) |
| | | | | | | | |
| | |
| | | | | | | | |
Class C | | Shares | | | Amount | |
Six-month period ended April 30, 2013: | | | | | | | | |
Shares sold | | | 105,987 | | | $ | 3,215,897 | |
Shares issued to shareholders in reinvestment
of dividends | | | 1,860 | | | | 53,161 | |
Shares redeemed | | | (120,868 | ) | | | (3,586,696 | ) |
| | | | | | | | |
Net increase (decrease) | | | (13,021 | ) | | $ | (317,638 | ) |
| | | | | | | | |
Year ended October 31, 2012: | | | | | | | | |
Shares sold | | | 131,804 | | | $ | 3,554,420 | |
Shares issued to shareholders in reinvestment of dividends | | | 1,882 | | | | 50,628 | |
Shares redeemed | | | (422,482 | ) | | | (11,458,860 | ) |
| | | | | | | | |
Net increase (decrease) | | | (288,796 | ) | | $ | (7,853,812 | ) |
| | | | | | | | |
| | |
| | | | | | | | |
Class I | | Shares | | | Amount | |
Six-month period ended April 30, 2013: | | | | | | | | |
Shares sold | | | 1,146,224 | | | $ | 34,883,242 | |
Shares issued to shareholders in reinvestment of dividends | | | 57,428 | | | | 1,710,193 | |
Shares redeemed | | | (888,670 | ) | | | (26,839,186 | ) |
| | | | | | | | |
Net increase (decrease) | | | 314,982 | | | $ | 9,754,249 | |
| | | | | | | | |
Year ended October 31, 2012: | | | | | | | | |
Shares sold | | | 1,944,571 | | | $ | 52,919,851 | |
Shares issued to shareholders in reinvestment of dividends | | | 105,376 | | | | 2,868,172 | |
Shares redeemed | | | (2,043,396 | ) | | | (55,923,252 | ) |
| | | | | | | | |
Net increase (decrease) | | | 6,551 | | | $ | (135,229 | ) |
| | | | | | | | |
| | | | | | | | |
Class R1 | | Shares | | | Amount | |
Six-month period ended April 30, 2013: | | | | | | | | |
Shares sold | | | 18,024 | | | $ | 540,950 | |
Shares issued to shareholders in reinvestment of dividends | | | 2,238 | | | | 66,500 | |
Shares redeemed | | | (33,525 | ) | | | (1,035,265 | ) |
| | | | | | | | |
Net increase (decrease) | | | (13,263 | ) | | $ | (427,815 | ) |
| | | | | | | | |
Year ended October 31, 2012: | | | | | | | | |
Shares sold | | | 105,023 | | | $ | 2,851,417 | |
Shares issued to shareholders in reinvestment of dividends | | | 8,834 | | | | 239,793 | |
Shares redeemed | | | (561,950 | ) | | | (15,729,644 | ) |
| | | | | | | | |
Net increase (decrease) | | | (448,093 | ) | | $ | (12,638,434 | ) |
| | | | | | | | |
| | |
| | | | | | | | |
Class R2 | | Shares | | | Amount | |
Six-month period ended April 30, 2013: | | | | | | | | |
Shares sold | | | 327,025 | | | $ | 9,904,904 | |
Shares issued to shareholders in reinvestment of dividends | | | 8,595 | | | | 254,364 | |
Shares redeemed | | | (395,791 | ) | | | (11,746,303 | ) |
| | | | | | | | |
Net increase (decrease) | | | (60,171 | ) | | $ | (1,587,035 | ) |
| | | | | | | | |
Year ended October 31, 2012: | | | | | | | | |
Shares sold | | | 532,144 | | | $ | 14,402,342 | |
Shares issued to shareholders in reinvestment of dividends | | | 15,503 | | | | 421,272 | |
Shares redeemed | | | (521,495 | ) | | | (14,131,873 | ) |
| | | | | | | | |
Net increase (decrease) | | | 26,152 | | | $ | 691,741 | |
| | | | | | | | |
| | |
| | | | | | | | |
Class R3 | | Shares | | | Amount | |
Six-month period ended April 30, 2013: | | | | | | | | |
Shares sold | | | 26,200 | | | $ | 760,771 | |
Shares issued to shareholders in reinvestment of dividends | | | 83 | | | | 2,521 | |
Shares redeemed | | | (3,486 | ) | | | (105,104 | ) |
| | | | | | | | |
Net increase (decrease) | | | 22,797 | | | $ | 658,188 | |
| | | | | | | | |
Year ended October 31, 2012: | | | | | | | | |
Shares sold | | | 2,875 | | | $ | 78,989 | |
Shares issued to shareholders in reinvestment of dividends | | | 75 | | | | 2,042 | |
Shares redeemed | | | (351 | ) | | | (9,783 | ) |
| | | | | | | | |
Net increase (decrease) | | | 2,599 | | | $ | 71,248 | |
| | | | | | | | |
Note 10–Subsequent Events
In connection with the preparation of the financial statements of the Fund as of and for the six-month period ended April 30, 2013, events and transactions subsequent to April 30, 2013, through the date the financial statements were issued have been evaluated by the Fund’s management for possible adjustment and/or disclosure. No subsequent events requiring financial statement adjustment or disclosure have been identified.
| | | | |
| mainstayinvestments.com | | | 43 | |
Board Consideration and Approval of Management Agreement and
Subadvisory Agreement (Unaudited)
Section 15(c) of the Investment Company Act of 1940, as amended (the “1940 Act”) requires that each mutual fund’s board of trustees, including a majority of the independent trustees, annually review and approve the fund’s investment advisory agreements. At its December 10-12, 2012 meeting, the Board of Trustees of the MainStay Group of Funds (“Board”) unanimously approved the Management Agreement with respect to the MainStay Balanced Fund (“Fund”) and New York Life Investment Management LLC (“New York Life Investments”), and the Subadvisory Agreement between New York Life Investments and Madison Square Investors LLC, which subsequently changed its name to Cornerstone Capital Management Holdings LLC (“Cornerstone Holdings”), with respect to the Fund.
In reaching its decision to approve the Agreements, the Board considered information furnished by New York Life Investments and Cornerstone Holdings in connection with a contract review process that took place at various meetings of the Board and its Contracts Committee between September 2012 and December 2012, as well as other relevant information furnished to the Board throughout the year by New York Life Investments and Cornerstone Holdings. Information requested by and furnished to the Board in connection with the contract review process included, among other items, reports on the Fund prepared by Strategic Insight Mutual Fund Research and Consulting, LLC (“Strategic Insight”), an independent third-party service provider engaged by the Board to report objectively on the Fund’s investment performance, management and subadvisory fees and ordinary operating expenses. The Board also considered information provided by New York Life Investments and Cornerstone Holdings on the fees charged to other investment advisory clients (including institutional separate accounts) that follow investment strategies similar to the Fund, and the rationale for any differences in the Fund’s management and subadvisory fees and the fees charged to those other investment advisory clients. In addition, the Board requested and received information on the profitability of the Fund to New York Life Investments and its affiliates, including Cornerstone Holdings as subadvisor to the Fund, and responses from New York Life Investments and Cornerstone Holdings to a series of questions encompassing a variety of topics prepared on behalf of the Board by independent legal counsel to the Board and its independent trustees (the “Independent Trustees”). Information provided to the Board at its meetings throughout the year included, among other items, detailed investment performance reports on the Fund prepared by the Investment Consulting Group at New York Life Investments. The structure and format for this regular reporting was developed in consultation with the Board. The Board also received from New York Life Investments throughout the year, among other items, periodic reports on legal and compliance matters, portfolio turnover, and sales and marketing activity.
In determining to approve the Agreements, the members of the Board reviewed and evaluated all of the information and factors they believed to be relevant and appropriate in light of legal advice furnished to them by independent legal counsel and through the exercise of their own business judgment. The broad factors considered by the Board are discussed in greater detail below, and included, among other items: (i) the nature, scope and quality of the services provided to the Fund by New York Life Investments and Cornerstone Holdings; (ii) the investment performance of the Fund, New York Life Investments and Cornerstone Holdings; (iii) the costs of the services provided, and profits realized, by
New York Life Investments and Cornerstone Holdings from their
relationship with the Fund; (iv) the extent to which economies of scale may be realized as the Fund grows, and the extent to which economies of scale may benefit Fund investors; and (v) the reasonableness of the Fund’s management and subadvisory fees and overall total ordinary operating expenses, particularly as compared to similar funds and accounts managed by New York Life Investments and Cornerstone Holdings and third-party “peer funds” identified by Strategic Insight.
While individual members of the Board may have weighed certain factors differently, the Board’s decision to approve the Agreements was based on a consideration of all the information provided to the Board, including information provided to the Board throughout the year and specifically in connection with the contract review process. The Board’s conclusions with respect to the Agreements also were based, in part, on the Board’s consideration of the Agreements in prior years. In addition to considering the above-referenced factors, the Board observed that in the marketplace there are a range of investment options available to shareholders of the Fund, and that the Fund’s shareholders, having had the opportunity to consider other investment options, have chosen to invest in the Fund. A more detailed discussion of the factors that figured prominently in the Board’s decisions to approve the Agreements is provided below.
Nature, Scope and Quality of Services to Be Provided by New York Life Investments and Cornerstone Holdings
The Board examined the nature, scope and quality of the services that New York Life Investments provides to the Fund. The Board evaluated New York Life Investments’ experience in serving as manager of the Fund, noting that New York Life Investments manages other mutual funds, serves a variety of other investment advisory clients, including other pooled investment vehicles, and has experience with overseeing mutual fund service providers, including subadvisors. The Board considered the experience of senior personnel at New York Life Investments providing management and administrative services to the Fund, as well as New York Life Investments’ reputation and financial condition. The Board also considered the full range of non-advisory services that New York Life Investments supplies to the Fund under the terms of the Management Agreement, including: (i) fund accounting services provided by New York Life Investments’ Fund Accounting and Administration Group; (ii) investment oversight and analytical services provided by New York Life Investments’ Investment Consulting Group; (iii) compliance services provided by New York Life Investments’ compliance department, including oversight and implementation of the Fund’s compliance program; and (iv) legal services provided by New York Life Investments’ Office of the General Counsel. Additional information about the non-advisory services provided by New York Life Investments is set forth in the Fund’s Management Agreement. The Board also considered New York Life Investments’ willingness to invest in personnel that benefit the Fund, and noted that New York Life Investments is responsible for compensating the Fund’s officers. The Board also considered benefits to shareholders of being part of the MainStay Group of Funds, including the privilege of exchanging investments between the same class of shares without the imposition of a sales charge, as described more fully in the Fund’s prospectus.
The Board also examined the nature, scope and quality of the advisory services that New York Life Investments and Cornerstone Holdings
| | |
| 44 | | MainStay Balanced Fund |
provide to the Fund. The Board evaluated New York Life Investments’ and Cornerstone Holdings’ experience in serving as investment adviser and subadvisor, respectively, to the Fund and managing other portfolios. It examined New York Life Investments’ and Cornerstone Holdings’ track records and experience in providing investment advisory services, the experience of investment advisory, senior management and administrative personnel at New York Life Investments and Cornerstone Holdings, and New York Life Investments’ and Cornerstone Holdings’ overall legal and compliance environments. The Board also reviewed New York Life Investments’ and Cornerstone Holdings’ willingness to invest in personnel that benefit the Fund. In this regard, the Board considered the experience of the Fund’s portfolio managers, the number of accounts managed by the portfolio managers and the method for compensating portfolio managers.
Based on these considerations, the Board concluded, within the context of its overall determinations regarding the Agreements, that the Fund should continue to benefit from the nature, scope and quality of these services as a result of New York Life Investments’ and Cornerstone Holdings’ experience, personnel, operations and resources.
Investment Performance
In evaluating the Fund’s investment performance, the Board considered investment performance results in light of the Fund’s investment objective, strategies and risks, as disclosed in the Fund’s prospectus. The Board particularly considered detailed investment reports on the Fund’s performance provided to the Board throughout the year by the Investment Consulting Group of New York Life Investments. These reports include, among other items, information on the Fund’s gross and net returns, the Fund’s investment performance relative to relevant investment categories and Fund benchmarks, the Fund’s risk-adjusted investment performance, and the Fund’s investment performance as compared to similar competitor funds, as appropriate. The Board also considered information provided by Strategic Insight showing the investment performance of the Fund as compared to peer funds.
In considering the Fund’s investment performance, the Board focused principally on the Fund’s long-term performance track record. The Board also gave weight to its ongoing discussions with senior management at New York Life Investments concerning the Fund’s investment performance, as well as discussions between the Fund’s portfolio managers and the Board that occur typically on an annual basis. In addition, the Board considered any specific actions that New York Life Investments or Cornerstone Holdings had taken, or had agreed with the Board to take, to enhance Fund investment performance, and the results of those actions.
Based on these considerations, the Board concluded, within the context of its overall determinations regarding the Agreements, that the long-term investment performance of the Fund, along with ongoing efforts by New York Life Investments and Cornerstone Holdings to enhance investment returns, supported a determination to approve the Agreements. The Fund discloses more information about investment performance in the Portfolio Management Discussion and Analysis, Investment and Performance Comparison and Financial Highlights sections of this Semiannual Report and in the Fund’s prospectus.
Costs of the Services Provided, and Profits Realized, by New York Life Investments and Cornerstone Holdings
The Board considered the costs of the services provided by New York Life Investments and Cornerstone Holdings under the Agreements, and the profits realized by New York Life Investments and its affiliates, including Cornerstone Holdings, due to their relationships with the Fund. Because Cornerstone Holdings is an affiliate of New York Life Investments whose subadvisory fees are paid directly by New York Life Investments, the Board considered cost and profitability information for New York Life Investments and Cornerstone Holdings in the aggregate.
In evaluating the costs and profits of New York Life Investments and its affiliates, including Cornerstone Holdings, the Board considered, among other factors, each party’s investments in personnel, systems, equipment and other resources necessary to manage the Fund, and that New York Life Investments is responsible for paying the subadvisory fees for the Fund. The Board acknowledged that New York Life Investments and Cornerstone Holdings must be in a position to pay and retain experienced professional personnel to provide services to the Fund, and that the ability to maintain a strong financial position is important in order for New York Life Investments and Cornerstone Holdings to continue to provide high-quality services to the Fund. The Board also noted that the Fund benefits from the allocation of certain fixed costs across the MainStay Group of Funds.
In addition, the Board noted the difficulty in obtaining reliable comparative data about mutual fund managers’ profitability, since such information generally is not publicly available and may be impacted by numerous factors, including the structure of a fund manager’s organization, the types of funds it manages, the methodology used to allocate certain fixed costs to specific funds, and the manager’s capital structure and costs of capital. While recognizing the difficulty in evaluating a manager’s profitability with respect to the Fund, and noting that other profitability methodologies may also be reasonable, the Board concluded that the profitability methodology presented by New York Life Investments to the Board, which was developed by New York Life Investments in consultation with an independent consultant, was reasonable in all material respects.
In considering the costs and profitability of the Fund, the Board also considered certain fall-out benefits that may be realized by New York Life Investments and its affiliates due to their relationships with the Fund. The Board recognized, for example, the benefits to Cornerstone Holdings from legally permitted “soft-dollar” arrangements by which brokers provide research and other services to Cornerstone Holdings in exchange for commissions paid by the Fund with respect to trades on the Fund’s portfolio securities.
The Board further considered that, in addition to fees earned by New York Life Investments for managing the Fund, New York Life Investments’ affiliates also earn revenues from serving the Fund in various other capacities, including as the Fund’s transfer agent and distributor. The Board observed that information about these other revenues, and their impact on the profitability of the Fund to New York Life Investments and its affiliates, was furnished to the Board as part of the 15(c) process. The Board noted that, although it assessed the overall profitability of the Fund to New York Life Investments and its affiliates as part of the contract review process, when considering the reasonableness of the
| | | | |
| mainstayinvestments.com | | | 45 | |
Board Consideration and Approval of Management Agreement and
Subadvisory Agreement (Unaudited) (continued)
fees to be paid to New York Life Investments and its affiliates under the Agreements, the Board considered the profitability of New York Life Investments’ relationship with the Fund on a pre-tax basis, and without regard to distribution expenses.
After evaluating the information presented to the Board, the Board concluded, within the context of its overall determinations regarding the Agreements, that any profits realized by New York Life Investments and its affiliates, including Cornerstone Holdings, due to their relationships with the Fund supported the Board’s decision to approve the Agreements.
Extent to Which Economies of Scale May Be Realized as the Fund Grows
The Board also considered whether the Fund’s expense structure permitted economies of scale to be shared with Fund investors. The Board reviewed information from New York Life Investments showing how the Fund’s management fee schedule compared to fee schedules of other funds and accounts managed by New York Life Investments. The Board also reviewed information from Strategic Insight showing how the Fund’s management fee schedule hypothetically would compare with fees paid for similar services by peer funds at varying asset levels. While recognizing the difficulty of determining economies of scale with precision, the Board acknowledged that economies of scale may be shared with the Fund in a number of ways, including, for example, through the imposition of management fee breakpoints and by initially setting relatively lower management fees.
Based on this information, the Board concluded, within the context of its overall determinations regarding the Agreements, that the Fund’s expense structure appropriately reflects economies of scale for the benefit of Fund investors. The Board noted, however, that it would continue to evaluate the reasonableness of the Fund’s expense structure as the Fund grows over time.
Management and Subadvisory Fees and Total Ordinary Operating Expenses
The Board evaluated the reasonableness of the fees to be paid under the Agreements and the Fund’s expected total ordinary operating expenses. The Board primarily considered the reasonableness of the management fee paid by the Fund to New York Life Investments, since the fees paid to Cornerstone Holdings are paid by New York Life Investments, not the Fund.
In assessing the reasonableness of the Fund’s fees and expenses, the Board primarily considered comparative data provided by Strategic Insight on the fees and expenses charged by similar mutual funds managed by other investment advisers. In addition, the Board considered information provided by New York Life Investments and Cornerstone Holdings on fees charged to other investment advisory clients, including institutional separate accounts and other funds with similar investment objectives as the Fund. The Board particularly considered differences in the contractual management fee schedules of the retail MainStay Funds and similarly-managed MainStay VP Portfolios, taking into account New York Life Investments’ rationale for any differences in fee schedules. The Board also took into account explanations provided by New York Life Investments about the different scope of services
provided to mutual funds as compared with other investment advisory clients. Additionally, the Board considered the impact of any expense limitation arrangements on the Fund’s net management fee and expenses.
The Board noted that, outside of the Fund’s management fee and the fees charged under a share class’s Rule 12b-1 and/or shareholder services plans, a share class’s most significant “other expenses” are transfer agent fees. Transfer agent fees are charged to the Fund based on the number of shareholder accounts (a “per-account” fee) as compared with certain other fees (e.g., management fees), which are charged based on the Fund’s average net assets. The Board took into account information from New York Life Investments showing that the Fund’s transfer agent fee schedule is reasonable, including industry data showing that the per-account fees that NYLIM Service Company LLC, the Fund’s transfer agent, charges the Fund are within the range of per-account fees charged by transfer agents to other mutual funds. In addition, the Board considered NYLIM Service Company LLC’s profitability in connection with the transfer agent services it provides to the Fund.
The Board acknowledged that, because the Fund’s transfer agent fees are billed on a per-account basis, the impact of transfer agent fees on a share class’s expense ratio may be more significant in cases where the share class has a high number of accounts with limited assets (i.e., small accounts). The Board observed that transfer agent fees are a significant portion of total expenses of many Funds in the MainStay Group of Funds. The impact of transfer agent fees on the expense ratios of these MainStay Funds tend to be greater than for other open-end retail funds, because the MainStay Group of Funds generally has a significant number of small accounts relative to competitor funds. The Board acknowledged the role that the MainStay Group of Funds historically has played in serving the investment needs of New York Life Insurance Company (“New York Life”) policyholders, who often maintain smaller account balances than other fund investors. The Board discussed measures that it and New York Life Investments have taken in recent years to mitigate the effect of small accounts on the expense ratios of Fund share classes, including: (i) encouraging New York Life agents to consolidate multiple small accounts held by the same investor into one MainStay Asset Allocation Fund account; (ii) increasing investment minimums from $500 to $1,000 in 2003; (iii) introducing Investor Class shares for certain MainStay Funds in early 2008 to consolidate smaller account investors; (iv) closing small accounts with balances below $250 in Investor Class shares or $750 in all other classes of shares; (v) no longer allowing an exception with no minimum investment amount with respect to AutoInvest accounts with subsequent monthly purchases of $100; (vi) since 2007, charging an annual $20.00 small account fee on certain accounts with balances below $1,000; and (vii) modifying the approach for billing transfer agent expenses to reduce the degree of subsidization by large accounts of smaller accounts. In addition, the Board acknowledged New York Life Investments’ efforts to encourage intermediaries to consolidate small accounts in multiple Funds held by the same investor into a single Asset Allocation Fund account, if appropriate under the circumstances, in an effort to mitigate the effect of small accounts on the Funds in the MainStay Group of Funds.
| | |
| 46 | | MainStay Balanced Fund |
After considering all of the factors outlined above, the Board concluded that the Fund’s management and subadvisory fees and total ordinary operating expenses were within a range that is competitive and, within the context of the Board’s overall conclusions regarding the Agreements, support a conclusion that these fees and expenses are reasonable.
Conclusion
On the basis of the information provided to it and its evaluation thereof, the Board, including the Independent Trustees, unanimously voted to approve the Agreements.
| | | | |
| mainstayinvestments.com | | | 47 | |
Proxy Voting Policies and Procedures and Proxy Voting Record
A description of the policies and procedures that New York Life Investments uses to vote proxies related to the Fund’s securities is available without charge, upon request, (i) by visiting the Fund’s website at mainstayinvestments.com; and (ii) on the Securities and Exchange Commission’s (“SEC”) website at www.sec.gov.
The Fund is required to file with the SEC its proxy voting record for the 12-month period ending June 30 on Form N-PX. The Fund’s most recent Form N-PX is available free of charge upon request by calling 800-MAINSTAY (624-6782); visiting the Fund’s website at mainstayinvestments.com; or on the SEC’s website at www.sec.gov.
Shareholder Reports and Quarterly Portfolio Disclosure
The Fund is required to file its complete schedule of portfolio holdings with the SEC for its first and third fiscal quarters on Form N-Q. The Fund’s Form N-Q is available without charge, on the SEC’s website at www.sec.gov or by calling MainStay Investments at 800-MAINSTAY (624-6782). You also can obtain and review copies of Form N-Q by visiting the SEC’s Public Reference Room in Washington, DC (information on the operation of the Public Reference Room may be obtained by calling 1-800-SEC-0330).
| | |
| 48 | | MainStay Balanced Fund |
This page intentionally left blank
This page intentionally left blank
MainStay Funds
MainStay offers a wide range of Funds for virtually any investment need. The full array of MainStay open-end offerings is listed here, with information about the manager, subadvisors, legal counsel and independent registered public accounting firms.
Equity
U.S. Equity Funds
MainStay Common Stock Fund
MainStay Cornerstone Growth Fund
MainStay Epoch U.S. All Cap Fund
MainStay Epoch U.S. Equity Yield Fund
MainStay ICAP Equity Fund
MainStay ICAP Select Equity Fund
MainStay Large Cap Growth Fund1
MainStay MAP Fund
MainStay S&P 500 Index Fund
MainStay U.S. Equity Opportunities Fund
MainStay U.S. Small Cap Fund
International/Global Equity Funds
MainStay Epoch Global Choice Fund
MainStay Epoch Global Equity Yield Fund
MainStay Epoch International Small Cap Fund
MainStay ICAP Global Fund
MainStay ICAP International Fund
MainStay International Equity Fund
MainStay International Opportunities Fund
Income
Taxable Bond Funds
MainStay Floating Rate Fund
MainStay Global High Income Fund
MainStay Government Fund
MainStay High Yield Corporate Bond Fund
MainStay High Yield Opportunities Fund
MainStay Indexed Bond Fund
MainStay Intermediate Term Bond Fund
MainStay Short Duration High Yield Fund
MainStay Short Term Bond Fund
MainStay Unconstrained Bond Fund
Municipal Bond Funds
MainStay California Tax Free Opportunities Fund2
MainStay High Yield Municipal Bond Fund
MainStay New York Tax Free Opportunities Fund3
MainStay Tax Free Bond Fund
Money Market Fund
MainStay Money Market Fund
Mixed Asset
MainStay Balanced Fund
MainStay Convertible Fund
MainStay Income Builder Fund
MainStay Marketfield Fund
Asset Allocation/Target Date
MainStay Conservative Allocation Fund
MainStay Growth Allocation Fund
MainStay Moderate Allocation Fund
MainStay Moderate Growth Allocation Fund
MainStay Retirement 2010 Fund
MainStay Retirement 2020 Fund
MainStay Retirement 2030 Fund
MainStay Retirement 2040 Fund
MainStay Retirement 2050 Fund
Manager
New York Life Investment Management LLC
New York, New York
Subadvisors
Cornerstone Capital Management Holdings LLC4
New York, New York
Cornerstone Capital Management LLC4
Bloomington, Minnesota
Epoch Investment Partners, Inc.
New York, New York
Institutional Capital LLC4
Chicago, Illinois
MacKay Shields LLC4
New York, New York
Marketfield Asset Management LLC
New York, New York
Markston International LLC
White Plains, New York
Winslow Capital Management LLC
Minneapolis, Minnesota
Legal Counsel
Dechert LLP
Independent Registered Public Accounting Firms
KPMG LLP
PricewaterhouseCoopers LLP
1. Effective January 13, 2012, the Fund was closed to new investors with certain exceptions.
2. This Fund is only registered for sale in AZ, CA, NV, OR, UT, and WA.
3. This Fund is only registered for sale in CT, DE, FL, MA, NJ, NY, and VT.
4. An affiliate of New York Life Investment Management LLC.
Not part of the Semiannual Report
For more information
800-MAINSTAY (624-6782)
mainstayinvestments.com
The MainStay Funds® are managed by New York Life Investment Management LLC and distributed through NYLIFE Distributors LLC, 169 Lackawanna Avenue, Parsippany, NJ 07054, a wholly owned subsidiary of New York Life Insurance Company. NYLIFE Distributors LLC is a Member FINRA/SIPC.
MainStay Investments® is a registered service mark and name under which New York Life Investment Management LLC does business. MainStay Investments, an indirect subsidiary of New York Life Insurance Company, New York, NY 10010, provides investment advisory products and services.
This report may be distributed only when preceded or accompanied by a current Fund prospectus.
©2013 NYLIFE Distributors LLC. All rights reserved.
| | | | | | | | |
| Not FDIC/NCUA Insured | | Not a Deposit | | May Lose Value | | No Bank Guarantee | | Not Insured by Any Government Agency |
| | |
| NYLIM-30075 MS175-13 | | MSBL10-06/13 NL0B7 |
MainStay U.S. Small Cap Fund
Message from the President and Semiannual Report
Unaudited | April 30, 2013


This page intentionally left blank
Message from the President
The U.S. stock market advanced during the six months ended April 30, 2013, generally providing double-digit returns at all capitalization levels. Value stocks tended to outpace growth stocks among large- and mid-capitalization companies, while growth stocks tended to outpace value stocks among smaller companies.
The market’s advance, however, was far from uniform. Stocks declined in early November, both before and immediately after the U.S. presidential election. Following a sharp recovery, stocks climbed until mid-December, when a Congressional stalemate on the fiscal cliff led to a brief decline. Another dip occurred in late February as investors speculated that the Federal Open Market Committee (FOMC) might stop purchasing mortgage-backed securities sooner than expected. Stocks also dipped in mid-April, as consumer sentiment dropped after the Boston marathon bombing. Despite these setbacks, U.S. stocks continued to trend upward during the six-month reporting period.
International stock markets also advanced, with several regional differences. Accommodative action by the Bank of Japan helped lower the yen and lift Japanese stocks to their highest levels since 2008. In Europe, stocks did well until early February, bolstered by the promise of support for the euro. As the year progressed, however, economic contraction, rising unemployment and systematic banking concerns took a toll on investor enthusiasm. In China, manufacturing slowed as the nation sought to balance growth and inflation risks. On the Korean peninsula, tensions rose as North Korea continued to threaten its neighbors, which added an undercurrent of caution to the market.
During the six months ended April 30, 2013, the FOMC kept the federal funds rate in a range close to zero. The FOMC also continued its direct purchases of mortgage-backed securities and longer-term U.S. government securities. With short-term interest rates likely to remain at low levels, many bond investors pursued higher yields by lengthening maturities and assuming greater risk. As a result, bonds with higher risk profiles tended
to outperform higher-quality investment-grade bonds and U.S. Treasury securities. Cash and cash equivalents essentially returned zero.
With wide variations in the performance of various asset classes, some investors might be tempted to chase higher returns by shifting back and forth between stocks and bonds. Since no one can predict where the market will move next, however, we encourage investors to select an appropriate mix of investments for their risk tolerance and time horizon and to stick with that mix, making only minor adjustments over time.
At MainStay Funds, our portfolio managers use a similar approach. Careful security selection and thoughtful sell disciplines help them pursue the investment objectives of their respective Funds. Using the principal investment strategies outlined in the Prospectus, they focus primarily on providing long-term investment potential for our shareholders.
Has this approach proved successful? In its most recent rankings, Barron’s listed MainStay Funds as the #1 fund family over the past 10 years. We were also the only mutual fund family that has appeared in Barron’s top six for the past five consecutive years.
The pages that follow provide additional insight into the specific market events, investment decisions and securities that shaped your MainStay Fund(s) during the six months ended April 30, 2013. We encourage you to read the semiannual report(s) carefully and to evaluate your results with your long-term financial goals in mind.
Sincerely,

Stephen P. Fisher
President
The opinions expressed are as of the date of this report and are subject to change. There is no guarantee that any forecast made will come to pass. This material does not constitute investment advice and is not intended as an endorsement of any specific investment.
To qualify for the Lipper/Barron’s Fund Survey, a fund family must have at least three funds in Lipper’s general U.S.-stock category, one in world equity (which combines global and international funds), one mixed-equity fund (which holds stocks and bonds), two taxable-bond funds, and one tax-exempt fund. Fund loads and 12b-1 fees aren’t included in the calculation of returns because the aim is to measure the manager’s skill. Each fund’s return is measured against all funds in its Lipper category, resulting in a percentile ranking which is then weighted by asset size relative to the fund family’s other assets in its general classifications. Finally, the score is multiplied by the general classification weightings as determined by the entire Lipper universe of funds.
Source: Barron’s, 2/9/13. Overall, MainStay Funds ranked number 56 for the one-year period, 20 for the five-year period and one for the 10-year period ended December 31, 2012, out of 62, 53 and 46 fund families, respectively. MainStay ranked number three for the 10-year period in 2009, 2010 and 2011 from among 48, 46 and 45 fund families, respectively. MainStay ranked number six from among 48 fund families for the 10-year period in 2008. Past performance is no guarantee of future results, which will vary. For the most recent MainStay Funds performance, please visit our website at mainstayinvestments.com. All mutual funds are subject to market risk and will fluctuate in value.
Not part of the Semiannual Report
Table of Contents
Investors should refer to the Fund’s Summary Prospectus and/or Prospectus and consider the Fund’s investment objectives, strategies, risks, charges and expenses carefully before investing. The Summary Prospectus and/or Prospectus contain this and other information about the Fund. You may obtain copies of the Fund’s Summary Prospectus, Prospectus and Statement of Additional Information free of charge, upon request, by calling toll-free 800-MAINSTAY (624-6782), by writing to NYLIFE Distributors LLC, Attn: MainStay Marketing Department, 169 Lackawanna Avenue, Parsippany, New Jersey 07054 or by sending an e-mail to MainStayShareholderServices@nylim.com. These documents are also available via the MainStay Funds’ website at mainstayinvestments.com/documents. Please read the Summary Prospectus and/or Prospectus carefully before investing.
Investment and Performance Comparison1 (Unaudited)
Performance data quoted represents past performance. Past performance is no guarantee of future results. Because of market volatility, current performance may be lower or higher than the figures shown. Investment return and principal value will fluctuate, and as a result, when shares are redeemed, they may be worth more or less than their original cost. The graph below depicts the historical performance of Class I shares of the Fund. Performance will vary from class to class based on differences in class-specific expenses and sales charges. For performance information current to the most recent month-end, please call 800-MAINSTAY (624-6782) or visit mainstayinvestments.com.
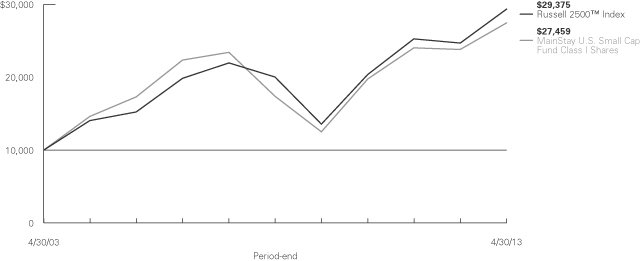
Average Annual Total Returns for the Period Ended April 30, 2013
| | | | | | | | | | | | | | | | | | | | | | |
| Class | | Sales Charge | | | | Six Months | | One Year | | | Five Years | | | Ten Years | | | Gross
Expense
Ratio2,6 | |
| Investor Class Shares3 | | Maximum 5.5% Initial Sales Charge | | With sales charges Excluding sales charges | | 11.44% 17.93 | |
| 8.31
14.61 | %
| |
| 7.78
9.01 | %
| |
| 9.49
10.11 | %
| |
| 1.69
1.69 | %
|
| Class A Shares4 | | Maximum 5.5% Initial Sales Charge | | With sales charges Excluding sales charges | | 11.63 18.12 | |
| 8.63
14.95 |
| |
| 8.03
9.26 |
| |
| 9.61
10.23 |
| |
| 1.39
1.39 |
|
| Class B Shares4 | | Maximum 5% CDSC if Redeemed Within the First Six Years of Purchase | | With sales charges Excluding sales charges | | 12.47 17.47 | |
| 8.70
13.70 |
| |
| 7.92
8.22 |
| |
| 9.27
9.27 |
| |
| 2.44
2.44 |
|
| Class C Shares5 | | Maximum 1% CDSC if Redeemed Within One Year of Purchase | | With sales charges Excluding sales charges | | 16.55 17.55 | |
| 12.76
13.76 |
| |
| 8.22
8.22 |
| |
| 9.29
9.29 |
| |
| 2.44
2.44 |
|
| Class I Shares | | No Sales Charges | | | | 18.31 | | | 15.20 | | | | 9.58 | | | | 10.63 | | | | 1.14 | |
| Class R1 Shares6 | | No Sales Charge | | | | 18.21 | | | 15.07 | | | | 9.47 | | | | 10.52 | | | | 1.27 | |
| Class R2 Shares6 | | No Sales Charge | | | | 18.09 | | | 14.78 | | | | 9.20 | | | | 10.24 | | | | 1.52 | |
| 1. | The performance table and graph do not reflect the deduction of taxes that a shareholder would pay on dividends, distributions or Fund share redemptions. Total returns reflect maximum applicable sales charges as indicated in the table above, changes in share price, and reinvestment of dividend and capital gain distributions. The graph assumes the initial investment amount shown above and reflects the deduction of all sales charges that would have applied for the period of investment. Performance figures reflect certain fee waivers and/or expense limitations, without which total returns may have been lower. For more information on share classes and current fee waivers and/or expense limitations, please refer to the notes to the financial statements. |
| 2. | The gross expense ratios presented reflect the Fund’s “Total Annual Fund Operating Expenses” from the most recent Prospectus and may differ from other expense ratios disclosed in this report. |
| 3. | Performance figures for Investor Class shares, first offered on February 28, 2008, include the historical performance of Class A shares through February 27, 2008, adjusted for differences in certain expenses and fees. Unadjusted, the performance shown for Investor Class shares would likely have been different. |
| 4. | Performance figures for Class A and B shares, first offered on January 2, 2004, include the historical performance of Class I shares through January 1, 2004, adjusted for differences in certain expenses and fees. Unadjusted, the performance shown for Class A and Class B shares would likely have been different. |
| 5. | Performance figures for Class C shares, first offered on January 2, 2004, include the historical performance of L Class shares (which were redesignated as Class C shares on January 2, 2004) from December 30, 2002, through January 1, 2004, and the historical performance of Class I shares through December 29, 2002, adjusted for differences in certain expenses and fees. Unadjusted, the performance shown for Class C shares would likely have been different. |
| 6. | Performance figures for Class R1 and Class R2 shares, first offered on July 31, 2012, include the historical performance of Class I shares through July 30, 2012. The performance for newer share classes is adjusted for differences in fees and expenses. Unadjusted, the performance shown for the newer classes would likely have been different. |
The footnotes on the next page are an integral part of the table and graph and should be carefully read in conjunction with them.
| | | | |
| mainstayinvestments.com | | | 5 | |
| | | | | | | | | | | | | | |
| Benchmark Performance | | Six
Months | | One
Year | | | Five
Years | | | Ten
Years | |
Russell 2500TM Index7 | | 17.94% | | | 18.96 | % | | | 7.95 | % | | | 11.38 | % |
Average Lipper Small-Cap Core Fund8 | | 15.74 | | | 15.47 | | | | 6.81 | | | | 10.27 | |
| 7. | The Russell 2500TM Index measures the performance of the small to mid-cap segment of the U.S. equity universe, commonly referred to as “smid” cap. The Russell 2500TM Index is subset of the Russell 3000® Index. It includes approximately 2,500 of the smallest securities based on a combination of their market cap and current index membership. The Russell 2500TM Index is the Fund’s broad-based securities market index for comparison purposes. Total returns assume reinvestment of all dividends and capital gains. An investment cannot be made directly in an index. |
| 8. | The average Lipper small-cap core fund is representative of funds that, by portfolio practice, invest at least 75% of their equity assets in companies |
| | with market capitalizations (on a three-year weighted basis) below Lipper’s U.S. Diversified Equity small-cap ceiling. Small-cap core funds have more latitude in the companies in which they invest. These funds typically have an average price-to-earnings ratio, price-to-book ratio, and three-year sales-per-share growth value, compared to the S&P SmallCap 600 Index. This average is a product of Lipper Inc. Lipper Inc. is an independent monitor of fund performance. Results are based on average total returns of similar funds with all dividend and capital gain distributions reinvested. |
The footnotes on the preceding page are an integral part of the table and graph and should be carefully read in conjunction with them.
| | |
| 6 | | MainStay U.S. Small Cap Fund |
Cost in Dollars of a $1,000 Investment in MainStay U.S. Small Cap Fund (Unaudited)
The example below is intended to describe the fees and expenses borne by shareholders during the six-month period from November 1, 2012, to April 30, 2013, and the impact of those costs on your investment.
Example
As a shareholder of the Fund, you incur two types of costs: (1) transaction costs, including exchange fees and sales charges (loads) on purchases (as applicable), and (2) ongoing costs, including management fees, distribution and/or service (12b-1) fees, and other Fund expenses (as applicable). This example is intended to help you understand your ongoing costs (in dollars) of investing in the Fund and to compare these costs with the ongoing costs of investing in other mutual funds. The example is based on an investment of $1,000 made at the beginning of the six-month period and held for the entire period from November 1, 2012, to April 30, 2013.
This example illustrates your Fund’s ongoing costs in two ways:
Actual Expenses
The second and third data columns in the table below provide information about actual account values and actual expenses. You may use the information in these columns, together with the amount you invested, to estimate the expenses that you paid during the six months ended April 30, 2013. Simply divide your account value by $1,000 (for example, an $8,600 account value divided by $1,000 = 8.6), then
multiply the result by the number under the heading entitled “Expenses Paid During Period” to estimate the expenses you paid on your account during this period.
Hypothetical Example for Comparison Purposes
The fourth and fifth data columns in the table below provide information about hypothetical account values and hypothetical expenses based on the Fund’s actual expense ratio and an assumed rate of return of 5% per year before expenses, which is not the Fund’s actual return. The hypothetical account values and expenses may not be used to estimate the actual ending account balances or expenses you paid for the six-month period shown. You may use this information to compare the ongoing costs of investing in the Fund with the ongoing costs of investing in other Funds. To do so, compare this 5% hypothetical example with the 5% hypothetical examples that appear in the shareholder reports of the other Funds.
Please note that the expenses shown in the table are meant to highlight your ongoing costs only and do not reflect any transactional costs, such as exchange fees or sales charges (loads). Therefore, the fourth and fifth data columns of the table are useful in comparing ongoing costs only and will not help you determine the relative total costs of owning different funds. In addition, if these transactional costs were included, your costs would have been higher.
| | | | | | | | | | | | | | | | | | | | |
| | | | | | | | | | | | | | | | |
| Share Class | | Beginning
Account
Value
11/1/12 | | | Ending Account
Value (Based
on Actual
Returns and
Expenses)
4/30/13 | | | Expenses
Paid
During
Period1 | | | Ending Account
Value (Based
on Hypothetical
5% Annualized
Return and
Actual Expenses)
4/30/13 | | | Expenses
Paid
During
Period1 | |
| | | | | |
| Investor Class Shares | | $ | 1,000.00 | | | $ | 1,179.30 | | | $ | 8.92 | | | $ | 1,016.60 | | | $ | 8.25 | |
| | | | | |
| Class A Shares | | $ | 1,000.00 | | | $ | 1,181.20 | | | $ | 7.30 | | | $ | 1,018.10 | | | $ | 6.76 | |
| | | | | |
| Class B Shares | | $ | 1,000.00 | | | $ | 1,174.70 | | | $ | 12.94 | | | $ | 1,012.90 | | | $ | 11.98 | |
| | | | | |
| Class C Shares | | $ | 1,000.00 | | | $ | 1,175.50 | | | $ | 12.95 | | | $ | 1,012.90 | | | $ | 11.98 | |
| | | | | |
| Class I Shares | | $ | 1,000.00 | | | $ | 1,183.10 | | | $ | 5.95 | | | $ | 1,019.30 | | | $ | 5.51 | |
| | | | | |
| Class R1 Shares | | $ | 1,000.00 | | | $ | 1,182.10 | | | $ | 6.49 | | | $ | 1,018.80 | | | $ | 6.01 | |
| | | | | |
| Class R2 Shares | | $ | 1,000.00 | | | $ | 1,180.90 | | | $ | 7.84 | | | $ | 1,017.60 | | | $ | 7.25 | |
| 1. | Expenses are equal to the Fund’s annualized expense ratio of each class (1.65% for Investor Class, 1.35% for Class A, 2.40% for Class B and Class C, 1.10% for Class I, 1.20% for Class R1 and 1.45% for Class R2) multiplied by the average account value over the period, divided by 365 and multiplied by 181 (to reflect the six-month period). The table above represents the actual expenses incurred during the six-month period. |
| | | | |
| mainstayinvestments.com | | | 7 | |
Industry Composition as of April 30, 2013 (Unaudited)
| | | | |
| Health Care Equipment & Supplies | | | 8.0 | % |
| Machinery | | | 7.8 | |
| Commercial Banks | | | 6.5 | |
| Hotels, Restaurants & Leisure | | | 6.2 | |
| Exchange Traded Funds | | | 4.3 | |
| Electric Utilities | | | 3.8 | |
| IT Services | | | 3.6 | |
| Semiconductors & Semiconductor Equipment | | | 3.6 | |
| Textiles, Apparel & Luxury Goods | | | 3.6 | |
| Thrifts & Mortgage Finance | | | 3.4 | |
| Auto Components | | | 3.1 | |
| Health Care Providers & Services | | | 3.0 | |
| Aerospace & Defense | | | 2.7 | |
| Chemicals | | | 2.7 | |
| Specialty Retail | | | 2.7 | |
| Electronic Equipment & Instruments | | | 2.5 | |
| Commercial Services & Supplies | | | 2.4 | |
| Road & Rail | | | 2.3 | |
| Diversified Consumer Services | | | 1.9 | |
| Multi-Utilities | | | 1.9 | |
| Pharmaceuticals | | | 1.8 | |
| | | | |
| Biotechnology | | | 1.7 | % |
| Containers & Packaging | | | 1.6 | |
| Diversified Financial Services | | | 1.6 | |
| Building Products | | | 1.5 | |
| Communications Equipment | | | 1.5 | |
| Food & Staples Retailing | | | 1.2 | |
| Trading Companies & Distributors | | | 1.2 | |
| Food Products | | | 1.1 | |
| Paper & Forest Products | | | 1.1 | |
| Real Estate Investment Trusts | | | 1.1 | |
| Software | | | 1.1 | |
| Capital Markets | | | 1.0 | |
| Energy Equipment & Services | | | 1.0 | |
| Computers & Peripherals | | | 0.7 | |
| Diversified Telecommunication Services | | | 0.7 | |
| Professional Services | | | 0.6 | |
| Household Durables | | | 0.2 | |
| Metals & Mining | | | 0.1 | |
| Short-Term Investment | | | 0.5 | |
| Other Assets, Less Liabilities | | | 2.7 | |
| | | | |
| | | 100.0 | % |
| | | | |
See Portfolio of Investments beginning on page 11 for specific holdings within these categories.
Top Ten Holdings as of April 30, 2013 (excluding short-term investment)
| 1. | iShares Russell 2000 Value Index Fund |
| 2. | Mueller Industries, Inc. |
| 3. | Iconix Brand Group, Inc. |
| 5. | Service Corp. International |
| 6. | Life Time Fitness, Inc. |
| 7. | Endo Health Solutions, Inc. |
| 8. | WellCare Health Plans, Inc. |
| | |
| 8 | | MainStay U.S. Small Cap Fund |
Portfolio Management Discussion and Analysis (Unaudited)
Questions answered by portfolio managers David Pearl, Michael Welhoelter, CFA, and Janet K. Navon of Epoch Investment Partners, Inc., the Fund’s Subadvisor.
How did MainStay U.S. Small Cap Fund perform relative to its peers and its benchmark for the six months ended April 30, 2013?
Excluding all sales charges, MainStay U.S. Small Cap Fund returned 17.93% for Investor Class shares, 18.12% for Class A shares, 17.47% for Class B shares and 17.55% for Class C shares for the six months ended April 30, 2013. Over the same period, Class I shares returned 18.31%, Class R1 shares returned 18.21% and Class R2 shares returned 18.09%. All share classes outperformed the 15.74% return of the average Lipper1 small-cap core fund. Investor Class, Class B and Class C shares underperformed—and Class A, Class I, Class R1 and Class R2 shares outperformed—the 17.94% return of the Russell 2500™ Index2 for the six months ended April 30, 2013. The Russell 2500™ Index is the Fund’s broad-based securities-market index. See page 5 for Fund returns with applicable sales charges.
What factors affected the Fund’s relative performance during the reporting period?
Several factors affected the Fund’s performance relative to the Russell 2500™ Index during the reporting period. Stock selection within the materials sector was the greatest positive contributor during the reporting period. (Contributions take weightings and total returns into account.) A generously overweight position and effective stock selection in the consumer discretionary sector also added to the Fund’s relative performance. On the other hand, stock selection in the industrials and financials sectors detracted from the Fund’s performance relative to the Russell 2500™ Index.
During the reporting period, which sectors were the strongest positive contributors to the Fund’s relative performance and which sectors were particularly weak?
Favorable stock selection made materials the strongest positive sector contributor to performance relative to the Russell 2500™ Index. Strong stock selection in the consumer discretionary, consumer staples and telecommunication services sectors also contributed positively to the Fund’s relative performance.
Stock selection within the financials and industrials sectors was the biggest detractor from performance relative to the Russell 2500™ Index. The Fund’s residual cash position also detracted from relative performance in a rising equity market.
During the reporting period, which individual stocks made the strongest positive contributions to the Fund’s absolute performance and which stocks detracted the most?
The individual stocks that made the strongest positive contributions to the Fund’s absolute performance were integrated
biopharmaceutical company Alkermes, brand management company Iconix, drilling and production-related company Flotek and slot machine manufacturer Multimedia Games Holding. Alkermes beat earnings expectations and raised guidance for its fiscal year, and the company’s stock price reacted favorably. Iconix beat earnings and revised guidance upwards for 2013, and the stock price reacted favorably. In addition, Iconix continued to expand on its strong brand portfolio, announcing the acquisition of Umbro from Nike. Flotek saw its stock price advance after the company announced a joint venture with oil services company Gulf Energy to construct an oilfield chemicals production and research-and-development facility in the Middle East. Multimedia Games Holding’s stock advanced during the reporting period, as the company prepared for expansion into the Nevada and New Jersey markets.
The most substantial detractors from absolute performance during the reporting period were semiconductor company Volterra Semiconductor and clinical test service provider Bio-Reference Laboratories. Volterra Semiconductor suffered some revenue headwinds in conjunction with a shift in corporate strategy, and the stock was a drag on Fund performance during the reporting period. Bio-Reference Laboratories reported better-than-expected earnings, but the stock declined as the market continued to worry about reimbursement pressures from Blue Cross Blue Shield customers and the Medicare program.
Did the Fund make any significant purchases or sales during the reporting period?
The Fund initiated a position in Waste Connection, a U.S.-based waste collection and transfer entity. The company has created a competitive advantage by focusing on long-term exclusive markets or vertically-integrated competitive markets. We believe that the company is well-positioned for continued growth. The Fund also purchased shares of Papa John’s Pizza, the third-largest global pizza chain. The company was highly resilient during the recession and has implemented a multiyear overseas expansion plan, which will provide scale abroad.
The Fund sold out of several positions because of market capitalization restrictions after significant price appreciation. Among these were positions in metals processor and fabricator Haynes International and building materials manufacturer Masco. Shares of apparel and footwear retailer PVH, which were received as a portion of the consideration for the company’s acquisition of Warnaco, were also sold during the reporting period.
How did the Fund’s sector weightings change during the reporting period?
We increased the Fund’s exposure to the financials sector but remained significantly underweight relative to the Russell
| 1. | See footnote on page 6 for more information on Lipper Inc. |
| 2. | See footnote on page 6 for more information on the Russell 2500TM Index. |
| | | | |
| mainstayinvestments.com | | | 9 | |
2500™ Index. We considerably reduced the Fund’s consumer staples weighting, moving from a significantly overweight position at the beginning of the reporting period to a moderately underweight position relative to the Russell 2500™ Index at the end of the reporting period. We also trimmed the Fund’s position in information technology, moving from a slightly overweight position to an underweight position relative to the Russell 2500™ Index. Exposure to industrials was also reduced, although that sector remains overweight relative to the Index.
How was the Fund positioned at the end of April 2013?
All sector weights are arrived at through stock selection rather than top-down decisions on the attractiveness of specific sectors. As of April 30, 2013, the Fund held an overweight position relative to the Russell 2500™ Index in the consumer discretionary sector, where a number of holdings experienced increased revenue as aggregate consumer spending increased.
As of the same date, the Fund also held an overweight position relative to the Index in the industrials sector, with a range of industries represented, and an overweight position in the health care sector, where many companies are enjoying increased participation rates following new regulation.
As of April 30, 2013, the most significant sector-weighting variation from the Russell 2500™ Index was in the financials sector, where the Fund had much less exposure than the Index. As of the same date, the Fund was also underweight the energy sector.
We remain committed to investing in high-quality, cash-generating businesses with sound capital allocation policies. In an environment where economic growth is slower than in past cycles, this is where we see opportunity, even if the market pauses in the near term after a period of outsized returns.
The opinions expressed are those of the portfolio managers as of the date of this report and are subject to change. There is no guarantee that any forecast made will come to pass. This material does not constitute investment advice and is not intended as an endorsement of any specific investment.
| | |
| 10 | | MainStay U.S. Small Cap Fund |
Portfolio of Investments April 30, 2013 (Unaudited)
| | | | | | | | |
| | |
| | | Shares | | | Value | |
| | | | | | | | |
| | | | | | | | |
| Common Stocks 92.5%† | |
Aerospace & Defense 2.7% | |
Curtiss-Wright Corp. | | | 151,350 | | | $ | 4,970,334 | |
HEICO Corp. Class A | | | 4,900 | | | | 165,718 | |
Hexcel Corp. (a) | | | 232,900 | | | | 7,103,450 | |
| | | | | | | | |
| | | | | | | 12,239,502 | |
| | | | | | | | |
Auto Components 3.1% | | | | | | | | |
Dana Holding Corp. | | | 291,850 | | | | 5,034,412 | |
Tenneco, Inc. (a) | | | 130,100 | | | | 5,030,967 | |
Visteon Corp. (a) | | | 65,450 | | | | 3,847,806 | |
| | | | | | | | |
| | | | | | | 13,913,185 | |
| | | | | | | | |
Biotechnology 1.7% | | | | | | | | |
¨Alkermes PLC (a) | | | 245,955 | | | | 7,528,683 | |
| | | | | | | | |
| | |
Building Products 1.5% | | | | | | | | |
Armstrong World Industries, Inc. (a) | | | 66,000 | | | | 3,368,640 | |
Simpson Manufacturing Co., Inc. | | | 113,660 | | | | 3,266,588 | |
| | | | | | | | |
| | | | | | | 6,635,228 | |
| | | | | | | | |
Capital Markets 1.0% | | | | | | | | |
Waddell & Reed Financial, Inc. Class A | | | 104,450 | | | | 4,477,772 | |
| | | | | | | | |
| | |
Chemicals 2.7% | | | | | | | | |
Chemtura Corp. (a) | | | 273,000 | | | | 5,803,980 | |
Flotek Industries, Inc. (a) | | | 402,050 | | | | 6,448,882 | |
| | | | | | | | |
| | | | | | | 12,252,862 | |
| | | | | | | | |
Commercial Banks 6.5% | | | | | | | | |
Bank of Hawaii Corp. | | | 128,450 | | | | 6,125,780 | |
BankUnited, Inc. | | | 285,580 | | | | 7,239,453 | |
CVB Financial Corp. | | | 357,977 | | | | 3,891,210 | |
Investors Bancorp, Inc. | | | 362,752 | | | | 7,182,490 | |
Texas Capital Bancshares, Inc. (a) | | | 108,200 | | | | 4,507,612 | |
| | | | | | | | |
| | | | | | | 28,946,545 | |
| | | | | | | | |
Commercial Services & Supplies 2.4% | | | | | | | | |
Herman Miller, Inc. | | | 249,541 | | | | 6,260,984 | |
Waste Connections, Inc. | | | 116,200 | | | | 4,409,790 | |
| | | | | | | | |
| | | | | | | 10,670,774 | |
| | | | | | | | |
Communications Equipment 1.5% | | | | | | | | |
Harmonic, Inc. (a) | | | 1,149,035 | | | | 6,526,519 | |
| | | | | | | | |
| | |
Computers & Peripherals 0.7% | | | | | | | | |
Diebold, Inc. | | | 103,415 | | | | 3,029,025 | |
| | | | | | | | |
| | |
Containers & Packaging 1.6% | | | | | | | | |
Silgan Holdings, Inc. | | | 153,010 | | | | 7,324,589 | |
| | | | | | | | |
| | | | | | | | |
| | |
| | | Shares | | | Value | |
| | | | | | | | |
Diversified Consumer Services 1.9% | | | | | | | | |
¨Service Corp. International | | | 491,500 | | | $ | 8,296,520 | |
| | | | | | | | |
| | |
Diversified Financial Services 1.6% | | | | | | | | |
CBOE Holdings, Inc. | | | 185,450 | | | | 6,959,938 | |
| | | | | | | | |
|
Diversified Telecommunication Services 0.7% | |
Lumos Networks Corp. | | | 226,925 | | | | 3,061,218 | |
| | | | | | | | |
| | |
Electric Utilities 3.8% | | | | | | | | |
Cleco Corp. | | | 91,290 | | | | 4,520,681 | |
Great Plains Energy, Inc. | | | 276,850 | | | | 6,680,390 | |
Westar Energy, Inc. | | | 161,250 | | | | 5,637,300 | |
| | | | | | | | |
| | | | | | | 16,838,371 | |
| | | | | | | | |
Electronic Equipment & Instruments 2.5% | | | | | | | | |
MTS Systems Corp. | | | 94,350 | | | | 5,750,633 | |
National Instruments Corp. | | | 195,834 | | | | 5,352,143 | |
| | | | | | | | |
| | | | | | | 11,102,776 | |
| | | | | | | | |
Energy Equipment & Services 1.0% | | | | | | | | |
Dril-Quip, Inc. (a) | | | 53,150 | | | | 4,449,187 | |
| | | | | | | | |
| | |
Food & Staples Retailing 1.2% | | | | | | | | |
Spartan Stores, Inc. | | | 321,300 | | | | 5,391,414 | |
| | | | | | | | |
| | |
Food Products 1.1% | | | | | | | | |
TreeHouse Foods, Inc. (a) | | | 80,200 | | | | 5,109,542 | |
| | | | | | | | |
| | |
Health Care Equipment & Supplies 8.0% | | | | | | | | |
Alere, Inc. (a) | | | 91,900 | | | | 2,359,992 | |
Greatbatch, Inc. (a) | | | 27,654 | | | | 772,653 | |
Haemonetics Corp. (a) | | | 150,000 | | | | 5,775,000 | |
Integra LifeSciences Holdings Corp. (a) | | | 178,681 | | | | 6,259,195 | |
Sirona Dental Systems, Inc. (a) | | | 85,938 | | | | 6,319,881 | |
¨Teleflex, Inc. | | | 97,100 | | | | 7,586,423 | |
Wright Medical Group, Inc. (a) | | | 277,667 | | | | 6,508,514 | |
| | | | | | | | |
| | | | | | | 35,581,658 | |
| | | | | | | | |
Health Care Providers & Services 3.0% | | | | | | | | |
Bio-Reference Laboratories, Inc. (a) | | | 217,675 | | | | 5,550,712 | |
¨WellCare Health Plans, Inc. (a) | | | 131,280 | | | | 7,654,937 | |
| | | | | | | | |
| | | | | | | 13,205,649 | |
| | | | | | | | |
Hotels, Restaurants & Leisure 6.2% | | | | | | | | |
Brinker International, Inc. | | | 180,020 | | | | 7,002,778 | |
¨Life Time Fitness, Inc. (a) | | | 179,030 | | | | 8,267,605 | |
Monarch Casino & Resort, Inc. (a) | | | 144,149 | | | | 1,855,198 | |
Multimedia Games Holding Co., Inc. (a) | | | 54,343 | | | | 1,340,098 | |
Papa John’s International, Inc. (a) | | | 60,300 | | | | 3,798,900 | |
| † | Percentages indicated are based on Fund net assets. |
| ¨ | | Among the Fund’s 10 largest holdings, as of April 30, 2013, excluding short-term investment. May be subject to change daily. |
| | | | | | |
The notes to the financial statements are an integral part of,
and should be read in conjunction with, the financial statements. | | mainstayinvestments.com | | | 11 | |
Portfolio of Investments April 30, 2013 (Unaudited) (continued)
| | | | | | | | |
| | |
| | | Shares | | | Value | |
| | | | | | | | |
| Common Stocks (continued) | |
Hotels, Restaurants & Leisure (continued) | | | | | | | | |
SHFL Entertainment, Inc. (a) | | | 329,200 | | | $ | 5,201,360 | |
| | | | | | | | |
| | | | | | | 27,465,939 | |
| | | | | | | | |
Household Durables 0.2% | | | | | | | | |
Ryland Group, Inc. (The) | | | 15,897 | | | | 716,319 | |
| | | | | | | | |
| | |
IT Services 3.6% | | | | | | | | |
Euronet Worldwide, Inc. (a) | | | 166,800 | | | | 5,092,404 | |
Forrester Research, Inc. | | | 173,212 | | | | 6,209,650 | |
NeuStar, Inc. Class A (a) | | | 111,200 | | | | 4,878,344 | |
| | | | | | | | |
| | | | | | | 16,180,398 | |
| | | | | | | | |
Machinery 7.8% | | | | | | | | |
Actuant Corp. Class A | | | 77,500 | | | | 2,425,750 | |
Harsco Corp. | | | 257,200 | | | | 5,614,676 | |
Kennametal, Inc. | | | 79,939 | | | | 3,196,761 | |
¨Mueller Industries, Inc. | | | 171,550 | | | | 8,882,859 | |
Navistar International Corp. (a) | | | 85,350 | | | | 2,826,792 | |
Wabtec Corp. | | | 42,101 | | | | 4,418,079 | |
Woodward, Inc. | | | 206,200 | | | | 7,421,138 | |
| | | | | | | | |
| | | | | | | 34,786,055 | |
| | | | | | | | |
Metals & Mining 0.1% | | | | | | | | |
Haynes International, Inc. | | | 7,037 | | | | 342,069 | |
| | | | | | | | |
| | |
Multi-Utilities 1.9% | | | | | | | | |
¨Vectren Corp. | | | 221,200 | | | | 8,308,272 | |
| | | | | | | | |
| | |
Paper & Forest Products 1.1% | | | | | | | | |
KapStone Paper and Packaging Corp. (a) | | | 160,980 | | | | 4,761,788 | |
| | | | | | | | |
| | |
Pharmaceuticals 1.8% | | | | | | | | |
¨Endo Health Solutions, Inc. (a) | | | 217,950 | | | | 7,985,688 | |
| | | | | | | | |
| | |
Professional Services 0.6% | | | | | | | | |
Resources Connection, Inc. | | | 228,300 | | | | 2,593,488 | |
| | | | | | | | |
| | |
Real Estate Investment Trusts 1.1% | | | | | | | | |
Tanger Factory Outlet Centers, Inc. | | | 128,150 | | | | 4,756,928 | |
| | | | | | | | |
| | |
Road & Rail 2.3% | | | | | | | | |
Con-way, Inc. | | | 124,100 | | | | 4,194,580 | |
Genesee & Wyoming, Inc. Class A (a) | | | 69,290 | | | | 5,903,508 | |
| | | | | | | | |
| | | | | | | 10,098,088 | |
| | | | | | | | |
Semiconductors & Semiconductor Equipment 3.6% | |
Cypress Semiconductor Corp. (a) | | | 535,510 | | | | 5,403,296 | |
Teradyne, Inc. (a) | | | 257,500 | | | | 4,233,300 | |
Veeco Instruments, Inc. (a) | | | 120,790 | | | | 4,598,475 | |
Volterra Semiconductor Corp. (a) | | | 122,584 | | | | 1,594,818 | |
| | | | | | | | |
| | | | | | | 15,829,889 | |
| | | | | | | | |
| | | | | | | | |
| | |
| | | Shares | | | Value | |
| | | | | | | | |
Software 1.1% | | | | | | | | |
Rovi Corp. (a) | | | 202,950 | | | $ | 4,747,001 | |
| | | | | | | | |
| | |
Specialty Retail 2.7% | | | | | | | | |
Express, Inc. (a) | | | 315,600 | | | | 5,747,076 | |
JoS. A. Bank Clothiers, Inc. (a) | | | 124,958 | | | | 5,458,166 | |
Sonic Automotive, Inc. | | | 48,386 | | | | 1,064,008 | |
| | | | | | | | |
| | | | | | | 12,269,250 | |
| | | | | | | | |
Textiles, Apparel & Luxury Goods 3.6% | | | | | | | | |
G-III Apparel Group, Ltd. (a) | | | 93,050 | | | | 3,783,413 | |
¨Iconix Brand Group, Inc. (a) | | | 291,850 | | | | 8,361,502 | |
Perry Ellis International, Inc. | | | 221,200 | | | | 3,886,484 | |
| | | | | | | | |
| | | | | | | 16,031,399 | |
| | | | | | | | |
Thrifts & Mortgage Finance 3.4% | | | | | | | | |
Brookline Bancorp, Inc. | | | 624,850 | | | | 5,248,740 | |
Capitol Federal Financial, Inc. | | | 354,560 | | | | 4,197,990 | |
Viewpoint Financial Group, Inc. | | | 300,350 | | | | 5,592,517 | |
| | | | | | | | |
| | | | | | | 15,039,247 | |
| | | | | | | | |
Trading Companies & Distributors 1.2% | | | | | | | | |
Titan Machinery, Inc. (a) | | | 247,369 | | | | 5,580,666 | |
| | | | | | | | |
Total Common Stocks
(Cost $327,715,016) | | | | | | | 411,033,441 | |
| | | | | | | | |
| | |
| | | | | | | | |
| Exchange Traded Fund 4.3% (b) | |
¨iShares Russell 2000 Value Index Fund | | | 230,570 | | | | 19,330,989 | |
| | | | | | | | |
Total Exchange Traded Fund
(Cost $18,625,484) | | | | | | | 19,330,989 | |
| | | | | | | | |
| | |
| | | | | | | | |
| | | Principal
Amount | | | | |
| Short-Term Investment 0.5% | |
Repurchase Agreement 0.5% | |
State Street Bank and Trust Co.
0.01%, dated 4/30/13
due 5/1/13
Proceeds at Maturity $2,360,810 (Collateralized by a Federal Home Loan Mortgage Corp. security with a rate of 2.10% and a maturity date of 10/17/22, with a Principal Amount of $2,425,000 and a Market Value of $2,409,402) | | $ | 2,360,810 | | | | 2,360,810 | |
| | | | | | | | |
Total Short-Term Investment
(Cost $2,360,810) | | | | | | | 2,360,810 | |
| | | | | | | | |
Total Investments
(Cost $348,701,310) (c) | | | 97.3 | % | | | 432,725,240 | |
Other Assets, Less Liabilities | | | 2.7 | | | | 11,816,342 | |
Net Assets | | | 100.0 | % | | $ | 444,541,582 | |
| | | | |
| 12 | | MainStay U.S. Small Cap Fund | | The notes to the financial statements are an integral part of,
and should be read in conjunction with, the financial statements. |
| (a) | Non-income producing security. |
| (b) | Exchange Traded Fund—An investment vehicle that represents a basket of securities that is traded on an exchange. |
| (c) | As of April 30, 2013, cost is $350,002,756 for federal income tax purposes and net unrealized appreciation is as follows: |
| | | | |
Gross unrealized appreciation | | $ | 91,311,907 | |
Gross unrealized depreciation | | | (8,589,423 | ) |
| | | | |
Net unrealized appreciation | | $ | 82,722,484 | |
| | | | |
The following is a summary of the fair valuations according to the inputs used as of April 30, 2013, for valuing the Fund’s assets.
Asset Valuation Inputs
| | | | | | | | | | | | | | | | |
Description | | Quoted
Prices in
Active
Markets for
Identical
Assets (Level 1) | | | Significant
Other
Observable
Inputs (Level 2) | | | Significant
Unobservable
Inputs (Level 3) | | | Total | |
| Investments in Securities (a) | | | | | | | | | | | | | | | | |
| Common Stocks | | $ | 411,033,441 | | | $ | — | | | $ | — | | | $ | 411,033,441 | |
| Exchange Traded Fund | | | 19,330,989 | | | | — | | | | — | | | | 19,330,989 | |
| Short-Term Investment | | | | | | | | | | | | | | | | |
Repurchase Agreement | | | — | | | | 2,360,810 | | | | — | | | | 2,360,810 | |
| | | | | | | | | | | | | | | | |
| Total Investments in Securities | | $ | 430,364,430 | | | $ | 2,360,810 | | | $ | — | | | $ | 432,725,240 | |
| | | | | | | | | | | | | | | | |
| (a) | For a complete listing of investments and their industries, see the Portfolio of Investments. |
The Fund recognizes transfers between the levels as of the beginning of the period.
For the period ended April 30, 2013, the Fund did not have any transfers between Level 1 and Level 2 fair value measurements. (See Note 2)
As of April 30, 2013, the Fund did not hold any investments with significant unobservable inputs (Level 3). (See Note 2)
| | | | | | |
The notes to the financial statements are an integral part of,
and should be read in conjunction with, the financial statements. | | mainstayinvestments.com | | | 13 | |
Statement of Assets and Liabilities as of April 30, 2013 (Unaudited)
| | | | |
| Assets | | | | |
Investment in securities, at value
(identified cost $348,701,310) | | $ | 432,725,240 | |
Receivables: | | | | |
Investment securities sold | | | 16,800,274 | |
Fund shares sold | | | 372,548 | |
Dividends and interest | | | 110,807 | |
Other assets | | | 56,445 | |
| | | | |
Total assets | | | 450,065,314 | |
| | | | |
| |
| Liabilities | | | | |
Payables: | | | | |
Investment securities purchased | | | 4,255,632 | |
Fund shares redeemed | | | 591,397 | |
Manager (See Note 3) | | | 303,126 | |
Transfer agent (See Note 3) | | | 178,347 | |
NYLIFE Distributors (See Note 3) | | | 75,593 | |
Shareholder communication | | | 71,447 | |
Professional fees | | | 42,462 | |
Custodian | | | 2,269 | |
Trustees | | | 639 | |
Accrued expenses | | | 2,820 | |
| | | | |
Total liabilities | | | 5,523,732 | |
| | | | |
Net assets | | $ | 444,541,582 | |
| | | | |
| |
| Composition of Net Assets | | | | |
Shares of beneficial interest outstanding (par value of $.001 per share) unlimited number of shares authorized | | $ | 21,698 | |
Additional paid-in capital | | | 553,066,699 | |
| | | | |
| | | 553,088,397 | |
Distributions in excess of net investment loss | | | (483,939 | ) |
Accumulated net realized gain (loss) on investments | | | (192,086,806 | ) |
Net unrealized appreciation (depreciation) on investments | | | 84,023,930 | |
| | | | |
Net assets | | $ | 444,541,582 | |
| | | | |
| | | | |
Investor Class | | | | |
Net assets applicable to outstanding shares | | $ | 76,819,808 | |
| | | | |
Shares of beneficial interest outstanding | | | 3,771,985 | |
| | | | |
Net asset value per share outstanding | | $ | 20.37 | |
Maximum sales charge (5.50% of offering price) | | | 1.19 | |
| | | | |
Maximum offering price per share outstanding | | $ | 21.56 | |
| | | | |
Class A | | | | |
Net assets applicable to outstanding shares | | $ | 105,081,173 | |
| | | | |
Shares of beneficial interest outstanding | | | 5,134,848 | |
| | | | |
Net asset value per share outstanding | | $ | 20.46 | |
Maximum sales charge (5.50% of offering price) | | | 1.19 | |
| | | | |
Maximum offering price per share outstanding | | $ | 21.65 | |
| | | | |
Class B | | | | |
Net assets applicable to outstanding shares | | $ | 30,072,748 | |
| | | | |
Shares of beneficial interest outstanding | | | 1,577,114 | |
| | | | |
Net asset value and offering price per share outstanding | | $ | 19.07 | |
| | | | |
Class C | | | | |
Net assets applicable to outstanding shares | | $ | 18,372,889 | |
| | | | |
Shares of beneficial interest outstanding | | | 963,758 | |
| | | | |
Net asset value and offering price per share outstanding | | $ | 19.06 | |
| | | | |
Class I | | | | |
Net assets applicable to outstanding shares | | $ | 214,133,461 | |
| | | | |
Shares of beneficial interest outstanding | | | 10,247,417 | |
| | | | |
Net asset value and offering price per share outstanding | | $ | 20.90 | |
| | | | |
Class R1 | | | | |
Net assets applicable to outstanding shares | | $ | 30,780 | |
| | | | |
Shares of beneficial interest outstanding | | | 1,473 | |
| | | | |
Net asset value and offering price per share outstanding | | $ | 20.89 | |
| | | | |
Class R2 | | | | |
Net assets applicable to outstanding shares | | $ | 30,723 | |
| | | | |
Shares of beneficial interest outstanding | | | 1,502 | |
| | | | |
Net asset value and offering price per share outstanding | | $ | 20.46 | |
| | | | |
| | | | |
| 14 | | MainStay U.S. Small Cap Fund | | The notes to the financial statements are an integral part of,
and should be read in conjunction with, the financial statements. |
Statement of Operations for the six months ended April 30, 2013 (Unaudited)
| | | | |
| Investment Income (Loss) | |
Income | | | | |
Dividends (a) | | $ | 2,690,536 | |
Interest | | | 518 | |
| | | | |
Total income | | | 2,691,054 | |
| | | | |
Expenses | | | | |
Manager (See Note 3) | | | 1,678,681 | |
Transfer agent (See Note 3) | | | 483,958 | |
Distribution/Service—Investor Class (See Note 3) | | | 90,285 | |
Distribution/Service—Class A (See Note 3) | | | 112,346 | |
Distribution/Service—Class B (See Note 3) | | | 150,280 | |
Distribution/Service—Class C (See Note 3) | | | 84,690 | |
Distribution/Service—Class R2 (See Note 3) | | | 35 | |
Shareholder communication | | | 79,739 | |
Registration | | | 51,100 | |
Professional fees | | | 27,394 | |
Custodian | | | 5,576 | |
Trustees | | | 4,390 | |
Shareholder service (See Note 3) | | | 28 | |
Miscellaneous | | | 15,110 | |
| | | | |
Total expenses | | | 2,783,612 | |
| | | | |
Net investment income (loss) | | | (92,558 | ) |
| | | | |
|
| Realized and Unrealized Gain (Loss) on Investments | |
Net realized gain (loss) on investments | | | 33,413,183 | |
Net change in unrealized appreciation (depreciation) on investments | | | 32,094,389 | |
| | | | |
Net realized and unrealized gain (loss) on investments | | | 65,507,572 | |
| | | | |
Net increase (decrease) in net assets resulting from operations | | $ | 65,415,014 | |
| | | | |
| (a) | Dividends recorded net of foreign withholding taxes in the amount of $10,033. |
| | | | | | |
The notes to the financial statements are an integral part of,
and should be read in conjunction with, the financial statements. | | mainstayinvestments.com | | | 15 | |
Statements of Changes in Net Assets
for the six months ended April 30, 2013 (Unaudited) and the year ended October 31, 2012
| | | | | | | | |
| | | 2013 | | | 2012 | |
| Increase (Decrease) in Net Assets | |
Operations: | | | | | | | | |
Net investment income (loss) | | $ | (92,558 | ) | | $ | 882,660 | |
Net realized gain (loss) on investments | | | 33,413,183 | | | | 12,987,175 | |
Net change in unrealized appreciation (depreciation) on investments | | | 32,094,389 | | | | 13,966,121 | |
| | | | |
Net increase (decrease) in net assets resulting from operations | | | 65,415,014 | | | | 27,835,956 | |
| | | | |
Dividends to shareholders: | | | | | | | | |
From net investment income: | | | | | | | | |
Investor Class | | | (66,940 | ) | | | — | |
Class A | | | (246,233 | ) | | | — | |
Class B | | | (29,746 | ) | | | — | |
Class C | | | (16,528 | ) | | | — | |
Class I | | | (914,424 | ) | | | — | |
Class R1 | | | (134 | ) | | | — | |
Class R2 | | | (68 | ) | | | — | |
| | | | |
Total dividends to shareholders | | | (1,274,073 | ) | | | — | |
| | | | |
Capital share transactions: | | | | | | | | |
Net proceeds from sale of shares | | | 46,676,546 | | | | 68,725,440 | |
Net asset value of shares issued to shareholders in reinvestment of dividends | | | 1,228,068 | | | | — | |
Cost of shares redeemed | | | (31,422,614 | ) | | | (118,263,493 | ) |
| | | | |
Increase (decrease) in net assets derived from capital share transactions | | | 16,482,000 | | | | (49,538,053 | ) |
| | | | |
Net increase (decrease) in net assets | | | 80,622,941 | | | | (21,702,097 | ) |
| | |
| Net Assets | | | | | | | | |
Beginning of period | | | 363,918,641 | | | | 385,620,738 | |
| | | | |
End of period | | $ | 444,541,582 | | | $ | 363,918,641 | |
| | | | |
Distributions in excess of net investment income at end of period | | $ | (483,939 | ) | | $ | 882,692 | |
| | | | |
| | | | |
| 16 | | MainStay U.S. Small Cap Fund | | The notes to the financial statements are an integral part of,
and should be read in conjunction with, the financial statements. |
Financial Highlights selected per share data and ratios
| | | | | | | | | | | | | | | | | | | | | | | | |
| | | Investor Class | |
| | | Six months
ended
April 30, | | | Year ended October 31, | | | February 28,
2008**
through
October 31, | |
| | | 2013* | | | 2012 | | | 2011 | | | 2010 | | | 2009 | | | 2008 | |
Net asset value at beginning of period | | $ | 17.29 | | | $ | 16.17 | | | $ | 15.35 | | | $ | 12.52 | | | $ | 10.14 | | | $ | 13.86 | |
| | | | | | | | | | | | | | | | | | | | | | | | |
Net investment income (loss) (a) | | | (0.03 | ) | | | (0.00 | )‡ | | | 0.03 | | | | (0.03 | ) | | | (0.03 | ) | | | 0.10 | |
Net realized and unrealized gain (loss) on investments | | | 3.13 | | | | 1.12 | | | | 0.82 | | | | 2.86 | | | | 2.63 | | | | (3.82 | ) |
| | | | | | | | | | | | | | | | | | | | | | | | |
Total from investment operations | | | 3.10 | | | | 1.12 | | | | 0.85 | | | | 2.83 | | | | 2.60 | | | | (3.72 | ) |
| | | | | | | | | | | | | | | | | | | | | | | | |
Less dividends: | | | | | | | | | | | | | | | | | | | | | | | | |
From net investment income | | | (0.02 | ) | | | — | | | | (0.03 | ) | | | — | | | | (0.22 | ) | | | — | |
| | | | | | | | | | | | | | | | | | | | | | | | |
Net asset value at end of period | | $ | 20.37 | | | $ | 17.29 | | | $ | 16.17 | | | $ | 15.35 | | | $ | 12.52 | | | $ | 10.14 | |
| | | | | | | | | | | | | | | | | | | | | | | | |
Total investment return (b) | | | 17.93 | % (c) | | | 6.93 | % | | | 5.55 | % | | | 22.60 | % | | | 26.91 | % | | | (26.91 | %)(c) |
Ratios (to average net assets)/Supplemental Data: | | | | | | | | | | | | | | | | | | | | | | | | |
Net investment income (loss) | | | (0.27 | %)†† | | | (0.00 | %)(d) | | | 0.17 | % | | | (0.20 | %) | | | (0.28 | %) | | | 1.10 | % †† |
Net expenses | | | 1.65 | % †† | | | 1.68 | % | | | 1.63 | % | | | 1.63 | % | | | 1.66 | % | | | 1.80 | % †† |
Expenses (before waiver/reimbursement) | | | 1.65 | % †† | | | 1.68 | % | | | 1.66 | % | | | 1.81 | % | | | 2.02 | % | | | 1.83 | % †† |
Portfolio turnover rate | | | 23 | % | | | 32 | % | | | 45 | % | | | 49 | % | | | 218 | % | | | 158 | % |
Net assets at end of period (in 000’s) | | $ | 76,820 | | | $ | 67,818 | | | $ | 68,152 | | | $ | 67,217 | | | $ | 25,832 | | | $ | 11,480 | |
| ** | Commencement of operations. |
| ‡ | Less than one cent per share. |
| (a) | Per share data based on average shares outstanding during the period. |
| (b) | Total investment return is calculated exclusive of sales charges and assumes the reinvestment of dividends and distributions. |
| (c) | Total investment return is not annualized. |
| (d) | Less than one-hundredth of a percent. |
| | | | | | | | | | | | | | | | | | | | | | | | |
| | | Class A | |
| | | Six months
ended
April 30, | | | Year ended October 31, | |
| | | 2013* | | | 2012 | | | 2011 | | | 2010 | | | 2009 | | | 2008 | |
Net asset value at beginning of period | | $ | 17.38 | | | $ | 16.21 | | | $ | 15.36 | | | $ | 12.51 | | | $ | 10.14 | | | $ | 18.65 | |
| | | | | | | | | | | | | | | | | | | | | | | | |
Net investment income (loss) (a) | | | 0.00 | ‡ | | | 0.06 | | | | 0.07 | | | | (0.00 | )‡ | | | 0.00 | ‡ | | | 0.17 | |
Net realized and unrealized gain (loss) on investments | | | 3.13 | | | | 1.11 | | | | 0.83 | | | | 2.85 | | | | 2.61 | | | | (6.55 | ) |
| | | | | | | | | | | | | | | | | | | | | | | | |
Total from investment operations | | | 3.13 | | | | 1.17 | | | | 0.90 | | | | 2.85 | | | | 2.61 | | | | (6.38 | ) |
| | | | | | | | | | | | | | | | | | | | | | | | |
Less dividends and distributions: | | | | | | | | | | | | | | | | | | | | | | | | |
From net investment income | | | (0.05 | ) | | | — | | | | (0.05 | ) | | | — | | | | (0.24 | ) | | | (0.12 | ) |
From net realized gain on investments | | | — | | | | — | | | | — | | | | — | | | | — | | | | (2.01 | ) |
| | | | | | | | | | | | | | | | | | | | | | | | |
Total dividends and distributions | | | (0.05 | ) | | | — | | | | (0.05 | ) | | | — | | | | (0.24 | ) | | | (2.13 | ) |
| | | | | | | | | | | | | | | | | | | | | | | | |
Net asset value at end of period | | $ | 20.46 | | | $ | 17.38 | | | $ | 16.21 | | | $ | 15.36 | | | $ | 12.51 | | | $ | 10.14 | |
| | | | | | | | | | | | | | | | | | | | | | | | |
Total investment return (b) | | | 18.12 | %(c) | | | 7.22 | % | | | 5.86 | % | | | 22.78 | % | | | 27.05 | % | | | (38.10 | %) |
Ratios (to average net assets)/Supplemental Data: | | | | | | | | | | | | | | | | | | | | | | | | |
Net investment income (loss) | | | 0.00 | %††(d) | | | 0.32 | % | | | 0.43 | % | | | (0.02 | %) | | | 0.01 | % | | | 1.24 | % |
Net expenses | | | 1.35 | %†† | | | 1.38 | % | | | 1.36 | % | | | 1.48 | % | | | 1.54 | % | | | 1.65 | % |
Expenses (before waiver/reimbursement) | | | 1.35 | %†† | | | 1.38 | % | | | 1.36 | % | | | 1.48 | % | | | 1.92 | % | | | 1.84 | % |
Portfolio turnover rate | | | 23 | % | | | 32 | % | | | 45 | % | | | 49 | % | | | 218 | % | | | 158 | % |
Net assets at end of period (in 000’s) | | $ | 105,081 | | | $ | 83,047 | | | $ | 89,115 | | | $ | 97,707 | | | $ | 66,905 | | | $ | 64,527 | |
| ‡ | Less than one cent per share. |
| (a) | Per share data based on average shares outstanding during the period. |
| (b) | Total investment return is calculated exclusive of sales charges and assumes the reinvestment of dividends and distributions. |
| (c) | Total investment return is not annualized. |
| (d) | Less than one-hundredth of a percent. |
| | | | | | |
The notes to the financial statements are an integral part of,
and should be read in conjunction with, the financial statements. | | mainstayinvestments.com | | | 17 | |
Financial Highlights selected per share data and ratios
| | | | | | | | | | | | | | | | | | | | | | | | |
| | | Class B | |
| | | Six months
ended
April 30, | | | Year ended October 31, | |
| | | 2013* | | | 2012 | | | 2011 | | | 2010 | | | 2009 | | | 2008 | |
Net asset value at beginning of period | | $ | 16.25 | | | $ | 15.32 | | | $ | 14.62 | | | $ | 12.02 | | | $ | 9.70 | | | $ | 17.94 | |
| | | | | | | | | | | | | | | | | | | | | | | | |
Net investment income (loss) (a) | | | (0.09 | ) | | | (0.12 | ) | | | (0.09 | ) | | | (0.12 | ) | | | (0.09 | ) | | | 0.06 | |
Net realized and unrealized gain (loss) on investments | | | 2.93 | | | | 1.05 | | | | 0.79 | | | | 2.72 | | | | 2.54 | | | | (6.29 | ) |
| | | | | | | | | | | | | | | | | | | | | | | | |
Total from investment operations | | | 2.84 | | | | 0.93 | | | | 0.70 | | | | 2.60 | | | | 2.45 | | | | (6.23 | ) |
| | | | | | | | | | | | | | | | | | | | | | | | |
Less dividends and distributions: | | | | | | | | | | | | | | | | | | | | | | | | |
From net investment income | | | (0.02 | ) | | | — | | | | (0.00 | )‡ | | | — | | | | (0.13 | ) | | | — | |
From net realized gain on investments | | | — | | | | — | | | | — | | | | — | | | | — | | | | (2.01 | ) |
| | | | | | | | | | | | | | | | | | | | | | | | |
Total dividends and distributions | | | (0.02 | ) | | | — | | | | (0.00 | )‡ | | | — | | | | (0.13 | ) | | | (2.01 | ) |
| | | | | | | | | | | | | | | | | | | | | | | | |
Net asset value at end of period | | $ | 19.07 | | | $ | 16.25 | | | $ | 15.32 | | | $ | 14.62 | | | $ | 12.02 | | | $ | 9.70 | |
| | | | | | | | | | | | | | | | | | | | | | | | |
Total investment return (b) | | | 17.47 | % (c) | | | 6.07 | % | | | 4.81 | % | | | 21.63 | % | | | 25.99 | % | | | (38.56 | %) |
Ratios (to average net assets)/Supplemental Data: | | | | | | | | | | | | | | | | | | | | | | | | |
Net investment income (loss) | | | (1.00 | %)†† | | | (0.73 | %) | | | (0.57 | %) | | | (0.93 | %) | | | (0.95 | %) | | | 0.47 | % |
Net expenses | | | 2.40 | % †† | | | 2.43 | % | | | 2.38 | % | | | 2.38 | % | | | 2.38 | % | | | 2.44 | % |
Expenses (before waiver/reimbursement) | | | 2.40 | % †† | | | 2.43 | % | | | 2.41 | % | | | 2.56 | % | | | 2.78 | % | | | 2.66 | % |
Portfolio turnover rate | | | 23 | % | | | 32 | % | | | 45 | % | | | 49 | % | | | 218 | % | | | 158 | % |
Net assets at end of period (in 000’s) | | $ | 30,073 | | | $ | 29,832 | | | $ | 37,309 | | | $ | 43,744 | | | $ | 23,354 | | | $ | 13,305 | |
| ‡ | Less than one cent per share. |
| (a) | Per share data based on average shares outstanding during the period. |
| (b) | Total investment return is calculated exclusive of sales charges and assumes the reinvestment of dividends and distributions. |
| (c) | Total investment return is not annualized. |
| | | | | | | | | | | | | | | | | | | | | | | | |
| | | Class C | |
| | | Six months
ended
April 30, | | | Year ended October 31, | |
| | | 2013* | | | 2012 | | | 2011 | | | 2010 | | | 2009 | | | 2008 | |
Net asset value at beginning of period | | $ | 16.24 | | | $ | 15.31 | | | $ | 14.62 | | | $ | 12.01 | | | $ | 9.70 | | | $ | 17.94 | |
| | | | | | | | | | | | | | | | | | | | | | | | |
Net investment income (loss) (a) | | | (0.09 | ) | | | (0.12 | ) | | | (0.09 | ) | | | (0.12 | ) | | | (0.08 | ) | | | 0.06 | |
Net realized and unrealized gain (loss) on investments | | | 2.93 | | | | 1.05 | | | | 0.78 | | | | 2.73 | | | | 2.53 | | | | (6.29 | ) |
| | | | | | | | | | | | | | | | | | | | | | | | |
Total from investment operations | | | 2.84 | | | | 0.93 | | | | 0.69 | | | | 2.61 | | | | 2.45 | | | | (6.23 | ) |
| | | | | | | | | | | | | | | | | | | | | | | | |
Less dividends and distributions: | | | | | | | | | | | | | | | | | | | | | | | | |
From net investment income | | | (0.02 | ) | | | — | | | | (0.00 | )‡ | | | — | | | | (0.14 | ) | | | — | |
From net realized gain on investments | | | — | | | | — | | | | — | | | | — | | | | — | | | | (2.01 | ) |
| | | | | | | | | | | | | | | | | | | | | | | | |
Total dividends and distributions | | | (0.02 | ) | | | — | | | | (0.00 | )‡ | | | — | | | | (0.14 | ) | | | (2.01 | ) |
| | | | | | | | | | | | | | | | | | | | | | | | |
Net asset value at end of period | | $ | 19.06 | | | $ | 16.24 | | | $ | 15.31 | | | $ | 14.62 | | | $ | 12.01 | | | $ | 9.70 | |
| | | | | | | | | | | | | | | | | | | | | | | | |
Total investment return (b) | | | 17.36 | %(c)(d) | | | 6.07 | % | | | 4.74 | % | | | 21.73 | % | | | 26.00 | % | | | (38.60 | %) |
Ratios (to average net assets)/Supplemental Data: | | | | | | | | | | | | | | | | | | | | | | | | |
Net investment income (loss) | | | (1.03 | %)†† | | | (0.74 | %) | | | (0.57 | %) | | | (0.91 | %) | | | (0.83 | %) | | | 0.45 | % |
Net expenses | | | 2.40 | % †† | | | 2.43 | % | | | 2.38 | % | | | 2.38 | % | | | 2.39 | % | | | 2.45 | % |
Expenses (before waiver/reimbursement) | | | 2.40 | % †† | | | 2.43 | % | | | 2.41 | % | | | 2.56 | % | | | 2.81 | % | | | 2.67 | % |
Portfolio turnover rate | | | 23 | % | | | 32 | % | | | 45 | % | | | 49 | % | | | 218 | % | | | 158 | % |
Net assets at end of period (in 000’s) | | $ | 18,373 | | | $ | 16,036 | | | $ | 17,589 | | | $ | 19,944 | | | $ | 17,048 | | | $ | 15,123 | |
| ‡ | Less than one cent per share. |
| (a) | Per share data based on average shares outstanding during the period. |
| (b) | Total investment return is calculated exclusive of sales charges and assumes the reinvestment of dividends and distributions. |
| (c) | Total investment return is not annualized. |
| (d) | Total investment return may reflect adjustments to conform to generally accepted accounting principles. |
| | | | |
| 18 | | MainStay U.S. Small Cap Fund | | The notes to the financial statements are an integral part of,
and should be read in conjunction with, the financial statements. |
Financial Highlights selected per share data and ratios
| | | | | | | | | | | | | | | | | | | | | | | | |
| | | Class I | |
| | | Six months
ended
April 30, | | | Year ended October 31, | |
| | | 2013* | | | 2012 | | | 2011 | | | 2010 | | | 2009 | | | 2008 | |
Net asset value at beginning of period | | $ | 17.76 | | | $ | 16.53 | | | $ | 15.67 | | | $ | 12.72 | | | $ | 10.34 | | | $ | 19.03 | |
| | | | | | | | | | | | | | | | | | | | | | | | |
Net investment income (loss) (a) | | | 0.02 | | | | 0.10 | | | | 0.10 | | | | 0.04 | | | | 0.04 | | | | 0.24 | |
Net realized and unrealized gain (loss) on investments | | | 3.22 | | | | 1.13 | | | | 0.86 | | | | 2.91 | | | | 2.65 | | | | (6.69 | ) |
| | | | | | | | | | | | | | | | | | | | | | | | |
Total from investment operations | | | 3.24 | | | | 1.23 | | | | 0.96 | | | | 2.95 | | | | 2.69 | | | | (6.45 | ) |
| | | | | | | | | | | | | | | | | | | | | | | | |
Less dividends and distributions: | | | | | | | | | | | | | | | | | | | | | | | | |
From net investment income | | | (0.10 | ) | | | — | | | | (0.10 | ) | | | — | | | | (0.31 | ) | | | (0.23 | ) |
From net realized gain on investments | | | — | | | | — | | | | — | | | | — | | | | — | | | | (2.01 | ) |
| | | | | | | | | | | | | | | | | | | | | | | | |
Total dividends and distributions | | | (0.10 | ) | | | — | | | | (0.10 | ) | | | — | | | | (0.31 | ) | | | (2.24 | ) |
| | | | | | | | | | | | | | | | | | | | | | | | |
Net asset value at end of period | | $ | 20.90 | | | $ | 17.76 | | | $ | 16.53 | | | $ | 15.67 | | | $ | 12.72 | | | $ | 10.34 | |
| | | | | | | | | | | | | | | | | | | | | | | | |
Total investment return (b) | | | 18.31 | %(c) | | | 7.44 | % | | | 6.11 | % | | | 23.19 | % | | | 27.57 | % | | | (37.81 | %) |
Ratios (to average net assets)/Supplemental Data: | | | | | | | | | | | | | | | | | | | | | | | | |
Net investment income (loss) | | | 0.26 | % †† | | | 0.57 | % | | | 0.60 | % | | | 0.30 | % | | | 0.39 | % | | | 1.69 | % |
Net expenses | | | 1.10 | % †† | | | 1.13 | % | | | 1.10 | % | | | 1.17 | % | | | 1.18 | % | | | 1.20 | % |
Expenses (before waiver/reimbursement) | | | 1.10 | % †† | | | 1.13 | % | | | 1.10 | % | | | 1.23 | % | | | 1.68 | % | | | 1.48 | % |
Portfolio turnover rate | | | 23 | % | | | 32 | % | | | 45 | % | | | 49 | % | | | 218 | % | | | 158 | % |
Net assets at end of period (in 000’s) | | $ | 214,133 | | | $ | 167,135 | | | $ | 173,456 | | | $ | 152,227 | | | $ | 155,425 | | | $ | 116,390 | |
| (a) | Per share data based on average shares outstanding during the period. |
| (b) | Total investment return is calculated exclusive of sales charges and assumes the reinvestment of dividends and distributions. Class I shares are not subject to sales charges. |
| (c) | Total investment return is not annualized. |
| | | | | | | | |
| | | Class R1 | |
| | | Six months
ended
April 30, | | | July 31,
2012**
through
October 31, | |
| | | 2013* | | | 2012 | |
Net asset value at beginning of period | | $ | 17.76 | | | $ | 17.05 | |
| | | | | | | | |
Net investment income (loss) (a) | | | 0.02 | | | | (0.00 | )‡ |
Net realized and unrealized gain (loss) on investments | | | 3.20 | | | | 0.71 | |
| | | | | | | | |
Total from investment operations | | | 3.22 | | | | 0.71 | |
| | | | | | | | |
Less dividends: | | | | | | | | |
From net investment income | | | (0.09 | ) | | | — | |
| | | | | | | | |
Net asset value at end of period | | $ | 20.89 | | | $ | 17.76 | |
| | | | | | | | |
Total investment return (b) | | | 18.21 | %(c) | | | 4.16 | %(c)(d) |
Ratios (to average net assets)/Supplemental Data: | | | | | | | | |
Net investment income (loss) | | | 0.18 | %†† | | | (0.03 | %)†† |
Net expenses | | | 1.20 | %†† | | | 1.26 | % †† |
Portfolio turnover rate | | | 23 | % | | | 32 | % |
Net assets at end of period (in 000’s) | | $ | 31 | | | $ | 26 | |
| ** | Commencement of operations. |
| ‡ | Less than one cent per share. |
| (a) | Per share data based on average shares outstanding during the period. |
| (b) | Total investment return is calculated exclusive of sales charges and assumes the reinvestment of dividends and distributions. Class R1 shares are not subject to sales charges. |
| (c) | Total investment return is not annualized. |
| (d) | Total investment return may reflect adjustments to conform to generally accepted accounting principles. |
| | | | | | |
The notes to the financial statements are an integral part of,
and should be read in conjunction with, the financial statements. | | mainstayinvestments.com | | | 19 | |
Financial Highlights selected per share data and ratios
| | | | | | | | |
| | | Class R2 | |
| | | Six months
ended
April 30, | | | July 31,
2012**
through
October 31,
| |
| | | 2013* | | | 2012* | |
Net asset value at beginning of period | | $ | 17.37 | | | $ | 16.69 | |
| | | | | | | | |
Net investment income (loss) (a) | | | (0.01 | ) | | | (0.01 | ) |
Net realized and unrealized gain (loss) on investments | | | 3.15 | | | | 0.69 | |
| | | | | | | | |
Total from investment operations | | | 3.14 | | | | 0.68 | |
| | | | | | | | |
Less dividends: | | | | | | | | |
From net investment income | | | (0.05 | ) | | | — | |
| | | | | | | | |
Net asset value at end of period | | $ | 20.46 | | | $ | 17.37 | |
| | | | | | | | |
Total investment return (b) | | | 18.09 | %(c) | | | 4.07 | %(c)(d) |
Ratios (to average net assets)/Supplemental Data: | | | | | | | | |
Net investment income (loss) | | | (0.07 | %)†† | | | (0.27 | %)†† |
Net expenses | | | 1.45 | % †† | | | 1.51 | % †† |
Portfolio turnover rate | | | 23 | % | | | 32 | % |
Net assets at end of period (in 000’s) | | $ | 31 | | | $ | 26 | |
| ** | Commencement of operations. |
| (a) | Per share data based on average shares outstanding during the period. |
| (b) | Total investment return is calculated exclusive of sales charges and assumes the reinvestment of dividends and distributions. Class R2 shares are not subject to sales charges. |
| (c) | Total investment return is not annualized. |
| (d) | Total investment return may reflect adjustments to conform to generally accepted accounting principles. |
| | | | |
| 20 | | MainStay U.S. Small Cap Fund | | The notes to the financial statements are an integral part of,
and should be read in conjunction with, the financial statements. |
Notes to Financial Statements (Unaudited)
Note 1–Organization and Business
MainStay Funds Trust (the “Trust”) was organized as a Delaware statutory trust on April 28, 2009, and is governed by a Declaration of Trust. The Trust is registered under the Investment Company Act of 1940, as amended (the “1940 Act”), as an open-end investment management company, and is comprised of thirty-three funds (collectively referred to as the “Funds”). These financial statements and notes relate only to the MainStay U.S. Small Cap Fund (the “Fund”), a diversified fund. The Fund is the successor of the MainStay U.S. Small Cap Fund, a series of Eclipse Funds (the “Predecessor Fund”). The reorganization of the Predecessor Fund with and into the Fund occurred on May 25, 2012. All information and references to periods prior to May 25, 2012 relate to the Predecessor Fund.
The Fund currently offers seven classes of shares. Class I shares commenced operations on January 12, 1987. Class A and Class B shares commenced operations on January 2, 2004. Class C shares commenced operations on December 30, 2002. Investor Class shares commenced operations on February 28, 2008. Class R1 and R2 shares commenced operations on July 31, 2012. Investor Class and Class A shares are offered at net asset value (“NAV”) per share plus an initial sales charge. No sales charge applies to investments of $1 million or more (and certain other qualified purchases) in Investor Class and Class A shares, but a contingent deferred sales charge (“CDSC”) is imposed on certain redemptions of such shares made within one year of the date of purchase. Class B and Class C shares are offered at NAV without an initial sales charge, although a declining CDSC may be imposed on redemptions made within six years of the date of purchase of Class B shares and a 1.00% CDSC may be imposed on redemptions made within one year of the date of purchase of Class C shares. Class I, Class R1 and Class R2 shares are offered at NAV and are not subject to a sales charge. Depending upon eligibility, Class B shares convert to either Investor Class or Class A eight years after the date they were purchased. Additionally, depending upon eligibility, Investor Class shares may convert to Class A shares and Class A shares may convert to Investor Class shares. The seven classes of shares have the same voting (except for issues that relate solely to one class), dividend, liquidation and other rights, and the same terms and conditions, except that Class B and Class C shares are subject to higher distribution and/or service fee rates than Investor Class, Class A and Class R2 shares under a distribution plan pursuant to Rule 12b-1 under the 1940 Act. Class I and Class R1 shares are not subject to a distribution and/or service fee. Class R1 and Class R2 shares are subject to a shareholder service fee. This is in addition to any fees paid under a distribution plan, where applicable.
The Fund’s investment objective is to seek long-term capital appreciation by investing primarily in securities of small-cap companies.
Note 2–Significant Accounting Policies
The Fund prepares its financial statements in accordance with generally accepted accounting principles (“GAAP”) in the United States of America and follows the significant accounting policies described below.
(A) Securities Valuation. Investments are valued as of the close of regular trading on the New York Stock Exchange (“Exchange”) (generally 4:00 p.m. Eastern time) on each day the Fund is open for business (“valuation date”).
The Board of Trustees (the “Board”) has adopted procedures for the valuation of the Fund’s securities and has delegated the responsibility for valuation determination under those procedures to the Valuation Committee of the Fund (the “Valuation Committee”). The Board has authorized the Valuation Committee to appoint a Valuation Sub-Committee (the “Sub-Committee”) to deal in the first instance with questions that arise or cannot be resolved under these procedures. The Sub-Committee meets (in person, via electronic mail or via teleconference) on an as-needed basis. The Valuation Committee meets at a later time, as necessary, to ensure that actions taken by the Sub-Committee were appropriate. The procedures recognize that, subject to the oversight of the Board and unless otherwise noted, the responsibility for day-to-day valuation of portfolio assets (including securities for which market prices are not readily available) rests with New York Life Investment Management LLC ( “New York Life Investments” or the “Manager”), aided to whatever extent necessary by the Subadvisor (as defined in Note 3(A)) of the Fund.
To assess the appropriateness of security valuations, the Manager or the Fund’s third party service provider who is subject to oversight by the Manager, regularly compares prior day prices, prices on comparable securities and the sale prices to the prior and current day prices and challenges prices exceeding certain tolerance levels with third party pricing services or broker sources. For those securities valued by recommendation, whether through a standardized fair valuation methodology or a fair valuation determination, the Valuation Committee reviews and affirms the reasonableness of the valuation based on such methodologies and determinations on a regular basis after considering all relevant information that is reasonably available.
“Fair value” is defined as the price that the Fund would receive upon selling an investment in an orderly transaction to an independent buyer in the principal or most advantageous market of the investment. Fair value measurements are determined within a framework that has established a three-tier hierarchy which maximizes the use of observable market data and minimizes the use of unobservable inputs to establish classification of fair value measurements for disclosure purposes. “Inputs” refers broadly to the assumptions that market participants would use in pricing the asset or liability, including assumptions about risk, such as the risk inherent in a particular valuation technique used to measure fair value using a pricing model and/or the risk inherent in the inputs for the valuation technique. Inputs may be observable or unobservable. Observable inputs reflect the assumptions market participants would use in pricing the asset or liability based on market data obtained from sources independent of the Fund. Unobservable inputs reflect the Fund’s own assumptions about the assumptions market participants would use in pricing the asset or liability developed based on the information available in the circumstances. The inputs or methodology used for valuing securities may not be an indication of the risks associated with investing in those securities. The three-tier hierarchy of inputs is summarized in the three broad Levels listed below.
| • | | Level 1—quoted prices in active markets for identical investments |
| • | | Level 2—other significant observable inputs (including quoted prices for similar investments in active markets, interest rates and yield curves, prepayment speeds, credit risks, etc.) |
| | | | |
| mainstayinvestments.com | | | 21 | |
Notes to Financial Statements (Unaudited) (continued)
| • | | Level 3—significant unobservable inputs (including the Fund’s own assumptions about the assumptions that market participants would use in determining the fair value of investments) |
The aggregate value by input level, as of April 30, 2013, for the Fund’s investments is included at the end of the Fund’s Portfolio of Investments.
The valuation techniques used by the Fund to measure fair value maximize the use of observable inputs and minimize the use of unobservable inputs. The Fund may utilize third party vendor evaluations, whose prices may be derived from one or more of the following standard inputs:
| | |
• Benchmark Yields | | • Reported Trades |
• Broker Dealer Quotes | | • Issuer Spreads |
• Two-sided markets | | • Benchmark securities |
• Bids/Offers | | • Reference Data (corporate actions or material event notices) |
• Industry and economic events | | • Comparable bonds |
• Equity and credit default swap curves | | • Monthly payment information |
Securities for which market values cannot be determined using the methodologies described above are valued by methods deemed in good faith by the Fund’s Valuation Committee, following the procedures established by the Board, to represent fair value. Under these procedures, the Fund primarily employs a market-based approach which may use related or comparable assets or liabilities, recent transactions, market multiples, book values, and other relevant information. The Fund may also use an income-based valuation approach in which the anticipated future cash flows of the investment are discounted to calculate fair value. Discounts may also be applied due to the nature or duration of any restrictions on the disposition of the investments. Due to the inherent uncertainty of valuations of such investments, the fair values may differ significantly from the values that would have been used had an active market existed. For the six-month period ended April 30, 2013, there have been no changes to the fair value methodologies.
Equity and non-equity securities which may be valued in this manner include, but are not limited to: (i) a security for which the trading has been halted or suspended; (ii) a debt security that has recently gone into default and for which there is not a current market quotation; (iii) a security of an issuer that has entered into a restructuring; (iv) a security that has been de-listed from a national exchange; (v) a security for which the market price is not available from a third party pricing source or, if so provided, does not, in the opinion of the Fund’s Manager or Subadvisor reflect the security’s market value; and (vi) a security whose principal market has been temporarily closed at a time when, under normal conditions, it would be open. Securities for which market quotations or observable inputs are not readily available are generally categorized as Level 3 in the hierarchy. As of April 30, 2013, the Fund did not hold any securities that were fair valued in such a manner.
Certain events may occur between the time that foreign markets close, on which securities held by the Fund principally trade, and the time at which the Fund’s NAV is calculated. These events may include, but are not limited to, situations relating to a single issuer in a market sector, significant fluctuations in U.S. or foreign markets, natural disasters,
armed conflicts, governmental actions or other developments not tied directly to the securities markets. Should the Manager or Subadvisor conclude that such events may have affected the accuracy of the last price of such securities reported on the local foreign market, the Manager or Subadvisor may, pursuant to procedures adopted by the Board, adjust the value of the local price to reflect the estimated impact on the price of such securities as a result of such events. In this instance, securities are generally categorized as Level 3 in the hierarchy. Additionally, foreign equity securities are also fair valued whenever the movement of a particular index exceeds certain thresholds. In such cases, the securities are fair valued by applying factors provided by a third party vendor in accordance with the Fund’s policies and procedures and are generally categorized as Level 2 in the hierarchy. As of April 30, 2013, the Fund did not hold any foreign equity securities.
Equity securities and Exchange Traded Funds are valued at the latest quoted sales prices as of the close of regular trading on the Exchange on each valuation date. Securities that are not traded on the valuation date are valued at the mean of the latest quoted bid and ask prices. Prices normally are taken from the principal market in which each security trades. Futures contracts are valued at the last posted settlement price on the market where such futures are primarily traded. Investments in other mutual funds are valued at their respective NAVs as of the close of the Exchange on the valuation date. These securities are generally categorized as Level 1 in the hierarchy.
Temporary cash investments acquired over 60 days to maturity are valued using the latest bid prices or using valuations based on a matrix system (which considers such factors as security prices, yields, maturities, and ratings), both as furnished by independent pricing services. Other temporary cash investments which mature in 60 days or less (“Short-Term Investments”) are valued at amortized cost. The amortized cost method involves valuing a security at its cost on the date of purchase and thereafter assuming a constant amortization to maturity of the difference between such cost and the value on maturity date. Amortized cost approximates the current fair value of a security. Securities valued at amortized cost are not valued using a quoted price in an active market. These securities are generally categorized as Level 2 in the hierarchy.
(B) Income Taxes. The Fund’s policy is to comply with the requirements of the Internal Revenue Code of 1986, as amended (the “Internal Revenue Code”), applicable to regulated investment companies and to distribute all of the taxable income to the shareholders of the Fund within the allowable time limits. Therefore, no federal, state and local income tax provision is required.
Management evaluates its tax positions to determine if the tax positions taken meet the minimum recognition threshold in connection with accounting for uncertainties in income tax positions taken or expected to be taken for the purposes of measuring and recognizing tax liabilities in the financial statements. Recognition of tax benefits of an uncertain tax position is required only when the position is “more likely than not” to be sustained assuming examination by taxing authorities. Management has analyzed the Fund’s tax positions taken on federal, state and local income tax returns for all open tax years (for up to three tax years), and has concluded that no provision for federal, state and local income tax is required in the Fund’s financial statements. The Fund’s federal, state and local income and federal excise tax returns for tax years for which
| | |
| 22 | | MainStay U.S. Small Cap Fund |
the applicable statutes of limitations have not expired are subject to examination by the Internal Revenue Service and state and local departments of revenue.
(C) Dividends and Distributions to Shareholders. Dividends and distributions are recorded on the ex-dividend date. The Fund intends to declare and pay dividends of net investment income and distributions of net realized capital and currency gains, if any, at least annually. Unless the shareholder elects otherwise, all dividends and distributions are reinvested in the same class of shares of the Fund, at NAV. Dividends and distributions to shareholders are determined in accordance with federal income tax regulations and may differ from GAAP.
(D) Security Transactions and Investment Income. The Fund records security transactions on the trade date. Realized gains and losses on security transactions are determined using the identified cost method. Dividend income is recognized on the ex-dividend date and interest income is accrued as earned using the effective interest rate method. Discounts and premiums on Short-Term Investments are accreted and amortized, respectively, on the straight-line method.
Investment income and realized and unrealized gains and losses on investments of the Fund are allocated to separate classes of shares pro rata based upon their relative net assets on the date the income is earned or realized and unrealized gains and losses are incurred.
(E) Expenses. Expenses of the Trust are allocated to the individual Funds in proportion to the net assets of the respective Funds when the expenses are incurred, except where direct allocations of expenses can be made. Expenses (other than transfer agent expenses and fees incurred under the shareholder services plans and the distribution plans further discussed in Note 3(B)) are allocated to separate classes of shares pro rata based upon their relative net assets on the date the expenses are incurred. The expenses borne by the Fund, including those of related parties to the Fund, are shown in the Statement of Operations.
(F) Use of Estimates. In preparing financial statements in conformity with GAAP, management makes estimates and assumptions that affect the reported amounts and disclosures in the financial statements. Actual results could differ from those estimates.
(G) Repurchase Agreements. The Fund may enter into repurchase agreements to earn income. The Fund may enter into repurchase agreements only with financial institutions that are deemed by the Manager or Subadvisor to be creditworthy, pursuant to guidelines established by the Fund’s Board. During the term of any repurchase agreement, the Manager or Subadvisor will continue to monitor the creditworthiness of the seller. Under the 1940 Act, repurchase agreements are considered to be collateralized loans by a Fund to the seller secured by the securities transferred to the Fund.
When the Fund invests in repurchase agreements, the Fund’s custodian takes possession of the collateral pledged for investments in the repurchase agreement. The underlying collateral is valued daily on a mark-to-market basis to determine that the value, including accrued interest, exceeds the repurchase price. In the event of the seller’s default on the obligation to repurchase, the Fund has the right to liquidate the collateral and apply the proceeds in satisfaction of the obligation. Under certain circumstances, such as in the event of default or
bankruptcy by the counterparty to the agreement, realization and/or retention of the collateral may be subject to legal proceedings and possible realized loss to the Fund.
(H) Securities Lending. In order to realize additional income, the Fund may engage in securities lending, subject to the limitations set forth in the 1940 Act and relevant guidance by the staff of the Securities and Exchange Commission. In the event the Fund does engage in securities lending, the Fund will lend through its custodian, State Street Bank and Trust Company (“State Street”). State Street will manage the Fund’s cash collateral in accordance with the lending agreement between the Fund and State Street, and indemnify the Fund’s portfolio against counterparty risk. The loans will be collateralized by cash or securities at least equal at all times to the market value of the securities loaned. Collateral will consist of U.S. Government securities, cash equivalents or irrevocable letters of credit. The Fund may bear the risk of delay in recovery of, or loss of rights in, the securities loaned should the borrower of the securities experience financial difficulty. The Fund may also record realized gain or loss on securities deemed sold due to a borrower’s inability to return securities on loan. The Fund will receive compensation for lending its securities in the form of fees or the retention of a portion of the interest on the investment of any cash received as collateral. The Fund also will continue to receive interest and dividends on the securities loaned and any gain or loss in the market price of the securities loaned that may occur during the term of the loan will be for the account of the Fund.
Although the Fund and New York Life Investments have temporarily suspended securities lending, the Fund and New York Life Investments reserve the right to reinstitute lending when deemed appropriate. The Fund did not have any portfolio securities on loan as of April 30, 2013.
(I) Indemnifications. Under the Trust’s organizational documents, its officers and trustees are indemnified against certain liabilities that may arise out of performance of their duties to the Trust. Additionally, in the normal course of business, the Fund enters into contracts with third-party service providers that contain a variety of representations and warranties and which may provide general indemnifications. The Fund’s maximum exposure under these arrangements is unknown, as this would involve future claims that may be made against the Fund that have not yet occurred. Based on experience, management is of the view that the risk of loss in connection with these potential indemnification obligations is remote. However, there can be no assurance that material liabilities related to such obligations will not arise in the future, which could adversely impact the Fund.
Note 3–Fees and Related Party Transactions
(A) Manager and Subadvisor. New York Life Investments, a registered investment adviser and an indirect, wholly-owned subsidiary of New York Life Insurance Company (“New York Life”), serves as the Fund’s Manager, pursuant to an Amended and Restated Management Agreement (“Management Agreement”). The Manager provides offices, conducts clerical, recordkeeping and bookkeeping services, and keeps most of the financial and accounting records required to be maintained by the Fund. Except for the portion of salaries and expenses that are the responsibility of the Fund, the Manager pays the salaries and expenses of all personnel affiliated with the Fund and certain operational expenses of the Fund. The Fund reimburses New York Life Investments in an
| | | | |
| mainstayinvestments.com | | | 23 | |
Notes to Financial Statements (Unaudited) (continued)
amount equal to a portion of the salary of the Chief Compliance Officer (“CCO”) of the Fund. Epoch Investment Partners, Inc. (“Epoch” or “Subadvisor”), a registered investment adviser, is responsible for the day-to-day portfolio management of the Fund. Pursuant to the terms of an Amended and Restated Subadvisory Agreement (“Subadvisory Agreement”) between New York Life Investments and Epoch, New York Life Investments pays for the services of the Subadvisor.
The Fund pays the Manager a monthly fee for services performed and facilities furnished at an annual rate of the Fund’s average daily net assets as follows: 0.85% up to $1 billion and 0.80% in excess of $1 billion. The effective management fee rate (exclusive of any applicable waivers/reimbursements) was 0.85% for the six-month period ended April 30, 2013.
Prior to February 28, 2013, New York Life Investments had contractually agreed to waive fees and/or reimburse expenses so that Total Annual Fund Operating Expenses of Class A shares would not exceed 1.53% of its average daily net assets. New York Life Investments applied an equivalent waiver or reimbursement in an equal number of basis points to the other share classes.
Prior to February 28, 2013, New York Life Investments had agreed to voluntarily waive fees and/or reimburse expenses so that Total Annual Fund Operating Expenses do not exceed the following percentage of average daily net assets: Investor Class, 1.70%; Class B, 2.45%; and Class C, 2.45%. These voluntary waivers or reimbursements were discontinued on February 28, 2013. For the six-month period ended April 30, 2013, New York Life Investments earned fees from the Fund in the amount of $1,678,681.
State Street, 1 Lincoln Street, Boston, Massachusetts 02111, provides sub-administration and sub-accounting services to the Fund pursuant to an agreement with New York Life Investments. These services include calculating the daily NAVs of the Fund, maintaining the general ledger and sub-ledger accounts for the calculation of the Fund’s respective NAVs, and assisting New York Life Investments in conducting various aspects of the Fund’s administrative operations. For providing these services to the Fund, State Street is compensated by New York Life Investments.
(B) Distribution, Service and Shareholder Service Fees. The Trust, on behalf of the Fund, has entered into a distribution agreement with NYLIFE Distributors LLC (the ‘‘Distributor’’), an indirect, wholly-owned subsidiary of New York Life. The Fund has adopted distribution plans (the ‘‘Plans’’) in accordance with the provisions of Rule 12b-1 under the 1940 Act.
Pursuant to the Investor Class, Class A and Class R2 Plans, the Distributor receives a monthly distribution fee from the Investor Class, Class A and Class R2 shares at an annual rate of 0.25% of the average daily net assets of the Investor Class, Class A and Class R2 shares for distribution and/or service activities as designated by the Distributor. Pursuant to the Class B and Class C Plans, Class B and Class C shares pay the Distributor a monthly distribution fee at an annual rate of 0.75% of the average daily net assets of the Class B and Class C shares, along with a service fee at an annual rate of 0.25% of the average daily net assets of the Class B and Class C shares, for a total 12b-1 fee of 1.00%. Class I shares are not subject to a distribution and/or service fee.
In accordance with the Shareholder Services Plans for the Class R1 and Class R2 shares, the Manager has agreed to provide, through its affiliates or independent third parties, various shareholder and administrative support services to shareholders of the Class R1 and Class R2 shares. For its services, the Manager is entitled to a shareholder service fee accrued daily and paid monthly at an annual rate of 0.10% of the average daily net assets of the Class R1 and Class R2 shares. This is in addition to any fees paid under a distribution plan, where applicable.
Shareholder service fees incurred by the Fund for the six-month period ended April 30, 2013, were as follows:
(C) Sales Charges. The Fund was advised by the Distributor that the amount of sales charges retained on sales of Investor Class and Class A shares were $13,053 and $9,810, respectively, for the six-month period ended April 30, 2013.
The Fund was also advised that the Distributor retained CDSCs on redemptions of Investor Class, Class A, Class B and Class C shares of $51, $917, $18,370 and $476, respectively, for the six-month period ended April 30, 2013.
(D) Transfer, Dividend Disbursing and Shareholder Servicing Agent. NYLIM Service Company LLC, an affiliate of New York Life Investments, is the Fund’s transfer, dividend disbursing and shareholder servicing agent pursuant to an agreement between NYLIM Service Company LLC and the Trust. NYLIM Service Company LLC has entered into an agreement with Boston Financial Data Services, Inc. (“BFDS”) pursuant to which BFDS performs certain transfer agent services on behalf of NYLIM Service Company LLC. Transfer agent expenses incurred by the Fund for the six-month period ended April 30, 2013, were as follows:
| | | | |
Investor Class | | $ | 164,379 | |
Class A | | | 69,362 | |
Class B | | | 68,492 | |
Class C | | | 38,552 | |
Class I | | | 143,129 | |
Class R1 | | | 22 | |
Class R2 | | | 22 | |
(E) Small Account Fee. Shareholders with small accounts adversely impact the cost of providing transfer agency services. In an effort to reduce total transfer agency expenses, the Fund has implemented a small account fee on certain types of accounts. Certain shareholders with an account balance of less than $1,000 are charged an annual per account fee of $20 (assessed semi-annually), the proceeds from which offset transfer agent fees as reflected in the Statement of Operations.
| | |
| 24 | | MainStay U.S. Small Cap Fund |
(F) Capital. As of April 30, 2013, New York Life and its affiliates beneficially held shares of the Fund with values and percentages of net assets as follows:
| | | | | | | | |
Class A | | $ | 4,357 | | | | 0.0 | %‡ |
Class I | | | 58,914,759 | | | | 27.5 | |
Class R1 | | | 30,783 | | | | 100.0 | |
Class R2 | | | 30,725 | | | | 100.0 | |
| ‡ | Less than one-tenth of a percent. |
Note 4–Federal Income Tax
Under the Regulated Investment Company Modernization Act of 2010, the Fund is permitted to carry forward capital losses incurred in taxable years beginning after December 22, 2010, for an unlimited period. However, any losses incurred during those future years will be required to be utilized prior to the losses incurred in pre-enactment tax years. As a result of this ordering rule, pre-enactment capital loss carryforwards may be more likely to expire unused. Additionally, post-enactment capital losses that are carried forward will retain their character as either short-term or long-term capital losses rather than being considered all short-term as under previous law.
As of October 31, 2012, for federal income tax purposes, capital loss carryforwards of $224,198,543 were available as shown in the table below, to the extent provided by the regulations to offset future realized gains of the Fund through the years indicated. To the extent that these capital loss carryforwards are used to offset future capital gains, it is probable that the capital gains so offset will not be distributed to shareholders. No capital gain distributions shall be made until any capital loss carryforwards have been fully utilized or expired.
| | | | | | | | |
Capital Loss
Available Through | | Short-Term
Capital Loss
Amounts
(000’s) | | | Long-Term
Capital Loss
Amounts
(000’s) | |
| 2015 | | $ | 24,635 | | | $ | — | |
| 2016 | | | 151,911 | | | | — | |
| 2017 | | | 47,653 | | | | — | |
| Total | | $ | 224,199 | | | $ | — | |
Note 5–Custodian
State Street is the custodian of the cash and the securities of the Fund. Custodial fees are charged to the Fund based on the market value of securities in the Fund and the number of certain cash transactions incurred by the Fund.
Note 6–Line of Credit
The Fund and certain affiliated funds maintain a line of credit with a syndicate of banks in order to secure a source of funds for temporary purposes to meet unanticipated or excessive redemption requests.
Effective August 29, 2012, under a second amended and restated credit agreement (the “Credit Agreement”), the aggregate commitment amount is $200,000,000 with an optional maximum amount of $250,000,000. The commitment fee is an annual rate of 0.08% of the
average commitment amount payable quarterly, regardless of usage, to Bank of New York Mellon, which serves as the agent to the syndicate. The commitment fee is allocated among the Fund and certain affiliated funds based upon net assets and other factors. Interest on any revolving credit loan is charged based upon the Federal Funds Advances rate or the one month London InterBank Offered Rate, whichever is higher. The Credit Agreement expires on August 28, 2013, although the Fund, certain affiliated funds and the syndicate of banks may renew the Credit Agreement for an additional year on the same or different terms. There were no borrowings made or outstanding with respect to the Fund on the Credit Agreement during the six-month period ended April 30, 2013.
Note 7–Purchases and Sales of Securities (in 000’s)
During the six-month period ended April 30, 2013, purchases and sales of securities, other than short-term securities, were $106,017 and $91,305, respectively.
Note 8–Capital Share Transactions
| | | | | | | | |
Investor Class | | Shares | | | Amount | |
Six-month period ended April 30, 2013: | | | | | | | | |
Shares sold | | | 143,933 | | | $ | 2,731,195 | |
Shares issued to shareholders in reinvestment of dividends | | | 3,748 | | | | 66,634 | |
Shares redeemed | | | (297,348 | ) | | | (5,599,028 | ) |
| | | | | | | | |
Net increase (decrease) in shares outstanding before conversion | | | (149,667 | ) | | | (2,801,199 | ) |
Shares converted into Investor Class (See Note 1) | | | 138,671 | | | | 2,659,409 | |
Shares converted from Investor Class (See Note 1) | | | (140,434 | ) | | | (2,806,965 | ) |
| | | | | | | | |
Net increase (decrease) | | | (151,430 | ) | | $ | (2,948,755 | ) |
| | | | | | | | |
Year ended October 31, 2012: | | | | | | | | |
Shares sold | | | 236,258 | | | $ | 4,030,183 | |
Shares redeemed | | | (610,414 | ) | | | (10,389,255 | ) |
| | | | | | | | |
Net increase (decrease) in shares outstanding before conversion | | | (374,156 | ) | | | (6,359,072 | ) |
Shares converted into Investor Class (See Note 1) | | | 317,686 | | | | 5,373,308 | |
Shares converted from Investor Class (See Note 1) | | | (233,861 | ) | | | (4,033,403 | ) |
| | | | | | | | |
Net increase (decrease) | | | (290,331 | ) | | $ | (5,019,167 | ) |
| | | | | | | | |
| | |
| | | | | | | | |
| | | | |
| mainstayinvestments.com | | | 25 | |
Notes to Financial Statements (Unaudited) (continued)
| | | | | | | | |
Class A | | Shares | | | Amount | |
Six-month period ended April 30, 2013: | | | | | | | | |
Shares sold | | | 672,506 | | | $ | 13,280,683 | |
Shares issued to shareholders in reinvestment of dividends | | | 12,300 | | | | 220,886 | |
Shares redeemed | | | (497,969 | ) | | | (9,282,074 | ) |
| | | | | | | | |
Net increase (decrease) in shares outstanding before conversion | | | 186,837 | | | | 4,219,495 | |
Shares converted into Class A (See Note 1) | | | 175,866 | | | | 3,506,454 | |
Shares converted from Class A (See Note 1) | | | (6,883 | ) | | | (140,008 | ) |
| | | | | | | | |
Net increase (decrease) | | | 355,820 | | | $ | 7,585,941 | |
| | | | | | | | |
Year ended October 31, 2012: | | | | | | | | |
Shares sold | | | 492,723 | | | $ | 8,481,481 | |
Shares redeemed | | | (1,526,037 | ) | | | (26,090,081 | ) |
| | | | | | | | |
Net increase (decrease) in shares outstanding before conversion | | | (1,033,314 | ) | | | (17,608,600 | ) |
Shares converted into Class A (See Note 1) | | | 332,731 | | | | 5,750,793 | |
Shares converted from Class A (See Note 1) | | | (17,556 | ) | | | (313,094 | ) |
| | | | | | | | |
Net increase (decrease) | | | (718,139 | ) | | $ | (12,170,901 | ) |
| | | | | | | | |
| | |
| | | | | | | | |
Class B | | Shares | | | Amount | |
Six-month period ended April 30, 2013: | | | | | | | | |
Shares sold | | | 83,448 | | | $ | 1,471,891 | |
Shares issued to shareholders in reinvestment of dividends | | | 1,699 | | | | 28,357 | |
Shares redeemed | | | (165,301 | ) | | | (2,932,257 | ) |
| | | | | | | | |
Net increase (decrease) in shares outstanding before conversion | | | (80,154 | ) | | | (1,432,009 | ) |
Shares converted from Class B (See Note 1) | | | (179,064 | ) | | | (3,218,890 | ) |
| | | | | | | | |
Net increase (decrease) | | | (259,218 | ) | | $ | (4,650,899 | ) |
| | | | | | | | |
Year ended October 31, 2012: | | | | | | | | |
Shares sold | | | 203,343 | | | $ | 3,270,423 | |
Shares redeemed | | | (378,815 | ) | | | (6,092,161 | ) |
| | | | | | | | |
Net increase (decrease) in shares outstanding before conversion | | | (175,472 | ) | | | (2,821,738 | ) |
Shares converted from Class B (See Note 1) | | | (423,977 | ) | | | (6,777,604 | ) |
| | | | | | | | |
Net increase (decrease) | | | (599,449 | ) | | $ | (9,599,342 | ) |
| | | | | | | | |
| | |
| | | | | | | | |
Class C | | Shares | | | Amount | |
Six-month period ended April 30, 2013: | | | | | | | | |
Shares sold | | | 75,757 | | | $ | 1,363,103 | |
Shares issued to shareholders in reinvestment of dividends | | | 798 | | | | 13,318 | |
Shares redeemed | | | (100,180 | ) | | | (1,761,510 | ) |
| | | | | | | | |
Net increase (decrease) | | | (23,625 | ) | | $ | (385,089 | ) |
| | | | | | | | |
Year ended October 31, 2012: | | | | | | | | |
Shares sold | | | 82,933 | | | $ | 1,341,495 | |
Shares redeemed | | | (244,308 | ) | | | (3,914,415 | ) |
| | | | | | | | |
Net increase (decrease) | | | (161,375 | ) | | $ | (2,572,920 | ) |
| | | | | | | | |
| | |
| | | | | | | | |
| | | | | | | | |
Class I | | Shares | | | Amount | |
Six-month period ended April 30, 2013: | | | | | | | | |
Shares sold | | | 1,407,097 | | | $ | 27,829,674 | |
Shares issued to shareholders in reinvestment of dividends | | | 48,995 | | | | 898,671 | |
Shares redeemed | | | (617,044 | ) | | | (11,847,745 | ) |
| | | | | | | | |
Net increase (decrease) | | | 839,048 | | | $ | 16,880,600 | |
| | | | | | | | |
Year ended October 31, 2012: | | | | | | | | |
Shares sold | | | 2,958,245 | | | $ | 51,551,858 | |
Shares redeemed | | | (4,042,450 | ) | | | (71,777,581 | ) |
| | | | | | | | |
Net increase (decrease) | | | (1,084,205 | ) | | $ | (20,225,723 | ) |
| | | | | | | | |
| | |
| | | | | | | | |
Class R1 | | Shares | | | Amount | |
Six-month period ended April 30, 2013: | | | | | | | | |
Shares issued to shareholders in reinvestment of dividends | | | 7 | | | $ | 134 | |
| | | | | | | | |
Net increase (decrease) | | | 7 | | | $ | 134 | |
| | | | | | | | |
Year ended October 31, 2012 (a): | | | | | | | | |
Shares sold | | | 1,466 | | | $ | 25,000 | |
| | | | | | | | |
Net increase (decrease) | | | 1,466 | | | $ | 25,000 | |
| | | | | | | | |
| | |
| | | | | | | | |
Class R2 | | Shares | | | Amount | |
Six-month period ended April 30, 2013: | | | | | | | | |
Shares issued to shareholders in reinvestment of dividends | | | 4 | | | $ | 68 | |
| | | | | | | | |
Net increase (decrease) | | | 4 | | | $ | 68 | |
| | | | | | | | |
Year ended October 31, 2012 (a): | | | | | | | | |
Shares sold | | | 1,498 | | | $ | 25,000 | |
| | | | | | | | |
Net increase (decrease) | | | 1,498 | | | $ | 25,000 | |
| | | | | | | | |
|
(a) Class R1 shares and Class R2 shares were first offered on July 31, 2012. | |
Note 9–Subsequent Events
In connection with the preparation of the financial statements of the Fund as of and for the six-month period ended April 30, 2013, events and transactions subsequent to April 30, 2013, through the date the financial statements were issued have been evaluated by the Fund’s management for possible adjustment and/or disclosure. No subsequent events requiring financial statement adjustment or disclosure have been identified.
| | |
| 26 | | MainStay U.S. Small Cap Fund |
I. Board Consideration and Approval of Management Agreement and
Subadvisory Agreement (Unaudited)
Section 15(c) of the Investment Company Act of 1940, as amended (the “1940 Act”) requires that each mutual fund’s board of trustees, including a majority of the independent trustees, annually review and approve the fund’s investment advisory agreements. At its December 10-12, 2012 meeting, the Board of Trustees of the MainStay Group of Funds (“Board”) unanimously approved the Management Agreement with respect to the MainStay U.S. Small Cap Fund (“Fund”) and New York Life Investment Management LLC (“New York Life Investments”), and the Subadvisory Agreement between New York Life Investments and Epoch Investment Partners, Inc. (“Epoch”) with respect to the Fund.
In reaching its decision to approve the Agreements, the Board considered information furnished by New York Life Investments and Epoch in connection with a contract review process that took place at various meetings of the Board and its Contracts Committee between September 2012 and December 2012, as well as other relevant information furnished to the Board throughout the year by New York Life Investments and Epoch. Information requested by and furnished to the Board in connection with the contract review process included, among other items, reports on the Fund prepared by Strategic Insight Mutual Fund Research and Consulting, LLC (“Strategic Insight”), an independent third-party service provider engaged by the Board to report objectively on the Fund’s investment performance, management and subadvisory fees and ordinary operating expenses. The Board also considered information provided by New York Life Investments and Epoch on the fees charged to other investment advisory clients (including institutional separate accounts) that follow investment strategies similar to the Fund, and the rationale for any differences in the Fund’s management and subadvisory fees and the fees charged to those other investment advisory clients. In addition, the Board requested and received information on the profitability of the Fund to New York Life Investments and its affiliates and Epoch, and responses from New York Life Investments and Epoch to a series of questions encompassing a variety of topics prepared on behalf of the Board by independent legal counsel to the Board and its independent trustees (the “Independent Trustees”). Information provided to the Board at its meetings throughout the year included, among other items, detailed investment performance reports on the Fund prepared by the Investment Consulting Group at New York Life Investments. The structure and format for this regular reporting was developed in consultation with the Board. The Board also received from New York Life Investments throughout the year, among other items, periodic reports on legal and compliance matters, portfolio turnover, and sales and marketing activity.
In determining to approve the Agreements, the members of the Board reviewed and evaluated all of the information and factors they believed to be relevant and appropriate in light of legal advice furnished to them by independent legal counsel and through the exercise of their own business judgment. The broad factors considered by the Board are discussed in greater detail below, and included, among other items: (i) the nature, scope and quality of the services provided to the Fund by New York Life Investments and Epoch; (ii) the investment performance of the Fund, New York Life Investments and Epoch; (iii) the costs of the services provided, and profits realized, by New York Life Investments and Epoch from their relationship with the Fund; (iv) the extent to which economies of scale may be realized as the Fund grows, and the extent to which economies of scale may benefit Fund investors; and (v) the reasonableness of the Fund’s management and subadvisory fees and
overall total ordinary operating expenses, particularly as compared to similar funds and accounts managed by New York Life Investments and Epoch and third-party “peer funds” identified by Strategic Insight.
While individual members of the Board may have weighed certain factors differently, the Board’s decision to approve the Agreements was based on a consideration of all the information provided to the Board, including information provided to the Board throughout the year and specifically in connection with the contract review process. The Board’s conclusions with respect to the Agreements also were based, in part, on the Board’s consideration of the Agreements in prior years. In addition to considering the above-referenced factors, the Board observed that in the marketplace there are a range of investment options available to shareholders of the Fund, and that the Fund’s shareholders, having had the opportunity to consider other investment options, have chosen to invest in the Fund. A more detailed discussion of the factors that figured prominently in the Board’s decisions to approve the Agreements is provided below.
Nature, Scope and Quality of Services to Be Provided by New York Life Investments and Epoch
The Board examined the nature, scope and quality of the services that New York Life Investments provides to the Fund. The Board evaluated New York Life Investments’ experience in serving as manager of the Fund, noting that New York Life Investments manages other mutual funds, serves a variety of other investment advisory clients, including other pooled investment vehicles, and has experience with overseeing mutual fund service providers, including subadvisors. The Board considered the experience of senior personnel at New York Life Investments providing management and administrative services to the Fund, as well as New York Life Investments’ reputation and financial condition. The Board also considered the full range of non-advisory services that New York Life Investments supplies to the Fund under the terms of the Management Agreement, including: (i) fund accounting services provided by New York Life Investments’ Fund Accounting and Administration Group; (ii) investment oversight and analytical services provided by New York Life Investments’ Investment Consulting Group; (iii) compliance services provided by New York Life Investments’ compliance department, including oversight and implementation of the Fund’s compliance program; and (iv) legal services provided by New York Life Investments’ Office of the General Counsel. Additional information about the non-advisory services provided by New York Life Investments is set forth in the Fund’s Management Agreement. The Board also considered New York Life Investments’ willingness to invest in personnel that benefit the Fund, and noted that New York Life Investments is responsible for compensating the Fund’s officers. The Board also considered benefits to shareholders of being part of the MainStay Group of Funds, including the privilege of exchanging investments between the same class of shares without the imposition of a sales charge, as described more fully in the Fund’s prospectus.
The Board also examined the nature, scope and quality of the advisory services that Epoch provides to the Fund. The Board evaluated Epoch’s experience in serving as subadvisor to the Fund and managing other portfolios. It examined Epoch’s track record and experience in providing investment advisory services, the experience of investment advisory, senior management and administrative personnel at Epoch, and Epoch’s overall legal and compliance environment. The Board also reviewed
| | | | |
| mainstayinvestments.com | | | 27 | |
I. Board Consideration and Approval of Management Agreement and
Subadvisory Agreement (Unaudited) (continued)
Epoch’s willingness to invest in personnel that benefit the Fund. In this regard, the Board considered the experience of the Fund’s portfolio managers, the number of accounts managed by the portfolio managers and the method for compensating portfolio managers.
Based on these considerations, the Board concluded, within the context of its overall determinations regarding the Agreements, that the Fund should continue to benefit from the nature, scope and quality of these services as a result of New York Life Investments’ and Epoch’s experience, personnel, operations and resources.
Investment Performance
In evaluating the Fund’s investment performance, the Board considered investment performance results in light of the Fund’s investment objective, strategies and risks, as disclosed in the Fund’s prospectus. The Board particularly considered detailed investment reports on the Fund’s performance provided to the Board throughout the year by the Investment Consulting Group of New York Life Investments. These reports include, among other items, information on the Fund’s gross and net returns, the Fund’s investment performance relative to relevant investment categories and Fund benchmarks, the Fund’s risk-adjusted investment performance, and the Fund’s investment performance as compared to similar competitor funds, as appropriate. The Board also considered information provided by Strategic Insight showing the investment performance of the Fund as compared to peer funds.
In considering the Fund’s investment performance, the Board focused principally on the Fund’s long-term performance track record. The Board also gave weight to its ongoing discussions with senior management at New York Life Investments concerning the Fund’s investment performance, as well as discussions between the Fund’s portfolio managers and the Board that occur typically on an annual basis. In addition, the Board considered any specific actions that New York Life Investments or Epoch had taken, or had agreed with the Board to take, to enhance Fund investment performance, and the results of those actions.
Based on these considerations, the Board concluded, within the context of its overall determinations regarding the Agreements, that the long-term investment performance of the Fund, along with ongoing efforts by New York Life Investments and Epoch to enhance investment returns, supported a determination to approve the Agreements. The Fund discloses more information about investment performance in the Portfolio Management Discussion and Analysis, Investment and Performance Comparison and Financial Highlights sections of this Semiannual Report and in the Fund’s prospectus.
Costs of the Services Provided, and Profits Realized, by New York Life Investments and Epoch
The Board considered the costs of the services provided by New York Life Investments and Epoch under the Agreements, and the profits realized by New York Life Investments and its affiliates and Epoch due to their relationships with the Fund. Because Epoch’s subadvisory fees are negotiated at arm’s-length by New York Life Investments and are paid by New York Life Investments, not the Fund, the Board principally considered the profits realized by New York Life Investments and its affiliates with respect to the Fund.
In evaluating the costs and profits of New York Life Investments and its affiliates and Epoch, the Board considered, among other factors, each
party’s investments in personnel, systems, equipment and other resources necessary to manage the Fund, and that New York Life Investments is responsible for paying the subadvisory fees for the Fund. The Board acknowledged that New York Life Investments and Epoch must be in a position to pay and retain experienced professional personnel to provide services to the Fund, and that the ability to maintain a strong financial position is important in order for New York Life Investments and Epoch to continue to provide high-quality services to the Fund. The Board also noted that the Fund benefits from the allocation of certain fixed costs across the MainStay Group of Funds.
In addition, the Board noted the difficulty in obtaining reliable comparative data about mutual fund managers’ profitability, since such information generally is not publicly available and may be impacted by numerous factors, including the structure of a fund manager’s organization, the types of funds it manages, the methodology used to allocate certain fixed costs to specific funds, and the manager’s capital structure and costs of capital. While recognizing the difficulty in evaluating a manager’s profitability with respect to the Fund, and noting that other profitability methodologies may also be reasonable, the Board concluded that the profitability methodology presented by New York Life Investments to the Board, which was developed by New York Life Investments in consultation with an independent consultant, was reasonable in all material respects.
In considering the costs and profitability of the Fund, the Board also considered certain fall-out benefits that may be realized by New York Life Investments and its affiliates due to their relationships with the Fund. The Board recognized, for example, the benefits to Epoch from legally permitted “soft-dollar” arrangements by which brokers provide research and other services to Epoch in exchange for commissions paid by the Fund with respect to trades on the Fund’s portfolio securities. The Board also requested and received information from New York Life Investments and Epoch concerning other business relationships between Epoch and its affiliates and New York Life Investments and its affiliates.
The Board further considered that, in addition to fees earned by New York Life Investments for managing the Fund, New York Life Investments’ affiliates also earn revenues from serving the Fund in various other capacities, including as the Fund’s transfer agent and distributor. The Board observed that information about these other revenues, and their impact on the profitability of the Fund to New York Life Investments and its affiliates, was furnished to the Board as part of the 15(c) process. The Board noted that, although it assessed the overall profitability of the Fund to New York Life Investments and its affiliates as part of the contract review process, when considering the reasonableness of the fees to be paid to New York Life Investments and its affiliates under the Agreements, the Board considered the profitability of New York Life Investments’ relationship with the Fund on a pre-tax basis, and without regard to distribution expenses.
After evaluating the information presented to the Board, the Board concluded, within the context of its overall determinations regarding the Agreements, that any profits realized by New York Life Investments and its affiliates due to their relationships with the Fund supported the Board’s decision to approve the Agreements. With respect to Epoch, the Board concluded that any profits realized by Epoch due to its relationship with the Fund are the result of arm’s-length negotiations between
| | |
| 28 | | MainStay U.S. Small Cap Fund |
New York Life Investments and Epoch, and are based on fees paid to Epoch by New York Life Investments, not the Fund.
Extent to Which Economies of Scale May Be Realized as the Fund Grows
The Board also considered whether the Fund’s expense structure permitted economies of scale to be shared with Fund investors. The Board reviewed information from New York Life Investments showing how the Fund’s management fee schedule compared to fee schedules of other funds and accounts managed by New York Life Investments. The Board also reviewed information from Strategic Insight showing how the Fund’s management fee schedule hypothetically would compare with fees paid for similar services by peer funds at varying asset levels. While recognizing the difficulty of determining economies of scale with precision, the Board acknowledged that economies of scale may be shared with the Fund in a number of ways, including, for example, through the imposition of management fee breakpoints and by initially setting relatively lower management fees.
Based on this information, the Board concluded, within the context of its overall determinations regarding the Agreements, that the Fund’s expense structure appropriately reflects economies of scale for the benefit of Fund investors. The Board noted, however, that it would continue to evaluate the reasonableness of the Fund’s expense structure as the Fund grows over time.
Management and Subadvisory Fees and Total Ordinary Operating Expenses
The Board evaluated the reasonableness of the fees to be paid under the Agreements and the Fund’s expected total ordinary operating expenses. The Board primarily considered the reasonableness of the management fee paid by the Fund to New York Life Investments, since the fees paid to Epoch are paid by New York Life Investments, not the Fund.
In assessing the reasonableness of the Fund’s fees and expenses, the Board primarily considered comparative data provided by Strategic Insight on the fees and expenses charged by similar mutual funds managed by other investment advisers. In addition, the Board considered information provided by New York Life Investments and Epoch on fees charged to other investment advisory clients, including institutional separate accounts and other funds with similar investment objectives as the Fund. The Board particularly considered differences in the contractual management fee schedules of the retail MainStay Funds and similarly-managed MainStay VP Portfolios, taking into account New York Life Investments’ rationale for any differences in fee schedules. The Board also took into account explanations provided by New York Life Investments about the different scope of services provided to mutual funds as compared with other investment advisory clients. Additionally, the Board considered the impact of any expense limitation arrangements on the Fund’s net management fee and expenses. In addition, the Board considered and approved New York Life Investments’ proposal to remove the Fund’s contractual expense limitation arrangements, noting that the Fund’s management fee and total expenses would be reasonable without the expense limitation arrangements.
The Board noted that, outside of the Fund’s management fee and the fees charged under a share class’s Rule 12b-1 and/or shareholder services plans, a share class’s most significant “other expenses” are
transfer agent fees. Transfer agent fees are charged to the Fund based on the number of shareholder accounts (a “per-account” fee) as compared with certain other fees (e.g., management fees), which are charged based on the Fund’s average net assets. The Board took into account information from New York Life Investments showing that the Fund’s transfer agent fee schedule is reasonable, including industry data showing that the per-account fees that NYLIM Service Company LLC, the Fund’s transfer agent, charges the Fund are within the range of per-account fees charged by transfer agents to other mutual funds. In addition, the Board considered NYLIM Service Company LLC’s profitability in connection with the transfer agent services it provides to the Fund.
The Board acknowledged that, because the Fund’s transfer agent fees are billed on a per-account basis, the impact of transfer agent fees on a share class’s expense ratio may be more significant in cases where the share class has a high number of accounts with limited assets (i.e., small accounts). The Board observed that transfer agent fees are a significant portion of total expenses of many Funds in the MainStay Group of Funds. The impact of transfer agent fees on the expense ratios of these MainStay Funds tend to be greater than for other open-end retail funds, because the MainStay Group of Funds generally has a significant number of small accounts relative to competitor funds. The Board acknowledged the role that the MainStay Group of Funds historically has played in serving the investment needs of New York Life Insurance Company (“New York Life”) policyholders, who often maintain smaller account balances than other fund investors. The Board discussed measures that it and New York Life Investments have taken in recent years to mitigate the effect of small accounts on the expense ratios of Fund share classes, including: (i) encouraging New York Life agents to consolidate multiple small accounts held by the same investor into one MainStay Asset Allocation Fund account; (ii) increasing investment minimums from $500 to $1,000 in 2003; (iii) introducing Investor Class shares for certain MainStay Funds in early 2008 to consolidate smaller account investors; (iv) closing small accounts with balances below $250 in Investor Class shares or $750 in all other classes of shares; (v) no longer allowing an exception with no minimum investment amount with respect to AutoInvest accounts with subsequent monthly purchases of $100; (vi) since 2007, charging an annual $20.00 small account fee on certain accounts with balances below $1,000; and (vii) modifying the approach for billing transfer agent expenses to reduce the degree of subsidization by large accounts of smaller accounts. In addition, the Board acknowledged New York Life Investments’ efforts to encourage intermediaries to consolidate small accounts in multiple Funds held by the same investor into a single Asset Allocation Fund account, if appropriate under the circumstances, in an effort to mitigate the effect of small accounts on the Funds in the MainStay Group of Funds.
After considering all of the factors outlined above, the Board concluded that the Fund’s management and subadvisory fees and total ordinary operating expenses were within a range that is competitive and, within the context of the Board’s overall conclusions regarding the Agreements, support a conclusion that these fees and expenses are reasonable.
Conclusion
On the basis of the information provided to it and its evaluation thereof, the Board, including the Independent Trustees, unanimously voted to approve the Agreements.
| | | | |
| mainstayinvestments.com | | | 29 | |
II. Board Consideration and Approval of New Subadvisory Agreement (Unaudited)
At its March 21, 2013 meeting, the Board unanimously approved a new Subadvisory Agreement (the “Subadvisory Agreement”) between New York Life Investments and Epoch on behalf of the Fund that took effect on March 27, 2013. The Board was asked to approve the Subadvisory Agreement in connection with a “change in control” of Epoch and, accordingly, the termination by law and the express terms of the previous subadvisory agreement between New York Life Investments and Epoch with respect to the Fund.
On March 27, 2013, Epoch Holding Corporation (“Epoch Holding”) merged with Empire Merger Sub, Inc., a wholly-owned subsidiary of The Toronto-Dominion Bank, a Canadian chartered bank (“Epoch Holding Merger”) following the approval of Epoch Holding shareholders. As a result, Epoch Holding became a wholly-owned subsidiary of The Toronto-Dominion Bank (“TD Bank”). Epoch Holding is the parent company of Epoch Investment Partners, Inc. (“Epoch”), the Fund’s subadvisor. The closing of the Epoch Holding Merger resulted in a “change of control” of Epoch.
In reaching its decision to approve the continued retention of Epoch and the Agreement, the Board considered information presented to it by New York Life Investments, Epoch and TD Bank as part of its consideration and approval of the Agreement at the Board’s meeting in March 2013, as well as other relevant information furnished to it throughout the year by New York Life Investments and Epoch at regular and special Board meetings. The Board also requested and received responses from Epoch to a comprehensive list of questions encompassing a variety of topics prepared on behalf of the Board by independent legal counsel to the Board. The Board noted that it had also requested and received responses to similar questions in connection with its annual approval of the previous subadvisory agreement with Epoch at various meetings of the Board and its Contracts Committee between September 2012 and December 2012. The Board considered its historical experience with Epoch’s capabilities and resources, and its evaluation of Epoch in connection with previous contract review processes, including the contract review process that culminated with approval of the previous subadvisory agreement between New York Life Investments and Epoch, on behalf of the Fund (the “Prior Contract Review Processes”).
In determining to approve the continued retention of Epoch and approve the Agreement, the members of the Board reviewed and evaluated all of the information and factors they believed to be relevant and appropriate in light of legal advice furnished to them by independent legal counsel and through the exercise of their own business judgment. The broad factors considered by the Board are discussed in greater detail below, and included, among other things: (i) the nature, scope and quality of the services to be provided to the Fund by Epoch; (ii) the investment performance of the Fund; (iii) the costs of the services to be provided and the profits to be realized by Epoch and its affiliates from its relationship with the Fund; (iv) the extent to which economies of scale may be realized as the Fund grows, and the extent to which economies of scale may benefit Fund investors; and (v) the reasonableness of the Fund’s management and subadvisory fee levels and overall total ordinary operating expenses.
While the members of the Board may have weighed certain factors differently, the Board’s decision to approve the continued retention of Epoch and approve the Agreement was based on a comprehensive consideration of all the information provided to the Board, including
information provided to the Board in connection with its review of Epoch. The Board also considered that shareholders of the Fund approved the ability of New York Life Investments to act as a “manager of managers,” which allows the Board and New York Life Investments to retain unaffiliated subadvisors for the Fund without the approval of Fund shareholders. A more detailed discussion of the factors that figured prominently in the Board’s decision to approve the continued retention of Epoch and approve the Agreement is provided below.
Nature, Scope and Quality of Services to Be Provided by Epoch
In considering the approval of the continued retention of Epoch and approval of the Agreement, the Board examined the nature, scope and quality of the services that Epoch historically had provided to the Fund. Based on information provided to the Board in connection with the Prior Contract Review Processes, the Board acknowledged Epoch’s historical service to the Fund, and took note of the experience of Epoch’s portfolio managers, the number of accounts managed by the portfolio managers and Epoch’s method for compensating portfolio managers. The Board also considered the experience of senior personnel at Epoch, and Epoch’s plans for retaining key personnel in connection with the acquisition of Epoch Holding by TD Bank. Based on these considerations, the Board concluded, within the context of its overall determinations regarding the Agreement, that the Fund should continue to benefit from the nature, scope and quality of these services as a result of Epoch’s experience, personnel, operations and resources.
Investment Performance
In evaluating investment performance, the Board took note of the Fund’s historical investment performance results, as presented to the Board in connection with the Prior Contract Review Processes, in light of the Fund’s investment objectives, strategies and risks, as disclosed in the Fund’s prospectuses. The Board considered information about the Fund’s investment performance that is provided to the Board in connection with its regularly scheduled meetings, and also took note of information provided in connection with the Prior Contract Review Processes showing the investment performance of the Fund as compared to peer funds. The Board also considered the strength of Epoch’s resources (including research capabilities). Based on these considerations, the Board concluded, within the context of its overall determinations regarding the Agreement, that the retention of Epoch as subadvisor to the Fund is likely to benefit the Fund’s long-term investment performance.
Costs of the Services to Be Provided, and Profits to Be Realized, by Epoch
The Board considered the costs of the services to be provided by Epoch under the Agreement, and the profits to be realized by Epoch due to its relationship with the Fund, taking into account information provided to the Board in connection with the Prior Contract Review Processes. The Board noted that, in connection with Prior Contract Review Processes, Epoch has provided the Board with information about its profitability in connection with its relationship with the Fund. In addition, the Board considered past representations from Epoch and New York Life Investments that the subadvisory fees paid by New York Life Investments to
| | |
| 30 | | MainStay U.S. Small Cap Fund |
Epoch were the result of arm’s-length negotiations. Because Epoch’s subadvisory fees are paid by New York Life Investments, and not the Fund, the Board historically has focused principally on the profitability of the Fund to New York Life Investments and its affiliates.
In evaluating the costs of the services provided by Epoch in connection with the Prior Contract Review Processes, the Board considered, among other things, Epoch’s investments in personnel, systems, equipment and other resources necessary to manage the Fund, and the fact that New York Life Investments is responsible for paying the subadvisory fees for the Fund. The Board acknowledged that Epoch must be in a position to pay and retain experienced professional personnel to provide services to the Fund, and that Epoch’s ability to maintain a strong financial position is important in order for Epoch to provide high-quality ongoing services to the Fund and its investors.
The Board also considered certain fall-out benefits that may be realized by Epoch due to its relationship with the Fund. The Board recognized, for example, the benefits to Epoch from legally permitted “soft-dollar” arrangements by which brokers may provide research and other services to Epoch in exchange for commissions paid by the Fund with respect to trades on the Fund’s portfolio securities.
As part of the Prior Contract Review Processes, the Board requested and received information from Epoch and New York Life Investments concerning other business relationships between Epoch and its affiliates and New York Life Investments and its affiliates. The Board requested and received assurances that these other business relationships did not impact New York Life Investments’ recommendation for Epoch to serve as the Fund’s subadvisor, and that neither New York Life Investments nor its affiliates are expected to benefit in its other business relationships due to Epoch’s continued engagement as the Fund’s subadvisor.
After evaluating the information presented to the Board, the Board concluded, within the context of its overall determinations regarding the Agreement, that any profits to be realized by Epoch due to its relationship with the Fund supported the Board’s determination to approve the Agreement. The Board also concluded that any profits to be realized by Epoch will be the result of arm’s-length negotiations between New York Life Investments and Epoch, and will be based on subadvisory fees paid to Epoch by New York Life Investments, not the Fund.
Extent to Which Economies of Scale May Be Realized as the Fund Grows
The Board also considered whether the Fund’s expense structures permitted economies of scale to be shared with the Fund’s investors, taking into account information provided to the Board in connection with the Prior Contract Review Processes.
Based on this information, the Board concluded, within the context of its overall determinations regarding the Agreement, that the Fund’s expense structure appropriately reflect economies of scale for the benefit of Fund investors. The Board noted, however, that it would continue to evaluate the reasonableness of the Fund’s expense structure as the Fund grows over time.
Reasonableness of Subadvisory Fees
The Board evaluated the reasonableness of the fees to be paid under the existing management agreement with New York Life Investments and the Agreement, and the Fund’s expected total ordinary operating expenses. The Board considered that the fees to be paid to Epoch under the Agreement will be paid by New York Life Investments, not the Fund, and will result in no increase in the Fund’s expenses. In assessing the reasonableness of the Fund’s fees and expenses the Board primarily considered comparative data provided to the Board in connection with the Prior Contract Review Processes on the fees and expenses charged by similar mutual funds managed by other investment advisers. In addition, the Board considered information provided by New York Life Investments and Epoch on fees charged to other investment advisory clients, including institutional separate accounts and other funds with similar investment objectives as the Fund. In this regard, the Board took into account explanations from New York Life Investments and Epoch about the different scope of services provided to retail mutual funds as compared with other investment advisory clients. The Board also took into account the impact of any expenses limitation arrangements on the Fund’s net expenses.
After considering all of the factors outlined above, the Board concluded that the Fund’s management and subadvisory fees and total ordinary operating expenses were within a range that is competitive and, within the context of the Board’s overall conclusions regarding the Agreement, support a conclusion that these fees and expenses are reasonable.
Conclusion
On the basis of the information provided to it and its evaluation thereof, the Board, including the Independent Trustees, unanimously voted to approve the Agreement.
| | | | |
| mainstayinvestments.com | | | 31 | |
Proxy Voting Policies and Procedures and Proxy Voting Record
A description of the policies and procedures that New York Life Investments uses to vote proxies related to the Fund’s securities is available without charge, upon request, (i) by visiting the Fund’s website at mainstayinvestments.com; or (ii) on the Securities and Exchange Commission’s (“SEC”) website at www.sec.gov.
The Fund is required to file with the SEC its proxy voting record for the 12-month period ending June 30 on Form N-PX. The Fund’s most recent Form N-PX is available free of charge upon request (i) by calling 800-MAINSTAY (624-6782); (ii) by visiting the Fund’s website at mainstayinvestments.com; or (iii) on the SEC’s website at www.sec.gov.
Shareholder Reports and Quarterly Portfolio Disclosure
The Fund is required to file its complete schedule of portfolio holdings with the SEC for its first and third fiscal quarters on Form N-Q. The Fund’s Form N-Q is available without charge on the SEC’s website at www.sec.gov or by calling MainStay Investments at 800-MAINSTAY (624-6782). You also can obtain and review copies of Form N-Q by visiting the SEC’s Public Reference Room in Washington, DC (information on the operation of the Public Reference Room may be obtained by calling 1-800-SEC-0330).
| | |
| 32 | | MainStay U.S. Small Cap Fund |
This page intentionally left blank
This page intentionally left blank
MainStay Funds
MainStay offers a wide range of Funds for virtually any investment need. The full array of MainStay open-end offerings is listed here, with information about the manager, subadvisors, legal counsel and independent registered public accounting firms.
Equity
U.S. Equity Funds
MainStay Common Stock Fund
MainStay Cornerstone Growth Fund
MainStay Epoch U.S. All Cap Fund
MainStay Epoch U.S. Equity Yield Fund
MainStay ICAP Equity Fund
MainStay ICAP Select Equity Fund
MainStay Large Cap Growth Fund1
MainStay MAP Fund
MainStay S&P 500 Index Fund
MainStay U.S. Equity Opportunities Fund
MainStay U.S. Small Cap Fund
International/Global Equity Funds
MainStay Epoch Global Choice Fund
MainStay Epoch Global Equity Yield Fund
MainStay Epoch International Small Cap Fund
MainStay ICAP Global Fund
MainStay ICAP International Fund
MainStay International Equity Fund
MainStay International Opportunities Fund
Income
Taxable Bond Funds
MainStay Floating Rate Fund
MainStay Global High Income Fund
MainStay Government Fund
MainStay High Yield Corporate Bond Fund
MainStay High Yield Opportunities Fund
MainStay Indexed Bond Fund
MainStay Intermediate Term Bond Fund
MainStay Short Duration High Yield Fund
MainStay Short Term Bond Fund
MainStay Unconstrained Bond Fund
Municipal Bond Funds
MainStay California Tax Free Opportunities Fund2
MainStay High Yield Municipal Bond Fund
MainStay New York Tax Free Opportunities Fund3
MainStay Tax Free Bond Fund
Money Market Fund
MainStay Money Market Fund
Mixed Asset
MainStay Balanced Fund
MainStay Convertible Fund
MainStay Income Builder Fund
MainStay Marketfield Fund
Asset Allocation/Target Date
MainStay Conservative Allocation Fund
MainStay Growth Allocation Fund
MainStay Moderate Allocation Fund
MainStay Moderate Growth Allocation Fund
MainStay Retirement 2010 Fund
MainStay Retirement 2020 Fund
MainStay Retirement 2030 Fund
MainStay Retirement 2040 Fund
MainStay Retirement 2050 Fund
Manager
New York Life Investment Management LLC
New York, New York
Subadvisors
Cornerstone Capital Management Holdings LLC4
New York, New York
Cornerstone Capital Management LLC4
Bloomington, Minnesota
Epoch Investment Partners, Inc.
New York, New York
Institutional Capital LLC4
Chicago, Illinois
MacKay Shields LLC4
New York, New York
Marketfield Asset Management LLC
New York, New York
Markston International LLC
White Plains, New York
Winslow Capital Management LLC
Minneapolis, Minnesota
Legal Counsel
Dechert LLP
Independent Registered Public Accounting Firms
KPMG LLP
PricewaterhouseCoopers LLP
1. Effective January 13, 2012, the Fund was closed to new investors with certain exceptions.
2. This Fund is only registered for sale in AZ, CA, NV, OR, UT, and WA.
3. This Fund is only registered for sale in CT, DE, FL, MA, NJ, NY, and VT.
4. An affiliate of New York Life Investment Management LLC.
Not part of the Semiannual Report
For more information
800-MAINSTAY (624-6782)
mainstayinvestments.com
The MainStay Funds® are managed by New York Life Investment Management LLC and distributed through NYLIFE Distributors LLC, 169 Lackawanna Avenue, Parsippany, NJ 07054, a wholly owned subsidiary of New York Life Insurance Company. NYLIFE Distributors LLC is a Member FINRA/SIPC.
MainStay Investments® is a registered service mark and name under which New York Life Investment Management LLC does business. MainStay Investments, an indirect subsidiary of New York Life Insurance Company, New York, NY 10010, provides investment advisory products and services.
This report may be distributed only when preceded or accompanied by a current Fund prospectus.
©2013 NYLIFE Distributors LLC. All rights reserved.
| | | | | | | | |
| Not FDIC/NCUA Insured | | Not a Deposit | | May Lose Value | | No Bank Guarantee | | Not Insured by Any Government Agency |
| | |
| NYLIM-30046 MS175-13 | | MSUSC10-06/13 NL0B1 |
MainStay New York Tax Free Opportunities Fund
Message from the President and Semiannual Report
Unaudited | April 30, 2013


This page intentionally left blank
Message from the President
The U.S. stock market advanced during the six months ended April 30, 2013, generally providing double-digit returns at all capitalization levels. Value stocks tended to outpace growth stocks among large- and mid-capitalization companies, while growth stocks tended to outpace value stocks among smaller companies.
The market’s advance, however, was far from uniform. Stocks declined in early November, both before and immediately after the U.S. presidential election. Following a sharp recovery, stocks climbed until mid-December, when a Congressional stalemate on the fiscal cliff led to a brief decline. Another dip occurred in late February as investors speculated that the Federal Open Market Committee (FOMC) might stop purchasing mortgage-backed securities sooner than expected. Stocks also dipped in mid-April, as consumer sentiment dropped after the Boston marathon bombing. Despite these setbacks, U.S. stocks continued to trend upward during the six-month reporting period.
International stock markets also advanced, with several regional differences. Accommodative action by the Bank of Japan helped lower the yen and lift Japanese stocks to their highest levels since 2008. In Europe, stocks did well until early February, bolstered by the promise of support for the euro. As the year progressed, however, economic contraction, rising unemployment and systematic banking concerns took a toll on investor enthusiasm. In China, manufacturing slowed as the nation sought to balance growth and inflation risks. On the Korean peninsula, tensions rose as North Korea continued to threaten its neighbors, which added an undercurrent of caution to the market.
During the six months ended April 30, 2013, the FOMC kept the federal funds rate in a range close to zero. The FOMC also continued its direct purchases of mortgage-backed securities and longer-term U.S. government securities. With short-term interest rates likely to remain at low levels, many bond investors pursued higher yields by lengthening maturities and assuming greater risk. As a result, bonds with higher risk profiles tended
to outperform higher-quality investment-grade bonds and U.S. Treasury securities. Cash and cash equivalents essentially returned zero.
With wide variations in the performance of various asset classes, some investors might be tempted to chase higher returns by shifting back and forth between stocks and bonds. Since no one can predict where the market will move next, however, we encourage investors to select an appropriate mix of investments for their risk tolerance and time horizon and to stick with that mix, making only minor adjustments over time.
At MainStay Funds, our portfolio managers use a similar approach. Careful security selection and thoughtful sell disciplines help them pursue the investment objectives of their respective Funds. Using the principal investment strategies outlined in the Prospectus, they focus primarily on providing long-term investment potential for our shareholders.
Has this approach proved successful? In its most recent rankings, Barron’s listed MainStay Funds as the #1 fund family over the past 10 years. We were also the only mutual fund family that has appeared in Barron’s top six for the past five consecutive years.
The pages that follow provide additional insight into the specific market events, investment decisions and securities that shaped your MainStay Fund(s) during the six months ended April 30, 2013. We encourage you to read the semiannual report(s) carefully and to evaluate your results with your long-term financial goals in mind.
Sincerely,

Stephen P. Fisher
President
The opinions expressed are as of the date of this report and are subject to change. There is no guarantee that any forecast made will come to pass. This material does not constitute investment advice and is not intended as an endorsement of any specific investment.
To qualify for the Lipper/Barron’s Fund Survey, a fund family must have at least three funds in Lipper’s general U.S.-stock category, one in world equity (which combines global and international funds), one mixed-equity fund (which holds stocks and bonds), two taxable-bond funds, and one tax-exempt fund. Fund loads and 12b-1 fees aren’t included in the calculation of returns because the aim is to measure the manager’s skill. Each fund’s return is measured against all funds in its Lipper category, resulting in a percentile ranking which is then weighted by asset size relative to the fund family’s other assets in its general classifications. Finally, the score is multiplied by the general classification weightings as determined by the entire Lipper universe of funds.
Source: Barron’s, 2/9/13. Overall, MainStay Funds ranked number 56 for the one-year period, 20 for the five-year period and one for the 10-year period ended December 31, 2012, out of 62, 53 and 46 fund families, respectively. MainStay ranked number three for the 10-year period in 2009, 2010 and 2011 from among 48, 46 and 45 fund families, respectively. MainStay ranked number six from among 48 fund families for the 10-year period in 2008. Past performance is no guarantee of future results, which will vary. For the most recent MainStay Funds performance, please visit our website at mainstayinvestments.com. All mutual funds are subject to market risk and will fluctuate in value.
Not part of the Semiannual Report
Table of Contents
Investors should refer to the Fund’s Summary Prospectus and/or Prospectus and consider the Fund’s investment objectives, strategies, risks, charges and expenses carefully before investing. The Summary Prospectus and/or Prospectus contain this and other information about the Fund. You may obtain copies of the Fund’s Summary Prospectus, Prospectus and Statement of Additional Information free of charge, upon request, by calling toll-free 800-MAINSTAY (624-6782), by writing to NYLIFE Distributors LLC, Attn: MainStay Marketing Department, 169 Lackawanna Avenue, Parsippany, New Jersey 07054 or by sending an e-mail to MainStayShareholderServices@nylim.com. These documents are also available via the MainStay Funds’ website at mainstayinvestments.com/documents. Please read the Summary Prospectus and/or Prospectus carefully before investing.
Investment and Performance Comparison1 (Unaudited)
Performance data quoted represents past performance. Past performance is no guarantee of future results. Because of market volatility, current performance may be lower or higher than the figures shown. Investment return and principal value will fluctuate, and as a result, when shares are redeemed, they may be worth more or less than their original cost. The graph below depicts the historical performance of Class I shares of the Fund. Performance will vary from class to class based on differences in class-specific expenses and sales charges. For performance information current to the most recent month-end, please call 800-MAINSTAY (624-6782) or visit mainstayinvestments.com.
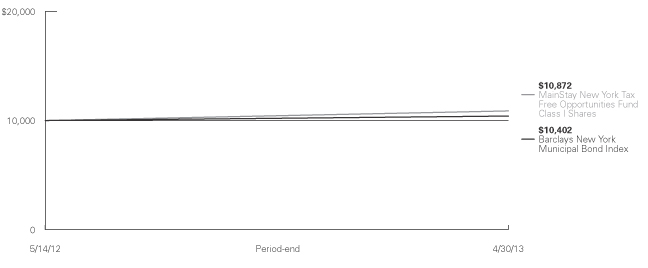
Average Annual Total Returns for the Period Ended April 30, 2013
| | | | | | | | | | | | | | | | |
| Class | | Sales Charge | | | | Six Months | | | Since
Inception
(5/14/12) | | | Gross
Expense
Ratio2 | |
| Investor Class Shares | | Maximum 4.5% Initial Sales Charge | | With sales charges Excluding sales charges | |
| –1.63
3.00 | %
| |
| 3.44
8.32 | %
| |
| 1.32
1.32 | %
|
| Class A Shares | | Maximum 4.5% Initial Sales Charge | | With sales charges Excluding sales charges | |
| –1.67
2.96 |
| |
| 3.46
8.33 |
| |
| 1.15
1.15 |
|
| Class C Shares | | Maximum 1% CDSC if Redeemed Within One Year of Purchase | | With sales charges Excluding sales charges | |
| 1.86
2.85 |
| |
| 7.04
8.04 |
| |
| 1.57
1.57 |
|
| Class I Shares | | No Sales Charge | | | | | 3.19 | | | | 8.73 | | | | 0.90 | |
| 1. | The performance table and graph do not reflect the deduction of taxes that a shareholder would pay on dividends, distributions or Fund share redemptions. Total returns reflect maximum applicable sales charges as indicated in the table above, changes in share price, and reinvestment of dividend and capital gain distributions. The graph assumes the initial investment amount shown above and reflects the deduction of all sales charges that would have applied for the period of investment. Performance |
| | figures reflect certain fee waivers and/or expense limitations, without which total returns may have been lower. For more information on share classes and current fee waivers and/or expense limitations, please refer to the notes to the financial statements. |
| 2. | The gross expense ratios presented reflect the Fund’s “Total Annual Fund Operating Expenses” from the most recent Prospectus and may differ from other expense ratios disclosed in this report. |
The footnotes on the next page are an integral part of the table and graph and should be carefully read in conjunction with them.
| | | | |
| mainstayinvestments.com | | | 5 | |
| | | | | | | | |
| Benchmark Performance | | Six
Months | | | Since
Inception | |
Barclays New York Municipal Bond Index3 | | | 1.54 | % | | | 4.02 | % |
Average Lipper New York Municipal Debt Fund4 | | | 1.75 | | | | 4.92 | |
| 3. | Barclays New York Municipal Bond Index is a market value-weighted index of New York investment grade tax exempt fixed-rate municipal bonds with maturities of one year or more. The Barclays New York Municipal Bond Index is the Fund’s broad-based securities market index for comparison purposes. Results assume the reinvestment of all dividends and capital gains. An investment cannot be made directly in an index. |
| 4. | The average Lipper New York municipal debt fund is representative of funds that, by portfolio practice, limit assets to those securities that are exempt |
| | from taxation in New York (double tax-exempt) or a city in New York (triple tax-exempt). This benchmark is a product of Lipper Inc. Lipper Inc. is an independent monitor of fund performance. Results are based on average total returns of similar funds with all dividend and capital gain distributions reinvested. |
The footnotes on the preceding page are an integral part of the table and graph and should be carefully read in conjunction with them.
| | |
| 6 | | MainStay New York Tax Free Opportunities Fund |
Cost in Dollars of a $1,000 Investment in MainStay New York Tax Free Opportunities Fund (Unaudited)
The example below is intended to describe the fees and expenses borne by shareholders during the six-month period from November 1, 2012, to April 30, 2013, and the impact of those costs on your investment.
Example
As a shareholder of the Fund, you incur two types of costs: (1) transaction costs, including exchange fees and sales charges (loads) on purchases (as applicable), and (2) ongoing costs, including management fees, distribution and/or service (12b-1) fees, and other Fund expenses (as applicable). This example is intended to help you understand your ongoing costs (in dollars) of investing in the Fund and to compare these costs with the ongoing costs of investing in other mutual funds. The example is based on an investment of $1,000 made at the beginning of the six-month period and held for the entire period from November 1, 2012, to April 30, 2013.
This example illustrates your Fund’s ongoing costs in two ways:
Actual Expenses
The second and third data columns in the table below provide information about actual account values and actual expenses. You may use the information in these columns, together with the amount you invested, to estimate the expenses that you paid during the six months ended April 30, 2013. Simply divide your account value by $1,000 (for example, an $8,600 account value divided by $1,000 = 8.6), then
multiply the result by the number under the heading entitled “Expenses Paid During Period” to estimate the expenses you paid on your account during this period.
Hypothetical Example for Comparison Purposes
The fourth and fifth data columns in the table below provide information about hypothetical account values and hypothetical expenses based on the Fund’s actual expense ratio and an assumed rate of return of 5% per year before expenses, which is not the Fund’s actual return. The hypothetical account values and expenses may not be used to estimate the actual ending account balances or expenses you paid for the six-month period shown. You may use this information to compare the ongoing costs of investing in the Fund with the ongoing costs of investing in other Funds. To do so, compare this 5% hypothetical example with the 5% hypothetical examples that appear in the shareholder reports of the other Funds.
Please note that the expenses shown in the table are meant to highlight your ongoing costs only and do not reflect any transactional costs, such as exchange fees or sales charges (loads). Therefore, the fourth and fifth data columns of the table are useful in comparing ongoing costs only and will not help you determine the relative total costs of owning different funds. In addition, if these transactional costs were included, your costs would have been higher.
| | | | | | | | | | | | | | | | | | | | |
| | | | | | | | | | | | | | | | |
| Share Class | | Beginning
Account
Value
11/1/12 | | | Ending Account
Value (Based
on Actual
Returns and
Expenses)
4/30/13 | | | Expenses
Paid
During
Period1 | | | Ending Account
Value (Based
on Hypothetical
5% Annualized
Return and
Actual Expenses)
4/30/13 | | | Expenses
Paid
During
Period1 | |
| | | | | |
| Investor Class Shares | | $ | 1,000.00 | | | $ | 1,030.00 | | | $ | 4.43 | | | $ | 1,020.40 | | | $ | 4.41 | |
| | | | | |
| Class A Shares | | $ | 1,000.00 | | | $ | 1,029.60 | | | $ | 3.77 | | | $ | 1,021.10 | | | $ | 3.76 | |
| | | | | |
| Class C Shares | | $ | 1,000.00 | | | $ | 1,028.60 | | | $ | 5.68 | | | $ | 1,019.20 | | | $ | 5.66 | |
| | | | | |
| Class I Shares | | $ | 1,000.00 | | | $ | 1,032.00 | | | $ | 2.52 | | | $ | 1,022.30 | | | $ | 2.51 | |
| 1. | Expenses are equal to the Fund’s annualized expense ratio of each class (0.88% for Investor Class, 0.75% for Class A, 1.13% for Class C and 0.50% for Class I) multiplied by the average account value over the period, divided by 365 and multiplied by 181 (to reflect the six-month period). The table above represents the actual expenses incurred during the six-month period. |
| | | | |
| mainstayinvestments.com | | | 7 | |
Industry Composition as of April 30, 2013 (Unaudited)
| | | | |
| Higher Education | | | 23.4 | % |
| Industrial Development / Pollution Control | | | 17.7 | |
| General Obligation | | | 8.9 | |
| Dedicated Tax | | | 7.2 | |
| Tobacco Settlement | | | 6.4 | |
| Hospital | | | 5.1 | |
| General | | | 4.0 | |
| Water | | | 4.0 | |
| Transportation | | | 3.5 | |
| Multi Family Housing | | | 3.3 | |
| Life Care | | | 3.1 | |
| | | | |
| Housing | | | 2.9 | % |
| Airport | | | 2.4 | |
| Public Power | | | 1.8 | |
| State General Obligation | | | 1.4 | |
| Utilities | | | 1.4 | |
| Charter School | | | 1.1 | |
| Unaffiliated Investment Company | | | 0.3 | |
| Appropriation | | | 0.2 | |
| Other Assets, Less Liabilities | | | 1.9 | |
| | | | |
| | | 100.0 | % |
| | | | |
See Portfolio of Investments beginning on page 11 for specific holdings within these categories.
Top Ten Holdings or Issuers Held as of April 30, 2013 (excluding short-term investment)
| 1. | New York City Trust for Cultural Resources, Wildlife Conservation Society, Revenue Bonds, 5.00%, due 8/1/33–8/1/42 |
| 2. | Build NYC Resource Corp., YMCA of Greater New York, Revenue Bonds, 5.00%, due 8/1/32–8/1/42 |
| 3. | New York Liberty Development Corp., World Trade Center, Revenue Bonds, 5.00%, due 9/15/43–3/15/44 |
| 4. | Build NYC Resource Corp., Royal Charter Properties, Revenue Bonds, 4.75%, due 12/15/32 |
| 5. | Ramapo Local Development Corp., Revenue Bonds, 5.00%, due 3/15/41 |
| 6. | Dutchess County Industrial Development Agency, Bard College, Revenue Bonds, 5.00%, due 8/1/46 |
| 7. | Niagara Falls Public Water Authority, Revenue Bonds, 5.00%, due 7/15/34 |
| 8. | Troy Capital Resource Corp., Rensselaer Polytechnic-A, Revenue Bonds, 5.00%–5.125%, due 9/1/30–9/1/40 |
| 9. | Westchester County Local Development Corp., Kendal on Hudson Project, Revenue Bonds, 5.00%, due 1/1/34 |
| 10. | New York Liberty Development Corp., Bank of America, Revenue Bonds, 5.625%–6.375%, due 7/15/47–7/15/49 |
| | |
| 8 | | MainStay New York Tax Free Opportunities Fund |
Portfolio Management Discussion and Analysis (Unaudited)
Questions answered by portfolio managers John Loffredo, CFA, Robert DiMella, CFA, Michael Petty, David Dowden and Scott Sprauer of MacKay Shields LLC, the Fund’s Subadvisor.
How did MainStay New York Tax Free Opportunities Fund perform relative to its peers and its benchmark during the six months ended April 30, 2013?
Excluding all sales charges, MainStay New York Tax Free Opportunities Fund returned 3.00% for Investor Class shares, 2.96% for Class A shares and 2.85% for Class C shares for the six months ended April 30, 2013. Over the same period, Class I shares returned 3.19%. All share classes outperformed the 1.75% return of the average Lipper1 New York municipal debt fund and the 1.54% return of the Barclays New York Municipal Bond Index2 for the six months ended April 30, 2013. The Barclays New York Municipal Bond Index is the Fund’s broad-based securities-market index. See page 5 for Fund returns with applicable sales charges.
What factors affected the Fund’s relative performance during the reporting period?
The Fund outperformed the Barclays New York Municipal Bond Index during the reporting period because of various factors, most notably the Fund’s overweight exposure to longer-term municipal bonds, its overweight exposure to credits rated A and BBB3 and its zero exposure to Puerto Rico bonds. During the reporting period, longer-term bonds outperformed shorter-term bonds, and credits rated A and BBB outperformed higher-quality credits. Puerto Rico bonds significantly underperformed the broad Barclays Municipal Bond Index.4
What was the Fund’s duration5 strategy during the reporting period?
The Fund’s duration remained in a neutral range relative to its investable universe as outlined in the Prospectus.
What specific factors, risks or market forces prompted significant decisions for the Fund during the reporting period?
During the reporting period, our view on the municipal market did not materially change. Our team’s assessment of the
municipal market was that the municipal yield curve6 was steep and that credit spreads7 for bonds rated A and BBB were wide. In addition, we maintained our negative view of any Puerto Rico–related issuers. As a result, the Fund continued to have overweight positions in longer-term premium-coupon bonds and lower-rated investment-grade bonds. The Fund had no exposure to Puerto Rico bonds.
During the reporting period, which market segments were the strongest positive contributors to the Fund’s performance and which market segments were particularly weak?
On an absolute basis, the most significant positive contributions to the Fund’s performance came from bonds rated A and BBB and from bonds with maturities of 20 years or more. (Contributions take weightings and total returns into account.) The decision to avoid securities issued by the Commonwealth of Puerto Rico also contributed positively to performance. During the reporting period, none of the market segments in which the Fund invested posted negative absolute returns.
Did the Fund make any significant purchases or sales during the reporting period?
Because of strong inflows during the reporting period, the Fund made significantly more purchases than sales. Purchases in the Fund were largely targeted toward increasing the Fund’s diversification and adding exposure to lower-rated investment-grade municipal bonds. We added a number of different higher-education and health care–related issuers to the Fund’s holdings. Sales in the Fund focused primarily on profit-taking. In light of the Fund’s broad diversification, however, no single transaction can be considered significant.
How did the Fund’s sector weightings change during the reporting period?
While there were changes in sector weightings during the reporting period, they were primarily the by-product of security-
| 1. | See footnote on page 6 for more information on Lipper Inc. |
| 2. | See footnote on page 6 for more information on the Barclays New York Municipal Bond Index. |
| 3. | An obligation rated ‘A’ by Standard & Poor’s (“S&P”) is deemed by S&P to be somewhat more susceptible to the adverse effects of changes in circumstances and economic conditions than obligation in higher-rated categories. In the opinion of S&P, however, the obligor’s capacity to meet its financial commitment on the obligation is still strong. An obligation rated ‘BBB’ by S&P is deemed by S&P to exhibit adequate protection parameters. It is the opinion of S&P, however, that adverse economic conditions or changing circumstances are more likely to lead to a weakened capacity of the obligor to meet its financial commitment on the obligation. When applied to Fund holdings, ratings are based solely on the creditworthiness of the bonds in the portfolio and are not meant to represent the security or safety of the Fund. |
| 4. | The Barclays Municipal Bond Index includes approximately 15,000 municipal bonds, rated Baa or better by Moody’s, with a maturity of at least two years. Bonds subject to the alternative minimum tax or with floating or zero coupons are excluded. The Barclays Municipal Bond Index is the Fund’s broad-based securities market index for comparison purposes. Total returns assume the reinvestment of all dividends and capital gains. An investment cannot be made directly in an index. |
| 5. | Duration is a measure of the price sensitivity of a fixed-income investment to changes in interest rates. Duration is expressed as a number of years and is considered a more accurate sensitivity gauge than average maturity. |
| 6. | The yield curve is a line that plots the yields of various securities of similar quality–typically U.S. Treasury issues–across a range of maturities. The U.S. Treasury yield curve serves as a benchmark for other debt and is used in economic forecasting. The municipal yield curve is said to be steep when the spread between short-term and long-term municipal bonds is large and the yields of intermediate-term municipal bonds remain within that spread. |
| 7. | The terms “spread” and “yield spread” may refer to the difference in yield between a security or type of security and comparable U.S. Treasury issues. The terms may also refer to the difference in yield between two specific securities or types of securities at a given time |
| | | | |
| mainstayinvestments.com | | | 9 | |
specific trades rather than expressions of any change in sector outlook or strategy.
How was the Fund positioned at the end of the reporting period?
As of April 30, 2013, the Fund was overweight relative to the Barclays New York Municipal Bond Index in the higher education sector and the industrial development revenue/pollution control revenue sector. These overweight allocations resulted from two strategic initiatives. First, the Fund sought to achieve a strong level of diversification; and to embed scarcity value8 into the Fund, we included issuers who typically come to market less frequently. Second, the Fund sought an array of economic development bonds that provided relatively high income,
exposure to mostly lower-rated investment-grade debt and exposure to a number of large issuers that are well-known names in the municipal market.
On the same date, the Fund held underweight positions relative to the Barclays New York Municipal Index in the special tax and local general obligation sectors. In our view, there have been a limited number of opportunities to add to the special tax sector in New York. We do, however, favor this sector, and we expect to add to it over time. The Fund’s underweight exposure to local general obligation bonds resulted primarily from the bonds’ relative value. We believed that local general obligation bonds tended to be highly rated or expensively priced during the reporting period, which made them unattractive candidates for the Fund.
| 8. | Scarcity value is value added to a security by desirable characteristics—such as atypical yield, unusual protective covenants or rare availability—that tend to be difficult to find in the marketplace. |
The opinions expressed are those of the portfolio managers as of the date of this report and are subject to change. There is no guarantee that any forecast made will come to pass. This material does not constitute investment advice and is not intended as an endorsement of any specific investment.
| | |
| 10 | | MainStay New York Tax Free Opportunities Fund |
Portfolio of Investments April 30, 2013 (Unaudited)
| | | | | | | | |
| | | Principal
Amount | | | Value | |
| | | | | | | | |
| Municipal Bonds 97.8% † | |
Airport 2.4% | |
New York City Industrial Development Agency, Terminal One Group Association Project, Revenue Bonds
5.50%, due 1/1/24 (a) | | $ | 500,000 | | | $ | 550,955 | |
Port Authority of New York & New Jersey, JFK International Airport, Revenue Bonds | | | | | | | | |
5.50%, due 12/1/31 | | | 600,000 | | | | 686,196 | |
6.00%, due 12/1/42 | | | 520,000 | | | | 610,366 | |
| | | | | | | | |
| | | | | | | 1,847,517 | |
| | | | | | | | |
Appropriation 0.2% | | | | | | | | |
Hudson Yards Infrastructure Corp., Revenue Bonds Series A, Insured: NATL-RE 4.50%, due 2/15/47 | | | 145,000 | | | | 150,059 | |
| | | | | | | | |
| | |
Charter School 1.1% | | | | | | | | |
Build NYC Resource Corp., Bronx Charter School For Excellence, Revenue Bonds Series A
5.50%, due 4/1/43 | | | 750,000 | | | | 835,492 | |
| | | | | | | | |
| | |
Dedicated Tax 7.2% | | | | | | | | |
Guam Government, Business Privilege Tax, Revenue Bonds
Series B-1
5.00%, due 1/1/42 | | | 1,200,000 | | | | 1,330,224 | |
Guam Government, Revenue Bonds
Series A
5.375%, due 12/1/24 | | | 1,000,000 | | | | 1,113,080 | |
New York City Transitional Finance Authority Future Tax Secured, Revenue Bonds
Series F-1
5.00%, due 5/1/28 | | | 500,000 | | | | 585,055 | |
New York Convention Center Development Corp., Hotel Unit, Revenue Bonds Insured: AMBAC
5.00%, due 11/15/44 | | | 115,000 | | | | 124,042 | |
Virgin Islands Public Finance Authority, Gross Receipts Taxes Loan, Revenue Bonds
Series A
5.00%, due 10/1/32 | | | 1,000,000 | | | | 1,119,880 | |
Virgin Islands Public Finance Authority, Matching Fund Loan Notes
Series A
5.00%, due 10/1/32 | | | 1,200,000 | | | | 1,343,856 | |
| | | | | | | | |
| | | | | | | 5,616,137 | |
| | | | | | | | |
| | | | | | | | |
| | | Principal
Amount | | | Value | |
| | | | | | | | |
General 4.0% | | | | | | | | |
¨Build NYC Resource Corp., YMCA of Greater New York, Revenue Bonds | | | | | | | | |
5.00%, due 8/1/32 | | $ | 1,000,000 | | | $ | 1,120,570 | |
5.00%, due 8/1/42 | | | 1,000,000 | | | | 1,124,790 | |
New York City Industrial Development Agency, Yankee Stadium, Revenue Bonds | | | | | | | | |
Insured: ASSURED GTY
(zero coupon), due 3/1/44 | | | 500,000 | | | | 120,790 | |
Insured: ASSURED GTY
(zero coupon), due 3/1/46 | | | 3,250,000 | | | | 702,585 | |
Insured: ASSURED GTY
(zero coupon), due 3/1/47 | | | 400,000 | | | | 81,996 | |
| | | | | | | | |
| | | | 3,150,731 | |
| | | | | | | | |
General Obligation 8.9% | | | | | | | | |
Genesee Valley Central School District at Angelica Belmont, General Obligation Insured: AGM
4.00%, due 6/15/30 | | | 665,000 | | | | 726,891 | |
Moravia Central School District, General Obligation
Insured: AGM | | | | | | | | |
4.00%, due 6/15/35 | | | 335,000 | | | | 351,787 | |
Insured: AGM
4.00%, due 6/15/36 | | | 345,000 | | | | 360,132 | |
Insured: AGM
4.00%, due 6/15/37 | | | 360,000 | | | | 372,143 | |
Nassau County, General Obligation
Series A
4.00%, due 4/1/27 | | | 1,000,000 | | | | 1,060,590 | |
Newburgh, Limited General Obligation
Series A
5.50%, due 6/15/31 | | | 500,000 | | | | 529,375 | |
Oyster Bay Public Improvement, Unlimited General Obligation
Series B
4.00%, due 12/1/20 | | | 100,000 | | | | 113,089 | |
¨Ramapo Local Development Corp., Revenue Bonds
Insured: MUN GOVT GTD
5.00%, due 3/15/41 | | | 2,000,000 | | | | 2,183,080 | |
Suffolk County Industrial Development Agency, Westhampton Free Association Library, Revenue Bonds
Insured: AMBAC
5.00%, due 6/15/17 | | | 315,000 | | | | 348,847 | |
Village of Harrison, NY, Public Improvement, General Obligation | | | | | | | | |
5.00%, due 12/15/24 | | | 395,000 | | | | 488,196 | |
5.00%, due 12/15/25 | | | 365,000 | | | | 443,844 | |
| | | | | | | | |
| | | | 6,977,974 | |
| | | | | | | | |
| † | Percentages indicated are based on Fund net assets. |
| ¨ | | Among the Fund’s 10 largest holdings or issuers held, as of April 30, 2013. May be subject to change daily. |
| | | | | | |
The notes to the financial statements are an integral part of,
and should be read in conjunction with, the financial statements. | | mainstayinvestments.com | | | 11 | |
Portfolio of Investments April 30, 2013 (Unaudited) (continued)
| | | | | | | | |
| | | Principal
Amount | | | Value | |
| | | | | | | | |
| Municipal Bonds (continued) | |
Higher Education 23.4% | | | | | | | | |
Buffalo & Erie County Industrial Land Development Corp., Buffalo State College Foundation Housing, Revenue Bonds
Series: A
5.375%, due 10/1/41 | | $ | 855,000 | | | $ | 982,549 | |
¨Dutchess County Industrial Development Agency, Bard College, Revenue Bonds
Series A-1
5.00%, due 8/1/46 | | | 2,015,000 | | | | 2,118,067 | |
Dutchess County Local Development Corp., Marist College Project, Revenue Bonds
Series A
5.00%, due 7/1/39 | | | 1,000,000 | | | | 1,131,490 | |
Geneva Development Corp., Hobart & William Smith College, Revenue Bonds
5.00%, due 9/1/32 | | | 1,500,000 | | | | 1,745,970 | |
Hempstead Town Local Development Corp., Adelphi University Project, Revenue Bonds
Series B
5.25%, due 2/1/39 | | | 475,000 | | | | 526,690 | |
Madison County Capital Resource Corp., Colgate University Project, Revenue Bonds
Series A
5.00%, due 7/1/29 | | | 1,000,000 | | | | 1,197,800 | |
Monroe County Industrial Development Corp., John Fisher College, Revenue Bonds
Series A
5.00%, due 6/1/24 | | | 330,000 | | | | 380,652 | |
New York City Industrial Development Agency, Polytechnic University Project, Revenue Bonds
Insured: ACA
5.25%, due 11/1/37 | | | 340,000 | | | | 365,762 | |
New York City Industrial Development Agency, Vaughn College of Aeronautics & Technology, Revenue Bonds
Series B
5.25%, due 12/1/36 | | | 500,000 | | | | 523,560 | |
New York State Dormitory Authority, Catholic Health System Obligation Group, Revenue Bonds
Series B
5.00%, due 7/1/32 | | | 390,000 | | | | 421,067 | |
Series A 5.00%, due 7/1/32 | | | 600,000 | | | | 647,796 | |
New York State Dormitory Authority, Culinary Institute of America, Revenue Bonds
5.00%, due 7/1/42 | | | 250,000 | | | | 271,318 | |
| | | | | | | | |
| | | Principal
Amount | | | Value | |
| | | | | | | | |
Higher Education (continued) | | | | | | | | |
New York State Dormitory Authority, Miriam Osborn Memorial Home, Revenue Bonds
5.00%, due 7/1/42 | | $ | 500,000 | | | $ | 538,250 | |
New York State Dormitory Authority, North Shore Long Island Jewish Obligated Group, Revenue Bonds
Series B
5.00%, due 5/1/39 | | | 1,500,000 | | | | 1,676,775 | |
New York State Dormitory Authority, Pace University, Revenue Bonds | | | | | | | | |
Series A
5.00%, due 5/1/29 | | | 1,100,000 | | | | 1,238,732 | |
Series A
5.00%, due 5/1/38 | | | 500,000 | | | | 544,975 | |
Onondaga Civic Development Corp., Le Moyne College, Revenue Bonds
5.00%, due 7/1/42 | | | 525,000 | | | | 574,003 | |
Orange County Funding Corp., Mount St. Mary College, Revenue Bonds | | | | | | | | |
Series A
3.25%, due 7/1/32 | | | 500,000 | | | | 471,115 | |
Series B
3.25%, due 7/1/32 | | | 500,000 | | | | 476,425 | |
St. Lawrence County Industrial Development Agency, Clarkson University Project, Revenue Bonds
5.375%, due 9/1/41 | | | 500,000 | | | | 575,245 | |
¨Troy Capital Resource Corp., Rensselaer Polytechnic-A, Revenue Bonds | | | | | | | | |
5.00%, due 9/1/30 | | | 465,000 | | | | 526,631 | |
5.125%, due 9/1/40 | | | 1,285,000 | | | | 1,428,239 | |
| | | | | | | | |
| | | | | | | 18,363,111 | |
| | | | | | | | |
Hospital 5.1% | | | | | | | | |
¨Build NYC Resource Corp., Royal Charter Properties, Revenue Bonds
Insured: AGM
4.75%, due 12/15/32 | | | 2,000,000 | | | | 2,210,460 | |
Monroe County Industrial Development Corp., Rochester General Hospital, Revenue Bonds
Series A
5.00%, due 12/1/32 | | | 540,000 | | | | 613,235 | |
Onondaga Civic Development Corp., St. Joseph Hospital Health Center, Revenue Bonds
4.50%, due 7/1/32 | | | 1,000,000 | | | | 1,007,420 | |
Westchester County Healthcare Corp., Revenue Bonds
Series A
4.50%, due 11/1/26 | | | 125,000 | | | | 136,251 | |
| | | | | | | | |
| | | | | | | 3,967,366 | |
| | | | | | | | |
| | | | |
| 12 | | MainStay New York Tax Free Opportunities Fund | | The notes to the financial statements are an integral part of,
and should be read in conjunction with, the financial statements. |
| | | | | | | | |
| | | Principal
Amount | | | Value | |
| | | | | | | | |
| Municipal Bonds (continued) | |
Housing 2.9% | | | | | | | | |
New York Mortgage Agency, Revenue Bonds Series 48
3.70%, due 10/1/38 | | $ | 250,000 | | | $ | 253,595 | |
New York State Housing Finance Agency, Affordable Housing, Revenue Bonds
Series B
4.85%, due 11/1/41 | | | 1,000,000 | | | | 1,105,000 | |
Southampton Housing Authority, Revenue Bonds | | | | | | | | |
3.00%, due 5/15/32 | | | 425,000 | | | | 414,728 | |
3.125%, due 5/15/35 | | | 315,000 | | | | 302,586 | |
3.25%, due 5/15/37 | | | 200,000 | | | | 193,498 | |
| | | | | | | | |
| | | | | | | 2,269,407 | |
| | | | | | | | |
Industrial Development / Pollution Control 17.7% | |
New York City Industrial Development Agency, Liberty Interactive Corp., Revenue Bonds
5.00%, due 9/1/35 | | | 700,000 | | | | 728,756 | |
New York City Industrial Development Agency, Revenue Bonds
Series A
5.00%, due 7/1/28 (a) | | | 1,000,000 | | | | 1,068,160 | |
¨New York City Trust for Cultural Resources, Wildlife Conservation Society, Revenue Bonds | | | | | | | | |
Series A
5.00%, due 8/1/33 | | | 1,000,000 | | | | 1,198,310 | |
Series A
5.00%, due 8/1/42 | | | 1,975,000 | | | | 2,295,740 | |
New York Liberty Development Corp., 4 World Trade Center Project, Revenue Bonds
5.75%, due 11/15/51 | | | 1,500,000 | | | | 1,782,030 | |
¨New York Liberty Development Corp., Bank of America, Revenue Bonds | | | | | | | | |
Class 2
5.625%, due 7/15/47 | | | 1,050,000 | | | | 1,214,577 | |
Class 3
6.375%, due 7/15/49 | | | 545,000 | | | | 653,057 | |
New York Liberty Development Corp., Goldman Sachs Headquarter, Revenue Bonds
5.25%, due 10/1/35 | | | 1,020,000 | | | | 1,213,453 | |
New York Liberty Development Corp., Goldman Sachs Headquarters, Revenue Bonds
5.50%, due 10/1/37 | | | 365,000 | | | | 450,151 | |
| | | | | | | | |
| | | Principal
Amount | | | Value | |
| | | | | | | | |
Industrial Development / Pollution Control (continued) | |
¨New York Liberty Development Corp., World Trade Center, Revenue Bonds | | | | | | | | |
Class 2
5.00%, due 9/15/43 | | $ | 1,040,000 | | | $ | 1,142,679 | |
Class 3
5.00%, due 3/15/44 | | | 1,000,000 | | | | 1,080,640 | |
Niagara Area Development Corp., Covanta Energy Project, Revenue Bonds
5.25%, due 11/1/42 (a) | | | 1,000,000 | | | | 1,040,800 | |
| | | | | | | | |
| | | | | | | 13,868,353 | |
| | | | | | | | |
Life Care 3.1% | | | | | | | | |
Tompkins County Development Corp., Kendall at Ithaca, Inc. Project, Revenue Bonds
4.50%, due 7/1/42 | | | 500,000 | | | | 505,030 | |
¨Westchester County Local Development Corp., Kendal on Hudson Project, Revenue Bonds
5.00%, due 1/1/34 | | | 1,750,000 | | | | 1,925,210 | |
| | | | | | | | |
| | | | | | | 2,430,240 | |
| | | | | | | | |
Multi Family Housing 3.3% | | | | | | | | |
Housing Development Corp., College of Staten Island Residence, Revenue Bonds Insured: AGM
4.10%, due 7/1/42 | | | 1,000,000 | | | | 1,043,960 | |
Housing Development Corp., Revenue Bonds | | | | | | | | |
Series D-1-A
4.00%, due 5/1/32 | | | 1,000,000 | | | | 1,034,260 | |
Series D-1-B
4.20%, due 5/1/37 | | | 500,000 | | | | 522,925 | |
| | | | | | | | |
| | | | | | | 2,601,145 | |
| | | | | | | | |
Public Power 1.8% | | | | | | | | |
Guam Power Authority, Revenue Bonds | | | | | | | | |
Series A,
Insured: AGM
5.00%, due 10/1/30 | | | 250,000 | | | | 288,207 | |
Series A
5.00%, due 10/1/34 | | | 1,000,000 | | | | 1,110,130 | |
| | | | | | | | |
| | | | | | | 1,398,337 | |
| | | | | | | | |
State General Obligation 1.4% | | | | | | | | |
Guam Government, Unlimited General Obligation
Series A
7.00%, due 11/15/39 | | | 1,000,000 | | | | 1,137,860 | |
| | | | | | | | |
|
Tobacco Settlement 6.4% | |
Guam Economic Development & Commerce Authority, Tobacco Settlement Asset Backed, Revenue Bonds
5.625%, due 6/1/47 | | | 675,000 | | | | 606,697 | |
| | | | | | |
The notes to the financial statements are an integral part of,
and should be read in conjunction with, the financial statements. | | mainstayinvestments.com | | | 13 | |
Portfolio of Investments April 30, 2013 (Unaudited) (continued)
| | | | | | | | |
| | | Principal
Amount | | | Value | |
| | | | | | | | |
| Municipal Bonds (continued) | |
Tobacco Settlement (continued) | |
Nassau County Tobacco Settlement Corp., Asset-Backed, Revenue Bonds | | | | | | | | |
Series A-3
5.00%, due 6/1/35 | | $ | 1,000,000 | | | $ | 869,630 | |
Series A-3
5.125%, due 6/1/46 | | | 1,000,000 | | | | 853,500 | |
New York Counties Tobacco Trust IV, Settlement Pass Through, Revenue Bonds
Series A
5.00%, due 6/1/42 | | | 485,000 | | | | 419,220 | |
Suffolk Tobacco Asset Securitization Corp., Revenue Bonds
Series B
5.25%, due 6/1/37 | | | 1,000,000 | | | | 1,078,990 | |
TSASC, Inc., Revenue Bonds | | | | | | | | |
Series 1
5.00%, due 6/1/34 | | | 1,205,000 | | | | 1,093,959 | |
Series 1
5.125%, due 6/1/42 | | | 145,000 | | | | 128,358 | |
| | | | | | | | |
| | | | | | | 5,050,354 | |
| | | | | | | | |
Transportation 3.5% | | | | | | | | |
Metropolitan Transportation Authority, Transportation, Revenue Bonds
Series B
5.00%, due 11/15/43 | | | 1,500,000 | | | | 1,681,680 | |
Triborough Bridge & Tunnel Authority, Revenue Bonds
5.25%, due 11/15/30 | | | 1,020,000 | | | | 1,047,754 | |
| | | | | | | | |
| | | | | | | 2,729,434 | |
| | | | | | | | |
Utilities 1.4% | |
New York City Municipal Water Finance Authority, Second General Fiscal, Revenue Bonds
Series BB
5.00%, due 6/15/47 | | | 1,000,000 | | | | 1,139,480 | |
| | | | | | | | |
|
Water 4.0% | |
Guam Government, Waterworks Authority, Revenue Bonds
5.875%, due 7/1/35 | | | 1,000,000 | | | | 1,036,210 | |
¨Niagara Falls Public Water Authority, Revenue Bonds Insured:NATL-RE
5.00%, due 7/15/34 | | | 2,090,000 | | | | 2,105,090 | |
| | | | | | | | |
| | | | | | | 3,141,300 | |
| | | | | | | | |
Total Municipal Bonds
(Cost $74,183,220) | | | | | | | 76,674,297 | |
| | | | | | | | |
| | | | | | | | |
| | |
Shares | | | Value | |
| Unaffiliated Investment Company 0.3% | |
New York 0.3% | | | | | | | | |
Nuveen New York AMT-Free Municipal Income Fund | | | 17,036 | | | $ | 250,259 | |
| | | | | | | | |
Total Unaffiliated Investment Company
(Cost $255,425) | | | | | | | 250,259 | |
| | | | | | | | |
Total Investments
(Cost $74,438,645) (d) | | | 98.1 | % | | | 76,924,556 | |
Other Assets, Less Liabilities | | | 1.9 | | | | 1,509,860 | |
Net Assets | | | 100.0 | % | | $ | 78,434,416 | |
| | |
| | | | | | | | |
| | | | | | | | |
| | | Contracts
Short | | | Unrealized
Appreciation
(Depreciation) (b) | |
| Futures Contracts (0.2%) | |
United States Treasury Notes
June 2013 (10 Year) (c) | | | (85 | ) | | $ | (155,603 | ) |
United States Treasury Ultra Long-Term Bonds
June 2013 (c) | | | (16 | ) | | | (5,970 | ) |
Total Futures Contracts
(Settlement Value $13,709,547) | | | | | | $ | (161,573 | ) |
| (a) | Interest on these securities is subject to alternative minimum tax. |
| (b) | Represents the difference between the value of the contracts at the time they were opened and the value as of April 30, 2013. |
| (c) | As of April 30, 2013, cash in the amount of $133,500 is on deposit with the broker for futures transactions. |
| (d) | As of April 30, 2013, cost is $74,438,645 for federal income tax purposes and net unrealized appreciation is as follows: |
| | | | |
Gross unrealized appreciation | | $ | 2,604,319 | |
Gross unrealized depreciation | | | (118,408 | ) |
| | | | |
Net unrealized appreciation | | $ | 2,485,911 | |
| | | | |
The following abbreviations are used in the above portfolio:
ACA—ACA Financial Guaranty Corp.
AGM—Assured Guaranty Municipal Corp.
AMBAC—Ambac Assurance Corp.
GTY—Assured Guaranty Corp.
NATL-RE—National Public Finance Guarantee Corp.
| | | | |
| 14 | | MainStay New York Tax Free Opportunities Fund | | The notes to the financial statements are an integral part of,
and should be read in conjunction with, the financial statements. |
The following is a summary of the fair valuations according to the inputs used as of April 30, 2013, for valuing the Fund’s assets and liabilities.
Asset Valuation Inputs
| | | | | | | | | | | | | | | | |
Description | | Quoted
Prices in
Active
Markets for
Identical
Assets (Level 1) | | | Significant
Other
Observable
Inputs (Level 2) | | | Significant
Unobservable
Inputs
(Level 3) | | | Total | |
| Investments in Securities (a) | | | | | | | | | | | | | | | | |
| Municipal Bonds | | $ | — | | | $ | 76,674,297 | | | $ | — | | | $ | 76,674,297 | |
| Unaffiliated Investment Companies | | | 250,259 | | | | — | | | | — | | | | 250,259 | |
| | | | | | | | | | | | | | | | |
| Total Investments in Securities | | $ | 250,259 | | | $ | 76,674,297 | | | $ | — | | | $ | 76,924,556 | |
| | | | | | | | | | | | | | | | |
Liability Valuation Inputs
| | | | | | | | | | | | | | | | |
Description | | Quoted
Prices in
Active
Markets for
Identical
Assets (Level 1) | | | Significant
Other
Observable
Inputs
(Level 2) | | | Significant
Unobservable
Inputs
(Level 3) | | | Total | |
| Other Financial Instruments | | | | | | | | | | | | | | | | |
Futures Contracts Short (b) | | $ | (161,573 | ) | | $ | — | | | $ | — | | | $ | (161,573 | ) |
| | | | | | | | | | | | | | | | |
| Total Other Financial Instruments | | $ | (161,573 | ) | | $ | — | | | $ | — | | | $ | (161,573 | ) |
| | | | | | | | | | | | | | | | |
| (a) | For a complete listing of investments and their industries, see the Portfolio of Investments. |
| (b) | The value listed for this security reflects unrealized appreciation (depreciation) as shown on the Portfolio of Investments. |
The Fund recognizes transfers between the levels as of the beginning of the period.
For the period ended April 30, 2013, the Fund did not have any transfers between Level 1 and Level 2 fair value measurements. (See Note 2)
As of April 30, 2013, the Fund did not hold any investments with significant unobservable inputs (Level 3). (See Note 2)
| | | | | | |
The notes to the financial statements are an integral part of,
and should be read in conjunction with, the financial statements. | | mainstayinvestments.com | | | 15 | |
Statement of Assets and Liabilities as of April 30, 2013 (Unaudited)
| | | | |
| Assets | |
Investment in securities, at value
(identified cost $74,438,645) | | $ | 76,924,556 | |
Cash | | | 199,886 | |
Cash collateral on deposit at broker | | | 133,500 | |
Receivables: | | | | |
Dividends and interest | | | 999,579 | |
Fund shares sold | | | 255,046 | |
Variation margin on futures contracts | | | 11,469 | |
Other assets | | | 9,433 | |
| | | | |
Total assets | | | 78,533,469 | |
| | | | |
| |
| Liabilities | | | | |
Payables: | | | | |
Professional fees | | | 25,160 | |
Manager (See Note 3) | | | 22,037 | |
Fund shares redeemed | | | 16,387 | |
NYLIFE Distributors (See Note 3) | | | 5,170 | |
Transfer agent (See Note 3) | | | 1,639 | |
Custodian | | | 366 | |
Trustees | | | 63 | |
Accrued expenses | | | 14,497 | |
Dividend payable | | | 13,734 | |
| | | | |
Total liabilities | | | 99,053 | |
| | | | |
Net assets | | $ | 78,434,416 | |
| | | | |
| |
| Composition of Net Assets | | | | |
Shares of beneficial interest outstanding (par value of $.001 per share) unlimited number of shares authorized | | $ | 7,486 | |
Additional paid-in capital | | | 75,879,462 | |
| | | | |
| | | 75,886,948 | |
Undistributed net investment income | | | 540 | |
Accumulated net realized gain (loss) on investments and futures transactions | | | 222,590 | |
Net unrealized appreciation (depreciation) on investments and futures contracts | | | 2,324,338 | |
| | | | |
Net assets | | $ | 78,434,416 | |
| | | | |
| | | | |
Investor Class | | | | |
Net assets applicable to outstanding shares | | $ | 89,733 | |
| | | | |
Shares of beneficial interest outstanding | | | 8,564 | |
| | | | |
Net asset value per share outstanding | | $ | 10.48 | |
Maximum sales charge (4.50% of offering price) | | | 0.49 | |
| | | | |
Maximum offering price per share outstanding | | $ | 10.97 | |
| | | | |
Class A | | | | |
Net assets applicable to outstanding shares | | $ | 18,954,197 | |
| | | | |
Shares of beneficial interest outstanding | | | 1,809,824 | |
| | | | |
Net asset value per share outstanding | | $ | 10.47 | |
Maximum sales charge (4.50% of offering price) | | | 0.49 | |
| | | | |
Maximum offering price per share outstanding | | $ | 10.96 | |
| | | | |
Class C | | | | |
Net assets applicable to outstanding shares | | $ | 3,469,387 | |
| | | | |
Shares of beneficial interest outstanding | | | 331,161 | |
| | | | |
Net asset value and offering price per share outstanding | | $ | 10.48 | |
| | | | |
Class I | | | | |
Net assets applicable to outstanding shares | | $ | 55,921,099 | |
| | | | |
Shares of beneficial interest outstanding | | | 5,336,240 | |
| | | | |
Net asset value and offering price per share outstanding | | $ | 10.48 | |
| | | | |
| | | | |
| 16 | | MainStay New York Tax Free Opportunities Fund | | The notes to the financial statements are an integral part of,
and should be read in conjunction with, the financial statements. |
Statement of Operations for the six months ended April 30, 2013 (Unaudited)
| | | | |
| Investment Income (Loss) | |
Income | | | | |
Interest | | $ | 1,339,331 | |
Dividends | | | 10,258 | |
| | | | |
Total income | | | 1,349,589 | |
| | | | |
Expenses | | | | |
Manager (See Note 3) | | | 162,226 | |
Professional fees | | | 24,013 | |
Distribution/Service—Investor Class (See Note 3) | | | 89 | |
Distribution/Service—Class A (See Note 3) | | | 11,399 | |
Distribution/Service—Class C (See Note 3) | | | 4,892 | |
Registration | | | 9,875 | |
Offering (See Note 2) | | | 7,417 | |
Transfer agent (See Note 3) | | | 6,871 | |
Shareholder communication | | | 3,904 | |
Custodian | | | 2,909 | |
Trustees | | | 698 | |
Miscellaneous | | | 3,625 | |
| | | | |
Total expenses before waiver/reimbursement | | | 237,918 | |
Expense waiver/reimbursement from Manager (See Note 3) | | | (57,239 | ) |
| | | | |
Net expenses | | | 180,679 | |
| | | | |
Net investment income (loss) | | | 1,168,910 | |
| | | | |
|
Realized and Unrealized Gain (Loss)
on Investments and Futures Contracts | |
Net realized gain (loss) on: | | | | |
Security transactions | | | 190,827 | |
Futures transactions | | | 31,845 | |
| | | | |
Net realized gain (loss) on investments and futures transactions | | | 222,672 | |
| | | | |
Net change in unrealized appreciation (depreciation) on: | | | | |
Investments | | | 762,515 | |
Futures contracts | | | (183,923 | ) |
| | | | |
Net change in unrealized appreciation (depreciation) on investments and futures contracts | | | 578,592 | |
| | | | |
Net realized and unrealized gain (loss) on investments and futures transactions | | | 801,264 | |
| | | | |
Net increase (decrease) in net assets resulting from operations | | $ | 1,970,174 | |
| | | | |
| | | | | | |
The notes to the financial statements are an integral part of,
and should be read in conjunction with, the financial statements. | | mainstayinvestments.com | | | 17 | |
Statements of Changes in Net Assets
for the six months ended April 30, 2013 (Unaudited) and for the period May 14, 2012 (Inception Date) through October 31, 2012
| | | | | | | | |
| | | 2013 | | | 2012 | |
| Increase (Decrease) in Net Assets | |
Operations: | | | | | | | | |
Net investment income (loss) | | $ | 1,168,910 | | | $ | 788,114 | |
Net realized gain (loss) on investments and futures transactions | | | 222,672 | | | | 214,392 | |
Net change in unrealized appreciation (depreciation) on investments and futures contracts | | | 578,592 | | | | 1,745,746 | |
| | | | |
Net increase (decrease) in net assets resulting from operations | | | 1,970,174 | | | | 2,748,252 | |
| | | | |
Dividends and distributions to shareholders: | | | | | | | | |
From net investment income: | | | | | | | | |
Investor Class | | | (1,162 | ) | | | (878 | ) |
Class A | | | (148,865 | ) | | | (16,393 | ) |
Class C | | | (28,267 | ) | | | (3,590 | ) |
Class I | | | (989,053 | ) | | | (768,816 | ) |
| | | | |
| | | (1,167,347 | ) | | | (789,677 | ) |
| | | | |
From net realized gain on investments: | | | | | | | | |
Investor Class | | | (220 | ) | | | — | |
Class A | | | (13,757 | ) | | | — | |
Class C | | | (3,988 | ) | | | — | |
Class I | | | (195,969 | ) | | | — | |
| | | | |
| | | (213,934 | ) | | | — | |
| | | | |
Total dividends and distributions to shareholders | | | (1,381,281 | ) | | | (789,677 | ) |
| | | | |
Capital share transactions: | | | | | | | | |
Net proceeds from sale of shares | | | 21,283,759 | | | | 52,954,966 | |
Net asset value of shares issued to shareholders in reinvestment of dividends and distributions | | | 1,351,025 | | | | 785,782 | |
Cost of shares redeemed | | | (434,181 | ) | | | (54,403 | ) |
| | | | |
Increase (decrease) in net assets derived from capital share transactions | | | 22,200,603 | | | | 53,686,345 | |
| | | | |
Net increase (decrease) in net assets | | | 22,789,496 | | | | 55,644,920 | |
|
| Net Assets | |
Beginning of period | | | 55,644,920 | | | | — | |
| | | | |
End of period | | $ | 78,434,416 | | | $ | 55,644,920 | |
| | | | |
Undistributed (distribution in excess of) net investment income at end of period | | $ | 540 | | | $ | (1,023 | ) |
| | | | |
| | | | |
| 18 | | MainStay New York Tax Free Opportunities Fund | | The notes to the financial statements are an integral part of,
and should be read in conjunction with, the financial statements. |
Financial Highlights selected per share data and ratios
| | | | | | | | |
| | | Investor Class | |
| | | Six months
ended
April 30, | | | May 14,
2012**
through
October 31, | |
| | | 2013* | | | 2012 | |
Net asset value at beginning of period | | $ | 10.38 | | | $ | 10.00 | |
| | | | | | | | |
Net investment income (loss) | | | 0.23 | | | | 0.13 | |
Net realized and unrealized gain (loss) on investments | | | 0.14 | | | | 0.38 | |
| | | | | | | | |
Total from investment operations | | | 0.37 | | | | 0.51 | |
| | | | | | | | |
Less dividends and distributions: | | | | | | | | |
From net investment income | | | (0.23 | ) | | | (0.13 | ) |
From net realized gain on investments | | | (0.04 | ) | | | — | |
| | | | | | | | |
Total dividends and distributions | | | (0.27 | ) | | | (0.13 | ) |
| | | | | | | | |
Net asset value at end of period | | $ | 10.48 | | | $ | 10.38 | |
| | | | | | | | |
Total investment return (a)(b) | | | 3.00 | % | | | 5.16 | % |
Ratios (to average net assets)/Supplemental Data: | | | | | | | | |
Net investment income (loss) | | | 3.31 | %†† | | | 3.18 | %†† |
Net expenses | | | 0.88 | %†† | | | 0.92 | %†† |
Expenses (before waiver/reimbursement) | | | 1.06 | %†† | | | 1.30 | %†† |
Portfolio turnover rate | | | 22 | % | | | 67 | % |
Net assets at end of period (in 000’s) | | $ | 90 | | | $ | 56 | |
| (a) | Total investment return is calculated exclusive of sales charges and assumes the reinvestment of dividends and distributions. |
| (b) | Total investment return is not annualized. |
| | | | | | | | |
| | | Class A | |
| | | Six months
ended
April 30, | | | May 14,
2012**
through
October 31, | |
| | | 2013* | | | 2012 | |
Net asset value at beginning of period | | $ | 10.38 | | | $ | 10.00 | |
| | | | | | | | |
Net investment income (loss) | | | 0.25 | | | | 0.14 | |
Net realized and unrealized gain (loss) on investments | | | 0.13 | | | | 0.38 | |
| | | | | | | | |
Total from investment operations | | | 0.38 | | | | 0.52 | |
| | | | | | | | |
Less dividends and distributions: | | | | | | | | |
From net investment income | | | (0.25 | ) | | | (0.14 | ) |
From net realized gain on investments | | | (0.04 | ) | | | — | |
| | | | | | | | |
Total dividends and distributions | | | (0.29 | ) | | | (0.14 | ) |
| | | | | | | | |
Net asset value at end of period | | $ | 10.47 | | | $ | 10.38 | |
| | | | | | | | |
Total investment return (a)(b) | | | 2.96 | % | | | 5.22 | % |
Ratios (to average net assets)/Supplemental Data: | | | | | | | | |
Net investment income (loss) | | | 3.30 | %†† | | | 3.46 | %†† |
Net expenses | | | 0.75 | %†† | | | 0.75 | %†† |
Expenses (before waiver/reimbursement) | | | 0.93 | %†† | | | 1.13 | %†† |
Portfolio turnover rate | | | 22 | % | | | 67 | % |
Net assets at end of period (in 000’s) | | $ | 18,954 | | | $ | 2,368 | |
| (a) | Total investment return is calculated exclusive of sales charges and assumes the reinvestment of dividends and distributions. |
| (b) | Total investment return is not annualized. |
| | | | | | |
The notes to the financial statements are an integral part of,
and should be read in conjunction with, the financial statements. | | mainstayinvestments.com | | | 19 | |
Financial Highlights selected per share data and ratios
| | | | | | | | |
| | | Class C | |
| | | Six months
ended
April 30, | | | May 14,
2012**
through
October 31, | |
| | | 2013* | | | 2012 | |
Net asset value at beginning of period | | $ | 10.38 | | | $ | 10.00 | |
| | | | | | | | |
Net investment income (loss) | | | 0.16 | | | | 0.12 | |
Net realized and unrealized gain (loss) on investments | | | 0.14 | | | | 0.38 | |
| | | | | | | | |
Total from investment operations | | | 0.30 | | | | 0.50 | |
| | | | | | | | |
Less dividends and distributions: | | | | | | | | |
From net investment income | | | (0.16 | ) | | | (0.12 | ) |
From net realized gain on investments | | | (0.04 | ) | | | — | |
| | | | | | | | |
Total dividends and distributions | | | (0.20 | ) | | | (0.12 | ) |
| | | | | | | | |
Net asset value at end of period | | $ | 10.48 | | | $ | 10.38 | |
| | | | | | | | |
Total investment return (a)(b) | | | 2.85 | % | | | 5.03 | % |
Ratios (to average net assets)/Supplemental Data: | | | | | | | | |
Net investment income (loss) | | | 2.91 | %†† | | | 2.96 | %†† |
Net expenses | | | 1.13 | %†† | | | 1.17 | %†† |
Expenses (before waiver/reimbursement) | | | 1.31 | %†† | | | 1.55 | %†† |
Portfolio turnover rate | | | 22 | % | | | 67 | % |
Net assets at end of period (in 000’s) | | $ | 3,469 | | | $ | 601 | |
| (a) | Total investment return is calculated exclusive of sales charges and assumes the reinvestment of dividends and distributions. |
| (b) | Total investment return is not annualized. |
| | | | | | | | |
| | | Class I | |
| | | Six months
ended
April 30, | | | May 14,
2012**
through
October 31, | |
| | | 2013* | | | 2012 | |
Net asset value at beginning of period | | $ | 10.38 | | | $ | 10.00 | |
| | | | | | | | |
Net investment income (loss) | | | 0.19 | | | | 0.15 | |
Net realized and unrealized gain (loss) on investments | | | 0.14 | | | | 0.38 | |
| | | | | | | | |
Total from investment operations | | | 0.33 | | | | 0.53 | |
| | | | | | | | |
Less dividends and distributions: | | | | | | | | |
From net investment income | | | (0.19 | ) | | | (0.15 | ) |
From net realized gain on investments | | | (0.04 | ) | | | — | |
| | | | | | | | |
Total dividends and distributions | | | (0.23 | ) | | | (0.15 | ) |
| | | | | | | | |
Net asset value at end of period | | $ | 10.48 | | | $ | 10.38 | |
| | | | | | | | |
Total investment return (a)(b) | | | 3.19 | % | | | 5.36 | % |
Ratios (to average net assets)/Supplemental Data: | | | | | | | | |
Net investment income (loss) | | | 3.69 | %†† | | | 3.21 | %†† |
Net expenses | | | 0.50 | %†† | | | 0.50 | %†† |
Expenses (before waiver/reimbursement) | | | 0.68 | %†† | | | 0.88 | %†† |
Portfolio turnover rate | | | 22 | % | | | 67 | % |
Net assets at end of period (in 000’s) | | $ | 55,921 | | | $ | 52,619 | |
| (a) | Total investment return is calculated exclusive of sales charges and assumes the reinvestment of dividends and distributions. Class I shares are not subject to sales charges. |
| (b) | Total investment return is not annualized. |
| | | | |
| 20 | | MainStay New York Tax Free Opportunities Fund | | The notes to the financial statements are an integral part of,
and should be read in conjunction with, the financial statements. |
Notes to Financial Statements (Unaudited)
Note 1–Organization and Business
MainStay Funds Trust (the “Trust”) was organized as a Delaware statutory trust on April 28, 2009, and is governed by a Declaration of Trust. The Trust is registered under the Investment Company Act of 1940, as amended (the “1940 Act”), as an open-end investment management company, and is comprised of thirty-three funds (collectively referred to as the “Funds”). These financial statements and notes relate only to the MainStay New York Tax Free Opportunities Fund (the “Fund”), a diversified fund.
The Fund currently offers four classes of shares. Investor Class, Class A, Class C and Class I shares. The inception date was on May 14, 2012. Investor Class and Class A shares are offered at net asset value (“NAV”) per share plus an initial sales charge. No sales charge applies to investments of $500,000 or more (and certain other qualified purchases) in Investor Class and Class A shares, but a contingent deferred sales charge (“CDSC”) is imposed on certain redemptions made within one year of the date of purchase. Class C shares are offered at NAV without an initial sales charge, although a 1.00% CDSC may be imposed on redemptions made within one year of the date of purchase of Class C shares. Class I shares are offered at NAV and are not subject to a sales charge. Depending upon eligibility, Investor Class shares may convert to Class A shares, and Class A shares may convert to Investor Class shares. The four classes of shares have the same voting (except for issues that relate solely to one class), dividend, liquidation and other rights, and the same terms and conditions, except that Class C shares are subject to higher distribution and/or service fee rates than Investor Class and Class A shares under a distribution plan pursuant to Rule 12b-1 under the 1940 Act. Class I shares are not subject to a distribution and/or service fee.
The Fund’s investment objective is to seek current income exempt from federal and New York state and, in some cases, New York local income taxes.
Note 2–Significant Accounting Policies
The Fund prepares its financial statements in accordance with generally accepted accounting principles (“GAAP”) in the United States of America and follows the significant accounting policies described below.
(A) Securities Valuation. Investments are valued as of the close of regular trading on the New York Stock Exchange (“Exchange”) (generally 4:00 p.m. Eastern time) on each day the Fund is open for business (“valuation date”).
The Board of Trustees (the “Board”) has adopted procedures for the valuation of the Fund’s securities and has delegated the responsibility for valuation determination under those procedures to the Valuation Committee of the Fund (the “Valuation Committee”). The Board has authorized the Valuation Committee to appoint a Valuation Sub-Committee (the “Sub-Committee”) to deal in the first instance with questions that arise or cannot be resolved under these procedures. The Sub-Committee meets (in person, via electronic mail or via teleconference) on an as-needed basis. The Valuation Committee meets at a later time, as necessary, to ensure that actions taken by the Sub-Committee were appropriate. The procedures recognize that, subject to the oversight of the Board and unless otherwise noted, the responsibility
for day-to-day valuation of portfolio assets (including securities for which market prices are not readily available) rests with New York Life Investment Management LLC ( “New York Life Investments” or the “Manager”), aided to whatever extent necessary by the Subadvisor (as defined in Note 3(A)) of the Fund.
To assess the appropriateness of security valuations, the Manager or the Fund’s third party service provider who is subject to oversight by the Manager, regularly compares prior day prices, prices on comparable securities and the sale prices to the prior and current day prices and challenges prices exceeding certain tolerance levels with third party pricing services or broker sources. For those securities valued by recommendation, whether through a standardized fair valuation methodology or a fair valuation determination, the Valuation Committee reviews and affirms the reasonableness of the valuation based on such methodologies and determinations on a regular basis after considering all relevant information that is reasonably available.
“Fair value” is defined as the price that the Fund would receive upon selling an investment in an orderly transaction to an independent buyer in the principal or most advantageous market of the investment. Fair value measurements are determined within a framework that has established a three-tier hierarchy which maximizes the use of observable market data and minimizes the use of unobservable inputs to establish classification of fair value measurements for disclosure purposes. “Inputs” refers broadly to the assumptions that market participants would use in pricing the asset or liability, including assumptions about risk, such as the risk inherent in a particular valuation technique used to measure fair value using a pricing model and/or the risk inherent in the inputs for the valuation technique. Inputs may be observable or unobservable. Observable inputs reflect the assumptions market participants would use in pricing the asset or liability based on market data obtained from sources independent of the Fund. Unobservable inputs reflect the Fund’s own assumptions about the assumptions market participants would use in pricing the asset or liability developed based on the information available in the circumstances. The inputs or methodology used for valuing securities may not be an indication of the risks associated with investing in those securities. The three-tier hierarchy of inputs is summarized in the three broad Levels listed below.
| • | | Level 1—quoted prices in active markets for identical investments |
| • | | Level 2—other significant observable inputs (including quoted prices for similar investments in active markets, interest rates and yield curves, prepayment speeds, credit risks, etc.) |
| • | | Level 3—significant unobservable inputs (including the Fund’s own assumptions about the assumptions that market participants would use in determining the fair value of investments) |
The aggregate value by input level, as of April 30, 2013, for the Fund’s investments is included at the end of the Fund’s Portfolio of Investments.
The valuation techniques used by the Fund to measure fair value maximize the use of observable inputs and minimize the use of unobservable
| | | | |
| mainstayinvestments.com | | | 21 | |
Notes to Financial Statements (Unaudited) (continued)
inputs. The Fund may utilize third party vendor evaluations, whose prices may be derived from one or more of the following standard inputs:
| | |
• Benchmark Yields | | • Reported Trades |
• Broker Dealer Quotes | | • Issuer Spreads |
• Two-sided markets | | • Benchmark securities |
• Bids / Offers | | • Reference Data (corporate actions or material event notices) |
• Industry and economic events | | • Comparable bonds |
• Equity and credit default swap curves | | • Monthly payment information |
Securities for which market values cannot be determined using the methodologies described above are valued by methods deemed in good faith by the Fund’s Valuation Committee, following the procedures established by the Board, to represent fair value. Under these procedures, the Fund primarily employs a market-based approach which may use related or comparable assets or liabilities, recent transactions, market multiples, book values, and other relevant information. The Fund may also use an income-based valuation approach in which the anticipated future cash flows of the investment are discounted to calculate fair value. Discounts may also be applied due to the nature or duration of any restrictions on the disposition of the investments. Due to the inherent uncertainty of valuations of such investments, the fair values may differ significantly from the values that would have been used had an active market existed. For the six-month period ended April 30, 2013, there have been no changes to the fair value methodologies.
Equity and non-equity securities which may be valued in this manner include, but are not limited to: (i) a security for which the trading has been halted or suspended; (ii) a debt security that has recently gone into default and for which there is not a current market quotation; (iii) a security of an issuer that has entered into a restructuring; (iv) a security that has been de-listed from a national exchange; (v) a security for which the market price is not available from a third party pricing source or, if so provided, does not, in the opinion of the Fund’s Manager or Subadvisor reflect the security’s market value; and (vi) a security whose principal market has been temporarily closed at a time when, under normal conditions, it would be open. Securities for which market quotations or observable inputs are not readily available are generally categorized as Level 3 in the hierarchy. As of April 30, 2013, the Fund did not hold any securities that were fair valued in such a manner.
Futures contracts are valued at the last posted settlement price on the market where such futures are primarily traded. Investments in other mutual funds are valued at their respective NAVs as of the close of the Exchange on the valuation date. These securities are generally categorized as Level 1 in the hierarchy.
Debt securities are valued at the evaluated mean prices supplied by a pricing agent or broker selected by the Fund’s Manager in consultation with the Fund’s Subadvisor whose prices reflect broker/dealer supplied valuations and electronic data processing techniques, if such prices are deemed by the Fund’s Manager, in consultation with the Fund’s Subadvisor, to be representative of market values, at the regular close of trading of the Exchange on each valuation date. Debt securities, including corporate bonds, U.S. government and federal agency bonds, municipal bonds, foreign bonds, Yankee bonds, convertible bonds,
asset-backed securities and mortgage-backed securities are generally categorized as Level 2 in the hierarchy.
Temporary cash investments acquired over 60 days to maturity are valued using the latest bid prices or using valuations based on a matrix system (which considers such factors as security prices, yields, maturities, and ratings), both as furnished by independent pricing services. Other temporary cash investments which mature in 60 days or less (“Short-Term Investments”) are valued at amortized cost. The amortized cost method involves valuing a security at its cost on the date of purchase and thereafter assuming a constant amortization to maturity of the difference between such cost and the value on maturity date. Amortized cost approximates the current fair value of a security. Securities valued at amortized cost are not valued using a quoted price in an active market. These securities are generally categorized as Level 2 in the hierarchy.
Generally, a security is considered illiquid if it cannot be sold or disposed of in the ordinary course of business at approximately the price at which it is valued. Its illiquidity might prevent the sale of such security at a time when the Manager or Subadvisor might wish to sell, and these securities could have the effect of decreasing the overall level of a Fund’s liquidity. Further, the lack of an established secondary market may make it more difficult to value illiquid securities, requiring the Fund to rely on judgments that may be somewhat subjective in determining value, which could vary from the amount that the Fund could realize upon disposition. Difficulty in selling illiquid securities may result in a loss or may be costly to the Fund. Under the supervision of the Board, the Manager or Subadvisor determines the liquidity of the Fund’s investments; in doing so, the Manager or Subadvisor may consider various factors, including (i) the frequency of trades and quotations, (ii) the number of dealers and prospective purchasers, (iii) dealer undertakings to make a market, and (iv) the nature of the security and the market in which it trades (e.g., the time needed to dispose of the security, the method of soliciting offers and the mechanics of transfer). Illiquid securities generally will be valued in good faith in such a manner as the Board deems appropriate to reflect their fair value.
(B) Income Taxes. The Fund’s policy is to comply with the requirements of the Internal Revenue Code of 1986, as amended (the “Internal Revenue Code”), applicable to regulated investment companies and to distribute all of the taxable income to the shareholders of the Fund within the allowable time limits. Therefore, no federal, state and local income tax provision is required.
Management evaluates its tax positions to determine if the tax positions taken meet the minimum recognition threshold in connection with accounting for uncertainties in income tax positions taken or expected to be taken for the purposes of measuring and recognizing tax liabilities in the financial statements. Recognition of tax benefits of an uncertain tax position is required only when the position is “more likely than not” to be sustained assuming examination by taxing authorities. Management has analyzed the Fund’s tax positions taken on federal, state and local income tax returns for all open tax years (for up to three tax years), and has concluded that no provision for federal, state and local income tax is required in the Fund’s financial statements. The Fund’s federal, state and local income and federal excise tax returns for tax years for which the applicable statutes of limitations have not expired are subject to
| | |
| 22 | | MainStay New York Tax Free Opportunities Fund |
examination by the Internal Revenue Service and state and local departments of revenue.
(C) Dividends and Distributions to Shareholders. Dividends and distributions are recorded on the ex-dividend date. The Fund intends to declare dividends of net investment income, if any, at least daily and intends to pay them at least monthly and declares and pays distributions of net realized capital gains, if any, at least annually. Unless the shareholder elects otherwise, all dividends and distributions are reinvested in the same class of shares of the Fund, at NAV. Dividends and distributions to shareholders are determined in accordance with federal income tax regulations and may differ from GAAP.
(D) Security Transactions and Investment Income. The Fund records security transactions on the trade date. Realized gains and losses on security transactions are determined using the identified cost method. Interest income is accrued as earned using the effective interest rate method. Discounts and premiums on securities purchased, other than Short-Term Investments, for the Fund are accreted and amortized, respectively, on the effective interest rate method over the life of the respective securities or, in the case of a callable security, over the period to the first date of call. Discounts and premiums on Short-Term Investments are accreted and amortized, respectively, on the straight-line method.
Investment income and realized and unrealized gains and losses on investments of the Fund are allocated to separate classes of shares pro rata based upon their relative net assets on the date the income is earned or realized and unrealized gains and losses are incurred.
(E) Expenses. Expenses of the Trust are allocated to the individual Funds in proportion to the net assets of the respective Funds when the expenses are incurred, except where direct allocations of expenses can be made. Expenses (other than transfer agent expenses and fees incurred under the shareholder services plans and the distribution plans further discussed in Note 3(B)) are allocated to separate classes of shares pro rata based upon their relative net assets on the date the expenses are incurred. The expenses borne by the Fund, including those of related parties to the Fund, are shown in the Statement of Operations.
(F) Use of Estimates. In preparing financial statements in conformity with GAAP, management makes estimates and assumptions that affect the reported amounts and disclosures in the financial statements. Actual results could differ from those estimates.
(G) Futures Contracts. A futures contract is an agreement to purchase or sell a specified quantity of an underlying instrument at a specified future date and price, or to make or receive a cash payment based on the value of a financial instrument (e.g., foreign currency, interest rate, security, or securities index). The Fund is subject to equity price risk and/or interest rate risk in the normal course of investing in these transactions. During the period the futures contract is open, changes in the value of the contract are recognized as unrealized appreciation or depreciation by ‘‘marking-to-market’’ such contract on a daily basis to reflect the market value of the contract at the end of each day’s trading. The Fund agrees to receive from or pay to the broker an amount of cash equal to the daily fluctuation in the value of the contract. Such receipts or payments are known as ‘‘variation margin.’’ When the futures contract is closed, the Fund records a realized gain or loss equal
to the difference between the proceeds from (or cost of) the closing transaction and the Fund’s basis in the contract.
The use of futures contracts involves, to varying degrees, elements of market risk in excess of the amount recognized in the Statement of Assets and Liabilities. The contract or notional amounts and variation margin reflect the extent of the Fund’s involvement in open futures positions. Risks arise from the possible imperfect correlation in movements in the price of futures contracts, interest rates and the underlying hedged assets, and the possible inability of counterparties to meet the terms of their contracts. However, the Fund’s activities in futures contracts have minimal counterparty risk as they are conducted through regulated exchanges that guarantee the futures against default by the counterparty. The Fund may invest in futures contracts to help manage the duration and yield curve of the portfolio while minimizing the exposure to wider bid/ask spreads in traditional bonds. The Fund’s investment in futures contracts and other derivatives may increase the volatility of the Fund’s NAV and may result in a loss to the Fund.
(H) Offering Costs. Costs incurred by the Fund in connection with the commencement of the Fund’s operations. These costs are being amortized on a straight line basis over twelve months.
(I) Securities Lending. In order to realize additional income, the Fund may engage in securities lending, subject to the limitations set forth in the 1940 Act and relevant guidance by the staff of the Securities and Exchange Commission. In the event the Fund does engage in securities lending, the Fund will lend through its custodian, State Street Bank and Trust Company (“State Street”). State Street will manage the Fund’s cash collateral in accordance with the lending agreement between the Fund and State Street, and indemnify the Fund’s portfolio against counterparty risk. The loans will be collateralized by cash or securities at least equal at all times to the market value of the securities loaned. Collateral will consist of U.S. Government securities, cash equivalents or irrevocable letters of credit. The Fund may bear the risk of delay in recovery of, or loss of rights in, the securities loaned should the borrower of the securities experience financial difficulty. The Fund may also record realized gain or loss on securities deemed sold due to a borrower’s inability to return securities on loan. The Fund will receive compensation for lending its securities in the form of fees or the retention of a portion of the interest on the investment of any cash received as collateral. The Fund also will continue to receive interest and dividends on the securities loaned and any gain or loss in the market price of the securities loaned that may occur during the term of the loan will be for the account of the Fund.
Although the Fund and New York Life Investments have temporarily suspended securities lending, the Fund and New York Life Investments reserve the right to reinstitute lending when deemed appropriate. The Fund did not have any portfolio securities on loan as of April 30, 2013.
(J) Concentration of Risk. The ability of issuers of debt securities held by the Fund to meet their obligations may be affected by economic or political developments in a specific industry or region. Because the Fund’s principal investments include municipal bonds issued by or on behalf of the State of New York, and its political subdivisions, agencies and instrumentalities, events in New York will affect the Fund’s investments and performance. These events may include fiscal or political policy changes, tax base erosion, budget deficits and other financial diffi-
| | | | |
| mainstayinvestments.com | | | 23 | |
Notes to Financial Statements (Unaudited) (continued)
culties. New York continues to experience financial difficulties due to the economic environment. The further deterioration of New York’s fiscal situation and economic situation of its municipalities could cause greater volatility and increase the risk of investing in New York.
(K) Indemnifications. Under the Trust’s organizational documents, its officers and trustees are indemnified against certain liabilities that may arise out of performance of their duties to the Trust. Additionally, in the normal course of business, the Fund enters into contracts with third-party service providers that contain a variety of representations and warranties and which may provide general indemnifications. The Fund’s maximum exposure under these arrangements is unknown, as this would involve future claims that may be made against the Fund that have not yet occurred. Based on experience, management is of the view that the risk of loss in connection with these potential indemnification obligations is remote. However, there can be no assurance that material liabilities related to such obligations will not arise in the future, which could adversely impact the Fund.
(L) Quantitative Disclosure of Derivative Holdings. The following tables show additional disclosures about the Fund’s derivative and hedging activities, including how such activities are accounted for and their effect on the Fund’s financial positions, performance and cash flows. These derivatives are not accounted for as hedging instruments.
Fair value of derivatives instruments as of April 30, 2013:
Liability Derivatives
| | | | | | | | | | |
| | | Statement of
Assets and
Liabilities
Location | | Interest
Rate
Contracts
Risk | | | Total | |
Futures Contracts | | Net Assets-Net unrealized appreciation (depreciation) on investments and futures contracts (a) | | $ | 161,573 | | | $ | 161,573 | |
| | | | | | | | | | |
Total Fair Value | | $ | 161,573 | | | $ | 161,573 | |
| | | | | | | | | | |
| (a) | Includes cumulative appreciation (depreciation) of futures contracts as reported in the Portfolio of Investments. Only current day’s variation margin is reported within the Statement of Assets and Liabilities. |
The effect of derivative instruments on the Statement of Operations for the period ended April 30, 2013:
Realized Gain (Loss)
| | | | | | | | | | |
| | | Statement of
Operations Location | | Interest
Rate
Contracts
Risk | | | Total | |
Futures Contracts | | Net realized gain (loss) on futures transactions | | $ | 31,845 | | | $ | 31,845 | |
| | | | | | | | | | |
Total Realized Gain (Loss) | | $ | 31,845 | | | $ | 31,845 | |
| | | | | | | | | | |
Change in Unrealized Appreciation (Depreciation)
| | | | | | | | | | |
| | | Statement of
Operations Location | | Interest
Rate
Contracts
Risk | | | Total | |
Futures Contracts | | Net change in unrealized appreciation (depreciation) on futures contracts | | $ | (183,923 | ) | | $ | (183,923 | ) |
| | | | | | | | | | |
Total Change in Unrealized Appreciation (Depreciation) | | $ | (183,923 | ) | | $ | (183,923 | ) |
| | | | | | | | | | |
Number of Contracts, Notional Amounts or Shares/Units (1)
| | | | | | | | |
| | | Interest
Rate
Contracts
Risk | | | Total | |
Futures Contracts Short | | | (88 | ) | | | (88 | ) |
| | | | | | | | |
| (1) | Amount disclosed represents the weighted average held during the period ended April 30, 2013. |
Note 3–Fees and Related Party Transactions
(A) Manager and Subadvisor. New York Life Investments, a registered investment adviser and an indirect, wholly-owned subsidiary of New York Life Insurance Company (“New York Life”), serves as the Fund’s Manager, pursuant to an Amended and Restated Management Agreement (“Management Agreement”). The Manager provides offices, conducts clerical, recordkeeping and bookkeeping services, and keeps most of the financial and accounting records required to be maintained by the Fund. Except for the portion of salaries and expenses that are the responsibility of the Fund, the Manager pays the salaries and expenses of all personnel affiliated with the Fund and certain operational expenses of the Fund. The Fund reimburses New York Life Investments in an amount equal to a portion of the salary of the Chief Compliance Officer (“CCO”) of the Fund. MacKay Shields LLC (“MacKay Shields” or the ‘‘Subadvisor’’), a registered investment adviser and an indirect, wholly-owned subsidiary of New York Life, serves as Subadvisor to the Fund and is responsible for the day-to-day portfolio management of the Fund. Pursuant to the terms of an Amended and Restated Subadvisory Agreement (“Subadvisory Agreement”) between New York Life Investments and MacKay Shields, New York Life Investments pays for the services of the Subadvisor.
The Fund pays the Manager a monthly fee for services performed and facilities furnished at an annual rate of 0.50% of the Fund’s average daily net assets. New York Life Investments has contractually agreed to waive a portion of its management fee so that the management fee does not exceed 0.45% of the Fund’s average daily net assets. This agreement will remain in effect until February 28, 2014, and shall renew automatically for one-year terms unless New York Life Investments provides written notice of termination prior to the start of the next term or upon approval of the Board.
New York Life Investments has contractually agreed to waive fees and/or reimburse expenses so that Total Annual Fund Operating Expenses for Class A shares do not exceed 0.75% of its average daily net assets.
| | |
| 24 | | MainStay New York Tax Free Opportunities Fund |
New York Life Investments will apply an equivalent waiver or reimbursement, in an equal number of basis points, to the other share classes of the Fund. This agreement will remain in effect until February 28, 2014, and shall renew automatically for one-year terms unless New York Life Investments provides written notice of termination prior to the start of the next term or upon approval of the Board. Total Annual Fund Operating Expenses excludes taxes, interest, litigation, extraordinary expenses, brokerage and other transaction expenses relating to the purchase or sale of portfolio investments, and acquired (underlying) fund fees and expenses.
For the six-month period ended April 30, 2013, New York Life Investments earned fees from the Fund in the amount of $162,226 and waived its fees and/or reimbursed expenses in the amount of $57,239.
State Street Bank, 1 Lincoln Street, Boston, Massachusetts 02111, provides sub-administration and sub-accounting services to the Fund pursuant to an agreement with New York Life Investments. These services include calculating the daily NAVs of the Fund, maintaining the general ledger and sub-ledger accounts for the calculation of the Fund’s respective NAVs, and assisting New York Life Investments in conducting various aspects of the Fund’s administrative operations. For providing these services to the Fund, State Street is compensated by New York Life Investments.
(B) Distribution and Service Fees. The Trust, on behalf of the Fund, has entered into a distribution agreement with NYLIFE Distributors LLC (the ‘‘Distributor’’), an indirect, wholly-owned subsidiary of New York Life. The Fund has adopted distribution plans (the ‘‘Plans’’) in accordance with the provisions of Rule 12b-1 under the 1940 Act.
Pursuant to the Investor Class and Class A Plans, the Distributor receives a monthly distribution fee from Investor Class and Class A shares at an annual rate of 0.25% of the average daily net assets of the Investor Class and Class A shares for distribution and/or service activities as designated by the Distributor. Pursuant to the Class C Plan, Class C shares pay the Distributor a monthly distribution fee at an annual rate of 0.25% of the average daily net assets of the Class C shares, along with a service fee at an annual rate of 0.25% of the average daily net assets of the Class C shares, for a total 12b-1 fee of 0.50%. Class I shares are not subject to a distribution and/or service fee.
The Plans provide that the distribution and service fees are payable to the Distributor regardless of the amounts actually expended by the Distributor for distribution of the Fund’s shares and service activities.
(C) Sales Charges. The Fund was advised by the Distributor that the amount of sales charges retained on sales of Investor Class and Class A shares were $462 and $4,562, respectively, for the six-month period ended April 30, 2013. The Fund was also advised that the Distributor retained CDSCs on redemptions of Class C shares of $441 for the six-month period ended April 30, 2013.
(D) Transfer, Dividend Disbursing and Shareholder Servicing Agent. NYLIM Service Company LLC, an affiliate of New York Life Investments, is the Fund’s transfer, dividend disbursing and shareholder servicing agent pursuant to an agreement between NYLIM Service Company LLC and the Trust. NYLIM Service Company LLC has entered into an agreement with Boston Financial Data Services, Inc. (“BFDS”) pursuant to which BFDS performs certain transfer agent
services on behalf of NYLIM Service Company LLC. Transfer agent expenses incurred by the Fund for the six-month period ended April 30, 2013, were as follows:
| | | | |
Investor Class | | $ | 50 | |
Class A | | | 767 | |
Class C | | | 1,411 | |
Class I | | | 4,643 | |
(E) Small Account Fee. Shareholders with small accounts adversely impact the cost of providing transfer agency services. In an effort to reduce total transfer agency expenses, the Fund has implemented a small account fee on certain types of accounts. Certain shareholders with an account balance of less than $1,000 are charged an annual per account fee of $20 (assessed semi-annually), the proceeds from which offset transfer agent fees as reflected in the Statement of Operations.
(F) Capital. As of April 30, 2013, New York Life and its affiliates beneficially held shares of the Fund with values and percentages of net assets as follows:
| | | | | | | | |
Investor Class | | $ | 27,004 | | | | 30.1 | % |
Class A | | | 27,005 | | | | 0.1 | |
Class C | | | 26,940 | | | | 0.8 | |
Class I | | | 54,114,074 | | | | 96.8 | |
Note 4–Federal Income Tax
The tax character of distributions paid during the year ended October 31, 2012, shown in the Statements of Changes in Net Assets was as follows:
| | | | |
| | | 2012 | |
Distributions paid from: | | | | |
Ordinary Income | | $ | 4,142 | |
Exempt Interest Dividends | | | 785,535 | |
Total | | $ | 789,677 | |
Note 5–Custodian
State Street is the custodian of the cash and the securities of the Fund. Custodial fees are charged to the Fund based on the market value of securities in the Fund and the number of certain cash transactions incurred by the Fund.
Note 6–Line of Credit
The Fund and certain affiliated funds maintain a line of credit with a syndicate of banks in order to secure a source of funds for temporary purposes to meet unanticipated or excessive redemption requests.
Effective August 29, 2012, under a second amended and restated credit agreement (the “Credit Agreement”), the aggregate commitment amount is $200,000,000 with an optional maximum amount of $250,000,000. The commitment fee is an annual rate of 0.08% of the average commitment amount payable quarterly, regardless of usage, to Bank of New York Mellon, which serves as the agent to the syndicate. The commitment fee is allocated among the Fund and certain affiliated funds based upon net assets and other factors. Interest on any revolving
| | | | |
| mainstayinvestments.com | | | 25 | |
Notes to Financial Statements (Unaudited) (continued)
credit loan is charged based upon the Federal Funds Advances rate or the one month London InterBank Offered Rate, whichever is higher. The Credit Agreement expires on August 28, 2013, although the Fund, certain affiliated funds and the syndicate of banks may renew the Credit Agreement for an additional year on the same or different terms. There were no borrowings made or outstanding with respect to the Fund on the Credit Agreement during the six-month period ended April 30, 2013.
Note 7–Purchases and Sales of Securities (in 000’s)
During the six-month period ended April 30, 2013, purchases and sales of securities, other than short-term securities, were $35,551 and $14,282, respectively.
Note 8–Capital Share Transactions
| | | | | | | | |
Investor Class (a) | | Shares | | | Amount | |
Six-month period ended April 30, 2013: | | | | | | | | |
Shares sold | | | 8,675 | | | $ | 90,376 | |
Shares issued to shareholders in reinvestment of dividends and distributions | | | 129 | | | | 1,354 | |
Shares redeemed | | | (7,263 | ) | | | (75,604 | ) |
| | | | |
Net increase (decrease) in shares outstanding before conversion | | | 1,541 | | | | 16,126 | |
Shares converted into Investor Class (See Note 1) | | | 1,583 | | | | 16,414 | |
| | | | |
Net increase (decrease) | | | 3,124 | | | $ | 32,540 | |
| | | | |
Year ended October 31, 2012: | | | | | | | | |
Shares sold | | | 9,363 | | | $ | 94,659 | |
Shares issued to shareholders in reinvestment of dividends | | | 78 | | | | 799 | |
Net increase (decrease) in shares outstanding before conversion | | | 9,441 | | | | 95,458 | |
Shares converted from Investor Class (See Note 1) | | | (4,001 | ) | | | (41,127 | ) |
| | | | |
Net increase (decrease) | | | 5,440 | | | $ | 54,331 | |
| | | | |
| | |
| | | | | | | | |
Class A (a) | | Shares | | | Amount | |
Six-month period ended April 30, 2013: | | | | | | | | |
Shares sold | | | 1,595,935 | | | $ | 16,650,562 | |
Shares issued to shareholders in reinvestment of dividends and distributions | | | 14,021 | | | | 146,728 | |
Shares redeemed | | | (26,780 | ) | | | (280,085 | ) |
| | | | |
Net increase (decrease) in shares outstanding before conversion | | | 1,583,176 | | | | 16,517,205 | |
Shares converted from Class A (See Note 1) | | | (1,584 | ) | | | (16,414 | ) |
| | | | |
Net increase (decrease) | | | 1,581,592 | | | $ | 16,500,791 | |
| | | | |
Year ended October 31, 2012: | | | | | | | | |
Shares sold | | | 227,441 | | | $ | 2,325,421 | |
Shares issued to shareholders in reinvestment of dividends | | | 1,419 | | | | 14,665 | |
Shares redeemed | | | (4,629 | ) | | | (47,814 | ) |
| | | | |
Net increase (decrease) in shares outstanding before conversion | | | 224,231 | | | | 2,292,272 | |
Shares converted into Class A (See Note 1) | | | 4,001 | | | | 41,127 | |
| | | | |
Net increase (decrease) | | | 228,232 | | | $ | 2,333,399 | |
| | | | |
| | |
| | | | | | | | |
| | | | | | | | |
Class C (a) | | Shares | | | Amount | |
Six-month period ended April 30, 2013: | | | | | | | | |
Shares sold | | | 276,758 | | | $ | 2,900,989 | |
Shares issued to shareholders in reinvestment of dividends and distributions | | | 2,354 | | | | 24,656 | |
Shares redeemed | | | (5,859 | ) | | | (61,171 | ) |
| | | | |
Net increase (decrease) | | | 273,253 | | | $ | 2,864,474 | |
| | | | |
Year ended October 31, 2012: | | | | | | | | |
Shares sold | | | 58,400 | | | $ | 594,931 | |
Shares issued to shareholders in reinvestment of dividends | | | 145 | | | | 1,502 | |
Shares redeemed | | | (637 | ) | | | (6,589 | ) |
| | | | |
Net increase (decrease) | | | 57,908 | | | $ | 589,844 | |
| | | | |
| | |
| | | | | | | | |
Class I (a) | | Shares | | | Amount | |
Six-month period ended April 30, 2013: | | | | | | | | |
Shares sold | | | 156,851 | | | $ | 1,641,832 | |
Shares issued to shareholders in reinvestment of dividends and distributions | | | 112,233 | | | | 1,178,287 | |
Shares redeemed | | | (1,662 | ) | | | (17,321 | ) |
| | | | |
Net increase (decrease) | | | 267,422 | | | $ | 2,802,798 | |
| | | | |
Year ended October 31, 2012: | | | | | | | | |
Shares sold | | | 4,993,974 | | | $ | 49,939,955 | |
Shares issued to shareholders in reinvestment of dividends | | | 74,844 | | | | 768,816 | |
| | | | |
Net increase (decrease) | | | 5,068,818 | | | $ | 50,708,771 | |
| | | | |
| (a) | The inception date of the Fund was May 14, 2012. |
Note 9–Subsequent Events
In connection with the preparation of the financial statements of the Fund as of and for the six-month period ended April 30, 2013, events and transactions subsequent to April 30, 2013, through the date the financial statements were issued have been evaluated by the Fund’s management for possible adjustment and/or disclosure. No subsequent events requiring financial statement adjustment or disclosure have been identified.
| | |
| 26 | | MainStay New York Tax Free Opportunities Fund |
Proxy Voting Policies and Procedures
and Proxy Voting Record
A description of the policies and procedures that New York Life Investments uses to vote proxies related to the Fund’s securities is available without charge, upon request, (i) by visiting the Fund’s website at mainstayinvestments.com; or (ii) on the SEC’s website at www.sec.gov.
The Fund is required to file with the SEC its proxy voting record for the 12-month period ending June 30 on Form N-PX. The Fund’s most recent Form N-PX is available free of charge upon request (i) by calling 800-MAINSTAY (624-6782); (ii) by visiting the Fund’s website at mainstayinvestments.com; or (iii) on the SEC’s website at www.sec.gov.
Shareholder Reports and Quarterly Portfolio Disclosure
The Fund is required to file its complete schedule of portfolio holdings with the SEC for its first and third fiscal quarters on Form N-Q. The Fund’s Form N-Q is available without charge on the SEC’s website at www.sec.gov or by calling MainStay Investments at 800-MAINSTAY (624-6782). You also can obtain and review copies of Form N-Q by visiting the SEC’s Public Reference Room in Washington, DC (information on the operation of the Public Reference Room may be obtained by calling 1-800-SEC-0330).
| | | | |
| mainstayinvestments.com | | | 27 | |
This page intentionally left blank
This page intentionally left blank
This page intentionally left blank
MainStay Funds
MainStay offers a wide range of Funds for virtually any investment need. The full array of MainStay open-end offerings is listed here, with information about the manager, subadvisors, legal counsel and independent registered public accounting firms.
Equity
U.S. Equity Funds
MainStay Common Stock Fund
MainStay Cornerstone Growth Fund
MainStay Epoch U.S. All Cap Fund
MainStay Epoch U.S. Equity Yield Fund
MainStay ICAP Equity Fund
MainStay ICAP Select Equity Fund
MainStay Large Cap Growth Fund1
MainStay MAP Fund
MainStay S&P 500 Index Fund
MainStay U.S. Equity Opportunities Fund
MainStay U.S. Small Cap Fund
International/Global Equity Funds
MainStay Epoch Global Choice Fund
MainStay Epoch Global Equity Yield Fund
MainStay Epoch International Small Cap Fund
MainStay ICAP Global Fund
MainStay ICAP International Fund
MainStay International Equity Fund
MainStay International Opportunities Fund
Income
Taxable Bond Funds
MainStay Floating Rate Fund
MainStay Global High Income Fund
MainStay Government Fund
MainStay High Yield Corporate Bond Fund
MainStay High Yield Opportunities Fund
MainStay Indexed Bond Fund
MainStay Intermediate Term Bond Fund
MainStay Short Duration High Yield Fund
MainStay Short Term Bond Fund
MainStay Unconstrained Bond Fund
Municipal Bond Funds
MainStay California Tax Free Opportunities Fund2
MainStay High Yield Municipal Bond Fund
MainStay New York Tax Free Opportunities Fund3
MainStay Tax Free Bond Fund
Money Market Fund
MainStay Money Market Fund
Mixed Asset
MainStay Balanced Fund
MainStay Convertible Fund
MainStay Income Builder Fund
MainStay Marketfield Fund
Asset Allocation/Target Date
MainStay Conservative Allocation Fund
MainStay Growth Allocation Fund
MainStay Moderate Allocation Fund
MainStay Moderate Growth Allocation Fund
MainStay Retirement 2010 Fund
MainStay Retirement 2020 Fund
MainStay Retirement 2030 Fund
MainStay Retirement 2040 Fund
MainStay Retirement 2050 Fund
Manager
New York Life Investment Management LLC
New York, New York
Subadvisors
Cornerstone Capital Management Holdings LLC4
New York, New York
Cornerstone Capital Management LLC4
Bloomington, Minnesota
Epoch Investment Partners, Inc.
New York, New York
Institutional Capital LLC4
Chicago, Illinois
MacKay Shields LLC4
New York, New York
Marketfield Asset Management LLC
New York, New York
Markston International LLC
White Plains, New York
Winslow Capital Management LLC
Minneapolis, Minnesota
Legal Counsel
Dechert LLP
Independent Registered Public Accounting Firms
KPMG LLP
PricewaterhouseCoopers LLP
1. Effective January 13, 2012, the Fund was closed to new investors with certain exceptions.
2. This Fund is only registered for sale in AZ, CA, NV, OR, UT, and WA.
3. This Fund is only registered for sale in CT, DE, FL, MA, NJ, NY, and VT.
4. An affiliate of New York Life Investment Management LLC.
Not part of the Semiannual Report
For more information
800-MAINSTAY (624-6782)
mainstayinvestments.com
The MainStay Funds® are managed by New York Life Investment Management LLC and distributed through NYLIFE Distributors LLC, 169 Lackawanna Avenue, Parsippany, NJ 07054, a wholly owned subsidiary of New York Life Insurance Company. NYLIFE Distributors LLC is a Member FINRA/SIPC.
MainStay Investments® is a registered service mark and name under which New York Life Investment Management LLC does business. MainStay Investments, an indirect subsidiary of New York Life Insurance Company, New York, NY 10010, provides investment advisory products and services.
This report may be distributed only when preceded or accompanied by a current Fund prospectus.
©2013 NYLIFE Distributors LLC. All rights reserved.
| | | | | | | | |
| Not FDIC/NCUA Insured | | Not a Deposit | | May Lose Value | | No Bank Guarantee | | Not Insured by Any Government Agency |
| | |
| NYLIM-30158 MS175-13 | | MSNTF10-06/13 NL035 |
MainStay Short Duration High Yield Fund
Message from the President and Semiannual Report
Unaudited | April 30, 2013


This page intentionally left blank
Message from the President
The U.S. stock market advanced during the six months ended April 30, 2013, generally providing double-digit returns at all capitalization levels. Value stocks tended to outpace growth stocks among large- and mid-capitalization companies, while growth stocks tended to outpace value stocks among smaller companies.
The market’s advance, however, was far from uniform. Stocks declined in early November, both before and immediately after the U.S. presidential election. Following a sharp recovery, stocks climbed until mid-December, when a Congressional stalemate on the fiscal cliff led to a brief decline. Another dip occurred in late February as investors speculated that the Federal Open Market Committee (FOMC) might stop purchasing mortgage-backed securities sooner than expected. Stocks also dipped in mid-April, as consumer sentiment dropped after the Boston marathon bombing. Despite these setbacks, U.S. stocks continued to trend upward during the six-month reporting period.
International stock markets also advanced, with several regional differences. Accommodative action by the Bank of Japan helped lower the yen and lift Japanese stocks to their highest levels since 2008. In Europe, stocks did well until early February, bolstered by the promise of support for the euro. As the year progressed, however, economic contraction, rising unemployment and systematic banking concerns took a toll on investor enthusiasm. In China, manufacturing slowed as the nation sought to balance growth and inflation risks. On the Korean peninsula, tensions rose as North Korea continued to threaten its neighbors, which added an undercurrent of caution to the market.
During the six months ended April 30, 2013, the FOMC kept the federal funds rate in a range close to zero. The FOMC also continued its direct purchases of mortgage-backed securities and longer-term U.S. government securities. With short-term interest rates likely to remain at low levels, many bond investors pursued higher yields by lengthening maturities and assuming greater risk. As a result, bonds with higher risk profiles tended
to outperform higher-quality investment-grade bonds and U.S. Treasury securities. Cash and cash equivalents essentially returned zero.
With wide variations in the performance of various asset classes, some investors might be tempted to chase higher returns by shifting back and forth between stocks and bonds. Since no one can predict where the market will move next, however, we encourage investors to select an appropriate mix of investments for their risk tolerance and time horizon and to stick with that mix, making only minor adjustments over time.
At MainStay Funds, our portfolio managers use a similar approach. Careful security selection and thoughtful sell disciplines help them pursue the investment objectives of their respective Funds. Using the principal investment strategies outlined in the Prospectus, they focus primarily on providing long-term investment potential for our shareholders.
Has this approach proved successful? In its most recent rankings, Barron’s listed MainStay Funds as the #1 fund family over the past 10 years. We were also the only mutual fund family that has appeared in Barron’s top six for the past five consecutive years.
The pages that follow provide additional insight into the specific market events, investment decisions and securities that shaped your MainStay Fund(s) during the six months ended April 30, 2013. We encourage you to read the semiannual report(s) carefully and to evaluate your results with your long-term financial goals in mind.
Sincerely,

Stephen P. Fisher
President
The opinions expressed are as of the date of this report and are subject to change. There is no guarantee that any forecast made will come to pass. This material does not constitute investment advice and is not intended as an endorsement of any specific investment.
To qualify for the Lipper/Barron’s Fund Survey, a fund family must have at least three funds in Lipper’s general U.S.-stock category, one in world equity (which combines global and international funds), one mixed-equity fund (which holds stocks and bonds), two taxable-bond funds, and one tax-exempt fund. Fund loads and 12b-1 fees aren’t included in the calculation of returns because the aim is to measure the manager’s skill. Each fund’s return is measured against all funds in its Lipper category, resulting in a percentile ranking which is then weighted by asset size relative to the fund family’s other assets in its general classifications. Finally, the score is multiplied by the general classification weightings as determined by the entire Lipper universe of funds.
Source: Barron’s, 2/9/13. Overall, MainStay Funds ranked number 56 for the one-year period, 20 for the five-year period and one for the 10-year period ended December 31, 2012, out of 62, 53 and 46 fund families, respectively. MainStay ranked number three for the 10-year period in 2009, 2010 and 2011 from among 48, 46 and 45 fund families, respectively. MainStay ranked number six from among 48 fund families for the 10-year period in 2008. Past performance is no guarantee of future results, which will vary. For the most recent MainStay Funds performance, please visit our website at mainstayinvestments.com. All mutual funds are subject to market risk and will fluctuate in value.
Not part of the Semiannual Report
Table of Contents
Investors should refer to the Fund’s Summary Prospectus and/or Prospectus and consider the Fund’s investment objectives, strategies, risks, charges and expenses carefully before investing. The Summary Prospectus and/or Prospectus contain this and other information about the Fund. You may obtain copies of the Fund’s Summary Prospectus, Prospectus and Statement of Additional Information free of charge, upon request, by calling toll-free 800-MAINSTAY (624-6782), by writing to NYLIFE Distributors LLC, Attn: MainStay Marketing Department, 169 Lackawanna Avenue, Parsippany, New Jersey 07054 or by sending an e-mail to MainStayShareholderServices@nylim.com. These documents are also available via the MainStay Funds’ website at mainstayinvestments.com/documents. Please read the Summary Prospectus and/or Prospectus carefully before investing.
Investment and Performance Comparison1 (Unaudited)
Performance data quoted represents past performance. Past performance is no guarantee of future results. Because of market volatility, current performance may be lower or higher than the figures shown. Investment return and principal value will fluctuate, and as a result, when shares are redeemed, they may be worth more or less than their original cost. The graph below depicts the historical performance of Class I shares of the Fund. Performance will vary from class to class based on differences in class-specific expenses and sales charges. For performance information current to the most recent month-end, please call 800-MAINSTAY (624-6782) or visit mainstayinvestments.com.
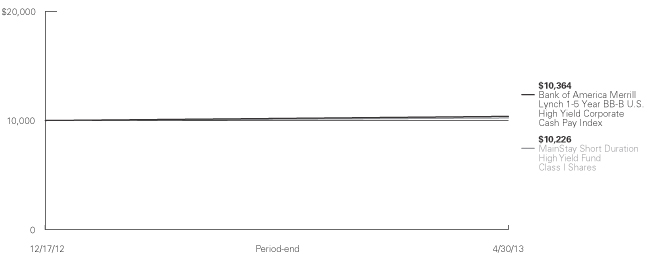
Average Annual Total Returns for the Period Ended April 30, 2013
| | | | | | | | | | | | |
| Class | | Sales Charge | | | | Since
Inception
(12/17/12) | | | Gross
Expense
Ratio2 | |
| Investor Class Shares | | Maximum 3.0% Initial Sales Charge | | With sales charges Excluding sales charges | |
| –1.01
2.05 | %
| |
| 1.43
1.43 | %
|
| Class A Shares | | Maximum 3.0% Initial Sales Charge | | With sales charges Excluding sales charges | |
| –0.95
2.11 |
| |
| 1.38
1.38 |
|
| Class C Shares | | Maximum 1% CDSC if Redeemed Within One Year of Purchase | | With sales charges Excluding sales charges | |
| 0.87
1.87 |
| |
| 2.18
2.18 |
|
| Class I Shares | | No Sales Charge | | | | | 2.26 | | | | 1.13 | |
| Class R2 Shares | | No Sales Charge | | | | | 2.07 | | | | 1.48 | |
| 1. | The performance table and graph do not reflect the deduction of taxes that a shareholder would pay on dividends, distributions or Fund share redemptions. Total returns reflect maximum applicable sales charges as indicated in the table above, changes in share price, and reinvestment of dividend and capital gain distributions. The graph assumes the initial investment amount shown above and reflects the deduction of all sales charges that would have applied for the period of investment. Performance |
| | figures reflect certain fee waivers and/or expense limitations, without which total returns may have been lower. For more information on share classes and current fee waivers and/or expense limitations, please refer to the notes to the financial statements. |
| 2. | The gross expense ratios presented reflect the Fund’s “Total Annual Fund Operating Expenses” from the most recent Prospectus and may differ from other expense ratios disclosed in this report. |
The footnotes on the next page are an integral part of the table and graph and should be carefully read in conjunction with them.
| | | | |
| mainstayinvestments.com | | | 5 | |
| | | | |
| Benchmark Performance | | Since
Inception | |
Bank of America Merrill Lynch 1-5 Year BB-B U.S. High Yield Corporate Cash Pay Index | | | 3.64 | % |
Average Lipper High Yield Fund | | | 4.54 | |
| 3. | The Bank of America Merrill Lynch 1-5 Year BB-B U.S. High Yield Corporate Cash Pay Index is an unmanaged index that generally tracks the performance of BB-B rated U.S. dollar-denominated corporate bonds publicly issued in the U.S. domestic market with maturities of 1 to 5 years. Bank of America Merrill Lynch 1-5 Year BB-B U.S. High Yield Corporate Cash Pay Index is the Fund’s broad-based securities market index for comparison purposes. Total returns assume the reinvestment of all dividends and capital gains. An investment cannot be made directly in an index. |
| 4. | The average Lipper high yield fund is representative of funds that, by portfolio practice, aim at high (relative) current yield from fixed income securities, have no quality or maturity restrictions, and tend to invest in lower-grade debt issues. This benchmark is a product of Lipper Inc. Lipper Inc. is an independent monitor of fund performance. Results are based on average total returns of similar funds with all dividend and capital gain distributions reinvested. |
The footnotes on the preceding page are an integral part of the table and graph and should be carefully read in conjunction with them.
| | |
| 6 | | MainStay Short Duration High Yield Fund |
Cost in Dollars of a $1,000 Investment in MainStay Short Duration High Yield Fund (Unaudited)
The example below is intended to describe the fees and expenses borne by shareholders during the period from December 17, 2012, to April 30, 2013, and the impact of those costs on your investment.
Example
As a shareholder of the Portfolio, you incur two types of costs: (1) transaction costs, including exchange fees and sales charges (loads) on purchases (as applicable), and (2) ongoing costs, including management fees, distribution and/or service (12b-1) fees, and other Portfolio expenses (as applicable). This example is intended to help you understand your ongoing costs (in dollars) of investing in the Portfolio and to compare these costs with the ongoing costs of investing in other Portfolios. The example is based on an investment of $1,000 made at the beginning of the period and held for the entire period from December 17, 2012, to April 30, 2013. Shares are only sold in connection with variable life and annuity contracts and the example does not reflect any contract level or transactional fees or expenses. If these costs had been included, your costs would have been higher.
This example illustrates your Portfolio’s ongoing costs in two ways:
Actual Expenses
The second and third data columns in the table below provide information about actual account values and actual expenses. You may use the information in these columns, together with the amount you invested, to estimate the expenses that you paid during the period ended April 30, 2013. Simply divide your account value by $1,000
(for example, an $8,600 account value divided by $1,000 = 8.6), then multiply the result by the number under the heading entitled ‘‘Expenses Paid During Period’’ to estimate the expenses you paid on your account during this period.
Hypothetical Example for Comparison Purposes
The fourth and fifth data columns in the table below provide information about hypothetical account values and hypothetical expenses based on the Portfolio’s actual expense ratio and an assumed rate of return of 5% per year before expenses, which is not the Portfolio’s actual return. The hypothetical account values and expenses may not be used to estimate the actual ending account balances or expenses you paid for the six-month period shown. You may use this information to compare the ongoing costs of investing in the Portfolio with the ongoing costs of investing in other Portfolios. To do so, compare this 5% hypothetical example with the 5% hypothetical examples that appear in the shareholder reports of the other Portfolios.
Please note that the expenses shown in the table are meant to highlight your ongoing costs only and do not reflect any transactional costs, such as exchange fees or sales charges (loads). Therefore, the fourth and fifth data columns of the table are useful in comparing ongoing costs only and will not help you determine the relative total costs of owning different funds. In addition, if these transactional costs were included, your costs would have been higher.
| | | | | | | | | | | | | | | | | | | | |
| | | | | | | | | | | | | | | | |
| Share Class | | Beginning
Account
Value
12/17/121 | | | Ending Account
Value (Based
on Actual
Returns and
Expenses)
4/30/13 | | | Expenses
Paid
During
Period2 | | | Ending Account
Value (Based
on Hypothetical
5% Annualized
Return and
Actual Expenses)
4/30/13 | | | Expenses
Paid
During
Period2 | |
| | | | | |
| Investor Class Shares3 | | $ | 1,000.00 | | | $ | 1,020.50 | | | $ | 3.75 | | | $ | 1,014.60 | | | $ | 3.74 | |
| | | | | |
| Class A Shares3 | | $ | 1,000.00 | | | $ | 1,021.10 | | | $ | 3.90 | | | $ | 1,014.50 | | | $ | 3.88 | |
| | | | | |
| Class C Shares3 | | $ | 1,000.00 | | | $ | 1,018.70 | | | $ | 6.52 | | | $ | 1,011.90 | | | $ | 6.50 | |
| | | | | |
| Class I Shares3 | | $ | 1,000.00 | | | $ | 1,022.60 | | | $ | 2.97 | | | $ | 1,015.40 | | | $ | 2.96 | |
| | | | | |
| Class R2 Shares3 | | $ | 1,000.00 | | | $ | 1,020.70 | | | $ | 4.27 | | | $ | 1,014.10 | | | $ | 4.25 | |
| 1. | The inception date of the Fund. |
| 2. | Expenses are equal to the Fund’s annualized expense ratio of each class (1.01% for Investor Class, 1.05% for Class A, 1.76% for Class C, 0.80% for Class I, and 1.15% for Class R2) multiplied by the average account value over the period, divided by 365 and multiplied by 134 days for Investor Class, Class A, Class C, Class I and Class R2 (to reflect the since-inception period which took place after the close of business on December 17, 2012). The table above represents the actual expenses incurred during the period. |
| 3. | Expenses paid during the period reflect ongoing costs for the period from inception through April 30, 2013. Had these shares been offered for the full six-month period ended April 30, 2013, and had the Fund provided a hypothetical 5% annualized return, expenses paid during the period would have been $5.06 for Investor Class, $5.26 for Class A, $8.80 for Class C, $4.01 for Class I and $5.76 for Class R2 and the ending account value would have been $1,019.80 for Investor Class, $1,019.60 for Class A, $1,016.10 for Class C, $1,020.80 for Class I and $1,019.10 for Class R2. |
| | | | |
| mainstayinvestments.com | | | 7 | |
Portfolio Composition as of April 30, 2013 (Unaudited)
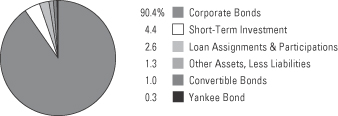
See Portfolio of Investments beginning on page 11 for specific holdings within these categories.
Top Ten Holdings or Issuers Held as of April 30, 2013 (excluding short-term investment)
| 1. | Florida East Coast Railway Corp., 8.125%, due 2/1/17 |
| 2. | DineEquity, Inc., 9.50%, due 10/30/18 |
| 3. | Amsted Industries, Inc., 8.125%, due 3/15/18 |
| 4. | Videotron, Ltd., 6.375%–9.125%, due 12/15/15–4/15/18 |
| 5. | Host Hotels & Resorts, L.P., 6.75%–9.00%, due 6/1/16–5/15/17 |
| 6. | KB Home, 5.75%, due 2/1/14 |
| 7. | Asbury Automotive Group, Inc., 7.625%, due 3/15/17 |
| 8. | NAI Entertainment Holdings LLC, 8.25%, due 12/15/17 |
| 9. | CONSOL Energy, Inc., 8.00%, due 4/1/17 |
| 10. | DISH DBS Corp., 4.25%–7.75%, due 5/31/15–5/1/20 |
| | |
| 8 | | MainStay Short Duration High Yield Fund |
Portfolio Management Discussion and Analysis (Unaudited)
Questions answered by portfolio managers J. Matthew Philo, CFA, and Andrew Susser of MacKay Shields LLC, the Fund’s Subadvisor.
How did MainStay Short Duration High Yield Fund perform relative to its peers and its benchmark from its inception on December 17, 2012, through April 30, 2013?
Excluding all sales charges, MainStay Short Duration High Yield Fund returned 2.05% for Investor Class shares, 2.11% for Class A shares and 1.87% for Class C shares from December 17, 2012, through April 30, 2013. Over the same period, Class I shares returned 2.26% and Class R2 shares returned 2.07%. All share classes underperformed the 4.54% return of the average Lipper1 high yield fund and the 3.64% return of the Bank of America Merrill Lynch 1–5 Year BB–B U.S. High Yield Corporate Cash Pay Index2 from December 17, 2012, through April 30, 2013. The Bank of America Merrill Lynch 1–5 Year BB–B U.S. High Yield Corporate Cash Pay Index is the Fund’s broad-based securities-market index. See page 5 for Fund returns with applicable sales charges.
What factors affected the Fund’s relative performance from December 17, 2012 through April 30, 2013?
The Fund is managed in a bottom-up investment style, which focuses on individual companies and seeks to maximize risk-adjusted returns.
From inception on December 17, 2012, through April 30, 2013, the Fund underperformed the Bank of America Merrill Lynch 1–5 Year BB–B U.S. High Yield Corporate Cash Pay Index, primarily because it was conservatively positioned. We believed that valuations (as measured by spreads)3 and the resiliency of credit profiles in the higher-quality portion of the high-yield market were attractive. On the other hand, we felt that weak credit profiles tended to make valuations in the riskier segment of the high-yield market unattractive. During the reporting period, CCC-rated4 credits significantly outperformed the rest of the market. As a result, the Fund’s underweight position in higher-risk credits detracted from relative performance.
What was the Fund’s duration5 strategy during the reporting period?
As of April 30, 2013, the Fund held a shorter duration than that of the Bank of America Merrill Lynch 1–5 Year BB–B U.S. High Yield Corporate Cash Pay Index. High-yield bonds tend to have a
low correlation to U.S. Treasury securities. The Fund’s comparatively shorter duration further reduced its sensitivity to changes in interest rates.
What specific factors, risks or market forces prompted significant decisions for the Fund during the reporting period?
The U.S. high yield corporate bond market generated strong returns during the reporting period, as exceptionally low interest rates and market liquidity fueled demand for income-generating assets. During the reporting period, we sought to limit what we viewed as elevated risk in the lower-quality segment of the high-yield market.
As a result, the Fund focused on higher-quality high-yield issues and held an underweight position in credit risk relative to the Bank of America Merrill Lynch 1–5 Year BB–B U.S. High Yield Corporate Cash Pay Index. Although our valuation assessment remains unchanged, this positioning detracted from relative performance when CCC-rated credits significantly outperformed the broad high-yield market.
During the reporting period, which market segments were the strongest positive contributors to the Fund’s performance and which market segments were particularly weak?
On an absolute basis, the Fund’s investments in the services, basic industry and capital goods market segments made the greatest contribution to performance during the reporting period. (Contributions take weightings and total returns into account.) Although no market segments generated negative absolute returns, the Fund’s exposure to the technology and electronics and the banking market segments contributed the least to absolute performance.
Did the Fund make any significant purchases or sales during the reporting period?
Because the reporting period included the Fund’s initial asset purchases, all of the trades in the Fund may be considered significant. An example of a bond our team purchased during the reporting period was Wells Enterprises, a family-owned and
| 1. | See page 6 for more information on Lipper Inc. |
| 2. | See page 6 for more information on the Bank of America Merrill Lynch 1–5 Year BB-B U.S. High Yield Corporate Cash Pay Index. |
| 3. | The terms “spread” and “yield spread” may refer to the difference in yield between a security or type of security and comparable U.S. Treasury issues. The terms may also refer to the difference in yield between two specific securities or types of securities at a given time. |
| 4. | An obligation rated ‘CCC’ by Standard & Poor’s (“S&P”) is deemed by S&P to be currently vulnerable to nonpayment and is dependent upon favorable business, financial and economic conditions for the obligor to meet its financial commitment on the obligation. It is the opinion of S&P that in the event of adverse business, financial or economic conditions, the obligor is not likely to have the capacity to meet its financial commitment on the obligation. When applied to Fund holdings, ratings are based solely on the creditworthiness of the bonds in the portfolio and are not meant to represent the security or safety of the Fund. |
| 5. | Duration is a measure of the price sensitivity of a fixed-income investment to changes in interest rates. Duration is expressed as a number of years and is considered a more accurate sensitivity gauge than average maturity. |
| | | | |
| mainstayinvestments.com | | | 9 | |
-managed ice-cream company. The bonds of Wells Enterprises
are secured by the majority of the company’s assets and represent the majority of the company’s capital structure. We found the company’s strong free cash flow attractive.
How did the Fund’s sector weightings change during the reporting period?
During the since-inception period, the Fund’s sector weights changed as bonds were purchased. We constructed a portfolio of what we consider to be high-quality short-duration high-yield bonds. We looked for resilient credits, as measured by strong
asset coverage, conservative debt maturities and robust liquidity.
How was the Fund positioned at the end of the reporting period?
As of April 30, 2013, the Fund was overweight relative to the Bank of America Merrill Lynch 1–5 Year BB–B U.S. High Yield Corporate Cash Pay Index in the services and consumer cyclical segments of the market. As of the same date, the Fund held underweight positions relative to the Index in the banking and financials market segments.
The opinions expressed are those of the portfolio managers as of the date of this report and are subject to change. There is no guarantee that any forecast made will come to pass. This material does not constitute investment advice and is not intended as an endorsement of any specific investment.
| | |
| 10 | | MainStay Short Duration High Yield Fund |
Portfolio of Investments April 30, 2013 (Unaudited)
| | | | | | | | |
| | | Principal
Amount | | | Value | |
| | | | | | | | |
Long-Term Bonds 94.3%† Convertible Bonds 1.0% | |
Holding Company—Diversified 0.3% | |
Icahn Enterprises, L.P.
4.00%, due 8/15/13 (a) | | $ | 265,000 | | | $ | 265,000 | |
| | | | | | | | |
| | |
Packaging & Containers 0.7% | | | | | | | | |
Owens-Brockway Glass Container, Inc.
3.00%, due 6/1/15 (b) | | | 650,000 | | | | 661,375 | |
| | | | | | | | |
Total Convertible Bonds
(Cost $914,006) | | | | | | | 926,375 | |
| | | | | | | | |
|
| Corporate Bonds 90.4% | |
Advertising 0.6% | |
Lamar Media Corp. | | | | | | | | |
7.875%, due 4/15/18 | | | 250,000 | | | | 273,125 | |
9.75%, due 4/1/14 | | | 285,000 | | | | 306,375 | |
| | | | | | | | |
| | | | | | | 579,500 | |
| | | | | | | | |
Aerospace & Defense 0.4% | |
GenCorp, Inc.
7.125%, due 3/15/21 (b) | | | 370,000 | | | | 398,675 | |
| | | | | | | | |
| | |
Auto Parts & Equipment 4.3% | | | | | | | | |
Cooper-Standard Automotive, Inc.
8.50%, due 5/1/18 | | | 430,000 | | | | 469,775 | |
Cooper-Standard Holding, Inc.
7.375%, due 4/1/18 (b)(c) | | | 305,000 | | | | 305,381 | |
Dana Holding Corp.
6.50%, due 2/15/19 | | | 685,000 | | | | 740,656 | |
Exide Technologies
8.625%, due 2/1/18 | | | 305,000 | | | | 203,969 | |
Schaeffler Finance B.V. | | | | | | | | |
7.75%, due 2/15/17 (b) | | | 530,000 | | | | 602,212 | |
8.50%, due 2/15/19 (b) | | | 266,000 | | | | 303,573 | |
Tenneco, Inc.
7.75%, due 8/15/18 | | | 230,000 | | | | 252,713 | |
Titan International, Inc. | | | | | | | | |
7.875%, due 10/1/17 (b) | | | 490,000 | | | | 526,750 | |
7.875%, due 10/1/17 | | | 290,000 | | | | 311,750 | |
TRW Automotive, Inc.
7.00%, due 3/15/14 (b) | | | 225,000 | | | | 235,406 | |
| | | | | | | | |
| | | | | | | 3,952,185 | |
| | | | | | | | |
Banks 1.3% | |
Ally Financial, Inc.
8.30%, due 2/12/15 | | | 1,080,000 | | | | 1,200,150 | |
| | | | | | | | |
| | | | | | | | |
| | | Principal
Amount | | | Value | |
| | | | | | | | |
Beverages 0.9% | | | | | | | | |
Constellation Brands, Inc.
8.375%, due 12/15/14 | | $ | 100,000 | | | $ | 110,500 | |
Cott Beverages, Inc. | | | | | | | | |
8.125%, due 9/1/18 | | | 445,000 | | | | 488,388 | |
8.375%, due 11/15/17 | | | 200,000 | | | | 214,000 | |
| | | | | | | | |
| | | | 812,888 | |
| | | | | | | | |
Biotechnology 0.3% | |
Bio Rad Labs
8.00%, due 9/15/16 | | | 265,000 | | | | 281,809 | |
| | | | | | | | |
| | |
Building Materials 2.2% | | | | | | | | |
Building Materials Corp. of America
6.875%, due 8/15/18 (b) | | | 690,000 | | | | 745,200 | |
Headwaters, Inc.
7.625%, due 4/1/19 | | | 455,000 | | | | 492,537 | |
USG Corp. | | | | | | | | |
6.30%, due 11/15/16 | | | 460,000 | | | | 489,900 | |
8.375%, due 10/15/18 (b) | | | 70,000 | | | | 77,350 | |
Vulcan Materials Co.
6.50%, due 12/1/16 | | | 200,000 | | | | 224,500 | |
| | | | | | | | |
| | | | 2,029,487 | |
| | | | | | | | |
Chemicals 1.9% | |
Ineos Finance PLC
8.375%, due 2/15/19 (b) | | | 316,000 | | | | 356,290 | |
Kraton Polymers LLC / Kraton Polymers Capital Corp.
6.75%, due 3/1/19 | | | 420,000 | | | | 439,950 | |
NOVA Chemicals Corp. | | | | | | | | |
8.375%, due 11/1/16 | | | 275,000 | | | | 294,937 | |
8.625%, due 11/1/19 | | | 89,000 | | | | 100,681 | |
Olin Corp.
8.875%, due 8/15/19 | | | 255,000 | | | | 285,600 | |
Phibro Animal Health Corp.
9.25%, due 7/1/18 (b) | | | 265,000 | | | | 286,863 | |
| | | | | | | | |
| | | | 1,764,321 | |
| | | | | | | | |
Coal 3.0% | |
Arch Coal, Inc. | | | | | | | | |
7.00%, due 6/15/19 | | | 130,000 | | | | 120,575 | |
8.75%, due 8/1/16 | | | 240,000 | | | | 249,600 | |
¨CONSOL Energy, Inc.
8.00%, due 4/1/17 | | | 1,260,000 | | | | 1,363,950 | |
Peabody Energy Corp.
7.375%, due 11/1/16 | | | 250,000 | | | | 286,250 | |
Penn Virginia Resource Partners, L.P. / Penn Virginia Resource Finance Corp.
8.25%, due 4/15/18 | | | 740,000 | | | | 789,950 | |
| | | | | | | | |
| | | | 2,810,325 | |
| | | | | | | | |
| † | Percentages indicated are based on Fund net assets. |
| ¨ | | Among the Fund’s 10 largest holdings or issuers held, as of April 30, 2013, excluding short-term investment. May be subject to change daily. |
| | | | | | |
The notes to the financial statements are an integral part of,
and should be read in conjunction with, the financial statements. | | mainstayinvestments.com | | | 11 | |
Portfolio of Investments April 30, 2013 (Unaudited) (continued)
| | | | | | | | |
| | | Principal
Amount | | | Value | |
| | | | | | | | |
| Corporate Bonds (continued) | |
Commercial Services 3.2% | |
Alliance Data Systems Corp.
5.25%, due 12/1/17 (b) | | $ | 240,000 | | | $ | 250,200 | |
Catalent Pharma Solutions, Inc.
9.50%, due 4/15/15 | | | 172,525 | | | | 172,956 | |
Cenveo Corp.
8.875%, due 2/1/18 | | | 185,000 | | | | 187,313 | |
Geo Group, Inc. (The)
7.75%, due 10/15/17 | | | 620,000 | | | | 660,300 | |
Great Lakes Dredge & Dock Corp.
7.375%, due 2/1/19 | | | 465,000 | | | | 491,737 | |
Hertz Corp. (The)
4.25%, due 4/1/18 (b) | | | 150,000 | | | | 155,813 | |
PHH Corp. | | | | | | | | |
7.375%, due 9/1/19 | | | 10,000 | | | | 11,425 | |
9.25%, due 3/1/16 | | | 245,000 | | | | 287,262 | |
Sunstate Equipment Co. LLC / Sunstate Equipment Co., Inc.
12.00%, due 6/15/16 (b)(c) | | | 435,000 | | | | 489,375 | |
United Rentals North America, Inc.
5.75%, due 7/15/18 | | | 280,000 | | | | 305,200 | |
| | | | | | | | |
| | | | | | | 3,011,581 | |
| | | | | | | | |
Computers 1.7% | | | | | | | | |
iGATE Corp.
9.00%, due 5/1/16 | | | 375,000 | | | | 408,750 | |
Seagate Technology International
10.00%, due 5/1/14 (b) | | | 666,000 | | | | 699,300 | |
SunGard Data Systems, Inc.
4.875%, due 1/15/14 | | | 500,000 | | | | 508,750 | |
| | | | | | | | |
| | | | | | | 1,616,800 | |
| | | | | | | | |
Distribution & Wholesale 0.5% | |
American Tire Distributors, Inc.
9.75%, due 6/1/17 | | | 400,000 | | | | 429,500 | |
| | | | | | | | |
| | |
Diversified Financial Services 0.5% | | | | | | | | |
National Money Mart Co.
10.375%, due 12/15/16 | | | 185,000 | | | | 199,106 | |
ROC Finance LLC / ROC Finance 1 Corp.
12.125%, due 9/1/18 (b) | | | 255,000 | | | | 299,625 | |
| | | | | | | | |
| | | | | | | 498,731 | |
| | | | | | | | |
Electric 2.7% | |
Calpine Construction Finance Co., L.P. / CCFC Finance Corp.
8.00%, due 6/1/16 (b) | | | 1,140,000 | | | | 1,191,300 | |
GenOn Energy, Inc. | | | | | | | | |
7.625%, due 6/15/14 | | | 300,000 | | | | 318,750 | |
7.875%, due 6/15/17 | | | 440,000 | | | �� | 497,200 | |
IPALCO Enterprises, Inc.
7.25%, due 4/1/16 (b) | | | 170,000 | | | | 190,825 | |
| | | | | | | | |
| | | Principal
Amount | | | Value | |
| | | | | | | | |
Electric (continued) | |
Public Service Co. of New Mexico
7.95%, due 5/15/18 | | $ | 230,000 | | | $ | 287,478 | |
| | | | | | | | |
| | | | | | | 2,485,553 | |
| | | | | | | | |
Electrical Components & Equipment 0.5% | |
Anixter, Inc.
5.95%, due 3/1/15 | | | 450,000 | | | | 480,375 | |
| | | | | | | | |
| | |
Electronics 0.6% | | | | | | | | |
Kemet Corp.
10.50%, due 5/1/18 | | | 350,000 | | | | 365,750 | |
Stoneridge, Inc.
9.50%, due 10/15/17 (b) | | | 140,000 | | | | 151,025 | |
| | | | | | | | |
| | | | | | | 516,775 | |
| | | | | | | | |
Engineering & Construction 0.3% | |
New Enterprise Stone & Lime Co., Inc.
13.00%, due 3/15/18 (b)(c) | | | 275,000 | | | | 294,250 | |
| | | | | | | | |
| | |
Entertainment 3.8% | | | | | | | | |
Affinity Gaming LLC / Affinity Gaming Finance Corp.
9.00%, due 5/15/18 (b) | | | 524,000 | | | | 569,850 | |
MU Finance PLC
8.375%, due 2/1/17 (b) | | | 548,447 | | | | 593,694 | |
¨NAI Entertainment Holdings LLC
8.25%, due 12/15/17 (b) | | | 1,310,000 | | | | 1,421,350 | |
Speedway Motorsports, Inc.
6.75%, due 2/1/19 (b) | | | 570,000 | | | | 612,038 | |
Vail Resorts, Inc.
6.50%, due 5/1/19 | | | 300,000 | | | | 322,875 | |
| | | | | | | | |
| | | | | | | 3,519,807 | |
| | | | | | | | |
Environmental Controls 0.5% | |
Darling International, Inc.
8.50%, due 12/15/18 | | | 390,000 | | | | 442,650 | |
| | | | | | | | |
| | |
Finance—Auto Loans 0.6% | | | | | | | | |
Credit Acceptance Corp.
9.125%, due 2/1/17 | | | 415,000 | | | | 452,350 | |
General Motors Financial Co., Inc.
4.75%, due 8/15/17 (b) | | | 60,000 | | | | 63,300 | |
| | | | | | | | |
| | | | | | | 515,650 | |
| | | | | | | | |
Finance—Leasing Companies 0.3% | |
Oxford Finance LLC / Oxford Finance Co-issuer, Inc.
7.25%, due 1/15/18 (b) | | | 265,000 | | | | 280,900 | |
| | | | | | | | |
| | |
Finance—Other Services 1.7% | | | | | | | | |
Cantor Commercial Real Estate Co., L.P.
7.75%, due 2/15/18 (b) | | | 595,000 | | | | 615,825 | |
| | | | |
| 12 | | MainStay Short Duration High Yield Fund | | The notes to the financial statements are an integral part of,
and should be read in conjunction with, the financial statements. |
| | | | | | | | |
| | | Principal
Amount | | | Value | |
| | | | | | | | |
| Corporate Bonds (continued) | |
Finance—Other Services (continued) | | | | | | | | |
Nationstar Mortgage LLC / Nationstar Capital Corp. | | | | | | | | |
6.50%, due 7/1/21 (b) | | $ | 20,000 | | | $ | 20,975 | |
9.625%, due 5/1/19 (b) | | | 355,000 | | | | 409,137 | |
SquareTwo Financial Corp.
11.625%, due 4/1/17 | | | 490,000 | | | | 508,375 | |
| | | | | | | | |
| | | | | | | 1,554,312 | |
| | | | | | | | |
Food 1.2% | |
B&G Foods, Inc.
7.625%, due 1/15/18 | | | 437,000 | | | | 468,682 | |
Harmony Foods Corp.
10.00%, due 5/1/16 (b) | | | 99,000 | | | | 107,168 | |
TreeHouse Foods, Inc.
7.75%, due 3/1/18 | | | 215,000 | | | | 232,738 | |
Wells Enterprises, Inc.
6.75%, due 2/1/20 (b) | | | 250,000 | | | | 271,250 | |
| | | | | | | | |
| | | | | | | 1,079,838 | |
| | | | | | | | |
Health Care—Products 0.3% | |
Hanger, Inc.
7.125%, due 11/15/18 | | | 285,000 | | | | 310,650 | |
| | | | | | | | |
|
Health Care—Services 3.5% | |
Fresenius Medical Care U.S. Finance, Inc. | | | | | | | | |
6.50%, due 9/15/18 (b) | | | 565,000 | | | | 653,988 | |
6.875%, due 7/15/17 | | | 525,000 | | | | 606,375 | |
HCA, Inc. | | | | | | | | |
6.50%, due 2/15/16 | | | 610,000 | | | | 673,287 | |
8.00%, due 10/1/18 | | | 75,000 | | | | 89,156 | |
9.00%, due 12/15/14 | | | 440,000 | | | | 488,950 | |
ResCare, Inc.
10.75%, due 1/15/19 | | | 622,000 | | | | 702,860 | |
| | | | | | | | |
| | | | | | | 3,214,616 | |
| | | | | | | | |
Holding Company—Diversified 0.7% | |
Leucadia National Corp.
8.125%, due 9/15/15 | | | 550,000 | | | | 624,250 | |
| | | | | | | | |
|
Home Builders 2.3% | |
¨KB Home
5.75%, due 2/1/14 | | | 1,425,000 | | | | 1,467,750 | |
Standard Pacific Corp.
10.75%, due 9/15/16 | | | 570,000 | | | | 711,075 | |
| | | | | | | | |
| | | | | | | 2,178,825 | |
| | | | | | | | |
Household Products & Wares 2.3% | |
Jarden Corp.
7.50%, due 5/1/17 | | | 365,000 | | | | 416,100 | |
Prestige Brands, Inc.
8.25%, due 4/1/18 | | | 715,000 | | | | 778,456 | |
| | | | | | | | |
| | | Principal
Amount | | | Value | |
| | | | | | | | |
Household Products & Wares (continued) | |
Spectrum Brands, Inc.
9.50%, due 6/15/18 | | $ | 854,000 | | | $ | 959,683 | |
| | | | | | | | |
| | | | | | | 2,154,239 | |
| | | | | | | | |
Insurance 0.2% | |
Fidelity & Guaranty Life Holdings, Inc.
6.375%, due 4/1/21 (b) | | | 155,000 | | | | 160,813 | |
| | | | | | | | |
|
Internet 1.3% | |
Cogent Communications Group, Inc.
8.375%, due 2/15/18 (b) | | | 1,120,000 | | | | 1,251,600 | |
| | | | | | | | |
|
Iron & Steel 0.6% | |
Bluescope Steel, Ltd. / Bluescope Steel Finance
7.125%, due 5/1/18 (b) | | | 530,000 | | | | 545,900 | |
| | | | | | | | |
|
Leisure Time 1.8% | |
Brunswick Corp.
11.25%, due 11/1/16 (b) | | | 818,000 | | | | 898,786 | |
Carlson Wagonlit B.V.
6.875%, due 6/15/19 (b) | | | 725,000 | | | | 768,500 | |
| | | | | | | | |
| | | | 1,667,286 | |
| | | | | | | | |
Lodging 0.4% | |
Eldorado Resorts LLC / Eldorado Capital Corp.
8.625%, due 6/15/19 (b) | | | 235,000 | | | | 231,475 | |
MTR Gaming Group, Inc.
11.50%, due 8/1/19 (c) | | | 175,000 | | | | 184,625 | |
| | | | | | | | |
| | | | 416,100 | |
| | | | | | | | |
Media 3.6% | |
¨DISH DBS Corp. | |
4.25%, due 4/1/18 (b) | | | 80,000 | | | | 78,600 | |
4.625%, due 7/15/17 | | | 500,000 | | | | 507,500 | |
5.125%, due 5/1/20 (b) | | | 165,000 | | | | 163,350 | |
7.125%, due 2/1/16 | | | 390,000 | | | | 430,950 | |
7.75%, due 5/31/15 | | | 150,000 | | | | 165,563 | |
ProQuest LLC / ProQuest Notes Co.
9.00%, due 10/15/18 (b) | | | 375,000 | | | | 375,000 | |
¨Videotron, Ltd. | |
6.375%, due 12/15/15 | | | 335,000 | | | | 339,187 | |
9.125%, due 4/15/18 | | | 1,240,000 | | | | 1,305,100 | |
| | | | | | | | |
| | | | 3,365,250 | |
| | | | | | | | |
Metal Fabricate & Hardware 1.3% | |
A. M. Castle & Co.
12.75%, due 12/15/16 | | | 385,000 | | | | 455,262 | |
Mueller Water Products, Inc.
7.375%, due 6/1/17 | | | 265,000 | | | | 272,288 | |
| | | | | | |
The notes to the financial statements are an integral part of,
and should be read in conjunction with, the financial statements. | | mainstayinvestments.com | | | 13 | |
Portfolio of Investments April 30, 2013 (Unaudited) (continued)
| | | | | | | | |
| | | Principal
Amount | | | Value | |
| | | | | | | | |
| Corporate Bonds (continued) | |
Metal Fabricate & Hardware (continued) | |
Shale-Inland Holdings LLC / Shale-Inland Finance Corp.
8.75%, due 11/15/19 (b) | | $ | 455,000 | | | $ | 481,162 | |
| | | | | | | | |
| | | | 1,208,712 | |
| | | | | | | | |
Mining 2.3% | |
Hecla Mining Co.
6.875%, due 5/1/21 (b) | | | 455,000 | | | | 451,587 | |
Kaiser Aluminum Corp.
8.25%, due 6/1/20 | | | 430,000 | | | | 489,125 | |
New Gold, Inc.
7.00%, due 4/15/20 (b) | | | 460,000 | | | | 487,600 | |
St. Barbara, Ltd.
8.875%, due 4/15/18 (b) | | | 710,000 | | | | 701,125 | |
| | | | | | | | |
| | | | 2,129,437 | |
| | | | | | | | |
Miscellaneous—Manufacturing 2.6% | |
¨Amsted Industries, Inc.
8.125%, due 3/15/18 (b) | | | 1,565,000 | | | | 1,690,200 | |
SPX Corp. | | | | | | | | |
6.875%, due 9/1/17 | | | 405,000 | | | | 454,612 | |
7.625%, due 12/15/14 | | | 240,000 | | | | 261,900 | |
| | | | | | | | |
| | | | | | | 2,406,712 | |
| | | | | | | | |
Office Furnishings 0.3% | |
Interface, Inc.
7.625%, due 12/1/18 | | | 250,000 | | | | 271,563 | |
| | | | | | | | |
|
Oil & Gas 7.2% | |
Berry Petroleum Co.
10.25%, due 6/1/14 | | | 330,000 | | | | 356,400 | |
Calumet Specialty Products Partners, L.P. / Calumet Finance Corp.
9.375%, due 5/1/19 | | | 675,000 | | | | 756,000 | |
Chesapeake Energy Corp.
6.775%, due 3/15/19 | | | 305,000 | | | | 333,975 | |
Chesapeake Oilfield Operating LLC / Chesapeake Oilfield Finance, Inc.
6.625%, due 11/15/19 (b) | | | 190,000 | | | | 195,700 | |
Comstock Resources, Inc.
7.75%, due 4/1/19 | | | 215,000 | | | | 230,050 | |
Concho Resources, Inc.
8.625%, due 10/1/17 | | | 595,000 | | | | 636,650 | |
Frontier Oil Corp.
6.875%, due 11/15/18 | | | 450,000 | | | | 487,688 | |
HollyFrontier Corp.
9.875%, due 6/15/17 | | | 475,000 | | | | 502,559 | |
Linn Energy LLC / Linn Energy Finance Corp. | | | | | | | | |
6.50%, due 5/15/19 | | | 175,000 | | | | 185,500 | |
11.75%, due 5/15/17 | | | 415,000 | | | | 441,975 | |
PetroQuest Energy, Inc.
10.00%, due 9/1/17 | | | 465,000 | | | | 504,525 | |
| | | | | | | | |
| | | Principal
Amount | | | Value | |
| | | | | | | | |
Oil & Gas (continued) | |
Rex Energy Corp.
8.875%, due 12/1/20 (b) | | $ | 275,000 | | | $ | 293,906 | |
Rosetta Resources, Inc.
5.625%, due 5/1/21 | | | 535,000 | | | | 557,737 | |
SM Energy Co.
6.625%, due 2/15/19 | | | 290,000 | | | | 312,113 | |
Whiting Petroleum Corp.
6.50%, due 10/1/18 | | | 500,000 | | | | 538,750 | |
WPX Energy, Inc.
5.25%, due 1/15/17 | | | 285,000 | | | | 304,950 | |
| | | | | | | | |
| | | | | | | 6,638,478 | |
| | | | | | | | |
Oil & Gas Services 0.4% | |
American Petroleum Tankers LLC / AP Tankers Co.
10.25%, due 5/1/15 | | | 393,000 | | | | 403,073 | |
| | | | | | | | |
|
Packaging & Containers 1.5% | |
AEP Industries, Inc.
8.25%, due 4/15/19 | | | 320,000 | | | | 348,800 | |
Greif, Inc.
6.75%, due 2/1/17 | | | 500,000 | | | | 563,750 | |
Plastipak Holdings, Inc.
10.625%, due 8/15/19 (b) | | | 415,000 | | | | 473,100 | |
| | | | | | | | |
| | | | | | | 1,385,650 | |
| | | | | | | | |
Pharmaceuticals 3.6% | |
BioScrip, Inc.
10.25%, due 10/1/15 | | | 195,000 | | | | 205,969 | |
Endo Health Solutions, Inc.
7.00%, due 7/15/19 | | | 370,000 | | | | 405,150 | |
Grifols, Inc.
8.25%, due 2/1/18 | | | 535,000 | | | | 587,162 | |
Lantheus Medical Imaging, Inc.
9.75%, due 5/15/17 | | | 235,000 | | | | 232,650 | |
NBTY, Inc.
9.00%, due 10/1/18 | | | 795,000 | | | | 895,369 | |
Valeant Pharmaceuticals International | | | | | | | | |
6.50%, due 7/15/16 (b) | | | 340,000 | | | | 354,237 | |
6.75%, due 10/1/17 (b) | | | 600,000 | | | | 651,000 | |
| | | | | | | | |
| | | | | | | 3,331,537 | |
| | | | | | | | |
Pipelines 0.9% | |
Copano Energy LLC / Copano Energy Finance Corp.
7.75%, due 6/1/18 | | | 755,000 | | | | 788,975 | |
| | | | | | | | |
|
Real Estate Investment Trusts 2.3% | |
¨Host Hotels & Resorts, L.P. | | | | | | | | |
Series Q | | | | | | | | |
6.75%, due 6/1/16 | | | 675,000 | | | | 685,969 | |
9.00%, due 5/15/17 | | | 900,000 | | | | 942,797 | |
| | | | |
| 14 | | MainStay Short Duration High Yield Fund | | The notes to the financial statements are an integral part of,
and should be read in conjunction with, the financial statements. |
| | | | | | | | |
| | | Principal
Amount | | | Value | |
| | | | | | | | |
| Corporate Bonds (continued) | |
Real Estate Investment Trusts (continued) | |
Sabra Health Care, L.P. / Sabra Capital Corp.
8.125%, due 11/1/18 | | $ | 475,000 | | | $ | 517,750 | |
| | | | | | | | |
| | | | | | | 2,146,516 | |
| | | | | | | | |
Retail 6.0% | | | | | | | | |
AmeriGas Partners, L.P. / AmeriGas Finance Corp.
6.25%, due 8/20/19 | | | 280,000 | | | | 303,100 | |
¨Asbury Automotive Group, Inc.
7.625%, due 3/15/17 | | | 1,400,000 | | | | 1,438,514 | |
¨DineEquity, Inc.
9.50%, due 10/30/18 | | | 1,745,000 | | | | 1,989,300 | |
Radio Systems Corp.
8.375%, due 11/1/19 (b) | | | 542,000 | | | | 589,425 | |
Sonic Automotive, Inc.
9.00%, due 3/15/18 | | | 1,135,000 | | | | 1,244,244 | |
| | | | | | | | |
| | | | | | | 5,564,583 | |
| | | | | | | | |
Retail—Food 1.2% | |
Susser Holdings LLC / Susser Finance Corp.
8.50%, due 5/15/16 | | | 1,021,000 | | | | 1,068,859 | |
| | | | | | | | |
|
Shipbuilding 0.3% | |
Huntington Ingalls Industries, Inc.
6.875%, due 3/15/18 | | | 250,000 | | | | 276,563 | |
| | | | | | | | |
|
Special Purpose Entity 0.5% | |
Rivers Pittsburgh Borrower L.P. / Rivers Pittsburgh Finance Corp.
9.50%, due 6/15/19 (b) | | | 420,000 | | | | 464,100 | |
| | | | | | | | |
|
Storage & Warehousing 0.7% | |
Algeco Scotsman Global Finance PLC | | | | | | | | |
8.50%, due 10/15/18 (b) | | | 445,000 | | | | 480,600 | |
10.75%, due 10/15/19 (b) | | | 145,000 | | | | 147,538 | |
| | | | | | | | |
| | | | | | | 628,138 | |
| | | | | | | | |
Telecommunications 5.6% | | | | | | | | |
Hughes Satellite Systems Corp.
6.50%, due 6/15/19 | | | 510,000 | | | | 567,375 | |
MetroPCS Wireless, Inc. | | | | | | | | |
6.25%, due 4/1/21 (b) | | | 315,000 | | | | 338,231 | |
6.625%, due 11/15/20 | | | 200,000 | | | | 216,500 | |
7.875%, due 9/1/18 | | | 125,000 | | | | 137,656 | |
NII International Telecom Sarl
11.375%, due 8/15/19 (b) | | | 265,000 | | | | 306,075 | |
Sable International Finance, Ltd.
7.75%, due 2/15/17 (b) | | | 635,000 | | | | 685,800 | |
Satelites Mexicanos S.A. de C.V.
9.50%, due 5/15/17 | | | 540,000 | | | | 584,550 | |
| | | | | | | | |
| | | Principal
Amount | | | Value | |
| | | | | | | | |
Telecommunications (continued) | | | | | | | | |
SBA Telecommunications, Inc.
8.25%, due 8/15/19 | | $ | 430,000 | | | $ | 476,225 | |
Sprint Nextel Corp. | | | | | | | | |
8.375%, due 8/15/17 | | | 825,000 | | | | 961,125 | |
9.125%, due 3/1/17 | | | 100,000 | | | | 117,750 | |
tw telecom holdings, Inc.
8.00%, due 3/1/18 | | | 250,000 | | | | 271,250 | |
Virgin Media Finance PLC
8.375%, due 10/15/19 | | | 375,000 | | | | 423,282 | |
Virgin Media Secured Finance PLC
5.25%, due 1/15/21 | | | 80,000 | | | | 86,209 | |
| | | | | | | | |
| | | | | | | 5,172,028 | |
| | | | | | | | |
Transportation 2.8% | | | | | | | | |
¨Florida East Coast Railway Corp.
8.125%, due 2/1/17 | | | 2,065,000 | | | | 2,212,131 | |
Syncreon Global Ireland, Ltd. / Syncreon Global Finance US, Inc.
9.50%, due 5/1/18 (b) | | | 370,000 | | | | 394,050 | |
| | | | | | | | |
| | | | | | | 2,606,181 | |
| | | | | | | | |
Trucking & Leasing 0.3% | | | | | | | | |
TRAC Intermodal LLC / TRAC Intermodal Corp.
11.00%, due 8/15/19 (b) | | | 290,000 | | | | 319,000 | |
| | | | | | | | |
|
Vitamins & Nutrition Products 0.6% | |
Alphabet Holding Co., Inc.
7.75%, due 11/1/17 (b)(c) | | | 490,000 | | | | 512,050 | |
| | | | | | | | |
Total Corporate Bonds
(Cost $83,373,733) | | | | | | | 83,767,746 | |
| | | | | | | | |
|
| Loan Assignments & Participations 2.6% (d) | |
Broadcasting 0.5% | |
Nielsen Finance LLC
USD Term Loan E
2.95%, due 5/2/16 | | | 498,750 | | | | 504,610 | |
| | | | | | | | |
|
Finance 0.7% | |
Ocwen Financial Corp.
Term Loan
5.00%, due 2/15/18 | | | 660,000 | | | | 670,107 | |
| | | | | | | | |
|
Lodging 0.2% | |
Cannery Casino Resorts LLC
New 2nd Lien Term Loan
10.00%, due 10/2/19 | | | 145,000 | | | | 142,281 | |
| | | | | | | | |
|
Miscellaneous—Manufacturing 0.7% | |
FGI Operating Co. LLC
Term Loan
5.50%, due 4/19/19 | | | 598,493 | | | | 598,493 | |
| | | | | | | | |
| | | | | | |
The notes to the financial statements are an integral part of,
and should be read in conjunction with, the financial statements. | | mainstayinvestments.com | | | 15 | |
Portfolio of Investments April 30, 2013 (Unaudited) (continued)
| | | | | | | | |
| | | Principal
Amount | | | Value | |
| | | | | | | | |
| Loan Assignments & Participations (continued) | |
Personal, Food & Miscellaneous Services 0.5% | |
Dunkin’ Brands, Inc.
Term Loan B3
3.75%, due 2/14/20 | | $ | 498,648 | | | $ | 503,545 | |
| | | | | | | | |
Total Loan Assignments & Participations
(Cost $2,383,642) | | | | | | | 2,419,036 | |
| | | | | | | | |
|
| Yankee Bond 0.3% (e) | |
Computers 0.3% | |
Seagate Technology HDD Holdings
6.80%, due 10/1/16 | | | 265,000 | | | | 299,450 | |
| | | | | | | | |
Total Yankee Bond
(Cost $298,305) | | | | | | | 299,450 | |
| | | | | | | | |
Total Long-Term Bonds
(Cost $86,969,686) | | | | | | | 87,412,607 | |
| | | | | | | | |
| | |
| Short-Term Investment 4.4% | | | | | | | | |
Repurchase Agreement 4.4% | | | | | | | | |
State Street Bank and Trust Co.
0.01%, dated 4/30/13
due 5/1/13
Proceeds at Maturity $4,063,878
(Collateralized by a Federal Home Loan Mortgage Corp. security with a rate of 2.10% and a maturity date of 10/17/22, with a Principal Amount of $4,175,000 and a Market Value of $4,148,146) | | | 4,063,877 | | | | 4,063,877 | |
| | | | | | | | |
Total Short-Term Investment
(Cost $4,063,877) | | | | | | | 4,063,877 | |
| | | | | | | | |
Total Investments
(Cost $91,033,563) (f) | | | 98.7 | % | | | 91,476,484 | |
Other Assets, Less Liabilities | | | 1.3 | | | | 1,191,855 | |
Net Assets | | | 100.0 | % | | $ | 92,668,339 | |
| (a) | Floating rate—Rate shown is the rate in effect as of April 30, 2013. |
| (b) | May be sold to institutional investors only under Rule 144A or securities offered pursuant to Section 4(a)(2) of the Securities Act of 1933, as amended. |
| (c) | PIK (“Payment in Kind”)—interest or dividend payment is made with additional securities. |
| (d) | Floating Rate Loan—generally pays interest at rates which are periodically re-determined at a margin above the London InterBank Offered Rate or other short-term rates. The rate shown is the rate(s) in effect as of April 30, 2013. |
| (e) | Yankee Bond—Dollar-denominated bond issued in the United States by a foreign bank or corporation. |
| (f) | As of April 30, 2013, cost is $91,033,563 for federal income tax purposes and net unrealized appreciation is as follows: |
| | | | |
Gross unrealized appreciation | | $ | 751,824 | |
Gross unrealized depreciation | | | (308,903 | ) |
| | | | |
Net unrealized appreciation | | $ | 442,921 | |
| | | | |
| | | | |
| 16 | | MainStay Short Duration High Yield Fund | | The notes to the financial statements are an integral part of,
and should be read in conjunction with, the financial statements. |
The following is a summary of the fair valuations according to the inputs used as of April 30, 2013, for valuing the Fund’s assets.
Asset Valuation Inputs
| | | | | | | | | | | | | | | | |
Description | | Quoted
Prices in
Active
Markets for
Identical
Assets
(Level 1) | | | Significant
Other
Observable
Inputs
(Level 2) | | | Significant
Unobservable
Inputs
(Level 3) | | | Total | |
| Investments in Securities (a) | | | | | | | | | | | | | | | | |
| Long-Term Bonds | | | | | | | | | | | | | | | | |
Convertible Bonds | | $ | — | | | $ | 926,375 | | | $ | — | | | $ | 926,375 | |
Corporate Bonds | | | — | | | | 83,767,746 | | | | — | | | | 83,767,746 | |
Loan Assignments & Participations | | | — | | | | 2,419,036 | | | | — | | | | 2,419,036 | |
Yankee Bond | | | — | | | | 299,450 | | | | — | | | | 299,450 | |
| | | | | | | | | | | | | | | | |
| Total Long-Term Bonds | | | — | | | | 87,412,607 | | | | — | | | | 87,412,607 | |
| | | | | | | | | | | | | | | | |
| Short-Term Investment | | | | | | | | | | | | | | | | |
Repurchase Agreement | | | — | | | | 4,063,877 | | | | — | | | | 4,063,877 | |
| | | | | | | | | | | | | | | | |
| Total Investments in Securities | | $ | — | | | $ | 91,476,484 | | | $ | — | | | $ | 91,476,484 | |
| | | | | | | | | | | | | | | | |
| (a) | For a complete listing of investments and their industries, see the Portfolio of Investments. |
The Fund recognizes transfers between the levels as of the beginning of the period.
For the period ended April 30, 2013, the Fund did not have any transfers between Level 1 and Level 2 fair value measurements. (See Note 2)
As of April 30, 2013, the Fund did not hold any investments with significant unobservable inputs (Level 3). (See Note 2)
| | | | | | |
The notes to the financial statements are an integral part of,
and should be read in conjunction with, the financial statements. | | mainstayinvestments.com | | | 17 | |
Statement of Assets and Liabilities as of April 30, 2013 (Unaudited)
| | | | |
| Assets | |
Investment in securities, at value
(identified cost $91,033,563) | | $ | 91,476,484 | |
Receivables: | | | | |
Interest | | | 1,673,379 | |
Fund shares sold | | | 529,166 | |
Investment securities sold | | | 53,380 | |
Other assets | | | 118,134 | |
| | | | |
Total assets | | | 93,850,543 | |
| | | | |
| |
| Liabilities | | | | |
Payables: | | | | |
Investment securities purchased | | | 992,998 | |
Fund shares redeemed | | | 109,546 | |
Manager (See Note 3) | | | 28,745 | |
Professional fees | | | 17,539 | |
Shareholder communication | | | 12,130 | |
Transfer agent (See Note 3) | | | 9,879 | |
NYLIFE Distributors (See Note 3) | | | 6,041 | |
Custodian | | | 516 | |
Trustees | | | 16 | |
Accrued expenses | | | 1,026 | |
Dividend payable | | | 3,768 | |
| | | | |
Total liabilities | | | 1,182,204 | |
| | | | |
Net assets | | $ | 92,668,339 | |
| | | | |
| |
| Composition of Net Assets | | | | |
Shares of beneficial interest outstanding (par value of $.01 per share) unlimited number of shares authorized | | $ | 91,986 | |
Additional paid-in capital | | | 91,957,909 | |
| | | | |
| | | 92,049,895 | |
Distributions in excess of net investment income | | | (8,245 | ) |
Accumulated net realized gain (loss) on investments | | | 183,768 | |
Net unrealized appreciation (depreciation) on investments | | | 442,921 | |
| | | | |
Net assets | | $ | 92,668,339 | |
| | | | |
| | | | |
Investor Class | | | | |
Net assets applicable to outstanding shares | | $ | 409,313 | |
| | | | |
Shares of beneficial interest outstanding | | | 40,627 | |
| | | | |
Net asset value per share outstanding | | $ | 10.07 | |
Maximum sales charge (3.00% of offering price) | | | 0.31 | |
| | | | |
Maximum offering price per share outstanding | | $ | 10.38 | |
| | | | |
Class A | | | | |
Net assets applicable to outstanding shares | | $ | 12,469,090 | |
| | | | |
Shares of beneficial interest outstanding | | | 1,237,835 | |
| | | | |
Net asset value per share outstanding | | $ | 10.07 | |
Maximum sales charge (3.00% of offering price) | | | 0.31 | |
| | | | |
Maximum offering price per share outstanding | | $ | 10.38 | |
| | | | |
Class C | | | | |
Net assets applicable to outstanding shares | | $ | 5,248,249 | |
| | | | |
Shares of beneficial interest outstanding | | | 520,938 | |
| | | | |
Net asset value and offering price per share outstanding | | $ | 10.07 | |
| | | | |
Class I | | | | |
Net assets applicable to outstanding shares | | $ | 74,516,175 | |
| | | | |
Shares of beneficial interest outstanding | | | 7,396,635 | |
| | | | |
Net asset value and offering price per share outstanding | | $ | 10.07 | |
| | | | |
Class R2 | | | | |
Net assets applicable to outstanding shares | | $ | 25,512 | |
| | | | |
Shares of beneficial interest outstanding | | | 2,534 | |
| | | | |
Net asset value and offering price per share outstanding | | $ | 10.07 | |
| | | | |
| | | | |
| 18 | | MainStay Short Duration High Yield Fund | | The notes to the financial statements are an integral part of,
and should be read in conjunction with, the financial statements. |
Statement of Operations for the period December 17, 2012 (inception date) through April 30, 2013 (Unaudited)
| | | | |
| Investment Income (Loss) | |
Income | | | | |
Interest (a) | | $ | 1,240,883 | |
| | | | |
Expenses | | | | |
Manager (See Note 3) | | | 158,229 | |
Professional fees | | | 22,089 | |
Offering (See Note 2) | | | 18,962 | |
Registration | | | 18,008 | |
Shareholder communication | | | 12,368 | |
Distribution/Service—Investor Class (See Note 3) | | | 130 | |
Distribution/Service—Class A (See Note 3) | | | 5,157 | |
Distribution/Service—Class C (See Note 3) | | | 6,810 | |
Distribution/Service—Class R2 (See Note 3) | | | 23 | |
Transfer agent (See Note 3) | | | 11,060 | |
Custodian | | | 2,937 | |
Trustees | | | 527 | |
Shareholder service (See Note 3) | | | 9 | |
Miscellaneous | | | 2,928 | |
| | | | |
Total expenses before waiver/reimbursement | | | 259,237 | |
Expense waiver/reimbursement from Manager (See Note 3) | | | (52,661 | ) |
| | | | |
Net expenses | | | 206,576 | |
| | | | |
Net investment income (loss) | | | 1,034,307 | |
| | | | |
|
| Realized and Unrealized Gain (Loss) on Investments | |
Net realized gain (loss) on investments | | | 183,768 | |
Net change in unrealized appreciation (depreciation) on investments | | | 442,921 | |
| | | | |
Net realized and unrealized gain (loss) on investments | | | 626,689 | |
| | | | |
Net increase (decrease) in net assets resulting from operations | | $ | 1,660,996 | |
| �� | | | |
| (a) | Interest recorded net of foreign withholding taxes in the amount of $752. |
| | | | | | |
The notes to the financial statements are an integral part of,
and should be read in conjunction with, the financial statements. | | mainstayinvestments.com | | | 19 | |
Statements of Changes in Net Assets
for the period December 17, 2012 (inception date) through April 30, 2013 (Unaudited)
| | | | |
| | | 2013 | |
| Increase (Decrease) in Net Assets | |
Operations: | | | | |
Net investment income (loss) | | $ | 1,034,307 | |
Net realized gain (loss) on investments | | | 183,768 | |
Net change in unrealized appreciation (depreciation) on investments | | | 442,921 | |
| | | | |
Net increase (decrease) in net assets resulting from operations | | | 1,660,996 | |
| | | | |
Dividends to shareholders: | | | | |
From net investment income: | | | | |
Investor Class | | | (2,807 | ) |
Class A | | | (105,371 | ) |
Class C | | | (31,754 | ) |
Class I | | | (902,280 | ) |
Class R2 | | | (340 | ) |
| | | | |
Total dividends to shareholders | | | (1,042,552 | ) |
| | | | |
Capital share transactions: | | | | |
Net proceeds from sale of shares | | | 92,919,316 | |
Net asset value of shares issued to shareholders in reinvestment of dividends | | | 1,035,723 | |
Cost of shares redeemed | | | (1,905,144 | ) |
| | | | |
Increase (decrease) in net assets derived from capital share transactions | | | 92,049,895 | |
| | | | |
Net increase (decrease) in net assets | | | 92,668,339 | |
|
| Net Assets | |
Beginning of period | | | — | |
| | | | |
End of period | | $ | 92,668,339 | |
| | | | |
Distributions in excess of net investment income at end of period | | $ | (8,245 | ) |
| | | | |
| | | | |
| 20 | | MainStay Short Duration High Yield Fund | | The notes to the financial statements are an integral part of,
and should be read in conjunction with, the financial statements. |
Financial Highlights selected per share data and ratios
| | | | |
| | | Investor Class | |
| | | December 17,
2012**
through
April 30, | |
| | | 2013* | |
Net asset value at beginning of period | | $ | 10.00 | |
| | | | |
Net investment income (loss) | | | 0.11 | |
Net realized and unrealized gain (loss) on investments | | | 0.08 | |
| | | | |
Total from investment operations | | | 0.19 | |
| | | | |
Less dividends: | | | | |
From net investment income | | | (0.12 | ) |
| | | | |
Net asset value at end of period | | $ | 10.07 | |
| | | | |
Total investment return (a) | | | 2.05 | %(b) |
Ratios (to average net assets)/Supplemental Data: | | | | |
Net investment income (loss) | | | 4.33 | %†† |
Net expenses | | | 1.01 | %†† |
Expenses (before waiver/reimbursement) | | | 1.23 | %†† |
Portfolio turnover rate | | | 25 | % |
Net assets at end of period (in 000’s) | | $ | 409 | |
| (a) | Total investment return is calculated exclusive of sales charges and assumes the reinvestment of dividends and distributions. |
| (b) | Total investment return is not annualized. |
| | | | |
| | | Class A | |
| | | December 17,
2012**
through
April 30, | |
| | | 2013* | |
Net asset value at beginning of period | | $ | 10.00 | |
| | | | |
Net investment income (loss) | | | 0.11 | |
Net realized and unrealized gain (loss) on investments | | | 0.08 | |
| | | | |
Total from investment operations | | | 0.19 | |
| | | | |
Less dividends: | | | | |
From net investment income | | | (0.12 | ) |
| | | | |
Net asset value at end of period | | $ | 10.07 | |
| | | | |
Total investment return (a) | | | 2.11 | %(b) |
Ratios (to average net assets)/Supplemental Data: | | | | |
Net investment income (loss) | | | 4.21 | %†† |
Net expenses | | | 1.05 | %†† |
Expenses (before waiver/reimbursement) | | | 1.27 | %†† |
Portfolio turnover rate | | | 25 | % |
Net assets at end of period (in 000’s) | | $ | 12,469 | |
| (a) | Total investment return is calculated exclusive of sales charges and assumes the reinvestment of dividends and distributions. |
| (b) | Total investment return is not annualized. |
| | | | | | |
The notes to the financial statements are an integral part of,
and should be read in conjunction with, the financial statements. | | mainstayinvestments.com | | | 21 | |
Financial Highlights selected per share data and ratios
| | | | |
| | | Class C | |
| | | December 17,
2012**
through
April 30, | |
| | | 2013* | |
Net asset value at beginning of period | | $ | 10.00 | |
| | | | |
Net investment income (loss) | | | 0.10 | |
Net realized and unrealized gain (loss) on investments | | | 0.08 | |
| | | | |
Total from investment operations | | | 0.18 | |
| | | | |
Less dividends: | | | | |
From net investment income | | | (0.11 | ) |
| | | | |
Net asset value at end of period | | $ | 10.07 | |
| | | | |
Total investment return (a) | | | 1.87 | %(b) |
Ratios (to average net assets)/Supplemental Data: | | | | |
Net investment income (loss) | | | 3.72 | %†† |
Net expenses | | | 1.76 | %†† |
Expenses (before waiver/reimbursement) | | | 1.98 | %†† |
Portfolio turnover rate | | | 25 | % |
Net assets at end of period (in 000’s) | | $ | 5,248 | |
| (a) | Total investment return is calculated exclusive of sales charges and assumes the reinvestment of dividends and distributions. |
| (b) | Total investment return is not annualized. |
| | | | |
| | | Class I | |
| | | December 17,
2012**
through
April 30, | |
| | | 2013* | |
Net asset value at beginning of period | | $ | 10.00 | |
| | | | |
Net investment income (loss) | | | 0.13 | |
Net realized and unrealized gain (loss) on investments | | | 0.07 | |
| | | | |
Total from investment operations | | | 0.20 | |
| | | | |
Less dividends: | | | | |
From net investment income | | | (0.13 | ) |
| | | | |
Net asset value at end of period | | $ | 10.07 | |
| | | | |
Total investment return (a) | | | 2.26 | %(b) |
Ratios (to average net assets)/Supplemental Data: | | | | |
Net investment income (loss) | | | 4.27 | %†† |
Net expenses | | | 0.80 | %†† |
Expenses (before waiver/reimbursement) | | | 1.02 | %†† |
Portfolio turnover rate | | | 25 | % |
Net assets at end of period (in 000’s) | | $ | 74,516 | |
| (a) | Total investment return is calculated exclusive of sales charges and assumes the reinvestment of dividends and distributions. Class I shares are not subject to sales charges. |
| (b) | Total investment return is not annualized. |
| | | | |
| 22 | | MainStay Short Duration High Yield Fund | | The notes to the financial statements are an integral part of,
and should be read in conjunction with, the financial statements. |
Financial Highlights selected per share data and ratios
| | | | |
| | | Class R2 | |
| | | December 17,
2012**
through
April 30, | |
| | | 2013* | |
Net asset value at beginning of period | | $ | 10.00 | |
| | | | |
Net investment income (loss) | | | 0.13 | |
Net realized and unrealized gain (loss) on investments | | | 0.06 | |
| | | | |
Total from investment operations | | | 0.19 | |
| | | | |
Less dividends: | | | | |
From net investment income | | | (0.12 | ) |
| | | | |
Net asset value at end of period | | $ | 10.07 | |
| | | | |
Total investment return (a) | | | 2.07 | %(b) |
Ratios (to average net assets)/Supplemental Data: | | | | |
Net investment income (loss) | | | 3.83 | %†† |
Net expenses | | | 1.15 | %†† |
Expenses (before waiver/reimbursement) | | | 1.37 | %†† |
Portfolio turnover rate | | | 25 | % |
Net assets at end of period (in 000’s) | | $ | 26 | |
| (a) | Total investment return is calculated exclusive of sales charges and assumes the reinvestment of dividends and distributions. Class R2 shares are not subject to sales charges. |
| (b) | Total investment return is not annualized. |
| | | | | | |
The notes to the financial statements are an integral part of,
and should be read in conjunction with, the financial statements. | | mainstayinvestments.com | | | 23 | |
Notes to Financial Statements (Unaudited)
Note 1–Organization and Business
MainStay Funds Trust (the “Trust”) was organized as a Delaware statutory trust on April 28, 2009, and is governed by a Declaration of Trust. The Trust is registered under the Investment Company Act of 1940, as amended (the “1940 Act”), as an open-end investment management company, and is comprised of thirty-three funds (collectively referred to as the “Funds”). These financial statements and notes relate only to the MainStay Short Duration High Yield Fund (the “Fund”), a diversified fund.
The Fund currently offers five classes of shares: Investor Class, Class A, Class C, Class I and Class R2 shares. The inception date was on December 17, 2012. Investor Class and Class A shares are offered at net asset value (“NAV”) per share plus an initial sales charge. No sales charge applies to investments of $1 million or more (and certain other qualified purchases) in Investor Class and Class A shares, but a contingent deferred sales charge (“CDSC”) is imposed on certain redemptions made within one year of the date of purchase. Class C shares are offered at NAV without an initial sales charge and a 1.00% CDSC may be imposed on redemptions made within 18 months of the date of purchase of Class C shares. Class I and Class R2 shares are offered at NAV and are not subject to a sales charge. Depending upon eligibility, Investor Class shares may convert to Class A shares and Class A shares may convert to Investor Class shares. The five classes of shares have the same voting (except for issues that relate solely to one class), dividend, liquidation and other rights, and the same terms and conditions, except that Class C shares are subject to higher distribution and/or service fee rates than Investor Class, Class A and Class R2 shares under a distribution plan pursuant to Rule 12b-1 under the 1940 Act. Class I shares are not subject to a distribution and/or service fee. Class R2 shares are subject to a shareholder service fee. This is in addition to any fees paid under a distribution plan, where applicable.
The Fund’s investment objective is to seek high current income. Capital appreciation is a secondary objective.
Note 2–Significant Accounting Policies
The Fund prepares its financial statements in accordance with generally accepted accounting principles (“GAAP”) in the United States of America and follows the significant accounting policies described below.
(A) Securities Valuation. Investments are valued as of the close of regular trading on the New York Stock Exchange (“Exchange”) (generally 4:00 p.m. Eastern time) on each day the Fund is open for business (“valuation date”).
The Board of Trustees (the “Board”) has adopted procedures for the valuation of the Fund’s securities and has delegated the responsibility for valuation determination under those procedures to the Valuation Committee of the Fund (the “Valuation Committee”). The Board has authorized the Valuation Committee to appoint a Valuation Sub-Committee (the “Sub-Committee”) to deal in the first instance with questions that arise or cannot be resolved under these procedures. The Sub-Committee meets (in person, via electronic mail or via teleconference) on an as-needed basis. The Valuation Committee meets at a later time, as necessary, to ensure that actions taken by the Sub-Committee were appropriate. The procedures recognize that, subject to the oversight of the Board and unless otherwise noted, the responsibility for day-to-day valuation of portfolio assets (including securities for
which market prices are not readily available) rests with New York Life Investment Management LLC ( “New York Life Investments” or the “Manager”), aided to whatever extent necessary by the Subadvisor (as defined in Note 3(A)) of the Fund.
To assess the appropriateness of security valuations, the Manager or the Fund’s third party service provider who is subject to oversight by the Manager, regularly compares prior day prices, prices on comparable securities and the sale prices to the prior and current day prices and challenges prices exceeding certain tolerance levels with third party pricing services or broker sources. For those securities valued by recommendation, whether through a standardized fair valuation methodology or a fair valuation determination, the Valuation Committee reviews and affirms the reasonableness of the valuation based on such methodologies and determinations on a regular basis after considering all relevant information that is reasonably available.
“Fair value” is defined as the price that the Fund would receive upon selling an investment in an orderly transaction to an independent buyer in the principal or most advantageous market of the investment. Fair value measurements are determined within a framework that has established a three-tier hierarchy which maximizes the use of observable market data and minimizes the use of unobservable inputs to establish classification of fair value measurements for disclosure purposes. “Inputs” refers broadly to the assumptions that market participants would use in pricing the asset or liability, including assumptions about risk, such as the risk inherent in a particular valuation technique used to measure fair value using a pricing model and/or the risk inherent in the inputs for the valuation technique. Inputs may be observable or unobservable. Observable inputs reflect the assumptions market participants would use in pricing the asset or liability based on market data obtained from sources independent of the Fund. Unobservable inputs reflect the Fund’s own assumptions about the assumptions market participants would use in pricing the asset or liability developed based on the information available in the circumstances. The inputs or methodology used for valuing securities may not be an indication of the risks associated with investing in those securities. The three-tier hierarchy of inputs is summarized in the three broad Levels listed below.
| • | | Level 1—quoted prices in active markets for identical investments |
| • | | Level 2—other significant observable inputs (including quoted prices for similar investments in active markets, interest rates and yield curves, prepayment speeds, credit risks, etc.) |
| • | | Level 3—significant unobservable inputs (including the Fund’s own assumptions about the assumptions that market participants would use in determining the fair value of investments) |
The aggregate value by input level, as of April 30, 2013, for the Fund’s investments is included at the end of the Fund’s Portfolio of Investments.
The valuation techniques used by the Fund to measure fair value maximize the use of observable inputs and minimize the use of unobservable inputs. The Fund may utilize third party vendor
| | |
| 24 | | MainStay Short Duration High Yield Fund |
evaluations, whose prices may be derived from one or more of the following standard inputs:
| | |
• Benchmark Yields | | • Reported Trades |
• Broker Dealer Quotes | | • Issuer Spreads |
• Two-sided markets | | • Benchmark securities |
• Bids/Offers | | • Reference Data (corporate actions or material event notices) |
• Industry and economic events | | • Comparable bonds |
• Equity and credit default swap curves | | • Monthly payment information |
Securities for which market values cannot be determined using the methodologies described above are valued by methods deemed in good faith by the Fund’s Valuation Committee, following the procedures established by the Board, to represent fair value. Under these procedures, the Fund primarily employs a market-based approach which may use related or comparable assets or liabilities, recent transactions, market multiples, book values, and other relevant information. The Fund may also use an income-based valuation approach in which the anticipated future cash flows of the investment are discounted to calculate fair value. Discounts may also be applied due to the nature or duration of any restrictions on the disposition of the investments. Due to the inherent uncertainty of valuations of such investments, the fair values may differ significantly from the values that would have been used had an active market existed. For the period ended April 30, 2013, there have been no changes to the fair value methodologies.
Equity and non-equity securities which may be valued in this manner include, but are not limited to: (i) a security for which the trading has been halted or suspended; (ii) a debt security that has recently gone into default and for which there is not a current market quotation; (iii) a security of an issuer that has entered into a restructuring; (iv) a security that has been de-listed from a national exchange; (v) a security for which the market price is not available from a third party pricing source or, if so provided, does not, in the opinion of the Fund’s Manager or Subadvisor reflect the security’s market value; and (vi) a security whose principal market has been temporarily closed at a time when, under normal conditions, it would be open. Securities for which market quotations or observable inputs are not readily available are generally categorized as Level 3 in the hierarchy. As of April 30, 2013, the Fund did not hold any securities that were fair valued in such a manner.
Equity securities and Exchange Traded Funds are valued at the latest quoted sales prices as of the close of regular trading on the Exchange on each valuation date. Securities that are not traded on the valuation date are valued at the mean of the latest quoted bid and ask prices. Prices normally are taken from the principal market in which each security trades. Investments in other mutual funds are valued at their respective NAVs as of the close of the Exchange on the valuation date. These securities are generally categorized as Level 1 in the hierarchy.
Debt securities (other than convertible bonds and municipal debt securities) are valued at the evaluated bid prices (evaluated mean prices in the case of convertible bonds and municipal debt securities) supplied by a pricing agent or brokers selected by the Fund’s Manager in consultation with the Fund’s Subadvisor, whose prices reflect broker/dealer supplied valuations and electronic data processing techniques, if such prices are deemed by the Fund’s Manager, in consultation with the
Fund’s Subadvisor to be representative of market values, at the regular close of trading of the Exchange on each valuation date. Debt securities, including corporate bonds, U.S. government and federal agency bonds, municipal bonds, foreign bonds, Yankee bonds, convertible bonds, asset-backed securities and mortgage-backed securities are generally categorized as Level 2 in the hierarchy.
Temporary cash investments acquired over 60 days to maturity are valued using the latest bid prices or using valuations based on a matrix system (which considers such factors as security prices, yields, maturities, and ratings), both as furnished by independent pricing services. Other temporary cash investments which mature in 60 days or less (“Short-Term Investments”) are valued at amortized cost. The amortized cost method involves valuing a security at its cost on the date of purchase and thereafter assuming a constant amortization to maturity of the difference between such cost and the value on maturity date. Amortized cost approximates the current fair value of a security. Securities valued at amortized cost are not valued using a quoted price in an active market. These securities are generally categorized as Level 2 in the hierarchy.
Loan assignments, participations and commitments are valued at the average of bid quotations obtained from the engaged independent pricing service and are generally categorized as Level 2 in the hierarchy. Certain loan assignments, participations and commitments may be valued by single broker quotes obtained from the engaged independent pricing service with significant unobservable inputs and are generally categorized as Level 3 in the hierarchy. For these loan assignments, participations and commitments the Manager may consider additional factors such as liquidity of the Fund’s investments.
(B) Income Taxes. The Fund’s policy is to comply with the requirements of the Internal Revenue Code of 1986, as amended (the “Internal Revenue Code”), applicable to regulated investment companies and to distribute all of the taxable income to the shareholders of the Fund within the allowable time limits. Therefore, no federal, state and local income tax provision is required.
Management evaluates its tax positions to determine if the tax positions taken meet the minimum recognition threshold in connection with accounting for uncertainties in income tax positions taken or expected to be taken for the purposes of measuring and recognizing tax liabilities in the financial statements. Recognition of tax benefits of an uncertain tax position is required only when the position is “more likely than not” to be sustained assuming examination by taxing authorities. Management has analyzed the Fund’s tax positions taken on federal, state and local income tax returns for all open tax years (for up to three tax years), and has concluded that no provision for federal, state and local income tax is required in the Fund’s financial statements. The Fund’s federal, state and local income and federal excise tax returns for tax years for which the applicable statutes of limitations have not expired are subject to examination by the Internal Revenue Service and state and local departments of revenue.
(C) Dividends and Distributions to Shareholders. Dividends and distributions are recorded on the ex-dividend date. The Fund intends to declare and pay dividends of net investment income, if any, at least monthly and distributions of net realized capital and currency gains, if any, at least annually. Unless the shareholder elects otherwise,
| | | | |
| mainstayinvestments.com | | | 25 | |
Notes to Financial Statements (Unaudited) (continued)
all dividends and distributions are reinvested in the same class of shares of the Fund, at NAV. Dividends and distributions to shareholders are determined in accordance with federal income tax regulations and may differ from GAAP.
(D) Security Transactions and Investment Income. The Fund records security transactions on the trade date. Realized gains and losses on security transactions are determined using the identified cost method. Dividend income is recognized on the ex-dividend date and interest income is accrued as earned using the effective interest rate method. Discounts and premiums on securities purchased, other than Short-Term Investments, for the Fund are accreted and amortized, respectively, on the effective interest rate method over the life of the respective securities or, in the case of a callable security, over the period to the first date of call. Discounts and premiums on Short-Term Investments are accreted and amortized, respectively, on the straight-line method.
Investment income and realized and unrealized gains and losses on investments of the Fund are allocated to separate classes of shares pro rata based upon their relative net assets on the date the income is earned or realized and unrealized gains and losses are incurred.
The Fund may place a debt obligation on non-accrual status and reduce related interest income by ceasing current accruals and writing off interest receivables when the collection of all or a portion of interest has become doubtful based on consistently applied procedures. A debt obligation is removed from non-accrual status when the issuer resumes interest payments or when collectability of interest is reasonably assured.
(E) Expenses. Expenses of the Trust are allocated to the individual Funds in proportion to the net assets of the respective Funds when the expenses are incurred, except where direct allocations of expenses can be made. Expenses (other than transfer agent expenses and fees incurred under the shareholder services plans and the distribution plans further discussed in Note 3(B)) are allocated to separate classes of shares pro rata based upon their relative net assets on the date the expenses are incurred. The expenses borne by the Fund, including those of related parties to the Fund, are shown in the Statement of Operations.
(F) Use of Estimates. In preparing financial statements in conformity with GAAP, management makes estimates and assumptions that affect the reported amounts and disclosures in the financial statements. Actual results could differ from those estimates.
(G) Repurchase Agreements. The Fund may enter into repurchase agreements to earn income. The Fund may enter into repurchase agreements only with financial institutions that are deemed by the Manager or Subadvisor to be creditworthy, pursuant to guidelines established by the Fund’s Board. During the term of any repurchase agreement, the Manager or Subadvisor will continue to monitor the creditworthiness of the seller. Under the 1940 Act, repurchase agreements are considered to be collateralized loans by a Fund to the seller secured by the securities transferred to the Fund.
When the Fund invests in repurchase agreements, the Fund’s custodian takes possession of the collateral pledged for investments in the repurchase agreement. The underlying collateral is valued daily on a
mark-to-market basis to determine that the value, including accrued interest, exceeds the repurchase price. In the event of the seller’s default on the obligation to repurchase, the Fund has the right to liquidate the collateral and apply the proceeds in satisfaction of the obligation. Under certain circumstances, such as in the event of default or bankruptcy by the counterparty to the agreement, realization and/or retention of the collateral may be subject to legal proceedings and possible realized loss to the Fund.
(H) Loan Assignments, Participations and Commitments. The Fund may invest in loan assignments and loan participations (“loans”). Loans are agreements to make money available (a “commitment”) to a borrower in a specified amount, at a specified rate and within a specified time. Such loans are typically senior, secured and collateralized in nature. The Fund records an investment when the borrower withdraws money and records interest as earned. These loans pay interest at rates that are periodically reset by reference to a base lending rate plus a spread. These base lending rates are generally the prime rate offered by a designated U.S. bank or the London InterBank Offered Rate.
The loans in which the Fund invests are generally readily marketable, but may be subject to some restrictions on resale. For example, the Fund may be contractually obligated to receive approval from the agent bank and/or borrower prior to the sale of these investments. The Fund assumes the credit risk of the borrower, the selling participant and any other persons interpositioned between the Fund and the borrower (“intermediate participants”). In the event that the borrower, selling participant or intermediate participants become insolvent or enters into bankruptcy, the Fund may incur certain costs and delays in realizing payment, or may suffer a loss of principal and/or interest.
Unfunded commitments represent the remaining obligation of the Fund to the borrower. At any point in time, up to the maturity date of the issue, the borrower may demand the unfunded portion. These unfunded amounts are marked to market and any unrealized gains and losses are recorded in the Statement of Assets and Liabilities. As of April 30, 2013, the Fund did not hold any unfunded commitments.
(I) Offering Costs. Costs incurred by the Fund in connection with the commencement of the Fund’s operations. These costs are being amortized on a straight line basis over twelve months.
(J) Securities Lending. In order to realize additional income, the Fund may engage in securities lending, subject to the limitations set forth in the 1940 Act and relevant guidance by the staff of the Securities and Exchange Commission. In the event the Fund does engage in securities lending, the Fund will lend through its custodian, State Street Bank and Trust Company (“State Street”). State Street will manage the Fund’s cash collateral in accordance with the lending agreement between the Fund and State Street, and indemnify the Fund’s portfolio against counterparty risk. The loans will be collateralized by cash or securities at least equal at all times to the market value of the securities loaned. Collateral will consist of U.S. Government securities, cash equivalents or irrevocable letters of credit. The Fund may bear the risk of delay in recovery of, or loss of rights in, the securities loaned should the borrower of the securities experience financial difficulty. The Fund may also record realized gain or loss on securities deemed sold due to a borrower’s inability to return securities on loan. The Fund will receive
| | |
| 26 | | MainStay Short Duration High Yield Fund |
compensation for lending its securities in the form of fees or the retention of a portion of the interest on the investment of any cash received as collateral. The Fund also will continue to receive interest and dividends on the securities loaned and any gain or loss in the market price of the securities loaned that may occur during the term of the loan will be for the account of the Fund.
Although the Fund and New York Life Investments have temporarily suspended securities lending, the Fund and New York Life Investments reserve the right to reinstitute lending when deemed appropriate. The Fund did not have any portfolio securities on loan as of April 30, 2013.
(K) Concentration of Risk. The Fund’s principal investments include high-yield securities (sometimes called ‘‘junk bonds’’), which are generally considered speculative because they present a greater risk of loss, including default, than higher quality debt securities. These securities pay investors a premium—a high interest rate or yield—because of the increased risk of loss. These securities can also be subject to greater price volatility.
(L) Indemnifications. Under the Trust’s organizational documents, its officers and trustees are indemnified against certain liabilities that may arise out of performance of their duties to the Trust. Additionally, in the normal course of business, the Fund enters into contracts with third-party service providers that contain a variety of representations and warranties and which may provide general indemnifications. The Fund’s maximum exposure under these arrangements is unknown, as this would involve future claims that may be made against the Fund that have not yet occurred. Based on experience, management is of the view that the risk of loss in connection with these potential indemnification obligations is remote. However, there can be no assurance that material liabilities related to such obligations will not arise in the future, which could adversely impact the Fund.
Note 3–Fees and Related Party Transactions
(A) Manager and Subadvisor. New York Life Investments, a registered investment adviser and an indirect, wholly-owned subsidiary of New York Life Insurance Company (“New York Life”), serves as the Fund’s Manager, pursuant to an Amended and Restated Management Agreement (“Management Agreement”). The Manager provides offices, conducts clerical, recordkeeping and bookkeeping services, and keeps most of the financial and accounting records required to be maintained by the Fund. Except for the portion of salaries and expenses that are the responsibility of the Fund, the Manager pays the salaries and expenses of all personnel affiliated with the Fund and certain operational expenses of the Fund. The Fund reimburses New York Life Investments in an amount equal to a portion of the salary of the Chief Compliance Officer (“CCO”) of the Fund. MacKay Shields LLC (‘‘MacKay Shields” or the “Subadvisor’’), a registered investment adviser and an indirect, wholly-owned subsidiary of New York Life, serves as Subadvisor to the Fund and is responsible for the day-to-day portfolio management of the Fund. Pursuant to the terms of an Amended and Restated Subadvisory Agreement (“Subadvisory Agreement”) between New York Life Investments and MacKay Shields, New York Life Investments pays for the services of the Subadvisor.
The Fund pays the Manager a monthly fee for services performed and facilities furnished at an annual rate of 0.65% of the Fund’s average daily net assets.
New York Life Investments has contractually agreed to waive fees and/or reimburse expenses so that Total Annual Fund Operating Expenses for Class A shares do not exceed 1.05% of its average daily net assets. New York Life Investments will apply an equivalent waiver or reimbursement, in an equal number of basis points, to the other share classes of the Fund. This agreement will remain in effect until February 28, 2014, and shall renew automatically for one-year terms unless New York Life Investments provides written notice of termination prior to the start of the next term or upon approval of the Board. Total Annual Fund Operating Expenses excludes taxes, interest, litigation, extraordinary expenses, brokerage and other transaction expenses relating to the purchase or sale of portfolio investments, and acquired (underlying) fund fees and expenses.
For the period ended April 30, 2013, New York Life Investments earned fees from the Fund in the amount of $158,229 and waived its fees and/or reimbursed expenses in the amount of $52,661.
State Street, 1 Lincoln Street, Boston, Massachusetts 02111, provides sub-administration and sub-accounting services to the Fund pursuant to an agreement with New York Life Investments. These services include calculating the daily NAVs of the Fund, maintaining the general ledger and sub-ledger accounts for the calculation of the Fund’s respective NAVs, and assisting New York Life Investments in conducting various aspects of the Fund’s administrative operations. For providing these services to the Fund, State Street is compensated by New York Life Investments.
(B) Distribution, Service and Shareholder Service Fees. The Trust, on behalf of the Fund, has entered into a distribution agreement with NYLIFE Distributors LLC (the ‘‘Distributor’’), an indirect, wholly-owned subsidiary of New York Life. The Fund has adopted distribution plans (the ‘‘Plans’’) in accordance with the provisions of Rule 12b-1 under the 1940 Act.
Pursuant to the Investor Class, Class A and Class R2 Plans, the Distributor receives a monthly distribution fee from the Investor Class, Class A and Class R2 shares at an annual rate of 0.25% of the average daily net assets of the Investor Class, Class A and Class R2 shares for distribution and/or service activities as designated by the Distributor. Pursuant to the Class C Plan pay the Distributor a monthly distribution fee at an annual rate of 0.75% of the average daily net assets of the Class C shares, along with a service fee at an annual rate of 0.25% of the average daily net assets of the Class C shares, for a total 12b-1 fee of 1.00%. Class I shares are not subject to a distribution and/or service fee.
The Plans provide that the distribution and service fees are payable to the Distributor regardless of the amounts actually expended by the Distributor for distribution of the Fund’s shares and service activities.
In accordance with the Shareholder Services Plan for the Class R2 shares, the Manager has agreed to provide, through its affiliates or independent third parties, various shareholder and administrative support services to shareholders of the Class R2 shares. For its services, the Manager is entitled to a Shareholder Service Fee accrued daily and paid monthly at an annual rate of 0.10% of the average daily net assets of the Class R2 shares. This is in addition to any fees paid under a distribution plan, where applicable.
| | | | |
| mainstayinvestments.com | | | 27 | |
Notes to Financial Statements (Unaudited) (continued)
For the period ended April 30, 2013, the Fund incurred shareholder service fees of $9.
(C) Sales Charges. The Fund was advised by the Distributor that the amount of sales charges retained on sales of Investor Class and Class A shares were $452 and $4,589, respectively, for the period ended April 30, 2013. The Fund was also advised that the Distributor retained CDSCs on redemptions of Class C shares of $38 for the period ended April 30, 2013.
(D) Transfer, Dividend Disbursing and Shareholder Servicing Agent. NYLIM Service Company LLC, an affiliate of New York Life Investments, is the Fund’s transfer, dividend disbursing and shareholder servicing agent pursuant to an agreement between NYLIM Service Company LLC and the Trust. NYLIM Service Company LLC has entered into an agreement with Boston Financial Data Services, Inc. (“BFDS”) pursuant to which BFDS performs certain transfer agent services on behalf of NYLIM Service Company LLC. Transfer agent expenses incurred by the Fund for the period ended April 30, 2013, were as follows:
| | | | |
Investor Class | | $ | 3 | |
Class A | | | 962 | |
Class C | | | 43 | |
Class I | | | 10,048 | |
Class R2 | | | 4 | |
(E) Small Account Fee. Shareholders with small accounts adversely impact the cost of providing transfer agency services. In an effort to reduce total transfer agency expenses, the Fund has implemented a small account fee on certain types of accounts. Certain shareholders with an account balance of less than $1,000 are charged an annual per account fee of $20 (assessed semi-annually), the proceeds from which offset transfer agent fees as reflected in the Statement of Operations.
(F) Capital. As of April 30, 2013, New York Life and its affiliates beneficially held shares of the Fund with values and percentages of net assets as follows:
| | | | | | | | |
Investor Class | | $ | 25,424 | | | | 6.2 | % |
Class A | | | 25,439 | | | | 0.2 | |
Class C | | | 25,393 | | | | 0.5 | |
Class I | | | 10,086,443 | | | | 13.5 | |
Class R2 | | | 25,430 | | | | 99.7 | |
Note 4–Custodian
State Street is the custodian of the cash and the securities of the Fund. Custodial fees are charged to the Fund based on the market value of securities in the Fund and the number of certain cash transactions incurred by the Fund.
Note 5–Line of Credit
The Fund and certain affiliated funds maintain a line of credit with a syndicate of banks in order to secure a source of funds for temporary purposes to meet unanticipated or excessive redemption requests.
Effective August 29, 2012, under a second amended and restated credit agreement (the “Credit Agreement”), the aggregate commitment amount is $200,000,000 with an optional maximum amount of $250,000,000. The commitment fee is an annual rate of 0.08% of the average commitment amount payable quarterly, regardless of usage, to Bank of New York Mellon, which serves as the agent to the syndicate. The commitment fee is allocated among the Fund and certain affiliated funds based upon net assets and other factors. Interest on any revolving credit loan is charged based upon the Federal Funds Advances rate or the one month London InterBank Offered Rate, whichever is higher. The Credit Agreement expires on August 28, 2013, although the Fund, certain affiliated funds and the syndicate of banks may renew the Credit Agreement for an additional year on the same or different terms. There were no borrowings made or outstanding with respect to the Fund on the Credit Agreement during the six-month period ended April 30, 2013.
Note 6–Purchases and Sales of Securities (in 000’s)
During the period ended April 30, 2013, purchases and sales of securities, other than short-term securities, were $102,769 and $15,617, respectively.
Note 7–Capital Share Transactions
| | | | | | | | |
Investor Class (a) | | Shares | | | Amount | |
Six-month period ended April 30, 2013: | | | | | | | | |
Shares sold | | | 39,213 | | | $ | 393,628 | |
Shares issued to shareholders in reinvestment of dividends | | | 278 | | | | 2,797 | |
Shares redeemed | | | (547 | ) | | | (5,500 | ) |
| | | | | | | | |
Net increase (decrease) in shares outstanding before conversion | | | 38,944 | | | | 390,925 | |
Shares converted into Investor Class
(See Note 1) | | | 1,683 | | | | 16,929 | |
| | | | |
Net increase (decrease) | | | 40,627 | | | $ | 407,854 | |
| | | | |
|
| |
Class A (a) | | Shares | | | Amount | |
Six-month period ended April 30, 2013: | | | | | | | | |
Shares sold | | | 1,302,770 | | | $ | 13,067,619 | |
Shares issued to shareholders in reinvestment of dividends | | | 10,041 | | | | 100,797 | |
Shares redeemed | | | (73,293 | ) | | | (735,639 | ) |
| | | | | | | | |
Net increase (decrease) in shares outstanding before conversion | | | 1,239,518 | | | | 12,432,777 | |
Shares converted from Class A (See Note 1) | | | (1,683 | ) | | | (16,929 | ) |
| | | | |
Net increase (decrease) | | | 1,237,835 | | | $ | 12,415,848 | |
| | | | |
| | |
| | | | | | | | |
Class C (a) | | Shares | | | Amount | |
Six-month period ended April 30, 2013: | | | | | | | | |
Shares sold | | | 518,733 | | | $ | 5,203,770 | |
Shares issued to shareholders in reinvestment of dividends | | | 2,967 | | | | 29,805 | |
Shares redeemed | | | (762 | ) | | | (7,662 | ) |
| | | | |
Net increase (decrease) | | | 520,938 | | | $ | 5,225,913 | |
| | | | |
|
| |
| | |
| 28 | | MainStay Short Duration High Yield Fund |
| | | | | | | | |
Class I (a) | | Shares | | | Amount | |
Six-month period ended April 30, 2013: | | | | | | | | |
Shares sold | | | 7,422,159 | | | $ | 74,229,299 | |
Shares issued to shareholders in reinvestment of dividends | | | 89,918 | | | | 901,984 | |
Shares redeemed | | | (115,442 | ) | | | (1,156,343 | ) |
| | | | |
Net increase (decrease) | | | 7,396,635 | | | $ | 73,974,940 | |
| | | | |
|
| |
Class R2 (a) | | Shares | | | Amount | |
Six-month period ended April 30, 2013: | | | | | | | | |
Shares sold | | | 2,500 | | | $ | 25,000 | |
Shares issued to shareholders in reinvestment of dividends | | | 34 | | | | 340 | |
| | | | |
Net increase (decrease) | | | 2,534 | | | $ | 25,340 | |
| | | | |
|
(a) The inception date of the Fund was December 17, 2012. | |
Note 8–Subsequent Events
In connection with the preparation of the financial statements of the Fund as of and for the period ended April 30, 2013, events and transactions subsequent to April 30, 2013, through the date the financial statements were issued have been evaluated by the Fund’s management for possible adjustment and/or disclosure. No subsequent events requiring financial statement adjustment or disclosure have been identified.
| | | | |
| mainstayinvestments.com | | | 29 | |
Board Consideration and Approval of Management Agreement and
Subadvisory Agreement (Unaudited)
Section 15(c) of the Investment Company Act of 1940, as amended (the “1940 Act”) requires that each mutual fund’s board of trustees, including a majority of the independent trustees, review and approve the fund’s investment advisory agreements. At its December 10-12, 2012 meeting, the Board of Trustees of the MainStay Group of Funds (“Board”) unanimously approved the Management Agreement with respect to the MainStay Short Duration High Yield Fund (“Fund”) and New York Life Investment Management LLC (“New York Life Investments”), and the Subadvisory Agreement between New York Life Investments and MacKay Shields LLC (“MacKay Shields”) with respect to the Fund.
In reaching its decision to approve the Agreements, the Board considered information furnished by New York Life Investments and MacKay Shields specifically in connection with the contract review process that took place in advance of its December 2012 meeting, which included responses from New York Life Investments and MacKay Shields to a comprehensive list of questions encompassing a variety of topics prepared on behalf of the Board by independent legal counsel to the Board and its independent trustees (the “Independent Trustees”). The Board also considered information provided by New York Life Investments and MacKay Shields on the fees charged to other investment advisory clients (including institutional separate accounts) that follow the investment strategies similar to those proposed for the Fund, and the rationale for any differences in the Fund’s proposed management and subadvisory fees and the fees charged to those other investment advisory clients. The Board also considered relevant information previously provided to the Board in connection with its review of the investment advisory agreements for other MainStay Funds.
In determining to approve the Agreements, the members of the Board reviewed and evaluated all of the information and factors they believed to be relevant and appropriate in light of legal advice furnished to them by independent legal counsel and through the exercise of their own business judgment. The broad factors considered by the Board are discussed in greater detail below, and included, among other items: (i) the nature, extent, and quality of the services to be provided to the Fund by New York Life Investments and MacKay Shields; (ii) the qualifications of the proposed portfolio managers for the Fund and the historical investment performance of products previously managed by such portfolio managers with similar investment strategies to the Fund; (iii) the anticipated costs of the services to be provided, and profits expected to be realized, by New York Life Investments and its affiliates, including MacKay Shields, from their relationships with the Fund; (iv) the extent to which economies of scale may be realized as the Fund grows, and the extent to which economies of scale may benefit Fund investors; and (v) the reasonableness of the Fund’s proposed management and subadvisory fees and overall total ordinary operating expenses, particularly as compared to similar funds and accounts managed by New York Life Investments and MacKay Shields.
While individual members of the Board may have weighed certain factors differently, the Board’s decisions to approve the Agreements were based on a consideration of all the information provided to the Board, including information provided to the Board specifically in connection with the contract review processes. In addition to considering the above-referenced factors, the Board observed that in the marketplace there are a range of investment options available to shareholders of the
Fund, and that the Fund’s shareholders, having had the opportunity to consider other investment options, will have chosen to invest in the Fund. A more detailed discussion of the factors that figured prominently in the Board’s decisions to approve the Agreements is provided below.
Nature, Scope and Quality of Services to Be Provided by New York Life Investments and MacKay Shields
The Board examined the nature scope and quality of the services that New York Life Investments proposed to provide to the Fund. The Board evaluated New York Life Investments’ experience in serving as manager of other mutual funds, noting that New York Life Investments manages other mutual funds, serves a variety of other investment advisory clients, including other pooled investment vehicles, and has experience with overseeing mutual fund service providers, including subadvisers. The Board considered the experience of senior personnel at New York Life Investments proposed to provide management and administrative services to the Fund, as well as New York Life Investments’ reputation and financial condition. The Board also considered the full range of non-advisory services that New York Life Investments will supply to the Fund under the terms of the Fund’s Management Agreement, including: (i) fund accounting services provided by New York Life Investments’ Fund Accounting and Administration Group; (ii) investment oversight and analytical services provided by New York Life Investments’ Investment Consulting Group; (iii) compliance services provided by New York Life Investments’ compliance department, including oversight and implementation of the Fund’s compliance program; and (iv) legal services provided by New York Life Investments’ Office of the General Counsel. Additional information about the non-advisory services provided by New York Life Investments is to be set forth in the Management Agreement. The Board also considered New York Life Investments’ willingness to invest in personnel that benefit the Fund, and noted that New York Life Investments is responsible for compensating the Fund’s officers. The Board also considered benefits to shareholders of being part of the MainStay Group of Funds, including the privilege of exchanging investments between the same class of shares without the imposition of a sales charge, as described more fully in the Fund’s prospectus.
The Board also examined the nature, scope and quality of the advisory services that MacKay Shields proposed to provide to the Fund. The Board evaluated MacKay Shields’ experience in managing other portfolios, including those with similar investment strategies to the Fund. It examined MacKay Shields’ track record and experience in providing investment advisory services, the experience of investment advisory, senior management and administrative personnel at MacKay Shields, and MacKay Shields’ overall legal and compliance environment. The Board also reviewed MacKay Shields’ willingness to invest in personnel designed to benefit the Fund. In this regard, the Board considered the experience of the Fund’s proposed portfolio managers, including with respect to other products with similar investment strategies to the Fund, the number of accounts managed by the portfolio managers and the method for compensating portfolio managers.
Based on these considerations, the Board concluded, within the context of its overall determinations regarding the Agreements, that the Fund likely would benefit from the nature, extent and quality of these services as a result of New York Life Investments’ and MacKay Shields’ experience, personnel, operations and resources.
| | |
| 30 | | MainStay Short Duration High Yield Fund |
Investment Performance
In connection with the Board’s consideration of the Agreements, the Board noted that the Fund had no investment performance track record since the Fund had not yet been offered to investors. The Board discussed with management and the Fund’s proposed portfolio management team the Fund’s investment process, strategies and risks. Additionally, the Board considered the historical performance of other investment portfolios with similar investment strategies that are or have been managed by the proposed portfolio managers for the Fund. Based on these considerations, the Board concluded that the Fund was likely to be managed responsibly and capably by MacKay Shields.
Costs of the Services to Be Provided, and Profits to Be Realized, by New York Life Investments and MacKay Shields
The Board considered the anticipated costs of the services to be provided by New York Life Investments and MacKay Shields under the Agreements, and the profits expected to be realized by New York Life Investments and its affiliates, including MacKay Shields, due to their relationships with the Fund. Because MacKay Shields is an affiliate of New York Life Investments whose subadvisory fees will be paid directly by New York Life Investments, the Board considered cost and profitability information for New York Life Investments and MacKay Shields in the aggregate.
In evaluating the anticipated costs and profits of New York Life Investments and its affiliates, including MacKay Shields, due to their relationships with the Fund, the Board considered, among other factors, each party’s investments in personnel, systems, equipment and other resources necessary to manage the Fund, and that New York Life Investments will be responsible for paying the subadvisory fees for the Fund. The Board acknowledged that New York Life Investments and MacKay Shields must be in a position to pay and retain experienced professional personnel to provide services to the Fund, and that the ability to maintain a strong financial position is important in order for New York Life Investments and MacKay Shields to continue to provide high-quality services to the Fund. The Board also noted that the Fund will benefit from the allocation of certain fixed costs across the MainStay Group of Funds.
In addition, the Board noted the difficulty in obtaining reliable comparative data about mutual fund managers’ profitability, since such information generally is not publicly available and may be impacted by numerous factors, including the structure of a fund manager’s organization, the types of funds it manages, the methodology used to allocate certain fixed costs to specific funds, and the manager’s capital structure and costs of capital. While recognizing the difficulty in evaluating a manager’s profitability with respect to the Fund, and noting that other profitability methodologies may also be reasonable, the Board concluded that the profitability methodology presented by New York Life Investments to the Board with respect to the Fund, which was developed by New York Life Investments in consultation with an independent consultant, was reasonable in all material respects.
In considering the anticipated costs and profitability of the Fund, the Board also considered certain fall-out benefits that may be realized by New York Life Investments and its affiliates, including MacKay Shields, due to their relationships with the Fund.
The Board further considered that, in addition to fees earned by New York Life Investments for managing the Fund, New York Life Investments’ affiliates would also earn revenues from serving the Fund in various other capacities, including as the Fund’s transfer agent and distributor. The Board observed that information about these other revenues, and their impact on the profitability of the Fund to New York Life Investments, was furnished to the Board as part of the 15(c) process. The Board noted that, although it assessed the overall profitability of the Fund to New York Life Investments and its affiliates as part of the contract review process, when considering the reasonableness of the fees to be paid to New York Life Investments and its affiliates under the Agreements, the Board considered the profitability of New York Life Investments’ relationship with the Fund on a pre-tax basis, and without regard to distribution expenses.
After evaluating the information presented to the Board, the Board concluded, within the context of its overall determinations regarding the Agreements, that any profits expected to be realized by New York Life Investments and its affiliates, including MacKay Shields, due to their relationships with the Fund supported the Board’s decision to approve the Agreements.
Extent to Which Economies of Scale May Be Realized as the Fund Grows
The Board also considered whether the Fund’s proposed expense structure permitted economies of scale to be shared with Fund investors. The Board reviewed information from New York Life Investments showing how the Fund’s management fee schedule compared to fee schedules of other funds and accounts managed by New York Life Investments and how it hypothetically would compare with fees paid for similar services by peer funds at varying asset levels. While recognizing the difficulty of determining future economies of scale with precision, the Board acknowledged that economies of scale may be shared with the Fund in a number of ways, including, for example, through the imposition of management fee breakpoints and by initially setting relatively lower management fees.
Based on this information, the Board concluded, within the context of its overall determinations regarding the Agreements, that the Fund’s expense structure appropriately reflects economies of scale for the benefit of Fund investors. The Board noted, however, that it would continue to evaluate the reasonableness of the Fund’s expense structure as the Fund grows over time.
Management and Subadvisory Fees and Total Ordinary Operating Expenses
The Board evaluated the reasonableness of the fees to be paid under the Agreements in relation to the scope of services to be provided and the Fund’s expected total ordinary operating expenses. The Board primarily considered the reasonableness of the management fee to be paid by the Fund to New York Life Investments, since the fees to be paid to MacKay Shields will be paid by New York Life Investments, not the Fund.
In assessing the reasonableness of the Fund’s fees and expenses, the Board primarily considered comparative data provided by New York Life Investments on the fees and expenses charged by similar mutual funds
| | | | |
| mainstayinvestments.com | | | 31 | |
Board Consideration and Approval of Management Agreement and
Subadvisory Agreement (Unaudited) (continued)
managed by other investment advisers. In addition, the Board considered information provided by New York Life Investments and MacKay Shields on fees charged to other investment advisory clients, including institutional separate accounts and other funds with similar investment objectives as the Fund. In this regard, the Board took into account the explanation provided by New York Life Investments about the different scope of services provided to mutual funds as compared with other investment advisory clients. The Board also took into account the impact of any expense limitation arrangements on the Fund’s net management fee and expenses.
The Board noted that, outside of the Fund’s management fee and the fees charged under a share class’s Rule 12b-1 and/or shareholder services plans, a share class’s most significant “other expenses” are transfer agent fees. Transfer agent fees will be charged to the Fund based on the number of shareholder accounts (a “per-account” fee) as compared with certain other fees (e.g., management fees), which will be charged based on the Fund’s average net assets. The Board took into account information from New York Life Investments showing that the Fund’s transfer agent fee schedule is reasonable, including industry data showing that the per-account fees that NYLIM Service Company LLC, the Fund’s transfer agent, will charge the Fund are within the range of per-account fees charged by transfer agents to other mutual funds. In addition, the Board considered NYLIM Service Company LLC’s profitability in connection with the transfer agent services it will provide to the Fund.
The Board acknowledged that, because the Fund’s transfer agent fees will be billed on a per-account basis, the impact of transfer agent fees on a share class’s expense ratio may be more significant in cases where the share class has a high number of accounts with limited assets (i.e., small accounts). The Board observed that transfer agent fees are a significant portion of total expenses of many Funds in the MainStay Group of Funds. The impact of transfer agent fees on the expense ratios of these MainStay Funds tends to be greater than for other open-end retail funds, because the MainStay Group of Funds generally has a significant number of small accounts relative to competitor funds. The Board acknowledged the role that the MainStay Group of Funds historically has played in serving the investment needs of New York Life Insurance Company (“New York Life”) policyholders, who often maintain smaller account balances than other fund investors. The Board discussed measures that it and New York Life Investments have taken in recent years to mitigate the effect of small accounts on the expense ratios of Fund share classes, including: (i) encouraging New York Life agents to consolidate multiple small accounts held by the same investor into one MainStay Asset Allocation Fund account; (ii) increasing investment minimums from $500 to $1,000 in 2003; (iii) introducing Investor Class shares for certain MainStay Funds in early 2008 to consolidate smaller account investors; (iv) closing small accounts with balances below $250 in Investor Class shares or $750 in all other classes of shares; (v) no longer allowing an exception with no minimum investment amount with respect to AutoInvest accounts with subsequent monthly purchases of $100; (vi) since 2007, charging an annual $20.00 small account fee on certain accounts with balances below $1,000; and (vii) modifying the approach for billing transfer agent expenses to reduce the degree of subsidization by large accounts of smaller accounts. In addition, the Board acknowledged New York Life Investments’ efforts to
encourage intermediaries to consolidate small accounts in multiple Funds held by the same investor into a single Asset Allocation Fund account, if appropriate under the circumstances, in an effort to mitigate the effect of small accounts on the Funds in the MainStay Group of Funds.
Based on these considerations, the Board concluded that the Fund’s management and subadvisory fees and anticipated total ordinary operating expenses were within a range that is competitive and, within the context of the Board’s overall conclusions regarding the Agreements, support a conclusion that these fees and expenses are reasonable.
Conclusion
On the basis of the information provided to it and its evaluation thereof, the Board, including the Independent Trustees, unanimously voted to approve the Agreements.
| | |
| 32 | | MainStay Short Duration High Yield Fund |
Proxy Voting Policies and Procedures and Proxy Voting Record
A description of the policies and procedures that New York Life Investments uses to vote proxies related to the Fund’s securities is available without charge, upon request, (i) by visiting the Fund’s website at mainstayinvestments.com; and (ii) on the Securities and Exchange Commission’s (SEC) website at www.sec.gov.
The Fund is required to file with the SEC its proxy voting record for the 12-month period ending June 30 on Form N-PX. The Fund’s most recent Form N-PX is available free of charge upon request by calling 800-MAINSTAY (624-6782); visiting the Fund’s website at mainstayinvestments.com; or on the SEC’s website at www.sec.gov.
Shareholder Reports and Quarterly Portfolio Disclosure
The Fund is required to file its complete schedule of portfolio holdings with the SEC for its first and third fiscal quarters on Form N-Q. The Fund’s Form N-Q is available without charge, on the SEC’s website at www.sec.gov or by calling MainStay Investments at
800-MAINSTAY (624-6782). You also can obtain and review copies of Form N-Q by visiting the SEC’s Public Reference Room in Washington, DC (information on the operation of the Public Reference Room may be obtained by calling 1-800-SEC-0330).
| | | | |
| mainstayinvestments.com | | | 33 | |
This page intentionally left blank
MainStay Funds
MainStay offers a wide range of Funds for virtually any investment need. The full array of MainStay open-end offerings is listed here, with information about the manager, subadvisors, legal counsel and independent registered public accounting firms.
Equity
U.S. Equity Funds
MainStay Common Stock Fund
MainStay Cornerstone Growth Fund
MainStay Epoch U.S. All Cap Fund
MainStay Epoch U.S. Equity Yield Fund
MainStay ICAP Equity Fund
MainStay ICAP Select Equity Fund
MainStay Large Cap Growth Fund1
MainStay MAP Fund
MainStay S&P 500 Index Fund
MainStay U.S. Equity Opportunities Fund
MainStay U.S. Small Cap Fund
International/Global Equity Funds
MainStay Epoch Global Choice Fund
MainStay Epoch Global Equity Yield Fund
MainStay Epoch International Small Cap Fund
MainStay ICAP Global Fund
MainStay ICAP International Fund
MainStay International Equity Fund
MainStay International Opportunities Fund
Income
Taxable Bond Funds
MainStay Floating Rate Fund
MainStay Global High Income Fund
MainStay Government Fund
MainStay High Yield Corporate Bond Fund
MainStay High Yield Opportunities Fund
MainStay Indexed Bond Fund
MainStay Intermediate Term Bond Fund
MainStay Short Duration High Yield Fund
MainStay Short Term Bond Fund
MainStay Unconstrained Bond Fund
Municipal Bond Funds
MainStay California Tax Free Opportunities Fund2
MainStay High Yield Municipal Bond Fund
MainStay New York Tax Free Opportunities Fund3
MainStay Tax Free Bond Fund
Money Market Fund
MainStay Money Market Fund
Mixed Asset
MainStay Balanced Fund
MainStay Convertible Fund
MainStay Income Builder Fund
MainStay Marketfield Fund
Asset Allocation/Target Date
MainStay Conservative Allocation Fund
MainStay Growth Allocation Fund
MainStay Moderate Allocation Fund
MainStay Moderate Growth Allocation Fund
MainStay Retirement 2010 Fund
MainStay Retirement 2020 Fund
MainStay Retirement 2030 Fund
MainStay Retirement 2040 Fund
MainStay Retirement 2050 Fund
Manager
New York Life Investment Management LLC
New York, New York
Subadvisors
Cornerstone Capital Management Holdings LLC4
New York, New York
Cornerstone Capital Management LLC4
Bloomington, Minnesota
Epoch Investment Partners, Inc.
New York, New York
Institutional Capital LLC4
Chicago, Illinois
MacKay Shields LLC4
New York, New York
Marketfield Asset Management LLC
New York, New York
Markston International LLC
White Plains, New York
Winslow Capital Management LLC
Minneapolis, Minnesota
Legal Counsel
Dechert LLP
Independent Registered Public Accounting Firms
KPMG LLP
PricewaterhouseCoopers LLP
1. Effective January 13, 2012, the Fund was closed to new investors with certain exceptions.
2. This Fund is only registered for sale in AZ, CA, NV, OR, UT, and WA.
3. This Fund is only registered for sale in CT, DE, FL, MA, NJ, NY, and VT.
4. An affiliate of New York Life Investment Management LLC.
Not part of the Semiannual Report
For more information
800-MAINSTAY (624-6782)
mainstayinvestments.com
The MainStay Funds® are managed by New York Life Investment Management LLC and distributed through NYLIFE Distributors LLC, 169 Lackawanna Avenue, Parsippany, NJ 07054, a wholly owned subsidiary of New York Life Insurance Company. NYLIFE Distributors LLC is a Member FINRA/SIPC.
MainStay Investments® is a registered service mark and name under which New York Life Investment Management LLC does business. MainStay Investments, an indirect subsidiary of New York Life Insurance Company, New York, NY 10010, provides investment advisory products and services.
This report may be distributed only when preceded or accompanied by a current Fund prospectus.
©2013 NYLIFE Distributors LLC. All rights reserved.
| | | | | | | | |
| Not FDIC/NCUA Insured | | Not a Deposit | | May Lose Value | | No Bank Guarantee | | Not Insured by Any Government Agency |
| | |
| NYLIM-30428 MS175-13 | | MSSHY10-06/13 NL0B9 |
MainStay California Tax Free Opportunities Fund
Message from the President and Semiannual Report
Unaudited | April 30, 2013


This page intentionally left blank
Message from the President
The U.S. stock market advanced during the six months ended April 30, 2013, generally providing double-digit returns at all capitalization levels. Value stocks tended to outpace growth stocks among large- and mid-capitalization companies, while growth stocks tended to outpace value stocks among smaller companies.
The market’s advance, however, was far from uniform. Stocks declined in early November, both before and immediately after the U.S. presidential election. Following a sharp recovery, stocks climbed until mid-December, when a Congressional stalemate on the fiscal cliff led to a brief decline. Another dip occurred in late February as investors speculated that the Federal Open Market Committee (FOMC) might stop purchasing mortgage-backed securities sooner than expected. Stocks also dipped in mid-April, as consumer sentiment dropped after the Boston marathon bombing. Despite these setbacks, U.S. stocks continued to trend upward during the six-month reporting period.
International stock markets also advanced, with several regional differences. Accommodative action by the Bank of Japan helped lower the yen and lift Japanese stocks to their highest levels since 2008. In Europe, stocks did well until early February, bolstered by the promise of support for the euro. As the year progressed, however, economic contraction, rising unemployment and systematic banking concerns took a toll on investor enthusiasm. In China, manufacturing slowed as the nation sought to balance growth and inflation risks. On the Korean peninsula, tensions rose as North Korea continued to threaten its neighbors, which added an undercurrent of caution to the market.
During the six months ended April 30, 2013, the FOMC kept the federal funds rate in a range close to zero. The FOMC also continued its direct purchases of mortgage-backed securities and longer-term U.S. government securities. With short-term interest rates likely to remain at low levels, many bond investors pursued higher yields by lengthening maturities and assuming greater risk. As a result, bonds with higher risk profiles tended
to outperform higher-quality investment-grade bonds and U.S. Treasury securities. Cash and cash equivalents essentially returned zero.
With wide variations in the performance of various asset classes, some investors might be tempted to chase higher returns by shifting back and forth between stocks and bonds. Since no one can predict where the market will move next, however, we encourage investors to select an appropriate mix of investments for their risk tolerance and time horizon and to stick with that mix, making only minor adjustments over time.
At MainStay Funds, our portfolio managers use a similar approach. Careful security selection and thoughtful sell disciplines help them pursue the investment objectives of their respective Funds. Using the principal investment strategies outlined in the Prospectus, they focus primarily on providing long-term investment potential for our shareholders.
Has this approach proved successful? In its most recent rankings, Barron’s listed MainStay Funds as the #1 fund family over the past 10 years. We were also the only mutual fund family that has appeared in Barron’s top six for the past five consecutive years.
The pages that follow provide additional insight into the specific market events, investment decisions and securities that shaped your MainStay Fund(s) during the six months ended April 30, 2013. We encourage you to read the semiannual report(s) carefully and to evaluate your results with your long-term financial goals in mind.
Sincerely,

Stephen P. Fisher
President
The opinions expressed are as of the date of this report and are subject to change. There is no guarantee that any forecast made will come to pass. This material does not constitute investment advice and is not intended as an endorsement of any specific investment.
To qualify for the Lipper/Barron’s Fund Survey, a fund family must have at least three funds in Lipper’s general U.S.-stock category, one in world equity (which combines global and international funds), one mixed-equity fund (which holds stocks and bonds), two taxable-bond funds, and one tax-exempt fund. Fund loads and 12b-1 fees aren’t included in the calculation of returns because the aim is to measure the manager’s skill. Each fund’s return is measured against all funds in its Lipper category, resulting in a percentile ranking which is then weighted by asset size relative to the fund family’s other assets in its general classifications. Finally, the score is multiplied by the general classification weightings as determined by the entire Lipper universe of funds.
Source: Barron’s, 2/9/13. Overall, MainStay Funds ranked number 56 for the one-year period, 20 for the five-year period and one for the 10-year period ended December 31, 2012, out of 62, 53 and 46 fund families, respectively. MainStay ranked number three for the 10-year period in 2009, 2010 and 2011 from among 48, 46 and 45 fund families, respectively. MainStay ranked number six from among 48 fund families for the 10-year period in 2008. Past performance is no guarantee of future results, which will vary. For the most recent MainStay Funds performance, please visit our website at mainstayinvestments.com. All mutual funds are subject to market risk and will fluctuate in value.
Not part of the Semiannual Report
Table of Contents
Investors should refer to the Fund’s Summary Prospectus and/or Prospectus and consider the Fund’s investment objectives, strategies, risks, charges and expenses carefully before investing. The Summary Prospectus and/or Prospectus contain this and other information about the Fund. You may obtain copies of the Fund’s Summary Prospectus, Prospectus and Statement of Additional Information free of charge, upon request, by calling toll-free 800-MAINSTAY (624-6782), by writing to NYLIFE Distributors LLC, Attn: MainStay Marketing Department, 169 Lackawanna Avenue, Parsippany, New Jersey 07054 or by sending an e-mail to MainStayShareholderServices@nylim.com. These documents are also available via the MainStay Funds’ website at mainstayinvestments.com/documents. Please read the Summary Prospectus and/or Prospectus carefully before investing.
Investment and Performance Comparison1 (Unaudited)
Performance data quoted represents past performance. Past performance is no guarantee of future results. Because of market volatility, current performance may be lower or higher than the figures shown. Investment return and principal value will fluctuate, and as a result, when shares are redeemed, they may be worth more or less than their original cost. The graph below depicts the historical performance of Class I shares of the Fund. Performance will vary from class to class based on differences in class-specific expenses and sales charges. For performance information current to the most recent month-end, please call 800-MAINSTAY (624-6782) or visit mainstayinvestments.com.
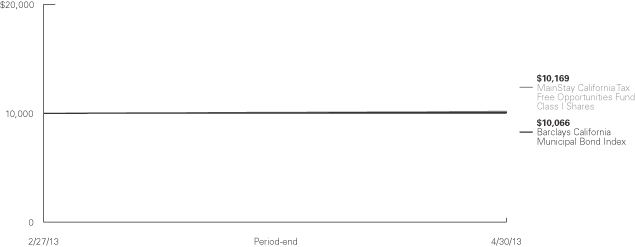
Average Annual Total Returns for the Period Ended April 30, 2013
| | | | | | | | | | | | |
| Class | | Sales Charge | | | | Since
Inception
(2/27/13) | | | Gross
Expense
Ratio2 | |
| Investor Class Shares | | Maximum 4.5% Initial Sales Charge | | With sales charges Excluding sales charges | | –
| 2.93
1.64 | %
| |
| 1.22
1.22 | %
|
| Class A Shares | | Maximum 4.5% Initial Sales Charge | | With sales charges Excluding sales charges | | –
| 3.02
1.55 |
| |
| 1.10
1.10 |
|
| Class C Shares | | Maximum 1% CDSC if Redeemed Within One Year of Purchase | | With sales charges Excluding sales charges | |
| 0.61
1.61 |
| |
| 1.47
1.47 |
|
| Class I Shares | | No Sales Charge | | | | | 1.69 | | | | 0.85 | |
| 1. | The performance table and graph do not reflect the deduction of taxes that a shareholder would pay on dividends, distributions or Fund share redemptions. Total returns reflect maximum applicable sales charges as indicated in the table above, changes in share price, and reinvestment of dividend and capital gain distributions. The graph assumes the initial investment amount shown above and reflects the deduction of all sales charges that would have applied for the period of investment. Performance |
| | figures reflect certain fee waivers and/or expense limitations, without which total returns may have been lower. For more information on share classes and current fee waivers and/or expense limitations, please refer to the notes to the financial statements. |
| 2. | The gross expense ratios presented reflect the Fund’s “Total Annual Fund Operating Expenses” from the most recent Prospectus and may differ from other expense ratios disclosed in this report. |
The footnotes on the next page are an integral part of the table and graph and should be carefully read in conjunction with them.
| | | | |
| mainstayinvestments.com | | | 5 | |
| | | | |
| Benchmark Performance | | Since
Inception | |
Barclays California Municipal Bond Index3 | | | 0.66 | % |
Average Lipper California Municipal Debt Fund4 | | | 0.76 | |
| 3. | The Barclays California Municipal Bond Index is a market-value-weighted index of California investment grade tax exempt fixed-rate municipal bonds with maturities of one year or more. The Barclays California Municipal Bond Index is the Fund’s broad-based securities market index for comparison purposes. Total returns assume the reinvestment of all dividends and capital gains. An investment cannot be made directly in an index. |
| 4. | The average Lipper California municipal debt fund is representative of funds that, by portfolio practice, invest primarily in municipal debt issues that are |
| | exempt from taxation in California (double tax-exempt) or a city in California (triple tax-exempt). This benchmark is a product of Lipper Inc. Lipper Inc. is an independent monitor of fund performance. Results are based on average total returns of similar funds with all dividend and capital gain distributions reinvested. |
The footnotes on the preceding page are an integral part of the table and graph and should be carefully read in conjunction with them.
| | |
| 6 | | MainStay California Tax Free Opportunities Fund |
Cost in Dollars of a $1,000 Investment in MainStay California Tax Free Opportunities Fund (Unaudited)
The example below is intended to describe the fees and expenses borne by shareholders during the period from February 27, 2013, to April 30, 2013, and the impact of those costs on your investment.
Example
As a shareholder of the Fund, you incur two types of costs: (1) transaction costs, including exchange fees and sales charges (loads) on purchases (as applicable), and (2) ongoing costs, including management fees, distribution and/or service (12b-1) fees, and other Fund expenses (as applicable). This example is intended to help you understand your ongoing costs (in dollars) of investing in the Fund and to compare these costs with the ongoing costs of investing in other Funds. The example is based on an investment of $1,000 made at the beginning of the period and held for the entire period from February 27, 2013, to April 30, 2013. Shares are only sold in connection with variable life and annuity contracts and the example does not reflect any contract level or transactional fees or expenses. If these costs had been included, your costs would have been higher.
This example illustrates your Fund’s ongoing costs in two ways:
Actual Expenses
The second and third data columns in the table below provide information about actual account values and actual expenses. You may use the information in these columns, together with the amount you invested, to estimate the expenses that you paid during the period
ended April 30, 2013. Simply divide your account value by $1,000 (for example, an $8,600 account value divided by $1,000 = 8.6), then multiply the result by the number under the heading entitled ‘‘Expenses Paid During Period’’ to estimate the expenses you paid on your account during this period.
Hypothetical Example for Comparison Purposes
The fourth and fifth data columns in the table below provide information about hypothetical account values and hypothetical expenses based on the Fund’s actual expense ratio and an assumed rate of return of 5% per year before expenses, which is not the Fund’s actual return. The hypothetical account values and expenses may not be used to estimate the actual ending account balances or expenses you paid for the six-month period shown. You may use this information to compare the ongoing costs of investing in the Fund with the ongoing costs of investing in other Funds. To do so, compare this 5% hypothetical example with the 5% hypothetical examples that appear in the shareholder reports of the other Funds.
Please note that the expenses shown in the table are meant to highlight your ongoing costs only and do not reflect any transactional costs, such as exchange fees or sales charges (loads). Therefore, the fourth and fifth data columns of the table are useful in comparing ongoing costs only and will not help you determine the relative total costs of owning different funds. In addition, if these transactional costs were included, your costs would have been higher.
| | | | | | | | | | | | | | | | | | | | |
| | | | | | | | | | | | | | | | |
| Share Class | | Beginning
Account
Value
2/27/131 | | | Ending Account
Value (Based
on Actual
Returns and
Expenses)
4/30/13 | | | Expenses
Paid
During
Period2 | | | Ending Account
Value (Based
on Hypothetical
5% Annualized
Return and
Actual Expenses)
4/30/13 | | | Expenses
Paid
During
Period2 | |
| | | | | |
| Investor Class Shares3 | | $ | 1,000.00 | | | $ | 1,016.40 | | | $ | 1.28 | | | $ | 1,007.20 | | | $ | 1.28 | |
| | | | | |
| Class A Shares3 | | $ | 1,000.00 | | | $ | 1,015.50 | | | $ | 1.28 | | | $ | 1,007.20 | | | $ | 1.28 | |
| | | | | |
| Class C Shares3 | | $ | 1,000.00 | | | $ | 1,016.10 | | | $ | 1.71 | | | $ | 1,006.80 | | | $ | 1.70 | |
| | | | | |
| Class I Shares3 | | $ | 1,000.00 | | | $ | 1,016.90 | | | $ | 0.86 | | | $ | 1,007.60 | | | $ | 0.85 | |
| 1. | The inception date of the Fund. |
| 2. | Expenses are equal to the Fund’s annualized expense ratio of each class (0.75% for Investor Class, 0.75% for Class A, 1.00% for Class C and 0.50% for Class I) multiplied by the average account value over the period, divided by 365 and multiplied by 62 days (to reflect the since-inception period which took place after the close of business of February 27, 2013). The table above represents the actual expenses incurred during the period. |
| 3. | Expenses paid during the period reflect ongoing costs for the period from inception through April 30, 2013. Had these shares been offered for the full six-month period ended April 30, 2013, and had the Fund provided a hypothetical 5% annualized return, expenses paid during the period would have been $3.76 for Investor Class, $3.76 for Class A, $5.01 for Class C and $2.51 for Class I and the ending account value would have been $1,021.10 for Investor Class, $1,021.10 for Class A, $1,019.80 for Class C and $1,022.30 for Class I. |
| | | | |
| mainstayinvestments.com | | | 7 | |
Industry Composition as of April 30, 2013 (Unaudited)
| | | | |
| General Obligation | | | 20.5 | % |
| Industrial Development / Pollution Control | | | 10.5 | |
| Appropriation | | | 10.4 | |
| Airport | | | 8.7 | |
| Transportation | | | 7.9 | |
| Water | | | 7.3 | |
| Dedicated Tax | | | 6.6 | |
| Tobacco Settlement | | | 6.4 | |
| | | | |
| Utilities | | | 6.0 | % |
| State General Obligation | | | 5.1 | |
| Higher Education | | | 4.2 | |
| Medical | | | 3.9 | |
| General | | | 3.3 | |
| Hospital | | | 0.3 | |
| Other Assets, Less Liabilities | | | –1.1 | |
| | | | |
| | | 100.0 | % |
| | | | |
| | | | |
See Portfolio of Investments beginning on page 11 for specific holdings within these categories.
Top Ten Holdings or Issuers Held as of April 30, 2013 (excluding short-term investment)
| 1. | Virgin Islands Public Finance Authority, Revenue Bonds, 5.00%, due 10/1/30 |
| 2. | Anaheim, California, School District, Unlimited General Obligation, 6.25%, due 8/1/40 |
| 3. | Chabot-Las Positas Community College District, 2016 Crossover, Unlimited General Obligation, 5.00%, due 8/1/32 |
| 4. | City of Sacramento, California, Water, Revenue Bonds, 5.00%, due 9/1/42 |
| 5. | California Infrastructure & Economic Development Bank, Revenue Bonds, 5.00%, due 9/1/28 |
| 6. | Castaic Union School District, Election of 2012, Unlimited General Obligation, 5.00%, due 8/1/38 |
| 7. | California State Municipal Finance Authority, Centro De Salud De La, Revenue Bonds, 5.00%, due 3/1/38 |
| 8. | San Francisco City & County International Airports Communities, Revenue Bonds, 5.00%, due 5/1/26 |
| 9. | Anaheim Public Financing Authority, Public Improvement Project, Revenue Bonds, 4.75%, due 9/1/33 |
| 10. | Bellflower California Unified School District 2012 Election, Unlimited General Obligation, 5.00%, due 8/1/32 |
| | |
| 8 | | MainStay California Tax Free Opportunities Fund |
Portfolio Management Discussion and Analysis (Unaudited)
Questions answered by portfolio managers John Loffredo, CFA, Robert DiMella, CFA, Michael Petty, David Dowden and Scott Sprauer of MacKay Shields LLC, the Fund’s Subadvisor.
How did MainStay California Tax Free Opportunities Fund perform relative to its peers and its benchmark from its inception on February 27, 2013, through April 30, 2013?
Excluding all sales charges, MainStay California Tax Free Opportunities Fund returned 1.64% for Investor Class shares, 1.55% for Class A shares and 1.61% for Class C shares from February 27, 2013, through April 30, 2013. Over the same period, Class I shares returned 1.69%. All share classes outperformed the 0.76% return of the average Lipper1 California municipal debt fund and the 0.66% return of the Barclays California Municipal Bond Index2 from February 27, 2013, through April 30, 2013. The Barclays California Municipal Bond Index is the Fund’s broad-based securities-market index. See page 5 for Fund returns applicable with sales charges.
What factors affected the Fund’s relative performance from February 27, 2013, through April 30, 2013?
From the Fund’s inception on February 27, 2013, through April 30, 2013, the Fund outperformed the Barclays California Municipal Bond Index, largely because of the Fund’s exposure to bonds rated A and BBB,3 an overweight position relative to the Index in bonds with maturities of 20 years or more, and zero exposure to Puerto Rico bonds. During the reporting period, longer-term bonds tended to outperform shorter-maturity issues, lower-rated municipal bonds outperformed higher-quality issues, and Puerto Rico bonds significantly underperformed the broad Barclays Municipal Bond Index.4
What was the Fund’s duration5 strategy during the reporting period?
Overall, our strategy is to keep the Fund’s duration close to that of the Barclays California Municipal Bond Index. At times, depending on conditions in the municipal market—such as seasonal supply-and-demand imbalances and our outlook for what lies ahead—we may adjust the Fund’s duration modestly
shorter or longer. During the reporting period, the Fund’s duration was longer than the duration of the Barclays California Municipal Bond Index, as we were in the process of investing the Fund’s initial assets.
What specific factors, risks or market forces prompted significant decisions for the Fund during the reporting period?
Our view on the municipal market was that the municipal yield curve6 was too steep and that spreads7 for lower-rated municipal bonds were too wide. While investing the Fund’s initial assets, we sought to structure an adequately diversified portfolio that reflected our view of the municipal market. To that end, the Fund primarily targeted lower-rated investment-grade bonds with maturities of 15 years or longer.
In addition, the Fund avoided any purchases of Puerto Rico–related issuers, even though these issues would be tax exempt for California residents. We believed that the deteriorating financial condition of the Commonwealth of Puerto Rico and its associated agencies would become more apparent to the market as the year progressed. For this reason, we felt that credit spreads on Puerto Rico bonds would widen, leading to potentially significant underperformance.
During the reporting period, which market segments were the strongest positive contributors to the Fund’s performance and which market segments were particularly weak?
The most significant positive contributions to the Fund’s absolute performance came from bonds rated A and BBB, from below investment-grade bonds and from bonds with maturities of 20 years or more. (Contributions take weightings and total returns into account.) Spread tightening and a gravitation of investors toward bonds providing incremental yield were significant drivers of the municipal market during the reporting
| 1. | See footnote on page 6 for more information on Lipper Inc. |
| 2. | See footnote on page 6 for more information on the Barclays California Municipal Bond Index. |
| 3. | An obligation rated ‘A’ by Standard & Poor’s (“S&P”) is deemed by S&P to be somewhat more susceptible to the adverse effects of changes in circumstances and economic conditions than obligations in higher-rated categories. In the opinion of S&P, however, the obligor’s capacity to meet its financial commitment on the obligation is still strong. An obligation rated ‘BBB’ by S&P is deemed by S&P to exhibit adequate protection parameters. It is the opinion of S&P, however, that adverse economic conditions or changing circumstances are more likely to lead to a weakened capacity of the obligor to meet its financial commitment on the obligation. When applied to Fund holdings, ratings are based solely on the creditworthiness of the bonds in the portfolio and are not meant to represent the security or safety of the Fund. |
| 4. | The Barclays Municipal Bond Index includes approximately 15,000 municipal bonds, rated Baa or better by Moody’s, with a maturity of at least two years. Bonds subject to the alternative minimum tax or with floating or zero coupons are excluded. Total returns assume the reinvestment of all dividends and capital gains. An investment cannot be made directly in an index. |
| 5. | Duration is a measure of the price sensitivity of a fixed-income investment to changes in interest rates. Duration is expressed as a number of years and is considered a more accurate sensitivity gauge than average maturity. |
| 6. | The yield curve is a line that plots the yields of various securities of similar quality—typically U.S. Treasury issues—across a range of maturities. The U.S. Treasury yield curve serves as a benchmark for other debt and is used in economic forecasting. The municipal yield curve is said to be steep when the spread between short-term and long-term municipal bonds is large and the yields of intermediate-term municipal bonds remain within that spread. |
| 7. | The terms “spread” and “yield spread” may refer to the difference in yield between a security or type of security and comparable U.S. Treasury issues. The terms may also refer to the difference in yield between two specific securities or types of securities at a given time. |
| | | | |
| mainstayinvestments.com | | | 9 | |
period. The decision to avoid securities issued by the Commonwealth of Puerto Rico also contributed positively to performance. During the reporting period, Puerto Rico bond credit spreads widened and Puerto Rico bonds underperformed, as the market became concerned about deteriorating credit conditions in the Commonwealth. During the reporting period, none of the market segments in which the Fund invested posted negative absolute returns.
Did the Fund make any significant purchases or sales during the reporting period?
Because the reporting period included the time when we initially invested the Fund’s assets, all of the trades in the Fund may be considered significant.
How did the Fund’s sector weightings change during the reporting period?
Given the short period since the Fund’s inception, its sector weightings changed as bonds were purchased. The prevalent
sectors in the Fund, such as local general obligation bonds, transportation bonds and water & sewer bonds, reflect our desire to construct a reasonably well-diversified Fund, including exposure to infrequent municipal issuers. In our opinion, the scarcity value8 of infrequent issuers was likely to enhance the performance of those specific bonds over time.
How was the Fund positioned at the end of the reporting period?
As of April 30, 2013, the Fund was overweight relative to the Barclays California Municipal Bond Index in bonds with maturities of 15 years or longer. The Fund was also overweight relative to the Index in credits rated BBB and held approximately 12% of its net assets in below-investment-grade credits.
On the same date, the Fund held underweight positions relative to the Index in securities rated AA9 and higher and in bonds with maturities of less than 10 years. We felt that these sectors could have a higher correlation to inflation and to potentially higher interest rates than the rest of the municipal market.
| 8. | Scarcity value is value added to a security by desirable characteristics—such as atypical yield, unusual protective covenants or rare availability—that tend to be difficult to find in the marketplace. |
| 9. | An obligation rated ‘AA’ by S&P is deemed by S&P to differ from the highest-rated issues only to a small degree. In the opinion of S&P, the obligor’s capacity to meet its financial commitment on the obligation is very strong. When applied to Fund holdings, ratings are based solely on the creditworthiness of the bonds in the portfolio and are not meant to represent the security or safety of the Fund. |
The opinions expressed are those of the portfolio managers as of the date of this report and are subject to change. There is no guarantee that any forecast made will come to pass. This material does not constitute investment advice and is not intended as an endorsement of any specific investment.
| | |
| 10 | | MainStay California Tax Free Opportunities Fund |
Portfolio of Investments April 30, 2013 (Unaudited)
| | | | | | | | |
| | | Principal
Amount | | | Value | |
| | | | | | | | |
| Municipal Bonds 101.1%† | |
Airport 8.7% | | | | | | | | |
Los Angeles, Department of Airports, International Airport, Revenue Bonds
Series A
5.00%, due 5/15/40 | | $ | 1,245,000 | | | $ | 1,408,307 | |
San Diego County Regional Airport Authority, Revenue Bonds
Series B
5.00%, due 7/1/30 (a) | | | 1,325,000 | | | | 1,521,285 | |
¨San Francisco City & County International Airports Communities, Revenue Bonds
Series A
5.00%, due 5/1/26 (a) | | | 1,430,000 | | | | 1,667,094 | |
| | | | | | | | |
| | | | | | | 4,596,686 | |
| | | | | | | | |
Appropriation 10.4% | | | | | | | | |
¨Anaheim Public Financing Authority, Public Improvement Project, Revenue Bonds
Series A-1, Insured: FGIC, NATL-RE
4.75%, due 9/1/33 | | | 1,500,000 | | | | 1,624,335 | |
¨California State Municipal Finance Authority, Centro De Salud De La, Revenue Bonds 5.00%, due 3/1/38 | | | 1,500,000 | | | | 1,667,610 | |
Stockton Public Financing Authority, Parking & Capital Projects, Revenue Bonds
Insured: FGIC, NATL-RE
5.25%, due 9/1/22 | | | 285,000 | | | | 282,803 | |
Stockton Redevelopment Agency, Stockton Events Center-Arena Project, Revenue Bonds | | | | | | | | |
Insured: FGIC, NATL-RE | | | | | | | | |
5.00%, due 9/1/28 | | | 255,000 | | | | 243,668 | |
Insured: FGIC, NATL-RE | | | | | | | | |
5.00%, due 9/1/36 | | | 150,000 | | | | 140,571 | |
Ventura County Public Financing Authority, Revenue Bonds
Series A
5.00%, due 11/1/38 | | | 1,355,000 | | | | 1,524,524 | |
| | | | | | | | |
| | | | | | | 5,483,511 | |
| | | | | | | | |
Dedicated Tax 6.6% | | | | | | | | |
City of San Jose California Special Hotel Tax Convention Center Expansion, Revenue Bonds
6.50%, due 5/1/36 | | | 760,000 | | | | 932,528 | |
Guam Government, Hotel Occupancy Tax, Revenue Bonds
Series A
6.50%, due 11/1/40 | | | 250,000 | | | | 297,057 | |
| | | | | | | | |
| | | Principal
Amount | | | Value | |
| | | | | | | | |
Dedicated Tax (continued) | | | | | | | | |
¨Virgin Islands Public Finance Authority, Revenue Bonds
5.00%, due 10/1/30 | | $ | 2,000,000 | | | $ | 2,265,500 | |
| | | | | | | | |
| | | | | | | 3,495,085 | |
| | | | | | | | |
General 3.3% | | | | | | | | |
¨California Infrastructure & Economic Development Bank, Revenue Bonds
5.00%, due 9/1/28 | | | 1,500,000 | | | | 1,718,310 | |
| | | | | | | | |
| | |
General Obligation 20.5% | | | | | | | | |
¨Anaheim, California, School District, Unlimited General Obligation
Insured: AGM
6.25%, due 8/1/40 | | | 1,500,000 | | | | 1,871,370 | |
¨Bellflower California Unified School District 2012 Election, Unlimited General Obligation
Series A
5.00%, due 8/1/32 | | | 1,410,000 | | | | 1,607,118 | |
California School Facilities Financing Authority, Azusa Unified School District, Revenue Bonds
Series A, Insured: AGM
5.00%, due 8/1/32 | | | 1,095,000 | | | | 1,206,821 | |
¨Castaic Union School District, Election of 2012, Unlimited General Obligation
Insured: BAM
5.00%, due 8/1/38 | | | 1,500,000 | | | | 1,693,050 | |
¨Chabot-Las Positas Community College District, 2016 Crossover, Unlimited General Obligation
5.00%, due 8/1/32 | | | 1,500,000 | | | | 1,781,250 | |
Emery Unified School District 2010 Election, Unlimited General Obligation
Series D
5.00%, due 8/1/45 | | | 825,000 | | | | 944,955 | |
San Ysidro School District, Unlimited General Obligation
Series F, Insured: AGM
(zero coupon), due 8/1/47 | | | 2,500,000 | | | | 250,925 | |
Santa Maria Joint Union High School District, Election 2004, Unlimited General Obligation 5.00%, due 8/1/33 | | | 1,000,000 | | | | 1,172,940 | |
Temecula Valley Unified School District, 2012 Election, Unlimited General Obligation
Series A, Insured: BAM
5.00%, due 8/1/42 | | | 250,000 | | | | 282,405 | |
| | | | | | | | |
| | | | | | | 10,810,834 | |
| | | | | | | | |
Higher Education 4.2% | | | | | | | | |
California Educational Facilities Authority, Dominican University, Revenue Bonds
5.00%, due 12/1/36 | | | 1,000,000 | | | | 1,043,590 | |
| † | Percentages indicated are based on Fund net assets. |
| ¨ | | Among the Fund’s 10 largest holdings or issuers held, as of April 30, 2013. May be subject to change daily. |
| | | | | | |
The notes to the financial statements are an integral part of,
and should be read in conjunction with, the financial statements. | | mainstayinvestments.com | | | 11 | |
Portfolio of Investments April 30, 2013 (Unaudited) (continued)
| | | | | | | | |
| | | Principal
Amount | | | Value | |
| | | | | | | | |
| Municipal Bonds (continued) | |
Higher Education (continued) | | | | | | | | |
California Municipal Finance Authority, Biola University, Revenue Bonds
5.00%, due 10/1/42 | | $ | 150,000 | | | $ | 164,079 | |
California Statewide Communities Development Authority, Lancer Plaza Project, Revenue Bonds
5.875%, due 11/1/43 | | | 1,000,000 | | | | 1,003,500 | |
| | | | | | | | |
| | | | | | | 2,211,169 | |
| | | | | | | | |
Hospital 0.3% | | | | | | | | |
California Statewide Communities Development Authority, John Muir Health, Revenue Bonds 5.00%, due 7/1/29 | | | 150,000 | | | | 164,957 | |
| | | | | | | | |
|
Industrial Development / Pollution Control 10.5% | |
ABAG Finance Authority for Nonprofit Corp., Various Jewish Home Sanitary Francisco, Revenue Bonds
0.16%, due 11/15/35 (b) | | | 1,000,000 | | | | 1,000,000 | |
California Infrastructure & Economic Development Bank, Los Angeles Museum, Revenue Bonds
Series A
0.17%, due 9/1/37 (b) | | | 1,400,000 | | | | 1,400,000 | |
California Municipal Finance Authority, Various Chevron USA-Recovery Zone, Revenue Bonds
0.14%, due 11/1/35 (b) | | | 600,000 | | | | 600,000 | |
California Pollution Control Financing Authority, Daily Paper Pacific Gas & Electric, Revenue Bonds
Series C
0.19%, due 11/1/26 (b) | | | 1,500,000 | | | | 1,500,000 | |
California Pollution Control Financing Authority, Revenue Bonds
5.00%, due 11/21/45 (a) | | | 1,000,000 | | | | 1,028,910 | |
| | | | | | | | |
| | | | | | | 5,528,910 | |
| | | | | | | | |
Medical 3.9% | | | | | | | | |
California Health Facilities Financing Authority, Scripps Health, Revenue Bonds
Series A
5.00%, due 11/15/36 | | | 775,000 | | | | 864,637 | |
City of Whittier, California, Health Facility Presbyterian Inter Community Hospital,
Revenue Bonds
6.25%, due 6/1/36 | | | 1,000,000 | | | | 1,203,510 | |
| | | | | | | | |
| | | | | | | 2,068,147 | |
| | | | | | | | |
| | | | | | | | |
| | | Principal
Amount | | | Value | |
| | | | | | | | |
State General Obligation 5.1% | | | | | | | | |
California State Public Works Board, Capital Project, Revenue Bonds
Series I-1
6.625%, due 11/1/34 | | $ | 1,430,000 | | | $ | 1,580,593 | |
Guam Government, Unlimited General Obligation
Series A
7.00%, due 11/15/39 | | | 1,000,000 | | | | 1,137,860 | |
| | | | | | | | |
| | | | | | | 2,718,453 | |
| | | | | | | | |
Tobacco Settlement 6.4% | | | | | | | | |
California County Tobacco Securitization Agency, Asset Backed, Revenue Bonds | | | | | | | | |
5.65%, due 6/1/41 | | | 750,000 | | | | 702,473 | |
5.70%, due 6/1/46 | | | 250,000 | | | | 233,325 | |
California County Tobacco Securitization Agency, Asset Backed, Sonoma County Corp., Revenue Bonds
5.125%, due 6/1/38 | | | 380,000 | | | | 341,901 | |
Golden State Tobacco Securitization Corp., Asset Backed, Revenue Bonds
Series A-1
5.75%, due 6/1/47 | | | 1,000,000 | | | | 955,470 | |
Tobacco Securitization Authority Northern California, Asset-Backed, Revenue Bonds Series A-1
5.50%, due 6/1/45 | | | 1,250,000 | | | | 1,135,112 | |
| | | | | | | | |
| | | | | | | 3,368,281 | |
| | | | | | | | |
Transportation 7.9% | | | | | | | | |
Alameda Corridor Transportation Authority, Capital Appreciation, Revenue Bonds Insured: NATL-RE
(zero coupon), due 10/1/32 | | | 1,550,000 | | | | 652,534 | |
Foothill-Eastern Transportation Corridor Agency, Revenue Bonds
Series A, Insured: NATL-RE
5.00%, due 1/1/35 | | | 1,525,000 | | | | 1,525,061 | |
San Joaquin Hills Transportation Corridor Agency, Revenue Bonds | | | | | | | | |
Series A, Insured: NATL-RE
| | | | | | | | |
(zero coupon), due 1/15/24 | | | 130,000 | | | | 78,884 | |
Series A, Insured: NATL-RE
| | | | | | | | |
(zero coupon), due 1/15/26 | | | 230,000 | | | | 126,815 | |
Series A, Insured: NATL-RE
| | | | | | | | |
(zero coupon), due 1/15/27 | | | 200,000 | | | | 105,228 | |
Series A, Insured: NATL-RE
| | | | | | | | |
(zero coupon), due 1/15/30 | | | 135,000 | | | | 60,421 | |
Series A, Insured: NATL-RE
| | | | | | | | |
(zero coupon), due 1/15/35 | | | 150,000 | | | | 50,589 | |
Series A, Insured: NATL-RE
| | | | | | | | |
(zero coupon), due 1/15/36 | | | 180,000 | | | | 57,107 | |
| | | | |
| 12 | | MainStay California Tax Free Opportunities Fund | | The notes to the financial statements are an integral part of,
and should be read in conjunction with, the financial statements. |
| | | | | | | | |
| | | Principal
Amount | | | Value | |
| | | | | | | | |
| Municipal Bonds (continued) | |
Transportation (continued) | | | | | | | | |
San Joaquin Hills Transportation Corridor Agency, Revenue Bonds (continued) | | | | | | | | |
Series A, Insured: NATL-RE
| | | | | | | | |
5.25%, due 1/15/30 | | $ | 245,000 | | | $ | 245,005 | |
Series A, Insured: NATL-RE
| | | | | | | | |
5.375%, due 1/15/29 | | | 245,000 | | | | 245,034 | |
Stockton District Port, Revenue Bonds
Series A, Insured: NATL-RE
4.50%, due 7/1/32 | | | 1,000,000 | | | | 1,002,390 | |
| | | | | | | | |
| | | | | | | 4,149,068 | |
| | | | | | | | |
Utilities 6.0% | | | | | | | | |
City of Glendale, California, Electric,
Revenue Bonds
5.00%, due 2/1/32 | | | 1,000,000 | | | | 1,154,710 | |
Corona Utility Authority Water Projects,
Revenue Bonds
5.00%, due 9/1/32 | | | 1,000,000 | | | | 1,168,420 | |
Turlock Irrigation District, Revenue Bonds
Series A
5.00%, due 1/1/40 | | | 760,000 | | | | 830,323 | |
| | | | | | | | |
| | | | | | | 3,153,453 | |
| | | | | | | | |
Water 7.3% | | | | | | | | |
¨City of Sacramento, California, Water,
Revenue Bonds
5.00%, due 9/1/42 | | | 1,500,000 | | | | 1,739,550 | |
Escondido Joint Powers Financing Authority, Revenue Bonds
5.00%, due 9/1/41 | | | 1,000,000 | | | | 1,116,740 | |
| | | | | | | | |
| | | Principal
Amount | | | Value | |
| | | | | | | | |
Water (continued) | | | | | | | | |
Irvine Ranch Water District, Various Improvement District, Special Assessment Series B
0.17%, due 10/1/41 (b) | | $ | 1,000,000 | | | $ | 1,000,000 | |
| | | | | | | | |
| | | | | | | 3,856,290 | |
| | | | | | | | |
Total Municipal Bonds
(Cost $52,719,805) | | | | | | | 53,323,154 | |
| | | | | | | | |
Total Investments
(Cost $52,719,805) (c) | | | 101.1 | % | | | 53,323,154 | |
Other Assets, Less Liabilities | | | (1.1 | ) | | | (572,144 | ) |
Net Assets | | | 100.0 | % | | $ | 52,751,010 | |
| (a) | Interest on these securities is subject to alternative minimum tax. |
| (b) | Variable rate securities that may be tendered back to the issuer at any time prior to maturity at par. Rate shown is the rate in effect as of April 30, 2013. |
| (c) | As of April 30, 2013, cost is $52,719,805 for federal income tax purposes and net unrealized appreciation is as follows: |
| | | | |
Gross unrealized appreciation | | $ | 625,588 | |
Gross unrealized depreciation | | | (22,239 | ) |
| | | | |
Net unrealized appreciation | | $ | 603,349 | |
| | | | |
The following abbreviations are used in the above portfolio:
AGM—Assured Guaranty Municipal Corp.
BAM—Build America Mutual Assurance Co.
FGIC—Financial Guaranty Insurance Co.
NATL—RE -National Public Finance Guarantee Corp.
The following is a summary of the fair valuations according to the inputs used as of April 30, 2013, for valuing the Fund’s assets.
Asset Valuation Inputs
| | | | | | | | | | | | | | | | |
Description | | Quoted
Prices in
Active
Markets for
Identical
Assets
(Level 1) | | | Significant
Other
Observable
Inputs (Level 2) | | | Significant
Unobservable
Inputs (Level 3) | | | Total | |
| Investments in Securities (a) | | | | | | | | | | | | | | | | |
| Municipal Bonds | | $ | — | | | $ | 53,323,154 | | | $ | — | | | $ | 53,323,154 | |
| | | | | | | | | | | | | | | | |
| Total Investments in Securities | | $ | — | | | $ | 53,323,154 | | | $ | — | | | $ | 53,323,154 | |
| | | | | | | | | | | | | | | | |
| (a) | For a complete listing of investments and their industries, see the Portfolio of Investments. |
The Fund recognizes transfers between the levels as of the beginning of the period.
For the period ended April 30, 2013, the Fund did not have any transfers between Level 1 and Level 2 fair value measurements. (See Note 2)
As of April 30, 2013, the Fund did not hold any investments with significant unobservable inputs (Level 3). (See Note 2)
| | | | | | |
The notes to the financial statements are an integral part of,
and should be read in conjunction with, the financial statements. | | mainstayinvestments.com | | | 13 | |
Statement of Assets and Liabilities as of April 30, 2013 (Unaudited)
| | | | |
| Assets | |
Investment in securities, at value
(identified cost $52,719,805) | | $ | 53,323,154 | |
Cash | | | 1,035,087 | |
Receivables: | | | | |
Interest | | | 577,013 | |
Fund shares sold | | | 213,968 | |
Other assets | | | 11,845 | |
| | | | |
Total assets | | | 55,161,067 | |
| | | | |
| |
| Liabilities | | | | |
Payables: | | | | |
Investment securities purchased | | | 2,378,172 | |
Professional fees | | | 11,751 | |
Manager (See Note 3) | | | 6,545 | |
Shareholder communication | | | 6,069 | |
Fund shares redeemed | | | 760 | |
Custodian | | | 557 | |
NYLIFE Distributors (See Note 3) | | | 77 | |
Accrued expenses | | | 6,126 | |
| | | | |
Total liabilities | | | 2,410,057 | |
| | | | |
Net assets | | $ | 52,751,010 | |
| | | | |
| |
| Composition of Net Assets | | | | |
Shares of beneficial interest outstanding (par value of $.001 per share) unlimited number of shares authorized | | $ | 5,209 | |
Additional paid-in capital | | | 52,104,044 | |
| | | | |
| | | 52,109,253 | |
Distributions in excess of net investment income | | | (162 | ) |
Accumulated net realized gain (loss) on investments | | | 38,570 | |
Net unrealized appreciation (depreciation) on investments | | | 603,349 | |
| | | | |
Net assets | | $ | 52,751,010 | |
| | | | |
| | | | |
Investor Class | | | | |
Net assets applicable to outstanding shares | | $ | 25,403 | |
| | | | |
Shares of beneficial interest outstanding | | | 2,509 | |
| | | | |
Net asset value per share outstanding | | $ | 10.13 | |
Maximum sales charge (4.50% of offering price) | | | 0.48 | |
| | | | |
Maximum offering price per share outstanding | | $ | 10.61 | |
| | | | |
Class A | | | | |
Net assets applicable to outstanding shares | | $ | 807,561 | |
| | | | |
Shares of beneficial interest outstanding | | | 79,771 | |
| | | | |
Net asset value per share outstanding | | $ | 10.12 | |
Maximum sales charge (4.50% of offering price) | | | 0.48 | |
| | | | |
Maximum offering price per share outstanding | | $ | 10.60 | |
| | | | |
Class C | | | | |
Net assets applicable to outstanding shares | | $ | 25,393 | |
| | | | |
Shares of beneficial interest outstanding | | | 2,508 | |
| | | | |
Net asset value and offering price per share outstanding | | $ | 10.13 | |
| | | | |
Class I | | | | |
Net assets applicable to outstanding shares | | $ | 51,892,653 | |
| | | | |
Shares of beneficial interest outstanding | | | 5,124,301 | |
| | | | |
Net asset value and offering price per share outstanding | | $ | 10.13 | |
| | | | |
| | | | |
| 14 | | MainStay California Tax Free Opportunities Fund | | The notes to the financial statements are an integral part of,
and should be read in conjunction with, the financial statements. |
Statement of Operations
for the period February 27, 2013 (inception date) through April 30, 2013 (Unaudited)
| | | | |
| Investment Income (Loss) | |
Income | | | | |
Interest | | $ | 236,618 | |
| | | | |
Expenses | | | | |
Manager (See Note 3) | | | 42,757 | |
Professional fees | | | 11,751 | |
Offering (See Note 2) | | | 7,644 | |
Shareholder communication | | | 6,370 | |
Registration | | | 1,332 | |
Custodian | | | 557 | |
Trustees | | | 224 | |
Distribution/Service—Investor Class (See Note 3) | | | 11 | |
Distribution/Service—Class A (See Note 3) | | | 68 | |
Distribution/Service—Class C (See Note 3) | | | 21 | |
Miscellaneous | | | 1,541 | |
| | | | |
Total expenses before waiver/reimbursement | | | 72,276 | |
Expense waiver/reimbursement from Manager (See Note 3) | | | (29,386 | ) |
| | | | |
Net expenses | | | 42,890 | |
| | | | |
Net investment income (loss) | | | 193,728 | |
| | | | |
|
| Realized and Unrealized Gain (Loss) on Investments | |
Net realized gain (loss) on investments | | | 38,570 | |
Net change in unrealized appreciation (depreciation) on investments | | | 603,349 | |
| | | | |
Net realized and unrealized gain (loss) on investments | | | 641,919 | |
| | | | |
Net increase (decrease) in net assets resulting from operations | | $ | 835,647 | |
| | | | |
| | | | | | |
The notes to the financial statements are an integral part of,
and should be read in conjunction with, the financial statements. | | mainstayinvestments.com | | | 15 | |
Statements of Changes in Net Assets
for the period February 27, 2013 (inception date) through April 30, 2013 (Unaudited)
| | | | |
| | | 2013 | |
| Increase (Decrease) in Net Assets | |
Operations: | | | | |
Net investment income (loss) | | $ | 193,728 | |
Net realized gain (loss) on investments | | | 38,570 | |
Net change in unrealized appreciation (depreciation) on investments | | | 603,349 | |
| | | | |
Net increase (decrease) in net assets resulting from operations | | | 835,647 | |
| | | | |
Dividends to shareholders: | | | | |
From net investment income: | | | | |
Investor Class | | | (86 | ) |
Class A | | | (760 | ) |
Class C | | | (78 | ) |
Class I | | | (192,966 | ) |
| | | | |
Total dividends to shareholders | | | (193,890 | ) |
| | | | |
Capital share transactions: | | | | |
Net proceeds from sale of shares | | | 51,916,123 | |
Net asset value of shares issued to shareholders in reinvestment of dividends | | | 193,890 | |
Cost of shares redeemed | | | (760 | ) |
| | | | |
Increase (decrease) in net assets derived from capital share transactions | | | 52,109,253 | |
| | | | |
Net increase (decrease) in net assets | | | 52,751,010 | |
| |
| Net Assets | | | | |
Beginning of period | | | — | |
| | | | |
End of period | | $ | 52,751,010 | |
| | | | |
Distributions in excess of net investment income at end of period | | $ | (162 | ) |
| | | | |
| | | | |
| 16 | | MainStay California Tax Free Opportunities Fund | | The notes to the financial statements are an integral part of,
and should be read in conjunction with, the financial statements. |
Financial Highlights selected per share data and ratios
| | | | | | | | | | | | | | | | | | |
| | | Investor Class | | | Class A | | | | | Class C | | | Class I | |
| | | February 27,
2013**
through
April 30, | | | February 27,
2013**
through
April 30, | | | | | February 27,
2013**
through
April 30, | | | February 27,
2013**
through
April 30, | |
| | | 2013* | | | 2013* | | | | | 2013* | | | 2013* | |
Net asset value at beginning of period | | $ | 10.00 | | | $ | 10.00 | | | | | $ | 10.00 | | | $ | 10.00 | |
| | | | | | | | | | | | | | | | | | |
Net investment income (loss) | | | 0.03 | | | | 0.03 | | | | | | 0.03 | | | | 0.04 | |
Net realized and unrealized gain (loss) on investments | | | 0.13 | | | | 0.12 | | | | | | 0.13 | | | | 0.13 | |
| | | | | | | | | | | | | | | | | | |
Total from investment operations | | | 0.16 | | | | 0.15 | | | | | | 0.16 | | | | 0.17 | |
| | | | | | | | | | | | | | | | | | |
Less dividends: | | | | | | | | | | | | | | | | | | |
From net investment income | | | (0.03 | ) | | | (0.03 | ) | | | | | (0.03 | ) | | | (0.04 | ) |
| | | | | | | | | | | | | | | | | | |
Net asset value at end of period | | $ | 10.13 | | | $ | 10.12 | | | | | $ | 10.13 | | | $ | 10.13 | |
| | | | | | | | | | | | | | | | | | |
Total investment return | | | 1.64 | %(a) | | | 1.55 | %(a) | | | | | 1.61 | %(a) | | | 1.69 | %(a) |
Ratios (to average net assets)/Supplemental Data: | | | | | | | | | | | | | | | | | | |
Net investment income (loss) | | | 2.02 | %†† | | | 2.80 | %†† | | | | | 1.78 | %†† | | | 2.26 | %†† |
Net expenses | | | 0.75 | %†† | | | 0.75 | %†† | | | | | 1.00 | %†† | | | 0.50 | %†† |
Expenses (before waiver/reimbursement) | | | 1.09 | %†† | | | 1.09 | %†† | | | | | 1.34 | %†† | | | 0.84 | %†† |
Portfolio turnover rate | | | 18 | % | | | 18 | % | | | | | 18 | % | | | 18 | % |
Net assets at end of period (in 000’s) | | $ | 25 | | | $ | 808 | | | | | $ | 25 | | | $ | 51,893 | |
| (a) | Total investment return is not annualized. |
| | | | | | |
The notes to the financial statements are an integral part of,
and should be read in conjunction with, the financial statements. | | mainstayinvestments.com | | | 17 | |
Notes to Financial Statements (Unaudited)
Note 1–Organization and Business
MainStay Funds Trust (the “Trust”) was organized as a Delaware statutory trust on April 28, 2009, and is governed by a Declaration of Trust. The Trust is registered under the Investment Company Act of 1940, as amended (the “1940 Act”), as an open-end investment management company, and is comprised of thirty-three funds (collectively referred to as the “Funds”). These financial statements and notes relate only to the MainStay California Tax Free Opportunities Fund (the “Fund”), a diversified fund.
The Fund currently offers four classes of shares. Investor Class, Class A, Class C and Class I shares. The inception date was on February 27, 2013. Investor Class and Class A shares are offered at net asset value (“NAV”) per share plus an initial sales charge. No sales charge applies to investments of $500,000 or more (and certain other qualified purchases) in Investor Class and Class A shares, but a contingent deferred sales charge (“CDSC”) is imposed on certain redemptions made within one year of the date of purchase. Class C shares are offered at NAV without an initial sales charge, although a 1.00% CDSC may be imposed on redemptions made within one year of the date of purchase of Class C shares. Class I shares are offered at NAV and are not subject to a sales charge. Depending upon eligibility, Investor Class shares may convert to Class A shares, and Class A shares may convert to Investor Class shares. The four classes of shares have the same voting (except for issues that relate solely to one class), dividend, liquidation and other rights, and the same terms and conditions, except that Class C shares are subject to higher distribution and/or service fee rates than Investor Class and Class A shares under a distribution plan pursuant to Rule 12b-1 under the 1940 Act. Class I shares are not subject to a distribution and/or service fee.
The Fund’s investment objective is to seek current income exempt from federal and California income taxes.
Note 2–Significant Accounting Policies
The Fund prepares its financial statements in accordance with generally accepted accounting principles (“GAAP”) in the United States of America and follows the significant accounting policies described below.
(A) Securities Valuation. Investments are valued as of the close of regular trading on the New York Stock Exchange (“Exchange”) (generally 4:00 p.m. Eastern time) on each day the Fund is open for business (“valuation date”).
The Board of Trustees (the “Board”) has adopted procedures for the valuation of the Fund’s securities and has delegated the responsibility for valuation determination under those procedures to the Valuation Committee of the Fund (the “Valuation Committee”). The Board has authorized the Valuation Committee to appoint a Valuation Sub-Committee (the “Sub-Committee”) to deal in the first instance with questions that arise or cannot be resolved under these procedures. The Sub-Committee meets (in person, via electronic mail or via teleconference) on an as-needed basis. The Valuation Committee meets at a later time, as necessary, to ensure that actions taken by the Sub-Committee were appropriate. The procedures recognize that, subject to the oversight of the Board and unless otherwise noted, the responsibility for day-to-day valuation of portfolio assets (including securities for which market prices are not readily available) rests with New York Life
Investment Management LLC ( “New York Life Investments” or the “Manager”), aided to whatever extent necessary by the Subadvisor (as defined in Note 3(A)) of the Fund.
To assess the appropriateness of security valuations, the Manager or the Fund’s third party service provider who is subject to oversight by the Manager, regularly compares prior day prices, prices on comparable securities and the sale prices to the prior and current day prices and challenges prices exceeding certain tolerance levels with third party pricing services or broker sources. For those securities valued by recommendation, whether through a standardized fair valuation methodology or a fair valuation determination, the Valuation Committee reviews and affirms the reasonableness of the valuation based on such methodologies and determinations on a regular basis after considering all relevant information that is reasonably available.
“Fair value” is defined as the price that the Fund would receive upon selling an investment in an orderly transaction to an independent buyer in the principal or most advantageous market of the investment. Fair value measurements are determined within a framework that has established a three-tier hierarchy which maximizes the use of observable market data and minimizes the use of unobservable inputs to establish classification of fair value measurements for disclosure purposes. “Inputs” refers broadly to the assumptions that market participants would use in pricing the asset or liability, including assumptions about risk, such as the risk inherent in a particular valuation technique used to measure fair value using a pricing model and/or the risk inherent in the inputs for the valuation technique. Inputs may be observable or unobservable. Observable inputs reflect the assumptions market participants would use in pricing the asset or liability based on market data obtained from sources independent of the Fund. Unobservable inputs reflect the Fund’s own assumptions about the assumptions market participants would use in pricing the asset or liability developed based on the information available in the circumstances. The inputs or methodology used for valuing securities may not be an indication of the risks associated with investing in those securities. The three-tier hierarchy of inputs is summarized in the three broad Levels listed below.
| • | | Level 1—quoted prices in active markets for identical investments |
| • | | Level 2—other significant observable inputs (including quoted prices for similar investments in active markets, interest rates and yield curves, prepayment speeds, credit risks, etc.) |
| • | | Level 3—significant unobservable inputs (including the Fund’s own assumptions about the assumptions that market participants would use in determining the fair value of investments) |
The aggregate value by input level, as of April 30, 2013, for the Fund’s investments is included at the end of the Fund’s Portfolio of Investments.
The valuation techniques used by the Fund to measure fair value maximize the use of observable inputs and minimize the use of unobservable inputs. The Fund may utilize third party vendor
| | |
| 18 | | MainStay California Tax Free Opportunities Fund |
evaluations, whose prices may be derived from one or more of the following standard inputs:
| | |
• Benchmark Yields | | • Reported Trades |
• Broker Dealer Quotes | | • Issuer Spreads |
• Two-sided markets | | • Benchmark securities |
• Bids/Offers | | • Reference Data (corporate actions or material event notices) |
• Industry and economic events | | • Comparable bonds |
• Equity and credit default swap curves | | • Monthly payment information |
Securities for which market values cannot be determined using the methodologies described above are valued by methods deemed in good faith by the Fund’s Valuation Committee, following the procedures established by the Board, to represent fair value. Under these procedures, the Fund primarily employs a market-based approach which may use related or comparable assets or liabilities, recent transactions, market multiples, book values, and other relevant information. The Fund may also use an income-based valuation approach in which the anticipated future cash flows of the investment are discounted to calculate fair value. Discounts may also be applied due to the nature or duration of any restrictions on the disposition of the investments. Due to the inherent uncertainty of valuations of such investments, the fair values may differ significantly from the values that would have been used had an active market existed. For the period ended April 30, 2013, there have been no changes to the fair value methodologies.
Equity and non-equity securities which may be valued in this manner include, but are not limited to: (i) a security for which the trading has been halted or suspended; (ii) a debt security that has recently gone into default and for which there is not a current market quotation; (iii) a security of an issuer that has entered into a restructuring; (iv) a security that has been de-listed from a national exchange; (v) a security for which the market price is not available from a third party pricing source or, if so provided, does not, in the opinion of the Fund’s Manager or Subadvisor reflect the security’s market value; and (vi) a security whose principal market has been temporarily closed at a time when, under normal conditions, it would be open. Securities for which market quotations or observable inputs are not readily available are generally categorized as Level 3 in the hierarchy. As of April 30, 2013, the Fund did not hold any securities that were fair valued in such a manner.
Futures contracts are valued at the last posted settlement price on the market where such futures are primarily traded. Investments in other mutual funds are valued at their respective NAVs as of the close of the Exchange on the valuation date. These securities are generally categorized as Level 1 in the hierarchy.
Debt securities are valued at the evaluated mean prices supplied by a pricing agent or broker selected by the Fund’s Manager in consultation with the Fund’s Subadvisor whose prices reflect broker/dealer supplied valuations and electronic data processing techniques, if such prices are deemed by the Fund’s Manager, in consultation with the Fund’s Subadvisor, to be representative of market values, at the regular close of trading of the Exchange on each valuation date. Debt securities, including corporate bonds, U.S. government and federal agency bonds, municipal bonds, foreign bonds, Yankee bonds, convertible bonds, asset-backed securities and mortgage-backed securities are generally categorized as Level 2 in the hierarchy.
Temporary cash investments acquired over 60 days to maturity are valued using the latest bid prices or using valuations based on a matrix system (which considers such factors as security prices, yields, maturities, and ratings), both as furnished by independent pricing services. Other temporary cash investments which mature in 60 days or less (“Short-Term Investments”) are valued at amortized cost. The amortized cost method involves valuing a security at its cost on the date of purchase and thereafter assuming a constant amortization to maturity of the difference between such cost and the value on maturity date. Amortized cost approximates the current fair value of a security. Securities valued at amortized cost are not valued using a quoted price in an active market. These securities are generally categorized as Level 2 in the hierarchy.
Generally, a security is considered illiquid if it cannot be sold or disposed of in the ordinary course of business at approximately the price at which it is valued. Its illiquidity might prevent the sale of such security at a time when the Manager or Subadvisor might wish to sell, and these securities could have the effect of decreasing the overall level of a Fund’s liquidity. Further, the lack of an established secondary market may make it more difficult to value illiquid securities, requiring the Fund to rely on judgments that may be somewhat subjective in determining value, which could vary from the amount that the Fund could realize upon disposition. Difficulty in selling illiquid securities may result in a loss or may be costly to the Fund. Under the supervision of the Board, the Manager or Subadvisor determines the liquidity of the Fund’s investments; in doing so, the Manager or Subadvisor may consider various factors, including (i) the frequency of trades and quotations, (ii) the number of dealers and prospective purchasers, (iii) dealer undertakings to make a market, and (iv) the nature of the security and the market in which it trades (e.g., the time needed to dispose of the security, the method of soliciting offers and the mechanics of transfer). Illiquid securities generally will be valued in good faith in such a manner as the Board deems appropriate to reflect their fair value.
(B) Income Taxes. The Fund’s policy is to comply with the requirements of the Internal Revenue Code of 1986, as amended (the “Internal Revenue Code”), applicable to regulated investment companies and to distribute all of the taxable income to the shareholders of the Fund within the allowable time limits. Therefore, no federal, state and local income tax provision is required.
Management evaluates its tax positions to determine if the tax positions taken meet the minimum recognition threshold in connection with accounting for uncertainties in income tax positions taken or expected to be taken for the purposes of measuring and recognizing tax liabilities in the financial statements. Recognition of tax benefits of an uncertain tax position is required only when the position is “more likely than not” to be sustained assuming examination by taxing authorities. Management has analyzed the Fund’s tax positions taken on federal, state and local income tax returns for all open tax years (for up to three tax years), and has concluded that no provision for federal, state and local income tax is required in the Fund’s financial statements. The Fund’s federal, state and local income and federal excise tax returns for tax years for which the applicable statutes of limitations have not expired are subject to examination by the Internal Revenue Service and state and local departments of revenue.
| | | | |
| mainstayinvestments.com | | | 19 | |
Notes to Financial Statements (Unaudited) (continued)
(C) Dividends and Distributions to Shareholders. Dividends and distributions are recorded on the ex-dividend date. The Fund intends to declare dividends of net investment income, if any, at least daily and intends to pay them at least monthly and intends to declare and pay distributions of net realized capital gains, if any, at least annually. Unless the shareholder elects otherwise, all dividends and distributions are reinvested in the same class of shares of the Fund, at NAV. Dividends and distributions to shareholders are determined in accordance with federal income tax regulations and may differ from GAAP.
(D) Security Transactions and Investment Income. The Fund records security transactions on the trade date. Realized gains and losses on security transactions are determined using the identified cost method. Interest income is accrued as earned using the effective interest rate method. Discounts and premiums on securities purchased, other than Short-Term Investments, for the Fund are accreted and amortized, respectively, on the effective interest rate method over the life of the respective securities or, in the case of a callable security, over the period to the first date of call. Discounts and premiums on Short-Term Investments are accreted and amortized, respectively, on the straight-line method.
Investment income and realized and unrealized gains and losses on investments of the Fund are allocated to separate classes of shares pro rata based upon their relative net assets on the date the income is earned or realized and unrealized gains and losses are incurred.
(E) Expenses. Expenses of the Trust are allocated to the individual Funds in proportion to the net assets of the respective Funds when the expenses are incurred, except where direct allocations of expenses can be made. Expenses (other than transfer agent expenses and fees incurred under the shareholder services plans and the distribution plans further discussed in Note 3(B)) are allocated to separate classes of shares pro rata based upon their relative net assets on the date the expenses are incurred. The expenses borne by the Fund, including those of related parties to the Fund, are shown in the Statement of Operations.
(F) Use of Estimates. In preparing financial statements in conformity with GAAP, management makes estimates and assumptions that affect the reported amounts and disclosures in the financial statements. Actual results could differ from those estimates.
(G) Offering Costs. Costs incurred by the Fund in connection with the commencement of the Fund’s operations. These costs are being amortized on a straight line basis over twelve months.
(H) Securities Lending. In order to realize additional income, the Fund may engage in securities lending, subject to the limitations set forth in the 1940 Act and relevant guidance by the staff of the Securities and Exchange Commission. In the event the Fund does engage in securities lending, the Fund will lend through its custodian, State Street Bank and Trust Company (“State Street”). State Street will manage the Fund’s cash collateral in accordance with the lending agreement between the Fund and State Street, and indemnify the Fund’s portfolio against counterparty risk. The loans will be collateralized by cash or securities at least equal at all times to the market value of the securities loaned. Collateral will consist of U.S. Government securities, cash equivalents or irrevocable letters of credit. The Fund may bear the risk of delay in recovery of, or loss of rights in, the securities loaned should the bor-
rower of the securities experience financial difficulty. The Fund may also record realized gain or loss on securities deemed sold due to a borrower’s inability to return securities on loan. The Fund will receive compensation for lending its securities in the form of fees or the retention of a portion of the interest on the investment of any cash received as collateral. The Fund also will continue to receive interest and dividends on the securities loaned and any gain or loss in the market price of the securities loaned that may occur during the term of the loan will be for the account of the Fund.
Although the Fund and New York Life Investments have temporarily suspended securities lending, the Fund and New York Life Investments reserve the right to reinstitute lending when deemed appropriate. The Fund did not have any portfolio securities on loan as of April 30, 2013.
(I) Concentration of Risk. The ability of issuers of debt securities held by the Fund to meet their obligations may be affected by economic or political developments in a specific industry or region. Because the Fund’s principal investments include municipal bonds issued by or on behalf of the State of California, and its political subdivisions, agencies and instrumentalities, events in California will affect the Fund’s investments and performance. These events may include fiscal or political policy changes, tax base erosion, budget deficits and other financial difficulties. California continues to experience financial difficulties due to the economic environment. The further deterioration of California’s fiscal situation and economic situation of its municipalities could cause greater volatility and increase the risk of investing in California.
(J) Indemnifications. Under the Trust’s organizational documents, its officers and trustees are indemnified against certain liabilities that may arise out of performance of their duties to the Trust. Additionally, in the normal course of business, the Fund enters into contracts with third-party service providers that contain a variety of representations and warranties and which may provide general indemnifications. The Fund’s maximum exposure under these arrangements is unknown, as this would involve future claims that may be made against the Fund that have not yet occurred. Based on experience, management is of the view that the risk of loss in connection with these potential indemnification obligations is remote. However, there can be no assurance that material liabilities related to such obligations will not arise in the future, which could adversely impact the Fund.
Note 3–Fees and Related Party Transactions
(A) Manager and Subadvisor. New York Life Investments, a registered investment adviser and an indirect, wholly-owned subsidiary of New York Life Insurance Company (“New York Life”), serves as the Fund’s Manager, pursuant to an Amended and Restated Management Agreement (“Management Agreement”). The Manager provides offices, conducts clerical, recordkeeping and bookkeeping services, and keeps most of the financial and accounting records required to be maintained by the Fund. Except for the portion of salaries and expenses that are the responsibility of the Fund, the Manager pays the salaries and expenses of all personnel affiliated with the Fund and certain operational expenses of the Fund. The Fund reimburses New York Life Investments in an amount equal to a portion of the salary of the Chief Compliance Officer (“CCO”) of the Fund. MacKay Shields LLC (“MacKay Shields” or the “Subadvisor”), a registered investment adviser and an indirect, wholly-owned subsidiary of New York Life, serves as Subadvisor to the Fund
| | |
| 20 | | MainStay California Tax Free Opportunities Fund |
and is responsible for the day-to-day portfolio management of the Fund. Pursuant to the terms of an Amended and Restated Subadvisory Agreement (“Subadvisory Agreement”) between New York Life Investments and MacKay Shields, New York Life Investments pays for the services of the Subadvisor.
The Fund pays the Manager a monthly fee for services performed and facilities furnished at an annual rate of 0.50% of the Fund’s average daily net assets. New York Life Investments has contractually agreed to waive a portion of its management fee so that the management fee does not exceed 0.45% of the Fund’s average daily net assets. This agreement will remain in effect until February 28, 2014, and shall renew automatically for one-year terms unless New York Life Investments provides written notice of termination prior to the start of the next term or upon approval of the Board.
New York Life Investments has contractually agreed to waive fees and/or reimburse expenses so that Total Annual Fund Operating Expenses for Class A shares do not exceed 0.75% of its average daily net assets. New York Life Investments will apply an equivalent waiver or reimbursement, in an equal number of basis points, to the other share classes of the Fund. This agreement will remain in effect until February 28, 2014, and shall renew automatically for one-year terms unless New York Life Investments provides written notice of termination prior to the start of the next term or upon approval of the Board. Total Annual Fund Operating Expenses excludes taxes, interest, litigation, extraordinary expenses, brokerage and other transaction expenses relating to the purchase or sale of portfolio investments, and acquired (underlying) fund fees and expenses.
For the period ended April 30, 2013, New York Life Investments earned fees from the Fund in the amount of $42,757 and waived its fees and/or reimbursed expenses in the amount of $29,386.
State Street Bank, 1 Lincoln Street, Boston, Massachusetts 02111, provides sub-administration and sub-accounting services to the Fund pursuant to an agreement with New York Life Investments. These services include calculating the daily NAVs of the Fund, maintaining the general ledger and sub-ledger accounts for the calculation of the Fund’s respective NAVs, and assisting New York Life Investments in conducting various aspects of the Fund’s administrative operations. For providing these services to the Fund, State Street is compensated by New York Life Investments.
(B) Distribution and Service Fees. The Trust, on behalf of the Fund, has entered into a distribution agreement with NYLIFE Distributors LLC (the “Distributor”), an indirect, wholly-owned subsidiary of New York Life. The Fund has adopted distribution plans (the “Plans”) in accordance with the provisions of Rule 12b-1 under the 1940 Act.
Pursuant to the Investor Class and Class A Plans, the Distributor receives a monthly distribution fee from the Investor Class and Class A shares at an annual rate of 0.25% of the average daily net assets of the Investor Class and Class A shares for distribution and/or service activities as designated by the Distributor. Pursuant to the Class C Plan, Class C shares pay the Distributor a monthly distribution fee at an annual rate of 0.25% of the average daily net assets of the Class C shares, along with a service fee at an annual rate of 0.25% of the average daily net assets of the Class C shares, for a total 12b-1 fee of 0.50%. Class I shares are not subject to a distribution and/or service fee.
The Plans provide that the distribution and service fees are payable to the Distributor regardless of the amounts actually expended by the Distributor for distribution of the Fund’s shares and service activities.
(C) Transfer, Dividend Disbursing and Shareholder Servicing Agent. NYLIM Service Company LLC, an affiliate of New York Life Investments, is the Fund’s transfer, dividend disbursing and shareholder servicing agent pursuant to an agreement between NYLIM Service Company LLC and the Trust. NYLIM Service Company LLC has entered into an agreement with Boston Financial Data Services, Inc. (“BFDS”) pursuant to which BFDS performs certain transfer agent services on behalf of NYLIM Service Company LLC.
(D) Small Account Fee. Shareholders with small accounts adversely impact the cost of providing transfer agency services. In an effort to reduce total transfer agency expenses, the Fund has implemented a small account fee on certain types of accounts. Certain shareholders with an account balance of less than $1,000 are charged an annual per account fee of $20 (assessed semi-annually), the proceeds from which offset transfer agent fees as reflected in the Statement of Operations.
(E) Capital. As of April 30, 2013, New York Life and its affiliates beneficially held shares of the Fund with values and percentages of net assets as follows:
| | | | | | | | |
Investor Class | | $ | 25,350 | | | | 99.8 | % |
Class A | | | 25,325 | | | | 3.1 | |
Class C | | | 25,345 | | | | 99.8 | |
Class I | | | 50,633,583 | | | | 97.6 | |
Note 4–Custodian
State Street is the custodian of the cash and the securities of the Fund. Custodial fees are charged to the Fund based on the market value of securities in the Fund and the number of certain cash transactions incurred by the Fund.
Note 5–Purchases and Sales of Securities (in 000’s)
During the period ended April 30, 2013, purchases and sales of securities, other than short-term securities, were $61,419 and $8,742, respectively.
Note 6–Capital Share Transactions
| | | | | | | | |
Investor Class (a) | | Shares | | | Amount | |
Period ended April 30, 2013: | | | | | | | | |
Shares sold | | | 2,500 | | | $ | 25,000 | |
Shares issued to shareholders in reinvestment of dividends | | | 9 | | | | 86 | |
| | | | | | | | |
Net increase (decrease) | | | 2,509 | | | $ | 25,086 | |
| | | | |
| | |
| | | | | | | | |
| | | | |
| mainstayinvestments.com | | | 21 | |
Notes to Financial Statements (Unaudited) (continued)
| | | | | | | | |
Class A (a) | | Shares | | | Amount | |
Period ended April 30, 2013: | | | | | | | | |
Shares sold | | | 79,748 | | | $ | 803,968 | |
Shares issued to shareholders in reinvestment of dividends | | | 77 | | | | 760 | |
Shares redeemed | | | (54 | ) | | | (551 | ) |
| | | | | | | | |
Net increase (decrease) | | | 79,771 | | | $ | 804,177 | |
| | | | | | | | |
| | |
| | | | | | | | |
Class C (a) | | Shares | | | Amount | |
Period ended April 30, 2013: | | | | | | | | |
Shares sold | | | 2,500 | | | $ | 25,000 | |
Shares issued to shareholders in reinvestment of dividends | | | 8 | | | | 78 | |
| | | | | | | | |
Net increase (decrease) | | | 2,508 | | | $ | 25,078 | |
| | | | | | | | |
| | |
| | | | | | | | |
| | | | | | | | |
Class I (a) | | Shares | | | Amount | |
Period ended April 30, 2013: | | | | | | | | |
Shares sold | | | 5,105,189 | | | $ | 51,062,155 | |
Shares issued to shareholders in reinvestment of dividends | | | 19,133 | | | | 192,966 | |
Shares redeemed | | | (21 | ) | | | (209 | ) |
| | | | | | | | |
Net increase (decrease) | | | 5,124,301 | | | $ | 51,254,912 | |
| | | | | | | | |
|
(a) The inception date of the Fund was February 27, 2013. | |
Note 7–Subsequent Events
In connection with the preparation of the financial statements of the Fund as of and for the fiscal period ended April 30, 2013, events and transactions subsequent to April 30, 2013 through the date the financial statements were issued have been evaluated by the Fund’s management for possible adjustment and/or disclosure. No subsequent events requiring financial statement adjustment or disclosure have been identified.
| | |
| 22 | | MainStay California Tax Free Opportunities Fund |
Board Consideration and Approval of Management Agreement and
Subadvisory Agreement (Unaudited)
Section 15(c) of the Investment Company Act of 1940, as amended (the “1940 Act”) requires that each mutual fund’s board of trustees, including a majority of the independent trustees, review and approve the fund’s investment advisory agreements. At its December 10-12, 2012 meeting, the Board of Trustees of the MainStay Group of Funds (“Board”) unanimously approved the Management Agreement with respect to the MainStay California Tax Free Opportunities Fund (“Fund”) and New York Life Investment Management LLC (“New York Life Investments”), and the Subadvisory Agreement between New York Life Investments and MacKay Shields LLC (“MacKay Shields”) with respect to the Fund.
In reaching its decision to approve the Agreements, the Board considered information furnished by New York Life Investments and MacKay Shields specifically in connection with the contract review process that took place in advance of its December 2012 meeting, which included responses from New York Life Investments and MacKay Shields to a comprehensive list of questions encompassing a variety of topics prepared on behalf of the Board by independent legal counsel to the Board and its independent trustees (the “Independent Trustees”). The Board also considered information provided by New York Life Investments and MacKay Shields on the fees charged to other investment advisory clients (including institutional separate accounts) that follow the investment strategies similar to those proposed for the Fund, and the rationale for any differences in the Fund’s proposed management and subadvisory fees and the fees charged to those other investment advisory clients. The Board also considered relevant information previously provided to the Board in connection with its review of the investment advisory agreements for other MainStay Funds.
In determining to approve the Agreements, the members of the Board reviewed and evaluated all of the information and factors they believed to be relevant and appropriate in light of legal advice furnished to them by independent legal counsel and through the exercise of their own business judgment. The broad factors considered by the Board are discussed in greater detail below, and included, among other items: (i) the nature, extent, and quality of the services to be provided to the Fund by New York Life Investments and MacKay Shields; (ii) the qualifications of the proposed portfolio managers for the Fund and the historical investment performance of products previously managed by such portfolio managers with similar investment strategies to the Fund; (iii) the anticipated costs of the services to be provided, and profits expected to be realized, by New York Life Investments and its affiliates, including MacKay Shields, from their relationships with the Fund; (iv) the extent to which economies of scale may be realized as the Fund grows, and the extent to which economies of scale may benefit Fund investors; and (v) the reasonableness of the Fund’s proposed management and subadvisory fees and overall total ordinary operating expenses, particularly as compared to similar funds and accounts managed by New York Life Investments and MacKay Shields.
While individual members of the Board may have weighed certain factors differently, the Board’s decisions to approve the Agreements were based on a consideration of all the information provided to the Board, including information provided to the Board specifically in connection with the contract review processes. In addition to considering the above-referenced factors, the Board observed that in the marketplace there are a range of investment options available to shareholders of the
Fund, and that the Fund’s shareholders, having had the opportunity to consider other investment options, will have chosen to invest in the Fund. A more detailed discussion of the factors that figured prominently in the Board’s decisions to approve the Agreements is provided below.
Nature, Scope and Quality of Services to Be Provided by New York Life Investments and MacKay Shields
The Board examined the nature scope and quality of the services that New York Life Investments proposed to provide to the Fund. The Board evaluated New York Life Investments’ experience in serving as manager of other mutual funds, noting that New York Life Investments manages other mutual funds, serves a variety of other investment advisory clients, including other pooled investment vehicles, and has experience with overseeing mutual fund service providers, including subadvisers. The Board considered the experience of senior personnel at New York Life Investments proposed to provide management and administrative services to the Fund, as well as New York Life Investments’ reputation and financial condition. The Board also considered the full range of non-advisory services that New York Life Investments will supply to the Fund under the terms of the Fund’s Management Agreement, including: (i) fund accounting services provided by New York Life Investments’ Fund Accounting and Administration Group; (ii) investment oversight and analytical services provided by New York Life Investments’ Investment Consulting Group; (iii) compliance services provided by New York Life Investments’ compliance department, including oversight and implementation of the Fund’s compliance program; and (iv) legal services provided by New York Life Investments’ Office of the General Counsel. Additional information about the non-advisory services provided by New York Life Investments is to be set forth in the Management Agreement. The Board also considered New York Life Investments’ willingness to invest in personnel that benefit the Fund, and noted that New York Life Investments is responsible for compensating the Fund’s officers. The Board also considered benefits to shareholders of being part of the MainStay Group of Funds, including the privilege of exchanging investments between the same class of shares without the imposition of a sales charge, as described more fully in the Fund’s prospectus.
The Board also examined the nature, scope and quality of the advisory services that MacKay Shields proposed to provide to the Fund. The Board evaluated MacKay Shields’ experience in managing other portfolios, including those with similar investment strategies to the Fund. It examined MacKay Shields’ track record and experience in providing investment advisory services, the experience of investment advisory, senior management and administrative personnel at MacKay Shields, and MacKay Shields’ overall legal and compliance environment. The Board also reviewed MacKay Shields’ willingness to invest in personnel designed to benefit the Fund. In this regard, the Board considered the experience of the Fund’s proposed portfolio managers, including with respect to other products with similar investment strategies to the Fund, the number of accounts managed by the portfolio managers and the method for compensating portfolio managers.
Based on these considerations, the Board concluded, within the context of its overall determinations regarding the Agreements, that the Fund likely would benefit from the nature, extent and quality of these services as a result of New York Life Investments’ and MacKay Shields’ experience, personnel, operations and resources.
| | | | |
| mainstayinvestments.com | | | 23 | |
Board Consideration and Approval of Management Agreement and
Subadvisory Agreement (Unaudited) (continued)
Investment Performance
In connection with the Board’s consideration of the Agreements, the Board noted that the Fund had no investment performance track record since the Fund had not yet been offered to investors. The Board discussed with management and the Fund’s proposed portfolio management team the Fund’s investment process, strategies and risks. Additionally, the Board considered the historical performance of other investment portfolios with similar investment strategies that are or have been managed by the proposed portfolio managers for the Fund. Based on these considerations, the Board concluded that the Fund was likely to be managed responsibly and capably by MacKay Shields.
Costs of the Services to Be Provided, and Profits to Be Realized, by New York Life Investments and MacKay Shields
The Board considered the anticipated costs of the services to be provided by New York Life Investments and MacKay Shields under the Agreements, and the profits expected to be realized by New York Life Investments and its affiliates, including MacKay Shields, due to their relationships with the Fund. Because MacKay Shields is an affiliate of New York Life Investments whose subadvisory fees will be paid directly by New York Life Investments, the Board considered cost and profitability information for New York Life Investments and MacKay Shields in the aggregate.
In evaluating the anticipated costs and profits of New York Life Investments and its affiliates, including MacKay Shields, due to their relationships with the Fund, the Board considered, among other factors, each party’s investments in personnel, systems, equipment and other resources necessary to manage the Fund, and that New York Life Investments will be responsible for paying the subadvisory fees for the Fund. The Board acknowledged that New York Life Investments and MacKay Shields must be in a position to pay and retain experienced professional personnel to provide services to the Fund, and that the ability to maintain a strong financial position is important in order for New York Life Investments and MacKay Shields to continue to provide high-quality services to the Fund. The Board also noted that the Fund will benefit from the allocation of certain fixed costs across the MainStay Group of Funds.
In addition, the Board noted the difficulty in obtaining reliable comparative data about mutual fund managers’ profitability, since such information generally is not publicly available and may be impacted by numerous factors, including the structure of a fund manager’s organization, the types of funds it manages, the methodology used to allocate certain fixed costs to specific funds, and the manager’s capital structure and costs of capital. While recognizing the difficulty in evaluating a manager’s profitability with respect to the Fund, and noting that other profitability methodologies may also be reasonable, the Board concluded that the profitability methodology presented by New York Life Investments to the Board with respect to the Fund, which was developed by New York Life Investments in consultation with an independent consultant, was reasonable in all material respects.
In considering the anticipated costs and profitability of the Fund, the Board also considered certain fall-out benefits that may be realized by New York Life Investments and its affiliates, including MacKay Shields, due to their relationships with the Fund.
The Board further considered that, in addition to fees earned by New York Life Investments for managing the Fund, New York Life Investments’ affiliates would also earn revenues from serving the Fund in various other capacities, including as the Fund’s transfer agent and distributor. The Board observed that information about these other revenues, and their impact on the profitability of the Fund to New York Life Investments, was furnished to the Board as part of the 15(c) process. The Board noted that, although it assessed the overall profitability of the Fund to New York Life Investments and its affiliates as part of the contract review process, when considering the reasonableness of the fees to be paid to New York Life Investments and its affiliates under the Agreements, the Board considered the profitability of New York Life Investments’ relationship with the Fund on a pre-tax basis, and without regard to distribution expenses.
After evaluating the information presented to the Board, the Board concluded, within the context of its overall determinations regarding the Agreements, that any profits expected to be realized by New York Life Investments and its affiliates, including MacKay Shields, due to their relationships with the Fund supported the Board’s decision to approve the Agreements.
Extent to Which Economies of Scale May Be Realized as the Fund Grows
The Board also considered whether the Fund’s proposed expense structure permitted economies of scale to be shared with Fund investors. The Board reviewed information from New York Life Investments showing how the Fund’s management fee schedule compared to fee schedules of other funds and accounts managed by New York Life Investments and how it hypothetically would compare with fees paid for similar services by peer funds at varying asset levels. While recognizing the difficulty of determining future economies of scale with precision, the Board acknowledged that economies of scale may be shared with the Fund in a number of ways, including, for example, through the imposition of management fee breakpoints and by initially setting relatively lower management fees.
Based on this information, the Board concluded, within the context of its overall determinations regarding the Agreements, that the Fund’s expense structure appropriately reflects economies of scale for the benefit of Fund investors. The Board noted, however, that it would continue to evaluate the reasonableness of the Fund’s expense structure as the Fund grows over time.
Management and Subadvisory Fees and Total Ordinary Operating Expenses
The Board evaluated the reasonableness of the fees to be paid under the Agreements in relation to the scope of services to be provided and the Fund’s expected total ordinary operating expenses. The Board primarily considered the reasonableness of the management fee to be paid by the Fund to New York Life Investments, since the fees to be paid to MacKay Shields will be paid by New York Life Investments, not the Fund.
In assessing the reasonableness of the Fund’s fees and expenses, the Board primarily considered comparative data provided by New York Life Investments on the fees and expenses charged by similar mutual funds
| | |
| 24 | | MainStay California Tax Free Opportunities Fund |
managed by other investment advisers. In addition, the Board considered information provided by New York Life Investments and MacKay Shields on fees charged to other investment advisory clients, including institutional separate accounts and other funds with similar investment objectives as the Fund. In this regard, the Board took into account the explanation provided by New York Life Investments about the different scope of services provided to mutual funds as compared with other investment advisory clients. The Board also took into account the impact of any expense limitation arrangements on the Fund’s net management fee and expenses.
The Board noted that, outside of the Fund’s management fee and the fees charged under a share class’s Rule 12b-1 and/or shareholder services plans, a share class’s most significant “other expenses” are transfer agent fees. Transfer agent fees will be charged to the Fund based on the number of shareholder accounts (a “per-account” fee) as compared with certain other fees (e.g., management fees), which will be charged based on the Fund’s average net assets. The Board took into account information from New York Life Investments showing that the Fund’s transfer agent fee schedule is reasonable, including industry data showing that the per-account fees that NYLIM Service Company LLC, the Fund’s transfer agent, will charge the Fund are within the range of per-account fees charged by transfer agents to other mutual funds. In addition, the Board considered NYLIM Service Company LLC’s profitability in connection with the transfer agent services it will provide to the Fund.
The Board acknowledged that, because the Fund’s transfer agent fees will be billed on a per-account basis, the impact of transfer agent fees on a share class’s expense ratio may be more significant in cases where the share class has a high number of accounts with limited assets (i.e., small accounts). The Board observed that transfer agent fees are a significant portion of total expenses of many Funds in the MainStay Group of Funds. The impact of transfer agent fees on the expense ratios of these MainStay Funds tends to be greater than for other open-end retail funds, because the MainStay Group of Funds generally has a significant number of small accounts relative to competitor funds. The Board acknowledged the role that the MainStay Group of Funds historically has played in serving the investment needs of New York Life Insurance Company (“New York Life”) policyholders, who often maintain smaller account balances than other fund investors. The Board discussed measures that it and New York Life Investments have taken in recent years to mitigate the effect of small accounts on the expense ratios of Fund share classes, including: (i) encouraging New York Life agents to consolidate multiple small accounts held by the same investor into one MainStay Asset Allocation Fund account; (ii) increasing investment minimums from $500 to $1,000 in 2003; (iii) introducing Investor Class shares for certain MainStay Funds in early 2008 to consolidate smaller account investors; (iv) closing small accounts with balances below $250 in Investor Class shares or $750 in all other classes of shares; (v) no longer allowing an exception with no minimum investment amount with respect to AutoInvest accounts with subsequent monthly purchases of $100; (vi) since 2007, charging an annual $20.00 small account fee on certain accounts with balances below $1,000; and (vii) modifying the approach for billing transfer agent expenses to reduce the degree of subsidization by large accounts of smaller accounts. In addition, the Board acknowledged New York Life Investments’ efforts to
encourage intermediaries to consolidate small accounts in multiple Funds held by the same investor into a single Asset Allocation Fund account, if appropriate under the circumstances, in an effort to mitigate the effect of small accounts on the Funds in the MainStay Group of Funds.
Based on these considerations, the Board concluded that the Fund’s management and subadvisory fees and anticipated total ordinary operating expenses were within a range that is competitive and, within the context of the Board’s overall conclusions regarding the Agreements, support a conclusion that these fees and expenses are reasonable.
Conclusion
On the basis of the information provided to it and its evaluation thereof, the Board, including the Independent Trustees, unanimously voted to approve the Agreements.
| | | | |
| mainstayinvestments.com | | | 25 | |
Proxy Voting Policies and Procedures
and Proxy Voting Record
A description of the policies and procedures that New York Life Investments uses to vote proxies related to the Fund’s securities is available without charge, upon request, (i) by visiting the Fund’s website at mainstayinvestments.com; or (ii) on the SEC’s website at www.sec.gov.
The Fund is required to file with the SEC its proxy voting record for the 12-month period ending June 30 on Form N-PX. The Fund’s most recent Form N-PX is available free of charge upon request (i) by calling 800-MAINSTAY (624-6782); (ii) by visiting the Fund’s website at mainstayinvestments.com; or (iii) on the SEC’s website at www.sec.gov.
Shareholder Reports and Quarterly Portfolio Disclosure
The Fund is required to file its complete schedule of portfolio holdings with the SEC for its first and third fiscal quarters on Form N-Q. The Fund’s Form N-Q is available without charge on the SEC’s website at www.sec.gov or by calling MainStay Investments at 800-MAINSTAY (624-6782). You also can obtain and review copies of Form N-Q by visiting the SEC’s Public Reference Room in Washington, DC (information on the operation of the Public Reference Room may be obtained by calling 1-800-SEC-0330).
| | |
| 26 | | MainStay California Tax Free Opportunities Fund |
MainStay Funds
MainStay offers a wide range of Funds for virtually any investment need. The full array of MainStay open-end offerings is listed here, with information about the manager, subadvisors, legal counsel and independent registered public accounting firms.
Equity
U.S. Equity Funds
MainStay Common Stock Fund
MainStay Cornerstone Growth Fund
MainStay Epoch U.S. All Cap Fund
MainStay Epoch U.S. Equity Yield Fund
MainStay ICAP Equity Fund
MainStay ICAP Select Equity Fund
MainStay Large Cap Growth Fund1
MainStay MAP Fund
MainStay S&P 500 Index Fund
MainStay U.S. Equity Opportunities Fund
MainStay U.S. Small Cap Fund
International/Global Equity Funds
MainStay Epoch Global Choice Fund
MainStay Epoch Global Equity Yield Fund
MainStay Epoch International Small Cap Fund
MainStay ICAP Global Fund
MainStay ICAP International Fund
MainStay International Equity Fund
MainStay International Opportunities Fund
Income
Taxable Bond Funds
MainStay Floating Rate Fund
MainStay Global High Income Fund
MainStay Government Fund
MainStay High Yield Corporate Bond Fund
MainStay High Yield Opportunities Fund
MainStay Indexed Bond Fund
MainStay Intermediate Term Bond Fund
MainStay Short Duration High Yield Fund
MainStay Short Term Bond Fund
MainStay Unconstrained Bond Fund
Municipal Bond Funds
MainStay California Tax Free Opportunities Fund2
MainStay High Yield Municipal Bond Fund
MainStay New York Tax Free Opportunities Fund3
MainStay Tax Free Bond Fund
Money Market Fund
MainStay Money Market Fund
Mixed Asset
MainStay Balanced Fund
MainStay Convertible Fund
MainStay Income Builder Fund
MainStay Marketfield Fund
Asset Allocation/Target Date
MainStay Conservative Allocation Fund
MainStay Growth Allocation Fund
MainStay Moderate Allocation Fund
MainStay Moderate Growth Allocation Fund
MainStay Retirement 2010 Fund
MainStay Retirement 2020 Fund
MainStay Retirement 2030 Fund
MainStay Retirement 2040 Fund
MainStay Retirement 2050 Fund
Manager
New York Life Investment Management LLC
New York, New York
Subadvisors
Cornerstone Capital Management Holdings LLC4
New York, New York
Cornerstone Capital Management LLC4
Bloomington, Minnesota
Epoch Investment Partners, Inc.
New York, New York
Institutional Capital LLC4
Chicago, Illinois
MacKay Shields LLC4
New York, New York
Marketfield Asset Management LLC
New York, New York
Markston International LLC
White Plains, New York
Winslow Capital Management LLC
Minneapolis, Minnesota
Legal Counsel
Dechert LLP
Independent Registered Public Accounting Firms
KPMG LLP
PricewaterhouseCoopers LLP
1. Effective January 13, 2012, the Fund was closed to new investors with certain exceptions.
2. This Fund is only registered for sale in AZ, CA, NV, OR, UT, and WA.
3. This Fund is only registered for sale in CT, DE, FL, MA, NJ, NY, and VT.
4. An affiliate of New York Life Investment Management LLC.
Not part of the Semiannual Report
For more information
800-MAINSTAY (624-6782)
mainstayinvestments.com
The MainStay Funds® are managed by New York Life Investment Management LLC and distributed through NYLIFE Distributors LLC, 169 Lackawanna Avenue, Parsippany, NJ 07054, a wholly owned subsidiary of New York Life Insurance Company. NYLIFE Distributors LLC is a Member FINRA/SIPC.
MainStay Investments® is a registered service mark and name under which New York Life Investment Management LLC does business. MainStay Investments, an indirect subsidiary of New York Life Insurance Company, New York, NY 10010, provides investment advisory products and services.
This report may be distributed only when preceded or accompanied by a current Fund prospectus.
©2013 NYLIFE Distributors LLC. All rights reserved.
| | | | | | | | |
| Not FDIC/NCUA Insured | | Not a Deposit | | May Lose Value | | No Bank Guarantee | | Not Insured by Any Government Agency |
| | |
| NYLIM-30212 MS175-13 | | MSCTF10-06/13 NL0C5 |
Not applicable.
| Item 3. | Audit Committee Financial Expert. |
Not applicable.
| Item 4. | Principal Accountant Fees and Services. |
Not applicable.
| Item 5. | Audit Committee of Listed Registrants |
Not applicable.
| Item 6. | Schedule of Investments |
The Schedule of Investments is included as part of Item 1 of this report.
| Item 7. | Disclosure of Proxy Voting Policies and Procedures for Closed-End Management Investment Companies. |
Not applicable.
| Item 8. | Portfolio Managers of Closed-End Management Investment Companies. |
Not applicable.
| Item 9. | Purchases of Equity Securities by Closed-End Management Investment Company and Affiliated Purchasers. |
Not applicable.
| Item 10. | Submission of Matters to a Vote of Security Holders. |
Since the Registrant’s last response to this Item, there have been no material changes to the procedures by which shareholders may recommend nominees to the Registrant’s Board of Trustees.
| Item 11. | Controls and Procedures. |
(a) Based on an evaluation of the Registrant’s Disclosure Controls and Procedures (as defined in Rule 30a-3(c) under the Investment Company Act of 1940) (the “Disclosure Controls”), as of a date within 90 days prior to the filing date (the “Filing Date”) of this Form N-CSR (the “Report”), the Registrant’s principal executive officer and principal financial officer have concluded that the Disclosure Controls are reasonably designed to ensure that information required to be disclosed by the Registrant in the Report is recorded, processed, summarized and reported by the Filing Date, including ensuring that information required to be disclosed in the Report is accumulated and communicated to the Registrant’s management, including the Registrant’s principal executive officer and principal financial officer, as appropriate to allow timely decisions regarding required disclosure.
(b) There were no changes in the Registrant’s internal control over financial reporting (as defined in Rule 30a-3(d)) under the Investment Company Act of 1940 that occurred during the second fiscal quarter of the period covered by this report that has materially affected, or is reasonably likely to materially affect, the Registrant’s internal control over financial reporting.
| (a) | Certifications of principal executive officer and principal financial officer as required by Rule 30a-2 under the Investment Company Act of 1940. |
| (b) | Certifications of principal executive officer and principal financial officer as required by Section 906 of the Sarbanes-Oxley Act of 2002. |
SIGNATURES
Pursuant to the requirements of the Securities Exchange Act of 1934 and the Investment Company Act of 1940, the Registrant has duly caused this Report to be signed on its behalf by the undersigned, thereunto duly authorized.
MAINSTAY FUNDS TRUST
| | |
| |
| By: | | /s/ Stephen P. Fisher |
| | Stephen P. Fisher President and Principal Executive Officer |
Date: July 8, 2013
Pursuant to the requirements of the Securities Exchange Act of 1934 and the Investment Company Act of 1940, this Report has been signed below by the following persons on behalf of the Registrant and in the capacities and on the dates indicated.
| | |
| |
| By: | | /s/ Stephen P. Fisher |
| | Stephen P. Fisher President and Principal Executive Officer |
Date: July 8, 2013
| | |
| |
| By: | | /s/ Jack R. Benintende |
| | Jack R. Benintende Treasurer and Principal Financial and Accounting Officer |
Date: July 8, 2013
EXHIBIT INDEX
| (a) | Certifications of principal executive officer and principal financial officer as required by Rule 30a-2 under the Investment Company Act of 1940. |
| (b) | Certification of principal executive officer and principal financial officer as required by Section 906 of the Sarbanes-Oxley Act of 2002. |