UNITED STATES
SECURITIES AND EXCHANGE COMMISSION
Washington, D.C. 20549
Form N-CSR
CERTIFIED SHAREHOLDER REPORT OF REGISTERED
MANAGEMENT INVESTMENT COMPANIES
Investment Company Act File Number 811-22321
MAINSTAY FUNDS TRUST
(Exact name of Registrant as specified in charter)
51 Madison Avenue, New York, NY 10010
(Address of principal executive offices) (Zip code)
J. Kevin Gao, Esq.
169 Lackawanna Avenue
Parsippany, New Jersey 07054
(Name and address of agent for service)
Registrant’s telephone number, including area code: (212) 576-7000
Date of fiscal year end: December 31 (MainStay Marketfield Fund)
Date of reporting period: June 30, 2013
FORM N-CSR
The information presented in this Form N-CSR relates solely to the
MainStay Marketfield Fund, a series of the Registrant.
| Item 1. | Reports to Stockholders. |
MainStay Marketfield Fund
Message from the President, Marketfield Asset Management LLC Six-Month Commentary and Semiannual Report
Unaudited | June 30, 2013


This page intentionally left blank
Message from the President
We are pleased to present the six-month commentary from Michael Aronstein, President and Chief Investment Officer of Marketfield Asset Management LLC and the portfolio manager of MainStay Marketfield Fund.
Following this commentary is the semiannual report for MainStay Marketfield Fund for the six-months ended June 30, 2013. These materials contain specific information about the market events, investment decisions and securities that affected MainStay Marketfield Fund during the reporting period.
We invite you to read these materials carefully and to use them as part of your long-term investment planning and financial review. We thank you for investing with MainStay and look forward to continuing our partnership for many years to come.
You may be interested to know that in its most recent rankings, Barron’s listed MainStay Funds as the #1 fund family over the past 10 years. We were also the only mutual fund family that has appeared in Barron’s top six for the past five consecutive years.
Sincerely,

Stephen P. Fisher
President
The opinions expressed are as of the date of this report and are subject to change. There is no guarantee that any forecast made will come to pass. This material does not constitute investment advice and is not intended as an endorsement of any specific investment.
To qualify for the Lipper/Barron’s Fund Survey, a fund family must have at least three funds in Lipper’s general U.S.-stock category, one in world equity (which combines global and international funds), one mixed-equity fund (which holds stocks and bonds), two taxable-bond funds, and one tax-exempt fund. Fund loads and 12b-1 fees aren’t included in the calculation of returns because the aim is to measure the manager’s skill. Each fund’s return is measured against all funds in its Lipper category, resulting in a percentile ranking which is then weighted by asset size relative to the fund family’s other assets in its general classifications. Finally, the score is multiplied by the general classification weightings as determined by the entire Lipper universe of funds.
Source: Barron’s, 2/9/13. Overall, MainStay Funds ranked number 56 for the one-year period, 20 for the five-year period and one for the 10-year period ended December 31, 2012, out of 62, 53 and 46 fund families, respectively. MainStay ranked number three for the 10-year period in 2009, 2010 and 2011 from among 48, 46 and 45 fund families, respectively. MainStay ranked number six from among 48 fund families for the 10-year period in 2008.
According to Lipper Inc., the percentile ranks for MainStay Marketfield Fund Class I shares are 28, 19, 5 and 7 for the one-, three-, five-year and since-inception periods and are from among 175, 108, 61 and 45 long/short equity funds, respectively. The Fund’s total-return percentile rank for the specified time period is relative to all funds that have the same Lipper category. The highest (or most favorable) percentile rank is 1 and the lowest (or least favorable) percentile rank is 100. The top-performing fund in a category will always receive a rank of 1. Percentile ranks within categories are most useful in those categories that have a large number of funds. Lipper Inc. is an independent monitor of fund performance. Past performance is no guarantee of future results, which will vary. For the most recent MainStay Funds performance, please visit our website at mainstayinvestments.com. All mutual funds are subject to market risk and will fluctuate in value.
Not part of the Semiannual Report
Marketfield Asset Management LLC Six-Month Commentary
For the six months ended June 30, 2013, MainStay Marketfield Fund Class I shares had a total return of 7.51%, compared to 13.82% for the S&P 500® Index. The Fund’s year-to-date returns, as compared to the returns of the S&P 500® Index, were negatively effected by the underperformance of cyclical shares during the first four months of the year, when most of the S&P 500® Index gains occurred. (See page 8 for more information on the S&P 500® Index.)
To judge from the financial media, all of the recent gyrations across markets for equities, fixed income, foreign exchange and commodities can be traced directly to the musings of the Federal Reserve Board, and particularly those of its chairman.
The idea that markets are, as always, reacting to a composite of macroeconomic conditions is lost in the popular narrative. The macroeconomic landscape comprises hundreds of important variables, of which U.S. monetary policy is an important element.
Substantial changes in monetary conditions, often reinforced by changes in Federal Reserve Board (FRB) policy, are indeed important factors in setting the overall macroeconomic tone. Investors would do well to keep the nature of these changes uppermost in their minds when contemplating the role of monetary policy on prospective returns. The sequence of cause and effect is, however, generally opposite to what popular thinking holds.
The best practical rule of thumb in analyzing Federal Reserve policy is to remember that they are invariably late in their actions, particularly around macroeconomic inflection points.
The Federal Reserve Board is a bureaucracy. Bureaucracies cannot forecast. Period.
The process of convincing a room full of people that an important change in macroeconomic conditions is in prospect requires a great deal of data. The evidentiary standard is so high as to guarantee that the point of inflection (and market response) is well past once policy change is agreed upon.
For the past twenty-five years, every important directional change by the Federal Reserve has been between one and two years behind the markets. This tendency, once recognized, makes most efforts to base investment strategies on any anticipated changes in monetary policy something of a fool’s errand. Nonetheless, we would expect that the current fashion in financial news, “all Fed, all the time” would persist long after it becomes clear that the practical value of the endeavor is small.
The hysteria surrounding a potential change in liquidity provision by the FRB obscures the fact that general market and macroeconomic conditions are already indicating the sorts of changes that the Fed will eventually be forced to respond to. Their
response will occur long after the investment implications of the regime change have been felt.
Recent declines in “safe” assets, particularly in fixed income markets, are fully justified by the better tone in private sector economic activity and the continuing normalization of many of the deficiencies that arose in the aftermath of 2008. In that instance, the Federal Reserve was two years late in addressing the financial consequences stemming from the unwinding property mania.
Bonds have not sold off because the Fed might modify its extraordinary liquidity regime, but because rates of return for more cyclically tied activities continue to improve, drawing investment flows away from the miniscule returns and high risks of investment grade bonds and their proxies. The former explanation, is, however, more readily packaged in thirty-second sound bites and illustrated with stock footage of Chairman Bernanke and the imposing façade of the Federal Reserve building.
The diminishing enthusiasm for fixed income instruments comes on the heels of a colossal cycle of issuance over the past two years. This cycle has created a record overhang of market capitalization in the fixed income space, all of which represents potential sell side pressure as the mood among asset allocators changes.
This is one of the more misunderstood dynamics of what we refer to as “market economics”. Vast increases in the outstanding market capitalization of an asset type or an individual security have the same potentially dangerous repercussions as a simple increase in prices. Both represent the weight (in monetary terms) of potential future supply. It is one reason that the appearance of large sources of new supply normally precedes reversals of long bull markets and the subsequent bear markets that follow. It takes an enormous decline in price to find housing for boatloads of new supply once the owners have begun to morph into sellers. This is the case at all times in every asset class.
By absorbing a great deal of new treasury issuance, the Federal Reserve has simply opened the floodgates in the IPO markets for fixed income instruments of other sorts. Since 2011, new issuance has more than made up for the Fed’s absorption of existing bonds. This leaves the fixed income markets structurally more vulnerable than they might have been with less industrious quantitative easing.
In the late stages of every long bull market, the terminal expansion of supply often comprises assets that look like the primary objects of enthusiasm, but are, in fact, lower quality copies. When shortages of AAA assets arose a decade ago, banks invented new ones by packaging substandard mortgages and dividing their apparent risks into tiered tranches, the
Not part of the Semiannual Report
highest of which were affirmed as AAA by their irreparably conflicted partners in rating agencies.1
At the height of the technology mania, demand for Internet related shares prompted a wave of new issues that clearly avoided the quality control departments of their sponsoring underwriters.
In the present cycle, flows into income products combined with the Fed’s purchases to produce an apparent shortage of fixed income vehicles. Markets responded by producing hundreds of billions of new issues from remarkably dubious sources.
It is interesting that the same venues that have produced a raft of fake designer products over the past decades are now following up with financial instruments that look just like high-grade bonds. The latter product is much more lucrative for the producer than a container full of faux designer handbags.
The structural flaws that have arisen across fixed income markets during the past two years have the potential to produce events within that space that have the same shock value as those of 1980, 1987, 1994, 1997-8, 2002 and 2008. Each of these periods was marked by episodes of panic, during which liquidity conditions in certain portions of the capital markets were revealed as inadequate.
Our extensive travels allow us to speak directly with thousands of professional advisors. Our strong sense from these contacts is that little has been done in the way of mitigating risks within the fixed income portions of client portfolios. This is not for want of trying by most advisors, who are able to see the dangers firsthand.
As is the case at the end of all bull markets, there are compelling structural and business factors that keep passengers in the boat as it goes over the falls. In the case of fixed income investing there is a strong compliance and asset allocation bias that still rates this as a relatively riskless portion of one’s portfolio.
Target date funds that increase bond exposure as one ages look problematic to us. We question conventional wisdom that suggests older and more risk adverse investors continue with large exposures to fixed income. This is a story that we do not expect to end well.
With the fixed income risks moving to center stage in the past months, it is becoming clear that the one fundamental, macroeconomic scenario that presents the greatest overall threat to stability is acceleration in activity, particularly in the U.S. economy. This outcome appears to us to be increasingly likely, with Europe beginning to stabilize and Japan accelerating in response to unprecedented monetary and cultural change.
The equity portion of our portfolio remains heavily skewed toward businesses in the developed world that are more sensitive to increases in economic activity, particularly in areas involving capital spending and construction, both residential and commercial. Materials and commodity related sectors, which have been clear laggards since the 2008 lows, should begin exhibiting signs of life.
We are beginning to watch closely for signs of input cost and wage pressures in businesses that have enjoyed cost deflation in both until now. We would not be surprised to see invitations being posted on the U.S. borders rather than armed guards sometime in the next two years.
July 24, 2013
Michael C. Aronstein
President, CIO & Portfolio Manager
| 1. | An obligation rated ‘AAA’ has the highest rating assigned by Standard & Poor’s (“S&P”), and in the opinion of S&P, the obligor’s capacity to meet its financial commitment on the obligation is extremely strong. When applied to Fund holdings, ratings are based solely on the creditworthiness of the bonds in the portfolio and are not meant to represent the security or safety of the Fund. |
The information provided herein represents the opinion of the Portfolio Manager and is not intended to be a forecast of future events, a guarantee of future results, nor investment advice. Past performance is no guarantee of future results, which will vary.
Not part of the Semiannual Report
Table of Contents
Investors should refer to the Fund’s Summary Prospectus and/or Prospectus and consider the Fund’s investment objectives, strategies, risks, charges and expenses carefully before investing. The Summary Prospectus and/or Prospectus contain this and other information about the Fund. You may obtain copies of the Fund’s Summary Prospectus, Prospectus and Statement of Additional Information free of charge, upon request, by calling toll-free 800-MAINSTAY (624-6782), by writing to NYLIFE Distributors LLC, Attn: MainStay Marketing Department, 169 Lackawanna Avenue, Parsippany, New Jersey 07054 or by sending an e-mail to MainStayShareholderServices@nylim.com. These documents are also available via the MainStay Funds’ website at mainstayinvestments.com/documents. Please read the Summary Prospectus and/or Prospectus carefully before investing.
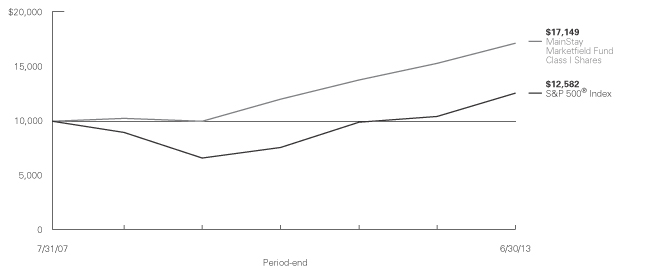
Investment and Performance Comparison1 (Unaudited)
Performance data quoted represents past performance. Past performance is no guarantee of future results. Because of market volatility, current performance may be lower or higher than the figures shown. Investment return and principal value will fluctuate, and as a result, when shares are redeemed, they may be worth more or less than their original cost. The graph below depicts the historical performance of Class I shares of the Fund. Performance will vary from class to class based on differences in class-specific expenses and sales charges. For performance information current to the most recent month-end, please call 800-MAINSTAY (624-6782) or visit mainstayinvestments.com.
Average Annual Total Returns for the Period Ended June 30, 2013
| | | | | | | | | | | | | | | | | | | | | | | | |
| Class | | Sales Charge | | | | Six Months | | | One Year | | | Five Years | | | Since
Inception
(7/31/07) | | | Gross
Expense
Ratio2 | |
| Investor Class Shares3 | | Maximum 5.5% Initial Sales Charge | | With sales charges Excluding sales charges | |
| 1.54
7.45 | %
| |
| 5.89
12.05 | %
| |
| 9.37
10.61 | %
| |
| 8.25
9.29 | %
| |
| 4.11
4.11 | %
|
| Class A Shares3 | | Maximum 5.5% Initial Sales Charge | | With sales charges Excluding sales charges | |
| 1.48
7.39 |
| |
| 5.82
11.98 |
| |
| 9.36
10.60 |
| |
| 8.24
9.28 |
| |
| 4.15
4.15 |
|
| Class C Shares3 | | Maximum 1% CDSC if Redeemed Within One Year of Purchase | | With sales charges Excluding sales charges | |
| 6.02
7.02 |
| |
| 10.17
11.17 |
| |
| 9.78
9.78 |
| |
| 8.46
8.46 |
| |
| 4.90
4.90 |
|
| Class I Shares4 | | No Sales Charge | | | |
| 7.51
|
| | | 12.19 | | | | 10.86 | | | | 9.54 | | | | 2.94 | |
| Class R2 Shares3 | | No Sales Charge | | | | | 7.40 | | | | 11.82 | | | | 10.48 | | | | 9.16 | | | | 3.91 | |
| Class R6 Shares5 | | No Sales Charge | | | | | 7.51 | | |
| 12.19
|
| |
| 10.86
|
| |
| 9.54
|
| |
| 2.84
|
|
| Class P Shares6 | | No Sales Charge | | | | | 7.51 | | | | 12.19 | | | | 10.86 | | | | 9.54 | | | | 2.94 | |
| 1. | The performance table and graph do not reflect the deduction of taxes that a shareholder would pay on dividends and/or distributions or Fund-share redemptions. Total returns reflect maximum applicable sales charges as indicated in the table above, changes in share price, and reinvestment of dividends and capital gain distributions. The graph assumes the initial investment amount shown above and reflects the deduction of all sales charges that would have applied for the period of investment. Performance figures reflect certain fee waivers and/or expense limitations, without which total returns may have been lower. For more information on share classes and current fee waivers and/or expense limitations, please refer to the notes to the financial statements. |
| 2. | The gross expense ratios presented reflect the Fund’s “Total Annual Fund Operating Expenses” from the most recent Prospectus and may differ from other expense ratios disclosed in this report. |
| 3. | Performance figures for Investor Class, Class A, Class C, and Class R2 shares, reflect the historical performance of Class I shares and are adjusted to reflect differences in fees and expenses. Performance data for the classes varies based on differences in their fee and expense |
| | structures. Marketfield Fund commenced operations on July 31, 2007. Unadjusted, the performance for the newer classes would likely have been different. |
| 4. | Performance figures for Class I shares reflect the historical performance of the then-existing shares of Marketfield Fund (the predecessor to the Fund, which was subject to a different fee structure, and for which a predecessor entity to Marketfield Asset Management LLC served as investment advisor) for periods prior to October 5, 2012. Marketfield Fund commenced operations on July 31, 2007. |
| 5. | Performance figures for Class R6 shares, first offered on June 17, 2013, include the historical performance of Class I shares through June 16, 2013. Performance for Class R6 would likely have been different because of differences in certain expenses attributable to each share class. |
| 6. | Performance figures for Class P shares, first offered on May 31, 2013, include the historical performance of Class I shares through May 30, 2013. Performance for Class P shares would likely have been different because of differences in certain expenses attributable to each share class. |
The footnotes on the next page are an integral part of the table and graph and should be carefully read in conjunction with them.
| | | | |
| mainstayinvestments.com | | | 7 | |
| | | | | | | | | | | | | | | | |
| Benchmark Performance | | Six
Months | | | One
Year | | | Five
Years | | | Since
Inception | |
S&P 500® Index7 | | | 13.82 | % | | | 20.60 | % | | | 7.01 | % | | | 3.96 | % |
Average Lipper Long/Short Equity Fund8 | | | 6.11 | | | | 8.96 | | | | 2.63 | | | | 1.46 | |
| 7. | S&P 500® Index is a trademark of The McGraw-Hill Companies, Inc. The S&P 500® Index is widely regarded as the standard index for measuring large-cap U.S. stock market performance. The S&P 500® Index is the Fund’s broad-based securities market index for comparison purposes. Results assume reinvestment of all dividends and capital gains. An investment cannot be made directly in an Index. |
| 8. | The average Lipper long/short equity fund is representative of funds that employ portfolio strategies combining long holdings of equities with short sales of equity, equity options, or equity index options. The funds may be either net long or net short, depending on the portfolio manager’s view of the market. This benchmark is a product of Lipper Inc. Lipper Inc. is an independent monitor of fund performance. Results are based on average total returns of similar funds with all dividend and capital gain distributions reinvested. |
The footnotes on the preceding page are an integral part of the table and graph and should be carefully read in conjunction with them.
| | |
| 8 | | MainStay Marketfield Fund |
Cost in Dollars of a $1,000 Investment in MainStay Marketfield Fund (Unaudited)
The example below is intended to describe the fees and expenses borne by shareholders during the period from January 1, 2013, to June 30, 2013, and the impact of those costs on your investment.
Example
As a shareholder of the Fund, you incur two types of costs: (1) transaction costs, including exchange fees and sales charges (loads) on purchases (as applicable), and (2) ongoing costs, including management fees, distribution and/or service (12b-1) fees, and other Fund expenses (as applicable). This example is intended to help you understand your ongoing costs (in dollars) of investing in the Fund and to compare these costs with the ongoing costs of investing in other Funds. The example is based on an investment of $1,000 made at the beginning of the six-month period and held for the entire period from January 1, 2013, to June 30, 2013. Shares are only sold in connection with variable life and annuity contracts and the example does not reflect any contract level or transactional fees or expenses. If these costs had been included, your costs would have been higher.
This example illustrates your Fund’s ongoing costs in two ways:
Actual Expenses
The second and third data columns in the table below provide information about actual account values and actual expenses. You may use the information in these columns, together with the amount you invested, to estimate the expenses that you paid during the six months ended June 30, 2013. Simply divide your account value by $1,000 (for
example, an $8,600 account value divided by $1,000 = 8.6), then multiply the result by the number under the heading entitled “Expenses Paid During Period” to estimate the expenses you paid on your account during this period.
Hypothetical Example for Comparison Purposes
The fourth and fifth data columns in the table below provide information about hypothetical account values and hypothetical expenses based on the Fund’s actual expense ratio and an assumed rate of return of 5% per year before expenses, which is not the Fund’s actual return. The hypothetical account values and expenses may not be used to estimate the actual ending account balances or expenses you paid for the six-month period shown. You may use this information to compare the ongoing costs of investing in the Fund with the ongoing costs of investing in other Funds. To do so, compare this 5% hypothetical example with the 5% hypothetical examples that appear in the shareholder reports of the other Funds.
Please note that the expenses shown in the table are meant to highlight your ongoing costs only and do not reflect any transactional costs, such as exchange fees or sales charges (loads). Therefore, the fourth and fifth data columns of the table are useful in comparing ongoing costs only and will not help you determine the relative total costs of owning different funds. In addition, if these transactional costs were included, your costs would have been higher.
| | | | | | | | | | | | | | | | | | | | |
| | | | | | | | | | | | | | | | |
| Share Class | | Beginning
Account
Value
1/1/131 | | | Ending Account
Value (Based
on Actual
Returns and
Expenses)
6/30/13 | | | Expenses
Paid
During
Period2 | | | Ending Account
Value (Based
on Hypothetical
5% Annualized
Return and
Actual Expenses)
6/30/13 | | | Expenses
Paid
During
Period2 | |
| | | | | |
| Investor Class Shares | | $ | 1,000.00 | | | $ | 1,074.50 | | | $ | 15.64 | | | $ | 1,009.70 | | | $ | 15.15 | |
| | | | | |
| Class A Shares | | $ | 1,000.00 | | | $ | 1,073.90 | | | $ | 15.43 | | | $ | 1,009.90 | | | $ | 14.95 | |
| | | | | |
| Class C Shares | | $ | 1,000.00 | | | $ | 1,070.20 | | | $ | 19.15 | | | $ | 1,006.30 | | | $ | 18.55 | |
| | | | | |
| Class I Shares | | $ | 1,000.00 | | | $ | 1,075.10 | | | $ | 13.63 | | | $ | 1,011.70 | | | $ | 13.22 | |
| | | | | |
| Class R2 Shares | | $ | 1,000.00 | | | $ | 1,074.00 | | | $ | 20.36 | | | $ | 1,005.20 | | | $ | 19.69 | |
| | | | | |
| Class R6 Shares3 | | $ | 1,000.00 | | | $ | 1,075.10 | 4 | | $ | 1.75 | | | $ | 1,000.10 | | | $ | 1.68 | |
| | | | | |
| Class P Shares3 | | $ | 1,000.00 | | | $ | 1,075.10 | 5 | | $ | 3.37 | | | $ | 1,000.90 | | | $ | 3.25 | |
| 1. | The inception date for Class R6 shares was on June 17, 2013 and Class P shares was on May 31, 2013. |
| 2. | Expenses are equal to the Fund’s annualized expense ratio of each class (3.04% for Investor Class, 3.00% for Class A, 3.73% for Class C, 2.65% for Class I, 3.96% for Class R2, 4.77% for Class R6 and 3.95% for Class P) multiplied by the average account value over the period, divided by 365 and multiplied by 181 days for Investor Class, Class A, Class C, Class I and Class R2 (to reflect the six-month period), 13 days for Class R6 and 30 days for Class P (to reflect the since inception period). The table above represents the actual expenses incurred during the six-month period. |
| 3. | Expenses paid during the period reflect ongoing costs for the period from inception through June 30, 2013. Had these shares been offered for the full six-month period ended June 30, 2013, and had the Fund provided a hypothetical 5% annualized return, expenses paid during the period would have been $23.67 for Class R6 and $19.64 for Class P and the ending account value would have been $1,001.10 for Class R6 and $1,005.20 for Class P. |
| 4. | Performance figures for Class R6 shares, first offered on June 17, 2013, include the historical performance of Class I shares through June 16, 2013. |
| 5. | Performance figures for Class P shares, first offered on May 31, 2013, include the historical performance of Class I shares through May 30, 2013. |
| | | | |
| mainstayinvestments.com | | | 9 | |
Industry Composition as of June 30, 2013 (Unaudited)
| | | | |
| Exchange Traded Funds | | | 10.4 | % |
| Commercial Banks | | | 7.6 | |
| Household Durables | | | 5.8 | |
| Construction Materials | | | 5.1 | |
| Road & Rail | | | 4.4 | |
| Chemicals | | | 4.2 | |
| Machinery | | | 4.0 | |
| Automobiles | | | 3.3 | |
| Metals & Mining | | | 2.7 | |
| Specialty Retail | | | 2.4 | |
| Industrial Conglomerates | | | 2.3 | |
| Electrical Equipment | | | 2.2 | |
| Trading Companies & Distributors | | | 2.2 | |
| Oil, Gas & Consumable Fuels | | | 2.1 | |
| Transportation Infrastructure | | | 2.0 | |
| Auto Components | | | 1.7 | |
| Consumer Finance | | | 1.3 | |
| Air Freight & Logistics | | | 1.2 | |
| Energy Equipment & Services | | | 1.2 | |
| | | | |
| Real Estate Management & Development | | | 1.2 | % |
| Food & Staples Retailing | | | 1.1 | |
| Insurance | | | 1.1 | |
| Purchased Options | | | 1.1 | |
| Semiconductors & Semiconductor Equipment | | | 1.1 | |
| Aerospace & Defense | | | 1.0 | |
| Building Products | | | 1.0 | |
| Food Products | | | 1.0 | |
| Internet & Catalog Retail | | | 1.0 | |
| Internet Software & Services | | | 1.0 | |
| IT Services | | | 1.0 | |
| Real Estate Investment Trusts | | | 1.0 | |
| Software | | | 1.0 | |
| Commercial Services & Supplies | | | 0.8 | |
| Investment in Money Market Fund | | | 13.3 | |
| Other Assets, Less Liabilities | | | 31.6 | |
| Investments Sold Short | | | –25.4 | |
| | | | |
| | | 100.0 | % |
| | | | |
See Portfolio of Investments beginning on page 12 for specific holdings within these categories.
Top Ten Holdings as of June 30, 2013 (excluding short-term investment) (Unaudited)
| 1. | iShares MSCI Japan Index Fund |
| 2. | SPDR S&P Regional Banking |
| 3. | iShares MSCI Mexico Investable Market Index Fund |
| 6. | iShares MSCI Italy Index Fund |
| 7. | Discover Financial Services |
Top Five Short Positions as of June 30, 2013
| 1. | iShares JPMorgan USD Emerging Markets Bond Fund |
| 3. | iShares IBOXX Investment Grade Corporate Bond Fund |
| 4. | iShares FTSE China 25 Index Fund |
| 5. | WisdomTree India Earnings Fund |
| | |
| 10 | | MainStay Marketfield Fund |
Portfolio Management Discussion and Analysis (Unaudited)
Questions answered by portfolio manager Michael C. Aronstein of Marketfield Asset Management LLC, the Fund’s Subadvisor.
How did MainStay Marketfield Fund perform relative to its benchmark and peers during the six months ended June 30, 2013?
Excluding all sales charges, MainStay Marketfield Fund returned 7.45% for Investor Class shares, 7.39% for Class A shares and 7.02% for Class C shares for the six months ended June 30, 2013. Over the same period, Class I shares returned 7.51%, Class R2 shares returned 7.40% and Class R6 and Class P shares1 returned 7.51%. During the six months ended June 30, 2013, all share classes underperformed the 13.82% return of the S&P 500® Index,2 which is the Fund’s broad-based securities-market index. Over the same period, all share classes outperformed the 6.11% return of the average Lipper3 long/short equity fund. See page 7 for Fund returns with applicable sales charges.
What factors affected the Fund’s relative performance during the reporting period?
The Fund takes a top-down investment approach in which the portfolio manager identifies macroeconomic trends and themes, and then determines the most appropriate investment instruments or strategies to express those themes in the Fund.
By theme, the most significant positive contributors to the Fund’s relative performance in the first half of 2013 included the rebound in the housing market, the capital spending cycle theme and the emerging-market short theme. (Contributions take weightings and total returns into account.) The long housing theme contributed 3.2% of the Fund’s positive relative performance. The long theme in capital spending contributed 1.79% to relative performance. The short emerging-market theme contributed 2.05% of the Fund’s positive relative performance. The short theme, End of the PC Era, detracted from relative performance by contributing –0.18%.
During the reporting period, how was the Fund’s performance materially affected by investments in derivatives?
We used puts on various fixed-income and emerging-market securities as a way of creating short positions on these markets. We also used puts on a gold miner ETF to express a short position in gold.
During the reporting period, which sectors were the strongest positive contributors to the Fund’s relative
performance and which sectors were particularly weak?
During the first half of 2013, the strongest positive sector contributions to the Fund’s performance relative to the S&P 500® Index came from the consumer discretionary and industrials sectors on the long side and from emerging-market ETFs on the short side. The weakest-performing sector was a long position in European equities.
During the reporting period, which individual stocks made the strongest contributions to the Fund’s absolute performance and which stocks detracted the most?
During the first half of 2013, the strongest individual positive contributors to the Fund’s absolute performance were a short position in Market Vectors Gold Miners ETF, a short position in iShares China ETF and a long position in media company Pandora Media. Over the same period, the weakest contributions to the Fund’s absolute performance came from a short position in Internet software & services company Qihoo 360 Technology, a short position in software company Microsoft and a short position in diversified financial services company Leucadia National.
Were there other stocks that were particularly noteworthy during the reporting period?
During the final two months of the reporting period, the Fund’s fixed-income short positions performed very well. These were concentrated in ETFs or puts on ETFs including TLT (a long-maturity U.S. Treasury ETF), LQD (a high-grade U.S. corporate-bond ETF) and EMB (a JPMorgan Emerging Market Bond ETF).
Did the Fund make any significant purchases or sales during the reporting period?
During the first half of 2013, we invested approximately 5% of the Fund’s equity holdings in shares of Japanese companies. Japan is undergoing major social change as evidenced by the election of Prime Minister Abe and his subsequent follow-through on the promise of monetary expansion.
How did the Fund’s sector weightings change during the reporting period?
There were no material changes in the Fund’s sector weightings during the six months ended June 30, 2013.
How was the Fund positioned at the end of June 2013?
As of June 30, 2013, the Fund was 79% long (excluding short-term investments) and 26% short. The net exposure was long 53%.4 Since the Fund’s inception, net long exposure has averaged 58%.
| 1. | See footnote on page 7 for more information on historical performance of Class R6 and Class P shares. |
| 2. | See footnote on page 8 for more information on the S&P 500® Index. |
| 3. | See footnote on page 8 for more information on Lipper Inc. |
| 4. | See Portfolio of Investments beginning on page 12 for specific holdings information. |
The opinions expressed are those of the portfolio manager as of the date of this report and are subject to change. There is no guarantee that any forecast made will come to pass. This material does not constitute investment advice and is not intended as an endorsement of any specific investment.
| | | | |
| mainstayinvestments.com | | | 11 | |
Portfolio of Investments June 30, 2013 (Unaudited)
| | | | | | | | |
| | |
Shares | | |
Value | |
| | | | | | | | |
| Common Stocks 68.4%† | |
Aerospace & Defense 1.0% | |
Precision Castparts Corp. (a) | | | 474,495 | | | $ | 107,240,615 | |
| | | | | | | | |
| | |
Air Freight & Logistics 1.2% | | | | | | | | |
FedEx Corp. (a) | | | 1,259,607 | | | | 124,172,058 | |
| | | | | | | | |
| | |
Auto Components 1.7% | | | | | | | | |
Continental A.G. | | | 970,704 | | | | 129,636,775 | |
ElringKlinger A.G. | | | 1,574,676 | | | | 52,553,697 | |
| | | | | | | | |
| | | | | | | 182,190,472 | |
| | | | | | | | |
Automobiles 3.3% | | | | | | | | |
Daimler A.G. | | | 1,948,590 | | | | 117,903,675 | |
Fiat S.p.A (b) | | | 17,881,201 | | | | 124,987,048 | |
Ford Motor Co. | | | 6,661,750 | | | | 103,057,272 | |
| | | | | | | | |
| | | | | | | 345,947,995 | |
| | | | | | | | |
Building Products 1.0% | | | | | | | | |
Geberit A.G. | | | 414,537 | | | | 102,827,822 | |
| | | | | | | | |
| | |
Chemicals 3.6% | | | | | | | | |
Air Liquide S.A. | | | 798,777 | | | | 98,638,962 | |
¨BASF S.E. | | | 1,878,376 | | | | 167,799,464 | |
Sherwin-Williams Co. (The) (a) | | | 619,414 | | | | 109,388,512 | |
| | | | | | | | |
| | | | | | | 375,826,938 | |
| | | | | | | | |
Commercial Banks 7.6% | | | | | | | | |
Bank of Ireland (b) | | | 502,348,076 | | | | 102,005,451 | |
Barclays PLC | | | 24,761,642 | | | | 104,867,635 | |
BB&T Corp. (a) | | | 2,861,008 | | | | 96,930,951 | |
CIT Group, Inc. (a)(b) | | | 2,377,128 | | | | 110,845,479 | |
Fifth Third Bancorp (a) | | | 6,168,144 | | | | 111,334,999 | |
Governor & Co. of The Bank of Ireland (The), Sponsored
ADR (b) | | | 3,389,402 | | | | 28,335,401 | |
Lloyds Banking Group PLC (b) | | | 130,694,605 | | | | 125,549,386 | |
UniCredit S.p.A | | | 25,360,244 | | | | 118,770,511 | |
| | | | | | | | |
| | | | | | | 798,639,813 | |
| | | | | | | | |
Commercial Services & Supplies 0.8% | | | | | |
Bilfinger S.E. | | | 884,036 | | | | 81,412,377 | |
| | | | | | | | |
| | |
Construction Materials 5.1% | | | | | | | | |
Buzzi Unicem S.p.A. | | | 8,231,631 | | | | 123,647,614 | |
¨CRH PLC | | | 6,550,925 | | | | 133,014,414 | |
¨Eagle Materials, Inc. (a) | | | 2,252,622 | | | | 149,281,260 | |
¨Taiheiyo Cement Corp. | | | 41,874,137 | | | | 133,838,490 | |
| | | | | | | | |
| | | | | | | 539,781,778 | |
| | | | | | | | |
Consumer Finance 1.3% | | | | | | | | |
¨Discover Financial Services | | | 2,913,511 | | | | 138,799,664 | |
| | | | | | | | |
| | | | | | | | |
| | |
Shares | | |
Value | |
| | | | | | | | |
Electrical Equipment 2.2% | | | | | | | | |
ABB, Ltd. (b) | | | 5,425,294 | | | $ | 117,805,071 | |
Emerson Electric Co. | | | 2,092,336 | | | | 114,116,006 | |
| | | | | | | | |
| | | | | | | 231,921,077 | |
| | | | | | | | |
Energy Equipment & Services 1.2% | | | | | |
Schlumberger, Ltd. (a) | | | 1,771,000 | | | | 126,909,860 | |
| | | | | | | | |
| | |
Food & Staples Retailing 1.1% | | | | | | | | |
Costco Wholesale Corp. (a) | | | 1,087,767 | | | | 120,274,397 | |
| | | | | | | | |
| | |
Food Products 1.0% | | | | | | | | |
Hershey Co. (The) (a) | | | 1,131,222 | | | | 100,995,500 | |
| | | | | | | | |
| | |
Household Durables 5.8% | | | | | | | | |
D.R. Horton, Inc. (a) | | | 4,625,618 | | | | 98,433,151 | |
Mohawk Industries, Inc. (a)(b) | | | 939,991 | | | | 105,739,588 | |
PulteGroup, Inc. (a)(b) | | | 4,986,917 | | | | 94,601,815 | |
Ryland Group, Inc. (The) (a) | | | 2,524,816 | | | | 101,245,122 | |
Sekisui House, Ltd. | | | 7,120,942 | | | | 102,958,568 | |
Toll Brothers, Inc. (a)(b) | | | 3,161,466 | | | | 103,158,636 | |
| | | | | | | | |
| | | | | | | 606,136,880 | |
| | | | | | | | |
Industrial Conglomerates 2.3% | | | | | | | | |
3M Co. (a) | | | 1,104,440 | | | | 120,770,514 | |
General Electric Co. (a) | | | 5,442,996 | | | | 126,223,077 | |
| | | | | | | | |
| | | | | | | 246,993,591 | |
| | | | | | | | |
Insurance 1.1% | | | | | | | | |
Assicurazioni Generali S.p.A | | | 6,927,549 | | | | 121,011,365 | |
| | | | | | | | |
| | |
Internet & Catalog Retail 1.0% | | | | | | | | |
Amazon.com, Inc. (a)(b) | | | 370,760 | | | | 102,956,344 | |
| | | | | | | | |
| |
Internet Software & Services 1.0% | | | | | |
Facebook, Inc. Class A (a)(b) | | | 4,266,850 | | | | 106,073,891 | |
| | | | | | | | |
| | |
IT Services 1.0% | | | | | | | | |
Amadeus IT Holding S.A. Class A | | | 3,179,083 | | | | 101,609,858 | |
| | | | | | | | |
| | |
Machinery 4.0% | | | | | | | | |
Cummins, Inc. (a) | | | 946,412 | | | | 102,647,846 | |
Deere & Co. (a) | | | 1,387,668 | | | | 112,748,025 | |
Ingersoll-Rand PLC (a) | | | 1,880,893 | | | | 104,427,179 | |
Scania AB Class B | | | 5,300,821 | | | | 106,157,120 | |
| | | | | | | | |
| | | | | | | 425,980,170 | |
| | | | | | | | |
| † | Percentages indicated are based on Fund net assets. |
| ¨ | | Among the Fund’s 10 largest holdings, as of June 30, 2013, excluding short-term investment. May be subject to change daily. |
| | | | |
| 12 | | MainStay Marketfield Fund | | The notes to the financial statements are an integral part of,
and should be read in conjunction with, the financial statements. |
| | | | | | | | |
| | |
| | | Shares | | | Value | |
| | | | | | | | |
| Common Stocks (continued) | |
Metals & Mining 2.7% | | | | | | | | |
Freeport-McMoRan Copper & Gold, Inc. | | | 4,015,163 | | | $ | 110,858,651 | |
Steel Dynamics, Inc. (a) | | | 7,508,166 | | | | 111,946,755 | |
Teck Resources, Ltd. Class B (a) | | | 2,992,760 | | | | 63,955,281 | |
| | | | | | | | |
| | | | | | | 286,760,687 | |
| | | | | | | | |
Oil, Gas & Consumable Fuels 2.1% | | | | | |
Apache Corp. | | | 1,254,568 | | | | 105,170,435 | |
Chesapeake Energy Corp. | | | 2,758,900 | | | | 56,226,382 | |
Exxon Mobil Corp. (a) | | | 656,945 | | | | 59,354,981 | |
| | | | | | | | |
| | | | | | | 220,751,798 | |
| | | | | | | | |
Real Estate Investment Trusts 1.0% | | | | | |
Rayonier, Inc. (a) | | | 1,901,419 | | | | 105,319,598 | |
| | | | | | | | |
|
Real Estate Management & Development 1.2% | |
Deutsche Wohnen A.G. | | | 4,561,815 | | | | 77,459,697 | |
St. Joe Co. (The) (b) | | | 2,558,198 | | | | 53,850,068 | |
| | | | | | | | |
| | | | | | | 131,309,765 | |
| | | | | | | | |
Road & Rail 4.4% | | | | | | | | |
DSV A/S | | | 4,185,496 | | | | 102,042,511 | |
Kansas City Southern (a) | | | 957,779 | | | | 101,486,263 | |
Old Dominion Freight Line, Inc. (a)(b) | | | 2,980,300 | | | | 124,040,086 | |
¨Union Pacific Corp. (a) | | | 867,422 | | | | 133,825,866 | |
| | | | | | | | |
| | | | | | | 461,394,726 | |
| | | | | | | | |
Semiconductors & Semiconductor Equipment 1.1% | |
Intel Corp. | | | 4,799,310 | | | | 116,239,288 | |
| | | | | | | | |
| | |
Software 1.0% | | | | | | | | |
Splunk, Inc. (b) | | | 2,208,101 | | | | 102,367,562 | |
| | | | | | | | |
| | |
Specialty Retail 2.4% | | | | | | | | |
Home Depot, Inc. (The) (a) | | | 1,672,521 | | | | 129,570,202 | |
Tractor Supply Co. | | | 1,006,964 | | | | 118,429,036 | |
| | | | | | | | |
| | | | | | | 247,999,238 | |
| | | | | | | | |
Trading Companies & Distributors 2.2% | | | | | |
Beacon Roofing Supply, Inc. (a)(b) | | | 3,199,872 | | | | 121,211,151 | |
Wolseley PLC | | | 2,325,562 | | | | 107,279,106 | |
| | | | | | | | |
| | | | | | | 228,490,257 | |
| | | | | | | | |
Transportation Infrastructure 2.0% | | | | | |
Abertis Infraestructuras S.A. | | | 5,146,125 | | | | 89,759,240 | |
Atlantia S.p.A | | | 7,717,586 | | | | 125,871,263 | |
| | | | | | | | |
| | | | | | | 215,630,503 | |
| | | | | | | | |
Total Common Stocks
(Cost $6,700,253,548) | | | | | | | 7,203,965,887 | |
| | | | | | | | |
| | | | | | | | |
| | |
| | | Shares | | | Value | |
| | | | | | | | |
| Exchange Traded Funds 10.4% (c) | |
iShares Dow Jones US Home Construction Index Fund (a) | | | 5,730,876 | | | $ | 128,257,005 | |
¨iShares MSCI Italy Index
Fund (a) | | | 11,992,820 | | | | 141,635,204 | |
¨iShares MSCI Japan Index Fund | | | 25,692,377 | | | | 288,268,470 | |
¨iShares MSCI Mexico Investable Market Index Fund (a) | | | 3,013,282 | | | | 196,465,986 | |
SPDR S&P Homebuilders (a) | | | 3,656,479 | | | | 107,573,612 | |
¨SPDR S&P Regional Banking (a) | | | 6,809,405 | | | | 230,702,642 | |
| | | | | | | | |
Total Exchange Traded Funds
(Cost $1,035,713,650) | | | | 1,092,902,919 | |
| | | | | | | | |
|
| Preferred Stock 0.6% | |
Chemicals 0.6% | | | | | | | | |
Fuchs Petrolub A.G. 2.20% | | | 831,954 | | | | 66,220,097 | |
| | | | | | | | |
Total Preferred Stock
(Cost $53,595,494) | | | | | | | 66,220,097 | |
| | | | | | | | |
| | |
| | | | | | | | |
| | | Notional
Amount | | | | |
| Purchased Options 1.1% | | | | | |
Purchased Call Options 0.4% | |
CNY/USD
Strike Price $6.321
Expires 6/9/14(d) | | | 1,401,000,000 | | | | 19,015,773 | |
Strike Price $6.722
Expires 12/9/14(d) | | | 1,401,000,000 | | | | 19,691,055 | |
| | | | | | | | |
Total Purchased Call Options
(Cost $38,340,700) | | | | | | | 38,706,828 | |
| | | | | | | | |
| | |
| | | | | | | | |
| | | Number of
Contracts | | | | |
Purchased Put Options 0.7% | | | | | | | | |
Apple, Inc.
Strike Price $400.00
Expires 7/20/13 | | | 3,370 | | | | 3,959,750 | |
Strike Price $430.00
Expires 7/20/13 | | | 3,000 | | | | 10,350,000 | |
Strike Price $435.00
Expires 7/20/13 | | | 1,000 | | | | 3,860,000 | |
| | | | | | | | |
| | | | | | | 18,169,750 | |
| | | | | | | | |
iShares MSCI Emerging Markets
Strike Price $40.50
Expires 7/20/13 | | | 154,540 | | | | 34,926,040 | |
Market Vectors Gold Miners ETF
Strike Price $28.00
Expires 7/20/13 | | | 25,000 | | | | 8,875,000 | |
| | | | | | |
The notes to the financial statements are an integral part of,
and should be read in conjunction with, the financial statements. | | mainstayinvestments.com | | | 13 | |
Portfolio of Investments June 30, 2013 (Unaudited) (continued)
| | | | | | | | |
| | | Number of
Contracts | | | Value | |
| | | | | | | | |
| Purchased Options (continued) | |
Purchased Put Options (continued) | |
Vanguard FTSE Emerging Markets
Strike Price $40.00
Expires 7/20/13 | | | 112,502 | | | $ | 18,562,830 | |
| | | | | | | | |
Total Purchased Put Options
(Cost $43,551,614) | | | | | | | 80,533,620 | |
| | | | | | | | |
Total Purchased Options
(Cost $81,892,314) | | | | | | | 119,240,448 | |
| | | | | | | | |
| | |
| | | | | | | | |
| | |
| | | Shares | | | | |
| Short-Term Investments 13.3% | | | | | |
Money Market Fund 13.3% | |
State Street Institutional Treasury Money Market Fund | | | 1,400,000,000 | | | | 1,400,000,000 | |
| | | | | | | | |
Total Short-Term Investment (Cost $1,400,000,000) | | | | | | | 1,400,000,000 | |
| | | | | | | | |
Total Investments, Before Investments Sold Short
(Cost $9,271,455,006) (f) | | | 93.8 | % | | | 9,882,329,351 | |
| | | | | | | | |
|
| Common Stocks Sold Short (11.7%) | |
Capital Markets (0.8%) | |
Franklin Resources, Inc. | | | (599,036 | ) | | | (81,480,877 | ) |
| | | | | | | | |
| | |
Commercial Banks (1.3%) | | | | | | | | |
ICICI Bank, Ltd., Sponsored ADR | | | (2,355,536 | ) | | | (90,099,252 | ) |
Itau Unibanco Holding S.A., ADR | | | (3,341,180 | ) | | | (43,168,046 | ) |
| | | | | | | | |
| | | | | | | (133,267,298 | ) |
| | | | | | | | |
Computers & Peripherals (1.2%) | | | | | | | | |
Apple, Inc. | | | (317,495 | ) | | | (125,753,420 | ) |
| | | | | | | | |
| | |
Food Products (0.8%) | | | | | | | | |
Mondelez International, Inc. Class A | | | (3,138,742 | ) | | | (89,548,309 | ) |
| | | | | | | | |
| | |
Insurance (2.9%) | | | | | | | | |
Allianz SE | | | (2,063,202 | ) | | | (301,454,755 | ) |
| | | | | | | | |
|
Internet Software & Services (1.7%) | |
Baidu, Inc., Sponsored ADR (b) | | | (801,657 | ) | | | (75,780,636 | ) |
Qihoo 360 Technology Co., Ltd., ADR (b) | | | (2,347,513 | ) | | | (108,384,675 | ) |
| | | | | | | | |
| | | | | | | (184,165,311 | ) |
| | | | | | | | |
IT Services (0.7%) | | | | | | | | |
International Business Machines Corp. | | | (411,813 | ) | | | (78,701,582 | ) |
| | | | | | | | |
| | | | | | | | |
| | |
Shares | | | Value | |
| | | | | | | | |
Metals & Mining (0.6%) | �� | | | | | | | |
Barrick Gold Corp. | | | (3,713,330 | ) | | $ | (58,447,814 | ) |
| | | | | | | | |
| | |
Software (1.7%) | | | | | | | | |
Microsoft Corp. | | | (3,667,019 | ) | | | (126,622,166 | ) |
Oracle Corp. | | | (1,793,639 | ) | | | (55,100,590 | ) |
| | | | | | | | |
| | | | | | | (181,722,756 | ) |
| | | | | | | | |
Total Common Stocks Sold Short
(Proceeds $(1,237,841,104)) | | | | (1,234,542,122 | ) |
| | | | | | | | |
|
| Exchange Traded Funds Sold Short (13.7%) (c) | |
iShares FTSE China 25 Index Fund | | | (7,674,094 | ) | | | (249,561,537 | ) |
iShares IBOXX Investment Grade Corporate Bond Fund | | | (2,622,698 | ) | | | (298,069,628 | ) |
iShares JPMorgan USD Emerging Markets Bond Fund | | | (4,468,601 | ) | | | (489,445,867 | ) |
iShares MSCI Brazil Index Fund | | | (2,278,810 | ) | | | (99,948,607 | ) |
iShares MSCI South Africa Index Fund | | | (952,837 | ) | | | (55,683,794 | ) |
Vanguard FTSE Emerging Markets ETF | | | (2,886,302 | ) | | | (111,930,792 | ) |
WisdomTree India Earnings Fund | | | (8,531,370 | ) | | | (137,866,939 | ) |
| | | | | | | | |
Total Exchange Traded Funds Sold Short
(Cost $(1,592,493,675)) | | | | (1,442,507,164 | ) |
| | | | | | | | |
Total Investments Sold Short
(Proceeds $(2,830,334,779)) (e) | | | (25.4 | )% | | | (2,677,049,286 | ) |
| | | | | | | | |
Total Investments, Net of Investments Sold Short
(Cost $(6,441,120,227)) | | | 68.4 | | | | 7,205,280,065 | |
Other Assets, Less Liabilities | | | 31.6 | | | | 3,322,588,515 | |
Net Assets | | | 100.0 | % | | $ | 10,527,868,580 | |
| (a) | Security, or a portion thereof, is maintained in a segregated account at the Fund’s custodian as collateral for securities sold short (See Note 2(I)). |
| (b) | Non-income producing security. |
| (c) | Exchange Traded Fund—An investment vehicle that represents a basket of securities that is traded on an exchange. |
| (d) | Fair valued security—The total market value of these securities as of June 30, 2013 is $38,706,828, which represents 0.4% of the Fund’s net assets. |
| (e) | As of June 30, 2013, cash in the amount of $3,177,578,812 is on deposit with broker for short sale transactions. |
| | | | |
| 14 | | MainStay Marketfield Fund | | The notes to the financial statements are an integral part of,
and should be read in conjunction with, the financial statements. |
| (f) | As of June 30, 2013, cost is $9,273,792,556 for federal income tax purposes and net unrealized appreciation is as follows: |
| | | | |
Gross unrealized appreciation | | $ | 764,651,271 | |
Gross unrealized depreciation | | | (156,114,476 | ) |
| | | | |
Net unrealized appreciation | | $ | 608,536,795 | |
| | | | |
The following abbreviations are used in the above portfolio:
ADR—American Depositary Receipt
CNY—Chinese Yuan
SPDR—Standard & Poor’s Depositary Receipt
The following is a summary of the fair valuations according to the inputs used as of June 30, 2013, for valuing the Fund’s assets and liabilities.
Asset Valuation Inputs
| | | | | | | | | | | | | | | | |
Description | | Quoted
Prices in
Active
Markets for
Identical
Assets
(Level 1) | | | Significant
Other
Observable
Inputs
(Level 2) | | | Significant
Unobservable
Inputs (Level 3) | | | Total | |
| Investments in Securities (a) | | | | | | | | | | | | | | | | |
| Common Stocks | | $ | 7,203,965,887 | | | $ | — | | | $ | — | | | $ | 7,203,965,887 | |
| Exchange Traded Funds | | | 1,092,902,919 | | | | — | | | | — | | | | 1,092,902,919 | |
| Preferred Stock | | | 66,220,097 | | | | — | | | | — | | | | 66,220,097 | |
| Short-Term Investment | | | | | | | | | | | | | | | | |
Money Market Fund | | | 1,400,000,000 | | | | — | | | | — | | | | 1,400,000,000 | |
| | | | | | | | | | | | | | | | |
| Total Investments in Securities | | | 9,763,088,903 | | | | — | | | | — | | | | 9,763,088,903 | |
| | | | | | | | | | | | | | | | |
| Other Financial Instruments | | | | | | | | | | | | | | | | |
Purchased Call Options (b) | | | — | | | | — | | | | 38,706,828 | | | | 38,706,828 | |
Purchased Put Options | | | 80,533,620 | | | | — | | | | — | | | | 80,533,620 | |
| | | | | | | | | | | | | | | | |
| Total Investments in Securities and Other Financial Instruments | | $ | 9,843,622,523 | | | $ | — | | | $ | 38,706,828 | | | $ | 9,882,329,351 | |
| | | | | | | | | | | | | | | | |
Liability Valuation Inputs
| | | | | | | | | | | | | | | | |
Description | | Quoted
Prices in
Active
Markets for
Identical
Assets
(Level 1) | | | Significant
Other
Observable
Inputs
(Level 2) | | | Significant
Unobservable
Inputs (Level 3) | | | Total | |
| Investments Sold Short (a) | | | | | | | | | | | | | | | | |
| Common Stocks Sold Short | | $ | (1,234,542,122 | ) | | $ | — | | | $ | — | | | $ | (1,234,542,122 | ) |
| Exchange Traded Funds Sold Short | | | (1,442,507,164 | ) | | | — | | | | — | | | | (1,442,507,164 | ) |
| | | | | | | | | | | | | | | | |
| Total Investments in Securities | | $ | (2,677,049,286 | ) | | $ | — | | | $ | — | | | $ | (2,677,049,286 | ) |
| | | | | | | | | | | | | | | | |
| (a) | For a complete listing of investments and their industries, see the Portfolio of Investments. |
| (b) | The Level 3 security valued at $38,706,828 is held in Purchased Call Options within the Purchased Options section of the Portfolio of Investments. |
The Fund recognizes transfers between the levels as of the beginning of the period.
For the period ended June 30, 2013, the Portfolio did not have any transfers between Level 1 and Level 2 fair value measurements. (See Note 2)
| | | | | | |
The notes to the financial statements are an integral part of,
and should be read in conjunction with, the financial statements. | | mainstayinvestments.com | | | 15 | |
Portfolio of Investments June 30, 2013 (Unaudited) (continued)
The following is a reconciliation of investments in which significant unobservable inputs (Level 3) were used in determining value:
| | | | | | | | | | | | | | | | | | | | | | | | | | | | | | | | | | | | | | | | |
Investments
in Securities | | Balance
December 31,
2012 | | | Accrued
Discounts
(Premiums) | | | Realized
Gain
(Loss) | | | Change in
Unrealized
Appreciation
(Depreciation) | | | Purchases | | | Sales | | | Transfers
in to
Level 3 | | | Transfers
out of
Level 3 | | | Balance
as of
June 30,
2013 | | | Change in
Unrealized
Appreciation
(Depreciation)
from
Investments
Still Held at
June 30,
2013 (a) | |
Purchased
Options | | | | | | | | | | | | | | | | | | | | | | | | | | | | | | | | | | | | | | | | |
Purchased
Call Options | | $ | — | | | $ | — | | | $ | — | | | $ | 366,128 | | | $ | 38,340,700 | | | $ | — | | | $ | — | | | $ | — | | | $ | 38,706,828 | | | $ | 366,128 | |
| | | | | | | | | | | | | | | | | | | | | | | | | | | | | | | | | | | | | | | | |
| Total | | $ | — | | | $ | — | | | $ | — | | | $ | 366,128 | | | $ | 38,340,700 | | | $ | — | | | $ | — | | | $ | — | | | $ | 38,706,828 | | | $ | 366,128 | |
| | | | | | | | | | | | | | | | | | | | | | | | | | | | | | | | | | | | | | | | |
| (a) | Included in “Net change in unrealized appreciation (depreciation) on investments” in the Statement of Operations. |
| | | | |
| 16 | | MainStay Marketfield Fund | | The notes to the financial statements are an integral part of,
and should be read in conjunction with, the financial statements. |
Statement of Assets and Liabilities as of June 30, 2013 (Unaudited)
| | | | |
| Assets | |
Investment in securities, at value
(identified cost $9,271,455,006) | | $ | 9,882,329,351 | |
Cash collateral on deposit at broker | | | 3,177,578,812 | |
Cash | | | 594,237,581 | |
Cash denominated in foreign currencies
(identified cost $29,117) | | | 28,804 | |
Receivables: | | | | |
Fund shares sold | | | 240,676,579 | |
Investment securities sold | | | 130,081,007 | |
Dividends | | | 19,571,714 | |
Other assets | | | 1,025,220 | |
| | | | |
Total assets | | | 14,045,529,068 | |
| | | | |
| |
| Liabilities | | | | |
Investments sold short (proceeds $2,830,334,779) | | | 2,677,049,286 | |
Payables: | | | | |
Investment securities purchased | | | 809,771,333 | |
Manager (See Note 3) | | | 11,147,662 | |
Dividends on investments sold short | | | 11,092,485 | |
Fund shares redeemed | | | 6,666,300 | |
Transfer agent (See Note 3) | | | 1,081,962 | |
NYLIFE Distributors (See Note 3) | | | 653,140 | |
Shareholder communication | | | 133,599 | |
Professional fees | | | 24,777 | |
Custodian | | | 21,607 | |
Trustees | | | 7,424 | |
Other Liabilities | | | 10,913 | |
| | | | |
Total liabilities | | | 3,517,660,488 | |
| | | | |
Net assets | | $ | 10,527,868,580 | |
| | | | |
| |
| Composition of Net Assets | | | | |
Shares of beneficial interest outstanding (par value of $.001 per share) unlimited number of shares authorized | | $ | 618,498 | |
Additional paid-in capital | | | 9,758,631,787 | |
| | | | |
| | | 9,759,250,285 | |
Net investment loss | | | (34,723,309 | ) |
Accumulated net realized gain (loss) on investments, investments sold short, written options and foreign currency transactions | | | 39,234,616 | |
Net unrealized appreciation (depreciation) on investments | | | 610,874,345 | |
Net unrealized appreciation (depreciation) on investments sold short | | | 153,285,484 | |
Net unrealized appreciation (depreciation) on translation of other assets and liabilities in foreign currencies | | | (52,841 | ) |
| | | | |
Net assets | | $ | 10,527,868,580 | |
| | | | |
| | | | |
Investor Class | | | | |
Net assets applicable to outstanding shares | | $ | 5,303,681 | |
| | | | |
Shares of beneficial interest outstanding | | | 311,735 | |
| | | | |
Net asset value per share outstanding | | $ | 17.01 | |
Maximum sales charge (5.50% of offering price) | | | 0.99 | |
| | | | |
Maximum offering price per share outstanding | | $ | 18.00 | |
| | | | |
Class A | | | | |
Net assets applicable to outstanding shares | | $ | 778,850,729 | |
| | | | |
Shares of beneficial interest outstanding | | | 45,788,669 | |
| | | | |
Net asset value and offering price per share outstanding | | $ | 17.01 | |
| | | | |
Maximum sales charge (5.50% of offering price) | | | 0.99 | |
| | | | |
Maximum offering price per share outstanding | | $ | 18.00 | |
| | | | |
Class C | | | | |
Net assets applicable to outstanding shares | | $ | 687,414,082 | |
| | | | |
Shares of beneficial interest outstanding | | | 40,628,794 | |
| | | | |
Net asset value and offering price per share outstanding | | $ | 16.92 | |
| | | | |
Class I | | | | |
Net assets applicable to outstanding shares | | $ | 9,030,102,979 | |
| | | | |
Shares of beneficial interest outstanding | | | 530,230,188 | |
| | | | |
Net asset value and offering price per share outstanding | | $ | 17.03 | |
| | | | |
Class R2 | | | | |
Net assets applicable to outstanding shares | | $ | 4,184,505 | |
| | | | |
Shares of beneficial interest outstanding | | | 246,307 | |
| | | | |
Net asset value and offering price per share outstanding | | $ | 16.99 | |
| | | | |
Class R6 | | | | |
Net assets applicable to outstanding shares | | $ | 24,922 | |
| | | | |
Shares of beneficial interest outstanding | | | 1,464 | |
| | | | |
Net asset value and offering price per share outstanding | | $ | 17.02 | |
| | | | |
Class P | | | | |
Net assets applicable to outstanding shares | | $ | 21,987,682 | |
| | | | |
Shares of beneficial interest outstanding | | | 1,291,111 | |
| | | | |
Net asset value and offering price per share outstanding | | $ | 17.03 | |
| | | | |
| | | | | | |
The notes to the financial statements are an integral part of,
and should be read in conjunction with, the financial statements. | | mainstayinvestments.com | | | 17 | |
Statement of Operations for the six months ended June 30, 2013 (Unaudited)
| | | | |
| Investment Income (Loss) | |
Income | | | | |
Dividends (a) | | $ | 64,824,153 | |
Interest | | | 42,340 | |
| | | | |
Total income | | | 64,866,493 | |
| | | | |
Expenses | | | | |
Manager (See Note 3) | | | 51,079,756 | |
Dividends on investments sold short | | | 34,544,709 | |
Broker fees and charges on short sales | | | 7,834,581 | |
Transfer agent (See Note 3) | | | 2,810,130 | |
Distribution/Service—Investor Class (See Note 3) | | | 3,781 | |
Distribution/Service—Class A (See Note 3) | | | 534,778 | |
Distribution/Service—Class C (See Note 3) | | | 1,952,420 | |
Distribution/Service—Class R2 (See Note 3) | | | 835 | |
Registration | | | 272,552 | |
Shareholder communication | | | 232,635 | |
Professional fees | | | 156,473 | |
Custodian | | | 65,588 | |
Trustees | | | 63,775 | |
Shareholder service—Class R2 (See Note 3) | | | 334 | |
Miscellaneous | | | 38,934 | |
| | | | |
Total expenses | | | 99,591,281 | |
| | | | |
Net investment income (loss) | | | (34,724,788 | ) |
| | | | |
|
| Realized and Unrealized Gain (Loss) on Investments, Written Options and Foreign Currency Transactions | |
Net realized gain (loss) on: | | | | |
Security transactions | | | 171,625,218 | |
Investments sold short | | | (89,652,655 | ) |
Written option transactions | | | 9,994,815 | |
Foreign currency transactions | | | 643,461 | |
| | | | |
Net realized gain (loss) on investments, investments sold short, written option transactions and foreign currency transactions | | | 92,610,839 | |
| | | | |
Net change in unrealized appreciation (depreciation) on: | | | | |
Investments | | | 172,211,607 | |
Investments sold short | | | 203,162,403 | |
Written option contracts | | | (948,324 | ) |
Translation of other assets and liabilities in foreign currencies | | | (58,690 | ) |
| | | | |
Net change in unrealized appreciation (depreciation) on investments, investments sold short, written options and foreign currency transactions | | | 374,366,996 | |
| | | | |
Net realized and unrealized gain (loss) on investments, investments sold short, written options and foreign currency transactions | | | 466,977,835 | |
| | | | |
Net increase (decrease) in net assets resulting from operations | | $ | 432,253,047 | |
| | | | |
| (a) | Dividends recorded net of foreign withholding taxes in the amount of $4,350,388. |
| | | | |
| 18 | | MainStay Marketfield Fund | | The notes to the financial statements are an integral part of,
and should be read in conjunction with, the financial statements. |
Statements of Changes in Net Assets
for the six months ended June 30, 2013 (Unaudited) and the year ended December 31, 2012
| | | | | | | | |
| | | 2013 | | | 2012 | |
| Increase (Decrease) in Net Assets | | | | | |
Operations: | | | | | | | | |
Net investment income (loss) | | $ | (34,724,788 | ) | | $ | (27,714,619 | ) |
Net realized gain (loss) on investments, futures transactions, written option transactions, investments sold short and foreign currency transactions | | | 92,610,839 | | | | (23,685,780 | ) |
Net change in unrealized appreciation (depreciation) on investments, investments sold short, futures contracts, written options and foreign currency transactions | | | 374,366,996 | | | | 301,411,597 | |
| | | | |
Net increase (decrease) in net assets resulting from operations | | | 432,253,047 | | | | 250,011,198 | |
| | | | |
Distributions to shareholders: | | | | | | | | |
From net realized gain on investments: | | | | | | | | |
Investor Class | | | — | | | | (1,882 | ) |
Class A | | | — | | | | (407,905 | ) |
Class C | | | — | | | | (366,143 | ) |
Class I | | | — | | | | (16,701,031 | ) |
Class R2 | | | — | | | | (114 | ) |
Class R6 | | | — | | | | — | |
Class P | | | — | | | | — | |
| | | | |
Total distributions to shareholders | | | — | | | | (17,477,075 | ) |
| | | | |
Capital share transactions: | | | | | | | | |
Net proceeds from sale of shares | | | 6,331,356,840 | | | | 3,627,403,963 | |
Net asset value of shares issued to shareholders in reinvestment of distributions | | | — | | | | 13,221,785 | |
Cost of shares redeemed | | | (642,863,444 | ) | | | (354,820,101 | )(a) |
| | | | |
Increase (decrease) in net assets derived from capital share transactions | | | 5,688,493,396 | | | | 3,285,805,647 | |
| | | | |
Net increase (decrease) in net assets | | | 6,120,746,443 | | | | 3,518,339,770 | |
|
| Net Assets | |
Beginning of period | | | 4,407,122,137 | | | | 888,782,367 | |
| | | | |
End of period | | $ | 10,527,868,580 | | | $ | 4,407,122,137 | |
| | | | |
Net investment income (loss) at end of period | | $ | (34,723,309 | ) | | $ | 1,479 | |
| | | | |
| (a) | Cost of shares redeemed net of redemption fees of $140,260 for the year ended December 31, 2012. |
| | | | | | |
The notes to the financial statements are an integral part of,
and should be read in conjunction with, the financial statements. | | mainstayinvestments.com | | | 19 | |
Financial Highlights selected per share data and ratios
| | | | | | | | |
| | | Investor Class | |
| | | Six months
ended
June 30, | | | October 5,
2012**
through
December 31, | |
| | | 2013* | | | 2012 | |
Net asset value at beginning of period | | $ | 15.84 | | | $ | 15.80 | † |
| | | | | | | | |
Net investment income (loss) (a) | | | (0.08 | ) | | | (0.04 | ) |
Net realized and unrealized gain (loss) on investments | | | 1.25 | | | | 0.15 | |
Net realized and unrealized gain (loss) on foreign currency transactions | | | — | | | | — | |
| | | | | | | | |
Total from investment operations | | | 1.17 | | | | 0.11 | |
| | | | | | | | |
Less distributions: | | | | | | | | |
From net realized gain on investments | | | — | | | | (0.07 | ) |
| | | | | | | | |
Net asset value at end of period | | $ | 17.01 | | | $ | 15.84 | |
| | | | | | | | |
Total investment return (b)(c) | | | 7.39 | % (d) | | | 0.72 | % |
Ratios of expenses to average net assets (e): | | | | | | | | |
Before waivers/reimbursements of expenses | | | 3.04 | % †† | | | 4.03 | % †† |
Excluding dividends and interest expense on short positions | | | 1.74 | % †† | | | 1.74 | % †† |
After waivers/reimbursements of expenses | | | 3.04 | % †† | | | 4.03 | % †† |
Excluding dividends and interest expense on short positions | | | 1.74 | % †† | | | 1.74 | % †† |
Ratio of net investment loss to average net assets: | | | | | | | | |
Before waivers/reimbursements of expenses (f) | | | (1.02 | %)†† | | | (1.06 | %)†† |
After waivers/reimbursements of expenses (f) | | | (1.02 | %)†† | | | (1.06 | %)†† |
Short sale expenses | | | 1.30 | % †† | | | 2.29 | % †† |
Portfolio turnover rate | | | 22 | % | | | 66 | % |
Net assets at end of period (in 000’s) | | $ | 5,304 | | | $ | 619 | |
| † | Based on the net asset value of Class I as of October 5, 2012. |
| (a) | Per share data based on average shares outstanding during the period. |
| (b) | Total investment return is not annualized. |
| (c) | Total investment return is calculated exclusive of sales charges and assumes the reinvestment of dividends and distributions. |
| (d) | Total investment return may reflect adjustments to conform to generally accepted accounting principles. |
| (e) | In addition to the fees and expenses which the Fund bears directly, the Fund indirectly bears a pro-rata share of the fees and expenses of the Exchange Traded Funds in which it invests. Such indirect expenses are not included in the above expense ratios. |
| (f) | The net investment loss ratios include dividends and interest expense on short positions. |
| | | | |
| 20 | | MainStay Marketfield Fund | | The notes to the financial statements are an integral part of,
and should be read in conjunction with, the financial statements. |
Financial Highlights selected per share data and ratios
| | | | | | | | |
| | | Class A | |
| | | Six months
ended
June 30, | | | October 5,
2012**
through
December 31, | |
| | | 2013* | | | 2012 | |
Net asset value at beginning of period | | $ | 15.84 | | | $ | 15.80 | † |
| | | | | | | | |
Net investment income (loss) (a) | | | (0.09 | ) | | | (0.04 | ) |
Net realized and unrealized gain (loss) on investments | | | 1.26 | | | | 0.15 | |
Net realized and unrealized gain (loss) on foreign currency transactions | | | — | | | | — | |
| | | | | | | | |
Total from investment operations | | | 1.17 | | | | 0.11 | |
| | | | | | | | |
Less distributions: | | | | | | | | |
From net realized gain on investments | | | — | | | | (0.07 | ) |
| | | | | | | | |
Net asset value at end of period | | $ | 17.01 | | | $ | 15.84 | |
| | | | | | | | |
Total investment return (b)(c) | | | 7.39 | % | | | 0.72 | % |
Ratios of expenses to average net assets (d): | | | | | | | | |
Before waivers/reimbursements of expenses | | | 3.00 | % †† | | | 4.07 | % †† |
Excluding dividends and interest expense on short positions | | | 1.75 | % †† | | | 1.80 | % †† |
After waivers/reimbursements of expenses | | | 3.00 | % †† | | | 4.07 | % †† |
Excluding dividends and interest expense on short positions | | | 1.75 | % †† | | | 1.80 | % †† |
Ratio of net investment loss to average net assets: | | | | | | | | |
Before waivers/reimbursements of expenses (e) | | | (1.06 | %)†† | | | (1.13 | %)†† |
After waivers/reimbursements of expenses (e) | | | (1.06 | %)†† | | | (1.13 | %)†† |
Short sale expenses | | | 1.25 | % †† | | | 2.27 | % †† |
Portfolio turnover rate | | | 22 | % | | | 66 | % |
Net assets at end of period (in 000’s) | | $ | 778,851 | | | $ | 137,056 | |
| † | Based on the net asset value of Class I as of October 5, 2012. |
| (a) | Per share data based on average shares outstanding during the period. |
| (b) | Total investment return is not annualized. |
| (c) | Total investment return is calculated exclusive of sales charges and assumes the reinvestment of dividends and distributions. |
| (d) | In addition to the fees and expenses which the Fund bears directly, the Fund indirectly bears a pro-rata share of the fees and expenses of the Exchange Traded Funds in which it invests. Such indirect expenses are not included in the above expense ratios. |
| (e) | The net investment loss ratios include dividends and interest expense on short positions. |
| | | | | | |
The notes to the financial statements are an integral part of,
and should be read in conjunction with, the financial statements. | | mainstayinvestments.com | | | 21 | |
Financial Highlights selected per share data and ratios
| | | | | | | | |
| | | Class C | |
| | | Six months
ended
June 30, | | | October 5,
2012**
through
December 31, | |
| | | 2013* | | | 2012 | |
Net asset value at beginning of period | | $ | 15.81 | | | $ | 15.80 | † |
| | | | | | | | |
Net investment income (loss) (a) | | | (0.15 | ) | | | (0.07 | ) |
Net realized and unrealized gain (loss) on investments | | | 1.26 | | | | 0.15 | |
Net realized and unrealized gain (loss) on foreign currency transactions | | | — | | | | — | |
| | | | | | | | |
Total from investment operations | | | 1.11 | | | | 0.08 | |
| | | | | | | | |
Less distributions: | | | | | | | | |
From net realized gain on investments | | | — | | | | (0.07 | ) |
| | | | | | | | |
Net asset value at end of period | | $ | 16.92 | | | $ | 15.81 | |
| | | | | | | | |
Total investment return (b)(c) | | | 7.02 | % | | | 0.53 | % |
Ratios of expenses to average net assets (d): | | | | | | | | |
Before waivers/reimbursements of expenses | | | 3.73 | % †† | | | 4.82 | % †† |
Excluding dividends and interest expense on short positions | | | 2.49 | % †† | | | 2.50 | % †† |
After waivers/reimbursements of expenses | | | 3.73 | % †† | | | 4.82 | % †† |
Excluding dividends and interest expense on short positions | | | 2.49 | % †† | | | 2.50 | % †† |
Ratio of net investment loss to average net assets: | | | | | | | | |
Before waivers/reimbursements of expenses (e) | | | (1.80 | %)†† | | | (1.85 | %)†† |
After waivers/reimbursements of expenses (e) | | | (1.80 | %)†† | | | (1.85 | %)†† |
Short sale expenses | | | 1.24 | % †† | | | 2.32 | % †† |
Portfolio turnover rate | | | 22 | % | | | 66 | % |
Net assets at end of period (in 000’s) | | $ | 687,414 | | | $ | 124,430 | |
| † | Based on the net asset value of Class I as of October 5, 2012. |
| (a) | Per share data based on average shares outstanding during the period. |
| (b) | Total investment return is not annualized. |
| (c) | Total investment return is calculated exclusive of sales charges and assumes the reinvestment of dividends and distributions. |
| (d) | In addition to the fees and expenses which the Fund bears directly, the Fund indirectly bears a pro-rata share of the fees and expenses of the Exchange Traded Funds in which it invests. Such indirect expenses are not included in the above expense ratios. |
| (e) | The net investment loss ratios include dividends and interest expense on short positions. |
| | | | |
| 22 | | MainStay Marketfield Fund | | The notes to the financial statements are an integral part of,
and should be read in conjunction with, the financial statements. |
Financial Highlights selected per share data and ratios
| | | | | | | | | | | | | | | | | | | | | | | | | | | | |
| | | Class I | |
| | | Six months
ended
June 30, | | | Year ended December 31, | | | June 1,
2009
through
December 31, | | | Year ended
May 31, | | | July 31,
2007**
through
May 31, | |
| | | 2013* | | | 2012 | | | 2011*** | | | 2010*** | | | 2009*** | | | 2009*** | | | 2008*** | |
Net asset value at beginning of period | | $ | 15.84 | | | $ | 14.02 | | | $ | 13.52 | | | $ | 11.84 | | | $ | 10.18 | | | $ | 10.76 | | | $ | 10.00 | |
| | | | | | | | | | | | | | | | | | | | | | | | | | | | |
Net investment income (loss) | | | (0.07 | )(a) | | | (0.06 | )(a) | | | (0.11 | ) | | | (0.04 | ) | | | (0.06 | ) | | | (0.03 | ) | | | (0.05 | ) |
Net realized and unrealized gain (loss) on investments | | | 1.26 | | | | 1.96 | | | | 0.61 | | | | 1.75 | | | | 1.72 | | | | (0.55 | ) | | | 0.81 | |
Net realized and unrealized gain (loss)
on foreign currency transactions | | | 0.00 | ‡ | | | (0.01 | ) | | | — | (b) | | | — | (b) | | | — | (b) | | | — | (b) | | | — | (b) |
| | | | | | | | | | | | | | | | | | | | | | | | | | | | |
Total from investment operations | | | 1.19 | | | | 1.89 | | | | 0.50 | | | | 1.71 | | | | 1.66 | | | | (0.58 | ) | | | 0.76 | |
| | | | | | | | | | | | | | | | | | | | | | | | | | | | |
Less dividends and distributions: | | | | | | | | | | | | | | | | | | | | | | | | | | | | |
From net investment income | | | — | | | | — | | | | — | | | | (0.01 | ) | | | — | | | | — | | | | — | |
From net realized gain on investments | | | — | | | | (0.07 | ) | | | — | | | | (0.02 | ) | | | — | | | | (0.00 | )‡ | | | — | |
| | | | | | | | | | | | | | | | | | | | | | | | | | | | |
Total dividends and distributions | | | — | | | | (0.07 | ) | | | — | | | | (0.03 | ) | | | — | | | | (0.00 | )‡ | | | — | |
| | | | | | | | | | | | | | | | | | | | | | | | | | | | |
Redemption fee | | | — | | | | — | | | | 0.00 | ‡ | | | 0.00 | ‡ | | | 0.00 | ‡ | | | 0.00 | ‡ | | | — | |
| | | | | | | | | | | | | | | | | | | | | | | | | | | | |
Net asset value at end of period | | $ | 17.03 | | | $ | 15.84 | | | $ | 14.02 | | | $ | 13.52 | | | $ | 11.84 | | | $ | 10.18 | | | $ | 10.76 | |
| | | | | | | | | | | | | | | | | | | | | | | | | | | | |
Total investment return (c) | | | 7.51 | % (d) | | | 13.50 | % | | | 3.70 | % | | | 14.32 | % | | | 16.40 | % (e) | | | (5.36 | %)(e) | | | 7.60 | % |
Ratios of expenses to average net assets (f): | | | | | | | | | | | | | | | | | | | | | | | | | | | | |
Before waivers/reimbursements and recoupments or expenses | | | 2.65 | % †† | | | 2.86 | % | | | 2.42 | % | | | 2.35 | % | | | 2.58 | % †† | | | 2.67 | % | | | 5.98 | % †† |
Excluding dividends and interest expense on short positions | | | 1.50 | % †† | | | 1.53 | % | | | 1.55 | % | | | 1.64 | % | | | 1.75 | % †† | | | 2.24 | % | | | 5.01 | % †† |
After waivers/reimbursements and
recoupments of expenses | | | 2.65 | % †† | | | 2.86 | % | | | 2.43 | % | | | 2.46 | % | | | 2.43 | % (g)†† | | | 2.24 | % | | | 2.97 | % †† |
Excluding dividends and interest expense on short position | | | 1.50 | % †† | | | 1.53 | % | | | 1.56 | % | | | 1.75 | % | | | 1.90 | % (g)†† | | | 1.81 | % | | | 2.00 | % †† |
Ratio of net investment loss to average net assets: | | | | | | | | | | | | | | | | | | | | | | | | | | | | |
Before waivers/reimbursements and recoupments of expense (h) | | | (0.89 | %)†† | | | (1.28 | %) | | | (1.06 | %) | | | (0.25 | %) | | | (1.48 | %)(i)†† | | | (0.92 | %) | | | (4.33 | %)†† |
After waivers/reimbursements
and recoupments of expense (h) | | | (0.89 | %)†† | | | (1.28 | %) | | | (1.07 | %) | | | (0.36 | %) | | | (1.33 | %)(g)†† | | | (0.49 | %) | | | (1.32 | %)†† |
Short sale expenses | | | 1.15 | % †† | | | 1.33 | % | | | 0.87 | % | | | 0.71 | % | | | 0.83 | % †† | | | 0.43 | % | | | 0.97 | % †† |
Portfolio turnover rate | | | 22 | % | | | 66 | % | | | 138 | % | | | 159 | % | | | 78 | % | | | 227 | % | | | 123 | % |
Net assets at end of period (in 000’s) | | $ | 9,030,103 | | | $ | 4,144,927 | | | $ | 888,782 | | | $ | 433,921 | | | $ | 98,503 | | | $ | 43,044 | | | $ | 11,684 | |
| *** | These years were audited by a predecessor audit firm whose opinion was unqualified. |
| ‡ | Rounds to less than 0.5 cent per share. |
| (a) | Per share data based on average shares outstanding during the period. |
| (b) | This information was not separately reported and part of realized unrealized gain (loss). |
| (c) | Total investment return is calculated exclusive of sales charges and assumes the reinvestment of dividends and distributions. Class I shares are not subject to sales charges. |
| (d) | Total investment return is not annualized. |
| (e) | Not annualized for periods less than a full year. The total return shown for the year ended May 31, 2009 and the period ended December 31, 2009, reflect the total return while the Fund was taxed as a C corporation. (See Note 2(b)) |
| (f) | In addition to the fees and expenses which the Fund bears directly, the Fund indirectly bears a pro-rata share of the fees and expenses of the Exchange Traded Funds in which it invests. Such indirect expenses are not included in the above expense ratios. |
| (h) | The net investment loss ratios include dividends and interest expense on short positions. |
| (i) | The net investment loss ratios include tax expense. |
| | | | | | |
The notes to the financial statements are an integral part of,
and should be read in conjunction with, the financial statements. | | mainstayinvestments.com | | | 23 | |
Financial Highlights selected per share data and ratios
| | | | | | | | |
| | | Class R2 | |
| | | Six months
ended
June 30, | | | October 5,
2012**
through
December 31, | |
| | | 2013* | | | 2012 | |
Net asset value at beginning of period | | $ | 15.82 | | | $ | 15.80 | † |
| | | | | | | | |
Net investment income (loss) (a) | | | (0.13 | ) | | | (0.06 | ) |
Net realized and unrealized gain (loss) on investments | | | 1.30 | | | | 0.15 | |
Net realized and unrealized gain (loss) on foreign currency transactions | | | — | | | | — | |
| | | | | | | | |
Total from investment operations | | | 1.17 | | | | 0.09 | |
| | | | | | | | |
Less distributions: | | | | | | | | |
From net realized gain on investments | | | — | | | | (0.07 | ) |
| | | | | | | | |
Net asset value at end of period | | $ | 16.99 | | | $ | 15.82 | |
| | | | | | | | |
Total investment return (b)(c) | | | 7.40 | % | | | 0.59 | % |
Ratios of expenses to average net assets (d): | | | | | | | | |
Before waivers/reimbursements of expenses | | | 3.96 | % †† | | | 3.83 | % †† |
Excluding dividends and interest expense on short positions | | | 1.86 | % †† | | | 1.89 | % †† |
After waivers/reimbursements of expenses | | | 3.96 | % †† | | | 3.83 | % †† |
Excluding dividends and interest expense on short positions | | | 1.86 | % †† | | | 1.89 | % †† |
Ratio of net investment loss to average net assets: | | | | | | | | |
Before waivers/reimbursements of expenses (e) | | | (1.55 | %)†† | | | (1.56 | %)†† |
After waivers/reimbursements of expenses (e) | | | (1.55 | %)†† | | | (1.56 | %)†† |
Short sale expenses | | | 2.10 | % †† | | | 1.94 | % †† |
Portfolio turnover rate | | | 22 | % | | | 66 | % |
Net assets at end of period (in 000’s) | | $ | 4,185 | | | $ | 90 | |
| † | Based on the net asset value of Class I as of October 5, 2012. |
| (a) | Per share data based on average shares outstanding during the period. |
| (b) | Total investment return is not annualized. |
| (c) | Total investment return is calculated exclusive of sales charges and assumes the reinvestment of dividends and distributions. Class R2 shares are not subject to sales charges. |
| (d) | In addition to the fees and expenses which the Fund bears directly, the Fund indirectly bears a pro-rata share of the fees and expenses of the Exchange Traded Funds in which it invests. Such indirect expenses are not included in the above expense ratios. |
| (e) | The net investment loss ratios include dividends and interest expense on short positions. |
| | | | |
| 24 | | MainStay Marketfield Fund | | The notes to the financial statements are an integral part of,
and should be read in conjunction with, the financial statements. |
Financial Highlights selected per share data and ratios
| | | | |
| | | Class R6 | |
| | | June 17,
2013**
through
June 30, | |
| | | 2013* | |
Net asset value at beginning of period | | $ | 17.08 | † |
| | | | |
Net investment income (loss) | | | (0.01 | )(a) |
Net realized and unrealized gain (loss) on investments | | | (0.05 | ) |
| | | | |
Total from investment operations | | | (0.06 | ) |
| | | | |
Net asset value at end of period | | $ | 17.02 | |
| | | | |
Total investment return | | | (0.35 | %)(b)(c)(d) |
Ratios of expenses to average net assets (e): | | | | |
Before waivers/reimbursements of expenses | | | 4.77 | % †† |
Excluding dividends and interest expense on short positions | | | 1.43 | % †† |
After waivers/reimbursements of expenses | | | 4.77 | % †† |
Excluding dividends and interest expense on short positions | | | 1.43 | % †† |
Ratio of net investment loss to average net assets: | | | | |
Before waivers/reimbursements of expenses (f) | | | (2.13 | %)†† |
After waivers/reimbursements of expenses (f) | | | (2.13 | %)†† |
Short sale expenses | | | 3.34 | % †† |
Portfolio turnover rate | | | 22 | % |
Net assets at end of period (in 000’s) | | $ | 25 | |
| † | Based on the net asset value of Class I as of June 17, 2013. |
| (a) | Per share data based on average shares outstanding during the period. |
| (b) | Total investment return is not annualized. |
| (c) | Total investment return is calculated exclusive of sales charges and assumes the reinvestment of dividends and distributions. Class R6 shares are not subject to sales charges. |
| (d) | Total investment return may reflect adjustments to conform to generally accepted accounting principles. |
| (e) | In addition to the fees and expenses which the Fund bears directly, the Fund indirectly bears a pro-rata share of the fees and expenses of the Exchange Traded Funds in which it invests. Such indirect expenses are not included in the above expense ratios. |
| (f) | The net investment loss ratios include dividends and interest expense on short positions. |
| | | | | | |
The notes to the financial statements are an integral part of,
and should be read in conjunction with, the financial statements. | | mainstayinvestments.com | | | 25 | |
Financial Highlights selected per share data and ratios
| | | | |
| | | Class P | |
| | | May 31,
2013**
through
June 30, | |
| | | 2013* | |
Net asset value at beginning of period | | $ | 17.01 | † |
| | | | |
Net investment income (loss) | | | (0.02 | )(a) |
Net realized and unrealized gain (loss) on investments | | | 0.04 | |
| | | | |
Total from investment operations | | | 0.02 | |
| | | | |
Net asset value at end of period | | $ | 17.03 | |
| | | | |
Total investment return | | | 0.12 | % (b)(c)(d) |
Ratios of expenses to average net assets (e): | | | | |
Before waivers/reimbursements of expenses | | | 3.95 | % †† |
Excluding dividends and interest expense on short positions | | | 1.50 | % †† |
After waivers/reimbursements of expenses | | | 3.95 | % †† |
Excluding dividends and interest expense on short positions | | | 1.50 | % †† |
Ratio of net investment loss to average net assets: | | | | |
Before waivers/reimbursements of expenses (f) | | | (1.41 | %)†† |
After waivers/reimbursements of expenses (f) | | | (1.41 | %)†† |
Short sale expenses | | | 2.45 | % †† |
Portfolio turnover rate | | | 22 | % |
Net assets at end of period (in 000’s) | | $ | 21,988 | |
| † | Based on the net asset value of Class I as of May 31, 2013. |
| (a) | Per share data based on average shares outstanding during the period. |
| (b) | Total investment return is not annualized. |
| (c) | Total investment return is calculated exclusive of sales charges and assumes the reinvestment of dividends and distributions. Class P shares are not subject to sales charges. |
| (d) | Total investment return may reflect adjustments to conform to generally accepted accounting principles. |
| (e) | In addition to the fees and expenses which the Fund bears directly, the Fund indirectly bears a pro-rata share of the fees and expenses of the Exchange Traded Funds in which it invests. Such indirect expenses are not included in the above expense ratios. |
| (f) | The net investment loss ratios include dividends and interest expense on short positions. |
| | | | |
| 26 | | MainStay Marketfield Fund | | The notes to the financial statements are an integral part of,
and should be read in conjunction with, the financial statements. |
Notes to Financial Statements (Unaudited)
Note 1–Organization and Business
MainStay Funds Trust (the “Trust”) was organized as a Delaware statutory trust on April 28, 2009, and is governed by a Declaration of Trust. The Trust is registered under the Investment Company Act of 1940, as amended (the “1940 Act”), as an open-end management investment company, and is comprised of thirty-four funds (collectively referred to as the “Funds”). These financial statements and notes relate only to the MainStay Marketfield Fund (the “Fund”), a diversified fund. The Fund is successor to Marketfield Fund (the “Predecessor Fund”), which was a series of a different registered investment company for which Marketfield Asset Management, LLC, a New York limited liability company and the predecessor entity to the Fund’s Subadvisor (as defined in Note 3(A)), served as investment adviser. The financial statements of the Fund reflect the historical results of the Predecessor Fund prior to its reorganization on October 5, 2012. Upon the completion of the reorganization, the Class I shares of the Fund assumed the performance, financial and other information of the Predecessor Fund. All information and references to periods prior to October 5, 2012 refer to the Predecessor Fund.
The Fund currently offers seven classes of shares. Investor Class, Class A, Class C and Class R2 shares commenced operations on October 5, 2012. Class I shares commenced operations on July 31, 2007. Class R6 shares commenced operations on June 17, 2013. Class P shares commenced operations on May 31, 2013. Investor Class and Class A shares are offered at net asset value (“NAV”) per share plus an initial sales charge. No sales charge applies to investments of $1 million or more (and certain other qualified purchases) in Investor Class and Class A shares, but a contingent deferred sales charge (“CDSC”) is imposed on certain redemptions made within one year of the date of purchase. Class C shares are offered at NAV without an initial sales charge, although a 1.00% CDSC may be imposed on redemptions made within one year of the date of purchase of Class C shares. Class I, Class R2, Class R6, and Class P shares are offered at NAV and are not subject to a sales charge. Depending upon eligibility, Investor Class shares may convert to Class A shares and Class A shares may convert to Investor Class shares. The seven classes of shares have the same voting (except for issues that relate solely to one class), dividend, liquidation and other rights, and the same terms and conditions, except that Class C shares are subject to higher distribution and/or service fee rates than Investor Class and Class A shares under a distribution plan pursuant to Rule 12b-1 under the 1940 Act. Class I, Class R6 and Class P shares are not subject to a distribution and/or service fee.
The Fund’s investment objective is to seek capital appreciation.
Note 2–Significant Accounting Policies
The Fund prepares its financial statements in accordance with generally accepted accounting principles (“GAAP”) in the United States of America and follows the significant accounting policies described below.
(A) Securities Valuation. Investments are valued as of the close of regular trading on the New York Stock Exchange (“Exchange”) (generally 4:00 p.m. Eastern time) on each day the Fund is open for business (“valuation date”).
The Board of Trustees (the “Board”) has adopted procedures for the valuation of the Fund’s securities and has delegated the responsibility
for valuation determinations under those procedures to the Valuation Committee of the Fund (the “Valuation Committee”). The Board has authorized the Valuation Committee to appoint a Valuation Sub-Committee (the “Sub-Committee”) to deal in the first instance with questions that arise or cannot be resolved under these procedures. The Sub-Committee meets (in person, via electronic mail or via teleconference) on an as-needed basis. The Valuation Committee meets at a later time, as necessary, to ensure that actions taken by the Sub-Committee were appropriate. The procedures recognize that, subject to the oversight of the Board and unless otherwise noted, the responsibility for day-to-day valuation of portfolio assets (including securities for which market prices are not readily available) rests with New York Life Investment Management LLC (“New York Life Investments” or the “Manager”), aided to whatever extent necessary by the Subadvisor (as defined in Note 3(A)) of the Fund.
To assess the appropriateness of security valuations, the Manager or the Fund’s third party service provider who is subject to oversight by the Manager regularly compares prior day prices, prices on comparable securities and the sale prices to the prior and current day prices and challenges prices exceeding certain tolerance levels with third party pricing services or broker sources. For those securities valued by recommendation, whether through a standardized fair valuation methodology or a fair valuation determination, the Valuation Committee reviews and affirms the reasonableness of the valuation based on such methodologies and determinations on a regular basis after considering all relevant information that is reasonably available.
Each security owned by the Fund that is listed on a securities exchange is valued at its last sale price on that exchange on the date as of which assets are valued. When the security is listed on more than one exchange, the Fund will use the price of the exchange that the Fund generally considers to be the principal exchange on which the stock is traded.
Fund securities listed on the NASDAQ Stock Market, Inc. (“NASDAQ”) will be valued at the NASDAQ Official Closing Price (“NOCP”), which may not necessarily represent the last sale price. If the NOCP is not available, such securities shall be valued at the last sale price on the day of valuation. If there has been no sale on such exchange or on NASDAQ on such day, the security is valued at the mean between the bid and asked prices on such day.
“Fair value” is defined as the price that the Fund would receive upon selling an investment in an orderly transaction to an independent buyer in the principal or most advantageous market of the investment. Fair value measurements are determined within a framework that has established a three-tier hierarchy which maximizes the use of observable market data and minimizes the use of unobservable inputs to establish a classification of fair value measurements for disclosure purposes. “Inputs” refers broadly to the assumptions that market participants would use in pricing the asset or liability, including assumptions about risk, such as the risk inherent in a particular valuation technique used to measure fair value using a pricing model and/or the risk inherent in the inputs for the valuation technique. Inputs may be observable or unobservable. Observable inputs reflect the assumptions market participants would use in pricing the asset or liability based on market data obtained from sources independent of the Fund. Unobservable inputs reflect the Fund’s own assumptions about the assumptions market
| | | | |
| mainstayinvestments.com | | | 27 | |
Notes to Financial Statements (Unaudited) (continued)
participants would use in pricing the asset or liability developed based on the information available in the circumstances. The inputs or methodology used for valuing securities may not be an indication of the risks associated with investing in those securities. The three-tier hierarchy of inputs is summarized in the three broad Levels listed below.
| • | | Level 1—quoted prices in active markets for identical investments |
| • | | Level 2—other significant observable inputs (including quoted prices for similar investments in active markets, interest rates and yield curves, prepayment speeds, credit risks, etc.) |
| • | | Level 3—significant unobservable inputs (including the Fund’s own assumptions about the assumptions that market participants would use in determining the fair value of investments) |
The aggregate value by input level, as of June 30, 2013, for the Fund’s investments is included at the end of the Fund’s Portfolio of Investments.
The valuation techniques used by the Fund to measure fair value maximize the use of observable inputs and minimize the use of unobservable inputs. The Fund may utilize third party vendor evaluations, whose prices may be derived from one or more of the following standard inputs:
| | |
• Benchmark Yields | | • Reported Trades |
• Broker Dealer Quotes | | • �� Issuer Spreads |
• Two-sided markets | | • Benchmark securities |
• Bids/Offers | | • Reference Data (corporate actions or material event notices) |
• Industry and economic events | | • Comparable bonds |
• Equity and credit default swap curves | | • Monthly payment information |
Securities for which market values cannot be determined using the methodologies described above are valued by methods deemed in good faith by the Fund’s Valuation Committee, following the procedures established by the Board, to represent fair value. Under these procedures, the Fund primarily employs a market-based approach which may use related or comparable assets or liabilities, recent transactions, market multiples, book values, and other relevant information. The Fund may also use an income-based valuation approach in which the anticipated future cash flows of the investment are discounted to calculate fair value. Discounts may also be applied due to the nature or duration of any restrictions on the disposition of the investments. Due to the inherent uncertainty of valuations of such investments, the fair values may differ significantly from the values that would have been used had an active market existed. For the period ended June 30, 2013, there have been no changes to the fair value methodologies.
Equity and non-equity securities which may be valued in this manner include, but are not limited to: (i) a security for which the trading has been halted or suspended; (ii) a debt security that has recently gone into default and for which there is not a current market quotation; (iii) a security of an issuer that has entered into a restructuring; (iv) a security that has been de-listed from a national exchange; (v) a security for which the market price is not available from a third party pricing source or, if so provided, does not, in the opinion of the Fund’s Manager or Subadvisor reflect the security’s market value; and (vi) a security whose
principal market has been temporarily closed at a time when, under normal conditions, it would be open. Securities for which market quotations or observable inputs are not readily available are generally categorized as Level 3 in the hierarchy. As of June 30, 2013, the Fund held securities with a value of $38,706,828 that were fair valued in such a manner.
Certain events may occur between the time that foreign markets, on which securities held by the Fund principally trade, close and the time at which the Fund’s NAV is calculated. These events may include, but are not limited to, situations relating to a single issuer in a market sector, significant fluctuations in U.S. or foreign markets, natural disasters, armed conflicts, governmental actions or other developments not tied directly to the securities markets. Should the Manager or Subadvisor conclude that such events may have affected the accuracy of the last price of such securities reported on the local foreign market, the Manager or Subadvisor may, pursuant to procedures adopted by the Board, adjust the value of the local price to reflect the estimated impact on the price of such securities as a result of such events. In this instance, securities are generally categorized as Level 3 in the hierarchy. Additionally, foreign equity securities are also fair valued whenever the movement of a particular index exceeds certain thresholds. In such cases, the securities are fair valued by applying factors provided by a third party vendor in accordance with the Fund’s policies and procedures and are generally categorized as Level 2 in the hierarchy. As of June 30, 2013, certain foreign equity securities held by the Fund were not fair valued in such a manner.
Equity securities and Exchange Traded Funds are valued at the latest quoted sales prices as of the close of regular trading on the Exchange on each valuation date. Securities that are not traded on the valuation date are valued at the mean of the latest quoted bid and ask prices. Prices normally are taken from the principal market in which each security trades. Investments in other mutual funds are valued at their respective NAVs as of the close of the Exchange on the valuation date. These securities are generally categorized as Level 1 in the hierarchy.
Temporary cash investments acquired over 60 days to maturity are valued using the latest bid prices or using valuations based on a matrix system (which considers such factors as security prices, yields, maturities, and ratings), both as furnished by independent pricing services. Other temporary cash investments which mature in 60 days or less (“Short-Term Investments”) are valued at amortized cost. The amortized cost method involves valuing a security at its cost on the date of purchase and thereafter assuming a constant amortization to maturity of the difference between such cost and the value on maturity date. Amortized cost approximates the current fair value of a security. Securities valued at amortized cost are not valued using a quoted price in an active market. These securities are generally categorized as Level 2 in the hierarchy.
The valuation techniques and significant amounts of unobservable inputs used in the fair valuation measurement of the Fund’s Level 3 securities are outlined in the tables below. A significant increase or decrease in any of those inputs in isolation would result in a significantly higher or lower fair value measurement.
| | |
| 28 | | MainStay Marketfield Fund |
Marketfield
| | | | | | | | | | | | |
Asset Class | | Fair Value
at 6/30/13 | | | Valuation
Technique | | Unobservable
Inputs | | Range | |
Purchased Call Options (2 positions) | | $ | 38,706,828 | | | Market
Approach | | Offered
Quotes | | | $0.0077-0.0146 | |
| | | | | | | | | | | | |
Total | | $ | 38,706,828 | | | | | | | | | |
| | | | | | | | | | | | |
Generally, a security is considered illiquid if it cannot be sold or disposed of in the ordinary course of business at approximately the price at which it is valued within seven days. Its illiquidity might prevent the sale of such security at a time when the Manager or Subadvisor might wish to sell, and these securities could have the effect of decreasing the overall level of a Fund’s liquidity. Further, the lack of an established secondary market may make it more difficult to value illiquid securities, requiring the Fund to rely on judgments that may be somewhat subjective in determining value, which could vary from the amount that the Fund could realize upon disposition. Difficulty in selling illiquid securities may result in a loss or may be costly to the Fund. Under the supervision of the Board, the Manager or Subadvisor determines the liquidity of the Fund’s investments; in doing so, the Manager or Subadvisor may consider various factors, including (i) the frequency of trades and quotations, (ii) the number of dealers and prospective purchasers, (iii) dealer undertakings to make a market, and (iv) the nature of the security and the market in which it trades (e.g., the time needed to dispose of the security, the method of soliciting offers and the mechanics of transfer). Illiquid securities generally will be valued in good faith in such a manner as the Board deems appropriate to reflect their fair value.
(B) Income Taxes. The Fund’s policy is to comply with the requirements of the Internal Revenue Code of 1986, as amended (the “Code”), applicable to regulated investment companies (“RIC”) and to distribute all of the taxable income to the shareholders of the Fund within the allowable time limits. Therefore, no federal, state and local income tax provision is required.
Due to significant non-qualifying income earned by the Fund on its investments in futures on commodities and other financial instruments for the period from June 1, 2008 to December 31, 2009, the Predecessor Fund failed to qualify as a “RIC” and was therefore treated as a C corporation for that period. The results of operations of the Predecessor Fund for this period may have been different than they would have been had the Predecessor Fund complied with the requirements of Subchapter M of the code. In order to re-qualify as a RIC, the Predecessor Fund distributed, prior to the end of its first new RIC taxable year, all of its earnings and profits accumulated in those non-RIC taxable years. During 2010, the Predecessor Fund complied with the requirements of subchapter M of the Code necessary to qualify as a RIC in 2010, including distributing earnings and profits accumulated as of December 31, 2009. As such, the Predecessor Fund met the requirements to once again qualify as a RIC beginning with its December 31, 2010 tax year, and so qualified for each fiscal year thereafter for the Fund.
Management evaluates the Fund’s tax positions to determine if the tax positions taken meet the minimum recognition threshold in connection with accounting for uncertainties in income tax positions taken or expected to be taken for the purposes of measuring and recognizing tax
liabilities in the financial statements. Recognition of tax benefits of an uncertain tax position is required only when the position is “more likely than not” to be sustained assuming examination by taxing authorities. Management has analyzed the Fund’s tax positions taken on federal, state and local income tax returns for all open tax years (for up to three tax years), and has concluded that no provision for federal, state and local income tax is required in the Fund’s financial statements. The Fund’s federal, state and local income and federal excise tax returns for tax years for which the applicable statutes of limitations have not expired are subject to examination by the Internal Revenue Service and state and local departments of revenue.
(C) Foreign Taxes. Investment income received by the Fund from foreign sources may be subject to foreign income taxes. These foreign income taxes are generally withheld at the source, a portion of which may be recoverable. The Fund will accrue such taxes and recoveries as applicable, based upon its current interpretation of tax rules and regulations that exist in the markets in which it invests.
The Fund may be subject to taxation on realized capital gains, repatriation proceeds and other transaction-based taxes imposed by certain countries in which it invests. The Fund will accrue such taxes as applicable based upon its current interpretation of tax rules and regulations that exist in the market in which it invests. Capital gains taxes relating to positions still held are reflected as a liability on the Statement of Assets and Liabilities, as well as an adjustment to the Fund’s net unrealized appreciation (depreciation). Taxes related to capital gains realized during the period ended June 30, 2013, if any, are reflected as part of net realized gain (loss) in the Statement of Operations. Changes in tax liabilities related to capital gains taxes on unrealized investment gains, if any, are reflected as part of the change in net unrealized appreciation (depreciation) on investments in the Statement Operations. Transaction-based charges are generally assessed as a percentage of the transaction amount.
(D) Dividends and Distributions to Shareholders. Dividends and distributions are recorded on the ex-dividend date. The Fund intends to declare and pay dividends of net investment income and distributions of net realized capital and currency gains, if any, at least annually. Unless the shareholder elects otherwise, all dividends and distributions are reinvested in the same class of shares of the Fund, at NAV. Dividends and distributions to shareholders are determined in accordance with federal income tax regulations and may differ from GAAP.
(E) Security Transactions and Investment Income. The Fund records security transactions on the trade date. Realized gains and losses on security transactions are determined using the identified cost method. Dividend income is recognized on the ex-dividend date and interest income is accrued as earned using the effective interest rate method. Discounts and premiums on Short-Term Investments are accreted and amortized, respectively, on the straight-line method.
(F) Expenses. Expenses of the Trust are allocated to the individual Funds in proportion to the net assets of the respective Funds when the expenses are incurred, except where direct allocations of expenses can be made. Expenses (other than transfer agent expenses and fees incurred under the shareholder services plans and the distribution plans further discussed in Note 3(B)) are allocated to separate classes of
| | | | |
| mainstayinvestments.com | | | 29 | |
Notes to Financial Statements (Unaudited) (continued)
shares pro rata based upon their relative net assets on the date the expenses are incurred. The expenses borne by the Fund, including those of related parties to the Fund, are shown in the Statement of Operations.
(G) Use of Estimates. In preparing financial statements in conformity with GAAP, management makes estimates and assumptions that affect the reported amounts and disclosures in the financial statements. Actual results could differ from those estimates.
(H) Foreign Currency Transactions. The books and records of the Fund are kept in U.S. dollars. Prices of securities denominated in foreign currency amounts are translated into U.S. dollars at the mean between the buying and selling rates last quoted by any major U.S. bank at the following dates:
| (i) | market value of investment securities, other assets and liabilities—at the valuation date, and |
| (ii) | purchases and sales of investment securities, income and expenses—at the date of such transactions. |
The assets and liabilities that are denominated in foreign currency amounts are presented at the exchange rates and market values at the close of the period. The realized and unrealized changes in net assets arising from fluctuations in exchange rates and market prices of securities are not separately presented.
Net realized gain (loss) on foreign currency transactions represents net gains and losses on foreign currency forward contracts, net currency gains or losses realized as a result of differences between the amounts of securities sale proceeds or purchase cost, dividends, interest and withholding taxes as recorded on the Fund’s books, and the U.S. dollar equivalent amount actually received or paid. Net currency gains or losses from valuing such foreign currency denominated assets and liabilities, other than investments at valuation date exchange rates, are reflected in unrealized foreign exchange gains or losses.
(I) Securities Sold Short. The Fund engages in sales of securities it does not own (“short sales”) as part of its investment strategy. When the Fund enters into a short sale, it must segregate the cash proceeds from the security sold short or other securities as collateral for its obligation to deliver the security upon conclusion of the sale. During the period a short position is open, depending on the nature and type of security, short positions held are reflected as liabilities and are marked to market in accordance with the valuation methodologies previously detailed (See Note 2(A)). Liabilities for securities sold short are closed out by purchasing the applicable securities for delivery to the counterparty broker. A gain, limited to the price at which the Fund sold the security short, or a loss, unlimited as to dollar amount, will be recognized upon termination of a short sale if the market price on the date the short position is closed out is less or greater, respectively, than the proceeds originally received. Any such gain or loss may be offset, completely or in part, by the change in the value of the hedged investments. Dividends declared on short positions exisiting on the record date are recorded on the ex-dividend date. Interest on short positions held is accrued daily while dividends declared on short positions existing on the record date are recorded on the ex-dividend date. Both the interest and dividends paid on short sales are recorded as expenses on the Statement of Operations. Short sales involve risk of loss in excess of the related amounts reflected on the Statement of Assets and Liabilities.
At June 30, 2013 the Fund’s deposit for short sales at broker was with Barclays Capital Inc. and Citigroup Global Markets Inc. (the “Brokers”). The Subadvisor (as defined in Note 3(A)) determined, based on information available at the time, that the creditworthiness of the Brokers is satisfactory. However, there is no guarantee that the Adviser’s determination is correct or will remain accurate. The Fund’s deposit for short sales at broker was $3,177,578,812 and in excess of the Fund’s liability for securities sold short of $2,677,060,199. The Fund does not require the Brokers to maintain collateral in support of the receivable for proceeds on securities sold short.
(J) Options. The Fund may purchase and write call or put options on securities and indices and enter into related closing transactions. As a holder of a call option, the Fund has the right, but not the obligation, to purchase a security at the exercise price during the exercise period. As the writer of a call option, the Fund has the obligation to sell the security at the exercise price during the exercise period in the event the option is exercised. As a holder of a put option, the Fund has the right, but not the obligation, to sell a security at the exercise price during the exercise period. As the writer of a put option, the Fund has the obligation to buy the underlying security at the exercise price during the exercise period in the event the option is exercised.
The premium that the Fund pays when purchasing a call option or receives when writing a call option will reflect, among other things, the market price of the security, the relationship of the exercise price to the market price of the security, the relationship of the exercise price to the volatility of the security, the length of the option period and supply and demand factors. The premium is the market value of an option at the time of the trade.
When the Fund writes (sells) an option, an amount equal to the premium received by the Fund is included in the Statement of Assets and Liabilities as an equivalent liability. The amount of the liability is subsequently marked to-market to reflect the current value of the option written.
When the Fund purchases an option, the Fund pays a non-refundable premium to the seller (writer) of the option. The Fund includes the premium paid in the Statement of Assets and Liabilities as an equivalent asset. The amount of the asset is subsequently marked to market to reflect the current value of the option purchased.
Certain options may expose the Fund to counterparty credit risk. The Fund will not enter into these transactions unless it owns either 1) an offsetting position in securities or other options or 2) cash and liquid assets with a value marked-to market daily, sufficient to cover potential obligations.
During the period ended June 30, 2013, the Fund had the following transactions in written options:
| | | | | | | | |
| | | Number of Contracts | | | Premium | |
Options Outstanding at December 31, 2012 | | | (34,778 | ) | | $ | (10,206,790 | ) |
Options—Written | | | (119,000 | ) | | | (16,637,168 | ) |
Options—Canceled in closing transactions | | | 139,910 | | | | 24,707,997 | |
Options—Excercised | | | 13,868 | | | | 2,135,961 | |
Options Outstanding at June 30, 2013 | | | — | | | | — | |
| | |
| 30 | | MainStay Marketfield Fund |
(K) Futures Contracts. A futures contract is an agreement to purchase or sell a specified quantity of an underlying instrument at a specified future date and price, or to make or receive a cash payment based on the value of a financial instrument (e.g., foreign currency, interest rate, security, or securities index). The Fund is subject to equity price risk and/or interest rate risk in the normal course of investing in these transactions. During the period the futures contract is open, changes in the value of the contract are recognized as unrealized appreciation or depreciation by “marking-to-market” such contract on a daily basis to reflect the market value of the contract at the end of each day’s trading. The Fund agrees to receive from or pay to the broker an amount of cash equal to the daily fluctuation in the value of the contract. Such receipts or payments are known as “variation margin.” When the futures contract is closed, the Fund records a realized gain or loss equal to the difference between the proceeds from (or cost of) the closing transaction and the Fund’s basis in the contract.
The use of futures contracts involves, to varying degrees, elements of market risk in excess of the amount recognized in the Statement of Assets and Liabilities. The contract or notional amounts and variation margin reflect the extent of the Fund’s involvement in open futures positions. Risks arise from the possible imperfect correlation in movements in the price of futures contracts, interest rates and the underlying hedged assets, and the possible inability of counterparties to meet the terms of their contracts. However, the Fund’s activities in futures contracts have minimal counterparty risk as they are conducted through regulated exchanges that guarantee the futures against default by the counterparty. In the event of a bankruptcy or insolvency of a futures commission merchant that holds margin on behalf of the Fund, the Fund may not be entitled to the return of all of the margin owed to the Fund, potentially resulting in a loss. The Fund may invest in futures contracts to protect against possible adverse changes in the market value of securities held and to manage risks of its assets. The Fund’s investment in futures contracts and other derivatives may increase the volatility of the Fund’s NAV and may result in a loss to the Fund. As of June 30, 2013, the Fund did not hold any futures contracts.
(L) Securities Lending. In order to realize additional income, the Fund may engage in securities lending, subject to the limitations set forth in the 1940 Act and relevant guidance by the staff of the Securities and Exchange Commission. In the event the Fund does engage in securities lending, the Fund will lend through its custodian, State Street Bank and Trust Company (“State Street”). State Street will manage the Fund’s cash collateral in accordance with the lending agreement between the Fund and State Street, and indemnify the Fund’s portfolio against counterparty risk. The loans will be collateralized by cash or securities at least equal at all times to the market value of the securities loaned. Collateral will consist of U.S. Government securities, cash equivalents or irrevocable letters of credit. The Fund may bear the risk of delay in recovery of, or loss of rights in, the securities loaned should the borrower of the securities experience financial difficulty. The Fund may also record realized gain or loss on securities deemed sold due to a borrower’s inability to return securities on loan. The Fund will receive compensation for lending its securities in the form of fees or the retention of a portion of the interest on the investment of any cash received as collateral. The Fund also will continue to receive interest and dividends on the securities loaned and any gain or loss in the market price of the securities loaned that may occur during the term of the loan will be for the account of the Fund.
Although the Fund and New York Life Investments have temporarily suspended securities lending, the Fund and New York Life Investments reserve the right to reinstitute lending when deemed appropriate. The Fund did not have any portfolio securities on loan as of June 30, 2013.
(M) Redemption Fee. Prior to October 5, 2012, the Predecessor Fund imposed a 1.00% redemption fee on redemptions (including exchanges) of Predecessor Fund shares made within 60 days of their date of purchase. These fees were deducted from the redemption proceeds otherwise payable to the shareholder. The Predecessor Fund retained the fee charged as an increase in paid-in capital and such fees became part of the Fund’s daily NAV calculation. The redemption fees are included in the Statement of Changes in Net Assets’ shares redeemed amount and retained by the Predecessor Fund. The Predecessor Fund retained redemption fees of $136,086 for the year ended December 31, 2012. Upon adoption of the Predecessor Fund by the Fund the redemption fee was terminated.
(N) Indemnifications. Under the Trust’s organizational documents, its officers and trustees are indemnified against certain liabilities that may arise out of performance of their duties to the Trust. Additionally, in the normal course of business, the Fund enters into contracts with third-party service providers that contain a variety of representations and warranties and which may provide general indemnifications. The Fund’s maximum exposure under these arrangements is unknown, as this would involve future claims that may be made against the Fund that have not yet occurred. Based on experience, management is of the view that the risk of loss in connection with these potential indemnification obligations is remote. However, there can be no assurance that material liabilities related to such obligations will not arise in the future, which could adversely impact the Fund.
(O) Other. Investment transactions are recorded on the trade date. The Fund determines the gain or loss from investment transactions on the identified cost basis by comparing the original cost of the security lot sold with the net sale proceeds. Dividend income is recognized on the ex-dividend date and interest income is recognized on an accrual basis.
(P) Quantitative Disclosure of Derivative Holdings. The following tables show additional disclosures about the Fund’s derivative and hedging activities, including how such activities are accounted for and their effect on the Fund’s financial positions, performance and cash flows. These derivatives are not accounted for as hedging instruments.
The effect of derivative instruments on the Statement of Operations for the period ended June 30, 2013:
Asset Derivatives
| | | | | | | | | | | | | | |
| | | Statement of Assets and Liabilities
Location | | Foreign
Exchange
Contracts Risk | | | Equity
Contracts
Risk | | | Total | |
Purchased
Currency
Options | | Investments
in securities,
at value | | $ | 38,706,828 | | | $ | – | | | $ | 38,706,828 | |
Purchased
Options | | Investments
in securities,
at value | | | – | | | | 80,533,620 | | | | 80,533,620 | |
| | | | | | |
Total Fair
Value | | | | $ | 38,706,828 | | | $ | 80,533,620 | | | $ | 119,240,448 | |
| | | | | | |
| | | | |
| mainstayinvestments.com | | | 31 | |
Notes to Financial Statements (Unaudited) (continued)
Realized Gain (Loss)
| | | | | | | | | | |
| | | Statement of
Operations
Location | | Equity
Contracts
Risk | | | Total | |
Written Options | | Net realized gain (loss) on written option transactions | | $ | 9,994,815 | | | $ | 9,994,815 | |
| | | | | | |
Total Realized Gain (Loss) | | | | $ | 9,994,815 | | | $ | 9,994,815 | |
| | | | | | |
Change in Unrealized Appreciation (Depreciation)
| | | | | | | | | | | | | | |
| | | Statement of
Operations
Location | | Foreign
Exchange
Contracts
Risk | | | Equity
Contracts
Risk | | | Total | |
Purchased Currency Options | | Net change in unrealized appreciation (depreciation) on investments | | $ | 366,128 | | | | — | | | $ | 366,128 | |
Written Options | | Net change in unrealized appreciation (depreciation) on written options | | | — | | | | (948,324 | ) | | | (948,324 | ) |
| | | | | | | | | | |
Total Change in Unrealized Appreciation (Depreciation) | | | | $ | 366,128 | | | | (948,324 | ) | | $ | (582,196 | ) |
| | | | | | | | | | |
Number of Contracts, Notional Amounts or Shares/Units (1)
| | | | | | | | | | | | |
| | | Foreign
Exchange
Contracts
Risk | | | Equity
Contracts
Risk | | | Total | |
Purchased Currency Options | | | 2,802,000,000 | | | | — | | | | 2,802,000,000 | |
Purchased Options | | | — | | | | 456,141 | | | | 456,141 | |
Written Options | | | — | | | | (58,733 | ) | | | (58,733 | ) |
| | | | |
| (1) | Amount disclosed represents the average held during the period ended June 30, 2013. |
Note 3–Fees and Related Party Transactions
(A) Manager and Subadvisor. Effective after the close of business on October 5, 2012, New York Life Investments, a registered investment adviser and an indirect, wholly-owned subsidiary of New York Life Insurance Company (“New York Life”), serves as the Fund’s Manager, pursuant to an Amended and Restated Management Agreement (“Management Agreement”). The Manager provides offices, conducts clerical, recordkeeping and bookkeeping services, and keeps most of the financial and accounting records required to be maintained by the Fund. Except for the portion of salaries and expenses that are the responsibility of the Fund, the Manager pays the salaries and expenses of all personnel affiliated with the Fund and certain operational expenses of the Fund. The Fund reimburses New York Life Investments in an amount equal to a portion of the salary of the Chief Compliance Officer (“CCO”) of the Fund. Marketfield Asset Management, LLC (“MAM” or “Subadvisor”), serves as Subadvisor to the Fund and is responsible for the day-to-day portfolio management of the Fund. Pursuant to the terms of a Subadvisory Agreement (“Subadvisory Agreement”) between New York Life Investments and MAM, New York Life Investments pays for the services of the Subadvisor.
The Fund pays the Manager a monthly fee for services performed and facilities furnished at an annual rate of 1.40% of the Fund’s average daily net assets. Prior to the close of business on October 5, 2012, the
monthly fee rates paid to Marketfield were the same as the current monthly fees.
Effective after the close of business on October 5, 2012, New York Life Investments entered into a written expense limitation agreement under which it has agreed to reimburse expenses of Class I shares so that the total ordinary operating expenses for Class I shares do not exceed 1.56% of average daily net assets. This agreement will be in effect for a two-year period unless extended by New York Life Investments and approved by the Board in connection with its review of the Fund’s investment advisory agreement. Based on its review, the Board may agree to maintain, modify or terminate the agreement. Total ordinary operating expenses excludes taxes, interest, litigation, extraordinary expenses, brokerage and other transaction expenses relating to the purchase or sale of portfolio investments and the fees and expenses of any other funds in which the Fund invests.
Prior to the close of business on October 5, 2012, Marketfield had a written expense limitation agreement under which it had agreed to waive a portion of the Predecessor Fund’s management fee and/or reimburse expenses of the Predecessor Fund to ensure that Total Annual Fund operating expenses (exclusive of taxes, leverage, interest, brokerage commissions, expenses incurred in connection with any merger or reorganization, dividends on short positions, acquired fund fees and expenses and extraordinary or non-recurring expenses, such as litigation) did not exceed 1.75% of the Predecessor Fund’s average annual net assets. MAM was permitted to be reimbursed by the Predecessor Fund for management fee reductions and/or expense payments made in the prior three fiscal years, so long as the reimbursement did not cause the Predecessor Fund’s Total Annual Fund Operating Expenses to exceed the 1.75% expense limitation cap.
For the period ended June 30, 2013, New York Life Investments earned fees from the Fund in the amount of $51,079,756.
For the period from January 1, 2012 through October 5, 2012, MAM earned fees from the Fund in the amount of $18,408,611.
| | |
| 32 | | MainStay Marketfield Fund |
State Street, 1 Lincoln Street, Boston, Massachusetts 02111, provides sub-administration and sub-accounting services to the Fund pursuant to an agreement with New York Life Investments. These services include calculating the daily NAVs of the Fund, maintaining the general ledger and sub-ledger accounts for the calculation of the Fund’s respective NAVs, and assisting New York Life Investments in conducting various aspects of the Fund’s administrative operations. For providing these services to the Fund, State Street is compensated by New York Life Investments.
Prior to the close of business on October 5, 2012, these services were provided by U.S. Bancorp Fund Services, LLC and U.S. Bank N.A. The services provided by U.S. Bank, N.A., were a direct expense of the Fund and are included in the Statement of Operations as Administration and Accounting which totaled $848,640 for the period January 1, 2012 through October 5, 2012.
(B) Distribution, Service and Shareholder Service Fees. The Trust, on behalf of the Fund, has entered into a distribution agreement with NYLIFE Distributors LLC (the “Distributor”), an indirect, wholly-owned subsidiary of New York Life. The Fund has adopted distribution plans (the “Plans”) in accordance with the provisions of Rule 12b-1 under the 1940 Act.
Pursuant to the Investor Class, Class A and Class R2 Plans, the Distributor receives a monthly distribution fee from the Investor Class, Class A, Class C and Class R2 shares at an annual rate of 0.25% of the average daily net assets of the Investor Class, Class A, Class C and Class R2 shares for distribution and/or service activities as designated by the Distributor. Pursuant to the Class C Plan pay the Distributor a monthly distribution fee at an annual rate of 0.75% of the average daily net assets of the Class C shares, along with a service fee at an annual rate of 0.25% of the average daily net assets of the Class C shares, for a total 12b-1 fee of 1.00%. Class I, Class R6 and Class P shares are not subject to a distribution and/or service fee.
The Plans provide that the distribution and service fees are payable to the Distributor regardless of the amounts actually expended by the Distributor for distribution of the Fund’s shares and service activities.
In accordance with the Shareholder Services Plan for the Class R2 shares, the Manager has agreed to provide, through its affiliates or independent third parties, various shareholder and administrative support services to shareholders of the Class R2 shares. For its services, the Manager is entitled to a Shareholder Service Fee accrued daily and paid monthly at an annual rate of 0.10% of the average daily net assets of the Class R2 shares. This is in addition to any fees paid under a distribution plan, where applicable.
(C) Sales Charges. The Fund was advised by the Distributor that the amount of sales charges retained on sales of Investor Class and Class A shares were $20,713 and $744,044, respectively, for the period ended June 30, 2013. The Fund was also advised that the Distributor retained CDSCs on redemptions of Class A and Class C shares of $3,476 and $73,245, respectively, for the period ended June 30, 2013.
(D) Transfer, Dividend Disbursing and Shareholder Servicing Agent. NYLIM Service Company LLC, an affiliate of New York Life Investments, is the Fund’s transfer, dividend disbursing and shareholder servicing agent pursuant to an agreement between NYLIM Service Company LLC and the Trust. NYLIM Service Company LLC has entered into an agreement with Boston Financial Data Services, Inc. (“BFDS”) pursuant to which BFDS performs certain transfer agent services on
behalf of NYLIM Service Company LLC. Transfer agent expenses incurred by the Fund for the period ended June 30, 2013, were as follows:
| | | | |
Investor Class | | $ | 1,053 | |
Class A | | | 167,306 | |
Class C | | | 124,595 | |
Class I | | | 2,516,443 | |
Class R2 | | | 267 | |
Class R6 | | | — | |
Class P | | | 466 | |
Prior to the close of business on October 5, 2012, these services were provided by U.S. Bancorp Fund Services, LLC.
(E) Capital. As of June 30, 2013, New York Life and its affiliates beneficially held shares of the Fund with values and percentages of net assets as follows:
| | | | | | | | |
Class R2 | | $ | 27,076 | | | | 0.6 | % |
Class R6 | | | 24,927 | | | | 100.0 | |
Class P | | | 27,123 | | | | 0.1 | |
Note 4–Federal Income Tax
The tax character of distributions paid during the year ended December 31, 2012, shown in the Statements of Changes in Net Assets was as follows:
| | | | |
| | | 2012 | |
Distributions paid from: | | | | |
Long-term Capital Gain | | $ | 17,477,075 | |
Note 5–Custodian
State Street is the custodian of the cash and the securities of the Fund. Custodial fees are charged to the Fund based on the market value of securities in the Fund and the number of certain cash transactions incurred by the Fund.
Prior to the close of business on October 5, 2012, these services were provided by U.S. Bank, N.A.
Note 6–Line of Credit
The Fund and certain affiliated funds maintain a line of credit with a syndicate of banks in order to secure a source of funds for temporary purposes to meet unanticipated or excessive redemption requests.
Effective August 29, 2012, under a second amended and restated credit agreement (the “Credit Agreement”), the aggregate commitment amount is $200,000,000 with an optional maximum amount of $250,000,000. The commitment fee is an annual rate of 0.08% of the average commitment amount payable quarterly, regardless of usage, to Bank of New York Mellon, which serves as the agent to the syndicate. The commitment fee is allocated among the Fund and certain affiliated funds based upon net assets and other factors. Interest on any revolving credit loan is charged based upon the Federal Funds Advances rate or the one month London InterBank Offered Rate, whichever is higher. The Credit Agreement expires on August 28, 2013, although the Fund, certain affiliated funds and the syndicate of banks may renew the Credit Agreement for an additional year on the same or different terms. There were no borrowings made or outstanding with respect to the Fund on the Credit Agreement during the six-month period ended June 30, 2013.
| | | | |
| mainstayinvestments.com | | | 33 | |
Notes to Financial Statements (Unaudited) (continued)
Note 7–Purchases and Sales of Securities (in 000’s)
During the period ended June 30, 2013, purchases and sales of securities, other than short-term securities, were $5,681,055 and $1,310,718, respectively.
Note 8–Capital Share Transactions
| | | | | | | | |
Investor Class | | Shares | | | Amount | |
Six-month period ended June 30, 2013: | | | | | | | | |
Shares sold | | | 358,270 | | | $ | 5,990,343 | |
Shares redeemed | | | (9,836 | ) | | | (166,240 | ) |
| | | | |
Net increase (decrease) in shares outstanding before conversion | | | 348,434 | | | | 5,824,103 | |
Shares converted into Investor Class (See Note 1) | | | 4,288 | | | | 71,523 | |
Shares converted from Investor Class (See Note 1) | | | (80,051 | ) | | | (1,357,055 | ) |
| | | | |
Net increase (decrease) | | | 272,671 | | | $ | 4,538,571 | |
| | | | |
Year ended December 31, 2012 (a): | | | | | | | | |
Shares sold | | | 42,880 | | | $ | 669,105 | |
Shares issued to shareholders in reinvestment of distributions | | | 121 | | | | 1,882 | |
Shares redeemed | | | (3,937 | ) | | | (61,620 | ) |
| | | | |
Net increase (decrease) | | | 39,064 | | | $ | 609,367 | |
| | | | |
|
| |
Class A | | Shares | | | Amount | |
Six-month period ended June 30, 2013: | | | | | | | | |
Shares sold | | | 39,469,515 | | | $ | 659,989,246 | |
Shares redeemed | | | (2,410,585 | ) | | | (40,402,147 | ) |
| | | | |
Net increase (decrease) in shares outstanding before conversion | | | 37,058,930 | | | | 619,587,099 | |
Shares converted into Class A (See Note 1) | | | 80,051 | | | | 1,357,055 | |
Shares converted from Class A (See Note 1) | | | (4,288 | ) | | | (71,523 | ) |
| | | | |
Net increase (decrease) | | | 37,134,693 | | | $ | 620,872,631 | |
| | | | |
Year ended December 31, 2012 (a): | | | | | | | | |
Shares sold | | | 8,787,539 | | | $ | 137,164,370 | |
Shares issued to shareholders in reinvestment of distributions | | | 17,759 | | | | 275,442 | |
Shares redeemed | | | (151,322 | ) | | | (2,358,740 | ) |
| | | | |
Net increase (decrease) | | | 8,653,976 | | | $ | 135,081,072 | |
| | | | |
|
| |
Class C | | Shares | | | Amount | |
Six-month period ended June 30, 2013: | | | | | | | | |
Shares sold | | | 33,423,845 | | | $ | 556,533,606 | |
Shares redeemed | | | (665,474 | ) | | | (11,117,551 | ) |
| | | | |
Net increase (decrease) | | | 32,758,371 | | | $ | 545,416,055 | |
| | | | |
Year ended December 31, 2012 (a): | | | | | | | | |
Shares sold | | | 7,929,550 | | | $ | 123,516,328 | |
Shares issued to shareholders in reinvestment of distributions | | | 15,737 | | | | 243,922 | |
Shares redeemed | | | (74,864 | ) | | | (1,170,444 | ) |
| | | | |
Net increase (decrease) | | | 7,870,423 | | | $ | 122,589,806 | |
| | | | |
|
| |
| | | | | | | | |
Class I | | Shares | | | Amount | |
Six-month period ended June 30, 2013: | | | | | | | | |
Shares sold | | | 303,895,522 | | | $ | 5,082,616,491 | |
Shares redeemed | | | (35,362,163 | ) | | | (591,100,068 | ) |
| | | | |
Net increase (decrease) | | | 268,533,359 | | | $ | 4,491,516,423 | |
| | | | |
Year ended December 31, 2012: | | | | | | | | |
Shares sold | | | 220,353,583 | | | $ | 3,365,964,623 | |
Shares issued to shareholders in reinvestment of distributions | | | 818,854 | | | | 12,700,425 | |
Shares redeemed | | | (22,868,512 | ) | | | (351,229,292 | ) |
| | | | |
Net increase (decrease) | | | 198,303,925 | | | $ | 3,027,435,756 | |
| | | | |
|
| |
Class R2 | | Shares | | | Amount | |
Six-month period ended June 30, 2013: | | | | | | | | |
Shares sold | | | 241,353 | | | $ | 4,083,845 | |
Shares redeemed | | | (741 | ) | | | (12,485 | ) |
| | | | |
Net increase (decrease) | | | 240,612 | | | $ | 4,071,360 | |
| | | | |
Year ended December 31, 2012 (a): | | | | | | | | |
Shares sold | | | 5,688 | | | $ | 89,537 | |
Shares issued to shareholders in reinvestment of distributions | | | 7 | | | | 114 | |
Shares redeemed | | | — | (b) | | | (5 | ) |
| | | | |
Net increase (decrease) | | | 5,695 | | | $ | 89,646 | |
| | | | |
|
| |
Class R6 | | | | | | |
Period ended June 30, 2013 (c): | | | | | | | | |
Shares sold | | | 1,464 | | | $ | 25,000 | |
| | | | |
Net increase (decrease) | | | 1,464 | | | $ | 25,000 | |
| | | | |
|
| |
Class P | | | | | | |
Period ended June 30, 2013 (c): | | | | | | | | |
Shares sold | | | 1,294,902 | | | $ | 22,118,309 | |
Shares redeemed | | | (3,791 | ) | | | (64,953 | ) |
| | | | |
Net increase (decrease) | | | 1,291,111 | | | $ | 22,053,356 | |
| | | | |
| (a) | Class A shares, Class C shares, Class Investor shares and Class R2 shares were first offered on October 5, 2012. |
| (c) | Class R6 shares were first offered on June 17, 2013 and Class P shares was first offered on May 31, 2013. |
Note 9–Acquisition of Marketfield Fund
On October 5, 2012, MainStay Marketfield Fund acquired all of the net assets of Marketfield Fund, an open-end investment company, pursuant to a plan of reorganization approved by Marketfield Fund shareholders on September 24, 2012. The acquisition was accomplished by a tax-free exchange of 191,379,249 shares of MainStay Marketfield Fund, valued at $3,023,808,744, for 191,379,249 Class I shares of Marketfield Fund outstanding on October 5, 2012. The investment portfolio of Marketfield Fund, with a fair value of $1,934,359,404 and identified cost of $1,655,741,379 at October 5, 2012 was the principal asset acquired by MainStay Marketfield Fund. Immediately prior to the merger, MainStay Marketfield Fund did not have any assets or liabilities. On October 5, 2012, the MainStay Marketfield Fund also launched Classes A, C, R2 and Investor.
| | |
| 34 | | MainStay Marketfield Fund |
Assuming the acquisition had been completed on January 1, 2012, the beginning of the annual reporting period of MainStay Marketfield Fund, there would have been no difference in the results of operations since the acquiring fund was established to receive all assets and liabilities of the predecessor, Marketfield Fund, and the MainStay Marketfield Fund did not have any operations or investment activities prior to the acquisition.
Note 10–Subsequent Events
In connection with the preparation of the financial statements of the Fund as of and for the period ended June 30, 2013, events and transactions subsequent to June 30, 2013, through the date the financial statements were issued have been evaluated by the Fund’s management for possible adjustment and/or disclosure. No subsequent events requiring financial statement adjustment or disclosure have been identified.
| | | | |
| mainstayinvestments.com | | | 35 | |
Proxy Voting Policies and Procedures and Proxy Voting Record
A description of the policies and procedures that New York Life Investments uses to vote proxies related to the Fund’s securities is available without charge, upon request, (i) by visiting the Fund’s website at mainstayinvestments.com; and (ii) on the Securities and Exchange Commission’s (“SEC”) website at www.sec.gov.
The Fund is required to file with the SEC its proxy voting record for the 12-month period ending June 30 on Form N-PX. The Fund’s most recent Form N-PX is available free of charge upon request by calling 800-MAINSTAY (624-6782); visiting the Fund’s website at mainstayinvestments.com; or on the SEC’s website at www.sec.gov.
Shareholder Reports and Quarterly Portfolio Disclosure
The Fund is required to file its complete schedule of portfolio holdings with the SEC for its first and third fiscal quarters on Form N-Q. The Fund’s Form N-Q is available without charge, on the SEC’s website at www.sec.gov or by calling MainStay Investments at 800-MAINSTAY (624-6782). You also can obtain and review copies of Form N-Q by visiting the SEC’s Public Reference Room in Washington, DC (information on the operation of the Public Reference Room may be obtained by calling 1-800-SEC-0330).
| | |
| 36 | | MainStay Marketfield Fund |
This page intentionally left blank
This page intentionally left blank
MainStay Funds
MainStay offers a wide range of Funds for virtually any investment need. The full array of MainStay open-end offerings is listed here, with information about the manager, subadvisors, legal counsel and independent registered public accounting firms.
Equity
U.S. Equity Funds
MainStay Common Stock Fund
MainStay Cornerstone Growth Fund
MainStay Epoch U.S. All Cap Fund
MainStay Epoch U.S. Equity Yield Fund
MainStay ICAP Equity Fund
MainStay ICAP Select Equity Fund
MainStay Large Cap Growth Fund1
MainStay MAP Fund
MainStay S&P 500 Index Fund
MainStay U.S. Equity Opportunities Fund
MainStay U.S. Small Cap Fund
International/Global Equity Funds
MainStay Epoch Global Choice Fund
MainStay Epoch Global Equity Yield Fund
MainStay Epoch International Small Cap Fund
MainStay ICAP Global Fund
MainStay ICAP International Fund
MainStay International Equity Fund
MainStay International Opportunities Fund
Income
Taxable Bond Funds
MainStay Floating Rate Fund
MainStay Global High Income Fund
MainStay Government Fund
MainStay High Yield Corporate Bond Fund
MainStay High Yield Opportunities Fund
MainStay Indexed Bond Fund
MainStay Intermediate Term Bond Fund
MainStay Short Duration High Yield Fund
MainStay Short Term Bond Fund
MainStay Unconstrained Bond Fund
Municipal Bond Funds
MainStay California Tax Free Opportunities Fund2
MainStay High Yield Municipal Bond Fund
MainStay New York Tax Free Opportunities Fund3
MainStay Tax Free Bond Fund
Money Market Fund
MainStay Money Market Fund
Mixed Asset
MainStay Balanced Fund
MainStay Convertible Fund
MainStay Income Builder Fund
MainStay Marketfield Fund
Asset Allocation/Target Date
MainStay Conservative Allocation Fund
MainStay Growth Allocation Fund
MainStay Moderate Allocation Fund
MainStay Moderate Growth Allocation Fund
MainStay Retirement 2010 Fund
MainStay Retirement 2020 Fund
MainStay Retirement 2030 Fund
MainStay Retirement 2040 Fund
MainStay Retirement 2050 Fund
Manager
New York Life Investment Management LLC
New York, New York
Subadvisors
Cornerstone Capital Management Holdings LLC4
New York, New York
Cornerstone Capital Management LLC4
Bloomington, Minnesota
Epoch Investment Partners, Inc.
New York, New York
Institutional Capital LLC4
Chicago, Illinois
MacKay Shields LLC4
New York, New York
Marketfield Asset Management LLC
New York, New York
Markston International LLC
White Plains, New York
Winslow Capital Management, LLC
Minneapolis, Minnesota
Legal Counsel
Dechert LLP
Independent Registered Public Accounting Firms
KPMG LLP
PricewaterhouseCoopers LLP5
1. Effective January 13, 2012, the Fund was closed to new investors with certain exceptions.
2. This Fund is only registered for sale in AZ, CA, NV, OR, UT, and WA.
3. This Fund is only registered for sale in CT, DE, FL, MA, NJ, NY, and VT.
4. An affiliate of New York Life Investment Management LLC.
5. For MainStay Marketfield Fund only.
Not part of the Semiannual Report
For more information
800-MAINSTAY (624-6782)
mainstayinvestments.com
The MainStay Funds® are managed by New York Life Investment Management LLC and distributed through NYLIFE Distributors LLC, 169 Lackawanna Avenue, Parsippany, NJ 07054, a wholly owned subsidiary of New York Life Insurance Company. NYLIFE Distributors is a Member FINRA/SIPC.
MainStay Investments® is a registered service mark and name under which New York Life Investment Management LLC does business. MainStay Investments, an indirect subsidiary of New York Life Insurance Company, New York, NY 10010, provides investment advisory products and services.
This report may be distributed only when preceded or accompanied by a current Fund prospectus.
© 2013 by NYLIFE Distributors LLC. All rights reserved.
| | | | | | | | |
| Not FDIC/NCUA Insured | | Not a Deposit | | May Lose Value | | No Bank Guarantee | | Not Insured by Any Government Agency |
| | |
| NYLIM-30683 MS213-13 | | MSMK10-08/13 NL040 |
Not applicable.
| Item 3. | Audit Committee Financial Expert. |
Not applicable.
| Item 4. | Principal Accountant Fees and Services. |
Not applicable.
| Item 5. | Audit Committee of Listed Registrants |
Not applicable.
| Item 6. | Schedule of Investments |
The Schedule of Investments is included as part of Item 1 of this report.
| Item 7. | Disclosure of Proxy Voting Policies and Procedures for Closed-End Management Investment Companies. |
Not applicable.
| Item 8. | Portfolio Managers of Closed-End Management Investment Companies. |
Not applicable.
| Item 9. | Purchases of Equity Securities by Closed-End Management Investment Company and Affiliated Purchasers. |
Not Applicable.
| Item 10. | Submission of Matters to a Vote of Security Holders. |
Since the Registrant’s last response to this Item, there have been no material changes to the procedures by which shareholders may recommend nominees to the Registrant’s Board of Trustees.
| Item 11. | Controls and Procedures. |
| (a) | Based on an evaluation of the Registrant’s Disclosure Controls and Procedures (as defined in Rule 30a-3(c) under the Investment Company Act of 1940) (the “Disclosure Controls”), as of a date within 90 days prior to the filing date (the “Filing Date”) of this Form N-CSR (the “Report”), the Registrant’s principal executive officer and principal financial officer have concluded that the Disclosure Controls are reasonably designed to ensure that information required to be disclosed by the Registrant in the Report is recorded, processed, summarized and reported by the Filing Date, including ensuring that information required to be disclosed in the Report is accumulated and communicated to the Registrant’s management, including the Registrant’s principal executive officer and principal financial officer, as appropriate to allow timely decisions regarding required disclosure. |
| (b) | There were no changes in the Registrant’s internal control over financial reporting (as defined in Rule 30a-3(d)) under the Investment Company Act of 1940 that occurred during the second fiscal quarter of the period covered by this report that has materially affected, or is reasonably likely to materially affect, the Registrant’s internal control over financial reporting. |
| (a) | Certifications of principal executive officer and principal financial officer as required by Rule 30a-2 under the Investment Company Act of 1940. |
| (b) | Certifications of principal executive officer and principal financial officer as required by Section 906 of the Sarbanes-Oxley Act of 2002. |
SIGNATURES
Pursuant to the requirements of the Securities Exchange Act of 1934 and the Investment Company Act of 1940, the Registrant has duly caused this Report to be signed on its behalf by the undersigned, thereunto duly authorized.
| | |
| MAINSTAY FUNDS TRUST |
| |
| By: | | /s/ Stephen P. Fisher |
| | Stephen P. Fisher President and Principal Executive Officer |
| |
Date: | | September 6, 2013 |
Pursuant to the requirements of the Securities Exchange Act of 1934 and the Investment Company Act of 1940, this Report has been signed below by the following persons on behalf of the Registrant and in the capacities and on the dates indicated.
| | |
| By: | | /s/ Stephen P. Fisher |
| | Stephen P. Fisher President and Principal Executive Officer |
| |
Date: | | September 6, 2013 |
| |
| By: | | /s/ Jack R. Benintende |
| | Jack R. Benintende Treasurer and Principal Financial and Accounting Officer |
| |
Date: | | September 6, 2013 |
EXHIBIT INDEX
| (a) | Certifications of principal executive officer and principal financial officer as required by Rule 30a-2 under the Investment Company Act of 1940. |
| (b) | Certification of principal executive officer and principal financial officer as required by Section 906 of the Sarbanes-Oxley Act of 2002. |