| | | | | | | | |
| | | | | | | | OMB APPROVAL |
| | | | | | | | OMB Number: 3235-0570 Expires: January 31, 2017 Estimated average burden hours per response. . . 20.6 |
UNITED STATES
SECURITIES AND EXCHANGE COMMISSION
Washington, D.C. 20549
Form N-CSR
CERTIFIED SHAREHOLDER REPORT OF REGISTERED MANAGEMENT
INVESTMENT COMPANIES
Investment Company Act File Number 811-22321
MAINSTAY FUNDS TRUST
(Exact name of Registrant as specified in charter)
51 Madison Avenue, New York, NY 10010
(Address of principal executive offices) (Zip code)
J. Kevin Gao, Esq.
169 Lackawanna Avenue
Parsippany, New Jersey 07054
(Name and address of agent for service)
Registrant’s telephone number, including area code: (212) 576-7000
Date of fiscal year end: December 31 (MainStay Marketfield Fund)
Date of reporting period: June 30, 2014
FORM N-CSR
The information presented in this Form N-CSR relates solely to the
MainStay Marketfield Fund, a series of the Registrant.
Item 1. Reports to Stockholders.
MainStay Marketfield Fund
Message from the President, Marketfield Asset Management LLC Six-Month Commentary and Semiannual Report
Unaudited | June 30, 2014


This page intentionally left blank
Message from the President
Once again, it is our pleasure to present the semiannual report for MainStay Marketfield Fund and the Marketfield Asset Management LLC Six-Month Commentary by Michael Aronstein.
Mr. Aronstein is President and Chief Investment Officer of Marketfield Asset Management LLC and the portfolio manager of MainStay Marketfield Fund.
The commentary and the semiannual report include detailed information about the market events, macroeconomic trends and investment decisions that shaped MainStay Marketfield Fund during the six-months ended June 30, 2014.
We hope that you’ll find the following material useful in your ongoing investment planning and review process. While short-term results may vary, we hope that you’ll view them in light of your long-term goals and objectives.
We appreciate your choice of MainStay Marketfield Fund, and we look forward to strengthening our relationship over time.
Sincerely,

Stephen P. Fisher
President
The opinions expressed are as of the date of this report and are subject to change. There is no guarantee that any forecast made will come to pass. This material does not constitute investment advice and is not intended as an endorsement of any specific investment. Past performance is no guarantee of future results.
Not part of the Semiannual Report
Marketfield Asset Management LLC Six-Month Commentary
Portfolio Discussion
June represented a better month for performance than the difficult March through May period as a number of our investment themes emerged from the penalty box. This was clearly the case with Japan, where the Nikkei Index gained 3.62% as investors realized that they had overreacted to the increase of the domestic sales tax earlier this year. We remain of the view that Japan’s domestic economy has commenced a period of sustained recovery and have rebuilt our exposure to this market.
We cut back further our exposure to Europe, where we believe the easy money has already been made. Although we do not see much risk of general deterioration, the investor view of Europe has swung 180 degrees over the last 30 months while local conditions have done no more than match our muted expectation that the world (or at least continent) was not ending. We also have some concerns that with domestic liquidity remaining quite tight (at least at the level of the central bank), Europe is overly reliant on a combination of foreign liquidity (QE3 has perhaps been more important here than people realize) and a continued wide current account surplus. The former is always subject to abrupt change while the latter could be expected to have reached a cyclical peak as domestic economic recovery starts to reinvigorate European imports of goods and services.
On the other hand, we feel much better about the prospects for emerging markets, particularly for those with exposure to China, where we believe overall economic activity has stabilized. June saw us add to individual positions, a process which we have continued in July.
Our general theme on reflation (which we view as a precursor to inflation) has also started to perform quite well with a number of commodity-related equities posting gains in June even as commentary fretted about the Chinese economy. We consider this area to be a core holding of our portfolio for reasons which are outlined in our discussion on monetary policy, and it is important that strong equity market performance has been matched in the most part by better-than-expected corporate earnings.
Our exposure to U.S. housing and construction performed well in June, although these gains were subsequently wiped out in July, following poor Census Bureau estimates of New Home sales. For reasons we have discussed at length in our macro research, we continue to be patient with this area, although we can understand why some of our clients may feel less charitable to a sector which has supplied volatility without positive returns for over a year.
On the short side of our portfolio, we have struggled to generate a successful strategy since correctly collapsing our long standing short positions on emerging markets at the start of the year. Our short exposure to utilities proved painful at the end of June when investor allocations were strongly in favor of this group, although some of these losses were recouped in July.
Being short retailers, on the other hand, had little impact on performance in June, and this group has been a notable laggard within the U.S. equity market so far this year. All of these shorts are connected by a belief that cost pressures may be starting to erode corporate margins in certain sectors and can be treated as the intellectual twin of our reflation theme. Thus far, the long side of this story has worked substantially better, which is a reflection of the fact that we remain in the midst of a powerful bull market.
Macroeconomic Commentary
This commentary involves a departure from our normal course. In light of the recent congressional testimony from Janet Yellen and to a somewhat lesser extent, commentary from Mark Carney, Governor of the Bank of England, we consider it important to look closely at the perspectives underlying what is clearly the most radical policy experiment in the annals of central banking.
Our inclination over the years has been to steer clear of specific policy discussions, believing that there is little in the way of insight that we can offer. We have been content to explain the consequences of official actions, be they monetary, regulatory, or administrative.
Current financial conditions are not only unique, but also decisive in driving business and capital markets’ performance. In 2009 and again in Europe in 2011 and Japan in 2012, policy changes towards much greater accommodation were necessary to address inadequacies in bank solvency and systemic liquidity.
In each case, the central bank in question acted after unwarranted delays, having allowed monetary inadequacies to provoke crises and, in the case of Japan, prolonged depression.
We believe that the initial policy changes in response to emergency conditions were entirely necessary and long overdue. Now that we are nearly six years past the panic of ‘08, both the propriety and consequences of central banks’ policy inertia are the major questions for capital markets in the months and years ahead.
Thus far, the main, clear consequences of the monetary abundance that has persisted since 2009 have been various forms of asset price inflation. These episodes, pandemic in nature, underlie the populist concept of income inequality. This is a new slogan attached to a centuries-old economic concept—misallocation of capital—which has long been recognized as a harmful effect of price rises caused by monetary conditions rather than organic changes in supply and demand.
Modern academic economics does not treat hyperbolic asset price appreciation supported by expanding credit in the banking system or capital markets as inflation. A threefold increase in house prices, driven by a record expansion of mortgage credit between 2001 and 2006 was not considered inflationary, although all of the theoretical consequences of inflation and its subsequent reversal were clearly in evidence. The political responses to the misallocation of capital and capital gains were
Not part of the Semiannual Report
very much muted, as the beneficiaries of property inflation were numerous. The process was seen to have a certain egalitarian aspect and hence did not attract the attention of academics, politicians and populist charlatans of all stripes. This contrasts sharply with the current cycle, where the migration of asset inflation to capital assets has enriched those who were already fortunate enough to own or be involved in the movement of these. A panoply of economic pseudo-science has arisen in response.
Because we are concerned with the investment consequences of policy rather than partaking in policy debates, we will leave the question of economic nomenclature alone and concentrate on the probable outcomes of current policy. The difficulty consists in the fact that there are no direct precedents to consider. Current central bank policy is well into uncharted territory. The Bernanke/Yellen voyage makes Lewis and Clark look like backyard campers.
It is clear in listening to the public statements of various central bank heads that political imperatives have taken over from orthodox monetary considerations as the driving force behind policy. Traditional measures of employment will no longer suffice in providing policy guidance. The employment situation, including job quality, real wages, length of workweek, and a host of additional, secondary considerations will now be used to justify and retain the emergency monetary policy long after all traditional measures would argue for change. Central bankers have clearly accepted roles as social engineers in response to populist reaction to their own policies.
One unique feature of the current monetary expansion is its locus beyond banking systems. For most of this cycle, banks in the U.S., Europe, and Japan have been criticized for (among many other things) failing to lend. It is only recently that the overall figures have begun to pick up.
Instead of banks, the agency of credit expansion this time around has been the bond markets. By absorbing a large proportion of fixed-income assets, central banks have accommodated a raft of issuance from all corners. Corporate and sovereign issuers have responded in record fashion, resulting in a buildup of spending power in portions of the global economy over which the Federal Reserve has almost no control.
In prior inflation cycles, the underlying credit structure could be restrained via the Federal Reserve Bank’s direct influence on the banking system of the costs of credit therein. As most bank lending is done at variable rates, tightening through the mechanism of higher-cost federal funds would quickly filter through into the cost and availability of loans, whereas in this cycle, bond issuance has created liquid purchasing power in forms that are largely outside the influence of the Federal Reserve and other central banks.
Since 2003, reserve assets among global sovereigns have risen from slightly less than $3 trillion to, as of July 11, 2014, just over $12 trillion. This has occurred over a period in which global Gross Domestic Product (GDP) has fallen just shy of doubling.
Corporate cash holdings have exhibited similar growth trends, as have assets held in public and private pension funds, endowments, and foundations.
In each of these repositories of liquid and liquefiable assets, a rise in the Federal Funds Rate to one or two percent will have little or no effect on the existing stock of assets. Deposits in the banking system, which have also grown far faster than GDP, will likewise be untouched by a tightening in monetary policy. If anything, their growth rate may increase.
The accumulated mountain of liquid purchasing power and the ability to rapidly liquefy capital assets through fixed-income issuance and wholesale mortgage markets make it unlikely that central bank policy will be able to meaningfully restrain price and wage accelerations in real economies. The liquidity created in this cycle is much more permanent in nature and does not depend on continued bank lending for its perpetuation.
This strikes us as entirely unique.
During every other modern credit inflation, the core of the process was excessive bank lending and deteriorating standards as the cycle progressed. This time, banks are virtually uninvolved, except as unusually robust buyers of bonds in response to nearly impossible regulatory strictures.
If the cycle proceeds as we suspect, corporate demand for capital goods, labor, and capacity, whether through building or buying, will be little constrained by tighter monetary policy. The corporate sector’s unfettered access to bond markets and the fruits of their borrowings during the past four years make it unlikely that they will have to reduce demand in response to anything but the most draconian Federal Reserve policies.
In similar fashion, record (and growing) reserves in the coffers of the world’s sovereigns make it unlikely that any will be forced by lack of means to restrain their expenditures for globally-traded goods in the face of slowing private activity. This has been our point about China, where, despite serious structural issues, their store of liquidity is so vast that the likelihood of a deflationary cataclysm is extremely slight. In fact, their response to GDP sluggishness is likely to be increased spending and credit support in yet-to-be inflated sectors of their economy.
Not part of the Semiannual Report
In practical terms, our sense is that the consequences of what has become reckless monetary policy will become increasingly clear during the remaining part of this year. Our repositioning of our portfolio in recent months has been made with this shift in mind.
July 28, 2014
Michael C. Aronstein
President, CIO & Portfolio Manager
The information provided herein represents the opinion of the Portfolio Manager and is not intended to be a forecast of future events, a guarantee of future results, nor investment advice. Past performance is no guarantee of future results.
Not part of the Semiannual Report
Table of Contents
Investors should refer to the Fund’s Summary Prospectus and/or Prospectus and consider the Fund’s investment objectives, strategies, risks, charges and expenses carefully before investing. The Summary Prospectus and/or Prospectus contain this and other information about the Fund. You may obtain copies of the Fund’s Summary Prospectus, Prospectus and Statement of Additional Information free of charge, upon request, by calling toll-free 800-MAINSTAY (624-6782), by writing to NYLIFE Distributors LLC, Attn: MainStay Marketing Department, 169 Lackawanna Avenue, Parsippany, New Jersey 07054 or by sending an e-mail to MainStayShareholderServices@nylim.com. These documents are also available via the MainStay Funds’ website at mainstayinvestments.com/documents. Please read the Summary Prospectus and/or Prospectus carefully before investing.
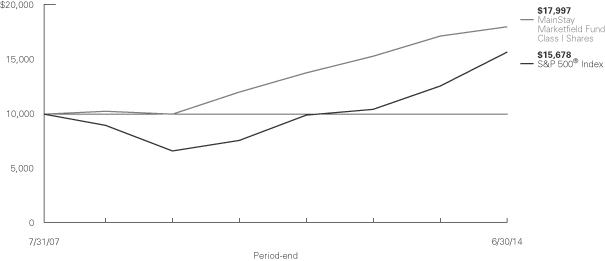
Investment and Performance Comparison1 (Unaudited)
Performance data quoted represents past performance. Past performance is no guarantee of future results. Because of market volatility, current performance may be lower or higher than the figures shown. Investment return and principal value will fluctuate, and as a result, when shares are redeemed, they may be worth more or less than their original cost. The graph below depicts the historical performance of Class I shares of the Fund. Performance will vary from class to class based on differences in class-specific expenses and sales charges. For performance information current to the most recent month-end, please call 800-MAINSTAY (624-6782) or visit mainstayinvestments.com.
Average Annual Total Returns for the Period Ended June 30, 2014
| | | | | | | | | | | | | | | | | | | | | | | | |
| Class | | Sales Charge | | | | Six Months | | | One Year | | | Five Years | | | Since
Inception
(7/31/07) | | | Gross
Expense
Ratio2 | |
| Class A Shares3 | | Maximum 5.5% Initial Sales Charge | | With sales charges Excluding sales charges | |
| –8.93
–3.63 | %
| |
| –1.10
4.66 | %
| |
| 10.95
12.21 | %
| |
| 7.71
8.60 | %
| |
| 2.93
2.93 | %
|
| Investor Class Shares3 | | Maximum 5.5% Initial Sales Charge | | With sales charges Excluding sales charges | |
| –8.93
–3.63 |
| |
| –1.16
4.60 |
| |
| 10.95
12.21 |
| |
| 7.71
8.60 |
| |
| 2.95
2.95 |
|
| Class C Shares3 | | Maximum 1% CDSC if Redeemed Within One Year of Purchase | | With sales charges Excluding sales charges | |
| –4.90
–3.93 |
| |
| 2.91
3.91 |
| |
| 11.39
11.39 |
| |
| 7.79
7.79 |
| |
| 3.68
3.68 |
|
| Class I Shares4 | | No Sales Charge | | | | | –3.51 | | | | 4.94 | | | | 12.49 | | | | 8.86 | | | | 2.66 | |
| Class R2 Shares3 | | No Sales Charge | | | | | –3.69 | | | | 4.54 | | | | 12.09 | | | | 8.48 | | | | 3.05 | |
| Class R6 Shares5 | | No Sales Charge | | | | | –3.40 | | | | 5.06 | | | | 12.51 | | | | 8.88 | | | | 2.72 | |
| Class P Shares6 | | No Sales Charge | | | | | –3.46 | | | | 4.94 | | | | 12.49 | | | | 8.86 | | | | 2.66 | |
| 1. | The performance table and graph do not reflect the deduction of taxes that a shareholder would pay on distributions or Fund-share redemptions. Total returns reflect maximum applicable sales charges as indicated in the table above, changes in share price, and reinvestment of dividends and capital gain distributions. The graph assumes the initial investment amount shown above and reflects the deduction of all sales charges that would have applied for the period of investment. Performance figures reflect certain fee waivers and/or expense limitations, without which total returns may have been lower. For more information on share classes and current fee waivers and/or expense limitations, please refer to the notes to the financial statements. |
| 2. | The gross expense ratios presented reflect the Fund’s “Total Annual Fund Operating Expenses” from the most recent Prospectus and may differ from other expense ratios disclosed in this report. |
| 3. | Performance figures for Class A, Investor Class, Class C, and Class R2 shares, first offered on October 5, 2012 include the historical performance of Class I shares through October 4, 2012 and are adjusted to reflect differences in fees and expenses. Performance data for the classes varies |
| | based on differences in their fee and expense structures. Marketfield Fund commenced operations on July 31, 2007. Unadjusted, the performance for the newer classes would likely have been different. |
| 4. | Performance figures for Class I shares reflect the historical performance of the then-existing shares of Marketfield Fund (the predecessor to the Fund, which was subject to a different fee structure, and for which a predecessor entity to Marketfield Asset Management LLC served as investment advisor) for periods prior to October 5, 2012. Marketfield Fund commenced operations on July 31, 2007. |
| 5. | Performance figures for Class R6 shares, first offered on June 17, 2013, include the historical performance of Class I shares through June 16, 2013. Performance for Class R6 would likely have been different because of differences in certain expenses attributable to each share class. |
| 6. | Performance figures for Class P shares, first offered on May 31, 2013, include the historical performance of Class I shares through May 30, 2013. Performance for Class P shares would likely have been different because of differences in certain expenses attributable to each share class. |
The footnotes on the next page are an integral part of the table and graph and should be carefully read in conjunction with them.
| | |
| 8 | | MainStay Marketfield Fund |
| | | | | | | | | | | | | | |
| Benchmark Performance | �� | Six
Months | | One
Year | | | Five
Years | | | Since
Inception | |
S&P 500® Index7 | | 7.14% | | | 24.61 | % | | | 18.83 | % | | | 6.72 | % |
Average Lipper Alternative Long/Short Equity Fund8 | | 3.06 | | | 12.14 | | | | 8.35 | | | | 2.94 | |
| 7. | S&P 500® Index is a trademark of The McGraw-Hill Companies, Inc. The S&P 500® Index is widely regarded as the standard index for measuring large-cap U.S. stock market performance. The S&P 500® Index is the Fund’s broad-based securities market index for comparison purposes. Results assume reinvestment of all dividends and capital gains. An investment cannot be made directly in an Index. |
| 8. | The average Lipper alternative long/short equity fund is representative of funds that employ portfolio strategies combining long holdings of equities |
| | with short sales of equity, equity options, or equity index options. The funds may be either net long or net short, depending on the portfolio manager’s view of the market. This benchmark is a product of Lipper Inc. Lipper Inc. is an independent monitor of fund performance. Results are based on average total returns of similar funds with all dividend and capital gain distributions reinvested. |
The footnotes on the preceding page are an integral part of the table and graph and should be carefully read in conjunction with them.
Cost in Dollars of a $1,000 Investment in MainStay Marketfield Fund (Unaudited)
The example below is intended to describe the fees and expenses borne by shareholders during the period from January 1, 2014, to June 30, 2014, and the impact of those costs on your investment.
Example
As a shareholder of the Fund, you incur two types of costs: (1) transaction costs, including exchange fees and sales charges (loads) on purchases (as applicable), and (2) ongoing costs, including management fees, distribution and/or service (12b-1) fees, and other Fund expenses (as applicable). This example is intended to help you understand your ongoing costs (in dollars) of investing in the Fund and to compare these costs with the ongoing costs of investing in other Funds. The example is based on an investment of $1,000 made at the beginning of the six-month period and held for the entire period from January 1, 2014, to June 30, 2014.
This example illustrates your Fund’s ongoing costs in two ways:
Actual Expenses
The second and third data columns in the table below provide information about actual account values and actual expenses. You may use the information in these columns, together with the amount you invested, to estimate the expenses that you paid during the six months ended June 30, 2014. Simply divide your account value by $1,000 (for example, an $8,600 account value divided by $1,000 = 8.6), then
multiply the result by the number under the heading entitled “Expenses Paid During Period” to estimate the expenses you paid on your account during this period.
Hypothetical Example for Comparison Purposes
The fourth and fifth data columns in the table below provide information about hypothetical account values and hypothetical expenses based on the Fund’s actual expense ratio and an assumed rate of return of 5% per year before expenses, which is not the Fund’s actual return. The hypothetical account values and expenses may not be used to estimate the actual ending account balances or expenses you paid for the six-month period shown. You may use this information to compare the ongoing costs of investing in the Fund with the ongoing costs of investing in other Funds. To do so, compare this 5% hypothetical example with the 5% hypothetical examples that appear in the shareholder reports of the other Funds.
Please note that the expenses shown in the table are meant to highlight your ongoing costs only and do not reflect any transactional costs, such as exchange fees or sales charges (loads). Therefore, the fourth and fifth data columns of the table are useful in comparing ongoing costs only and will not help you determine the relative total costs of owning different funds. In addition, if these transactional costs were included, your costs would have been higher.
| | | | | | | | | | | | | | | | | | | | |
| | | | | | | | | | | | | | | | |
| Share Class | | Beginning
Account
Value
1/1/14 | | | Ending Account
Value (Based
on Actual
Returns and
Expenses)
6/30/14 | | | Expenses
Paid
During
Period1 | | | Ending Account
Value (Based
on Hypothetical
5% Annualized
Return and
Actual Expenses)
6/30/14 | | | Expenses
Paid
During
Period1 | |
| | | | | |
| Class A Shares | | $ | 1,000.00 | | | $ | 963.70 | | | $ | 14.27 | | | $ | 1,010.30 | | | $ | 14.60 | |
| | | | | |
| Investor Class Shares | | $ | 1,000.00 | | | $ | 963.70 | | | $ | 14.46 | | | $ | 1,010.10 | | | $ | 14.80 | |
| | | | | |
| Class C Shares | | $ | 1,000.00 | | | $ | 960.70 | | | $ | 17.94 | | | $ | 1,006.50 | | | $ | 18.36 | |
| | | | | |
| Class I Shares | | $ | 1,000.00 | | | $ | 964.90 | | | $ | 13.01 | | | $ | 1,011.60 | | | $ | 13.32 | |
| | | | | |
| Class R2 Shares | | $ | 1,000.00 | | | $ | 963.10 | | | $ | 14.94 | | | $ | 1,009.60 | | | $ | 15.30 | |
| | | | | |
| Class R6 Shares | | $ | 1,000.00 | | | $ | 966.00 | | | $ | 13.45 | | | $ | 1,011.10 | | | $ | 13.76 | |
| | | | | |
| Class P Shares | | $ | 1,000.00 | | | $ | 965.40 | | | $ | 13.21 | | | $ | 1,011.40 | | | $ | 13.52 | |
| 1. | Expenses are equal to the Fund’s annualized expense ratio of (2.93% for Class A, 2.97% for Investor Class, 3.69% for Class C, 2.67% for Class I, 3.07% for Class R2, 2.76% for Class R6 and 2.71% for Class P) multiplied by the average account value over the period, divided by 365 and multiplied by 181 (to reflect the six-month period). The table above represents the actual expenses incurred during the six-month period. |
| | |
| 10 | | MainStay Marketfield Fund |
Country Composition as of June 30, 2014 (Unaudited)
| | | | |
| United States | | | 56.8 | % |
| Japan | | | 7.8 | |
| Ireland | | | 5.0 | |
| Germany | �� | | 3.3 | |
| United Kingdom | | | 3.2 | |
| Spain | | | 3.0 | |
| Canada | | | 2.7 | |
| Brazil | | | 2.2 | |
| Italy | | | 2.1 | |
| | | | |
| Australia | | | 1.3 | % |
| Taiwan | | | 1.1 | |
| Mexico | | | 1.0 | |
| Switzerland | | | 0.9 | |
| Denmark | | | 0.7 | |
| Other Assets, Less Liabilities | | | 38.4 | |
| Investments Sold Short | | | –29.5 | |
| | | | |
| | | 100.0 | % |
| | | | |
Industry Composition as of June 30, 2014 (Unaudited)
| | | | |
| Metals & Mining | | | 12.2 | % |
| Banks | | | 11.4 | |
| Exchange-Traded Funds | | | 10.4 | |
| Household Durables | | | 6.9 | |
| Real Estate Management & Development | | | 5.0 | |
| Construction Materials | | | 4.6 | |
| Machinery | | | 3.9 | |
| Oil, Gas & Consumable Fuels | | | 3.8 | |
| Chemicals | | | 3.2 | |
| Energy Equipment & Services | | | 2.9 | |
| Semiconductors & Semiconductor Equipment | | | 2.2 | |
| Industrial Conglomerates | | | 1.9 | |
| Internet Software & Services | | | 1.6 | |
| Software | | | 1.5 | |
| Automobiles | | | 1.4 | |
| Trading Companies & Distributors | | | 1.3 | |
| Consumer Finance | | | 1.1 | |
| Auto Components | | | 1.0 | |
| Electronic Equipment, Instruments & Components | | | 1.0 | |
| | | | |
| Food & Staples Retailing | | | 1.0 | % |
| Specialty Retail | | | 1.0 | |
| Aerospace & Defense | | | 0.9 | |
| Miscellaneous | | | 0.9 | |
| Diversified Financial Services | | | 0.8 | |
| Real Estate Investments Trusts | | | 0.8 | |
| Building Products | | | 0.7 | |
| Road & Rail | | | 0.7 | |
| IT Services | | | 0.6 | |
| Transportation Infrastructure | | | 0.6 | |
| Purchased Options | | | 0.4 | |
| Commercial Services & Supplies | | | 0.3 | |
| Hotels, Restaurants & Leisure | | | 0.2 | |
| Electrical Equipment | | | 0.1 | |
| Investment in Money Market Fund | | | 4.8 | |
| Other Assets, Less Liabilities | | | 38.4 | |
| Investments Sold Short | | | –29.5 | |
| | | | |
| | | 100.0 | % |
| | | | |
See Portfolio of Investments beginning on page 14 for specific holdings within these categories.
Top Ten Holdings or Issuers as of June 30, 2014 (excluding short-term investment) (Unaudited)
| 1. | iShares MSCI Japan Index Fund |
| 7. | iShares MSCI Mexico Investable Market Index Fund |
| 9. | BHP Billiton, Ltd., ADR |
Top Five Short Positions as of June 30, 2014 (Unaudited)
| 1. | S&P 500 Index—SPDR Trust Series 1 |
| 2. | Vanguard FTSE Emerging Markets |
| 4. | Consumer Staples Select Sector Consumer Staples SPDR |
| 5. | iShares JP Morgan USD Emerging Markets Bond |
Portfolio Management Discussion and Analysis (Unaudited)
Questions answered by portfolio manager Michael C. Aronstein of Marketfield Asset Management LLC, the Fund’s Subadvisor.
How did MainStay Marketfield Fund perform relative to its benchmark and peers during the six months ended June 30, 2014?
Excluding all sales charges, MainStay Marketfield Fund returned –3.63% for Class A and Investor Class shares and –3.93% for Class C shares for the six months ended June 30, 2014. Over the same period, Class I shares returned –3.51%, Class R2 shares returned –3.69%, Class R6 shares returned –3.40% and Class P shares returned –3.46%. During the six months ended June 30, 2014, all share classes underperformed the 7.14% return of the S&P 500® Index,1 which is the Fund’s broad-based securities-market index. Over the same period, all share classes underperformed the 3.06% return of the average Lipper2 alternative long/short equity fund. See page 8 for Fund returns with applicable sales charges.
What factors affected the Fund’s performance relative to the S&P 500® Index during the reporting period?
The decline in developed-world interest rates negatively impacted the Fund’s short positions in fixed-income futures and fixed-income proxies (e.g., high dividend equities).
The Fund’s long Reflation and long European Recovery themes were primary positive drivers of performance. The short Safe Haven Assets and short Margin Pressures themes were the primary detractors from the Fund’s relative performance.
During the reporting period, how was the Fund’s performance materially affected by investments in derivatives?
We took short positions in long-term developed-world bonds, which negatively affected the Fund’s performance. We used bond futures to express these positions. On a net basis, the various option positions we used during the first half of 2014 detracted from performance.
Which investment themes were the strongest contributors to the Fund’s performance and which themes were particularly weak?
Among the strongest contributors to the Fund’s performance was our Reflation theme, which reflected our view that pricing power is moving upstream in the value chain. (Contributions take weightings and total returns into account.) This theme contributed 1.3% to the Fund’s performance. Our European Recovery theme contributed 0.7% to the Fund’s performance. The rationale for this theme was that depressed European assets were recovering. Our End of the PC Era theme contributed 0.08% to performance. This theme reflected our view that the marketplace had become saturated with legacy computers and software and that the new technology era was likely
to benefit consumer-driven web-based solutions and service providers.
The weakest theme and contribution to performance came from our Safe Haven Assets theme, whose rationale was that assets considered to be “safe haven” assets by investors were over-owned and overvalued, that interest rates had greater risk to
the upside at then-current historic low yields, and that economic fears were subsiding. This theme detracted from performance by 2.2%. Our Margin Pressures theme detracted from performance by 0.9%. This theme reflected our belief that price takers lose out in a capacity-strained economy. Our Emerging Markets theme detracted from performance by 0.6%. The rationale for this theme was that many emerging markets had deteriorating economic fundamentals.
During the reporting period, which individual stocks made the strongest contributions to the Fund’s absolute performance and which stocks were particularly weak?
During the reporting period, the strongest individual positive contributors to the Fund’s absolute performance were long holdings in metals & mining company Alcoa and energy equipment & services companies Schlumberger and Baker Hughes.
Over the same period, the weakest contributions to the Fund’s absolute performance were short holdings in Euro-Oat (French government bond) futures, Euro-Bund (German federal government) futures, and SPDR Select Utilities ETF.
Did the Fund make any significant purchases or sales during the reporting period?
During the reporting period, we increased long exposure to Japan from 8% to 13% of net assets, which included individual equities as well as Tokyo Price Index futures. We increased the Fund’s short Margin Pressures theme from 7% to 20%. During the reporting period, we decreased the Fund’s long European holdings from 26% to 10% of net assets and we decreased our long Capital Spending theme from 27% to 14%.
How did the Fund’s sector weightings change during the reporting period?
We increased the Fund’s weighting in materials by 5.8 percentage points, from 14.2% of net assets at the beginning of the reporting period to 20% as of June 30, 2014. We increased the Fund’s financials position by 5.9 percentage points, from 9.8% to 15.7% of net assets. We decreased the Fund’s consumer discretionary holdings by 1 percentage point, from 10.7% of net assets at the beginning of the reporting period to 9.7% at the end. The Fund’s holdings in industrials declined by 5.3 percentage points, from 15.2% to 9.9% of net assets. We increased the Fund’s technology weighting by 5.3 percentage
| 1. | See footnote on page 9 for more information on the S&P 500® Index. |
| 2. | See footnote on page 9 for more information on Lipper Inc. |
| | |
| 12 | | MainStay Marketfield Fund |
points, from 1.6% to 6.9% of net assets. The Fund’s energy weighting saw a 1.1 percentage point increase from 5.6% of net assets at the beginning of the reporting period to 6.7% as of June 30, 2014.
How was the Fund positioned at the end of the reporting period?
As of June 30, 2014, the equity portion of the Fund was 86% long and 30% short. The net equity exposure was long 56%.3 As of the same date, the futures portion of the Fund was 1% long and 15% short. The net futures exposure was short 14%.
| 3. | See Portfolio of Investments on page 14 for information on specific holdings. |
The opinions expressed are those of the portfolio manager as of the date of this report and are subject to change. There is no guarantee that any forecasts made will come to pass. This material does not constitute investment advice and is not intended as an endorsement of any specific investment.
Portfolio of Investments June 30, 2014 (Unaudited)
| | | | | | | | |
| | |
| | | Shares | | | Value | |
| Common Stocks 73.8%† | |
Aerospace & Defense 0.9% | | | | | | | | |
Precision Castparts Corp. (a) | | | 705,858 | | | $ | 178,158,559 | |
| | | | | | | | |
| | |
Auto Components 1.0% | | | | | | | | |
Continental A.G. | | | 608,117 | | | | 140,850,323 | |
ElringKlinger A.G. | | | 1,270,875 | | | | 52,441,213 | |
| | | | | | | | |
| | | | | | | 193,291,536 | |
| | | | | | | | |
Automobiles 1.4% | | | | | | | | |
Daimler A.G., Registered Shares | | | 1,460,937 | | | | 136,831,564 | |
Fiat Industrial S.p.A. (b) | | | 13,902,602 | | | | 137,255,594 | |
| | | | | | | | |
| | | | | | | 274,087,158 | |
| | | | | | | | |
Banks 10.0% | | | | | | | | |
Banco Bilbao Vizcaya Argentaria S.A. | | | 7,637,147 | | | | 97,349,310 | |
Banco Popular Espanol S.A. | | | 13,848,123 | | | | 92,535,725 | |
¨Bank of Ireland (b) | | | 970,626,542 | | | | 326,953,484 | |
¨Bank of Ireland, Sponsored ADR (b) | | | 2,136,786 | | | | 29,701,325 | |
Citigroup, Inc. (a) | | | 4,202,869 | | | | 197,955,130 | |
Grupo Financiero Banorte S.A.B. de C.V. Class O | | | 27,266,015 | | | | 194,992,937 | |
Itau Unibanco Holding S.A., ADR (a) | | | 17,348,681 | | | | 249,474,033 | |
Sumitomo Mitsui Financial Group, Inc. | | | 5,569,789 | | | | 233,336,800 | |
U.S. Bancorp | | | 4,730,296 | | | | 204,916,423 | |
UniCredit S.p.A. | | | 18,059,015 | | | | 151,213,031 | |
Wells Fargo & Co. (a) | | | 4,162,458 | | | | 218,778,793 | |
| | | | | | | | |
| | | | | | | 1,997,206,991 | |
| | | | | | | | |
Building Products 0.7% | | | | | | | | |
Geberit A.G. | | | 416,599 | | | | 146,241,846 | |
| | | | | | | | |
| | |
Chemicals 2.9% | | | | | | | | |
Eastman Chemical Co. | | | 2,407,046 | | | | 210,255,468 | |
Potash Corporation of Saskatchewan, Inc. | | | 5,831,807 | | | | 221,375,394 | |
Sherwin-Williams Co. (The) (a) | | | 726,947 | | | | 150,412,604 | |
| | | | | | | | |
| | | | | | | 582,043,466 | |
| | | | | | | | |
Commercial Services & Supplies 0.3% | | | | | |
Bilfinger S.E. | | | 441,323 | | | | 50,314,327 | |
| | | | | | | | |
| | |
Construction Materials 4.6% | | | | | | | | |
Buzzi Unicem S.p.A. | | | 8,356,535 | | | | 140,629,625 | |
CRH PLC | | | 5,739,426 | | | | 147,435,013 | |
Eagle Materials, Inc. (a) | | | 2,554,727 | | | | 240,859,661 | |
HeidelbergCement A.G. | | | 1,649,551 | | | | 140,786,682 | |
¨Taiheiyo Cement Corp. | | | 64,568,797 | | | | 260,047,077 | |
| | | | | | | | |
| | | | | | | 929,758,058 | |
| | | | | | | | |
| | | | | | | | |
| | |
| | | Shares | | | Value | |
Consumer Finance 1.1% | | | | | | | | |
Discover Financial Services (a) | | | 3,465,406 | | | $ | 214,785,864 | |
| | | | | | | | |
| |
Diversified Financial Services 0.8% | | | | | |
CME Group, Inc. | | | 2,390,287 | | | | 169,590,863 | |
| | | | | | | | |
| | |
Electrical Equipment 0.1% | | | | | | | | |
ABB, Ltd. (b) | | | 1,230,066 | | | | 28,324,253 | |
| | | | | | | | |
|
Electronic Equipment, Instruments & Components 1.0% | |
Trimble Navigation, Ltd. (b) | | | 5,441,309 | | | | 201,056,368 | |
| | | | | | | | |
| | |
Energy Equipment & Services 2.9% | | | | | | | | |
¨Baker Hughes, Inc. | | | 3,568,318 | | | | 265,661,275 | |
¨Schlumberger, Ltd. (a) | | | 2,594,725 | | | | 306,047,814 | |
| | | | | | | | |
| | | | | | | 571,709,089 | |
| | | | | | | | |
Food & Staples Retailing 1.0% | | | | | | | | |
Costco Wholesale Corp. (a) | | | 1,819,547 | | | | 209,539,032 | |
| | | | | | | | |
| |
Hotels, Restaurants & Leisure 0.2% | | | | | |
Dalata Hotel Group, Ltd. (b) | | | 11,559,265 | | | | 47,414,671 | |
| | | | | | | | |
| | |
Household Durables 6.9% | | | | | | | | |
D.R. Horton, Inc. (a) | | | 8,812,670 | | | | 216,615,428 | |
Lennar Corp. Class A (a) | | | 4,886,607 | | | | 205,139,762 | |
Mohawk Industries, Inc. (a)(b) | | | 1,398,874 | | | | 193,520,229 | |
PulteGroup, Inc. (a) | | | 9,735,337 | | | | 196,264,394 | |
Ryland Group, Inc. (The) (a) | | | 4,452,901 | | | | 175,622,415 | |
Sekisui House, Ltd. | | | 14,232,374 | | | | 195,141,084 | |
Toll Brothers, Inc. (a)(b) | | | 5,345,054 | | | | 197,232,493 | |
| | | | | | | | |
| | | | | | | 1,379,535,805 | |
| | | | | | | | |
Industrial Conglomerates 1.9% | | | | | | | | |
3M Co. (a) | | | 1,357,845 | | | | 194,497,718 | |
General Electric Co. (a) | | | 6,838,535 | | | | 179,716,700 | |
| | | | | | | | |
| | | | | | | 374,214,418 | |
| | | | | | | | |
Internet Software & Services 1.6% | | | | | | | | |
¨Facebook, Inc. Class A (a)(b) | | | 4,843,985 | | | | 325,951,751 | |
| | | | | | | | |
| | |
IT Services 0.6% | | | | | | | | |
Amadeus IT Holding S.A. Class A | | | 2,848,293 | | | | 117,473,073 | |
| | | | | | | | |
| | |
Machinery 3.9% | | | | | | | | |
Cummins, Inc. (a) | | | 1,348,008 | | | | 207,984,155 | |
Deere & Co. (a) | | | 2,078,902 | | | | 188,244,576 | |
Fanuc Corp. | | | 1,003,830 | | | | 173,110,015 | |
| † | Percentages indicated are based on Fund net assets. |
| ¨ | | Among the Fund’s 10 largest holdings or issuers, as of June 30, 2014, excluding short-term investments. May be subject to change daily. |
| | | | |
| 14 | | MainStay Marketfield Fund | | The notes to the financial statements are an integral part of,
and should be read in conjunction with, the financial statements. |
| | | | | | | | |
| | |
| | | Shares | | | Value | |
| Common Stocks (continued) | |
Machinery (continued) | | | | | | | | |
Joy Global, Inc. (a) | | | 3,397,250 | | | $ | 209,202,655 | |
| | | | | | | | |
| | | | | | | 778,541,401 | |
| | | | | | | | |
Metals & Mining 12.2% | | | | | | | | |
¨Alcoa, Inc. (a) | | | 24,101,860 | | | | 358,876,695 | |
Allegheny Technologies, Inc. | | | 2,667,417 | | | | 120,300,507 | |
Anglo American PLC | | | 2,649,744 | | | | 64,847,231 | |
¨BHP Billiton, Ltd., ADR | | | 3,877,110 | | | | 265,388,179 | |
Carpenter Technology Corp. | | | 1,663,006 | | | | 105,185,130 | |
Freeport-McMoRan Copper & Gold, Inc. | | | 5,804,856 | | | | 211,877,244 | |
Nippon Steel & Sumitomo Metal Corp. | | | 65,550,397 | | | | 209,647,388 | |
Nucor Corp. | | | 4,025,498 | | | | 198,255,776 | |
Rio Tinto PLC | | | 3,412,140 | | | | 181,521,968 | |
Silver Wheaton Corp. | | | 5,989,476 | | | | 157,343,535 | |
Steel Dynamics, Inc. (a) | | | 10,169,161 | | | | 182,536,440 | |
Teck Resources, Ltd. Class B (a) | | | 7,573,287 | | | | 172,898,142 | |
Vale S.A., Sponsored ADR | | | 14,407,699 | | | | 190,613,858 | |
Walter Energy, Inc. | | | 4,804,521 | | | | 26,184,639 | |
| | | | | | | | |
| | | | | | | 2,445,476,732 | |
| | | | | | | | |
Miscellaneous 0.9% | | | | | | | | |
Merlin Properties Socimi S.A. (b) | | | 12,998,275 | | | | 171,755,927 | |
| | | | | | | | |
| |
Oil, Gas & Consumable Fuels 3.8% | | | | | |
Alpha Natural Resources, Inc. (a)(b) | | | 10,939,170 | | | | 40,584,321 | |
Chesapeake Energy Corp. (a) | | | 7,409,289 | | | | 230,280,702 | |
Devon Energy Corp. (a) | | | 3,159,471 | | | | 250,861,997 | |
EOG Resources, Inc. | | | 2,121,551 | | | | 247,924,450 | |
| | | | | | | | |
| | | | | | | 769,651,470 | |
| | | | | | | | |
Real Estate Investment Trusts 0.8% | | | | | |
Green REIT PLC (b) | | | 61,346,244 | | | | 103,321,758 | |
Hibernia REIT PLC (b) | | | 34,883,746 | | | | 53,020,619 | |
| | | | | | | | |
| | | | | | | 156,342,377 | |
| | | | | | | | |
Real Estate Management & Development 5.0% | |
Deutsche Wohnen A.G. | | | 3,648,956 | | | | 78,695,135 | |
Kennedy Wilson Europe Real Estate PLC (b) | | | 12,733,477 | | | | 239,712,770 | |
Mitsubishi Estate Co., Ltd. | | | 10,119,999 | | | | 249,840,753 | |
St. Joe Co. (The) (a)(b) | | | 7,471,432 | | | | 189,998,516 | |
Sumitomo Realty & Development Co., Ltd. | | | 5,655,045 | | | | 242,658,118 | |
| | | | | | | | |
| | | | | | | 1,000,905,292 | |
| | | | | | | | |
Road & Rail 0.7% | | | | | | | | |
DSV A/S | | | 4,119,552 | | | | 134,295,799 | |
| | | | | | | | |
| | | | | | | | |
| | |
| | | Shares | | | Value | |
Semiconductors & Semiconductor Equipment 2.2% | |
Intel Corp. | | | 7,365,138 | | | $ | 227,582,764 | |
Taiwan Semiconductor Manufacturing Co., Ltd., Sponsored ADR (a) | | | 10,085,395 | | | | 215,726,599 | |
| | | | | | | | |
| | | | | | | 443,309,363 | |
| | | | | | | | |
Software 1.5% | | | | | | | | |
FireEye, Inc. (b) | | | 3,512,680 | | | | 142,439,174 | |
Splunk, Inc. (a)(b) | | | 2,702,084 | | | | 149,506,308 | |
| | | | | | | | |
| | | | | | | 291,945,482 | |
| | | | | | | | |
Specialty Retail 1.0% | | | | | | | | |
Home Depot, Inc. (The) (a) | | | 2,547,039 | | | | 206,208,277 | |
| | | | | | | | |
|
Trading Companies & Distributors 1.3% | |
Beacon Roofing Supply, Inc. (a)(b) | | | 3,412,861 | | | | 113,033,956 | |
Wolseley PLC | | | 2,760,523 | | | | 151,321,204 | |
| | | | | | | | |
| | | | | | | 264,355,160 | |
| | | | | | | | |
Transportation Infrastructure 0.6% | | | | | | | | |
Abertis Infraestructuras S.A. | | | 5,574,385 | | | | 128,272,682 | |
| | | | | | | | |
Total Common Stocks
(Cost $12,602,482,255) | | | | | | | 14,781,757,090 | |
| | | | | | | | |
|
| Exchange-Traded Funds 10.4% (c) | |
iShares Dow Jones U.S. Home Construction Index Fund (a) | | | 9,372,379 | | | | 232,434,999 | |
¨iShares MSCI Japan Index Fund | | | 63,346,250 | | | | 762,688,850 | |
¨iShares MSCI Mexico Investable Market Index Fund (a) | | | 4,083,080 | | | | 276,873,655 | |
Market Vectors Agribusiness ETF (a) | | | 4,612,334 | | | | 253,724,493 | |
Market Vectors Gold Miners ETF (a) | | | 8,648,701 | | | | 228,758,142 | |
¨SPDR S&P Homebuilders | | | 10,000,000 | | | | 327,500,000 | |
| | | | | | | | |
Total Exchange-Traded Funds
(Cost $1,999,642,736) | | | | | | | 2,081,980,139 | |
| | | | | | | | |
| | |
| Preferred Stocks 1.7% | | | | | | | | |
Banks 1.4% | | | | | | | | |
¨Bank of Ireland Trust-Preferred Security 10.24% (d) | | | 192,001,000 | | | | 289,197,727 | |
| | | | | | | | |
| | |
Chemicals 0.3% | | | | | | | | |
Fuchs Petrolub SE 2.09% | | | 1,151,340 | | | | 52,057,027 | |
| | | | | | | | |
Total Preferred Stocks
(Cost $310,196,732) | | | | | | | 341,254,754 | |
| | | | | | | | |
| | |
| | | | | | | | |
| | | | | | |
The notes to the financial statements are an integral part of,
and should be read in conjunction with, the financial statements. | | | | | 15 | |
Portfolio of Investments June 30, 2014 (Unaudited) (continued)
| | | | | | | | |
| | | Notional
Amount | | | Value | |
| Purchased Options 0.4% | | | | | | | | |
Purchased Call Options 0.2% | | | | | | | | |
CNH/USD | | | | | | | | |
Strike Price $6.167
Expires 2/27/15 | | | 1,421,932,700 | | | $ | 28,819,732 | |
Strike Price $6.722
Expires 12/9/14 | | | 1,401,000,000 | | | | 491,751 | |
| | |
| | | | | | | | |
| | | Number of
Contracts | | | | |
iShares Russell 2000 ETF
Strike Price $117.00
Expires 7/19/14 | | | 75,731 | | | | 16,888,013 | |
| | | | | | | | |
Total Purchased Call Options
(Cost $55,136,485) | | | | | | | 46,199,496 | |
| | | | | | | | |
| | |
| | | | | | | | |
| | | Notional
Amount | | | | |
Purchased Put Options 0.2% | | | | | | | | |
EUR/USD | | | | | | | | |
Strike Price $1.376
Expires 9/4/14 | | | 1,042,640,877 | | | | 14,513,881 | |
Strike Price $1.379
Expires 9/4/14 | | | 1,042,052,227 | | | | 16,347,792 | |
| | | | | | | | |
Total Purchased Put Options
(Cost $60,351,462) | | | | | | | 30,861,673 | |
| | | | | | | | |
Total Purchased Options
(Cost $115,487,947) | | | | | | | 77,061,169 | |
| | | | | | | | |
| | |
| | | | | | | | |
| | |
| | | Shares | | | | |
| Short-Term Investment 4.8% | |
Money Market Fund 4.8% | | | | | | | | |
State Street Institutional Treasury Money Market Fund | | | 950,000,000 | | | | 950,000,000 | |
| | | | | | | | |
Total Short-Term Investment
(Cost $950,000,000) | | | | | | | 950,000,000 | |
| | | | | | | | |
Total Investments, Before Investments Sold Short
(Cost $15,977,809,670) (h) | | | 91.1 | % | | | 18,232,053,152 | |
| | | | | | | | |
|
| Common Stocks Sold Short (13.4%) | |
Air Freight & Logistics (0.6%) | | | | | | | | |
C.H. Robinson Worldwide, Inc. | | | (1,772,317 | ) | | | (113,056,101 | ) |
| | | | | | | | |
| | |
Beverages (1.2%) | | | | | | | | |
Coca-Cola Co. (The) | | | (5,488,583 | ) | | | (232,496,376 | ) |
| | | | | | | | |
| | | | | | | | |
| | |
| | | Shares | | | Value | |
Capital Markets (0.7%) | | | | | | | | |
Deutsche Bank A.G. | | | (3,739,121 | ) | | $ | (131,557,872 | ) |
| | | | | | | | |
| | |
Electric Utilities (1.3%) | | | | | | | | |
Southern Co. | | | (5,904,588 | ) | | | (267,950,204 | ) |
| | | | | | | | |
| | |
Food & Staples Retailing (0.6%) | | | | | | | | |
Whole Foods Market, Inc. | | | (3,239,040 | ) | | | (125,124,115 | ) |
| | | | | | | | |
| | |
Food Products (2.2%) | | | | | | | | |
Danone | | | (3,281,498 | ) | | | (243,719,638 | ) |
Nestle S.A. | | | (2,560,648 | ) | | | (198,372,257 | ) |
| | | | | | | | |
| | | | | | | (442,091,895 | ) |
| | | | | | | | |
Insurance (2.2%) | | | | | | | | |
Allianz SE | | | (2,570,191 | ) | | | (428,306,511 | ) |
| | | | | | | | |
| | |
Multi-Utilities (3.9%) | | | | | | | | |
Consolidated Edison, Inc. | | | (3,921,557 | ) | | | (226,430,701 | ) |
PG&E Corp. | | | (5,674,937 | ) | | | (272,510,475 | ) |
Public Service Enterprise Group, Inc. | | | (3,373,938 | ) | | | (137,622,931 | ) |
Wisconsin Energy Corp. | | | (3,206,509 | ) | | | (150,449,402 | ) |
| | | | | | | | |
| | | | | | | (787,013,509 | ) |
| | | | | | | | |
Textiles, Apparel & Luxury Goods (0.7%) | |
Adidas A.G. | | | (1,460,257 | ) | | | (147,905,259 | ) |
| | | | | | | | |
Total Common Stocks Sold Short
(Proceeds $2,586,132,546) | | | | | | | (2,675,501,842 | ) |
| | | | | | | | |
|
| Exchange-Traded Funds Sold Short (16.1%) (c) | |
Consumer Staples Select Sector Consumer Staples SPDR | | | (13,469,945 | ) | | | (601,028,946 | ) |
iShares JP Morgan USD Emerging Markets Bond | | | (3,793,905 | ) | | | (437,323,429 | ) |
S&P 500 Index—SPDR Trust Series 1 | | | (4,110,128 | ) | | | (804,434,252 | ) |
SPDR S&P Retail ETF | | | (7,599,843 | ) | | | (659,666,372 | ) |
Vanguard FTSE Emerging Markets | | | (16,849,266 | ) | | | (726,708,843 | ) |
| | | | | | | | |
Total Exchange-Traded Funds Sold Short
(Cost $3,122,444,348) | | | | | | | (3,229,161,842 | ) |
| | | | | | | | |
Total Investments Sold Short
(Proceeds $5,708,576,894) (e) | | | (29.5 | )% | | | (5,904,663,684 | ) |
| | | | | | | | |
Total Investments, Net of Investments Sold Short
(Cost $10,269,232,776) | | | 61.6 | | | | 12,327,389,468 | |
Other Assets, Less Liabilities | | | 38.4 | | | | 7,698,952,831 | |
Net Assets | | | 100.0 | % | | $ | 20,026,342,299 | |
| | | | |
| 16 | | MainStay Marketfield Fund | | The notes to the financial statements are an integral part of,
and should be read in conjunction with, the financial statements. |
| | | | | | | | |
| | | Contracts
Long | | | Unrealized
Appreciation
(Depreciation) (g) | |
| Futures Contracts (0.2%) | | | | | | | | |
Yen Denom Nikkei September 2014 (f) | | | 3,606 | | | $ | 76,388 | |
| | | | | | | | |
Total Futures Contracts Long (Notional Amount $269,902,720) | | | | | | | 76,388 | |
| | | | | | | | |
| | |
| | | | | | | | |
| | | Contracts
Short | | | | |
CAC 40 Index 10 Euro July 2014 (f) | | | (6,180 | ) | | | 7,541,451 | |
Euro-Bund (German Federal Government) August 2014 (f) | | | (5,420 | ) | | | (15,820,047 | ) |
Euro-OAT (French Government Bond) August 2014 (f) | | | (8,483 | ) | | | (31,846,039 | ) |
| | | | | | | | |
Total Futures Contracts Short
(Notional Amount $3,097,617,130) | | | | | | | (40,124,635 | ) |
| | | | | | | | |
Total Futures Contracts
(Notional Amount $2,827,714,410) | | | | | | $ | (40,048,247 | ) |
| | | | | | | | |
| (a) | Security, or a portion thereof, was maintained in a segregated account at the Fund’s custodian as collateral for securities sold short (See Note 2(J)). |
| (b) | Non-income producing security. |
| (c) | Exchange-Traded Fund—An investment vehicle that represents a basket of securities that is traded on an exchange. |
| (d) | May be sold to institutional investors only under Rule 144A or securities offered pursuant to Section 4(a)(2) of the Securities Act of 1933, as amended. |
| (e) | As of June 30, 2014, cash in the amount of $5,961,483,341 was on deposit with brokers for short sale transactions. |
| (f) | As of June 30, 2014, cash in the amount of $121,527,005 was on deposit with brokers for futures transactions. |
| (g) | Represents the difference between the value of the contracts at the time they were opened and the value as of June 30, 2014. |
| (h) | As of June 30, 2014, cost was $16,014,621,349 for federal income tax purposes and net unrealized appreciation was as follows: |
| | | | |
Gross unrealized appreciation | | $ | 2,611,206,841 | |
Gross unrealized depreciation | | | (393,775,038 | ) |
| | | | |
Net unrealized appreciation | | $ | 2,217,431,803 | |
| | | | |
The following abbreviations are used in the above portfolio:
ADR—American Depositary Receipt
CNH—Chinese Offshore Yuan
ETF—Exchange-Traded Fund
EUR—Euro
SPDR—Standard & Poor’s Depositary Receipt
USD—United States Dollar
At June 30, 2014, the Fund held the following OTC credit default swap contract:
| | | | | | | | | | | | | | | | | | | | | | | | | | | | | | | | |
Reference Entity | | Counterparty | | | Termination
Date | | | Buy/Sell
Protection1 | | | Notional
Amount
(000)2 | | | (Pay)/ Receive
Fixed
Rate3 | | | Upfront
Premiums
Received/ (Paid) | | | Value | | | Unrealized
Appreciation/
Depreciation4 | |
Republic of South Africa
5.50%, due 3/9/20 | | | Citigroup | | | | 6/20/2019 | | | | Buy | | | $ | 236,926 | | | | 1.00 | % | | $ | (12,698,168 | ) | | $ | 7,856,092 | | | $ | (4,842,076 | ) |
| | | | | | | | | | | | | | | | | | | | | | | | | | | $ | 7,856,092 | | | $ | (4,842,076 | ) |
| 1. | Buy—Fund pays premium and buys credit protection. If a credit event occurs, as defined under the terms of that particular swap agreement, the Fund will either (i) receive from the seller of protection an amount equal to the notional amount of the swap and deliver the referenced obligation or underlying securities comprising the referenced index or (ii) receive a net settlement amount in the form of cash or securities equal to the notional amount of the swap less the recovery value of the referenced obligation or underlying securities comprising the referenced index. |
| | Sell—Fund receives premium and sells credit protection. If a credit event occurs, as defined under the terms of that particular swap agreement, the Fund will either (i) pay to the buyer of protection an amount equal to the notional amount of the swap and take delivery of the referenced obligation or underlying securities comprising the referenced index or (ii) pay a net settlement amount in the form of cash or securities equal to the notional amount of the swap less the recovery value of the referenced obligation or underlying securities comprising the referenced index. |
| 2. | The maximum potential amount the Fund could be required to pay as a seller of credit protection or receive as a buyer of credit protection if a credit event occurs as defined under the terms of that particular swap contract. |
| 3. | The annual fixed rate represents the interest received by the Fund (as a seller of protection) or paid by the Fund (as a buyer of protection) annually on the notional amount of the credit default swap contract. |
| 4. | Represents the difference between the value of the credit default swap contracts at the time they were opened and the value at June 30, 2014. |
| | | | | | |
The notes to the financial statements are an integral part of,
and should be read in conjunction with, the financial statements. | | | | | 17 | |
Portfolio of Investments June 30, 2014 (Unaudited) (continued)
The following is a summary of the fair valuations according to the inputs used as of June 30, 2014, for valuing the Fund’s assets and liabilities.
Asset Valuation Inputs
| | | | | | | | | | | | | | | | |
Description | | Quoted
Prices in
Active
Markets for
Identical
Assets (Level 1) | | | Significant
Other
Observable
Inputs (Level 2) | | | Significant
Unobservable
Inputs (Level 3) | | | Total | |
| Investments in Securities (a) | | | | | | | | | | | | | | | | |
| Common Stocks | | $ | 14,781,757,090 | | | $ | — | | | $ | — | | | $ | 14,781,757,090 | |
| Exchange-Traded Funds | | | 2,081,980,139 | | | | — | | | | — | | | | 2,081,980,139 | |
| Preferred Stocks | | | 52,057,027 | | | | 289,197,727 | | | | — | | | | 341,254,754 | |
| Short-Term Investment | | | | | | | | | | | | | | | | |
Money Market Fund | | | 950,000,000 | | | | — | | | | — | | | | 950,000,000 | |
| | | | | | | | | | | | | | | | |
| Total Investments in Securities | | | 17,865,794,256 | | | | 289,197,727 | | | | — | | | | 18,154,991,983 | |
| | | | | | | | | | | | | | | | |
| Other Financial Instruments | | | | | | | | | | | | | | | | |
Futures Contracts Long (b) | | | 76,388 | | | | — | | | | — | | | | 76,388 | |
Futures Contracts Short (b) | | | 7,541,451 | | | | — | | | | — | | | | 7,541,451 | |
Purchased Call Options | | | 46,199,496 | | | | — | | | | — | | | | 46,199,496 | |
Purchased Put Options | | | 30,861,673 | | | | — | | | | — | | | | 30,861,673 | |
| | | | | | | | | | | | | | | | |
| Total Other Financial Instruments | | | 84,679,008 | | | | — | | | | — | | | | 84,679,008 | |
| | | | | | | | | | | | | | | | |
| Total Investments in Securities and Other Financial Instruments | | $ | 17,950,473,264 | | | $ | 289,197,727 | | | $ | — | | | $ | 18,239,670,991 | |
| | | | | | | | | | | | | | | | |
Liability Valuation Inputs
| | | | | | | | | | | | | | | | |
Description | | Quoted
Prices in
Active
Markets for
Identical
Assets (Level 1) | | | Significant
Other
Observable
Inputs (Level 2) | | | Significant
Unobservable
Inputs (Level 3) | | | Total | |
| Investments in Securities Sold Short (a) | | | | | | | | | | | | | | | | |
| Common Stocks Sold Short | | $ | (2,675,501,842 | ) | | $ | — | | | $ | — | | | $ | (2,675,501,842 | ) |
| Exchange-Traded Funds Sold Short | | | (3,229,161,842 | ) | | | — | | | | — | | | | (3,229,161,842 | ) |
| | | | | | | | | | | | | | | | |
| Total Investments in Securities Sold Short | | | (5,904,663,684 | ) | | | — | | | | — | | | | (5,904,663,684 | ) |
| | | | | | | | | | | | | | | | |
| Other Financial Instruments | | | | | | | | | | | | | | | | |
Futures Contracts Short (b) | | | (47,666,086 | ) | | | — | | | | — | | | | (47,666,086 | ) |
Credit Default Swap Contracts | | | — | | | | (4,842,076 | ) | | | — | | | | (4,842,076 | ) |
| | | | | | | | | | | | | | | | |
| Total Other Financial Instruments | | | (47,666,086 | ) | | | (4,842,076 | ) | | | — | | | | (52,508,162 | ) |
| | | | | | | | | | | | | | | | |
| Total Investments in Securities Sold Short and Other Financial Instruments | | $ | (5,952,329,770 | ) | | $ | (4,842,076 | ) | | $ | — | | | $ | (5,957,171,846 | ) |
| | | | | | | | | | | | | | | | |
| (a) | For a complete listing of investments and their industries, see the Portfolio of Investments. |
| (b) | The value listed for these securities reflects unrealized appreciation (depreciation) as shown on the Portfolio of Investments. |
The Fund recognizes transfers between the levels as of the beginning of the period.
For the period ended June 30, 2014, the Fund did not have any transfers between Level 1 and Level 2 fair value measurements. (See Note 2)
As of June 30, 2014, the Fund did not hold any investments with significant unobservable inputs (Level 3). (See Note 2)
| | | | |
| 18 | | MainStay Marketfield Fund | | The notes to the financial statements are an integral part of,
and should be read in conjunction with, the financial statements. |
Statement of Assets and Liabilities as of June 30, 2014 (Unaudited)
| | | | |
| Assets | |
Investment in securities, at value
(identified cost $15,977,809,670) | | $ | 18,232,053,152 | |
Cash collateral on deposit at broker | | | 6,083,010,346 | |
Cash | | | 1,601,390,521 | |
Cash denominated in foreign currencies
(identified cost $1,448,120) | | | 1,456,036 | |
Receivables: | | | | |
Investment securities sold | | | 339,203,212 | |
Fund shares sold | | | 39,245,345 | |
Dividends and interest | | | 34,805,304 | |
Premiums paid for swap contracts | | | 12,698,168 | |
Other assets | | | 762,866 | |
| | | | |
Total assets | | | 26,344,624,950 | |
| | | | |
|
| Liabilities | |
Investments sold short (proceeds $5,708,576,894) | | | 5,904,663,684 | |
Payables: | | | | |
Investment securities purchased | | | 266,359,072 | |
Fund shares redeemed | | | 57,032,648 | |
Unrealized depreciation on futures contracts (a) | | | 40,048,247 | |
Manager (See Note 3) | | | 22,915,019 | |
Dividends on investments sold short | | | 13,525,913 | |
Broker fees and charges on short sales | | | 4,366,036 | |
Transfer agent (See Note 3) | | | 2,381,676 | |
NYLIFE Distributors (See Note 3) | | | 1,877,676 | |
Professional fees | | | 166,427 | |
Custodian | | | 53,194 | |
Trustees | | | 26,009 | |
Shareholder communication | | | 24,974 | |
Unrealized depreciation on swap contracts | | | 4,842,076 | |
| | | | |
Total liabilities | | | 6,318,282,651 | |
| | | | |
Net assets | | $ | 20,026,342,299 | |
| | | | |
|
| Composition of Net Assets | |
Shares of beneficial interest outstanding (par value of $.001 per share) unlimited number of shares authorized | | $ | 1,122,774 | |
Additional paid-in capital | | | 18,723,309,793 | |
| | | | |
| | | 18,724,432,567 | |
Net investment loss | | | (141,429,440 | ) |
Accumulated net realized gain (loss) on investments, investments sold short, futures transactions, written options, swap transactions and foreign currency transactions | | | (570,853,027 | ) |
Net unrealized appreciation (depreciation) on investments, futures contracts and swap contracts | | | 2,209,353,159 | |
Net unrealized appreciation (depreciation) on investments sold short | | | (196,086,790 | ) |
Net unrealized appreciation (depreciation) on translation of other assets and liabilities in foreign currencies | | | 925,830 | |
| | | | |
Net assets | | $ | 20,026,342,299 | |
| | | | |
| | | | |
Class A | | | | |
Net assets applicable to outstanding shares | | $ | 1,876,014,687 | |
| | | | |
Shares of beneficial interest outstanding | | | 105,371,980 | |
| | | | |
Net asset value per share outstanding | | $ | 17.80 | |
Maximum sales charge (5.50% of offering price) | | | 1.04 | |
| | | | |
Maximum offering price per share outstanding | | $ | 18.84 | |
| | | | |
Investor Class | | | | |
Net assets applicable to outstanding shares | | $ | 16,378,201 | |
| | | | |
Shares of beneficial interest outstanding | | | 919,855 | |
| | | | |
Net asset value per share outstanding | | $ | 17.81 | |
Maximum sales charge (5.50% of offering price) | | | 1.04 | |
| | | | |
Maximum offering price per share outstanding | | $ | 18.85 | |
| | | | |
Class C | | | | |
Net assets applicable to outstanding shares | | $ | 1,797,124,189 | |
| | | | |
Shares of beneficial interest outstanding | | | 102,239,773 | |
| | | | |
Net asset value and offering price per share outstanding | | $ | 17.58 | |
| | | | |
Class I | | | | |
Net assets applicable to outstanding shares | | $ | 16,049,779,074 | |
| | | | |
Shares of beneficial interest outstanding | | | 898,170,974 | |
| | | | |
Net asset value and offering price per share outstanding | | $ | 17.87 | |
| | | | |
Class R2 | | | | |
Net assets applicable to outstanding shares | | $ | 24,217,913 | |
| | | | |
Shares of beneficial interest outstanding | | | 1,363,662 | |
| | | | |
Net asset value and offering price per share outstanding | | $ | 17.76 | |
| | | | |
Class R6 | | | | |
Net assets applicable to outstanding shares | | $ | 7,670,700 | |
| | | | |
Shares of beneficial interest outstanding | | | 428,736 | |
| | | | |
Net asset value and offering price per share outstanding | | $ | 17.89 | |
| | | | |
Class P | | | | |
Net assets applicable to outstanding shares | | $ | 255,157,535 | |
| | | | |
Shares of beneficial interest outstanding | | | 14,279,408 | |
| | | | |
Net asset value and offering price per share outstanding | | $ | 17.87 | |
| | | | |
| (a) | Represents the difference between the value of the contracts at the time they were opened and the value as of June 30, 2014. Margin payments are not paid or received daily. |
| | | | | | |
The notes to the financial statements are an integral part of,
and should be read in conjunction with, the financial statements. | | | | | 19 | |
Statement of Operations for the six months ended June 30, 2014 (Unaudited)
| | | | | |
| Investment Income (Loss) | |
Income | | | | | |
Dividends (a) | | | $ | 152,551,269 | |
Interest | | | | 13,132,510 | |
| | | | | |
Total income | | | | 165,683,779 | |
| | | | | |
Expenses | | | | | |
Manager (See Note 3) | | | | 141,786,369 | |
Dividends on investments sold short | | | | 93,230,196 | |
Broker fees and charges on short sales | | | | 25,892,345 | |
Distribution/Service—Class A (See Note 3) | | | | 2,369,432 | |
Distribution/Service—Investor Class (See Note 3) | | | | 18,798 | |
Distribution/Service—Class C (See Note 3) | | | | 8,755,227 | |
Distribution/Service—Class R2 (See Note 3) | | | | 27,741 | |
Transfer agent (See Note 3) | | | | 9,477,318 | |
Registration | | | | 1,375,747 | |
Shareholder communication | | | | 706,073 | |
Custodian | | | | 431,425 | |
Professional fees | | | | 334,747 | |
Trustees | | | | 174,525 | |
Shareholder service—Class R2 (See Note 3) | | | | 11,096 | |
Miscellaneous | | | | 158,971 | |
| | | | | |
Total expenses | | | | 284,750,010 | |
| | | | | |
Net investment income (loss) | | | | (119,066,231 | ) |
| | | | | |
|
Realized and Unrealized Gain (Loss)
on Investments, Futures
Contracts, Written Options,
Swap Contracts and
Foreign Currency Transactions | |
Net realized gain (loss) on: | | | | | |
Investment transactions | | | | 252,256,324 | |
Investments sold short | | | | (376,518,659 | ) |
Futures transactions | | | | (213,651,398 | ) |
Written option transactions | | | | 11,326,570 | |
Swap transactions | | | | (27,933,310 | ) |
Foreign currency transactions | | | | 1,569,328 | |
Net increase from payment by affiliates (Note 3) | | | | 1,282,342 | |
| | | | | |
Net realized gain (loss) on investments, investments sold short, futures transactions, written option transactions, swap transactions and foreign currency transactions | | | | (351,668,803 | ) |
| | | | | |
Net change in unrealized appreciation (depreciation) on: | | | | | |
Investments | | | | (320,433,984 | ) |
Investments sold short | | | | 84,698,336 | |
Futures contracts | | | | (66,144,379 | ) |
Swap contracts | | | | (4,230,702 | ) |
Translation of other assets and liabilities in foreign currencies | | | | 836,491 | |
| | | | | |
Net change in unrealized appreciation (depreciation) on investments, investments sold short, futures contracts, swap contracts and foreign currency transactions | | | | (305,274,238 | ) |
| | | | | |
Net realized and unrealized gain (loss) on investments, investments sold short, futures transactions, written options, swap transactions and foreign currency transactions | | | | (656,943,041 | ) |
| | | | | |
Net increase (decrease) in net assets resulting from operations | | | $ | (776,009,272 | ) |
| | | | | |
| (a) | Dividends recorded net of foreign withholding taxes in the amount of $8,405,019. |
| | | | |
| 20 | | MainStay Marketfield Fund | | The notes to the financial statements are an integral part of,
and should be read in conjunction with, the financial statements. |
Statements of Changes in Net Assets
for the six months ended June 30, 2014 (Unaudited) and the year ended December 31, 2013
| | | | | | | | |
| | | 2014 | | | 2013 | |
| Increase (Decrease) in Net Assets | |
Operations: | | | | | | | | |
Net investment income (loss) | | $ | (119,066,231 | ) | | $ | (160,390,429 | ) |
Net realized gain (loss) on investments, investments sold short, futures transactions, written option transactions, swap transactions and foreign currency transactions | | | (351,668,803 | ) | | | (155,701,363 | ) |
Net change in unrealized appreciation (depreciation) on investments, investments sold short, futures contracts, swap contracts and foreign currency transactions | | | (305,274,238 | ) | | | 1,929,726,445 | |
| | | | |
Net increase (decrease) in net assets resulting from operations | | | (776,009,272 | ) | | | 1,613,634,653 | |
| | | | |
Dividends to shareholders: | | | | | | | | |
From net investment income: | | | | | | | | |
Class A | | | — | | | | (185,252 | ) |
Investor Class | | | — | | | | (1,320 | ) |
Class C | | | — | | | | (172,240 | ) |
Class I | | | — | | | | (1,727,880 | ) |
Class R2 | | | — | | | | (1,849 | ) |
Class R6 | | | — | | | | (256 | ) |
Class P | | | — | | | | (20,583 | ) |
| | | | |
Total dividends to shareholders | | | — | | | | (2,109,380 | ) |
| | | | |
Capital share transactions: | | | | | | | | |
Net proceeds from sale of shares | | | 5,286,288,343 | | | | 15,259,206,171 | |
Net asset value of shares issued to shareholders in reinvestment of dividends | | | — | | | | 1,639,832 | |
Cost of shares redeemed | | | (3,880,181,851 | ) | | | (1,883,248,334 | ) |
| | | | |
Increase (decrease) in net assets derived from capital share transactions | | | 1,406,106,492 | | | | 13,377,597,669 | |
| | | | |
Net increase (decrease) in net assets | | | 630,097,220 | | | | 14,989,122,942 | |
|
| Net Assets | |
Beginning of period | | | 19,396,245,079 | | | | 4,407,122,137 | |
| | | | |
End of period | | | 20,026,342,299 | | | | 19,396,245,079 | |
| | | | |
Net investment loss at end of period | | $ | (141,429,440 | ) | | $ | (22,363,209 | ) |
| | | | |
| | | | | | |
The notes to the financial statements are an integral part of,
and should be read in conjunction with, the financial statements. | | | | | 21 | |
Financial Highlights selected per share data and ratios
| | | | | | | | | | | | |
| Class A | | Six months
ended
June 30,
2014* | | | Year ended
December 31,
2013 | | | October 5,
2012**
through
December 31,
2012 | |
Net asset value at beginning of period | | $ | 18.47 | | | $ | 15.84 | | | $ | 15.80 | † |
| | | | | | | | | | | | |
Net investment income (loss) (a) | | | (0.12 | ) | | | (0.28 | ) | | | (0.04 | ) |
Net realized and unrealized gain (loss) on investments | | | (0.55 | ) | | | 2.91 | | | | 0.15 | |
Net realized and unrealized gain (loss) on foreign currency transactions | | | 0.00 | ‡ | | | 0.00 | ‡ | | | — | |
| | | | | | | | | | | | |
Total from investment operations | | | (0.67 | ) | | | 2.63 | | | | 0.11 | |
| | | | | | | | | | | | |
| Less dividends and distributions: | | | | | | | | | | | | |
From net investment income | | | — | | | | (0.00 | )‡ | | | — | |
From net realized gain on investments | | | — | | | | — | | | | (0.07 | ) |
| | | | | | | | | | | | |
Total dividends and distributions | | | — | | | | (0.00 | )‡ | | | (0.07 | ) |
| | | | | | | | | | | | |
Net asset value at end of period | | $ | 17.80 | | | $ | 18.47 | | | $ | 15.84 | |
| | | | | | | | | | | | |
Total investment return | | | (3.63 | %)(b) | | | 16.60 | % (c) | | | 0.72 | % (b)(d) |
| Ratios of expenses to average net assets (e): | | | | | | | | | | | | |
Before waivers/reimbursements of expenses | | | 2.93 | % †† | | | 2.87 | % | | | 4.07 | % †† |
Excluding dividends and interest expense on short positions | | | 1.76 | % †† | | | 1.78 | % | | | 1.80 | % †† |
After waivers/reimbursements of expenses | | | 2.93 | % †† | | | 2.87 | % | | | 4.07 | % †† |
Excluding dividends and interest expense on short positions | | | 1.76 | % †† | | | 1.78 | % | | | 1.80 | % †† |
| Ratio of net investment loss to average net assets: | | | | | | | | | | | | |
Before waivers/reimbursements of expenses (f) | | | (1.30 | %)†† | | | (1.59 | %) | | | (1.13 | %)†† |
After waivers/reimbursements of expenses (f) | | | (1.30 | %)†† | | | (1.59 | %) | | | (1.13 | %)†† |
Short sale expenses | | | 1.17 | % †† | | | 1.09 | % | | | 2.27 | % †† |
Portfolio turnover rate | | | 45 | % | | | 32 | % | | | 66 | % |
Net assets at end of period (in 000’s) | | $ | 1,876,015 | | | $ | 1,718,301 | | | $ | 137,056 | |
| † | Based on the net asset value of Class I as of October 5, 2012. |
| ‡ | Rounds to less than 0.5 cent per share. |
| (a) | Per share data based on average shares outstanding during the period. |
| (b) | Total investment return is not annualized. |
| (c) | Total investment return may reflect adjustments to conform to generally accepted accounting principles. |
| (d) | Total investment return is calculated exclusive of sales charges and assumes the reinvestment of dividends and distributions. |
| (e) | In addition to the fees and expenses which the Fund bears directly, the Fund indirectly bears a pro-rata share of the fees and expenses of the Exchange-Traded Funds in which it invests. Such indirect expenses are not included in the above expense ratios. |
| (f) | The net investment loss ratios include dividends and interest expense on short positions. |
| | | | |
| 22 | | MainStay Marketfield Fund | | The notes to the financial statements are an integral part of,
and should be read in conjunction with, the financial statements. |
Financial Highlights selected per share data and ratios
| | | | | | | | | | | | |
| Investor Class | | Six months
ended
June 30,
2014* | | | Year ended
December 31,
2013 | | | October 5,
2012**
through
December 31,
2012 | |
Net asset value at beginning of period | | $ | 18.47 | | | $ | 15.84 | | | $ | 15.80 | † |
| | | | | | | | | | | | |
Net investment income (loss) (a) | | | (0.12 | ) | | | (0.28 | ) | | | (0.04 | ) |
Net realized and unrealized gain (loss) on investments | | | (0.54 | ) | | | 2.91 | | | | 0.15 | |
Net realized and unrealized gain (loss) on foreign currency transactions | | | 0.00 | ‡ | | | 0.00 | ‡ | | | — | |
| | | | | | | | | | | | |
Total from investment operations | | | (0.66 | ) | | | 2.63 | | | | 0.11 | |
| | | | | | | | | | | | |
| Less dividends and distributions: | | | | | | | | | | | | |
From net investment income | | | — | | | | (0.00 | )‡ | | | — | |
From net realized gain on investments | | | — | | | | — | | | | (0.07 | ) |
| | | | | | | | | | | | |
Total dividends and distributions | | | — | | | | (0.00 | )‡ | | | (0.07 | ) |
| | | | | | | | | | | | |
Net asset value at end of period | | $ | 17.81 | | | $ | 18.47 | | | $ | 15.84 | |
| | | | | | | | | | | | |
Total investment return | | | (3.57 | %)(b)(c) | | | 16.60 | % (b) | | | 0.72 | % (c)(d) |
| Ratios of expenses to average net assets (e): | | | | | | | | | | | | |
Before waivers/reimbursement of expenses | | | 2.97 | % †† | | | 2.89 | % | | | 4.03 | % †† |
Excluding dividends and interest expense on short positions | | | 1.76 | % †† | | | 1.79 | % | | | 1.74 | % †† |
After waivers/reimbursements of expenses | | | 2.97 | % †† | | | 2.89 | % | | | 4.03 | % †† |
Excluding dividends and interest expense on short positions | | | 1.76 | % †† | | | 1.79 | % | | | 1.74 | % †† |
| Ratio of net investment loss to average net assets: | | | | | | | | | | | | |
Before waivers/reimbursements of expenses (f) | | | (1.32 | %)†† | | | (1.59 | %) | | | (1.06 | %)†† |
After waivers/reimbursements of expenses (f) | | | (1.32 | %)†† | | | (1.59 | %) | | | (1.06 | %)†† |
Short sale expenses | | | 1.21 | % †† | | | 1.10 | % | | | 2.29 | % †† |
Portfolio turnover rate | | | 45 | % | | | 32 | % | | | 66 | % |
Net assets at end of period (in 000’s) | | $ | 16,378 | | | $ | 11,913 | | | $ | 619 | |
| † | Based on the net asset value of Class I as of October 5, 2012. |
| ‡ | Rounds to less than 0.5 cent per share. |
| (a) | Per share data based on average shares outstanding during the period. |
| (b) | Total investment return may reflect adjustments to conform to generally accepted accounting principles. |
| (c) | Total investment return is not annualized. |
| (d) | Total investment return is calculated exclusive of sales charges and assumes the reinvestment of dividends and distributions. |
| (e) | In addition to the fees and expenses which the Fund bears directly, the Fund indirectly bears a pro-rata share of the fees and expenses of the Exchange-Traded Funds in which it invests. Such indirect expenses are not included in the above expense ratios. |
| (f) | The net investment loss ratios include dividends and interest expense on short positions. |
| | | | | | |
The notes to the financial statements are an integral part of,
and should be read in conjunction with, the financial statements. | | | | | 23 | |
Financial Highlights selected per share data and ratios
| | | | | | | | | | | | |
| Class C | | Six months
ended
June 30,
2014* | | | Year ended
December 31,
2013 | | | October 5,
2012**
through
December 31,
2012 | |
Net asset value at beginning of period | | $ | 18.30 | | | $ | 15.81 | | | $ | 15.80 | † |
| | | | | | | | | | | | |
Net investment income (loss) (a) | | | (0.18 | ) | | | (0.41 | ) | | | (0.07 | ) |
Net realized and unrealized gain (loss) on investments | | | (0.54 | ) | | | 2.90 | | | | 0.15 | |
Net realized and unrealized gain (loss) on foreign currency transactions | | | 0.00 | ‡ | | | 0.00 | ‡ | | | — | |
| | | | | | | | | | | | |
Total from investment operations | | | (0.72 | ) | | | 2.49 | | | | 0.08 | |
| | | | | | | | | | | | |
| Less dividends and distributions: | | | | | | | | | | | | |
From net investment income | | | — | | | | (0.00 | )‡ | | | — | |
From net realized gain on investments | | | — | | | | — | | | | (0.07 | ) |
| | | | | | | | | | | | |
Total dividends and distributions | | | — | | | | (0.00 | )‡ | | | (0.07 | ) |
| | | | | | | | | | | | |
Net asset value at end of period | | $ | 17.58 | | | $ | 18.30 | | | $ | 15.81 | |
| | | | | | | | | | | | |
Total investment return | | | (3.93 | %)(b) | | | 15.75 | % (c) | | | 0.53 | % (b)(d) |
| Ratios of expenses to average net assets (e): | | | | | | | | | | | | |
Before waivers/reimbursements of expenses | | | 3.69 | % †† | | | 3.62 | % | | | 4.82 | % †† |
Excluding dividends and interest expense on short positions | | | 2.51 | % †† | | | 2.53 | % | | | 2.50 | % †† |
After waivers/reimbursements of expenses | | | 3.69 | % †† | | | 3.62 | % | | | 4.82 | % †† |
Excluding dividends and interest expense on short positions | | | 2.51 | % †† | | | 2.53 | % | | | 2.50 | % †† |
| Ratio of net investment loss to average net assets: | | | | | | | | | | | | |
Before waivers/reimbursements of expense (f) | | | (2.06 | %)†† | | | (2.35 | %) | | | (1.85 | %)†† |
After waivers/reimbursements of expense (f) | | | (2.06 | %)†† | | | (2.35 | %) | | | (1.85 | %)†† |
Short sale expenses | | | 1.18 | % †† | | | 1.09 | % | | | 2.32 | % †† |
Portfolio turnover rate | | | 45 | % | | | 32 | % | | | 66 | % |
Net assets at end of period (in 000’s) | | $ | 1,797,124 | | | $ | 1,582,396 | | | $ | 124,430 | |
| † | Based on the net asset value of Class I as of October 5, 2012. |
| ‡ | Rounds to less than 0.5 cent per share. |
| (a) | Per share data based on average shares outstanding during the period. |
| (b) | Total investment return is not annualized. |
| (c) | Total investment return may reflect adjustments to conform to generally accepted accounting principles. |
| (d) | Total investment return is calculated exclusive of sales charges and assumes the reinvestment of dividends and distributions. |
| (e) | In addition to the fees and expenses which the Fund bears directly, the Fund indirectly bears a pro-rata share of the fees and expenses of the Exchange-Traded Funds in which it invests. Such indirect expenses are not included in the above expense ratios. |
| (f) | The net investment loss ratios include dividends and interest expense on short positions. |
| | | | |
| 24 | | MainStay Marketfield Fund | | The notes to the financial statements are an integral part of,
and should be read in conjunction with, the financial statements. |
Financial Highlights selected per share data and ratios
| | | | | | | | | | | | | | | | | | | | | | | | | | | | | | | | | | | |
| | | Six months
ended
June 30, | | Year ended December 31, | | Period ended
June 1, 2009 to
December 31, | | Year ended
May 31, |
| Class I | | 2014* | | 2013 | | 2012 | | 2011** | | 2010** | | 2009** | | 2009** |
Net asset value at beginning of period | | | $ | 18.51 | | | | $ | 15.84 | | | | $ | 14.02 | | | | $ | 13.52 | | | | $ | 11.84 | | | | $ | 10.18 | | | | $ | 10.76 | |
| | | | | | | | | | | | | | | | | | | | | | | | | | | | | | | | | | | |
Net investment income (loss) | | | | (0.09 | )(a) | | | | (0.23 | )(a) | | | | (0.06 | )(a) | | | | (0.11 | ) | | | | (0.04 | ) | | | | (0.06 | ) | | | | (0.03 | ) |
Net realized and unrealized gain (loss) on investments | | | | (0.55 | ) | | | | 2.90 | | | | | 1.96 | | | | | 0.61 | | | | | 1.75 | | | | | 1.72 | | | | | (0.55 | ) |
Net realized and unrealized gain (loss) on foreign currency transactions | | | | 0.00 | ‡ | | | | 0.00 | ‡ | | | | (0.01 | ) | | | | — | (b) | | | | — | (b) | | | | — | (b) | | | | — | (b) |
| | | | | | | | | | | | | | | | | | | | | | | | | | | | | | | | | | | |
Total from investment operations | | | | (0.64 | ) | | | | 2.67 | | | | | 1.89 | | | | | 0.50 | | | | | 1.71 | | | | | 1.66 | | | | | (0.58 | ) |
| | | | | | | | | | | | | | | | | | | | | | | | | | | | | | | | | | | |
| Less dividends and distributions: | | | | | | | | | | | | | | | | | | | | | | | | | | | | | | | | | | | |
From net investment income | | | | — | | | | | (0.00 | )‡ | | | | — | | | | | — | | | | | (0.01 | ) | | | | — | | | | | — | |
From net realized gain on investments | | | | — | | | | | — | | | | | (0.07 | ) | | | | — | | | | | (0.02 | ) | | | | — | | | | | (0.00 | )‡ |
| | | | | | | | | | | | | | | | | | | | | | | | | | | | | | | | | | | |
Total dividends and distributions | | | | — | | | | | (0.00 | )‡ | | | | (0.07 | ) | | | | — | | | | | (0.03 | ) | | | | — | | | | | (0.00 | )‡ |
| | | | | | | | | | | | | | | | | | | | | | | | | | | | | | | | | | | |
Redemption fee | | | | — | | | | | — | | | | | — | | | | | 0.00 | ‡ | | | | 0.00 | ‡ | | | | 0.00 | ‡ | | | | 0.00 | ‡ |
| | | | | | | | | | | | | | | | | | | | | | | | | | | | | | | | | | | |
Net asset value at end of period | | | $ | 17.87 | | | | $ | 18.51 | | | | $ | 15.84 | | | | $ | 14.02 | | | | $ | 13.52 | | | | $ | 11.84 | | | | $ | 10.18 | |
| | | | | | | | | | | | | | | | | | | | | | | | | | | | | | | | | | | |
Total investment return (c) | | | | (3.46 | %)(d)(e) | | | | 16.86 | % (e) | | | | 13.50 | % | | | | 3.70 | % | | | | 14.32 | % | | | | 16.40 | % (f) | | | | (5.36 | %)(f) |
| Ratios of expenses to average net assets (g): | | | | | | | | | | | | | | | | | | | | | | | | | | | | | | | | | | | |
Before waivers/reimbursements and recoupments or expenses | | | | 2.67 | % †† | | | | 2.60 | % | | | | 2.86 | % | | | | 2.42 | % | | | | 2.35 | % | | | | 2.58 | % †† | | | | 2.67 | % |
Excluding dividends and interest expense on short positions | | | | 1.51 | % †† | | | | 1.52 | % | | | | 1.53 | % | | | | 1.55 | % | | | | 1.64 | % | | | | 1.75 | % †† | | | | 2.24 | % |
After waivers/reimbursements and recoupments or expenses | | | | 2.67 | % †† | | | | 2.60 | % | | | | 2.86 | % | | | | 2.43 | % | | | | 2.46 | % | | | | 2.43 | % (h)†† | | | | 2.24 | % |
Excluding dividends and interest expense on short positions | | | | 1.51 | % †† | | | | 1.52 | % | | | | 1.53 | % | | | | 1.56 | % | | | | 1.75 | % | | | | 1.90 | % (h)†† | | | | 1.81 | % |
| Ratio of net investment loss to average net assets: | | | | | | | | | | | | | | | | | | | | | | | | | | | | | | | | | | | |
Before waivers/reimbursements and recoupments or expenses (i) | | | | (1.06 | %)†† | | | | (1.33 | %) | | | | (1.28 | %) | | | | (1.06 | %) | | | | (0.25 | %) | | | | (1.48 | %)(j)†† | | | | (0.92 | %) |
After waivers/reimbursements and recoupments or expenses(i) | | | | (1.06 | %)†† | | | | (1.33 | %) | | | | (1.28 | %) | | | | (1.07 | %) | | | | (0.36 | %) | | | | (1.33 | %)(h)†† | | | | (0.49 | %) |
Short sale expenses | | | | 1.16 | % †† | | | | 1.08 | % | | | | 1.33 | % | | | | 0.87 | % | | | | 0.71 | % | | | | 0.83 | % †† | | | | 0.43 | % |
Portfolio turnover rate | | | | 45 | % | | | | 32 | % | | | | 66 | % | | | | 138 | % | | | | 159 | % | | | | 78 | % | | | | 227 | % |
Net assets at end of period (in 000’s) | | | $ | 16,049,779 | | | | $ | 15,867,200 | | | | $ | 4,144,927 | | | | $ | 888,782 | | | | $ | 433,921 | | | | $ | 98,503 | | | | $ | 43,044 | |
| ** | These periods were audited by a predecessor audit firm whose opinion was unqualified. |
| ‡ | Rounds to less than 0.5 cent per share. |
| (a) | Per share data based on average shares outstanding during the period. |
| (b) | This information was not separately reported and part of realized unrealized gain (loss). |
| (c) | Total investment return is calculated exclusive of sales charges and assumes the reinvestment of dividends and distributions. Class I shares are not subject to sales charges. |
| (d) | Total investment return is not annualized. |
| (e) | Total investment return may reflect adjustments to conform to generally accepted accounting principles |
| (f) | Not annualized for periods less than a full year. The total return for the year ended May 31, 2009, and the period ended December 31, 2009, reflect the total return while the Fund was taxed as a C corporation. (See Note 2(b)) |
| (g) | In addition to the fees and expenses which the Fund bears directly, the Fund indirectly bears a pro-rata share of the fees and expenses of the Exchange-Traded Funds in which it invests. |
| (i) | The net investment loss ratios include dividends and interest expense of short positions. |
| (j) | The net investment loss ratios include tax expense. |
| | | | | | |
The notes to the financial statements are an integral part of,
and should be read in conjunction with, the financial statements. | | | | | 25 | |
Financial Highlights selected per share data and ratios
| | | | | | | | | | | | |
| Class R2 | | Six months
ended
June 30,
2014* | | | Year ended
December 31,
2013 | | | October 5,
2012**
through
December 31,
2012 | |
Net asset value at beginning of period | | $ | 18.44 | | | $ | 15.82 | | | $ | 15.80 | † |
| | | | | | | | | | | | |
Net investment income (loss) (a) | | | (0.13 | ) | | | (0.32 | ) | | | (0.06 | ) |
Net realized and unrealized gain (loss) on investments | | | (0.55 | ) | | | 2.94 | | | | 0.15 | |
Net realized and unrealized gain (loss) on foreign currency transactions | | | 0.00 | ‡ | | | 0.00 | ‡ | | | — | |
| | | | | | | | | | | | |
Total from investment operations | | | (0.68 | ) | | | 2.62 | | | | 0.09 | |
| | | | | | | | | | | | |
| Less dividends and distributions: | | | | | | | | | | | | |
From net investment income | | | — | | | | (0.00 | )‡ | | | — | |
From net realized gain on investments | | | — | | | | — | | | | (0.07 | ) |
| | | | | | | | | | | | |
Total dividends and distributions | | | — | | | | (0.00 | )‡ | | | (0.07 | ) |
| | | | | | | | | | | | |
Net asset value at end of period | | $ | 17.76 | | | $ | 18.44 | | | $ | 15.82 | |
| | | | | | | | | | | | |
Total investment return (b) | | | (3.69 | %)(c) | | | 16.56 | % (d) | | | 0.59 | % (c) |
| Ratios of expenses to average net assets (e): | | | | | | | | | | | | |
Before waivers/reimbursements of expenses | | | 3.07 | % †† | | | 2.99 | % | | | 3.83 | % †† |
Excluding dividends and interest expense on short positions | | | 1.86 | % †† | | | 1.89 | % | | | 1.89 | % †† |
After waivers/reimbursements of expenses | | | 3.07 | % †† | | | 2.99 | % | | | 3.83 | % †† |
Excluding dividends and interest expense on short positions | | | 1.86 | % †† | | | 1.89 | % | | | 1.89 | % †† |
| Ratio of net investment loss to average net assets: | | | | | | | | | | | | |
Before waivers/reimbursements of expenses (f) | | | (1.41 | %)†† | | | (1.80 | %) | | | (1.56 | %)†† |
After waivers/reimbursements of expenses (f) | | | (1.41 | %)†† | | | (1.80 | %) | | | (1.56 | %)†† |
Short sale expenses | | | 1.21 | % †† | | | 1.10 | % | | | 1.94 | % †† |
Portfolio turnover rate | | | 45 | % | | | 32 | % | | | 66 | % |
Net assets at end of period (in 000’s) | | $ | 24,218 | | | $ | 17,234 | | | $ | 90 | |
| † | Based on the net asset value of Class I as of October 5, 2012. |
| ‡ | Rounds to less than 0.5 cent per share. |
| (a) | Per share data based on average shares outstanding during the period. |
| (b) | Total investment return is calculated exclusive of sales charges and assumes the reinvestment of dividends and distributions. Class R2 shares are not subject to sales charges. |
| (c) | Total investment return is not annualized. |
| (d) | Total investment return may reflect adjustments to conform to generally accepted accounting principles. |
| (e) | In addition to the fees and expenses which the Fund bears directly, the Fund indirectly bears a pro-rata share of the fees and expenses of the Exchange-Traded Funds in which it invests. Such indirect expenses are not included in the above expense ratios. |
| (f) | The net investment loss ratios include dividends and interest expense on short positions. |
| | | | |
| 26 | | MainStay Marketfield Fund | | The notes to the financial statements are an integral part of,
and should be read in conjunction with, the financial statements. |
Financial Highlights selected per share data and ratios
| | | | | | | | |
| Class R6 | | Six months
ended
June 30,
2014* | | | June 17,
2013**
through
December 31,
2013 | |
Net asset value at beginning of period | | $ | 18.53 | | | $ | 17.08 | † |
| | | | | | | | |
Net investment income (loss) (a) | | | (0.09 | ) | | | (0.10 | ) |
Net realized and unrealized gain (loss) on investments | | | (0.55 | ) | | | 1.55 | |
Net realized and unrealized gain (loss) on foreign currency transactions | | | 0.00 | ‡ | | | 0.00 | ‡ |
| | | | | | | | |
Total from investment operations | | | (0.64 | ) | | | 1.45 | |
| | | | | | | | |
| Less dividends: | | | | | | | | |
From net investment income | | | — | | | | (0.00 | )‡ |
| | | | | | | | |
Net asset value at end of period | | $ | 17.89 | | | $ | 18.53 | |
| | | | | | | | |
Total investment return (b)(c)(d) | | | (3.45 | %) | | | 8.49 | % |
| Ratios of expenses to average net assets (e): | | | | | | | | |
Before waivers/reimbursements of expenses | | | 2.76 | % †† | | | 2.66 | % †† |
Excluding dividends and interest expense on short positions | | | 1.41 | % †† | | | 1.44 | % †† |
After waivers/reimbursements of expenses | | | 2.76 | % †† | | | 2.66 | % †† |
Excluding dividends and interest expense on short positions | | | 1.41 | % †† | | | 1.44 | % †† |
| Ratio of net investment loss to average net assets: | | | | | | | | |
Before waivers/reimbursements of expenses (f) | | | (0.97 | %)†† | | | (1.04 | %)†† |
After waivers/reimbursements of expenses (f) | | | (0.97 | %)†† | | | (1.04 | %)†† |
Short sale expenses | | | 1.35 | % †† | | | 1.22 | % †† |
Portfolio turnover rate | | | 45 | % | | | 32 | % |
Net assets at end of period (in 000’s) | | $ | 7,671 | | | $ | 1,957 | |
| † | Based on the net asset value of Class I as of June 17, 2013. |
| ‡ | Rounds to less than 0.5 cent per share. |
| (a) | Per share data based on average shares outstanding during the period. |
| (b) | Total investment return is calculated exclusive of sales charges and assumes the reinvestment of dividends and distributions. Class R6 shares are not subject to sales charges. |
| (c) | Total investment return may reflect adjustments to conform to generally accepted accounting principles. |
| (d) | Total investment return is not annualized. |
| (e) | In addition to the fees and expenses which the Fund bears directly, the Fund indirectly bears a pro-rata share of the fees and expenses of the Exchange-Traded Funds in which it invests. Such indirect expenses are not included in the above expense ratios. |
| (f) | The net investment loss ratios include dividends and interest expense on short positions. |
| | | | | | |
The notes to the financial statements are an integral part of,
and should be read in conjunction with, the financial statements. | | | | | 27 | |
Financial Highlights selected per share data and ratios
| | | | | | | | |
| Class P | | Year ended
June 30,
2014* | | | May 31,
2013**
through
December 31,
2013 | |
Net asset value at beginning of period | | $ | 18.51 | | | $ | 17.01 | † |
| | | | | | | | |
Net investment income (loss) (a) | | | (0.10 | ) | | | (0.15 | ) |
Net realized and unrealized gain (loss) on investments | | | (0.54 | ) | | | 1.65 | |
Net realized and unrealized gain (loss) on foreign currency transactions | | | 0.00 | ‡ | | | 0.00 | ‡ |
| | | | | | | | |
Total from investment operations | | | (0.64 | ) | | | 1.50 | |
| | | | | | | | |
| Less dividends: | | | | | | | | |
From net investment income | | | — | | | | (0.00 | )‡ |
| | | | | | | | |
Net asset value at end of period | | $ | 17.87 | | | $ | 18.51 | |
| | | | | | | | |
Total investment return (b) | | | (3.46 | %)(c) | | | 8.82 | % (c)(d) |
| Ratios of expenses to average net assets (e): | | | | | | | | |
Before waivers/reimbursements of expenses | | | 2.71 | % †† | | | 2.58 | % †† |
Excluding dividends and interest expense on short positions | | | 1.51 | % †† | | | 1.54 | % †† |
After waivers/reimbursements of expenses | | | 2.71 | % †† | | | 2.58 | % †† |
Excluding dividends and interest expense on short positions | | | 1.51 | % †† | | | 1.54 | % †† |
| Ratio of net investment loss to average net assets: | | | | | | | | |
Before waivers/reimbursements of expenses (f) | | | (1.07 | %)†† | | | (1.46 | %)†† |
After waivers/reimbursements of expenses (f) | | | (1.07 | %)†† | | | (1.46 | %)†† |
Short sale expenses | | | 1.20 | % †† | | | 1.04 | % †† |
Portfolio turnover rate | | | 45 | % | | | 32 | % |
Net assets at end of period (in 000’s) | | $ | 255,158 | | | $ | 197,245 | |
| † | Based on the net asset value of Class I as of May 31, 2013. |
| ‡ | Rounds to less than 0.5 cent per share. |
| (a) | Per share data based on average shares outstanding during the period. |
| (b) | Total investment return is calculated exclusive of sales charges and assumes the reinvestment of dividends and distributions. Class P shares are not subject to sales charges. |
| (c) | Total investment return is not annualized. |
| (d) | Total investment return may reflect adjustments to conform to generally accepted accounting principles. |
| (e) | In addition to the fees and expenses which the Fund bears directly, the Fund indirectly bears a pro-rata share of the fees and expenses of the Exchange-Traded Funds in which it invests. Such indirect expenses are not included in the above expense ratios. |
| (f) | The net investment loss ratios include dividends and interest expense on short positions. |
| | | | |
| 28 | | MainStay Marketfield Fund | | The notes to the financial statements are an integral part of,
and should be read in conjunction with, the financial statements. |
Notes to Financial Statements (Unaudited)
Note 1–Organization and Business
MainStay Funds Trust (the “Trust”) was organized as a Delaware statutory trust on April 28, 2009, and is governed by a Declaration of Trust. The Trust is registered under the Investment Company Act of 1940, as amended (the “1940 Act”), as an open-end management investment company, and is comprised of thirty-eight funds (collectively referred to as the “Funds”). These financial statements and notes relate to the MainStay Marketfield Fund (the “Fund”), a diversified fund. The Fund is successor to Marketfield Fund (the “Predecessor Fund”), which was a series of a different registered investment company for which Marketfield Asset Management, LLC, a New York limited liability company and the predecessor entity to the Fund’s Subadvisor (as defined in Note 3(A)), served as investment adviser. The financial statements of the Fund reflect the historical results of the Predecessor Fund prior to its reorganization on October 5, 2012. Upon the completion of the reorganization, the Class I shares of the Fund assumed the performance, financial and other information of the Predecessor Fund. All information and references to periods prior to October 5, 2012 refer to the Predecessor Fund.
The Fund currently offers seven classes of shares. Class A, Investor Class, Class C and Class R2 shares commenced operations on October 5, 2012. Class I shares commenced operations on July 31, 2007. Class R6 shares commenced operations on June 17, 2013. Class P shares commenced operations on May 31, 2013. Class A and Investor Class shares are offered at net asset value (“NAV”) per share plus an initial sales charge. No sales charge applies to investments of $1 million or more (and certain other qualified purchases) in Class A and Investor Class shares, but a contingent deferred sales charge (“CDSC”) is imposed on certain redemptions made within one year of the date of purchase. Class C shares are offered at NAV without an initial sales charge, although a 1.00% CDSC may be imposed on redemptions made within one year of the date of purchase of Class C shares. Class I, Class R2, Class R6, and Class P shares are offered at NAV and are not subject to a sales charge. Depending upon eligibility, Class A shares may convert to Investor Class shares and Investor Class shares may convert to Class A shares. The seven classes of shares have the same voting (except for issues that relate solely to one class), dividend, liquidation and other rights, and the same terms and conditions, except that Class C shares are subject to higher distribution and/or service fee rates than Class A, Investor Class and Class R2 shares under a distribution plan pursuant to Rule 12b-1 under the 1940 Act. Class I, Class R6, and Class P shares are not subject to a distribution and/or service fee. Class R2 shares are subject to a shareholder service fee. This is in addition to any fees paid under a distribution plan, where applicable.
The Fund’s investment objective is to seek capital appreciation.
Note 2–Significant Accounting Policies
The Fund prepares its financial statements in accordance with generally accepted accounting principles (“GAAP”) in the United States of America and follows the significant accounting policies described below.
(A) Securities Valuation. Investments are valued as of the close of regular trading on the New York Stock Exchange (“Exchange”) (generally 4:00 p.m. Eastern time) on each day the Fund is open for business (“valuation date”).
The Board of Trustees (the “Board”) adopted procedures for the valuation of the Fund’s securities and delegated the responsibility for valuation determinations under those procedures to the Valuation Committee of the Fund (the “Valuation Committee”). The Board authorized the Valuation Committee to appoint a Valuation Sub-Committee (the “Sub-Committee”) to deal in the first instance with questions that arise or cannot be resolved under these procedures. The Sub-Committee meets (in person, via electronic mail or via teleconference) on an as-needed basis. The Valuation Committee meets at a later time, as necessary, to ensure that actions taken by the Sub-Committee were appropriate. The procedures recognize that, subject to the oversight of the Board and unless otherwise noted, the responsibility for day-to-day valuation of portfolio assets (including securities for which market prices are not readily available) rests with New York Life Investment Management LLC (“New York Life Investments” or the “Manager”), aided to whatever extent necessary by the Subadvisor (as defined in Note 3(A)) to the Fund.
To assess the appropriateness of security valuations, the Manager or the Fund’s third party service provider, who is subject to oversight by the Manager, regularly compares prior day prices, prices on comparable securities, and the sale prices to the prior and current day prices and challenges prices with changes exceeding certain tolerance levels with third party pricing services or broker sources. For those securities valued through either a standardized fair valuation methodology or a fair valuation measurement, the Sub-Committee deals in the first instance with such valuation and the Valuation Committee reviews and affirms the reasonableness of the valuation based on such methodologies and measurements on a regular basis after considering all relevant information that is reasonably available. Any action taken by the Sub-Committee with respect to the valuation of a portfolio security is submitted by the Valuation Committee to the full Board for its review at its next regularly scheduled meeting immediately after such action.
Each security owned by the Fund that is listed on a securities exchange is valued at its last sale price on that exchange on the date as of which assets are valued. When the security is listed on more than one exchange, the Fund will use the price of the exchange that the Fund generally considers to be the principal exchange on which the stock is traded.
Fund securities listed on the NASDAQ Stock Market, Inc. (“NASDAQ”) will be valued at the NASDAQ Official Closing Price (“NOCP”), which may not necessarily represent the last sale price. If the NOCP is not available, such securities shall be valued at the last sale price on the day of valuation. If there has been no sale on such exchange or on NASDAQ on such day, the security is valued at the mean between the bid and asked prices on such day.
“Fair value” is defined as the price that the Fund would receive upon selling an asset or liability in an orderly transaction to an independent buyer in the principal or most advantageous market for the asset or liability. Fair value measurements are determined within a framework that established a three-tier hierarchy which maximizes the use of observable market data and minimizes the use of unobservable inputs to establish a classification of fair value measurements for disclosure purposes. “Inputs” refer broadly to the assumptions that market participants would use in pricing the asset or liability, including assumptions about risk, such as the risk inherent in a particular valuation technique
Notes to Financial Statements (Unaudited) (continued)
used to measure fair value using a pricing model and/or the risk inherent in the inputs for the valuation technique. Inputs may be observable or unobservable. Observable inputs reflect the assumptions market participants would use in pricing the asset or liability based on market data obtained from sources independent of the Fund. Unobservable inputs reflect the Fund’s own assumptions about the assumptions market participants would use in pricing the asset or liability based on the information available. The inputs or methodology used for valuing securities may not be an indication of the risks associated with investing in those securities. The three-tier hierarchy of inputs is summarized below.
| • | | Level 1—quoted prices in active markets for an identical asset or liability |
| • | | Level 2—other significant observable inputs (including quoted prices for a similar asset or liability in active markets, interest rates and yield curves, prepayment speeds, credit risk etc.) |
| • | | Level 3—significant unobservable inputs (including the Fund’s own assumptions about the assumptions that market participants would use in measuring fair value of an asset or liability) |
The aggregate value by input level, as of June 30, 2014, for the Fund’s assets or liabilities is included at the end of the Fund’s Portfolio of Investments.
The Fund may use third party vendor evaluations, whose prices may be derived from one or more of the following standard inputs among others:
| | |
• Benchmark Yields | | • Reported Trades |
• Broker Dealer Quotes | | • Issuer Spreads |
• Two-sided markets | | • Benchmark securities |
• Bids/Offers | | • Reference Data (corporate actions or material event notices) |
• Industry and economic events | | • Comparable bonds |
• Monthly payment information | | |
An asset or liability for which market values cannot be measured using the methodologies described above are valued by methods deemed reasonable and in good faith by the Valuation Committee, following the procedures established by the Board, to represent fair value. Under these procedures, the Fund generally uses a market-based approach which may use related or comparable assets or liabilities, recent transactions, market multiples, book values, and other relevant information. The Fund may also use an income-based valuation approach in which the anticipated future cash flows of the asset or liability are discounted to calculate fair value. Discounts may also be applied due to the nature and/or duration of any restrictions on the disposition of the asset or liability. Due to the inherent valuation uncertainty of such assets or liabilities, fair values may differ significantly from values that would have been used had an active market existed. For the six-month period ended June 30, 2014 there have been no material changes to the fair value methodologies.
Equity and non-equity securities which may be valued in this manner include, but are not limited to: (i) a security for which trading has been halted or suspended; (ii) a debt security that has recently gone into default and for which there is not a current market quotation; (iii) a
security of an issuer that has entered into a restructuring; (iv) a security that has been de-listed from a national exchange; (v) a security for which the market price is not readily available from a third party pricing source or, if so provided, does not, in the opinion of the Manager or Subadvisor reflect the security’s market value; (vi) a security subject to trading collars for which no or limited trading takes place; and (vii) a security whose principal market has been temporarily closed at a time when, under normal conditions, it would be open. Securities for which market quotations or observable inputs are not readily available are generally categorized as Level 3 in the hierarchy. As of June 30, 2014, there were no securities held by the Fund that were fair valued in such a manner.
Certain securities held by the Fund may principally trade in foreign markets. Events may occur between the time that foreign markets close and the time at which the Fund’s NAV is calculated. These events may include, but are not limited to, situations relating to a single issuer in a market sector, significant fluctuations in U.S. or foreign markets, natural disasters, armed conflicts, governmental actions or other developments not tied directly to the securities markets. Should the Manager or Subadvisor conclude that such events may have affected the accuracy of the last price of such securities reported on the local foreign market, the Sub-Committee may, pursuant to procedures adopted by the Board, adjust the value of the local price to reflect the estimated impact on the price of such securities as a result of such events. In this instance, securities are generally categorized as Level 3 in the hierarchy. Additionally, certain foreign equity securities are also fair valued whenever the movement of a particular index exceeds an established threshold. In such cases, the securities are fair valued by applying factors provided by a third party vendor in accordance with the Fund’s policies and procedures and are generally categorized as Level 2 in the hierarchy. As of June 30, 2014, no foreign equity securities held by the Fund were fair valued in such a manner.
Equity securities and Exchange-Traded Funds are valued at the last quoted sales prices as of the close of regular trading on the Exchange on each valuation date. Securities that are not traded on the valuation date are valued at the mean of the last quoted bid and ask prices. Prices are normally taken from the principal market in which each security trades. Options contracts are valued at the last posted settlement price on the market where such options are primarily traded. Investments in other mutual funds are valued at their respective NAV(s) as of the close of the Exchange on the valuation date. These securities are generally categorized as Level 1 in the hierarchy.
Temporary cash investments acquired in excess of 60 days to maturity are valued using the latest bid prices or using valuations based on a matrix system (which considers such factors as security prices, yields, maturities, and ratings), both as furnished by independent pricing services. Other temporary cash investments which mature in 60 days or less at the time of purchase (“Short-Term Investments”) are valued at amortized cost. The amortized cost method involves valuing a security at its cost on the date of purchase and thereafter assuming a constant amortization to maturity of the difference between such cost and the value on maturity date. Amortized cost approximates the current fair value of a security. Securities valued at amortized cost are not valued using a quoted price in an active market. These securities are generally categorized as Level 2 in the hierarchy.
| | |
| 30 | | MainStay Marketfield Fund |
Generally, a security is considered illiquid if it cannot be sold or disposed of in the ordinary course of business at approximately the price at which it is valued within seven days. Its illiquidity might prevent the sale of such security at a time when the Manager or Subadvisor might wish to sell, and these securities could have the effect of decreasing the overall level of a Fund’s liquidity. Further, the lack of an established secondary market may make it more difficult to value illiquid securities, requiring the Fund to rely on judgments that may be somewhat subjective in measuring value, which could vary from the amount that the Fund could realize upon disposition. Difficulty in selling illiquid securities may result in a loss or may be costly to the Fund. Under the supervision of the Board, the Manager or Subadvisor measures the liquidity of the Fund’s investments; in doing so, the Manager or Subadvisor may consider various factors, including (i) the frequency of trades and quotations, (ii) the number of dealers and prospective purchasers, (iii) dealer undertakings to make a market, and (iv) the nature of the security and the market in which it trades (e.g., the time needed to dispose of the security, the method of soliciting offers and the mechanics of transfer). Illiquid securities generally will be valued in good faith in such a manner as the Board deems appropriate to reflect their fair value.
(B) Income Taxes. The Fund’s policy is to comply with the requirements of the Internal Revenue Code of 1986, as amended (the “Code”), applicable to regulated investment companies (“RIC”) and to distribute all of the taxable income to the shareholders of the Fund within the allowable time limits. Therefore, no federal, state and local income tax provisions are required.
Management evaluates the Fund’s tax positions to determine if the tax positions taken meet the minimum recognition threshold in connection with accounting for uncertainties in income tax positions taken or expected to be taken for the purposes of measuring and recognizing tax liabilities in the financial statements. Recognition of tax benefits of an uncertain tax position is required only when the position is “more likely than not” to be sustained assuming examination by taxing authorities. Management has analyzed the Fund’s tax positions taken on federal, state and local income tax returns for all open tax years (for up to three tax years), and has concluded that no provisions for federal, state and local income tax are required in the Fund’s financial statements. The Fund’s federal, state and local income and federal excise tax returns for tax years for which the applicable statutes of limitations have not expired are subject to examination by the Internal Revenue Service and state and local departments of revenue.
(C) Foreign Taxes. The Fund may be subject to foreign taxes on income and other transaction-based taxes imposed by certain countries in which they invest. A portion of the taxes on gains on investments or currency purchases/repatriation may be recoverable. The Fund will accrue such taxes and recoveries as applicable, based upon its current interpretation of tax rules and regulations that exist in the markets in which it invests.
The Fund may be subject to taxation on realized capital gains, repatriation proceeds and other transaction-based taxes imposed by certain countries in which it invests. The Fund will accrue such taxes as applicable based upon its current interpretation of tax rules and regulations that exist in the market in which it invests. Capital gains taxes relating to positions still held are reflected as a liability on the Statement of Assets and Liabilities, as well as an adjustment to the Fund’s net unrealized
appreciation (depreciation). Taxes related to capital gains realized during the six-month period ended June 30, 2014, if any, are reflected as part of net realized gain (loss) in the Statement of Operations. Changes in tax liabilities related to capital gains taxes on unrealized investment gains, if any, are reflected as part of the change in net unrealized appreciation (depreciation) on investments in the Statement of Operations. Transaction-based charges are generally assessed as a percentage of the transaction amount.
(D) Dividends and Distributions to Shareholders. Dividends and distributions are recorded on the ex-dividend date. The Fund intends to declare and pay dividends from net investment income and distributions from net realized capital and currency gains, if any, at least annually. Unless the shareholder elects otherwise, all dividends and distributions are reinvested in the same class of shares of the Fund, at NAV. Dividends and distributions to shareholders are determined in accordance with federal income tax regulations and may differ from GAAP.
(E) Security Transactions and Investment Income. The Fund records security transactions on the trade date. Realized gains and losses on security transactions are determined using the identified cost method. Dividend income is recognized on the ex-dividend date, net of any foreign tax withheld at the source, and interest income is accrued as earned using the effective interest rate method. Discounts and premiums on Short-Term Investments are accreted and amortized, respectively, on the straight-line method. The straight-line method approximates the effective interest method for short-term investments. Income from payment-in-kind securities is recorded daily based on the effective interest method of accrual.
Investment income and realized and unrealized gains and losses on investments of the Fund are allocated to separate classes of shares pro rata based upon their relative net assets on the date the income is earned or realized and unrealized gains and losses are incurred.
(F) Expenses. Expenses of the Trust are allocated to the individual Funds in proportion to the net assets of the respective Funds when the expenses are incurred, except where direct allocations of expenses can be made. Expenses (other than transfer agent expenses and fees incurred under the shareholder services plans and the distribution plans further discussed in Note 3(B)) are allocated to separate classes of shares pro rata based upon their relative net assets on the date the expenses are incurred. The expenses borne by the Fund, including those of related parties to the Fund, are shown in the Statement of Operations.
(G) Use of Estimates. In preparing financial statements in conformity with GAAP, management makes estimates and assumptions that affect the reported amounts and disclosures in the financial statements. Actual results could differ from those estimates.
(H) Foreign Currency Transactions. The books and records of the Fund are kept in U.S. dollars. Prices of securities denominated in
foreign currency amounts are translated into U.S. dollars at the mean between the buying and selling rates last quoted by any major U.S. bank at the following dates:
| (i) | market value of investment securities, other assets and liabilities—at the valuation date; and |
Notes to Financial Statements (Unaudited) (continued)
| (ii) | purchases and sales of investment securities, income and expenses—at the date of such transactions. |
The assets and liabilities that are denominated in foreign currency amounts are presented at the exchange rates and market values at the close of the period. The realized and unrealized changes in net assets arising from fluctuations in exchange rates and market prices of securities are not separately presented.
Net realized gain (loss) on foreign currency transactions represents net gains and losses on foreign currency forward contracts, net currency gains or losses realized as a result of differences between the amounts of securities sale proceeds or purchase cost, dividends, interest and withholding taxes as recorded on the Fund’s books, and the U.S. dollar equivalent amount actually received or paid. Net currency gains or losses from valuing such foreign currency denominated assets and liabilities, other than investments at valuation date exchange rates, are reflected in unrealized foreign exchange gains or losses.
(I) Swap Contracts. The Fund may enter into credit default, interest rate, index and currency exchange rate swap contracts (“swaps”) for the purpose of attempting to obtain a desired return at a lower cost to the Fund, rather than directly investing in an instrument yielding that desired return or to hedge against credit and interest rate risk. In a typical swap transaction, two parties agree to exchange the returns (or differentials in rates of returns) earned or realized on a particular investment or instruments. The gross returns to be exchanged or “swapped” between the parties are calculated with respect to a notional amount. The payments may be adjusted for transaction costs, interest payments, the amount of interest paid on the investment or instrument, or other factors. Collateral, in the form of cash or securities, may be required to be held in segregated accounts with the custodian bank or broker in accordance with the swap. Swaps agreements are privately negotiated in the over the counter market (“OTC swaps”) and may be executed in a multilateral or other trade facilities platform, such as a registered commodities exchange (“centrally cleared swaps”).
Credit default swaps, in particular, are contracts whereby one party makes periodic payments to a counterparty in exchange for the right to receive a specified return in the event of a default by a third party on its obligation. Such periodic payments are accrued daily and recorded as a realized gain or loss. Credit default swaps may be used to provide a measure of protection against defaults of sovereign or corporate issuers.
Certain standardized swaps, including certain credit default and interest rate swaps, are subject to mandatory clearing, and more are expected to be in the future. The counterparty risk for cleared derivatives is expected to be generally lower than the counterparty risk for uncleared derivatives, but cleared contracts are not risk-free. In a cleared derivative transaction, a Fund typically enters into the transaction with a financial institution counterparty, and performance of the transaction is effectively guaranteed by a central clearinghouse, thereby reducing or eliminating the Fund’s exposure to the credit risk of its original counterparty. The Fund will be required to post specified levels of margin with the clearinghouse or at the instruction of the clearinghouse; the margin required by a clearinghouse may be greater than the margin the Fund would be required to post in an uncleared transaction.
Swaps are marked-to-market daily based upon quotations from pricing agents, brokers, or market makers and the change in value, if any, is
recorded as unrealized appreciation or depreciation. Any payments made or received upon entering a swap would be amortized or accreted over the life of the swap and recorded as a realized gain or loss. Early termination of a swap is recorded as a realized gain or loss. Daily changes in valuation of centrally cleared swaps, if any, are recorded as a receivable or payable for the change in value as appropriate (“variation margin”) on the Statements of Assets and Liabilities.
The Fund bears the risk of loss of the amount expected to be received under a swap in the event of the default or bankruptcy of the swap counterparty. The Fund may be able to eliminate its exposure under a swap either by assignment or other disposition, or by entering into an offsetting swap with the same party or a similar creditworthy party. Swaps are not actively traded on financial markets. Entering into swaps involves elements of credit, market, and documentation risk in excess of the amounts recognized on the Statement of Assets and Liabilities. Such risks involve the possibilities that there will be no liquid market for these swaps, that the counterparty to the swaps may default on its obligation to perform or disagree as to the meaning of the contractual terms in the swaps and that there may be unfavorable changes in interest rates, the price of the index or the security underlying these transactions.
(J) Securities Sold Short. The Fund engages in sales of securities it does not own (“short sales”) as part of its investment strategy. When the Fund enters into a short sale, it must segregate the cash proceeds from the security sold short or other securities as collateral for its obligation to deliver the security upon conclusion of the sale. During the period a short position is open, depending on the nature and type of security, short positions held are reflected as liabilities and are marked to market in accordance with the valuation methodologies previously detailed (See Note 2(A)). Liabilities for securities sold short are closed out by purchasing the applicable securities for delivery to the counterparty broker. A gain, limited to the price at which the Fund sold the security short, or a loss, unlimited as to dollar amount, will be recognized upon termination of a short sale if the market price on the date the short position is closed out is less or greater, respectively, than the proceeds originally received. Dividends declared on short positions existing on the record date are recorded on the ex-dividend date. Interest on short positions held is accrued daily as interest expense while dividends declared on short positions existing on the record date are recorded on the ex-dividend date as a dividend expense on the Statement of Operations.
At June 30, 2014 the Fund’s deposit for short sales at broker was with Bank of America, Barclays Capital Inc., Citigroup Global Markets Inc., Credit Suisse and State Street Bank and Trust Company (“State Street”) (the “Brokers”). The Subadvisor (as defined in Note 3(A)) determined, based on information available at the time, that the creditworthiness of the Brokers is satisfactory. However, there is no guarantee that the Subadviser’s determination is correct or will remain accurate. The Fund’s deposit for short sales at broker was $5,961,483,341 and in excess of the Fund’s liability for securities sold short of $5,708,576,894. The Fund does not require the Brokers to maintain collateral in support of the receivable for proceeds on securities sold short.
(K) Options. The Fund may purchase and write call or put options on securities and indices and enter into related closing transactions. As a holder of a call option, the Fund has the right, but not the obligation, to
| | |
| 32 | | MainStay Marketfield Fund |
purchase a security at the exercise price during the exercise period. As the writer of a call option, the Fund has the obligation to sell the security at the exercise price during the exercise period in the event the option is exercised. As a holder of a put option, the Fund has the right, but not the obligation, to sell a security at the exercise price during the exercise period. As the writer of a put option, the Fund has the obligation to buy the underlying security at the exercise price during the exercise period in the event the option is exercised.
The premium that the Fund pays when purchasing a call option or receives when writing a call option will reflect, among other things, the market price of the security, the relationship of the exercise price to the market price of the security, the relationship of the exercise price to the volatility of the security, the length of the option period and supply and demand factors. The premium is the market value of an option at the time of the trade.
When the Fund writes (sells) an option, an amount equal to the premium received by the Fund is included in the Statement of Assets and Liabilities as an equivalent liability. The amount of the liability is subsequently marked to-market to reflect the current value of the option written.
When the Fund purchases an option, the Fund pays a non-refundable premium to the seller (writer) of the option. The Fund includes the premium paid in the Statement of Assets and Liabilities as an equivalent asset. The amount of the asset is subsequently marked to market to reflect the current value of the option purchased. Premiums paid for purchasing options which expire are treated as realized losses. Certain options may be purchased with premiums to be determined on a future date. The premiums for these options are based upon implied volatility parameters at specified terms. The risk associated with purchasing put and call options is limited to the premium paid. Premiums paid for purchasing options which are exercised or closed are added to the amounts paid or offset against the proceeds on the underlying investment transaction to determine the realized gain or loss when the underlying transaction is sold.
Certain options may expose the Fund to counterparty credit risk. The Fund will not enter into these transactions unless it owns either 1) an offsetting position in securities or other options or 2) cash and liquid assets with a value marked-to market daily, sufficient to cover potential obligations.
The Fund may purchase or write foreign currency options. Purchasing foreign currency options gives the Fund the right, but not the obligation to buy or sell the currency and will specify the amount of currency and a rate of exchange that may be exercised by a specified date. These options may be used as a short or long hedge against possible variations in foreign exchange rates or to gain exposure to foreign currencies.
During the six-month period ended June 30, 2014, the Fund had the following transactions in written options:
| | | | | | | | |
| | | Number of Contracts | | | Premium | |
Options Outstanding at December 31, 2013 | | | — | | | $ | — | |
Options—Canceled in closing transactions | | | 284,311 | | | | 14,169,769 | |
Options—Written | | | (379,091 | ) | | | (26,112,049 | ) |
Options—Expired | | | 94,780 | | | | 11,942,280 | |
Options Outstanding at June 30, 2014 | | | — | | | | — | |
(L) Futures Contracts. A futures contract is an agreement to purchase or sell a specified quantity of an underlying instrument at a specified future date and price, or to make or receive a cash payment based on the value of a financial instrument (e.g., interest rate, security, or securities index). The Fund is subject to market price risk and/or interest rate risk in the normal course of investing in these transactions. During the period the futures contract is open, changes in the value of the contract are recognized as unrealized appreciation or depreciation by marking-to-market such contract on a daily basis to reflect the market value of the contract at the end of each day’s trading. The Fund agrees to receive from or pay to the broker an amount of cash equal to the daily fluctuation in the value of the contract. Such receipts or payments are known as ‘‘variation margin.’’ When the futures contract is closed, the Fund records a realized gain or loss equal to the difference between the proceeds from (or cost of) the closing transaction and the Fund’s basis in the contract.
The use of futures contracts involves, to varying degrees, elements of market risk in excess of the amount recognized in the Statement of Assets and Liabilities. The contract or notional amounts and variation margin reflect the extent of the Fund’s involvement in open futures positions. Risks arise from the possible imperfect correlation in movements in the price of futures contracts, interest rates and the underlying hedged assets, and the possible inability of counterparties to meet the terms of their contracts. However, the Fund’s activities in futures contracts have minimal counterparty risk as they are conducted through regulated exchanges that guarantee the futures against default by the counterparty. In the event of a bankruptcy or insolvency of a futures commission merchant that holds margin on behalf of the Fund, the Fund may not be entitled to the return of all of the margin owed to the Fund, potentially resulting in a loss. The Fund may invest in futures contracts to protect against possible adverse changes in the market value of securities held and to manage risks of its assets. The Fund’s investment in futures contracts and other derivatives may increase the volatility of the Fund’s NAV and may result in a loss to the Fund.
(M) Securities Lending. In order to realize additional income, the Fund may engage in securities lending, subject to the limitations set forth in the 1940 Act and relevant guidance by the staff of the Securities and Exchange Commission. In the event the Fund does engage in securities lending, the Fund will lend through its custodian, State Street. State Street will manage the Fund’s cash collateral in accordance with the lending agreement between the Fund and State Street, and indemnify the Fund’s portfolio against counterparty risk. The loans will be collateralized by cash or securities at least equal at all times to the market value of the securities loaned. Collateral will consist of U.S. government securities, cash equivalents or irrevocable letters of credit. The Fund may bear the risk of delay in recovery of, or loss of rights in, the securities loaned should the borrower of the securities experience financial difficulty. The Fund may also record realized gain or loss on securities deemed sold due to a borrower’s inability to return securities on loan. The Fund will receive compensation for lending its securities in the form of fees or the retention of a portion of the interest on the investment of any cash received as collateral. The Fund also will continue to receive interest and dividends on the securities loaned and any gain or loss in the market price of the securities loaned that may occur during the term of the loan will be for the account of the Fund.
Although the Fund and New York Life Investments have temporarily suspended securities lending, the Fund and New York Life Investments
Notes to Financial Statements (Unaudited) (continued)
reserve the right to reinstitute lending when deemed appropriate. The Fund did not have any portfolio securities on loan as of June 30, 2014.
(N) Indemnifications. Under the Trust’s organizational documents, its officers and trustees are indemnified against certain liabilities that may arise out of performance of their duties to the Trust. Additionally, in the normal course of business, the Fund enters into contracts with third-party service providers that contain a variety of representations and warranties and which may provide general indemnifications. The Fund’s maximum exposure under these arrangements is unknown, as this would involve future claims that may be made against the Fund that have not yet occurred. Based on experience, management is of the view
that the risk of loss in connection with these potential indemnification obligations is remote. However, there can be no assurance that material liabilities related to such obligations will not arise in the future, which could adversely impact the Fund.
(O) Quantitative Disclosure of Derivative Holdings. The following tables show additional disclosures about the Fund’s derivative and hedging activities, including how such activities are accounted for and their effect on the Fund’s financial positions, performance and cash flows. These derivatives are not accounted for as hedging instruments. The amounts disclosed in the table represent the monthly average held during the six-month period ended June 30, 2014.
Fair value of derivatives instruments as of June 30, 2014:
Asset Derivatives
| | | | | | | | | | | | | | | | | | | | | | |
| | | Statement of Assets and Liabilities Location | | Credit
Contracts Risk | | | Foreign
Exchange
Contracts Risk | | | Equity
Contracts Risk | | | Interest Rate Contracts Risk | | | Total | |
Purchased Currency Options | | Investments in securities, at value | | $ | — | | | $ | 60,173,156 | | | $ | — | | | $ | — | | | $ | 60,173,156 | |
Purchased Options | | Investments in securities, at value | | | — | | | | — | | | | 16,888,013 | | | | — | | | | 16,888,013 | |
Futures Contracts | | Net Assets-Net unrealized appreciation (depreciation) on investments and futures contracts (a) | | | — | | | | — | | | | 7,617,839 | | | | | | | | 7,617,839 | |
Swap Contracts | | Premiums paid for swap contracts | | | 12,698,168 | | | | — | | | | — | | | | — | | | | 12,698,168 | |
| | | | | | | | | | | | | | | | | | | | | | |
Total Fair Value | | | | $ | 12,698,168 | | | $ | 60,173,156 | | | $ | 24,505,852 | | | $ | — | | | $ | 97,377,176 | |
| | | | | | | | | | | | | | | | | | | | | | |
Liability Derivatives
| | | | | | | | | | | | | | | | | | | | | | |
| | | Statement of Assets and Liabilities Location | | Credit
Contracts
Risk | | | Foreign
Exchange
Contracts
Risk | | | Equity
Contracts
Risk | | | Interest Rate Contracts Risk | | | Total | |
Futures Contracts | | Net Assets-Net unrealized appreciation (depreciation) on investments and futures contracts (a) | | $ | — | | | $ | — | | | $ | — | | | $ | 47,666,086 | | | $ | 47,666,086 | |
Swap Contracts | | Unrealized depreciation on swap contracts | | | 4,842,076 | | | | — | | | | — | | | | — | | | | 4,842,076 | |
| | | | | | | | | | | | | | | | | | | | | | |
Total Fair Value | | | | $ | 4,842,076 | | | $ | — | | | $ | — | | | $ | 47,666,086 | | | $ | 52,508,162 | |
| | | | | | | | | | | | | | | | | | | | | | |
| (a) | Includes cumulative appreciation (depreciation) of futures contracts as reported in the Portfolio of Investments. Only current day’s variation margin is reported within the Statement of Assets and Liabilities. |
The effect of derivative instruments on the Statement of Operations for the period ended June 30, 2014:
Realized Gain (Loss)
| | | | | | | | | | | | | | | | | | | | | | |
| | | Statement of Operations Location | | Credit
Contracts Risk | | | Foreign
Exchange
Contracts Risk | | | Equity Contracts Risk | | | Interest Rate Contracts Risk | | | Total | |
Purchased Currency Options | | Net realized gain (loss) on investments/security transactions | | $ | — | | | $ | (46,930,256 | ) | | $ | — | | | $ | — | | | $ | (46,930,256 | ) |
Purchased Options | | Net realized gain (loss) on investments/security transactions | | | — | | | | — | | | | (182,601,608 | ) | | | (56,708,320 | ) | | | (239,309,928 | ) |
Written Options | | Net realized gain (loss) on written option transactions | | | — | | | | — | | | | 11,326,570 | | | | — | | | | 11,326,570 | |
Futures Contracts | | Net realized gain (loss) on futures transactions | | | — | | | | — | | | | (43,049,946 | ) | | | (170,601,452 | ) | | | (213,651,398 | ) |
Forward Contracts | | Net realized gain (loss) on foreign currency transactions | | | — | | | | (35,445 | ) | | | — | | | | — | | | | (35,445 | ) |
Swap Contracts | | Net realized gain (loss) on swap transactions | | | (27,933,310 | ) | | | — | | | | — | | | | — | | | | (27,933,310 | ) |
| | | | | | | | | | | | | | | | | | | | | | |
Total Realized Gain (Loss) | | | | $ | (27,933,310 | ) | | $ | (46,965,701 | ) | | $ | (214,324,984 | ) | | $ | (227,309,772 | ) | | $ | (516,533,767 | ) |
| | | | | | | | | | | | | | | | | | | | | | |
| | |
| 34 | | MainStay Marketfield Fund |
Change in Unrealized Appreciation (Depreciation)
| | | | | | | | | | | | | | | | | | | | | | |
| | | Statement of
Operations Location | | Credit Contracts Risk | | | Foreign Exchange
Contracts Risk | | | Equity
Contracts Risk | | | Interest Rate Contracts Risk | | | Total | |
Purchased Currency Options | | Net change in unrealized appreciation (depreciation) on investments | | $ | — | | | $ | 8,709,996 | | | $ | — | | | $ | — | | | $ | 8,709,996 | |
Purchased Options | | Net change in unrealized appreciation (depreciation) on investments | | | — | | | | — | | | | 6,412,039 | | | | (1,662,520 | ) | | | 4,749,519 | |
Futures Contracts | | Net change in unrealized appreciation (depreciation) on futures contracts | | | — | | | | — | | | | 10,197,189 | | | | (76,341,568 | ) | | | (66,144,379 | ) |
Swap Contracts | | Net change in unrealized appreciation (depreciation) on swap contracts | | | (4,230,702 | ) | | | — | | | | — | | | | — | | | | (4,230,702 | ) |
| | | | | | | | | | | | | | | | | | | | | | |
Total Change in Unrealized Appreciation (Depreciation) | | $ | (4,230,702 | ) | | $ | 8,709,996 | | | $ | 16,609,228 | | | $ | (78,004,088 | ) | | $ | (56,915,566 | ) |
| | | | | | | | | | | | | | | | | | | | | | |
Number of Contracts, Notional Amounts or Shares/Units
| | | | | | | | | | | | | | | | | | | | |
| | | Credit Contracts Risk | | | Foreign
Exchange
Contracts
Risk | | | Equity
Contracts
Risk | | | Interest
Rate
Contracts
Risk | | | Total | |
Purchased Currency Options (Average notional amount) | | $ | — | | | $ | 5,411,453,548 | | | $ | — | | | $ | — | | | $ | 5,411,453,548 | |
Purchased Options (Average notional amount) | | $ | — | | | $ | — | | | $ | 734,496 | | | $ | 30,000 | | | $ | 764,496 | |
Swap Contracts (Average notional amount) | | $ | 788,823,125 | | | $ | — | | | $ | — | | | $ | — | | | $ | 788,823,125 | |
Written Options (Average notional amount) | | $ | — | | | $ | — | | | $ | (113,739 | ) | | $ | — | | | $ | (113,739 | ) |
Futures Contracts Long (Average number of contracts) | | | — | | | | — | | | | 3,272 | | | | — | | | | 3,272 | |
Futures Contracts Short (Average number of contracts) | | | — | | | | — | | | | (7,991 | ) | | | (14,942 | ) | | | (22,933 | ) |
| | | | | | | | |
The following table presents the Portfolio’s derivative assets by counterparty net of amounts available for offset under a master netting agreement, or similar agreement, and net of the related collateral received by the Portfolio as of June 30, 2014.
| | | | | | | | | | | | | | | | |
Counterparty | | Gross Assets
in Statement
of Assets
and Liabilities | | | Derivative
assets/
(liabilities)
available
for offset | | | Collateral
Received | | | Net Amount
of Derivative
Assets* | |
Bank of America N.A. | | $ | 16,888,013 | | | $ | — | | | $ | — | | | $ | 16,888,013 | |
Citibank N.A. | | | 60,173,156 | | | | — | | | | — | | | | 60,173,156 | |
| | | | | | | | | | | | | | | | |
| | $ | 77,061,169 | | | $ | — | | | $ | — | | | $ | 77,061,169 | |
| | | | | | | | | | | | | | | | |
| * | Represents the net amount receivable from the counterparty in the event of default. |
Note 3–Fees and Related Party Transactions
(A) Manager and Subadvisor. New York Life Investments, a registered investment adviser and an indirect, wholly-owned subsidiary of New York Life Insurance Company (“New York Life”), serves as the Fund’s Manager, pursuant to an Amended and Restated Management Agreement (“Management Agreement”). The Manager provides offices, conducts clerical, recordkeeping and bookkeeping services, and keeps most of the financial and accounting records required to be maintained by the Fund. Except for the portion of salaries and expenses that are the responsibility of the Fund, the Manager pays the salaries and expenses of all personnel affiliated with the Fund and certain operational expenses of the Fund. The Fund reimburses New York Life Investments in an amount equal to a portion of the compensation of the Chief Compliance Officer (“CCO”) of the Fund. Marketfield Asset Management, LLC (“MAM” or “Subadvisor”), serves as Subadvisor to the Fund and is
responsible for the day-to-day portfolio management of the Fund. Pursuant to the terms of a Subadvisory Agreement (“Subadvisory Agreement”) between New York Life Investments and MAM, New York Life Investments pays for the services of the Subadvisor.
The Fund pays the Manager a monthly fee for services performed and facilities furnished at an annual rate of the Fund’s average daily net assets as follows: 1.40% up to $7.5 billion; 1.38% from $7.5 billion to $15 billion; and 1.36% in excess of $15 billion.
New York Life Investments has voluntarily agreed to waive a portion of its management fee so that it does not exceed 1.34% in excess of average net assets of $22.5 billion. This voluntary waiver may be discontinued at any time. The effective management fee rate (exclusive of any applicable waivers/reimbursements) was 1.39% for the six-month period ended June 30, 2014.
Notes to Financial Statements (Unaudited) (continued)
On May 9, 2014, MAM voluntarily reimbursed the Fund $1,282,342 for a trading error which occurred during the reporting period. The effect of the loss incurred and the reimbursement by MAM of such amounts had no significant impact on total return.
New York Life Investments entered into a written expense limitation agreement under which it has agreed to reimburse expenses of Class I shares so that the total ordinary operating expenses for Class I shares do not exceed 1.56% of average daily net assets. This agreement will remain in effect until February 28, 2015 and shall renew automatically for one year terms unless New York Life Investments provides written notice of termination prior to the start of the next term or upon approval of the Board unless extended by New York Life Investments and approved by the Board in connection with its review of the Fund’s investment advisory agreement. Based on its review, the Board may agree to maintain, modify or terminate the agreement. Total ordinary operating expenses excludes taxes, interest, litigation, extraordinary expenses, brokerage and other transaction expenses relating to the purchase or sale of portfolio investments and the fees and expenses of any other funds in which the Fund invests.
For the six-month period ended June 30, 2014, New York Life Investments earned fees from the Fund in the amount of $141,786,369.
State Street, 1 Lincoln Street, Boston, Massachusetts 02111, provides sub-administration and sub-accounting services to the Fund pursuant to an agreement with New York Life Investments. These services include calculating the daily NAVs of the Fund, maintaining the general ledger and sub-ledger accounts for the calculation of the Fund’s respective NAVs, and assisting New York Life Investments in conducting various aspects of the Fund’s administrative operations. For providing these services to the Fund, State Street is compensated by New York Life Investments.
(B) Distribution, Service and Shareholder Service Fees. The Trust, on behalf of the Fund, has entered into a distribution agreement with NYLIFE Distributors LLC (the ‘‘Distributor’’), an indirect, wholly-owned subsidiary of New York Life. The Fund has adopted distribution plans (the ‘‘Plans’’) in accordance with the provisions of Rule 12b-1 under the 1940 Act.
Pursuant to the Class A, Investor Class and Class R2 Plans, the Distributor receives a monthly distribution fee from the Class A, Investor Class, Class C and Class R2 shares at an annual rate of 0.25% of the average daily net assets of the Class A, Investor Class, Class C and Class R2 shares for distribution and/or service activities as designated by the Distributor. Pursuant to the Class C Plan, Class C shares pay the Distributor a monthly distribution fee at an annual rate of 0.75% of the average daily net assets of the Class C shares, along with a service fee at an annual rate of 0.25% of the average daily net assets of the Class C shares, for a total 12b-1 fee of 1.00%. Class I, Class R6 and Class P shares are not subject to a distribution and/or service fee.
The Plans provide that the distribution and service fees are payable to the Distributor regardless of the amounts actually expended by the Distributor for distribution of the Fund’s shares and service activities.
In accordance with the Shareholder Services Plan for the Class R2 shares, the Manager has agreed to provide, through its affiliates or independent third parties, various shareholder and administrative
support services to shareholders of the Class R2 shares. For its services, the Manager is entitled to a Shareholder Service Fee accrued daily and paid monthly at an annual rate of 0.10% of the average daily net assets of the Class R2 shares. This is in addition to any fees paid under a distribution plan, where applicable.
Shareholder Service Fees incurred by the Fund for the six-month period ended June 30, 2014, were as follows:
(C) Sales Charges. The Fund was advised by the Distributor that the amount of sales charges retained on sales of Class A and Investor Class shares were $514,476 and $30,415, respectively, for the six-month period ended June 30, 2014. The Fund was also advised that the Distributor retained CDSCs on redemptions of Class A and Class C shares of $61,227 and $359,150, respectively, for the six-month period ended June 30, 2014.
(D) Transfer, Dividend Disbursing and Shareholder Servicing Agent. NYLIM Service Company LLC, an affiliate of New York Life Investments, is the Fund’s transfer, dividend disbursing and shareholder servicing agent pursuant to an agreement between NYLIM Service Company LLC and the Trust. NYLIM Service Company LLC has entered into an agreement with Boston Financial Data Services, Inc. (“BFDS”) pursuant to which BFDS performs certain transfer agent services on behalf of NYLIM Service Company LLC. Transfer agent expenses incurred by the Fund for the six-month period ended June 30, 2014, were as follows:
| | | | |
Class A | | $ | 885,088 | |
Investor Class | | | 6,622 | |
Class C | | | 765,747 | |
Class I | | | 7,696,566 | |
Class R2 | | | 10,430 | |
Class P | | | 112,865 | |
Note 4–Federal Income Tax
As of December 31, 2013, for federal income tax purposes, capital loss carryforwards of $175,009,126 were available as shown in the table below, to the extent provided by the regulations to offset future realized gains of the Fund through the years indicated. To the extent that these capital loss carryforwards are used to offset future capital gains, it is probable that the capital gains so offset will not be distributed to shareholders. No capital gain distributions shall be made until any capital loss carryforwards have been fully utilized or expired.
| | | | | | | | |
Capital Loss Available Through | | Short-Term Capital
Loss Amount (000’s) | | | Long-Term Capital
Loss Amount (000’s) | |
| Unlimited | | $ | 175,009 | | | $ | — | |
The tax character of distributions paid during the year ended December 31, 2013 shown in the Statements of Changes in Net Assets was as follows:
| | | | |
| | | 2013 | |
Distributions paid from:
Ordinary Income | | $ | 2,109,380 | |
| | |
| 36 | | MainStay Marketfield Fund |
Note 5–Custodian
State Street is the custodian of cash and securities held by the Fund. Custodial fees are charged to the Fund based on the Fund’s net assets and/or the market value of securities held by the Fund and the number of certain cash transactions incurred by the Fund.
Note 6–Line of Credit
The Fund and certain affiliated funds, maintain a line of credit with a syndicate of banks in order to secure a source of funds for temporary purposes to meet unanticipated or excessive redemption requests.
Effective August 5, 2014, under a second amended and restated credit agreement (the “Credit Agreement”), the aggregate commitment amount is $600,000,000 with an optional maximum amount of $700,000,000. The commitment fee is an annual rate of 0.08% of the average commitment amount payable quarterly, regardless of usage, to Bank of New York Mellon, who serves as the agent to the syndicate. The commitment fee is allocated among the Fund and affiliated funds based upon net assets and other factors. Interest on any revolving credit loan is charged based upon the Federal Funds Advances rate or the one month London InterBank Offered Rate, whichever is higher. The Credit Agreement expires on August 4, 2015, although the Fund, certain affiliated funds and the syndicate of banks may renew the Credit Agreement for an additional year on the same or different terms. Prior to August 4, 2014, the aggregate commitment amount was $300,000,000 with an optional maximum amount of $400,000,000. There were no borrowings made or outstanding with respect to the Fund under the Credit Agreement during the six-month period ended June 30, 2014.
Note 7–Purchases and Sales of Securities (in 000’s)
During the six-month period ended June 30, 2014, purchases and sales of securities, other than short-term securities, were $9,233,587 and $7,822,299, respectively.
Note 8–Capital Share Transactions
| | | | | | | | |
Class A | | Shares | | | Amount | |
Six-month period ended June 30, 2014: | | | | | |
Shares sold | | | 34,782,868 | | | $ | 633,865,339 | |
Shares redeemed | | | (22,448,343 | ) | | | (402,803,247 | ) |
| | | | |
Net increase (decrease) | | | 12,334,525 | | | $ | 231,062,092 | |
| | | | |
Year ended December 31, 2013: | | | | | | | | |
Shares sold | | | 94,033,138 | | | $ | 1,634,199,101 | |
Shares issued to shareholders in reinvestment of dividends and distributions | | | 8,462 | | | | 152,319 | |
Shares redeemed | | | (9,733,884 | ) | | | (172,144,984 | ) |
| | | | |
Net increase (decrease) in shares outstanding before conversion | | | 84,307,716 | | | | 1,462,206,436 | |
Shares converted into Class A (See Note 1) | | | 80,051 | | | | 1,357,055 | |
Shares converted from Class A (See Note 1) | | | (4,288 | ) | | | (71,523 | ) |
| | | | |
Net increase (decrease) | | | 84,383,479 | | | $ | 1,463,491,968 | |
| | | | |
| | | | | | | | |
Investor Class | | Shares | | | Amount | |
Six-month period ended June 30, 2014: | | | | | |
Shares sold | | | 473,677 | | | $ | 8,611,671 | |
Shares redeemed | | | (198,770 | ) | | | (3,569,041 | ) |
| | | | |
Net increase (decrease) | | | 274,907 | | | $ | 5,042,630 | |
| | | | |
Year ended December 31, 2013: | | | | | | | | |
Shares sold | | | 805,375 | | | $ | 13,974,787 | |
Shares issued to shareholders in reinvestment of dividends and distributions | | | 73 | | | | 1,310 | |
Shares redeemed | | | (123,801 | ) | | | (2,230,380 | ) |
| | | | |
Net increase (decrease) in shares outstanding before conversion | | | 681,647 | | | | 11,745,717 | |
Shares converted into Investor Class (See Note 1) | | | 4,288 | | | | 71,523 | |
Shares converted from Investor Class (See Note 1) | | | (80,051 | ) | | | (1,357,055 | ) |
| | | | |
Net increase (decrease) | | | 605,884 | | | $ | 10,460,185 | |
| | | | |
| | |
| | | | | | | | |
Class C | | Shares | | | Amount | |
Six-month period ended June 30, 2014: | | | | | |
Shares sold | | | 24,593,090 | | | $ | 443,932,706 | |
Shares redeemed | | | (8,814,892 | ) | | | (155,987,251 | ) |
| | | | |
Net increase (decrease) | | | 15,778,198 | | | $ | 287,945,455 | |
| | | | |
Year ended December 31, 2013: | | | | | | | | |
Shares sold | | | 81,255,464 | | | $ | 1,404,630,213 | |
Shares issued to shareholders in reinvestment of dividends and distributions | | | 6,964 | | | | 124,245 | |
Shares redeemed | | | (2,671,276 | ) | | | (46,850,664 | ) |
| | | | |
Net increase (decrease) | | | 78,591,152 | | | $ | 1,357,903,794 | |
| | | | |
| | |
| | | | | | | | |
Class I | | Shares | | | Amount | |
Six-month period ended June 30, 2014: | | | | | |
Shares sold | | | 222,987,674 | | | $ | 4,071,203,004 | |
Shares redeemed | | | (181,835,664 | ) | | | (3,269,938,314 | ) |
| | | | |
Net increase (decrease) | | | 41,152,010 | | | $ | 801,264,690 | |
| | | | |
Year ended December 31, 2013: | | | | | | | | |
Shares sold | | | 689,748,082 | | | $ | 11,991,805,245 | |
Shares issued to shareholders in reinvestment of dividends and distributions | | | 74,287 | | | | 1,340,127 | |
Shares redeemed | | | (94,500,234 | ) | | | (1,653,850,170 | ) |
| | | | |
Net increase (decrease) | | | 595,322,135 | | | $ | 10,339,295,202 | |
| | | | |
| | |
| | | | | | | | |
Class R2 | | Shares | | | Amount | |
Six-month period ended June 30, 2014: | | | | | |
Shares sold | | | 541,633 | | | $ | 9,856,624 | |
Shares redeemed | | | (112,518 | ) | | | (2,004,946 | ) |
| | | | |
Net increase (decrease) | | | 429,115 | | | $ | 7,851,678 | |
| | | | |
Year ended December 31, 2013: | | | | | | | | |
Shares sold | | | 953,820 | | | $ | 16,807,376 | |
Shares issued to shareholders in reinvestment of dividends and distributions | | | 55 | | | | 992 | |
Shares redeemed | | | (25,023 | ) | | | (449,326 | ) |
| | | | |
Net increase (decrease) | | | 928,852 | | | $ | 16,359,042 | |
| | | | |
Notes to Financial Statements (Unaudited) (continued)
| | | | | | | | |
Class R6 | | Shares | | | Amount | |
Six-month period ended June 30, 2014: | | | | | |
Shares sold | | | 518,627 | | | $ | 9,581,637 | |
Shares redeemed | | | (195,527 | ) | | | (3,485,165 | ) |
| | | | |
Net increase (decrease) | | | 323,100 | | | $ | 6,096,472 | |
| | | | |
Period ended December 31, 2013 (a): | | | | | | | | |
Shares sold | | | 121,398 | | | $ | 2,187,045 | |
Shares issued to shareholders in reinvestment of dividends and distributions | | | 14 | | | | 256 | |
Shares redeemed | | | (15,776 | ) | | | (285,728 | ) |
| | | | |
Net increase (decrease) | | | 105,636 | | | $ | 1,901,573 | |
| | | | |
| | |
| | | | | | | | |
Class P | | Shares | | | Amount | |
Six-month period ended June 30, 2014: | | | | | |
Shares sold | | | 5,983,840 | | | $ | 109,237,362 | |
Shares redeemed | | | (2,359,221 | ) | | | (42,393,887 | ) |
| | | | |
Net increase (decrease) | | | 3,624,619 | | | $ | 66,843,475 | |
| | | | |
Period ended December 31, 2013 (a): | | | | | | | | |
Shares sold | | | 11,065,479 | | | $ | 195,602,404 | |
Shares issued to shareholders in reinvestment of dividends and distributions | | | 1,142 | | | | 20,583 | |
Shares redeemed | | | (411,832 | ) | | | (7,437,082 | ) |
| | | | |
Net increase (decrease) | | | 10,654,789 | | | $ | 188,185,905 | |
| | | | |
| (a) | Class R6 shares were first offered on June 17, 2013 and Class P shares were first offered on May 31, 2013. |
Note 9–Subsequent Events
In connection with the preparation of the financial statements of the Fund as of and for the six-month period ended June 30, 2014, events and transactions subsequent to June 30, 2014, through the date the financial statements were issued have been evaluated by the Fund’s management for possible adjustment and/or disclosure. No subsequent events requiring financial statement adjustment or disclosure have been identified.
| | |
| 38 | | MainStay Marketfield Fund |
Proxy Voting Policies and Procedures and Proxy Voting Record
A description of the policies and procedures that New York Life Investments uses to vote proxies related to the Fund’s securities is available without charge, upon request, (i) by visiting the Fund’s website at mainstayinvestments.com; and (ii) on the Securities and Exchange Commission’s (“SEC”) website at www.sec.gov.
The Fund is required to file with the SEC its proxy voting record for the 12-month period ending June 30 on Form N-PX. The Fund’s most recent Form N-PX is available free of charge upon request by calling 800-MAINSTAY (624-6782); visiting the Fund’s website at mainstayinvestments.com; or on the SEC’s website at www.sec.gov.
Shareholder Reports and Quarterly Portfolio Disclosure
The Fund is required to file its complete schedule of portfolio holdings with the SEC for its first and third fiscal quarters on Form N-Q. The Fund’s Form N-Q is available without charge, on the SEC’s website at www.sec.gov or by calling MainStay Investments at 800-MAINSTAY (624-6782). You also can obtain and review copies of Form N-Q by visiting the SEC’s Public Reference Room in Washington, DC (information on the operation of the Public Reference Room may be obtained by calling 1-800-SEC-0330).
This page intentionally left blank
This page intentionally left blank
This page intentionally left blank
MainStay Funds
MainStay offers a wide range of Funds for virtually any investment need. The full array of MainStay open-end offerings is listed here, with information about the manager, subadvisors, legal counsel and independent registered public accounting firms.
Equity
U.S. Equity Funds
MainStay Common Stock Fund
MainStay Cornerstone Growth Fund
MainStay Cushing MLP Premier Fund
MainStay Cushing Renaissance Advantage Fund
MainStay Cushing Royalty Energy Income Fund
MainStay Epoch U.S. All Cap Fund
MainStay Epoch U.S. Equity Yield Fund
MainStay ICAP Equity Fund
MainStay ICAP Select Equity Fund
MainStay Large Cap Growth Fund
MainStay MAP Fund
MainStay S&P 500 Index Fund
MainStay U.S. Equity Opportunities Fund
MainStay U.S. Small Cap Fund
International/Global Equity Funds
MainStay Emerging Markets Opportunities Fund
MainStay Epoch Global Choice Fund
MainStay Epoch Global Equity Yield Fund
MainStay Epoch International Small Cap Fund
MainStay ICAP Global Fund
MainStay ICAP International Fund
MainStay International Equity Fund
MainStay International Opportunities Fund
Income
Taxable Bond Funds
MainStay Floating Rate Fund
MainStay Global High Income Fund
MainStay Government Fund
MainStay High Yield Corporate Bond Fund
MainStay High Yield Opportunities Fund
MainStay Indexed Bond Fund
MainStay Short Duration High Yield Fund
MainStay Short Term Bond Fund
MainStay Total Return Bond Fund
MainStay Unconstrained Bond Fund
Municipal Bond Funds
MainStay California Tax Free Opportunities Fund1
MainStay High Yield Municipal Bond Fund
MainStay New York Tax Free Opportunities Fund2
MainStay Tax Free Bond Fund
Money Market Fund
MainStay Money Market Fund
Mixed Asset
MainStay Balanced Fund
MainStay Convertible Fund
MainStay Income Builder Fund
MainStay Marketfield Fund
Asset Allocation/Target Date
MainStay Conservative Allocation Fund
MainStay Growth Allocation Fund
MainStay Moderate Allocation Fund
MainStay Moderate Growth Allocation Fund
MainStay Retirement 2010 Fund
MainStay Retirement 2020 Fund
MainStay Retirement 2030 Fund
MainStay Retirement 2040 Fund
MainStay Retirement 2050 Fund
Manager
New York Life Investment Management LLC
New York, New York
Subadvisors
Cornerstone Capital Management Holdings LLC3
New York, New York
Cornerstone Capital Management LLC3
Bloomington, Minnesota
Cushing Asset Management, LP
Dallas, Texas
Epoch Investment Partners, Inc.
New York, New York
Institutional Capital LLC3
Chicago, Illinois
MacKay Shields LLC3
New York, New York
Marketfield Asset Management LLC
New York, New York
Markston International LLC
White Plains, New York
NYL Investors LLC3
New York, New York
Winslow Capital Management LLC
Minneapolis, Minnesota
Legal Counsel
Dechert LLP
Independent Registered Public Accounting Firms
KPMG LLP4
PricewaterhouseCoopers LLP5
1. This Fund is only registered for sale in AZ, CA, NV, OR, UT, and WA.
2. This Fund is only registered for sale in CT, DE, FL, MA, NJ, NY, and VT.
3. An affiliate of New York Life Investment Management LLC.
4. For all Funds listed above except MainStay Marketfield Fund.
5. For MainStay Marketfield Fund only.
Not part of the Semiannual Report
For more information
800-MAINSTAY (624-6782)
mainstayinvestments.com
The MainStay Funds® are managed by New York Life Investment Management LLC and distributed through NYLIFE Distributors LLC, 169 Lackawanna Avenue, Parsippany, NJ 07054, a wholly owned subsidiary of New York Life Insurance Company. NYLIFE Distributors is a Member FINRA/SIPC.
MainStay Investments® is a registered service mark and name under which New York Life Investment Management LLC does business. MainStay Investments, an indirect subsidiary of New York Life Insurance Company, New York, NY 10010, provides investment advisory products and services.
© 2014 by NYLIFE Distributors LLC. All rights reserved.
| | | | | | | | |
| Not FDIC/NCUA Insured | | Not a Deposit | | May Lose Value | | No Bank Guarantee | | Not Insured by Any Government Agency |
| | |
| 1613480 MS234-14 | | MSMK10-08/14 NL056 |
Not applicable.
| Item 3. | Audit Committee Financial Expert. |
Not applicable.
| Item 4. | Principal Accountant Fees and Services. |
Not applicable.
| Item 5. | Audit Committee of Listed Registrants |
Not applicable.
| Item 6. | Schedule of Investments |
The Schedule of Investments is included as part of Item 1 of this report.
| Item 7. | Disclosure of Proxy Voting Policies and Procedures for Closed-End Management Investment Companies. |
Not applicable.
| Item 8. | Portfolio Managers of Closed-End Management Investment Companies. |
Not applicable.
| Item 9. | Purchases of Equity Securities by Closed-End Management Investment Company and Affiliated Purchasers. |
Not Applicable.
| Item 10. | Submission of Matters to a Vote of Security Holders. |
Since the Registrant’s last response to this Item, there have been no material changes to the procedures by which shareholders may recommend nominees to the Registrant’s Board of Trustees.
| Item 11. | Controls and Procedures. |
| (a) | Based on an evaluation of the Registrant’s Disclosure Controls and Procedures (as defined in Rule 30a-3(c) under the Investment Company Act of 1940) (the “Disclosure Controls”), as of a date within 90 days prior to the filing date (the “Filing Date”) of this Form N-CSR (the “Report”), the Registrant’s principal executive officer and principal financial officer have concluded that the Disclosure Controls are reasonably designed to ensure that information required to be disclosed by the Registrant in the Report is recorded, processed, summarized and reported by the Filing Date, including ensuring that information required to be disclosed in the Report is accumulated and communicated to the Registrant’s management, including the Registrant’s principal executive officer and principal financial officer, as appropriate to allow timely decisions regarding required disclosure. |
| (b) | There were no changes in the Registrant’s internal control over financial reporting (as defined in Rule 30a-3(d)) under the Investment Company Act of 1940 that occurred during the second fiscal quarter of the period covered by this report that has materially affected, or is reasonably likely to materially affect, the Registrant’s internal control over financial reporting. |
Item 12. Exhibits.
| (a) | Certifications of principal executive officer and principal financial officer as required by Rule 30a-2 under the Investment Company Act of 1940. |
| (b) | Certifications of principal executive officer and principal financial officer as required by Section 906 of the Sarbanes-Oxley Act of 2002. |
SIGNATURES
Pursuant to the requirements of the Securities Exchange Act of 1934 and the Investment Company Act of 1940, the Registrant has duly caused this Report to be signed on its behalf by the undersigned, thereunto duly authorized.
MAINSTAY FUNDS TRUST
| | |
| By: | | /s/ Stephen P. Fisher |
| | Stephen P. Fisher President and Principal Executive Officer |
| |
| Date: | | September 5, 2014 |
Pursuant to the requirements of the Securities Exchange Act of 1934 and the Investment Company Act of 1940, this Report has been signed below by the following persons on behalf of the Registrant and in the capacities and on the dates indicated.
| | |
| By: | | /s/ Stephen P. Fisher |
| | Stephen P. Fisher President and Principal Executive Officer |
| |
| Date: | | September 5, 2014 |
| |
| By: | | /s/ Jack R. Benintende |
| | Jack R. Benintende Treasurer and Principal Financial and Accounting Officer |
| |
| Date: | | September 5, 2014 |
EXHIBIT INDEX
| (a) | Certifications of principal executive officer and principal financial officer as required by Rule 30a-2 under the Investment Company Act of 1940. |
| (b) | Certification of principal executive officer and principal financial officer as required by Section 906 of the Sarbanes-Oxley Act of 2002. |