| | | | |
| | | | OMB APPROVAL |
| | | | OMB Number: 3235-0570 |
| | | | Expires: January 31, 2017 |
| | | | Estimated average burden hours |
| | | | per response. . . ..20.6 |
UNITED STATES
SECURITIES AND EXCHANGE COMMISSION
Washington, D.C. 20549
Form N-CSR
CERTIFIED SHAREHOLDER REPORT OF REGISTERED MANAGEMENT
INVESTMENT COMPANIES
Investment Company Act File Number 811-22321
MAINSTAY FUNDS TRUST
(Exact name of Registrant as specified in charter)
51 Madison Avenue, New York, NY 10010
(Address of principal executive offices) (Zip code)
J. Kevin Gao, Esq.
169 Lackawanna Avenue
Parsippany, New Jersey 07054
(Name and address of agent for service)
Registrant’s telephone number, including area code: (212) 576-7000
Date of fiscal year end: November 30
(MainStay Cushing Funds only)
Date of reporting period: May 31, 2015
FORM N-CSR
The information presented in this Form N-CSR relates solely to
MainStay Cushing MLP Premier Fund, MainStay Cushing Renaissance Advantage Fund and MainStay
Cushing Royalty Energy Fund, series of the Registrant.
Item 1. Reports to Stockholders.
MainStay Cushing® Funds
Message from the President, Cushing® Asset Management, LP, Semiannual Report Commentary and Semiannual Report
Unaudited | May 31, 2015

MainStay Cushing® MLP Premier Fund
MainStay Cushing® Renaissance Advantage Fund
MainStay Cushing® Royalty Energy Income Fund

This page intentionally left blank
Message from the President
As you may know, the energy sector as a whole was volatile during the six months ended May 31, 2015. Oil prices dropped precipitously at the end of 2014, recovering somewhat in the early months of 2015.
As investors in MainStay Cushing Funds, you can be assured that the portfolio managers of your Fund(s) used time-tested investment principles and risk-management techniques to help weather this market volatility.
The Cushing Asset Management, LP, Semiannual Report Commentary that follows provides detailed insights into the progress of upstream, midstream and downstream energy companies and partnerships. We hope this commentary will help you gain a better understanding of the dynamics of the energy markets during the reporting period.
The enclosed semiannual report explains the market forces, investment decisions and specific securities that affected your MainStay Cushing Fund(s) during the six months ended May 31, 2015.
We encourage you to read the commentary and the semiannual report carefully. The more you know about your investments, the better you can determine how they fit with your long-range financial goals.
At MainStay, it has been our pleasure to assist you during the reporting period, and we look forward to serving your investment needs for many years to come.
Sincerely,

Stephen P. Fisher
President
The opinions expressed are as of the date of this report and are subject to change. There is no guarantee that any forecast made will come to pass. This material does not constitute investment advice and is not intended as an endorsement of any specific investment. Past performance is no guarantee of future results.
Not part of the Semiannual Report
Cushing Asset Management, LP, Semiannual Report Commentary
Midstream MLPs
The six-month reporting period ended May 31, 2015, was certainly challenging for energy-related equities. The most pertinent topic was the weakness and volatility in crude oil prices. Nonetheless, as global demand for crude oil has improved, we believe the energy industry was successfully working through the corrective part of this cycle at the end of the reporting period. Consequently, crude oil prices appeared to be forming a bottom. From our viewpoint, we believe exploration and production (“E&P”) company management teams have reacted much quicker and more severely to the precipitous drop in commodities than they have historically. According to IHS Herold, E&P companies reduced their capital spending guidance for 2015 by 37% on average.1 We believe it will not take long for the combination of spending cuts (i.e. lower growth capex and fewer rigs deployed) and steep production declines associated with shale reserves to impact oil supplies. In light of the 60% decline in the U.S. oil directed rig count since October 2014, the U.S. Energy Information Administration revised its energy forecast in June and stated that it expects monthly U.S. production to generally decline from June 2015 through early 2016 before growth resumes.2 We believe this is a testament to the old adage: the cure for low prices is low prices.
In our view, both midstream master limited partnership (“MLP”) management teams and investors have appropriately recalibrated expectations using realistic commodity price assumptions (i.e. approximately $50/bbl crude). We also think investors have become more comfortable in this environment, assuming the recovery plays out as expected (the consensus view is that there will be a modest supply-driven price recovery closer to year-end—but with prices ultimately settling much lower than pre-crash ranges). To be clear, we believe that while there are areas of weakness such as certain natural gas gatherers & processors facing currently very depressed natural gas liquids prices and declining volumes, we also believe that the broad trend for the overall midstream group remains stable. Overall, there appears to us to be a modest reduction of future expected growth as volumes and projects are in many cases simply “pushed to the right,” not an absolute reduction of current cash flows.
Importantly, there are parts of the midstream energy industry that may benefit in a lower crude oil price environment. Refined products pipelines systems have traditionally done very well in a supply-driven low crude price environment as consumers are incentivized to purchase more fuel. Crude oil storage and terminalling benefits as the contango forward curve incentivizes producers and marketers to fully utilize all available storage. Natural gas infrastructure continued to benefit from robust investment, primarily to provide greater Marcellus/Utica production to new markets in the Northeast and Southeast (e.g. gas
powered utility demand) and South for liquified natural gas (“LNG”) exports. Retail propane and retail fuel margins may also benefit as the underlying commodity price drop (cost of goods) is slower to be reflected in the retail price (sales price).
We are constructive on the midstream MLP space, but we recognize there will likely be continued volatility. Our current view is that crude oil pricing and energy equities in general are in the process of bottoming. There are select areas of production that are less economical to produce and could ultimately result in a decline in the flow of existing volumes, but we remain confident that North American shale basins will be developed over time, albeit at a reduced pace than previously projected. While expected volume growth, cap-ex spending, and distribution growth have generally moderated for at least 2015, we believe the midstream business model for the broader group (largely based on fee-based, multi-year contracts) is proving again to be resilient, and we do not expect to see distribution cuts for the vast majority of midstream MLPs. Earnings results for the recent fourth quarter 2014 and first quarter 2015 periods provided few surprises and were generally in line with expectations. However, there has been considerable dispersion of returns even within MLP subsectors, creating opportunities for active stock selection. Along with declining—but still positive—fund flows into MLP products, overall valuations have pulled back to longer-term historical levels. With the reset of valuation levels lower and the double digit (yield plus growth) return potential, we believe the opportunity for patient, long-term investors is compelling.
Upstream Sector—Upstream MLPs, E&P, Integrated Oil & Gas and Royalty Trusts
Despite the modest recovery in crude oil prices, the stock prices of the upstream energy space continued to be relatively lethargic. While crude oil prices have increased 13.2% as of May 31, 2015, the Energy Select Sector Index (“IXE”) has declined 1.5%. It is worth noting that during the second half of 2014, as crude oil prices declined by nearly 50%, IXE only declined by approximately 21%. In our view, the lack of recovery in upstream energy equities relative to the moderate recovery in the underlying commodity price may be explained in part by continued investor uncertainty surrounding commodity prices and near-term global supply/demand dynamics. We believe that the broad energy sector has the potential to see meaningful upside as investors gain more clarity on commodity price levels and the impact those levels have on the upstream energy sector companies’ ability to generate cash flow.
The upstream MLP subsector has experienced increased consolidation through merger and acquistion (“M&A”) over the past several months with the announcement in April 2015, from Vanguard Resources (NASDAQ: VNR) that it plans to acquire LRR Energy (NYSE: LRE) as well as Eagle Rock Energy Partners
| 1. | “Outlook for Upstream Spending for U.S. E&Ps Continues to Drop.” IHS Herold, 3/9/15. |
| 2. | “Short-Term Energy Outlook (STEO).” U.S. Energy Information Administration, 6/15. |
|
| Not part of the Semiannual Report |
(NASDAQ: EROC), which Vanguard Resources announced in May 2015. Prior to the dramatic fall in crude oil prices, deal flow and acquisition activity by upstream MLPs continued to be robust. We believe deal flow and acquisitions by upstream MLPs may continue, but it will likely take time to recover to the pace we witnessed over the last several quarters. We expect that it will take time for buyers and sellers of oil and natural gas assets to adjust to this new crude oil price environment and the subsequent changes in their cost of capital, liquidity and the conditions of their balance sheets.
Throughout the first several months of 2015, MainStay Cushing Royalty Energy Income Fund continued to increase exposure to oil & gas E&P, as well as integrated oil & gas sectors and reduce exposure to the upstream MLP sector. This shift in allocation was partially driven by the reduced market cap and investable universe within the upstream MLP subsector, as well as the E&P and integrated oil & gas sectors demonstrating a historically higher correlation to commodity prices after a significant pullback in crude oil prices, similar to that which we experienced over the past several months. We remain focused on the current commodity price environment and its impact on the broad upstream sector, upstream MLPs and Energy Trusts, and anticipate deploying capital opportunistically as the market gains more clarity regarding crude oil prices. The thesis of growth for the upstream MLP sector through acquisitions of mature, low-decline producing assets is challenged in this environment, but could look increasingly favorable as the U.S. Energy Renaissance continues and E&P companies seek alternatives to fund their shale development opportunities.
We remain focused on the favorable long-term fundamental attributes of the broad upstream sector, upstream MLPs and Energy Trusts and the potential for attractive total returns based on current yield and expected distributions. We will continue to seek out stocks with attractive valuations and long-term growth opportunities, as well as those with near-term catalysts.
U.S. Energy Renaissance
During the reporting period, the U.S. Energy Renaissance continued to strengthen as the natural gas export theme and infrastructure build-out associated with the U.S. shale revolution moved forward. The beneficiaries of the Renaissance theme continued to be dynamic during the reporting period, shifting significantly with the dramatic decline in crude oil prices. Industries which may not have been as compelling in a high crude oil price environment became favorable at a West Texas Intermediate crude oil price of approximately $50-$60 per barrel.
We positioned MainStay Cushing Renaissance Advantage Fund’s portfolio with candidates that we believe have multi-year growth embedded in their business models with appropriate capital structures, good free cash flow growth and higher return on invested capital relative to their peers. Our theses on such names are not a function of their quarterly performance but a function of their underlying business fundamentals. We continue
to identify new candidates through our investment screening process (both top down and bottom up). We are believers in the multi-year growth in the transportation sector, industrial companies benefiting from energy and industrial Renaissance and materials companies benefiting from lower feedstock prices.
Throughout the reporting period, the continued discount of U.S. natural gas prices to global natural gas prices has helped several industries maintain a competitive advantage. The incentive to take advantage of the price arbitrage through exporting natural gas as liquefied natural gas (“LNG”) has been the driving force behind multiple companies filing for permits to build LNG export facilities along the coasts (primarily the Gulf Coast). Cheniere Energy, Inc. (NYSE: LNG) has an LNG facility under construction which is expected in service later this year, followed by another facility in Cove Point, MD from Dominion (NYSE: D) and another Gulf Coast LNG facility sponsored by ConocoPhillips (NYSE: COP), Energy Transfer Partners, L.P. (NYSE: ETP) and Sempra Energy (NYSE: SRE). On the same note, U.S. industries that have a high energy input cost, such as the manufacturing, industrials and chemicals industries, continued to realize a significant competitive advantage through a reduction in operating expense as U.S. natural gas prices remained at a significant discount to natural gas prices around the world. This advantage not only drove higher margins for companies currently operating domestically, but also drove jobs back to the U.S. that had largely moved overseas for the past 20 years. The competitive price advantage incentivized domestic companies to increase their production capacity, which led to a significant expansion in manufacturing and chemical plants. This expansion created heightened demand for industrial companies involved with design, construction and supply.
With oil prices at a nearly 35% discount to the five-year average, the beneficiaries within the scope of the U.S. Energy Renaissance shifted to those who benefitted from a lower price environment. The reduced price of crude oil resulted in significantly lower gasoline prices, which had a positive impact on operating expenses for companies with fuel expense as a high input cost in their operations, similar to the dynamic mentioned previously with natural gas. Beneficiaries of low oil prices within the Renaissance universe include trucking companies, auto and auto part manufacturers, retail gas companies and airlines. Although the decrease in crude oil prices created a new dynamic within the Renaissance theme, the drop in natural gas prices only served as further support to the theme. The industries which gained a competitive price advantage versus global pricing were able to further reduce their operating costs with respect to natural gas and natural gas liquids (“NGLs”). Additionally, a low crude oil price environment has historically been a positive driver for domestic gross domestic product, which ultimately drives additional growth opportunities for a majority of the industries within the scope of the Renaissance universe. Due to the dynamic theme and broad scope of the
Not part of the Semiannual Report
U.S. Energy Renaissance, the industries and companies which see the greatest benefit can vary in different macroeconomic environments. As an example within the transportation sector, when crude oil prices were above $100, the demand for crude oil trucking was very high due to lack of pipeline infrastructure in developing shales. However, the decline in crude oil prices led to a decline in gasoline prices, as well as decreased demand for crude oil trucking. Trucking companies which focus on hauling consumer goods versus crude oil experienced increased margins relative to recent historical levels, without decreased volumes associated with crude oil.
We believe that the fundamentals for the thesis have improved. The benefit has shifted from only portions of the economy benefiting from low natural gas prices to an even larger portion of the economy benefitting from both low natural gas prices and now low crude oil prices. As a result, our investment universe has broadened and we believe the markets are beginning to realize the potential benefits. Through active management, we believe the portfolio holdings can be adapted to capitalize on the opportunities created by the U.S. Energy Renaissance as it plays out over the next several years.
The information provided herein represents the opinion of the portfolio manager and is not intended to be a forecast of future events, a guarantee of future results, nor investment advice. The opinions expressed are as of the date of this report and are subject to change.
Not part of the Semiannual Report
Table of Contents
Investors should refer to each Fund’s Summary Prospectus and/or Prospectus and consider each Fund’s investment objectives, strategies, risks, charges and expenses carefully before investing. The Summary Prospectus and/or Prospectus contain this and other information about each Fund. You may obtain copies of each Fund’s Summary Prospectus, Prospectus and Statement of Additional Information free of charge, upon request, by calling toll-free 800-MAINSTAY (624-6782), by writing to NYLIFE Distributors LLC, Attn: MainStay Marketing Department, 169 Lackawanna Avenue, Parsippany, New Jersey 07054 or by sending an e-mail to MainStayShareholderServices@nylim.com. These documents are also available via the MainStay Funds’ website at mainstayinvestments.com/documents. Please read each Summary Prospectus and/or Prospectus carefully before investing.
MainStay Cushing MLP Premier Fund
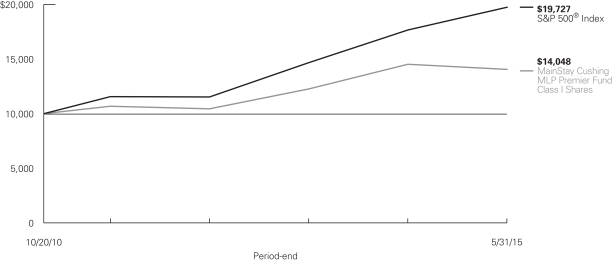
Investment and Performance Comparison1 (Unaudited)
Performance data quoted represents past performance. Past performance is no guarantee of future results. Because of market volatility, current performance may be lower or higher than the figures shown. Investment return and principal value will fluctuate, and as a result, when shares are redeemed, they may be worth more or less than their original cost. The graph below depicts the historical performance of Class I shares of the Fund. Performance will vary from class to class based on differences in class-specific expenses and sales charges. For performance information current to the most recent month-end, please call 800-MAINSTAY (624-6782) or visit mainstayinvestments.com.
Average Annual Total Returns for the Period Ended May 31, 2015
| | | | | | | | | | | | | | | | | | | | |
| Class | | Sales Charge | | | | Six Months | | | One Year | | | Since
Inception
(10/20/10) | | | Gross
Expense
Ratio2 | |
| Class A Shares4 | | Maximum 5.5% Initial Sales Charge | | With sales charge Excluding sales charge | |
| –7.96
–2.60 | %
| |
| –9.00
–3.45 | %
| |
| 6.01
7.38 | %
| |
| 6.98
6.98 | %
|
| Investor Class Shares3 | | Maximum 5.5% Initial Sales Charge | | With sales charge Excluding sales charge | |
| –7.95
–2.60 |
| |
| –9.00
–3.45 |
| |
| 6.02
7.38 |
| |
| 6.97
6.97 |
|
| Class C Shares4 | | Maximum 1% CDSC if Redeemed Within One Year of Purchase | | With sales charge Excluding sales charge | |
| –3.92
–2.98 |
| |
| –5.07
–4.17 |
| |
| 6.56
6.56 |
| |
| 7.72
7.72 |
|
| Class I Shares4 | | No Sales Charge | | | | | –2.48 | | | | –3.19 | | | | 7.65 | | | | 6.73 | |
| 1. | The performance table and graph do not reflect the deduction of taxes that a shareholder would pay on distributions or Fund share redemptions. Total returns reflect maximum applicable sales charges as indicated in the table above, changes in share price, and reinvestment of dividend and capital gain distributions. The graph assumes the initial investment amount shown above and reflects the deduction of all sales charges that would have applied for the period of investment. Performance figures reflect certain fee waivers and/or expense limitations, without which total returns may have been lower. For more information on share classes and current fee waivers and/or expense limitations, please refer to the notes to the financial statements. |
| 2. | The gross expense ratios presented reflect the Fund’s “Total Annual Fund Operating Expenses” from the most recent Prospectus and may differ from other expense ratios disclosed in this report. |
| 3. | Performance figures for Investor Class shares, first offered on July 11, 2014, include the historical performance of Class A shares through July 10, 2014, adjusted for differences in certain expenses and fees. Unadjusted, the performance shown for Investor Class shares would likely have been different. |
| 4. | Performance figures for Class A shares, Class C shares and Class I shares reflect the historical performance of the then-existing Class A shares, Class C shares and Class I shares, respectively, of the Cushing® MLP Premier Fund (the predecessor to the Fund, which was subject to a different fee structure) for periods prior to July 11, 2014. The Cushing® MLP Premier Fund commenced operations on October 20, 2010. |
The footnotes on the next page are an integral part of the table and graph and should be carefully read in conjunction with them.
| | |
| 8 | | MainStay Cushing MLP Premier Fund |
| | | | | | | | | | | | |
| Benchmark Performance | | Six
Months | | | One
Year | | | Since
Inception | |
S&P 500® Index5 | | | 2.97 | % | | | 11.81 | % | | | 15.87 | % |
Average Lipper Energy MLP Fund6 | | | –4.31 | | | | –4.24 | | | | 9.10 | |
| 5. | “S&P 500®” is a trademark of The McGraw-Hill Companies, Inc. The S&P 500® Index is widely regarded as the standard index for measuring large-cap U.S. stock market performance. The S&P 500® Index is the Fund’s primary benchmark. Results assume reinvestment of all dividends and capital gains. An investment cannot be made directly in an index. |
| 6. | The average Lipper Energy MLP Fund is representative of funds that invest primarily in Master Limited Partnerships (MLPs) engaged in the |
| | transportation, storage and processing of minerals and natural resources. This benchmark is a product of Lipper Inc. Lipper Inc. is an independent monitor of fund performance. Results are based on total returns with all dividend and capital gain distributions reinvested. |
The footnotes on the preceding page are an integral part of the table and graph and should be carefully read in conjunction with them.
Cost in Dollars of a $1,000 Investment in MainStay Cushing MLP Premier Fund (Unaudited)
The example below is intended to describe the fees and expenses borne by shareholders during the six-month period from December 1, 2014, to May 31, 2015, and the impact of those costs on your investment.
Example
As a shareholder of the Fund, you incur two types of costs: (1) transaction costs, including exchange fees and sales charges (loads) on purchases (as applicable), and (2) ongoing costs, including management fees, distribution and/or service (12b-1) fees, and other Fund expenses (as applicable). This example is intended to help you understand your ongoing costs (in dollars) of investing in the Fund and to compare these costs with the ongoing costs of investing in other mutual funds. The example is based on an investment of $1,000 made at the beginning of the six-month period and held for the entire period from December 1, 2014, to May 31, 2015.
This example illustrates your Fund’s ongoing costs in two ways:
Actual Expenses
The second and third data columns in the table below provide information about actual account values and actual expenses. You may use the information in these columns, together with the amount you invested, to estimate the expenses that you paid during the six months ended May 31, 2015. Simply divide your account value by $1,000 (for example, an $8,600 account value divided by $1,000 = 8.6), then
multiply the result by the number under the heading entitled “Expenses Paid During Period” to estimate the expenses you paid on your account during this period.
Hypothetical Example for Comparison Purposes
The fourth and fifth data columns in the table below provide information about hypothetical account values and hypothetical expenses based on the Fund’s actual expense ratio and an assumed rate of return of 5% per year before expenses, which is not the Fund’s actual return. The hypothetical account values and expenses may not be used to estimate the actual ending account balances or expenses you paid for the six-month period shown. You may use this information to compare the ongoing costs of investing in the Fund with the ongoing costs of investing in other Funds. To do so, compare this 5% hypothetical example with the 5% hypothetical examples that appear in the shareholder reports of the other Funds.
Please note that the expenses shown in the table are meant to highlight your ongoing costs only and do not reflect any transactional costs, such as exchange fees or sales charges (loads). Therefore, the fourth and fifth data columns of the table are useful in comparing ongoing costs only and will not help you determine the relative total costs of owning different funds. In addition, if these transactional costs were included, your costs would have been higher.
| | | | | | | | | | | | | | | | | | | | |
| | | | | | | | | | | | | | | | |
| Share Class | | Beginning Account Value 12/1/14 | | | Ending Account Value (Based on Actual Returns and Expenses) 5/31/15 | | | Expenses Paid During Period1 | | | Ending Account Value (Based on Hypothetical 5% Annualized Return and Actual Expenses)
5/31/2015 | | | Expenses Paid During
Period1 | |
| | | | | |
| Class A Shares | | $ | 1,000.00 | | | $ | 974.00 | | | $ | 7.23 | | | $ | 1,017.60 | | | $ | 7.39 | |
| | | | | |
| Investor Class Shares | | $ | 1,000.00 | | | $ | 974.00 | | | $ | 7.19 | | | $ | 1,017.65 | | | $ | 7.34 | |
| | | | | |
| Class C Shares | | $ | 1,000.00 | | | $ | 970.20 | | | $ | 10.86 | | | $ | 1,013.91 | | | $ | 11.10 | |
| | | | | |
| Class I Shares | | $ | 1,000.00 | | | $ | 975.20 | | | $ | 6.01 | | | $ | 1,018.85 | | | $ | 6.14 | |
| 1. | Expenses are equal to the Fund’s annualized expense ratio of each class (1.47% for Class A, 1.46% for Investor Class, 2.21% for Class C and 1.22% for Class I) multiplied by the average account value over the period, divided by 365 and multiplied by 182 for Class A, Investor Class, Class C and Class I (to reflect the six-month period). Expenses for the six-month period ended excluded a net deferred tax benefit to the Fund that equaled 1.63% for Class A, 1.63% for Investor Class, 1.63% for Class C, and 1.63% for Class I. The table above represents the actual expenses incurred during the six-month period. |
| | |
| 10 | | MainStay Cushing MLP Premier Fund |
Portfolio Composition as of May 31, 2015(1) (Unaudited)
(Expressed as a Percentage of Total Investments)

See Portfolio of Investments beginning on page 14 for specific holdings within these categories.
Top Ten Holdings as of May 31, 2015 (excluding short-term investments)
| 2. | Energy Transfer Equity, L.P. |
| 3. | Williams Companies, Inc. |
| 4. | Targa Resources Partners, L.P. |
| 5. | Williams Partners, L.P. |
| 6. | EQT Midstream Partners, L.P. |
| 7. | Energy Transfer Partners, L.P. |
| 8. | EnLink Midstream Partners, L.P. |
| 9. | Enterprise Products Partners, L.P. |
| 10. | Tesoro Logistics, L.P. |
| (1) | Fund holdings and sector allocations are subject to change, and there is no assurance that the Fund will continue to hold any particular security. |
| (2) | Master Limited Partnerships and Related Companies |
Portfolio Management Discussion and Analysis (Unaudited)
Questions answered by portfolio managers Jerry V. Swank, Daniel L. Spears and Kevin P. Gallagher, CFA, of Cushing Asset Management, LP, the Fund’s Subadvisor.
How did MainStay Cushing MLP Premier Fund perform relative to its primary benchmark and peers for the six months ended May 31, 2015?
Excluding all sales charges, MainStay Cushing MLP Premier Fund returned –2.60% for Class A shares and Investor Class shares and –2.98% for Class C shares for the six months ended May 31, 2015. Over the same period, Class I shares returned –2.48%. For the six months ended May 31, 2015, all share classes underperformed the 2.97% return of the S&P 500® Index,1 which is the Fund’s broad-based securities-market index. Over the same period, all share classes outperformed the –4.31% return of the Average Lipper2 Energy MLP Fund. See page 8 for Fund returns with applicable sales charges.
What factors affected the Fund’s performance relative to the S&P 500® Index during the reporting period?
Key factors that negatively affected the Fund’s performance relative to the S&P 500® Index were generally related to the precipitous decline in crude oil and natural gas liquids prices in late 2014 and into 2015. For the midstream energy industry, sharply lower commodity prices have, in general, led to reduced expectations for volume growth, growth-capital spending, and distribution growth. Additionally, the Fund is subject to fees and expenses and is taxed as a regular corporation for federal income tax purposes, while the returns of the S&P 500® Index are not subject to taxes, fees or expenses.
Which subsectors were the strongest contributors to the Fund’s absolute performance and which subsectors were particularly weak?
The top three contributors to the Fund’s absolute performance during the reporting period were crude oil & refined products, shipping, and shipping general partners. (Contributions take weightings and total returns into account.) The average weighting for the crude oil & refined products subsector during the reporting period was one of the highest in the Fund, while the shipping-related subsectors were two of the lowest. All subsectors, however, contributed positively to the Fund’s absolute performance. The crude oil & refined products subsector contributed the strongest performance, in large part because of the outsized actual and estimated distribution growth for its constituents relative to other master limited partnerships (“MLPs”). The three subsectors with the weakest contributions to the Fund’s absolute performance, in order of impact on the Fund, were natural gas gatherers & processors, upstream MLPs, and large-cap diversified MLPs. (All three of these subsectors had negative absolute performance during the reporting period.) Performance for the natural gas gatherers & processors and upstream MLPs subsectors was particularly
hurt by the deteriorating commodity price environment. At the end of the reporting period, the Fund did not hold any upstream MLPs.
During the reporting period, which individual holdings made the strongest contributions to the Fund’s absolute performance and which holdings detracted the most?
The top three contributors to the Fund’s absolute performance during the reporting period were Energy Transfer Equity, L.P., an MLP general partner; Williams Partners, L.P., a large-cap diversified MLP; and Shell Midstream Partners, L.P., a crude oil & refined products MLP. We projected double-digit percent multiyear distribution growth for Energy Transfer Equity, driven by acquisitions and a healthy backlog of organic projects across a diverse asset base. Williams Partners’ performance benefited from the announced consolidation acquisition by its parent company, The Williams Companies, Inc. Shell Midstream Partners went public late in 2014 and we are projecting multiyear distribution growth of over 20% driven by asset acquisitions from its parent/sponsor. All three of these holdings had positive absolute performance during the reporting period.
The bottom three contributors to absolute performance during the reporting period were BreitBurn Energy Partners, L.P., an upstream MLP; Regency Energy Partners, L.P., a natural gas gatherers & processors MLP acquired in April by Energy Transfer Partners, L.P.; and Targa Resources Corp., a general partner. All three of these detractors from the Fund’s absolute performance also had negative absolute performance driven by the deteriorating commodity price environment. At the end of the reporting period, the Fund no longer had a position in BreitBurn Energy Partners.
Did the Fund make any significant purchases or sales during the reporting period?
During the reporting period, the Fund’s largest purchases included Williams Partners, L.P. (a large-cap diversified MLP) and Targa Resources Partners, L.P. (a natural gas gatherers & processors MLP). The Fund purchased both MLPs because of their attractive high yields with perceived distribution growth potential in a low crude-oil price environment. During the reporting period, the Fund’s largest sales included Atlas Pipeline Partners, L.P. (a natural gas gatherers & processors MLP acquired by Targa Resources Partners) and Regency Energy Partners, L.P. (a natural gas gatherers & processors MLP acquired by Energy Transfer Partners). Both MLPs were involved with transactions to merge with other MLPs held by the Fund, and both sales were made to reduce combined exposure to the pro forma merged entities.
| 1. | See footnote on page 9 for more information on the S&P 500® Index. |
| 2. | See footnote on page 9 for more information on Lipper Inc. |
| | |
| 12 | | MainStay Cushing MLP Premier Fund |
How did the Fund’s subsector weightings change during the reporting period?
During the reporting period, the Fund increased subsector weightings in crude oil & refined products, large-cap diversified, and general partners. The Fund reduced exposure to the natural gas gatherers & processors subsector and completely exited upstream MLPs.
How was the Fund positioned at the end of the reporting period?
At the end of the reporting period, the three largest MLP subsector positions, in order of size, were crude oil & refined products, large-cap diversified, and general partners.
The opinions expressed are those of the portfolio managers as of the date of this report and are subject to change. There is no guarantee that any forecast made will come to pass. This material does not constitute investment advice and is not intended as an endorsement of any specific investment.
Portfolio of Investments May 31, 2015 (Unaudited)
| | | | | | | | |
| | |
| | | Shares | | | Value | |
| | | | | | | | |
| Common Stock 21.1%† | |
Diversified General Partnerships 7.4% | | | | | | | | |
United States 7.4% | | | | | | | | |
ONEOK, Inc. | | | 974,800 | | | $ | 40,863,616 | |
¨Williams Companies, Inc. | | | 2,049,700 | | | | 104,739,670 | |
| | | | | | | | |
| | | | | | | 145,603,286 | |
| | | | | | | | |
General Partnerships 9.9% | | | | | | | | |
United States 9.9% | | | | | | | | |
¨Kinder Morgan, Inc. | | | 3,148,432 | | | | 130,628,444 | |
Targa Resources Corp. | | | 708,100 | | | | 65,109,795 | |
| | | | | | | | |
| | | | | | | 195,738,239 | |
| | | | | | | | |
Shipping 3.8% | | | | | | | | |
Bermuda 1.9% | | | | | | | | |
Golar LNG Ltd. | | | 770,000 | | | | 36,582,700 | |
Republic of the Marshall Islands 1.9% | | | | | | | | |
Teekay Corp. | | | 830,000 | | | | 38,030,600 | |
| | | | | | | | |
| | | | | | | 74,613,300 | |
| | | | | | | | |
Total Common Stock
(Cost $322,113,147) | | | | | | | 415,954,825 | |
| | | | | | | | |
| | |
| | | | | | | | |
| Master Limited Partnerships and Related Companies 79.7% | |
Crude Oil & Refined Products 20.2% | | | | | | | | |
United States 20.2% | | | | | | | | |
Blueknight Energy Partners, L.P. | | | 2,161,200 | | | | 16,684,464 | |
Enbridge Energy Partners, L.P. | | | 2,112,800 | | | | 78,363,752 | |
Genesis Energy, L.P. | | | 1,226,000 | | | | 59,620,380 | |
NuStar Energy, L.P. | | | 1,108,500 | | | | 69,181,485 | |
Shell Midstream Partners, L.P. | | | 1,107,987 | | | | 49,748,616 | |
Sunoco Logistics Partners, L.P. | | | 1,158,400 | | | | 45,872,640 | |
¨Tesoro Logistics, L.P. | | | 1,375,600 | | | | 79,523,436 | |
| | | | | | | | |
| | | | | | | 398,994,773 | |
| | | | | | | | |
General Partnerships 8.7% | | | | | | | | |
United States 8.7% | | | | | | | | |
¨Energy Transfer Equity, L.P. | | | 1,848,600 | | | | 126,943,362 | |
Plains GP Holdings, L.P. | | | 1,555,000 | | | | 43,477,800 | |
| | | | | | | | |
| | | | | | | 170,421,162 | |
| | | | | | | | |
Large Cap Diversified 20.3% | | | | | | | | |
United States 20.3% | | | | | | | | |
¨Energy Transfer Partners, L.P. | | | 1,615,312 | | | | 90,828,994 | |
¨Enterprise Products Partners, L.P. | | | 2,509,250 | | | | 81,349,885 | |
Magellan Midstream Partners, L.P. | | | 771,615 | | | | 61,513,148 | |
ONEOK Partners, L.P. | | | 441,600 | | | | 17,244,480 | |
Plains All American Pipeline, L.P. | | | 1,125,905 | | | | 52,861,240 | |
¨Williams Partners, L.P. | | | 1,726,603 | | | | 96,482,575 | |
| | | | | | | | |
| | | | | | | 400,280,322 | |
| | | | | | | | |
| | | | | | | | |
| | |
| | | Shares | | | Value | |
| | | | | | | | |
Natural Gas Gatherers & Processors 17.9% | |
United States 17.9% | | | | | | | | |
DCP Midstream Partners, L.P. | | | 1,401,000 | | | $ | 52,957,800 | |
Enable Midstream Partners, L.P. | | | 524,124 | | | | 9,329,407 | |
¨EnLink Midstream Partners, L.P. | | | 3,346,700 | | | | 83,065,094 | |
MarkWest Energy Partners, L.P. | | | 816,400 | | | | 52,763,932 | |
¨Targa Resources Partners, L.P. | | | 2,238,025 | | | | 96,749,821 | |
Western Gas Partners, L.P. | | | 833,600 | | | | 57,101,600 | |
| | | | | | | | |
| | | | | | | 351,967,654 | |
| | | | | | | | |
Natural Gas Transportation & Storage 4.7% | |
United States 4.7% | | | | | | | | |
¨EQT Midstream Partners, L.P. | | | 1,110,000 | | | | 92,873,700 | |
| | | | | | | | |
|
Propane 2.9% | |
United States 2.9% | | | | | | | | |
NGL Energy Partners, L.P. | | | 1,918,652 | | | | 57,674,679 | |
| | | | | | | | |
| | |
Shipping 5.0% | | | | | | | | |
Republic of the Marshall Islands 5.0% | |
Capital Products Partners, L.P. | | | 4,991,100 | | | | 45,468,921 | |
Golar LNG Partners, L.P. | | | 1,130,000 | | | | 31,877,300 | |
Navios Maritime Partners, L.P. | | | 1,916,000 | | | | 20,846,080 | |
| | | | | | | | |
| | | | | | | 98,192,301 | |
| | | | | | | | |
Total Master Limited Partnerships and Related Companies
(Cost $1,249,789,959) | | | | | | | 1,570,404,591 | |
| | | | | | | | |
| | |
| | | | | | | | |
| Preferred Stock 0.9% | |
Crude Oil & Refined Products 0.9% | | | | | | | | |
United States 0.9% | | | | | | | | |
Blueknight Energy Partners, L.P., 11.00% (a) | | | 1,902,541 | | | | 16,856,513 | |
| | | | | | | | |
Total Preferred Stock
(Cost $14,949,976) | | | | | | | 16,856,513 | |
| | | | | | | | |
| | |
| | | | | | | | |
| Short-Term Investments—Investment Companies 4.6% | |
United States 4.6% | | | | | | | | |
AIM Short-Term Treasury Portfolio Fund—Institutional Class, 0.02% (b) | | | 18,284,265 | | | | 18,284,265 | |
Fidelity Government Portfolio Fund—Institutional Class, 0.01% (b) | | | 18,284,266 | | | | 18,284,266 | |
Fidelity Money Market Portfolio—Institutional Class, 0.11% (b) | | | 18,284,266 | | | | 18,284,266 | |
First American Government Obligations Fund—Class Z, 0.01% (b) | | | 18,284,265 | | | | 18,284,265 | |
| † | Percentages indicated are based on Fund net assets. |
| ¨ | | Among the Portfolio’s 10 largest holdings or issuers held, as of May 31, 2015, excluding short-term investments. May be subject to change daily. |
| | | | |
| 14 | | MainStay Cushing MLP Premier Fund | | The notes to the financial statements are an integral part of,
and should be read in conjunction with, the financial statements. |
| | | | | | | | |
| | |
| | | Shares | | | Value | |
| | | | | | | | |
| Short-Term Investments—Investment Companies (continued) | |
United States (continued) | | | | | | | | |
Invesco STIC Prime Portfolio, 0.07% (b) | | | 18,284,265 | | | $ | 18,284,265 | |
| | | | | | | | |
Total Short-Term Investments—Investment Companies
(Cost $91,421,327) | | | | | | | 91,421,327 | |
| | | | | | | | |
Total Investments
(Cost $1,678,274,409) (c) | | | 106.3 | % | | | 2,094,637,256 | |
Liabilities in Excess of Other Assets | | | (6.3 | ) | | | (124,214,772 | ) |
Net Assets | | | 100.0 | % | | $ | 1,970,422,484 | |
| (a) | Illiquid security—As of May 31, 2015, the total market value of this security was $16,856,513, which represented 0.9% of the Fund’s net assets. |
| (b) | Rate reported is the current yield as of May 31, 2015. |
| (c) | As of May 31, 2015, cost was $1,575,584,736 for federal income tax purposes and net unrealized appreciation was as follows: |
| | | | |
Gross unrealized appreciation | | $ | 541,761,444 | |
Gross unrealized depreciation | | | (22,708,924 | ) |
| | | | |
Net unrealized appreciation | | $ | 519,052,520 | |
| | | | |
The following is a summary of the fair valuations according to the inputs used as of May 31, 2015, for valuing the Fund’s assets and liabilities.
Asset Valuation Inputs
| | | | | | | | | | | | | | | | |
Description | | Quoted
Prices in
Active
Markets for
Identical
Assets
(Level 1) | | | Significant
Other
Observable
Inputs
(Level 2) | | | Significant
Unobservable
Inputs
(Level 3) | | | Total | |
| Investments in Securities (a) | | | | | | | | | | | | | | | | |
Common Stock | | $ | 415,954,825 | | | $ | — | | | $ | — | | | $ | 415,954,825 | |
Master Limited Partnerships and Related Companies | | | 1,570,404,591 | | | | — | | | | — | | | | 1,570,404,591 | |
Preferred Stock | | | 16,856,513 | | | | — | | | | — | | | | 16,856,513 | |
Short-Term Investments | | | 91,421,327 | | | | — | | | | — | | | | 91,421,327 | |
| | | | | | | | | | | | | | | | |
| Total Investments in Securities | | $ | 2,094,637,256 | | | $ | — | | | $ | — | | | $ | 2,094,637,256 | |
| | | | | | | | | | | | | | | | |
| (a) | For a complete listing of investments and their industries, see the Portfolio of Investments. |
The Fund recognizes transfers between the levels as of the beginning of the period.
For the period ended May 31, 2015, the Fund did not have any transfers between Level 1 and Level 2 fair value measurements. (See Note 2)
As of May 31, 2015, the Fund did not hold any investments with significant unobservable inputs (Level 3). (See Note 2)
| | | | | | |
The notes to the financial statements are an integral part of,
and should be read in conjunction with, the financial statements. | | | | | 15 | |
Statement of Assets and Liabilities as of May 31, 2015 (Unaudited)
| | | | |
| Assets | | | | |
Investments, at value
(identified cost $1,678,274,409) | | $ | 2,094,637,256 | |
Receivables: | | | | |
Fund shares sold | | | 6,161,943 | |
Dividends and interest | | | 2,375 | |
Prepaid expenses | | | 342,873 | |
| | | | |
Total assets | | | 2,101,144,447 | |
| | | | |
| |
| Liabilities | | | | |
Payables: | | | | |
Fund shares redeemed | | | 4,977,832 | |
Advisory fees (See Note 3) | | | 1,863,414 | |
NYLIFE Distributors (See Note 3) | | | 832,021 | |
Transfer agent (See Note 3) | | | 349,867 | |
Professional fees | | | 89,827 | |
Trustees | | | 26,875 | |
Custodian | | | 4,758 | |
Deferred tax liability | | | 122,577,369 | |
| | | | |
Total liabilities | | | 130,721,963 | |
| | | | |
Net assets | | $ | 1,970,422,484 | |
| | | | |
| |
| Composition of Net Assets | | | | |
Shares of beneficial interest outstanding (par value of $.001 per share) unlimited number of shares authorized | | $ | 95,597 | |
Additional paid-in capital | | | 1,786,771,006 | |
| | | | |
| | | 1,786,866,603 | |
Accumulated net investment loss, net of income taxes | | | (67,599,948 | ) |
Accumulated net realized gain (loss) on investments, net of income taxes | | | (13,839,967 | ) |
Net unrealized appreciation (depreciation) on investments, net of income taxes | | | 264,995,796 | |
| | | | |
Net assets | | $ | 1,970,422,484 | |
| | | | |
| | | | |
Class A | | | | |
Net assets applicable to outstanding shares | | $ | 509,961,019 | |
| | | | |
Shares of beneficial interest outstanding | | | 24,398,877 | |
| | | | |
Net asset value per share outstanding | | $ | 20.90 | |
Maximum sales charge (5.50% of offering price) | | | 1.15 | |
| | | | |
Maximum offering price per share outstanding | | $ | 22.05 | |
| | | | |
Investor Class | | | | |
Net assets applicable to outstanding shares | | $ | 2,755,612 | |
| | | | |
Shares of beneficial interest outstanding | | | 131,856 | |
| | | | |
Net asset value per share outstanding | | $ | 20.90 | |
Maximum sales charge (5.50% of offering price) | | | 1.15 | |
| | | | |
Maximum offering price per share outstanding | | $ | 22.05 | |
| | | | |
Class C | | | | |
Net assets applicable to outstanding shares | | $ | 841,445,458 | |
| | | | |
Shares of beneficial interest outstanding | | | 41,960,699 | |
| | | | |
Net asset value per share outstanding | | $ | 20.05 | |
| | | | |
Class I | | | | |
Net assets applicable to outstanding shares | | $ | 616,260,395 | |
| | | | |
Shares of beneficial interest outstanding | | | 29,105,378 | |
| | | | |
Net asset value per share outstanding | | $ | 21.17 | |
| | | | |
| | | | |
| 16 | | MainStay Cushing MLP Premier Fund | | The notes to the financial statements are an integral part of,
and should be read in conjunction with, the financial statements. |
Statement of Operations for the six months ended May 31, 2015 (Unaudited)
| | | | |
| Investment Income (Loss) | |
Income | | | | |
Dividends and distributions (Net of return of capital of $40,082,150) | | $ | 15,122,055 | |
Interest | | | 24,478 | |
| | | | |
Total income | | | 15,146,533 | |
| | | | |
Expenses | | | | |
Manager (See Note 3) | | | 10,689,256 | |
Distribution/Service—Class A (See Note 3) | | | 645,409 | |
Distribution/Service—Investor Class (See Note 3) | | | 2,522 | |
Distribution/Service—Class C (See Note 3) | | | 4,154,099 | |
Transfer agent (See Note 3) | | | 734,956 | |
Registration | | | 144,764 | |
Professional fees | | | 115,927 | |
Franchise tax | | | 88,551 | |
Shareholder communication | | | 80,043 | |
Trustees | | | 31,128 | |
Custodian | | | 12,701 | |
Miscellaneous | | | 15,945 | |
| | | | |
Net expenses | | | 16,715,301 | |
| | | | |
Net investment loss, before income taxes | | | (1,568,768 | ) |
Deferred tax benefit | | | 1,553,084 | |
| | | | |
Net investment income (loss) | | | (15,684 | ) |
| | | | |
|
| Realized and Unrealized Gain (Loss) on Investments | |
Net realized gain (loss) on: | | | | |
Investments, before income taxes | | | (60,132,432 | ) |
Deferred tax benefit | | | 22,267,705 | |
| | | | |
Net realized gain (loss) on investments | | | (37,864,727 | ) |
| | | | |
Net change in unrealized appreciation (depreciation) on: | | | | |
Investments, before income taxes | | | (22,708,642 | ) |
Deferred tax benefit | | | 8,409,261 | |
| | | | |
Net change in unrealized appreciation (depreciation) | | | (14,299,381 | ) |
| | | | |
Net realized and unrealized gain (loss) on investments | | | (52,164,108 | ) |
| | | | |
Net increase (decrease) in net assets resulting from operations | | $ | (52,179,792 | ) |
| | | | |
| | | | | | |
The notes to the financial statements are an integral part of,
and should be read in conjunction with, the financial statements. | | | | | 17 | |
Statements of Changes in Net Assets
| | | | | | | | |
| | | Six months
ended
May 31,
2015
(Unaudited) | | | Year
ended
November 30,
2014 | |
| Increase (Decrease) in Net Assets | |
Operations: | | | | | | | | |
Net investment income (loss) | | $ | (15,684 | ) | | $ | (10,515,805 | ) |
Net realized gain (loss) on investments | | | (37,864,727 | ) | | | 35,136,178 | |
Net change in unrealized appreciation (depreciation) on investments | | | (14,299,381 | ) | | | 100,775,299 | |
| | | | |
Net increase (decrease) in net assets resulting from operations | | | (52,179,792 | ) | | | 125,395,672 | |
| | | | |
Dividends and distributions to shareholders: | | | | | | | | |
From net investment income: | | | | | | | | |
Class A | | | — | | | | (14,189,873 | ) |
Investor Class | | | — | | | | (6,008 | ) |
Class C | | | — | | | | (20,166,403 | ) |
Class I | | | — | | | | (10,131,458 | ) |
| | | | |
| | | — | | | | (44,493,742 | ) |
| | | | |
From return of capital: | | | | | | | | |
Class A | | | (16,376,559 | ) | | | (18,145,019 | ) |
Investor Class | | | (67,443 | ) | | | (7,683 | ) |
Class C | | | (27,567,083 | ) | | | (25,787,389 | ) |
Class I | | | (18,657,284 | ) | | | (12,955,400 | ) |
| | | | |
| | | (62,668,369 | ) | | | (56,895,491 | ) |
| | | | |
Total dividends and distributions to shareholders | | | (62,668,369 | ) | | | (101,389,233 | ) |
| | | | |
Capital share transactions: | | | | | | | | |
Net proceeds from sale of shares | | | 433,611,670 | | | | 1,058,742,376 | |
Net asset value of shares issued to shareholders in reinvestment of dividends and distributions | | | 57,401,741 | | | | 86,845,034 | |
Cost of shares redeemed | | | (377,398,911 | ) | | | (475,289,126 | ) |
| | | | |
Increase (decrease) in net assets derived from capital share transactions | | | 113,614,500 | | | | 670,298,284 | |
| | | | |
Net increase (decrease) in net assets | | | (1,233,661 | ) | | | 694,304,723 | |
| | |
| Net Assets | | | | | | | | |
Beginning of period | | | 1,971,656,145 | | | | 1,277,351,422 | |
| | | | |
End of period | | $ | 1,970,422,484 | | | $ | 1,971,656,145 | |
| | | | |
Accumulated net investment loss, net of income taxes | | $ | (67,599,948 | ) | | $ | (67,584,264 | ) |
| | | | |
| | | | |
| 18 | | MainStay Cushing MLP Premier Fund | | The notes to the financial statements are an integral part of,
and should be read in conjunction with, the financial statements. |
Financial Highlights selected per share data and ratios
| | | | | | | | | | | | | | | | | | | | | | | | | | |
| | | Six months
ended
May 31, | | | | | Year ended November 30, | | | October 20,
2010**
through
November 30, | |
| Class A | | 2015* | | | | | 2014 | | | 2013*** | | | 2012*** | | | 2011*** | | | 2010*** | |
Net asset value at beginning of period | | $ | 22.15 | | | | | $ | 21.36 | | | $ | 19.48 | | | $ | 19.92 | | | $ | 20.28 | | | $ | 20.00 | |
| | | | | | | | | | | | | | | | | | | | | | | | | | |
Net investment income (loss) (a) | | | 0.02 | | | | | | (0.09 | ) | | | (0.12 | ) | | | (0.13 | ) | | | (0.14 | ) | | | (0.02 | ) |
Net realized and unrealized gain (loss) on investments | | | (0.60 | ) | | | | | 2.21 | | | | 3.34 | | | | 1.02 | | | | 1.07 | | | | 0.30 | |
| | | | | | | | | | | | | | | | | | | | | | | | | | |
Total from investment operations | | | (0.58 | ) | | | | | 2.12 | | | | 3.22 | | | | 0.89 | | | | 0.93 | | | | 0.28 | |
| | | | | | | | | | | | | | | | | | | | | | | | | | |
| Less dividends and distributions: | | | | | | | | | | | | | | | | | | | | | | | | | | |
From net investment income | | | — | | | | | | (0.59 | ) | | | — | | | | — | | | | — | | | | — | |
From return of capital | | | (0.67 | ) | | | | | (0.75 | ) | | | (1.34 | ) | | | (1.34 | ) | | | (1.30 | ) | | | — | |
| | | | | | | | | | | | | | | | | | | | | | | | | | |
Total dividends and distributions | | | (0.67 | ) | | | | | (1.34 | ) | | | (1.34 | ) | | | (1.34 | ) | | | (1.30 | ) | | | — | |
| | | | | | | | | | | | | | | | | | | | | | | | | | |
Redemption fees retained (a)(b) | | | — | | | | | | 0.01 | | | | 0.00 | ‡ | | | 0.01 | | | | 0.01 | | | | — | |
| | | | | | | | | | | | | | | | | | | | | | | | | | |
Net asset value at end of period | | $ | 20.90 | | | | | $ | 22.15 | | | $ | 21.36 | | | $ | 19.48 | | | $ | 19.92 | | | $ | 20.28 | |
| | | | | | | | | | | | | | | | | | | | | | | | | | |
Total investment return (c) | | | (2.60 | %)(d) | | | | | 10.00 | % | | | 16.91 | % | | | 4.56 | % | | | 4.55 | % | | | 1.40 | % (d) |
| Ratios (to average net assets)/Supplemental Data: | | | | | | | | | | | | | | | | | | | | | | | | | | |
Net investment income (loss) (including net deferred income tax benefit (expense)) (e) | | | 1.71 | % (f) | | | | | (6.46 | %) | | | (9.12 | %) | | | (2.95 | %) | | | (1.95 | %) | | | (5.32 | %)†† |
Net investment income (loss) (excluding net deferred income tax benefit (expense)) (e) | | | 0.08 | % (f) | | | | | (0.97 | %) | | | (1.18 | %) | | | (1.23 | %) | | | (1.29 | %) | | | (1.45 | %)†† |
Net expenses (including net deferred income tax (benefit) expense) (e)(g) | | | (0.16 | %)(f) | | | | | 7.08 | % | | | 9.59 | % | | | 3.37 | % | | | 2.32 | % | | | 5.52 | % †† |
Expenses (before waiver/recoupment, including net deferred income tax (benefit) expense) (e)(g) | | | (0.16 | %)(f) | | | | | 7.03 | % | | | 9.57 | % | | | 3.43 | % | | | 3.29 | % | | | 44.22 | % †† |
Portfolio turnover rate | | | 17.25 | % | | | | | 20.70 | % | | | 27.29 | % | | | 43.32 | % | | | 72.32 | % | | | 0.74 | % |
Net assets at end of period (in 000’s) | | $ | 509,961 | | | | | $ | 531,607 | | | $ | 487,318 | | | $ | 306,054 | | | $ | 81,865 | | | $ | 697 | |
| *** | These years were audited by a predecessor audit firm whose opinion was unqualified. |
| ‡ | Less than one cent per share. |
| (a) | Per share data based on average shares outstanding during the period. |
| (b) | Redemption fees were only applicable prior to reorganization. (See Note 1) |
| (c) | Total investment return is calculated exclusive of sales charges and assumes the reinvestment of dividends and distributions. |
| (d) | Total investment return is not annualized. |
| (e) | For the period from December 1, 2014 to May 31, 2015, the Fund accrued $31,930,050 in net deferred income tax benefit, of which $8,482,816 is attributable to Class A. |
| | For the year ended November 30, 2014, the Fund accrued $70,224,241 in net deferred income tax expense, of which $30,305,000 is attributable to Class A. |
| | For the year ended November 30, 2013, the Fund accrued $77,002,011 in net deferred income tax expense, of which $31,765,943 is attributable to Class A. |
| | For the year ended November 30, 2012, the Fund accrued $7,120,938 in net deferred income tax expense, of which $3,616,649 is attributable to Class A. |
| | For the year ended November 30, 2011, the Fund accrued $452,365 in net deferred tax expense, of which $212,282 is attributable to Class A. |
| | For the period from October 20, 2010 to November 30, 2010, the Fund accrued $7,864 in net deferred income tax expense, of which $2,596 is attributable to Class A. |
| (f) | Ratios including/excluding net deferred income tax benefit (expense) includes applicable franchise tax expense for the period. |
| | For the period from December 1, 2014 to May 31, 2015, the Fund accrued $88,551 in franchise tax expense, of which $23,098 is attributable to Class A. |
| (g) | The ratio of expenses excluding net deferred income tax expense to average net assets before waiver and recoupment was 1.47%, 1.54%, 1.63%, 1.71%, 2.62% and 40.35% for the period from December 1, 2014 to May 31, 2015, fiscal years ended November 30, 2014, 2013, 2012, 2011, and the period from October 20, 2012 to November 30, 2010, respectively. The ratio of expenses excluding net deferred income tax expense to average net assets after waiver and recoupment was 1.47%, 1.59%, 1.65%, 1.65%, 1.65% and 1.65% for the period from December 1, 2014 to May 31, 2015, fiscal years ended November 30, 2014, 2013, 2012, 2011, and the period from October 20, 2012 to November 30, 2010, respectively. |
| | | | | | |
The notes to the financial statements are an integral part of,
and should be read in conjunction with, the financial statements. | | | | | 19 | |
Financial Highlights selected per share data and ratios
| | | | | | | | |
| Investor Class | | Six months
ended
May 31,
2015* | | | July 12,
2014**
through
November 30,
2014 | |
Net asset value at beginning of period | | $ | 22.15 | | | $ | 24.02 | |
| | | | | | | | |
Net investment income (loss) (a) | | | 0.03 | | | | (0.03 | ) |
Net realized and unrealized gain (loss) on investments | | | (0.61 | ) | | | (1.17 | ) |
| | | | | | | | |
Total from investment operations | | | (0.58 | ) | | | (1.20 | ) |
| | | | | | | | |
| Less dividends and distributions: | | | | | | | | |
From net investment income | | | — | | | | (0.29 | ) |
From return of capital | | | (0.67 | ) | | | (0.38 | ) |
| | | | | | | | |
Total dividends and distributions | | | (0.67 | ) | | | (0.67 | ) |
| | | | | | | | |
Net asset value at end of period | | $ | 20.90 | | | $ | 22.15 | |
| | | | | | | | |
Total investment return (b)(c) | | | (2.60 | %)(d) | | | (5.12 | %)(d) |
| Ratios (to average net assets)/Supplemental Data: | | | | | | | | |
Net investment income (loss) (including net deferred income tax benefit (expense)) (e) | | | 1.77 | % (f) | | | 2.79 | % †† |
Net investment income (loss) (excluding net deferred income tax benefit (expense)) (e) | | | 0.14 | % (f) | | | (0.52 | %)†† |
Net expenses (including net deferred income tax (benefit) expense) (e)(g) | | | (0.17 | %)(f) | | | (1.80 | %)†† |
Expenses (before waiver/recoupment, including net deferred income tax (benefit) expense) (e)(g) | | | (0.17 | %)(f) | | | (1.80 | %)†† |
Portfolio turnover rate | | | 17.25 | % | | | 20.70 | % |
Net assets at end of period (in 000’s) | | $ | 2,756 | | | $ | 1,310 | |
| (a) | Per share data based on average shares outstanding during the period. |
| (b) | Total investment return is calculated exclusive of sales charges and assumes the reinvestment of dividends and distributions. |
| (c) | Total investment return is not annualized. |
| (d) | Total investment return may reflect adjustments to conform to generally accepted accounting principles. |
| (e) | For the period from December 1, 2014 to May 31, 2015, the Fund accrued $31,930,050 in net deferred income tax benefit, of which $33,150 is attributable to Investor Class. For the year ended November 30, 2014, the Fund accrued $70,224,241 in net deferred income tax expense, of which $17,830 of deferred income tax benefit is attributable to Investor Class. |
| (f) | Ratios including/excluding net deferred income tax benefit (expense) includes applicable franchise tax expense for the period. |
| | For the period from December 1, 2014 to May 31, 2015, the Fund accrued $88,551 in franchise tax expense, of which $105 is attributable to Investor Class. |
| (g) | The ratio of expenses excluding net deferred income tax expense to average net assets before waiver and recoupment was 1.46% and 1.51%, for the period from December 1, 2014 to May 31, 2015 and the period from July 12, 2014 to November 30, 2014. The ratio of expenses excluding net deferred income tax expense to average net assets after waiver and recoupment was 1.46% and 1.51% for the period from December 1, 2014 to May 31, 2015 and the period from July 12 to November 30, 2010, respectively. |
| | | | |
| 20 | | MainStay Cushing MLP Premier Fund | | The notes to the financial statements are an integral part of,
and should be read in conjunction with, the financial statements. |
Financial Highlights selected per share data and ratios
| | | | | | | | | | | | | | | | | | | | | | | | | | |
| | | Six months
ended
May 31, | | | | | Year ended November 30, | | | October 20,
2010**
through
November 30, | |
| Class C | | 2015* | | | | | 2014 | | | 2013*** | | | 2012*** | | | 2011*** | | | 2010*** | |
Net asset value at beginning of period | | $ | 21.36 | | | | | $ | 20.79 | | | $ | 19.14 | | | $ | 19.73 | | | $ | 20.26 | | | $ | 20.00 | |
| | | | | | | | | | | | | | | | | | | | | | | | | | |
Net investment income (loss) (a) | | | (0.05 | ) | | | | | (0.25 | ) | | | (0.27 | ) | | | (0.27 | ) | | | (0.29 | ) | | | (0.04 | ) |
Net realized and unrealized gain (loss) on investments | | | (0.59 | ) | | | | | 2.16 | | | | 3.26 | | | | 1.02 | | | | 1.06 | | | | 0.30 | |
| | | | | | | | | | | | | | | | | | | | | | | | | | |
Total from investment operations | | | (0.64 | ) | | | | | 1.91 | | | | 2.99 | | | | 0.75 | | | | 0.77 | | | | 0.26 | |
| | | | | | | | | | | | | | | | | | | | | | | | | | |
| Less dividends and distributions: | | | | | | | | | | | | | | | | | | | | | | | | | | |
From net investment income | | | — | | | | | | (0.59 | ) | | | — | | | | — | | | | — | | | | — | |
From return of capital | | | (0.67 | ) | | | | | (0.75 | ) | | | (1.34 | ) | | | (1.34 | ) | | | (1.30 | ) | | | — | |
| | | | | | | | | | | | | | | | | | | | | | | | | | |
Total dividends and distributions | | | (0.67 | ) | | | | | (1.34 | ) | | | (1.34 | ) | | | (1.34 | ) | | | (1.30 | ) | | | — | |
| | | | | | | | | | | | | | | | | | | | | | | | | | |
Redemption fees retained (a)(b) | | | — | | | | | | 0.00 | ‡ | | | 0.00 | ‡ | | | 0.00 | ‡ | | | 0.00 | ‡ | | | — | |
| | | | | | | | | | | | | | | | | | | | | | | | | | |
Net asset value at end of period | | $ | 20.05 | | | | | $ | 21.36 | | | $ | 20.79 | | | $ | 19.14 | | | $ | 19.73 | | | $ | 20.26 | |
| | | | | | | | | | | | | | | | | | | | | | | | | | |
Total investment return (c) | | | (2.98 | %)(d) | | | | | 9.19 | % | | | 16.05 | % | | | 3.82 | % | | | 3.69 | % | | | 1.30 | % (d) |
| Ratios (to average net assets)/Supplemental Data: | | | | | | | | | | | | | | | | | | | | | | | | | | |
Net investment income (loss) (including net deferred income tax benefit (expense)) (e) | | | 0.97 | % (f) | | | | | (5.80 | %) | | | (9.87 | %) | | | (3.70 | %) | | | (2.70 | %) | | | (6.07 | %)†† |
Net investment income (loss) (excluding net deferred income tax benefit (expense)) (e) | | | (0.66 | %)(f) | | | | | (1.68 | %) | | | (1.93 | %) | | | (1.98 | %) | | | (2.04 | %) | | | (2.20 | %)†† |
Net expenses (including net deferred income tax (benefit) expense) (e)(g) | | | 0.58 | % (f) | | | | | 6.46 | % | | | 10.34 | % | | | 4.12 | % | | | 3.07 | % | | | 6.27 | % †† |
Expenses (before waiver/recoupment, including net deferred income tax (benefit) expense) (e)(g) | | | 0.58 | %(f) | | | | | 6.41 | % | | | 10.32 | % | | | 4.18 | % | | | 4.04 | % | | | 44.97 | % †† |
Portfolio turnover rate | | | 17.25 | % | | | | | 20.70 | % | | | 27.29 | % | | | 43.32 | % | | | 72.32 | % | | | 0.74 | % |
Net assets at end of period (in 000’s) | | $ | 841,445 | | | | | $ | 859,193 | | | $ | 568,837 | | | $ | 252,473 | | | $ | 50,321 | | | $ | 598 | |
| *** | These years were audited by a predecessor audit firm whose opinion was unqualified. |
| ‡ | Less than one cent per share. |
| (a) | Per share data based on average shares outstanding during the period. |
| (b) | Redemption fees were only applicable prior to reorganization. (See Note 1) |
| (c) | Total investment return is calculated exclusive of sales charges and assumes the reinvestment of dividends and distributions. |
| (d) | Total investment return is not annualized. |
| (e) | For the period from December 1, 2014 to May 31, 2015, the Fund accrued $31,930,050 in net deferred income tax benefit, of which $13,649,654 is attributable to Class C. |
| | For the year ended November 30, 2014, the Fund accrued $70,224,241 in net deferred income tax expense, of which $31,069,447 is attributable to Class C. |
| | For the year ended November 30, 2013, the Fund accrued $77,002,011 in net deferred income tax expense, of which $33,095,235 is attributable to Class C. |
| | For the year ended November 30, 2012, the Fund accrued $7,120,938 in net deferred income tax expense, of which $147,543 is attributable to Class C. |
| | For the year ended November 30, 2011, the Fund accrued $452,365 in net deferred income tax expense, of which $147,543 is attributable to Class C. |
| | For the period from October 20, 2010 to November 30, 2010, the Fund accrued $7,864 in net deferred income tax expense, of which $1,536 is attributable to Class C. |
| (f) | Ratios including/excluding net deferred income tax benefit (expense) includes applicable franchise tax expense for the period. |
| | For the period from December 1, 2014 to May 31, 2015, the Fund accrued $88,551 in franchise tax expense, of which $37,526 is attributable to Class C. |
| (g) | The ratio of expenses excluding net deferred income tax expense to average net assets before waiver and recoupment was 2.21% 2.29%, 2.38%, 2.46%, 3.37% and 41.10% for the period from December 1, 2014 to May 31, 2015, fiscal years ended November 30, 2014, 2013, 2012, 2011, and the period from October 20, 2012 to November 30, 2010, respectively. The ratio of expenses excluding net deferred income tax expense to average net assets after waiver and recoupment was 2.21%, 2.34%, 2.40%, 2.40%, 2.40% and 2.40% for the period from December 1, 2014 to May 31, 2015, fiscal years ended November 30, 2014, 2013, 2012, 2011, and the period , from October 20, 2012 to November 30, 2010, respectively. |
| | | | | | |
The notes to the financial statements are an integral part of,
and should be read in conjunction with, the financial statements. | | | | | 21 | |
Financial Highlights selected per share data and ratios
| | | | | | | | | | | | | | | | | | | | | | | | | | |
| | | Six months
ended
May 31, | | | | | Year ended November 30, | | | October 20,
2010**
through
November 30, | |
| Class I | | 2015* | | | | | 2014 | | | 2013*** | | | 2012*** | | | 2011*** | | | 2010*** | |
Net asset value at beginning of period | | $ | 22.40 | | | | | $ | 21.54 | | | $ | 19.57 | | | $ | 19.96 | | | $ | 20.28 | | | $ | 20.00 | |
| | | | | | | | | | | | | | | | | | | | | | | | | | |
Net investment income (loss) (a) | | | 0.05 | | | | | | (0.03 | ) | | | (0.07 | ) | | | (0.08 | ) | | | (0.09 | ) | | | (0.02 | ) |
Net realized and unrealized gain (loss) on investments | | | (0.61 | ) | | | | | 2.22 | | | | 3.36 | | | | 1.02 | | | | 1.07 | | | | 0.30 | |
| | | | | | | | | | | | | | | | | | | | | | | | | | |
Total from investment operations | | | (0.56 | ) | | | | | 2.19 | | | | 3.29 | | | | 0.94 | | | | 0.98 | | | | 0.28 | |
| | | | | | | | | | | | | | | | | | | | | | | | | | |
| Less dividends and distributions: | | | | | | | | | | | | | | | | | | | | | | | | | | |
From net investment income | | | — | | | | | | (0.59 | ) | | | — | | | | — | | | | — | | | | — | |
From return of capital | | | (0.67 | ) | | | | | (0.75 | ) | | | (1.34 | ) | | | (1.34 | ) | | | (1.30 | ) | | | — | |
| | | | | | | | | | | | | | | | | | | | | | | | | | |
Total dividends and distributions | | | (0.67 | ) | | | | | (1.34 | ) | | | (1.34 | ) | | | (1.34 | ) | | | (1.30 | ) | | | — | |
| | | | | | | | | | | | | | | | | | | | | | | | | | |
Redemption fees retained (a)(b) | | | — | | | | | | 0.01 | | | | 0.02 | | | | 0.01 | | | | 0.00 | ‡ | | | — | |
| | | | | | | | | | | | | | | | | | | | | | | | | | |
Net asset value at end of period | | $ | 21.17 | | | | | $ | 22.40 | | | $ | 21.54 | | | $ | 19.57 | | | $ | 19.96 | | | $ | 20.28 | |
| | | | | | | | | | | | | | | | | | | | | | | | | | |
Total investment return (c) | | | (2.48 | %)(d) | | | | | 10.25 | % | | | 17.37 | % | | | 4.81 | % | | | 4.75 | % | | | 1.40 | % (d) |
| Ratios (to average net assets)/Supplemental Data: | | | | | | | | | | | | | | | | | | | | | | | | | | |
Net investment income (loss) (including net deferred income tax benefit (expense)) (e) | | | 1.97 | % (f) | | | | | (2.90 | %) | | | (8.87 | %) | | | (2.70 | %) | | | (1.70 | %) | | | (5.07 | %)†† |
Net investment income (loss) (excluding net deferred income tax benefit (expense)) (e) | | | 0.34 | % (f) | | | | | (0.62 | %) | | | (0.93 | %) | | | (0.98 | %) | | | (1.04 | %) | | | (1.20 | %)†† |
Net expenses (including net deferred income tax (benefit) expense) (e)(g) | | | (0.41 | %)(f) | | | | | 3.61 | % | | | 9.34 | % | | | 3.12 | % | | | 2.07 | % | | | 5.27 | % †† |
Expenses (before waiver/recoupment, including net deferred income tax (benefit) expense) (e)(g) | | | (0.41 | %)(f) | | | | | 3.57 | % | | | 9.32 | % | | | 3.18 | % | | | 3.04 | % | | | 43.97 | % †† |
Portfolio turnover rate | | | 17.25 | % | | | | | 20.70 | % | | | 27.29 | % | | | 43.32 | % | | | 72.32 | % | | | 0.74 | % |
Net assets at end of period (in 000’s) | | $ | 616,260 | | | | | $ | 579,546 | | | $ | 221,196 | | | $ | 92,104 | | | $ | 27,847 | | | $ | 1,533 | |
| *** | These years were audited by a predecessor audit firm whose opinion was unqualified. |
| ‡ | Less than one cent per share. |
| (a) | Per share data based on average shares outstanding during the period. |
| (b) | Redemption fees were only applicable prior to reorganization. (See Note 1) |
| (c) | Total investment return is calculated exclusive of sales charges and assumes the reinvestment of dividends and distributions. Class I shares are not subject to sales charges. |
| (d) | Total investment return is not annualized. |
| (e) | For the period from December 1, 2014 to May 31, 2015, the Fund accrued $31,930,050 in net deferred income tax benefit, of which $9,764,430 is attributable to Class I. |
| | For the year ended November 30, 2014, the Fund accrued $70,224,241 in net deferred income tax expense, of which $8,867,624 is attributable to Class I. |
| | For the year ended November 30, 2013, the Fund accrued $77,002,011 in net deferred income tax expense, of which $12,140,833 is attributable to Class I. |
| | For the year ended November 30, 2012, the Fund accrued $7,120,938 in net deferred income tax expense, of which $1,072,968 is attributable to Class I. |
| | For the year ended November 30, 2011, the Fund accrued $452,365 in net deferred income tax expense, of which $92,540 is attributable to Class I. |
| | For the period from October 20, 2010 to November 30, 2010, the Fund accrued $7,864 in net deferred income tax expense, of which $3,732 is attributable to Class I. |
| (f) | Ratios including/excluding net deferred income tax benefit (expense) includes applicable franchise tax expense for the period. |
| | For the period from December 1, 2014 to May 31, 2015, the Fund accrued $88,551 in franchise tax expense, of which $27,822 is attributable to Class I. |
| (g) | The ratio of expenses excluding net deferred income tax expense to average net assets before waiver and recoupment was 1.22%, 1.29%, 1.38%, 1.46%, 2.37% and 40.10% for the period from December 1, 2014 to May 31, 2015, fiscal years ended November 30, 2014, 2013, 2012, 2011, and the period from October 20, 2010 to November 30, 2010, respectively. The ratio of expenses excluding net deferred income tax expense to average net assets after waiver and recoupment was 1.22%, 1.33%, 1.40%, 1.40%, 1.40% and 1.40% for the period from December 1, 2014 to May 31, 2015, fiscal years ended November 30, 2014, 2013, 2012, 2011, and the period from October 20, 2010 to November 30, 2010, respectively. |
| | | | |
| 22 | | MainStay Cushing MLP Premier Fund | | The notes to the financial statements are an integral part of,
and should be read in conjunction with, the financial statements. |
MainStay Cushing Renaissance Advantage Fund
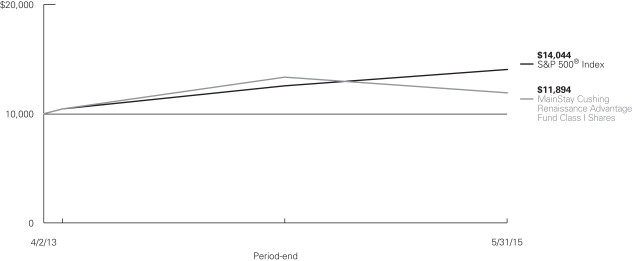
Investment and Performance Comparison1 (Unaudited)
Performance data quoted represents past performance. Past performance is no guarantee of future results. Because of market volatility, current performance may be lower or higher than the figures shown. Investment return and principal value will fluctuate, and as a result, when shares are redeemed, they may be worth more or less than their original cost. The graph below depicts the historical performance of Class I shares of the Fund. Performance will vary from class to class based on differences in class-specific expenses and sales charges. For performance information current to the most recent month-end, please call 800-MAINSTAY (624-6782) or visit mainstayinvestments.com.
Average Annual Total Returns for the Period Ended May 31, 2015
| | | | | | | | | | | | | | | | | | | | |
| Class | | Sales Charge | | | | Six Months | | | One Year | | | Since
Inception
(4/2/13) | | | Gross Expense Ratio2 | |
| Class A Shares4 | | Maximum 5.5% Initial Sales Charge | | With sales charge Excluding sales charge | |
| –7.34
–1.95 | %
| |
| –16.22
–11.11 | %
| |
| 5.24
8.16 | %
| |
| 1.76
1.76 | %
|
| Investor Class Shares3 | | Maximum 5.5% Initial Sales Charge | | With sales charge Excluding sales charge | |
| –7.42
–2.04 |
| |
| –16.22
–11.11 |
| |
| 5.24
8.16 |
| |
| 1.88
1.88 |
|
| Class C Shares4 | | Maximum 1% CDSC if Redeemed Within One Year of Purchase | | With sales charge Excluding sales charge | |
| –3.33
–2.37 |
| |
| –12.68
–11.82 |
| |
| 7.40
7.40 |
| |
| 2.63
2.63 |
|
| Class I Shares4 | | No Sales Charge | | | | | –1.86 | | | | –10.90 | | | | 8.35 | | | | 1.51 | |
| 1. | The performance table and graph do not reflect the deduction of taxes that a shareholder would pay on distributions or Fund share redemptions. Total returns reflect maximum applicable sales charges as indicated in the table above, changes in share price, and reinvestment of dividend and capital gain distributions. The graph assumes the initial investment amount shown above and reflects the deduction of all sales charges that would have applied for the period of investment. Performance figures reflect certain fee waivers and/or expense limitations, without which total returns may have been lower. For more information on share classes and current fee waivers and/or expense limitations, please refer to the notes to the financial statements. |
| 2. | The gross expense ratios presented reflect the Fund’s “Total Annual Fund Operating Expenses” from the most recent Prospectus and may differ from other expense ratios disclosed in this report. |
| 3. | Performance figures for Investor Class shares, first offered on July 11, 2014, include the historical performance of Class A shares through July 10, 2014, adjusted for differences in certain expenses and fees. Unadjusted, the performance for Investor Class shares would likely have been different. |
| 4. | Performance figures for Class A shares, Class C shares and Class I shares reflect the historical performance of the then-existing Class A shares, Class C shares and Class I shares, respectively, of the Cushing® Renaissance Advantage Fund (the predecessor to the Fund, which was subject to a different fee structure) for periods prior to July 11, 2014. The Cushing® Renaissance Advantage Fund commenced operations on April 2, 2013. |
The footnotes on the next page are an integral part of the table and graph and should be carefully read in conjunction with them.
| | | | | | | | | | | | |
| Benchmark Performance | | Six Months | | | One
Year | | | Since
Inception | |
S&P 500® Index5 | | | 2.97 | % | | | 11.81 | % | | | 17.01 | % |
Average Lipper Natural Resources Fund6 | | | –0.19 | | | | –20.11 | | | | 0.51 | |
| 5. | “S&P 500®” is a trademark of The McGraw-Hill Companies, Inc. The S&P 500® Index is widely regarded as the standard index for measuring large-cap U.S. stock market performance. The S&P 500® Index is the Fund’s primary benchmark. Results assume reinvestment of all dividends and capital gains. An investment cannot be made directly in an index. |
| 6. | The average Lipper Natural Resources Fund is representative of funds that invest primarily in the equity securities of domestic companies engaged in |
| | the exploration, development, production, or distribution of natural resources (including oil, natural gas, and base minerals) and/or alternative energy sources (including solar, wind, hydro, tidal, and geothermal). This benchmark is a product of Lipper Inc. Lipper Inc. is an independent monitor of fund performance. Results are based on total returns with all dividend and capital gain distributions reinvested. |
The footnotes on the preceding page are an integral part of the table and graph and should be carefully read in conjunction with them.
| | |
| 24 | | MainStay Cushing Renaissance Advantage Fund |
Cost in Dollars of a $1,000 Investment in MainStay Cushing Renaissance Advantage Fund (Unaudited)
The example below is intended to describe the fees and expenses borne by shareholders during the six-month period from December 1, 2014, to May 31, 2015, and the impact of those costs on your investment.
Example
As a shareholder of the Fund, you incur two types of costs: (1) transaction costs, including exchange fees and sales charges (loads) on purchases (as applicable), and (2) ongoing costs, including management fees, distribution and/or service (12b-1) fees, and other Fund expenses (as applicable). This example is intended to help you understand your ongoing costs (in dollars) of investing in the Fund and to compare these costs with the ongoing costs of investing in other mutual funds. The example is based on an investment of $1,000 made at the beginning of the six-month period and held for the entire period from December 1, 2014, to May 31, 2015.
This example illustrates your Fund’s ongoing costs in two ways:
Actual Expenses
The second and third data columns in the table below provide information about actual account values and actual expenses. You may use the information in these columns, together with the amount you invested, to estimate the expenses that you paid during the six months ended May 31, 2015. Simply divide your account value by $1,000 (for example, an $8,600 account value divided by $1,000 = 8.6), then
multiply the result by the number under the heading entitled “Expenses Paid During Period” to estimate the expenses you paid on your account during this period.
Hypothetical Example for Comparison Purposes
The fourth and fifth data columns in the table below provide information about hypothetical account values and hypothetical expenses based on the Fund’s actual expense ratio and an assumed rate of return of 5% per year before expenses, which is not the Fund’s actual return. The hypothetical account values and expenses may not be used to estimate the actual ending account balances or expenses you paid for the six-month period shown. You may use this information to compare the ongoing costs of investing in the Fund with the ongoing costs of investing in other Funds. To do so, compare this 5% hypothetical example with the 5% hypothetical examples that appear in the shareholder reports of the other Funds.
Please note that the expenses shown in the table are meant to highlight your ongoing costs only and do not reflect any transactional costs, such as exchange fees or sales charges (loads). Therefore, the fourth and fifth data columns of the table are useful in comparing ongoing costs only and will not help you determine the relative total costs of owning different funds. In addition, if these transactional costs were included, your costs would have been higher.
| | | | | | | | | | | | | | | | | | | | |
| | | | | | | | | | | | | | | | |
| Share Class | | Beginning Account Value 12/1/14 | | | Ending Account Value (Based on Actual Returns and Expenses)
5/31/15 | | | Expenses Paid During Period1 | | | Ending Account Value (Based on Hypothetical 5% Annualized Return and Actual Expenses) 5/31/15 | | | Expenses
Paid During
Period1 | |
| | | | | |
| Class A Shares | | $ | 1,000.00 | | | $ | 980.50 | | | $ | 8.59 | | | $ | 1016.26 | | | $ | 8.75 | |
| | | | | |
| Investor Class Shares | | $ | 1,000.00 | | | $ | 979.60 | | | $ | 9.03 | | | $ | 1,015.81 | | | $ | 9.20 | |
| | | | | |
| Class C Shares | | $ | 1,000.00 | | | $ | 976.30 | | | $ | 12.71 | | | $ | 1,012.07 | | | $ | 12.94 | |
| | | | | |
| Class I Shares | | $ | 1,000.00 | | | $ | 981.40 | | | $ | 7.36 | | | $ | 1,017.50 | | | $ | 7.49 | |
| 1. | Expenses are equal to the Fund’s annualized expense ratio of each class (1.74% for Class A, 1.83% for Investor Class, 2.58% for Class C and 1.49% for Class I) multiplied by the average account value over the period, divided by 365 and multiplied by 182 for Class A, Investor Class, Class C and Class I (to reflect the six-month period). The table above represents the actual expenses incurred during the six-month period. |
Portfolio Composition as of May 31, 2015(1) (Unaudited)
(Expressed as a Percentage of Total Investments)

See Portfolio of Investments beginning on page 29 for specific holdings within these categories.
Top Ten Holdings as of May 31, 2015 (excluding short-term investments)
| 6. | Marathon Petroleum Corporation |
| 9. | Dominion Resources, Inc. |
| 10. | The Dow Chemical Company |
| (1) | Fund holdings and sector allocations are subject to change, and there is no assurance that the Fund will continue to hold any particular security. |
| (2) | Master Limited Partnerships and Related Companies |
| | |
| 26 | | MainStay Cushing Renaissance Advantage Fund |
Portfolio Management Discussion and Analysis (Unaudited)
Questions answered by portfolio managers Jerry V. Swank, Matthew A. Lemme, CFA, and Saket Kumar of Cushing Asset Management, LP, the Fund’s Subadvisor.
How did MainStay Cushing Renaissance Advantage Fund perform relative to its primary benchmark and peers during the six months ended May 31, 2015?
Excluding all sales charges, MainStay Cushing Renaissance Advantage Fund returned –1.95% for Class A shares, –2.04% for Investor Class shares and –2.37% for Class C shares for the six months ended May 31, 2015. Over the same period, Class I shares returned –1.86%. For the six months ended May 31, 2015, all share classes underperformed the 2.97% return of the S&P 500® Index,1 which is the Fund’s broad-based securities-market index. Over the same period, all share classes underperformed the –0.19% return of the Average Lipper2 Natural Resources Fund. See page 23 for Fund returns with applicable sales charges.
What factors affected the Fund’s performance relative to the S&P 500® Index during the reporting period?
The Fund’s performance relative to the S&P 500® Index during the reporting period reflected the fact that the top-two performing sectors in the S&P 500® Index were health care and consumer discretionary, neither of which were sectors in which the Fund invested.
Which subsectors were the strongest contributors to the Fund’s absolute performance and which subsectors were particularly weak?
During the reporting period, the most substantial contributors to the Fund’s absolute performance were refiners, chemicals and midstream. (Contributions take weightings and total returns into account.) The most substantial detractors from the Fund’s absolute performance during the reporting period were oilfield services, utilities, and engineering & construction.
During the reporting period, which individual holdings made the strongest contributions to the Fund’s absolute performance and which holdings detracted the most?
During the reporting period, the strongest individual contributors to the Fund’s absolute performance were locomotive and rail components manufacturer Wabtec Corporation, coatings manufacturer The Sherwin-Williams Company and oil refiner Marathon Petroleum Corporation. Wabtec benefited from changes in railcar regulations that require new braking systems on tank cars, a market in which Wabtec had an approximately 50% share as of the end of the reporting period. Sherwin-Williams was the beneficiary of both reduced feedstock costs (part of their paint formulation is petroleum-based) and growth in existing and new home sales. Marathon Petroleum benefited from a combination of strong demand for gasoline and diesel fuel and from exceptionally wide refining margins caused by a
build in crude oil inventories and regional pricing dislocations from oil’s rapid decline.
The most substantial detractors from the Fund’s absolute performance during the reporting period included equipment rental company H&E Equipment Services Inc., Rice Energy Inc., and Eastman Chemical Company. H&E Equipment Services shares fell as investors grew concerned that the company’s industrial customers, many of which were building new plants to benefit from cheap and abundant U.S. energy, would delay or cancel projects. Rice Energy shares also fell with oil & gas stocks broadly, driven by the decline in oil prices. Eastman shares suffered from several disappointing consecutive quarterly earnings reports.
Did the Fund make any significant purchases or sales during the reporting period?
The Fund initiated a position in oil refiner Valero Energy Corporation in January 2015 and quickly increased it to approximately 3% of the Fund as of May 31, 2015. The increase reflected our view that refining margins for Valero’s Gulf Coast plants would expand with rising midcontinent oil inventories and that the company’s West Coast refineries would benefit from unplanned outages at competitors’ facilities. During the reporting period, the Fund also initiated a position in trucking company JB Hunt Transportation Services Inc. The purchase reflected our view that trucking would benefit directly from lower fuel costs and indirectly from higher consumer-driven demand for goods. As of May 31, 2015, JB Hunt Transportation Services represented approximately 2.3% of the Fund’s total assets.
The Fund sold its entire position in oil refiner Delek US Holdings Inc., which was over a 2% position at the beginning of the reporting period. Most of the catalysts that we had identified last year when we bought the stock had been exhausted, including stock buybacks and an acquisition, and we believed that the stock was close to fully valued. The Fund also sold most of its holdings in equipment rental company United Rentals Inc., near the end of the reporting period because we were increasingly concerned about revenue effect and perceptions of future revenue effects from the low price of oil. United Rentals supplies equipment for construction of chemical and industrial plants, and many investors are concerned about the viability of some of these projects in the current commodity environment.
How did the Fund’s subsector weightings change during the reporting period?
The Fund increased exposure to transportation stocks by over 10 percentage points by increasing exposure to shipping and trucking, and concentrating in core names. Refining exposure also increased by about 4 percentage points. Exposure to
| 1. | See footnote on page 24 for more information on the S&P 500® Index. |
| 2. | See footnote on page 24 for more information on Lipper Inc. |
oilfield services stocks and industrial stocks fell the most during the reporting period. Oilfield services exposure fell by 5.5 percentage points and went to zero shortly after the beginning of the reporting period. We viewed the space as structurally challenged in a lower oil-price environment. Exposure to industrial stocks fell 1.5 percentage points as we substantially reduced one of our long-term holdings.
How was the Fund positioned at the end of the reporting period?
As of May 31, 2015, the Fund continued to hold a large portion of its portfolio in transportation and industrial stocks. These two subsectors constituted about 41% of the Fund at the end of the reporting period. As of the same date, we continued to limit direct commodity exposure and had very little exploration & production exposure and zero oilfield services exposure. As of May 31, 2015, we continued to favor chemicals and select refining stocks.
The opinions expressed are those of the portfolio managers as of the date of this report and are subject to change. There is no guarantee that any forecast made will come to pass. This material does not constitute investment advice and is not intended as an endorsement of any specific investment.
| | |
| 28 | | MainStay Cushing Renaissance Advantage Fund |
Portfolio of Investments May 31, 2015 (Unaudited)
| | | | | | | | |
| | |
| | | Shares | | | Value | |
| | | | | | | | |
| Common Stock 94.5%† | |
Chemicals 14.4% | |
Netherlands 2.3% | |
LyondellBasell Industries NV | | | 61,337 | | | $ | 6,201,171 | |
United States 12.1% | | | | | | | | |
Polyone Corporation | | | 186,758 | | | | 7,263,019 | |
PPG Industries, Inc. | | | 23,915 | | | | 5,473,904 | |
¨The Dow Chemical Company | | | 165,209 | | | | 8,602,433 | |
The Sherwin Williams Company | | | 17,957 | | | | 5,174,848 | |
Westlake Chemical Corporation | | | 94,647 | | | | 6,673,560 | |
| | | | | | | | |
| | | | | | | 39,388,935 | |
| | | | | | | | |
Commercial Service Supplies & Distributors 0.6% | |
United States 0.6% | |
Mobile Mini, Inc. | | | 41,302 | | | | 1,638,863 | |
| | | | | | | | |
|
Construction & Engineering 3.1% | |
United States 3.1% | |
Chart Industries Inc. (a) | | | 45,638 | | | | 1,481,410 | |
Quanta Services, Inc. (a) | | | 239,064 | | | | 7,009,356 | |
| | | | | | | | |
| | | | | | | 8,490,766 | |
| | | | | | | | |
Machinery 10.9% | |
United States 10.9% | |
Flowserve Corporation | | | 62,388 | | | | 3,431,340 | |
Greenbrier Companies, Inc. | | | 114,928 | | | | 6,922,113 | |
ITT Corporation | | | 108,463 | | | | 4,629,201 | |
The Lincoln Electric Company | | | 28,732 | | | | 1,931,078 | |
¨Wabtec Corporation | | | 129,112 | | | | 12,949,934 | |
| | | | | | | | |
| | | | | | | 29,863,666 | |
| | | | | | | | |
Materials 3.7% | |
United States 3.7% | |
Eagle Materials Inc. | | | 37,360 | | | | 3,118,813 | |
Sealed Air Corp. | | | 143,660 | | | | 6,996,242 | |
| | | | | | | | |
| | | | | | | 10,115,055 | |
| | | | | | | | |
Oil & Gas Exploration & Production 1.5% | |
United States 1.5% | |
Cimarex Energy Co. | | | 3,571 | | | | 412,486 | |
Continental Resources, Inc. (a) | | | 15,000 | | | | 683,400 | |
EOG Resource, Inc. | | | 15,000 | | | | 1,330,350 | |
QEP Resources, Inc. | | | 80,000 | | | | 1,506,400 | |
| | | | | | | | |
| | | | | | | 3,932,636 | |
| | | | | | | | |
Oil & Gas Refining & Marketing 15.1% | |
United States 15.1% | |
¨Marathon Petroleum Corporation | | | 101,065 | | | | 10,456,185 | |
¨Phillips 66 | | | 158,026 | | | | 12,503,017 | |
Tesoro Corporation | | | 63,000 | | | | 5,575,500 | |
Valero Energy Corporation | | | 140,068 | | | | 8,297,628 | |
| | | | | | | | |
| | |
| | | Shares | | | Value | |
| | | | | | | | |
Oil & Gas Refining & Marketing (continued) | |
United States (continued) | |
Western Refining Inc. | | | 103,000 | | | $ | 4,529,940 | |
| | | | | | | | |
| | | | | | | 41,362,270 | |
| | | | | | | | |
Oil & Gas Storage & Transportation 13.7% | |
Bermuda 4.8% | |
¨GasLog Ltd. | | | 462,994 | | | | 9,583,976 | |
Golar LNG Ltd. | | | 76,217 | | | | 3,621,070 | |
Republic of the Marshall Islands 4.2% | |
¨Teekay Corp. | | | 253,355 | | | | 11,608,726 | |
United States 4.7% | |
¨Cheniere Energy Inc. (a) | | | 168,082 | | | | 12,745,658 | |
| | | | | | | | |
| | | | | | | 37,559,430 | |
| | | | | | | | |
Trading Companies & Distributors 1.4% | |
United States 1.4% | |
Neff Corp. (a) | | | 193,941 | | | | 1,989,835 | |
United Rentals, Inc. (a) | | | 21,830 | | | | 1,940,905 | |
| | | | | | | | |
| | | | | | | 3,930,740 | |
| | | | | | | | |
Transportation 16.1% | |
Canada 0.9% | |
Canadian Pacific Railway Limited | | | 15,000 | | | | 2,470,650 | |
United States 15.2% | |
CSX Corp. | | | 82,604 | | | | 2,815,145 | |
Old Dominion Freight Line (a) | | | 58,182 | | | | 3,956,958 | |
J.B. Hunt Transport Services, Inc. | | | 73,805 | | | | 6,201,096 | |
¨Ryder Systems, Inc. | | | 150,397 | | | | 13,783,885 | |
Saia Inc. (a) | | | 35,915 | | | | 1,470,360 | |
Swift Transportation Company (a) | | | 168,800 | | | | 3,927,976 | |
Union Pacific Corp. | | | 47,408 | | | | 4,783,941 | |
XPO Logistics, Inc. (a) | | | 96,737 | | | | 4,755,590 | |
| | | | | | | | |
| | | | | | | 44,165,601 | |
| | | | | | | | |
Utilities 14.0% | |
United States 14.0% | |
Calpine Corporation (a) | | | 287,320 | | | | 5,775,132 | |
Centerpoint Energy, Inc. | | | 254,996 | | | | 5,194,268 | |
¨Dominion Resources, Inc. | | | 125,990 | | | | 8,884,815 | |
ITC Holdings Corp. | | | 100,000 | | | | 3,529,000 | |
NRG Energy, Inc. | | | 215,490 | | | | 5,430,348 | |
¨Sempra Energy | | | 89,787 | | | | 9,649,409 | |
| | | | | | | | |
| | | | | | | 38,462,972 | |
| | | | | | | | |
Total Common Stock
(Cost $247,996,742) | | | | | | | 258,910,934 | |
| | | | | | | | |
| † | Calculated as a percentage of net assets applicable to common shareholders. |
| ¨ | | Among the Portfolio’s 10 largest holdings or issuers held, as of May 31, 2015, excluding short-term investments. May be subject to change daily. |
| | | | | | |
The notes to the financial statements are an integral part of,
and should be read in conjunction with, the financial statements. | | | | | 29 | |
Portfolio of Investments May 31, 2015 (Unaudited) (continued)
| | | | | | | | |
| | |
| | | Shares | | | Value | |
| | | | | | | | |
| Master Limited Partnerships and Related Companies 4.5% | |
Oil & Gas Storage & Transportation 4.5% | |
Republic of the Marshall Islands 3.1% | |
Capital Products Partners, L.P. | | | 452,151 | | | $ | 4,119,095 | |
GasLog Partners, L.P. | | | 144,654 | | | | 3,688,677 | |
Hoegh LNG Partners, L.P. | | | 36,877 | | | | 848,171 | |
United States 1.4% | |
Energy Transfer Equity, L.P. | | | 54,591 | | | | 3,748,764 | |
| | | | | | | | |
| | | | | | | 12,404,707 | |
| | | | | | | | |
Total Master Limited Partnerships and Related Companies
(Cost $11,137,625) | | | | | | | 12,404,707 | |
| | | | | | | | |
|
| Short-Term Investments—Investment Companies 0.9% | |
United States 0.9% | |
AIM Short-Term Treasury Portfolio Fund—Institutional Class, 0.02% (b) | | | 464,452 | | | | 464,452 | |
Fidelity Government Portfolio Fund—Institutional Class, 0.01% (b) | | | 464,452 | | | | 464,452 | |
Fidelity Money Market Portfolio—Institutional Class, 0.11% (b) | | | 464,452 | | | | 464,452 | |
| | | | | | | | |
| | |
| | | Shares | | | Value | |
| | | | | | | | |
United States (continued) | |
First American Government Obligations Fund—Class Z, 0.01% (b) | | | 464,453 | | | $ | 464,453 | |
Invesco STIC Prime Portfolio, 0.07% (b) | | | 464,452 | | | | 464,452 | |
| | | | | | | | |
Total Short-Term Investments—Investment Companies
(Cost $2,322,261) | | | | 2,322,261 | |
| | | | | | | | |
Total Investments
(Cost $261,456,628) (c) | | | 99.9 | % | | | 273,637,902 | |
Other Assets in Excess of Liabilities | | | 0.1 | | | | 348,899 | |
Net Assets | | | 100.0 | % | | $ | 273,986,801 | |
| (a) | No distribution or dividend was made during the period ended May 31, 2015. As such, it is classified as a non-income producing security as of May 31, 2015. |
| (b) | Rate reported is the current yield as of May 31, 2015. |
| (c) | As of May 31, 2015, cost was $263,227,178 for federal income tax purposes and net unrealized appreciation was as follows: |
| | | | |
Gross unrealized appreciation | | $ | 18,695,439 | |
Gross unrealized depreciation | | | (8,284,715 | ) |
| | | | |
Net unrealized appreciation | | $ | 10,410,724 | |
| | | | |
The following is a summary of the fair valuations according to the inputs used as of May 31, 2015, for valuing the Fund’s assets and liabilities.
Asset Valuation Inputs
| | | | | | | | | | | | | | | | |
Description | | Quoted
Prices in
Active
Markets for
Identical
Assets
(Level 1) | | | Significant
Other
Observable
Inputs
(Level 2) | | | Significant
Unobservable
Inputs
(Level 3) | | | Total | |
| Investments in Securities (a) | | | | | | | | | | | | | | | | |
Common Stock | | $ | 258,910,934 | | | $ | — | | | $ | — | | | $ | 258,910,934 | |
Master Limited Partnerships and Related Companies | | | 12,404,707 | | | | — | | | | — | | | | 12,404,707 | |
Short-Term Investments | | | 2,322,261 | | | | — | | | | — | | | | 2,322,261 | |
| | | | | | | | | | | | | | | | |
| Total Investments in Securities | | $ | 273,637,902 | | | $ | — | | | $ | — | | | $ | 273,637,902 | |
| | | | | | | | | | | | | | | | |
| (a) | For a complete listing of investments and their industries, see the Portfolio of Investments. |
The Fund recognizes transfers between the levels as of the beginning of the period.
For the period ended May 31, 2015, the Fund did not have any transfers between Level 1 and Level 2 fair value measurements. (See Note 2)
As of May 31, 2015, the Fund did not hold any investments with significant unobservable inputs (Level 3). (See Note 2)
| | | | |
| 30 | | MainStay Cushing Renaissance Advantage Fund | | The notes to the financial statements are an integral part of,
and should be read in conjunction with, the financial statements. |
Statement of Assets and Liabilities as of May 31, 2015 (Unaudited)
| | | | |
| Assets | |
Investments, at value
(identified cost $261,456,628) | | $ | 273,637,902 | |
Receivables: | | | | |
Investments sold | | | 3,192,192 | |
Dividends and interest | | | 550,705 | |
Fund shares sold | | | 364,442 | |
Prepaid expenses | | | 148,139 | |
| | | | |
Total assets | | | 277,893,380 | |
| | | | |
|
| Liabilities | |
Payables: | | | | |
Investments purchased | | | 2,779,928 | |
Fund shares redeemed | | | 528,838 | |
Manager fees (See Note 3) | | | 278,685 | |
Transfer agent (See Note 3) | | | 231,038 | |
NYLIFE Distributors (See Note 3) | | | 53,003 | |
Professional fees | | | 29,343 | |
Trustees | | | 5,370 | |
Custodian | | | 374 | |
| | | | |
Total liabilities | | | 3,906,579 | |
| | | | |
Net assets | | $ | 273,986,801 | |
| | | | |
|
| Composition of Net Assets | |
Shares of beneficial interest outstanding (par value of $.001 per share) unlimited number of shares authorized | | $ | 12,156 | |
Additional paid-in capital | | | 315,811,544 | |
| | | | |
| | | 315,823,700 | |
Undistributed net investment income | | | 364,750 | |
Accumulated net realized gain (loss) on investments | | | (54,382,923 | ) |
Net unrealized appreciation (depreciation) on investments | | | 12,181,274 | |
| | | | |
Net assets | | $ | 273,986,801 | |
| | | | |
| | | | |
Class A | | | | |
Net assets applicable to outstanding shares | | $ | 58,907,513 | |
| | | | |
Shares of beneficial interest outstanding | | | 2,613,097 | |
| | | | |
Net asset value per share outstanding | | $ | 22.54 | |
Maximum sales charge (5.50% of offering price) | | | 1.24 | |
| | | | |
Maximum offering price per share outstanding | | $ | 23.78 | |
| | | | |
Investor Class | | | | |
Net assets applicable to outstanding shares | | $ | 2,843,192 | |
| | | | |
Shares of beneficial interest outstanding | | | 126,116 | |
| | | | |
Net asset value per share outstanding | | $ | 22.54 | |
Maximum sales charge (5.50% of offering price) | | | 1.24 | |
| | | | |
Maximum offering price per share outstanding | | $ | 23.78 | |
| | | | |
Class C | | | | |
Net assets applicable to outstanding shares | | $ | 46,218,979 | |
| | | | |
Shares of beneficial interest outstanding | | | 2,082,951 | |
| | | | |
Net asset value per share outstanding | | $ | 22.19 | |
| | | | |
Class I | | | | |
Net assets applicable to outstanding shares | | $ | 166,017,117 | |
| | | | |
Shares of beneficial interest outstanding | | | 7,334,256 | |
| | | | |
Net asset value per share outstanding | | $ | 22.64 | |
| | | | |
| | | | | | |
The notes to the financial statements are an integral part of,
and should be read in conjunction with, the financial statements. | | | | | 31 | |
Statement of Operations for the six months ended May 31, 2015 (Unaudited)
| | | | |
| Investment Income (Loss) | |
Income | |
Dividends and distributions | | | | |
(Net of return of capital of $148,509) (a) | | $ | 3,416,594 | |
Interest | | | 1,397 | |
| | | | |
Total income | | | 3,417,991 | |
| | | | |
Expenses | | | | |
Manager (See Note 3) | | | 2,286,051 | |
Transfer agent (See Note 3) | | | 351,485 | |
Distribution/Service—Class A (See Note 3) | | | 67,135 | |
Distribution/Service—Investor Class (See Note 3) | | | 2,800 | |
Distribution/Service—Class C (See Note 3) | | | 227,175 | |
Registration | | | 80,951 | |
Professional fees | | | 24,881 | |
Shareholder communication | | | 11,467 | |
Trustees | | | 7,688 | |
Custodian | | | 4,055 | |
Miscellaneous | | | 3,617 | |
| | | | |
Total expenses before recovery of previous waivers | | | 3,067,305 | |
Expense waiver/reimbursement from Manager (See Note 3) | | | (19,782 | ) |
| | | | |
Net expenses | | | 3,047,523 | |
| | | | |
Net investment income (loss) | | | 370,468 | |
| | | | |
|
| Realized and Unrealized Gain (Loss) on Investments | |
Net realized gain (loss) on investments (b) | | | (43,810,741 | ) |
Net change in unrealized appreciation (depreciation) | | | 34,350,072 | |
| | | | |
Net realized and unrealized gain (loss) on investments | | | (9,460,669 | ) |
| | | | |
Net increase (decrease) in net assets resulting from operations | | $ | (9,090,201 | ) |
| | | | |
| (a) | Dividends and distributions recorded net of foreign withholding taxes in the amount of $2,596. |
| (b) | Includes realized net loss of $2,678,381 due to an in-kind redemption during the six-month period ended May 31, 2015 (See Note 9). |
| | | | |
| 32 | | MainStay Cushing Renaissance Advantage Fund | | The notes to the financial statements are an integral part of,
and should be read in conjunction with, the financial statements. |
Statements of Changes in Net Assets
| | | | | | | | |
| | | Six months ended May 31, 2015 (Unaudited) | | | Year ended November 30, 2014 | |
| Increase (Decrease) in Net Assets | |
Operations: | | | | | | | | |
Net investment income (loss) | | $ | 370,468 | | | $ | 254,429 | |
Net realized gain (loss) on investments | | | (43,810,741 | ) | | | (10,615,161 | ) |
Net change in unrealized appreciation (depreciation) on investments | | | 34,350,072 | | | | (23,486,369 | ) |
| | | | |
Net increase (decrease) in net assets resulting from operations | | | (9,090,201 | ) | | | (33,847,101 | ) |
| | | | |
Dividends and distributions to shareholders: | | | | | | | | |
From net investment income: | | | | | | | | |
Class A | | | — | | | | (30,993 | ) |
Investor Class | | | — | | | | (456 | ) |
Class C | | | — | | | | (24,795 | ) |
Class I | | | — | | | | (144,092 | ) |
| | | | |
| | | — | | | | (200,336 | ) |
| | | | |
From return of capital: | | | | | | | | |
Class A | | | (674,903 | ) | | | (474,870 | ) |
Investor Class | | | (28,840 | ) | | | (6,995 | ) |
Class C | | | (576,582 | ) | | | (379,894 | ) |
Class I | | | (3,513,812 | ) | | | (2,207,751 | ) |
| | | | |
| | | (4,794,137 | ) | | | (3,069,510 | ) |
| | | | |
Total dividends and distributions to shareholders | | | (4,794,137 | ) | | | (3,269,846 | ) |
| | | | |
Capital share transactions: | | | | | | | | |
Net proceeds from sale of shares | | | 120,007,395 | | | | 465,017,287 | |
Net asset value of shares issued to shareholders in reinvestment of dividends and distributions | | | 4,421,289 | | | | 2,784,065 | |
Cost of shares redeemed (a) | | | (252,705,454 | ) | | | (40,445,800 | ) |
| | | | |
Increase (decrease) in net assets derived from capital share transactions | | | (128,276,770 | ) | | | 427,355,552 | |
| | | | |
Net increase (decrease) in net assets | | | (142,161,108 | ) | | | 390,238,605 | |
| | |
| Net Assets | | | | | | | | |
Beginning of period | | | 416,147,909 | | | | 25,909,304 | |
| | | | |
End of period | | $ | 273,986,801 | | | $ | 416,147,909 | |
| | | | |
Undistributed (distributions in excess of) net investment income at end of period | | $ | 364,750 | | | $ | (5,718 | ) |
| | | | |
| (a) | Includes an in-kind redemption in the amount of $106,860,629 during the six-month period ended May 31, 2015 (See Note 9). |
| | | | | | |
The notes to the financial statements are an integral part of,
and should be read in conjunction with, the financial statements. | | | | | 33 | |
Financial Highlights selected per share data and ratios
| | | | | | | | | | | | |
| Class A | | Six months
ended
May 31,
2015* | | | Year ended
November 30,
2014 | | | April 2,
2013**
through
November 30,
2013*** | |
Net asset value at beginning of period | | $ | 23.29 | | | $ | 22.65 | | | $ | 20.00 | |
| | | | | | | | | | | | |
Net investment income (loss) (a) | | | 0.03 | | | | 0.01 | | | | (0.12 | ) |
Net realized and unrealized gain (loss) on investments | | | (0.50 | ) | | | 1.19 | | | | 3.09 | |
| | | | | | | | | | | | |
Total from investment operations | | | (0.47 | ) | | | 1.20 | | | | 2.97 | |
| | | | | | | | | | | | |
| Less dividends and distributions: | | | | | | | | | | | | |
From net investment income | | | — | | | | (0.03 | ) | | | — | |
From net realized gain on investment | | | — | | | | — | | | | (0.02 | ) |
From return of capital | | | (0.28 | ) | | | (0.53 | ) | | | (0.30 | ) |
| | | | | | | | | | | | |
Total dividends and distributions | | | (0.28 | ) | | | (0.56 | ) | | | (0.32 | ) |
| | | | | | | | | | | | |
Redemption fees retained (a)(b) | | | — | | | | 0.00 | ‡ | | | 0.00 | ‡ |
| | | | | | | | | | | | |
Net asset value at end of period | | $ | 22.54 | | | $ | 23.29 | | | $ | 22.65 | |
| | | | | | | | | | | | |
Total investment return (c) | | | (1.95 | %)(d) | | | 5.14 | % | | | 14.92 | % (d) |
| Ratios (to average net assets)/Supplemental Data: | | | | | | | | | | | | |
Net investment income (loss) | | | 0.25 | % †† | | | 0.03 | % | | | (0.83 | %)†† |
Net expenses | | | 1.74 | % †† | | | 1.80 | % | | | 2.00 | % †† |
Expenses (before waiver/reimbursement) | | | 1.75 | % †† | | | 1.81 | % | | | 5.65 | % †† |
Portfolio turnover rate | | | 83.48 | % | | | 115.22 | % | | | 23.44 | % |
Net assets at end of period (in 000’s) | | $ | 58,908 | | | $ | 51,472 | | | $ | 6,867 | |
| *** | This period was audited by a predecessor audit firm whose opinion was unqualified. |
| ‡ | Less than one cent per share. |
| (a) | Per share data based on average shares outstanding during the period. |
| (b) | Redemption fees were only applicable prior to reorganization. (See Note 1) |
| (c) | Total investment return is calculated exclusive of sales charges and assumes the reinvestment of dividends and distributions. |
| (d) | Total investment return is not annualized. |
| | | | |
| 34 | | MainStay Cushing Renaissance Advantage Fund | | The notes to the financial statements are an integral part of,
and should be read in conjunction with, the financial statements. |
Financial Highlights selected per share data and ratios
| | | | | | | | |
| Investor Class | | Six months
ended
May 31,
2015* | | | July 12,
2014**
through
November 30,
2014 | |
Net asset value at beginning of period | | $ | 23.30 | | | $ | 26.80 | |
| | | | | | | | |
Net investment income (loss) (a) | | | 0.02 | | | | 0.03 | |
Net realized and unrealized gain (loss) on investments | | | (0.50 | ) | | | (3.25 | ) |
| | | | | | | | |
Total from investment operations | | | (0.48 | ) | | | (3.22 | ) |
| | | | | | | | |
| Less dividends and distributions: | | | | | | | | |
From net investment income | | | — | | | | (0.02 | ) |
From return of capital | | | (0.28 | ) | | | (0.26 | ) |
| | | | | | | | |
Total dividends and distributions | | | (0.28 | ) | | | (0.28 | ) |
| | | | | | | | |
Net asset value at end of period | | $ | 22.54 | | | $ | 23.30 | |
| | | | | | | | |
Total investment return (b)(c) | | | (2.04 | %)(d) | | | (12.10 | %)(d) |
| Ratios (to average net assets)/Supplemental Data: | | | | | | | | |
Net investment income (loss) | | | 0.20 | % †† | | | 0.31 | % †† |
Net expenses | | | 1.83 | % †† | | | 1.70 | % †† |
Expenses (before waiver/reimbursement) | | | 1.84 | % †† | | | 1.70 | % †† |
Portfolio turnover rate | | | 83.48 | % | | | 115.22 | % |
Net assets at end of period (in 000’s) | | $ | 2,843 | | | $ | 1,651 | |
| (a) | Per share data based on average shares outstanding during the period. |
| (b) | Total investment return is calculated exclusive of sales charges and assumes the reinvestment of dividends and distributions. |
| (c) | Total investment return may reflect adjustments to conform to generally accepted accounting principles. |
| (d) | Total investment return is not annualized. |
| | | | | | |
The notes to the financial statements are an integral part of,
and should be read in conjunction with, the financial statements. | | | | | 35 | |
Financial Highlights selected per share data and ratios
| | | | | | | | | | | | |
| Class C | | Six months
ended
May 31,
2015* | | | Year
ended
November 30,
2014 | | | April 2,
2013**
through
November 30,
2013*** | |
Net asset value at beginning of period | | $ | 23.02 | | | $ | 22.56 | | | $ | 20.00 | |
| | | | | | | | | | | | |
Net investment income (loss) (a) | | | (0.07 | ) | | | (0.16 | ) | | | (0.23 | ) |
Net realized and unrealized gain (loss) on investments | | | (0.48 | ) | | | 1.18 | | | | 3.11 | |
| | | | | | | | | | | | |
Total from investment operations | | | (0.55 | ) | | | 1.02 | | | | 2.88 | |
| | | | | | | | | | | | |
| Less dividends and distributions: | | | | | | | | | | | | |
From net investment income | | | — | | | | (0.03 | ) | | | — | |
From net realized gain on investment | | | — | | | | — | | | | (0.02 | ) |
From return of capital | | | (0.28 | ) | | | (0.53 | ) | | | (0.30 | ) |
| | | | | | | | | | | | |
Total dividends and distributions | | | (0.28 | ) | | | (0.56 | ) | | | (0.32 | ) |
| | | | | | | | | | | | |
Redemption fees retained (a)(b) | | | — | | | | 0.00 | ‡ | | | — | |
| | | | | | | | | | | | |
Net asset value at end of period | | $ | 22.19 | | | $ | 23.02 | | | $ | 22.56 | |
| | | | | | | | | | | | |
Total investment return (c) | | | (2.37 | %)(d) | | | 4.40 | % | | | 14.47 | % (d) |
| Ratios (to average net assets)/Supplemental Data: | | | | | | | | | | | | |
Net investment income (loss) | | | (0.61 | %)†† | | | (0.65 | %) | | | (1.58 | %)†† |
Net expenses | | | 2.58 | % †† | | | 2.52 | % | | | 2.75 | % †† |
Expenses (before waiver/reimbursement) | | | 2.59 | % †† | | | 2.53 | % | | | 6.40 | % †† |
Portfolio turnover rate | | | 83.48 | % | | | 115.22 | % | | | 23.44 | % |
Net assets at end of period (in 000’s) | | $ | 46,219 | | | $ | 47,022 | | | $ | 2,263 | |
| *** | This period was audited by a predecessor audit firm whose opinion was unqualified. |
| ‡ | Less than one cent per share. |
| (a) | Per share data based on average shares outstanding during the period. |
| (b) | Redemption fees were only applicable prior to reorganization. (See Note 1) |
| (c) | Total investment return is calculated exclusive of sales charges and assumes the reinvestment of dividends and distributions. |
| (d) | Total investment return is not annualized. |
| | | | |
| 36 | | MainStay Cushing Renaissance Advantage Fund | | The notes to the financial statements are an integral part of,
and should be read in conjunction with, the financial statements. |
Financial Highlights selected per share data and ratios
| | | | | | | | | | | | |
| Class I | | Six months
ended
May 31,
2015* | | | Year
ended
November 30,
2014 | | | April 2,
2013**
through
November 30,
2013*** | |
Net asset value at beginning of period | | $ | 23.36 | | | $ | 22.66 | | | $ | 20.00 | |
| | | | | | | | | | | | |
Net investment income (loss) (a) | | | 0.04 | | | | 0.09 | | | | (0.08 | ) |
Net realized and unrealized gain (loss) on investments | | | (0.48 | ) | | | 1.17 | | | | 3.06 | |
| | | | | | | | | | | | |
Total from investment operations | | | (0.44 | ) | | | 1.26 | | | | 2.98 | |
| | | | | | | | | | | | |
| Less dividends and distributions: | | | | | | | | | | | | |
From net investment income | | | — | | | | (0.03 | ) | | | — | |
From net realized gain on investment | | | — | | | | — | | | | (0.02 | ) |
From return of capital | | | (0.28 | ) | | | (0.53 | ) | | | (0.30 | ) |
| | | | | | | | | | | | |
Total dividends and distributions | | | (0.28 | ) | | | (0.56 | ) | | | (0.32 | ) |
| | | | | | | | | | | | |
Redemption fees retained (a)(b) | | | — | | | | 0.00 | ‡ | | | 0.00 | ‡ |
| | | | | | | | | | | | |
Net asset value at end of period | | $ | 22.64 | | | $ | 23.36 | | | $ | 22.66 | |
| | | | | | | | | | | | |
Total investment return (c) | | | (1.86 | %)(d) | | | 5.41 | % | | | 14.97 | % (d) |
| Ratios (to average net assets)/Supplemental Data: | | | | | | | | | | | | |
Net investment income (loss) | | | 0.33 | % †† | | | 0.37 | % | | | (0.58 | %)†† |
Net expenses | | | 1.49 | % †† | | | 1.51 | % | | | 1.75 | % †† |
Expenses (before waiver/reimbursement) | | | 1.50 | % †† | | | 1.52 | % | | | 5.40 | % †† |
Portfolio turnover rate | | | 83.48 | % | | | 115.22 | % | | | 23.44 | % |
Net assets at end of period (in 000’s) | | $ | 166,017 | | | $ | 316,002 | | | $ | 16,779 | |
| *** | This period was audited by a predecessor audit firm whose opinion was unqualified. |
| ‡ | Less than one cent per share. |
| (a) | Per share data based on average shares outstanding during the period. |
| (b) | Redemption fees were only applicable prior to reorganization. (See Note 1) |
| (c) | Total investment return is calculated exclusive of sales charges and assumes the reinvestment of dividends and distributions. Class I shares are not subject to sales charges. |
| (d) | Total investment return is not annualized. |
| | | | | | |
The notes to the financial statements are an integral part of,
and should be read in conjunction with, the financial statements. | | | | | 37 | |
MainStay Cushing Royalty Energy Income Fund
Investment and Performance Comparison1 (Unaudited)
Performance data quoted represents past performance. Past performance is no guarantee of future results. Because of market volatility, current performance may be lower or higher than the figures shown. Investment return and principal value will fluctuate, and as a result, when shares are redeemed, they may be worth more or less than their original cost. The graph below depicts the historical performance of Class I shares of the Fund. Performance will vary from class to class based on differences in class-specific expenses and sales charges. For performance information current to the most recent month-end, please call 800-MAINSTAY (624-6782) or visit mainstayinvestments.com.
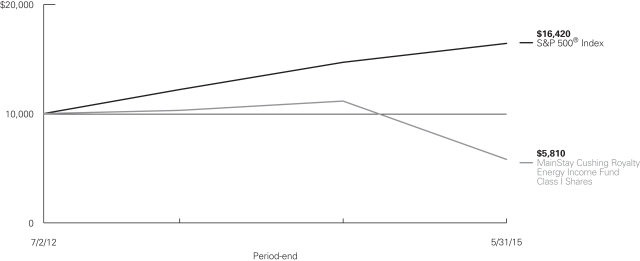
Average Annual Total Returns for the Period Ended May 31, 2015
| | | | | | | | | | | | | | | | | | | | |
| Class | | Sales Charge | | | | Six Months | | | One Year | | | Since
Inception
(7/2/12) | | | Gross Expense Ratio2 | |
| Class A Shares4 | | Maximum 5.5% Initial Sales Charge | | With sales charge Excluding sales charge | |
| –32.13
–28.18 | %
| |
| –50.96
–47.97 | %
| |
| –18.90
–17.23 | %
| |
| 1.88
1.88 | %
|
| Investor Class Shares3 | | Maximum 5.5% Initial Sales Charge | | With sales charge Excluding sales charge | |
| –32.13
–28.18 |
| |
| –50.96
–47.96 |
| |
| –18.90
–17.23 |
| |
| 1.90
1.90 |
|
| Class C Shares4 | | Maximum 1% CDSC if Redeemed Within One Year of Purchase | | With sales charge Excluding sales charge | |
| –29.19
–28.50 |
| |
| –48.86
–48.39 |
| |
| –17.86
–17.86 |
| |
| 2.65
2.65 |
|
| Class I Shares4 | | No Sales Charge | | | | | –28.06 | | | | –47.81 | | | | –17.01 | | | | 1.63 | |
| 1. | The performance table and graph do not reflect the deduction of taxes that a shareholder would pay on distributions or Fund share redemptions. Total returns reflect maximum applicable sales charges as indicated in the table above, changes in share price, and reinvestment of dividend and capital gain distributions. The graph assumes the initial investment amount shown above and reflects the deduction of all sales charges that would have applied for the period of investment. Performance figures reflect certain fee waivers and/or expense limitations, without which total returns may have been lower. For more information on share classes and current fee waivers and/or expense limitations, please refer to the notes to the financial statements. |
| 2. | The gross expense ratios presented reflect the Fund’s “Total Annual Fund Operating Expenses” from the most recent Prospectus and may differ from other expense ratios disclosed in this report. |
| 3. | Performance figures for Investor Class shares, first offered on July 11, 2014, include the historical performance of Class A shares through July 10, 2014, adjusted to reflect differences in certain fees and expenses. Unadjusted, the performance for Investor Class shares would likely have been different. |
| 4. | Performance figures for Class A shares, Class C shares and Class I shares reflect the historical performance of the then-existing Class A shares, Class C shares and Class I shares, respectively, of the Cushing® Royalty Energy Income Fund (the predecessor to the Fund, which was subject to a different fee structure) for periods prior to July 11, 2014. The Cushing® Royalty Energy Income Fund commenced operations on July 2, 2012. |
The footnotes on the next page are an integral part of the table and graph and should be carefully read in conjunction with them.
| | |
| 38 | | MainStay Cushing Royalty Energy Income Fund |
| | | | | | | | | | | | |
| Benchmark Performance | | Six
Months | | | One
Year | | | Since
Inception | |
S&P 500® Index5 | | | 2.97 | % | | | 11.81 | % | | | 18.58 | % |
Average Lipper Energy MLP Fund6 | | | –4.31 | % | | | –4.24 | % | | | 8.94 | |
| 5. | “S&P 500®” is a trademark of The McGraw-Hill Companies, Inc. The S&P 500® Index is widely regarded as the standard index for measuring large-cap U.S. stock market performance. The S&P 500® Index is the Fund’s primary benchmark. Results assume reinvestment of all dividends and capital gains. An investment cannot be made directly in an index. |
| 6. | The average Lipper Energy MLP Fund is representative of funds that invest primarily in Master Limited Partnerships (MLPs) engaged in the |
| | transportation, storage and processing of minerals and natural resources. This benchmark is a product of Lipper Inc. Lipper Inc. is an independent monitor of fund performance. Results are based on total returns with all dividend and capital gain distributions reinvested. |
The footnotes on the preceding page are an integral part of the table and graph and should be carefully read in conjunction with them.
Cost in Dollars of a $1,000 Investment in MainStay Cushing Royalty Energy Income Fund (Unaudited)
The example below is intended to describe the fees and expenses borne by shareholders during the six-month period from December 1, 2014, to May 31, 2015, and the impact of those costs on your investment.
Example
As a shareholder of the Fund, you incur two types of costs: (1) transaction costs, including exchange fees and sales charges (loads) on purchases (as applicable), and (2) ongoing costs, including management fees, distribution and/or service (12b-1) fees, and other Fund expenses (as applicable). This example is intended to help you understand your ongoing costs (in dollars) of investing in the Fund and to compare these costs with the ongoing costs of investing in other mutual funds. The example is based on an investment of $1,000 made at the beginning of the six-month period and held for the entire period from December 1, 2014, to May 31, 2015.
This example illustrates your Fund’s ongoing costs in two ways:
Actual Expenses
The second and third data columns in the table below provide information about actual account values and actual expenses. You may use the information in these columns, together with the amount you invested, to estimate the expenses that you paid during the six months ended May 31, 2015. Simply divide your account value by $1,000 (for example, an $8,600 account value divided by $1,000 = 8.6), then
multiply the result by the number under the heading entitled “Expenses Paid During Period” to estimate the expenses you paid on your account during this period.
Hypothetical Example for Comparison Purposes
The fourth and fifth data columns in the table below provide information about hypothetical account values and hypothetical expenses based on the Fund’s actual expense ratio and an assumed rate of return of 5% per year before expenses, which is not the Fund’s actual return. The hypothetical account values and expenses may not be used to estimate the actual ending account balances or expenses you paid for the six-month period shown. You may use this information to compare the ongoing costs of investing in the Fund with the ongoing costs of investing in other Funds. To do so, compare this 5% hypothetical example with the 5% hypothetical examples that appear in the shareholder reports of the other Funds.
Please note that the expenses shown in the table are meant to highlight your ongoing costs only and do not reflect any transactional costs, such as exchange fees or sales charges (loads). Therefore, the fourth and fifth data columns of the table are useful in comparing ongoing costs only and will not help you determine the relative total costs of owning different funds. In addition, if these transactional costs were included, your costs would have been higher.
| | | | | | | | | | | | | | | | | | | | |
| | | | | | | | | | | | | | | | |
| Share Class | | Beginning
Account Value
12/1/14 | | | Ending Account Value (Based
on Actual
Returns and
Expenses)
5/31/15 | | | Expenses
Paid
(Received) During
Period1 | | | Ending Account
Value (Based
on Hypothetical
5% Annualized
Return and
Actual Expenses)
5/31/15 | | | Expenses
Paid During
Period1 | |
| | | | | |
| Class A Shares | | $ | 1,000.00 | | | $ | 718.20 | | | $ | 7.50 | | | $ | 1,016.21 | | | $ | 8.80 | |
| | | | | |
| Investor Class Shares | | $ | 1,000.00 | | | $ | 718.20 | | | $ | 7.45 | | | $ | 1,016.26 | | | $ | 8.75 | |
| | | | | |
| Class C Shares | | $ | 1,000.00 | | | $ | 715.00 | | | $ | 10.65 | | | $ | 1,012.52 | | | $ | 12.49 | |
| | | | | |
| Class I Shares | | $ | 1,000.00 | | | $ | 719.40 | | | $ | 6.39 | | | $ | 1,017.50 | | | $ | 7.49 | |
| 1. | Expenses are equal to the Fund’s annualized expense ratio of each class (1.75% for Class A, 1.74% for Investor Class, 2.49% for Class C and 1.49% for Class I) multiplied by the average account value over the period, divided by 365 and multiplied by 182 for Class A, Investor Class, Class C and Class I (to reflect the six-month period). The table above represents the actual expenses incurred during the six-month period. |
| | |
| 40 | | MainStay Cushing Royalty Energy Income Fund |
Portfolio Composition as of May 31, 2015(1) (Unaudited)
(Expressed as a Percentage of Total Investments)

See Portfolio of Investments beginning on page 44 for specific holdings within these categories.
Top Ten Holdings as of May 31, 2015 (excluding short-term investments)
| 1. | Memorial Production Partners, L.P. |
| 2. | Vanguard Natural Resources, LLC |
| 3. | EV Energy Partners, L.P. |
| 5. | Williams Partners, L.P. |
| 6. | Energy Transfer Partners, L.P. |
| 8. | Targa Resources Partners, L.P. |
| 9. | Dorchester Minerals, L.P. |
| (1) | Fund holdings and sector allocations are subject to change, and there is no assurance that the Fund will continue to hold any particular security. |
| (2) | Master Limited Partnerships and Related Companies |
Portfolio Management Discussion and Analysis (Unaudited)
Questions answered by portfolio managers Jerry V. Swank, Daniel L. Spears and Judd B. Cryer of Cushing Asset Management, LP, the Fund’s Subadvisor.
How did MainStay Cushing Royalty Energy Income Fund perform relative to its primary benchmark and peers during the six months ended May 31, 2015?
Excluding all sales charges, MainStay Cushing Royalty Energy Income Fund returned –28.18% for Class A shares and Investor Class shares and –28.50% for Class C shares. Over the same period, Class I shares returned –28.06%. For the six months ended May 31, 2015, all share classes underperformed the 2.97% return of the S&P 500® Index,1 which is the Fund’s broad-based securities-market index. Over the same period, all share classes underperformed the –4.31% return of the Average Lipper2 Energy MLP Fund. See page 38 for Fund returns with applicable sales charges.
What factors affected the Fund’s performance relative to the S&P 500® Index during the reporting period?
During the reporting period, the most significant factors that affected the Fund’s performance relative to the S&P 500® Index were the continued volatility and decline in domestic and international crude oil prices and the subsequent reduction of distribution rates by upstream master limited partnerships (“MLPs”) held by the Fund. The S&P 500® Index includes stocks across many sectors, while the Fund’s exposure was limited to the energy sector. It was therefore not surprising that declining crude oil prices led the Fund to underperform the S&P 500® Index during the reporting period.
Which subsectors were the strongest contributors to the Fund’s absolute performance and which subsectors were particularly weak?
The Fund invests primarily in four subsectors: upstream MLPs, U.S. royalty trusts, Canadian exploration and production (“E&P”) companies (“Energy Trusts”), and other energy companies (“Other Energy Companies”). The top contributors to the Fund’s absolute performance during the reporting period were upstream MLPs and Canadian E&P companies. (Contributions take weightings and total returns into account). On average, these subsectors represented the highest and third-highest Fund weightings during the reporting period; and they both provided negative absolute performance.
The subsectors with the weakest contributions to the Fund’s absolute performance during the reporting period were Other Energy Companies and U.S. Energy Trusts. The Other Energy Companies subsector had the second-highest weighting, while the U.S. Energy Trust subsector had a very small weighting. Both of these subsectors provided negative absolute performance during the reporting period.
Performance in all of the Fund’s main subsectors was particularly hard hit by the deteriorating and volatile commodity-price environment.
During the reporting period, which individual holdings made the strongest contributions to the Fund’s absolute performance and which holdings detracted the most?
The strongest positive contribution to the Fund’s absolute performance came from large-cap diversified MLP William Partners, L.P., followed by upstream MLP Memorial Production Partners, L.P., and petroleum product shipping MLP Capital Product Partners, L.P. The greatest detractor from the Fund’s absolute performance during the reporting period was upstream MLP BreitBurn Energy Partners, L.P., followed by upstream MLP EV Energy Partners, L.P., and upstream MLP Atlas Resource Partners, L.P. Each of these detractors had negative absolute performance driven by the fall in crude oil prices.
Did the Fund make any significant purchases or sales during the reporting period?
During the reporting period, upstream MLPs in general came under significant pressure because of the decline in crude oil prices. As a result, they faced difficult fundamentals and strained balance sheets. Because of the accompanying extraordinary volatility and the decline in fundamentals for the subsector, the Fund decreased overall exposure to upstream MLPs and replaced this exposure with investments in integrated energy companies and certain large-capitalization oil and natural gas E&P companies. Large purchases included positions in integrated energy company Chevron Corp. and exploration and production company Occidental Petroleum Corp. The Fund purchased its positions in these companies because of their size, their more-conservative balance sheets and their exposure to crude oil prices.
During the reporting period, large sales included Linn Energy, LLC, and BreitBurn Energy Partners, L.P., both upstream MLPs. The Fund sold its positions in these MLPs because of their high debt levels and distressed fundamentals resulting from the collapse in crude oil and natural gas liquids prices.
How did the Fund’s subsector weightings change during the reporting period?
During the reporting period, the Fund decreased its exposure to the upstream MLP subsector and the U.S. Energy Trust subsector. The Fund also increased exposure to Other Energy Companies during the reporting period. These included integrated energy companies, oil and natural gas E&P companies and midstream MLPs. Exposure to Canadian E&P companies remained relatively unchanged.
| 1. | See footnote on page 39 for more information on the S&P 500® Index. |
| 2. | See footnote on page 39 for more information on Lipper Inc. |
| | |
| 42 | | MainStay Cushing Royalty Energy Income Fund |
How was the Fund positioned at the end of the reporting period?
As of May 31, 2015, the Fund’s largest subsector position was in Other Energy Companies, followed by upstream MLPs and Canadian E&P companies. As of the same date, the majority of the Fund’s exposure was in Other Energy Companies and upstream MLPs.
The opinions expressed are those of the portfolio managers as of the date of this report and are subject to change. There is no guarantee that any forecast made will come to pass. This material does not constitute investment advice and is not intended as an endorsement of any specific investment.
Portfolio of Investments May 31, 2015 (Unaudited)
| | | | | | | | |
| | |
Shares | | | Value | |
Common Stock 26.7%† | |
Integrated Oil & Gas 9.1% | |
Netherlands 1.4% | |
Royal Dutch Shell Plc | | | 53,000 | | | $ | 3,165,160 | |
| | | | | | | | |
|
United States 7.7% | |
Chevron Corporation | | | 71,000 | | | | 7,313,000 | |
Exxon Mobil Corporation | | | 48,000 | | | | 4,089,600 | |
Occidental Petroleum Corporation | | | 82,000 | | | | 6,411,580 | |
| | | | | | | | |
| | | | | | | 20,979,340 | |
| | | | | | | | |
Oil & Gas Exploration & Production 14.9% | |
Canada 2.7% | |
Vermilion Energy Inc. | | | 144,000 | | | | 6,179,865 | |
| | | | | | | | |
|
United States 12.2% | |
Anadarko Petroleum Corporation | | | 61,400 | | | | 5,133,654 | |
ConocoPhillips Co. | | | 100,315 | | | | 6,388,059 | |
Devon Energy Corporation | | | 80,411 | | | | 5,244,405 | |
EOG Resource, Inc. | | | 73,756 | | | | 6,541,420 | |
Pioneer Natural Resource Co. | | | 30,938 | | | | 4,573,564 | |
| | | | | | | | |
| | | | | | | 34,060,967 | |
| | | | | | | | |
Upstream 2.7% | |
Canada 2.7% | |
Arc Resources Ltd. | | | 340,577 | | | | 6,238,617 | |
| | | | | | | | |
Total Common Stock
(Cost $64,820,429) | | | | | | | 61,278,924 | |
| | | | | | | | |
|
| Master Limited Partnerships and Related Companies 63.8% | |
Crude Oil & Refined Products 3.4% | |
United States 3.4% | |
¨NuStar Energy, L.P. | | | 124,000 | | | | 7,738,840 | |
| | | | | | | | |
|
Large Cap Diversified 12.6% | |
United States 12.6% | |
¨Energy Transfer Partners, L.P. | | | 168,672 | | | | 9,484,427 | |
¨ONEOK Partners, L.P. | | | 218,000 | | | | 8,512,900 | |
¨Williams Partners, L.P. | | | 196,000 | | | | 10,952,480 | |
| | | | | | | | |
| | | | | | | 28,949,807 | |
| | | | | | | | |
Natural Gas Gatherers & Processors 6.3% | |
United States 6.3% | |
Enable Midstream Partners, L.P. | | | 364,000 | | | | 6,479,200 | |
¨Targa Resources Partners, L.P. | | | 184,600 | | | | 7,980,258 | |
| | | | | | | | |
| | | | | | | 14,459,458 | |
| | | | | | | | |
| | | | | | | | |
| | |
Shares | | | Value | |
Other 1.4% | |
Republic of the Marshall Islands 1.4% | |
Seadrill Partners, LLC | | | 240,169 | | | $ | 3,307,127 | |
| | | | | | | | |
|
Shipping 3.7% | |
Republic of the Marshall Islands 3.7% | |
Golar LNG Partners, L.P. | | | 201,500 | | | | 5,684,315 | |
Teekay Offshore Partners, L.P. | | | 125,000 | | | | 2,793,750 | |
| | | | | | | | |
| | | | | | | 8,478,065 | |
| | | | | | | | |
Upstream 36.4% | |
Republic of the Marshall Islands 2.1% | |
Capital Products Partners, L.P. | | | 535,295 | | | | 4,876,537 | |
| | | | | | | | |
|
United States 34.3% | |
Atlas Resource Partners, L.P. | | | 756,499 | | | | 5,726,698 | |
¨Dorchester Minerals, L.P. | | | 342,598 | | | | 7,766,697 | |
¨EV Energy Partners, L.P. | | | 1,015,279 | | | | 14,345,892 | |
¨Legacy Reserves, L.P. | | | 1,363,776 | | | | 13,692,311 | |
LRR Energy, L.P. | | | 175,232 | | | | 1,391,342 | |
¨Memorial Production Partners, L.P. | | | 1,123,035 | | | | 16,778,143 | |
Mid-Con Energy Partners, L.P. | | | 435,244 | | | | 2,502,653 | |
¨Vanguard Natural Resources, LLC | | | 1,030,590 | | | | 16,365,769 | |
| | | | | | | | |
| | | | | | | 83,446,042 | |
| | | | | | | | |
Total Master Limited Partnerships and Related Companies
(Cost $190,397,780) | | | | | | | 146,379,339 | |
| | | | | | | | |
|
| Short-Term Investments—Investment Companies 9.0% | |
United States 9.0% | |
AIM Short-Term Treasury Portfolio Fund—Institutional Class, 0.02% (a) | | | 4,114,598 | | | | 4,114,598 | |
Fidelity Government Portfolio Fund—Institutional Class, 0.01% (a) | | | 4,114,598 | | | | 4,114,598 | |
Fidelity Money Market Portfolio—Institutional Class, 0.11% (a) | | | 4,114,598 | | | | 4,114,598 | |
First American Government Obligations Fund—Class Z, 0.01% (a) | | | 4,114,599 | | | | 4,114,599 | |
Invesco STIC Prime Portfolio, 0.07% (a) | | | 4,114,598 | | | | 4,114,598 | |
| | | | | | | | |
Total Short-Term Investments—Investment Companies (Cost $20,572,991) | | | | | | | 20,572,991 | |
| | | | | | | | |
Total Investments
(Cost $275,791,200) (b) | | | 99.5 | % | | | 228,231,254 | |
Other Assets in Excess of Liabilities | | | 0.5 | | | | 1,062,625 | |
Net Assets | | | 100.0 | % | | $ | 229,293,879 | |
| (a) | Rate reported is the current yield as of May 31, 2015. |
| † | Calculated as a percentage of net assets applicable to common shareholders. |
| ¨ | | Among the Portfolio’s 10 largest holdings or issuers held, as of May 31, 2015, excluding short-term investments. May be subject to change daily. |
| | | | |
| 44 | | MainStay Cushing Royalty Energy Income Fund | | The notes to the financial statements are an integral part of,
and should be read in conjunction with, the financial statements. |
| (b) | As of May 31, 2015, cost was $278,925,059 for federal income tax purposes and net unrealized appreciation was as follows: |
| | | | |
Gross unrealized appreciation | | $ | 25,074,009 | |
Gross unrealized depreciation | | | (75,767,814 | ) |
| | | | |
Net unrealized depreciation | | $ | (50,693,805 | ) |
| | | | |
The following is a summary of the fair valuations according to the inputs used as of May 31, 2015, for valuing the Fund’s assets and liabilities.
Asset Valuation Inputs
| | | | | | | | | | | | | | | | |
Description | | Quoted
Prices in
Active
Markets for
Identical
Assets
(Level 1) | | | Significant
Other
Observable
Inputs
(Level 2) | | | Significant
Unobservable
Inputs
(Level 3) | | | Total | |
| Investments in Securities (a) | | | | | | | | | | | | | | | | |
Common Stock | | $ | 61,278,924 | | | $ | — | | | $ | — | | | $ | 61,278,924 | |
Master Limited Partnerships and Related Companies | | | 146,379,339 | | | | — | | | | — | | | | 146,379,339 | |
Short-Term Investments | | | 20,572,991 | | | | — | | | | — | | | | 20,572,991 | |
| | | | | | | | | | | | | | | | |
| Total Investments in Securities | | $ | 228,231,254 | | | $ | — | | | $ | — | | | $ | 228,231,254 | |
| | | | | | | | | | | | | | | | |
| (a) | For a complete listing of investments and their industries, see the Portfolio of Investments. |
The Fund recognizes transfers between the levels as of the beginning of the period.
For the period ended May 31, 2015, the Fund did not have any transfers between Level 1 and Level 2 fair value measurements. (See Note 2)
As of May 31, 2015, the Fund did not hold any investments with significant unobservable inputs (Level 3). (See Note 2)
| | | | | | |
The notes to the financial statements are an integral part of,
and should be read in conjunction with, the financial statements. | | | | | 45 | |
Statement of Assets and Liabilities as of May 31, 2015 (Unaudited)
| | | | |
| Assets | |
Investments, at value
(identified cost $275,791,200) | | $ | 228,231,254 | |
Receivables: | | | | |
Fund shares sold | | | 1,000,410 | |
Dividends and interest | | | 487,999 | |
Prepaid expenses | | | 195,461 | |
| | | | |
Total assets | | | 229,915,124 | |
| | | | |
| |
| Liabilities | | | | |
Payables: | | | | |
Fund shares redeemed | | | 194,202 | |
Advisory fees (See Note 3) | | | 260,293 | |
NYLIFE Distributors (See Note 3) | | | 88,957 | |
Transfer agent (See Note 3) | | | 33,328 | |
Professional fees | | | 37,421 | |
Trustees | | | 6,598 | |
Custodian | | | 446 | |
| | | | |
Total liabilities | | | 621,245 | |
| | | | |
Net assets | | $ | 229,293,879 | |
| | | | |
| |
| Composition of Net Assets | | | | |
Shares of beneficial interest outstanding (par value of $.001 per share) unlimited number of shares authorized | | $ | 25,735 | |
Additional paid-in capital | | | 391,701,751 | |
| | | | |
| | | 391,727,486 | |
Accumulated net investment loss, net of income taxes | | | (818,588 | ) |
Accumulated net realized gain (loss) on investments, net of income taxes | | | (113,483,856 | ) |
Net unrealized appreciation (depreciation) on investments, net of income taxes | | | (48,131,163 | ) |
| | | | |
Net assets | | $ | 229,293,879 | |
| | | | |
| | | | |
Class A | | | | |
Net assets applicable to outstanding shares | | $ | 104,238,357 | |
| | | | |
Shares of beneficial interest outstanding | | | 11,659,272 | |
| | | | |
Net asset value per share outstanding | | $ | 8.94 | |
Maximum sales charge (5.50% of offering price) | | | 0.49 | |
| | | | |
Maximum offering price per share outstanding | | $ | 9.43 | |
| | | | |
Investor Class | | | | |
Net assets applicable to outstanding shares | | $ | 3,071,286 | |
| | | | |
Shares of beneficial interest outstanding | | | 343,642 | |
| | | | |
Net asset value per share outstanding | | $ | 8.94 | |
Maximum sales charge (5.50% of offering price) | | | 0.49 | |
| | | | |
Maximum offering price per share outstanding | | $ | 9.43 | |
| | | | |
Class C | | | | |
Net assets applicable to outstanding shares | | $ | 54,387,687 | |
| | | | |
Shares of beneficial interest outstanding | | | 6,234,636 | |
| | | | |
Net asset value per share outstanding | | $ | 8.72 | |
| | | | |
Class I | | | | |
Net assets applicable to outstanding shares | | $ | 67,596,549 | |
| | | | |
Shares of beneficial interest outstanding | | | 7,497,347 | |
| | | | |
Net asset value per share outstanding | | $ | 9.02 | |
| | | | |
| | | | |
| 46 | | MainStay Cushing Royalty Energy Income Fund | | The notes to the financial statements are an integral part of,
and should be read in conjunction with, the financial statements. |
Statement of Operations for the six months ended May 31, 2015 (Unaudited)
| | | | |
| Investment Income (Loss) | |
Income | | | | |
Dividends and distributions
(Net of return of capital of $7,544,524) (a) | | $ | 1,955,831 | |
Interest | | | 6,785 | |
| | | | |
Total Income | | | 1,962,616 | |
| | | | |
Expenses | | | | |
Manager (See Note 3) | | | 1,604,942 | |
Distribution/Service—Class A (See Note 3) | | | 136,663 | |
Distribution/Service—Investor Class (See Note 3) | | | 2,304 | |
Distribution/Service—Class C (See Note 3) | | | 251,848 | |
Transfer agent (See Note 3) | | | 163,016 | |
Registration | | | 81,322 | |
Professional fees | | | 41,475 | |
Franchise tax | | | 17,992 | |
Shareholder communication | | | 8,175 | |
Trustees | | | 7,759 | |
Custodian | | | 3,969 | |
Miscellaneous | | | 3,690 | |
| | | | |
Total expenses before recovery of previous waivers | | | 2,323,155 | |
Expense waiver/reimbursement from Manager (see Note 3) | | | (155,712 | ) |
| | | | |
Net expenses | | | 2,167,443 | |
| | | | |
Net investment income (Loss) | | | (204,827 | ) |
| | | | |
|
| Realized and Unrealized Gain (Loss) on Investments | |
Net realized gain (loss) on: | | | | |
Investments | | | (108,575,558 | ) |
Foreign currency transactions | | | (9,831 | ) |
| | | | |
Net realized gain (loss) on investments | | | (108,585,389 | ) |
| | | | |
Net change in unrealized appreciation (depreciation) on: | | | | |
Investments | | | 23,357,482 | |
Foreign currency translations | | | 2,215 | |
| | | | |
Net change in unrealized appreciation (depreciation) | | | 23,359,697 | |
| | | | |
Net realized and unrealized gain (loss) on investments | | | (85,225,692 | ) |
| | | | |
Net increase (decrease) in net assets resulting from operations | | $ | (85,430,519 | ) |
| | | | |
| (a) | Dividends and distributions recorded net of foreign withholding taxes in the amount of $108,083. |
| | | | | | |
The notes to the financial statements are an integral part of,
and should be read in conjunction with, the financial statements. | | | | | 47 | |
Statements of Changes in Net Assets
| | | | | | | | |
| | | Six months
ended
May 31,
2015
(Unaudited) | | | Year
ended
November 30,
2014 | |
| Increase (Decrease) in Net Assets | |
Operations: | | | | | | | | |
Net investment income (loss) | | $ | (204,827 | ) | | $ | (631,369 | ) |
Net realized gain (loss) on investments | | | (108,585,389 | ) | | | (3,930,018 | ) |
Net change in unrealized appreciation (depreciation) on investments | | | 23,359,697 | | | | (72,633,645 | ) |
| | | | |
Net increase (decrease) in net assets resulting from operations | | | (85,430,519 | ) | | | (77,195,032 | ) |
| | | | |
Dividends and distributions to shareholders: | | | | | | | | |
From return of capital: | | | | | | | | |
Class A | | | (4,625,123 | ) | | | (7,839,149 | ) |
Investor Class | | | (87,767 | ) | | | (16,376 | ) |
Class C | | | (2,204,789 | ) | | | (2,107,208 | ) |
Class I | | | (3,511,597 | ) | | | (2,213,237 | ) |
| | | | |
| | | (10,429,276 | ) | | | (12,175,970 | ) |
| | | | |
Total dividends and distributions to shareholders | | | (10,429,276 | ) | | | (12,175,970 | ) |
| | | | |
Capital share transactions: | | | | | | | | |
Net proceeds from sale of shares | | | 181,266,229 | | | | 334,154,320 | |
Net asset value of shares issued to shareholders in reinvestment of dividends and distributions | | | 9,428,301 | | | | 10,602,789 | |
Cost of shares redeemed | | | (146,035,106 | ) | | | (35,503,765 | ) |
| | | | |
Increase (decrease) in net assets derived from capital share transactions | | | 44,659,424 | | | | 309,253,344 | |
| | | | |
Net increase (decrease) in net assets | | | (51,200,371 | ) | | | 219,882,342 | |
|
| Net Assets | |
Beginning of year | | | 280,494,250 | | | | 60,611,908 | |
| | | | |
End of year | | $ | 229,293,879 | | | $ | 280,494,250 | |
| | | | |
Accumulated net investment loss, net of income taxes | | $ | (818,588 | ) | | $ | (613,761 | ) |
| | | | |
| | | | |
| 48 | | MainStay Cushing Royalty Energy Income Fund | | The notes to the financial statements are an integral part of,
and should be read in conjunction with, the financial statements. |
Financial Highlights selected per share data and ratios
| | | | | | | | | | | | | | | | |
| | | Six months
ended
May 31, | | | Year ended November 30, | | | July 2,
2012**
through
November 30, | |
| Class A | | 2015* | | | 2014 | | | 2013*** | | | 2012*** | |
Net asset value at beginning of period | | $ | 12.99 | | | $ | 18.23 | | | $ | 19.58 | | | $ | 20.00 | |
| | | | | | | | | | | | | | | | |
Net investment income (loss) (a) | | | 0.00 | ‡ | | | (0.08 | ) | | | 0.03 | | | | 0.07 | |
Net realized and unrealized gain (loss) on investments | | | (3.65 | ) | | | (3.56 | ) | | | 0.22 | | | | 0.31 | |
| | | | | | | | | | | | | | | | |
Total from investment operations | | | (3.65 | ) | | | (3.64 | ) | | | 0.25 | | | | 0.38 | |
| | | | | | | | | | | | | | | | |
| Less dividends and distributions: | | | | | | | | | | | | | | | | |
From return of capital | | | (0.40 | ) | | | (1.60 | ) | | | (1.60 | ) | | | (0.80 | ) |
| | | | | | | | | | | | | | | | |
Total dividends and distributions | | | (0.40 | ) | | | (1.60 | ) | | | (1.60 | ) | | | (0.80 | ) |
| | | | | | | | | | | | | | | | |
Redemption fees retained (a)(b) | | | — | | | | 0.00 | ‡ | | | — | | | | — | |
| | | | | | | | | | | | | | | | |
Net asset value at end of period | | $ | 8.94 | | | $ | 12.99 | | | $ | 18.23 | | | $ | 19.58 | |
| | | | | | | | | | | | | | | | |
Total investment return (c) | | | (28.18 | %)(d) | | | (22.12 | %) | | | 1.23 | % | | | 1.81 | %(d) |
| Ratios (to average net assets)/Supplemental Data: | | | | | | | | | | | | | | | | |
Net investment income (loss) (including net deferred income tax benefit (expense)) (e) | | | (0.07 | %)(f) | | | 1.75 | % | | | (0.19 | )% | | | 0.55 | %†† |
Net investment income (loss) (excluding net deferred income tax benefit (expense)) (e) | | | (0.05 | %)(f) | | | (0.53 | )% | | | 0.10 | % | | | 0.50 | %†† |
Net expenses (including net deferred income tax (benefit) expense) (e)(g) | | | 1.75 | % (f) | | | 3.02 | % | | | 2.29 | % | | | 1.95 | %†† |
Expenses (before waiver/reimbursement, including net deferred income tax (benefit) expense) (e)(g) | | | 1.88 | % (f) | | | 3.19 | % | | | 3.80 | % | | | 439.62 | %†† |
Portfolio turnover rate | | | 64.23 | % | | | 26.81 | % | | | 61.96 | % | | | 17.31 | % |
Net assets at end of period (in 000’s) | | $ | 104,238 | | | $ | 136,037 | | | $ | 50,565 | | | $ | 297 | |
| *** | These years were audited by a predecessor audit firm whose opinion was unqualified. |
| ‡ | Less than one cent per share. |
| (a) | Per share data based on average shares outstanding during the period. |
| (b) | Redemption fees were only applicable prior to reorganization. (See Note 1) |
| (c) | Total investment return is calculated exclusive of sales charges and assumes the reinvestment of dividends and distributions. |
| (d) | Total investment return is not annualized. |
| (e) | For the year ended November 30, 2014, the Fund accrued $65,316 in net current and deferred income tax benefit, of which $(978,230) is attributable to Class A. For the year ended November 30, 2013, the Fund accrued $71,348 in net current and deferred income tax expense, of which $58,510 is attributable to Class A. For the period from July 2, 2012 to November 30, 2012, the Fund accrued $31 in net current and deferred income tax benefit, of which $13 is attributable to Class A. |
| (f) | Ratios including/excluding net deferred income tax benefit (expense) includes applicable franchise tax expense for the period. For the period from December 1, 2014 to May 31, 2015, the Fund accrued $17,992 in franchise tax expense, of which $8,627 is attributable to Class A. |
| (g) | The ratio of expenses excluding net current and deferred income tax benefit to average net assets before waiver was 1.86%, 1.97%, 3.26% and 439.42% for the period from December 1, 2014 to May 31, 2015, fiscal years ended November 30, 2014, 2013 and the period from July 2, 2012 to November 30, 2012, respectively. The ratio of expenses excluding deferred income tax benefit to average net assets after waiver was 1.73% 1.80%, 1.75% and 1.75% for the period from December 1, 2014 to May 31, 2015, fiscal years ended November 30, 2014, 2013 and the period from July 2, 2012 to November 30, 2012, respectively. |
| | | | | | |
The notes to the financial statements are an integral part of,
and should be read in conjunction with, the financial statements. | | | | | 49 | |
Financial Highlights selected per share data and ratios
| | | | | | | | |
| Investor Class | | Six months
ended
May 31,
2015* | | | July 12,
2014**
through
November 30
2014 | |
Net asset value at beginning of period | | $ | 12.99 | | | $ | 19.15 | |
| | | | | | | | |
Net investment income (loss) (a) | | | 0.00 | ‡ | | | (0.02 | ) |
Net realized and unrealized gain (loss) on investments | | | (3.65 | ) | | | (5.34 | ) |
| | | | | | | | |
Total from investment operations | | | (3.65 | ) | | | (5.36 | ) |
| | | | | | | | |
| Less dividends and distributions: | | | | | | | | |
From return of capital | | | (0.40 | ) | | | (0.80 | ) |
| | | | | | | | |
Total dividends and distributions | | | (0.40 | ) | | | (0.80 | ) |
| | | | | | | | |
Net asset value at end of period | | $ | 8.94 | | | $ | 12.99 | |
| | | | | | | | |
Total investment return (b)(c) | | | (28.18 | %)(d) | | | (28.99 | %)(d) |
| Ratios (to average net assets)/Supplemental Data: | | | | | | | | |
Net investment income (loss) (including net deferred income tax benefit (expense)) (e) | | | 0.03 | % (f) | | | 1.97 | % †† |
Net investment income (loss) (excluding net deferred income tax benefit (expense)) (e) | | | 0.05 | % (f) | | | (0.20 | %)†† |
Net expenses (including net deferred income tax (benefit) expense) (e)(g) | | | 1.74 | % (f) | | | (0.55 | %)†† |
Expenses (before waiver/reimbursement, including net deferred income tax (benefit) expense) (e)(g) | | | 1.87 | % (f) | | | (0.45 | %)†† |
Portfolio turnover rate | | | 64.23 | % | | | 26.81 | % |
Net assets at end of period (in 000’s) | | $ | 3,071 | | | $ | 908 | |
| ‡ | Less than one cent per share. |
| (a) | Per share data based on average shares outstanding during the period. |
| (b) | Total investment return is calculated exclusive of sales charges and assumes the reinvestment of dividends and distributions. |
| (c) | Total investment return may reflect adjustments to conform to generally accepted accounting principles. |
| (d) | Total investment return is not annualized. |
| (e) | For the year ended November 30, 2014, the Fund accrued $65,316 in net current and deferred income tax benefit, of which $8,533 is attributable to Investor Class. |
| (f) | Ratios including/excluding net deferred income tax benefit (expense) includes applicable franchise tax expense for the period. For the period from December 1, 2014 to May 31, 2015, the Fund accrued $17,992 in franchise tax expense, of which $172 is attributable to Investor Class. |
| (g) | The ratio of expenses excluding net current and deferred income tax benefit to average net assets before waiver was 1.85%, 1.72% for the period from December 1, 2014 to May 31, 2015 and the period from July 12, 2014 to November 30, 2014, respectively. The ratio of expenses excluding deferred income tax benefit to average net assets after waiver was 1.72%, 1.62% for the period from December 1, 2014 to May 31, 2015 and the period from July 12, 2014 to November 30, 2014, respectively. |
| | | | |
| 50 | | MainStay Cushing Royalty Energy Income Fund | | The notes to the financial statements are an integral part of,
and should be read in conjunction with, the financial statements. |
Financial Highlights selected per share data and ratios
| | | | | | | | | | | | | | | | |
| | | Six months
ended
May 31, | | | Year ended November 30, | | | July 2,
2012**
through
November 30, | |
| Class C | | 2015* | | | 2014 | | | 2013*** | | | 2012*** | |
Net asset value at beginning of period | | $ | 12.74 | | | $ | 18.04 | | | $ | 19.53 | | | $ | 20.00 | |
| | | | | | | | | | | | | | | | |
Net investment income (loss) (a) | | | (0.04 | ) | | | (0.20 | ) | | | (0.11 | ) | | | 0.01 | |
Net realized and unrealized gain (loss) on investments | | | (3.58 | ) | | | (3.50 | ) | | | 0.22 | | | | 0.32 | |
| | | | | | | | | | | | | | | | |
Total from investment operations | | | (3.62 | ) | | | (3.70 | ) | | | 0.11 | | | | 0.33 | |
| | | | | | | | | | | | | | | | |
| Less dividends and distributions: | | | | | | | | | | | | | | | | |
From return of capital | | | (0.40 | ) | | | (1.60 | ) | | | (1.60 | ) | | | (0.80 | ) |
| | | | | | | | | | | | | | | | |
Total dividends and distributions | | | (0.40 | ) | | | (1.60 | ) | | | (1.60 | ) | | | (0.80 | ) |
| | | | | | | | | | | | | | | | |
Redemption fees retained (a)(b) | | | — | | | | 0.00 | ‡ | | | — | | | | — | |
| | | | | | | | | | | | | | | | |
Net asset value at end of period | | $ | 8.72 | | | $ | 12.74 | | | $ | 18.04 | | | $ | 19.53 | |
| | | | | | | | | | | | | | | | |
Total investment return (c) | | | (28.50 | %)(d) | | | (22.71 | %) | | | 0.48 | % | | | 1.56 | % (d) |
| Ratios (to average net assets)/Supplemental Data: | | | | | | | | | | | | | | | | |
Net investment income (loss) (including net deferred income tax benefit (expense)) (e) | | | (0.80 | %)(f) | | | (0.93 | %) | | | (0.94 | %) | | | (0.20 | %)†† |
Net investment income (loss) (excluding net deferred income tax benefit (expense)) (e) | | | (0.78 | %)(f) | | | (1.21 | %) | | | (0.65 | %) | | | (0.25 | %)†† |
Net expenses (including net deferred income tax (benefit) expense) (e)(g) | | | 2.49 | % (f) | | | 2.23 | % | | | 3.04 | % | | | 2.70 | % †† |
Expenses (before waiver/reimbursement, including net deferred income tax (benefit) expense) (e)(g) | | | 2.62 | % (f) | | | 2.38 | % | | | 4.55 | % | | | 440.37 | % †† |
Portfolio turnover rate | | | 64.23 | % | | | 26.81 | % | | | 61.96 | % | | | 17.31 | % |
Net assets at end of period (in 000’s) | | $ | 54,388 | | | $ | 48,574 | | | $ | 8,379 | | | $ | 401 | |
| *** | These years were audited by a predecessor audit firm whose opinion was unqualified. |
| ‡ | Less than one cent per share. |
| (a) | Per share data based on average shares outstanding during the period. |
| (b) | Redemption fees were only applicable prior to reorganization. (See Note 1) |
| (c) | Total investment return is calculated exclusive of sales charges and assumes the reinvestment of dividends and distributions. |
| (d) | Total investment return is not annualized. |
| (e) | For the year ended November 30, 2014, the Fund accrued $65,316 in net current and deferred income tax benefit, of which $62,248 is attributable to Class C. For the year ended November 30, 2013, the Fund accrued $71,348 in net current and deferred income tax expense, of which $10,203 is attributable to Class C. For the period from July 2, 2012 to November 30, 2012, the Fund accrued $31 in net current and deferred income tax benefit, of which $10 is attributable to Class C. |
| (f) | Ratios including/excluding net deferred income tax benefit (expense) includes applicable franchise tax expense for the period. For the period from December 1, 2014 to May 31, 2015, the Fund accrued $17,992 in franchise tax expense, of which $4,082 is attributable to Class C. |
| (g) | The ratio of expenses excluding net current and deferred income tax benefit to average net assets before waiver was 2.60%, 2.66%, 4.26% and 440.42% for the period from December 1, 2014 to May 31, 2015, fiscal years ended November 30, 2014, 2013 and the period from July 2, 2012 to November 30, 2012, respectively. The ratio of expenses excluding deferred income tax benefit to average net assets after waiver was 2.47%, 2.51%, 2.75% and 2.75% for the period from December 1, 2014 to May 31, 2015 fiscal years ended November 30, 2014, 2013 and the period from July 2, 2012 to November 30, 2012, respectively. |
| | | | | | |
The notes to the financial statements are an integral part of,
and should be read in conjunction with, the financial statements. | | | | | 51 | |
Financial Highlights selected per share data and ratios
| | | | | | | | | | | | | | | | |
| | | Six months
ended
May 31, | | | Year ended November 30, | | | July 2,
2012**
through
November 30, | |
| Class I | | 2015* | | | 2014 | | | 2013*** | | | 2012*** | |
Net asset value at beginning of period | | $ | 13.08 | | | $ | 18.30 | | | $ | 19.60 | | | $ | 20.00 | |
| | | | | | | | | | | | | | | | |
Net investment income (loss) (a) | | | 0.00 | ‡ | | | (0.02 | ) | | | 0.08 | | | | 0.10 | |
Net realized and unrealized gain (loss) on investments | | | (3.66 | ) | | | (3.60 | ) | | | 0.22 | | | | 0.30 | |
| | | | | | | | | | | | | | | | |
Total from investment operations | | | (3.66 | ) | | | (3.62 | ) | | | 0.30 | | | | 0.40 | |
| | | | | | | | | | | | | | | | |
| Less dividends and distributions: | | | | | | | | | | | | | | | | |
From return of capital | | | (0.40 | ) | | | (1.60 | ) | | | (1.60 | ) | | | (0.80 | ) |
| | | | | | | | | | | | | | | | |
Total dividends and distributions | | | (0.40 | ) | | | (1.60 | ) | | | (1.60 | ) | | | (0.80 | ) |
| | | | | | | | | | | | | | | | |
Redemption fees retained (a)(b) | | | — | | | | — | | | | — | | | | — | |
| | | | | | | | | | | | | | | | |
Net asset value at end of period | | $ | 9.02 | | | $ | 13.08 | | | $ | 18.30 | | | $ | 19.60 | |
| | | | | | | | | | | | | | | | |
Total investment return (c) | | | (28.06 | %)(d) | | | (21.92 | %) | | | 1.49 | % | | | 1.91 | %(d) |
| Ratios (to average net assets)/Supplemental Data: | | | | | | | | | | | | | | | | |
Net investment income (loss) (including net deferred income tax benefit (expense)) (e) | | | 0.09 | % (f) | | | 4.33 | % | | | 0.06 | % | | | 0.80 | %†† |
Net investment income (loss) (excluding net deferred income tax benefit (expense)) (e) | | | 0.10 | % (f) | | | (0.01 | %) | | | 0.35 | % | | | 0.75 | %†† |
Net expenses (including net deferred income tax (benefit) expense) (e)(g) | | | 1.49 | % (f) | | | (2.94 | %) | | | 2.04 | % | | | 1.70 | %†† |
Expenses (before waiver/reimbursement, including net deferred income tax (benefit) expense) (e)(g) | | | 1.62 | % (f) | | | (2.83 | %) | | | 3.55 | % | | | 439.37 | %†† |
Portfolio turnover rate | | | 64.23 | % | | | 26.81 | % | | | 61.96 | % | | | 17.31 | % |
Net assets at end of period (in 000’s) | | $ | 67,597 | | | $ | 94,975 | | | $ | 1,667 | | | $ | 77 | |
| *** | These years were audited by a predecessor audit firm whose opinion was unqualified. |
| ‡ | Less than one cent per share. |
| (a) | Per share data based on average shares outstanding during the period. |
| (b) | Redemption fees were only applicable prior to reorganization. (See Note 1) |
| (c) | Total investment return is calculated exclusive of sales charges and assumes the reinvestment of dividends and distributions. Class I shares are not subject to sales charges. |
| (d) | Total investment return is not annualized. |
| (e) | For the year ended November 30, 2014, the Fund accrued $65,316 in net current and deferred income tax benefit, of which $972,765 is attributable to Class I. For the year ended November 30, 2013, the Fund accrued $71,348 in net current and deferred income tax expense, of which $2,635 is attributable to Class I. For the period from July 2, 2012 to November 30, 2012, the Fund accrued $31 in net current and deferred income tax benefit, of which $8 is attributable to Class I. |
| (f) | Ratios including/excluding net deferred income tax benefit (expense) includes applicable franchise tax expense for the period. For the period from December 1, 2014 to May 31, 2015, the Fund accrued $17,992 in franchise tax expense, of which $5,107 is attributable to Class I. |
| (g) | The ratio of expenses excluding net current and deferred income tax benefit to average net assets before waiver was 1.61%, 1.52%, 3.26% and 439.42% for the period from December 1, 2014 to May 31, 2015, fiscal years ended November 30, 2014, 2013 and the period from July 2, 2012 to November 30, 2012, respectively. The ratio of expenses excluding deferred income tax benefit to average net assets after waiver was 1.48%, 1.41%, 1.75% and 1.75% for the period from December 1, 2014 to May 31, 2015 fiscal years ended November 30, 2014, 2013 and the period from July 2, 2012 to November 30, 2012, respectively. |
| | | | |
| 52 | | MainStay Cushing Royalty Energy Income Fund | | The notes to the financial statements are an integral part of,
and should be read in conjunction with, the financial statements. |
Notes to Financial Statements (Unaudited)
Note 1–Organization and Business
MainStay Funds Trust (the “Trust”) was organized as a Delaware statutory trust on April 28, 2009 and is governed by a Declaration of Trust. The Trust is registered under the Investment Company Act of 1940, as amended (the “1940 Act”), as an open-end management investment company, and is comprised of thirty-eight funds (collectively referred to as the “Funds” and each individually, referred to as a “Fund”). These financial statements and notes relate to the MainStay Cushing MLP Premier Fund, MainStay Cushing Renaissance Advantage Fund and MainStay Cushing Royalty Energy Income Fund (collectively referred to as the “MainStay Cushing Funds” and each individually referred to as a “Cushing Fund”). Each Cushing Fund is the successor corresponding series of The Cushing® Funds Trust (collectively referred to as the “Predecessor Funds” and each individually referred to as a “Predecessor Fund”), for which Cushing® Asset Management, LP, a Texas limited partnership and the Funds’ Subadvisor (as defined in Note 3(A)), served as investment adviser. The financial statements of the Funds reflect the historical results of the Predecessor Funds prior to their reorganization on July 11, 2014. Upon the completion of the reorganization, Class A, Class C and Class I shares of each Cushing Fund assumed the performance, financial and other information of the Predecessor Funds. All information and references to periods prior to July 11, 2014 refer to the Predecessor Funds.
The MainStay Cushing MLP Premier Fund offers four classes of shares. Class A, Class C and Class I shares commenced operations on October 20, 2010. Investor Class shares commenced operations on July 11, 2014. The investment objective is to seek current income and capital appreciation.
The MainStay Cushing Renaissance Advantage Fund offers four classes of shares. Class A, Class C and Class I shares commenced operations on April 2, 2013. Investor Class shares commenced operations on July 11, 2014. The investment objective is to seek total return.
The MainStay Cushing Royalty Energy Income Fund offers four classes of shares. Class A, Class C and Class I shares commenced operations on July 2, 2012. Investor Class shares commenced operations on July 11, 2014. The investment objective is to seek current income and capital appreciation.
Class A and Investor Class shares are offered at net asset value (“NAV”) per share plus an initial sales charge. No sales charge applies to investments of $1 million or more (and certain other qualified purchases) in Class A and Investor Class shares, but a contingent deferred sales charge (“CDSC”) is imposed on certain redemptions of such shares made within one year of the date of purchase. Class C shares are offered at NAV without an initial sales charge, although a 1.00% CDSC may be imposed on redemptions of such shares made within one year of the date of purchase of Class C shares. Class I shares are offered at NAV and are not subject to a sales charge. Depending upon eligibility, Class A shares may convert to Investor Class shares and Investor Class shares may convert to Class A shares. Each class of shares has the same voting (except for issues that relate solely to one class), dividend, liquidation and other rights, and the same terms and conditions, except that Class C shares are subject to higher distribution and/or service fee rates than Class A and Investor Class shares under a distribution plan pursuant to Rule 12b-1 under the 1940 Act. Class I shares are not subject to a distribution and/or service fee.
Note 2–Significant Accounting Policies
The MainStay Cushing Funds are investment companies and accordingly follow the investment company accounting and reporting guidance of the Financial Accounting Standards Board (FASB) Accounting Standard Codification Topic 946 Financial Services—Investment Companies.
The MainStay Cushing Funds prepare their financial statements in accordance with generally accepted accounting principles (“GAAP”) in the United States of America and follow the significant accounting policies described below.
(A) Securities Valuation. Investments are valued as of the close of regular trading on the New York Stock Exchange (“Exchange”) (generally 4:00 p.m. Eastern time) on each day the MainStay Cushing Funds are open for business (“valuation date”).
The Board of Trustees (the “Board”) adopted procedures establishing methodologies for the valuation of each Cushing Fund’s securities and delegated the responsibility for valuation determinations under those procedures to the Valuation Committee of the MainStay Cushing Funds (the “Valuation Committee”). The Board authorized the Valuation Committee to appoint a Valuation Sub-Committee (the “Sub-Committee”) to deal in the first instance with establishing the prices of securities for which market quotations are not readily available or the prices of which are not otherwise readily determinable under these procedures. The Sub-Committee meets (in person, via electronic mail or via teleconference) on an as-needed basis. Subsequently, the Valuation Committee meets to ensure that actions taken by the Sub-Committee were appropriate. The procedures recognize that, subject to the oversight of the Board and unless otherwise noted, the responsibility for day-to-day valuation of portfolio assets (including fair value measurements for the MainStay Cushing Funds’ assets and liabilities) rests with New York Life Investment Management LLC (“New York Life Investments” or the “Manager”), aided to whatever extent necessary by the Subadvisor (as defined in Note 3(A)) to each Cushing Fund.
To assess the appropriateness of security valuations, the Manager or the MainStay Cushing Funds’ third party service provider, who is subject to oversight by the Manager, regularly compares prior day prices, prices on comparable securities, and the sale prices to the prior and current day prices and challenges prices with changes exceeding certain tolerance levels with third party pricing services or broker sources. For those securities valued through either a standardized fair valuation methodology or a fair valuation measurement, the Sub-Committee deals in the first instance with such valuation and the Valuation Committee reviews and affirms the reasonableness of the valuation based on such methodologies and measurements on a regular basis after considering all relevant information that is reasonably available. Any action taken by the Sub-Committee with respect to the valuation of a portfolio security is submitted by the Valuation Committee to the Board for its review and ratification, if appropriate, at its next regularly scheduled meeting.
“Fair value” is defined as the price a Cushing Fund would receive upon selling an asset or liability in an orderly transaction to an independent buyer in the principal or most advantageous market for the asset or liability. Fair value measurements are determined within a framework that establishes a three-tier hierarchy which maximizes the use of observable market data and minimizes the use of unobservable inputs to establish a classification of fair value measurements for disclosure
Notes to Financial Statements (Unaudited) (continued)
purposes. “Inputs” refers broadly to the assumptions that market participants would use in pricing the asset or liability, including assumptions about risk, such as the risk inherent in a particular valuation technique used to measure fair value using a pricing model and/or the risk inherent in the inputs for the valuation technique. Inputs may be observable or unobservable. Observable inputs reflect the assumptions market participants would use in pricing the asset or liability based on market data obtained from sources independent of the MainStay Cushing Funds. Unobservable inputs reflect each Cushing Fund’s own assumptions about the assumptions market participants would use in pricing the asset or liability based on the information available. The inputs or methodology used for valuing assets or liabilities may not be an indication of the risks associated with investing in those assets or liabilities. The three-tier hierarchy of inputs is summarized below.
| • | | Level 1—quoted prices in active markets for an identical asset or liability |
| • | | Level 2—other significant observable inputs (including quoted prices for a similar asset or liability in active markets, interest rates and yield curves, prepayment speeds, credit risk, etc.) |
| • | | Level 3—significant unobservable inputs (including each MainStay Cushing Fund’s own assumptions about the assumptions that market participants would use in measuring fair value of an asset or liability) |
The aggregate value by input level, as of May 31, 2015, of each Cushing Fund’s assets and liabilities is included at the end of each MainStay Cushing Fund’s Portfolio of Investments.
The MainStay Cushing Funds may use third party vendor evaluations, whose prices may be derived from one or more of the following standard inputs among others:
| | |
• Benchmark Yields | | • Reported Trades |
• Broker Dealer Quotes | | • Issuer Spreads |
• Two-sided markets | | • Benchmark securities |
• Bids/Offers | | • Reference Data (corporate actions or material event notices) |
• Industry and economic events | | • Monthly payment information |
An asset or liability for which market values cannot be measured using the methodologies described above is valued by methods deemed reasonable in good faith by the Valuation Committee, following the procedures established by the Board, to represent fair value. Under these procedures, the MainStay Cushing Funds generally use a market-based approach which may use related or comparable assets or liabilities, recent transactions, market multiples, book values, and other relevant information. The MainStay Cushing Funds may also use an income-based valuation approach in which the anticipated future cash flows of the asset or liability are discounted to calculate fair value. Discounts may also be applied due to the nature and/or duration of any restrictions on the disposition of the asset or liability. Due to the inherent valuation uncertainty of such assets or liabilities, fair values may differ significantly from values that would have been used had an active market existed. For the six-months ended May 31, 2015, there have been no material changes to the fair value methodologies.
Equity and non-equity securities which may be valued in this manner include, but are not limited to: (i) a security for which trading has been
halted or suspended; (ii) a debt security that has recently gone into default and for which there is not a current market quotation; (iii) a security of an issuer that has entered into a restructuring; (iv) a security that has been de-listed from a national exchange; (v) a security for which the market price is not readily available from a third party pricing source or, if so provided, does not, in the opinion of the Manager or Subadvisor reflect the security’s market value; (vi) a security subject to trading collars for which no or limited trading takes place; and (vii) a security whose principal market has been temporarily closed at a time when, under normal conditions, it would be open. Securities for which market quotations or observable inputs are not readily available are generally categorized as Level 3 in the hierarchy. As of May 31, 2015, the MainStay Cushing Funds did not hold any securities that were fair valued in such a manner.
Equity securities and Exchange-Traded Funds are valued at the last quoted sales prices as of the close of regular trading on the relevant exchange on each valuation date. Securities that are not traded on the valuation date are valued at the mean of the last quoted bid and ask prices. Prices are normally taken from the principal market in which each security trades. These securities are generally categorized as Level 1 in the hierarchy.
Temporary cash investments acquired in excess of 60 days to maturity at the time of purchase are valued using the latest bid prices or using valuations based on a matrix system (which considers such factors as security prices, yields, maturities, and ratings), both as furnished by independent pricing services. Other temporary cash investments which mature in 60 days or less at the time of purchase (“Short-Term Investments”) are valued using the amortized cost method of valuation, unless the use of such method would be inappropriate. The amortized cost method involves valuing a security at its cost on the date of purchase and thereafter assuming a constant amortization to maturity of the difference between such cost and the value on maturity date. Amortized cost approximates the current fair value of a security. These securities are generally categorized as Level 2 in the hierarchy.
Generally, a security is considered illiquid if it cannot be sold or disposed of in the ordinary course of business at approximately the price at which it is valued within seven days. Its illiquidity might prevent the sale of such security at a time when the Manager or Subadvisor might wish to sell, and these securities could have the effect of decreasing the overall level of a MainStay Cushing Fund’s liquidity. Further, the lack of an established secondary market may make it more difficult to value illiquid securities, requiring a MainStay Cushing Fund to rely on judgments that may be somewhat subjective in measuring value, which could vary from the amount that a MainStay Cushing Fund could realize upon disposition. Difficulty in selling illiquid securities may result in a loss or may be costly to a MainStay Cushing Fund. Under the supervision of the Board, the Manager or Subadvisor measure the liquidity of each MainStay Cushing Fund’s investments; in doing so, the Manager or Subadvisor may consider various factors, including (i) the frequency of trades and quotations, (ii) the number of dealers and prospective purchasers, (iii) dealer undertakings to make a market, and (iv) the nature of the security and the market in which it trades (e.g., the time needed to dispose of the security, the method of soliciting offers and the mechanics of transfer). Illiquid securities generally will be valued in good faith in such a manner as the Board deems appropriate to reflect their fair value.
| | |
| 54 | | MainStay Cushing Funds |
(B) Income Taxes. The MainStay Cushing MLP Premier Fund and the MainStay Cushing Royalty Energy Income Fund, taxed as corporations, are obligated to pay federal and state income tax on their taxable income. Currently, the maximum marginal regular federal income tax rate for a corporation is 35%. The MainStay Cushing MLP Premier Fund and the MainStay Cushing Royalty Energy Income Fund may each be subject to a 20% federal alternative minimum tax on their respective federal alternative minimum taxable income to the extent that their respective alternative minimum tax exceeds their respective regular federal income tax.
The MainStay Cushing MLP Premier Fund invests its assets primarily in master limited partnerships (“MLPs”), which generally are treated as partnerships for federal income tax purposes. As a limited partner in MLPs, The MainStay Cushing MLP Premier Fund reports its allocable share of each MLP’s taxable income in computing its own taxable income.
The MainStay Cushing Royalty Energy Income Fund invests its assets primarily in energy trusts and MLPs. U.S. royalty trusts are generally not subject to U.S. federal corporate income taxation at the trust or entity level. Instead, each unitholder of the U.S. royalty trust is required to take into account its share of all items of the U.S. royalty trust’s income, gain, loss, deduction and expense. It is possible that the Fund’s share of taxable income from a U.S. royalty trust may exceed the cash actually distributed to it from the U.S. royalty trust in a given year. In such a case, the MainStay Cushing Royalty Energy Income Fund will have less after-tax cash available for distribution to shareholders. Canadian royalty trusts are taxed as regular Canadian corporations and are now subject to “double taxation” at both the corporate level and on the income distributed to investors. MLPs are generally treated as partnerships for federal income tax purposes. As a limited partner in MLPs, the MainStay Cushing Royalty Energy Income Fund reports its allocable share of each MLP’s taxable income in computing its own taxable income.
The MainStay Cushing MLP Premier Fund and the MainStay Cushing Royalty Energy Income Fund’s respective tax expense or benefit is included in the Statements of Operations based on the component of income or gains (losses) to which such expense or benefit relates. Deferred income taxes reflect the net tax effects of temporary differences between the carrying amounts of assets and liabilities for financial reporting purposes and the amounts used for income tax purposes. A valuation allowance is recognized if, based on the weight of available evidence, it is more likely than not that some portion or all of the deferred income tax asset will not be realized.
The MainStay Cushing Renaissance Advantage Fund’s policy is to comply with the requirements of the Internal Revenue Code of 1986, as amended (the “Internal Revenue Code”), applicable to regulated investment companies (“RIC”) and to distribute all of the taxable income to the shareholders of the Fund within the allowable time limits. Therefore, no federal, state, and local income tax provisions are required.
Management evaluates each Cushing Fund’s tax positions to determine if the tax positions taken meet the minimum recognition threshold in connection with accounting for uncertainties in income tax positions taken or expected to be taken for the purposes of measuring and recognizing tax liabilities in the financial statements. Recognition of tax benefits of an uncertain tax position is required only when the position is
“more likely than not” to be sustained assuming examination by taxing authorities. Management has analyzed the MainStay Cushing Funds’ tax positions taken on federal, state and local income tax returns for all open tax years (for up to three tax years). Management has concluded that no provisions for federal, state and local income tax are required in the MainStay Cushing Renaissance Advantage Fund’s financial statements as it intends to qualify each year for special tax treatment afforded to a RIC. Management has concluded that provisions for federal, state and local income tax are required to be included in the financial statements for the MainStay Cushing MLP Premier Fund and the MainStay Cushing Royalty Energy Income Fund which are taxed as corporations and obligated to pay federal and state income tax on their taxable income. The MainStay Cushing Funds’ federal, state and local income and federal excise tax returns for tax years for which the applicable statutes of limitations have not expired are subject to examination by the Internal Revenue Service and state and local departments of revenue.
(C) Dividends and Distributions to Shareholders. Dividends and distributions are recorded on the ex-dividend date. The MainStay Cushing MLP Premier Fund and the MainStay Cushing Royalty Energy Income Fund intend to declare and pay distributions, if any, at least quarterly. On a book basis, all realized capital gains net of applicable taxes will be retained by the MainStay Cushing MLP Premier Fund and the MainStay Cushing Royalty Energy Income Fund. The MainStay Renaissance Advantage Fund intends to declare and pay distributions quarterly and distributions from net capital gains, if any, annually. Unless the shareholder elects otherwise, all dividends and distributions are reinvested in the same class of shares of the respective Cushing Fund, at NAV. Dividends and distributions to shareholders are determined in accordance with federal income tax regulations and may differ from GAAP.
(D) Security Transactions and Investment Income. The MainStay Cushing Funds record security transactions on the trade date. Realized gains and losses on security transactions are determined using the identified cost method. Dividend income is recognized on the ex-dividend date, net of any foreign tax withheld at the source, and interest income is accrued as earned using the effective interest rate method. Discounts and premiums on Short-Term Investments are accreted and amortized, respectively, on the straight-line method. The straight-line method approximates the effective interest method for short-term investments. Income from payment-in-kind securities is recorded daily based on the effective interest method of accrual. Distributions on a MLP are generally recorded based on the characterization reported on the Cushing Fund’s Form 1065, Schedule K-1, received from the MLP. The MainStay Cushing Funds record their pro rata share of the income and deductions, and capital gains and losses allocated from each MLP, as well as adjusting the cost basis of each MLP accordingly.
Distributions received from each of the MainStay Cushing Fund’s investments in energy related U.S. royalty trusts and Canadian royalty trusts and exploration and production companies (collectively, “Energy Trusts”) and MLPs generally are comprised of ordinary income, capital gains and return of capital from the Energy Trusts or MLPs. The MainStay Cushing Funds record investment income on the ex-date of the distributions. For financial statement purposes, the MainStay Cushing Funds use return of capital and income estimates to allocate the dividend income received.
Notes to Financial Statements (Unaudited) (continued)
Such estimates are based on historical information available from each Energy Trust, MLP and other industry sources. These estimates may subsequently be revised based on information received from Energy Trusts or MLPs after their tax reporting periods are concluded, as the actual character of these distributions is not known until after the fiscal year end of the Funds.
Each MainStay Cushing Fund estimates the allocation of investment income and return of capital for the distributions received from MLPs within the Statements of Operations. For the six-months ended May 31, 2015, each MainStay Cushing Fund estimated approximately 100% of the distributions received from MLPs to be from return of capital. Investment income and realized and unrealized gains and losses on investments of the MainStay Cushing Funds are allocated to separate classes of shares pro rata based upon their relative net assets on the date the income is earned or realized and unrealized gains and losses are incurred.
(E) Expenses. Expenses of the Trust are allocated to the individual MainStay Cushing Funds in proportion to the net assets of the respective Funds when the expenses are incurred, except where direct allocations of expenses can be made. Expenses (other than transfer agent expenses and fees incurred under the shareholder services plans and/or the distribution plans further discussed in Note 3(B)) are allocated to separate classes of shares pro rata based upon their relative net assets on the date the expenses are incurred. The expenses borne by the MainStay Cushing Funds, including those of related parties to the MainStay Cushing Funds, are shown in the Statement of Operations.
(F) Use of Estimates. In preparing financial statements in conformity with GAAP, management makes estimates and assumptions that affect the reported amounts and disclosures in the financial statements. Actual results could differ from those estimates.
(H) Concentration of Risk. The MainStay Cushing MLP Premier Fund’s investment objective is to seek current income and capital appreciation. The MainStay Cushing MLP Premier Fund seeks to achieve its investment objective by investing, under normal market conditions, at least 80% of its assets (net assets plus any borrowings for investment purposes) in a portfolio of MLP investments.
The MainStay Cushing Renaissance Advantage Fund’s investment objective is to seek total return. The MainStay Cushing Renaissance Advantage Fund will seek to achieve its investment objective by investing, under normal market conditions, at least 80% of its assets (net assets plus any borrowings for investment purposes) in a portfolio of (i) companies across the energy supply chain spectrum, including upstream, midstream and downstream energy companies, as well as oil and gas services companies, (ii) energy-intensive chemical, metal and industrial and manufacturing companies and engineering and construction companies that the Subadvisor expects to benefit from growing energy production and lower feedstock costs relative to global costs, and (iii) transportation and logistics companies providing solutions to the U.S. manufacturing industry.
The MainStay Cushing Royalty Energy Income Fund’s investment objective is to seek current income and capital appreciation. The MainStay Cushing Royalty Energy Income Fund will seek to achieve its investment objective by investing, under normal market conditions, at least 80% of its assets (net assets plus any borrowings for investment
purposes) in a portfolio of (i) Energy Trusts, (ii) exploration and production MLPs and (iii) securities of other companies based in North America that are generally engaged in the energy sector.
(I) Indemnifications. Under the Trust’s organizational documents, its officers and trustees are indemnified against certain liabilities that may arise out of performance of their duties to the Trust. Additionally, in the normal course of business, the MainStay Cushing Funds enter into contracts with third-party service providers that contain a variety of representations and warranties and which may provide general indemnifications. The MainStay Cushing Funds’ maximum exposure under these arrangements is unknown, as this would involve future claims that may be made against the MainStay Cushing Funds that have not yet occurred. Based on experience, management is of the view that the risk of loss in connection with these potential indemnification obligations is remote. However, there can be no assurance that material liabilities related to such obligations will not arise in the future, which could adversely impact the MainStay Cushing Funds.
Note 3–Fees and Related Party Transactions
(A) Manager and Subadvisor. Effective after the close of business on July 11, 2014, New York Life Investments, a registered investment adviser and an indirect, wholly-owned subsidiary of New York Life Insurance Company (“New York Life”), began serving as the MainStay Cushing Funds’ Manager, pursuant to an Amended and Restated Management Agreement, (“Management Agreement”). The Manager provides offices, conducts clerical, recordkeeping and bookkeeping services, and keeps most of the financial and accounting records required to be maintained by the MainStay Cushing Funds. Except for the portion of salaries and expenses that are the responsibility of the MainStay Cushing Funds, the Manager pays the salaries and expenses of all personnel affiliated with the MainStay Cushing Funds and certain operational expenses of the MainStay Cushing Funds. The MainStay Cushing Funds reimburse New York Life Investments in an amount equal to a portion of the compensation of the Chief Compliance Officer of the MainStay Cushing Funds. Cushing® Asset Management, LP (“Cushing® Asset Management” or the “Subadvisor”), a registered investment adviser, serves as Subadvisor to the MainStay Cushing Funds and is responsible for the day-to-day portfolio management of the MainStay Cushing Funds. Pursuant to the terms of a Subadvisory Agreement (“Subadvisory Agreement”) between New York Life Investments and Cushing® Asset Management, New York Life Investments pays for the services of the Subadvisor.
Under the Management Agreement, the MainStay Cushing MLP Premier Fund pays the Manager a monthly fee for services performed and facilities furnished at an annual rate of 1.10% of the Fund’s average daily net assets.
Under the Management Agreement, the MainStay Cushing Renaissance Advantage Fund pays the Manager a monthly fee for services performed and facilities furnished at an annual rate of 1.25% of the Fund’s average daily net assets.
Under the Management Agreement, the MainStay Cushing Royalty Energy Income Fund pays the Manager a monthly fee for services performed and facilities furnished at an annual rate of 1.35% of the Fund’s average daily net assets.
| | |
| 56 | | MainStay Cushing Funds |
In connection with the discussion below regarding expense limitation agreements, Total Annual Fund Operating Expenses excludes taxes, interest, litigation, extraordinary expenses, brokerage and other transaction expenses relating to the purchase or sale of portfolio investments and acquired (underlying) fund fees and expenses.
MainStay Cushing MLP Premier Fund
Effective after the close of business on July 11, 2014, New York Life Investments has contractually agreed to waive a portion of the MainStay Cushing MLP Premier Fund’s management fees and/or reimburse expenses so that Total Annual Fund Operating Expenses (excluding taxes, deferred income tax expenses, interest, litigation, extraordinary expenses, brokerage and other transaction expenses relating to the purchase or sale of portfolio investments, and acquired (underlying) fund fees and expenses) do not exceed the following percentages of average daily net assets: Class A, 1.60%; Class C, 2.35%; and Class I, 1.35%. Based on the waiver or reimbursement with respect to Class A shares, New York Life Investments will apply an equivalent waiver or reimbursement, in an equal number of basis points, to Investor Class shares. This agreement will remain in effect until July 11, 2016 unless extended by New York Life Investments and approved by the Board.
MainStay Cushing Renaissance Advantage Fund
Effective after the close of business on July 11, 2014, New York Life Investments has contractually agreed to waive a portion of the MainStay Cushing Renaissance Advantage Fund’s management fees and/or reimburse expenses so that Total Annual Fund Operating Expenses for Class A shares do not exceed 1.75% of its average daily net assets. New York Life Investments will apply an equivalent waiver or reimbursement, in an equal number of basis points, to the other share classes. This agreement will remain in effect until April 1, 2016 unless extended by New York Life Investments and approved by the Board.
Effective after the close of business on July 11, 2014, New York Life Investments has contractually agreed to waive fees and/or reimburse expenses so that MainStay Cushing Renaissance Advantage Fund’s Total Annual Fund Operating Expenses (excluding taxes, interest, litigation, extraordinary expenses, brokerage and other transaction expenses relating to the purchase or sale of portfolio investments, and acquired (underlying) fund fees and expenses) of a class do not exceed the following percentages of average daily net assets: Class A, 1.90%; Class C, 2.65% and Class I, 1.65%. Based on the waiver or reimbursement with respect to Class A shares, New York Life Investments will apply an equivalent waiver or reimbursement, in an equal number of basis points, to Investor Class shares. This expense limitation agreement will remain in effect until July 11, 2016 unless extended by New York Life Investments and approved by the Board of Trustees of the Fund.
MainStay Cushing Royalty Energy Income Fund
Effective after the close of business on July 11, 2014, New York Life Investments has contractually agreed to waive a portion of its management fee so that the management fee does not exceed 1.25% of the Fund’s average daily net assets. This agreement will remain in effect until April 1, 2016 unless extended by New York Life Investments and approved by the Board.
Effective after the close of business on July 11, 2014, New York Life Investments has contractually agreed to waive a portion of the MainStay Cushing Royalty Energy Income Fund’s management fees and/or reimburse expenses so that Total Annual Fund Operating Expenses for Class A shares do not exceed 1.73% of its average daily net assets. New York Life Investments will apply an equivalent waiver or reimbursement, in an equal number of basis points, to the other share classes. This agreement will remain in effect until April 1, 2016 unless extended by New York Life Investments and approved by the Board.
Effective after the close of business on July 11, 2014, New York Life Investments has contractually agreed to waive fees and/or reimburse expenses so that MainStay Cushing Royalty Energy Income Fund’s Total Annual Fund Operating Expenses (excluding taxes, deferred income tax expenses, interest, litigation, extraordinary expenses, brokerage and other transaction expenses relating to the purchase or sale of portfolio investments, and acquired (underlying) fund fees and expenses) of a class do not exceed the following percentages of average daily net assets: Class A, 1.90%, Class C, 2.65% and Class I, 1.65%. Based on the waiver or reimbursement with respect to Class A shares, New York Life Investments will apply an equivalent waiver or reimbursement, in an equal number of basis points, to Investor Class shares. This expense limitation agreement will remain in effect until July 11, 2016 unless extended by New York Life Investments and approved by the Board of Trustees of the Fund.
For the six-months ended May 31, 2015, New York Life Investments earned fees from the MainStay Cushing Funds and waived its fees and/or reimbursed expenses as follows:
| | | | | | | | |
| | | Fees Earned | | | Fees
Waived/ Reimbursed | |
MainStay Cushing MLP Premier Fund | | $ | 10,689,256 | | | $ | — | |
MainStay Cushing Renaissance Advantage Fund | | | 2,286,051 | | | | 19,782 | |
MainStay Cushing Royalty Energy Income Fund | | | 1,604,942 | | | | 155,712 | |
U.S. Bancorp Fund Services, LLC (“U.S. Bancorp”) provides sub-administration and sub-accounting services to the MainStay Cushing Funds pursuant to an agreement with New York Life Investments. These services include calculating the daily NAVs of the MainStay Cushing Funds, maintaining the general ledger and sub-ledger accounts for the calculation of the MainStay Cushing Funds’ respective NAVs, and assisting New York Life Investments in conducting various aspects of the MainStay Cushing Funds’ administrative operations. For providing these services to the MainStay Cushing Funds, U.S. Bancorp is compensated by New York Life Investments.
(B) Distribution, Service and Shareholder Service Fees. The Trust, on behalf of the MainStay Cushing Funds, has entered into a distribution agreement with NYLIFE Distributors LLC (the ‘‘Distributor’’), an indirect, wholly-owned subsidiary of New York Life. The MainStay Cushing Funds have adopted distribution plans (the ‘‘Plans’’) in accordance with the provisions of Rule 12b-1 under the 1940 Act.
Pursuant to the Class A and Investor Class Plans, the Distributor receives a monthly distribution fee from the Class A and Investor Class
Notes to Financial Statements (Unaudited) (continued)
shares, at an annual rate of 0.25% of the average daily net assets of the Class A and Investor Class shares for distribution and/or service activities as designated by the Distributor. Pursuant to the Class C Plan, Class C shares pay the Distributor a monthly distribution fee at an annual rate of 0.75% of the average daily net assets of the Class C shares, along with a service fee at an annual rate of 0.25% of the average daily net assets of the Class C shares, for a total 12b-1 fee of 1.00%. Class I shares are not subject to a distribution and/or service fee.
The Plans provide that the distribution and service fees are payable to the Distributor regardless of the amounts actually expended by the Distributor for distribution of the MainStay Cushing Funds’ shares and service activities.
(C) Sales Charges. The MainStay Cushing Funds were advised by the Distributor that the amount of initial sales charges retained on sales of Class A and Investor Class shares for the six-months ended May 31, 2015, were as follows:
| | | | |
MainStay Cushing MLP Premier Fund | |
Class A | | $ | 169,723 | |
Investor Class | | | 5,296 | |
| |
| | | | |
MainStay Cushing Renaissance Advantage Fund | |
Class A | | $ | 37,806 | |
Investor Class | | | 4,635 | |
| |
| | | | |
MainStay Cushing Royalty Energy Income Fund | |
Class A | | $ | 102,148 | |
Investor Class | | | 7,867 | |
The MainStay Cushing Funds were also advised that the Distributor retained CDSCs on redemptions of Class A, Investor Class and Class C shares, for the six-months ended May 31, 2015, were as follows:
| | | | |
MainStay Cushing MLP Premier Fund | |
Class A | | $ | 12,824 | |
Investor Class | | | 49 | |
Class C | | | 89,628 | |
| |
| | | | |
MainStay Cushing Renaissance Advantage Fund | |
Class A | | $ | 1,038 | |
Investor Class | | | — | |
Class C | | | 16,544 | |
| |
| | | | |
MainStay Cushing Royalty Energy Income Fund | |
Class A | | $ | 5,000 | |
Investor Class | | | — | |
Class C | | | 38,982 | |
(D) Transfer, Dividend Disbursing and Shareholder Servicing Agent. NYLIM Service Company LLC, an affiliate of New York Life Investments, is the MainStay Cushing Funds’ transfer, dividend disbursing and shareholder servicing agent pursuant to an
agreement between NYLIM Service Company LLC and the Trust. NYLIM Service Company LLC has entered into an agreement with Boston Financial Data Services, Inc. (“BFDS”) pursuant to which BFDS performs certain transfer agent services on behalf of NYLIM Service Company LLC. Transfer agent expenses incurred by the MainStay Cushing Funds’ share classes for the six-months ended May 31, 2015, were as follows:
| | | | |
MainStay Cushing MLP Premier Fund | |
Class A | | $ | 202,516 | |
Investor Class | | | 748 | |
Class C | | | 299,875 | |
Class I | | | 231,817 | |
| |
| | | | |
MainStay Cushing Renaissance Advantage Fund | |
Class A | | $ | 48,769 | |
Investor Class | | | 3,016 | |
Class C | | | 61,491 | |
Class I | | | 238,209 | |
| |
| | | | |
MainStay Cushing Royalty Energy Income Fund | |
Class A | | $ | 74,662 | |
Investor Class | | | 1,129 | |
Class C | | | 33,567 | |
Class I | | | 53,658 | |
(E) Small Account Fee. Shareholders with small accounts adversely impact the cost of providing transfer agency services. In an effort to reduce total transfer agency expenses, the MainStay Cushing Funds have implemented a small account fee on certain types of accounts. Certain shareholders with an account balance of less than $1,000 are charged an annual per account fee of $20 (assessed semi-annually), the proceeds from which offset transfer agent fees as reflected in the Statement of Operations.
Note 4–Federal Income Tax
MainStay Cushing MLP Premier Fund and MainStay Cushing Royalty Energy Income Fund
Deferred income taxes reflect the net tax effect of temporary differences between the carrying amount of assets and liabilities for financial reporting and tax purposes. Components of the MainStay Cushing MLP Premier Fund and MainStay Cushing Royalty Energy Income Fund deferred tax assets and liabilities as of May 31, 2015 are as follows:
| | | | |
MainStay Cushing MLP Premier Fund | |
Deferred tax assets: | | | | |
Net operating loss carryforward | | $ | 49,193,099 | |
Capital loss carryforward utilized | | | 19,299,564 | |
| Total deferred tax assets | | | 68,492,663 | |
Less deferred tax liabilities: | | | | |
Net unrealized appreciation on investments in securities | | | 191,070,032 | |
| Net deferred tax liability | | $ | 122,577,369 | |
| |
| | | | |
| | |
| 58 | | MainStay Cushing Funds |
| | | | |
MainStay Cushing Royalty Energy Income Fund | |
Deferred tax assets: | | | | |
Net operating loss carryforward | | $ | 3,622,352 | |
Capital loss carryforward | | | 37,675,538 | |
Net unrealized depreciation on investments in securities | | | 18,012,860 | |
Foreign tax credit | | | 108,083 | |
| Total deferred tax assets | | | 59,418,833 | |
Less valuation allowance | | | 59,418,833 | |
| Net deferred tax asset | | $ | — | |
The MainStay Cushing MLP Premier Fund has recorded a deferred tax liability as of May 31, 2015. The MainStay Cushing Funds periodically review the recoverability of their deferred tax assets, if any, based on the weight of available evidence. When assessing the recoverability of each MainStay Cushing Fund’s deferred tax assets, significant weight is given to the effects of potential future realized and unrealized gains on investments, and the period over which these deferred tax assets can be realized. Unexpected significant decreases in cash distributions from the MainStay Cushing Funds’ MLP investments or significant declines in the fair value of their investments may change the MainStay Cushing Funds’ assessment regarding the recoverability of their deferred tax assets and may result in a valuation allowance. Each MainStay Cushing Fund will continue to assess the need to record a valuation allowance in the future. If a valuation allowance is required to reduce any deferred tax asset in the future, it could have a material impact on the MainStay Cushing Fund’s net asset value and results of operations in the period it is recovered.
Each MainStay Cushing Fund may rely, to some extent, on information provided by the MLPs, which may not necessarily be timely, to estimate taxable income allocable to MLP units held in its portfolio, and to estimate its associated deferred tax benefit (liability). Such estimates are made in good faith. From time to time, as new information becomes available, each MainStay Cushing Fund will modify its estimates or assumptions regarding its tax benefit (liability).
The net operating loss carryforward and capital loss carryforward are available to offset future taxable income. For corporations, capital losses can only be used to offset capital gains and cannot be used to offset ordinary income. The capital loss may be carried forward for five years and, accordingly, would begin to expire as of November 30, 2017. The net operating loss can be carried forward for 20 years and, accordingly, would begin to expire as of November 30, 2030. The MainStay Cushing
MLP Premier Fund and MainStay Cushing Royalty Energy Income Fund have the following net operating loss and capital loss amounts:
| | | | | | | | |
MainStay Cushing MLP Premier Fund | |
Fiscal Year Ended Net Operating Loss | | Amount | | | Expiration | |
November 30, 2010 | | $ | 3,330 | | | | November 30, 2030 | |
| November 30, 2011 | | | 541,249 | | | | November 30, 2031 | |
| November 30, 2012 | | | 9,226,669 | | | | November 30, 2032 | |
| November 30, 2013 | | | 22,865,115 | | | | November 30, 2033 | |
| November 30, 2014 | | | 29,334,750 | | | | November 30, 2034 | |
| November 30, 2015 | | | 65,709,963 | | | | November 30, 2035 | |
| | | | | | | | |
| Total | | $ | 127,681,076 | | | | | |
| | | | | | | | |
| | |
| | | | | | | | |
Fiscal Year Ended Capital Loss | | Amount | | | Expiration | |
November 30, 2015 | | $ | 52,033,525 | | | | November 30, 2020 | |
| | | | | | | | |
| | |
| | | | | | | | |
MainStay Cushing Royalty Energy Income Fund | |
Fiscal Year Ended Net Operating Loss | | Amount | | | Expiration | |
November 30, 2012 | | $ | 522 | | | | November 30, 2032 | |
| November 30, 2013 | | | 11,924 | | | | November 30, 2033 | |
| November 30, 2014 | | | 1,934,847 | | | | November 30, 2034 | |
| November 30, 2015 | | | 7,932,933 | | | | November 30, 2035 | |
| | | | | | | | |
| Total | | $ | 9,880,226 | | | | | |
| | | | | | | | |
| | |
| | | | | | | | |
Fiscal Year Ended Capital Loss | | Amount | | | Expiration | |
November 30, 2012 | | $ | 2,914 | | | | November 30, 2017 | |
| November 30, 2013 | | | 1,371,868 | | | | November 30, 2018 | |
| November 30, 2014 | | | 3,090,784 | | | | November 30, 2019 | |
| November 30, 2015 | | | 98,295,778 | | | | November 30, 2020 | |
| | | | | | | | |
| Total | | $ | 102,761,344 | | | | | |
| | | | | | | | |
Total income tax benefit (current and deferred) differs from the amount computed by applying the federal statutory income tax rate of 35% to net investment income and realized and unrealized gains (losses) on investments before taxes for the six-months ended May 31, 2015, as follows:
| | | | | | | | |
| | | MainStay
Cushing MLP
Premier Fund | | | MainStay Cushing
Royalty Energy
Income Fund | |
Income tax provision (benefit) at the federal statutory rate of 35% | | $ | (32,579,931 | ) | | $ | (29,265,654 | ) |
State income tax (benefit), net of federal benefit | | | (1,439,484 | ) | | | (1,411,691 | ) |
| Permanent differences, net | | | (972,152 | ) | | | (26,799 | ) |
| Foreign taxes withheld | | | — | | | | 108,083 | |
| Provision to return | | | 2,631,691 | | | | (492,288 | ) |
Tax expense (benefit) due to change in effective state rates | | | 129,826 | | | | 139,509 | |
| Change in valuation allowance | | | — | | | | 31,056,923 | |
| | | | | | | | |
| Total tax expense (benefit) | | $ | (32,230,050 | ) | | $ | 108,083 | |
| | | | | | | | |
MainStay Cushing Renaissance Advantage Fund
As of November 30, 2014, the components of accumulated gain (loss) on a tax basis were as follows:
| | | | | | | | | | | | | | | | | | | | |
| | | Ordinary
Income | | | Accumulated
Capital
and Other
Gain (Loss) | | | Other
Temporary
Differences | | | Unrealized
Appreciation
(Depreciation) | | | Total
Accumulated Gain (Loss) | |
MainStay Cushing Renaissance Advantage Fund | | $ | — | | | $ | (8,806,880 | ) | | $ | (470 | ) | | $ | (23,939,348 | ) | | $ | (32,746,698 | ) |
Notes to Financial Statements (Unaudited) (continued)
The difference between book basis and tax basis unrealized depreciation is primarily due to wash sale and partnership adjustments.
The following table discloses the current year reclassifications between undistributed net investment income (loss), accumulated net realized gain (loss) on investments, and additional paid-in capital arising from permanent differences; net assets as of November 30, 2014 were not affected.
| | | | | | | | | | | | |
| | | Undistributed
Net Investment
Income (Loss) | | | Accumulated
Net Realized
Gain (Loss) on
Investments | | | Additional
Paid-In
Capital | |
MainStay Cushing Renaissance Advantage Fund | | $ | (40,411 | ) | | $ | 28,839 | | | $ | 11,572 | |
The reclassifications for the MainStay Cushing Renaissance Advantage Fund are primarily due to partnership adjustments.
As of November 30, 2014, for federal income tax purposes, capital loss carryforwards of $8,806,880 were available as shown in the table below, to the extent provided by the regulations to offset future realized gains of the Fund through the years indicated.
| | | | | | | | |
Capital Loss
Available Through | | Short-Term
Capital Loss
Amounts (000’s) | | | Long-Term
Capital Loss
Amounts (000’s) | |
| Unlimited | | $ | 8,807 | | | $ | — | |
The tax character of distributions paid during the year ended November 30, 2014 shown in the Statements of Changes in Net Assets was as follows:
| | | | | | | | | | | | |
| | | 2014 | |
| | | Tax Based
Distributions
from
Ordinary
Income | | | Tax Based
Distributions
from Return of
Capital | | | Total | |
MainStay Cushing MLP Premier Fund | | $ | 44,493,742 | | | $ | 56,895,491 | | | $ | 101,389,233 | |
MainStay Cushing Renaissance Advantage Fund | | | 200,336 | | | | 3,069,510 | | | | 3,269,846 | |
MainStay Cushing Royalty Energy Income Fund | | | — | | | | 12,175,970 | | | | 12,175,970 | |
Note 5–Custodian
U.S. Bank, N.A. is the custodian of cash and securities held by the MainStay Cushing Funds. Custodial fees are charged to the MainStay Cushing Funds based on the Cushing Fund’s net assets and/or the market value of securities held by the MainStay Cushing Funds and the number of certain cash transactions incurred by the MainStay Cushing Funds.
Note 6–Line of Credit
The MainStay Cushing Funds and certain affiliated funds, maintain a line of credit with a syndicate of banks in order to secure a source of funds for temporary purposes to meet unanticipated or excessive redemption requests.
Effective August 5, 2014, under a second amended and restated credit agreement (the “Credit Agreement”), the aggregate commitment amount is $600,000,000 with an optional maximum aggregate amount of $700,000,000. The commitment fee is an annual rate of 0.08% of the average commitment amount payable quarterly, regardless of usage, to Bank of New York Mellon, who serves as the agent to the syndicate. The commitment fee is allocated among the MainStay Cushing Funds and certain affiliated funds based upon their respective net assets and other factors. Interest on any revolving credit loan is charged based upon the Federal Funds Advances rate or the one month London InterBank Offered Rate, whichever is higher. The Credit Agreement expires on August 4, 2015, although the Funds, certain affiliated funds and the syndicate of banks may renew the Credit Agreement for an additional year on the same or different terms. There were no borrowings made or outstanding with respect to any of the Funds under the Credit Agreement during the period ended May 31, 2015.
Note 7–Purchases and Sales of Securities (in 000’s)
For the six months ended May 31, 2015, purchases and sales of securities, other than short-term securities, were as follows:
| | | | | | | | |
| | | Purchases | | | Sales | |
MainStay Cushing MLP Premier Fund | | $ | 415,868 | | | $ | 343,064 | |
MainStay Cushing Renaissance Advantage Fund | | | 302,422 | | | | 377,691 | |
MainStay Cushing Royalty Energy Income Fund | | | 192,158 | | | | 131,509 | |
Note 8–Capital Share Transactions
MainStay Cushing MLP Premier Fund
| | | | | | | | |
Class A | | Shares | | | Amount | |
Six-month period ended May 31, 2015: | | | | | | | | |
Shares sold | | | 5,093,542 | | | $ | 107,196,974 | |
Shares issued to shareholders in reinvestment of dividends and distributions | | | 641,294 | | | | 13,420,115 | |
Shares redeemed | | | (5,339,149 | ) | | | (111,737,871 | ) |
| | | | |
Net increase (decrease) | | | 395,687 | | | $ | 8,879,218 | |
| | | | |
Year ended November 30, 2014: | | | | | | | | |
Shares sold | | | 11,116,389 | | | $ | 252,609,875 | |
Shares issued to shareholders in reinvestment of dividends and distributions | | | 1,120,336 | | | | 25,292,145 | |
Shares redeemed | | | (10,919,530 | ) | | | (255,083,262 | ) |
| | | | |
Net increase (decrease) in shares before conversion | | | 1,317,195 | | | | 22,818,758 | |
Shares converted into Class A (See Note 1) | | | 27,373 | | | | 638,400 | |
Shares converted from Class A (See Note 1) | | | (156,802 | ) | | | (3,679,320 | ) |
| | | | |
Net increase (decrease) | | | 1,187,766 | | | $ | 19,777,838 | |
| | | | |
| | |
| | | | | | | | |
| | |
| 60 | | MainStay Cushing Funds |
| | | | | | | | |
Investor Class (a) | | Shares | | | Amount | |
Six-month period ended May 31, 2015: | | | | | | | | |
Shares sold | | | 88,639 | | | $ | 1,857,055 | |
Shares issued to shareholders in reinvestment of dividends and distributions | | | 3,019 | | | | 63,246 | |
Shares redeemed | | | (18,963 | ) | | | (396,432 | ) |
| | | | |
Net increase (decrease) | | | 72,695 | | | $ | 1,523,869 | |
| | | | |
Period ended November 30, 2014: | | | | | | | | |
Shares sold | | | 61,067 | | | $ | 1,429,110 | |
Shares issued to shareholders in reinvestment of dividends and distributions | | | 567 | | | | 13,027 | |
Shares redeemed | | | (2,473 | ) | | | (59,411 | ) |
| | | | |
Net increase (decrease) | | | 59,161 | | | $ | 1,382,726 | |
| | | | |
| | |
| | | | | | | | |
Class C | | Shares | | | Amount | |
Six-month period ended May 31, 2015: | | | | | | | | |
Shares sold | | | 5,027,832 | | | $ | 101,664,547 | |
Shares issued to shareholders in reinvestment of dividends and distributions | | | 1,266,875 | | | | 25,490,408 | |
Shares redeemed | | | (4,567,676 | ) | | | (92,020,739 | ) |
| | | | |
Net increase (decrease) | | | 1,727,031 | | | $ | 35,134,216 | |
| | | | |
Year ended November 30, 2014: | | | | | | | | |
Shares sold | | | 15,598,796 | | | $ | 344,590,258 | |
Shares issued to shareholders in reinvestment of dividends and distributions | | | 1,838,916 | | | | 40,315,113 | |
Shares redeemed | | | (4,534,280 | ) | | | (100,418,307 | ) |
| | | | |
Net increase (decrease) in shares before conversion | | | 12,903,432 | | | | 284,487,064 | |
Shares converted from Class C (See Note 1) | | | (31,804 | ) | | | (724,353 | ) |
| | | | |
Net increase (decrease) | | | 12,871,628 | | | $ | 283,762,711 | |
| | | | |
| | |
| | | | | | | | |
Class I | | Shares | | | Amount | |
Six-month period ended May 31, 2015: | | | | | | | | |
Shares sold | | | 10,527,777 | | | $ | 222,893,094 | |
Shares issued to shareholders in reinvestment of dividends and distributions | | | 869,514 | | | | 18,427,972 | |
Shares redeemed | | | (8,164,827 | ) | | | (173,243,869 | ) |
| | | | |
Net increase (decrease) | | | 3,232,464 | | | $ | 68,077,197 | |
| | | | |
Year ended November 30, 2014: | | | | | | | | |
Shares sold | | | 19,696,781 | | | $ | 460,113,133 | |
Shares issued to shareholders in reinvestment of dividends and distributions | | | 924,636 | | | | 21,224,749 | |
Shares redeemed | | | (5,178,439 | ) | | | (119,728,146 | ) |
| | | | |
Net increase (decrease) in shares before conversion | | | 15,442,978 | | | | 361,609,736 | |
Shares converted into Class I (See Note 1) | | | 185,796 | | | | 4,403,673 | |
Shares converted from Class I (See Note 1) | | | (27,103 | ) | | | (638,400 | ) |
| | | | |
Net increase (decrease) | | | 15,601,671 | | | $ | 365,375,009 | |
| | | | |
|
(a) Investor shares were first offered on July 11, 2014. | |
MainStay Cushing Renaissance Advantage Fund
| | | | | | | | |
Class A | | Shares | | | Amount | |
Six-month period ended May 31, 2015: | | | | | | | | |
Shares sold | | | 918,951 | | | $ | 20,547,214 | |
Shares issued to shareholders in reinvestment of dividends and distributions | | | 26,056 | | | | 578,505 | |
Shares redeemed | | | (541,908 | ) | | | (12,165,344 | ) |
| | | | |
Net increase (decrease) | | | 403,099 | | | $ | 8,960,375 | |
| | | | |
Year ended November 30, 2014: | | | | | | | | |
Shares sold | | | 2,293,008 | | | $ | 58,961,228 | |
Shares issued to shareholders in reinvestment of dividends and distributions | | | 15,749 | | | | 390,094 | |
Shares redeemed | | | (397,479 | ) | | | (9,856,395 | ) |
| | | | |
Net increase (decrease) in shares before conversion | | | 1,911,278 | | | | 49,494,927 | |
Shares converted from Class A (See Note 1) | | | (4,434 | ) | | | (112,227 | ) |
| | | | |
Net increase (decrease) | | | 1,906,844 | | | $ | 49,382,700 | |
| | | | |
| | |
| | | | | | | | |
Investor Class (a) | | Shares | | | Amount | |
Six-month period ended May 31, 2015: | | | | | | | | |
Shares sold | | | 70,988 | | | $ | 1,583,348 | |
Shares issued to shareholders in reinvestment of dividends and distributions | | | 1,271 | | | | 28,331 | |
Shares redeemed | | | (16,998 | ) | | | (379,235 | ) |
| | | | |
Net increase (decrease) | | | 55,261 | | | $ | 1,232,444 | |
| | | | |
Period ended November 30, 2014: | | | | | | | | |
Shares sold | | | 79,488 | | | $ | 2,045,750 | |
Shares issued to shareholders in reinvestment of dividends and distributions | | | 302 | | | | 7,352 | |
Shares redeemed | | | (8,935 | ) | | | (240,309 | ) |
| | | | |
Net increase (decrease) | | | 70,855 | | | $ | 1,812,793 | |
| | | | |
| | |
| | | | | | | | |
Class C | | Shares | | | Amount | |
Six-month period ended May 31, 2015: | | | | | | | | |
Shares sold | | | 517,927 | | | $ | 11,429,268 | |
Shares issued to shareholders in reinvestment of dividends and distributions | | | 21,420 | | | | 468,819 | |
Shares redeemed | | | (498,627 | ) | | | (10,918,477 | ) |
| | | | |
Net increase (decrease) | | | 40,720 | | | $ | 979,610 | |
| | | | |
Year ended November 30, 2014: | | | | | | | | |
Shares sold | | | 2,039,865 | | | $ | 52,208,128 | |
Shares issued to shareholders in reinvestment of dividends and distributions | | | 14,009 | | | | 344,122 | |
Shares redeemed | | | (111,955 | ) | | | (2,723,972 | ) |
| | | | |
Net increase (decrease) | | | 1,941,919 | | | $ | 49,828,278 | |
| | | | |
| | |
| | | | | | | | |
Notes to Financial Statements (Unaudited) (continued)
| | | | | | | | |
Class I | | Shares | | | Amount | |
Six-month period ended May 31, 2015: | | | | | | | | |
Shares sold | | | 3,892,291 | | | $ | 86,447,565 | |
Shares issued to shareholders in reinvestment of dividends and distributions | | | 150,554 | | | | 3,345,634 | |
Shares redeemed (b) | | | (10,238,267 | ) | | | (229,242,398 | ) |
| | | | |
Net increase (decrease) | | | (6,195,422 | ) | | $ | (139,449,199 | ) |
| | | | |
Year ended November 30, 2014: | | | | | | | | |
Shares sold | | | 13,837,341 | | | $ | 351,802,181 | |
Shares issued to shareholders in reinvestment of dividends and distributions | | | 82,836 | | | | 2,042,497 | |
Shares redeemed | | | (1,135,479 | ) | | | (27,625,124 | ) |
| | | | |
Net increase (decrease) in shares before conversion | | | 12,784,698 | | | | 326,219,554 | |
Shares converted into Class I (See Note 1) | | | 4,427 | | | | 112,227 | |
| | | | |
Net increase (decrease) | | | 12,789,125 | | | $ | 326,331,781 | |
| | | | |
|
(a) Investor shares were first offered on July 11, 2014. (b) Includes an in-kind redemption in the amount of $106,860,629 during the six-month period ended May 31, 2015 (See Note 9). | |
MainStay Cushing Royalty Energy Income Fund
| | | | | | | | |
Class A | | Shares | | | Amount | |
Six-month period ended May 31, 2015: | | | | | | | | |
Shares sold | | | 6,428,977 | | | $ | 64,429,585 | |
Shares issued to shareholders in reinvestment of dividends and distributions | | | 436,174 | | | | 4,057,534 | |
Shares redeemed | | | (5,675,066 | ) | | | (56,535,822 | ) |
| | | | |
Net increase (decrease) | | | 1,190,085 | | | $ | 11,951,297 | |
| | | | |
Year ended November 30, 2014: | | | | | | | | |
Shares sold | | | 8,836,339 | | | $ | 149,815,415 | |
Shares issued to shareholders in reinvestment of dividends and distributions | | | 411,696 | | | | 7,080,446 | |
Shares redeemed | | | (1,551,239 | ) | | | (26,198,303 | ) |
| | | | |
Net increase (decrease) in shares before conversion | | | 7,696,796 | | | | 130,697,558 | |
Shares converted from Class A (See Note 1) | | | (893 | ) | | | (16,882 | ) |
| | | | |
Net increase (decrease) | | | 7,695,903 | | | $ | 130,680,676 | |
| | | | |
| | |
| | | | | | | | |
Investor Class (a) | | Shares | | | Amount | |
Six-month period ended May 31, 2015: | | | | | | | | |
Shares sold | | | 293,457 | | | $ | 2,780,341 | |
Shares issued to shareholders in reinvestment of dividends and distributions | | | 8,667 | | | | 81,251 | |
Shares redeemed | | | (28,396 | ) | | | (268,112 | ) |
| | | | |
Net increase (decrease) | | | 273,728 | | | $ | 2,593,480 | |
| | | | |
Period ended November 30, 2014: | | | | | | | | |
Shares sold | | | 71,172 | | | $ | 1,181,406 | |
Shares issued to shareholders in reinvestment of dividends and distributions | | | 933 | | | | 14,871 | |
Shares redeemed | | | (2,191 | ) | | | (38,745 | ) |
| | | | |
Net increase (decrease) | | | 69,914 | | | $ | 1,157,532 | |
| | | | |
| | | | | | | | |
Class C | | Shares | | | Amount | |
Six-month period ended May 31, 2015: | | | | | | | | |
Shares sold | | | 3,307,344 | | | $ | 32,710,381 | |
Shares issued to shareholders in reinvestment of dividends and distributions | | | 198,309 | | | | 1,803,209 | |
Shares redeemed | | | (1,085,067 | ) | | | (10,710,386 | ) |
| | | | |
Net increase (decrease) | | | 2,420,586 | | | $ | 23,803,204 | |
| | | | |
Year ended November 30, 2014: | | | | | | | | |
Shares sold | | | 3,560,370 | | | $ | 60,007,899 | |
Shares issued to shareholders in reinvestment of dividends and distributions | | | 86,793 | | | | 1,437,135 | |
Shares redeemed | | | (297,610 | ) | | | (4,940,033 | ) |
| | | | |
Net increase (decrease) | | | 3,349,553 | | | $ | 56,505,001 | |
| | | | |
| | |
| | | | | | | | |
Class I | | Shares | | | Amount | |
Six-month period ended May 31, 2015: | | | | | | | | |
Shares sold | | | 8,035,864 | | | $ | 81,345,922 | |
Shares issued to shareholders in reinvestment of dividends and distributions | | | 374,156 | | | | 3,486,307 | |
Shares redeemed | | | (8,173,735 | ) | | | (78,520,786 | ) |
| | | | |
Net increase (decrease) | | | 236,285 | | | $ | 6,311,443 | |
| | | | |
Year ended November 30, 2014: | | | | | | | | |
Shares sold | | | 7,305,537 | | | $ | 123,149,600 | |
Shares issued to shareholders in reinvestment of dividends and distributions | | | 128,133 | | | | 2,070,337 | |
Shares redeemed | | | (264,573 | ) | | | (4,326,684 | ) |
| | | | |
Net increase (decrease) in shares before conversion | | | 7,169,097 | | | | 120,893,253 | |
Shares converted into Class I (See Note 1) | | | 888 | | | | 16,882 | |
| | | | |
Net increase (decrease) | | | 7,169,985 | | | $ | 120,910,135 | |
| | | | |
|
(a) Investor shares were first offered on July 11, 2014. | |
Note 9–In Kind Transfer of Securities
During the six-month period ended May 31, 2015, the MainStay Cushing Renaissance Advantage Fund redeemed shares of beneficial interest in exchange for securities. The securities were transferred at their current value on the date of transaction.
| | | | | | | | | | |
| Transaction Date | | Shares | | Value | | | Gain (Loss) | |
| 4/30/2015 | | 4,707,392 | | $ | 106,860,629 | | | $ | (2,678,381 | ) |
| | |
| 62 | | MainStay Cushing Funds |
Note 10–Subsequent Events
In connection with the preparation of the financial statements of the MainStay Cushing Funds as of and for the six-month period ended May 31, 2015, events and transactions subsequent to May 31, 2015, through the date the financial statements were issued have been evaluated by the MainStay Cushing Funds’ management for possible adjustment and/or disclosure. No subsequent events requiring financial statement adjustment or disclosure have been identified other than the notice of quarterly distributions declared by MainStay.
On July 24, 2015 the MainStay Cushing MLP Premier Fund declared a distribution payable of $0.335 per share, to Class A shareholders,
Investors Class shareholders, Class C shareholders and Class I shareholders of record on July 23, 2015, and payable on July 24, 2015.
On July 24, 2015 the MainStay Cushing Renaissance Advantage Fund declared a distribution payable of $0.14 per share, to Class A shareholders, Investors Class shareholders, Class C shareholders and Class I shareholders of record on July 23, 2015, and payable on July 24, 2015.
On July 24, 2015 the MainStay Cushing Royalty Energy Income Fund declared a distribution of $0.20 per share, to Class A shareholders, Investors Class shareholders, Class C shareholders and Class I shareholders of record on July 23, 2015, and payable on July 24, 2015.
Proxy Voting Policies and Procedures and Proxy Voting Record (Unaudited)
A description of the policies and procedures that New York Life Investments uses to vote proxies related to the Funds’ securities is available without charge, upon request, (i) by visiting the Funds’ website at mainstayinvestments.com; and (ii) on the Securities and Exchange Commission’s (“SEC”) website at www.sec.gov.
The Funds are required to file with the SEC its proxy voting record for the 12-month period ending June 30 on Form N-PX. The Funds’ most recent Form N-PX is available free of charge upon request by calling 800-MAINSTAY (624-6782); visiting the Fund’s website at mainstayinvestments.com; or on the SEC’s website at www.sec.gov.
Shareholder Reports and Quarterly Portfolio Disclosure (Unaudited)
Each Cushing Fund is required to file its complete schedule of portfolio holdings with the SEC for its first and third fiscal quarters on Form N-Q. Each Cushing Fund’s Form N-Q is available without charge, on the SEC’s website at www.sec.gov or by calling MainStay Investments at 800-MAINSTAY (624-6782). You also can obtain and review copies of Form N-Q by visiting the SEC’s Public Reference Room in Washington, DC (information on the operation of the Public Reference Room may be obtained by calling 1-800-SEC-0330).
| | |
| 64 | | MainStay Cushing Funds |
This page intentionally left blank
This page intentionally left blank
MainStay Funds
MainStay offers a wide range of Funds for virtually any investment need. The full array of MainStay open-end offerings is listed here, with information about the manager, subadvisors, legal counsel and independent registered public accounting firms.
Equity
U.S. Equity
MainStay Common Stock Fund
MainStay Cornerstone Growth Fund
MainStay Epoch U.S. All Cap Fund
MainStay Epoch U.S. Equity Yield Fund
MainStay ICAP Equity Fund
MainStay ICAP Select Equity Fund
MainStay Large Cap Growth Fund
MainStay MAP Fund
MainStay S&P 500 Index Fund
MainStay U.S. Equity Opportunities Fund
MainStay U.S. Small Cap Fund
International/Global Equity
MainStay Emerging Markets Opportunities Fund
MainStay Epoch Global Choice Fund
MainStay Epoch Global Equity Yield Fund
MainStay Epoch International Small Cap Fund
MainStay ICAP Global Fund
MainStay ICAP International Fund
MainStay International Equity Fund
MainStay International Opportunities Fund
Income
Taxable Bond
MainStay Floating Rate Fund
MainStay Global High Income Fund
MainStay Government Fund
MainStay High Yield Corporate Bond Fund
MainStay High Yield Opportunities Fund
MainStay Indexed Bond Fund
MainStay Short Duration High Yield Fund
MainStay Total Return Bond Fund
MainStay Unconstrained Bond Fund
Municipal/Tax Advantaged Bond
MainStay California Tax Free Opportunities Fund1
MainStay High Yield Municipal Bond Fund
MainStay New York Tax Free Opportunities Fund2
MainStay Tax Advantaged Short Term Bond Fund (formerly known as MainStay Short Term Bond Fund)
MainStay Tax Free Bond Fund
Money Market
MainStay Money Market Fund
Mixed Asset
MainStay Balanced Fund
MainStay Convertible Fund
MainStay Income Builder Fund
Alternative
MainStay Absolute Return Multi-Strategy Fund
MainStay Cushing MLP Premier Fund
MainStay Cushing Renaissance Advantage Fund
MainStay Cushing Royalty Energy Income Fund
MainStay Marketfield Fund
Asset Allocation/Target Date
MainStay Conservative Allocation Fund
MainStay Growth Allocation Fund
MainStay Moderate Allocation Fund
MainStay Moderate Growth Allocation Fund
MainStay Retirement 2010 Fund
MainStay Retirement 2020 Fund
MainStay Retirement 2030 Fund
MainStay Retirement 2040 Fund
MainStay Retirement 2050 Fund
Manager
New York Life Investment Management LLC
New York, New York
Subadvisors
Candriam France S.A.S.3
Paris, France
Cornerstone Capital Management Holdings LLC3
New York, New York
Cornerstone Capital Management LLC3
Bloomington, Minnesota
Cushing Asset Management, LP
Dallas, Texas
Epoch Investment Partners, Inc.
New York, New York
Institutional Capital LLC3
Chicago, Illinois
MacKay Shields LLC3
New York, New York
Marketfield Asset Management LLC
New York, New York
Markston International LLC
White Plains, New York
NYL Investors LLC3
New York, New York
Winslow Capital Management LLC
Minneapolis, Minnesota
Legal Counsel
Dechert LLP
Independent Registered Public Accounting Firms
KPMG LLP4
PricewaterhouseCoopers LLP5
1. This Fund is only registered for sale in AZ, CA, NV, OR, UT, and WA.
2. This Fund is only registered for sale in CT, DE, FL, MA, NJ, NY, and VT.
3. An affiliate of New York Life Investment Management LLC.
4. For all Funds listed above except MainStay Marketfield Fund.
5. For MainStay Marketfield Fund only.
Not part of the Semiannual Report
For more information
800-MAINSTAY (624-6782)
mainstayinvestments.com
MainStay Investments® is a registered service mark and name under which New York Life Investment Management LLC does business. MainStay Investments, an indirect subsidiary of New York Life Insurance Company, New York, NY 10010, provides investment advisory products and services. The MainStay Funds® are managed by New York Life Investment Management LLC and distributed through NYLIFE Distributors LLC, 169 Lackawanna Avenue, Parsippany, NJ 07054, a wholly owned subsidiary of New York Life Insurance Company. NYLIFE Distributors LLC is a Member FINRA/SIPC.
©2015 NYLIFE Distributors LLC. All rights reserved.
| | | | | | | | |
| Not FDIC/NCUA Insured | | Not a Deposit | | May Lose Value | | No Bank Guarantee | | Not Insured by Any Government Agency |
| | |
| 1656472 MS182-15 | | MSCU10-07/15 (NYLIM) NL266 |
Item 2. Code of Ethics.
Not applicable.
| Item 3. | Audit Committee Financial Expert. |
Not applicable.
| Item 4. | Principal Accountant Fees and Services. |
Not applicable.
| Item 5. | Audit Committee of Listed Registrants |
Not applicable.
| Item 6. | Schedule of Investments |
The Schedule of Investments is included as part of Item 1 of this report.
| Item 7. | Disclosure of Proxy Voting Policies and Procedures for Closed-End Management Investment Companies. |
Not applicable.
| Item 8. | Portfolio Managers of Closed-End Management Investment Companies. |
Not applicable.
| Item 9. | Purchases of Equity Securities by Closed-End Management Investment Company and Affiliated Purchasers. |
Not Applicable.
| Item 10. | Submission of Matters to a Vote of Security Holders. |
Since the Registrant’s last response to this Item, there have been no material changes to the procedures by which shareholders may recommend nominees to the Registrant’s Board of Trustees.
| Item 11. | Controls and Procedures. |
(a) Based on an evaluation of the Registrant’s Disclosure Controls and Procedures (as defined in Rule 30a-3(c) under the Investment Company Act of 1940) (the “Disclosure Controls”), as of a date within 90 days prior to the filing date (the “Filing Date”) of this Form N-CSR (the “Report”), the Registrant’s principal executive officer and principal financial officer have concluded that the Disclosure Controls are reasonably designed to ensure that information required to be disclosed by the Registrant in the Report is recorded, processed, summarized and reported by the Filing Date, including ensuring that information required to be disclosed in the Report is accumulated and communicated to the Registrant’s management, including the Registrant’s principal executive officer and principal financial officer, as appropriate to allow timely decisions regarding required disclosure.
(b) There were no changes in the Registrant’s internal control over financial reporting (as defined in Rule 30a-3(d)) under the Investment Company Act of 1940 that occurred during the second fiscal quarter of the period covered by this report that has materially affected, or is reasonably likely to materially affect, the Registrant’s internal control over financial reporting.
Item 12. Exhibits.
| | |
(a) | | Certifications of principal executive officer and principal financial officer as required by Rule 30a-2 under the Investment Company Act of 1940. |
| |
(b) | | Certifications of principal executive officer and principal financial officer as required by Section 906 of the Sarbanes-Oxley Act of 2002. |
SIGNATURES
Pursuant to the requirements of the Securities Exchange Act of 1934 and the Investment Company Act of 1940, the Registrant has duly caused this Report to be signed on its behalf by the undersigned, thereunto duly authorized.
MAINSTAY FUNDS TRUST
| | |
| By: | | /s/ Stephen P. Fisher |
| | Stephen P. Fisher President and Principal Executive Officer |
| |
Date: | | August 6, 2015 |
Pursuant to the requirements of the Securities Exchange Act of 1934 and the Investment Company Act of 1940, this Report has been signed below by the following persons on behalf of the Registrant and in the capacities and on the dates indicated.
| | |
| By: | | /s/ Stephen P. Fisher |
| | Stephen P. Fisher President and Principal Executive Officer |
| |
Date: | | August 6, 2015 |
| | |
| By: | | /s/ Jack R. Benintende |
| | Jack R. Benintende Treasurer and Principal Financial and Accounting Officer |
| |
Date: | | August 6, 2015 |
EXHIBIT INDEX
| | |
(a) | | Certifications of principal executive officer and principal financial officer as required by Rule 30a-2 under the Investment Company Act of 1940. |
| |
(b) | | Certification of principal executive officer and principal financial officer as required by Section 906 of the Sarbanes-Oxley Act of 2002. |