| | |
| | OMB APPROVAL |
| | OMB Number: 3235-0570 Expires: January 31, 2017 Estimated average burden hours per response. . . ..20.6 |
UNITED STATES
SECURITIES AND EXCHANGE COMMISSION
Washington, D.C. 20549
Form N-CSR
CERTIFIED SHAREHOLDER REPORT OF REGISTERED MANAGEMENT
INVESTMENT COMPANIES
Investment Company Act File Number 811-22321
MAINSTAY FUNDS TRUST
(Exact name of Registrant as specified in charter)
51 Madison Avenue, New York, NY 10010
(Address of principal executive offices) (Zip code)
J. Kevin Gao, Esq.
169 Lackawanna Avenue
Parsippany, New Jersey 07054
(Name and address of agent for service)
Registrant’s telephone number, including area code: (212) 576-7000
Date of fiscal year end: April 30
(MainStay Absolute Return Multi-Strategy Fund and MainStay Tax Advantaged Short Term Bond Fund)
Date of reporting period: October 31, 2015
FORM N-CSR
The information presented in this Form N-CSR relates solely to the
MainStay Absolute Return Multi-Strategy Fund and MainStay Tax Advantaged Short Term Bond Fund, series of the Registrant.
| Item 1. | Reports to Stockholders. |
MainStay Absolute Return Multi-Strategy Fund
Message from the President and Semiannual Report
Unaudited | October 31, 2015


This page intentionally left blank
Message from the President
The period from June 18 through October 31, 2015, was marked by increased market volatility, particularly after the People’s Bank of China devalued the Chinese yuan on August 11, 2015. Following the devaluation, many stock markets around the world dropped substantially. Some took months to recover.
U.S. large-cap stocks were unable to end the reporting period in positive territory. Concerns that the Federal Reserve might raise the federal funds target rate weighed on many investors during the reporting period. Successive developments in employment, inflation and the stock market, however, led the Federal Reserve to repeatedly postpone a tightening move. According to Russell data, growth stocks outperformed value stocks among large- and mid-capitalization companies during the reporting period, while value stocks outperformed growth stocks among smaller-capitalization companies.
On the whole, international, global and emerging-market stocks all provided negative returns for the reporting period, with emerging-market stocks registering double-digit declines. Emerging markets suffered from a number of difficulties, including slowing growth in China, low oil and gas prices and slack demand for metals. This combination led to fewer exports.
The U.S. bond market saw mixed results during the reporting period. Yields on 3-year and shorter U.S. Treasury bonds closed
the reporting period higher than where they began, but yields on all other U.S. Treasury securities declined. During the reporting period, high-yield bonds provided negative returns, as did leveraged loans and convertible securities. In the aggregate, U.S. investment-grade bonds advanced during the reporting period, as did municipal bonds.
The stock and bond markets are constantly changing, often in unexpected ways. That’s why at MainStay, we encourage investors to view short-term performance in light of their long-term financial goals.
The following pages provide more detailed information about the specific markets, securities and investment decisions that most affected your MainStay Fund during the reporting period ended October 31, 2015. We hope that you will carefully review this report and use it as you consider ways to pursue your personal financial goals and objectives.
Sincerely,

Stephen P. Fisher
President
The opinions expressed are as of the date of this report and are subject to change. There is no guarantee that any forecast made will come to pass. This material does not constitute investment advice and is not intended as an endorsement of any specific investment. Past performance is no guarantee of future results.
Not part of the Semiannual Report
Table of Contents
Investors should refer to the Fund’s Summary Prospectus and/or Prospectus and consider the Fund’s investment objectives, strategies, risks, charges and expenses carefully before investing. The Summary Prospectus and/or Prospectus contain this and other information about the Fund. You may obtain copies of the Fund’s Summary Prospectus, Prospectus and Statement of Additional Information free of charge, upon request, by calling toll-free 800-MAINSTAY (624-6782), by writing to NYLIFE Distributors LLC, Attn: MainStay Marketing Department, 169 Lackawanna Avenue, Parsippany, New Jersey 07054 or by sending an e-mail to MainStayShareholderServices@nylim.com. These documents are also available via the MainStay Funds’ website at mainstayinvestments.com/documents. Please read the Summary Prospectus and/or Prospectus carefully before investing.
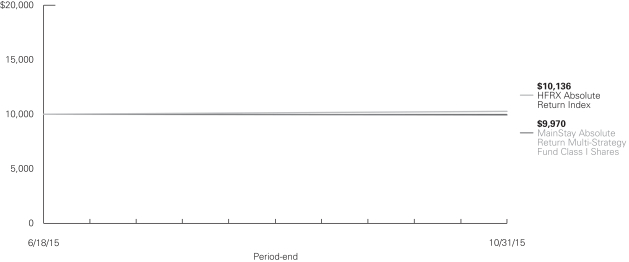
Investment and Performance Comparison1 (Unaudited)
Performance data quoted represents past performance. Past performance is no guarantee of future results. Because of market volatility, current performance may be lower or higher than the figures shown. Investment return and principal value will fluctuate, and as a result, when shares are redeemed, they may be worth more or less than their original cost. The graph below depicts the historical performance of Class I shares of the Fund. Performance will vary from class to class based on differences in class-specific expenses and sales charges. For performance information current to the most recent month-end, please call 800-MAINSTAY (624-6782) or visit mainstayinvestments.com.
Average Annual Total Returns for the Period Ended October 31, 2015
| | | | | | | | | | | | |
| Class | | Sales Charge | | | | Since
Inception
(6/18/15) | | | Gross
Expense
Ratio2 | |
| Class A Shares | | Maximum 5.5% Initial Sales Charge | | With sales charges Excluding sales charges | |
| –5.69
–0.20 | %
| |
| 2.51
2.51 | %
|
| Investor Class Shares | | Maximum 5.5% Initial Sales Charge | | With sales charges Excluding sales charges | |
| –5.88
–0.40 |
| |
| 2.67
2.67 |
|
| Class C Shares | | Maximum 1% CDSC if Redeemed Within One Year of Purchase | | With sales charges Excluding sales charges | |
| –1.69
–0.70 |
| |
| 3.42
3.42 |
|
| Class I Shares | | No Sales Charge | | | | | –0.30 | | | | 2.26 | |
| | | | |
| Benchmark Performance | | Since
Inception
(6/18/15) | |
HFRX Absolute Return Index3 | | | 1.36 | % |
Average Lipper Alternative Multi-Strategy Fund4 | | | –2.35 | |
| 1. | The performance table and graph do not reflect the deduction of taxes that a shareholder would pay on distributions or Fund share redemptions. Total returns reflect maximum applicable sales charges as indicated in the table above, changes in share price, and reinvestment of dividend and capital gain distributions. The graph assumes the initial investment amount shown above and reflects the deduction of all sales charges that would have applied for the periods of investment. Performance figures reflect certain fee waivers and/or expense limitations, without which total returns may have been lower. For more information on share classes and current fee waivers and/or expense limitations, please refer to the notes to the consolidated financial statements. |
| 2. | The gross expense ratios presented reflect the Fund’s “Total Annual Fund Operating Expenses” from the most recent Prospectus and may differ from other expense ratios disclosed in this report. |
| 3. | The HFRX Absolute Return Index is designed to be representative of the overall composition of the hedge fund universe. It is comprised of eligible hedge fund strategies; including but not limited to convertible arbitrage, distressed securities, equity hedge, equity market neutral, event driven, macro, merger arbitrage, and relative value arbitrage. |
| 4. | The Average Lipper Alternative Multi-Strategy Fund is representative of the funds that seek total returns through the management of several different hedge- like strategies. These funds are typically quantitatively driven to measure the existing relationship between instruments and in some cases to identify positions in which the risk-adjusted spread between these instruments represents an opportunity for the investment manager. This benchmark is a product of Lipper Inc. Lipper Inc. is an independent monitor of the fund performance. Results are based on average total returns of similar funds with all dividend and capital gain distributions reinvested. |
The footnotes are an integral part of the table and graph and should be carefully read in conjunction with them.
Cost in Dollars of a $1,000 Investment in MainStay Absolute Return Multi-Strategy Fund (Unaudited)
The example below is intended to describe the fees and expenses borne by shareholders during the period from June 18, 2015, to October 31, 2015, and the impact of those costs on your investment.
Example
As a shareholder of the Fund, you incur two types of costs: (1) transaction costs, including exchange fees and sales charges (loads) on purchases (as applicable), and (2) ongoing costs, including management fees, distribution and/or service (12b-1) fees, and other Fund expenses (as applicable). This example is intended to help you understand your ongoing costs (in dollars) of investing in the Fund and to compare these costs with the ongoing costs of investing in other mutual funds. The example is based on an investment of $1,000 made at the beginning of the period and held for the entire period from June 18, 2015, to October 31, 2015.
This example illustrates your Fund’s ongoing costs in two ways:
Actual Expenses
The second and third data columns in the table below provide information about actual account values and actual expenses. You may use the information in these columns, together with the amount you invested, to estimate the expenses that you paid during the period ended October 31, 2015. Simply divide your account value by $1,000 (for example, an $8,600 account value divided by $1,000 = 8.6), then
multiply the result by the number under the heading entitled “Expenses Paid During Period” to estimate the expenses you paid on your account during this period.
Hypothetical Example for Comparison Purposes
The fourth and fifth data columns in the table below provide information about hypothetical account values and hypothetical expenses based on the Fund’s actual expense ratio and an assumed rate of return of 5% per year before expenses, which is not the Fund’s actual return. The hypothetical account values and expenses may not be used to estimate the actual ending account balances or expenses you paid for the six-month period shown. You may use this information to compare the ongoing costs of investing in the Fund with the ongoing costs of investing in other Funds. To do so, compare this 5% hypothetical example with the 5% hypothetical examples that appear in the shareholder reports of the other Funds.
Please note that the expenses shown in the table are meant to highlight your ongoing costs only and do not reflect any transactional costs, such as exchange fees or sales charges (loads). Therefore, the fourth and fifth data columns of the table are useful in comparing ongoing costs only and will not help you determine the relative total costs of owning different funds. In addition, if these transactional costs were included, your costs would have been higher.
| | | | | | | | | | | | | | | | | | | | |
| | | | | | | | | | | | | | | | |
| Share Class | | Beginning
Account
Value
6/18/151 | | | Ending Account
Value (Based
on Actual
Returns and
Expenses)
10/31/15 | | | Expenses
Paid
During
Period2 | | | Ending Account
Value (Based
on Hypothetical
5% Annualized
Return and
Actual Expenses)
10/31/15 | | | Expenses
Paid
During
Period2 | |
| | | | | |
| Class A Shares3 | | $ | 1,000.00 | | | $ | 998.00 | | | $ | 9.32 | | | $ | 1,009.30 | | | $ | 9.37 | |
| | | | | |
| Investor Class Shares3 | | $ | 1,000.00 | | | $ | 996.00 | | | $ | 9.72 | | | $ | 1,008.80 | | | $ | 9.78 | |
| | | | | |
| Class C Shares3 | | $ | 1,000.00 | | | $ | 993.00 | | | $ | 12.44 | | | $ | 1,006.10 | | | $ | 12.52 | |
| | | | | |
| Class I Shares3 | | $ | 1,000.00 | | | $ | 997.00 | | | $ | 8.24 | | | $ | 1,010.30 | | | $ | 8.29 | |
| 1. | The inception date of the Fund. |
| 2. | Expenses are equal to the Fund’s annualized expense ratio of each class (2.51% for Class A, 2.62% for Investor Class, 3.36% for Class C and 2.22% for Class I) multiplied by the average account value over the period, divided by 366 and multiplied by 136 days (to reflect the since-inception period which took place after the close of business on June 18, 2015). The table above represents the actual expenses incurred during the period. |
| 3. | Expenses paid during the period reflect ongoing costs for the period from June 18, 2015 through October 31, 2015. Had these shares been offered for the full six-month period ended October 31, 2015, and had the Fund provided a hypothetical 5% annualized return, expenses paid during the period would have been $12.70 for Class A, $13.25 for Investor Class, $16.96 for Class C and $11.24 for Class I and the ending account value would have been $1,012.50 for Class A, $1,012.00 for Investor Class, $1,008.20 for Class C and $1,014.00 for Class I. |
| | |
| 6 | | MainStay Absolute Return Multi-Strategy Fund |
Portfolio Composition as of October 31, 2015 (Unaudited)
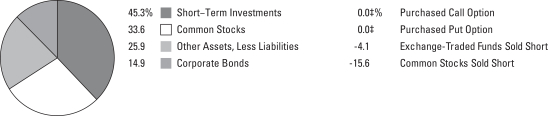
See Consolidated Portfolio of Investments beginning on page 10 for specific holdings within these categories.
| ‡ | Less than one-tenth of a percent. |
Top Ten Holdings Held as of October 31, 2015 (excluding short-term investments) (Unaudited)
| 3. | Integrated Silicon Solution, Inc. |
| 5. | Time Warner Cable, Inc. |
| 6. | Energy Transfer Equity, L.P. |
| 7. | Sunoco Logistics Partners, L.P. |
| 9. | Enterprise Products Partners, L.P. |
Top Five Short Positions as of October 31, 2015 (Unaudited)
| 1. | United States Oil Fund, L.P. |
| 3. | Chocoladefabriken Lindt & Sprungli A.G. |
| 4. | SBA Communications Corp. Class A |
| 5. | Level 3 Communications, Inc. |
Portfolio Management Discussion and Analysis (Unaudited)
Questions answered by Jae S. Yoon, CFA, Jonathan Swaney, Poul Kristensen, CFA, and Amit Soni, CFA, of New York Life Investments,1 the Fund’s manager.
How did MainStay Absolute Return Multi-Strategy Fund perform relative to its primary benchmark and peers during the period from June 18, 2015, through October 31, 2015?
MainStay Absolute Return Multi-Strategy Fund commenced operations on June 18, 2015. Excluding all sales charges, MainStay Absolute Return Multi-Strategy Fund returned –0.20% for Class A shares, –0.40% for Investor Class shares and –0.70% for Class C shares from June 18, 2015, through October 31, 2015. Over the same period, Class I shares returned –0.30%. From June 18, 2015, through October 31, 2015, all share classes underperformed the 1.36% return of the HFRX Absolute Return Index,2 which is the Fund’s broad-based securities-market index. Over the same period, all share classes outperformed the –2.35% return of the Average Lipper3 Alternative Multi-Strategy Fund. See page 5 for Fund returns with sales charges.
What factors affected the Fund’s relative performance during the reporting period?
Several factors affected the Fund’s performance relative to the HFRX Absolute Return Index. Market conditions were generally favorable for quantitatively driven investment programs, helping to explain why equity market neutral was the Fund’s best-performing strategy. The Fund’s allocations to the alpha and royalty strategies4 detracted the most from the Fund’s relative performance despite hedging activities intended to reduce the risk and volatility associated with these investments. The master limited partnerships (“MLP”) sector was adversely affected primarily by concerns about overbuilt infrastructure. The Fund’s exposure to the risk arbitrage strategy was also a moderate detractor. This exposure suffered from the widening of spreads and from some positions in event-driven strategies. The performance of the risk arbitrage strategy, however, was in line with other similar peer strategies during the reporting period. From a risk perspective, the Fund remained below its current target long-term annualized volatility level of less than 6% (as measured by annualized standard deviation of the Fund’s returns).
During the reporting period, how did the Fund’s performance correlate with traditional equity and fixed-income indices?
The Fund maintained low correlation to traditional equity and fixed-income indices during the reporting period, as designed. The correlation of the Fund’s overall portfolio to the S&P 500® Index5 was 33% and the correlation to the Barclays U.S. Aggregate Bond Index6 was 16%.
During the reporting period, how did the Fund’s volatility compare to that of traditional fixed-income indices?
During the reporting period, the Fund’s volatility (as measured by annualized standard deviation of the Fund’s returns) was closer to that of traditional fixed-income indices than it was to that of traditional equity indices. The Fund’s volatility was 4.8%, compared to a volatility of 3.9% for the Barclays U.S. Aggregate Bond Index and a volatility of 4.5% for the BofA Merrill Lynch High Yield Master II Index.7 During the reporting period, the volatility of the S&P 500® Index was 18.9%.
How did the Fund use derivatives during the reporting period?
The Fund used derivatives for a variety of purposes, including alpha generation, hedging and/or operational efficiency. We believe that measuring the impact of derivatives on performance as positive or negative does not properly reflect their utility to the Fund because of the function they perform within the Fund. For example, a hedge performing as expected might have a negative contribution to return even as it serves its intended function to reduce a risk or exposure.
How did you allocate the Fund’s assets among each of the strategies during the reporting period and why?
The Fund’s allocations are based on the estimated optimal distribution of assets taking into account both the risk and return expectations. (It is not possible to increase return without taking additional risk, and the Fund generally cannot reduce risk without also reducing return.) These estimates of risk and return are long term in nature, and as a result, asset allocations tend
| 1. | “New York Life Investments” is a service mark used by New York Life Investment Management Holdings LLC and its subsidiary New York Life Investment Management LLC. |
| 2. | See footnote on page 5 for more information on the HFRX Absolute Return Index. |
| 3. | See footnote on page 5 for more information on Lipper Inc. |
| 4. | The master limited partnerships and other energy companies portion of the Fund is comprised of two underlying strategies: the MLP alpha (midstream) strategy and the MLP royalty (upstream) strategy. |
| 5. | The S&P 500® Index is widely regarded as the as the standard index for measuring large-cap U.S. stock market performance. Results assume reinvestment of all dividends and capital gains. An investment cannot be made directly in an index. |
| 6. | The Barclays U.S. Aggregate Bond Index is a broad-based benchmark that measures the investment grade, U.S. dollar-denominated, fixed-rate taxable bond market, including Treasurys, government-related and corporate securities (agency fixed-rate and hybrid adjustable-rate mortgage pass-throughs), asset-backed securities and commercial mortgage-backed securities. Results assume reinvestment of all dividends and capital gains. An investment cannot be made directly in an index. |
| 7. | The BofA Merrill Lynch High Yield Master II Index monitors the performance of below investment-grade U.S. dollar-denominated corporate bonds publicly issued in the U.S. domestic market. An investment cannot be made directly in an index. |
| | |
| 8 | | MainStay Absolute Return Multi-Strategy Fund |
to be quite stable over time. The Fund’s allocation to an individual strategy may change if there is a statistically significant change in the risk-return characteristics of a strategy or if an attractive new strategy became available for investment that we believe would likely further support the Fund’s investment goal.
Below were the target allocations to each strategy as of October 31, 2015:
| • | | Flexible bond8 strategy: 10% |
| • | | Managed futures strategy: 19.5% |
| • | | Risk arbitrage strategy: 12% |
| • | | Credit opportunities8 strategy: 15% |
| • | | Equity market neutral strategy: 19.5% |
| • | | MLP alpha strategy: 10% |
| • | | MLP royalty strategy: 1% |
| • | | Tactical/completion strategy: 13% |
How did the tactical allocation among the strategies affect the Fund’s performance during the reporting period?
The strategy allocations were stable and there were no tactical adjustments among the strategies during the reporting period.
During the reporting period, how did each strategy either contribute to or detract from the Fund’s absolute performance?
The equity market neutral strategy, the managed futures strategy, the credit opportunities strategy and the flexible bond strategy made positive contributions to the Fund’s gross performance during the reporting period. (Contributions take weightings and total returns into account.) The tactical/completion strategy, the MLP royalty strategy, the risk arbitrage strategy and the MLP alpha strategy made negative contributions to the Fund’s gross performance during the reporting period.
How did the Fund’s strategy weightings change during the reporting period?
The Fund’s absolute return investment approach seeks to provide positive returns over a complete market cycle, although returns may be negative during certain periods within or over a complete market cycle. The Fund’s underlying investment strategies are intended to provide complementary risk-return expectations and diversified non-traditional investments. As previously noted, the allocations to various strategies remained stable and there were no tactical adjustments during the reporting period.
| 8. | The credit long/short or non-traditional fixed-income portion of the Fund consists of two underlying strategies: the flexible bond strategy and the credit opportunities strategy. |
The opinions expressed are those of the portfolio managers as of the date of this report and are subject to change. There is no guarantee that any forecast made will come to pass. This material does not constitute investment advice and is not intended as an endorsement of any specific investment.
Consolidated Portfolio of Investments October 31, 2015 (Unaudited)
| | | | | | | | |
| | | Principal
Amount | | | Value | |
| Corporate Bonds 14.9%† | | | | | | | | |
Apparel 0.2% | |
SMCP SAS
8.875%, due 6/15/20 | | $ | 200,000 | | | $ | 236,997 | |
| | | | | | | | |
|
Auto Manufacturers 0.4% | |
FCA U.S. LLC / CG Co-Issuer, Inc.
8.25%, due 6/15/21 | | | 400,000 | | | | 428,000 | |
| | | | | | | | |
|
Auto Parts & Equipment 1.1% | |
Alliance Automotive Finance PLC
6.25%, due 12/1/21 | | | EUR 100,000 | | | | 113,488 | |
Autodis S.A.
6.50%, due 2/1/19 | | | 300,000 | | | | 341,276 | |
Goodyear Tire & Rubber Co. (The)
8.25%, due 8/15/20 | | $ | 279,000 | | | | 291,834 | |
Grupo Antolin Dutch B.V.
5.125%, due 6/30/22 | | | EUR 200,000 | | | | 224,888 | |
Schaeffler Finance B.V.
2.75%, due 5/15/19 | | | 100,000 | | | | 110,927 | |
| | | | | | | | |
| | | | | | | 1,082,413 | |
| | | | | | | | |
Banks 0.4% | |
Bank of America Corp. | | | | | | | | |
4.20%, due 8/26/24 | | $ | 60,000 | | | | 60,329 | |
5.625%, due 7/1/20 | | | 55,000 | | | | 61,954 | |
Goldman Sachs Group, Inc. (The) | | | | | | | | |
5.375%, due 3/15/20 | | | 55,000 | | | | 61,432 | |
6.75%, due 10/1/37 | | | 50,000 | | | | 60,256 | |
Morgan Stanley | | | | | | | | |
5.00%, due 11/24/25 | | | 60,000 | | | | 64,201 | |
5.50%, due 1/26/20 | | | 50,000 | | | | 55,749 | |
| | | | | | | | |
| | | | | | | 363,921 | |
| | | | | | | | |
Building Materials 0.4% | |
CEMEX Espana S.A.
9.875%, due 4/30/19 | | | 350,000 | | | | 373,188 | |
| | | | | | | | |
|
Chemicals 0.3% | |
SPCM S.A.
2.875%, due 6/15/23 | | | EUR 250,000 | | | | 262,198 | |
| | | | | | | | |
|
Commercial Services 0.7% | |
La Financiere Atalian SAS
7.25%, due 1/15/20 | | | 120,000 | | | | 141,525 | |
Verisure Holding AB | | | | | | | | |
6.00%, due 11/1/22 | | | 110,000 | | | | 123,683 | |
8.75%, due 9/1/18 | | | 350,000 | | | | 401,716 | |
| | | | | | | | |
| | | | | | | 666,924 | |
| | | | | | | | |
| | | | | | | | |
| | | Principal
Amount | | | Value | |
Electric 0.5% | |
EDP Finance B.V.
6.00%, due 2/2/18 | | $ | 174,000 | | | $ | 184,962 | |
Enel S.p.A
6.50%, due 1/10/74 (a) | | | EUR 100,000 | | | | 118,888 | |
Iberdrola International B.V.
5.75%, due 2/27/49 (a) | | | 200,000 | | | | 235,901 | |
| | | | | | | | |
| | | | | | | 539,751 | |
| | | | | | | | |
Electronics 0.5% | |
Techem GmbH
6.125%, due 10/1/19 | | | 375,000 | | | | 432,225 | |
Trionista Holdco GmbH
5.00%, due 4/30/20 | | | 100,000 | | | | 114,116 | |
| | | | | | | | |
| | | | | | | 546,341 | |
| | | | | | | | |
Entertainment 0.1% | |
Isle of Capri Casinos, Inc.
5.875%, due 3/15/21 | | $ | 50,000 | | | | 52,625 | |
| | | | | | | | |
|
Finance—Other Services 0.1% | |
Icahn Enterprises, L.P. / Icahn Enterprises Finance Corp.
5.875%, due 2/1/22 | | | 50,000 | | | | 51,500 | |
| | | | | | | | |
|
Food 1.6% | |
Agrokor dd
9.875%, due 5/1/19 | | | EUR 360,000 | | | | 424,448 | |
Campofrio Food Group S.A.
3.375%, due 3/15/22 | | | 170,000 | | | | 188,418 | |
Kraft Heinz Foods Co. | | | | | | | | |
2.80%, due 7/2/20 (b) | | $ | 50,000 | | | | 50,194 | |
4.875%, due 2/15/25 (b) | | | 190,000 | | | | 204,271 | |
Picard Bondco S.A.
7.75%, due 2/1/20 | | | EUR 325,000 | | | | 381,767 | |
R&R Ice Cream PLC
4.75%, due 5/15/20 (c) | | | 282,000 | | | | 318,149 | |
Tyson Foods, Inc.
3.95%, due 8/15/24 | | $ | 75,000 | | | | 76,569 | |
| | | | | | | | |
| | | | | | | 1,643,816 | |
| | | | | | | | |
Food Services 0.3% | |
Elior Finance & Co. SCA
6.50%, due 5/1/20 (c) | | | EUR 286,000 | | | | 335,273 | |
| | | | | | | | |
|
Forest Products & Paper 0.2% | |
Sappi Papier Holding GmbH
7.75%, due 7/15/17 (b) | | $ | 210,000 | | | | 218,400 | |
| | | | | | | | |
| † | Percentages indicated are based on Fund net assets. |
| ¨ | | Among the Fund’s 10 largest holdings or issuers held, as of October 31, 2015, excluding short-term investments. May be subject to change daily. |
| ¡ | | Among the Fund’s 5 largest short positions as of October 31, 2015. May be subject to change daily. |
| | | | |
| 10 | | MainStay Absolute Return Multi-Strategy Fund | | The notes to the consolidated financial statements are an integral part of,
and should be read in conjunction with, the consolidated financial statements. |
| | | | | | | | |
| | | Principal
Amount | | | Value | |
| Corporate Bonds (continued) | |
Health Care—Products 0.4% | |
Boston Scientific Corp. | | | | | | | | |
2.85%, due 5/15/20 | | $ | 75,000 | | | $ | 74,954 | |
3.85%, due 5/15/25 | | | 140,000 | | | | 139,165 | |
Hologic, Inc.
5.25%, due 7/15/22 (b) | | | 172,000 | | | | 179,525 | |
| | | | | | | | |
| | | | | | | 393,644 | |
| | | | | | | | |
Health Care—Services 0.9% | |
Cerba European Lab SAS
7.00%, due 2/1/20 | | | EUR 200,000 | | | | 229,277 | |
DaVita HealthCare Partners, Inc.
5.00%, due 5/1/25 | | $ | 60,000 | | | | 59,562 | |
Ephios Bondco PLC
6.25%, due 7/1/22 | | | EUR 100,000 | | | | 114,913 | |
Fresenius Medical Care U.S. Finance II, Inc.
4.75%, due 10/15/24 (b) | | $ | 145,000 | | | | 146,812 | |
HomeVi SAS
6.875%, due 8/15/21 | | | EUR 275,000 | | | | 313,744 | |
Laboratory Corporation of America Holdings
2.625%, due 2/1/20 | | $ | 75,000 | | | | 74,855 | |
| | | | | | | | |
| | | | | | | 939,163 | |
| | | | | | | | |
Holding Companies—Diversified 0.7% | |
CeramTec Group GmbH
8.25%, due 8/15/21 | | | EUR 230,000 | | | | 274,102 | |
Nielsen Co. Luxembourg S.A.R.L. (The)
5.50%, due 10/1/21 (b) | | $ | 50,000 | | | | 51,812 | |
Novalis SAS
3.00%, due 4/30/22 | | | EUR 370,000 | | | | 393,688 | |
| | | | | | | | |
| | | | | | | 719,602 | |
| | | | | | | | |
Household Products & Wares 0.1% | |
Ontex Group N.V.
4.75%, due 11/15/21 | | | 100,000 | | | | 116,596 | |
| | | | | | | | |
|
Leisure Time 0.2% | |
Jarden Corp. | | | | | | | | |
6.125%, due 11/15/22 | | $ | 120,000 | | | | 124,050 | |
7.50%, due 5/1/17 | | | 35,000 | | | | 37,713 | |
| | | | | | | | |
| | | | | | | 161,763 | |
| | | | | | | | |
Lodging 0.4% | |
Accor S.A.
4.125%, due 6/30/49 (a) | | | EUR 400,000 | | | | 436,561 | |
| | | | | | | | |
|
Media 0.7% | |
Cable Communications Systems N.V.
7.50%, due 11/1/20 | | | 225,000 | | | | 261,029 | |
CCO Holdings LLC / CCO Holdings Capital Corp.
7.375%, due 6/1/20 | | $ | 250,000 | | | | 259,375 | |
| | | | | | | | |
| | | Principal
Amount | | | Value | |
Media (continued) | |
Nielsen Finance LLC / Nielsen Finance Co.
5.00%, due 4/15/22 (b) | | $ | 100,000 | | | $ | 101,625 | |
Unitymedia Hessen GmbH & Co. KG / Unitymedia NRW GmbH
4.00%, due 1/15/25 | | | EUR 100,000 | | | | 109,961 | |
| | | | | | | | |
| | | | | | | 731,990 | |
| | | | | | | | |
Oil & Gas 0.0%‡ | |
LINN Energy LLC / LINN Energy Finance Corp.
6.50%, due 5/15/19 | | $ | 45,000 | | | | 11,700 | |
| | | | | | | | |
|
Packaging & Containers 1.0% | |
Crown Americas LLC / Crown Americas Capital Corp. III
6.25%, due 2/1/21 | | | 100,000 | | | | 103,875 | |
Crown European Holdings S.A.
3.375%, due 5/15/25 | | | EUR 315,000 | | | | 330,802 | |
Kloeckner Pentaplast of America, Inc.
7.125%, due 11/1/20 | | | 250,000 | | | | 285,222 | |
Sealed Air Corp.
4.50%, due 9/15/23 | | | 230,000 | | | | 265,596 | |
| | | | | | | | |
| | | | | | | 985,495 | |
| | | | | | | | |
Pharmaceuticals 0.1% | |
AbbVie, Inc.
2.50%, due 5/14/20 | | $ | 75,000 | | | | 74,157 | |
Valeant Pharmaceuticals International, Inc.
6.125%, due 4/15/25 (b) | | | 40,000 | | | | 33,650 | |
| | | | | | | | |
| | | | | | | 107,807 | |
| | | | | | | | |
Real Estate 0.2% | |
Vonovia Finance B.V.
4.625%, due 4/8/74 (a) | | | EUR 200,000 | | | | 225,153 | |
| | | | | | | | |
|
Real Estate Investment Trusts 0.3% | |
MPT Operating Partnership, L.P. / MPT Finance Corp. | | | | | | | | |
4.00%, due 8/19/22 | | | 100,000 | | | | 111,295 | |
5.75%, due 10/1/20 | | | 100,000 | | | | 116,871 | |
6.375%, due 2/15/22 | | $ | 35,000 | | | | 36,575 | |
| | | | | | | | |
| | | | | | | 264,741 | |
| | | | | | | | |
Retail 0.4% | |
1011778 B.C. ULC / New Red Finance, Inc.
4.625%, due 1/15/22 (b) | | | 180,000 | | | | 182,700 | |
Dufry Finance SCA
5.50%, due 10/15/20 (b) | | | 200,000 | | | | 208,000 | |
O’Reilly Automotive, Inc.
3.80%, due 9/1/22 | | | 70,000 | | | | 71,108 | |
| | | | | | | | |
| | | | | | | 461,808 | |
| | | | | | | | |
| | | | | | |
The notes to the consolidated financial statements are an integral part of,
and should be read in conjunction with, the consolidated financial statements. | | | | | 11 | |
Consolidated Portfolio of Investments October 31, 2015 (Unaudited) (continued)
| | | | | | | | |
| | | Principal
Amount | | | Value | |
| Corporate Bonds (continued) | |
Software 0.2% | |
InterXion Holding N.V.
6.00%, due 7/15/20 | | | EUR 150,000 | | | $ | 174,910 | |
| | | | | | | | |
|
Telecommunications 2.0% | |
Altice Financing S.A. | | | | | | | | |
7.875%, due 12/15/19 (b) | | $ | 200,000 | | | | 208,875 | |
8.00%, due 12/15/19 | | | EUR 192,000 | | | | 220,634 | |
Eileme 2 AB
11.75%, due 1/31/20 | | | 325,000 | | | | 385,084 | |
Intelsat Jackson Holdings S.A.
7.50%, due 4/1/21 | | $ | 50,000 | | | | 45,125 | |
Play Topco S.A.
7.75%, due 2/28/20 (d) | | | EUR 275,000 | | | | 309,964 | |
Softbank Group Corp.
5.25%, due 7/30/27 | | | 100,000 | | | | 108,821 | |
T-Mobile USA, Inc.
6.375%, due 3/1/25 | | $ | 50,000 | | | | 50,125 | |
Telecom Italia Capital S.A.
6.999%, due 6/4/18 | | | 80,000 | | | | 88,200 | |
Telenet Finance Ill Luxembourg SCA
6.625%, due 2/15/21 | | | EUR 270,000 | | | | 309,955 | |
Telenet Finance VI Luxembourg SCA
4.875%, due 7/15/27 | | | 100,000 | | | | 106,556 | |
Virgin Media Secured Finance PLC
5.50%, due 1/15/25 (b) | | $ | 200,000 | | | | 202,500 | |
| | | | | | | | |
| | | | | | | 2,035,839 | |
| | | | | | | | |
Water 0.5% | |
Veolia Environnement S.A.
4.85%, due 1/29/49 (a) | | | GBP 300,000 | | | | 468,261 | |
| | | | | | | | |
Total Corporate Bonds
(Cost $15,221,343) | | | | | | | 15,036,380 | |
| | | | | | | | |
| | |
| | | | | | | | |
| | |
| | | Shares | | | | |
| Common Stocks 33.6% | |
Agriculture 0.2% | |
Bunge, Ltd. | | | 1,200 | | | | 87,552 | |
LivaNova PLC (e) | | | 1 | | | | 38 | |
Universal Corp. | | | 1,600 | | | | 86,416 | |
| | | | | | | | |
| | | | | | | 174,006 | |
| | | | | | | | |
Airlines 0.4% | |
Air New Zealand, Ltd. | | | 47,637 | | | | 93,869 | |
International Consolidated Airlines Group S.A. (e) | | | 11,046 | | | | 98,996 | |
Qantas Airways, Ltd. (e) | | | 30,097 | | | | 84,775 | |
Singapore Airlines, Ltd. | | | 9,900 | | | | 76,322 | |
SkyWest, Inc. (f) | | | 4,900 | | | | 93,296 | |
| | | | | | | | |
| | | | 447,258 | |
| | | | | | | | |
| | | | | | | | |
| | |
| | | Shares | | | Value | |
Apparel 0.4% | |
Carter’s, Inc. | | | 1,000 | | | $ | 90,880 | |
Pacific Brands, Ltd. (e) | | | 164,840 | | | | 84,634 | |
Puma S.E. | | | 744 | | | | 166,573 | |
Skechers U.S.A., Inc. Class A (e) | | | 2,100 | | | | 65,520 | |
| | | | | | | | |
| | | | 407,607 | |
| | | | | | | | |
Auto Manufacturers 0.1% | |
Wabash National Corp. (e)(f) | | | 7,200 | | | | 86,184 | |
| | | | | | | | |
|
Auto Parts & Equipment 0.2% | |
Autoneum Holding A.G. (e) | | | 177 | | | | 32,537 | |
Goodyear Tire & Rubber Co. (The) | | | 3,000 | | | | 98,520 | |
Tower International, Inc. (e) | | | 3,400 | | | | 93,398 | |
| | | | | | | | |
| | | | 224,455 | |
| | | | | | | | |
Banks 0.3% | |
Bank of Queensland, Ltd. | | | 9,261 | | | | 86,315 | |
Comerica, Inc. | | | 2,200 | | | | 95,480 | |
SunTrust Banks, Inc. | | | 2,400 | | | | 99,648 | |
| | | | | | | | |
| | | | 281,443 | |
| | | | | | | | |
Beverages 0.2% | |
Coca-Cola Bottling Co. Consolidated | | | 400 | | | | 84,484 | |
Treasury Wine Estates, Ltd. | | | 17,326 | | | | 87,475 | |
| | | | | | | | |
| | | | 171,959 | |
| | | | | | | | |
Biotechnology 0.4% | |
AMAG Pharmaceuticals, Inc. (e) | | | 1,100 | | | | 44,000 | |
Curis, Inc. (e) | | | 8,700 | | | | 17,748 | |
ImmunoGen, Inc. (e)(f) | | | 7,100 | | | | 83,070 | |
Infinity Pharmaceuticals, Inc. (e)(f) | | | 9,300 | | | | 96,255 | |
Medicines Co. (The) (e) | | | 1,200 | | | | 41,088 | |
NewLink Genetics Corp. (e) | | | 500 | | | | 19,135 | |
Repligen Corp. (e) | | | 2,200 | | | | 73,128 | |
| | | | | | | | |
| | | | 374,424 | |
| | | | | | | | |
Building Materials 0.7% | |
Armstrong World Industries, Inc. (e) | | | 1,900 | | | | 94,278 | |
Builders FirstSource, Inc. (e) | | | 2,000 | | | | 23,640 | |
Buzzi Unicem S.p.A. | | | 9,073 | | | | 91,690 | |
Gibraltar Industries, Inc. (e) | | | 4,400 | | | | 111,408 | |
Inwido AB | | | 3,259 | | | | 35,475 | |
Owens Corning, Inc | | | 2,200 | | | | 100,166 | |
Patrick Industries, Inc. (e) | | | 2,000 | | | | 81,160 | |
U.S. Concrete, Inc. (e) | | | 1,500 | | | | 83,190 | |
Universal Forest Products, Inc. | | | 1,400 | | | | 101,682 | |
| | | | | | | | |
| | | | 722,689 | |
| | | | | | | | |
Chemicals 1.7% | |
Borregaard ASA | | | 12,533 | | | | 66,819 | |
Cabot Corp. | | | 2,700 | | | | 97,038 | |
¨Cytec Industries, Inc. | | | 9,700 | | | | 721,874 | |
Huntsman Corp. (f) | | | 8,000 | | | | 105,360 | |
Koppers Holdings, Inc. | | | 3,900 | | | | 73,944 | |
| | | | |
| 12 | | MainStay Absolute Return Multi-Strategy Fund | | The notes to the consolidated financial statements are an integral part of,
and should be read in conjunction with, the consolidated financial statements. |
| | | | | | | | |
| | |
| | | Shares | | | Value | |
| Common Stocks (continued) | |
Chemicals (continued) | | | | | | | | |
Kraton Performance Polymers, Inc. (e) | | | 4,200 | | | $ | 85,638 | |
Mosaic Co. (The) | | | 1,200 | | | | 40,548 | |
Nuplex Industries, Ltd. | | | 30,247 | | | | 87,252 | |
Solvay S.A. | | | 3,700 | | | | 418,263 | |
Westlake Chemical Corp. | | | 600 | | | | 36,162 | |
| | | | | | | | |
| | | | | | | 1,732,898 | |
| | | | | | | | |
Commercial Services 1.4% | |
Adecco S.A. Registered (e) | | | 1,246 | | | | 92,777 | |
Avis Budget Group, Inc. (e) | | | 1,900 | | | | 94,886 | |
Ennis, Inc. | | | 4,600 | | | | 92,138 | |
Hertz Global Holdings, Inc. (e) | | | 5,100 | | | | 99,450 | |
HMS Holdings Corp. (e) | | | 8,400 | | | | 88,452 | |
LendingTree, Inc. (e) | | | 900 | | | | 109,224 | |
ManpowerGroup, Inc. | | | 1,100 | | | | 100,958 | |
Monster Worldwide, Inc. (e)(f) | | | 12,000 | | | | 75,240 | |
R.R. Donnelley & Sons Co. | | | 2,700 | | | | 45,549 | |
TrueBlue, Inc. (e) | | | 300 | | | | 8,691 | |
United Rentals, Inc. (e) | | | 1,400 | | | | 104,804 | |
Xoom Corp. (e) | | | 19,048 | | | | 475,057 | |
| | | | | | | | |
| | | | | | | 1,387,226 | |
| | | | | | | | |
Computers 0.8% | |
Brocade Communications Systems, Inc. (f) | | | 9,000 | | | | 93,780 | |
Computer Sciences Corp. | | | 1,500 | | | | 99,885 | |
EMC Corp. | | | 13,000 | | | | 340,860 | |
Leidos Holdings, Inc. | | | 2,100 | | | | 110,397 | |
Lexmark International, Inc. Class A | | | 1,300 | | | | 42,237 | |
NCR Corp. (e) | | | 3,800 | | | | 101,080 | |
Teradata Corp. (e) | | | 1,400 | | | | 39,354 | |
| | | | | | | | |
| | | | | | | 827,593 | |
| | | | | | | | |
Distribution & Wholesale 0.3% | |
D’ieteren S.A. | | | 1,970 | | | | 66,679 | |
HD Supply Holdings, Inc. (e) | | | 3,100 | | | | 92,349 | |
Ingram Micro, Inc. Class A | | | 3,200 | | | | 95,296 | |
WESCO International, Inc. (e) | | | 1,800 | | | | 88,074 | |
| | | | | | | | |
| | | | | | | 342,398 | |
| | | | | | | | |
Electric 0.2% | |
Mighty River Power, Ltd. | | | 52,085 | | | | 98,754 | |
Origin Energy, Ltd. | | | 15,270 | | | | 59,890 | |
| | | | | | | | |
| | | | | | | 158,644 | |
| | | | | | | | |
Electrical Components & Equipment 0.2% | |
Encore Wire Corp. | | | 2,300 | | | | 98,371 | |
General Cable Corp. (f) | | | 5,900 | | | | 90,801 | |
| | | | | | | | |
| | | | | | | 189,172 | |
| | | | | | | | |
Electronics 0.5% | |
Arrow Electronics, Inc. (e) | | | 1,600 | | | | 87,984 | |
Austria Technologie & Systemtechnik A.G. | | | 2,481 | | | | 42,397 | |
Avnet, Inc. | | | 2,100 | | | | 95,403 | |
| | | | | | | | |
| | |
| | | Shares | | | Value | |
Electronics (continued) | | | | | | | | |
Jabil Circuit, Inc. (f) | | | 4,100 | | | $ | 94,218 | |
Mycronic AB | | | 13,767 | | | | 98,295 | |
Sanmina Corp. (e) | | | 1,900 | | | | 39,273 | |
Tech Data Corp. (e) | | | 1,100 | | | | 80,069 | |
| | | | | | | | |
| | | | | | | 537,639 | |
| | | | | | | | |
Energy—Alternate Sources 0.2% | |
First Solar, Inc. (e) | | | 800 | | | | 45,656 | |
Green Plains, Inc. | | | 2,900 | | | | 59,479 | |
Renewable Energy Group, Inc. (e) | | | 6,600 | | | | 52,074 | |
Vestas Wind Systems A/S | | | 1,680 | | | | 97,917 | |
| | | | | | | | |
| | | | | | | 255,126 | |
| | | | | | | | |
Engineering & Construction 0.2% | |
Comfort Systems USA, Inc. (f) | | | 2,900 | | | | 92,597 | |
Mota-Engil SGPS S.A. | | | 1,936 | | | | 4,864 | |
PER Aarsleff A/S Class B | | | 221 | | | | 74,293 | |
| | | | | | | | |
| | | | | | | 171,754 | |
| | | | | | | | |
Entertainment 0.4% | |
Cinemark Holdings, Inc. | | | 2,100 | | | | 74,424 | |
Eldorado Resorts, Inc. (e) | | | 6,600 | | | | 65,340 | |
Isle of Capri Casinos, Inc. (e)(f) | | | 4,500 | | | | 86,085 | |
Penn National Gaming, Inc. (e)(f) | | | 4,600 | | | | 82,156 | |
Tabcorp Holdings, Ltd. | | | 24,089 | | | | 81,080 | |
Village Roadshow, Ltd. | | | 8,170 | | | | 43,870 | |
| | | | | | | | |
| | | | 432,955 | |
| | | | | | | | |
Environmental Controls 0.1% | |
Clean Harbors, Inc. (e) | | | 2,100 | | | | 97,629 | |
| | | | | | | | |
|
Finance—Consumer Loans 0.1% | |
SLM Corp. (e) | | | 12,800 | | | | 90,368 | |
| | | | | | | | |
|
Finance—Investment Banker/Broker 0.4% | |
GAIN Capital Holdings, Inc. (f) | | | 10,000 | | | | 74,500 | |
INTL. FCStone, Inc. (e) | | | 3,300 | | | | 105,567 | |
Investment Technology Group, Inc. | | | 5,900 | | | | 94,459 | |
LPL Financial Holdings, Inc. | | | 2,400 | | | | 102,240 | |
| | | | | | | | |
| | | | 376,766 | |
| | | | | | | | |
Finance—Leasing Companies 0.6% | |
¨Avolon Holdings, Ltd. (e) | | | 18,612 | | | | 567,852 | |
| | | | | | | | |
|
Finance—Mortgage Loan/Banker 0.2% | |
CoreLogic, Inc. (e) | | | 2,300 | | | | 89,654 | |
Genworth Mortgage Insurance Australia, Ltd. | | | 47,097 | | | | 90,679 | |
| | | | | | | | |
| | | | 180,333 | |
| | | | | | | | |
Food 0.5% | |
Austevoll Seafood ASA | | | 9,644 | | | | 59,305 | |
Bakkafrost P/F | | | 2,611 | | | | 83,891 | |
Dean Foods Co. (f) | | | 4,800 | | | | 86,928 | |
| | | | | | |
The notes to the consolidated financial statements are an integral part of,
and should be read in conjunction with, the consolidated financial statements. | | | | | 13 | |
Consolidated Portfolio of Investments October 31, 2015 (Unaudited) (continued)
| | | | | | | | |
| | |
| | | Shares | | | Value | |
| Common Stocks (continued) | |
Food (continued) | | | | | | | | |
Ingredion, Inc. | | | 100 | | | $ | 9,506 | |
Pilgrim’s Pride Corp. | | | 2,000 | | | | 37,980 | |
Seaboard Corp. (e) | | | 24 | | | | 80,832 | |
Select Harvests, Ltd. | | | 10,309 | | | | 74,690 | |
Tyson Foods, Inc. Class A | | | 2,100 | | | | 93,156 | |
Wilmar International, Ltd. | | | 4,800 | | | | 10,724 | |
| | | | | | | | |
| | | | 537,012 | |
| | | | | | | | |
Forest Products & Paper 0.1% | |
Altri SGPS S.A. | | | 19,171 | | | | 90,671 | |
Domtar Corp. | | | 1,100 | | | | 45,364 | |
| | | | | | | | |
| | | | 136,035 | |
| | | | | | | | |
Gas 0.3% | |
Western Gas Equity Partners, L.P. (f) | | | 7,200 | | | | 310,536 | |
| | | | | | | | |
|
Health Care—Products 0.3% | |
Biosensors International Group, Ltd. (c)(e)(g) | | | 104,500 | | | | 50,725 | |
Inogen, Inc. (e) | | | 300 | | | | 12,822 | |
Invacare Corp. (f) | | | 4,700 | | | | 81,216 | |
Merit Medical Systems, Inc. (e)(f) | | | 3,300 | | | | 61,182 | |
Orthofix International N.V. (e) | | | 2,500 | | | | 85,125 | |
| | | | | | | | |
| | | | 291,070 | |
| | | | | | | | |
Health Care—Services 0.8% | |
Amedisys, Inc. (e) | | | 1,100 | | | | 43,538 | |
Centene Corp. (e) | | | 1,700 | | | | 101,116 | |
LHC Group, Inc. (e) | | | 1,900 | | | | 85,623 | |
Magellan Health, Inc. (e) | | | 1,700 | | | | 90,780 | |
Molina Healthcare, Inc. (e) | | | 1,300 | | | | 80,600 | |
Providence Service Corp. (The) (e) | | | 1,900 | | | | 98,135 | |
Sonic Healthcare, Ltd. | | | 6,328 | | | | 87,001 | |
Triple-S Management Corp. (e) | | | 4,200 | | | | 86,478 | |
WellCare Health Plans, Inc. (e) | | | 1,000 | | | | 88,600 | |
| | | | | | | | |
| | | | 761,871 | |
| | | | | | | | |
Holding Company—Diversified 0.2% | |
Bollore S.A. | | | 39,862 | | | | 197,342 | |
| | | | | | | | |
|
Home Builders 0.0%‡ | |
Thor Industries, Inc. | | | 800 | | | | 43,264 | |
| | | | | | | | |
|
Home Furnishing 0.3% | |
American Woodmark Corp. (e) | | | 1,200 | | | | 87,240 | |
Harman International Industries, Inc. | | | 900 | | | | 98,964 | |
Whirlpool Corp. | | | 600 | | | | 96,084 | |
| | | | | | | | |
| | | | 282,288 | |
| | | | | | | | |
Household Products & Wares 0.3% | |
Central Garden & Pet Co. (e) | | | 5,000 | | | | 84,400 | |
Henkel A.G. & Co. KGaA | | | 2,123 | | | | 196,126 | |
| | | | | | | | |
| | | | 280,526 | |
| | | | | | | | |
| | | | | | | | |
| | |
| | | Shares | | | Value | |
Housewares 0.0%‡ | |
NACCO Industries, Inc. Class A | | | 600 | | | $ | 26,898 | |
| | | | | | | | |
|
Insurance 0.9% | |
Employers Holdings, Inc. | | | 3,800 | | | | 100,586 | |
¨PartnerRe, Ltd. | | | 5,508 | | | | 765,612 | |
| | | | | | | | |
| | | | 866,198 | |
| | | | | | | | |
Internet 0.7% | |
1-800-Flowers.com, Inc. Class A (e)(f) | | | 8,500 | | | | 84,405 | |
Blucora, Inc. (e)(f) | | | 5,800 | | | | 56,840 | |
ePlus, Inc. (e) | | | 1,000 | | | | 84,420 | |
Expedia, Inc. | | | 800 | | | | 109,040 | |
Groupon, Inc. (e) | | | 10,916 | | | | 40,498 | |
HomeAway, Inc. (e) | | | 3,400 | | | | 107,304 | |
IAC/InterActiveCorp | | | 1,300 | | | | 87,113 | |
Intralinks Holdings, Inc. (e) | | | 7,700 | | | | 67,375 | |
Overstock.com, Inc. (e) | | | 2,400 | | | | 37,584 | |
Symantec Corp. | | | 2,500 | | | | 51,500 | |
| | | | | | | | |
| | | | 726,079 | |
| | | | | | | | |
Investment Company 0.2% | |
EXOR S.p.A. | | | 4,838 | | | | 240,203 | |
| | | | | | | | |
|
Iron & Steel 0.3% | |
Reliance Steel & Aluminum Co. | | | 1,600 | | | | 95,936 | |
Steel Dynamics, Inc. (f) | | | 5,000 | | | | 92,350 | |
Voestalpine A.G. | | | 2,519 | | | | 91,231 | |
| | | | | | | | |
| | | | 279,517 | |
| | | | | | | | |
Leisure Time 0.1% | |
Flight Centre Travel Group, Ltd. | | | 3,042 | | | | 82,323 | |
| | | | | | | | |
|
Machinery—Construction & Mining 0.2% | |
Danieli & Co. S.p.A. | | | 4,506 | | | | 68,181 | |
Terex Corp. | | | 4,800 | | | | 96,288 | |
| | | | | | | | |
| | | | 164,469 | |
| | | | | | | | |
Machinery—Diversified 0.3% | |
AGCO Corp. | | | 2,000 | | | | 96,780 | |
Chart Industries, Inc. (e) | | | 1,800 | | | | 30,942 | |
MAN S.E. | | | 1,175 | | | | 122,542 | |
Valmet Oyj | | | 8,019 | | | | 84,565 | |
| | | | | | | | |
| | | | 334,829 | |
| | | | | | | | |
Media 0.7% | |
Altice N.V. Class A (e) | | | 7,604 | | | | 131,697 | |
Gray Television, Inc. (e) | | | 1,000 | | | | 15,890 | |
¨Time Warner Cable, Inc. | | | 2,920 | | | | 553,048 | |
| | | | | | | | |
| | | | 700,635 | |
| | | | | | | | |
Metal Fabricate & Hardware 0.1% | |
Global Brass & Copper Holdings, Inc. | | | 3,900 | | | | 87,711 | |
| | | | | | | | |
| | | | |
| 14 | | MainStay Absolute Return Multi-Strategy Fund | | The notes to the consolidated financial statements are an integral part of,
and should be read in conjunction with, the consolidated financial statements. |
| | | | | | | | |
| | |
| | | Shares | | | Value | |
| Common Stocks (continued) | |
Mining 0.4% | |
Boliden AB | | | 5,505 | | | $ | 105,415 | |
Evolution Mining, Ltd. | | | 88,082 | | | | 88,250 | |
Goldcorp, Inc. | | | 6,696 | | | | 85,672 | |
Newmont Mining Corp. (f) | | | 2,200 | | | | 42,812 | |
Norsk Hydro ASA | | | 13,208 | | | | 47,349 | |
OZ Minerals, Ltd. | | | 27,278 | | | | 84,810 | |
Rio Tinto, Ltd. | | | 86 | | | | 3,106 | |
| | | | | | | | |
| | | | 457,414 | |
| | | | | | | | |
Miscellaneous—Manufacturing 0.2% | |
AGFA-Gevaert N.V. (e) | | | 22,499 | | | | 95,847 | |
GUD Holdings, Ltd. | | | 12,980 | | | | 74,418 | |
Trinseo S.A. (e) | | | 2,700 | | | | 87,615 | |
| | | | | | | | |
| | | | 257,880 | |
| | | | | | | | |
Multi-National 0.1% | |
Banco Latinoamericano de Comercio Exterior S.A. Class E | | | 3,400 | | | | 91,902 | |
| | | | | | | | |
|
Office Equipment/Supplies 0.0%‡ | |
Xerox Corp. (f) | | | 4,100 | | | | 38,499 | |
| | | | | | | | |
|
Oil & Gas 1.9% | |
Alon USA Energy, Inc. | | | 3,300 | | | | 55,275 | |
Anadarko Petroleum Corp. | | | 400 | | | | 26,752 | |
Antero Midstream Partners, L.P. | | | 10,200 | | | | 242,964 | |
ARC Resources, Ltd. | | | 1,610 | | | | 23,754 | |
Cenovus Energy, Inc. | | | 850 | | | | 12,674 | |
Cheniere Energy, Inc. (e)(f) | | | 5,100 | | | | 252,552 | |
Chevron Corp. | | | 330 | | | | 29,990 | |
ConocoPhillips | | | 610 | | | | 32,543 | |
Devon Energy Corp. | | | 510 | | | | 21,384 | |
Dorchester Minerals, L.P. | | | 2,010 | | | | 29,045 | |
EOG Resources, Inc. | | | 380 | | | | 32,623 | |
EQT GP Holdings, L.P. (f) | | | 10,500 | | | | 277,620 | |
EV Energy Partners, L.P. | | | 7,440 | | | | 41,813 | |
Exxon Mobil Corp. | | | 300 | | | | 24,822 | |
Legacy Reserves, L.P. | | | 9,920 | | | | 39,581 | |
Memorial Production Partners, L.P. | | | 7,810 | | | | 43,580 | |
Mid-Con Energy Partners, L.P. | | | 2,930 | | | | 5,919 | |
Murphy Oil Corp. | | | 700 | | | | 19,901 | |
Murphy USA, Inc. (e) | | | 700 | | | | 42,959 | |
Nabors Industries, Ltd. | | | 1,800 | | | | 18,072 | |
Occidental Petroleum Corp. | | | 450 | | | | 33,543 | |
Patterson-UTI Energy, Inc. | | | 600 | | | | 8,934 | |
PBF Energy, Inc. Class A | | | 300 | | | | 10,200 | |
Pioneer Natural Resources Co. | | | 180 | | | | 24,685 | |
QEP Resources, Inc. | | | 1,300 | | | | 20,098 | |
Royal Dutch Shell PLC Class A, Sponsored ADR | | | 320 | | | | 16,787 | |
Seadrill Partners LLC | | | 1,010 | | | | 11,322 | |
| | | | | | | | |
| | |
| | | Shares | | | Value | |
Oil & Gas (continued) | | | | | | | | |
Seadrill, Ltd. | | | 11,970 | | | $ | 74,947 | |
SM Energy Co. | | | 500 | | | | 16,675 | |
Stone Energy Corp. (e) | | | 1,500 | | | | 8,385 | |
Valero Energy Partners, L.P. (f) | | | 6,700 | | | | 334,933 | |
Vanguard Natural Resources LLC | | | 7,840 | | | | 61,858 | |
Vermilion Energy, Inc. | | | 660 | | | | 23,223 | |
| | | | | | | | |
| | | | 1,919,413 | |
| | | | | | | | |
Oil & Gas Services 0.5% | |
CGG S.A. (e) | | | 26,183 | | | | 105,350 | |
FMC Technologies, Inc. (e) | | | 300 | | | | 10,149 | |
Prosafe S.E. | | | 20,598 | | | | 56,969 | |
RPC, Inc. | | | 1,800 | | | | 19,854 | |
Superior Energy Services, Inc. | | | 1,400 | | | | 19,824 | |
Targa Resources Corp. (f) | | | 5,550 | | | | 317,183 | |
| | | | | | | | |
| | | | 529,329 | |
| | | | | | | | |
Pharmaceuticals 1.6% | |
AmerisourceBergen Corp. | | | 1,000 | | | | 96,510 | |
Amphastar Pharmaceuticals, Inc. (e) | | | 7,200 | | | | 85,248 | |
Australian Pharmaceutical Industries, Ltd. | | | 67,225 | | | | 94,918 | |
Celesio A.G. | | | 4,740 | | | | 131,872 | |
Eagle Pharmaceuticals, Inc. (e) | | | 600 | | | | 38,226 | |
Horizon Pharma PLC (e) | | | 7,032 | | | | 110,543 | |
Mylan N.V. (e) | | | 3,066 | | | | 135,180 | |
Orexigen Therapeutics, Inc. (e)(f) | | | 19,300 | | | | 58,672 | |
PharMerica Corp. (e) | | | 3,000 | | | | 85,710 | |
Phibro Animal Health Corp. Class A | | | 2,700 | | | | 90,072 | |
Progenics Pharmaceuticals, Inc. (e) | | | 7,700 | | | | 56,518 | |
Raptor Pharmaceutical Corp. (e) | | | 13,900 | | | | 75,755 | |
Sagent Pharmaceuticals, Inc. (e) | | | 5,300 | | | | 89,093 | |
SciClone Pharmaceuticals, Inc. (e) | | | 10,400 | | | | 79,248 | |
Sigma Pharmaceuticals, Ltd. | | | 148,888 | | | | 89,185 | |
Sucampo Pharmaceuticals, Inc. Class A (e) | | | 4,300 | | | | 83,248 | |
Supernus Pharmaceuticals, Inc. (e)(f) | | | 5,800 | | | | 95,700 | |
Zealand Pharma A/S (e) | | | 3,457 | | | | 77,220 | |
| | | | | | | | |
| | | | 1,572,918 | |
| | | | | | | | |
Pipelines 7.0% | |
Columbia Pipeline Group, Inc. | | | 14,100 | | | | 292,857 | |
Dominion Midstream Partners, L.P. (e)(f) | | | 9,400 | | | | 307,944 | |
Enable Midstream Partners, L.P. | | | 2,360 | | | | 28,391 | |
¨Energy Transfer Equity, L.P. (f) | | | 24,400 | | | | 525,820 | |
Energy Transfer Partners, L.P. | | | 10,240 | | | | 452,198 | |
¨Enterprise Products Partners, L.P. (f) | | | 17,500 | | | | 483,525 | |
EQT Midstream Partners, L.P. | | | 4,900 | | | | 362,796 | |
¨Genesis Energy, L.P. (f) | | | 11,800 | | | | 475,658 | |
Kinder Morgan, Inc. (f) | | | 14,700 | | | | 402,045 | |
Magellan Midstream Partners, L.P. (f) | | | 5,600 | | | | 357,336 | |
MarkWest Energy Partners, L.P. (f) | | | 6,900 | | | | 301,392 | |
MPLX, L.P. (f) | | | 5,450 | | | | 211,406 | |
NGL Energy Partners, L.P. (f) | | | 13,830 | | | | 256,132 | |
NuStar Energy, L.P. | | | 720 | | | | 36,468 | |
ONEOK Partners, L.P. | | | 1,210 | | | | 38,514 | |
| | | | | | |
The notes to the consolidated financial statements are an integral part of,
and should be read in conjunction with, the consolidated financial statements. | | | | | 15 | |
Consolidated Portfolio of Investments October 31, 2015 (Unaudited) (continued)
| | | | | | | | |
| | |
| | | Shares | | | Value | |
| Common Stocks (continued) | |
Pipelines (continued) | | | | | | | | |
Phillips 66 Partners, L.P. (f) | | | 5,300 | | | $ | 321,392 | |
Plains All American Pipeline, L.P. | | | 9,400 | | | | 298,168 | |
SemGroup Corp. Class A (f) | | | 5,600 | | | | 255,080 | |
Shell Midstream Partners, L.P. (f) | | | 11,100 | | | | 379,953 | |
¨Sunoco Logistics Partners, L.P. (f) | | | 17,600 | | | | 511,104 | |
Tallgrass Energy GP, L.P. (f) | | | 7,650 | | | | 183,141 | |
Targa Resources Partners, L.P. | | | 1,030 | | | | 30,900 | |
Tesoro Logistics, L.P. (f) | | | 5,900 | | | | 330,813 | |
Williams Partners, L.P. | | | 5,290 | | | | 178,802 | |
| | | | | | | | |
| | | | 7,021,835 | |
| | | | | | | | |
Retail 1.2% | |
Best Buy Co., Inc. | | | 2,486 | | | | 87,085 | |
Bilia AB Class A | | | 2,985 | | | | 62,540 | |
Byggmax Group AB | | | 9,411 | | | | 76,281 | |
Carrols Restaurant Group, Inc. (e) | | | 7,000 | | | | 82,320 | |
DSW, Inc. Class A | | | 100 | | | | 2,494 | |
GameStop Corp. Class A | | | 2,200 | | | | 101,354 | |
Harvey Norman Holdings, Ltd. | | | 29,490 | | | | 83,697 | |
JB Hi-Fi, Ltd. | | | 6,268 | | | | 80,276 | |
Movado Group, Inc. | | | 400 | | | | 10,296 | |
Office Depot, Inc. (e) | | | 14,100 | | | | 107,442 | |
Pandora A/S | | | 765 | | | | 88,260 | |
Pep Boys-Manny Moe & Jack (The) (e) | | | 6,600 | | | | 99,264 | |
PVH Corp. | | | 900 | | | | 81,855 | |
Rallye S.A. | | | 3,858 | | | | 71,464 | |
Ruby Tuesday, Inc. (e)(f) | | | 6,500 | | | | 33,995 | |
Staples, Inc. (f) | | | 7,400 | | | | 96,126 | |
XXL ASA (b) | | | 1,186 | | | | 12,667 | |
| | | | | | | | |
| | | | 1,177,416 | |
| | | | | | | | |
Savings & Loans 0.2% | |
Banc of California, Inc. (f) | | | 6,700 | | | | 87,368 | |
Flagstar Bancorp, Inc. (e)(f) | | | 3,900 | | | | 86,736 | |
| | | | | | | | |
| | | | 174,104 | |
| | | | | | | | |
Semiconductors 1.2% | |
¨Altera Corp. | | | 9,236 | | | | 485,352 | |
¨Integrated Silicon Solution, Inc. | | | 32,000 | | | | 719,360 | |
| | | | | | | | |
| | | | 1,204,712 | |
| | | | | | | | |
Shipbuilding 0.2% | |
Huntington Ingalls Industries, Inc. | | | 800 | | | | 95,952 | |
Yangzijiang Shipbuilding Holdings, Ltd. | | | 94,700 | | | | 84,499 | |
| | | | | | | | |
| | | | 180,451 | |
| | | | | | | | |
Software 0.5% | |
Allscripts Healthcare Solutions, Inc. (e)(f) | | | 7,400 | | | | 104,044 | |
Citrix Systems, Inc. (e) | | | 1,300 | | | | 106,730 | |
Kudelski S.A. | | | 5,928 | | | | 79,764 | |
Nuance Communications, Inc. (e) | | | 5,500 | | | | 93,335 | |
QAD, Inc. Class A | | | 1,900 | | | | 48,526 | |
| | | | | | | | |
| | |
| | | Shares | | | Value | |
Software (continued) | | | | | | | | |
Rackspace Hosting, Inc. (e) | | | 1,500 | | | $ | 38,775 | |
| | | | | | | | |
| | | | 471,174 | |
| | | | | | | | |
Telecommunications 1.2% | |
EarthLink Holdings Corp. (f) | | | 5,200 | | | | 44,460 | |
EchoStar Corp. Class A (e) | | | 2,100 | | | | 94,143 | |
General Communication, Inc. Class A (e)(f) | | | 4,900 | | | | 99,788 | |
Gigamon, Inc. (e) | | | 4,000 | | | | 104,920 | |
IDT Corp. Class B (f) | | | 4,100 | | | | 53,095 | |
Koninklijke KPN N.V. | | | 110,088 | | | | 404,335 | |
T-Mobile U.S., Inc. (e) | | | 4,164 | | | | 157,774 | |
TDC A/S | | | 18,136 | | | | 95,061 | |
Telephone & Data Systems, Inc. | | | 3,600 | | | | 103,104 | |
Vonage Holdings Corp. (e) | | | 13,600 | | | | 82,552 | |
| | | | | | | | |
| | | | 1,239,232 | |
| | | | | | | | |
Transportation 0.9% | |
A.P. Moeller-Maersk A/S Class A | | | 58 | | | | 83,079 | |
Ansaldo STS S.p.A. | | | 20,156 | | | | 214,442 | |
Aurizon Holdings, Ltd. | | | 3,764 | | | | 13,877 | |
Avance Gas Holding, Ltd. (b) | | | 6,188 | | | | 85,208 | |
BW LPG, Ltd. (b) | | | 12,141 | | | | 82,447 | |
Capital Product Partners, L.P. | | | 3,530 | | | | 26,157 | |
Dfds A/S | | | 2,485 | | | | 75,477 | |
DHT Holdings, Inc. | | | 2,500 | | | | 19,650 | |
Golar LNG Partners, L.P. | | | 1,360 | | | | 24,181 | |
Teekay Corp. | | | 8,400 | | | | 269,892 | |
Teekay Offshore Partners, L.P. | | | 1,080 | | | | 16,600 | |
| | | | | | | | |
| | | | 911,010 | |
| | | | | | | | |
Total Common Stocks
(Cost $37,140,169) | | | | 33,834,473 | |
| | | | | | | | |
| | |
| | | | | | | | |
| | | Notional
Amount | | | | |
Purchased Options 0.0%‡ Purchased Put Option 0.0%‡ | |
10-Year United States Treasury Note
Strike Price $126.00
Expires 1/22/16, American Style (h) | | | 1,000 | | | | 734 | |
| | | | | | | | |
Total Purchased Put Option
(Cost $767) | | | | 734 | |
| | | | | | | | |
|
| Purchased Call Option 0.0%‡ | |
Euro-Bobl
Strike Price $129.00
Expires 11/20/15, American Style (h) | | | 3,000,000 | | | | 17,814 | |
| | | | | | | | |
Total Purchased Call Option
(Cost $10,610) | | | | 17,814 | |
| | | | | | | | |
Total Purchased Options
(Cost $11,377) | | | | 18,548 | |
| | | | | | | | |
| | | | |
| 16 | | MainStay Absolute Return Multi-Strategy Fund | | The notes to the consolidated financial statements are an integral part of,
and should be read in conjunction with, the consolidated financial statements. |
| | | | | | | | |
| | | Principal
Amount | | | Value | |
| Short-Term Investments 45.3% | |
Repurchase Agreements 36.7% | |
Fixed Income Clearing Corp.
0.00%, dated 10/30/15
due 11/2/15
Proceeds at Maturity $30,451,692 (Collateralized by United States Treasury and Government Agency securities with rates between 1.25% and 1.96% and maturity dates between 1/8/20 and 1/31/20, with a Principal Amount of $30,775,000 and a Market Value of $31,076,975) | | $ | 30,451,692 | | | $ | 30,451,692 | |
State Street Bank and Trust Co.
0.00%, dated 10/30/15
due 11/2/15
Proceeds at Maturity $6,588,266 (Collateralized by Federal Home Loan Mortgage Corp. securities with a rate of 2.00% and a maturity date of 1/30/23, with a Principal Amount of $6,865,000 and a Market Value of $6,724,062) | | | 6,588,266 | | | | 6,588,266 | |
| | | | | | | | |
Total Repurchase Agreements
(Cost $37,039,958) | | | | 37,039,958 | |
| | | | | | | | |
|
U.S. Government 8.6% | |
United States Treasury Bills 8.6% | |
0.000%, due 12/17/15 (i) | | | 2,650,000 | | | | 2,649,966 | |
0.235%, due 5/26/16 (i) | | | 6,000,000 | | | | 5,992,104 | |
| | | | | | | | |
Total U.S. Government
(Cost $8,641,703) | | | | 8,642,070 | |
| | | | | | | | |
Total Short-Term Investments
(Cost $45,681,661) | | | | 45,682,028 | |
| | | | | | | | |
Total Investments, Before Investments Sold Short
(Cost $98,054,550) (k) | | | 93.9 | % | | | 94,571,429 | |
| | | | | | | | |
| | |
| | | | | | | | |
| | |
Shares | | | | |
Investments Sold Short (19.7%) Common Stocks Sold Short (15.6%) | |
Aerospace & Defense (0.1%) | |
Aerovironment, Inc. (e) | | | (3,900 | ) | | | (89,973 | ) |
| | | | | | | | |
|
Airlines (0.1%) | |
Copa Holdings S.A. Class A | | | (1,700 | ) | | | (85,884 | ) |
Spirit Airlines, Inc. (e) | | | (300 | ) | | | (11,136 | ) |
| | | | | | | | |
| | | | | | | (97,020 | ) |
| | | | | | | | |
| | | | | | | | |
| | |
Shares | | | Value | |
Apparel (0.1%) | |
Iconix Brand Group, Inc. (e) | | | (5,500 | ) | | $ | (84,260 | ) |
Sequential Brands Group, Inc. (e) | | | (5,800 | ) | | | (72,558 | ) |
| | | | | | | | |
| | | | | | | (156,818 | ) |
| | | | | | | | |
Auto Manufacturers (0.0%)‡ | |
Navistar International Corp. (e) | | | (2,300 | ) | | | (28,290 | ) |
| | | | | | | | |
|
Auto Parts & Equipment (0.2%) | |
Dorman Products, Inc. (e) | | | (1,600 | ) | | | (74,688 | ) |
Motorcar Parts of America, Inc. (e) | | | (2,600 | ) | | | (87,516 | ) |
| | | | | | | | |
| | | | | | | (162,204 | ) |
| | | | | | | | |
Banks (0.4%) | |
Bankia S.A. | | | (67,695 | ) | | | (87,245 | ) |
First Horizon National Corp. | | | (6,500 | ) | | | (92,170 | ) |
PacWest Bancorp | | | (2,100 | ) | | | (94,584 | ) |
Raiffeisen Bank International A.G. (e) | | | (6,110 | ) | | | (96,617 | ) |
TCF Financial Corp. | | | (6,000 | ) | | | (92,340 | ) |
| | | | | | | | |
| | | | | | | (462,956 | ) |
| | | | | | | | |
Beverages (0.1%) | |
Carlsberg A/S | | | (241 | ) | | | (19,757 | ) |
Monster Beverage Corp. (e) | | | (700 | ) | | | (95,424 | ) |
| | | | | | | | |
| | | | | | | (115,181 | ) |
| | | | | | | | |
Biotechnology (0.4%) | |
Advaxis, Inc. (e) | | | (1,500 | ) | | | (16,635 | ) |
Aratana Therapeutics, Inc. (e) | | | (1,100 | ) | | | (7,689 | ) |
Basilea Pharmaceutica, Ltd. Registered (e) | | | (204 | ) | | | (21,196 | ) |
Bluebird Bio, Inc. (e) | | | (200 | ) | | | (15,426 | ) |
Esperion Therapeutics, Inc. (e) | | | (400 | ) | | | (9,600 | ) |
Evolva Holding S.A. (e) | | | (62,724 | ) | | | (77,417 | ) |
Genmab A/S (e) | | | (228 | ) | | | (22,490 | ) |
Idera Pharmaceuticals, Inc. (e) | | | (5,700 | ) | | | (15,732 | ) |
Intercept Pharmaceuticals, Inc. (e) | | | (200 | ) | | | (31,440 | ) |
Karyopharm Therapeutics, Inc. (e) | | | (1,700 | ) | | | (22,695 | ) |
Mesoblast, Ltd. (e)(g) | | | (8,795 | ) | | | (21,386 | ) |
Omeros Corp. (e) | | | (1,700 | ) | | | (21,301 | ) |
Organovo Holdings, Inc. (e) | | | (3,800 | ) | | | (11,438 | ) |
Otonomy, Inc. (e) | | | (1,000 | ) | | | (21,640 | ) |
OvaScience, Inc. (e) | | | (1,200 | ) | | | (15,564 | ) |
Pacific Biosciences of California, Inc. (e) | | | (2,700 | ) | | | (19,170 | ) |
Paratek Pharmaceuticals, Inc. | | | (800 | ) | | | (13,888 | ) |
Theravance Biopharma, Inc. (e) | | | (1,700 | ) | | | (25,415 | ) |
Theravance, Inc. | | | (2,400 | ) | | | (21,072 | ) |
Versartis, Inc. (e) | | | (1,200 | ) | | | (12,396 | ) |
Zeltia S.A. (e) | | | (4,929 | ) | | | (21,925 | ) |
| | | | | | | | |
| | | | | | | (445,515 | ) |
| | | | | | | | |
Building Materials (0.2%) | |
Boral, Ltd. | | | (21,644 | ) | | | (83,191 | ) |
James Hardie Industries PLC | | | (6,697 | ) | | | (87,394 | ) |
Trex Co., Inc. (e) | | | (2,100 | ) | | | (82,047 | ) |
| | | | | | | | |
| | | | | | | (252,632 | ) |
| | | | | | | | |
| | | | | | |
The notes to the consolidated financial statements are an integral part of,
and should be read in conjunction with, the consolidated financial statements. | | | | | 17 | |
Consolidated Portfolio of Investments October 31, 2015 (Unaudited) (continued)
| | | | | | | | |
| | |
Shares | | | Value | |
| Common Stocks Sold Short (continued) | |
Chemicals (0.4%) | |
Albemarle Corp. | | | (300 | ) | | $ | (16,056 | ) |
Balchem Corp. | | | (1,300 | ) | | | (88,790 | ) |
Novozymes A/S Class B | | | (2,147 | ) | | | (99,557 | ) |
Platform Specialty Products Corp. (e) | | | (1,600 | ) | | | (16,704 | ) |
Tronox, Ltd. Class A | | | (12,600 | ) | | | (78,246 | ) |
WR Grace & Co. (e) | | | (900 | ) | | | (90,270 | ) |
| | | | | | | | |
| | | | | | | (389,623 | ) |
| | | | | | | | |
Coal (0.0%)‡ | |
Peabody Energy Corp. | | | (2,366 | ) | | | (30,261 | ) |
Westmoreland Coal Co. (e) | | | (200 | ) | | | (1,432 | ) |
| | | | | | | | |
| | | | | | | (31,693 | ) |
| | | | | | | | |
Commercial Services (0.7%) | |
Advisory Board Co. (The) (e) | | | (1,700 | ) | | | (74,511 | ) |
Arrowhead Research Corp. (e) | | | (2,700 | ) | | | (13,905 | ) |
Ezion Holdings, Ltd. | | | (99,700 | ) | | | (49,818 | ) |
HealthEquity, Inc. (e) | | | (2,800 | ) | | | (91,588 | ) |
Macquarie Infrastructure Corp. | | | (1,300 | ) | | | (103,415 | ) |
Navitas, Ltd. | | | (28,143 | ) | | | (84,289 | ) |
Rollins, Inc. | | | (3,400 | ) | | | (91,188 | ) |
Sotheby’s | | | (2,400 | ) | | | (83,160 | ) |
Transurban Group | | | (11,823 | ) | | | (88,019 | ) |
| | | | | | | | |
| | | | | | | (679,893 | ) |
| | | | | | | | |
Computers (0.2%) | |
3D Systems Corp. (e) | | | (7,100 | ) | | | (71,426 | ) |
Nimble Storage, Inc. (e) | | | (3,500 | ) | | | (79,100 | ) |
Stratasys, Ltd. (e) | | | (2,800 | ) | | | (71,400 | ) |
| | | | | | | | |
| | | | | | | (221,926 | ) |
| | | | | | | | |
Distribution & Wholesale (0.1%) | |
Fastenal Co. | | | (2,300 | ) | | | (90,068 | ) |
| | | | | | | | |
|
Diversified Financial Services (0.1%) | |
Perpetual, Ltd. | | | (2,066 | ) | | | (66,164 | ) |
| | | | | | | | |
|
Electric (0.1%) | |
ITC Holdings Corp. | | | (3,000 | ) | | | (98,160 | ) |
| | | | | | | | |
|
Electronics (0.3%) | |
FARO Technologies, Inc. (e) | | | (2,100 | ) | | | (70,959 | ) |
Garmin, Ltd. | | | (2,500 | ) | | | (88,675 | ) |
Knowles Corp. (e) | | | (1,900 | ) | | | (31,654 | ) |
National Instruments Corp. | | | (3,200 | ) | | | (97,504 | ) |
Waters Corp. (e) | | | (300 | ) | | | (38,340 | ) |
| | | | | | | | |
| | | | | | | (327,132 | ) |
| | | | | | | | |
Energy—Alternate Sources (0.1%) | |
Clean Energy Fuels Corp. (e) | | | (7,100 | ) | | | (40,115 | ) |
Plug Power, Inc. (e) | | | (35,000 | ) | | | (84,350 | ) |
| | | | | | | | |
| | |
Shares | | | Value | |
Energy—Alternate Sources (continued) | |
SolarCity Corp. (e) | | | (300 | ) | | $ | (8,895 | ) |
| | | | | | | | |
| | | | | | | (133,360 | ) |
| | | | | | | | |
Engineering & Construction (0.4%) | |
Chicago Bridge & Iron Co. N.V. | | | (2,200 | ) | | | (98,714 | ) |
Exponent, Inc. | | | (1,700 | ) | | | (87,397 | ) |
¡ SBA Communications Corp. Class A (e) | | | (900 | ) | | | (107,118 | ) |
Singapore Technologies Engineering, Ltd. | | | (37,200 | ) | | | (87,895 | ) |
| | | | | | | | |
| | | | | | | (381,124 | ) |
| | | | | | | | |
Entertainment (0.3%) | |
Dolby Laboratories, Inc. Class A | | | (2,800 | ) | | | (97,076 | ) |
Genting Singapore PLC | | | (149,600 | ) | | | (87,033 | ) |
Scientific Games Corp. Class A (e) | | | (7,700 | ) | | | (85,393 | ) |
| | | | | | | | |
| | | | | | | (269,502 | ) |
| | | | | | | | |
Finance—Consumer Loans (0.1%) | |
Navient Corp. | | | (7,800 | ) | | | (102,882 | ) |
| | | | | | | | |
|
Finance—Mortgage Loan/Banker (0.1%) | |
Arlington Asset Investment Corp. Class A | | | (4,300 | ) | | | (59,555 | ) |
Walter Investment Management Corp. (e) | | | (100 | ) | | | (1,196 | ) |
| | | | | | | | |
| | | | | | | (60,751 | ) |
| | | | | | | | |
Finance—Other Services (0.2%) | |
CBOE Holdings, Inc. | | | (1,400 | ) | | | (93,856 | ) |
OzForex Group, Ltd. | | | (42,579 | ) | | | (86,231 | ) |
| | | | | | | | |
| | | | | | | (180,087 | ) |
| | | | | | | | |
Food (0.7%) | |
Aryzta A.G. (e) | | | (1,970 | ) | | | (88,889 | ) |
Barry Callebaut A.G. Registered (e) | | | (83 | ) | | | (99,672 | ) |
Boulder Brands, Inc. (e) | | | (7,800 | ) | | | (69,108 | ) |
Chefs’ Warehouse, Inc. (The) (e) | | | (5,400 | ) | | | (81,810 | ) |
¡ Chocoladefabriken Lindt & Sprungli A.G. | | | (17 | ) | | | (171,870 | ) |
CHR Hansen Holding A/S | | | (1,403 | ) | | | (84,316 | ) |
Sprouts Farmers Market, Inc. (e) | | | (4,200 | ) | | | (85,596 | ) |
Super Group, Ltd. | | | (68,100 | ) | | | (43,751 | ) |
| | | | | | | | |
| | | | | | | (725,012 | ) |
| | | | | | | | |
Forest Products & Paper (0.1%) | |
Deltic Timber Corp. | | | (1,300 | ) | | | (80,548 | ) |
| | | | | | | | |
|
Gas (0.1%) | |
Questar Corp. | | | (4,600 | ) | | | (94,990 | ) |
| | | | | | | | |
|
Health Care—Products (0.5%) | |
Accelerate Diagnostics, Inc. (e) | | | (1,100 | ) | | | (18,447 | ) |
Bio-Techne Corp. | | | (400 | ) | | | (35,280 | ) |
Cerus Corp. (e) | | | (17,600 | ) | | | (83,952 | ) |
Edwards Lifesciences Corp. (e) | | | (600 | ) | | | (94,290 | ) |
GenMark Diagnostics, Inc. (e) | | | (4,200 | ) | | | (26,712 | ) |
Henry Schein, Inc. (e) | | | (100 | ) | | | (15,171 | ) |
| | | | |
| 18 | | MainStay Absolute Return Multi-Strategy Fund | | The notes to the consolidated financial statements are an integral part of,
and should be read in conjunction with, the consolidated financial statements. |
| | | | | | | | |
| | |
Shares | | | Value | |
| Common Stocks Sold Short (continued) | |
Health Care—Products (continued) | |
IDEXX Laboratories, Inc. (e) | | | (1,300 | ) | | $ | (89,206 | ) |
Ocular Therapeutix, Inc. (e) | | | (1,200 | ) | | | (10,356 | ) |
Patterson Cos., Inc. | | | (2,100 | ) | | | (99,540 | ) |
| | | | | | | | |
| | | | | | | (472,954 | ) |
| | | | | | | | |
Health Care—Services (0.7%) | |
AAC Holdings, Inc. (e) | | | (3,100 | ) | | | (71,920 | ) |
Brookdale Senior Living, Inc. (e) | | | (3,900 | ) | | | (81,549 | ) |
Capital Senior Living Corp. (e) | | | (3,700 | ) | | | (83,694 | ) |
Envision Healthcare Holdings, Inc. (e) | | | (2,600 | ) | | | (73,320 | ) |
Healthscope, Ltd. | | | (4,521 | ) | | | (8,705 | ) |
Laboratory Corporation of America Holdings (e) | | | (800 | ) | | | (98,192 | ) |
MEDNAX, Inc. (e) | | | (1,200 | ) | | | (84,564 | ) |
Premier, Inc. Class A (e) | | | (2,600 | ) | | | (87,906 | ) |
Ramsay Health Care, Ltd. | | | (1,940 | ) | | | (85,785 | ) |
Tenet Healthcare Corp. (e) | | | (2,500 | ) | | | (78,425 | ) |
| | | | | | | | |
| | | | | | | (754,060 | ) |
| | | | | | | | |
Insurance (0.7%) | |
Ambac Financial Group, Inc. (e) | | | (5,200 | ) | | | (83,980 | ) |
Cover-More Group, Ltd. | | | (47,190 | ) | | | (76,724 | ) |
Genworth Financial, Inc. Class A (e) | | | (11,400 | ) | | | (53,352 | ) |
Greenlight Capital Re, Ltd. Class A (e) | | | (2,200 | ) | | | (48,312 | ) |
Insurance Australia Group, Ltd. | | | (17,849 | ) | | | (71,405 | ) |
MBIA, Inc. (e) | | | (11,900 | ) | | | (89,369 | ) |
Mercury General Corp. | | | (1,600 | ) | | | (86,416 | ) |
ProAssurance Corp. | | | (1,300 | ) | | | (68,848 | ) |
Tryg A/S | | | (4,801 | ) | | | (86,360 | ) |
| | | | | | | | |
| | | | | | | (664,766 | ) |
| | | | | | | | |
Internet (0.8%) | |
Chegg, Inc. (e) | | | (11,400 | ) | | | (78,660 | ) |
FireEye, Inc. (e) | | | (1,300 | ) | | | (33,995 | ) |
Marketo, Inc. (e) | | | (2,600 | ) | | | (76,518 | ) |
Quotient Technology, Inc. | | | (9,100 | ) | | | (50,414 | ) |
Seek, Ltd. | | | (9,015 | ) | | | (82,479 | ) |
Splunk, Inc. (e) | | | (1,600 | ) | | | (89,856 | ) |
TrueCar, Inc. (e) | | | (12,000 | ) | | | (73,680 | ) |
TubeMogul, Inc. (e) | | | (6,000 | ) | | | (71,700 | ) |
Twitter, Inc. (e) | | | (3,100 | ) | | | (88,226 | ) |
Wayfair, Inc. (e) | | | (1,900 | ) | | | (80,313 | ) |
Wix.com, Ltd. Class A (e) | | | (4,200 | ) | | | (92,904 | ) |
| | | | | | | | |
| | | | | | | (818,745 | ) |
| | | | | | | | |
Investment Companies (0.1%) | |
Acacia Research Corp. | | | (8,600 | ) | | | (57,276 | ) |
Aker ASA Class A | | | (2,517 | ) | | | (49,619 | ) |
| | | | | | | | |
| | | | | | | (106,895 | ) |
| | | | | | | | |
Investment Management/Advisory Services (0.3%) | |
Financial Engines, Inc. | | | (2,700 | ) | | | (86,832 | ) |
| | | | | | | | |
| | |
Shares | | | Value | |
Investment Management/Advisory Services (continued) | |
Platinum Asset Management, Ltd. | | | (17,044 | ) | | $ | (89,940 | ) |
WisdomTree Investments, Inc. | | | (5,000 | ) | | | (96,150 | ) |
| | | | | | | | |
| | | | | | | (272,922 | ) |
| | | | | | | | |
Iron & Steel (0.3%) | |
Acerinox S.A. | | | (7,986 | ) | | | (86,448 | ) |
AK Steel Holding Corp. (e) | | | (27,300 | ) | | | (78,897 | ) |
Cliffs Natural Resources, Inc. | | | (28,300 | ) | | | (78,108 | ) |
Outokumpu Oyj (e) | | | (12,668 | ) | | | (43,128 | ) |
| | | | | | | | |
| | | | | | | (286,581 | ) |
| | | | | | | | |
Leisure Time (0.1%) | |
Harley-Davidson, Inc. | | | (1,700 | ) | | | (84,065 | ) |
| | | | | | | | |
|
Lodging (0.1%) | |
Choice Hotels International, Inc. | | | (1,900 | ) | | | (99,389 | ) |
| | | | | | | | |
|
Machinery—Construction & Mining (0.1%) | |
Outotec Oyj | | | (19,437 | ) | | | (66,900 | ) |
| | | | | | | | |
|
Machinery—Diversified (0.4%) | |
Burckhardt Compression Holding A.G. | | | (49 | ) | | | (17,102 | ) |
Cognex Corp. | | | (2,600 | ) | | | (97,760 | ) |
Graco, Inc. | | | (1,300 | ) | | | (95,420 | ) |
Middleby Corp. (The) (e) | | | (800 | ) | | | (93,552 | ) |
Power Solutions International, Inc. (e) | | | (2,000 | ) | | | (36,080 | ) |
Zebra Technologies Corp. Class A (e) | | | (1,200 | ) | | | (92,280 | ) |
| | | | | | | | |
| | | | | | | (432,194 | ) |
| | | | | | | | |
Media (0.3%) | |
Discovery Communications, Inc. Class A (e) | | | (2,100 | ) | | | (61,824 | ) |
Promotora de Informaciones S.A. Class A (e) | | | (8,562 | ) | | | (47,565 | ) |
Singapore Press Holdings, Ltd. | | | (30,200 | ) | | | (86,015 | ) |
Tribune Media Co. Class A | | | (2,400 | ) | | | (96,792 | ) |
| | | | | | | | |
| | | | | | | (292,196 | ) |
| | | | | | | | |
Metal Fabricate & Hardware (0.1%) | |
RBC Bearings, Inc. (e) | | | (1,300 | ) | | | (88,907 | ) |
| | | | | | | | |
|
Mining (0.5%) | |
Alumina, Ltd. | | | (94,970 | ) | | | (73,479 | ) |
Hecla Mining Co. | | | (35,800 | ) | | | (74,106 | ) |
Horsehead Holding Corp. (e) | | | (11,400 | ) | | | (32,376 | ) |
Independence Group NL | | | (38,335 | ) | | | (75,723 | ) |
Newcrest Mining, Ltd. (e) | | | (8,242 | ) | | | (72,350 | ) |
Nyrstar N.V. (e) | | | (32,316 | ) | | | (49,431 | ) |
Royal Gold, Inc. | | | (1,900 | ) | | | (90,896 | ) |
Syrah Resources, Ltd. (e) | | | (19,624 | ) | | | (44,081 | ) |
| | | | | | | | |
| | | | | | | (512,442 | ) |
| | | | | | | | |
Miscellaneous—Manufacturing (0.3%) | |
Donaldson Co., Inc. | | | (3,000 | ) | | | (90,600 | ) |
GWA Group, Ltd. | | | (45,720 | ) | | | (80,855 | ) |
| | | | | | |
The notes to the consolidated financial statements are an integral part of,
and should be read in conjunction with, the consolidated financial statements. | | | | | 19 | |
Consolidated Portfolio of Investments October 31, 2015 (Unaudited) (continued)
| | | | | | | | |
| | |
Shares | | | Value | |
| Common Stocks Sold Short (continued) | |
Miscellaneous—Manufacturing (continued) | |
Orica, Ltd. | | | (412 | ) | | $ | (4,842 | ) |
Proto Labs, Inc. (e) | | | (1,200 | ) | | | (77,808 | ) |
Raven Industries, Inc. | | | (4,600 | ) | | | (83,766 | ) |
| | | | | | | | |
| | | | | | | (337,871 | ) |
| | | | | | | | |
Oil & Gas (0.3%) | |
Antero Resources Corp. (e) | | | (400 | ) | | | (9,428 | ) |
Atwood Oceanics, Inc. | | | (500 | ) | | | (8,275 | ) |
Cheniere Energy, Inc. (e) | | | (200 | ) | | | (9,904 | ) |
Cobalt International Energy, Inc. (e) | | | (900 | ) | | | (6,903 | ) |
Continental Resources, Inc. (e) | | | (300 | ) | | | (10,173 | ) |
Diamond Offshore Drilling, Inc. | | | (500 | ) | | | (9,940 | ) |
Diamondback Energy, Inc. (e) | | | (100 | ) | | | (7,384 | ) |
DNO ASA (e) | | | (63,464 | ) | | | (63,638 | ) |
Eclipse Resources Corp. (e) | | | (3,700 | ) | | | (7,955 | ) |
Energen Corp. | | | (200 | ) | | | (11,630 | ) |
Erin Energy Corp. (e) | | | (2,300 | ) | | | (9,200 | ) |
EXCO Resources, Inc. (e) | | | (6,200 | ) | | | (6,944 | ) |
Halcon Resources Corp. (e) | | | (11,700 | ) | | | (8,203 | ) |
Kosmos Energy, Ltd. (e) | | | (1,500 | ) | | | (10,230 | ) |
Laredo Petroleum, Inc. (e) | | | (800 | ) | | | (9,184 | ) |
Memorial Resource Development Corp. (e) | | | (500 | ) | | | (8,845 | ) |
Noble Corp. PLC | | | (800 | ) | | | (10,776 | ) |
Parsley Energy, Inc. Class A (e) | | | (700 | ) | | | (12,411 | ) |
Rice Energy, Inc. (e) | | | (600 | ) | | | (9,156 | ) |
RSP Permian, Inc. (e) | | | (400 | ) | | | (10,968 | ) |
SandRidge Energy, Inc. (e) | | | (8,700 | ) | | | (3,221 | ) |
Santos, Ltd. | | | (10,490 | ) | | | (43,686 | ) |
Synergy Resources Corp. (e) | | | (1,000 | ) | | | (11,190 | ) |
Ultra Petroleum Corp. (e) | | | (1,300 | ) | | | (7,124 | ) |
| | | | | | | | |
| | | | | | | (306,368 | ) |
| | | | | | | | |
Oil & Gas Services (0.2%) | |
Dril-Quip, Inc. (e) | | | (200 | ) | | | (12,312 | ) |
Flotek Industries, Inc. (e) | | | (4,100 | ) | | | (74,210 | ) |
Schoeller-Bleckmann Oilfield Equipment A.G. | | | (1,299 | ) | | | (78,065 | ) |
TETRA Technologies, Inc. (e) | | | (1,400 | ) | | | (9,436 | ) |
| | | | | | | | |
| | | | | | | (174,023 | ) |
| | | | | | | | |
Pharmaceuticals (0.6%) | |
Aerie Pharmaceuticals, Inc. (e) | | | (1,000 | ) | | | (22,810 | ) |
Akorn, Inc. (e) | | | (1,400 | ) | | | (37,436 | ) |
Catalyst Pharmaceuticals, Inc. (e) | | | (3,900 | ) | | | (12,324 | ) |
Cosmo Pharmaceuticals S.A. (e) | | | (129 | ) | | | (19,824 | ) |
Fagron | | | (4,280 | ) | | | (105,167 | ) |
Flexion Therapeutics, Inc. (e) | | | (800 | ) | | | (13,184 | ) |
Heron Therapeutics, Inc. (e) | | | (800 | ) | | | (21,936 | ) |
Intra-Cellular Therapies, Inc. (e) | | | (500 | ) | | | (23,925 | ) |
Jazz Pharmaceuticals PLC (e) | | | (300 | ) | | | (41,184 | ) |
Keryx Biopharmaceuticals, Inc. (e) | | | (2,000 | ) | | | (8,960 | ) |
La Jolla Pharmaceutical Co. (e) | | | (800 | ) | | | (19,992 | ) |
| | | | | | | | |
| | |
Shares | | | Value | |
Pharmaceuticals (continued) | | | | | | | | |
MannKind Corp. (e) | | | (6,800 | ) | | $ | (22,508 | ) |
OPKO Health, Inc. (e) | | | (3,700 | ) | | | (34,965 | ) |
Perrigo Co. PLC | | | (300 | ) | | | (47,322 | ) |
Relypsa, Inc. (e) | | | (1,100 | ) | | | (17,589 | ) |
Revance Therapeutics, Inc. (e) | | | (700 | ) | | | (27,419 | ) |
Santhera Pharmaceutical Holding A.G. Registered (e) | | | (198 | ) | | | (18,960 | ) |
TG Therapeutics, Inc. (e) | | | (1,700 | ) | | | (21,029 | ) |
TherapeuticsMD, Inc. (e) | | | (3,300 | ) | | | (19,371 | ) |
VCA, Inc. (e) | | | (1,700 | ) | | | (93,109 | ) |
Vital Therapies, Inc. (e) | | | (900 | ) | | | (6,993 | ) |
ZS Pharma, Inc. (e) | | | (300 | ) | | | (19,503 | ) |
| | | | | | | | |
| | | | | | | (655,510 | ) |
| | | | | | | | |
Real Estate (0.1%) | |
REA Group, Ltd. | | | (2,547 | ) | | | (87,235 | ) |
| | | | | | | | |
|
Real Estate Investment Trusts (0.1%) | |
Ubiquiti Networks, Inc. | | | (2,300 | ) | | | (67,114 | ) |
| | | | | | | | |
|
Retail (1.0%) | |
Cabela’s, Inc. (e) | | | (2,000 | ) | | | (78,340 | ) |
CarMax, Inc. (e) | | | (1,200 | ) | | | (70,812 | ) |
Chipotle Mexican Grill, Inc. (e) | | | (100 | ) | | | (64,023 | ) |
Container Store Group, Inc. (The) (e) | | | (6,900 | ) | | | (78,729 | ) |
Dufry A.G. Registered (e) | | | (724 | ) | | | (84,746 | ) |
Dunkin’ Brands Group, Inc. | | | (2,200 | ) | | | (91,102 | ) |
Five Below, Inc. (e) | | | (2,400 | ) | | | (82,416 | ) |
J.C. Penney Co., Inc. (e) | | | (4,400 | ) | | | (40,348 | ) |
Lululemon Athletica, Inc. (e) | | | (1,700 | ) | | | (83,589 | ) |
MarineMax, Inc. (e) | | | (3,200 | ) | | | (50,560 | ) |
Sears Holdings Corp. (e) | | | (3,700 | ) | | | (86,469 | ) |
Tiffany & Co. | | | (1,200 | ) | | | (98,928 | ) |
Tuesday Morning Corp. (e) | | | (8,500 | ) | | | (45,985 | ) |
Zoe’s Kitchen, Inc. (e) | | | (2,100 | ) | | | (72,303 | ) |
| | | | | | | | |
| | | | | | | (1,028,350 | ) |
| | | | | | | | |
Savings & Loans (0.1%) | |
TFS Financial Corp. | | | (3,900 | ) | | | (68,484 | ) |
| | | | | | | | |
|
Semiconductors (0.3%) | |
Applied Micro Circuits Corp. (e) | | | (13,800 | ) | | | (89,424 | ) |
IPG Photonics Corp. (e) | | | (1,200 | ) | | | (99,144 | ) |
Nordic Semiconductor ASA (e) | | | (15,910 | ) | | | (76,491 | ) |
| | | | | | | | |
| | | | | | | (265,059 | ) |
| | | | | | | | |
Shipbuilding (0.1%) | |
Sembcorp Marine, Ltd. | | | (34,000 | ) | | | (56,792 | ) |
Vard Holdings, Ltd. (e) | | | (179,800 | ) | | | (48,771 | ) |
| | | | | | | | |
| | | | | | | (105,563 | ) |
| | | | | | | | |
Software (0.8%) | |
Actua Corp. (e) | | | (6,600 | ) | | | (91,410 | ) |
| | | | |
| 20 | | MainStay Absolute Return Multi-Strategy Fund | | The notes to the consolidated financial statements are an integral part of,
and should be read in conjunction with, the consolidated financial statements. |
| | | | | | | | |
| | |
Shares | | | Value | |
| Common Stocks Sold Short (continued) | |
Software (continued) | | | | | | | | |
Altium, Ltd. | | | (24,853 | ) | | $ | (79,752 | ) |
athenahealth, Inc. (e) | | | (700 | ) | | | (106,715 | ) |
Castlight Health, Inc. Class B (e) | | | (19,000 | ) | | | (96,140 | ) |
Mobileiron, Inc. (e) | | | (8,200 | ) | | | (31,652 | ) |
NetSuite, Inc. (e) | | | (1,100 | ) | | | (93,577 | ) |
Opera Software ASA | | | (15,146 | ) | | | (94,565 | ) |
OPOWER, Inc. (e) | | | (9,200 | ) | | | (88,780 | ) |
Workday, Inc. Class A (e) | | | (1,100 | ) | | | (86,867 | ) |
Xero, Ltd. (e) | | | (2,774 | ) | | | (30,036 | ) |
| | | | | | | | |
| | | | | | | (799,494 | ) |
| | | | | | | | |
Storage & Warehousing (0.1%) | |
Mobile Mini, Inc. | | | (2,400 | ) | | | (82,176 | ) |
| | | | | | | | |
|
Telecommunications (0.5%) | |
Globalstar, Inc. (e) | | | (21,800 | ) | | | (39,240 | ) |
¡ Level 3 Communications, Inc. (e) | | | (2,100 | ) | | | (106,995 | ) |
Loral Space & Communications, Inc. (e) | | | (1,200 | ) | | | (53,652 | ) |
Millicom International Cellular S.A. | | | (1,478 | ) | | | (82,519 | ) |
Motorola Solutions, Inc. | | | (1,300 | ) | | | (90,961 | ) |
ORBCOMM, Inc. (e) | | | (13,700 | ) | | | (81,378 | ) |
RigNet, Inc. (e) | | | (300 | ) | | | (9,000 | ) |
Vocus Communications, Ltd. | | | (18,641 | ) | | | (86,537 | ) |
| | | | | | | | |
| | | | | | | (550,282 | ) |
| | | | | | | | |
Transportation (0.3%) | |
CAI International, Inc. (e) | | | (1,300 | ) | | | (15,106 | ) |
GasLog, Ltd. | | | (900 | ) | | | (10,413 | ) |
Golar LNG, Ltd. | | | (200 | ) | | | (5,802 | ) |
Golden Ocean Group, Ltd. | | | (27,200 | ) | | | (53,584 | ) |
Hoegh LNG Holdings, Ltd. | | | (207 | ) | | | (2,485 | ) |
Hornbeck Offshore Services, Inc. (e) | | | (600 | ) | | | (8,106 | ) |
Scorpio Bulkers, Inc. (e) | | | (52,100 | ) | | | (72,940 | ) |
Teekay Corp. | | | (300 | ) | | | (9,639 | ) |
Tidewater, Inc. | | | (600 | ) | | | (7,410 | ) |
XPO Logistics, Inc. (e) | | | (2,900 | ) | | | (80,504 | ) |
| | | | | | | | |
| | | | | | | (265,989 | ) |
| | | | | | | | |
Trucking & Leasing (0.1%) | | | | | | | | |
TAL International Group, Inc. (e) | | | (2,400 | ) | | | (40,704 | ) |
Textainer Group Holdings, Ltd. | | | (4,300 | ) | | | (84,108 | ) |
| | | | | | | | |
| | | | | | | (124,812 | ) |
| | | | | | | | |
Water (0.1%) | | | | | | | | |
Aqua America, Inc. | | | (3,200 | ) | | | (91,520 | ) |
| | | | | | | | |
Total Common Stocks Sold Short
(Proceeds $17,831,364) | | | | (15,706,370 | ) |
| | | | | | | | |
| | | | | | | | |
| | |
Shares | | | Value | |
| Exchange-Traded Funds Sold Short (4.1%) (j) | |
¡ SPDR S&P 500 ETF Trust | | | (4,900 | ) | | $ | (1,018,857 | ) |
¡ United States Oil Fund, L.P. (e) | | | (209,800 | ) | | | (3,107,138 | ) |
| | | | | | | | |
Total Exchange-Traded Funds Sold Short
(Proceeds $4,865,504) | | | | (4,125,995 | ) |
| | | | | | | | |
Total Investments Sold Short
(Proceeds $22,696,868) | | | | | | | (19,832,365 | ) |
| | | | | | | | |
Total Investments, Net of Investments Sold Short
(Cost $75,357,682) | | | 74.1 | % | | | 74,739,064 | |
Other Assets, Less Liabilities | | | 25.9 | | | | 26,088,285 | |
Net Assets | | | 100.0 | % | | $ | 100,827,349 | |
| ‡ | Less than one-tenth of a percent. |
| (a) | Floating rate—Rate shown was the rate in effect as of October 31, 2015. |
| (b) | May be sold to institutional investors only under Rule 144A or securities offered pursuant to Section 4(a)(2) of the Securities Act of 1933, as amended. |
| (c) | Illiquid security—As of October 31, 2015, the total market value of securities deemed illiquid under procedures approved by the Board of Trustees was $704,147, which represented 0.7% of the Fund’s net assets. |
| (d) | PIK (“Payment-in-Kind”)—issuer may pay interest or dividends with additional securities and/or in cash. |
| (e) | Non-income producing security. |
| (f) | Security, or a portion thereof, was maintained in a segregated account at the Fund’s custodian as collateral for securities Sold Short (See Note 2(P)). |
| (g) | Fair valued security—Represents fair value as measured in good faith under procedures approved by the Board of Trustees. As of October 31, 2015, the total market value of these securities was $29,339, which represented less than one-tenth of a percent of the Fund’s net assets. |
| (h) | As of October 31, 2015, cash in the amount of $40,273 is on deposit with a broker for futures transactions and options on futures transactions. |
| (i) | Interest rate shown represents yield to maturity. |
| (j) | Exchange-Traded Fund—An investment vehicle that represents a basket of securities that is traded on an exchange. |
| (k) | As of October 31, 2015, cost was $98,054,550 for federal income tax purposes and net unrealized depreciation was as follows: |
| | | | |
Gross unrealized appreciation | | $ | 978,152 | |
Gross unrealized depreciation | | | (4,461,273 | ) |
| | | | |
Net unrealized depreciation | | $ | (3,483,121 | ) |
| | | | |
| | | | | | |
The notes to the consolidated financial statements are an integral part of,
and should be read in conjunction with, the consolidated financial statements. | | | | | 21 | |
Consolidated Portfolio of Investments October 31, 2015 (Unaudited) (continued)
As of October 31, 2015, the Fund held the following foreign currency forward contracts:
| | | | | | | | | | | | | | | | | | | | | | |
Foreign Currency Buy Contracts | | Expiration
Date | | | Counterparty | | Contract
Amount
Purchased | | | Contract
Amount
Sold | | | Unrealized
Appreciation
(Depreciation) | |
Euro vs. U.S. Dollar | | | 11/20/15 | | | Societe Generale | | | EUR | | | | 346,375 | | | $ | 383,239 | | | $ | (2,267 | ) |
Euro vs. U.S. Dollar | | | 12/17/15 | | | Societe Generale | | | | | | | 170,000 | | | | 193,310 | | | | (6,238 | ) |
| | | | | | |
| | | | | | | | | | | | | | | | | | | | | | |
Foreign Currency Sales Contracts | | | | | | | Contract
Amount
Sold | | | Contract
Amount
Purchased | | | | |
Canadian Dollar vs. U.S. Dollar | | | 12/17/15 | | | Societe Generale | | | CAD | | | | 110,000 | | | | 82,994 | | | | (1,108 | ) |
Euro vs. U.S. Dollar | | | 11/20/15 | | | Societe Generale | | | EUR | | | | 9,030,000 | | | | 10,243,931 | | | | 312,020 | |
Euro vs. U.S. Dollar | | | 12/17/15 | | | Societe Generale | | | | | | | 2,950,000 | | | | 3,340,849 | | | | 94,588 | |
Pound Sterling vs. U.S. Dollar | | | 11/20/15 | | | Societe Generale | | | GBP | | | | 304,700 | | | | 470,410 | | | | 733 | |
Net unrealized appreciation (depreciation) on foreign currency forward contracts | | | $ | 397,728 | |
As of October 31, 2015, the Fund held the following futures contracts1:
| | | | | | | | | | | | | | | | |
Type | | Number of
Contracts
(Short) | | | Expiration
Date | | | Notional
Amount | | | Unrealized
Appreciation
(Depreciation)2 | |
| Euro-Bobl | | | (30 | ) | | | December 2015 | | | $ | (4,269,502 | ) | | $ | (37,001 | ) |
| Euro-Bund | | | (2 | ) | | | December 2015 | | | | (345,752 | ) | | | (7,195 | ) |
| | | | | | | | | | | | | | | | |
| | | | | | | | | | $ | (4,615,254 | ) | | $ | (44,196 | ) |
| | | | | | | | | | | | | | | | |
| 1. | As of October 31, 2015, cash in the amount of $40,273 was on deposit with a broker for futures transactions and options on futures transactions. |
| 2. | Represents the difference between the value of the contracts at the time they were opened and the value as of October 31, 2015. |
Written Option on Futures Contracts
| | | | | | | | | | | | | | | | | | | | | | | | |
Description | | Counterparty | | | Strike
Price | | | Expiration
Date | | | Notional
Amount | | | Premium
(Received) | | | Market
Value | |
Call-U.S. Treasury Note (10 Year) February 2016, American Style | | | Citibank NA | | | $ | 129.00 | | | | 2/19/2016 | | | $ | (1,000 | ) | | $ | (701 | ) | | $ | (734 | ) |
As of October 31, 2015, the Fund held the following centrally cleared interest rate swap agreements1:
| | | | | | | | | | | | | | | | | | | | | | | | | | | | |
Notional Amount | | Currency | | | Expiration
Date | | | Payments made
by Fund | | | Payments
Received by Fund | | | Upfront
Premiums
Received/
(Paid) | | | Value | | | Unrealized
Appreciation /
(Depreciation) | |
$9,500,000 | | | USD | | | | 6/23/2017 | | | | Fixed 0.877 | % | | | 3-Month USD-LIBOR | | | $ | — | | | $ | (20,072 | ) | | $ | (20,072 | ) |
2,300,000 | | | USD | | | | 6/23/2025 | | | | 3-Month USD-LIBOR | | | | Fixed 2.366 | % | | | — | | | | 67,761 | | | | 67,761 | |
| | | | | | | | | | | | | | | | | | | $ | — | | | $ | 47,689 | | | $ | 47,689 | |
| | | | |
| 22 | | MainStay Absolute Return Multi-Strategy Fund | | The notes to the consolidated financial statements are an integral part of,
and should be read in conjunction with, the consolidated financial statements. |
As of October 31, 2015, the Fund held the following open centrally cleared credit default swap contracts1:
| | | | | | | | | | | | | | | | | | | | | | | | | | | | |
Reference Entity | | Termination
Date | | | Buy/Sell
Protection2 | | | Notional
Amount
(000)3 | | | (Pay)/
Receive
Fixed
Rate4 | | | Upfront
Premiums
Received/
(Paid) | | | Value | | | Unrealized
Appreciation/
(Depreciation)5 | |
Markit iTraxx Europe Crossover Series 23 | | | 6/20/2020 | | | | Buy | | | | EUR 1,000 | | | | (5.00 | )% | | $ | (79,153 | ) | | $ | (91,923 | ) | | $ | (12,770 | ) |
Markit iTraxx Europe Crossover Series 23 | | | 6/20/2020 | | | | Buy | | | | 1,000 | | | | (5.00 | )% | | | (96,250 | ) | | | (91,923 | ) | | | 4,327 | |
Markit iTraxx Europe Crossover Series 23 | | | 6/20/2020 | | | | Sell | | | | 250 | | | | 5.00 | % | | | 23,938 | | | | 22,981 | | | | (957 | ) |
Markit iTraxx Europe Crossover Series 23 | | | 6/20/2020 | | | | Sell | | | | 1,250 | | | | 5.00 | % | | | 96,411 | | | | 114,901 | | | | 18,490 | |
Markit iTraxx Europe Crossover Series 23 | | | 6/20/2020 | | | | Sell | | | | 500 | | | | 5.00 | % | | | 47,025 | | | | 45,961 | | | | (1,064 | ) |
Markit iTraxx Europe Crossover Series 24 | | | 12/20/2020 | | | | Buy | | | | 1,250 | | | | (5.00 | )% | | | (119,585 | ) | | | (127,304 | ) | | | (7,719 | ) |
Markit iTraxx Europe Crossover Series 24 | | | 12/20/2020 | | | | Buy | | | | 1,000 | | | | (5.00 | )% | | | (56,311 | ) | | | (101,843 | ) | | | (45,532 | ) |
Markit iTraxx North American High Yield Series 24 | | | 6/20/2020 | | | | Sell | | | | $ 6,237 | | | | 5.00 | % | | | 356,047 | | | | 359,074 | | | | 3,027 | |
Markit iTraxx North American Investment Grade Series 24 | | | 6/20/2020 | | | | Sell | | | | 2,000 | | | | 1.00 | % | | | 28,457 | | | | 22,540 | | | | (5,917 | ) |
| | | | | | | | | | | | | | | | | | | $ | 200,579 | | | $ | 152,464 | | | $ | (48,115 | ) |
As of October 31, 2015, the Fund held the following open OTC credit default swap contracts:
| | | | | | | | | | | | | | | | | | | | | | | | | | | | | | |
Reference Entity | | Counterparty | | Termination
Date | | | Buy/Sell
Protection2 | | | Notional
Amount
(000)3 | | | (Pay)/
Receive
Fixed
Rate4 | | | Upfront
Premiums
Received/
(Paid) | | | Value | | | Unrealized
Appreciation/
(Depreciation)5 | |
Accor S.A.
2.875%, 6/19/17 | | BNP Paribas S.A. | | | 6/20/2020 | | | | Buy | | | | EUR 300 | | | | (1.00 | )% | | $ | (3,734 | ) | | $ | (3,791 | ) | | $ | (57 | ) |
Casino Guichard Perrachon S.A.
3.157%, 8/6/19 | | BNP Paribas S.A. | | | 12/20/2020 | | | | Buy | | | | 200 | | | | (1.00 | )% | | | 13,908 | | | | 13,829 | | | | (79 | ) |
Electricite de France S.A.
5.625%, 2/21/33 | | Societe Generale S.A. | | | 9/20/2020 | | | | Buy | | | | 250 | | | | (1.00 | )% | | | (5,088 | ) | | | (2,800 | ) | | | 2,288 | |
Fortum OYJ
6.00%, 3/20/19 | | Societe Generale S.A. | | | 12/20/2020 | | | | Buy | | | | 150 | | | | (1.00 | )% | | | (2,346 | ) | | | (3,087 | ) | | | (741 | ) |
Koninklijke KPN N.V.
7.50%, 2/4/19 | | Societe Generale S.A. | | | 9/20/2020 | | | | Buy | | | | 250 | | | | (1.00 | )% | | | (2,599 | ) | | | (2,683 | ) | | | (84 | ) |
Orange S.A.
5.625%, 5/22/18 | | Societe Generale S.A. | | | 9/20/2020 | | | | Buy | | | | 250 | | | | (1.00 | )% | | | (4,680 | ) | | | (6,152 | ) | | | (1,472 | ) |
Solvay S.A.
4.625%, 6/27/18 | | BNP Paribas S.A. | | | 12/20/2020 | | | | Buy | | | | 150 | | | | (1.00 | )% | | | (1,389 | ) | | | (1,578 | ) | | | (189 | ) |
Tesco PLC
6.00%, 12/14/29 | | BNP Paribas S.A. | | | 9/20/2020 | | | | Sell | | | | 100 | | | | 1.00 | % | | | (5,587 | ) | | | (6,205 | ) | | | (618 | ) |
Tesco PLC
6.00%, 12/14/29 | | BNP Paribas S.A. | | | 12/20/2020 | | | | Sell | | | | 200 | | | | 1.00 | % | | | (18,302 | ) | | | (13,789 | ) | | | 4,513 | |
Wind Acquisition Finance S.A.
7.00%, 4/23/21 | | Societe Generale S.A. | | | 12/20/2020 | | | | Buy | | | | 150 | | | | (5.00 | )% | | | (13,722 | ) | | | (14,943 | ) | | | (1,221 | ) |
| | | | | | | | | | | | | | | | | | | | | $ | (43,539 | ) | | $ | (41,199 | ) | | $ | 2,340 | |
| 1. | As of October 31, 2015, cash in the amount of $513,462 was on deposit with a broker for centrally cleared swap agreements. |
| 2. | Buy—Fund pays premium and buys credit protection. If a credit event occurs, as defined under the terms of that particular swap agreement, the Fund will either (i) receive from the seller of protection an amount equal to the notional amount of the swap and deliver the referenced obligation or underlying securities comprising the referenced index or (ii) receive a net settlement amount in the form of cash or securities equal to the notional amount of the swap less the recovery value of the referenced obligation or underlying securities comprising the referenced index. |
| | Sell—Fund receives premium and sells credit protection. If a credit event occurs, as defined under the terms of that particular swap agreement, the Fund will either (i) pay to the buyer of protection an amount equal to the notional amount of the swap and take delivery of the referenced obligation or underlying securities comprising the referenced index or (ii) pay a net settlement amount in the form of cash or securities equal to the notional amount of the swap less the recovery value of the referenced obligation or underlying securities comprising the referenced index. |
| | | | | | |
The notes to the consolidated financial statements are an integral part of,
and should be read in conjunction with, the consolidated financial statements. | | | | | 23 | |
Consolidated Portfolio of Investments October 31, 2015 (Unaudited) (continued)
| 3. | The maximum potential amount the Fund could be required to pay as a seller of credit protection or receive as a buyer of credit protection if a credit event occurs as defined under the terms of that particular swap contract. |
| 4. | The annual fixed rate represents the interest received by the Fund (as a seller of protection) or paid by the Fund (as a buyer of protection) annually on the notional amount of the credit default swap contract. |
| 5. | Represents the difference between the value of the credit default swap contracts at the time they were opened and the value at October 31, 2015. |
Total Return Swap Contracts
Open OTC total return equity swap contracts as of October 31, 2015 were as follows:
| | | | | | | | | | | | | | | | |
Swap Counterparty | | Reference Obligation | | Rate (Paid)/Received by the Fund | | Termination
Date | | | Notional
Amount
(000)* | | | Unrealized
Appreciation | |
Deutsche Bank | | AB Science SA | | 1 Month LIBOR BBA minus 0.45% | | | 7/20/2016 | | | $ | (16 | ) | | $ | 4,639 | |
Citibank NA | | Altera Corp | | 1 Month LIBOR BBA plus 0.35% | | | 6/24/2016 | | | | 242 | | | | 595 | |
Deutsche Bank | | Altice NV | | 1 Month LIBOR BBA minus 0.45% | | | 8/9/2016 | | | | (73 | ) | | | 23,834 | |
Deutsche Bank | | Amerisur Resources PLC | | 1 Month LIBOR BBA minus 0.45% | | | 7/7/2016 | | | | (35 | ) | | | 3,501 | |
Deutsche Bank | | Aurubis AG | | 1 Month LIBOR BBA plus 0.45% | | | 7/20/2016 | | | | 86 | | | | 9,347 | |
Deutsche Bank | | Banca Carige SpA | | 1 Month LIBOR BBA minus 1.25% | | | 7/20/2016 | | | | (89 | ) | | | 5,878 | |
Deutsche Bank | | Banca IFIS SpA | | 1 Month LIBOR BBA plus 0.45% | | | 7/20/2016 | | | | 86 | | | | 7,429 | |
Deutsche Bank | | Banca Monte dei Paschi di Siena SpA | | 1 Month LIBOR BBA minus 0.45% | | | 7/20/2016 | | | | (90 | ) | | | 10,121 | |
Deutsche Bank | | BE Semiconductor Industries NV | | 1 Month LIBOR BBA plus 0.45% | | | 8/9/2016 | | | | 106 | | | | 14,763 | |
Deutsche Bank | | Bellway PLC | | 1 Month LIBOR BBA plus 0.45% | | | 7/7/2016 | | | | 55 | | | | 4,701 | |
Deutsche Bank | | Berkeley Group Holdings PLC | | 1 Month LIBOR BBA plus 0.45% | | | 7/7/2016 | | | | 43 | | | | 1,083 | |
Deutsche Bank | | Boskalis Westminster | | 1 Month LIBOR BBA plus 0.45% | | | 8/9/2016 | | | | 43 | | | | 1,501 | |
Deutsche Bank | | Brunello Cucinelli SpA | | 1 Month LIBOR BBA minus 4.50% | | | 7/20/2016 | | | | (80 | ) | | | 4,520 | |
Deutsche Bank | | CGG SA | | 1 Month LIBOR BBA minus 5.50% | | | 7/20/2016 | | | | (39 | ) | | | 7,921 | |
Deutsche Bank | | Coca-Cola HBC AG | | 1 Month LIBOR BBA plus 0.45% | | | 7/7/2016 | | | | 100 | | | | 12,734 | |
Deutsche Bank | | Crest Nicholson Holdings PLC | | 1 Month LIBOR BBA plus 0.45% | | | 7/7/2016 | | | | 32 | | | | 186 | |
Deutsche Bank | | Dart Group PLC | | 1 Month LIBOR BBA plus 0.45% | | | 7/7/2016 | | | | 1 | | | | 57 | |
Deutsche Bank | | Debenhams PLC | | 1 Month LIBOR BBA plus 0.45% | | | 7/7/2016 | | | | 93 | | | | 2,028 | |
UBS AG | | Depomed Inc. | | US Federal Funds Rate minus 0.40% | | | 6/24/2016 | | | | (44 | ) | | | 4,340 | |
Deutsche Bank | | Deutz AG | | 1 Month LIBOR BBA minus 1.25% | | | 7/20/2016 | | | | (84 | ) | | | 1,483 | |
Deutsche Bank | | Diploma PLC | | 1 Month LIBOR BBA minus 1.00% | | | 7/7/2016 | | | | (56 | ) | | | 4,699 | |
Citibank NA | | Dollar Tree Inc. | | 1 Month LIBOR BBA minus 0.35% | | | 6/24/2016 | | | | (136 | ) | | | 4,032 | |
Deutsche Bank | | easyJet PLC | | 1 Month LIBOR BBA plus 0.45% | | | 7/7/2016 | | | | 98 | | | | 3,701 | |
Deutsche Bank | | Fiat Chrysler Automobiles NV | | 1 Month LIBOR BBA plus 0.45% | | | 7/20/2016 | | | | 95 | | | | 7,311 | |
Deutsche Bank | | Gerresheimer AG | | 1 Month LIBOR BBA plus 0.45% | | | 7/20/2016 | | | | 88 | | | | 7,426 | |
Deutsche Bank | | Greggs PLC | | 1 Month LIBOR BBA plus 0.45% | | | 7/7/2016 | | | | 87 | | | | 5,900 | |
Deutsche Bank | | Gulf Keystone Petroleum, Ltd. | | 1 Month LIBOR BBA minus 25.00% | | | 7/7/2016 | | | | (33 | ) | | | 8,501 | |
Deutsche Bank | | Imagination Technologies Group PLC | | 1 Month LIBOR BBA minus 2.50% | | | 7/7/2016 | | | | (85 | ) | | | 1,582 | |
Deutsche Bank | | Kabel Deutschland Holding AG | | 1 Month LIBOR BBA minus 0.45% | | | 7/20/2016 | | | | (88 | ) | | | 3,090 | |
Deutsche Bank | | Koninklijke Vopak NV | | 1 Month LIBOR BBA minus 0.45% | | | 8/9/2016 | | | | (92 | ) | | | 3,171 | |
Deutsche Bank | | Ladbrokes PLC | | 1 Month LIBOR BBA minus 1.25% | | | 7/7/2016 | | | | (61 | ) | | | 360 | |
Deutsche Bank | | Lonmin PLC | | 1 Month LIBOR BBA minus 13.00% | | | 7/7/2016 | | | | (31 | ) | | | 63,489 | |
| | | | |
| 24 | | MainStay Absolute Return Multi-Strategy Fund | | The notes to the consolidated financial statements are an integral part of,
and should be read in conjunction with, the consolidated financial statements. |
| | | | | | | | | | | | | | | | |
Swap Counterparty | | Reference Obligation | | Rate (Paid)/Received by the Fund | | Termination
Date | | | Notional
Amount
(000)* | | | Unrealized
Appreciation | |
Deutsche Bank | | Lookers PLC | | 1 Month LIBOR BBA plus 0.45% | | | 7/7/2016 | | | $ | 75 | | | $ | 2,553 | |
Deutsche Bank | | Manz AG | | 1 Month LIBOR BBA minus 8.00% | | | 7/20/2016 | | | | (51 | ) | | | 28,000 | |
Deutsche Bank | | Mondi PLC | | 1 Month LIBOR BBA plus 0.45% | | | 7/7/2016 | | | | 96 | | | | 3,090 | |
Deutsche Bank | | Nanoco Group PLC | | 1 Month LIBOR BBA minus 10.00% | | | 7/7/2016 | | | | (15 | ) | | | 18,281 | |
Deutsche Bank | | NN Group NV | | 1 Month LIBOR BBA plus 0.45% | | | 8/9/2016 | | | | 81 | | | | 3,129 | |
Deutsche Bank | | Nordex SE | | 1 Month LIBOR BBA plus 0.45% | | | 7/20/2016 | | | | 87 | | | | 14,425 | |
Deutsche Bank | | Old Mutual PLC | | 1 Month LIBOR BBA plus 0.45% | | | 7/7/2016 | | | | 96 | | | | 2,287 | |
Deutsche Bank | | OneSavings Bank PLC | | 1 Month LIBOR BBA plus 0.45% | | | 7/7/2016 | | | | 84 | | | | 8,194 | |
Deutsche Bank | | Orange SA | | 1 Month LIBOR BBA plus 0.45% | | | 7/20/2016 | | | | 107 | | | | 5,902 | |
Deutsche Bank | | Oxford Instruments PLC | | 1 Month LIBOR BBA minus 1.00% | | | 7/7/2016 | | | | (44 | ) | | | 39,211 | |
Deutsche Bank | | Piaggio & C SpA | | 1 Month LIBOR BBA minus 2.25% | | | 7/20/2016 | | | | (7 | ) | | | 634 | |
Citibank NA | | PMC-Sierra Inc. | | 1 Month LIBOR BBA plus 0.35% | | | 6/24/2016 | | | | 715 | | | | 11,183 | |
Deutsche Bank | | Randgold Resources, Ltd. | | 1 Month LIBOR BBA minus 0.45% | | | 7/7/2016 | | | | (96 | ) | | | 2,043 | |
Deutsche Bank | | RCS MediaGroup SpA | | 1 Month LIBOR BBA minus 0.45% | | | 7/20/2016 | | | | (67 | ) | | | 30,816 | |
Deutsche Bank | | Redde PLC | | 1 Month LIBOR BBA plus 0.45% | | | 7/7/2016 | | | | 4 | | | | 801 | |
Deutsche Bank | | RIB Software AG | | 1 Month LIBOR BBA minus 1.25% | | | 7/20/2016 | | | | (62 | ) | | | 18,304 | |
Deutsche Bank | | Rio Tinto PLC | | 1 Month LIBOR BBA plus 0.45% | | | 7/7/2016 | | | | 89 | | | | 4,231 | |
Deutsche Bank | | Rotork PLC | | 1 Month LIBOR BBA minus 1.25% | | | 7/7/2016 | | | | (82 | ) | | | 2,198 | |
Citibank NA | | SABMiller PLC | | 1 Month LIBOR BBA plus 0.40% | | | 6/24/2016 | | | | 193 | | | | 19,692 | |
Citibank NA | | SanDisk Corp | | 1 Month LIBOR BBA plus 0.35% | | | 6/24/2016 | | | | 241 | | | | 2,334 | |
Deutsche Bank | | Serco Group PLC | | 1 Month LIBOR BBA minus 1.00% | | | 7/7/2016 | | | | (73 | ) | | | 20,920 | |
UBS AG | | Shire PLC | | 1 Month LIBOR BBA plus 0.40% | | | 6/24/2016 | | | | 125 | | | | 16,545 | |
Deutsche Bank | | SMA Solar Technology AG | | 1 Month LIBOR BBA plus 0.45% | | | 7/20/2016 | | | | 94 | | | | 6,460 | |
Deutsche Bank | | Sopra Steria Group | | 1 Month LIBOR BBA plus 0.45% | | | 7/20/2016 | | | | 57 | | | | 2,044 | |
Deutsche Bank | | Suedzucker AG | | 1 Month LIBOR BBA plus 0.45% | | | 7/20/2016 | | | | 27 | | | | 2,183 | |
Citibank NA | | Swatch Group AG | | 1 Month LIBOR BBA plus 0.40% | | | 6/24/2016 | | | | 135 | | | | 3,866 | |
Deutsche Bank | | Telecom Plus PLC | | 1 Month LIBOR BBA minus 3.50% | | | 7/7/2016 | | | | (53 | ) | | | 4,046 | |
Deutsche Bank | | Telit Communications PLC | | 1 Month LIBOR BBA minus 1.25% | | | 7/7/2016 | | | | (12 | ) | | | 4,661 | |
Deutsche Bank | | Tenaris SA | | 1 Month LIBOR BBA minus 0.45% | | | 7/20/2016 | | | | (88 | ) | | | 2,477 | |
Deutsche Bank | | Tesco PLC | | 1 Month LIBOR BBA minus 0.45% | | | 7/7/2016 | | | | (87 | ) | | | 9,586 | |
Deutsche Bank | | Thomas Cook Group PLC | | 1 Month LIBOR BBA minus 0.45% | | | 7/7/2016 | | | | (86 | ) | | | 7,396 | |
Deutsche Bank | | Vedanta Resources PLC | | 1 Month LIBOR BBA minus 20.00% | | | 7/7/2016 | | | | (40 | ) | | | 2,277 | |
Deutsche Bank | | Virbac SA | | 1 Month LIBOR BBA minus 1.25% | | | 7/20/2016 | | | | (18 | ) | | | 3,337 | |
Deutsche Bank | | Weir Group PLC | | 1 Month LIBOR BBA minus 0.45% | | | 7/7/2016 | | | | (71 | ) | | | 39,411 | |
Deutsche Bank | | Zodiac Aerospace | | 1 Month LIBOR BBA minus 0.45% | | | 7/20/2016 | | | | (95 | ) | | | 14,714 | |
| | | | | | | | | | | $ | 1,382 | | | $ | 591,154 | |
| | | | | | |
The notes to the consolidated financial statements are an integral part of,
and should be read in conjunction with, the consolidated financial statements. | | | | | 25 | |
Consolidated Portfolio of Investments October 31, 2015 (Unaudited) (continued)
| | | | | | | | | | | | | | | | |
Swap Counterparty | | Reference Obligation | | Rate (Paid)/Received by the Fund | | Termination
Date | | | Notional
Amount
(000)* | | | Unrealized
Depreciation | |
UBS AG | | adidas AG | | 1 Month LIBOR BBA minus 0.45% | | | 6/24/2016 | | | $ | (80 | ) | | $ | (10,627 | ) |
Deutsche Bank | | Aegon NV | | 1 Month LIBOR BBA plus 0.45% | | | 8/9/2016 | | | | 78 | | | | (1,822 | ) |
Deutsche Bank | | Air France-KLM | | 1 Month LIBOR BBA minus 7.50% | | | 7/20/2016 | | | | (90 | ) | | | (1,283 | ) |
Citibank NA | | Air France-KLM | | 1 Month EURIBOR minus 12.50% | | | 12/6/2016 | | | | (61 | ) | | | (7,450 | ) |
Deutsche Bank | | AIXTRON SE | | 1 Month LIBOR BBA minus 3.00% | | | 7/20/2016 | | | | (88 | ) | | | (9,123 | ) |
Deutsche Bank | | Alent PLC | | 1 Month LIBOR BBA minus 1.25% | | | 7/7/2016 | | | | (84 | ) | | | (5,101 | ) |
Citibank NA | | Anheuser-Busch InBev SA/NV | | 1 Month EURIBOR minus 0.40% | | | 12/6/2016 | | | | (177 | ) | | | (24,123 | ) |
Deutsche Bank | | AO World PLC | | 1 Month LIBOR BBA minus 6.00% | | | 7/7/2016 | | | | (81 | ) | | | (16,421 | ) |
Deutsche Bank | | Associated British Foods PLC | | 1 Month LIBOR BBA minus 0.45% | | | 7/7/2016 | | | | (96 | ) | | | (9,151 | ) |
Deutsche Bank | | Astaldi SpA | | 1 Month LIBOR BBA plus 0.45% | | | 7/20/2016 | | | | 69 | | | | (13,799 | ) |
Deutsche Bank | | ASTM SpA | | 1 Month LIBOR BBA plus 0.45% | | | 7/20/2016 | | | | 34 | | | | (441 | ) |
Deutsche Bank | | Barratt Developments PLC | | 1 Month LIBOR BBA plus 0.45% | | | 7/7/2016 | | | | 69 | | | | (3,306 | ) |
Citibank NA | | Barrick Gold Corp | | 1 Month LIBOR BBA minus 0.35% | | | 6/24/2016 | | | | (121 | ) | | | (23,651 | ) |
UBS AG | | BASF SE | | 1 Month LIBOR BBA minus 0.45% | | | 6/24/2016 | | | | (139 | ) | | | (16,685 | ) |
Deutsche Bank | | Beiersdorf AG | | 1 Month LIBOR BBA minus 0.45% | | | 7/20/2016 | | | | (99 | ) | | | (1,567 | ) |
Deutsche Bank | | Biesse SpA | | 1 Month LIBOR BBA plus 0.45% | | | 7/20/2016 | | | | 86 | | | | (4,275 | ) |
Deutsche Bank | | BinckBank NV | | 1 Month LIBOR BBA plus 0.45% | | | 8/9/2016 | | | | 86 | | | | (7,785 | ) |
Deutsche Bank | | BNP Paribas SA | | 1 Month LIBOR BBA plus 0.45% | | | 7/20/2016 | | | | 94 | | | | (572 | ) |
Deutsche Bank | | Bouygues SA | | 1 Month LIBOR BBA plus 0.45% | | | 7/20/2016 | | | | 2 | | | | (28 | ) |
Deutsche Bank | | Brunel International NV | | 1 Month LIBOR BBA minus 1.25% | | | 8/9/2016 | | | | (76 | ) | | | (9,421 | ) |
Deutsche Bank | | BTG PLC | | 1 Month LIBOR BBA minus 0.45% | | | 7/7/2016 | | | | (21 | ) | | | (211 | ) |
UBS AG | | Buzzi Unicem SpA | | 1 Month LIBOR BBA minus 0.45% | | | 6/24/2016 | | | | (84 | ) | | | (3,268 | ) |
Deutsche Bank | | Cairn Energy PLC | | 1 Month LIBOR BBA plus 0.45% | | | 7/7/2016 | | | | 52 | | | | (4,035 | ) |
UBS AG | | Casino Guichard Perrachon SA | | 1 Month LIBOR BBA minus 0.45% | | | 6/24/2016 | | | | (74 | ) | | | (6,853 | ) |
Citibank NA | | CNH Industrial NV | | 1 Month EURIBOR minus 0.40% | | | 12/6/2016 | | | | (20 | ) | | | (1,309 | ) |
UBS AG | | Comcast Corp | | US Federal Funds Rate minus 0.40% | | | 6/24/2016 | | | | (307 | ) | | | (25,612 | ) |
Deutsche Bank | | Credit Agricole SA | | 1 Month LIBOR BBA plus 0.45% | | | 7/20/2016 | | | | 94 | | | | (18,765 | ) |
UBS AG | | Danieli & C Officine Meccaniche SpA | | 1 Month LIBOR BBA minus 0.45% | | | 6/24/2016 | | | | (58 | ) | | | (5,808 | ) |
Deutsche Bank | | Deutsche Beteiligungs AG | | 1 Month LIBOR BBA plus 0.45% | | | 7/20/2016 | | | | 23 | | | | (2,790 | ) |
Deutsche Bank | | Deutsche Lufthansa AG | | 1 Month LIBOR BBA plus 0.45% | | | 7/20/2016 | | | | 94 | | | | (3,704 | ) |
Citibank NA | | Deutsche Lufthansa AG | | 1 Month EURIBOR minus 0.40% | | | 12/6/2016 | | | | (65 | ) | | | (6,634 | ) |
Citibank NA | | Fiat Chrysler Automobiles NV | | 1 Month EURIBOR minus 0.40% | | | 12/6/2016 | | | | (37 | ) | | | (4,681 | ) |
Deutsche Bank | | Fresnillo PLC | | 1 Month LIBOR BBA minus 0.45% | | | 7/7/2016 | | | | (45 | ) | | | (3,311 | ) |
Deutsche Bank | | Hargreaves Lansdown PLC | | 1 Month LIBOR BBA minus 0.45% | | | 7/7/2016 | | | | (106 | ) | | | (16,026 | ) |
Deutsche Bank | | Heidelberger Druckmaschinen AG | | 1 Month LIBOR BBA minus 2.50% | | | 7/20/2016 | | | | (4 | ) | | | (433 | ) |
Citibank NA | | Henkel AG & Co KGaA | | 1 Month EURIBOR minus 0.40% | | | 12/6/2016 | | | | (182 | ) | | | (15,825 | ) |
Deutsche Bank | | Home Retail Group PLC | | 1 Month LIBOR BBA plus 0.45% | | | 7/7/2016 | | | | 46 | | | | (21,922 | ) |
Deutsche Bank | | Iliad SA | | 1 Month LIBOR BBA minus 0.45% | | | 7/20/2016 | | | | (96 | ) | | | (2,626 | ) |
| | | | |
| 26 | | MainStay Absolute Return Multi-Strategy Fund | | The notes to the consolidated financial statements are an integral part of,
and should be read in conjunction with, the consolidated financial statements. |
| | | | | | | | | | | | | | | | |
Swap Counterparty | | Reference Obligation | | Rate (Paid)/Received by the Fund | | Termination
Date | | | Notional
Amount
(000)* | | | Unrealized
Depreciation | |
Deutsche Bank | | IPSOS | | 1 Month LIBOR BBA plus 0.45% | | | 7/20/2016 | | | $ | 60 | | | $ | (6,672 | ) |
Citibank NA | | iShares Nasdaq Biotechnology ETF | | 1 Month LIBOR BBA minus 1.25% | | | 6/24/2016 | | | | (162 | ) | | | (10,350 | ) |
Deutsche Bank | | John Menzies PLC | | 1 Month LIBOR BBA plus 0.45% | | | 7/7/2016 | | | | 21 | | | | (5,270 | ) |
Deutsche Bank | | K+S AG | | 1 Month LIBOR BBA plus 0.45% | | | 7/20/2016 | | | | 89 | | | | (41,540 | ) |
Deutsche Bank | | Keller Group PLC | | 1 Month LIBOR BBA plus 0.45% | | | 7/7/2016 | | | | 54 | | | | (10,388 | ) |
Deutsche Bank | | La Doria SpA | | 1 Month LIBOR BBA plus 0.45% | | | 7/20/2016 | | | | 76 | | | | (6,285 | ) |
Deutsche Bank | | Mediobanca SpA | | 1 Month LIBOR BBA plus 0.45% | | | 7/20/2016 | | | | 90 | | | | (4,763 | ) |
Deutsche Bank | | Melrose Industries PLC | | 1 Month LIBOR BBA minus 0.45% | | | 7/7/2016 | | | | (91 | ) | | | (1,769 | ) |
UBS AG | | Merck KGaA | | 1 Month LIBOR BBA minus 0.45% | | | 6/24/2016 | | | | (91 | ) | | | (12,679 | ) |
Deutsche Bank | | Neopost SA | | 1 Month LIBOR BBA plus 0.45% | | | 7/20/2016 | | | | 81 | | | | (11,286 | ) |
Deutsche Bank | | Ocado Group PLC | | 1 Month LIBOR BBA minus 1.25% | | | 7/7/2016 | | | | (88 | ) | | | (8,544 | ) |
UBS AG | | Orange SA | | 1 Month LIBOR BBA minus 0.45% | | | 6/24/2016 | | | | (248 | ) | | | (48,393 | ) |
Deutsche Bank | | Pernod Ricard SA | | 1 Month LIBOR BBA minus 0.45% | | | 7/20/2016 | | | | (103 | ) | | | (13,955 | ) |
Deutsche Bank | | Persimmon PLC | | 1 Month LIBOR BBA plus 0.45% | | | 7/7/2016 | | | | 9 | | | | (31 | ) |
Deutsche Bank | | Peugeot SA | | 1 Month LIBOR BBA plus 0.45% | | | 7/20/2016 | | | | 97 | | | | (7,730 | ) |
Deutsche Bank | | Rallye SA | | 1 Month LIBOR BBA plus 0.45% | | | 7/20/2016 | | | | 11 | | | | (1,282 | ) |
Deutsche Bank | | Remy Cointreau SA | | 1 Month LIBOR BBA minus 0.45% | | | 7/20/2016 | | | | (98 | ) | | | (3,235 | ) |
Deutsche Bank | | Renault SA | | 1 Month LIBOR BBA plus 0.45% | | | 7/20/2016 | | | | 106 | | | | (3,490 | ) |
Deutsche Bank | | Rheinmetall AG | | 1 Month LIBOR BBA plus 0.45% | | | 7/20/2016 | | | | 15 | | | | (306 | ) |
Deutsche Bank | | Royal Dutch Shell PLC | | 1 Month LIBOR BBA plus 0.45% | | | 7/7/2016 | | | | 65 | | | | (3,277 | ) |
Deutsche Bank | | Royal Mail PLC | | 1 Month LIBOR BBA plus 0.45% | | | 7/7/2016 | | | | 8 | | | | (363 | ) |
Deutsche Bank | | Salini Impregilo SpA | | 1 Month LIBOR BBA plus 0.45% | | | 7/20/2016 | | | | 84 | | | | (2,099 | ) |
Deutsche Bank | | Salvatore Ferragamo SpA | | 1 Month LIBOR BBA minus 0.45% | | | 7/20/2016 | | | | (77 | ) | | | (4,722 | ) |
Deutsche Bank | | Saras SpA | | 1 Month LIBOR BBA plus 0.45% | | | 7/20/2016 | | | | 79 | | | | (12,561 | ) |
Deutsche Bank | | SGL Carbon SE | | 1 Month LIBOR BBA minus 9.00% | | | 7/20/2016 | | | | (73 | ) | | | (1,788 | ) |
Deutsche Bank | | Societe Generale SA | | 1 Month LIBOR BBA plus 0.45% | | | 7/20/2016 | | | | 93 | | | | (6,655 | ) |
Deutsche Bank | | STMicroelectronics NV | | 1 Month LIBOR BBA plus 0.45% | | | 7/20/2016 | | | | 91 | | | | (6,361 | ) |
Citibank NA | | Swatch Group AG | | 1 Month LIBOR BBA minus 0.40% | | | 6/24/2016 | | | | (144 | ) | | | (10,144 | ) |
Deutsche Bank | | Technicolor SA | | 1 Month LIBOR BBA plus 0.45% | | | 7/20/2016 | | | | 78 | | | | (11,054 | ) |
UBS AG | | T-Mobile US Inc. | | 1 Month LIBOR BBA plus 0.35% | | | 6/24/2016 | | | | 28 | | | | (1,658 | ) |
UBS AG | | Total SA | | 1 Month LIBOR BBA minus 0.45% | | | 6/24/2016 | | | | (81 | ) | | | (9,019 | ) |
Citibank NA | | Valeant Pharmaceuticals International Inc. | | 1 Month LIBOR BBA minus 0.35% | | | 6/24/2016 | | | | (52 | ) | | | (112 | ) |
Deutsche Bank | | Yoox Net-A-Porter Group SpA | | 1 Month LIBOR BBA minus 1.25% | | | 7/20/2016 | | | | (84 | ) | | | (3,066 | ) |
| | | | | | | | | | | $ | (1,621 | ) | | $ | (581,291 | ) |
| | | | | | |
The notes to the consolidated financial statements are an integral part of,
and should be read in conjunction with, the consolidated financial statements. | | | | | 27 | |
Consolidated Portfolio of Investments October 31, 2015 (Unaudited) (continued)
Open OTC total return basket swap contracts as of October 31, 2015 were as follows:
| | | | | | | | | | | | | | | | |
Swap
Counterparty | | Reference Obligation | | Rate (Paid)/Received by
the Fund | | Termination
Date | | | Notional
Amount
(000)* | | | Unrealized
Depreciation | |
Credit Suisse | | Credit Suisse Backwardation Long/Short Excess Return Index ** | | 1 Month LIBOR BBA plus 0.60% | | | 5/31/2016 | | | $ | 1,256 | | | $ | (761 | ) |
Credit Suisse | | Credit Suisse Custom 24A Excess Return Index ** | | 1 Month LIBOR BBA plus 1.50% | | | 5/31/2016 | | | | 1,546 | | | | (3,391 | ) |
Credit Suisse | | Credit Suisse Custom 88 Enhanced Excess Return Index ** | | 1 Month LIBOR BBA plus 0.60% | | | 5/31/2016 | | | | 2,236 | | | | (1,161 | ) |
Credit Suisse | | Credit Suisse Dividend Alpha ER Index | | 1 Month LIBOR BBA plus 0.60% | | | 5/31/2016 | | | | 1,598 | | | | (72,466 | ) |
Credit Suisse | | Credit Suisse GAINS 01E Long Short Excess Return Index ** | | 1 Month LIBOR BBA plus 1.25% | | | 5/31/2016 | | | | 1,489 | | | | (1,666 | ) |
Societe Generale | | SGI BOSS 3% Index | | 1 Month LIBOR BBA plus 0.60% | | | 6/3/2016 | | | | 2,036 | | | | (68 | ) |
Societe Generale | | SGI FX Smile Premium G4 Index | | 1 Month LIBOR BBA plus 0.60% | | | 6/3/2016 | | | | 1,982 | | | | (66 | ) |
Societe Generale | | SGI Smart Market Neutral Commodity 2 Index ** | | 1 Month LIBOR BBA plus 0.60% | | | 6/3/2016 | | | | 2,009 | | | | (66 | ) |
Societe Generale | | SGI US Gravity Index | | 1 Month LIBOR BBA plus 0.60% | | | 6/3/2016 | | | | 1,522 | | | | (52 | ) |
| | | | | | | | | | | $ | 15,674 | | | $ | (79,697 | ) |
Open OTC total return managed futures swap contract as of October 31, 2015 was as follows:
| | | | | | | | |
Swap Counterparty | | Reference Obligation | | Description | | Unrealized
Depreciation | |
Societe Generale Newedge UK Limited | | Candriam IG Diversified Futures Index ** | | Total return swap with Societe Generale Newedge UK Limited (“SG Newedge UK”). The swap provides exposure to the total returns of the Candriam Alternative Return Systemat program, calculated on a daily basis by NAV Consulting, Inc. with a reference to a managed account owned by SG Newedge UK, a company formed under the laws of England. (Notional Amount $19,826,088)*** | | $ | (289,699 | ) |
The summaries below provide a breakdown of the futures contracts comprising the index components of the above total return managed futures swap as of October 31, 2015:
| | | | |
Category | | % Breakdown | |
| Financials | | | 118.15% | |
| Energy | | | –3.03 | |
| Foreign Currency | | | –3.39 | |
| Agriculture | | | –3.39 | |
| Equity Index | | | –3.85 | |
| Metals | | | –4.49 | |
| Total | | | 100.00% | |
| | | | | | | | |
Future Ticker | | Description | | Sector | | Notional
Amount
(000)* | |
ADZ5 | | Australian Dollar CME Dec15 | | Foreign Currency | | $ | (1,637 | ) |
BPZ5 | | British Pound CME Dec15 | | Foreign Currency | | | 4,145 | |
C Z5 | | Corn Dec15 | | Agricultural | | | (726 | ) |
CDZ5 | | Canadian Dollar CME Dec15 | | Foreign Currency | | | (1,223 | ) |
CFX5 | | CAC Index Nov15 | | Equity Index | | | 269 | |
CLZ5 | | Crude Oil Dec15 | | Energy | | | (1,072 | ) |
COZ5 | | Brent Oil Dec15 | | Energy | | | (843 | ) |
CTZ5 | | Cotton Dec15 | | Agricultural | | | (1,805 | ) |
DMZ5 | | Mini Dow Dec15 | | Equity Index | | | 880 | |
ECZ5 | | EUR/USD CME Dec15 | | Foreign Currency | | | (688 | ) |
| | | | |
| 28 | | MainStay Absolute Return Multi-Strategy Fund | | The notes to the consolidated financial statements are an integral part of,
and should be read in conjunction with, the consolidated financial statements. |
| | | | | | | | |
Future Ticker | | Description | | Sector | | Notional
Amount
(000)* | |
EDM8 | | Eurodollars Jun18 | | Financials | | $ | 55,994 | |
ESZ5 | | EMINI S&P Dec15 | | Equity Index | | | (2,903 | ) |
FVZ5 | | 5 Yr T-Note Dec15 | | Financials | | | (3,473 | ) |
GCZ5 | | Gold CMX Dec15 | | Metals | | | (2,397 | ) |
HGZ5 | | High Grade Copper Dec15 | | Metals | | | (579 | ) |
HIX5 | | Hang Seng Index Nov15 | | Equity Index | | | (878 | ) |
IKZ5 | | Euro BTP Futures Dec15 | | Financials | | | 5,047 | |
JBZ5 | | Japan Govt Bond Tiffe Dec15 | | Financials | | | 33,254 | |
JYZ5 | | Japanese Yen CME Dec15 | | Foreign Currency | | | 207 | |
KEZ5 | | Korean Bond Dec15 | | Financials | | | 20,671 | |
L M8 | | Short Sterling Jun18 | | Financials | | | 57,925 | |
LAZ5 | | Aluminum LME 12/16/2015 | | Metals | | | (1,502 | ) |
LCZ5 | | Live Cattle Dec15 | | Agricultural | | | (1,644 | ) |
LXZ5 | | Zinc LME 12/16/2015 | | Metals | | | (1,148 | ) |
NGZ5 | | Natural Gas Dec15 | | Energy | | | (1,601 | ) |
NIZ5 | | Nikkei Index Dec15 | | Equity Index | | | (790 | ) |
NQZ5 | | Emini Nasdaq Dec15 | | Equity Index | | | (279 | ) |
NVZ5 | | New Zealand Dollar CME Dec15 | | Foreign Currency | | | (945 | ) |
OATZ | | Euro Oat Futures Dec15 | | Financials | | | 2,867 | |
PEZ5 | | Mexican Peso CME Dec15 | | Foreign Currency | | | (2,235 | ) |
RAZ5 | | South African Rand CME Dec15 | | Foreign Currency | | | (1,004 | ) |
RTAZ | | E Mini Russell Dec15 | | Equity Index | | | (463 | ) |
RXZ5 | | Euro Bund Dec15 | | Financials | | | 2,249 | |
RYZ5 | | EUR/JPY CME Dec15 | | Foreign Currency | | | (1,514 | ) |
S F6 | | Soybeans Jan16 | | Agricultural | | | (2,347 | ) |
SBH6 | | Sugar NY Mar16 | | Agricultural | | | 992 | |
SIZ5 | | Silver CMX Dec15 | | Metals | | | (856 | ) |
TPZ5 | | Topix Index Dec15 | | Equity Index | | | 388 | |
TYZ5 | | US 10 Yr Notes Dec15 | | Financials | | | (2,171 | ) |
USZ5 | | US Treasury Bond Dec15 | | Financials | | | (1,721 | ) |
UXX5 | | CFE VIX Nov15 | | Equity Index | | | (100 | ) |
VGZ5 | | Euro Stoxx50 Dec15 | | Equity Index | | | (75 | ) |
W Z5 | | Wheat Dec15 | | Agricultural | | | 626 | |
XBZ5 | | Gasoline Blendstock Dec15 | | Energy | | | (864 | ) |
XPZ5 | | SFE SPI 200 Dec15 | | Equity Index | | | (1,215 | ) |
Z Z5 | | FTSE Index Dec15 | | Equity Index | | | (390 | ) |
| * | Notional amounts reflected as a positive value indicate a long position held by the Fund or Index and a negative value indicates a short position. |
| ** | The total return swap is held in the MainStay Multi-Strategy Cayman Fund Ltd., which is a wholly-owned subsidiary of the MainStay Absolute Return Multi-Strategy Fund. |
| | | | | | |
The notes to the consolidated financial statements are an integral part of,
and should be read in conjunction with, the consolidated financial statements. | | | | | 29 | |
Consolidated Portfolio of Investments October 31, 2015 (Unaudited) (continued)
| *** | The investment portfolio of the managed account is comprised at any given time of trading positions selected by Candriam France S.A.S. that include exchange traded futures in relation to any commodity, currency, interest rate, bond or equity index traded on certain exchanges. Under the terms of the swap, the advisor has the ability to periodically adjust the notional level of the swap. The swap was effective on June 24, 2015 and has an open ended term unless terminated by one of the parties. In addition, the terms of the swap provide for a payment to the SG Newedge UK based upon 0.4% per annum accrued on the full notional level of the swap, plus a floating rate (based on LIBOR and Fed Funds) accrued on 15% of the notional of the swap. |
The following abbreviations are used in the preceding pages:
ADR—American Depositary Receipt
BTP—Buoni del Tesoro Poliennali
CAC—Cotation Assistée en Continu
CAD—Canadian Dollar
CFE—CBOE Futures Exchange
CME—Chicago Mercantile Exchange
CMX—Commodities Exchange
ETF—Exchange-Traded Fund
EUR—Euro
FTSE—Financial Times Stock Exchange
GBP—British Pound Sterling
JPY—Japanese Yen
LME—London Metal Exchange
SPDR—Standard & Poor’s Depositary Receipt
VIX—CBOE Volatility Index
The following is a summary of the fair valuations according to the inputs used as of October 31, 2015, for valuing the Fund’s assets and liabilities.
Asset Valuation Inputs
| | | | | | | | | | | | | | | | |
Description | | Quoted Prices in Active Markets for Identical Assets (Level 1) | | | Significant Other Observable Inputs (Level 2) | | | Significant Unobservable Inputs (Level 3) | | | Total | |
| Investments in Securities (a) | | | | | | | | | | | | | | | | |
| Corporate Bonds | | $ | — | | | $ | 15,036,380 | | | $ | — | | | $ | 15,036,380 | |
| Common Stocks | | | 33,834,473 | | | | — | | | | — | | | | 33,834,473 | |
| Purchased Call Option | | | 17,814 | | | | — | | | | — | | | | 17,814 | |
| Purchased Put Option | | | 734 | | | | — | | | | — | | | | 734 | |
| Short-Term Investments | | | | | | | | | | | | | | | | |
Repurchase Agreements | | | — | | | | 37,039,958 | | | | — | | | | 37,039,958 | |
U.S. Government | | | — | | | | 8,642,070 | | | | — | | | | 8,642,070 | |
| | | | | | | | | | | | | | | | |
| Total Short-Term Investments | | | — | | | | 45,682,028 | | | | — | | | | 45,682,028 | |
| | | | | | | | | | | | | | | | |
| Total Investments in Securities | | | 33,853,021 | | | | 60,718,408 | | | | — | | | | 94,571,429 | |
| | | | | | | | | | | | | | | | |
Other Financial Instruments | | | | | | | | | | | | | | | | |
Credit Default Swap Contracts (b) | | | — | | | | 32,645 | | | | — | | | | 32,645 | |
Foreign Currency Forward Contracts (b) | | | — | | | | 407,341 | | | | — | | | | 407,341 | |
Interest Rate Swap Contracts (b) | | | — | | | | 67,761 | | | | — | | | | 67,761 | |
Total Return Equity Swap Contracts (b) | | | — | | | | 591,154 | | | | — | | | | 591,154 | |
| | | | | | | | | | | | | | | | |
| Total Other Financial Instruments | | | — | | | | 1,098,901 | | | | — | | | | 1,098,901 | |
| | | | | | | | | | | | | | | | |
| Total Investments in Securities and Other Financial Instruments | | $ | 33,853,021 | | | $ | 61,817,309 | | | $ | — | | | $ | 95,670,330 | |
| | | | | | | | | | | | | | | | |
| | | | |
| 30 | | MainStay Absolute Return Multi-Strategy Fund | | The notes to the consolidated financial statements are an integral part of,
and should be read in conjunction with, the consolidated financial statements. |
Liability Valuation Inputs
| | | | | | | | | | | | | | | | |
Description | | Quoted Prices in Active Markets for Identical Assets (Level 1) | | | Significant Other Observable Inputs (Level 2) | | | Significant Unobservable Inputs (Level 3) | | | Total | |
| Investments in Securities Sold Short (a) | | | | | | | | | | | | | | | | |
| Common Stocks Sold Short | | $ | (15,706,370 | ) | | $ | — | | | $ | — | | | $ | (15,706,370 | ) |
| Exchange-Traded Funds Sold Short | | | (4,125,995 | ) | | | — | | | | — | | | | (4,125,995 | ) |
| | | | | | | | | | | | | | | | |
| Total Investments in Securities Sold Short | | | (19,832,365 | ) | | | — | | | | — | | | | (19,832,365 | ) |
| | | | | | | | | | | | | | | | |
Other Financial Instruments | |
Credit Default Swap Contracts (b) | | | — | | | | (78,420 | ) | | | — | | | | (78,420 | ) |
Foreign Currency Forward Contracts (b) | | | — | | | | (9,613 | ) | | | — | | | | (9,613 | ) |
Futures Contracts Short (b) | | | (44,196 | ) | | | — | | | | — | | | | (44,196 | ) |
Interest Rate Swap Contracts (b) | | | — | | | | (20,072 | ) | | | — | | | | (20,072 | ) |
Total Return Basket Swap Contracts (b) | | | — | | | | (79,697 | ) | | | — | | | | (79,697 | ) |
Total Return Equity Swap Contracts (b) | | | — | | | | (581,291 | ) | | | — | | | | (581,291 | ) |
Total Return Managed Futures Swap Contract (b) | | | — | | | | (289,699 | ) | | | — | | | | (289,699 | ) |
Written Option (b) | | | (734 | ) | | | — | | | | — | | | | (734 | ) |
| | | | | | | | | | | | | | | | |
| Total Other Financial Instruments | | | (44,930 | ) | | | (1,058,792 | ) | | | — | | | | (1,103,772 | ) |
| | | | | | | | | | | | | | | | |
| Total Investments in Securities Sold Short and Other Financial Instruments | | $ | (19,877,295 | ) | | $ | (1,058,792 | ) | | $ | — | | | $ | (20,936,087 | ) |
| | | | | | | | | | | | | | | | |
| (a) | For a complete listing of investments and their industries, see the Consolidated Portfolio of Investments. |
| (b) | The value listed for these securities reflects unrealized appreciation (depreciation) as shown on the Consolidated Portfolio of Investments. |
The Fund recognizes transfers between the levels as of the beginning of the period.
For the period ended October 31, 2015, the Fund did not have any transfers between Level 1 and Level 2 fair value measurements. (See Note 2)
As of October 31, 2015, the Fund did not hold any investments with significant unobservable inputs (Level 3). (See Note 2)
| | | | | | |
The notes to the consolidated financial statements are an integral part of,
and should be read in conjunction with, the consolidated financial statements. | | | | | 31 | |
Consolidated Statement of Assets and Liabilities as of October 31, 2015 (Unaudited)
| | | | |
| Assets | |
Investment in securities before investments sold short, at value (identified cost $61,014,592) | | $ | 57,531,471 | |
Repurchase agreements, at value (identified cost $37,039,958) | | | 37,039,958 | |
Cash collateral on deposit at broker | | | 24,589,590 | |
Cash denominated in foreign currencies (identified cost $973,121) | | | 974,882 | |
Receivables: | | | | |
Investment securities sold | | | 555,370 | |
Dividends and interest | | | 386,285 | |
Variation margin on futures contracts | | | 30,342 | |
Other assets | | | 150,829 | |
Unrealized appreciation on foreign currency forward contracts | | | 407,341 | |
Variation margin on centrally cleared swaps | | | 112,571 | |
Unrealized appreciation on OTC swap contracts | | | 597,955 | |
| | | | |
Total assets | | | 122,376,594 | |
| | | | |
| |
| Liabilities | | | | |
Investments sold short (proceeds $22,696,868) | | | 19,832,365 | |
Due to custodian | | | 69,839 | |
Written option, at value (premiums received $701) | | | 734 | |
Payables: | | | | |
Investment securities purchased | | | 245,398 | |
Custodian | | | 120,765 | |
Offering costs | | | 118,249 | |
Fund shares redeemed | | | 54,540 | |
Professional fees | | | 54,342 | |
Premiums received for OTC swap contracts | | | 43,539 | |
Manager (See Note 3) | | | 11,747 | |
Shareholder communication | | | 10,307 | |
Transfer agent (See Note 3) | | | 7,533 | |
Dividends on investments sold short | | | 2,614 | |
NYLIFE Distributors (See Note 3) | | | 445 | |
Accrued expenses | | | 7,258 | |
Interest expense and fees payable | | | 4,809 | |
Unrealized depreciation on foreign currency forward contracts | | | 9,613 | |
Unrealized depreciation on OTC swap contracts | | | 955,148 | |
| | | | |
Total liabilities | | | 21,549,245 | |
| | | | |
Net assets | | $ | 100,827,349 | |
| | | | |
| | | | |
| Composition of Net Assets | | | | |
Shares of beneficial interest outstanding (par value of $.001 per share) unlimited number of shares authorized | | $ | 10,109 | |
Additional paid-in capital | | | 101,097,270 | |
| | | | |
| | | 101,107,379 | |
Net investment loss | | | (216,240 | ) |
Accumulated net realized gain (loss) on investments, investments sold short, futures transactions, written options, swap transactions and foreign currency transactions | | | 562,339 | |
Net unrealized appreciation (depreciation) on investments, swap contracts, futures contracts and written options | | | (3,884,969 | ) |
Net unrealized appreciation (depreciation) on investments sold short | | | 2,864,503 | |
Net unrealized appreciation (depreciation) on translation of other assets and liabilities in foreign currencies and foreign currency forward contracts | | | 394,337 | |
| | | | |
Net assets | | $ | 100,827,349 | |
| | | | |
Class A | | | | |
Net assets applicable to outstanding shares | | $ | 1,080,597 | |
| | | | |
Shares of beneficial interest outstanding | | | 108,292 | |
| | | | |
Net asset value per share outstanding | | $ | 9.98 | |
Maximum sales charge (5.50% of offering price) | | | 0.58 | |
| | | | |
Maximum offering price per share outstanding | | $ | 10.56 | |
| | | | |
Investor Class | | | | |
Net assets applicable to outstanding shares | | $ | 52,580 | |
| | | | |
Shares of beneficial interest outstanding | | | 5,278 | |
| | | | |
Net asset value per share outstanding | | $ | 9.96 | |
Maximum sales charge (5.50% of offering price) | | | 0.58 | |
| | | | |
Maximum offering price per share outstanding | | $ | 10.54 | |
| | | | |
Class C | | | | |
Net assets applicable to outstanding shares | | $ | 30,282 | |
| | | | |
Shares of beneficial interest outstanding | | | 3,049 | |
| | | | |
Net asset value and offering price per share outstanding | | $ | 9.93 | |
| | | | |
Class I | | | | |
Net assets applicable to outstanding shares | | $ | 99,663,890 | |
| | | | |
Shares of beneficial interest outstanding | | | 9,992,500 | |
| | | | |
Net asset value and offering price per share outstanding | | $ | 9.97 | |
| | | | |
| | | | |
| 32 | | MainStay Absolute Return Multi-Strategy Fund | | The notes to the consolidated financial statements are an integral part of,
and should be read in conjunction with, the consolidated financial statements. |
Consolidated Statement of Operations
for the period June 18, 2015 (inception date) through October 31, 2015 (Unaudited)
| | | | |
| Investment Income (Loss) | |
Income | | | | |
Dividends | | $ | 333,263 | |
Interest | | | 288,691 | |
| | | | |
Total income | | | 621,954 | |
| | | | |
Expenses | | | | |
Manager (See Note 3) | | | 533,488 | |
Broker fees and charges on short sales | | | 163,464 | |
Custodian | | | 115,192 | |
Offering (See Note 2) | | | 101,309 | |
Dividends on investments sold short | | | 88,063 | |
Professional fees | | | 71,273 | |
Shareholder communication | | | 13,935 | |
Transfer agent (See Note 3) | | | 7,956 | |
Shareholder service (See Note 3) | | | 5,573 | |
Registration | | | 3,271 | |
Distribution/Service—Class A (See Note 3) | | | 1,211 | |
Distribution/Service—Investor Class (See Note 3) | | | 45 | |
Distribution/Service—Class C (See Note 3) | | | 108 | |
Trustees | | | 828 | |
Interest expense | | | 284 | |
Miscellaneous | | | 7,484 | |
| | | | |
Total expenses before waiver/reimbursement | | | 1,113,484 | |
Expense waiver/reimbursement from Manager (See Note 3) | | | (275,290 | ) |
| | | | |
Net expenses | | | 838,194 | |
| | | | |
Net investment income (loss) | | | (216,240 | ) |
| | | | |
|
| Realized and Unrealized Gain (Loss) on Investments, Futures Contracts, Swap Contracts, Written Options and Foreign Currency Transactions | |
Net realized gain (loss) on: | | | | |
Investment transactions | | | (1,564,602 | ) |
Investments sold short | | | 1,514,800 | |
Futures transactions | | | (538 | ) |
Swap transactions | | | 802,427 | |
Written option transactions | | | 15,222 | |
Foreign currency transactions | | | (204,970 | ) |
| | | | |
Net realized gain (loss) on investments, investments sold short, futures transactions, swap transactions, written option transactions and foreign currency transactions | | | 562,339 | |
| | | | |
Net change in unrealized appreciation (depreciation) on: | | | | |
Investments | | | (3,483,121 | ) |
Investments sold short | | | 2,864,503 | |
Futures contracts | | | (44,196 | ) |
Swap contracts | | | (357,619 | ) |
Written option contracts | | | (33 | ) |
Translation of other assets and liabilities in foreign currencies and foreign currency forward contracts | | | 394,337 | |
| | | | |
Net change in unrealized appreciation (depreciation) on investments, investments sold short, futures contracts, swap contracts, written options and foreign currency transactions | | | (626,129 | ) |
| | | | |
Net realized and unrealized gain (loss) on investments, investments sold short, futures transactions, written options, swap transactions and foreign currency transactions | | | (63,790 | ) |
| | | | |
Net increase (decrease) in net assets resulting from operations | | $ | (280,030 | ) |
| | | | |
| | | | | | |
The notes to the consolidated financial statements are an integral part of,
and should be read in conjunction with, the consolidated financial statements. | | | | | 33 | |
Consolidated Statement of Changes in Net Assets
for the period June 18, 2015 (inception date) through October 31, 2015 (Unaudited)
| | | | |
| | | 2015 | |
| Increase (Decrease) in Net Assets | |
Operations: | | | | |
Net investment income (loss) | | $ | (216,240 | ) |
Net realized gain (loss) on investments, investments sold short, futures transactions, written option transactions, swap transactions and foreign currency transactions | | | 562,339 | |
Net change in unrealized appreciation (depreciation) on investments, investments sold short, futures contracts, written options, swap contracts and foreign currency transactions | | | (626,129 | ) |
| | | | |
Net increase (decrease) in net assets resulting from operations | | | (280,030 | ) |
| | | | |
Capital share transactions: | | | | |
Net proceeds from sale of shares | | | 102,051,116 | |
Cost of shares redeemed | | | (943,737 | ) |
| | | | |
Increase (decrease) in net assets derived from capital share transactions | | | 101,107,379 | |
| | | | |
Net increase (decrease) in net assets | | | 100,827,349 | |
|
| Net Assets | |
Beginning of period | | | — | |
| | | | |
End of period | | $ | 100,827,349 | |
| | | | |
Net investment loss at end of period | | $ | (216,240 | ) |
| | | | |
| | | | |
| 34 | | MainStay Absolute Return Multi-Strategy Fund | | The notes to the consolidated financial statements are an integral part of,
and should be read in conjunction with, the consolidated financial statements. |
Consolidated Financial Highlights selected per share data and ratios
| | | | | | | | | | |
| | | Class A | | | | | Investor Class | |
| | | June 18,
2015**
through
October 31,
2015* | | | | | June 18,
2015**
through
October 31,
2015* | |
Net asset value at beginning of period | | $ | 10.00 | | | | | $ | 10.00 | |
| | | | | | | | | | |
Net investment income (loss) (a) | | | (0.02 | ) | | | | | (0.03 | ) |
Net realized and unrealized gain (loss) on investments | | | 0.00 | ‡ | | | | | (0.01 | ) |
Net realized and unrealized gain (loss) on foreign currency transactions | | | (0.00 | )‡ | | | | | 0.00 | ‡ |
| | | | | | | | | | |
Total from investment operations | | | (0.02 | ) | | | | | (0.04 | ) |
| | | | | | | | | | |
Net asset value at end of period | | $ | 9.98 | | | | | $ | 9.96 | |
| | | | | | | | | | |
Total investment return (b)(c) | | | (0.20 | %) | | | | | (0.40 | %) |
| Ratios (to average net assets)/Supplemental Data: | | | | | | | | | | |
Net investment income (loss)†† | | | (0.66 | %) | | | | | (0.84 | %) |
Net expenses (excluding short sale expenses)†† | | | 1.80 | % | | | | | 1.94 | % |
Expenses (including short sale expenses, before waiver/reimbursement)†† | | | 3.24 | % | | | | | 3.35 | % |
Short sale expenses†† | | | 0.71 | % | | | | | 0.68 | % |
Portfolio turnover rate | | | 69 | % | | | | | 69 | % |
Net assets at end of period (in 000’s) | | $ | 1,081 | | | | | $ | 53 | |
| ‡ | Less than one cent per share. |
| (a) | Per share data based on average shares outstanding during the period. |
| (b) | Total investment return is calculated exclusive of sales charges and assumes the reinvestment of dividends and distributions. |
| (c) | Total investment return is not annualized. |
| | | | | | | | | | |
| | | Class C | | | | | Class I | |
| | | June 18,
2015**
through
October 31,
2015* | | | | | June 18,
2015**
through
October 31,
2015* | |
Net asset value at beginning of period | | $ | 10.00 | | | | | $ | 10.00 | |
| | | | | | | | | | |
Net investment income (loss) (a) | | | (0.06 | ) | | | | | (0.02 | ) |
Net realized and unrealized gain (loss) on investments | | | (0.01 | ) | | | | | (0.01 | ) |
Net realized and unrealized gain (loss) on foreign currency transactions | | | 0.00 | ‡ | | | | | (0.00 | )‡ |
| | | | | | | | | | |
Total from investment operations | | | (0.07 | ) | | | | | (0.03 | ) |
| | | | | | | | | | |
Net asset value at end of period | | $ | 9.93 | | | | | $ | 9.97 | |
| | | | | | | | | | |
Total investment return (b)(c) | | | (0.70 | %) | | | | | (0.30 | %) |
| Ratios (to average net assets)/Supplemental Data: | | | | | | | | | | |
Net investment income (loss)†† | | | (1.63 | %) | | | | | (0.57 | %) |
Net expenses (excluding short sale expenses)†† | | | 2.69 | % | | | | | 1.55 | % |
Expenses (including short sale expenses, before waiver/reimbursement)†† | | | 4.09 | % | | | | | 2.95 | % |
Short sale expenses†† | | | 0.67 | % | | | | | 0.67 | % |
Portfolio turnover rate | | | 69 | % | | | | | 69 | % |
Net assets at end of period (in 000’s) | | $ | 30 | | | | | $ | 99,664 | |
| ‡ | Less than one cent per share. |
| (a) | Per share data based on average shares outstanding during the period. |
| (b) | Total investment return is calculated exclusive of sales charges and assumes the reinvestment of dividends and distributions. Class I shares are not subject to sales charges. |
| (c) | Total investment return is not annualized. |
| | | | | | |
The notes to the consolidated financial statements are an integral part of,
and should be read in conjunction with, the consolidated financial statements. | | | | | 35 | |
Notes to Consolidated Financial Statements (Unaudited)
Note 1–Organization and Business
MainStay Funds Trust (the “Trust”) was organized as a Delaware statutory trust on April 28, 2009, and is governed by a Declaration of Trust. The Trust is registered under the Investment Company Act of 1940, as amended (the “1940 Act”), as an open-end management investment company, and is comprised of thirty-eight funds (collectively referred to as the “Funds”). These consolidated financial statements and notes relate to the MainStay Absolute Return Multi-Strategy Fund (the “Fund”), a “diversified” fund, as that term is defined in the 1940 Act, as interpreted or modified by regulatory authorities having jurisdiction, from time to time.
The Fund currently offers four classes of shares. Investor Class, Class A, Class C and Class I shares. The inception date for all classes was June 18, 2015. Investor Class and Class A shares are offered at net asset value (“NAV”) per share plus an initial sales charge. No sales charge applies to investments of $1 million or more (and certain other qualified purchases) in Investor Class and Class A shares, but a contingent deferred sales charge (“CDSC”) is imposed on certain redemptions made within one year of the date of purchase. Class C shares are offered at NAV without an initial sales charge, although a 1.00% CDSC may be imposed on redemptions made within one year of the date of purchase of Class C shares. Class I shares are offered at NAV and are not subject to a sales charge. Depending upon eligibility, Investor Class shares may convert to Class A shares and Class A shares may convert to Investor Class shares. The four classes of shares have the same voting (except for issues that relate solely to one class), dividend, liquidation and other rights, and the same terms and conditions, except that Class C shares are subject to higher distribution and/or service fee rates than Investor Class and Class A shares under a distribution plan pursuant to Rule 12b-1 under the 1940 Act. Class I shares are not subject to a distribution and/or service fee.
The Fund’s investment objective is to seek long-term growth of capital.
Note 2–Significant Accounting Policies
The Fund is an investment company and accordingly follows the investment company accounting and reporting guidance of the Financial Accounting Standards Board (“FASB”) Accounting Standard Codification Topic 946 Financial Services—Investment Companies. The Fund prepares its consolidated financial statements in accordance with generally accepted accounting principles (“GAAP”) in the United States of America and follows the significant accounting policies described below.
(A) Securities Valuation. Investments are valued as of the close of regular trading on the New York Stock Exchange (“Exchange”) (generally 4:00 p.m. Eastern time) on each day the Fund is open for business (“valuation date”).
The Board of Trustees (the “Board”) adopted procedures establishing methodologies for the valuation of the Fund’s securities and delegated the responsibility for valuation determinations under those procedures to the Valuation Committee of the Fund (the “Valuation Committee”). The Board authorized the Valuation Committee to appoint a Valuation Sub-Committee (the “Sub-Committee”) to deal in the first instance with establishing the prices of securities for which market quotations are not readily available or the prices of which are not otherwise readily determinable under these procedures. The Sub-Committee meets (in
person, via electronic mail or via teleconference) on an as-needed basis. Subsequently, the Valuation Committee meets to ensure that actions taken by the Sub-Committee were appropriate. The procedures recognize that, subject to the oversight of the Board and unless otherwise noted, the responsibility for the day-to-day valuation of portfolio assets (including fair value measurements for the Fund’s assets and liabilities) rests with New York Life Investment Management LLC (“New York Life Investments” or the “Manager”), aided to whatever extent necessary by the Subadvisors (as defined in Note 3(A)) to the Fund.
To assess the appropriateness of security valuations, the Manager, Subadvisors or the Fund’s third party service provider, who is subject to oversight by the Manager, regularly compares prior day prices, prices on comparable securities, and the sale prices to the prior and current day prices and challenges prices with changes exceeding certain tolerance levels with third party pricing services or broker sources. For those securities valued through either a standardized fair valuation methodology or a fair valuation measurement, the Sub-Committee deals in the first instance with such valuation and the Valuation Committee reviews and affirms the reasonableness of the valuation based on such methodologies and measurements on a regular basis after considering all relevant information that is reasonably available. Any action taken by the Sub-Committee with respect to the valuation of a portfolio security is submitted by the Valuation Committee to the Board for its review and ratification, if appropriate, at its next regularly scheduled meeting.
“Fair value” is defined as the price the Fund would receive upon selling an asset or liability in an orderly transaction to an independent buyer in the principal or most advantageous market for the asset or liability. Fair value measurements are determined within a framework that establishes a three-tier hierarchy which maximizes the use of observable market data and minimizes the use of unobservable inputs to establish a classification of fair value measurements for disclosure purposes. “Inputs” refer broadly to the assumptions that market participants would use in pricing the asset or liability, including assumptions about risk, such as the risk inherent in a particular valuation technique used to measure fair value using a pricing model and/or the risk inherent in the inputs for the valuation technique. Inputs may be observable or unobservable. Observable inputs reflect the assumptions market participants would use in pricing the asset or liability based on market data obtained from sources independent of the Fund. Unobservable inputs reflect the Fund’s own assumptions about the assumptions market participants would use in pricing the asset or liability based on the information available. The inputs or methodology used for valuing assets or liabilities may not be an indication of the risks associated with investing in those assets or liabilities. The three-tier hierarchy of inputs is summarized below.
| • | | Level 1—quoted prices in active markets for an identical asset or liability |
| • | | Level 2—other significant observable inputs (including quoted prices for a similar asset or liability in active markets, interest rates and yield curves, prepayment speeds, credit risk, etc.) |
| • | | Level 3—significant unobservable inputs (including the Fund’s own assumptions about the assumptions that market participants would use in measuring fair value of an asset or liability) |
| | |
| 36 | | MainStay Absolute Return Multi-Strategy Fund |
The level of an asset or liability within the fair value hierarchy is based on the lowest level of an input, both individually and in the aggregate, that is significant to the fair value measurement. As of October 31, 2015, the aggregate value by input level of the Fund’s assets and liabilities is included at the end of the Fund’s Consolidated Portfolio of Investments.
The Fund may use third party vendor evaluations, whose prices may be derived from one or more of the following standard inputs among others:
| | |
• Benchmark yields | | • Reported trades |
• Broker/dealer quotes | | • Issuer spreads |
• Two-sided markets | | • Benchmark securities |
• Bids/offers | | • Reference data (corporate actions or material event notices) |
• Industry and economic events | | • Comparable bonds |
• Equity and credit default swap curves | | • Monthly payment information |
An asset or liability for which market values cannot be measured using the methodologies described above is valued by methods deemed reasonable in good faith by the Valuation Committee, following the procedures established by the Board, to represent fair value. Under these procedures, the Fund generally uses a market-based approach which may use related or comparable assets or liabilities, recent transactions, market multiples, book values, and other relevant information. The Fund may also use an income-based valuation approach in which the anticipated future cash flows of the asset or liability are discounted to calculate fair value. Discounts may also be applied due to the nature and/or duration of any restrictions on the disposition of the asset or liability. Due to the inherent uncertainty of such assets or liabilities, fair values may differ significantly from values that would have been used had an active market existed. During the period ended October 31, 2015, there were no material changes to the fair value methodologies.
Equity and non-equity securities which may be valued in this manner include, but are not limited to: (i) a security for which trading has been halted or suspended; (ii) a debt security that has recently gone into default and for which there is not a current market quotation; (iii) a security of an issuer that has entered into a restructuring; (iv) a security that has been de-listed from a national exchange; (v) a security for which the market price is not readily available from a third party pricing source or, if so provided, does not, in the opinion of the Manager or Subadvisor reflect the security’s market value; (vi) a security subject to trading collars for which no or limited trading takes place; and (vii) a security whose principal market has been temporarily closed at a time when, under normal conditions, it would be open. Securities for which market quotations or observable inputs are not readily available are generally categorized as Level 3 in the hierarchy. As of October 31, 2015, there were no securities held by the Fund that were fair valued in such a manner.
Certain securities held by the Fund may principally trade in foreign markets. Events may occur between the time the foreign markets close and the time at which the Fund’s NAV is calculated. These events may include, but are not limited to, situations relating to a single issuer in a market sector, significant fluctuations in U.S. or foreign markets, natural disasters, armed conflicts, governmental actions or other developments
not tied directly to the securities markets. Should the Manager or Subadvisor conclude that such events may have affected the accuracy of the last price of such securities reported on the local foreign market, the Sub-Committee may, pursuant to procedures adopted by the Board, adjust the value of the local price to reflect the estimated impact on the price of such securities as a result of such events. In this instance, securities are generally categorized as Level 3 in the hierarchy. Additionally, certain foreign equity securities are also fair valued whenever the movement of a particular index exceeds certain thresholds. In such cases, the securities are fair valued by applying factors provided by a third party vendor in accordance with valuation procedures adopted by the Board and are generally categorized as Level 2 in the hierarchy.
Equity securities and Exchange-Traded Funds are valued at the last quoted sales prices as of the close of regular trading on the relevant exchange on each valuation date. Securities that are not traded on the valuation date are valued at the mean of the last quoted bid and ask prices. Prices are normally taken from the principal market in which each security trades. Futures contracts are valued at the last posted settlement price on the market where such futures are primarily traded. Options contracts are valued at the last posted settlement price on the market where such options are primarily traded. Investments in mutual funds, including money market funds, are valued at their respective NAVs as of the close of the Exchange on the valuation date. These securities are generally categorized as Level 1 in the hierarchy.
Debt securities (other than convertible and municipal bonds) are valued at the evaluated bid prices (evaluated mean prices in the case of convertible and municipal bonds) supplied by a pricing agent or broker selected by the Manager, in consultation with the Subadvisors. Those values reflect broker/dealer supplied prices and electronic data processing techniques, if the evaluated bid or mean prices are deemed by the Manager, in consultation with the Subadvisors, to be representative of market values, at the regular close of trading of the Exchange on each valuation date. Debt securities purchased on a delayed delivery basis are marked to market daily until settlement at the forward settlement date. Debt securities, including corporate bonds, U.S. government & federal agency bonds, municipal bonds, foreign bonds, convertible bonds, asset-backed securities and mortgage-backed securities are generally categorized as Level 2 in the hierarchy.
Temporary cash investments acquired in excess of 60 days to maturity at the time of purchase are valued using the latest bid prices or using valuations based on a matrix system (which considers such factors as security prices, yields, maturities, and ratings), both as furnished by independent pricing services. Other temporary cash investments which mature in 60 days or less at the time of purchase (“Short-Term Investments”) are valued using the amortized cost method of valuation, unless the use of such method would be inappropriate. The amortized cost method involves valuing a security at its cost on the date of purchase and thereafter assuming a constant amortization to maturity of the difference between such cost and the value on maturity date. Amortized cost approximates the current fair value of a security. These securities are generally categorized as Level 2 in the hierarchy.
Foreign currency forward contracts are valued at their fair market values measured on the basis of the mean between the last current bid and ask prices based on dealer or exchange quotations and are generally categorized as Level 2 in the hierarchy.
Notes to Consolidated Financial Statements (Unaudited) (continued)
Total return swaps contracts, which are arrangements to exchange a market-linked return for a periodic payment, are based on a notional principal amount. To the extent that the total return of the security, index or other financial measure underlying the transaction exceeds or falls short of the offsetting interest rate obligation, a fund will receive a payment from or make a payment to the counterparty. Total return swap contracts are marked to market daily based upon quotations from market makers and these securities are generally categorized as Level 2 in the hierarchy.
Generally, a security is considered illiquid if it cannot be sold or disposed of in the ordinary course of business at approximately the price at which it is valued within seven days. Illiquidity of a security might prevent the sale of such security at a time when the Manager or Subadvisors might wish to sell, and these securities could have the effect of decreasing the overall level of the Fund’s liquidity. Further, the lack of an established secondary market may make it more difficult to value illiquid securities, requiring the Fund to rely on judgments that may be somewhat subjective in measuring value, which could vary from the amount that the Fund could realize upon disposition. Difficulty in selling illiquid securities may result in a loss or may be costly to the Fund. Under the supervision of the Board, the Manager or Subadvisors measure the liquidity of the Fund’s investments; in doing so, the Manager or Subadvisors may consider various factors, including (i) the frequency of trades and quotations, (ii) the number of dealers and prospective purchasers, (iii) dealer undertakings to make a market, and (iv) the nature of the security and the market in which it trades (e.g., the time needed to dispose of the security, the method of soliciting offers and the mechanics of transfer). Illiquid securities generally will be valued by methods deemed reasonable in good faith in such a manner as the Board deems appropriate to reflect their fair value. The liquidity of the Fund’s investments, as shown in the accompanying Consolidated Portfolio of Investments, was measured as of October 31, 2015 and can change at any time in response to, among other relevant factors, market conditions or events or developments with respect to an individual issuer or instrument. As of October 31, 2015, securities deemed to be illiquid under procedures approved by the Board of Trustees are shown in the Consolidated Portfolio of Investments.
(B) Income Taxes. The Fund’s policy is to comply with the requirements of the Internal Revenue Code of 1986, as amended (the “Internal Revenue Code”), applicable to regulated investment companies and to distribute all of the taxable income to the shareholders of the Fund within the allowable time limits. Therefore, no federal, state and local income tax provisions are required.
Management evaluates the Fund’s tax positions to determine if the tax positions taken meet the minimum recognition threshold in connection with accounting for uncertainties in income tax positions taken or expected to be taken for the purposes of measuring and recognizing tax liabilities in the financial statements. Recognition of tax benefits of an uncertain tax position is required only when the position is “more likely than not” to be sustained assuming examination by taxing authorities. Management has analyzed the Fund’s tax positions taken on federal, state and local income tax returns for all open tax years (for up to three tax years), and has concluded that no provisions for federal, state and local income tax are required in the Fund’s financial statements. The Fund’s federal, state and local income and federal excise tax returns for tax years for which the applicable statutes of limitations have not expired
are subject to examination by the Internal Revenue Service and state and local departments of revenue.
For U.S. tax purposes, the Cayman Subsidiary (defined below) is treated as a controlled foreign corporation (“CFC”) of the Fund under the Code. As a U.S. shareholder of a CFC, the Fund is required to include its share of the Cayman Subsidiary’s earnings in its taxable income. Any net loss or deficit in earnings generated by the Cayman Subsidiary cannot be deducted by the Fund in the period incurred, nor can such loss or deficit in earnings be carried forward to offset the Fund’s taxable income and the Cayman Subsidiary’s earnings in future periods. As a Cayman Islands exempted limited company, the Cayman Subsidiary has received an undertaking from the Government of the Cayman Islands exempting it from all local income, profits and capital gains taxes. No such taxes are levied in the Cayman Islands at this time.
With respect to Fund investments in the Cayman Subsidiary, the Internal Revenue Service (“IRS”) has issued private letter rulings to regulated investment companies (but not the Fund) in which the IRS specifically concluded that income and gains earned by a regulated investment company from its investment in a wholly-owned foreign subsidiary that invests in commodity-linked instruments are qualifying gross income of a regulated investment company for purposes of compliance with Subchapter M of the Code. However, the Fund is not able to rely on private letter rulings issued to other taxpayers. Additionally, the IRS has suspended the issuance of such private letter rulings, pending review of its position on this matter. In connection with investments in the Cayman Subsidiary, the Fund has obtained an opinion of counsel that gross income derived by the Fund from its investment in the Cayman Subsidiary should constitute qualifying gross income of a regulated investment company under Subchapter M of the Code. However, no assurances can be provided that the IRS would not be able to successfully assert that the gross income derived by the Fund from its investment in the Cayman Subsidiary was not qualifying gross income of a regulated investment company under Subchapter M of the Internal Revenue Code, in which case the Fund could fail to qualify as a regulated investment company under Subchapter M of the Code if less than 90% of its gross income was not derived from such qualifying gross income. If the Fund failed to qualify as a regulated investment company, it would be subject to federal and state income tax on all of its taxable income at regular corporate tax rates. This would significantly adversely affect the returns to, and could cause substantial losses for, Fund shareholders.
(C) Foreign Taxes. The Fund may be subject to foreign taxes on income and other transaction-based taxes imposed by certain countries in which it invests. A portion of the taxes on gains on investments or currency purchases/repatriation may be recoverable. The Fund will accrue such taxes and recoveries as applicable, based upon its current interpretation of tax rules and regulations that exist in the markets in which it invests.
The Fund may be subject to taxation on realized capital gains, repatriation proceeds and other transaction-based taxes imposed by certain countries in which it invests. The Fund will accrue such taxes as applicable based upon its current interpretation of tax rules and regulations that exist in the market in which it invests. Capital gains taxes relating to positions still held are reflected as a liability on the Consolidated Statement of Assets and Liabilities, as well as an adjustment to the Fund’s net unrealized appreciation (depreciation). Taxes related to capital gains
| | |
| 38 | | MainStay Absolute Return Multi-Strategy Fund |
realized during the period ended October 31, 2015, if any, are reflected as part of net realized gain (loss) in the Consolidated Statement of Operations. Changes in tax liabilities related to capital gains taxes on unrealized investment gains, if any, are reflected as part of the change in net unrealized appreciation (depreciation) on investments in the Consolidated Statement of Operations. Transaction-based charges are generally assessed as a percentage of the transaction amount.
(D) Dividends and Distributions to Shareholders. Dividends and distributions are recorded on the ex-dividend date. The Fund intends to declare and pay dividends from net investment income, if any, at least monthly and distributions from net realized capital and currency gains, if any, at least annually. Unless the shareholder elects otherwise, all dividends and distributions are reinvested in the same class of shares of the Fund, at NAV. Dividends and distributions to shareholders are determined in accordance with federal income tax regulations and may differ from GAAP.
(E) Security Transactions and Investment Income. The Fund records security transactions on the trade date. Realized gains and losses on security transactions are determined using the identified cost method. Dividend income is recognized on the ex-dividend date, net of any foreign tax withheld at the source, and interest income is accrued as earned using the effective interest rate method and includes realized gains and losses from repayments of principal on mortgage-backed securities. Discounts and premiums on securities purchased, other than Short-Term Investments, for the Fund are accreted and amortized, respectively, on the effective interest rate method over the life of the respective securities or, in the case of a callable security, over the period to the first date of call. Discounts and premiums on Short-Term Investments are accreted and amortized, respectively, on the straight-line method. The straight-line method approximates the effective interest method for short-term investments. Income from payment-in-kind securities is recorded daily based on the effective interest method of accrual.
The Fund may invest in master limited partnerships (“MLPs”). To comply with Subchapter M of the Code, the Fund may invest no more than 25% of its total assets in MLPs. Distributions on a MLP are generally recorded based on the characterization reported on the Fund’s Form 1065, Schedule K-1, received from the MLP. The Fund records its pro rata share of the income and deductions, and capital gains and losses allocated from each MLP on its Consolidated Statement of Operations, as well as adjusts the cost basis of each MLP accordingly, as reported on the Fund’s Consolidated Statement of Investments.
Distributions received from investments in energy related U.S. royalty trusts and Canadian royalty trusts and exploration and production companies (collectively, “Energy Trusts”) and MLPs generally are comprised of ordinary income, capital gains and return of capital from the Energy Trusts or MLPs. The Fund records its investment income on the ex-date of the distributions. For purposes of the consolidated financial statements, the Fund uses return of capital and income estimates to allocate the dividend income received. Such estimates are based on historical information available from each Energy Trust, MLP and other industry sources. These estimates may subsequently be revised based on information received from Energy Trusts or MLPs after their tax reporting periods are concluded, as the actual character of these distributions is not known until after the fiscal year end.
The Fund estimates the allocation of investment income and return of capital associated with distributions received from MLPs and recorded on the Consolidated Statement of Operations. For the period ended October 31, 2015, the Fund estimated approximately 100% of the distributions received from MLPs to be from return of capital.
Investment income and realized and unrealized gains and losses on investments of the Fund are allocated to separate classes of shares pro rata based upon their relative net assets on the date the income is earned or realized and unrealized gains and losses are incurred.
The Fund may place a debt obligation on non-accrual status and reduce related interest income by ceasing current accruals and writing off interest receivables when the collection of all or a portion of interest has become doubtful based on consistently applied procedures. A debt obligation is removed from non-accrual status when the issuer resumes interest payments or when collectability of interest is reasonably assured.
(F) Expenses. Expenses of the Trust are allocated to the individual Funds in proportion to the net assets of the respective Funds when the expenses are incurred, except where direct allocations of expenses can be made. Expenses (other than transfer agent expenses and fees incurred under the shareholder services plans and/or the distribution plans further discussed in Note 3(B)) are allocated to separate classes of shares pro rata based upon their relative net assets on the date the expenses are incurred. The expenses borne by the Fund, including those of related parties to the Fund, are shown in the Consolidated Statement of Operations.
(G) Use of Estimates. In preparing the consolidated financial statements in conformity with GAAP, management makes estimates and assumptions that affect the reported amounts and disclosures in the consolidated financial statements. Actual results could differ from those estimates.
(H) Repurchase Agreements. The Fund may enter into repurchase agreements to earn income. The Fund may enter into repurchase agreements only with financial institutions that are deemed by the Manager or Subadvisors to be creditworthy, pursuant to guidelines established by the Board. During the term of any repurchase agreement, the Manager or Subadvisors will continue to monitor the creditworthiness of the seller. Under the 1940 Act, repurchase agreements are considered to be collateralized loans by the Fund to the seller secured by the securities transferred to the Fund.
When the Fund invests in repurchase agreements, the Fund’s custodian takes possession of the collateral pledged for investments in the repurchase agreement. The underlying collateral is valued daily on a mark to market basis to determine if the value, including accrued interest, exceeds the repurchase price. In the event of the seller’s default on the obligation to repurchase, the Fund has the right to liquidate the collateral and apply the proceeds in satisfaction of the obligation. Under certain circumstances, such as in the event of default or bankruptcy by the counterparty to the agreement, realization and/or retention of the collateral may be subject to legal proceedings and possible realized loss to the Fund.
(I) Futures Contracts. A futures contract is an agreement to purchase or sell a specified quantity of an underlying instrument at a specified future date and price, or to make or receive a cash payment
Notes to Consolidated Financial Statements (Unaudited) (continued)
based on the value of a financial instrument (e.g., foreign currency, interest rate, security, or securities index). The Fund is subject to market price risk and/or interest rate risk in the normal course of investing in these transactions. During the period the futures contract is open, changes in the value of the contract are recognized as unrealized appreciation or depreciation by marking to market such contract on a daily basis to reflect the market value of the contract at the end of each day’s trading. The Fund agrees to receive from or pay to the broker or futures commission merchant an amount of cash equal to the daily fluctuation in the value of the contract. Such receipts or payments are known as “variation margin.” When the futures contract is closed, the Fund records a realized gain or loss equal to the difference between the proceeds from (or cost of) the closing transaction and the Fund’s basis in the contract.
The use of futures contracts involves, to varying degrees, elements of market risk in excess of the amount recognized in the Consolidated Statement of Assets and Liabilities. The contract or notional amounts and variation margin reflect the extent of the Fund’s involvement in open futures positions. There are several risks associated with the use of futures contracts as hedging techniques. There can be no assurance that a liquid market will exist at the time when the Fund seeks to close out a futures contract. If no liquid market exists, the Fund would remain obligated to meet margin requirements until the position is closed. Futures may involve a small initial investment relative to the risk assumed, which could result in losses greater than if they had not been used. Futures may be more volatile than direct investments in the instrument underlying the futures, and may not correlate to the underlying instrument, causing a given hedge not to achieve its objectives. The Fund’s activities in futures contracts have minimal counterparty risk as they are conducted through regulated exchanges that guarantee the futures against default by the counterparty. In the event of a bankruptcy or insolvency of a futures commission merchant that holds margin on behalf of the Fund, the Fund may not be entitled to the return of the entire margin owed to the Fund, potentially resulting in a loss. The Fund may invest in futures contracts to help manage the duration and yield curve of the portfolio while minimizing the exposure to wider bid/ask spreads in traditional bonds. The Fund’s investment in futures contracts and other derivatives may increase the volatility of the Fund’s NAV and may result in a loss to the Fund.
(J) Swap Contracts. The Fund may enter into credit default, interest rate, index and currency exchange rate swap contracts (“swaps”) for the purpose of attempting to obtain a desired return at a lower cost to the Fund, rather than directly investing in an instrument yielding that desired return or to hedge against credit and interest rate risk. In a typical swap transaction, two parties agree to exchange the returns (or differentials in rates of returns) earned or realized on a particular investment or instrument. The gross returns to be exchanged or “swapped” between the parties are calculated with respect to a notional amount. The payments may be adjusted for transaction costs, interest payments, the amount of interest paid on the investment or instrument, or other factors. Collateral, in the form of cash or securities, may be required to be held in segregated accounts with the custodian bank or broker in accordance with the terms of the swap. Swaps agreements are privately negotiated in the over the counter market (“OTC swaps”) and may be executed in a multilateral or other trade facilities platform, such as a registered commodities exchange (“centrally cleared swaps”).
Credit default swaps, in particular, are contracts whereby one party makes periodic payments to a counterparty in exchange for the right to receive a specified return in the event of a default by a third party on its obligation. Such periodic payments are accrued daily and recorded as a realized gain or loss. Credit default swaps may be used to provide a measure of protection against defaults of sovereign or corporate issuers.
Certain standardized swaps, including certain credit default and interest rate swaps, are subject to mandatory clearing, and more types of standardized swaps are expected to be subject to mandatory clearing in the future. The counterparty risk for cleared derivatives is expected to be generally lower than for uncleared derivatives, but cleared contracts are not risk-free. In a cleared derivative transaction, the Fund typically enters into the transaction with a financial institution counterparty, and performance of the transaction is effectively guaranteed by a central clearinghouse, thereby reducing or eliminating the Fund’s exposure to the credit risk of its original counterparty. The Fund will be required to post specified levels of margin with the clearinghouse or at the instruction of the clearinghouse; the margin required by a clearinghouse may be greater than the margin the Fund would be required to post in an uncleared transaction.
Swaps are marked to market daily based upon quotations from pricing agents, brokers, or market makers and the change in value, if any, is recorded as unrealized appreciation or depreciation. Any payments made or received upon entering into a swap would be amortized or accreted over the life of the swap and recorded as a realized gain or loss. Early termination of a swap is recorded as a realized gain or loss. Daily changes in valuation of centrally cleared swaps, if any, are recorded as a receivable or payable for the change in value as appropriate (“variation margin”) on the Consolidated Statements of Assets and Liabilities.
The Fund bears the risk of loss of the amount expected to be received under a swap in the event of the default or bankruptcy of the swap counterparty. The Fund may be able to eliminate its exposure under a swap either by assignment or other disposition, or by entering into an offsetting swap with the same party or a similar creditworthy party. Swaps are not actively traded on financial markets. Entering into swaps involves elements of credit, market, and documentation risk in excess of the amounts recognized on the Consolidated Statement of Assets and Liabilities. Such risks involve the possibilities that there will be no liquid market for these swaps, that the counterparty to the swaps may default on its obligation to perform or disagree as to the meaning of the contractual terms in the swaps and that there may be unfavorable changes in interest rates, the price of the index or the security underlying these transactions.
(K) Equity Swaps (Total Return Swaps). Equity swap contracts may be structured in different ways. For example, when the Fund takes a long position, the counterparty may agree to pay the Fund the amount, if any, by which the notional amount of the equity swap would have increased in value had it been invested in a particular stock (or group of stocks), plus the dividends that would have been received on the stock. In these cases, the Fund may agree to pay the counterparty interest on the notional amount of the equity swap plus the amount, if any, by which that notional amount would have decreased in value had it been
| | |
| 40 | | MainStay Absolute Return Multi-Strategy Fund |
invested in such stock. Therefore, in this case the return to the Fund on the equity swap should be the gain or loss on the notional amount plus dividends on the stock less the interest paid by the Fund on the notional amount. In other cases, when the Fund takes a short position, a counterparty may agree to pay the Fund the amount, if any, by which the notional amount of the equity swap would have decreased in value had the Fund sold a particular stock (or group of stocks) short, less the dividend expense that the Fund would have paid on the stock, as adjusted for interest payments or other economic factors. In these situations, a Fund may be obligated to pay the amount, if any, by which the notional amount of the swap would have increased in value had it been invested in such stock.
Equity swaps normally do not involve the delivery of securities or other underlying assets. Accordingly, the risk of loss with respect to equity swaps is normally limited to the net amount of payments that the Fund is contractually obligated to make. If the other party to an equity swap defaults, the Fund’s risk of loss consists of the net amount of payments that such Fund is contractually entitled to receive, if any. As much as these transactions are offset by segregated cash or liquid assets to cover the Funds’ current obligations (or are otherwise covered as permitted by applicable law), the Funds and New York Life Investments believe these transactions do not constitute senior securities under the Act and, accordingly, will not treat them as being subject to the Fund’s borrowing restrictions.
Equity swaps are derivatives and their value can be very volatile. The Fund engages in total return swaps to gain exposure to emerging markets securities, along with offsetting long total return swap positions to maintain appropriate currency balances and risk exposures across all swap positions. To the extent that the Manager, or Subadvisors does not accurately analyze and predict future market trends, the values or assets or economic factors, a Fund may suffer a loss, which may be substantial.
(L) Foreign Currency Forward Contracts. The Fund may enter into foreign currency forward contracts, which are agreements to buy or sell foreign currencies on a specified future date at a specified rate. The Fund is subject to foreign currency exchange rate risk in the normal course of investing in these transactions. During the period the forward contract is open, changes in the value of the contract are recognized as unrealized appreciation or depreciation by marking to market such contract on a daily basis to reflect the market value of the contract at the end of each day’s trading. Cash movement occurs on settlement date. When the forward contract is closed, the Fund records a realized gain or loss equal to the difference between the proceeds from (or cost of) the closing transaction and the Fund’s basis in the contract. The Fund may purchase and sell foreign currency forward contracts for purposes of seeking to enhance portfolio returns and manage portfolio risk more efficiently. Foreign currency forward contracts may also be used to gain exposure to a particular currency or to hedge against the risk of loss due to changing currency exchange rates. Foreign currency forward contracts to purchase or sell a foreign currency may also be used in anticipation of future purchases or sales of securities denominated in foreign currency, even if the specific investments have not yet been selected.
The use of foreign currency forward contracts involves, to varying degrees, elements of market risk in excess of the amount recognized in
the Consolidated Statement of Assets and Liabilities. The contract amount reflects the extent of the Fund’s involvement in these financial instruments. Risks arise from the possible movements in the foreign exchange rates underlying these instruments. While the Fund may enter into forward contracts to reduce currency exchange risks, changes in currency exchange rates may result in poorer overall performance for the Fund than if it had not engaged in such transactions. Exchange rate movements can be large, depending on the currency, and can last for extended periods of time, affecting the value of the Fund’s assets. Moreover, there may be an imperfect correlation between the Fund’s holdings of securities denominated in a particular currency and the forward contracts entered into by the Fund. Such imperfect correlation may prevent the Fund from achieving the intended hedge or expose the Fund to the risk of currency exchange loss. The unrealized appreciation (depreciation) on forward contracts reflects the Fund’s exposure at the valuation date to credit loss in the event of a counterparty’s failure to perform its obligations.
(M) Foreign Currency Transactions. The Fund’s books and records are maintained in U.S. dollars. Prices of securities denominated in foreign currency amounts are translated into U.S. dollars at the mean between the buying and selling rates last quoted by any major U.S. bank at the following dates:
| (i) | market value of investment securities, other assets and liabilities—at the valuation date; and |
| (ii) | purchases and sales of investment securities, income and expenses—at the date of such transactions. |
The assets and liabilities that are denominated in foreign currency amounts are presented at the exchange rates and market values at the close of the period. The realized and unrealized changes in net assets arising from fluctuations in exchange rates and market prices of securities are not separately presented.
Net realized gain (loss) on foreign currency transactions represents net gains and losses on foreign currency forward contracts, net currency gains or losses realized as a result of differences between the amounts of securities sale proceeds or purchase cost, dividends, interest and withholding taxes as recorded on the Fund’s books, and the U.S. dollar equivalent amount actually received or paid. Net currency gains or losses from valuing such foreign currency denominated assets and liabilities, other than investments at valuation date exchange rates, are reflected in unrealized foreign exchange gains or losses.
(N) Rights and Warrants. Rights are certificates that permit the holder to purchase a certain number of shares, or a fractional share, of a new stock from the issuer at a specific price. Warrants are instruments that entitle the holder to buy an equity security at a specific price for a specific period of time. These investments can provide a greater potential for profit or loss than an equivalent investment in the underlying security. Prices of these investments do not necessarily move in tandem with the prices of the underlying securities.
There is risk involved in the purchase of rights and warrants in that these investments are speculative investments. The Fund could also lose the entire value of its investment in warrants if such warrants are not exercised by the date of its expiration. The Fund is exposed to risk until the sale or exercise of each right or warrant is completed. As of October 31, 2015, the Fund did not hold any rights or warrants.
Notes to Consolidated Financial Statements (Unaudited) (continued)
(O) Options. The Fund may write call and put options on securities and financial derivative instruments it owns or in which it may invest. Writing put options tends to increase the Fund’s exposure to the underlying instrument. Writing call options tends to decrease the Fund’s exposure to the underlying instrument. When the Fund writes a call or put, an amount equal to the premium received is recorded as a liability and subsequently marked to market to reflect the current value of the option written. These liabilities are reflected as written options outstanding on the Consolidated Statement of Assets and Liabilities. Premiums received from writing options which expire are treated as realized gains. Premiums received from writing options which are exercised or closed are added to the proceeds or offset against amounts paid on the underlying futures, swaps, security or currency transaction to determine the realized gain or loss. Certain options may be written with premiums to be determined on a future date. The Fund, as a writer of an option has no control over whether the underlying instrument may be sold (call) or purchased (put) and as a result bears the market risk of an unfavorable change in the price of the instrument underlying the written option. There is the risk the Fund may not be able to enter into a closing transaction because of an illiquid market.
The Fund may also purchase put and call options. Purchasing call options tends to increase the Fund’s exposure to the underlying instrument. Purchasing put options tends to decrease the Fund’s exposure to the underlying instrument. The Fund pays a premium which is included on the Fund’s Consolidated Statement of Assets and Liabilities as an investment and subsequently marked to market to reflect the current value of the option. Premiums paid for purchasing options which expire are treated as realized losses. Certain options may be purchased with premiums to be determined on a future date. The premiums for these options are based upon implied volatility parameters at specified terms. The risk associated with purchasing put and call options is limited to the premium paid. Premiums paid for purchasing options which are exercised or closed are added to the amounts paid or offset against the proceeds on the underlying investment transaction to determine the realized gain or loss when the underlying transaction is sold.
The Fund may purchase or write foreign currency options. Purchasing a foreign currency option gives the Fund the right, but not the obligation, to buy or sell a specified amount of the currency at a specified rate of exchange that may be exercised on or before the option’s expiration date. These options may be used as a short or long hedge against possible variations in foreign exchange rates or to gain exposure to foreign currencies.
During the period ended October 31, 2015, the Fund engaged in the following transactions in written options:
| | | | | | | | |
| | | Notional
Amount | | | Premium | |
Options Outstanding at June 18, 2015 | | $ | — | | | $ | — | |
Options—Written | | | 2,001,000 | | | | 21,509 | |
Options—Bought back | | | (2,000,000 | ) | | | (20,808 | ) |
Options Outstanding at October 31, 2015 | | $ | 1,000 | | | $ | 701 | |
(P) Securities Sold Short. The Fund engages in sales of securities it does not own (“short sales”) as part of its investment strategy. When the Fund enters into a short sale, it must segregate or maintain with a
broker the cash proceeds from the security sold short or other securities as collateral for its obligation to deliver the security upon conclusion of the sale. During the period a short position is open, depending on the nature and type of security, a short position is reflected as a liability and is marked to market in accordance with the valuation methodologies previously detailed (See Note 2(A)). Liabilities for securities sold short are closed out by purchasing the applicable securities for delivery to the counterparty broker. A gain, limited to the price at which the Fund sold the security short, or a loss, unlimited as to dollar amount, will be recognized upon termination of a short sale if the market price on the date the short position is closed out is less or greater, respectively, than the proceeds originally received. Any such gain or loss may be offset, completely or in part, by the change in the value of the hedged investments. Interest on short positions held is accrued daily, while dividends declared on short positions existing on the record date are recorded on the ex-dividend date as a dividend expense in the Consolidated Statement of Operations. Short sales involve risk of loss in excess of the related amounts reflected in the Consolidated Statement of Assets and Liabilities.
(Q) Offering Costs. Costs were incurred by the Fund in connection with the commencement of the Fund’s operations. These costs are being amortized on a straight line basis over twelve months.
(R) Securities Lending. In order to realize additional income, the Fund may engage in securities lending, subject to the limitations set forth in the 1940 Act and relevant guidance by the staff of the Securities and Exchange Commission. In the event the Fund does engage in securities lending, the Fund will lend through its custodian, State Street Bank and Trust Company (“State Street”). State Street will manage the Fund’s cash collateral in accordance with the lending agreement between the Fund and State Street, and indemnify the Fund against counterparty risk. The loans will be collateralized by cash or securities at least equal at all times to the market value of the securities loaned. Collateral will consist of U.S. government securities, cash equivalents or irrevocable letters of credit. The Fund may bear the risk of delay in recovery of, or loss of rights in, the securities loaned should the borrower of the securities experience financial difficulty. The Fund may also record a realized gain or loss on securities deemed sold due to a borrower’s inability to return securities on loan. The Fund bears the risk of any loss on investment of the collateral. The Fund will receive compensation for lending its securities in the form of fees or it will retain a portion of interest on the investment of any cash received as collateral. The Fund will also continue to receive interest and dividends on the securities loaned and any gain or loss in the market price of the securities loaned that may occur during the term of the loan will be for the account of the Fund. During the period ended October 31, 2015, the Fund did not have any portfolio securities on loan.
(S) Concentration of Risk. The Fund may invest in high-yield debt securities (sometimes called “junk bonds”), which are generally considered speculative because they present a greater risk of loss, including default, than higher quality debt securities. These securities pay investors a premium—a higher interest rate or yield than investment grade debt securities—because of the increased risk of loss. These securities can also be subject to greater price volatility.
The Fund may invest up to 25% of its total assets in a portfolio of securities of domestic and foreign publicly traded partnerships and/or other issuers (including U.S. and Canadian royalty trusts and Canadian energy
| | |
| 42 | | MainStay Absolute Return Multi-Strategy Fund |
companies) engaged in the transportation, storage, processing, refining, marketing, exploration, production or mining of crude oil, natural gas, minerals or other natural resources (“Energy Companies”). The Fund may be particularly vulnerable to adverse events affecting Energy Companies as a result of its focus in Energy Companies.
The Fund may invest as limited partners in the equity securities of MLPs. As limited partners of MLPs, holders of MLP equity securities are subject to certain risks inherent in the structure of MLPs, including (i) tax risks, (ii) the limited ability to elect or remove management or the general partner or managing member, (iii) limited voting rights, except with respect to extraordinary transactions, and (iv) conflicts of interest between the general partner or managing member and its affiliates, on the one hand, and the limited partners or members, on the other hand, including those arising from incentive distribution payments or corporate opportunities.
The Fund may invest in foreign securities, which carry certain risks that are in addition to the usual risks inherent in domestic instruments. These risks include those resulting from currency fluctuations, future adverse political or economic developments and possible imposition of currency exchange blockages or other foreign governmental laws or restrictions. These risks are likely to be greater in emerging markets than in developed markets. The ability of issuers of debt securities held by the Fund to meet their obligations may be affected by economic or political developments in a specific country, industry or region.
(T) Counterparty Credit Risk. In order to better define its contractual rights and to secure rights that will help the Fund mitigate its counterparty risk, the Fund may enter into an International Swaps and Derivatives Association, Inc. Master Agreement (“ISDA Master Agreement”) or similar agreement with its counterparties. An ISDA Master Agreement is a bilateral agreement between the Fund and a counterparty that governs certain OTC derivatives and typically contains collateral posting terms and netting provisions. Under an ISDA Master Agreement, the Fund may, under certain circumstances, offset with the counterparty certain derivative financial instruments’ payables and/or receivables with collateral held and/or posted and create one single net payment. The provisions of the ISDA Master Agreement typically permit a single net payment in the event of default including the bankruptcy or insolvency of the counterparty. Bankruptcy or insolvency laws of a particular jurisdiction may restrict or prohibit the right of offset in bankruptcy, insolvency or other events. In addition, certain ISDA Master Agreements may contain provisions for early termination of OTC
derivative transactions in the event the net assets of the Fund decline below specific levels or if the Fund fails to meet the terms of its ISDA Master Agreements. The result would cause the Fund to accelerate payment of any net liability owed to the counterparty. For financial reporting purposes, the Fund does not offset derivative assets and derivative liabilities that are subject to netting arrangements, if any, in the Consolidated Statements of Assets and Liabilities.
(U) Indemnifications. Under the Trust’s organizational documents, its officers and trustees are indemnified against certain liabilities that may arise out of performance of their duties to the Trust. Additionally, in the normal course of business, the Fund enters into contracts with third-party service providers that contain a variety of representations and warranties and which may provide general indemnifications. The Fund’s maximum exposure under these arrangements is unknown, as this would involve future claims that may be made against the Fund that have not yet occurred. Based on experience, management is of the view that the risk of loss in connection with these potential indemnification obligations is remote. However, there can be no assurance that material liabilities related to such obligations will not arise in the future, which could adversely impact the Fund.
(V) Quantitative Disclosure of Derivative Holdings. The following tables show additional disclosures about the Fund’s derivative and hedging activities, including how such activities are accounted for and their effect on the Fund’s financial positions, performance and cash flows. These derivatives are not accounted for as hedging instruments.
The Fund utilizes a range of derivative instruments for a variety of different purposes. Total return swaps (“TRS”) are one form of derivative that is used. In some cases, TRS contracts are entered into so as to affect long and short exposure to individual securities or indices within a particular strategy. In other cases, TRS are used to gain exposure to the strategy itself, which may also use derivatives. For example, a TRS contract is used to generate the return available from a customized index comprised of a diversified basket of exchange-traded futures. Other examples of derivative positions into which the Fund has entered include interest rate swaps, credit default swaps and option contracts. These instruments are frequently used to obtain a desired rate of return at a lower cost to the Fund than is available when investing directly in the underlying instrument or to hedge against credit and interest rate risks. The Fund has also invested in foreign currency forward contracts to gain exposure to a particular currency or to hedge against the risk of loss due to changing currency exchange rates.
Fair value of derivative instruments as of October 31, 2015:
Asset Derivatives
| | | | | | | | | | | | | | | | | | | | | | |
| | | Consolidated Statement of Assets and Liabilities Location | | Equity
Contracts
Risk | | | Credit
Contracts
Risk | | | Foreign
Exchange
Contracts
Risk | | | Interest
Rate
Contracts
Risk | | | Total | |
Purchased Options | | Investments in securities, at value | | $ | — | | | $ | — | | | $ | — | | | $ | 18,548 | | | $ | 18,548 | |
Swap Contracts | | Unrealized appreciation on swap contracts (a) | | | 591,154 | | | | 32,645 | | | | — | | | | 67,761 | | | | 691,560 | |
Forward Contracts | | Unrealized appreciation on foreign currency forward contracts | | | — | | | | — | | | | 407,341 | | | | — | | | | 407,341 | |
| | | | | | |
Total Fair Value | | | | $ | 591,154 | | | $ | 32,645 | | | $ | 407,341 | | | $ | 86,309 | | | $ | 1,117,449 | |
| | | | | | |
Notes to Consolidated Financial Statements (Unaudited) (continued)
Liability Derivatives
| | | | | | | | | | | | | | | | | | | | | | |
| | | Consolidated Statement of Assets and Liabilities Location | | Equity
Contracts
Risk | | | Credit
Contracts
Risk | | | Foreign
Exchange
Contracts
Risk | | | Interest
Rate
Contracts
Risk | | | Total | |
Written Option | | Investments in written option, at value | | $ | — | | | $ | — | | | $ | — | | | $ | (734 | ) | | $ | (734 | ) |
Futures Contracts | | Net unrealized appreciation (depreciation) on investments and futures contracts (a) | | | — | | | | — | | | | — | | | | (44,196 | ) | | | (44,196 | ) |
Forward Contracts | | Unrealized depreciation on foreign currency forward contracts | | | — | | | | — | | | | (9,613 | ) | | | — | | | | (9,613 | ) |
Swap Contracts | | Premiums received for swap contracts | | | (7 | ) | | | (51,566 | ) | | | — | | | | — | | | | (51,573 | ) |
Swap Contracts | | Unrealized depreciation on swap contracts (b) | | | (950,687 | ) | | | (78,420 | ) | | | — | | | | (20,072 | ) | | | (1,049,179 | ) |
| | | | | | |
Total Fair Value | | | | $ | (950,694 | ) | | $ | (129,986 | ) | | $ | (9,613 | ) | | $ | (65,002 | ) | | $ | (1,155,295 | ) |
| | | | | | |
| (a) | Includes cumulative appreciation (depreciation) of futures contracts as reported in the Consolidated Portfolio of Investments. Only current day’s variation margin is reported within the Consolidated Statement of Assets and Liabilities. |
| (b) | Includes cumulative appreciation (depreciation) of centrally cleared swap agreements as reported in the Consolidated Portfolio of Investments. Only current day’s variation margin of centrally cleared swaps is reported within the Consolidated Statement of Assets and Liabilities. |
The effect of derivative instruments on the Consolidated Statement of Operations for the period ended October 31, 2015:
Realized Gain (Loss)
| | | | | | | | | | | | | | | | | | | | | | |
| | | Consolidated Statement of Operations Location | | Equity
Contracts
Risk | | | Credit
Contracts
Risk | | | Foreign
Exchange
Contracts
Risk | | | Interest
Rate
Contracts
Risk | | | Total | |
Purchased Options | | Net realized gain (loss) on investments transactions | | $ | — | | | $ | — | | | $ | — | | | $ | (20,967 | ) | | $ | (20,967 | ) |
Written Option | | Net realized gain (loss) on written option transactions | | | — | | | | — | | | | — | | | | 15,222 | | | | 15,222 | |
Futures Contracts | | Net realized gain (loss) on futures transactions | | | — | | | | — | | | | — | | | | (538 | ) | | | (538 | ) |
Forward Contracts | | Net realized gain (loss) on foreign currency transactions | | | — | | | | — | | | | (59,927 | ) | | | — | | | | (59,927 | ) |
Swap Contracts | | Net realized gain (loss) on swap transactions | | | 772,715 | | | | (78,085 | ) | | | — | | | | 107,797 | | | | 802,427 | |
| | | | | | |
Total Realized Gain (Loss) | | | | $ | 772,715 | | | $ | (78,085 | ) | | $ | (59,927 | ) | | $ | 101,514 | | | $ | 736,217 | |
| | | | | | |
Change in Unrealized Appreciation (Depreciation)
| | | | | | | | | | | | | | | | | | | | | | |
| | | Consolidated Statement of Operations Location | | Equity
Contracts
Risk | | | Credit
Contracts
Risk | | | Foreign
Exchange
Contracts
Risk | | | Interest
Rate
Contracts
Risk | | | Total | |
Purchased Options | | Net change in unrealized appreciation (depreciation) on investments | | $ | — | | | $ | — | | | $ | — | | | $ | 7,171 | | | $ | 7,171 | |
Written Option | | Net change in unrealized appreciation (depreciation) on written option | | | — | | | | — | | | | — | | | | (33 | ) | | | (33 | ) |
Futures Contracts | | Net change in unrealized appreciation (depreciation) on futures contracts | | | — | | | | — | | | | — | | | | (44,196 | ) | | | (44,196 | ) |
Forward Contracts | | Net change in unrealized appreciation (depreciation) on translation of other assets and liabilities in foreign currencies and foreign currency forward contracts | | | — | | | | — | | | | 397,728 | | | | — | | | | 397,728 | |
Swap Contracts | | Net change in unrealized appreciation (depreciation) on swap contracts | | | (359,533 | ) | | | (45,775 | ) | | | — | | | | 47,689 | | | | (357,619 | ) |
| | | | | | |
Total Change in Unrealized Appreciation (Depreciation) | | $ | (359,533 | ) | | $ | (45,775 | ) | | $ | 397,728 | | | $ | 10,631 | | | $ | 3,051 | |
| | | | | | |
| | |
| 44 | | MainStay Absolute Return Multi-Strategy Fund |
Average Notional Amount
| | | | | | | | | | | | | | | | | | | | |
| | | Equity
Contracts
Risk | | | Credit
Contracts
Risk | | | Foreign
Exchange
Contracts
Risk | | | Interest
Rate
Contracts
Risk | | | Total | |
Purchased Options | | $ | — | | | $ | — | | | $ | — | | | $ | 8,999 | | | $ | 8,999 | |
Written Option | | $ | — | | | $ | — | | | $ | — | | | $ | (1,000,000 | ) | | $ | (1,000,000 | ) |
Futures Contracts Short | | $ | — | | | $ | — | | | $ | — | | | $ | (2,961,638 | ) | | $ | (2,961,638 | ) |
Forward Contracts Long | | $ | — | | | $ | — | | | $ | 551,190 | | | $ | — | | | $ | 551,190 | |
Forward Contracts Short | | $ | — | | | $ | — | | | $ | (13,483,406 | ) | | $ | — | | | $ | (13,483,406 | ) |
Swap Contracts Long | | $ | 33,114,975 | | | $ | 13,057,000 | | | $ | — | | | $ | 12,700,000 | | | $ | 58,871,975 | |
Swap Contracts Short | | $ | (6,329,244 | ) | | $ | — | | | $ | — | | | $ | — | | | $ | (6,329,244 | ) |
| | | | | | | | |
The following table presents the Fund’s derivative assets by counterparty net of amounts available for offset under a master netting agreement, or similar agreement, and net of the related collateral received by the Fund as of October 31, 2015.
| | | | | | | | | | | | | | | | |
Counterparty | | Gross Assets in
Statement of Assets
and Liabilities | | | Derivative
Assets/(Liabilities)
Available for Offset | | | Collateral Received | | | Net Amount
of Derivative
Assets* | |
BNP Paribas S.A. | | $ | 4,513 | | | $ | (943 | ) | | $ | — | | | $ | 3,570 | |
Citibank N.A. | | | 41,702 | | | | (41,702 | ) | | | — | | | | — | |
Deutsche Bank | | | 528,567 | | | | (336,410 | ) | | | — | | | | 192,157 | |
Societe Generale S.A. | | | 409,629 | | | | (303,082 | ) | | | — | | | | 106,547 | |
UBS A.G. | | | 20,885 | | | | (20,885 | ) | | | — | | | | — | |
| | | | |
| | $ | 1,005,296 | | | $ | (703,022 | ) | | $ | — | | | $ | 302,274 | |
| | | | |
The following table presents the Fund’s derivative liabilities by counterparty net of amounts available for offset under a master netting agreement, or similar agreement, and net of the related collateral pledged by the Fund as of October 31, 2015.
| | | | | | | | | | | | | | | | |
Counterparty | | Gross Liabilities in
Statement of Assets
and Liabilities | | | Derivative
Assets/(Liabilities)
Available for Offset | | | Collateral Pledged | | | Net Amount
of Derivative
Liabilities† | |
BNP Paribas S.A. | | $ | 943 | | | $ | (943 | ) | | $ | — | | | $ | — | |
Citibank N.A. | | | 104,279 | | | | (41,702 | ) | | | — | | | | 62,577 | |
Credit Suisse International | | | 79,445 | | | | — | | | | — | | | | 79,445 | |
Deutsche Bank | | | 336,410 | | | | (336,410 | ) | | | — | | | | — | |
Societe Generale S.A. | | | 303,082 | | | | (303,082 | ) | | | — | | | | — | |
UBS A.G. | | | 140,602 | | | | (20,885 | ) | | | — | | | | 119,717 | |
| | | | |
| | $ | 964,761 | | | $ | (703,022 | ) | | $ | — | | | $ | 261,739 | |
| | | | |
| * | Represents the net amount receivable from the counterparty in the event of default. |
| † | Represents the net amount payable to the counterparty in the event of default. |
(W) Basis for Consolidation for the Wholly-Owned Subsidiary. MainStay Multi-Strategy Cayman Fund Ltd. (the “Cayman Subsidiary”) is organized as an exempted limited company under the laws of the Cayman Islands, and is a wholly-owned and controlled subsidiary of the Fund. The Fund and the Cayman Subsidiary are both advised by the Manager, and are subject to the same investment restrictions and guidelines as well as follows the same compliance policies and procedures. The Cayman Subsidiary serves as an investment vehicle for the Fund to enable the Fund to gain exposure to the commodity markets, primarily through investing up to 25% in the aggregate of the Fund’s assets in the equity securities of the Cayman Subsidiary. In pursuing its investment objective, the Cayman Subsidiary is expected to invest, directly or indirectly through the use of derivatives (including total return swaps), in securities, commodities, commodity-related instruments and other investments. Except where the context otherwise requires, the term “Fund” refers to the Fund together with the Cayman Subsidiary.
Although the Cayman Subsidiary is otherwise subject to the same fundamental, non-fundamental and certain other investment restrictions as the Fund, the investment programs of the Fund and the Cayman Subsidiary are not necessarily identical. The Fund currently conducts its commodity investment activities only through the Cayman Subsidiary, but retains the ability to invest in additional Cayman Islands subsidiary entities in the future. The Fund is currently the sole shareholder of the Cayman Subsidiary, and it is expected that the Fund will remain the sole shareholder and will continue to control the Cayman Subsidiary. As a wholly-owned subsidiary of the Fund, all assets, liabilities, income and expenses of the Cayman Subsidiary are consolidated in the financial statements and financial highlights of the Fund, and all significant intercompany balances, revenues and expenses have been eliminated in consolidation.
(X) Commodity Futures Trading Commission Regulation. The Fund and the Cayman Subsidiary operate subject to
Notes to Consolidated Financial Statements (Unaudited) (continued)
Commodity Futures Trading Commission (“CFTC”) regulation and the Manager and Candriam France S.A.S. (“Candriam” or “Subadvisor”) are registered with the CFTC as a commodity pool operator (“CPO”) and Commodity Trading Advisor (“CTA”), respectively, and each a member of the National Futures Association. The Manager and Candriam act as CPO and CTA, respectively, to the Fund and the Cayman Subsidiary. Accordingly, the Fund and the Manager will comply with certain CFTC rules regarding the disclosure, reporting and recordkeeping requirements that apply with respect to the Fund as a result of the Manager’s registration as a CPO. Generally, these rules allow for substituted compliance with CFTC disclosure and shareholder reporting requirements, based on the Fund’s compliance with comparable SEC requirements. This means that for most of the CFTC’s disclosure and shareholder reporting applicable to the Manager as the Fund’s CPO, the Manager’s compliance with SEC disclosure and shareholder reporting will generally be deemed to fulfill the Manager’s CFTC compliance obligations so long as the Fund operates in compliance with the conditions of CFTC Regulation 4.12.
Candriam operates the Cayman Subsidiary in accordance with an operational exemption from certain CFTC disclosure, reporting and recordkeeping provisions.
As a result of CFTC regulation with respect to the Fund and the Cayman Subsidiary, the Fund and the Cayman Subsidiary may incur additional compliance and other expenses. The CFTC has neither reviewed nor approved the Fund, the Cayman Subsidiary, their investment strategies, or the Fund’s Prospectus or Statement of Additional Information.
For purposes of CFTC Regulation 4.12, the Manager does not manage any other funds or separately managed accounts with investment objectives, strategies and policies that are substantially similar to those of the Fund.
Note 3–Fees and Related Party Transactions
(A) Manager and Subadvisors. New York Life Investments, a registered investment adviser and an indirect, wholly-owned subsidiary of New York Life Insurance Company (“New York Life”), serves as the Fund’s Manager, pursuant to an Amended and Restated Management Agreement (“Management Agreement”). The Manager provides offices, conducts clerical, recordkeeping and bookkeeping services, and keeps most of the financial and accounting records required to be maintained by the Fund. Except for the portion of salaries and expenses that are the responsibility of the Fund, the Manager pays the salaries and expenses of all personnel affiliated with the Fund and certain operational expenses of the Fund. The Fund reimburses New York Life Investments in an amount equal to a portion of the compensation of the Chief Compliance Officer of the Fund. Candriam France S.A.S. (“Candriam France” or “Subadvisor”), a registered investment adviser serves as a Subadvisor, pursuant to the terms of Subadvisory Agreements (“Subadvisory Agreement”) between New York Life Investments and Candriam France, is responsible for the day-to-day portfolio management of a portion of the Fund and the Cayman Subsidiary. Cornerstone Capital Management Holdings LLC (“Cornerstone Holdings” or “Subadvisor”), a registered investment adviser and an indirect, wholly-owned subsidiary of New York Life, serves as a Subadvisor, pursuant to the terms of a Subadvisory Agreement between New York Life Investments and Cornerstone Holdings and is responsible for the day-to-day portfolio
management of a portion of the Fund. Cushing® Asset Management, LP (“Cushing” or “Subadvisor”), a registered investment adviser, serves as a Subadvisor, pursuant to the terms of a Subadvisory Agreement between New York Life Investments and Cushing, is responsible for the day-to-day portfolio management of a portion of the Fund. MacKay Shields LLC (‘‘MacKay Shields’’ or “Subadvisor,” and together with Candriam France, Cornerstone Holdings and Cushing, the “Subadvisors”), a registered investment adviser and an indirect, wholly-owned subsidiary of New York Life, serves as a Subadvisor, pursuant to the terms of a Subadvisory Agreement between New York Life Investments and MacKay Shields, is responsible for the day-to-day portfolio management of a portion of the Fund. New York Life Investments pays for the services of the Subadvisors.
Under the Management Agreement, the Fund pays the Manager a monthly fee for services performed and facilities furnished at an annual rate of 1.25% of the Fund’s average daily net assets.
The Cayman Subsidiary (discussed above) has entered into a separate advisory agreement with New York Life Investments for the management of the Cayman Subsidiary’s portfolio pursuant to which the Cayman Subsidiary is obligated to pay New York Life Investments a management fee at the same rate that the Fund pays New York Life Investments for services provided to the Fund. New York Life Investments is contractually obligated to waive the management fee it receives from the Fund in an amount equal to the management fee paid to New York Life Investments by the Cayman Subsidiary. This waiver arrangement may not be terminated by New York Life Investments as long as its advisory agreement with the Cayman Subsidiary is in place.
New York Life Investments has contractually agreed to waive fees and/or reimburse expenses so that Total Annual Fund Operating Expenses (excluding taxes, interest, litigation, extraordinary expenses, brokerage and other transaction expenses relating to the purchase or sale of portfolio investments, and acquired (underlying) fund fees and expenses) for Class A shares do not exceed 1.80% of its average daily net assets. New York Life Investments will apply an equivalent waiver or reimbursement, in an equal number of basis points, to the other share classes. This agreement will remain in effect until August 31, 2017, and shall renew automatically for one-year terms unless New York Life Investments provides written notice of termination prior to the start of the next term or upon approval by the Board of Trustees of the Fund.
During the period ended October 31, 2015, New York Life Investments earned fees from the Fund in the amount of $533,488 and waived its fees and/or reimbursed expenses in the amount of $275,290.
State Street provides sub-administration and sub-accounting services to the Fund pursuant to an agreement with New York Life Investments. These services include calculating the daily NAVs of the Fund, maintaining the general ledger and sub-ledger accounts for the calculation of the Fund’s NAVs, and assisting New York Life Investments in conducting various aspects of the Fund’s administrative operations. For providing these services to the Fund, State Street is compensated by New York Life Investments.
(B) Distribution, Service and Shareholder Service Fees. The Trust, on behalf of the Fund, has entered into a distribution agreement with NYLIFE Distributors LLC (the “Distributor”), an indirect, wholly-owned subsidiary of New York Life. The Fund has adopted distribution
| | |
| 46 | | MainStay Absolute Return Multi-Strategy Fund |
plans (the “Plans”) in accordance with the provisions of Rule 12b-1 under the 1940 Act.
Pursuant to the Class A and Investor Class Plans, the Distributor receives a monthly distribution fee from the Class A and Investor Class shares at an annual rate of 0.25% of the average daily net assets of the Class A and Investor Class shares for distribution and/or service activities as designated by the Distributor. Pursuant to the Class C Plan, Class C shares pay the Distributor a monthly distribution fee at an annual rate of 0.75% of the average daily net assets of the Class C shares, along with a service fee at an annual rate of 0.25% of the average daily net assets of the Class C shares, for a total 12b-1 fee of 1.00%. Class I shares are not subject to a distribution and/or service fee.
The Plans provide that the distribution and service fees are payable to the Distributor regardless of the amounts actually expended by the Distributor for distribution of the Fund’s shares and service activities.
(C) Sales Charges. During the period ended October 31, 2015, the Fund was advised by the Distributor that the amount of initial sales charges retained on sales of Class A and Investor Class shares were $0 and $620, respectively.
(D) Transfer, Dividend Disbursing and Shareholder Servicing Agent. NYLIM Service Company LLC, an affiliate of New York Life Investments, is the Fund’s transfer, dividend disbursing and shareholder servicing agent pursuant to an agreement between NYLIM Service Company LLC and the Trust. NYLIM Service Company LLC has entered into an agreement with Boston Financial Data Services, Inc. (“BFDS”) pursuant to which BFDS performs certain transfer agent services on behalf of NYLIM Service Company LLC. State Street is the Cayman Subsidiary’s transfer agent pursuant to an agreement between State Street and the Cayman Subsidiary. During the period ended October 31, 2015, transfer agent expenses incurred by the Fund and the Cayman Subsidiary were $525 and $7,431, respectively.
(E) Small Account Fee. Shareholders with small accounts adversely impact the cost of providing transfer agency services. In an effort to reduce total transfer agency expenses, the Fund has implemented a small account fee on certain types of accounts. Certain shareholders with an account balance of less than $1,000 are charged an annual per account fee of $20 (assessed semi-annually), the proceeds from which offset transfer agent fees as reflected in the Consolidated Statement of Operations.
Note 4–Custodian
State Street is the custodian of cash and securities held by the Fund. Custodial fees are charged to the Fund based on the Fund’s net assets and/or the market value of securities held by the Fund and the number of certain cash transactions incurred by the Fund.
Note 5–Line of Credit
The Fund and certain affiliated funds, maintain a line of credit with a syndicate of banks in order to secure a source of funds for temporary purposes to meet unanticipated or excessive redemption requests.
Effective August 4, 2015, under a second amended and restated credit agreement (the “Credit Agreement”), the aggregate commitment amount is $600,000,000 with an optional maximum aggregate amount of $700,000,000. The commitment fee is an annual rate of 0.10% of the average commitment amount payable quarterly, regardless of usage, to Bank of New York Mellon, who serves as the agent to the syndicate. The commitment fee is allocated among the Fund and certain affiliated funds based upon their respective net assets and other factors. Interest on any revolving credit loan is charged based upon the Federal Funds Advances Rate or the one month London InterBank Offered Rate, whichever is higher. The Credit Agreement expires on August 2, 2016, although the Fund, certain affiliated funds and the syndicate of banks may renew the Credit Agreement for an additional year on the same or different terms. Prior to August 4, 2015, the aggregate commitment amount was $600,000,000 with an optional maximum of $700,000,000, and the commitment fee was at an annual rate of 0.08% of the average commitment amount. During the period ended October 31, 2015, there were no borrowings made or outstanding with respect to the Fund under the Credit Agreement.
Note 6–Purchases and Sales of Securities (in 000’s)
During the period ended October 31, 2015, purchases and sales of securities, other than short-term securities, were $64,964 and $35,354, respectively.
Note 7–Capital Share Transactions
| | | | | | | | |
Class A | | Shares | | | Amount | |
Period ended October 31, 2015 (a): | | | | | | | | |
Shares sold | | | 202,646 | | | $ | 2,042,258 | |
Shares redeemed | | | (94,354 | ) | | | (941,284 | ) |
| | | | |
Net increase (decrease) | | | 108,292 | | | $ | 1,100,974 | |
| | | | |
| | |
| | | | | | | | |
Investor Class | | Shares | | | Amount | |
Period ended October 31, 2015 (a): | | | | | | | | |
Shares sold | | | 5,524 | | | $ | 55,273 | |
Shares redeemed | | | (246 | ) | | | (2,453 | ) |
| | | | |
Net increase (decrease) | | | 5,278 | | | $ | 52,820 | |
| | | | |
| | |
| | | | | | | | |
Class C | | Shares | | | Amount | |
Period ended October 31, 2015 (a): | | | | | | | | |
Shares sold | | | 3,049 | | | $ | 30,500 | |
| | | | |
Net increase (decrease) | | | 3,049 | | | $ | 30,500 | |
| | | | |
| | |
| | | | | | | | |
Class I | | Shares | | | Amount | |
Period ended October 31, 2015 (a): | | | | | | | | |
Shares sold | | | 9,992,500 | | | $ | 99,923,085 | |
| | | | |
Net increase (decrease) | | | 9,992,500 | | | $ | 99,923,085 | |
| | | | |
| (a) | The inception date of the Fund was June 18, 2015. |
Note 8–Recent Accounting Pronouncement
In June 2014, FASB issued ASU 2014-11, Transfers & Servicing (Topic 860): Repurchase-to-Maturity Transactions, Repurchase
Notes to Consolidated Financial Statements (Unaudited) (continued)
Financings, and Disclosures, which addresses the financial reporting of repurchase agreements and other similar transactions. The guidance classifies when repurchase agreements and securities lending transactions should be accounted for as secured borrowings, as well as require expanded disclosure of these types of transactions. The guidance is effective for financial statements with fiscal years beginning after December 15, 2014, and for interim periods within those fiscal years. Management is evaluating the impact, if any, of this guidance on the Fund’s financial statement disclosures.
Note 9–Subsequent Events
In connection with the preparation of the consolidated financial statements of the Fund as of and for the period ended October 31, 2015, events and transactions subsequent to October 31, 2015, through the date the consolidated financial statements were issued have been evaluated by the Fund’s management for possible adjustment and/or disclosure. No subsequent events requiring financial statement adjustment or disclosure have been identified.
| | |
| 48 | | MainStay Absolute Return Multi-Strategy Fund |
Board Consideration and Approval of Management Agreement and
Subadvisory Agreements (Unaudited)
Section 15 of the Investment Company Act of 1940, as amended (the “1940 Act”), requires that each mutual fund’s board of trustees review and approve the fund’s investment advisory agreement(s). At its March 24-26, 2015 meeting, the Board of Trustees of the MainStay Group of Funds (“Board”) unanimously approved the Management Agreement with respect to the MainStay Absolute Return Multi-Strategy Fund (“Fund”) and New York Life Investment Management LLC (“New York Life Investments”) and the Subadvisory Agreements between New York Life Investments and each of Cornerstone Capital Management Holdings LLC (“Cornerstone”), Candriam France S.A.S. (“Candriam”), Cushing Asset Management, LP (“Cushing”), and MacKay Shields LLC (“MacKay Shields”) (each, a “Subadviser” and, collectively, the “Subadvisers”) with respect to the Fund.
In reaching its decision to approve the Agreements, the Board considered information furnished by New York Life Investments and the Subadvisers in connection with a contract review process that took place during several meetings, including its March 2015 meeting, as well as other relevant information furnished to the Board throughout the year. Information requested by and furnished to the Board in connection with the contract review process included, among other items, reports on the Fund and “peer funds” prepared by New York Life Investments. The Board also considered information on the fees charged to any other investment advisory clients of New York Life Investments and the Subadvisers (including institutional separate accounts) that follow investment strategies similar to those proposed for the Fund and the rationale for any differences in the Fund’s proposed management and subadvisory fees and the fees charged to those other investment advisory clients. In addition, the Board requested and received information on the expected profitability of the Fund to New York Life Investments and its affiliates, including Cornerstone, Candriam and MacKay Shields, and Cushing and responses from New York Life Investments and the Subadvisers to a series of questions encompassing a variety of topics prepared on behalf of the Board by independent legal counsel to the Board and its Trustees who are not “interested persons” (as such term is defined under the 1940 Act) of the Fund (the “Independent Trustees”). The Board in particular considered materials provided in connection with its special January 23, 2015 meeting regarding the proposed establishment of the Fund. Other information relevant to the Board’s consideration of the Agreements that was provided to the Board at its meetings throughout the year included, among other items, periodic reports on legal and compliance matters, risk management and sales and marketing activity. At various meetings, the Independent Trustees also met in executive session with their independent legal counsel, and met with senior management of New York Life Investments without other representatives of New York Life Investments present. The Board also considered relevant information previously provided to the Board in connection with its review of the investment advisory agreements for other MainStay Funds.
The Board also received an overview of the Fund’s proposed distribution arrangements. In addition, the Board received information regarding the Fund’s anticipated payment of Rule 12b-1 distribution and service fees. New York Life Investments also provided the Board with information regarding the anticipated revenue sharing payments likely to be made to intermediaries that will promote the sale, distribution, and/or servicing of Fund shares.
In considering the Agreements, the Trustees comprehensively reviewed and evaluated all of the information and factors they believed to be relevant and appropriate in light of legal advice furnished to them by independent legal counsel and through the exercise of their own business judgment. The broad factors considered by the Board are described in greater detail below and included, among other items: (i) the nature, scope and quality of the services to be provided to the Fund by New York Life Investments and the Subadvisers; (ii) the qualifications of the proposed portfolio managers for the Fund and the historical investment performance of products managed by such portfolio managers with similar investment strategies to the Fund; (iii) the anticipated costs of the services to be provided, and profits expected to be realized, by New York Life Investments and the Subadvisers from their relationships with the Fund; (iv) the extent to which economies of scale may be realized if the Fund grows, and the extent to which economies of scale may benefit Fund shareholders; and (v) the reasonableness of the Fund’s proposed management and subadvisory fees and overall total ordinary operating expenses, particularly as compared to any similar funds and accounts managed by New York Life Investments and the Subadvisers. The Board also considered the reasonableness of the Fund’s proposed management fee and overall total ordinary operating expenses as compared to certain peer funds.
While individual Trustees may have weighed certain factors or information differently, the Board’s decision to approve the Agreements was based on a consideration of the information provided to the Trustees specifically in connection with the contract review process. The Board’s conclusions with respect to the Agreements may have been based, in part, on the Board’s consideration of the MainStay Group of Funds’ advisory agreements in prior years. In addition to considering the above-referenced factors, the Board observed that in the marketplace there are a range of investment options available to shareholders of the Fund and that the Fund’s shareholders, having had the opportunity to consider other investment options, will have chosen to invest in the Fund. The factors that figured prominently in the Board’s decisions to approve the Agreements are summarized in more detail below.
Nature, Scope and Quality of Services to Be Provided by New York Life Investments and the Subadvisers
The Board examined the nature, scope and quality of the services that New York Life Investments proposed to provide to the Fund. The Board evaluated New York Life Investments’ experience and capabilities in serving as manager of other mutual funds, noting that New York Life Investments manages other mutual funds, serves a variety of other investment advisory clients, including other pooled investment vehicles, and has experience with overseeing mutual fund service providers, including subadvisers. The Board considered the experience of senior personnel at New York Life Investments proposed to provide management and administrative services to the Fund, as well as New York Life Investments’ reputation and financial condition. Additionally, the Board considered New York Life Investments’ substantial responsibilities as proposed manager of the Fund under a “multi-manager” structure in which New York Life Investments would have oversight responsibility for the Fund’s Subadvisers and responsibility for the allocation of the Fund’s assets among multiple Subadvisers, including overseeing reallocation of assets among Subadvisers. The Board further noted that
Board Consideration and Approval of Management Agreement and
Subadvisory Agreements (Unaudited) (continued)
New York Life Investments also proposed to manage one of the sleeves of the Fund directly.
The Board also considered the full range of services that New York Life Investments will supply to the Fund under the terms of the Management Agreement, including: (i) fund accounting and on-going oversight services provided by New York Life Investments’ Fund Administration and Accounting Group; (ii) investment oversight and analytical services provided by New York Life Investments’ Investment Consulting Group; (iii) compliance services provided by the Fund’s Chief Compliance Officer as well as New York Life Investments’ Compliance Department, including oversight and implementation of the Fund’s compliance program; (iv) legal services provided by New York Life Investments’ Office of the General Counsel; and (v) risk management and portfolio trading oversight and analysis by compliance and investment personnel. Additional information about the non-advisory services provided by New York Life Investments will be set forth in the Fund’s Management Agreement. The Board also considered New York Life Investments’ willingness to invest in personnel, infrastructure, technology, operational enhancements, cyber security, information security and shareholder privacy resources that are likely to benefit the Fund and noted that New York Life Investments is responsible for compensating the Fund’s officers. The Board also considered benefits to shareholders of being part of the MainStay Group of Funds, including the privilege of exchanging investments between the same class of shares without the imposition of a sales charge, as described more fully in the Fund’s prospectus.
The Board also examined the nature, scope and quality of the investment advisory services that the Subadvisers propose to provide to the Fund. The Board evaluated the Subadvisers’ experience in managing other portfolios, including those with similar investment strategies to the various proposed investment strategies that would initially constitute the Fund. It examined each Subadviser’s track records and experience in providing investment advisory services, the experience of investment advisory, senior management and administrative personnel at the Subadvisers, and each Subadviser’s overall legal and compliance environment. The Board further considered New York Life Investments’ policies, procedures and systems to reasonably assure compliance with applicable laws and regulations. In addition, the Board considered the policies and procedures in place with respect to matters that may involve conflicts of interest between the Fund’s investments and those of other accounts managed by the Subadvisers. The Board also reviewed each Subadviser’s willingness to invest in personnel designed to benefit the Fund. In this regard, the Board considered the experience of the Fund’s proposed portfolio managers, including with respect to other products with similar investment strategies as the Fund, the number of accounts managed by the portfolio managers and the method for compensating portfolio managers.
Based on these considerations, the Board concluded, within the context of its overall determinations regarding the Agreements, that the Fund likely would benefit from the nature, scope and quality of these services as a result of New York Life Investments’ and each Subadviser’s experience, personnel, operations and resources.
Investment Performance
In connection with the Board’s consideration of the Agreements, the Board noted that the Fund had no investment performance track record
because the Fund had not yet commenced investment operations. The Board discussed with management and the Fund’s proposed portfolio management team the Fund’s investment process, strategies and risks.
The Board considered various aspects of the Fund’s investment processes and strategies, including the proposed hedging strategies anticipated to be implemented within various sleeves of the Fund. The Board also considered that the Fund may invest a portion of its assets in one or more wholly-owned subsidiaries organized under the laws of the Cayman Islands (“Cayman Subsidiary”). In this regard, the Board considered the investment management services that New York Life Investments and certain Subadvisers proposed to provide to the Cayman Subsidiary and the expected benefits to be derived by the Fund from its use of one or more Cayman Subsidiaries. Additionally, the Board considered the historical performance of other investment portfolios with similar investment strategies that are or have been managed by the proposed portfolio managers for the Fund. Based on these considerations, the Board concluded that the Fund was likely to be managed responsibly and capably by New York Life Investments and the Subadvisers. The Fund discloses information about investment performance in the Portfolio Management Discussion and Analysis, Investment and Performance Comparison and Financial Highlights sections of this Annual Report and in the Fund’s prospectus.
Costs of the Services Provided, and Profits Realized, by New York Life Investments and the Subadvisers
The Board considered the anticipated costs of the services to be provided by New York Life Investments and the Subadvisers under the Agreements, and the profits expected to be realized by New York Life Investments and its affiliates and the Subadvisers due to their relationships with the Fund. Because Candriam, Cornerstone and MacKay Shields are affiliates of New York Life Investments whose subadvisory fees are to be paid directly by New York Life Investments, the Board considered anticipated cost and profitability information for New York Life Investments and these Subadvisers in the aggregate. Because the subadvisory fees of Cushing are negotiated at arm’s-length by New York Life Investments and are to be paid by New York Life Investments, not the Fund, the Board primarily considered the profits expected to be realized by New York Life Investments and its affiliates with respect to the Fund.
In evaluating the anticipated costs of the services to be provided by, and the expected profits to be realized by, New York Life Investments and its affiliates and the Subadvisers due to their relationships with the Fund, the Board considered, among other factors, each party’s investments in personnel, systems, equipment and other resources necessary to manage the Fund, and that New York Life Investments will be responsible for paying the subadvisory fees for the Fund. The Board acknowledged that New York Life Investments and each Subadviser must be in a position to pay and retain experienced professional personnel to provide services to the Fund, and that the ability to maintain a strong financial position is important in order for New York Life Investments and the Subadvisers to provide high-quality services to the Fund. The Board also considered the investment management services that New York Life Investments and certain Subadvisers proposed to provide to the Cayman Subsidiary and the related contractual management fee waiver, which obligates New York Life Investments to waive the
| | |
| 50 | | MainStay Absolute Return Multi-Strategy Fund |
management fee it receives from the Fund in an amount equal to the management fee paid to New York Life Investments by the Cayman Subsidiary. The Board also recognized that the Fund will benefit from the allocation of certain fixed costs across the MainStay Group of Funds, among other expected benefits resulting from its relationship with New York Life Investments.
In addition, the Board acknowledged the difficulty in obtaining reliable comparative data about mutual fund managers’ profitability, since such information generally is not publicly available and may be impacted by numerous factors, including the structure of a fund manager’s organization, the types of funds it manages, the methodology used to allocate certain fixed costs to specific funds, and the manager’s capital structure and costs of capital. In connection with the annual fund profitability analysis that New York Life Investments presents to the Board, the Board in 2014 engaged Bobroff Consulting, Inc., an independent third-party consultant, to review the methods used to allocate costs to the MainStay Funds, and among individual Funds. As part of this engagement, the consultant analyzed: (i) the various New York Life Investments’ business units and affiliated subadvisers that provide services to the MainStay Funds; (ii) how costs are allocated to the funds managed by New York Life Investments, and to other lines of businesses; and (iii) how New York Life Investments’ cost allocation methods and profitability reports compare to industry practices. The Board noted that the independent consultant had concluded that New York Life Investments’ methods for allocating costs and procedures for estimating overall profitability of the funds in the MainStay Group of Funds are reasonable, consistent with industry practice and likely to produce reasonable profitability estimates. While recognizing the difficulty in evaluating a manager’s profitability with respect to the Fund and noting that other profitability methodologies may also be reasonable, the Board concluded that the profitability methodology presented by New York Life Investments to the Board was reasonable in all material respects.
In considering the anticipated costs and profitability of the Fund, the Board also considered certain fall-out benefits that may be realized by New York Life Investments and its affiliates—including Candriam, Cornerstone and MacKay Shields—and Cushing due to their relationships with the Fund. The Board recognized, for example, the benefits to the Subadvisers from legally permitted “soft-dollar” arrangements by which brokers provide research and other services to the Subadvisers in exchange for commissions paid by the Fund with respect to trades on the Fund’s portfolio securities. In this regard, the Board also requested and received information from New York Life Investments and Cushing concerning other business relationships between Cushing and its affiliates and New York Life Investments and its affiliates.
The Board further considered that, in addition to fees earned by New York Life Investments for managing the Fund, New York Life Investments’ affiliates also would earn revenues from serving the Fund in various other capacities, including as the Fund’s transfer agent and distributor. The Board observed that information about these other anticipated revenues, and their impact on the profitability of the Fund to New York Life Investments and its affiliates, was furnished to the Board as part of the contract review process. The Board noted that, although it assessed the overall profitability of the Fund to New York Life Investments and its affiliates as part of the contract review process, when considering the reasonableness of the fees to be paid to New York Life
Investments and its affiliates under the Agreements, the Board considered the profitability of New York Life Investments’ relationship with the Fund on a pre-tax basis and without regard to distribution expenses.
After evaluating the information presented to the Board, the Board concluded, within the context of its overall determinations regarding the Agreements, that any profits expected to be realized by New York Life Investments and its affiliates, including Candriam, Cornerstone and MacKay Shields, due to their relationships with the Fund supported the Board’s decision to approve the Agreements. With respect to Cushing, the Board concluded that any profits to be realized by Cushing due to its relationship with the Fund would be the result of arm’s-length negotiations between New York Life Investments and Cushing, and will be based on fees paid to Cushing by New York Life Investments, not the Fund.
Extent to Which Economies of Scale May Be Realized as the Fund Grows
The Board considered whether the Fund’s proposed expense structure permits economies of scale to be shared with Fund investors. The Board also considered a report from New York Life Investments, prepared at the request of the Board, that addressed economies of scale in the mutual fund business generally, the changing economics of the mutual fund business and the various ways in which the benefits of economies of scale may be shared with the MainStay Group of Funds. While recognizing the difficulty of determining future economies of scale with precision, the Board acknowledged that economies of scale may be shared with the Fund in a number of ways, including, for example, through the imposition of management fee breakpoints and by initially setting relatively low management fees. The Board reviewed information from New York Life Investments showing how the Fund’s management fee schedule compared to fee schedules of other funds and accounts managed by New York Life Investments and how it hypothetically would compare with fees paid for similar services by peer funds at varying asset levels.
Based on this information, the Board concluded, within the context of its overall determinations regarding the Agreements, that the Fund’s expense structure appropriately reflects economies of scale for the benefit of Fund investors. The Board noted, however, that it would continue to evaluate the reasonableness of the Fund’s expense structure as the Fund grows over time.
Management and Subadvisory Fees and Total Ordinary Operating Expenses
The Board evaluated the reasonableness of the fees to be paid under the Agreements and the Fund’s expected total ordinary operating expenses. The Board primarily considered the reasonableness of the management fee to be paid by the Fund to New York Life Investments, because the fees to be paid to the Subadvisers will be paid by New York Life Investments, not the Fund.
In assessing the reasonableness of the Fund’s fees and expenses, the Board primarily considered comparative data provided by New York Life Investments on the fees and expenses charged by similar mutual funds managed by other investment advisers. In addition, the Board considered information provided by New York Life Investments and the
Board Consideration and Approval of Management Agreement and
Subadvisory Agreements (Unaudited) (continued)
Subadvisers on fees charged to other investment advisory clients, including institutional separate accounts and other funds with similar investment objectives as the Fund. The Board also took into account explanations provided by New York Life Investments about the different scope of services provided to registered investment companies as compared with other investment advisory clients. Additionally, the Board considered the impact of any contractual breakpoints, voluntary waivers and expense limitation arrangements on the Fund’s net management fee and expenses.
The Board noted that, outside of the Fund’s management fee and the fees charged under a share class’s Rule 12b-1 and/or shareholder services plans, a share class’s most significant “other expenses” are transfer agent fees. Transfer agent fees will be charged to the Fund based on the number of shareholder accounts (a “per-account” fee) as compared with certain other fees (e.g., management fees), which will be charged based on the Fund’s average net assets. The Board took into account information from New York Life Investments showing that the Fund’s transfer agent fee schedule is reasonable, including industry data demonstrating that the per-account fees that NYLIM Service Company LLC, the Fund’s transfer agent, will charge the Fund are within the range of per-account fees charged by transfer agents to other mutual funds. In addition, the Board considered NYLIM Service Company LLC’s profitability in connection with the transfer agent services it will provide to the Fund. The Board also noted information received from NYLIM Service Company LLC regarding the sub-transfer agency payments it may make to intermediaries in connection with the services it will provide to the Fund.
The Board considered that, because the Fund’s transfer agent fees will be billed on a per-account basis, the impact of transfer agent fees on a share class’s expense ratio may be more significant in cases where the share class has a high number of accounts with limited assets (i.e., small accounts). The Board observed that transfer agent fees are a significant portion of total expenses of a number of funds in the MainStay Group of Funds. The impact of transfer agent fees on the expense ratios of these MainStay Funds tend to be greater than for other open-end retail funds, because the MainStay Group of Funds generally has a significant number of small accounts relative to competitor funds. The Board acknowledged the role that the MainStay Group of Funds historically has played in serving the investment needs of New York Life Insurance Company (“New York Life”) policyholders, who often maintain smaller account balances than other fund investors. The Board also recognized measures that it and New York Life Investments have taken in recent years to mitigate the effect of small accounts on the expense ratios of Fund share classes, including: (i) encouraging New York Life agents to consolidate multiple small accounts held by the same investor into one MainStay Asset Allocation Fund account; (ii) introducing Investor Class shares for certain MainStay Funds in early 2008 to consolidate smaller account investors; (iii) closing small accounts with balances below $250 in Investor Class shares or $750 in all other classes of shares; (iv) eliminating an exception with no minimum investment amount with respect to AutoInvest accounts with subsequent monthly purchases of $100; (v) since 2007, charging an annual $20.00 small account fee on certain accounts with balances below $1,000; and (vi) modifying the approach for billing transfer agent expenses to reduce the degree of subsidization by large accounts of
smaller accounts. The Board also considered that NYLIM Service Company LLC had waived its cost of living adjustments in 2014 and 2015. In addition, the Board acknowledged New York Life Investments’ continued efforts to encourage intermediaries to consolidate small accounts in multiple Funds held by the same investor into a single Asset Allocation Fund account, if appropriate under the circumstances, in an effort to mitigate the effect of small accounts on the funds in the MainStay Group of Funds.
After considering all of the factors outlined above, the Board concluded that the Fund’s proposed management and subadvisory fees and anticipated total ordinary operating expenses were within a range that is competitive and, within the context of the Board’s overall conclusions regarding the Agreements, support a conclusion that these fees and expenses are reasonable.
Conclusion
On the basis of the information and factors summarized above and the evaluation thereof, the Board as a whole, including the Independent Trustees who are not parties to the Agreements or “interested persons” of any such party voting separately, unanimously voted to approve the Agreements.
| | |
| 52 | | MainStay Absolute Return Multi-Strategy Fund |
Proxy Voting Policies and Procedures and Proxy Voting Record
A description of the policies and procedures that New York Life Investments uses to vote proxies related to the Fund’s securities is available without charge, upon request, (i) by visiting the Fund’s website at mainstaylnvestments.com; and (ii) on the Securities and Exchange Commission’s (SEC) website at www.sec.gov.
The Fund is required to file with the SEC its proxy voting record for the 12-month period ending June 30 on Form N-PX. The Fund’s most recent Form N-PX or proxy voting record is available free of charge upon request by calling 800-MAINSTAY (624-6782); visiting the Fund’s website at mainstayinvestments.com; or on the SEC’s website at www.sec.gov.
Shareholder Reports and Quarterly Portfolio Disclosure
The Fund is required to file its complete schedule of portfolio holdings with the SEC for its first and third fiscal quarters on Form N-Q. The Fund’s Form N-Q is available without charge, on the SEC’s website at www.sec.gov or by calling MainStay Investments at 800-MAINSTAY (624-6782). You also can obtain and review copies of Form N-Q by visiting the SEC’s Public Reference Room in Washington, DC (information on the operation of the Public Reference Room may be obtained by calling 1-800-SEC-0330).
This page intentionally left blank
MainStay Funds
MainStay offers a wide range of Funds for virtually any investment need. The full array of MainStay open-end offerings is listed here, with information about the manager, subadvisors, legal counsel and independent registered public accounting firms.
Equity
U.S. Equity
MainStay Common Stock Fund
MainStay Cornerstone Growth Fund
MainStay Epoch U.S. All Cap Fund
MainStay Epoch U.S. Equity Yield Fund
MainStay ICAP Equity Fund
MainStay ICAP Select Equity Fund
MainStay Large Cap Growth Fund
MainStay MAP Fund
MainStay S&P 500 Index Fund
MainStay U.S. Equity Opportunities Fund
MainStay U.S. Small Cap Fund
International/Global Equity
MainStay Emerging Markets Opportunities Fund
MainStay Epoch Global Choice Fund
MainStay Epoch Global Equity Yield Fund
MainStay Epoch International Small Cap Fund
MainStay ICAP International Fund
MainStay International Equity Fund
MainStay International Opportunities Fund
Income
Taxable Bond
MainStay Floating Rate Fund
MainStay Global High Income Fund
MainStay Government Fund
MainStay High Yield Corporate Bond Fund
MainStay High Yield Opportunities Fund
MainStay Indexed Bond Fund
MainStay Short Duration High Yield Fund
MainStay Total Return Bond Fund
MainStay Unconstrained Bond Fund
Municipal/Tax Advantaged Bond
MainStay California Tax Free Opportunities Fund1
MainStay High Yield Municipal Bond Fund
MainStay New York Tax Free Opportunities Fund2
MainStay Tax Advantaged Short Term Bond Fund
MainStay Tax Free Bond Fund
Money Market
MainStay Money Market Fund
Mixed Asset
MainStay Balanced Fund
MainStay Convertible Fund
MainStay Income Builder Fund
Alternative
MainStay Absolute Return Multi-Strategy Fund
MainStay Cushing MLP Premier Fund
MainStay Cushing Renaissance Advantage Fund
MainStay Cushing Royalty Energy Income Fund
MainStay Marketfield Fund
Asset Allocation/Target Date
MainStay Conservative Allocation Fund
MainStay Growth Allocation Fund
MainStay Moderate Allocation Fund
MainStay Moderate Growth Allocation Fund
MainStay Retirement 2010 Fund
MainStay Retirement 2020 Fund
MainStay Retirement 2030 Fund
MainStay Retirement 2040 Fund
MainStay Retirement 2050 Fund
Manager
New York Life Investment Management LLC
New York, New York
Subadvisors
Candriam France S.A.S.3
Paris, France
Cornerstone Capital Management Holdings LLC3
New York, New York
Cornerstone Capital Management LLC3
Bloomington, Minnesota
Cushing Asset Management, LP
Dallas, Texas
Epoch Investment Partners, Inc.
New York, New York
Institutional Capital LLC3
Chicago, Illinois
MacKay Shields LLC3
New York, New York
Marketfield Asset Management LLC
New York, New York
Markston International LLC
White Plains, New York
NYL Investors LLC3
New York, New York
Winslow Capital Management LLC
Minneapolis, Minnesota
Legal Counsel
Dechert LLP
Independent Registered Public Accounting Firms
KPMG LLP4
PricewaterhouseCoopers LLP5
1. This Fund is only registered for sale in AZ, CA, NV, OR, UT, and WA.
2. This Fund is only registered for sale in CT, DE, FL, MA, NJ, NY, and VT.
3. An affiliate of New York Life Investment Management LLC.
4. For all Funds listed above except MainStay Marketfield Fund.
5. For MainStay Marketfield Fund only.
Not part of the Semiannual Report
For more information
800-MAINSTAY (624-6782)
mainstayinvestments.com
The MainStay Funds® are managed by New York Life Investment Management LLC and distributed through NYLIFE Distributors LLC, 169 Lackawanna Avenue, Parsippany, NJ 07054, a wholly owned subsidiary of New York Life Insurance Company. NYLIFE Distributors LLC is a Member FINRA/SIPC.
MainStay Investments® is a registered service mark and name under which New York Life Investment Management LLC does business. MainStay Investments, an indirect subsidiary of New York Life Insurance Company, New York, NY 10010, provides investment advisory products and services.
This report may be distributed only when preceded or accompanied by a current Fund prospectus.
©2015 NYLIFE Distributors LLC. All rights reserved.
| | | | | | | | |
| Not FDIC/NCUA Insured | | Not a Deposit | | May Lose Value | | No Bank Guarantee | | Not Insured by Any Government Agency |
| | |
| 1673510 MS291-15 | | MSARM10-12/15 NL269 |
MainStay Tax Advantaged Short Term Bond Fund
Message from the President and Semiannual Report
Unaudited | October 31, 2015


This page intentionally left blank
Message from the President
The six-month period ended October 31, 2015, was marked by increased market volatility, particularly after the People’s Bank of China devalued the Chinese yuan on August 11, 2015. Following the devaluation, many stock markets around the world dropped substantially. Some took months to recover.
U.S. large-cap stocks were able to end the six-month reporting period in positive territory. Concerns that the Federal Reserve might raise the federal funds target rate weighed on many investors during the reporting period. Successive developments in employment, inflation and the stock market, however, led the Federal Reserve to repeatedly postpone a tightening move. According to Russell data, U.S. growth stocks outperformed U.S. value stocks at most capitalization levels during the reporting period, with the smallest companies, known as microcaps, being the sole exception.
Mid-cap and small-cap stocks generally provided negative returns during the reporting period; and by various measures, the stock market as a whole was relatively flat to slightly negative.
On the whole, international, global and emerging-market stocks all provided negative returns for the reporting period, with emerging-market stocks registering double-digit declines. Emerging markets suffered from a number of difficulties, including slowing growth in China, low oil and gas prices and slack demand for metals. This combination led to fewer exports.
The U.S. bond market saw mixed results during the reporting period. Yields on 20-year U.S. Treasury bonds closed the reporting period where they began, but yields on all other U.S. Treasury securities rose. In the aggregate, U.S. investment-grade bonds, provided negative total returns for the reporting
period, as did high-yield bonds, leveraged loans and convertible securities. Municipal bonds, on the other hand, generally advanced during the reporting period, regardless of quality.
The stock and bond markets are constantly changing, often in unexpected ways. That’s why at MainStay, we encourage investors to view short-term performance in light of their long-term financial goals.
Rather than shifting investments every time the market moves or interest rates change, the portfolio managers of the MainStay Funds seek to pursue the investment objectives of their respective Funds. They may draw upon time-tested investment strategies, risk-management techniques and their own market experience as they seek to position their Funds for the long-term benefit of our shareholders.
The following pages provide more detailed information about the specific markets, securities and investment decisions that most affected your MainStay Fund during the six months ended October 31, 2015. We hope that you will carefully review this report and use it as you consider ways to pursue your personal financial goals and objectives.
Sincerely,

Stephen P. Fisher
President
The opinions expressed are as of the date of this report and are subject to change. There is no guarantee that any forecast made will come to pass. This material does not constitute investment advice and is not intended as an endorsement of any specific investment. Past performance is no guarantee of future results.
Not part of the Semiannual Report
Table of Contents
Investors should refer to the Fund’s Summary Prospectus and/or Prospectus and consider the Fund’s investment objectives, strategies, risks, charges and expenses carefully before investing. The Summary Prospectus and/or Prospectus contain this and other information about the Fund. You may obtain copies of the Fund’s Summary Prospectus, Prospectus and Statement of Additional Information free of charge, upon request, by calling toll-free 800-MAINSTAY (624-6782), by writing to NYLIFE Distributors LLC, Attn: MainStay Marketing Department, 169 Lackawanna Avenue, Parsippany, New Jersey 07054 or by sending an e-mail to MainStayShareholderServices@nylim.com. These documents are also available via the MainStay Funds’ website at mainstayinvestments.com/documents. Please read the Summary Prospectus and/or Prospectus carefully before investing.
Investment and Performance Comparison1 (Unaudited)
Performance data quoted represents past performance. Past performance is no guarantee of future results. Because of market volatility, current performance may be lower or higher than the figures shown. Investment return and principal value will fluctuate, and as a result, when shares are redeemed, they may be worth more or less than their original cost. The graph below depicts the historical performance of Class I shares of the Fund. Performance will vary from class to class based on differences in class-specific expenses and sales charges. For performance information current to the most recent month-end, please call 800-MAINSTAY (624-6782) or visit mainstayinvestments.com.
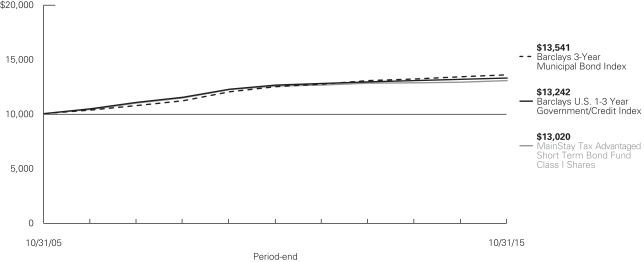
Average Annual Total Returns for the Period Ended October 31, 2015
| | | | | | | | | | | | | | | | | | | | | | | | |
| Class | | Sales Charge | | | | Six Months | | | One Year | | | Five Years | | | Ten Years | | | Gross
Expense
Ratio2 | |
| Class A Shares | | Maximum 1% Initial Sales Charge3 | | With sales charges Excluding sales charges | |
| –2.35
0.67 | %
| |
| –2.09
0.94 | %
| |
| –0.07
0.54 | %
| |
| 2.09
2.40 | %
| |
| 1.12
1.12 | %
|
| Investor Class Shares4 | | Maximum 1% Initial Sales Charge3 | | With sales charges Excluding sales charges | |
| –2.54
0.48 |
| |
| –2.52
0.49 |
| |
| –0.44
0.17 |
| |
| 1.83
2.14 |
| |
| 1.48
1.48 |
|
| Class I Shares | | No Sales Charge | | | | | 0.79 | | | | 1.19 | | | | 0.80 | | | | 2.67 | | | | 0.87 | |
| 1. | The performance table and graph do not reflect the deduction of taxes that a shareholder would pay on distributions or Fund share redemptions. Total returns reflect maximum applicable sales charges as indicated in the table above, changes in share price, and reinvestment of dividend and capital gain distributions. The graph assumes the initial investment amount shown above and reflect the deduction of all sales charges that would have applied for the periods of investment. Performance figures reflect certain fee waivers and/or expense limitations, without which total returns may have been lower. For more information on share classes and current fee waivers and/or expense limitations, please refer to the notes to the financial statements. |
| 2. | The gross expense ratios presented reflect the Fund’s “Total Annual Fund Operating Expenses” from the most recent Prospectus and may differ from other expense ratios disclosed in this report. |
| 3. | The Maximum initial sales charge prior to June 1, 2015 was 3.00%. |
| 4. | Performance figures for Investor Class shares, first offered on February 28, 2008, include the historical performance of Class A shares through February 27, 2008, adjusted for differences in certain expenses and fees. Unadjusted, the performance shown for Investor Class shares would likely have been different. |
The footnotes on the next page are an integral part of the table and graph and should be carefully read in conjunction with them.
| | | | | | | | | | | | | | | | |
| Benchmark Performance | | Six
Months | | | One
Year | | | Five
Years | | | Ten
Years | |
Barclays 3-Year Municipal Bond Index5 | | | 1.08 | % | | | 1.21 | % | | | 1.70 | % | | | 3.08 | % |
Barclays U.S. 1-3 Year Government/Credit Index6 | | | 0.31 | | | | 0.87 | | | | 0.98 | | | | 2.85 | |
Average Lipper Short U.S. Government Fund7 | | | –0.02 | | | | 0.38 | | | | 0.41 | | | | 2.25 | |
| 5. | The Barclays 3-Year Municipal Bond Index is considered representative of the broad market for investment grade, tax-exempt bonds with a maturity range of 2-4 years. The Barclays 3-Year Municipal Bond Index is the Fund’s broad-based securities-market index for comparison purposes. Total returns assume reinvestment of all dividends and capital gains. An investment cannot be made directly into an index. |
| 6. | The Barclays U.S. 1-3 Year Government/Credit Index includes investment grade corporate debt issues as well as debt issues of U.S. government agencies and the U.S. Treasury, with maturities of one to three years. The Barclays U.S. 1-3 Year Government/Credit Index is the Fund’s secondary |
| | benchmark. Total returns assume reinvestment of all dividends and capital gains. An investment cannot be made directly in an index. |
| 7. | The Average Lipper Short U.S. Government Fund is representative of funds that invest primarily in securities issued or guaranteed by the U.S. government, its agencies, or its instrumentalities, with dollar-weighted average maturities of less than three years. This benchmark is a product of Lipper Inc. Lipper Inc. is an independent monitor of fund performance. Results are based on average total returns of similar funds with all dividend and capital gain distributions reinvested. |
The footnotes on the preceding page are an integral part of the table and graph and should be carefully read in conjunction with them.
| | |
| 6 | | MainStay Tax Advantaged Short Term Bond Fund |
Cost in Dollars of a $1,000 Investment in MainStay Tax Advantaged Short Term Bond Fund (Unaudited)
The example below is intended to describe the fees and expenses borne by shareholders during the six-month period from May 1, 2015, to October 31, 2015, and the impact of those costs on your investment.
Example
As a shareholder of the Fund, you incur two types of costs: (1) transaction costs, including exchange fees and sales charges (loads) on purchases (as applicable), and (2) ongoing costs, including management fees, distribution and/or service (12b-1) fees, and other Fund expenses (as applicable). This example is intended to help you understand your ongoing costs (in dollars) of investing in the Fund and to compare these costs with the ongoing costs of investing in other mutual funds. The example is based on an investment of $1,000 made at the beginning of the six-month period and held for the entire period from May 1, 2015, to October 31, 2015.
This example illustrates your Fund’s ongoing costs in two ways:
Actual Expenses
The second and third data columns in the table below provide information about actual account values and actual expenses. You may use the information in these columns, together with the amount you invested, to estimate the expenses that you paid during the six months ended October 31, 2015. Simply divide your account value by $1,000 (for example, an $8,600 account value divided by $1,000 = 8.6), then
multiply the result by the number under the heading entitled “Expenses Paid During Period” to estimate the expenses you paid on your account during this period.
Hypothetical Example for Comparison Purposes
The fourth and fifth data columns in the table below provide information about hypothetical account values and hypothetical expenses based on the Fund’s actual expense ratio and an assumed rate of return of 5% per year before expenses, which is not the Fund’s actual return. The hypothetical account values and expenses may not be used to estimate the actual ending account balances or expenses you paid for the six-month period shown. You may use this information to compare the ongoing costs of investing in the Fund with the ongoing costs of investing in other Funds. To do so, compare this 5% hypothetical example with the 5% hypothetical examples that appear in the shareholder reports of the other Funds.
Please note that the expenses shown in the table are meant to highlight your ongoing costs only and do not reflect any transactional costs, such as exchange fees or sales charges (loads). Therefore, the fourth and fifth data columns of the table are useful in comparing ongoing costs only and will not help you determine the relative total costs of owning different funds. In addition, if these transactional costs were included, your costs would have been higher.
| | | | | | | | | | | | | | | | | | | | |
| | | | | | | | | | | | | | | | |
| Share Class | | Beginning Account Value 5/1/15 | | | Ending Account
Value (Based
on Actual
Returns and
Expenses)
10/31/15 | | | Expenses Paid During Period1 | | | Ending Account
Value (Based on
Hypothetical
5% Annualized
Return and
Actual Expenses)
10/31/15 | | | Expenses
Paid
During
Period1 | |
| | | | | |
| Class A Shares | | $ | 1,000.00 | | | $ | 1,006.70 | | | $ | 4.09 | | | $ | 1,021.10 | | | $ | 4.12 | |
| | | | | |
| Investor Class Shares | | $ | 1,000.00 | | | $ | 1,004.80 | | | $ | 6.00 | | | $ | 1,019.20 | | | $ | 6.04 | |
| | | | | |
| Class I Shares | | $ | 1,000.00 | | | $ | 1,007.90 | | | $ | 2.83 | | | $ | 1,022.30 | | | $ | 2.85 | |
| 1. | Expenses are equal to the Fund’s annualized expense ratio of each class (0.81% for Class A, 1.19% for Investor Class and 0.56% for Class I) multiplied by the average account value over the period, divided by 366 and multiplied by 184 (to reflect the six-month period). The table above represents the actual expenses incurred during the six-month period. |
Portfolio Composition as of October 31, 2015 (Unaudited)
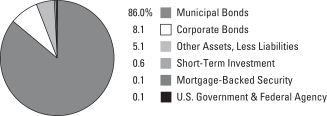
See Portfolio of Investments beginning on page 11 for specific holdings within these categories.
Top Ten Issuers Held as of October 31, 2015 (excluding short-term investment) (Unaudited)
| 1. | St. Paul Housing & Redevelopment Authority, Healtheast Care System, Revenue Bonds, 5.00%, due 11/15/18 |
| 2. | Commonwealth of Puerto Rico, Public Improvement, Unlimited General Obligation, (zero coupon)–5.50%, due 7/1/16–7/1/18 |
| 3. | State of Illinois, Unlimited General Obligation, 5.00%–5.50%, due 1/1/17–8/1/18 |
| 4. | Chicago Board of Education, Unlimited General Obligation, 3.40%–5.50%, due 12/1/15–12/1/18 |
| 5. | City of Chicago IL, Unlimited General Obligation, 4.125%–5.00%, due 12/1/16–1/1/19 |
| 6. | Town of Oyster Bay NY, Limited General Obligation, 3.00%, due 3/1/18 |
| 7. | New Jersey Transportation Trust Fund Authority, Revenue Bonds, 5.50%, due 12/15/16–12/15/17 |
| 8. | RBC Municipal Products, Inc., Revenue Bonds, 1.00%, due 5/1/17 |
| 9. | Hartland Consolidated Schools, Unlimited General Obligation, 1.386%, due 5/1/18 |
| 10. | E-470 Public Highway Authority, Revenue Bonds, 2.00%–5.00%, due 9/1/16–9/1/19 |
| | |
| 8 | | MainStay Tax Advantaged Short Term Bond Fund |
Portfolio Management Discussion and Analysis (Unaudited)
Questions answered by portfolio managers Dan Roberts, PhD, Louis N. Cohen, CFA, Claude Athaide, PhD, CFA, John Loffredo, CFA, Robert DiMella, CFA, Michael Petty, David Dowden, Scott Sprauer and Frances Lewis of MacKay Shields LLC, the Fund’s Subadvisor.
How did MainStay Tax Advantaged Short Term Bond Fund perform relative to its benchmarks and peers during the six months ended October 31, 2015?
Excluding all sales charges, MainStay Tax Advantaged Short Term Bond Fund returned 0.67% for Class A shares and 0.48% for Investor Class shares for the six months ended October 31, 2015. Over the same period, Class I shares returned 0.79%. For the six months ended October 31, 2015, all share classes underperformed the 1.08% return of the Barclays 3-Year Municipal Bond Index,1 which is the Fund’s primary benchmark, but outperformed the 0.31% return of the Barclays U.S.
1–3 Year Government/Credit Index, which is the Fund’s secondary benchmark.1 Over the same period, all share classes outperformed the –0.02% return of the Average Lipper2 Short U.S. Government Fund. See page 5 for Fund returns with applicable sales charges.
Were there any changes to the Fund during the reporting period?
Effective June 1, 2015, the Fund changed its name from MainStay Short Term Bond Fund to MainStay Tax Advantaged Short Term Bond Fund. On the same date, changes were made to the Fund’s principal investment strategies and investment process to allow the Fund to invest at least 50% of its assets in tax-exempt municipal securities. Accordingly, the Fund’s investment objective was changed to indicate that the Fund seeks after-tax total return. For more information on these and other changes to the Fund effective June 1, 2015, please see the prospectus supplement dated March 27, 2015.
What factors affected the Fund’s relative performance during the reporting period?
The Fund maintained a shorter duration3 than that of the Barclays 3-Year Municipal Bond Index during the reporting period. Having a shorter duration than the Index and a cash position at the end of the reporting period detracted slightly from the Fund’s relative performance during the reporting period as municipal yields gravitated lower across the entire maturity spectrum and taxable yields at the short end of the yield curve4 trended higher. The Fund’s exposure to taxable bonds detracted from relative performance, as the Barclays 3-Year Municipal Bond Index includes only tax-exempt bonds.
What was the Fund’s duration strategy during the reporting period?
Overall, our strategy was to keep the Fund’s duration close to that of its investable universe, which includes investment-grade municipal bonds, taxable fixed-income bonds, as well as insured and uninsured bonds of U.S. territories (Puerto Rico, Guam and the U.S. Virgin Islands). At times, depending on conditions in the municipal market, seasonal technicals (supply and demand) and our outlook for what lies ahead, we may adjust the Fund’s duration modestly shorter or longer. During the reporting period, the Fund’s duration was shorter than that of the Barclays 3-Year Municipal Bond Index as we continued to restructure the Fund to reflect its new investment strategy. At the end of the reporting period the Fund’s duration was 1.93 years.
What specific factors, risks or market forces prompted significant decisions for the Fund during the reporting period?
The economic slowdown in China, along with the dramatic drop in oil and commodity prices, provided a disinflationary backdrop during the reporting period. This, coupled with a mixed economic outlook domestically, allowed the Federal Reserve to hold off increasing the federal funds target rate until such a move would be warranted by economic data. This scenario created a somewhat volatile rate environment during the reporting period as yields rose and fell with each economic release. The uncertainty surrounding the economy and the Federal Reserve allowed the Fund to purchase attractively priced tax-exempt municipal securities in the new-issue and secondary markets, as dealer capital remained constrained and tax-exempt ratios were elevated. This also allowed the Fund to exit its short-term U.S. Treasury holdings at competitive prices during the reporting period. Additionally, in light of the potential risks of Puerto Rico credit restructurings, the Fund’s Puerto Rico investments were exclusively in bonds guaranteed by monoline insurance companies. In our opinion, investing in insured Puerto Rico credits provided the Fund with above-market tax-free income and uninterrupted payments of principal and interest in the event of a restructuring. This approach to investing in Puerto Rico bonds produced significant outperformance when compared to investing in uninsured Puerto Rico credits during the reporting period.
| 1. | See footnote on page 6 for more information on this index. |
| 2. | See footnote on page 6 for more information on Lipper Inc. |
| 3. | Duration is a measure of the price sensitivity of a fixed-income investment to changes in interest rates. Duration is expressed as a number of years and is considered a more accurate sensitivity gauge than average maturity. |
| 4. | The yield curve is a line that plots the yields of various securities of similar quality—typically U.S. Treasury issues—across a range of maturities. The U.S. Treasury yield curve serves as a benchmark for other debt and is used in economic forecasting. |
During the reporting period, which market segments were the strongest contributors to the Fund’s performance and which market segments were particularly weak?
During the reporting period, the Fund transitioned to an investment strategy that included exposure to taxable and tax-exempt securities. As this occurred, the Fund remained broadly diversified across sectors, ratings and credit categories. Among the
market segments that contributed positively to relative performance during the reporting period was the Fund’s overweight position in credits rated AA5 and below. (Contributions take weightings and total returns into account.) This strategy performed well during the reporting period as credit spreads6 for bonds rated A, BBB7 and below investment grade narrowed more than spreads for bonds rated AA+ and AAA.8 This trend was broad-based across all municipal sectors. Specifically, the Fund’s increased exposure to local general obligation and lease-backed bonds contributed positively to performance. The aspects of the Fund that detracted from the Fund’s performance relative to the Barclay’s U.S. 1–3 Year Government/Credit Index were a low exposure to prerefunded bonds (securities repurchased by the issuer prior to the first call date), AAA-rated bonds and transportation-backed bonds.
Did the Fund make any significant purchases or sales during the reporting period?
With the Fund transitioning to a new investment strategy during the reporting period, all purchases were significant. The sales of taxable securities during the period consisted of U.S. Treasury bills and notes and low-yielding corporate bonds.
How did the Fund’s sector weightings change during the reporting period?
The prevalent sectors in the Fund—such as local general obligations, special tax, lease-backed, and hospitals—reflected our desire to construct a reasonably well diversified Fund, include exposure to infrequent municipal issuers, and maintain a bias toward individual security selection (as opposed to a top-down approach to portfolio construction). During the reporting period, the Fund increased its exposure to most municipal sectors, as the Fund continued to transition to the newly approved investment strategy. During the reporting period, the Fund decreased its exposure to U.S. Treasury securities and select taxable corporate bonds.
How was the Fund positioned at the end of the reporting period?
As of October 31, 2015, the Fund held overweight positions relative to the Barclays 3-Year Municipal Bond Index in credits rated A– and BBB and in insured Puerto Rico bonds. As of the same date, the Fund held underweight positions relative to the Index in securities rated AAA and AA+ and in prerefunded securities. We anticipate maintaining these underweight positions into the future because these securities could have higher correlations to inflation and to higher interest rates than the rest of the municipal market when the Federal Reserve begins to raise the federal funds target rate.
| 5. | An obligation rated ‘AA’ by Standard & Poor’s (“S&P”) is deemed by S&P to differ from the highest-rated obligations only to a small degree. In the opinion of S&P, the obligor’s capacity to meet its financial commitment on the obligation is very strong. Ratings from ‘AA’ to ‘CCC’ may be modified by the addition of a plus (+) or minus
(–) sign to show relative standing within the major rating categories. When applied to Fund holdings, ratings are based solely on the creditworthiness of the bonds in the portfolio and are not meant to represent the security or safety of the Fund. |
| 6. | The terms “spread” and “yield spread” may refer to the difference in yield between a security or type of security and comparable U.S. Treasury issues. The terms may also refer to the difference in yield between two specific securities or types of securities at a given time. The term “credit spread” typically refers to the difference in yield between corporate or municipal bonds (or a specific category of these bonds) and comparable U.S. Treasury issues. |
| 7. | An obligation rated ‘A’ by S&P is deemed by S&P to be somewhat more susceptible to the adverse effects of changes in circumstances and economic conditions than obligations in higher-rated categories. In the opinion of S&P, however, the obligor’s capacity to meet its financial commitment on the obligation is still strong. An obligation rated ‘BBB’ by S&P is deemed by S&P to exhibit adequate protection parameters. In the opinion of S&P, however, adverse economic conditions or changing circumstances are more likely to lead to a weakened capacity of the obligor to meet its financial commitment on the obligation. When applied to Fund holdings, ratings are based solely on the creditworthiness of the bonds in the portfolio and are not meant to represent the security or safety of the Fund. |
| 8. | An obligation rated ‘AAA’ has the highest rating assigned by Standard & Poor’s (“S&P”), and in the opinion of S&P, the obligor’s capacity to meet its financial commitment on the obligation is extremely strong. When applied to Fund holdings, ratings are based solely on the creditworthiness of the bonds in the portfolio and are not meant to represent the security or safety of the Fund. |
The opinions expressed are those of the portfolio managers as of the date of this report and are subject to change. There is no guarantee that any forecasts will come to pass. This material does not constitute investment advice and is not intended as an endorsement of any specific investment.
| | |
| 10 | | MainStay Tax Advantaged Short Term Bond Fund |
Portfolio of Investments October 31, 2015 (Unaudited)
| | | | | | | | |
| | | Principal
Amount | | | Value | |
| | | | | | | | |
Long-Term Bonds 94.3%† Corporate Bonds 8.1% | |
Agriculture 1.3% | | | | | | | | |
Japan Tobacco, Inc.
2.10%, due 7/23/18 (a) | | $ | 1,070,000 | | | $ | 1,079,436 | |
| | | | | | | | |
| | |
Auto Manufacturers 0.5% | | | | | | | | |
Daimler Finance North America LLC
1.375%, due 8/1/17 (a) | | | 380,000 | | | | 377,332 | |
| | | | | | | | |
| | |
Banks 4.3% | | | | | | | | |
Bank of America Corp.
2.00%, due 1/11/18 | | | 305,000 | | | | 306,407 | |
BB&T Corp.
1.60%, due 8/15/17 | | | 915,000 | | | | 919,253 | |
Goldman Sachs Group, Inc. (The)
3.625%, due 2/7/16 | | | 975,000 | | | | 982,554 | |
JPMorgan Chase & Co.
3.45%, due 3/1/16 | | | 1,235,000 | | | | 1,246,542 | |
| | | | | | | | |
| | | | | | | 3,454,756 | |
| | | | | | | | |
Food 0.2% | | | | | | | | |
J.M Smucker Co. (The)
1.75%, due 3/15/18 | | | 205,000 | | | | 205,372 | |
| | | | | | | | |
| | |
Miscellaneous—Manufacturing 0.8% | | | | | | | | |
3M Co.
1.375%, due 9/29/16 | | | 660,000 | | | | 664,841 | |
| | | | | | | | |
| | |
Oil & Gas 1.0% | | | | | | | | |
Chevron Corp.
4.95%, due 3/3/19 | | | 445,000 | | | | 495,606 | |
Phillips 66
2.95%, due 5/1/17 | | | 285,000 | | | | 291,438 | |
| | | | | | | | |
| | | | | | | 787,044 | |
| | | | | | | | |
Total Corporate Bonds
(Cost $6,523,978) | | | | | | | 6,568,781 | |
| | | | | | | | |
|
| Mortgage-Backed Security 0.1% | |
Commercial Mortgage Loans (Collateralized Mortgage Obligation) 0.1% | |
LB-UBS Commercial Mortgage Trust | | | | | | | | |
Series 2004-C1, Class A4
4.568%, due 1/15/31 | | | 57,137 | | | | 57,494 | |
| | | | | | | | |
Total Mortgage-Backed Security
(Cost $58,028) | | | | | | | 57,494 | |
| | | | | | | | |
| | | | | | | | |
| | | Principal
Amount | | | Value | |
| | | | | | | | |
| Municipal Bonds 86.0% | |
Alabama 0.3% | | | | | | | | |
Industrial Development Board of the City of Mobile Alabama, Revenue Bonds
1.625%, due 7/15/34 (b) | | $ | 250,000 | | | $ | 252,460 | |
| | | | | | | | |
| | |
Arizona 1.6% | | | | | | | | |
Rio Nuevo Multipurpose Facilities, Revenue Bonds
Insured: GTY
5.75%, due 7/15/18 | | | 1,150,000 | | | | 1,288,770 | |
| | | | | | | | |
| | |
Arkansas 0.5% | | | | | | | | |
Arkansas Development Finance Authority, Baptist Health System Inc., Revenue Bonds
Series A
4.00%, due 12/1/17 | | | 375,000 | | | | 399,907 | |
| | | | | | | | |
| | |
California 13.1% | | | | | | | | |
Auburn Urban Development Authority Successor Agency, Tax Allocation | | | | | | | | |
Insured: BAM
4.00%, due 6/1/18 | | | 135,000 | | | | 144,578 | |
Insured: BAM
4.00%, due 6/1/19 | | | 140,000 | | | | 152,694 | |
Avalon Community Improvement Agency, Tax Allocation | | | | | | | | |
Series A, Insured: AGM
3.00%, due 9/1/17 | | | 810,000 | | | | 840,788 | |
Series A, Insured: AGM
4.00%, due 9/1/18 | | | 300,000 | | | | 322,677 | |
California Health Facilities Financing Authority, NV Methodist Homes, Revenue Bonds
3.00%, due 7/1/18 | | | 285,000 | | | | 301,992 | |
California Municipal Finance Authority, Revenue Bonds | | | | | | | | |
2.00%, due 11/1/17 | | | 615,000 | | | | 625,781 | |
4.00%, due 11/1/18 | | | 740,000 | | | | 796,640 | |
California Statewide Communities Development Authority, Inland Regional Center Project, Revenue Bonds | | | | | | | | |
2.00%, due 6/15/18 | | | 1,205,000 | | | | 1,225,473 | |
5.375%, due 12/1/37 | | | 50,000 | | | | 54,989 | |
Charter Oak Unified School District, Unlimited General Obligation
Insured: AGM
4.00%, due 8/1/18 | | | 435,000 | | | | 470,522 | |
Del Mar Race Track Authority, Revenue Bonds
4.00%, due 10/1/18 (a) | | | 1,230,000 | | | | 1,307,908 | |
| † | Percentages indicated are based on Fund net assets. |
| ¨ | | Among the Fund’s 10 largest issuers held, as of October 31, 2015, excluding short-term investment. May be subject to change daily. |
| | | | | | |
The notes to the financial statements are an integral part of,
and should be read in conjunction with, the financial statements. | | | | | 11 | |
Portfolio of Investments October 31, 2015 (Unaudited) (continued)
| | | | | | | | |
| | | Principal
Amount | | | Value | |
| | | | | | | | |
| Municipal Bonds (continued) | |
California (continued) | | | | | | | | |
Industry Public Finance Authority, Tax Allocation
Insured: AGM
5.00%, due 1/1/18 | | $ | 700,000 | | | $ | 757,729 | |
Ramona Unified School District Community Facilities District No. 92-1, Certificates of Participation
Insured: BAM
4.00%, due 5/1/18 | | | 1,245,000 | | | | 1,334,117 | |
Sacramento Public Financing Authority, Revenue Bonds
2.51%, due 4/1/18 | | | 750,000 | | | | 753,420 | |
San Bernardino City Unified School District, Election of 2012, Unlimited General Obligation | | | | | | | | |
Series C, Insured: AGM
4.00%, due 8/1/17 | | | 250,000 | | | | 263,855 | |
Series C, Insured: AGM
5.00%, due 8/1/18 | | | 300,000 | | | | 332,019 | |
San Diego County CA, Limited Obligation, Sanford Burnham Prebys Medical Discovery Institute, Revenue Bonds | | | | | | | | |
Series A
4.00%, due 11/1/17 | | | 400,000 | | | | 424,616 | |
Series A
5.00%, due 11/1/18 | | | 400,000 | | | | 445,008 | |
| | | | | | | | |
| | | | | | | 10,554,806 | |
| | | | | | | | |
Colorado 2.5% | | | | | | | | |
Colorado Health Facilities Authority, Evangelical Lutheran, Revenue Bonds
3.00%, due 6/1/18 | | | 500,000 | | | | 520,505 | |
¨E-470 Public Highway Authority, Revenue Bonds | | | | | | | | |
Series A
2.00%, due 9/1/17 | | | 230,000 | | | | 233,243 | |
Series A
3.00%, due 9/1/16 | | | 135,000 | | | | 137,560 | |
Series A
5.00%, due 9/1/19 | | | 1,000,000 | | | | 1,125,050 | |
| | | | | | | | |
| | | | 2,016,358 | |
| | | | | | | | |
Connecticut 3.3% | | | | | | | | |
City of Hartford CT, Unlimited General Obligation | | | | | | | | |
Series A, Insured: AGM
5.00%, due 7/1/18 | | | 650,000 | | | | 717,223 | |
Series C, Insured: NATL
5.00%, due 9/1/18 | | | 465,000 | | | | 515,625 | |
| | | | | | | | |
| | | Principal
Amount | | | Value | |
| | | | | | | | |
Connecticut (continued) | | | | | | | | |
City of New Britain CT, Unlimited General Obligation
Series A, Insured: AGM
4.00%, due 3/1/18 | | $ | 1,345,000 | | | $ | 1,434,402 | |
| | | | | | | | |
| | | | 2,667,250 | |
| | | | | | | | |
Delaware 0.5% | | | | | | | | |
Delaware State Health Facilities Authority, Beebe Medical Center, Revenue Bonds | | | | | | | | |
Series A
3.00%, due 6/1/16 | | | 100,000 | | | | 101,179 | |
Series A
4.00%, due 6/1/18 | | | 300,000 | | | | 316,653 | |
| | | | | | | | |
| | | | 417,832 | |
| | | | | | | | |
Florida 1.6% | | | | | | | | |
Martin County Health Facilities Authority, Martin Memorial Medical Center, Revenue Bonds
2.32%, due 11/15/17 | | | 1,265,000 | | | | 1,275,525 | |
| | | | | | | | |
| | |
Guam 0.9% | | | | | | | | |
Territory of Guam, Revenue Bonds | | | | | | | | |
Series D
3.00%, due 11/15/17 | | | 300,000 | | | | 311,757 | |
Series C
4.00%, due 11/15/15 | | | 125,000 | | | | 125,190 | |
Series D
4.00%, due 11/15/18 | | | 275,000 | | | | 296,623 | |
| | | | | | | | |
| | | | 733,570 | |
| | | | | | | | |
Hawaii 0.3% | | | | | | | | |
State of Hawaii Department of Budget & Finance, Hawaii Pacific Health Obligation, Revenue Bonds
5.00%, due 7/1/18 | | | 250,000 | | | | 276,097 | |
| | | | | | | | |
| | |
Illinois 12.6% | | | | | | | | |
¨Chicago Board of Education, Unlimited General Obligation | | | | | | | | |
Series A, Insured: NATL
3.40%, due 12/1/15 | | | 750,000 | | | | 748,515 | |
Series A, Insured: NATL
5.00%, due 12/1/16 | | | 750,000 | | | | 752,250 | |
Series A, Insured: AMBAC
5.50%, due 12/1/18 | | | 220,000 | | | | 226,283 | |
¨City of Chicago IL, Unlimited General Obligation | |
Insured: AMBAC
4.125%, due 1/1/19 | | | 275,000 | | | | 275,671 | |
Insured: AMBAC
5.00%, due 12/1/16 | | | 170,000 | | | | 173,385 | |
Insured: AMBAC
5.00%, due 12/1/17 | | | 1,225,000 | | | | 1,248,189 | |
| | | | |
| 12 | | MainStay Tax Advantaged Short Term Bond Fund | | The notes to the financial statements are an integral part of,
and should be read in conjunction with, the financial statements. |
| | | | | | | | |
| | | Principal
Amount | | | Value | |
| | | | | | | | |
| Municipal Bonds (continued) | |
Illinois (continued) | | | | | | | | |
City of Freeport IL, Unlimited General Obligation | | | | | | | | |
Series A, Insured: AGM
2.00%, due 1/1/17 | | $ | 100,000 | | | $ | 101,036 | |
Series A
2.00%, due 1/1/18 | | | 100,000 | | | | 101,469 | |
City of La Salle IL, Unlimited General Obligation
Series A
3.75%, due 12/1/16 | | | 135,000 | | | | 138,146 | |
Cook County School District No. 102 La Grange, Limited General Obligation
Series B, Insured: AGM
3.00%, due 12/15/17 | | | 275,000 | | | | 287,064 | |
County of Cook IL, Unlimited General Obligation Insured: BAM
2.03%, due 11/15/18 | | | 700,000 | | | | 701,239 | |
Illinois Sports Facilities Authority, Revenue Bonds
5.00%, due 6/15/18 | | | 495,000 | | | | 532,476 | |
Public Building Commission of Chicago, Revenue Bonds
Series B, Insured: NATL-RE
5.25%, due 12/1/15 | | | 750,000 | | | | 752,745 | |
Randolph County Community Unit School District No. 140 Sparta, Unlimited General Obligation | | | | | | | | |
Insured: AGM
4.00%, due 12/1/17 | | | 200,000 | | | | 212,004 | |
Insured: AGM
4.00%, due 12/1/18 | | | 405,000 | | | | 437,477 | |
Insured: AGM
4.00%, due 12/1/19 | | | 210,000 | | | | 229,898 | |
¨State of Illinois, Unlimited General Obligation | |
Insured: AGM
5.00%, due 1/1/17 | | | 750,000 | | | | 783,075 | |
Insured: AGM
5.00%, due 4/1/18 | | | 310,000 | | | | 328,026 | |
Insured: NATL-RE
5.50%, due 8/1/18 | | | 750,000 | | | | 814,440 | |
Village of Bellwood IL, Unlimited General Obligation
Insured: AGM
3.00%, due 12/1/18 | | | 1,000,000 | | | | 1,041,620 | |
Will & Kankakee Counties Community Unit School District No. 207-U Peotone, Unlimited General Obligation
3.00%, due 12/1/16 | | | 250,000 | | | | 255,148 | |
| | | | | | | | |
| | | | 10,140,156 | |
| | | | | | | | |
| | | | | | | | |
| | | Principal
Amount | | | Value | |
| | | | | | | | |
Indiana 2.6% | | | | | | | | |
Indiana Bond Bank, Revenue Bonds | | | | | | | | |
Series: A
5.25%, due 10/15/16 | | $ | 190,000 | | | $ | 198,297 | |
Series: A
5.25%, due 10/15/18 | | | 1,000,000 | | | | 1,109,340 | |
Indiana Finance Authority, Revenue Bonds
5.00%, due 3/1/19 | | | 750,000 | | | | 795,990 | |
| | | | | | | | |
| | | | 2,103,627 | |
| | | | | | | | |
Louisiana 2.7% | | | | | | | | |
Lafayette Consolidated Government, Revenue Bonds
Insured: AGM
5.00%, due 11/1/17 | | | 550,000 | | | | 594,913 | |
Lafayette Public Trust Financing Authority, Ragin Cajun Facilities, Revenue Bonds Insured: AGM
5.00%, due 10/1/18 | | | 705,000 | | | | 778,941 | |
Louisiana Public Facilities Authority, Nineteenth Judicial District, Revenue Bonds Insured: AGM
5.00%, due 6/1/18 | | | 245,000 | | | | 265,962 | |
Shreveport LA, Airport System, Revenue Bonds Series: B, Insured: AGM
2.452%, due 1/1/19 | | | 500,000 | | | | 503,355 | |
| | | | | | | | |
| | | | 2,143,171 | |
| | | | | | | | |
Maryland 1.3% | | | | | | | | |
Maryland Health & Higher Educational Facilities Authority, Revenue Bonds | | | | | | | | |
3.00%, due 1/1/18 | | | 705,000 | | | | 733,087 | |
5.00%, due 7/1/18 | | | 300,000 | | | | 327,741 | |
| | | | | | | | |
| | | | 1,060,828 | |
| | | | | | | | |
Massachusetts 1.2% | |
Massachusetts Development Finance Agency, Revenue Bonds
1.824%, due 7/1/17 | | | 1,000,000 | | | | 998,090 | |
| | | | | | | | |
|
Michigan 1.9% | |
¨Hartland Consolidated Schools, Unlimited General Obligation
Series B
1.386%, due 5/1/18 | | | 1,500,000 | | | | 1,498,770 | |
| | | | | | | | |
|
Minnesota 1.8% | |
¨St. Paul Housing & Redevelopment Authority, Healtheast Care System, Revenue Bonds
5.00%, due 11/15/18 | | | 1,350,000 | | | | 1,472,067 | |
| | | | | | | | |
| | | | | | |
The notes to the financial statements are an integral part of,
and should be read in conjunction with, the financial statements. | | | | | 13 | |
Portfolio of Investments October 31, 2015 (Unaudited) (continued)
| | | | | | | | |
| | | Principal
Amount | | | Value | |
| | | | | | | | |
| Municipal Bonds (continued) | |
Mississippi 2.9% | |
Mississippi Development Bank, Canton Public School District, Revenue Bonds | | | | | | | | |
Insured: AGM
4.00%, due 12/1/17 | | $ | 260,000 | | | $ | 276,385 | |
Insured: AGM
4.00%, due 12/1/18 | | | 935,000 | | | | 1,014,513 | |
Mississippi Hospital Equipment & Facilities Authority, Baptist Health System, Inc., Revenue Bonds
Class A
5.00%, due 8/15/17 | | | 1,000,000 | | | | 1,065,720 | |
| | | | | | | | |
| | | | 2,356,618 | |
| | | | | | | | |
Missouri 0.2% | |
City of Belton MO, Certificates of Participation Insured: NATL-RE
5.00%, due 3/1/17 | | | 150,000 | | | | 156,947 | |
| | | | | | | | |
|
New Hampshire 0.6% | |
City of Nashua NH, Unlimited General Obligation
3.00%, due 10/15/16 | | | 450,000 | | | | 461,200 | |
| | | | | | | | |
|
New Jersey 8.0% | |
Borough of North Plainfield NJ, Unlimited General Obligation
Insured: MAC
3.00%, due 6/1/20 | | | 330,000 | | | | 351,493 | |
Carteret Board of Education, Certificates of Participation
Insured: BAM
4.00%, due 1/15/19 | | | 315,000 | | | | 340,808 | |
City of Bayonne NJ, Unlimited General Obligation
Insured: AGM
4.00%, due 7/15/19 | | | 1,000,000 | | | | 1,090,330 | |
Garden State Preservation Trust, Revenue Bonds
Series C, Insured: AGM
5.125%, due 11/1/16 | | | 100,000 | | | | 104,699 | |
New Jersey Health Care Facilities Financing Authority, Revenue Bonds | | | | | | | | |
3.15%, due 7/1/18 | | | 1,000,000 | | | | 1,024,350 | |
Insured: AGM
4.00%, due 1/1/17 | | | 150,000 | | | | 155,601 | |
¨New Jersey Transportation Trust Fund Authority, Revenue Bonds | | | | | | | | |
Insured: NATL-RE
5.50%, due 12/15/16 | | | 1,000,000 | | | | 1,050,460 | |
Series C, Insured: AGM
5.50%, due 12/15/17 | | | 420,000 | | | | 455,179 | |
| | | | | | | | |
| | | Principal
Amount | | | Value | |
| | | | | | | | |
New Jersey (continued) | | | | | | | | |
Passaic Valley Water Commission, Revenue Bonds
Insured: AGM
5.00%, due 12/15/16 | | $ | 140,000 | | | $ | 146,947 | |
Phillipsburg School District, Unlimited General Obligation
Insured: AGM
2.00%, due 8/1/17 | | | 400,000 | | | | 408,064 | |
Township of Brick NJ, Unlimited General Obligation
5.00%, due 9/1/18 | | | 1,000,000 | | | | 1,112,830 | |
Upper Freehold Regional School District, Unlimited General Obligation
Insured: AGM
3.60%, due 11/1/16 | | | 235,000 | | | | 242,052 | |
| | | | | | | | |
| | | | 6,482,813 | |
| | | | | | | | |
New York 3.2% | |
City of Yonkers NY, Limited General Obligation
Series D
3.00%, due 8/1/17 | | | 1,000,000 | | | | 1,036,810 | |
¨Town of Oyster Bay NY, Limited General Obligation
Series A, Insured: AGM
3.00%, due 3/1/18 | | | 1,500,000 | | | | 1,569,345 | |
| | | | | | | | |
| | | | 2,606,155 | |
| | | | | | | | |
North Carolina 1.0% | |
Raleigh Durham Airport Authority, Revenue Bonds
Series B
5.00%, due 5/1/18 (c) | | | 750,000 | | | | 825,285 | |
| | | | | | | | |
|
North Dakota 1.2% | |
City of Bowman ND Healthcare Facilities, Revenue Notes
2.50%, due 2/15/17 | | | 1,000,000 | | | | 1,003,270 | |
| | | | | | | | |
|
Ohio 1.6% | |
Cleveland Municipal School District, Unlimited General Obligation
Series A
3.00%, due 12/1/18 | | | 1,185,000 | | | | 1,253,671 | |
| | | | | | | | |
|
Pennsylvania 7.3% | |
Pocono Mountain School District, Limited General Obligation
Series A, Insured: AGM
4.00%, due 6/15/17 | | | 1,350,000 | | | | 1,419,957 | |
| | | | |
| 14 | | MainStay Tax Advantaged Short Term Bond Fund | | The notes to the financial statements are an integral part of,
and should be read in conjunction with, the financial statements. |
| | | | | | | | |
| | | Principal
Amount | | | Value | |
| | | | | | | | |
| Municipal Bonds (continued) | |
Pennsylvania (continued) | |
Reading School District, Unlimited General Obligation
Series C, Insured: AGM
5.00%, due 2/1/18 | | $ | 790,000 | | | $ | 854,085 | |
State Public School Building Authority, Revenue Bonds
Series A, Insured: AGM
5.00%, due 9/15/18 | | | 1,140,000 | | | | 1,260,087 | |
Trinity Area School District, Unlimited General Obligation
Insured: AGM
4.00%, due 11/1/18 | | | 950,000 | | | | 1,029,971 | |
West Mifflin School District, Unlimited General Obligation | | | | | | | | |
Insured: AGM
4.00%, due 10/1/17 | | | 410,000 | | | | 431,074 | |
Insured: AGM
5.00%, due 10/1/18 | | | 500,000 | | | | 549,645 | |
Western Wayne School District, Limited General Obligation
Insured: BAM
4.00%, due 4/1/18 | | | 290,000 | | | | 309,340 | |
| | | | | | | | |
| | | | 5,854,159 | |
| | | | | | | | |
Puerto Rico 7.1% | |
¨Commonwealth of Puerto Rico, Public Improvement, Unlimited General Obligation | | | | | | | | |
Insured: NATL-RE
(zero coupon), due 7/1/17 | | | 395,000 | | | | 367,599 | |
Insured: NATL-RE
(zero coupon), due 7/1/18 | | | 155,000 | | | | 137,682 | |
Insured: AGC
5.00%, due 7/1/16 | | | 200,000 | | | | 204,268 | |
Insured: NATL-RE
5.50%, due 7/1/16 | | | 725,000 | | | | 736,528 | |
Series A, Insured: NATL-RE
5.50%, due 7/1/16 | | | 230,000 | | | | 233,657 | |
Series A, Insured: NATL-RE
5.50%, due 7/1/18 | | | 310,000 | | | | 321,048 | |
Government Development Bank for Puerto Rico, Revenue Bonds
Insured: NATL-RE
4.75%, due 12/1/15 | | | 1,000,000 | | | | 1,001,470 | |
Puerto Rico Electric Power Authority, Revenue Bonds | | | | | | | | |
Series SS, Insured: NATL-RE
5.00%, due 7/1/16 | | | 100,000 | | | | 100,158 | |
Series KK, Insured: NATL-RE
5.50%, due 7/1/16 | | | 535,000 | | | | 543,651 | |
| | | | | | | | |
| | | Principal
Amount | | | Value | |
| | | | | | | | |
Puerto Rico (continued) | |
Puerto Rico Highways & Transportation Authority, Revenue Bonds | | | | | | | | |
Series E, Insured: AGM
5.50%, due 7/1/16 | | $ | 175,000 | | | $ | 178,798 | |
Series E, Insured: AGM
5.50%, due 7/1/17 | | | 25,000 | | | | 25,747 | |
Series Z, Insured: AGM
6.25%, due 7/1/16 | | | 90,000 | | | | 92,238 | |
Puerto Rico Housing Finance Authority, Revenue Bonds
4.625%, due 12/1/18 | | | 100,000 | | | | 107,583 | |
Puerto Rico Municipal Finance Agency, Revenue Bonds | | | | | | | | |
Series B, Insured: AGC
5.25%, due 7/1/17 | | | 100,000 | | | | 102,523 | |
Series C, Insured: AGM
5.25%, due 8/1/17 | | | 100,000 | | | | 102,388 | |
¨RBC Municipal Products, Inc., Revenue Bonds
Series E
1.00%, due 5/1/17 (a)(b) | | | 1,500,000 | | | | 1,500,000 | |
| | | | | | | | |
| | | | 5,755,338 | |
| | | | | | | | |
South Carolina 1.8% | | | | | | | | |
South Carolina Jobs-Economic Development Authority, Revenue Bonds | | | | | | | | |
Series A
5.00%, due 8/1/16 | | | 1,000,000 | | | | 1,031,500 | |
Series A
5.00%, due 8/1/18 | | | 350,000 | | | | 381,136 | |
| | | | | | | | |
| | | | 1,412,636 | |
| | | | | | | | |
Texas 0.6% | | | | | | | | |
Crane County Water District, Unlimited General Obligation
3.00%, due 2/15/17 | | | 500,000 | | | | 513,140 | |
| | | | | | | | |
| | |
Utah 0.8% | | | | | | | | |
Utah Infrastructure Agency, Revenue Bonds
1.00%, due 10/15/18 | | | 630,000 | | | | 625,729 | |
| | | | | | | | |
| | |
Vermont 1.0% | | | | | | | | |
Vermont Educational & Health Building Financing Agency, Revenue Bonds | | | | | | | | |
2.00%, due 10/1/16 | | | 195,000 | | | | 197,170 | |
3.00%, due 10/1/17 | | | 315,000 | | | | 325,959 | |
4.00%, due 10/1/18 | | | 125,000 | | | | 134,231 | |
4.00%, due 10/1/19 | | | 130,000 | | | | 141,518 | |
| | | | | | | | |
| | | | 798,878 | |
| | | | | | | | |
Total Municipal Bonds
(Cost $69,013,257) | | | | | | | 69,405,123 | |
| | | | | | | | |
| | | | | | |
The notes to the financial statements are an integral part of,
and should be read in conjunction with, the financial statements. | | | | | 15 | |
Portfolio of Investments October 31, 2015 (Unaudited) (continued)
| | | | | | | | |
| | | Principal
Amount | | | Value | |
| | | | | | | | |
| U.S. Government & Federal Agency 0.1% | |
Federal National Mortgage Association
(Mortgage Pass-Through Security) 0.1% | |
4.50%, due 11/1/18 | | $ | 36,032 | | | $ | 37,320 | |
| | | | | | | | |
Total U.S. Government & Federal Agency
(Cost $35,885) | | | | | | | 37,320 | |
| | | | | | | | |
Total Long-Term Bonds
(Cost $75,631,148) | | | | | | | 76,068,718 | |
| | | | | | | | |
|
| Short-Term Investment 0.6% | |
Repurchase Agreement 0.6% | | | | | | | | |
State Street Bank and Trust Co.
0.00%, dated 10/30/15
due 11/2/15
Proceeds at Maturity $500,701 (Collateralized by a Federal Home Loan Mortgage Corp. security with a rate of 2.00% and a maturity date of 1/30/23, with a Principal Amount of $525,000 and a Market Value of $514,222) | | | 500,701 | | | | 500,701 | |
| | | | | | | | |
Total Short-Term Investment
(Cost $500,701) | | | | | | | 500,701 | |
| | | | | | | | |
Total Investments
(Cost $76,131,849) (d) | | | 94.9 | % | | | 76,569,419 | |
Other Assets, Less Liabilities | | | 5.1 | | | | 4,127,657 | |
Net Assets | | | 100.0 | % | | $ | 80,697,076 | |
| (a) | May be sold to institutional investors only under Rule 144A or securities offered pursuant to Section 4(a)(2) of the Securities Act of 1933, as amended. |
| (b) | Floating rate—Rate shown was the rate in effect as of October 31, 2015. |
| (c) | Interest on these securities was subject to alternative minimum tax. |
| (d) | As of October 31, 2015, cost was $76,131,849 for federal income tax purposes and net unrealized appreciation was as follows: |
| | | | |
Gross unrealized appreciation | | $ | 451,870 | |
Gross unrealized depreciation | | | (14,300 | ) |
| | | | |
Net unrealized appreciation | | $ | 437,570 | |
| | | | |
The following abbreviations are used in the preceding pages:
AGC/GTY—Assured Guaranty Corp.
AGM—Assured Guaranty Municipal Corp.
AMBAC—Ambac Assurance Corp.
BAM—Build America Mutual Assurance Co.
MAC—Municipal Assurance Corp.
NATL-RE—National Public Finance Guarantee Corp.
The following is a summary of the fair valuations according to the inputs used as of October 31, 2015, for valuing the Fund’s assets.
Asset Valuation Inputs
| | | | | | | | | | | | | | | | |
Description | | Quoted
Prices in
Active
Markets for
Identical
Assets (Level 1) | | | Significant
Other
Observable
Inputs (Level 2) | | | Significant
Unobservable
Inputs (Level 3) | | | Total | |
| Investments in Securities (a) | | | | | | | | | | | | | | | | |
| Long-Term Bonds | | | | | | | | | | | | | | | | |
Corporate Bonds | | $ | — | | | $ | 6,568,781 | | | $ | — | | | $ | 6,568,781 | |
Mortgage-Backed Security | | | — | | | | 57,494 | | | | — | | | | 57,494 | |
Municipal Bonds | | | — | | | | 69,405,123 | | | | — | | | | 69,405,123 | |
U.S. Government & Federal Agency | | | — | | | | 37,320 | | | | — | | | | 37,320 | |
| | | | | | | | | | | | | | | | |
| Total Long-Term Bonds | | | — | | | | 76,068,718 | | | | — | | | | 76,068,718 | |
| | | | | | | | | | | | | | | | |
| Short-Term Investment | | | | | | | | | | | | | | | | |
Repurchase Agreement | | | — | | | | 500,701 | | | | — | | | | 500,701 | |
| | | | | | | | | | | | | | | | |
| Total Investments in Securities | | $ | — | | | $ | 76,569,419 | | | $ | — | | | $ | 76,569,419 | |
| | | | | | | | | | | | | | | | |
| (a) | For a complete listing of investments and their industries, see the Portfolio of Investments. |
The Fund recognizes transfers between the levels as of the beginning of the period.
For the period ended October 31, 2015, the Fund did not have any transfers between Level 1 and Level 2 fair value measurements. (See Note 2)
As of October 31, 2015, the Fund did not hold any investments with significant unobservable inputs (Level 3). (See Note 2)
| | | | |
| 16 | | MainStay Tax Advantaged Short Term Bond Fund | | The notes to the financial statements are an integral part of,
and should be read in conjunction with, the financial statements. |
Statement of Assets and Liabilities as of October 31, 2015 (Unaudited)
| | | | |
| Assets | |
Investment in securities, at value
(identified cost $76,131,849) | | $ | 76,569,419 | |
Cash | | | 6,188,260 | |
Receivables: | | | | |
Fund shares sold | | | 1,726,571 | |
Interest | | | 692,844 | |
Other assets | | | 28,662 | |
| | | | |
Total assets | | | 85,205,756 | |
| | | | |
|
| Liabilities | |
Payables: | | | | |
Investment securities purchased | | | 3,869,265 | |
Fund shares redeemed | | | 550,344 | |
Professional fees | | | 30,388 | |
Manager (See Note 3) | | | 17,350 | |
Transfer agent (See Note 3) | | | 10,502 | |
NYLIFE Distributors (See Note 3) | | | 7,128 | |
Shareholder communication | | | 3,124 | |
Trustees | | | 9 | |
Accrued expenses | | | 4,004 | |
Dividend payable | | | 16,566 | |
| | | | |
Total liabilities | | | 4,508,680 | |
| | | | |
Net assets | | $ | 80,697,076 | |
| | | | |
|
| Composition of Net Assets | |
Shares of beneficial interest outstanding (par value of $.001 per share) unlimited number of shares authorized | | $ | 8,432 | |
Additional paid-in capital | | | 80,246,962 | |
| | | | |
| | | 80,255,394 | |
Distributions in excess of net investment income | | | (2,896 | ) |
Accumulated net realized gain (loss) on investments | | | 7,008 | |
Net unrealized appreciation (depreciation) on investments | | | 437,570 | |
| | | | |
Net assets | | $ | 80,697,076 | |
| | | | |
| | | | |
Class A | | | | |
Net assets applicable to outstanding shares | | $ | 32,604,914 | |
| | | | |
Shares of beneficial interest outstanding | | | 3,407,071 | |
| | | | |
Net asset value per share outstanding | | $ | 9.57 | |
Maximum sales charge (1.00% of offering price)* | | | 0.10 | |
| | | | |
Maximum offering price per share outstanding | | $ | 9.67 | |
| | | | |
Investor Class | | | | |
Net assets applicable to outstanding shares | | $ | 3,559,261 | |
| | | | |
Shares of beneficial interest outstanding | | | 371,070 | |
| | | | |
Net asset value per share outstanding | | $ | 9.59 | |
Maximum sales charge (1.00% of offering price)* | | | 0.10 | |
| | | | |
Maximum offering price per share outstanding | | $ | 9.69 | |
| | | | |
Class I | | | | |
Net assets applicable to outstanding shares | | $ | 44,532,901 | |
| | | | |
Shares of beneficial interest outstanding | | | 4,653,828 | |
| | | | |
Net asset value and offering price per share outstanding | | $ | 9.57 | |
| | | | |
| * | Maximum sales charge prior to June 1, 2015 was 3.00%. |
| | | | | | |
The notes to the financial statements are an integral part of,
and should be read in conjunction with, the financial statements. | | | | | 17 | |
Statement of Operations for the six months ended October 31, 2015 (Unaudited)
| | | | |
| Investment Income (Loss) | |
Income | | | | |
Interest | | $ | 465,110 | |
| | | | |
Expenses | | | | |
Manager (See Note 3) | | | 137,457 | |
Distribution/Service—Class A (See Note 3) | | | 30,196 | |
Distribution/Service—Investor Class (See Note 3) | | | 4,434 | |
Registration | | | 32,165 | |
Transfer agent (See Note 3) | | | 29,994 | |
Professional fees | | | 28,425 | |
Shareholder communication | | | 13,077 | |
Custodian | | | 3,837 | |
Trustees | | | 500 | |
Miscellaneous | | | 3,227 | |
| | | | |
Total expenses before waiver/reimbursement | | | 283,312 | |
Expense waiver/reimbursement from Manager (See Note 3) | | | (74,260 | ) |
| | | | |
Net expenses | | | 209,052 | |
| | | | |
Net investment income (loss) | | | 256,058 | |
| | | | |
|
| Realized and Unrealized Gain (Loss) on Investments | |
Net realized gain (loss) on investments | | | 11,051 | |
Net change in unrealized appreciation (depreciation) on investments | | | 220,791 | |
| | | | |
Net realized and unrealized gain (loss) on investments | | | 231,842 | |
| | | | |
Net increase (decrease) in net assets resulting from operations | | $ | 487,900 | |
| | | | |
| | | | |
| 18 | | MainStay Tax Advantaged Short Term Bond Fund | | The notes to the financial statements are an integral part of,
and should be read in conjunction with, the financial statements. |
Statements of Changes in Net Assets
for the six months ended October 31, 2015 (Unaudited), the period November 1, 2014 through April 30, 2015 and year ended October 31, 2014
| | | | | | | | | | | | |
| | | 2015 | | | 2015 (a) | | | 2014 | �� |
| Increase (Decrease) in Net Assets | | | | | |
Operations: | | | | | | | | | | | | |
Net investment income (loss) | | $ | 256,058 | | | $ | 129,152 | | | $ | 421,035 | |
Net realized gain (loss) on investments | | | 11,051 | | | | (4,043 | ) | | | 74,360 | |
Net change in unrealized appreciation (depreciation) on investments | | | 220,791 | | | | 44,743 | | | | (284,018 | ) |
| | | | |
Net increase (decrease) in net assets resulting from operations | | | 487,900 | | | | 169,852 | | | | 211,377 | |
| | | | |
Dividends and distributions to shareholders: | | | | | | | | | | | | |
From net investment income: | | | | | | | | | | | | |
Class A | | | (91,976 | ) | | | (30,329 | ) | | | (87,334 | ) |
Investor Class | | | (5,677 | ) | | | (236 | ) | | | (2,457 | ) |
Class I | | | (160,721 | ) | | | (97,172 | ) | | | (330,654 | ) |
| | | | |
| | | (258,374 | ) | | | (127,737 | ) | | | (420,445 | ) |
| | | | |
From net realized gain on investments: | | | | | | | | | | | | |
Class A | | | — | | | | (23,139 | ) | | | (49,098 | ) |
Investor Class | | | — | | | | (4,418 | ) | | | (8,065 | ) |
Class I | | | — | | | | (46,715 | ) | | | (120,264 | ) |
| | | | |
| | | — | | | | (74,272 | ) | | | (177,427 | ) |
| | | | |
Total dividends and distributions to shareholders | | | (258,374 | ) | | | (202,009 | ) | | | (597,872 | ) |
| | | | |
Capital share transactions: | | | | | | | | | | | | |
Net proceeds from sale of shares | | | 51,674,735 | | | | 14,409,884 | | | | 38,396,223 | |
Net asset value of shares issued to shareholders in reinvestment of dividends and distributions | | | 203,446 | | | | 166,250 | | | | 531,022 | |
Cost of shares redeemed | | | (24,496,003 | ) | | | (28,897,831 | ) | | | (60,159,882 | ) |
| | | | |
Increase (decrease) in net assets derived from capital share transactions | | | 27,382,178 | | | | (14,321,697 | ) | | | (21,232,637 | ) |
| | | | |
Net increase (decrease) in net assets | | | 27,611,704 | | | | (14,353,854 | ) | | | (21,619,132 | ) |
| |
| Net Assets | | | | | |
Beginning of period | | | 53,085,372 | | | | 67,439,226 | | | | 89,058,358 | |
| | | | |
End of period | | $ | 80,697,076 | | | $ | 53,085,372 | | | $ | 67,439,226 | |
| | | | |
Distributions in excess of net investment income at end of period | | $ | (2,896 | ) | | $ | (580 | ) | | $ | (1,962 | ) |
| | | | |
| (a) | The Fund changed its fiscal year end from October 31 to April 30. |
| | | | | | |
The notes to the financial statements are an integral part of,
and should be read in conjunction with, the financial statements. | | | | | 19 | |
Financial Highlights selected per share data and ratios
| | | | | | | | | | | | | | | | | | | | | | | | | | | | |
| | | Six months
ended
October 31, | | | November 1,
2014
through
April 30, | | | Year ended October 31, | |
| Class A | | 2015* | | | 2015*** | | | 2014 | | | 2013 | | | 2012 | | | 2011 | | | 2010 | |
Net asset value at beginning of period | | $ | 9.54 | | | $ | 9.54 | | | $ | 9.59 | | | $ | 9.68 | | | $ | 9.69 | | | $ | 9.78 | | | $ | 9.79 | |
| | | | | | | | | | | | | | | | | | | | | | | | | | | | |
Net investment income (loss) (a) | | | 0.04 | | | | 0.01 | | | | 0.04 | | | | 0.05 | | | | 0.09 | | | | 0.11 | | | | 0.11 | |
Net realized and unrealized gain (loss) on investments | | | 0.02 | | | | 0.01 | | | | (0.03 | ) | | | (0.05 | ) | | | 0.02 | | | | (0.06 | ) | | | 0.11 | |
| | | | | | | | | | | | | | | | | | | | | | | | | | | | |
Total from investment operations | | | 0.06 | | | | 0.02 | | | | 0.01 | | | | — | | | | 0.11 | | | | 0.05 | | | | 0.22 | |
| | | | | | | | | | | | | | | | | | | | | | | | | | | | |
| Less dividends and distributions: | | | | | | | | | | | | | | | | | | | | | | | | | | | | |
From net investment income | | | (0.03 | ) | | | (0.01 | ) | | | (0.04 | ) | | | (0.05 | ) | | | (0.08 | ) | | | (0.12 | ) | | | (0.11 | ) |
From net realized gain on investments | | | — | | | | (0.01 | ) | | | (0.02 | ) | | | (0.04 | ) | | | (0.04 | ) | | | (0.02 | ) | | | (0.12 | ) |
| | | | | | | | | | | | | | | | | | | | | | | | | | | | |
Total dividends and distributions | | | (0.03 | ) | | | (0.02 | ) | | | (0.06 | ) | | | (0.09 | ) | | | (0.12 | ) | | | (0.14 | ) | | | (0.23 | ) |
| | | | | | | | | | | | | | | | | | | | | | | | | | | | |
Net asset value at end of period | | $ | 9.57 | | | $ | 9.54 | | | $ | 9.54 | | | $ | 9.59 | | | $ | 9.68 | | | $ | 9.69 | | | $ | 9.78 | |
| | | | | | | | | | | | | | | | | | | | | | | | | | | | |
Total investment return (b) | | | 0.67 | %(c) | | | 0.27 | %(c) | | | 0.09 | % | | | 0.04 | % | | | 1.13 | % | | | 0.53 | % | | | 2.19 | % |
| Ratios (to average net assets)/Supplemental Data: | | | | | | | | | | | | | | | | | | | | | | | | | | | | |
Net investment income (loss) | | | 0.74 | %†† | | | 0.33 | %†† | | | 0.41 | % | | | 0.57 | % | | | 0.77 | % | | | 1.23 | % | | | 1.03 | % |
Net expenses | | | 0.81 | %†† | | | 0.86 | %†† | | | 0.86 | % | | | 0.88 | % | | | 0.93 | % | | | 0.93 | % | | | 0.93 | % |
Expenses (before waiver/reimbursement) | | | 1.06 | %†† | | | 1.24 | %†† | | | 1.07 | % | | | 1.13 | % | | | 1.10 | % | | | 1.15 | % | | | 1.15 | % |
Portfolio turnover rate | | | 98 | % | | | 7 | % | | | 30 | % | | | 67 | % | | | 60 | % | | | 39 | % | | | 68 | %(d) |
Net assets at end of period (in 000’s) | | $ | 32,605 | | | $ | 18,908 | | | $ | 20,086 | | | $ | 24,657 | | | $ | 31,422 | | | $ | 31,689 | | | $ | 36,665 | |
| *** | The Fund changed its fiscal year end from October 31 to April 30. |
| (a) | Per share data based on average shares outstanding during the period. |
| (b) | Total investment return is calculated exclusive of sales charges and assumes the reinvestment of dividends and distributions. |
| (c) | Total investment return is not annualized. |
| (d) | The portfolio turnover rate not including mortgage dollar rolls was 52% for the year ended October 31, 2010. |
| | | | |
| 20 | | MainStay Tax Advantaged Short Term Bond Fund | | The notes to the financial statements are an integral part of,
and should be read in conjunction with, the financial statements. |
Financial Highlights selected per share data and ratios
| | | | | | | | | | | | | | | | | | | | | | | | | | | | |
| | | Six months
ended
October 31, | | | November 1,
2014
through
April 30, | | | Year ended October 31, | |
| Investor Class | | 2015* | | | 2015*** | | | 2014 | | | 2013 | | | 2012 | | | 2011 | | | 2010 | |
Net asset value at beginning of period | | $ | 9.56 | | | $ | 9.57 | | | $ | 9.61 | | | $ | 9.71 | | | $ | 9.72 | | | $ | 9.81 | | | $ | 9.81 | |
| | | | | | | | | | | | | | | | | | | | | | | | | | | | |
Net investment income (loss) (a) | | | 0.02 | | | | (0.00 | )‡ | | | 0.01 | | | | 0.02 | | | | 0.04 | | | | 0.08 | | | | 0.05 | |
Net realized and unrealized gain (loss) on investments | | | 0.03 | | | | 0.00 | ‡ | | | (0.02 | ) | | | (0.06 | ) | | | 0.03 | | | | (0.06 | ) | | | 0.13 | |
| | | | | | | | | | | | | | | | | | | | | | | | | | | | |
Total from investment operations | | | 0.05 | | | | 0.00 | ‡ | | | (0.01 | ) | | | (0.04 | ) | | | 0.07 | | | | 0.02 | | | | 0.18 | |
| | | | | | | | | | | | | | | | | | | | | | | | | | | | |
| Less dividends and distributions: | | | | | | | | | | | | | | | | | | | | | | | | | | | | |
From net investment income | | | (0.02 | ) | | | (0.00 | )‡ | | | (0.01 | ) | | | (0.02 | ) | | | (0.04 | ) | | | (0.09 | ) | | | (0.06 | ) |
From net realized gain on investments | | | — | | | | (0.01 | ) | | | (0.02 | ) | | | (0.04 | ) | | | (0.04 | ) | | | (0.02 | ) | | | (0.12 | ) |
| | | | | | | | | | | | | | | | | | | | | | | | | | | | |
Total dividends and distributions | | | (0.02 | ) | | | (0.01 | ) | | | (0.03 | ) | | | (0.06 | ) | | | (0.08 | ) | | | (0.11 | ) | | | (0.18 | ) |
| | | | | | | | | | | | | | | | | | | | | | | | | | | | |
Net asset value at end of period | | $ | 9.59 | | | $ | 9.56 | | | $ | 9.57 | | | $ | 9.61 | | | $ | 9.71 | | | $ | 9.72 | | | $ | 9.81 | |
| | | | | | | | | | | | | | | | | | | | | | | | | | | | |
Total investment return (b) | | | 0.48 | %(c) | | | 0.02 | % (c) | | | (0.15 | %) | | | (0.41 | %) | | | 0.79 | % | | | 0.13 | % | | | 1.83 | % |
| Ratios (to average net assets)/Supplemental Data: | | | | | | | | | | | | | | | | | | | | | | | | | | | | |
Net investment income (loss) | | | 0.33 | %†† | | | (0.03 | %)†† | | | 0.02 | % | | | 0.22 | % | | | 0.44 | % | | | 0.83 | % | | | 0.63 | % |
Net expenses | | | 1.19 | %†† | | | 1.22 | % †† | | | 1.24 | % | | | 1.23 | % | | | 1.27 | % | | | 1.33 | % | | | 1.38 | % |
Expenses (before waiver/reimbursement) | | | 1.44 | %†† | | | 1.60 | % †† | | | 1.45 | % | | | 1.47 | % | | | 1.44 | % | | | 1.55 | % | | | 1.60 | % |
Portfolio turnover rate | | | 98 | % | | | 7 | % | | | 30 | % | | | 67 | % | | | 60 | % | | | 39 | % | | | 68 | %(d) |
Net assets at end of period (in 000’s) | | $ | 3,559 | | | $ | 3,552 | | | $ | 3,844 | | | $ | 3,965 | | | $ | 4,356 | | | $ | 4,128 | | | $ | 4,119 | |
| ‡ | Less than one cent per share. |
| *** | The Fund changed its fiscal year end from October 31 to April 30. |
| (a) | Per share data based on average shares outstanding during the period. |
| (b) | Total investment return is calculated exclusive of sales charges and assumes the reinvestment of dividends and distributions. |
| (c) | Total investment return is not annualized. |
| (d) | The portfolio turnover rate not including mortgage dollar rolls was 52% for the year ended October 31, 2010. |
| | | | | | |
The notes to the financial statements are an integral part of,
and should be read in conjunction with, the financial statements. | | | | | 21 | |
Financial Highlights selected per share data and ratios
| | | | | | | | | | | | | | | | | | | | | | | | | | | | |
| | | Six months
ended
October 31, | | | November 1,
2014
through
April 30, | | | Year ended October 31, | |
| Class I | | 2015* | | | 2015*** | | | 2014 | | | 2013 | | | 2012 | | | 2011 | | | 2010 | |
Net asset value at beginning of period | | $ | 9.54 | | | $ | 9.54 | | | $ | 9.58 | | | $ | 9.68 | | | $ | 9.69 | | | $ | 9.78 | | | $ | 9.78 | |
| | | | | | | | | | | | | | | | | | | | | | | | | | | | |
Net investment income (loss) (a) | | | 0.05 | | | | 0.03 | | | | 0.05 | | | | 0.08 | | | | 0.10 | | | | 0.14 | | | | 0.13 | |
Net realized and unrealized gain (loss) on investments | | | 0.03 | | | | 0.01 | | | | (0.01 | ) | | | (0.06 | ) | | | 0.03 | | | | (0.06 | ) | | | 0.12 | |
| | | | | | | | | | | | | | | | | | | | | | | | | | | | |
Total from investment operations | | | 0.08 | | | | 0.04 | | | | 0.04 | | | | 0.02 | | | | 0.13 | | | | 0.08 | | | | 0.25 | |
| | | | | | | | | | | | | | | | | | | | | | | | | | | | |
| Less dividends and distributions: | | | | | | | | | | | | | | | | | | | | | | | | | | | | |
From net investment income | | | (0.05 | ) | | | (0.03 | ) | | | (0.06 | ) | | | (0.08 | ) | | | (0.10 | ) | | | (0.15 | ) | | | (0.13 | ) |
From net realized gain on investments | | | — | | | | (0.01 | ) | | | (0.02 | ) | | | (0.04 | ) | | | (0.04 | ) | | | (0.02 | ) | | | (0.12 | ) |
| | | | | | | | | | | | | | | | | | | | | | | | | | | | |
Total dividends and distributions | | | (0.05 | ) | | | (0.04 | ) | | | (0.08 | ) | | | (0.12 | ) | | | (0.14 | ) | | | (0.17 | ) | | | (0.25 | ) |
| | | | | | | | | | | | | | | | | | | | | | | | | | | | |
Net asset value at end of period | | $ | 9.57 | | | $ | 9.54 | | | $ | 9.54 | | | $ | 9.58 | | | $ | 9.68 | | | $ | 9.69 | | | $ | 9.78 | |
| | | | | | | | | | | | | | | | | | | | | | | | | | | | |
Total investment return (b) | | | 0.79 | %(c) | | | 0.40 | %(c) | | | 0.45 | % | | | 0.19 | % | | | 1.39 | % | | | 0.78 | % | | | 2.55 | % |
| Ratios (to average net assets)/Supplemental Data: | | | | | | | | | | | | | | | | | | | | | | | | | | | | |
Net investment income (loss) | | | 0.99 | %†† | | | 0.56 | %†† | | | 0.66 | % | | | 0.79 | % | | | 1.03 | % | | | 1.48 | % | | | 1.32 | % |
Net expenses | | | 0.56 | %†† | | | 0.61 | %†† | | | 0.61 | % | | | 0.63 | % | | | 0.68 | % | | | 0.68 | % | | | 0.68 | % |
Expenses (before waiver/reimbursement) | | | 0.81 | %†† | | | 0.99 | %†† | | | 0.82 | % | | | 0.88 | % | | | 0.85 | % | | | 0.90 | % | | | 0.90 | % |
Portfolio turnover rate | | | 98 | % | | | 7 | % | | | 30 | % | | | 67 | % | | | 60 | % | | | 39 | % | | | 68 | %(d) |
Net assets at end of period (in 000’s) | | $ | 44,533 | | | $ | 30,626 | | | $ | 43,509 | | | $ | 60,437 | | | $ | 51,509 | | | $ | 48,193 | | | $ | 76,456 | |
| *** | The Fund changed its fiscal year end from October 31 to April 30. |
| (a) | Per share data based on average shares outstanding during the period. |
| (b) | Total investment return is calculated exclusive of sales charges and assumes the reinvestment of dividends and distributions. Class I shares are not subject to sales charges. |
| (c) | Total investment return is not annualized. |
| (d) | The portfolio turnover rate not including mortgage dollar rolls was 52% for the year ended October 31, 2010. |
| | | | |
| 22 | | MainStay Tax Advantaged Short Term Bond Fund | | The notes to the financial statements are an integral part of,
and should be read in conjunction with, the financial statements. |
Notes to Financial Statements (Unaudited)
Note 1–Organization and Business
MainStay Funds Trust (the “Trust”) was organized as a Delaware statutory trust on April 28, 2009, and is governed by a Declaration of Trust. The Trust is registered under the Investment Company Act of 1940, as amended (the “1940 Act”), as an open-end management investment company, and is comprised of thirty-eight funds (collectively referred to as the “Funds”). These financial statements and notes relate to the MainStay Tax Advantaged Short Term Bond Fund (formerly known as MainStay Short Term Bond Fund (the “Fund”), a “diversified” fund, as that term is defined in the 1940 Act, as interpreted or modified by regulatory authorities having jurisdiction, from time to time. The Fund is the successor of the MainStay Short Term Bond Fund, a series of Eclipse Funds Inc. (the “Predecessor Fund”). The reorganization of the Predecessor Fund with and into the Fund occurred on February 26, 2010. All information regarding and references to periods prior to February 26, 2010 relate to the Predecessor Fund.
The Fund currently offers three classes of shares. Class I shares commenced operations on January 2, 1991. Class A shares commenced operations on January 2, 2004. Investor Class shares commenced operations on February 28, 2008. Class A and Investor Class shares are offered at net asset value (“NAV”) per share plus an initial sales charge. No sales charge applies to investments of $250,000 or more (and certain other qualified purchases) in Class A and Investor Class shares, but a contingent deferred sales charge (“CDSC”) is imposed on certain redemptions of such shares made within one year of the date of purchase. Class I shares are offered at NAV and are not subject to a sales charge. Depending upon eligibility, Class A shares may convert to Investor Class shares and Investor Class shares may convert to Class A shares. The three classes of shares have the same voting (except for issues that relate solely to one class), dividend, liquidation and other rights, and the same terms and conditions, except that Class A and Investor Class shares are subject to a distribution and/or service fee. Class I shares are not subject to a distribution and/or service fee.
The Fund’s investment objective is to seek after tax total return.
Effective April 30, 2015, the Fund changed its fiscal and tax year end from October 31 to April 30.
At meetings held on March 24-26, 2015, the Board (as defined below) approved changes to the Fund’s name (from MainStay Short Term Bond Fund to MainStay Tax Advantaged Short Term Bond Fund), investment objective, primary benchmark, portfolio management team, principal investment strategies, management fee and certain other characteristics of the Fund effective June 1, 2015. For more information regarding these changes, please see the supplement to the Fund’s registration statement dated March 27, 2015.
Note 2–Significant Accounting Policies
The Fund is an investment company and accordingly follows the investment company accounting and reporting guidance of the Financial Accounting Standards Board (FASB) Accounting Standard Codification Topic 946 Financial Services – Investment Companies. The Fund prepares its financial statements in accordance with generally accepted accounting principles (“GAAP”) in the United States of America and follows the significant accounting policies described below.
(A) Securities Valuation. Investments are valued as of the close of regular trading on the New York Stock Exchange (“Exchange”) (generally 4:00 p.m. Eastern time) on each day the Fund is open for business (“valuation date”).
The Board of Trustees (the “Board”) adopted procedures establishing methodologies for the valuation of the Fund’s securities and delegated the responsibility for valuation determinations under those procedures to the Valuation Committee of the Fund (the “Valuation Committee”). The Board authorized the Valuation Committee to appoint a Valuation Sub-Committee (the “Sub-Committee”) to deal in the first instance with establishing the prices of securities for which market quotations are not readily available or the prices of which are not otherwise readily determinable under these procedures. The Sub-Committee meets (in person, via electronic mail or via teleconference) on an as-needed basis. Subsequently, the Valuation Committee meets to ensure that actions taken by the Sub-Committee were appropriate. The procedures recognize that, subject to the oversight of the Board and unless otherwise noted, the responsibility for the day-to-day valuation of portfolio assets (including fair value measurements for the Fund’s assets and liabilities) rests with New York Life Investment Management LLC (“New York Life Investments” or the “Manager”), aided to whatever extent necessary by the Subadvisor (as defined in Note 3(A)) to the Fund.
To assess the appropriateness of security valuations, the Manager, Subadvisor or the Fund’s third party service provider, who is subject to oversight by the Manager, regularly compares prior day prices, prices on comparable securities, and the sale prices to the prior and current day prices and challenges prices with changes exceeding certain tolerance levels with third party pricing services or broker sources. For those securities valued through either a standardized fair valuation methodology or a fair valuation measurement, the Sub-Committee deals in the first instance with such valuation and the Valuation Committee reviews and affirms the reasonableness of the valuation based on such methodologies and measurements on a regular basis after considering all relevant information that is reasonably available. Any action taken by the Sub-Committee with respect to the valuation of a portfolio security is submitted by the Valuation Committee to the Board for its review and ratification, if appropriate, at its next regularly scheduled meeting.
“Fair value” is defined as the price the Fund would receive upon selling an asset or liability in an orderly transaction to an independent buyer in the principal or most advantageous market for the asset or liability. Fair value measurements are determined within a framework that establishes a three-tier hierarchy which maximizes the use of observable market data and minimizes the use of unobservable inputs to establish a classification of fair value measurements for disclosure purposes. “Inputs” refer broadly to the assumptions that market participants would use in pricing the asset or liability, including assumptions about risk, such as the risk inherent in a particular valuation technique used to measure fair value using a pricing model and/or the risk inherent in the inputs for the valuation technique. Inputs may be observable or unobservable. Observable inputs reflect the assumptions market participants would use in pricing the asset or liability based on market data obtained from sources independent of the Fund. Unobservable inputs reflect the Fund’s own assumptions about the assumptions market participants would use in pricing the asset or liability based on the information available. The inputs or methodology used for valuing assets
Notes to Financial Statements (Unaudited) (continued)
or liabilities may not be an indication of the risks associated with investing in those assets or liabilities. The three-tier hierarchy of inputs is summarized below.
| • | | Level 1—quoted prices in active markets for an identical asset or liability |
| • | | Level 2—other significant observable inputs (including quoted prices for a similar asset or liability in active markets, interest rates and yield curves, prepayment speeds, credit risk, etc.) |
| • | | Level 3—significant unobservable inputs (including the Fund’s own assumptions about the assumptions that market participants would use in measuring fair value of an asset or liability) |
The level of an asset or liability within the fair value hierarchy is based on the lowest level of an input, both individually and in the aggregate, that is significant to the fair value measurement. As of October 31, 2015, the aggregate value by input level of the Fund’s assets and liabilities is included at the end of the Fund’s Portfolio of Investments.
The Fund may use third party vendor evaluations, whose prices may be derived from one or more of the following standard inputs among others:
| | |
• Benchmark yields | | • Reported trades |
• Broker/dealer quotes | | • Issuer spreads |
• Two-sided markets | | • Benchmark securities |
• Bids/offers | | • Reference data (corporate actions or material event notices) |
• Industry and economic events | | • Comparable bonds |
• Equity and credit default swap curves | | • Monthly payment information |
An asset or liability for which market values cannot be measured using the methodologies described above is valued by methods deemed reasonable in good faith by the Valuation Committee, following the procedures established by the Board, to represent fair value. Under these procedures, the Fund generally uses a market-based approach which may use related or comparable assets or liabilities, recent transactions, market multiples, book values, and other relevant information. The Fund may also use an income-based valuation approach in which the anticipated future cash flows of the asset or liability are discounted to calculate fair value. Discounts may also be applied due to the nature and/or duration of any restrictions on the disposition of the asset or liability. Due to the inherent uncertainty of such assets or liabilities, fair values may differ significantly from values that would have been used had an active market existed. During the six-month period ended October 31, 2015, there were no material changes to the fair value methodologies.
Equity and non-equity securities which may be valued in this manner include, but are not limited to: (i) a security for which trading has been halted or suspended; (ii) a debt security that has recently gone into default and for which there is not a current market quotation; (iii) a security of an issuer that has entered into a restructuring; (iv) a security that has been de-listed from a national exchange; (v) a security for which the market price is not readily available from a third party pricing source or, if so provided, does not, in the opinion of the Manager or Subadvisor reflect the security’s market value; (vi) a security subject to trading collars for which no or limited trading takes place; and (vii) a
security whose principal market has been temporarily closed at a time when, under normal conditions, it would be open. Securities for which market quotations or observable inputs are not readily available are generally categorized as Level 3 in the hierarchy. As of October 31, 2015, there were no securities held by the Fund that were fair valued in such a manner.
Debt securities (other than convertible and municipal bonds) are valued at the evaluated bid prices (evaluated mean prices in the case of convertible and municipal bonds) supplied by a pricing agent or broker selected by the Manager, in consultation with the Subadvisor. Those values reflect broker/dealer supplied prices and electronic data processing techniques, if the evaluated bid or mean prices are deemed by the Manager, in consultation with the Subadvisor, to be representative of market values, at the regular close of trading of the Exchange on each valuation date. Debt securities purchased on a delayed delivery basis are marked to market daily until settlement at the forward settlement date. Debt securities, including corporate bonds, U.S. government & federal agency bonds, municipal bonds, foreign bonds, convertible bonds, asset-backed securities and mortgage-backed securities are generally categorized as Level 2 in the hierarchy.
Investments in mutual funds, including money market funds, are valued at their respective NAVs as of the close of the Exchange on the valuation date. These securities are generally categorized as Level 1 in the hierarchy.
Temporary cash investments acquired in excess of 60 days to maturity at the time of purchase are valued using the latest bid prices or using valuations based on a matrix system (which considers such factors as security prices, yields, maturities, and ratings), both as furnished by independent pricing services. Other temporary cash investments which mature in 60 days or less at the time of purchase (“Short-Term Investments”) are valued using the amortized cost method of valuation, unless the use of such method would be inappropriate. The amortized cost method involves valuing a security at its cost on the date of purchase and thereafter assuming a constant amortization to maturity of the difference between such cost and the value on maturity date. Amortized cost approximates the current fair value of a security. These securities are generally categorized as Level 2 in the hierarchy.
(B) Income Taxes. The Fund’s policy is to comply with the requirements of the Internal Revenue Code of 1986, as amended (the “Internal Revenue Code”), applicable to regulated investment companies and to distribute all of the taxable income to the shareholders of the Fund within the allowable time limits. Therefore, no federal, state and local income tax provisions are required.
Management evaluates the Fund’s tax positions to determine if the tax positions taken meet the minimum recognition threshold in connection with accounting for uncertainties in income tax positions taken or expected to be taken for the purposes of measuring and recognizing tax liabilities in the financial statements. Recognition of tax benefits of an uncertain tax position is required only when the position is “more likely than not” to be sustained assuming examination by taxing authorities. Management has analyzed the Fund’s tax positions taken on federal, state and local income tax returns for all open tax years (for up to three tax years), and has concluded that no provisions for federal, state and local income tax are required in the Fund’s financial statements. The Fund’s federal, state and local income and federal excise tax returns for
| | |
| 24 | | MainStay Tax Advantaged Short Term Bond Fund |
tax years for which the applicable statutes of limitations have not expired are subject to examination by the Internal Revenue Service and state and local departments of revenue.
(C) Dividends and Distributions to Shareholders. Dividends and distributions are recorded on the ex-dividend date. The Fund intends to declare and pay dividends from net investment income, if any, at least monthly and distributions from net realized capital and currency gains, if any, at least annually. Unless the shareholder elects otherwise, all dividends and distributions are reinvested in the same class of shares of the Fund, at NAV. Dividends and distributions to shareholders are determined in accordance with federal income tax regulations and may differ from GAAP.
(D) Security Transactions and Investment Income. The Fund records security transactions on the trade date. Realized gains and losses on security transactions are determined using the identified cost method. Interest income is accrued as earned using the effective interest rate method and includes realized gains and losses from repayments of principal on mortgage-backed securities. Discounts and premiums on securities purchased, other than Short-Term Investments, for the Fund are accreted and amortized, respectively, on the effective interest rate method over the life of the respective securities or, in the case of a callable security, over the period to the first date of call. Discounts and premiums on Short-Term Investments are accreted and amortized, respectively, on the straight-line method. The straight-line method approximates the effective interest method for short-term investments. Income from payment-in-kind securities is recorded daily based on the effective interest method of accrual.
Investment income and realized and unrealized gains and losses on investments of the Fund are allocated to separate classes of shares pro rata based upon their relative net assets on the date the income is earned or realized and unrealized gains and losses are incurred.
The Fund may place a debt obligation on non-accrual status and reduce related interest income by ceasing current accruals and writing off interest receivables when the collection of all or a portion of interest has become doubtful based on consistently applied procedures. A debt obligation is removed from non-accrual status when the issuer resumes interest payments or when collectability of interest is reasonably assured.
(E) Expenses. Expenses of the Trust are allocated to the individual Funds in proportion to the net assets of the respective Funds when the expenses are incurred, except where direct allocations of expenses can be made. Expenses (other than transfer agent expenses and fees incurred under the shareholder services plans and/or the distribution plans further discussed in Note 3(B)) are allocated to separate classes of shares pro rata based upon their relative net assets on the date the expenses are incurred. The expenses borne by the Fund, including those of related parties to the Fund, are shown in the Statement of Operations.
(F) Use of Estimates. In preparing financial statements in conformity with GAAP, management makes estimates and assumptions that affect the reported amounts and disclosures in the financial statements. Actual results could differ from those estimates.
(G) Repurchase Agreements. The Fund may enter into repurchase agreements to earn income. The Fund may enter into repurchase agreements only with financial institutions that are deemed by the Manager or Subadvisor to be creditworthy, pursuant to guidelines established by the Board. During the term of any repurchase agreement, the Manager or Subadvisor will continue to monitor the creditworthiness of the seller. Under the 1940 Act, repurchase agreements are considered to be collateralized loans by the Fund to the seller secured by the securities transferred to the Fund.
When the Fund invests in repurchase agreements, the Fund’s custodian takes possession of the collateral pledged for investments in the repurchase agreement. The underlying collateral is valued daily on a mark to market basis to determine if the value, including accrued interest, exceeds the repurchase price. In the event of the seller’s default on the obligation to repurchase, the Fund has the right to liquidate the collateral and apply the proceeds in satisfaction of the obligation. Under certain circumstances, such as in the event of default or bankruptcy by the counterparty to the agreement, realization and/or retention of the collateral may be subject to legal proceedings and possible realized loss to the Fund.
(H) Dollar Rolls. The Fund may enter into dollar roll transactions in which it sells mortgage-backed securities (“MBS”) from its portfolio to a counterparty from whom it simultaneously agrees to buy a similar security on a delayed delivery basis. The Fund generally transfers MBS where the MBS are “to be announced,” therefore, the Fund accounts for these transactions as purchases and sales. The securities sold in connection with the dollar rolls are removed from the portfolio and a realized gain or loss is recognized. The securities the Fund has agreed to acquire are included at market value in the Portfolio of Investments and liabilities for such purchase commitments are included as payables for investments purchased. During the roll period, the Fund foregoes principal and interest paid on the securities. The Fund is compensated by the difference between the current sales price and the forward price for the future as well as by the earnings on the cash proceeds of the initial sale. Dollar rolls may be renewed without physical delivery of the securities subject to the contract. The Fund maintains liquid assets from its portfolio having a value not less than the repurchase price, including accrued interest. Dollar roll transactions involve certain risks, including the risk that the security returned to the Fund at the end of the roll period, while substantially similar, could be inferior to what was initially sold to the counterparty.
(I) Securities Lending. In order to realize additional income, the Fund may engage in securities lending, subject to the limitations set forth in the 1940 Act and relevant guidance by the staff of the Securities and Exchange Commission. In the event the Fund does engage in securities lending, the Fund will lend through its custodian, State Street Bank and Trust Company (“State Street”). State Street will manage the Fund’s cash collateral in accordance with the lending agreement between the Fund and State Street, and indemnify the Fund against counterparty risk. The loans will be collateralized by cash or securities at least equal at all times to the market value of the securities loaned. Collateral will consist of U.S. government securities, cash equivalents or irrevocable letters of credit. The Fund may bear the risk of delay in recovery of, or loss of rights in, the securities loaned should the borrower of the securities experience financial difficulty. The Fund may also record a realized
Notes to Financial Statements (Unaudited) (continued)
gain or loss on securities deemed sold due to a borrower’s inability to return securities on loan. The Fund bears the risk of any loss on investment of the collateral. The Fund will receive compensation for lending its securities in the form of fees or it will retain a portion of interest on the investment of any cash received as collateral. The Fund will also continue to receive interest and dividends on the securities loaned and any gain or loss in the market price of the securities loaned that may occur during the term of the loan will be for the account of the Fund. During the six-month period ended October 31, 2015, the Fund did not have any portfolio securities on loan.
(J) Concentration of Risk. The ability of issuers of debt securities held by the Fund to meet their obligations may be affected by economic or political developments in a specific country, industry or region.
(K) Indemnifications. Under the Trust’s organizational documents, its officers and trustees are indemnified against certain liabilities that may arise out of performance of their duties to the Trust. Additionally, in the normal course of business, the Fund enters into contracts with third-party service providers that contain a variety of representations and warranties and which may provide general indemnifications. The Fund’s maximum exposure under these arrangements is unknown, as this would involve future claims that may be made against the Fund that have not yet occurred. Based on experience, management is of the view that the risk of loss in connection with these potential indemnification obligations is remote. However, there can be no assurance that material liabilities related to such obligations will not arise in the future, which could adversely impact the Fund.
Note 3–Fees and Related Party Transactions
(A) Manager and Subadvisor. New York Life Investments, a registered investment adviser and an indirect, wholly-owned subsidiary of New York Life Insurance Company (“New York Life”), serves as the Fund’s Manager, pursuant to an Amended and Restated Management Agreement (“Management Agreement”). The Manager provides offices, conducts clerical, recordkeeping and bookkeeping services, and keeps most of the financial and accounting records required to be maintained by the Fund. Except for the portion of salaries and expenses that are the responsibility of the Fund, the Manager pays the salaries and expenses of all personnel affiliated with the Fund and certain operational expenses of the Fund. The Fund reimburses New York Life Investments in an amount equal to a portion of the compensation of the Chief Compliance Officer of the Fund. MacKay Shields LLC (“MacKay Shields” or the “Subadvisor”), a registered investment adviser and an indirect, wholly-owned subsidiary of New York Life, serves as Subadvisor to the Fund and is responsible for the day-to-day portfolio management of the Fund. Pursuant to the terms of a Subadvisory Agreement (“Subadvisory Agreement”) between New York Life Investments and MacKay Shields, New York Life Investments pays for the services of the Subadvisor.
Under the Management Agreement, which came into effect on June 1, 2015, the Fund pays the Manager a monthly fee for services performed and facilities furnished at an annual rate of the Fund’s average daily net assets as follows: 0.45% on all assets. Prior to June 1, 2015, the Fund paid the Manager a monthly fee at an annual rate of the Fund’s average daily net assets as follows: 0.50% up to $500 million and 0.475% on assets above $500 million. During the six month period ended
October 31, 2015, the effective management fee rate (exclusive of any applicable waivers/reimbursements) was 0.46%.
Effective June 1, 2015, New York Life Investments has contractually agreed to waive fees and/or reimburse expenses so that Total Annual Fund Operating Expenses for Class A shares do not exceed 0.80% of its average daily net assets. New York Life Investments will apply an equivalent waiver or reimbursement, in an equal number of basis points, to the other share classes of the Fund. This agreement will remain in effect until August 29, 2016, and shall renew automatically for one-year terms unless New York Life Investments provides written notice of termination prior to the start of the next term or upon approval by the Board. Prior to June 1, 2015, New York Life Investments contractually agreed to waive fees and/or reimburse expenses so that Total Annual Fund Operating Expenses for Class A shares would not exceed 0.86% of its average daily net assets. Prior to June 1, 2015, New York Life Investments contractually agreed to apply an equivalent waiver or reimbursement, in an equal number of basis points, to the other share classes of the Fund. Total Annual Fund Operating Expenses excludes taxes, interest, litigation, extraordinary expenses, brokerage and other transaction expenses relating to the purchase or sale of portfolio investments, and acquired (underlying) fund fees and expenses.
During the six-month period ended October 31, 2015, New York Life Investments earned fees from the Fund in the amount of $137,457 and waived its fees and/or reimbursed expenses in the amount of $74,260.
State Street provides sub-administration and sub-accounting services to the Fund pursuant to an agreement with New York Life Investments. These services include calculating the daily NAVs of the Fund, maintaining the general ledger and sub-ledger accounts for the calculation of the Fund’s NAVs, and assisting New York Life Investments in conducting various aspects of the Fund’s administrative operations. For providing these services to the Fund, State Street is compensated by New York Life Investments.
(B) Distribution and Service Fees. The Trust, on behalf of the Fund, has entered into a distribution agreement with NYLIFE Distributors LLC (the “Distributor”), an indirect, wholly-owned subsidiary of New York Life. The Fund has adopted distribution plans (the “Plans”) in accordance with the provisions of Rule 12b-1 under the 1940 Act.
Pursuant to the Class A and Investor Class Plans, the Distributor receives a monthly distribution fee from the Class A and Investor Class shares at an annual rate of 0.25% of the average daily net assets of the Class A and Investor Class shares for distribution and/or service activities as designated by the Distributor. Class I shares are not subject to a distribution and/or service fee.
The Plans provide that the distribution and service fees are payable to the Distributor regardless of the amounts actually expended by the Distributor for distribution of the Fund’s shares and service activities.
(C) Sales Charges. During the six-month period ended October 31, 2015, the Fund was advised by the Distributor that the amount of initial sales charges retained on sales of Class A and Investor Class shares were $688 and $1, respectively. During the six-month period ended October 31, 2015, the Fund was also advised that the Distributor retained CDSCs on redemptions of Class A shares of $22.
| | |
| 26 | | MainStay Tax Advantaged Short Term Bond Fund |
(D) Transfer, Dividend Disbursing and Shareholder Servicing Agent. NYLIM Service Company LLC, an affiliate of New York Life Investments, is the Fund’s transfer, dividend disbursing and shareholder servicing agent pursuant to an agreement between NYLIM Service Company LLC and the Trust. NYLIM Service Company LLC has entered into an agreement with Boston Financial Data Services, Inc. (“BFDS”) pursuant to which BFDS performs certain transfer agent services on behalf of NYLIM Service Company LLC. During the six-month period ended October 31, 2015, transfer agent expenses incurred by the Fund were as follows:
| | | | |
Class A | | $ | 9,355 | |
Investor Class | | | 8,147 | |
Class I | | | 12,492 | |
(E) Small Account Fee. Shareholders with small accounts adversely impact the cost of providing transfer agency services. In an effort to reduce total transfer agency expenses, the Fund has implemented a small account fee on certain types of accounts. Certain shareholders with an account balance of less than $1,000 are charged an annual per account fee of $20 (assessed semi-annually), the proceeds from which offset transfer agent fees as reflected in the Statement of Operations.
Note 4–Federal Income Tax
As of April 30, 2015 for federal income tax purposes, capital loss carryforwards of $4,043 were available as shown in the table below, to the extent provided by the regulations to offset future realized gains of the Fund through the years indicated. To the extent that these capital loss carryforwards are used to offset future capital gains, it is probable that the capital gains so offset will not be distributed to shareholders. No capital gain distributions shall be made until any capital loss carryforwards have been fully utilized or expired.
| | | | | | | | |
Capital Loss
Available Through | | Short-Term
Capital Loss
Amounts (000’s) | | | Long-Term
Capital Loss
Amounts (000’s) | |
| Unlimited | | $ | 2 | | | $ | 2 | |
During the six-month period ended April 30, 2015 and the fiscal year ended October 31, 2014, the tax character of distributions paid as reflected in the Statements of Changes in Net Assets was as follows:
| | | | | | | | |
| | | April 30, 2015 | | | October 31, 2014 | |
Distributions paid from: | | | | | | | | |
Ordinary Income | | $ | 128,626 | | | $ | 436,880 | |
Long-Term Capital Gain | | | 73,383 | | | | 160,992 | |
Total | | $ | 202,009 | | | $ | 597,872 | |
Note 5–Custodian
State Street is the custodian of cash and securities held by the Fund. Custodial fees are charged to the Fund based on the Fund’s net assets and/or the market value of securities held by the Fund and the number of certain cash transactions incurred by the Fund.
Note 6–Line of Credit
The Fund and certain affiliated funds, maintain a line of credit with a syndicate of banks in order to secure a source of funds for temporary purposes to meet unanticipated or excessive redemption requests.
Effective August 4, 2015, under a second amended and restated credit agreement (the “Credit Agreement”), the aggregate commitment amount is $600,000,000 with an optional maximum aggregate amount of $700,000,000. The commitment fee is an annual rate of 0.10% of the average commitment amount payable quarterly, regardless of usage, to Bank of New York Mellon, who serves as the agent to the syndicate. The commitment fee is allocated among the Fund and certain affiliated funds based upon their respective net assets and other factors. Interest on any revolving credit loan is charged based upon the Federal Funds Advances Rate or the one month London InterBank Offered Rate, whichever is higher. The Credit Agreement expires on August 2, 2016, although the Fund, certain affiliated funds and the syndicate of banks may renew the Credit Agreement for an additional year on the same or different terms. Prior to August 4, 2015, the aggregate commitment amount was $600,000,000 with an optional maximum of $700,000,000, and the commitment fee was at an annual rate of 0.08% of the average commitment amount. During the six-month period ended October 31, 2015, there were no borrowings made or outstanding with respect to the Fund under the Credit Agreement.
Note 7–Purchases and Sales of Securities (in 000’s)
During the six-month period ended October 31, 2015, purchases and sales of U.S. government securities were $0 and $21,553 respectively. Purchases and sales of securities, other than U.S. government securities and short-term securities, were $72,119 and $29,950, respectively.
Notes to Financial Statements (Unaudited) (continued)
Note 8–Capital Share Transactions
| | | | | | | | |
Class A | | Shares | | | Amount | |
Six-month period ended October 31, 2015: | | | | | | | | |
Shares sold | | | 2,503,922 | | | $ | 23,909,148 | |
Shares issued to shareholders in reinvestment of dividends and distributions | | | 8,670 | | | | 82,799 | |
Shares redeemed | | | (1,086,422 | ) | | | (10,377,425 | ) |
| | | | |
Net increase (decrease) in shares outstanding before conversion | | | 1,426,170 | | | | 13,614,522 | |
Shares converted from Class A (See Note 1) | | | (1,123 | ) | | | (10,739 | ) |
| | | | |
Net increase (decrease) | | | 1,425,047 | | | $ | 13,603,783 | |
| | | | |
Six-month period ended April 30, 2015: | | | | | | | | |
Shares sold | | | 364,606 | | | $ | 3,474,988 | |
Shares issued to shareholders in reinvestment of dividends and distributions | | | 5,246 | | | | 49,994 | |
Shares redeemed | | | (493,037 | ) | | | (4,700,369 | ) |
| | | | |
Net increase (decrease) in shares outstanding before conversion | | | (123,185 | ) | | | (1,175,387 | ) |
Shares converted into Class A (See Note 1) | | | 5,740 | | | | 54,683 | |
Shares converted from Class A (See Note 1) | | | (5,876 | ) | | | (55,997 | ) |
| | | | |
Net increase (decrease) | | | (123,321 | ) | | $ | (1,176,701 | ) |
| | | | |
Year ended October 31, 2014: | | | | | | | | |
Shares sold | | | 583,104 | | | $ | 5,571,685 | |
Shares issued to shareholders in reinvestment of dividends and distributions | | | 13,234 | | | | 126,430 | |
Shares redeemed | | | (1,051,168 | ) | | | (10,044,830 | ) |
| | | | |
Net increase (decrease) in shares outstanding before conversion | | | (454,830 | ) | | | (4,346,715 | ) |
Shares converted into Class A (See Note 1) | | | 4,207 | | | | 40,173 | |
Shares converted from Class A (See Note 1) | | | (16,440 | ) | | | (156,765 | ) |
| | | | |
Net increase (decrease) | | | (467,063 | ) | | $ | (4,463,307 | ) |
| | | | |
| | |
| | | | | | | | |
| | | | | | | | |
Investor Class | | Shares | | | Amount | |
Six-month period ended October 31, 2015: | | | | | | | | |
Shares sold | | | 19,120 | | | $ | 182,890 | |
Shares issued to shareholders in reinvestment of dividends and distributions | | | 591 | | | | 5,659 | |
Shares redeemed | | | (21,244 | ) | | | (203,105 | ) |
| | | | |
Net increase (decrease) in shares outstanding before conversion | | | (1,533 | ) | | | (14,556 | ) |
Shares converted into Investor Class (See Note 1) | | | 1,121 | | | | 10,739 | |
| | | | |
Net increase (decrease) | | | (412 | ) | | $ | (3,817 | ) |
| | | | |
Six-month period ended April 30, 2015: | | | | | | | | |
Shares sold | | | 45,517 | | | $ | 434,847 | |
Shares issued to shareholders in reinvestment of dividends and distributions | | | 486 | | | | 4,640 | |
Shares redeemed | | | (76,560 | ) | | | (731,537 | ) |
| | | | |
Net increase (decrease) in shares outstanding before conversion | | | (30,557 | ) | | | (292,050 | ) |
Shares converted into Investor Class (See Note 1) | | | 5,864 | | | | 55,997 | |
Shares converted from Investor Class (See Note 1) | | | (5,728 | ) | | | (54,683 | ) |
| | | | |
Net increase (decrease) | | | (30,421 | ) | | $ | (290,736 | ) |
| | | | |
Year ended October 31, 2014: | | | | | | | | |
Shares sold | | | 62,070 | | | $ | 594,852 | |
Shares issued to shareholders in reinvestment of dividends and distributions | | | 1,094 | | | | 10,488 | |
Shares redeemed | | | (85,847 | ) | | | (822,654 | ) |
| | | | |
Net increase (decrease) in shares outstanding before conversion | | | (22,683 | ) | | | (217,314 | ) |
Shares converted into Class A (See Note 1) | | | 16,388 | | | | 156,765 | |
Shares converted from Class A (See Note 1) | | | (4,194 | ) | | | (40,173 | ) |
| | | | |
Net increase (decrease) | | | (10,489 | ) | | $ | (100,722 | ) |
| | | | |
| | |
| | | | | | | | |
Class I | | Shares | | | Amount | |
Six-month period ended October 31, 2015: | | | | | | | | |
Shares sold | | | 2,888,155 | | | $ | 27,582,697 | |
Shares issued to shareholders in reinvestment of dividends and distributions | | | 12,041 | | | | 114,988 | |
Shares redeemed | | | (1,457,474 | ) | | | (13,915,473 | ) |
| | | | |
Net increase (decrease) | | | 1,442,722 | | | $ | 13,782,212 | |
| | | | |
Six-month period ended April 30, 2015: | | | | | | | | |
Shares sold | | | 1,101,344 | | | $ | 10,500,049 | |
Shares issued to shareholders in reinvestment of dividends and distributions | | | 11,710 | | | | 111,616 | |
Shares redeemed | | | (2,462,695 | ) | | | (23,465,925 | ) |
| | | | |
Net increase (decrease) | | | (1,349,641 | ) | | $ | (12,854,260 | ) |
| | | | |
Year ended October 31, 2014: | | | | | | | | |
Shares sold | | | 3,375,337 | | | $ | 32,229,686 | |
Shares issued to shareholders in reinvestment of dividends and distributions | | | 41,254 | | | | 394,104 | |
Shares redeemed | | | (5,162,502 | ) | | | (49,292,398 | ) |
| | | | |
Net increase (decrease) | | | (1,745,911 | ) | | $ | (16,668,608 | ) |
| | | | |
| | |
| 28 | | MainStay Tax Advantaged Short Term Bond Fund |
Note 9–Recent Accounting Pronouncement
In June 2014, FASB issued ASU 2014-11, Transfers & Servicing (Topic 860): Repurchase-to-Maturity Transactions, Repurchase Financings, and Disclosures, which addresses the financial reporting of repurchase agreements and other similar transactions. The guidance classifies when repurchase agreements and securities lending transactions should be accounted for as secured borrowings, as well as require expanded disclosure of these types of transactions. The guidance is effective for financial statements with fiscal years beginning after December 15, 2014, and for interim periods within those fiscal years. Management is evaluating the impact, if any, of this guidance on the Fund’s financial statement disclosures.
Note 10–Subsequent Events
In connection with the preparation of the financial statements of the Fund as of and for the six-month period ended October 31, 2015, events and transactions subsequent to October 31, 2015, through the date the financial statements were issued have been evaluated by the Fund’s management for possible adjustment and/or disclosure. No subsequent events requiring financial statement adjustment or disclosure have been identified.
Proxy Voting Policies and Procedures and Proxy Voting Record
A description of the policies and procedures that New York Life Investments uses to vote proxies related to the Fund’s securities is available without charge, upon request, (i) by visiting the Fund’s website at mainstaylnvestments.com; and (ii) on the Securities and Exchange Commission’s (SEC) website at www.sec.gov.
The Fund is required to file with the SEC its proxy voting record for the 12-month period ending June 30 on Form N-PX. The Fund’s most recent Form N-PX or proxy voting record is available free of charge upon request by calling 800-MAINSTAY (624-6782); visiting the Fund’s website at mainstayinvestments.com; or on the SEC’s website at www.sec.gov.
Shareholder Reports and Quarterly Portfolio Disclosure
The Fund is required to file its complete schedule of portfolio holdings with the SEC for its first and third fiscal quarters on Form N-Q. The Fund’s Form N-Q is available without charge, on the SEC’s website at www.sec.gov or by calling MainStay Investments at 800-MAINSTAY (624-6782). You also can obtain and review copies of Form N-Q by visiting the SEC’s Public Reference Room in Washington, DC (information on the operation of the Public Reference Room may be obtained by calling 1-800-SEC-0330).
| | |
| 30 | | MainStay Tax Advantaged Short Term Bond Fund |
MainStay Funds
MainStay offers a wide range of Funds for virtually any investment need. The full array of MainStay open-end offerings is listed here, with information about the manager, subadvisors, legal counsel and independent registered public accounting firms.
Equity
U.S. Equity
MainStay Common Stock Fund
MainStay Cornerstone Growth Fund
MainStay Epoch U.S. All Cap Fund
MainStay Epoch U.S. Equity Yield Fund
MainStay ICAP Equity Fund
MainStay ICAP Select Equity Fund
MainStay Large Cap Growth Fund
MainStay MAP Fund
MainStay S&P 500 Index Fund
MainStay U.S. Equity Opportunities Fund
MainStay U.S. Small Cap Fund
International/Global Equity
MainStay Emerging Markets Opportunities Fund
MainStay Epoch Global Choice Fund
MainStay Epoch Global Equity Yield Fund
MainStay Epoch International Small Cap Fund
MainStay ICAP International Fund
MainStay International Equity Fund
MainStay International Opportunities Fund
Income
Taxable Bond
MainStay Floating Rate Fund
MainStay Global High Income Fund
MainStay Government Fund
MainStay High Yield Corporate Bond Fund
MainStay High Yield Opportunities Fund
MainStay Indexed Bond Fund
MainStay Short Duration High Yield Fund
MainStay Total Return Bond Fund
MainStay Unconstrained Bond Fund
Municipal/Tax Advantaged Bond
MainStay California Tax Free Opportunities Fund1
MainStay High Yield Municipal Bond Fund
MainStay New York Tax Free Opportunities Fund2
MainStay Tax Advantaged Short Term Bond Fund
MainStay Tax Free Bond Fund
Money Market
MainStay Money Market Fund
Mixed Asset
MainStay Balanced Fund
MainStay Convertible Fund
MainStay Income Builder Fund
Alternative
MainStay Absolute Return Multi-Strategy Fund
MainStay Cushing MLP Premier Fund
MainStay Cushing Renaissance Advantage Fund
MainStay Cushing Royalty Energy Income Fund
MainStay Marketfield Fund
Asset Allocation/Target Date
MainStay Conservative Allocation Fund
MainStay Growth Allocation Fund
MainStay Moderate Allocation Fund
MainStay Moderate Growth Allocation Fund
MainStay Retirement 2010 Fund
MainStay Retirement 2020 Fund
MainStay Retirement 2030 Fund
MainStay Retirement 2040 Fund
MainStay Retirement 2050 Fund
Manager
New York Life Investment Management LLC
New York, New York
Subadvisors
Candriam France S.A.S.3
Paris, France
Cornerstone Capital Management Holdings LLC3
New York, New York
Cornerstone Capital Management LLC3
Bloomington, Minnesota
Cushing Asset Management, LP
Dallas, Texas
Epoch Investment Partners, Inc.
New York, New York
Institutional Capital LLC3
Chicago, Illinois
MacKay Shields LLC3
New York, New York
Marketfield Asset Management LLC
New York, New York
Markston International LLC
White Plains, New York
NYL Investors LLC3
New York, New York
Winslow Capital Management LLC
Minneapolis, Minnesota
Legal Counsel
Dechert LLP
Independent Registered Public Accounting Firms
KPMG LLP4
PricewaterhouseCoopers LLP5
1. This Fund is only registered for sale in AZ, CA, NV, OR, UT, and WA.
2. This Fund is only registered for sale in CT, DE, FL, MA, NJ, NY, and VT.
3. An affiliate of New York Life Investment Management LLC.
4. For all Funds listed above except MainStay Marketfield Fund.
5. For MainStay Marketfield Fund only.
Not part of the Semiannual Report
For more information
800-MAINSTAY (624-6782)
mainstayinvestments.com
The MainStay Funds® are managed by New York Life Investment Management LLC and distributed through NYLIFE Distributors LLC, 169 Lackawanna Avenue, Parsippany, NJ 07054, a wholly owned subsidiary of New York Life Insurance Company. NYLIFE Distributors LLC is a Member FINRA/SIPC.
MainStay Investments® is a registered service mark and name under which New York Life Investment Management LLC does business. MainStay Investments, an indirect subsidiary of New York Life Insurance Company, New York, NY 10010, provides investment advisory products and services.
This report may be distributed only when preceded or accompanied by a current Fund prospectus.
©2015 NYLIFE Distributors LLC. All rights reserved.
| | | | | | | | |
| Not FDIC/NCUA Insured | | Not a Deposit | | May Lose Value | | No Bank Guarantee | | Not Insured by Any Government Agency |
| | |
| 1673997 MS291-15 | | MSTAS10-12/15 NL0B5 |
Not applicable.
| Item 3. | Audit Committee Financial Expert. |
Not applicable.
| Item 4. | Principal Accountant Fees and Services. |
Not applicable.
| Item 5. | Audit Committee of Listed Registrants |
Not applicable.
| Item 6. | Schedule of Investments |
The Schedule of Investments is included as part of Item 1 of this report.
| Item 7. | Disclosure of Proxy Voting Policies and Procedures for Closed-End Management Investment Companies. |
Not applicable.
| Item 8. | Portfolio Managers of Closed-End Management Investment Companies. |
Not applicable.
| Item 9. | Purchases of Equity Securities by Closed-End Management Investment Company and Affiliated Purchasers. |
Not Applicable.
| Item 10. | Submission of Matters to a Vote of Security Holders. |
Since the Registrant’s last response to this Item, there have been no material changes to the procedures by which shareholders may recommend nominees to the Registrant’s Board of Trustees.
| Item 11. | Controls and Procedures. |
| (a) | Based on an evaluation of the Registrant’s Disclosure Controls and Procedures (as defined in Rule 30a-3(c) under the Investment Company Act of 1940) (the “Disclosure Controls”), as of a date within 90 days prior to the filing date (the “Filing Date”) of this Form N-CSR (the “Report”), the Registrant’s principal executive officer and principal financial officer have concluded that the Disclosure Controls are reasonably designed to ensure that information required to be disclosed by the Registrant in the Report is recorded, processed, summarized and reported by the Filing Date, including ensuring that information required to be disclosed in the Report is accumulated and communicated to the Registrant’s management, including the Registrant’s principal executive officer and principal financial officer, as appropriate to allow timely decisions regarding required disclosure. |
| (b) | There were no changes in the Registrant’s internal control over financial reporting (as defined in Rule 30a-3(d)) under the Investment Company Act of 1940 that occurred during the second fiscal quarter of the period covered by this report that has materially affected, or is reasonably likely to materially affect, the Registrant’s internal control over financial reporting. |
| (a) | Certifications of principal executive officer and principal financial officer as required by Rule 30a-2 under the Investment Company Act of 1940. |
| (b) | Certifications of principal executive officer and principal financial officer as required by Section 906 of the Sarbanes-Oxley Act of 2002. |
SIGNATURES
Pursuant to the requirements of the Securities Exchange Act of 1934 and the Investment Company Act of 1940, the Registrant has duly caused this Report to be signed on its behalf by the undersigned, thereunto duly authorized.
MAINSTAY FUNDS TRUST
| | |
| By: | | /s/ Stephen P. Fisher |
| | Stephen P. Fisher |
| | President and Principal Executive Officer |
| |
| Date: | | January 8, 2016 |
Pursuant to the requirements of the Securities Exchange Act of 1934 and the Investment Company Act of 1940, this Report has been signed below by the following persons on behalf of the Registrant and in the capacities and on the dates indicated.
| | |
| By: | | /s/ Stephen P. Fisher |
| | Stephen P. Fisher |
| | President and Principal Executive Officer |
| |
| Date: | | January 8, 2016 |
| |
| By: | | /s/ Jack R. Benintende |
| | Jack R. Benintende |
| | Treasurer and Principal Financial and Accounting Officer |
| |
| Date: | | January 8, 2016 |
EXHIBIT INDEX
| (a) | Certifications of principal executive officer and principal financial officer as required by Rule 30a-2 under the Investment Company Act of 1940. |
| (b) | Certification of principal executive officer and principal financial officer as required by Section 906 of the Sarbanes-Oxley Act of 2002. |