UNITED STATES
SECURITIES AND EXCHANGE COMMISSION
Washington, D.C. 20549
Form N-CSR
CERTIFIED SHAREHOLDER REPORT OF REGISTERED MANAGEMENT
INVESTMENT COMPANIES
Investment Company Act File Number 811-22321
MAINSTAY FUNDS TRUST
(Exact name of Registrant as specified in charter)
51 Madison Avenue, New York, NY 10010
(Address of principal executive offices) (Zip code)
J. Kevin Gao, Esq.
30 Hudson Street
Jersey City, New Jersey 07302
(Name and address of agent for service)
Registrant’s telephone number, including area code: (212) 576-7000
Date of fiscal year end: April 30
(MainStay Absolute Return Multi-Strategy Fund and MainStay Tax Advantaged Short Term Bond Fund)
Date of reporting period: October 31, 2016
FORM N-CSR
The information presented in this Form N-CSR relates solely to the
MainStay Absolute Return Multi-Strategy Fund and MainStay Tax Advantaged Short Term
Bond Fund, series of the Registrant.
Item 1. Reports to Stockholders.
MainStay Absolute Return Multi-Strategy Fund
Message from the President and Semiannual Report
Unaudited | October 31, 2016


This page intentionally left blank
Message from the President
During the six months ended October 31, 2016, the U.S. stock and bond markets were somewhat volatile but generally ended the reporting period in positive territory. When the reporting period began, the stock market was in a broad recovery as oil prices continued to rise from their low point in mid-February 2016. Crude oil prices tended to trade in a range during the reporting period, ending October not far from where they were on May 1, 2016.
In late June, the United Kingdom voted to leave the European Union in a referendum popularly known as “Brexit.” The news caused a temporary slump in stocks around the world. Although the British pound dropped in value following the vote, stocks generally recovered through the end of the reporting period. As the reporting period progressed, however, speculation about the upcoming U.S. presidential election heightened market volatility.
According to FTSE-Russell data, U.S. stocks as a whole tended to provide positive returns during the reporting period, with small-capitalization stocks generally outperforming stocks of larger companies. Value stocks outpaced growth stocks at all capitalization levels, with the largest differences among small- to mid-cap stocks.
International and emerging-market stocks were mixed. Rocked by Brexit, European stocks as a whole declined during the reporting period, while stocks in the Asia-Pacific region (with or without Japan) tended to provide positive returns. International stocks as a whole declined, while global stocks advanced. Emerging-market stocks were considerably stronger, boosted by advances in India and Latin America and prices for oil, metals, and other commodities that were closer to historical norms.
Anticipation of a possible Federal Reserve rate hike led to volatility in the bond market, but the Federal Open Market Committee chose not to raise the federal funds target rate during the reporting period. Short-term U.S. Treasury yields rose during the reporting period, and yields on U.S. Treasury securities with maturities of five years or longer declined. Overall, the U.S. bond market provided positive returns, with longer-term bonds generally outperforming shorter-term securities. High-yield bonds in general—and lower-quality credits in particular—were strong performers. Municipal bonds generally
provided modest but positive total returns for the six months ended October 31, 2016.
Central banks around the world remained highly accommodative during the reporting period, particularly in light of Brexit. Shortly after the U.K. referendum, more than a third of all sovereign debt carried negative yields. As an asset class, emerging-market bonds provided mid-single-digit positive returns during the reporting period, and world bonds as a whole also provided positive returns.
At MainStay, we know that political, economic and market events may influence the performance of your Fund investments. While our portfolio managers often pay close attention to such events, their primary emphasis is seeking to invest for the long-term investment needs of our shareholders. With this in mind, they seek to pursue the investment objectives of their respective Funds using the principal investment strategies and investment processes outlined in the prospectus. By placing your assets in the care of our investment professionals, you gain access to their extensive market insight, strategic investment discipline and in-depth experience in risk-management over a wide range of market cycles.
The report that follows provides more detailed information about the market forces, portfolio strategies and individual securities that influenced the performance of your MainStay Fund during the six months ended October 31, 2016. We invite you to read the report carefully as part of your personal investment-review process.
We thank you for your business, and we look forward to a continuing relationship as you pursue your long-range financial goals.
Sincerely,

Stephen P. Fisher
President
The opinions expressed are as of the date of this report and are subject to change. There is no guarantee that any forecast made will come to pass. This material does not constitute investment advice and is not intended as an endorsement of any specific investment. Past performance is no guarantee of future results.
Not part of the Semiannual Report
Table of Contents
Investors should refer to the Fund’s Summary Prospectus and/or Prospectus and consider the Fund’s investment objectives, strategies, risks, charges and expenses carefully before investing. The Summary Prospectus and/or Prospectus contain this and other information about the Fund. You may obtain copies of the Fund’s Summary Prospectus, Prospectus and Statement of Additional Information free of charge, upon request, by calling toll-free 800-MAINSTAY (624-6782), by writing to NYLIFE Distributors LLC, Attn: MainStay Marketing Department, 30 Hudson Street, Jersey City, NJ 07302 or by sending an e-mail to MainStayShareholderServices@nylim.com. These documents are also available via the MainStay Funds’ website at mainstayinvestments.com/documents. Please read the Summary Prospectus and/or Prospectus carefully before investing.
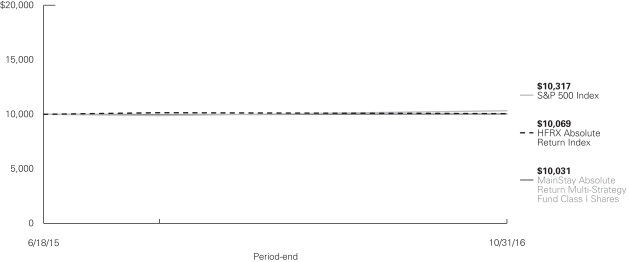
Investment and Performance Comparison1 (Unaudited)
Performance data quoted represents past performance. Past performance is no guarantee of future results. Because of market volatility and other factors, current performance may be lower or higher than the figures shown. Investment return and principal value will fluctuate, and as a result, when shares are redeemed, they may be worth more or less than their original cost. The graph below depicts the historical performance of Class I shares of the Fund. Performance will vary from class to class based on differences in class-specific expenses and sales charges. For performance information current to the most recent month-end, please call 800-MAINSTAY (624-6782) or visit mainstayinvestments.com.
Average Annual Total Returns for the Period Ended October 31, 2016
| | | | | | | | | | | | | | | | | | | | |
| Class | | Sales Charge | | | | Six Months | | | One Year | | | Since
Inception
(6/18/15) | | | Gross
Expense
Ratio2 | |
| Class A Shares | | Maximum 5.5% Initial Sales Charge | | With sales charges Excluding sales charges | |
| –4.93
0.60 | %
| |
| –5.21
0.31 | %
| |
| –3.96
0.08 | %
| |
| 3.48
3.48 | %
|
| Investor Class Shares | | Maximum 5.5% Initial Sales Charge | | With sales charges Excluding sales charges | |
| –5.02
0.51 |
| |
| –5.30
0.21 |
| |
| –4.17
–0.14 |
| |
| 3.67
3.67 |
|
| Class C Shares | | Maximum 1% CDSC if Redeemed Within One Year of Purchase | | With sales charges Excluding sales charges | |
| –0.90
0.10 |
| |
| –1.59
–0.60 |
| |
| –0.94
–0.94 |
| |
| 4.39
4.39 |
|
| Class I Shares | | No Sales Charge | | | | | 0.70 | | | | 0.61 | | | | 0.23 | | | | 3.20 | |
| | | | | | | | | | | | |
| Benchmark Performance | | Six
Months | | | One
Year | | | Since
Inception
(6/18/15) | |
HFRX Absolute Return Index3 | | | 0.78 | % | | | –0.66 | % | | | 0.50 | % |
S&P 500 Index4 | | | 4.06 | | | | 4.51 | | | | 2.30 | |
Average Lipper Alternative Multi-Strategy Fund5 | | | 0.91 | | | | –0.04 | | | | –1.88 | |
| 1. | The performance table and graph do not reflect the deduction of taxes that a shareholder would pay on distributions or Fund share redemptions. Total returns reflect maximum applicable sales charges as indicated in the table above (if any), changes in share price, and reinvestment of dividend and capital gain distributions. The graph assumes the initial investment amount shown above and reflects the deduction of all sales charges that would have applied for the period of investment. Performance figures may reflect certain fee waivers and/or expense limitations, without which total returns may have been lower. For more information on share classes and current fee waivers and/or expense limitations (if any), please refer to the notes to the consolidated financial statements. |
| 2. | The gross expense ratios presented reflect the Fund’s “Total Annual Fund Operating Expenses” from the most recent Prospectus and may differ from other expense ratios disclosed in this report. |
| 3. | The HFRX Absolute Return Index is the Fund’s primary broad-based securities market index for comparison purposes. The HFRX Absolute Return Index is designed to be representative of the overall composition of the hedge fund universe. It is comprised of eligible hedge fund strategies; including but not limited to convertible arbitrage, distressed securities, |
| | equity hedge, equity market neutral, event driven, macro, merger arbitrage, and relative value arbitrage. Results assume reinvestment of all dividends and capital gains. An investment cannot be made directly in an index. |
| 4. | The S&P 500® Index is the Fund’s secondary benchmark index for comparison purposes. “S&P 500®” is a trademark of the McGraw-Hill Companies, Inc. The S&P 500® Index is widely regarded as the standard index for measuring large-cap U.S. stock market performance. Results assume reinvestment of all dividends and capital gains. An investment cannot be made directly in an index. |
| 5. | The Average Lipper Alternative Multi-Strategy Fund is representative of funds that seek total returns through the management of several different hedge-fund like strategies. These funds are typically quantitatively driven to measure the existing relationship between instruments and in some cases to identify positions in which the risk-adjusted spread between these instruments represents an opportunity for the investment manager. This benchmark is a product of Lipper Inc. Lipper Inc. is an independent monitor of fund performance. Results are based on average total returns of similar funds with all dividend and capital gain distributions reinvested. |
The footnotes are an integral part of the table and graph and should be carefully read in conjunction with them.
Cost in Dollars of a $1,000 Investment in MainStay Absolute Return Multi-Strategy Fund (Unaudited)
The example below is intended to describe the fees and expenses borne by shareholders during the six-month period from May 1, 2016, to October 31, 2016, and the impact of those costs on your investment.
Example
As a shareholder of the Fund, you incur two types of costs: (1) transaction costs, including exchange fees and sales charges (loads) on purchases (as applicable), and (2) ongoing costs, including management fees, distribution and/or service (12b-1) fees, and other Fund expenses (as applicable). This example is intended to help you understand your ongoing costs (in dollars) of investing in the Fund and to compare these costs with the ongoing costs of investing in other mutual funds. The example is based on an investment of $1,000 made at the beginning of the six-month period and held for the entire period from May 1, 2016, to October 31, 2016.
This example illustrates your Fund’s ongoing costs in two ways:
Actual Expenses
The second and third data columns in the table below provide information about actual account values and actual expenses. You may use the information in these columns, together with the amount you invested, to estimate the expenses that you paid during the six months ended October 31, 2016. Simply divide your account value by $1,000 (for example, an $8,600 account value divided by $1,000 = 8.6), then
multiply the result by the number under the heading entitled “Expenses Paid During Period” to estimate the expenses you paid on your account during this period.
Hypothetical Example for Comparison Purposes
The fourth and fifth data columns in the table below provide information about hypothetical account values and hypothetical expenses based on the Fund’s actual expense ratio and an assumed rate of return of 5% per year before expenses, which is not the Fund’s actual return. The hypothetical account values and expenses may not be used to estimate the actual ending account balances or expenses you paid for the six-month period shown. You may use this information to compare the ongoing costs of investing in the Fund with the ongoing costs of investing in other Funds. To do so, compare this 5% hypothetical example with the 5% hypothetical examples that appear in the shareholder reports of the other Funds.
Please note that the expenses shown in the table are meant to highlight your ongoing costs only and do not reflect any transactional costs, such as exchange fees or sales charges (loads). Therefore, the fourth and fifth data columns of the table are useful in comparing ongoing costs only and will not help you determine the relative total costs of owning different funds. In addition, if these transactional costs were included, your costs would have been higher.
| | | | | | | | | | | | | | | | | | | | |
| | | | | | | | | | | | | | | | |
| Share Class | | Beginning
Account
Value
5/1/16 | | | Ending Account
Value (Based
on Actual
Returns and
Expenses)
10/31/16 | | | Expenses
Paid
During
Period1 | | | Ending Account
Value (Based
on Hypothetical
5% Annualized
Return and
Actual Expenses)
10/31/16 | | | Expenses
Paid
During
Period1 | |
| | | | | |
| Class A Shares | | $ | 1,000.00 | | | $ | 1,006.00 | | | $ | 13.50 | | | $ | 1,011.70 | | | $ | 13.54 | |
| | | | | |
| Investor Class Shares | | $ | 1,000.00 | | | $ | 1,005.10 | | | $ | 14.56 | | | $ | 1,010.70 | | | $ | 14.60 | |
| | | | | |
| Class C Shares | | $ | 1,000.00 | | | $ | 1,001.00 | | | $ | 18.36 | | | $ | 1,006.90 | | | $ | 18.41 | |
| | | | | |
| Class I Shares | | $ | 1,000.00 | | | $ | 1,007.00 | | | $ | 12.24 | | | $ | 1,013.00 | | | $ | 12.28 | |
| 1. | Expenses are equal to the Fund’s annualized expense ratio of each class (2.67% for Class A, 2.88% for Investor Class, 3.64% for Class C and 2.42% for Class I) multiplied by the average account value over the period, divided by 365 and multiplied by 184 (to reflect the six-month period). The table above represents the actual expenses incurred during the six-month period. |
| | |
| 6 | | MainStay Absolute Return Multi-Strategy Fund |
Strategy Allocation as of October 31, 20161 (Unaudited)
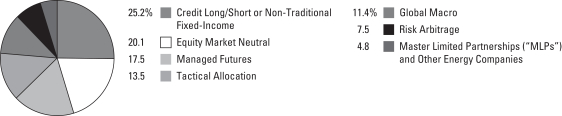
| 1 | Percentages based on total net assets. |
Equity Market Neutral: This strategy seeks to profit by detecting and exploiting perceived pricing inefficiencies in individual equity securities and neutralizing exposure to market risk by maintaining approximately equal value exposure in long and short positions. The strategy will identify investment opportunities based on a model that reflects the input of relevant factors, including relative value, market sentiment, and the Subadvisor’s forecasts as to anticipated market volatility. The strategy may engage in short sales in order to generate returns that are independent of the direction of the market.
Risk Arbitrage: This strategy implements event-driven arbitrage strategies on securities of companies that experience certain “special situations,” which are corporate events that are likely to create discontinuity in the price of a given security. The Fund’s risk arbitrage strategy consists primarily of an announced merger arbitrage strategy. An announced merger arbitrage strategy buys or sells the securities of companies involved in a merger based on the Subadvisor’s anticipation of the merger’s outcome. The strategy may also invest in securities of companies based on other event-driven strategies, such as holding discount arbitrage, share class arbitrage, spin-offs, asset sales, initial public offerings, minority buyouts, auctions or rights issues. Share class arbitrage involves capitalizing on perceived pricing inefficiencies of a particular share class in a multiple share class issuer. Discount arbitrage is when a discount option is purchased while an opposite transaction is taken in the underlying security.
Managed Futures: This strategy primarily takes long and short positions in futures contracts (directly or through derivatives, including total return swaps) across asset classes globally. The strategy seeks to exploit market trends and generate absolute returns utilizing a quantitative and systematic investment approach, which consists of analyzing financial markets through statistical models. These quantitative models produce buy or sell signals looking to benefit from the upward and downward movements of the asset classes covered based on market trends and patterns and contrarian views (i.e., instruments and strategies that may be out of favor in the broader market). The managed futures strategy will be implemented through (i) investment in derivative instruments, including swap agreements, exchange-traded futures and option and forward contracts, to gain exposure to a wide variety of global markets for currencies, interest rates, stock market indices, energy resources, metals and agricultural products and to hedge price risk, (ii) investment in swap agreements that reflect the return of securities, derivatives and commodity interests selected by the Subadvisor, or (iii) investment in some combination of (i) and (ii). This strategy will involve the use of one or more wholly-owned subsidiaries formed under
the laws of the Cayman Islands (each, a “Cayman Subsidiary”). See “Subsidiary Risk” below for more information.
Master Limited Partnerships (“MLPs”) and Other Energy Companies: This strategy seeks to deliver both high current income and total return by investing in a portfolio of domestic and foreign publicly traded partnerships and/or other issuers (including U.S. and Canadian royalty trusts and Canadian energy companies) engaged in the transportation, storage, processing, refining, marketing, exploration, production or mining of crude oil, natural gas, natural gas liquids, minerals or other natural resources. The Subadvisor implements this strategy by identifying companies it believes will benefit from increased crude oil, natural gas or natural gas liquids production resulting in greater energy infrastructure needs. The Fund will invest no more than 25% of its total assets in securities of MLPs that are qualified publicly traded partnerships (“QPTPs”), which are treated as partnerships for U.S. federal income tax purposes.
Credit Long/Short or Non-Traditional Fixed-Income: This strategy seeks to exploit opportunities in the global fixed-income markets based on top-down and bottom-up analysis. The strategy may invest in various credit strategies that involve being long and short different financial instruments, and the credit instruments involved will range from high grade to high yield (known as “junk bonds”) and distressed debt. The strategy may also invest in credit derivatives, including credit default swaps, options and indices. The Subadvisors responsible for this strategy dynamically allocate capital to the sectors and securities that they believe offer the best balance of risk and return, unrestricted by benchmark constraints.
Global Macro Strategy: This strategy seeks to obtain exposure to a broad spectrum of investments and countries or regions, based on discrete strategies that employ a variety of techniques, both discretionary and systematic analysis, combinations of top down and bottom up theses, and quantitative and fundamental approaches, designed to effectively identify and assess factors that affect businesses and economies broadly (e.g., monetary and fiscal policy, regulatory changes, demographics) and their impact on securities markets. The strategy may also employ arbitrage techniques and seek long and short exposure (directly or through derivatives, including total return swaps) across diversified asset classes globally. The strategy may be exposed significantly to interest rate and foreign currency futures. In addition, the strategy may involve the use of one or more Cayman Subsidiaries to obtain certain commodities market exposure.
Tactical Allocation: This strategy, which is managed by the Manager, may invest in a range of asset classes, including equity securities, fixed-income instruments, futures, options, currency forward contracts and swaps (including total return swaps) and affiliated and unaffiliated open-end funds, closed-end funds and exchange-traded funds, to manage or gain access to certain market exposures, including exposure to asset classes or strategies in which the Fund is not otherwise invested, to exploit perceived structural inefficiencies in the markets or to manage cash flows. Additionally, positions may be pursued on a long or short basis either to take advantage of perceived investment opportunities or to counter exposure from other strategies in the Fund.
Other Strategies: The Manager may modify the strategies summarized above and allocate the Fund’s assets among or to other strategies developed or implemented to further optimize risk reward expectations based on, among other factors, changing market conditions. In addition to the instruments described above, such other strategies may include taking long and/or short positions in a wide range of instruments, including, but not limited to, commodities and real estate investment trusts (“REITs”). Such investments may be made without restriction as to issuer capitalization, country (including emerging markets), currency, maturity or credit rating and within the context of a range of investment programs or strategies, including, but not limited to, carry strategies, relative value strategies, and various forms arbitrage.
| | |
| 8 | | MainStay Absolute Return Multi-Strategy Fund |
Manager Allocation as of October 31, 20161 (Unaudited)
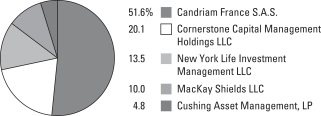
| 1 | Percentages based on total net assets. |
Top Ten Holdings or Issuers Held as of October 31, 2016 (excluding short-term investments) (Unaudited)
| 1. | United States Treasury Inflation—Indexed Bond, 0.375%, due 7/15/25 |
| 4. | 1011778 B.C. ULC / New Red Finance, Inc., 4.625%, due 1/15/22 |
| 5. | Crown European Holdings S.A., 2.625%–4.00%, due 7/15/22–5/15/25 |
| 6. | Enel S.p.A., 6.50%–7.75%, due 1/10/74–9/10/75 |
| 8. | Trionista Holdco GmbH, 5.00%, due 4/30/20 |
| 9. | Techem GmbH, 6.125%, due 10/1/19 |
Top Five Short Positions as of October 31, 2016
| 1. | United States Oil Fund, L.P. |
| 5. | Unione di Banche Italiane S.p.A. |
Portfolio Management Discussion and Analysis (Unaudited)
Questions answered by Jae S. Yoon, CFA, Jonathan Swaney, Poul Kristensen, CFA, and Amit Soni, CFA, of New York Life Investments,1 the Fund’s Manager.
How did MainStay Absolute Return Multi-Strategy Fund perform relative to its benchmarks and peers during the six months ended October 31, 2016?
Excluding all sales charges, MainStay Absolute Return Multi-Strategy Fund returned 0.60% for Class A shares, 0.51% for Investor Class shares and 0.10% for Class C shares for the six months ended October 31, 2016. Over the same period, Class I shares returned 0.70%. For the six months ended October 31, 2016, all share classes underperformed the 0.78% return of the HFRX Absolute Return Index,2 which is the Fund’s primary benchmark. Over the same period, all share classes also underperformed the 4.06% return of the S&P 500® Index,2 which is the Fund’s secondary benchmark. For the six months ended October 31, 2016, all share classes underperformed the 0.91% return of the Average Lipper3 Alternative Multi-Strategy Fund. See page 5 for Fund returns with sales charges.
Were there any changes to the Fund during the reporting period?
Effective August 6, 2016, Mr. Taylor Wagenseil no longer serves as a portfolio manager of the Fund. Mr. Wagenseil will provide nondiscretionary advisory support to the Fund’s portfolio management team as a Senior Advisor to the Fund through August 2017. Dan Roberts, Louis N. Cohen and Michael Kimble continue to manage the “Credit Long/Short or Non-Traditional Fixed-Income” strategy of the Fund for MacKay Shields LLC, a subadvisor to the Fund. For more information on this change, please see the supplement dated August 5, 2016.
What factors affected the Fund’s relative performance during the reporting period?
Several factors affected the Fund’s performance relative to the HFRX Absolute Return Index. The MLP alpha strategy was the best performing strategy as the asset class continued its recovery. The strategy benefited from crude oil prices that traded near $50 per barrel. The flexible bond strategy and the credit opportunities strategy also performed well as the high-yield asset class saw a strong rally during the reporting period. The biggest detractor from performance was the managed futures strategy, which suffered from some positions in equity &
agricultural futures. From a risk perspective, the Fund’s volatility (as measured by annualized standard deviation of the Fund’s returns) was in the mid-single digits, as expected.
During the reporting period, how did the Fund’s performance correlate with traditional fixed-income and equity indices?
During the reporting period, the Fund maintained low correlation to fixed-income indices. The correlation of the Fund’s overall portfolio to the Bloomberg Barclays U.S. Aggregate Bond Index4 during the reporting period was 0.14, which was within desired parameters. The correlation of the Fund’s overall portfolio to the S&P 500® Index during the reporting period was 0.70. This correlation was higher than desired, primarily because of the Fund’s flexible bond, risk arbitrage and global alpha strategies. Since inception, however, the Fund has, on average, maintained low correlation to equity indices.
During the reporting period, how did the Fund’s volatility compare to that of traditional fixed-income indices?
During the reporting period, the Fund’s volatility (as measured by annualized standard deviation of the Fund’s returns) was closer to that of traditional fixed-income indices than it was to that of traditional equity indices. The Fund’s volatility was 3.1%, compared to a volatility of 3.0% for the Bloomberg Barclays U.S. Aggregate Bond Index and a volatility of 4.0% for the BofA Merrill Lynch U.S. High Yield Master II Index.5 During the reporting period, the volatility of the S&P 500® Index was 11.5%.
How did the Fund use derivatives during the reporting period?
Derivatives were used in the Fund for alpha generation, hedging and operational efficiency. For example, we used total return swaps for alpha generation in the tactical allocation sleeve to gain exposure to certain alternative beta indices.6 The non-traditional fixed-income managers used interest-rate derivatives for hedging specific exposures in their sleeves. Also, in the tactical allocation sleeve, certain exposures were assumed through total return swaps because of operational efficiency
| 1. | “New York Life Investments” is a service mark used by New York Life Investment Management Holdings LLC and its subsidiary New York Life Investment Management LLC. |
| 2. | See footnote on page 5 for more information on this index. |
| 3. | See footnote on page 5 for more information on Lipper Inc. |
| 4. | The Bloomberg Barclays U.S. Aggregate Bond Index is a broad-based benchmark that measures the investment grade, U.S. dollar-denominated, fixed-rate taxable bond market, including Treasurys, government-related and corporate securities (agency fixed-rate and hybrid adjustable-rate mortgage pass-throughs), asset-backed securities and commercial mortgage-backed securities. Results assume reinvestment of all dividends and capital gains. An investment cannot be made directly in an index. |
| 5. | The BofA Merrill Lynch High Yield Master II Index monitors the performance of below-investment-grade U.S. dollar-denominated corporate bonds publicly issued in the U.S. domestic market. An investment cannot be made directly in an index. |
| 6. | Alpha measures the relationship between a mutual fund’s return and its beta over a three-year period. Often, alpha is viewed as the excess return (positive or negative) or the value added by the portfolio manager. Beta is a measure of volatility in relation to the market as a whole. A beta higher than 1 indicates that a security or portfolio will tend to exhibit higher volatility than the market. A beta lower than 1 indicates that a security or portfolio will tend to exhibit lower volatility than the market. |
| | |
| 10 | | MainStay Absolute Return Multi-Strategy Fund |
(leveraging better trading and operational infrastructure of external providers for cost efficiency). We believe that measuring the impact of derivatives on performance as positive or negative does not properly reflect the utility of derivatives to the Fund because of the functions they perform within the Fund. For example, a hedge performing as expected might have a negative contribution to return even as it serves its intended function to reduce a risk or an exposure. (Contributions take weightings and total returns into account.) Nevertheless, the use of derivatives contributed positively to the Fund’s performance during the reporting period, primarily from the global opportunities, tactical allocation and global alpha strategies.
How were the Fund’s assets allocated among each of the strategies during the reporting period and why?
The Fund’s allocations are based on the estimated optimal distribution of assets, taking into account both the risk and return expectations. See chart on page 7 for strategy allocations as of October, 31, 2016. (It is generally not possible to increase return without taking additional risk, and the Fund generally cannot reduce risk without also reducing return.) These estimates of risk and return are long term in nature; and as a result, asset allocations tend to be quite stable over time. The Fund’s allocation to an individual strategy may change if, for example, there is a statistically significant change in the risk-return characteristics of a strategy, if the outlook of a strategy improves substantially or if an attractive new strategy became available for investment that we believe would likely further support the Fund’s investment goal.
How did the tactical allocation among the strategies during the reporting period affect the Fund’s performance?
During the reporting period, the only tactical decision taken was to take off the overweight in the flexible bond strategy, which we had implemented in December 2015 when high-yield spreads had widened to attractive levels. As the spreads narrowed to longer-term averages in the middle of 2016, we took off this risk. This tactical allocation contributed positively to the Fund’s performance.
During the reporting period, how did each strategy either contribute to or detract from the Fund’s absolute performance?
During the reporting period, the Fund saw its greatest positive contribution from credit opportunities7 (+0.46%), followed by MLP alpha8 (+0.38%), flexible bond7 (+0.31%), global opportunities9 (+0.27%), tactical allocation (+0.25%), global alpha9 (+0.20%), equity market neutral (+0.15%), and risk arbitrage (+0.09%). The only negative contribution came from managed futures (–0.56%). The ultimate impact of each strategy on the Fund’s overall performance is a function of the strategy’s performance and the amount of Fund assets allocated to the particular strategy.
How did the Fund’s strategy weightings change during the reporting period?
There were no strategic changes to the strategy weightings during the reporting period, except for the previously discussed temporary overweighting of the flexible bond strategy.
| 7. | The credit long/short or non-traditional fixed-income portion of the Fund consists of two underlying strategies: the flexible bond strategy and the credit opportunities strategy. |
| 8. | The Master Limited Partnerships and other energy companies portion of the Fund consists of two underlying strategies: the MLP alpha strategy and the MLP equity strategy. |
| 9. | The global macro portion of the Fund consists of two underlying strategies: the global alpha strategy and the global opportunities strategy |
The opinions expressed are those of the portfolio managers as of the date of this report and are subject to change. There is no guarantee that any forecasts made will come to pass. This material does not constitute investment advice and is not intended as an endorsement of any specific investment.
Consolidated Portfolio of Investments October 31, 2016 (Unaudited)
| | | | | | | | |
| | | Principal
Amount | | | Value | |
Long-Term Bonds 17.3%† Corporate Bonds 8.9% | |
Apparel 0.1% | | | | | | | | |
Hanesbrands Finance Luxembourg SCA
Series Reg S
3.50%, due 6/15/24 | | $ | 100,000 | | | $ | 115,033 | |
Hanesbrands, Inc.
4.875%, due 5/15/26 (a) | | | 25,000 | | | | 25,438 | |
| | | | | | | | |
| | | | | | | 140,471 | |
| | | | | | | | |
Auto Parts & Equipment 1.1% | | | | | | | | |
Adient Global Holdings, Ltd.
Series Reg S
3.50%, due 8/15/24 | | EUR | 200,000 | | | | 218,152 | |
Goodyear Tire & Rubber Co. (The)
7.00%, due 5/15/22 | | $ | 300,000 | | | | 315,375 | |
IHO Verwaltungs GmbH | | | | | | | | |
Series Reg S
2.75%, due 9/15/21 | | EUR | 100,000 | | | | 112,296 | |
Series Reg S
3.25%, due 9/15/23 | | | 100,000 | | | | 111,435 | |
Series Reg S
3.75%, due 9/15/26 | | | 100,000 | | | | 108,412 | |
Lear Corp.
4.75%, due 1/15/23 | | $ | 150,000 | | | | 155,625 | |
Tenneco, Inc.
5.00%, due 7/15/26 | | | 46,000 | | | | 46,230 | |
ZF North America Capital, Inc.
4.50%, due 4/29/22 (a) | | | 315,000 | | | | 333,506 | |
| | | | | | | | |
| | | | | | | 1,401,031 | |
| | | | | | | | |
Banks 0.3% | |
Bank of America Corp. | | | | | | | | |
4.20%, due 8/26/24 | | | 55,000 | | | | 57,474 | |
5.625%, due 7/1/20 | | | 50,000 | | | | 55,962 | |
Citigroup, Inc.
4.60%, due 3/9/26 | | | 60,000 | | | | 64,031 | |
Goldman Sachs Group, Inc. (The) | | | | | | | | |
5.375%, due 3/15/20 | | | 50,000 | | | | 55,202 | |
6.75%, due 10/1/37 | | | 50,000 | | | | 63,062 | |
Morgan Stanley | | | | | | | | |
5.00%, due 11/24/25 | | | 55,000 | | | | 60,836 | |
5.50%, due 1/26/20 | | | 50,000 | | | | 55,123 | |
| | | | | | | | |
| | | | | | | 411,690 | |
| | | | | | | | |
Beverages 0.5% | |
Constellation Brands, Inc.
7.25%, due 5/15/17 | | | 300,000 | | | | 309,750 | |
Cott Beverages, Inc.
6.75%, due 1/1/20 | | | 180,000 | | | | 186,975 | |
| | | | | | | | |
| | | Principal
Amount | | | Value | |
Beverages (continued) | | | | | | | | |
Cott Corp.
Series Reg S
5.50%, due 7/1/24 | | EUR | 100,000 | | | $ | 115,675 | |
| | | | | | | | |
| | | | | | | 612,400 | |
| | | | | | | | |
Building Materials 0.2% | |
Cemex Finance LLC
Series Reg S
9.375%, due 10/12/22 | | $ | 215,000 | | | | 234,888 | |
| | | | | | | | |
|
Chemicals 0.1% | |
Axalta Coating Systems LLC
Series Reg S
4.25%, due 8/15/24 | | EUR | 100,000 | | | | 113,644 | |
| | | | | | | | |
|
Commercial Services 0.2% | |
Nielsen Co. Luxembourg S.A.R.L. (The)
5.50%, due 10/1/21 (a) | | $ | 183,000 | | | | 190,778 | |
| | | | | | | | |
|
Computers 0.2% | |
Diamond 1 Finance Corp. / Diamond 2 Finance Corp. | | | | | | | | |
4.42%, due 6/15/21 (a) | | | 115,000 | | | | 120,256 | |
5.45%, due 6/15/23 (a) | | | 27,000 | | | | 28,913 | |
6.02%, due 6/15/26 (a) | | | 35,000 | | | | 38,152 | |
8.10%, due 7/15/36 (a) | | | 13,000 | | | | 15,519 | |
| | | | | | | | |
| | | | | | | 202,840 | |
| | | | | | | | |
Distribution & Wholesale 0.1% | |
LKQ Corp.
4.75%, due 5/15/23 | | | 84,000 | | | | 86,205 | |
| | | | | | | | |
|
Electric 0.2% | |
EDP Finance B.V.
Series Reg S
6.00%, due 2/2/18 | | | 274,000 | | | | 286,002 | |
| | | | | | | | |
|
Entertainment 0.0%‡ | |
Isle of Capri Casinos, Inc.
5.875%, due 3/15/21 | | | 50,000 | | | | 52,000 | |
| | | | | | | | |
|
Food 0.2% | |
Albertsons Cos. LLC / Safeway, Inc. / New Albertson’s, Inc. / Albertson’s LLC
5.75%, due 3/15/25 (a) | | | 110,000 | | | | 108,591 | |
Kraft Heinz Foods Co.
2.80%, due 7/2/20 | | | 95,000 | | | | 97,740 | |
| † | Percentages indicated are based on Fund net assets. |
| ¨ | | Among the Fund’s 10 largest holdings or issuers held, as of October 31, 2016, excluding short-term investments. May be subject to change daily. |
| ∎ | | Among the Fund’s 5 largest short positions as of October 31, 2016. May be subject to change daily. |
| | | | |
| 12 | | MainStay Absolute Return Multi-Strategy Fund | | The notes to the consolidated financial statements are an integral part of,
and should be read in conjunction with, the consolidated financial statements. |
| | | | | | | | |
| | | Principal
Amount | | | Value | |
| Corporate Bonds (continued) | | | | | | | | |
Food (continued) | | | | | | | | |
Tyson Foods, Inc.
3.95%, due 8/15/24 | | $ | 105,000 | | | $ | 111,449 | |
| | | | | | | | |
| | | | | | | 317,780 | |
| | | | | | | | |
Food Services 0.3% | |
Aramark Services, Inc. | | | | | | | | |
4.75%, due 6/1/26 (a) | | | 100,000 | | | | 100,000 | |
5.125%, due 1/15/24 | | | 100,000 | | | | 104,750 | |
5.125%, due 1/15/24 (a) | | | 170,000 | | | | 178,075 | |
5.75%, due 3/15/20 | | | 33,000 | | | | 33,949 | |
| | | | | | | | |
| | | | | | | 416,774 | |
| | | | | | | | |
Forest Products & Paper 0.2% | |
Sappi Papier Holding GmbH
7.75%, due 7/15/17 (a) | | | 210,000 | | | | 213,675 | |
| | | | | | | | |
|
Health Care—Products 0.2% | |
Boston Scientific Corp.
2.85%, due 5/15/20 | | | 100,000 | | | | 102,702 | |
Hologic, Inc.
5.25%, due 7/15/22 (a) | | | 90,000 | | | | 95,184 | |
Teleflex, Inc.
4.875%, due 6/1/26 | | | 35,000 | | | | 35,875 | |
| | | | | | | | |
| | | | | | | 233,761 | |
| | | | | | | | |
Health Care—Services 0.3% | |
Fresenius Medical Care U.S. Finance II, Inc.
4.75%, due 10/15/24 (a) | | | 80,000 | | | | 83,400 | |
HCA, Inc.
5.875%, due 3/15/22 | | | 220,000 | | | | 242,000 | |
Laboratory Corporation of America Holdings
2.625%, due 2/1/20 | | | 100,000 | | | | 101,657 | |
| | | | | | | | |
| | | | | | | 427,057 | |
| | | | | | | | |
Home Builders 0.0%‡ | |
TRI Pointe Group, Inc. / TRI Pointe Homes, Inc.
5.875%, due 6/15/24 | | | 40,000 | | | | 41,450 | |
| | | | | | | | |
|
Household Products & Wares 0.2% | |
Spectrum Brands, Inc.
Series Reg S
4.00%, due 10/1/26 | | EUR | 200,000 | | | | 225,520 | |
| | | | | | | | |
|
Housewares 0.0%‡ | |
Newell Brands, Inc.
5.00%, due 11/15/23 | | $ | 22,000 | | | | 23,622 | |
| | | | | | | | |
| | | | | | | | |
| | | Principal
Amount | | | Value | |
Internet 0.2% | |
United Group B.V.
Series Reg S
7.875%, due 11/15/20 | | EUR | 200,000 | | | $ | 228,881 | |
| | | | | | | | |
| | |
Lodging 0.2% | | | | | | | | |
Hilton Domestic Operating Co., Inc.
4.25%, due 9/1/24 (a) | | $ | 240,000 | | | | 240,600 | |
| | | | | | | | |
| | |
Media 1.1% | | | | | | | | |
CCO Holdings LLC / CCO Holdings Capital Corp. | | | | | | | | |
5.875%, due 4/1/24 (a) | | | 100,000 | | | | 105,750 | |
6.625%, due 1/31/22 | | | 280,000 | | | | 291,900 | |
Nielsen Finance LLC / Nielsen Finance Co.
5.00%, due 4/15/22 (a) | | | 200,000 | | | | 204,000 | |
SFR Group S.A.
6.00%, due 5/15/22 (a) | | | 200,000 | | | | 205,064 | |
Sirius XM Radio, Inc. | | | | | | | | |
5.75%, due 8/1/21 (a) | | | 140,000 | | | | 145,950 | |
6.00%, due 7/15/24 (a) | | | 120,000 | | | | 127,350 | |
Virgin Media Secured Finance PLC
5.50%, due 1/15/25 (a) | | | 200,000 | | | | 205,000 | |
Ziggo Secured Finance B.V.
Series Reg S
4.25%, due 1/15/27 | | EUR | 100,000 | | | | 109,290 | |
| | | | | | | | |
| | | | | | | 1,394,304 | |
| | | | | | | | |
Packaging & Containers 0.8% | |
Ball Corp.
4.375%, due 12/15/23 | | | 325,000 | | | | 401,044 | |
¨Crown European Holdings S.A. | | | | | | | | |
Series Reg S
2.625%, due 9/30/24 | | | 100,000 | | | | 108,046 | |
Series Reg S
4.00%, due 7/15/22 | | | 100,000 | | | | 120,204 | |
Graphic Packaging International, Inc.
4.125%, due 8/15/24 | | $ | 70,000 | | | | 69,650 | |
Sealed Air Corp. | | | | | | | | |
Series Reg S
4.50%, due 9/15/23 | | EUR | 230,000 | | | | 278,993 | |
4.875%, due 12/1/22 (a) | | $ | 75,000 | | | | 79,031 | |
| | | | | | | | |
| | | | | | | 1,056,968 | |
| | | | | | | | |
Pharmaceuticals 0.2% | |
AbbVie, Inc.
2.50%, due 5/14/20 | | | 100,000 | | | | 101,257 | |
Grifols Worldwide Operations, Ltd.
5.25%, due 4/1/22 | | | 200,000 | | | | 208,500 | |
| | | | | | | | |
| | | | | | | 309,757 | |
| | | | | | | | |
| | | | | | |
The notes to the consolidated financial statements are an integral part of,
and should be read in conjunction with, the consolidated financial statements. | | | | | 13 | |
Consolidated Portfolio of Investments October 31, 2016 (Unaudited) (continued)
| | | | | | | | |
| | | Principal
Amount | | | Value | |
| Corporate Bonds (continued) | | | | | | | | |
Private Equity 0.0%‡ | |
Icahn Enterprises, L.P. / Icahn Enterprises Finance Corp.
5.875%, due 2/1/22 | | $ | 50,000 | | | $ | 47,563 | |
| | | | | | | | |
|
Real Estate Investment Trusts 0.2% | |
Equinix, Inc. | | | | | | | | |
5.375%, due 1/1/22 | | | 27,000 | | | | 28,620 | |
5.375%, due 4/1/23 | | | 40,000 | | | | 41,750 | |
5.75%, due 1/1/25 | | | 50,000 | | | | 52,875 | |
MPT Operating Partnership, L.P. / MPT Finance Corp. | | | | | | | | |
5.25%, due 8/1/26 | | | 20,000 | | | | 20,400 | |
5.75%, due 10/1/20 | | EUR | 100,000 | | | | 114,649 | |
6.375%, due 2/15/22 | | $ | 35,000 | | | | 36,313 | |
| | | | | | | | |
| | | | | | | 294,607 | |
| | | | | | | | |
Retail 1.2% | |
¨1011778 B.C. ULC / New Red Finance, Inc.
4.625%, due 1/15/22 (a) | | | 480,000 | | | | 495,600 | |
Dollar Tree, Inc.
5.75%, due 3/1/23 | | | 370,000 | | | | 394,050 | |
Dufry Finance SCA
5.50%, due 10/15/20 (a) | | | 200,000 | | | | 205,750 | |
Groupe Fnac S.A.
Series Reg S
3.25%, due 9/30/23 | | EUR | 110,000 | | | | 123,172 | |
KFC Holding Co. / Pizza Hut Holdings LLC / Taco Bell of America LLC | | | | | | | | |
5.00%, due 6/1/24 (a) | | $ | 200,000 | | | | 208,000 | |
5.25%, due 6/1/26 (a) | | | 35,000 | | | | 36,488 | |
O’Reilly Automotive, Inc.
3.80%, due 9/1/22 | | | 80,000 | | | | 84,189 | |
| | | | | | | | |
| | | | | | | 1,547,249 | |
| | | | | | | | |
Semiconductors 0.2% | |
NXP B.V. / NXP Funding LLC
3.875%, due 9/1/22 (a) | | | 285,000 | | | | 301,387 | |
| | | | | | | | |
|
Telecommunications 0.4% | |
¨T-Mobile USA, Inc. | | | | | | | | |
6.25%, due 4/1/21 | | | 53,000 | | | | 55,186 | |
6.375%, due 3/1/25 | | | 50,000 | | | | 53,594 | |
6.731%, due 4/28/22 | | | 305,000 | | | | 318,725 | |
Telefonica Europe B.V.
Series Reg S
3.75%, due 12/31/49 (b) | | EUR | 100,000 | | | | 108,216 | |
| | | | | | | | |
| | | | | | | 535,721 | |
| | | | | | | | |
Total Corporate Bonds
(Cost $11,479,188) | | | | | | | 11,588,625 | |
| | | | | | | | |
| | | | | | | | |
| | | Principal
Amount | | | Value | |
| Foreign Bonds 6.5% | |
Belgium 0.1% | | | | | | | | |
Ontex Group N.V.
Series Reg S
4.75%, due 11/15/21 | | EUR | 100,000 | | | $ | 116,581 | |
| | | | | | | | |
|
Croatia 0.3% | |
Agrokor D.D.
Series Reg S
9.875%, due 5/1/19 | | | 360,000 | | | | 408,034 | |
| | | | | | | | |
|
France 2.0% | |
Accor S.A.
Series Reg S
4.125%, due 6/30/49 (b) | | | 200,000 | | | | 223,721 | |
Cerba European Lab S.A.S.
Series Reg S
7.00%, due 2/1/20 | | | 150,000 | | | | 170,136 | |
¨Crown European Holdings S.A.
Series Reg S
3.375%, due 5/15/25 | | | 215,000 | | | | 241,988 | |
Elis S.A.
Series Reg S
3.00%, due 4/30/22 | | | 170,000 | | | | 190,378 | |
HomeVi S.A.S.
Series Reg S
6.875%, due 8/15/21 | | | 175,000 | | | | 204,766 | |
La Financiere Atalian S.A.S.
Series Reg S
7.25%, due 1/15/20 | | | 120,000 | | | | 137,917 | |
Orange S.A.
Series Reg S
5.875%, due 12/31/49 (b) | | GBP | 100,000 | | | | 131,746 | |
PSA Tresorerie GIE
6.00%, due 9/19/33 | | EUR | 35,000 | | | | 45,878 | |
Rexel S.A.
Series Reg S
3.50%, due 6/15/23 | | | 200,000 | | | | 225,039 | |
Solvay Finance S.A.
Series Reg S
5.869%, due 12/29/49 (b) | | | 200,000 | | | | 240,846 | |
Synlab Bondco PLC
Series Reg S
6.25%, due 7/1/22 | | | 200,000 | | | | 237,136 | |
Tereos Finance Groupe I S.A.
Series Reg S
4.125%, due 6/16/23 | | | 100,000 | | | | 112,591 | |
TOTAL S.A.
Series Reg S
3.369%, due 12/29/49 (b) | | | 100,000 | | | | 108,474 | |
| | | | |
| 14 | | MainStay Absolute Return Multi-Strategy Fund | | The notes to the consolidated financial statements are an integral part of,
and should be read in conjunction with, the consolidated financial statements. |
| | | | | | | | |
| | | Principal
Amount | | | Value | |
| Foreign Bonds (continued) | | | | | | | | |
France (continued) | | | | | | | | |
Veolia Environnement S.A.
Series Reg S
4.85%, due 1/29/49 (b) | | GBP | 300,000 | | | $ | 377,684 | |
| | | | | | | | |
| | | | | | | 2,648,300 | |
| | | | | | | | |
Germany 1.6% | |
CeramTec Group GmbH
Series Reg S
8.25%, due 8/15/21 | | EUR | 230,000 | | | | 267,632 | |
HeidelbergCement A.G.
Series Reg S
2.25%, due 3/30/23 | | | 102,000 | | | | 117,289 | |
Kirk Beauty One GmbH
Series Reg S
8.75%, due 7/15/23 | | | 100,000 | | | | 119,106 | |
¨Techem GmbH
Series Reg S
6.125%, due 10/1/19 | | | 375,000 | | | | 425,035 | |
¨Trionista Holdco GmbH
Series Reg S
5.00%, due 4/30/20 | | | 400,000 | | | | 451,175 | |
TUI A.G.
Series Reg S
2.125%, due 10/26/21 | | | 100,000 | | | | 111,437 | |
Unitymedia Hessen GmbH & Co. KG / Unitymedia NRW GmbH | | | | | | | | |
Series Reg S
5.125%, due 1/21/23 | | | 81,000 | | | | 93,547 | |
Series Reg S
5.50%, due 9/15/22 | | | 162,000 | | | | 187,172 | |
Vonovia Finance B.V.
Series Reg S
4.625%, due 4/8/74 (b) | | | 300,000 | | | | 347,026 | |
| | | | | | | | |
| | | | | | | 2,119,419 | |
| | | | | | | | |
Ireland 0.2% | |
Ardagh Packaging Finance PLC / Ardagh Holdings USA, Inc. | | | | | | | | |
Series Reg S
4.125%, due 5/15/23 | | | 100,000 | | | | 114,990 | |
Series Reg S
4.25%, due 1/15/22 | | | 100,000 | | | | 113,068 | |
| | | | | | | | |
| | | | | | | 228,058 | |
| | | | | | | | |
Italy 0.4% | |
¨Enel S.p.A. | | | | | | | | |
Series Reg S
6.50%, due 1/10/74 (b) | | | 278,000 | | | | 330,698 | |
Series Reg S
7.75%, due 9/10/75 (b) | | GBP | 100,000 | | | | 135,773 | |
| | | | | | | | |
| | | Principal
Amount | | | Value | |
Italy (continued) | | | | | | | | |
Telecom Italia S.p.A.
Series Reg S
3.625%, due 5/25/26 | | EUR | 100,000 | | | $ | 113,214 | |
| | | | | | | | |
| | | | | | | 579,685 | |
| | | | | | | | |
Luxembourg 0.5% | |
Dufry Finance SCA
Series Reg S
4.50%, due 8/1/23 | | | 100,000 | | | | 117,185 | |
LKQ Italia Bondco S.p.A.
Series Reg S
3.875%, due 4/1/24 | | | 100,000 | | | | 116,773 | |
Telenet Finance V Luxembourg SCA | | | | | | | | |
Series Reg S
6.25%, due 8/15/22 | | | 100,000 | | | | 116,636 | |
Series Reg S
6.75%, due 8/15/24 | | | 100,000 | | | | 120,948 | |
Telenet Finance VI Luxembourg SCA
Series Reg S
4.875%, due 7/15/27 | | | 112,000 | | | | 128,222 | |
| | | | | | | | |
| | | | | | | 599,764 | |
| | | | | | | | |
Netherlands 0.5% | | | | | | | | |
Cable Communications Systems N.V.
Series Reg S
7.50%, due 11/1/20 | | | 100,000 | | | | 113,936 | |
InterXion Holding N.V.
Series Reg S
6.00%, due 7/15/20 | | | 150,000 | | | | 172,072 | |
LGE HoldCo VI B.V.
Series Reg S
7.125%, due 5/15/24 | | | 210,000 | | | | 260,496 | |
Telefonica Europe B.V.
Series Reg S
6.50%, due 9/29/49 (b) | | | 100,000 | | | | 117,014 | |
| | | | | | | | |
| | | | | | | 663,518 | |
| | | | | | | | |
Poland 0.1% | |
Play Topco S.A.
Series Reg S
7.75%, due 2/28/20 (c) | | | 100,000 | | | | 111,970 | |
| | | | | | | | |
|
Spain 0.3% | |
Grupo Antolin Dutch B.V.
Series Reg S
5.125%, due 6/30/22 | | | 200,000 | | | | 234,370 | |
Iberdrola International B.V.
Series Reg S
5.75%, due 2/27/49 (b) | | | 100,000 | | | | 116,704 | |
| | | | | | | | |
| | | | | | | 351,074 | |
| | | | | | | | |
| | | | | | |
The notes to the consolidated financial statements are an integral part of,
and should be read in conjunction with, the consolidated financial statements. | | | | | 15 | |
Consolidated Portfolio of Investments October 31, 2016 (Unaudited) (continued)
| | | | | | | | |
| | | Principal
Amount | | | Value | |
| Foreign Bonds (continued) | | | | | | | | |
Sweden 0.2% | |
Verisure Holding AB
Series Reg S
6.00%, due 11/1/22 | | EUR | 210,000 | | | $ | 250,699 | |
| | | | | | | | |
| | |
United Kingdom 0.3% | | | | | | | | |
Alliance Automotive Finance PLC
Series Reg S
6.25%, due 12/1/21 | | | 140,000 | | | | 163,713 | |
Worldpay Finance PLC
Series Reg S
3.75%, due 11/15/22 | | | 200,000 | | | | 236,565 | |
| | | | | | | | |
| | | | | | | 400,278 | |
| | | | | | | | |
Total Foreign Bonds
(Cost $8,632,742) | | | | | | | 8,477,380 | |
| | | | | | | | |
| | |
| U.S. Government 1.9% | | | | | | | | |
¨United States Treasury Inflation—Indexed Bond 1.9% | |
0.375%, due 7/15/25 | | | 2,489,260 | | | | 2,555,263 | |
| | | | | | | | |
Total U.S. Government
(Cost $2,537,943) | | | | | | | 2,555,263 | |
| | | | | | | | |
Total Long-Term Bonds
(Cost $22,649,873) | | | | | | | 22,621,268 | |
| | | | | | | | |
| | |
| | | | | | | | |
| | |
| | | Shares | | | | |
| Common Stocks 28.0% | | | | | | | | |
Advertising 0.1% | | | | | | | | |
IPSOS (d) | | | 3,045 | | | | 99,444 | |
| | | | | | | | |
|
Aerospace & Defense 0.2% | |
Kratos Defense & Security Solutions, Inc. (d)(e) | | | 8,000 | | | | 44,960 | |
Spirit AeroSystems Holdings, Inc. Class A (d)(e) | | | 3,400 | | | | 171,224 | |
| | | | | | | | |
| | | | | | | 216,184 | |
| | | | | | | | |
Airlines 0.1% | |
Deutsche Lufthansa A.G. Registered (d) | | | 1,345 | | | | 17,194 | |
Qantas Airways, Ltd. | | | 18,174 | | | | 42,304 | |
SAS AB (e) | | | 30,274 | | | | 51,283 | |
| | | | | | | | |
| | | | | | | 110,781 | |
| | | | | | | | |
Apparel 0.2% | |
Carter’s, Inc. (d) | | | 1,800 | | | | 155,412 | |
Skechers U.S.A., Inc. Class A (d)(e) | | | 6,900 | | | | 145,107 | |
| | | | | | | | |
| | | | | | | 300,519 | |
| | | | | | | | |
| | | | | | | | |
| | |
Shares | | | Value | |
Auto Manufacturers 0.2% | |
Peugeot S.A. (d)(e) | | | 10,734 | | | $ | 160,783 | |
Renault S.A. (d) | | | 112 | | | | 9,726 | |
Wabash National Corp. (d)(e) | | | 9,400 | | | | 105,750 | |
| | | | | | | | |
| | | | | | | 276,259 | |
| | | | | | | | |
Auto Parts & Equipment 0.8% | |
Autoneum Holding A.G. (d) | | | 374 | | | | 99,023 | |
Faurecia (d) | | | 3,366 | | | | 123,820 | |
Grammer A.G. | | | 2,180 | | | | 124,513 | |
Haldex AB | | | 30,172 | | | | 389,170 | |
Meritor, Inc. (d)(e) | | | 5,500 | | | | 56,540 | |
Modine Manufacturing Co. (d)(e) | | | 3,600 | | | | 39,420 | |
Titan International, Inc. (d) | | | 9,100 | | | | 92,729 | |
Tower International, Inc. (d) | | | 4,000 | | | | 86,800 | |
| | | | | | | | |
| | | | | | | 1,012,015 | |
| | | | | | | | |
Banks 1.3% | |
BankUnited, Inc. (d) | | | 5,200 | | | | 151,528 | |
BGEO Group PLC (d) | | | 2,617 | | | | 94,687 | |
BNP Paribas S.A. (d) | | | 2,896 | | | | 167,983 | |
Customers Bancorp, Inc. (d)(e) | | | 2,700 | | | | 73,089 | |
Deutsche Pfandbriefbank A.G. (a)(d) | | | 3,707 | | | | 38,081 | |
Erste Group Bank A.G. (d)(e) | | | 5,207 | | | | 163,534 | |
First BanCorp (d)(e) | | | 21,700 | | | | 111,321 | |
Mediobanca S.p.A. (d) | | | 22,790 | | | | 166,993 | |
OFG Bancorp (d) | | | 9,800 | | | | 104,370 | |
OneSavings Bank PLC | | | 2,609 | | | | 9,261 | |
Raiffeisen Bank International A.G. (d)(e) | | | 2,895 | | | | 47,447 | |
Shawbrook Group PLC (a)(e) | | | 6,992 | | | | 19,239 | |
Societe Generale S.A. (d) | | | 4,256 | | | | 166,137 | |
SVB Financial Group (d)(e) | | | 1,100 | | | | 134,497 | |
UniCredit S.p.A. | | | 67,150 | | | | 166,594 | |
Virgin Money Holdings UK PLC | | | 9,218 | | | | 37,121 | |
| | | | | | | | |
| | | | | | | 1,651,882 | |
| | | | | | | | |
Biotechnology 0.0%‡ | |
Arena Pharmaceuticals, Inc. (e) | | | 8,000 | | | | 11,840 | |
PDL BioPharma, Inc. | | | 3,000 | | | | 9,660 | |
Spectrum Pharmaceuticals, Inc. (e) | | | 1,300 | | | | 4,602 | |
Vitrolife AB | | | 582 | | | | 30,124 | |
| | | | | | | | |
| | | | | | | 56,226 | |
| | | | | | | | |
Building Materials 0.2% | |
Buzzi Unicem S.p.A. | | | 6,207 | | | | 63,368 | |
CSR, Ltd. | | | 3,796 | | | | 10,569 | |
Gibraltar Industries, Inc. (d)(e) | | | 1,200 | | | | 46,680 | |
Inwido AB | | | 3,570 | | | | 39,031 | |
NCI Building Systems, Inc. (d)(e) | | | 100 | | | | 1,440 | |
USG Corp. (d)(e) | | | 3,300 | | | | 83,094 | |
| | | | | | | | |
| | | | | | | 244,182 | |
| | | | | | | | |
Chemicals 1.3% | | | | | | | | |
Chemours Co. (The) (d) | | | 8,300 | | | | 136,369 | |
Covestro A.G. (a)(d) | | | 1,540 | | | | 91,019 | |
| | | | |
| 16 | | MainStay Absolute Return Multi-Strategy Fund | | The notes to the consolidated financial statements are an integral part of,
and should be read in conjunction with, the consolidated financial statements. |
| | | | | | | | |
| | |
Shares | | | Value | |
| Common Stocks (continued) | | | | | | | | |
Chemicals (continued) | | | | | |
Huntsman Corp. (d) | | | 9,600 | | | $ | 162,720 | |
Koppers Holdings, Inc. (d)(e) | | | 3,000 | | | | 98,250 | |
Lenzing A.G. (d) | | | 988 | | | | 128,685 | |
Monsanto Co. | | | 3,800 | | | | 382,926 | |
OMNOVA Solutions, Inc. (d)(e) | | | 2,600 | | | | 19,760 | |
Rayonier Advanced Materials, Inc. (d) | | | 9,900 | | | | 128,007 | |
Syngenta A.G. Registered | | | 453 | | | | 181,099 | |
Valspar Corp. (The) | | | 3,967 | | | | 395,113 | |
| | | | | | | | |
| | | | | | | 1,723,948 | |
| | | | | | | | |
Coal 0.1% | | | | | | | | |
SunCoke Energy, Inc. (d) | | | 4,600 | | | | 46,966 | |
Whitehaven Coal, Ltd. (e) | | | 30,011 | | | | 69,173 | |
| | | | | | | | |
| | | | | | | 116,139 | |
| | | | | | | | |
Commercial Services 0.9% | | | | | | | | |
American Public Education, Inc. (d)(e) | | | 1,400 | | | | 28,210 | |
Avis Budget Group, Inc. (d)(e) | | | 4,800 | | | | 155,328 | |
Cramo OYJ | | | 1,235 | | | | 32,470 | |
DeVry Education Group, Inc. (d) | | | 5,100 | | | | 115,770 | |
Green Dot Corp. Class A (d)(e) | | | 2,000 | | | | 44,400 | |
HMS Holdings Corp. (d)(e) | | | 6,200 | | | | 130,634 | |
Insperity, Inc. (d) | | | 1,800 | | | | 135,360 | |
K12, Inc. (d)(e) | | | 7,300 | | | | 79,132 | |
LSC Communications, Inc. (e) | | | 812 | | | | 19,683 | |
ManpowerGroup, Inc. (d) | | | 2,200 | | | | 168,960 | |
Quad / Graphics, Inc. (d) | | | 5,000 | | | | 118,800 | |
Ramirent OYJ | | | 1,682 | | | | 12,408 | |
RR Donnelley & Sons Co. (d) | | | 2,166 | | | | 38,446 | |
Team Health Holdings, Inc. (e) | | | 2,260 | | | | 96,841 | |
| | | | | | | | |
| | | | | | | 1,176,442 | |
| | | | | | | | |
Computers 0.5% | | | | | | | | |
Barracuda Networks, Inc. (d)(e) | | | 5,600 | | | | 130,592 | |
Brocade Communications Systems, Inc. | | | 17,417 | | | | 184,620 | |
Cray, Inc. (d)(e) | | | 700 | | | | 14,560 | |
Engility Holdings, Inc. (d)(e) | | | 2,200 | | | | 63,206 | |
Logitech International S.A. Registered (d) | | | 5,691 | | | | 137,739 | |
Super Micro Computer, Inc. (d)(e) | | | 400 | | | | 9,480 | |
Teradata Corp. (d)(e) | | | 5,200 | | | | 140,192 | |
Wincor Nixdorf A.G. (e) | | | 279 | | | | 20,318 | |
| | | | | | | | |
| | | | | | | 700,707 | |
| | | | | | | | |
Cosmetics & Personal Care 0.1% | | | | | | | | |
Oriflame Holding A.G. (e) | | | 3,629 | | | | 133,433 | |
| | | | | | | | |
|
Distribution & Wholesale 0.3% | |
D’ieteren S.A. / N.V. | | | 2,300 | | | | 101,460 | |
Entertainment One, Ltd. | | | 40,184 | | | | 114,208 | |
HD Supply Holdings, Inc. (d)(e) | | | 4,900 | | | | 161,700 | |
| | | | | | | | |
| | | | | | | 377,368 | |
| | | | | | | | |
| | | | | | | | |
| | |
Shares | | | Value | |
Electric 0.1% | |
ACEA S.p.A | | | 3,095 | | | $ | 40,091 | |
EDP—Energias de Portugal S.A. | | | 20,314 | | | | 67,144 | |
Spark Energy, Inc. Class A (d) | | | 200 | | | | 4,840 | |
| | | | | | | | |
| | | | | | | 112,075 | |
| | | | | | | | |
Electrical Components & Equipment 0.1% | |
General Cable Corp. (d) | | | 8,900 | | | | 124,600 | |
Insteel Industries, Inc. (d) | | | 1,300 | | | | 34,970 | |
Powell Industries, Inc. (d) | | | 800 | | | | 28,312 | |
| | | | | | | | |
| | | | | | | 187,882 | |
| | | | | | | | |
Electronics 0.3% | |
Electrocomponents PLC | | | 11,610 | | | | 52,949 | |
Jabil Circuit, Inc. (d) | | | 7,200 | | | | 153,648 | |
Mycronic AB | | | 6,867 | | | | 71,657 | |
Stoneridge, Inc. (d)(e) | | | 6,300 | | | | 93,366 | |
TTM Technologies, Inc. (d)(e) | | | 4,300 | | | | 56,545 | |
| | | | | | | | |
| | | | | | | 428,165 | |
| | | | | | | | |
Energy—Alternate Sources 0.1% | |
Vestas Wind Systems A/S (d) | | | 1,342 | | | | 107,644 | |
| | | | | | | | |
|
Engineering & Construction 0.4% | |
ACS Actividades de Construccion y Servicios S.A. (d) | | | 5,295 | | | | 162,346 | |
Bouygues S.A. | | | 4,609 | | | | 150,293 | |
Carillion PLC | | | 30,698 | | | | 94,349 | |
Obrascon Huarte Lain S.A. | | | 30,999 | | | | 124,649 | |
| | | | | | | | |
| | | | | | | 531,637 | |
| | | | | | | | |
Entertainment 0.2% | |
Caesars Acquisition Co. Class A (d)(e) | | | 2,300 | | | | 26,795 | |
Carmike Cinemas, Inc. (e) | | | 2,610 | | | | 85,216 | |
International Game Technology PLC (d) | | | 4,000 | | | | 114,880 | |
Isle of Capri Casinos, Inc. (d)(e) | | | 624 | | | | 13,104 | |
William Hill PLC | | | 20,546 | | | | 74,389 | |
| | | | | | | | |
| | | | | | | 314,384 | |
| | | | | | | | |
Finance—Commercial 0.1% | |
Banca IFIS S.p.A. | | | 2,492 | | | | 72,083 | |
| | | | | | | | |
|
Finance—Consumer Loans 0.1% | |
Aldermore Group PLC (e) | | | 11,668 | | | | 24,650 | |
World Acceptance Corp. (d)(e) | | | 2,600 | | | | 123,552 | |
| | | | | | | | |
| | | | | | | 148,202 | |
| | | | | | | | |
Finance—Investment Banker/Broker 0.5% | |
GAIN Capital Holdings, Inc. | | | 4,900 | | | | 22,540 | |
INTL. FCStone, Inc. (d)(e) | | | 3,000 | | | | 107,700 | |
Investment Technology Group, Inc. (d) | | | 7,400 | | | | 113,294 | |
Lazard, Ltd. Class A (d) | | | 4,400 | | | | 160,424 | |
LPL Financial Holdings, Inc. (d) | | | 4,700 | | | | 145,512 | |
Raymond James Financial, Inc. (d) | | | 900 | | | | 54,108 | |
| | | | | | |
The notes to the consolidated financial statements are an integral part of,
and should be read in conjunction with, the consolidated financial statements. | | | | | 17 | |
Consolidated Portfolio of Investments October 31, 2016 (Unaudited) (continued)
| | | | | | | | |
| | |
Shares | | | Value | |
| Common Stocks (continued) | | | | | | | | |
Finance—Investment Banker/Broker (continued) | | | | | |
Tullett Prebon PLC | | | 9,459 | | | $ | 41,101 | |
| | | | | | | | |
| | | | | | | 644,679 | |
| | | | | | | | |
Finance—Other Services 0.1% | |
Deutsche Boerse A.G. | | | 971 | | | | 72,557 | |
| | | | | | | | |
| | |
Food 0.7% | | | | | | | | |
Austevoll Seafood ASA | | | 10,363 | | | | 93,441 | |
Casino Guichard Perrachon S.A. | | | 1,654 | | | | 82,305 | |
John B. Sanfilippo & Son, Inc. (d) | | | 100 | | | | 5,068 | |
Leroy Seafood Group ASA (d) | | | 42 | | | | 2,221 | |
Metcash, Ltd. (e) | | | 38,081 | | | | 57,647 | |
Pilgrim’s Pride Corp. (d) | | | 7,400 | | | | 161,616 | |
Premier Foods PLC (e) | | | 52,133 | | | | 29,034 | |
Salmar ASA (d) | | | 4,238 | | | | 137,567 | |
WhiteWave Foods Co. (The) (e) | | | 6,574 | | | | 358,217 | |
Wm Morrison Supermarkets PLC | | | 15,727 | | | | 43,601 | |
| | | | | | | | |
| | | | | | | 970,717 | |
| | | | | | | | |
Gas 0.2% | | | | | | | | |
Western Gas Equity Partners, L.P. | | | 5,200 | | | | 221,624 | |
| | | | | | | | |
| | |
Hand & Machine Tools 0.1% | | | | | | | | |
Regal Beloit Corp. (d) | | | 1,100 | | | | 65,010 | |
Schweiter Technologies A.G. (d) | | | 1 | | | | 1,077 | |
| | | | | | | | |
| | | | | | | 66,087 | |
| | | | | | | | |
Health Care—Products 1.0% | | | | | | | | |
Accuray, Inc. (d)(e) | | | 5,600 | | | | 27,440 | |
Alere, Inc. (d)(e) | | | 3,884 | | | | 173,537 | |
Ambu A/S Class B | | | 432 | | | | 22,379 | |
AngioDynamics, Inc. (d)(e) | | | 2,000 | | | | 31,880 | |
Bruker Corp. (d) | | | 7,300 | | | | 149,577 | |
Cepheid (e) | | | 3,900 | | | | 206,310 | |
Cynosure, Inc. Class A (d)(e) | | | 2,500 | | | | 106,625 | |
Halyard Health, Inc. (d)(e) | | | 3,800 | | | | 122,930 | |
Hill-Rom Holdings, Inc. (d) | | | 1,900 | | | | 105,279 | |
OraSure Technologies, Inc. (d)(e) | | | 6,700 | | | | 50,317 | |
Orthofix International N.V. (d)(e) | | | 2,300 | | | | 84,295 | |
VWR Corp. (d)(e) | | | 5,700 | | | | 156,807 | |
| | | | | | | | |
| | | | | | | 1,237,376 | |
| | | | | | | | |
Health Care—Services 0.4% | | | | | | | | |
Molina Healthcare, Inc. (d)(e) | | | 2,300 | | | | 125,143 | |
Natera, Inc. (d)(e) | | | 8,300 | | | | 70,384 | |
Summerset Group Holdings, Ltd. | | | 1,648 | | | | 5,610 | |
Triple-S Management Corp. Class B (e) | | | 5,000 | | | | 103,400 | |
WellCare Health Plans, Inc. (d)(e) | | | 1,300 | | | | 147,563 | |
| | | | | | | | |
| | | | | | | 452,100 | |
| | | | | | | | |
Holding Company—Diversified 0.1% | | | | | | | | |
Seven Group Holdings, Ltd. (d) | | | 11,787 | | | | 81,504 | |
| | | | | | | | |
| | | | | | | | |
| | |
Shares | | | Value | |
Home Builders 0.2% | | | | | | | | |
Barratt Developments PLC (d) | | | 11,850 | | | $ | 65,806 | |
Galliford Try PLC (d) | | | 4,686 | | | | 70,319 | |
Persimmon PLC (d) | | | 2,842 | | | | 58,928 | |
YIT OYJ (d) | | | 7,791 | | | | 64,914 | |
| | | | | | | | |
| | | | | | | 259,967 | |
| | | | | | | | |
Household Products & Wares 0.2% | | | | | | | | |
Central Garden & Pet Co. Class A (d)(e) | | | 5,200 | | | | 121,368 | |
Henkel A.G. & Co. KGaA | | | 1,452 | | | | 159,872 | |
| | | | | | | | |
| | | | | | | 281,240 | |
| | | | | | | | |
Housewares 0.0%‡ | | | | | | | | |
NACCO Industries, Inc. Class A (d) | | | 400 | | | | 29,260 | |
| | | | | | | | |
|
Insurance 0.6% | |
AXA S.A. (d) | | | 6,854 | | | | 154,505 | |
CNP Assurances (d) | | | 7,218 | | | | 125,074 | |
esure Group PLC | | | 13,203 | | | | 43,940 | |
NN Group N.V. (d) | | | 5,146 | | | | 155,066 | |
Old Mutual PLC | | | 19,875 | | | | 49,019 | |
Unipol Gruppo Finanziario S.p.A. | | | 47,905 | | | | 146,509 | |
Voya Financial, Inc. (d) | | | 5,000 | | | | 152,750 | |
| | | | | | | | |
| | | | | | | 826,863 | |
| | | | | | | | |
Internet 1.2% | | | | | | | | |
1-800-Flowers.com, Inc. Class A (d)(e) | | | 9,400 | | | | 89,770 | |
Blucora, Inc. (d)(e) | | | 8,000 | | | | 106,400 | |
GoDaddy, Inc. Class A (d)(e) | | | 300 | | | | 10,737 | |
Groupon, Inc. (e) | | | 30,700 | | | | 122,493 | |
IAC/InterActiveCorp (d) | | | 2,500 | | | | 161,100 | |
Intralinks Holdings, Inc. (d)(e) | | | 1,300 | | | | 11,921 | |
¨LinkedIn Corp. Class A (e) | | | 2,778 | | | | 526,709 | |
New Media Investment Group, Inc. (d) | | | 5,500 | | | | 79,200 | |
Overstock.com, Inc. (d)(e) | | | 2,200 | | | | 32,230 | |
RetailMeNot, Inc. (d)(e) | | | 11,700 | | | | 105,885 | |
Rubicon Project, Inc. (The) (d)(e) | | | 15,600 | | | | 119,496 | |
Twitter, Inc. (d)(e) | | | 4,000 | | | | 71,800 | |
Yahoo!, Inc. (e) | | | 4,561 | | | | 189,509 | |
| | | | | | | | |
| | | | | | | 1,627,250 | |
| | | | | | | | |
Investment Companies 0.3% | | | | | | | | |
EXOR S.p.A. | | | 8,021 | | | | 340,844 | |
John Laing Group PLC (a) | | | 3,759 | | | | 12,436 | |
| | | | | | | | |
| | | | | | | 353,280 | |
| | | | | | | | |
Iron & Steel 0.6% | | | | | | | | |
ArcelorMittal (d)(e) | | | 24,638 | | | | 166,011 | |
BlueScope Steel, Ltd. (d) | | | 23,198 | | | | 137,644 | |
Evraz PLC (e) | | | 33,045 | | | | 82,957 | |
Fortescue Metals Group, Ltd. | | | 39,767 | | | | 166,379 | |
Ryerson Holding Corp. (d)(e) | | | 200 | | | | 2,050 | |
Salzgitter A.G. (d) | | | 1,018 | | | | 33,414 | |
United States Steel Corp. (d) | | | 8,900 | | | | 172,126 | |
| | | | | | | | |
| | | | | | | 760,581 | |
| | | | | | | | |
| | | | |
| 18 | | MainStay Absolute Return Multi-Strategy Fund | | The notes to the consolidated financial statements are an integral part of,
and should be read in conjunction with, the consolidated financial statements. |
| | | | | | | | |
| | |
Shares | | | Value | |
| Common Stocks (continued) | | | | | | | | |
Leisure Time 0.1% | | | | | | | | |
Carnival PLC (d) | | | 3,331 | | | $ | 160,476 | |
Trigano S.A. (d) | | | 82 | | | | 5,802 | |
| | | | | | | | |
| | | | | | | 166,278 | |
| | | | | | | | |
Machinery—Construction & Mining 0.1% | |
Babcock & Wilcox Enterprises, Inc. (d)(e) | | | 3,000 | | | | 47,220 | |
Danieli & C Officine Meccaniche S.p.A. | | | 3,082 | | | | 41,276 | |
Oshkosh Corp. (d) | | | 1,800 | | | | 96,300 | |
| | | | | | | | |
| | | | | | | 184,796 | |
| | | | | | | | |
Machinery—Diversified 0.2% | | | | | | | | |
Biesse S.p.A. | | | 544 | | | | 9,382 | |
Chart Industries, Inc. (d)(e) | | | 3,200 | | | | 88,768 | |
Deutz A.G. | | | 12,929 | | | | 63,868 | |
Kardex A.G. Registered (d)(e) | | | 95 | | | | 8,122 | |
Koenig & Bauer A.G. (e) | | | 1,571 | | | | 73,785 | |
| | | | | | | | |
| | | | | | | 243,925 | |
| | | | | | | | |
Media 0.3% | | | | | | | | |
AMC Networks, Inc. Class A (d)(e) | | | 1,400 | | | | 68,502 | |
Gannett Co., Inc. (d) | | | 7,200 | | | | 55,944 | |
Sanoma OYJ | | | 5,321 | | | | 49,854 | |
Seven West Media, Ltd. | | | 196,284 | | | | 101,533 | |
SKY Network Television, Ltd. | | | 290 | | | | 958 | |
Southern Cross Media Group, Ltd. | | | 57,075 | | | | 62,521 | |
| | | | | | | | |
| | | | | | | 339,312 | |
| | | | | | | | |
Metal Fabricate & Hardware 0.2% | | | | | | | | |
Global Brass & Copper Holdings, Inc. (d) | | | 4,000 | | | | 114,800 | |
Granges AB | | | 5,194 | | | | 50,461 | |
Kloeckner & Co. S.E. (e) | | | 3,429 | | | | 42,799 | |
Timken Co. (The) (d) | | | 1,700 | | | | 56,185 | |
TimkenSteel Corp. (d)(e) | | | 5,500 | | | | 56,375 | |
| | | | | | | | |
| | | | | | | 320,620 | |
| | | | | | | | |
Mining 0.8% | | | | | | | | |
Acacia Mining PLC (d) | | | 15,293 | | | | 97,056 | |
Anglo American PLC (d)(e) | | | 9,783 | | | | 135,430 | |
Centamin PLC | | | 71,499 | | | | 138,098 | |
Coeur Mining, Inc. (d)(e) | | | 800 | | | | 8,944 | |
Detour Gold Corp. (e) | | | 3,655 | | | | 69,677 | |
Goldcorp, Inc. | | | 2,664 | | | | 40,458 | |
Lonmin PLC (e) | | | 47,953 | | | | 111,520 | |
Mineral Resources, Ltd. (d) | | | 991 | | | | 8,722 | |
Petra Diamonds, Ltd. | | | 29,333 | | | | 54,538 | |
Regis Resources, Ltd. | | | 50,638 | | | | 125,191 | |
Rio Tinto, Ltd. (d) | | | 2,636 | | | | 108,642 | |
South32, Ltd. | | | 81,421 | | | | 159,178 | |
| | | | | | | | |
| | | | | | | 1,057,454 | |
| | | | | | | | |
Miscellaneous—Manufacturing 0.3% | | | | | | | | |
AGFA-Gevaert N.V. (e) | | | 12,291 | | | | 51,136 | |
GWA Group, Ltd. | | | 10,052 | | | | 21,869 | |
| | | | | | | | |
| | |
Shares | | | Value | |
Miscellaneous—Manufacturing (continued) | | | | | |
Morgan Advanced Materials PLC | | | 863 | | | $ | 2,879 | |
RHI A.G. (d) | | | 1,136 | | | | 28,607 | |
Trinity Industries, Inc. (d) | | | 6,600 | | | | 140,910 | |
Trinseo S.A. (d) | | | 2,500 | | | | 131,125 | |
Vesuvius PLC | | | 383 | | | | 1,709 | |
| | | | | | | | |
| | | | | | | 378,235 | |
| | | | | | | | |
Office & Business Equipment 0.2% | | | | | | | | |
Neopost S.A. (d) | | | 4,658 | | | | 141,025 | |
Xerox Corp. (d) | | | 15,900 | | | | 155,343 | |
| | | | | | | | |
| | | | | | | 296,368 | |
| | | | | | | | |
Oil & Gas 1.3% | | | | | | | | |
Antero Midstream Partners, L.P. (d) | | | 8,700 | | | | 253,518 | |
Ensco PLC Class A (d) | | | 3,100 | | | | 24,242 | |
EQT GP Holdings, L.P. (d) | | | 7,200 | | | | 168,192 | |
¨InterOil Corp. (e) | | | 8,418 | | | | 417,701 | |
Murphy U.S.A., Inc. (d)(e) | | | 1,500 | | | | 103,170 | |
Nabors Industries, Ltd. (d) | | | 2,000 | | | | 23,800 | |
Noble Corp. PLC (d) | | | 4,100 | | | | 20,254 | |
PBF Energy, Inc. Class A (d) | | | 3,700 | | | | 80,660 | |
Premier Oil PLC (e) | | | 25,970 | | | | 20,980 | |
QEP Resources, Inc. (d) | | | 1,400 | | | | 22,498 | |
Rowan Cos. PLC Class A (d) | | | 1,900 | | | | 25,213 | |
Sanchez Energy Corp. (d)(e) | | | 2,900 | | | | 18,473 | |
Saras S.p.A. | | | 41,268 | | | | 71,668 | |
SM Energy Co. (d) | | | 600 | | | | 20,178 | |
Southwestern Energy Co. (d)(e) | | | 1,900 | | | | 19,741 | |
Suncor Energy, Inc. | | | 5,553 | | | | 166,635 | |
Transocean, Ltd. (d)(e) | | | 2,500 | | | | 24,025 | |
Valero Energy Partners, L.P. (d) | | | 3,200 | | | | 130,336 | |
VTTI Energy Partners, L.P. (d) | | | 8,100 | | | | 143,370 | |
| | | | | | | | |
| | | | 1,754,654 | |
| | | | | | | | |
Oil & Gas Services 1.0% | |
Baker Hughes, Inc. (d) | | | 500 | | | | 27,700 | |
FMC Technologies, Inc. (d)(e) | | | 900 | | | | 29,043 | |
Halliburton Co. | | | 1,434 | | | | 65,964 | |
Maire Tecnimont S.p.A. | | | 20,877 | | | | 50,419 | |
McDermott International, Inc. (d)(e) | | | 4,800 | | | | 24,672 | |
MRC Global, Inc. (d)(e) | | | 7,900 | | | | 116,446 | |
Newpark Resources, Inc. (d)(e) | | | 2,100 | | | | 13,230 | |
Oceaneering International, Inc. (d) | | | 900 | | | | 21,420 | |
Rice Midstream Partners, L.P. | | | 14,000 | | | | 303,380 | |
Targa Resources Corp. (d) | | | 7,500 | | | | 329,250 | |
Technip S.A. | | | 5,338 | | | | 354,049 | |
| | | | | | | | |
| | | | 1,335,573 | |
| | | | | | | | |
Pharmaceuticals 1.8% | |
Actelion, Ltd. Registered (d)(e) | | | 383 | | | | 55,347 | |
AmerisourceBergen Corp. (d) | | | 1,200 | | | | 84,384 | |
Amphastar Pharmaceuticals, Inc. (d)(e) | | | 6,800 | | | | 123,352 | |
AstraZeneca PLC, Sponsored ADR | | | 2,680 | | | | 75,898 | |
| | | | | | |
The notes to the consolidated financial statements are an integral part of,
and should be read in conjunction with, the consolidated financial statements. | | | | | 19 | |
Consolidated Portfolio of Investments October 31, 2016 (Unaudited) (continued)
| | | | | | | | |
| | |
Shares | | | Value | |
| Common Stocks (continued) | | | | | | | | |
Pharmaceuticals (continued) | | | | | |
Australian Pharmaceutical Industries, Ltd. | | | 10,370 | | | $ | 14,988 | |
Bayer A.G. Registered (d) | | | 409 | | | | 40,538 | |
Catalent, Inc. (d)(e) | | | 5,300 | | | | 120,893 | |
Herbalife, Ltd. (d)(e) | | | 2,500 | | | | 151,700 | |
Horizon Pharma PLC (d)(e) | | | 21,736 | | | | 363,426 | |
Impax Laboratories, Inc. (d)(e) | | | 5,600 | | | | 112,560 | |
Indivior PLC | | | 33,670 | | | | 129,571 | |
Lannett Co., Inc. (d)(e) | | | 5,100 | | | | 111,690 | |
Mylan N.V. (e) | | | 3,333 | | | | 121,654 | |
Omega Protein Corp. (d)(e) | | | 1,100 | | | | 24,530 | |
Pacira Pharmaceuticals, Inc. (d)(e) | | | 2,300 | | | | 73,140 | |
Phibro Animal Health Corp. Class A (d) | | | 4,900 | | | | 127,155 | |
SciClone Pharmaceuticals, Inc. (d)(e) | | | 12,100 | | | | 108,295 | |
Shire PLC, ADR | | | 426 | | | | 71,841 | |
Sigma Pharmaceuticals, Ltd. | | | 70,416 | | | | 71,242 | |
Sucampo Pharmaceuticals, Inc. Class A (d)(e) | | | 9,800 | | | | 111,720 | |
Supernus Pharmaceuticals, Inc. (d)(e) | | | 5,600 | | | | 110,880 | |
Taro Pharmaceutical Industries, Ltd. (e) | | | 1,400 | | | | 142,114 | |
| | | | | | | | |
| | | | | | | 2,346,918 | |
| | | | | | | | |
Pipelines 3.1% | | | | | | | | |
Cheniere Energy, Inc. (d)(e) | | | 3,400 | | | | 128,180 | |
Dominion Midstream Partners, L.P. (d) | | | 6,400 | | | | 151,040 | |
Energy Transfer Equity, L.P. (d) | | | 13,800 | | | | 206,034 | |
Energy Transfer Partners, L.P. (d) | | | 6,800 | | | | 237,864 | |
EnLink Midstream LLC | | | 9,000 | | | | 137,250 | |
Enterprise Products Partners, L.P. (d) | | | 10,800 | | | | 272,592 | |
EQT Midstream Partners, L.P. (d) | | | 2,000 | | | | 149,740 | |
Genesis Energy, L.P. (d) | | | 6,400 | | | | 223,552 | |
Magellan Midstream Partners, L.P. (d) | | | 2,100 | | | | 141,183 | |
MPLX, L.P. (d) | | | 7,500 | | | | 255,150 | |
NGL Energy Partners, L.P. (d) | | | 16,100 | | | | 286,580 | |
ONEOK, Inc. (d) | | | 4,300 | | | | 208,249 | |
Phillips 66 Partners, L.P. (d) | | | 3,700 | | | | 163,540 | |
Plains GP Holdings, L.P. Class A | | | 13,500 | | | | 169,560 | |
SemGroup Corp. Class A (d) | | | 7,600 | | | | 245,100 | |
Shell Midstream Partners, L.P. (d) | | | 5,700 | | | | 154,641 | |
Sunoco Logistics Partners, L.P. (d) | | | 9,200 | | | | 235,888 | |
Tesoro Logistics, L.P. (d) | | | 4,700 | | | | 224,378 | |
Williams Cos., Inc. (The) | | | 11,700 | | | | 341,640 | |
Williams Partners, L.P. | | | 4,700 | | | | 168,354 | |
| | | | | | | | |
| | | | | | | 4,100,515 | |
| | | | | | | | |
Private Equity 0.0%‡ | | | | | | | | |
Eurazeo S.A. (d) | | | 287 | | | | 16,518 | |
| | | | | | | | |
| | |
Retail 1.7% | | | | | | | | |
Abercrombie & Fitch Co. Class A (d) | | | 5,800 | | | | 84,738 | |
Ascena Retail Group, Inc. (e) | | | 14,500 | | | | 70,905 | |
Best Buy Co., Inc. (d) | | | 4,086 | | | | 158,986 | |
Brinker International, Inc. (d) | | | 3,100 | | | | 152,644 | |
| | | | | | | | |
| | |
Shares | | | Value | |
Retail (continued) | | | | | |
Byggmax Group AB | | | 1,516 | | | $ | 9,987 | |
Cewe Stiftung & Co. KGaA | | | 274 | | | | 26,228 | |
CST Brands, Inc. | | | 4,560 | | | | 218,971 | |
Debenhams PLC | | | 136,282 | | | | 89,577 | |
Dick’s Sporting Goods, Inc. (d) | | | 1,700 | | | | 94,605 | |
Finish Line, Inc. (The) Class A (d) | | | 5,900 | | | | 116,171 | |
Gap, Inc. (The) (d) | | | 2,500 | | | | 68,975 | |
JD Sports Fashion PLC (d) | | | 586 | | | | 10,895 | |
Kate Spade & Co. (d)(e) | | | 8,800 | | | | 147,400 | |
Liberty Interactive Corp. QVC Group Class A (d)(e) | | | 8,300 | | | | 153,467 | |
Matas A/S | | | 483 | | | | 9,374 | |
Nu Skin Enterprises, Inc. Class A (d) | | | 1,500 | | | | 92,475 | |
Office Depot, Inc. | | | 51,575 | | | | 162,461 | |
Pandora A/S (d) | | | 554 | | | | 72,114 | |
PVH Corp. (d) | | | 1,400 | | | | 149,772 | |
Rallye S.A. | | | 2,867 | | | | 51,898 | |
Regis Corp. (d)(e) | | | 6,200 | | | | 78,616 | |
Ruby Tuesday, Inc. (e) | | | 900 | | | | 2,673 | |
Staples, Inc. (d) | | | 20,000 | | | | 148,000 | |
| | | | | | | | |
| | | | | | | 2,170,932 | |
| | | | | | | | |
Savings & Loans 0.0%‡ | | | | | | | | |
Banc of California, Inc. (d) | | | 3,700 | | | | 49,210 | |
| | | | | | | | |
| | |
Semiconductors 0.5% | | | | | | | | |
Alpha & Omega Semiconductor, Ltd. (d)(e) | | | 3,400 | | | | 71,842 | |
Amkor Technology, Inc. (d)(e) | | | 13,700 | | | | 126,999 | |
BE Semiconductor Industries N.V. (d) | | | 3,804 | | | | 123,876 | |
Micron Technology, Inc. (d)(e) | | | 9,200 | | | | 157,872 | |
STMicroelectronics N.V. (d) | | | 19,265 | | | | 183,714 | |
| | | | | | | | |
| | | | | | | 664,303 | |
| | | | | | | | |
Software 1.1% | | | | | | | | |
Akamai Technologies, Inc. (d)(e) | | | 2,900 | | | | 201,463 | |
¨Apigee Corp. (e) | | | 26,100 | | | | 452,835 | |
Donnelley Financial Solutions, Inc. (e) | | | 812 | | | | 17,417 | |
IGG, Inc. | | | 188,000 | | | | 137,445 | |
InnerWorkings, Inc. (d)(e) | | | 2,500 | | | | 22,025 | |
Interactive Intelligence Group, Inc. (e) | | | 3,120 | | | | 188,604 | |
Kudelski S.A. (d)(e) | | | 3,462 | | | | 59,651 | |
LivePerson, Inc. (d)(e) | | | 2,800 | | | | 23,800 | |
Nuance Communications, Inc. (d)(e) | | | 11,200 | | | | 157,024 | |
Quality Systems, Inc. (d) | | | 5,800 | | | | 74,762 | |
RIB Software A.G. (d) | | | 1,025 | | | | 13,879 | |
Software A.G. (d) | | | 1,357 | | | | 49,307 | |
Ubisoft Entertainment S.A. (d)(e) | | | 1,125 | | | | 38,284 | |
| | | | | | | | |
| | | | | | | 1,436,496 | |
| | | | | | | | |
Telecommunications 1.0% | | | | | | | | |
A10 Networks, Inc. (d)(e) | | | 1,400 | | | | 10,724 | |
EarthLink Holdings Corp. (d) | | | 19,600 | | | | 112,112 | |
EchoStar Corp. Class A (d)(e) | | | 3,300 | | | | 154,242 | |
| | | | |
| 20 | | MainStay Absolute Return Multi-Strategy Fund | | The notes to the consolidated financial statements are an integral part of,
and should be read in conjunction with, the consolidated financial statements. |
| | | | | | | | |
| | |
Shares | | | Value | |
| Common Stocks (continued) | | | | | | | | |
Telecommunications (continued) | | | | | |
General Communication, Inc. Class A (d)(e) | | | 3,300 | | | $ | 52,272 | |
GN Store Nord A/S (d) | | | 39 | | | | 791 | |
Koninklijke KPN N.V. | | | 47,900 | | | | 156,222 | |
Millicom International Cellular S.A. | | | 1,293 | | | | 56,847 | |
NeoPhotonics Corp. (d)(e) | | | 2,500 | | | | 35,000 | |
Sonus Networks, Inc. (d)(e) | | | 3,200 | | | | 18,528 | |
Spark New Zealand, Ltd. | | | 63,131 | | | | 165,231 | |
¨T-Mobile U.S., Inc. (e) | | | 2,247 | | | | 111,743 | |
TDC A/S (e) | | | 33,850 | | | | 186,790 | |
Telecom Italia S.p.A. (e) | | | 235,728 | | | | 167,166 | |
Telenor ASA (d) | | | 4,852 | | | | 77,222 | |
Telephone & Data Systems, Inc. (d) | | | 1,300 | | | | 33,592 | |
| | | | | | | | |
| | | | | | | 1,338,482 | |
| | | | | | | | |
Transportation 0.3% | | | | | | | | |
Ansaldo STS S.p.A. | | | 5,640 | | | | 64,823 | |
Dfds A/S | | | 2,453 | | | | 118,563 | |
Nobina AB (a) | | | 5,066 | | | | 33,933 | |
Overseas Shipholding Group, Inc. Class A (d) | | | 2,500 | | | | 21,900 | |
Ryder System, Inc. (d) | | | 2,300 | | | | 159,597 | |
| | | | | | | | |
| | | | | | | 398,816 | |
| | | | | | | | |
Trucking & Leasing 0.1% | | | | | | | | |
Greenbrier Cos., Inc. (The) (d) | | | 3,500 | | | | 110,250 | |
| | | | | | | | |
Total Common Stocks
(Cost $35,948,309) | | | | 36,692,341 | |
| | | | | | | | |
| | |
| | | | | | | | |
| | | Number of
Rights | | | | |
| Rights 0.0%‡ | |
Finance—Other Services 0.0%‡ | |
Exor, Expires 11/9/16 (f) | | | 5,296 | | | | 0 | |
| | | | | | | | |
Total Rights
(Cost $0) | | | | | | | 0 | |
| | | | | | | | |
| | |
| | | | | | | | |
| | | Notional
Amount | | | | |
Purchased Options 0.0%‡ Purchased Put Options 0.0%‡ | |
Euro-Bund
Strike Price $161.50
Expires 11/25/16, American Style | | | 1,000,000 | | | | 7,026 | |
| | | | | | | | |
Euro-Bobl
Strike Price $132.50
Expires 12/23/16, American Style | | | 2,000,000 | | | | 8,123 | |
| | | | | | | | |
Total Purchased Options
(Cost $15,312) | | | | | | | 15,149 | |
| | | | | | | | |
| | | | | | | | |
| | | Principal
Amount | | | Value | |
| Short-Term Investments 63.1% | |
Repurchase Agreements 49.2% | |
Fixed Income Clearing Corp.
0.03%, dated 10/31/16
due 11/1/16
Proceeds at Maturity $57,113,999 (Collateralized by United States Treasury Notes and Government Agency securities with rates between 1.00% and 2.75% and maturity dates between 8/15/18 and 2/15/24, with a Principal Amount of $57,090,000 and a Market Value of $58,276,361) | | $ | 57,113,951 | | | $ | 57,113,951 | |
State Street Bank and Trust Co.
0.03%, dated 10/31/16
due 11/1/16
Proceeds at Maturity $7,230,339 (Collateralized by United States Treasury Notes and Bonds with rates between 3.125% and 8.00% and maturity dates between 5/15/19 and 11/15/21, with a Principal Amount of $5,465,000 and a Market Value of $7,389,021) | | | 7,230,333 | | | | 7,230,333 | |
| | | | | | | | |
Total Repurchase Agreements
(Cost $64,344,284) | | | | 64,344,284 | |
| | | | | | | | |
|
U.S. Government 13.9% | |
United States Treasury Bills 13.9% | |
0.00%, due 11/25/16 (g)(h) | | | 8,188,900 | | | | 8,187,958 | |
0.00%, due 12/15/16 (g)(h) | | | 2,650,000 | | | | 2,649,414 | |
0.00%, due 5/27/17 (g) | | | 6,000,000 | | | | 5,983,710 | |
0.00%, due 9/14/17 (g) | | | 1,309,600 | | | | 1,302,781 | |
| | | | | | | | |
Total U.S. Government
(Cost $18,115,264) | | | | 18,123,863 | |
| | | | | | | | |
Total Short-Term Investments
(Cost $82,459,548) | | | | 82,468,147 | |
| | | | | | | | |
Total Investments, Before Investments Sold Short
(Cost $141,073,042) (k) | | | 108.4 | % | | | 141,796,905 | |
| | | | | | | | |
| | |
| | | | | | | | |
| | |
Shares | | | | |
Investments Sold Short (20.8%) Common Stocks Sold Short (18.2%) | |
Advertising (0.1%) | |
JCDecaux S.A. | | | (3,636 | ) | | | (111,181 | ) |
MDC Partners, Inc. Class A | | | (6,100 | ) | | | (51,545 | ) |
| | | | | | | | |
| | | | | | | (162,726 | ) |
| | | | | | | | |
| | | | | | |
The notes to the consolidated financial statements are an integral part of,
and should be read in conjunction with, the consolidated financial statements. | | | | | 21 | |
Consolidated Portfolio of Investments October 31, 2016 (Unaudited) (continued)
| | | | | | | | |
| | |
Shares | | | Value | |
| Common Stocks Sold Short (continued) | |
Aerospace & Defense (0.4%) | | | | | | | | |
Aerovironment, Inc. (e) | | | (2,300 | ) | | $ | (55,177 | ) |
B/E Aerospace, Inc. | | | (1,000 | ) | | | (59,520 | ) |
Cobham PLC | | | (74,708 | ) | | | (130,672 | ) |
TransDigm Group, Inc. | | | (600 | ) | | | (163,476 | ) |
Zodiac Aerospace | | | (6,545 | ) | | | (159,286 | ) |
| | | | | | | | |
| | | | | | | (568,131 | ) |
| | | | | | | | |
Agriculture (0.0%)‡ | |
Australian Agricultural Co., Ltd. (e) | | | (8,643 | ) | | | (11,473 | ) |
| | | | | | | | |
|
Airlines (0.3%) | |
Copa Holdings S.A. Class A | | | (1,800 | ) | | | (166,014 | ) |
easyJet PLC | | | (8,541 | ) | | | (97,956 | ) |
Norwegian Air Shuttle ASA (e) | | | (414 | ) | | | (13,960 | ) |
Spirit Airlines, Inc. (e) | | | (900 | ) | | | (43,137 | ) |
| | | | | | | | |
| | | | | | | (321,067 | ) |
| | | | | | | | |
Apparel (0.3%) | |
Brunello Cucinelli S.p.A. | | | (2,397 | ) | | | (47,469 | ) |
Gerry Weber International A.G. | | | (114 | ) | | | (1,423 | ) |
Hermes International | | | (33 | ) | | | (13,371 | ) |
Iconix Brand Group, Inc. (e) | | | (12,500 | ) | | | (98,500 | ) |
Sequential Brands Group, Inc. (e) | | | (8,900 | ) | | | (64,080 | ) |
Ted Baker PLC | | | (2,634 | ) | | | (79,794 | ) |
Tod’s S.p.A. | | | (2,146 | ) | | | (125,563 | ) |
| | | | | | | | |
| | | | | | | (430,200 | ) |
| | | | | | | | |
Auto Parts & Equipment (0.0%)‡ | |
Motorcar Parts of America, Inc. (e) | | | (1,100 | ) | | | (28,864 | ) |
| | | | | | | | |
|
Banks (1.1%) | |
Banca Popolare di Sondrio SCPA | | | (34,935 | ) | | | (116,584 | ) |
Banco Popolare S.C. | | | (27,003 | ) | | | (77,782 | ) |
Banco Popular Espanol S.A. | | | (126,677 | ) | | | (138,921 | ) |
BOK Financial Corp. | | | (2,200 | ) | | | (156,244 | ) |
Credito Valtellinese S.C. | | | (186,357 | ) | | | (81,911 | ) |
EFG International A.G. (e) | | | (13,114 | ) | | | (70,636 | ) |
First Financial Bankshares, Inc. | | | (1,400 | ) | | | (50,680 | ) |
Liberbank S.A. (e) | | | (93,921 | ) | | | (93,307 | ) |
Park National Corp. | | | (900 | ) | | | (87,237 | ) |
Royal Bank of Scotland Group PLC (e) | | | (70,250 | ) | | | (162,599 | ) |
∎ Unione di Banche Italiane S.p.A. | | | (63,915 | ) | | | (176,249 | ) |
Westamerica Bancorp. | | | (2,500 | ) | | | (123,900 | ) |
Western Alliance Bancorp. (e) | | | (3,100 | ) | | | (115,816 | ) |
| | | | | | | | |
| | | | | | | (1,451,866 | ) |
| | | | | | | | |
Beverages (0.1%) | |
Brown-Forman Corp. Class A | | | (100 | ) | | | (4,850 | ) |
Brown-Forman Corp. Class B | | | (1,300 | ) | | | (60,021 | ) |
Coca-Cola European Partners PLC | | | (971 | ) | | | (37,440 | ) |
Marie Brizard Wine & Spirits S.A. (e) | | | (2,773 | ) | | | (47,153 | ) |
| | | | | | | | |
| | | | | | | (149,464 | ) |
| | | | | | | | |
| | | | | | | | |
| | |
Shares | | | Value | |
Biotechnology (0.7%) | |
Ablynx N.V. (e) | | | (1,735 | ) | | $ | (17,141 | ) |
Adocia (e) | | | (379 | ) | | | (20,719 | ) |
Atara Biotherapeutics, Inc. (e) | | | (200 | ) | | | (2,560 | ) |
Basilea Pharmaceutica A.G. Registered (e) | | | (1,404 | ) | | | (94,636 | ) |
Evolva Holding S.A. (e) | | | (11,352 | ) | | | (4,818 | ) |
Genfit (e) | | | (4,277 | ) | | | (80,051 | ) |
Genmab A/S (e) | | | (618 | ) | | | (101,969 | ) |
Illumina, Inc. (e) | | | (1,100 | ) | | | (149,754 | ) |
Innate Pharma S.A. (e) | | | (3,523 | ) | | | (41,381 | ) |
Lion Biotechnologies, Inc. (e) | | | (1,100 | ) | | | (6,875 | ) |
Loxo Oncology, Inc. (e) | | | (800 | ) | | | (16,688 | ) |
MorphoSys A.G. (e) | | | (2,724 | ) | | | (120,598 | ) |
Omeros Corp. (e) | | | (7,100 | ) | | | (58,220 | ) |
Pacific Biosciences of California, Inc. (e) | | | (15,400 | ) | | | (130,900 | ) |
Paratek Pharmaceuticals, Inc. (e) | | | (700 | ) | | | (7,490 | ) |
Pharma Mar S.A. (e) | | | (7,500 | ) | | | (20,295 | ) |
WaVe Life Sciences, Ltd. (e) | | | (1,700 | ) | | | (54,145 | ) |
XBiotech, Inc. (e) | | | (200 | ) | | | (2,650 | ) |
| | | | | | | | |
| | | | | | | (930,890 | ) |
| | | | | | | | |
Building Materials (0.0%)‡ | | | | | | | | |
James Hardie Industries PLC | | | (495 | ) | | | (7,392 | ) |
| | | | | | | | |
|
Chemicals (0.3%) | |
FMC Corp. | | | (1,300 | ) | | | (60,957 | ) |
Novozymes A/S Class B | | | (2,615 | ) | | | (97,139 | ) |
OCI N.V. (e) | | | (11,094 | ) | | | (154,057 | ) |
SGL Carbon S.E. (e) | | | (6,090 | ) | | | (75,945 | ) |
Tessenderlo Chemie N.V. (e) | | | (394 | ) | | | (13,140 | ) |
| | | | | | | | |
| | | | | | | (401,238 | ) |
| | | | | | | | |
Commercial Services (0.6%) | |
Cerved Information Solutions S.p.A. | | | (3,932 | ) | | | (31,660 | ) |
Europcar Groupe S.A. (a)(e) | | | (7,309 | ) | | | (67,927 | ) |
IPH, Ltd. | | | (13,758 | ) | | | (61,224 | ) |
Korn/Ferry International | | | (6,200 | ) | | | (126,418 | ) |
Macquarie Infrastructure Corp. | | | (1,400 | ) | | | (114,534 | ) |
Rollins, Inc. | | | (3,800 | ) | | | (117,116 | ) |
Square, Inc. Class A (e) | | | (9,100 | ) | | | (101,920 | ) |
Team, Inc. (e) | | | (400 | ) | | | (12,300 | ) |
Weight Watchers International, Inc. (e) | | | (12,600 | ) | | | (129,528 | ) |
| | | | | | | | |
| | | | | | | (762,627 | ) |
| | | | | | | | |
Computers (0.5%) | |
Arcam AB (e) | | | (2,944 | ) | | | (96,969 | ) |
Ingenico Group S.A. | | | (1,967 | ) | | | (155,684 | ) |
KEYW Holding Corp. (The) (e) | | | (1,900 | ) | | | (19,931 | ) |
Mercury Systems, Inc. (e) | | | (1,800 | ) | | | (50,004 | ) |
Nimble Storage, Inc. (e) | | | (15,000 | ) | | | (114,450 | ) |
Pure Storage, Inc. Class A (e) | | | (9,200 | ) | | | (113,528 | ) |
Tobii AB (e) | | | (9,479 | ) | | | (73,201 | ) |
| | | | | | | | |
| | | | | | | (623,767 | ) |
| | | | | | | | |
| | | | |
| 22 | | MainStay Absolute Return Multi-Strategy Fund | | The notes to the consolidated financial statements are an integral part of,
and should be read in conjunction with, the consolidated financial statements. |
| | | | | | | | |
| | |
Shares | | | Value | |
| Common Stocks Sold Short (continued) | |
Cosmetics & Personal Care (0.1%) | |
Coty, Inc. Class A (e) | | | (6,800 | ) | | $ | (156,332 | ) |
| | | | | | | | |
| | |
Country Funds—Closed-end (0.1%) | | | | | | | | |
Flow Traders (a) | | | (1,928 | ) | | | (59,483 | ) |
| | | | | | | | |
|
Distribution & Wholesale (0.0%)‡ | |
Triton International Ltd. | | | (2,600 | ) | | | (31,382 | ) |
| | | | | | | | |
|
Diversified Financial Services (0.0%)‡ | |
On Deck Capital, Inc. (e) | | | (5,400 | ) | | | (26,406 | ) |
| | | | | | | | |
|
Electrical Components & Equipment (0.0%)‡ | |
Vossloh A.G. (e) | | | (340 | ) | | | (20,636 | ) |
Zumtobel Group A.G. | | | (907 | ) | | | (15,926 | ) |
| | | | | | | | |
| | | | | | | (36,562 | ) |
| | | | | | | | |
Electronics (0.2%) | |
Gentex Corp. | | | (3,600 | ) | | | (60,876 | ) |
GoPro, Inc. Class A (e) | | | (8,600 | ) | | | (109,908 | ) |
Mesa Laboratories, Inc. | | | (600 | ) | | | (75,744 | ) |
TASER International, Inc. (e) | | | (2,900 | ) | | | (64,902 | ) |
| | | | | | | | |
| | | | | | | (311,430 | ) |
| | | | | | | | |
Energy—Alternate Sources (0.2%) | |
Plug Power, Inc. (e) | | | (12,900 | ) | | | (19,737 | ) |
SolarCity Corp. (e) | | | (3,900 | ) | | | (76,440 | ) |
Sunrun, Inc. (e) | | | (18,500 | ) | | | (96,385 | ) |
TPI Composites, Inc. (e) | | | (2,300 | ) | | | (36,616 | ) |
| | | | | | | | |
| | | | | | | (229,178 | ) |
| | | | | | | | |
Engineering & Construction (0.5%) | |
Bilfinger S.E. (e) | | | (3,095 | ) | | | (109,044 | ) |
Cie d’Entreprises CFE | | | (602 | ) | | | (66,316 | ) |
Ferrovial S.A. | | | (3,391 | ) | | | (65,981 | ) |
Kier Group PLC | | | (4,929 | ) | | | (81,990 | ) |
Koninklijke BAM Groep N.V. | | | (22,522 | ) | | | (104,852 | ) |
SBA Communications Corp. Class A (e) | | | (1,400 | ) | | | (158,592 | ) |
Singapore Technologies Engineering, Ltd. | | | (39,700 | ) | | | (89,316 | ) |
SPIE S.A. | | | (229 | ) | | | (4,331 | ) |
| | | | | | | | |
| | | | | | | (680,422 | ) |
| | | | | | | | |
Environmental Controls (0.1%) | |
Energy Recovery, Inc. (e) | | | (9,200 | ) | | | (112,332 | ) |
SIIC Environment Holdings, Ltd. (e) | | | (5,900 | ) | | | (2,693 | ) |
| | | | | | | | |
| | | | | | | (115,025 | ) |
| | | | | | | | |
Finance—Auto Loans (0.1%) | |
Credit Acceptance Corp. (e) | | | (500 | ) | | | (92,050 | ) |
| | | | | | | | |
|
Finance—Consumer Loans (0.4%) | |
Navient Corp. | | | (11,000 | ) | | | (140,580 | ) |
Ocwen Financial Corp. (e) | | | (1,800 | ) | | | (7,686 | ) |
| | | | | | | | |
| | |
Shares | | | Value | |
Finance—Consumer Loans (continued) | | | | | |
OneMain Holdings, Inc. (e) | | | (5,200 | ) | | $ | (147,368 | ) |
Provident Financial PLC | | | (3,335 | ) | | | (120,420 | ) |
Santander Consumer USA Holdings, Inc. (e) | | | (12,200 | ) | | | (148,840 | ) |
| | | | | | | | |
| | | | | | | (564,894 | ) |
| | | | | | | | |
Finance—Investment Banker/Broker (0.1%) | |
Virtu Financial, Inc. Class A | | | (7,000 | ) | | | (89,600 | ) |
| | | | | | | | |
|
Finance—Leasing Companies (0.1%) | |
Air Lease Corp. | | | (3,800 | ) | | | (114,988 | ) |
GRENKE A.G. | | | (29 | ) | | | (5,049 | ) |
| | | | | | | | |
| | | | | | | (120,037 | ) |
| | | | | | | | |
Finance—Mortgage Loan/Banker (0.1%) | |
Arlington Asset Investment Corp. Class A | | | (4,200 | ) | | | (59,976 | ) |
| | | | | | | | |
|
Finance—Other Services (0.0%)‡ | |
Hypoport A.G. (e) | | | (183 | ) | | | (14,635 | ) |
OFX Group Ltd | | | (33,680 | ) | | | (39,711 | ) |
| | | | | | | | |
| | | | | | | (54,346 | ) |
| | | | | | | | |
Food (0.5%) | |
a2 Milk Co., Ltd. (e) | | | (26,377 | ) | | | (35,084 | ) |
Amplify Snack Brands, Inc. (e) | | | (8,300 | ) | | | (120,267 | ) |
Associated British Foods PLC | | | (5,078 | ) | | | (153,025 | ) |
Blue Buffalo Pet Products, Inc. (e) | | | (6,300 | ) | | | (158,256 | ) |
Dairy Crest Group PLC | | | (3,954 | ) | | | (29,522 | ) |
Ocado Group PLC (e) | | | (41,553 | ) | | | (139,868 | ) |
Snyder’s-Lance, Inc. | | | (800 | ) | | | (28,456 | ) |
Tassal Group, Ltd. | | | (2,015 | ) | | | (5,901 | ) |
| | | | | | | | |
| | | | | | | (670,379 | ) |
| | | | | | | | |
Food Services (0.0%)‡ | |
Do & Co. A.G. | | | (380 | ) | | | (29,400 | ) |
| | | | | | | | |
|
Forest Products & Paper (0.0%)‡ | |
Deltic Timber Corp. | | | (200 | ) | | | (11,236 | ) |
| | | | | | | | |
|
Health Care—Products (0.4%) | |
ABIOMED, Inc. (e) | | | (400 | ) | | | (41,996 | ) |
Accelerate Diagnostics, Inc. (e) | | | (4,900 | ) | | | (104,125 | ) |
Cerus Corp. (e) | | | (22,600 | ) | | | (108,932 | ) |
ConforMIS, Inc. (e) | | | (2,900 | ) | | | (22,127 | ) |
GenMark Diagnostics, Inc. (e) | | | (2,100 | ) | | | (22,407 | ) |
Novocure, Ltd. (e) | | | (11,300 | ) | | | (68,365 | ) |
Patterson Cos., Inc. | | | (2,000 | ) | | | (85,420 | ) |
Rockwell Medical, Inc. (e) | | | (8,300 | ) | | | (48,223 | ) |
| | | | | | | | |
| | | | | | | (501,595 | ) |
| | | | | | | | |
Health Care—Services (0.5%) | |
AAC Holdings, Inc. (e) | | | (6,700 | ) | | | (109,813 | ) |
Adeptus Health, Inc. Class A (e) | | | (2,900 | ) | | | (87,348 | ) |
| | | | | | |
The notes to the consolidated financial statements are an integral part of,
and should be read in conjunction with, the consolidated financial statements. | | | | | 23 | |
Consolidated Portfolio of Investments October 31, 2016 (Unaudited) (continued)
| | | | | | | | |
| | |
Shares | | | Value | |
| Common Stocks Sold Short (continued) | |
Health Care—Services (continued) | | | | | |
Amsurg Corp. (e) | | | (1,200 | ) | | $ | (71,700 | ) |
LifePoint Health, Inc. (e) | | | (1,400 | ) | | | (83,790 | ) |
MEDNAX, Inc. (e) | | | (2,400 | ) | | | (147,000 | ) |
Surgery Partners, Inc. (e) | | | (4,400 | ) | | | (70,840 | ) |
Teladoc, Inc. (e) | | | (5,600 | ) | | | (91,000 | ) |
| | | | | | | | |
| | | | | | | (661,491 | ) |
| | | | | | | | |
Holding Companies—Diversified (0.2%) | |
Ackermans & van Haaren N.V. | | | (979 | ) | | | (136,003 | ) |
Bollore S.A. | | | (30,496 | ) | | | (100,431 | ) |
| | | | | | | | |
| | | | | | | (236,434 | ) |
| | | | | | | | |
Home Builders (0.3%) | |
CalAtlantic Group, Inc. | | | (3,000 | ) | | | (96,960 | ) |
LGI Homes, Inc. (e) | | | (3,900 | ) | | | (116,064 | ) |
William Lyon Homes Class A (e) | | | (7,700 | ) | | | (137,522 | ) |
| | | | | | | | |
| | | | | | | (350,546 | ) |
| | | | | | | | |
Household Products & Wares (0.0%)‡ | |
Societe BIC S.A. | | | (338 | ) | | | (46,862 | ) |
| | | | | | | | |
|
Insurance (0.5%) | |
Ambac Financial Group, Inc. (e) | | | (6,600 | ) | | | (121,770 | ) |
Erie Indemnity Co. Class A | | | (200 | ) | | | (20,478 | ) |
Greenlight Capital Re, Ltd. Class A (e) | | | (4,500 | ) | | | (89,550 | ) |
Kinsale Capital Group, Inc. | | | (1,100 | ) | | | (26,455 | ) |
MBIA, Inc. (e) | | | (16,800 | ) | | | (129,360 | ) |
Sampo OYJ Class A | | | (1,882 | ) | | | (86,295 | ) |
St James’s Place PLC | | | (13,491 | ) | | | (156,048 | ) |
Trupanion, Inc. (e) | | | (2,800 | ) | | | (45,332 | ) |
WMIH Corp. (e) | | | (5,400 | ) | | | (11,340 | ) |
| | | | | | | | |
| | | | | | | (686,628 | ) |
| | | | | | | | |
Internet (0.7%) | |
Chegg, Inc. (e) | | | (18,500 | ) | | | (123,025 | ) |
FireEye, Inc. (e) | | | (6,300 | ) | | | (73,206 | ) |
Liberty Ventures, Class A (e) | | | (3,900 | ) | | | (155,610 | ) |
Palo Alto Networks, Inc. (e) | | | (800 | ) | | | (123,064 | ) |
Pandora Media, Inc. (e) | | | (6,000 | ) | | | (67,980 | ) |
Rapid7, Inc. (e) | | | (3,800 | ) | | | (54,454 | ) |
Symantec Corp. | | | (2,200 | ) | | | (55,066 | ) |
TripAdvisor, Inc. (e) | | | (2,400 | ) | | | (154,752 | ) |
Yoox Net-A-Porter Group S.p.A. (e) | | | (4,242 | ) | | | (122,005 | ) |
zooplus A.G. (e) | | | (286 | ) | | | (40,673 | ) |
| | | | | | | | |
| | | | | | | (969,835 | ) |
| | | | | | | | |
Investment Companies (0.1%) | |
Aker ASA Class A | | | (731 | ) | | | (26,984 | ) |
KBC Ancora (e) | | | (396 | ) | | | (15,024 | ) |
Leonteq A.G. (e) | | | (555 | ) | | | (31,997 | ) |
| | | | | | | | |
| | | | | | | (74,005 | ) |
| | | | | | | | |
| | | | | | | | |
| | |
Shares | | | Value | |
Investment Management/Advisory Services (0.3%) | |
Hargreaves Lansdown PLC | | | (7,844 | ) | | $ | (111,373 | ) |
Platinum Asset Management, Ltd. | | | (36,073 | ) | | | (136,929 | ) |
VZ Holding A.G. | | | (32 | ) | | | (9,475 | ) |
WisdomTree Investments, Inc. | | | (7,300 | ) | | | (62,634 | ) |
| | | | | | | | |
| | | | | | | (320,411 | ) |
| | | | | | | | |
Iron & Steel (0.2%) | |
Allegheny Technologies, Inc. | | | (7,500 | ) | | | (102,300 | ) |
thyssenkrupp A.G. | | | (6,350 | ) | | | (147,012 | ) |
| | | | | | | | |
| | | | | | | (249,312 | ) |
| | | | | | | | |
Leisure Time (0.1%) | |
∎ Harley-Davidson, Inc. | | | (3,100 | ) | | | (176,762 | ) |
Piaggio & C. S.p.A. | | | (5,150 | ) | | | (8,989 | ) |
| | | | | | | | |
| | | | | | | (185,751 | ) |
| | | | | | | | |
Lodging (0.1%) | |
Accor S.A. | | | (567 | ) | | | (21,526 | ) |
Extended Stay America, Inc. | | | (500 | ) | | | (7,150 | ) |
NH Hotel Group S.A. (e) | | | (17,870 | ) | | | (78,958 | ) |
| | | | | | | | |
| | | | | | | (107,634 | ) |
| | | | | | | | |
Machinery—Construction & Mining (0.1%) | |
Outotec OYJ (e) | | | (21,373 | ) | | | (93,098 | ) |
| | | | | | | | |
|
Machinery—Diversified (0.4%) | |
Cognex Corp. | | | (3,000 | ) | | | (154,800 | ) |
FLSmidth & Co. A/S | | | (3,392 | ) | | | (123,249 | ) |
Middleby Corp. (The) (e) | | | (800 | ) | | | (89,688 | ) |
Power Solutions International, Inc. (e) | | | (1,900 | ) | | | (18,145 | ) |
Zardoya Otis S.A. | | | (1,521 | ) | | | (12,840 | ) |
Zebra Technologies Corp. Class A (e) | | | (2,300 | ) | | | (151,432 | ) |
| | | | | | | | |
| | | | | | | (550,154 | ) |
| | | | | | | | |
Media (0.5%) | |
Altice N.V. Class A (e) | | | (7,043 | ) | | | (129,888 | ) |
Altice N.V. Class B (e) | | | (4,283 | ) | | | (79,717 | ) |
Cairo Communication S.p.A. | | | (3,447 | ) | | | (14,757 | ) |
Discovery Communications, Inc. Class A (e) | | | (600 | ) | | | (15,666 | ) |
Liberty Broadband Corp. Class A (e) | | | (1,300 | ) | | | (84,435 | ) |
Liberty Broadband Corp. Class C (e) | | | (1,800 | ) | | | (119,970 | ) |
Promotora de Informaciones S.A. Class A (e) | | | (3,232 | ) | | | (22,423 | ) |
Schibsted ASA Class A | | | (4,371 | ) | | | (102,778 | ) |
Singapore Press Holdings, Ltd. | | | (1,400 | ) | | | (3,743 | ) |
Telenet Group Holding N.V. (e) | | | (242 | ) | | | (12,955 | ) |
Television Francaise 1 | | | (4,859 | ) | | | (44,795 | ) |
| | | | | | | | |
| | | | | | | (631,127 | ) |
| | | | | | | | |
Metal Fabricate & Hardware (0.2%) | |
Haynes International, Inc. | | | (200 | ) | | | (6,434 | ) |
Sun Hydraulics Corp. | | | (2,100 | ) | | | (61,803 | ) |
Valmont Industries, Inc. | | | (1,200 | ) | | | (153,540 | ) |
| | | | | | | | |
| | | | | | | (221,777 | ) |
| | | | | | | | |
| | | | |
| 24 | | MainStay Absolute Return Multi-Strategy Fund | | The notes to the consolidated financial statements are an integral part of,
and should be read in conjunction with, the consolidated financial statements. |
| | | | | | | | |
| | |
Shares | | | Value | |
| Common Stocks Sold Short (continued) | |
Mining (0.9%) | |
Century Aluminum Co. (e) | | | (17,400 | ) | | $ | (127,194 | ) |
Compass Minerals International, Inc. | | | (2,200 | ) | | | (158,070 | ) |
Eramet (e) | | | (1,824 | ) | | | (85,618 | ) |
Fairmount Santrol Holdings, Inc. (e) | | | (1,300 | ) | | | (11,167 | ) |
Ferroglobe PLC | | | (8,200 | ) | | | (75,850 | ) |
Independence Group NL | | | (29,903 | ) | | | (96,676 | ) |
Metals X, Ltd. (e) | | | (26,602 | ) | | | (27,926 | ) |
Nyrstar N.V. (e) | | | (13,145 | ) | | | (67,532 | ) |
Orocobre, Ltd. (e) | | | (21,030 | ) | | | (61,270 | ) |
Pilbara Minerals, Ltd. (e) | | | (110,110 | ) | | | (43,555 | ) |
Royal Gold, Inc. | | | (2,400 | ) | | | (165,168 | ) |
Sirius Minerals PLC (e) | | | (164,355 | ) | | | (77,451 | ) |
Syrah Resources, Ltd. (e) | | | (20,448 | ) | | | (55,997 | ) |
Vedanta Resources PLC | | | (13,969 | ) | | | (121,995 | ) |
Western Areas, Ltd. (e) | | | (26,921 | ) | | | (50,583 | ) |
| | | | | | | | |
| | | | | | | (1,226,052 | ) |
| | | | | | | | |
Miscellaneous—Manufacturing (0.1%) | |
GUD Holdings, Ltd. | | | (543 | ) | | | (3,924 | ) |
Hexpol AB | | | (5,969 | ) | | | (49,069 | ) |
Proto Labs, Inc. (e) | | | (2,300 | ) | | | (102,810 | ) |
Scapa Group PLC | | | (3,442 | ) | | | (12,028 | ) |
| | | | | | | | |
| | | | | | | (167,831 | ) |
| | | | | | | | |
Oil & Gas (0.2%) | |
Aker BP ASA (e) | | | (918 | ) | | | (14,733 | ) |
Caltex Australia, Ltd. | | | (1,367 | ) | | | (31,956 | ) |
Clayton Williams Energy, Inc. (e) | | | (200 | ) | | | (17,462 | ) |
Cobalt International Energy, Inc. (e) | | | (11,800 | ) | | | (11,140 | ) |
Concho Resources, Inc. (e) | | | (100 | ) | | | (12,694 | ) |
Continental Resources, Inc. (e) | | | (300 | ) | | | (14,673 | ) |
Diamondback Energy, Inc. (e) | | | (100 | ) | | | (9,129 | ) |
DNO ASA (e) | | | (10,154 | ) | | | (8,701 | ) |
Gulfport Energy Corp. (e) | | | (400 | ) | | | (9,644 | ) |
Hess Corp. | | | (200 | ) | | | (9,594 | ) |
Liquefied Natural Gas, Ltd. (e) | | | (299 | ) | | | (127 | ) |
Pantheon Resources PLC (e) | | | (6,402 | ) | | | (7,640 | ) |
Par Pacific Holdings, Inc. (e) | | | (2,900 | ) | | | (36,946 | ) |
Parsley Energy, Inc. Class A (e) | | | (300 | ) | | | (9,870 | ) |
Pioneer Natural Resources Co. | | | (100 | ) | | | (17,902 | ) |
Range Resources Corp. | | | (300 | ) | | | (10,137 | ) |
Ring Energy, Inc. (e) | | | (1,100 | ) | | | (10,153 | ) |
Synergy Resources Corp. (e) | | | (1,800 | ) | | | (12,312 | ) |
| | | | | | | | |
| | | | | | | (244,813 | ) |
| | | | | | | | |
Oil & Gas Services (0.2%) | |
Amec Foster Wheeler PLC | | | (1,722 | ) | | | (9,426 | ) |
Core Laboratories N.V. | | | (100 | ) | | | (9,697 | ) |
Flotek Industries, Inc. (e) | | | (6,700 | ) | | | (78,926 | ) |
Frank’s International N.V. | | | (1,000 | ) | | | (11,250 | ) |
Fugro N.V., CVA (e) | | | (768 | ) | | | (13,725 | ) |
| | | | | | | | |
| | |
Shares | | | Value | |
Oil & Gas Services (continued) | | | | | |
Petroleum Geo-Services ASA (e) | | | (5,090 | ) | | $ | (13,695 | ) |
RPC, Inc. (e) | | | (700 | ) | | | (12,089 | ) |
Saipem S.p.A (e) | | | (25,972 | ) | | | (10,691 | ) |
Schoeller-Bleckmann Oilfield Equipment A.G. | | | (201 | ) | | | (14,234 | ) |
Sembcorp Marine, Ltd. | | | (37,400 | ) | | | (34,813 | ) |
| | | | | | | | |
| | | | | | | (208,546 | ) |
| | | | | | | | |
Packaging & Containers (0.1%) | |
Ball Corp. | | | (2,000 | ) | | | (154,140 | ) |
| | | | | | | | |
|
Pharmaceuticals (1.1%) | |
AB Science S.A. (e) | | | (3,519 | ) | | | (39,171 | ) |
Aclaris Therapeutics, Inc. (e) | | | (2,000 | ) | | | (42,500 | ) |
Aerie Pharmaceuticals, Inc. (e) | | | (3,300 | ) | | | (109,725 | ) |
Aimmune Therapeutics, Inc. (e) | | | (600 | ) | | | (9,768 | ) |
Blackmores, Ltd. | | | (794 | ) | | | (67,696 | ) |
Cempra, Inc. (e) | | | (5,900 | ) | | | (106,938 | ) |
Collegium Pharmaceutical, Inc. (e) | | | (3,600 | ) | | | (53,892 | ) |
DBV Technologies S.A. (e) | | | (597 | ) | | | (41,261 | ) |
DexCom, Inc. (e) | | | (1,900 | ) | | | (148,656 | ) |
Fagron (e) | | | (11,562 | ) | | | (114,255 | ) |
Galenica A.G. Registered | | | (144 | ) | | | (144,357 | ) |
Greencross, Ltd. | | | (7,848 | ) | | | (41,670 | ) |
GW Pharmaceuticals PLC (e) | | | (6,072 | ) | | | (59,085 | ) |
Intra-Cellular Therapies, Inc. (e) | | | (2,400 | ) | | | (29,760 | ) |
MyoKardia, Inc. (e) | | | (2,100 | ) | | | (28,245 | ) |
NantKwest, Inc. (e) | | | (2,400 | ) | | | (14,376 | ) |
Premier, Inc. Class A (e) | | | (4,900 | ) | | | (156,016 | ) |
Revance Therapeutics, Inc. (e) | | | (4,700 | ) | | | (62,745 | ) |
Sirtex Medical, Ltd. | | | (2,180 | ) | | | (46,284 | ) |
TherapeuticsMD, Inc. (e) | | | (19,300 | ) | | | (110,782 | ) |
Vectura Group PLC (e) | | | (9,209 | ) | | | (15,262 | ) |
Vital Therapies, Inc. (e) | | | (900 | ) | | | (4,815 | ) |
Zealand Pharma A/S (e) | | | (842 | ) | | | (11,681 | ) |
| | | | | | | | |
| | | | | | | (1,458,940 | ) |
| | | | | | | | |
Pipelines (0.0%)‡ | |
Cheniere Energy, Inc. (e) | | | (300 | ) | | | (11,310 | ) |
| | | | | | | | |
|
Private Equity (0.0%)‡ | |
Allied Minds PLC (e) | | | (5,534 | ) | | | (23,030 | ) |
| | | | | | | | |
|
Retail (1.5%) | |
AO World PLC (e) | | | (10,727 | ) | | | (20,693 | ) |
At Home Group, Inc. (e) | | | (3,200 | ) | | | (35,840 | ) |
Chipotle Mexican Grill, Inc. (e) | | | (400 | ) | | | (144,304 | ) |
Cie Financiere Richemont S.A. Registered | | | (2,425 | ) | | | (155,981 | ) |
Duluth Holdings, Inc. Class B (e) | | | (3,300 | ) | | | (89,595 | ) |
Dunkin’ Brands Group, Inc. | | | (3,000 | ) | | | (145,080 | ) |
Lumber Liquidators Holdings, Inc. (e) | | | (6,900 | ) | | | (107,019 | ) |
Luxottica Group S.p.A | | | (3,438 | ) | | | (171,154 | ) |
| | | | | | |
The notes to the consolidated financial statements are an integral part of,
and should be read in conjunction with, the consolidated financial statements. | | | | | 25 | |
Consolidated Portfolio of Investments October 31, 2016 (Unaudited) (continued)
| | | | | | | | |
| | |
Shares | | | Value | |
| Common Stocks Sold Short (continued) | |
Retail (continued) | |
Majestic Wine PLC (e) | | | (418 | ) | | $ | (1,461 | ) |
Restoration Hardware Holdings, Inc. (e) | | | (4,100 | ) | | | (118,777 | ) |
Sears Holdings Corp. (e) | | | (11,700 | ) | | | (129,987 | ) |
Shake Shack, Inc. Class A (e) | | | (2,800 | ) | | | (89,292 | ) |
Sports Direct International PLC (e) | | | (36,103 | ) | | | (122,274 | ) |
Sportsman’s Warehouse Holdings, Inc. (e) | | | (5,000 | ) | | | (46,000 | ) |
Tiffany & Co. | | | (2,100 | ) | | | (154,182 | ) |
Tile Shop Holdings, Inc. (e) | | | (4,900 | ) | | | (83,055 | ) |
Wingstop, Inc. | | | (4,700 | ) | | | (125,772 | ) |
Zalando S.E. (a)(e) | | | (3,739 | ) | | | (164,138 | ) |
| | | | | | | | |
| | | | | | | (1,904,604 | ) |
| | | | | | | | |
Semiconductors (0.3%) | |
ams A.G. | | | (2,824 | ) | | | (79,194 | ) |
∎ IPG Photonics Corp. (e) | | | (1,900 | ) | | | (184,319 | ) |
Manz A.G. (e) | | | (211 | ) | | | (7,693 | ) |
Nanoco Group PLC (e) | | | (19,242 | ) | | | (11,364 | ) |
Nordic Semiconductor ASA (e) | | | (16,355 | ) | | | (65,322 | ) |
| | | | | | | | |
| | | | | | | (347,892 | ) |
| | | | | | | | |
Software (1.1%) | |
Atlassian Corp. PLC Class A (e) | | | (2,000 | ) | | | (53,720 | ) |
Black Knight Financial Services, Inc. Class A (e) | | | (3,800 | ) | | | (149,530 | ) |
Castlight Health, Inc. Class B (e) | | | (11,500 | ) | | | (50,025 | ) |
Hortonworks, Inc. (e) | | | (14,900 | ) | | | (113,836 | ) |
Inovalon Holdings, Inc. Class A (e) | | | (9,000 | ) | | | (122,400 | ) |
Instructure, Inc. (e) | | | (1,600 | ) | | | (40,720 | ) |
NantHealth, Inc. (e) | | | (1,100 | ) | | | (14,443 | ) |
NetSuite, Inc. (e) | | | (1,400 | ) | | | (130,368 | ) |
Opera Software ASA (e) | | | (2,348 | ) | | | (16,554 | ) |
pdvWireless, Inc. (e) | | | (1,000 | ) | | | (23,600 | ) |
ServiceNow, Inc. (e) | | | (2,000 | ) | | | (175,820 | ) |
Splunk, Inc. (e) | | | (2,600 | ) | | | (156,494 | ) |
TomTom N.V. (e) | | | (13,708 | ) | | | (110,843 | ) |
Twilio, Inc. Class A (e) | | | (500 | ) | | | (17,060 | ) |
Tyler Technologies, Inc. (e) | | | (900 | ) | | | (144,360 | ) |
Workday, Inc. Class A (e) | | | (1,800 | ) | | | (156,024 | ) |
| | | | | | | | |
| | | | | | | (1,475,797 | ) |
| | | | | | | | |
Telecommunications (0.8%) | |
Ascom Holding A.G. Registered | | | (94 | ) | | | (1,610 | ) |
Drillisch A.G. | | | (394 | ) | | | (17,993 | ) |
Ei Towers S.p.A. (e) | | | (238 | ) | | | (11,234 | ) |
Euskaltel S.A. (a)(e) | | | (12,090 | ) | | | (121,835 | ) |
Frontier Communications Corp. | | | (37,500 | ) | | | (150,750 | ) |
Globalstar, Inc. (e) | | | (101,950 | ) | | | (94,365 | ) |
Infrastrutture Wireless Italiane S.p.A (a) | | | (2,168 | ) | | | (10,257 | ) |
Loral Space & Communications, Inc. (e) | | | (1,900 | ) | | | (73,720 | ) |
Shenandoah Telecommunications Co. | | | (5,000 | ) | | | (132,000 | ) |
Telecom Plus PLC | | | (4,755 | ) | | | (68,910 | ) |
| | | | | | | | |
| | |
Shares | | | Value | |
Telecommunications (continued) | | | | | |
TPG Telecom, Ltd. | | | (26,010 | ) | | $ | (149,581 | ) |
Vocus Communications, Ltd. | | | (36,589 | ) | | | (158,928 | ) |
| | | | | | | | |
| | | | | | | (991,183 | ) |
| | | | | | | | |
Transportation (0.3%) | |
Atlas Air Worldwide Holdings, Inc. (e) | | | (2,200 | ) | | | (92,070 | ) |
CAI International, Inc. (e) | | | (1,100 | ) | | | (8,371 | ) |
D/S Norden A/S (e) | | | (2,914 | ) | | | (41,479 | ) |
GasLog, Ltd. | | | (900 | ) | | | (13,815 | ) |
Golar LNG, Ltd. | | | (600 | ) | | | (13,134 | ) |
Golden Ocean Group, Ltd. (e) | | | (1,720 | ) | | | (6,261 | ) |
Groupe Eurotunnel S.E. Registered | | | (16,407 | ) | | | (153,650 | ) |
Teekay Corp. | | | (1,700 | ) | | | (11,101 | ) |
Teekay Tankers, Ltd. Class A | | | (3,800 | ) | | | (8,094 | ) |
XPO Logistics, Inc. (e) | | | (2,700 | ) | | | (88,911 | ) |
| | | | | | | | |
| | | | | | | (436,886 | ) |
| | | | | | | | |
Trucking & Leasing (0.1%) | |
Textainer Group Holdings, Ltd. | | | (10,400 | ) | | | (79,040 | ) |
| | | | | | | | |
Total Common Stocks Sold Short
(Proceeds $24,446,856) | | | (18.2 | )% | | | (23,804,567 | ) |
| | | | | | | | |
|
| Exchange-Traded Funds Sold Short (2.6%) (i) | |
◾ SPDR S&P 500 ETF Trust | | | (2,800 | ) | | | (595,140 | ) |
◾ United States Oil Fund, L.P. (e) | | | (263,200 | ) | | | (2,771,496 | ) |
| | | | | | | | |
Total Exchange-Traded Funds Sold Short
(Proceeds $3,149,363) | | | (2.6 | )% | | | (3,366,636 | ) |
| | | | | | | | |
| | |
| | | | | | | | |
| | | Number of
Rights | | | | |
Rights Sold Short (0.0%)‡ | |
Engineering & Construction (0.0%)‡ | | | | | | | | |
Ferrovial S.A.,
Expires 11/18/16 (e) | | | (3,391 | ) | | | (1,452 | ) |
| | | | | | | | |
Total Rights Sold Short
(Proceeds $1,520) | | | 0.0 | % | | | (1,452 | ) |
| | | | | | | | |
Total Investments Sold Short
(Proceeds $27,597,739) (j) | | | (20.8 | )% | | | (27,172,655 | ) |
| | | | | | | | |
Total Investments, Net of Investments Sold Short
(Cost $113,475,303) | | | 87.6 | | | | 114,624,250 | |
Other Assets, Less Liabilities | | | 12.4 | | | | 16,163,713 | |
Net Assets | | | 100.0 | % | | $ | 130,787,963 | |
| | | | |
| 26 | | MainStay Absolute Return Multi-Strategy Fund | | The notes to the consolidated financial statements are an integral part of,
and should be read in conjunction with, the consolidated financial statements. |
| ‡ | Less than one-tenth of a percent. |
| (a) | May be sold to institutional investors only under Rule 144A or securities offered pursuant to Section 4(a)(2) of the Securities Act of 1933, as amended. |
| (b) | Floating rate—Rate shown was the rate in effect as of October 31, 2016. |
| (c) | PIK (“Payment-in-Kind”)—issuer may pay interest or dividends with additional securities and/or in cash. |
| (d) | Security, or a portion thereof, was maintained in a segregated account at the Fund’s custodian as collateral for securities Sold Short (See Note 2(O)). |
| (e) | Non-income producing security. |
| (f) | Fair valued security—Represents fair value as measured in good faith under procedures approved by the Board of Trustees. As of October 31, 2016, the total market value of this security was $0, which represented less than one-tenth of a percent of the Fund’s net assets. |
| (g) | Interest rate shown represents yield to maturity. |
| (h) | Security, or a portion thereof, was maintained in a segregated account at the Fund’s custodian as collateral for swap contracts. (See Note 2(J)) |
| (i) | Exchange-Traded Fund—An investment vehicle that represents a basket of securities that is traded on an exchange. |
| (j) | As of October 31, 2016, cash in the amount of $14,835,428 was on deposit with brokers for short sale transactions. |
| (k) | As of October 31, 2016, cost was $142,255,808 for federal income tax purposes and net unrealized depreciation was as follows: |
| | | | |
Gross unrealized appreciation | | $ | 2,743,813 | |
Gross unrealized depreciation | | | (3,202,716 | ) |
| | | | |
Net unrealized depreciation | | $ | (458,903 | ) |
| | | | |
As of October 31, 2016, the Fund held the following foreign currency forward contracts:
| | | | | | | | | | | | | | | | | | | | | | |
Foreign Currency Buy Contracts | | Expiration
Date | | | Counterparty | | Contract
Amount
Purchased | | | Contract
Amount
Sold | | | Unrealized
Appreciation
(Depreciation) | |
Euro vs. U.S. Dollar | | | 12/16/16 | | | Societe Generale | | | EUR | | | | 1,551,016 | | | $ | 1,750,000 | | | $ | (44,030 | ) |
Euro vs. U.S. Dollar | | | 11/30/16 | | | Societe Generale | | | | | | | 12,678 | | | | 13,908 | | | | 24 | |
| | | | | | |
| | | | | | | | | | | | | | | | | | | | | | |
Foreign Currency Sales Contracts | | | | | | | Contract
Amount
Sold | | | Contract
Amount
Purchased | | | | |
Canadian Dollar vs. U.S. Dollar | | | 12/16/16 | | | Societe Generale | | | CAD | | | | 515,000 | | | | 390,573 | | | | 6,489 | |
Euro vs. U.S. Dollar | | | 12/16/16 | | | Societe Generale | | | EUR | | | | 3,353,329 | | | | 3,777,234 | | | | 88,891 | |
Euro vs. U.S. Dollar | | | 11/30/16 | | | Societe Generale | | | | | | | 9,121,954 | | | | 9,966,106 | | | | (58,753 | ) |
Pound Sterling vs. U.S. Dollar | | | 11/30/16 | | | Societe Generale | | | GBP | | | | 538,900 | | | | 657,841 | | | | (2,130 | ) |
Swedish Krona vs. U.S. Dollar | | | 12/16/16 | | | Societe Generale | | | SEK | | | | 7,100,000 | | | | 839,153 | | | | 51,360 | |
Swiss Franc vs. U.S. Dollar | | | 12/16/16 | | | Societe Generale | | | CHF | | | | 200,000 | | | | 206,519 | | | | 3,903 | |
Net unrealized appreciation (depreciation) on foreign currency forward contracts | | | | | | | | | | | $ | 45,754 | |
As of October 31, 2016, the Fund held the following futures contracts1:
| | | | | | | | | | | | | | | | |
Type | | Number of
Contracts
(Short) | | | Expiration
Date | | | Notional
Amount | | | Unrealized
Appreciation
(Depreciation)2 | |
| Euro-Bobl | | | (10 | ) | | | December 2016 | | | $ | (1,439,261 | ) | | $ | 6,240 | |
| Euro-Bund | | | (1 | ) | | | December 2016 | | | | (178,022 | ) | | | 3,342 | |
| | | | | | | | | | | | | | | | |
| | | | | | | | | | $ | (1,617,283 | ) | | $ | 9,582 | |
| | | | | | | | | | | | | | | | |
Written Option on Futures Contracts1
| | | | | | | | | | | | | | | | | | | | | | | | |
Description | | Counterparty | | | Strike
Price | | | Expiration
Date | | | Notional
Amount | | | Premium
(Received) | | | Market
Value | |
Put-Euro-Bund | | | Citibank N.A. | | | $ | 160.00 | | | | 11/25/2016 | | | $ | (1,000,000 | ) | | $ | (2,839 | ) | | $ | (3,074 | ) |
| 1. | As of October 31, 2016, cash in the amount of $28,150 was on deposit with a broker for futures and options on futures transactions. |
| 2. | Represents the difference between the value of the contracts at the time they were opened and the value as of October 31, 2016. |
| | | | | | |
The notes to the consolidated financial statements are an integral part of,
and should be read in conjunction with, the consolidated financial statements. | | | | | 27 | |
Consolidated Portfolio of Investments October 31, 2016 (Unaudited) (continued)
As of October 31, 2016, the Portfolio held the following centrally cleared interest rate swap agreements1:
| | | | | | | | | | | | | | | | | | | | | | | | | | | | | | |
Notional
Amount | | | Currency | | | Expiration
Date | | | Payments
made by Fund | | | Payments
Received by Fund | | | Upfront
Premiums
Received/
(Paid) | | | Value | | | Unrealized
Appreciation/ (Depreciation) | |
| | $6,840,000 | | | | USD | | | | 6/23/2017 | | | | Fixed 0.878 | % | | | 3-Month USD-LIBOR | | | $ | — | | | $ | 3,357 | | | $ | 3,357 | |
| | 2,340,000 | | | | USD | | | | 1/22/2018 | | | | Fixed 0.870 | % | | | 3-Month USD-LIBOR | | | | — | | | | 4,266 | | | | 4,266 | |
| | 900,000 | | | | USD | | | | 2/25/2018 | | | | Fixed 0.800 | % | | | 3-Month USD-LIBOR | | | | — | | | | 2,681 | | | | 2,681 | |
| | 1,660,000 | | | | USD | | | | 6/23/2025 | | | | 3-Month USD-LIBOR | | | | Fixed 2.366 | % | | | — | | | | 103,124 | | | | 103,124 | |
| | 165,000 | | | | USD | | | | 1/22/2026 | | | | 3-Month USD-LIBOR | | | | Fixed 1.836 | % | | | — | | | | 2,729 | | | | 2,729 | |
| | | | | | | | | | | | | | | | | | | | | $ | — | | | $ | 116,157 | | | $ | 116,157 | |
As of October 31, 2016, the Fund held the following centrally cleared credit default swap contracts1:
| | | | | | | | | | | | | | | | | | | | | | | | | | | | |
Reference Entity | | Termination
Date | | | Buy/Sell
Protection2 | | | Notional
Amount
(000)3 | | | (Pay)/ Receive
Fixed
Rate4 | | | Upfront
Premiums
Received/ (Paid) | | | Value | | | Unrealized
Appreciation/ (Depreciation)5 | |
Markit iTraxx Europe Crossover Series 23 | | | 6/20/2020 | | | | Buy | | | | EUR 2,000 | | | | (5.00 | )% | | $ | (137,718 | ) | | $ | (183,115 | ) | | $ | (45,397 | ) |
Markit iTraxx Europe Crossover Series 23 | | | 6/20/2020 | | | | Sell | | | | 2,000 | | | | 5.00 | % | | | 131,105 | | | | 183,115 | | | | 52,010 | |
Markit iTraxx Europe Crossover Series 24 | | | 12/20/2020 | | | | Buy | | | | 2,850 | | | | (5.00 | )% | | | (159,640 | ) | | | (255,388 | ) | | | (95,748 | ) |
Markit iTraxx Europe Crossover Series 24 | | | 12/20/2020 | | | | Sell | | | | 2,850 | | | | 5.00 | % | | | 187,656 | | | | 255,388 | | | | 67,732 | |
Markit iTraxx Europe Crossover Series 25 | | | 6/20/2021 | | | | Buy | | | | 2,000 | | | | (5.00 | )% | | | (189,803 | ) | | | (169,777 | ) | | | 20,026 | |
Markit iTraxx Europe Crossover Series 25 | | | 6/20/2021 | | | | Sell | | | | 2,000 | | | | 5.00 | % | | | 161,559 | | | | 169,777 | | | | 8,218 | |
Markit iTraxx Europe Crossover Series 25 | | | 6/20/2021 | | | | Buy | | | | 1,000 | | | | (5.00 | )% | | | (82,054 | ) | | | (84,888 | ) | | | (2,834 | ) |
Markit iTraxx Europe Crossover Series 25 | | | 6/20/2021 | | | | Sell | | | | 1,000 | | | | 5.00 | % | | | 59,442 | | | | 84,888 | | | | 25,446 | |
Markit iTraxx Europe Crossover Series 25 | | | 6/20/2021 | | | | Buy | | | | 500 | | | | (5.00 | )% | | | (39,385 | ) | | | (42,444 | ) | | | (3,059 | ) |
Markit iTraxx Europe Crossover Series 25 | | | 6/20/2021 | | | | Sell | | | | 500 | | | | 5.00 | % | | | 22,088 | | | | 42,444 | | | | 20,356 | |
Markit iTraxx Europe Crossover Series 25 | | | 6/20/2021 | | | | Buy | | | | 700 | | | | (5.00 | )% | | | (48,279 | ) | | | (59,422 | ) | | | (11,143 | ) |
Markit iTraxx Europe Crossover Series 25 | | | 6/20/2021 | | | | Sell | | | | 700 | | | | 5.00 | % | | | 35,232 | | | | 59,422 | | | | 24,190 | |
Markit iTraxx Europe Crossover Series 25 | | | 6/20/2021 | | | | Buy | | | | 750 | | | | (5.00 | )% | | | (64,313 | ) | | | (63,666 | ) | | | 647 | |
Markit iTraxx Europe Crossover Series 25 | | | 6/20/2021 | | | | Sell | | | | 750 | | | | 5.00 | % | | | 62,754 | | | | 63,666 | | | | 912 | |
Markit iTraxx Europe Crossover Series 26 | | | 12/20/2021 | | | | Buy | | | | 2,500 | | | | (5.00 | )% | | | (205,074 | ) | | | (211,949 | ) | | | (6,875 | ) |
Markit iTraxx Europe Senior Financials Series 24 | | | 12/20/2020 | | | | Buy | | | | 700 | | | | (1.00 | )% | | | 777 | | | | (5,511 | ) | | | (6,288 | ) |
Markit iTraxx Europe Senior Financials Series 24 | | | 12/20/2020 | | | | Sell | | | | 700 | | | | 1.00 | % | | | 6,415 | | | | 5,511 | | | | (904 | ) |
Markit iTraxx Europe Senior Financials Series 25 | | | 6/20/2021 | | | | Buy | | | | 700 | | | | (1.00 | )% | | | (4,103 | ) | | | (3,499 | ) | | | 604 | |
Markit iTraxx Europe Senior Financials Series 25 | | | 6/20/2021 | | | | Sell | | | | 700 | | | | 1.00 | % | | | 2,170 | | | | 3,499 | | | | 1,329 | |
Markit iTraxx Europe Senior Financials Series 26 | | | 12/20/2021 | | | | Buy | | | | 700 | | | | (1.00 | )% | | | 442 | | | | (1,112 | ) | | | (1,554 | ) |
Markit CDX North American High Yield Series 26 | | | 12/20/2021 | | | | Sell | | | | $ 5,710 | | | | 5.00 | % | | | 216,033 | | | | 195,726 | | | | (20,307 | ) |
Markit CDX North American Investment Grade Series 26 | | | 12/20/2021 | | | | Sell | | | | 5,170 | | | | 1.00 | % | | | 58,913 | | | | 54,357 | | | | (4,556 | ) |
| | | | | | | | | | | | | | | | | | | $ | 14,217 | | | $ | 37,022 | | | $ | 22,805 | |
| | | | |
| 28 | | MainStay Absolute Return Multi-Strategy Fund | | The notes to the consolidated financial statements are an integral part of,
and should be read in conjunction with, the consolidated financial statements. |
As of October 31, 2016, the Fund held the following OTC credit default swap contracts:
| | | | | | | | | | | | | | | | | | | | | | | | | | | | | | | | |
Reference Entity | | Counterparty | | | Termination
Date | | | Buy/Sell
Protection2 | | | Notional
Amount
(000)3 | | | (Pay)/
Receive
Fixed
Rate4 | | | Upfront
Premiums
Received/ (Paid) | | | Value | | | Unrealized
Appreciation/
(Depreciation)5 | |
Bayer A.G.
5.625%, 5/23/18 | | | Societe Generale S.A. | | | | 6/20/2021 | | | | Buy | | | | EUR 150 | | | | (1.00 | )% | | $ | (3,592 | ) | | $ | (3,450 | ) | | $ | 142 | |
E.ON International Finance B.V.
6.375%, 5/29/17 | | | BNP Paribas S.A. | | | | 6/20/2021 | | | | Buy | | | | 125 | | | | (1.00 | )% | | | 441 | | | | (2,266 | ) | | | (2,707 | ) |
Electricite de France S.A.
5.625%, 2/21/33 | | | BNP Paribas S.A. | | | | 12/20/2021 | | | | Buy | | | | 350 | | | | (1.00 | )% | | | (3,471 | ) | | | (4,545 | ) | | | (1,074 | ) |
Fortum Oyj
6.00%, 3/20/19 | | | BNP Paribas S.A. | | | | 6/20/2021 | | | | Buy | | | | 150 | | | | (1.00 | )% | | | (850 | ) | | | (2,746 | ) | | | (1,896 | ) |
Orange S.A.
5.625%, 5/22/18 | | | BNP Paribas S.A. | | | | 6/20/2021 | | | | Buy | | | | 250 | | | | (1.00 | )% | | | (3,896 | ) | | | (6,173 | ) | | | (2,277 | ) |
Total Capital S.A.
4.875%, 1/28/19 | | | BNP Paribas S.A. | | | | 6/20/2021 | | | | Buy | | | | 200 | | | | (1.00 | )% | | | (3,661 | ) | | | (5,577 | ) | | | (1,916 | ) |
| | | | | | | | | | | | | | | | | | | | | | | $ | (15,029 | ) | | $ | (24,757 | ) | | $ | (9,728 | ) |
| 1. | As of October 31, 2016, cash in the amount of $53,314 was on deposit with a broker for centrally cleared swap agreements. |
| 2. | Buy—Fund pays premium and buys credit protection. If a credit event occurs, as defined under the terms of that particular swap agreement, the Fund will either (i) receive from the seller of protection an amount equal to the notional amount of the swap and deliver the referenced obligation or underlying securities comprising the referenced index or (ii) receive a net settlement amount in the form of cash or securities equal to the notional amount of the swap less the recovery value of the referenced obligation or underlying securities comprising the referenced index. |
| | Sell—Fund receives premium and sells credit protection. If a credit event occurs, as defined under the terms of that particular swap agreement, the Fund will either (i) pay to the buyer of protection an amount equal to the notional amount of the swap and take delivery of the referenced obligation or underlying securities comprising the referenced index or (ii) pay a net settlement amount in the form of cash or securities equal to the notional amount of the swap less the recovery value of the referenced obligation or underlying securities comprising the referenced index. |
| 3. | The maximum potential amount the Fund could be required to pay as a seller of credit protection or receive as a buyer of credit protection if a credit event occurs as defined under the terms of that particular swap contract. |
| 4. | The annual fixed rate represents the interest received by the Fund (as a seller of protection) or paid by the Fund (as a buyer of protection) annually on the notional amount of the credit default swap contract. |
| 5. | Represents the difference between the value of the credit default swap contracts at the time they were opened and the value at October 31, 2016. |
Total Return Swap Contracts
Open OTC total return equity swap contracts as of October 31, 2016 were as follows1:
| | | | | | | | | | | | | | | | |
Swap Counterparty | | Reference Obligation | | Rate(s) (Paid)/Received by the Fund | | Termination
Date(s) | | | Notional
Amount
Long/(Short)
(000)* | | | Unrealized
Appreciation | |
| | | | | | | | | | | | | | | | |
UBS AG | | Abbott Laboratories | | Overnight Bank Funding Rate minus 0.40% | | | 3/1/2025 | | | $ | (114 | ) | | $ | 6,632 | |
Citibank N.A. | | Alibaba Group Holding, Ltd. | | 1 Month LIBOR BBA minus 0.35% | | | 3/1/2025 | | | | (115 | ) | | | 4,181 | |
UBS AG | | AstraZeneca PLC | | 1 Month LIBOR BBA minus 0.40% | | | 3/1/2025 | | | | (41 | ) | | | 4,907 | |
UBS AG | | Buzzi Unicem S.p.A. | | 1 Month LIBOR BBA minus 0.45% | | | 3/1/2025 | | | | (66 | ) | | | 1,511 | |
Morgan Stanley Capital Services LLC | | Cairo Communication S.p.A. | | Euro OverNight Index Average plus 0.55% | | | 3/1/2025 | | | | 189 | | | | 21,143 | |
UBS AG | | Cepheid, Inc. | | 1 Month LIBOR BBA plus 0.35% | | | 3/1/2025 | | | | 103 | | | | 546 | |
UBS AG | | Danieli & C Officine Meccaniche S.p.A. | | 1 Month LIBOR BBA minus 0.45% | | | 3/1/2025 | | | | (35 | ) | | | 558 | |
Citibank N.A. | | Henkel AG & Co. KGaA | | 1 Month LIBOR BBA minus 0.40% | | | 3/1/2025 | | | | (147 | ) | | | 5,365 | |
Citibank N.A. | | iShares Nasdaq Biotechnology ETF | | 1 Month LIBOR BBA minus 1.40% | | | 3/1/2025 | | | | (46 | ) | | | 5,831 | |
Morgan Stanley Capital Services LLC | | J Sainsbury PLC | | Sterling OverNight Index Average plus 0.55% | | | 3/1/2025 | | | | 99 | | | | 2,803 | |
| | | | | | |
The notes to the consolidated financial statements are an integral part of,
and should be read in conjunction with, the consolidated financial statements. | | | | | 29 | |
Consolidated Portfolio of Investments October 31, 2016 (Unaudited) (continued)
| | | | | | | | | | | | | | | | |
Swap Counterparty | | Reference Obligation | | Rate(s) (Paid)/Received by the Fund | | Termination
Date(s) | | | Notional
Amount
Long/(Short)
(000)* | | | Unrealized
Appreciation | |
UBS AG | | Marriott International, Inc. | | 1 Month LIBOR BBA plus 0.35% | | | 3/1/2025 | | | $ | 332 | | | $ | 6,150 | |
UBS AG | | Merck KGaA | | 1 Month LIBOR BBA minus 0.45% | | | 3/1/2025 | | | | (55 | ) | | | 1,438 | |
Morgan Stanley Capital Services LLC | | Reynolds American, Inc. | | US Federal Funds Rate plus 0.45% | | | 3/1/2025 | | | | 88 | | | | 375 | |
UBS AG | | Staples, Inc. | | Overnight Bank Funding Rate minus 0.40% | | | 3/1/2025 | | | | (37 | ) | | | 5,272 | |
Citibank N.A. | | Swatch Group A.G. | | 1 Month LIBOR BBA plus 0.40% | | | 3/1/2025 | | | | 75 | | | | 4,511 | |
UBS AG | | Telecom Italia S.p.A. | | 1 Month LIBOR BBA plus 0.40% | | | 3/1/2025 | | | | 18 | | | | 1,346 | |
UBS AG | | Vinci S.A. | | 1 Month LIBOR BBA minus 0.45% | | | 3/1/2025 | | | | (47 | ) | | | 1,626 | |
| | | | | | | | | | | $ | 201 | | | $ | 74,195 | |
| | | | | | | | | | | | | | | | |
Swap Counterparty | | Reference Obligation | | Rate(s) (Paid)/Received by the Fund | | Termination
Date(s) | | | Notional
Amount
Long/(Short)
(000)* | | | Unrealized
Depreciation | |
Morgan Stanley Capital Services LLC | | Carmike Cinemas, Inc. | | US Federal Funds Rate plus 0.45% | | | 3/1/2025 | | | $ | 170 | | | $ | (2,140 | ) |
Citibank N.A. | | CNH Industrial N.V. | | 1 Month LIBOR BBA minus 0.40% | | | 3/1/2025 | | | | (16 | ) | | | (1,644 | ) |
Morgan Stanley Capital Services LLC | | Coty, Inc. | | US Federal Funds Rate plus 0.45% | | | 3/1/2025 | | | | 25 | | | | (874 | ) |
Morgan Stanley Capital Services LLC | | Depomed, Inc. | | US Federal Funds Rate plus 0.45% | | | 3/1/2025 | | | | 158 | | | | (25,526 | ) |
UBS AG | | Entertainment One, Ltd. | | 1 Month LIBOR BBA plus 0.40% | | | 3/1/2025 | | | | 83 | | | | (303 | ) |
Citibank N.A. | | Ferrari N.V. | | 1 Month LIBOR BBA minus 0.40% | | | 3/1/2025 | | | | (9 | ) | | | (310 | ) |
Citibank N.A. | | Fiat Chrysler Automobiles N.V. | | 1 Month LIBOR BBA minus 0.40% | | | 3/1/2025 | | | | (51 | ) | | | (10,972 | ) |
UBS AG | | FMC Technologies, Inc. | | Overnight Bank Funding Rate minus 0.40% | | | 3/1/2025 | | | | (113 | ) | | | (7,563 | ) |
UBS AG | | Gamesa Corp Tecnologica S.A. | | 1 Month LIBOR BBA plus 0.40% | | | 3/1/2025 | | | | 181 | | | | (2,730 | ) |
Morgan Stanley Capital Services LLC | | Groupe Fnac S.A. | | Euro OverNight Index Average plus 0.55% | | | 3/1/2025 | | | | 282 | | | | (16,282 | ) |
Morgan Stanley Capital Services LLC | | Haldex AB | | 1 Month LIBOR BBA plus 0.45% | | | 3/1/2025 | | | | 630 | | | | (2,078 | ) |
UBS AG | | Lagardere S.C.A. | | 1 Month LIBOR BBA minus 0.45% | | | 3/1/2025 | | | | (85 | ) | | | (2,328 | ) |
UBS AG | | London Stock Exchange Group PLC | | 1 Month LIBOR BBA plus 0.40% | | | 3/1/2025 | | | | 73 | | | | (2,211 | ) |
UBS AG | | Orange S.A. | | 1 Month LIBOR BBA minus 0.45% | | | 3/1/2025 | | | | (85 | ) | | | (3,534 | ) |
Morgan Stanley Capital Services LLC | | Shire PLC | | Sterling OverNight Index Average plus 0.55% | | | 3/1/2025 | | | | 115 | | | | (15,094 | ) |
UBS AG | | St Jude Medical, Inc. | | 1 Month LIBOR BBA plus 0.35% | | | 3/1/2025 | | | | 260 | | | | (10,647 | ) |
Citibank N.A. | | Swatch Group A.G. | | 1 Month LIBOR BBA minus 0.40% | | | 3/1/2025 | | | | (77 | ) | | | (6,597 | ) |
UBS AG | | Telecom Italia S.p.A. | | 1 Month LIBOR BBA minus 1.00% | | | 3/1/2025 | | | | (14 | ) | | | (1,150 | ) |
Morgan Stanley Capital Services LLC | | Twitter, Inc. | | US Federal Funds Rate plus 0.45% | | | 3/1/2025 | | | | 39 | | | | (18,163 | ) |
Morgan Stanley Capital Services LLC | | Ubisoft Entertainment S.A. | | Euro OverNight Index Average plus 0.55% | | | 3/1/2025 | | | | 184 | | | | (24,876 | ) |
| | | | | | | | | | | $ | 1,750 | | | $ | (155,022 | ) |
| | | | |
| 30 | | MainStay Absolute Return Multi-Strategy Fund | | The notes to the consolidated financial statements are an integral part of,
and should be read in conjunction with, the consolidated financial statements. |
Open OTC total return basket swap contracts as of October 31, 2016 were as follows:
| | | | | | | | | | | | | | | | |
Swap Counterparty | | Reference Obligation | | Rate (Paid)/Received by the Fund | | Termination
Date | | | Notional
Amount
(000)* | | | Unrealized
Appreciation /
(Depreciation) | |
Credit Suisse | | Credit Suisse Backwardation Long/Short Excess Return Index** | | 0.60% | | | 5/31/2017 | | | $ | 1,827 | | | $ | (1 | ) |
Credit Suisse | | Credit Suisse Custom 24A Excess Return Index** | | 1.50% | | | 5/31/2017 | | | | 2,299 | | | | (16 | ) |
Credit Suisse | | Credit Suisse Custom 88 Enhanced Excess Return Index** | | 0.60% | | | 5/31/2017 | | | | 2,990 | | | | 499 | |
Credit Suisse | | Credit Suisse Dividend Alpha ER Index | | 0.25% | | | 5/31/2017 | | | | 1,886 | | | | 385 | |
Credit Suisse | | Credit Suisse GAINS 01E Long/Short Excess Return Index** | | 1.25% | | | 5/31/2017 | | | | 1,820 | | | | 13 | |
JPMorgan Chase Bank | | JPMorgan JMAB125E Index | | 0.00% | | | 10/31/2017 | | | | 1,325 | | | | — | |
Societe Generale | | SGI BOSS 3% Index | | 0.60% | | | 6/5/2017 | | | | 2,609 | | | | (5 | ) |
Societe Generale | | SGI Smart Market Neutral Commodity 2 Index** | | 0.60% | | | 6/5/2017 | | | | 2,637 | | | | — | |
Societe Generale | | SGI US Gravity Index | | 0.60% | | | 6/5/2017 | | | | 1,031 | | | | (5 | ) |
Societe Generale | | SGI NYLIM Custom US Sector Reversal Index | | 0.00% | | | 6/5/2017 | | | | 2,327 | | | | — | |
| | | | | | | | | | | $ | 20,751 | | | $ | 870 | |
Open OTC Candriam proprietary total return swap contracts as of October 31, 2016 were as follows:
| | | | | | | | |
Swap Counterparty | | Reference Obligation | | Description | | Unrealized
Appreciation /
(Depreciation) | |
Societe Generale Newedge UK Limited | | Candriam IG Diversified Futures Index** | | Total return swap with Societe Generale Newedge UK Limited (“SG Newedge UK”). The swap provides exposure to the total returns of the Candriam Alternative Return Systemat program, calculated on a daily basis with a reference to a managed account owned by SG Newedge UK, a company formed under the laws of England. (Notional Amount $23,373,043)*** | | $ | (241,151 | ) |
Societe Generale Newedge UK Limited | | Candriam Global Alpha Index | | Total return swap with SG Newedge UK. The swap provides exposure to the returns of the exchange-traded derivatives and OTC foreign exchange forwards for the Candriam Global Alpha strategy, calculated on a daily basis with a reference to a managed account owned by SG Newedge UK, a company formed under the laws of England. (Notional Amount $7,571,020)**** | | | (16,362 | ) |
Societe Generale Newedge UK Limited | | Candriam Global Opportunities Index | | Total return swap with SG Newedge UK. The swap provides exposure to the returns of the exchange-traded derivatives and OTC foreign exchange forwards for the Candriam Global Opportunities strategy, calculated on a daily basis with a reference to a managed account owned by SG Newedge UK, a company formed under the laws of England. (Notional Amount $7,333,048)**** | | | (21,768 | ) |
| | | | | | | $ | (279,281 | ) |
The summaries below provide a breakdown of the derivative contracts comprising the index components of the above Candriam proprietary total return swaps as of October 31, 2016:
Candriam IG Diversified Futures Index
| | | | | | |
Description | | Sector | | Notional
Amount
(000)* | |
3-Month Sterling Mar19 | | Financials | | $ | (1,888 | ) |
Aluminum LME Dec16 | | Metals | | | (95,386 | ) |
Aluminum LME Dec16 | | Metals | | | 110,901 | |
Australian Dollar CME Dec16 | | Foreign Currency | | | 11,008 | |
Brent Crude Jan17 | | Energy | | | (3,403 | ) |
British Pound CME Dec16 | | Foreign Currency | | | (12,867 | ) |
| | | | | | |
The notes to the consolidated financial statements are an integral part of,
and should be read in conjunction with, the consolidated financial statements. | | | | | 31 | |
Consolidated Portfolio of Investments October 31, 2016 (Unaudited) (continued)
| | | | | | |
Description | | Sector | | Notional
Amount
(000)* | |
CAC Index Nov16 | | Equity Index | | $ | 4,353 | |
Canadian Dollar CME Dec16 | | Foreign Currency | | | (16,023 | ) |
CFE VIX Nov16 | | Equity Index | | | (2,911 | ) |
Corn Dec16 | | Agricultural | | | 3,601 | |
Cotton Dec16 | | Agricultural | | | 6,404 | |
Crude Oil Dec16 | | Energy | | | 5,623 | |
DAX Index Dec16 | | Equity Index | | | 3,809 | |
E-mini Nasdaq Dec16 | | Equity Index | | | 13,047 | |
E-mini Russell Dec16 | | Equity Index | | | 1,549 | |
E-mini S&P Dec16 | | Equity Index | | | 22,896 | |
EUR/USD CME Dec16 | | Foreign Currency | | | (25,819 | ) |
Euro BTP Futures Dec16 | | Financials | | | (357 | ) |
Euro Bund Dec16 | | Financials | | | (329 | ) |
Euro Bund Dec16 | | Financials | | | (27,439 | ) |
Euro Dollars Jun19 | | Foreign Currency | | | (4,050 | ) |
Euro Oat Futures Dec16 | | Agricultural | | | (331 | ) |
Euro Stoxx50 Dec16 | | Equity Index | | | 2,044 | |
FTSE Index Dec16 | | Equity Index | | | 12,722 | |
Gasoline Blendstock Dec16 | | Energy | | | (1,908 | ) |
Gold CMX Dec16 | | Metals | | | 12,986 | |
Hang Seng Index Nov16 | | Equity Index | | | 4,578 | |
High Grade Copper Dec16 | | Metals | | | 10,584 | |
Japan Govt Bond Tiffe Dec16 | | Financials | | | (2,098 | ) |
Japanese Yen CME Dec16 | | Foreign Currency | | | 7,398 | |
Live Cattle Dec16 | | Agricultural | | | (10,209 | ) |
Mexican Peso CME Dec16 | | Foreign Currency | | | (13,763 | ) |
Mini Dow Dec16 | | Equity Index | | | 9,302 | |
Natural Gas Dec16 | | Energy | | | (10,137 | ) |
New Zealand Dollar CME Dec16 | | Foreign Currency | | | 12,485 | |
Nikkei Index Dec16 | | Equity Index | | | (6,731 | ) |
SFE SPI 200 Dec16 | | Equity Index | | | 2,716 | |
Silver Dec16 | | Metals | | | 8,008 | |
South African Rand CME Dec16 | | Foreign Currency | | | 6,865 | |
Soybeans Jan17 | | Agricultural | | | 8,549 | |
Sugar Mar17 | | Agricultural | | | 5,073 | |
Topix Index Dec16 | | Equity Index | | | 4,124 | |
U.S. 5 Year Note Dec16 | | Financials | | | (482 | ) |
U.S. 10 Year Notes Dec16 | | Financials | | | (347 | ) |
U.S. Treasury Bond Dec16 | | Financials | | | (187 | ) |
Wheat Dec16 | | Agricultural | | | (6,306 | ) |
Zinc LME Dec16 | | Metals | | | (27,530 | ) |
Zinc LME Dec16 | | Metals | | | 46,518 | |
| | | | |
| 32 | | MainStay Absolute Return Multi-Strategy Fund | | The notes to the consolidated financial statements are an integral part of,
and should be read in conjunction with, the consolidated financial statements. |
Candriam Global Alpha Index
| | | | | | |
Description | | Sector | | Notional
Amount
(000)* | |
2 Year Midcurve Dec16 | | Financials | | $ | 0 | ‡ |
2 Year Midcurve Mar17 | | Financials | | | (1 | ) |
2 Year Midcurve Mar17 | | Financials | | | 0 | ‡ |
Australian Dollar CME Dec16 | | Foreign Currency | | | (24 | ) |
Australian Dollar CME Dec16 | | Foreign Currency | | | (29 | ) |
British Pound CME Dec16 | | Foreign Currency | | | (6 | ) |
British Pound CME Dec16 | | Foreign Currency | | | (5 | ) |
British Pound CME Dec16 | | Foreign Currency | | | (186 | ) |
British Pound CME Dec16 | | Foreign Currency | | | (306 | ) |
British Pound CME Mar17 | | Foreign Currency | | | (52 | ) |
British Pound CME Mar17 | | Foreign Currency | | | (70 | ) |
Canadian Dollar CME Dec16 | | Foreign Currency | | | 1,416 | |
CFE VIX Nov16 | | Equity Index | | | 2,394 | |
DAX Index Dec16 | | Equity Index | | | (102 | ) |
E-mini S&P Dec16 | | Equity Index | | | (1,802 | ) |
EUR/USD CME Dec16 | | Foreign Currency | | | 4,532 | |
EUR/USD CME Dec16 | | Foreign Currency | | | (57 | ) |
EUR/USD CME Dec16 | | Foreign Currency | | | 60 | |
Euro Bobl Dec16 | | Financials | | | (22 | ) |
Euro Bobl Dec16 | | Financials | | | 0 | ‡ |
Euro Bobl Jan17 | | Financials | | | (1 | ) |
Euro Bobl Jan17 | | Financials | | | (1 | ) |
Euro Bund Dec16 | | Financials | | | (53 | ) |
Euro Bund Dec16 | | Financials | | | 0 | ‡ |
Euro STOXX 50 Dec16 | | Equity Index | | | 380 | |
Euro STOXX 50 Dec16 | | Equity Index | | | 194 | |
Euro STOXX 50 Dec16 | | Equity Index | | | (51 | ) |
Euro STOXX 50 Dec16 | | Equity Index | | | (2,178 | ) |
Euro STOXX 50 Nov16 | | Equity Index | | | (41 | ) |
Euro STOXX 50 Nov16 | | Equity Index | | | (61 | ) |
Euro STOXX Banks Dec16 | | Equity Index | | | (3 | ) |
Euro STOXX Banks Dec16 | | Equity Index | | | (54 | ) |
Euro STOXX Banks Jan17 | | Equity Index | | | (82 | ) |
FTSE MIB Index Nov16 | | Equity Index | | | (81 | ) |
Japanese Yen CME Dec16 | | Foreign Currency | | | (2,625 | ) |
Japanese Yen CME Dec16 | | Foreign Currency | | | (22 | ) |
Japanese Yen CME Dec16 | | Foreign Currency | | | (22 | ) |
Japanese Yen CME Nov16 | | Foreign Currency | | | (1 | ) |
Japanese Yen CME Nov16 | | Foreign Currency | | | (1 | ) |
Mexican Peso CME Dec16 | | Foreign Currency | | | 1,553 | |
OMX Stockholm 30 Index Nov16 | | Equity Index | | | (66 | ) |
OMX Stockholm 30 Index Nov16 | | Equity Index | | | (21 | ) |
| | | | | | |
The notes to the consolidated financial statements are an integral part of,
and should be read in conjunction with, the consolidated financial statements. | | | | | 33 | |
Consolidated Portfolio of Investments October 31, 2016 (Unaudited) (continued)
| | | | | | |
Description | | Sector | | Notional
Amount
(000)* | |
Russell 2000 Dec16 | | Equity Index | | $ | (271 | ) |
S&P 500 Index Nov16 | | Equity Index | | | 59 | |
S&P 500 Index Nov16 | | Equity Index | | | (21 | ) |
South African Rand CME Dec16 | | Foreign Currency | | | (2,056 | ) |
STOXX Europe 600 Banks Dec16 | | Equity Index | | | (54 | ) |
STOXX Europe 600 Banks Dec16 | | Equity Index | | | (114 | ) |
STOXX Europe 600 Dec16 | | Equity Index | | | (87 | ) |
STOXX Europe 600 Dec16 | | Equity Index | | | (52 | ) |
STOXX Europe 600 Dec16 | | Equity Index | | | 72 | |
STOXX Europe 600 Dec16 | | Equity Index | | | 2,424 | |
STOXX Europe 600 Dec16 | | Equity Index | | | (183 | ) |
STOXX Europe 600 Health Care Dec16 | | Equity Index | | | 71 | |
STOXX Europe 600 Health Care Dec16 | | Equity Index | | | (24 | ) |
U.S. 5 Year Note Dec16 | | Financials | | | (16 | ) |
U.S. 5 Year Note Jan17 | | Financials | | | (1 | ) |
U.S. 5 Year Note Jan17 | | Financials | | | 0 | ‡ |
U.S. 10 Year Notes Dec16 | | Financials | | | 64 | |
VSTOXX Dec16 | | Equity Index | | | 126 | |
VSTOXX Dec16 | | Equity Index | | | (96 | ) |
VSTOXX Jan17 | | Equity Index | | | 161 | |
VSTOXX Jan17 | | Equity Index | | | (81 | ) |
Candriam Global Opportunities Index
| | | | | | |
Description | | Sector | | Notional
Amount
(000)* | |
2 Year Midcurve Dec16 | | Financials | | $ | (23 | ) |
2 Year Midcurve Dec16 | | Financials | | | 4 | |
2 Year Midcurve Dec16 | | Financials | | | 0 | ‡ |
2 Year Midcurve Dec16 | | Financials | | | (52 | ) |
2 Year Midcurve Nov16 | | Financials | | | 0 | ‡ |
2 Year Midcurve Nov16 | | Financials | | | (1 | ) |
British Pound CME Dec16 | | Foreign Currency | | | 1,991 | |
E-mini Nasdaq Dec16 | | Equity Index | | | 2,878 | |
E-mini Russell Dec16 | | Equity Index | | | (5,003 | ) |
E-mini S&P Dec16 | | Equity Index | | | (2,862 | ) |
EUR/USD CME Dec16 | | Foreign Currency | | | (1,283 | ) |
Euro STOXX 50 Dec16 | | Equity Index | | | 86 | |
Euro STOXX 50 Dec16 | | Equity Index | | | (9 | ) |
Euro STOXX 50 Dec16 | | Equity Index | | | 4,726 | |
Euro STOXX Banks Dec16 | | Equity Index | | | 2,237 | |
Euro STOXX Banks Dec16 | | Equity Index | | | 59 | |
Euro STOXX Banks Dec16 | | Equity Index | | | (6 | ) |
Euro STOXX Banks Dec16 | | Equity Index | | | (3 | ) |
IBEX 35 Index Dec16 | | Equity Index | | | 119 | |
| | | | |
| 34 | | MainStay Absolute Return Multi-Strategy Fund | | The notes to the consolidated financial statements are an integral part of,
and should be read in conjunction with, the consolidated financial statements. |
| | | | | | |
Description | | Sector | | Notional
Amount
(000)* | |
IBEX 35 Index Dec16 | | Equity Index | | $ | (58 | ) |
IBEX 35 Index Dec16 | | Equity Index | | | (9 | ) |
IBEX 35 Index Nov16 | | Equity Index | | | 1,202 | |
Japanese Yen CME Dec16 | | Foreign Currency | | | (13,125 | ) |
Japanese Yen CME Nov16 | | Foreign Currency | | | (115 | ) |
Nikkei Index Dec16 | | Equity Index | | | 3,235 | |
South African Rand CME Dec16 | | Foreign Currency | | | (955 | ) |
Topix Index Dec16 | | Equity Index | | | 1,596 | |
U.S. 5 Year Notes Dec16 | | Financials | | | (126 | ) |
U.S. 5 Year Notes Dec16 | | Financials | | | 0 | ‡ |
U.S. 10 Year Notes Dec16 | | Financials | | | (445 | ) |
U.S. 10 Year Notes Dec16 | | Financials | | | (3 | ) |
| 1. | As of October 31, 2016, cash in the amount of $500,071 was on deposit with brokers for total return equity swap contracts. |
| * | Notional amounts reflected as a positive value indicate a long position held by the Fund or Index and a negative value indicates a short position. |
| ** | The total return swap is held in the MainStay Multi-Strategy Cayman Fund Ltd., which is a wholly-owned subsidiary of the MainStay Absolute Return Multi-Strategy Fund. |
| *** | The investment portfolio of the managed account is comprised at any given time of trading positions selected by Candriam France S.A.S. that include exchange traded futures in relation to any commodity, currency, interest rate, bond or equity index traded on certain exchanges. Under the terms of the swap, the advisor has the ability to periodically adjust the notional level of the swap. The swap was effective on June 24, 2015 and has an open ended term unless terminated by one of the parties. In addition, the terms of the swap provide for a payment to the SG Newedge UK based upon 0.4% per annum accrued on the full notional level of the swap, plus a floating rate (based on LIBOR and Fed Funds) accrued on 15% of the notional of the swap. |
| **** | The investment portfolio of the managed account is comprised at any given time of trading positions selected by Candriam France S.A.S. that include exchange traded derivatives and over the counter derivatives. Under the terms of the swap, the advisor has the ability to periodically adjust the notional level of the swap. The swap was effective on February 26, 2016 and has an open ended term unless terminated by one of the parties. In addition, the terms of the swap provide for a payment to the SG Newedge UK based upon 0.4% per annum accrued on the full notional level of the swap, plus a floating rate (based on LIBOR and Fed Funds) accrued on 15% of the notional of the swap. |
| ‡ | Amount represents less than $500. |
The following abbreviations are used in the preceding pages:
BAM—Build America Mutual Assurance Co.
BTP—Buoni del Tesoro Poliennali (Eurex Exchange index)
CAC—Cotation Assiste´e en Continu (French stock market index)
CAD—Canadian Dollar
CFE—CBOE Futures Exchange
CHF—Swiss Franc
CME—Chicago Mercantile Exchange
DAX—Deutscher Aktienindex Index (German stock market index)
ETF—Exchange-Traded Fund
EUR—Euro
FTSE—Financial Times Stock Exchange
GBP—British Pound Sterling
IBEX—Spanish Exchange Index
LIBOR—London Interbank Offered Rate
LME—London Metal Exchange
MIB—Milano Italia Borsa (Italian national stock exchange)
SEK—Swedish Krona
SFE SPI—Sydney Futures Exchange Share Price Index
SPDR—Standard & Poor’s Depositary Receipt
VIX—CBOE Volatility Index
| | | | | | |
The notes to the consolidated financial statements are an integral part of,
and should be read in conjunction with, the consolidated financial statements. | | | | | 35 | |
Consolidated Portfolio of Investments October 31, 2016 (Unaudited) (continued)
The following is a summary of the fair valuations according to the inputs used as of October 31, 2016, for valuing the Fund’s assets and liabilities.
Asset Valuation Inputs
| | | | | | | | | | | | | | | | |
Description | | Quoted
Prices in
Active
Markets for
Identical
Assets (Level 1) | | | Significant
Other
Observable
Inputs (Level 2) | | | Significant
Unobservable
Inputs (Level 3) | | | Total | |
| Investments in Securities (a) | | | | | | | | | | | | | | | | |
| Long-Term Bonds | | | | | | | | | | | | | | | | |
Corporate Bonds | | $ | — | | | $ | 11,588,625 | | | $ | — | | | $ | 11,588,625 | |
Foreign Bonds | | | — | | | | 8,477,380 | | | | — | | | | 8,477,380 | |
U.S. Government | | | — | | | | 2,555,263 | | | | — | | | | 2,555,263 | |
| | | | | | | | | | | | | | | | |
| Total Long-Term Bonds | | | — | | | | 22,621,268 | | | | — | | | | 22,621,268 | |
| | | | | | | | | | | | | | | | |
| Common Stocks | | | 36,692,341 | | | | — | | | | — | | | | 36,692,341 | |
| Rights (b) | | | — | | | | — | | | | 0 | | | | 0 | |
| Purchased Options | | | 15,149 | | | | — | | | | — | | | | 15,149 | |
| Short-Term Investments | | | | | | | | | | | | | | | | |
Repurchase Agreements | | | — | | | | 64,344,284 | | | | — | | | | 64,344,284 | |
U.S. Government | | | — | | | | 18,123,863 | | | | — | | | | 18,123,863 | |
| | | | | | | | | | | | | | | | |
| Total Short-Term Investments | | | — | | | | 82,468,147 | | | | — | | | | 82,468,147 | |
| | | | | | | | | | | | | | | | |
| Total Investments in Securities | | | 36,707,490 | | | | 105,089,415 | | | | 0 | | | | 141,796,905 | |
| | | | | | | | | | | | | | | | |
| Other Financial Instruments | | | | | | | | | | | | | | | | |
Credit Default Swap Contracts (c) | | | — | | | | 221,612 | | | | — | | | | 221,612 | |
Foreign Currency Forward Contracts (c) | | | — | | | | 150,667 | | | | — | | | | 150,667 | |
Futures Contracts Short (c) | | | 9,582 | | | | — | | | | — | | | | 9,582 | |
Interest Rate Swap Contracts (c) | | | — | | | | 116,157 | | | | — | | | | 116,157 | |
Total Return Basket Swap Contracts (c) | | | — | | | | 897 | | | | — | | | | 897 | |
Total Return Equity Swap Contracts (c) | | | — | | | | 74,195 | | | | — | | | | 74,195 | |
| | | | | | | | | | | | | | | | |
| Total Other Financial Instruments | | | 9,582 | | | | 563,528 | | | | — | | | | 573,110 | |
| | | | | | | | | | | | | | | | |
| Total Investments in Securities and Other Financial Instruments | | $ | 36,717,072 | | | $ | 105,652,943 | | | $ | 0 | | | $ | 142,370,015 | |
| | | | | | | | | | | | | | | | |
Liability Valuation Inputs
| | | | | | | | | | | | | | | | |
Description | | Quoted
Prices in
Active
Markets for
Identical
Assets (Level 1) | | | Significant
Other
Observable
Inputs (Level 2) | | | Significant
Unobservable
Inputs (Level 3) | | | Total | |
| Investments in Securities Sold Short (a) | | | | | | | | | | | | | | | | |
Common Stocks Sold Short | | $ | (23,804,567 | ) | | $ | — | | | $ | — | | | $ | (23,804,567 | ) |
Exchange-Traded Funds Sold Short | | | (3,366,636 | ) | | | — | | | | — | | | | (3,366,636 | ) |
Rights Sold Short | | | (1,452 | ) | | | — | | | | — | | | | (1,452 | ) |
| | | | | | | | | | | | | | | | |
| Total Investments in Securities Sold Short | | | (27,172,655 | ) | | | — | | | | — | | | | (27,172,655 | ) |
| | | | | | | | | | | | | | | | |
| Other Financial Instruments | | | | | | | | | | | | | | | | |
Candriam Proprietary Total Return Swap Contracts (c) | | | — | | | | (279,281 | ) | | | — | | | | (279,281 | ) |
Credit Default Swap Contracts (c) | | | — | | | | (208,535 | ) | | | — | | | | (208,535 | ) |
Foreign Currency Forward Contracts (c) | | | — | | | | (104,913 | ) | | | — | | | | (104,913 | ) |
Total Return Basket Swap Contracts (c) | | | — | | | | (27 | ) | | | — | | | | (27 | ) |
Total Return Equity Swap Contracts (c) | | | — | | | | (155,022 | ) | | | — | | | | (155,022 | ) |
Written Options | | | (3,074 | ) | | | — | | | | — | | | | (3,074 | ) |
| | | | | | | | | | | | | | | | |
| Total Other Financial Instruments | | | (3,074 | ) | | | (747,778 | ) | | | — | | | | (750,852 | ) |
| | | | | | | | | | | | | | | | |
| Total Investments in Securities Sold Short and Other Financial Instruments | | $ | (27,175,729 | ) | | $ | (747,778 | ) | | $ | — | | | $ | (27,923,507 | ) |
| | | | | | | | | | | | | | | | |
| (a) | For a complete listing of investments and their industries, see the Portfolio of Investments. |
| (b) | The Level 3 security valued at $0 is held in Finance—Other Services within the Rights section of the Consolidated Portfolio of Investments. |
| (c) | The value listed for these securities reflects unrealized appreciation (depreciation) as shown on the Portfolio of Investments. |
The Fund recognizes transfers between the levels as of the beginning of the period.
For the period ended October 31, 2016, the Fund did not have any transfers between Level 1 and Level 2 fair value measurements. (See Note 2)
| | | | |
| 36 | | MainStay Absolute Return Multi-Strategy Fund | | The notes to the consolidated financial statements are an integral part of,
and should be read in conjunction with, the consolidated financial statements. |
Consolidated Statement of Assets and Liabilities as of October 31, 2016 (Unaudited)
| | | | |
| Assets | |
Investment in securities before investments sold short, at value (identified cost $76,728,758) | | $ | 77,452,621 | |
Repurchase agreements, at value (identified cost $64,344,284) | | | 64,344,284 | |
Cash collateral on deposit at broker | | | 15,416,963 | |
Cash denominated in foreign currencies (identified cost $505,828) | | | 510,720 | |
Cash | | | 17,594 | |
Receivables: | | | | |
Investment securities sold | | | 499,147 | |
Dividends and interest | | | 354,063 | |
Variation margin on futures contracts | | | 210,270 | |
Fund shares sold | | | 62,736 | |
Other assets | | | 22,919 | |
Unrealized appreciation on OTC swap contracts | | | 75,234 | |
Unrealized appreciation on foreign currency forward contracts | | | 150,667 | |
Variation margin on centrally cleared swaps | | | 598,924 | |
| | | | |
Total assets | | | 159,716,142 | |
| | | | |
| |
| Liabilities | | | | |
Investments sold short (proceeds $27,597,739) | | | 27,172,655 | |
Written options, at value (premiums received $2,839) | | | 3,074 | |
Payables: | | | | |
Investment securities purchased | | | 850,085 | |
Professional fees | | | 85,796 | |
Custodian | | | 72,950 | |
Broker fees and charges on short sales | | | 55,780 | |
Manager (See Note 3) | | | 51,558 | |
Fund shares redeemed | | | 26,338 | |
Dividends on investments sold short | | | 22,446 | |
Premiums received for OTC swap contracts | | | 15,029 | |
Shareholder communication | | | 9,279 | |
Transfer agent (See Note 3) | | | 7,239 | |
NYLIFE Distributors (See Note 3) | | | 1,764 | |
Trustees | | | 79 | |
Accrued expenses | | | 4,952 | |
Interest expense and fees payable | | | 42 | |
Unrealized depreciation on OTC swap contracts | | | 444,200 | |
Unrealized depreciation on foreign currency forward contracts | | | 104,913 | |
| | | | |
Total liabilities | | | 28,928,179 | |
| | | | |
Net assets | | $ | 130,787,963 | |
| | | | |
| | | | |
| Composition of Net Assets | | | | |
Shares of beneficial interest outstanding (par value of $.001 per share) unlimited number of shares authorized | | $ | 13,069 | |
Additional paid-in capital | | | 132,267,091 | |
| | | | |
| | | 132,280,160 | |
Net investment income (loss) | | | (1,407,675 | ) |
Accumulated net realized gain (loss) on investments, investments sold short, futures transactions, written options, swap transactions and foreign currency transactions | | | (1,059,584 | ) |
Net unrealized appreciation (depreciation) on investments, swap contracts, futures contracts and written options | | | 503,206 | |
Net unrealized appreciation (depreciation) on investments sold short | | | 425,084 | |
Net unrealized appreciation (depreciation) on translation of other assets and liabilities in foreign currencies and foreign currency forward contracts | | | 46,772 | |
| | | | |
Net assets | | $ | 130,787,963 | |
| | | | |
Class A | | | | |
Net assets applicable to outstanding shares | | $ | 4,436,421 | |
| | | | |
Shares of beneficial interest outstanding | | | 444,091 | |
| | | | |
Net asset value per share outstanding | | $ | 9.99 | |
Maximum sales charge (5.50% of offering price) | | | 0.58 | |
| | | | |
Maximum offering price per share outstanding | | $ | 10.57 | |
| | | | |
Investor Class | | | | |
Net assets applicable to outstanding shares | | $ | 1,170,419 | |
| | | | |
Shares of beneficial interest outstanding | | | 117,572 | |
| | | | |
Net asset value per share outstanding | | $ | 9.96 | |
Maximum sales charge (5.50% of offering price) | | | 0.58 | |
| | | | |
Maximum offering price per share outstanding | | $ | 10.54 | |
| | | | |
Class C | | | | |
Net assets applicable to outstanding shares | | $ | 724,875 | |
| | | | |
Shares of beneficial interest outstanding | | | 73,632 | |
| | | | |
Net asset value and offering price per share outstanding | | $ | 9.84 | |
| | | | |
Class I | | | | |
Net assets applicable to outstanding shares | | $ | 124,456,248 | |
| | | | |
Shares of beneficial interest outstanding | | | 12,433,625 | |
| | | | |
Net asset value and offering price per share outstanding | | $ | 10.01 | |
| | | | |
| | | | | | |
The notes to the consolidated financial statements are an integral part of,
and should be read in conjunction with, the consolidated financial statements. | | | | | 37 | |
Consolidated Statement of Operations
for the six months ended October 31, 2016 (Unaudited)
| | | | |
| Investment Income (Loss) | |
Income | | | | |
Interest | | $ | 560,063 | |
Dividends (a) | | | 371,182 | |
| | | | |
Total income | | | 931,245 | |
| | | | |
Expenses | | | | |
Manager (See Note 3) | | | 859,976 | |
Custodian | | | 423,000 | |
Broker fees and charges on short sales | | | 318,380 | |
Dividends and interest on investments sold short | | | 214,467 | |
Professional fees | | | 98,007 | |
Registration | | | 26,691 | |
Transfer agent (See Note 3) | | | 17,675 | |
Shareholder communication | | | 14,928 | |
Distribution/Service—Class A (See Note 3) | | | 5,381 | |
Distribution/Service—Investor Class (See Note 3) | | | 1,264 | |
Distribution/Service—Class C (See Note 3) | | | 2,708 | |
Trustees | | | 1,826 | |
Interest expense | | | 1,547 | |
Miscellaneous | | | 6,174 | |
| | | | |
Total expenses before waiver/reimbursement | | | 1,992,024 | |
Expense waiver/reimbursement from Manager (See Note 3) | | | (491,677 | ) |
Reimbursement from custodian (b) | | | (1,766 | ) |
| | | | |
Net expenses | | | 1,498,581 | |
| | | | |
Net investment income (loss) | | | (567,336 | ) |
| | | | |
|
| Realized and Unrealized Gain (Loss) on Investments, Futures Contracts, Swap Contracts, Written Options and Foreign Currency Transactions | |
Net realized gain (loss) on: | | | | |
Investment transactions | | | 1,495,235 | |
Investments sold short | | | (924,708 | ) |
Futures transactions | | | (49,048 | ) |
Written option transactions | | | 3,136 | |
Swap transactions | | | 1,113,896 | |
Foreign currency transactions | | | 537,952 | |
| | | | |
Net realized gain (loss) on investments, investments sold short, futures transactions, swap transactions, written option transactions and foreign currency transactions | | | 2,176,463 | |
| | | | |
Net change in unrealized appreciation (depreciation) on: | | | | |
Investments | | | (919,055 | ) |
Investments sold short | | | 605,136 | |
Futures contracts | | | (19,182 | ) |
Swap contracts | | | (770,703 | ) |
Written option contracts | | | (235 | ) |
Translation of other assets and liabilities in foreign currencies and foreign currency forward contracts | | | 266,138 | |
| | | | |
Net change in unrealized appreciation (depreciation) on investments, investments sold short, futures contracts, swap contracts, written options and foreign currency transactions | | | (837,901 | ) |
| | | | |
Net realized and unrealized gain (loss) on investments, investments sold short, futures transactions, swap transactions, written options and foreign currency transactions | | | 1,338,562 | |
| | | | |
Net increase (decrease) in net assets resulting from operations | | $ | 771,226 | |
| | | | |
| (a) | Dividends recorded net of foreign withholdings taxes in the amount of $9,971. |
| (b) | Reimbursement from custodian represents a refund for overbilling of prior period’s custody out-of-pocket fees. |
| | | | |
| 38 | | MainStay Absolute Return Multi-Strategy Fund | | The notes to the consolidated financial statements are an integral part of,
and should be read in conjunction with, the consolidated financial statements. |
Consolidated Statement of Changes in Net Assets
for the periods ended October 31, 2016 and June 18, 2015 (inception date) through April 30, 2016
| | | | | | | | |
| | | 2016 | | | 2016 (a) | |
| Increase (Decrease) in Net Assets | |
Operations: | | | | | | | | |
Net investment income (loss) | | $ | (567,336 | ) | | $ | (693,814 | ) |
Net realized gain (loss) on investments, investments sold short, futures transactions, swap transactions, written option transactions and foreign currency transactions | | | 2,176,463 | | | | (1,577,868 | ) |
Net change in unrealized appreciation (depreciation) on investments, investments sold short, futures contracts, swap contracts, written options and foreign currency transactions | | | (837,901 | ) | | | 1,812,963 | |
| | | | |
Net increase (decrease) in net assets resulting from operations | | | 771,226 | | | | (458,719 | ) |
| | | | |
Distributions to shareholders: | | | | | | | | |
From net realized gain on investments: | | | | | | | | |
Class A | | | — | | | | (3,314 | ) |
Investor Class | | | — | | | | (162 | ) |
Class C | | | — | | | | (236 | ) |
Class I | | | — | | | | (306,293 | ) |
| | | | |
Total distributions to shareholders | | | — | | | | (310,005 | ) |
| | | | |
Capital share transactions: | | | | | | | | |
Net proceeds from sale of shares | | | 21,442,999 | | | | 176,915,339 | |
Net asset value of shares issued to shareholders in reinvestment of distributions | | | — | | | | 310,005 | |
Cost of shares redeemed | | | (1,223,700 | ) | | | (66,659,182 | ) |
| | | | |
Increase (decrease) in net assets derived from capital share transactions | | | 20,219,299 | | | | 110,566,162 | |
| | | | |
Net increase (decrease) in net assets | | | 20,990,525 | | | | 109,797,438 | |
|
| Net Assets | |
Beginning of period | | | 109,797,438 | | | | — | |
| | | | |
End of period | | $ | 130,787,963 | | | $ | 109,797,438 | |
| | | | |
Net investment loss at end of period | | $ | (1,407,675 | ) | | $ | (840,339 | ) |
| | | | |
| (a) | The inception date of the Fund was June 18, 2015. |
| | | | | | |
The notes to the consolidated financial statements are an integral part of,
and should be read in conjunction with, the consolidated financial statements. | | | | | 39 | |
Consolidated Financial Highlights selected per share data and ratios
| | | | | | | | |
| Class A | | Six months
ended
October 31,
2016* | | | June 18, 2015** through April 30, 2016 | |
Net asset value at beginning of period | | $ | 9.92 | | | $ | 10.00 | |
| | | | | | | | |
Net investment income (loss) (a) | | | (0.06 | ) | | | (0.08 | ) |
Net realized and unrealized gain (loss) on investments | | | 0.05 | | | | 0.05 | |
Net realized and unrealized gain (loss) on foreign currency transactions | | | 0.08 | | | | (0.02 | ) |
| | | | | | | | |
Total from investment operations | | | 0.07 | | | | (0.05 | ) |
| | | | | | | | |
| Less distributions: | | | | | | | | |
From net realized gain on investments | | | — | | | | (0.03 | ) |
| | | | | | | | |
Net asset value at end of period | | $ | 9.99 | | | $ | 9.92 | |
| | | | | | | | |
Total investment return (b)(c)(d) | | | 0.71 | % | | | (0.49 | %) |
| Ratios (to average net assets)/Supplemental Data: | | | | | | | | |
Net investment income (loss)†† | | | (1.15 | %) | | | (0.97 | %) |
Net expenses (excluding short sale expenses)†† | | | 1.80 | % | | | 1.80 | % |
Expenses (before waiver/reimbursement)†† | | | 3.47 | % | | | 3.64 | % |
Short sale expenses†† | | | 0.87 | % | | | 0.88 | % |
Portfolio turnover rate (e) | | | 88 | % | | | 164 | % |
Net assets at end of period (in 000’s) | | $ | 4,436 | | | $ | 3,638 | |
| (a) | Per share data based on average shares outstanding during the period. |
| (b) | Total investment return is calculated exclusive of sales charges and assumes the reinvestment of dividends and distributions. |
| (c) | Total investment return is not annualized. |
| (d) | Total investment return may reflect adjustments to conform to generally accepted accounting principals. |
| (e) | Portfolio turnover rate is not annualized. |
| | | | | | | | |
| Investor Class | | Six months
ended
October 31,
2016* | | | June 18, 2015** through April 30, 2016 | |
Net asset value at beginning of period | | $ | 9.90 | | | $ | 10.00 | |
| | | | | | | | |
Net investment income (loss) (a) | | | (0.07 | ) | | | (0.10 | ) |
Net realized and unrealized gain (loss) on investments | | | 0.05 | | | | 0.05 | |
Net realized and unrealized gain (loss) on foreign currency transactions | | | 0.08 | | | | (0.02 | ) |
| | | | | | | | |
Total from investment operations | | | 0.06 | | | | (0.07 | ) |
| | | | | | | | |
| Less distributions: | | | | | | | | |
From net realized gain on investments | | | — | | | | (0.03 | ) |
| | | | | | | | |
Net asset value at end of period | | $ | 9.96 | | | $ | 9.90 | |
| | | | | | | | |
Total investment return (b)(c)(d) | | | 0.61 | % | | | (0.69 | %) |
| Ratios (to average net assets)/Supplemental Data: | | | | | | | | |
Net investment income (loss)†† | | | (1.38 | %) | | | (1.18 | %) |
Net expenses (excluding short sale expenses)†† | | | 2.02 | % | | | 1.95 | % |
Expenses (before waiver/reimbursement)†† | | | 3.68 | % | | | 3.82 | % |
Short sale expenses†† | | | 0.86 | % | | | 0.92 | % |
Portfolio turnover rate (e) | | | 88 | % | | | 164 | % |
Net assets at end of period (in 000’s) | | $ | 1,170 | | | $ | 748 | |
| (a) | Per share data based on average shares outstanding during the period. |
| (b) | Total investment return is calculated exclusive of sales charges and assumes the reinvestment of dividends and distributions. |
| (c) | Total investment return is not annualized. |
| (d) | Total investment return may reflect adjustments to conform to generally accepted accounting principals. |
| (e) | Portfolio turnover rate is not annualized. |
| | | | |
| 40 | | MainStay Absolute Return Multi-Strategy Fund | | The notes to the consolidated financial statements are an integral part of,
and should be read in conjunction with, the consolidated financial statements. |
Consolidated Financial Highlights selected per share data and ratios
| | | | | | | | |
| Class C | | Six months
ended
October 31,
2016* | | | June 18, 2015** through April 30, 2016 | |
Net asset value at beginning of period* | | $ | 9.83 | | | $ | 10.00 | |
| | | | | | | | |
Net investment income (loss) (a) | | | (0.11 | ) | | | (0.17 | ) |
Net realized and unrealized gain (loss) on investments | | | 0.05 | | | | 0.05 | |
Net realized and unrealized gain (loss) on foreign currency transactions | | | 0.07 | | | | (0.02 | ) |
| | | | | | | | |
Total from investment operations | | | 0.01 | | | | (0.14 | ) |
| | | | | | | | |
| Less distributions: | | | | | | | | |
From net realized gain on investments | | | — | | | | (0.03 | ) |
| | | | | | | | |
Net asset value at end of period | | $ | 9.84 | | | $ | 9.83 | |
| | | | | | | | |
Total investment return (b)(c) | | | 0.10 | % | | | (1.39 | %) |
| Ratios (to average net assets)/Supplemental Data: | | | | | | | | |
Net investment income (loss)†† | | | (2.14 | %) | | | (1.95 | %) |
Net expenses (excluding short sale expenses)†† | | | 2.78 | % | | | 2.70 | % |
Expenses (before waiver/reimbursement)†† | | | 4.44 | % | | | 4.54 | % |
Short sale expenses†† | | | 0.86 | % | | | 0.89 | % |
Portfolio turnover rate (d) | | | 88 | % | | | 164 | % |
Net assets at end of period (in 000’s) | | $ | 725 | | | $ | 299 | |
| (a) | Per share data based on average shares outstanding during the period. |
| (b) | Total investment return is calculated exclusive of sales charges and assumes the reinvestment of dividends and distributions. |
| (c) | Total investment return is not annualized. |
| (d) | Portfolio turnover rate is not annualized. |
| | | | | | | | |
| Class I | | Six months
ended
October 31,
2016* | | | June 18, 2015** through April 30, 2016 | |
Net asset value at beginning of period* | | $ | 9.93 | | | $ | 10.00 | |
| | | | | | | | |
Net investment income (loss) (a) | | | (0.05 | ) | | | (0.07 | ) |
Net realized and unrealized gain (loss) on investments | | | 0.05 | | | | 0.05 | |
Net realized and unrealized gain (loss) on foreign currency transactions | | | 0.08 | | | | (0.02 | ) |
| | | | | | | | |
Total from investment operations | | | 0.08 | | | | (0.04 | ) |
| | | | | | | | |
| Less distributions: | | | | | | | | |
From net realized gain on investments | | | — | | | | (0.03 | ) |
| | | | | | | | |
Net asset value at end of period | | $ | 10.01 | | | $ | 9.93 | |
| | | | | | | | |
Total investment return (b)(c)(d) | | | 0.81 | % | | | (0.39 | %) |
| Ratios (to average net assets)/Supplemental Data: | | | | | | | | |
Net investment income (loss)†† | | | (0.90 | %) | | | (0.78 | %) |
Net expenses (excluding short sale expenses)†† | | | 1.55 | % | | | 1.55 | % |
Expenses (before waiver/reimbursement)†† | | | 3.22 | % | | | 3.36 | % |
Short sale expenses†† | | | 0.87 | % | | | 0.85 | % |
Portfolio turnover rate (e) | | | 88 | % | | | 164 | % |
Net assets at end of period (in 000’s) | | $ | 124,456 | | | $ | 105,112 | |
| (a) | Per share data based on average shares outstanding during the period. |
| (b) | Total investment return is calculated exclusive of sales charges and assumes the reinvestment of dividends and distributions. Class I shares are not subject to sales charges. |
| (c) | Total investment return is not annualized. |
| (d) | Total investment return may reflect adjustments to conform to generally accepted accounting principals. |
| (e) | Portfolio turnover rate is not annualized. |
| | | | | | |
The notes to the consolidated financial statements are an integral part of,
and should be read in conjunction with, the consolidated financial statements. | | | | | 41 | |
Notes to Consolidated Financial Statements (Unaudited)
Note 1–Organization and Business
MainStay Funds Trust (the “Trust”) was organized as a Delaware statutory trust on April 28, 2009, and is governed by a Declaration of Trust. The Trust is registered under the Investment Company Act of 1940, as amended (the “1940 Act”), as an open-end management investment company, and is comprised of thirty-nine funds (collectively referred to as the “Funds”). These consolidated financial statements and notes relate to the MainStay Absolute Return Multi-Strategy Fund (the “Fund”), a “diversified” fund, as that term is defined in the 1940 Act, as interpreted or modified by regulatory authorities having jurisdiction, from time to time.
The Fund currently offers four classes of shares. Investor Class, Class A, Class C and Class I shares. The inception date for all classes was June 18, 2015. Investor Class and Class A shares are offered at net asset value (“NAV”) per share plus an initial sales charge. No initial sales charge applies to investments of $1 million or more (and certain other qualified purchases) in Investor Class and Class A shares, but a contingent deferred sales charge (“CDSC”) of 1.00% may be imposed on certain redemptions of such shares made within one year of the date of purchase on shares that were purchased without an initial sales charge made before January 1, 2017. Effective January 1, 2017, a CDSC of 1.00% may be imposed on certain redemptions of Class A and Investor Class shares made within 24 months of the date of purchase of such shares that were made without an initial sales charge. Class C shares are offered at NAV without an initial sales charge, although a 1.00% CDSC may be imposed on redemptions made within one year of the date of purchase of Class C shares. Class I shares are offered at NAV and are not subject to a sales charge. Depending upon eligibility, Investor Class shares may convert to Class A shares and Class A shares may convert to Investor Class shares. Under certain circumstances and as may be permitted by the Trust’s multiple class plan under Rule 18f-3 of the 1940 Act, an exchange/conversion may be made from specified share classes of the Fund to one or more other share classes of the Fund as disclosed in the capital share transactions within these notes. The four classes of shares have the same voting (except for issues that relate solely to one class), dividend, liquidation and other rights, and the same terms and conditions, except that Class C shares are subject to higher distribution and/or service fee rates than Investor Class and Class A shares under a distribution plan pursuant to Rule 12b-1 under the 1940 Act. Class I shares are not subject to a distribution and/or service fee.
The Fund’s investment objective is to seek long-term growth of capital.
Note 2–Significant Accounting Policies
The Fund is an investment company and accordingly follows the investment company accounting and reporting guidance of the Financial Accounting Standards Board (“FASB”) Accounting Standard Codification Topic 946 Financial Services—Investment Companies. The Fund prepares its consolidated financial statements in accordance with generally accepted accounting principles (“GAAP”) in the United States of America and follows the significant accounting policies described below.
(A) Securities Valuation. Investments are usually valued as of the close of regular trading on the New York Stock Exchange (the “Exchange”) (usually 4:00 p.m. Eastern time) on each day the Fund is open for business (“valuation date”).
The Board of Trustees (the “Board”) adopted procedures establishing methodologies for the valuation of the Fund’s securities and other assets and delegated the responsibility for valuation determinations under those procedures to the Valuation Committee of the Trust (the “Valuation Committee”). The Board authorized the Valuation Committee to appoint a Valuation Sub-Committee (the “Sub-Committee”) to deal in the first instance with establishing the prices of securities for which market quotations are not readily available or the prices of which are not otherwise readily determinable under these procedures. The Sub-Committee meets (in person, via electronic mail or via teleconference) on an as-needed basis. Subsequently, the Valuation Committee meets to ensure that actions taken by the Sub-Committee were appropriate. The procedures recognize that, subject to the oversight of the Board and unless otherwise noted, the responsibility for the day-to-day valuation of portfolio assets (including fair value measurements for the Fund’s assets and liabilities) rests with New York Life Investment Management LLC (“New York Life Investments” or the “Manager”), aided to whatever extent necessary by the Subadvisors (as defined in Note 3(A)) to the Fund.
To assess the appropriateness of security valuations, the Manager, Subadvisors or the Fund’s third party service provider, who is subject to oversight by the Manager, regularly compares prior day prices, prices on comparable securities, and the sale prices to the prior and current day prices and challenges prices with changes exceeding certain tolerance levels with third party pricing services or broker sources. For those securities valued through either a standardized fair valuation methodology or a fair valuation measurement, the Sub-Committee deals in the first instance with such valuation and the Valuation Committee reviews and affirms, if appropriate, the reasonableness of the valuation based on such methodologies and measurements on a regular basis after considering all relevant information that is reasonably available. Any action taken by the Sub-Committee with respect to the valuation of a portfolio security or other asset is submitted by the Valuation Committee to the Board for its review and ratification, if appropriate, at its next regularly scheduled meeting.
“Fair value” is defined as the price the Fund would reasonably expect to receive upon selling an asset or liability in an orderly transaction to an independent buyer in the principal or most advantageous market for the asset or liability. Fair value measurements are determined within a framework that establishes a three-tier hierarchy which maximizes the use of observable market data and minimizes the use of unobservable inputs to establish a classification of fair value measurements for disclosure purposes. “Inputs” refer broadly to the assumptions that market participants would use in pricing the asset or liability, including assumptions about risk, such as the risk inherent in a particular valuation technique used to measure fair value using a pricing model and/or the risk inherent in the inputs for the valuation technique. Inputs may be observable or unobservable. Observable inputs reflect the assumptions market participants would use in pricing the asset or liability based on market data obtained from sources independent of the Fund. Unobservable inputs reflect the Fund’s own assumptions about the assumptions market participants would use in pricing the asset or liability based on the information available. The inputs or methodology used for valuing assets or liabilities may not be an indication of the risks
| | |
| 42 | | MainStay Absolute Return Multi-Strategy Fund |
associated with investing in those assets or liabilities. The three-tier hierarchy of inputs is summarized below.
| • | | Level 1—quoted prices in active markets for an identical asset or liability |
| • | | Level 2—other significant observable inputs (including quoted prices for a similar asset or liability in active markets, interest rates and yield curves, prepayment speeds, credit risk, etc.) |
| • | | Level 3—significant unobservable inputs (including the Fund’s own assumptions about the assumptions that market participants would use in measuring fair value of an asset or liability) |
The level of an asset or liability within the fair value hierarchy is based on the lowest level of an input, both individually and in the aggregate, that is significant to the fair value measurement. As of October 31, 2016, the aggregate value by input level of the Fund’s assets and liabilities is included at the end of the Fund’s Consolidated Portfolio of Investments.
The Fund may use third party vendor evaluations, whose prices may be derived from one or more of the following standard inputs, among others:
| | |
• Benchmark yields | | • Reported trades |
• Broker/dealer quotes | | • Issuer spreads |
• Two-sided markets | | • Benchmark securities |
• Bids/offers | | • Reference data (corporate actions or material event notices) |
• Industry and economic events | | • Comparable bonds |
• Equity and credit default swap curves | | • Monthly payment information |
An asset or liability for which market values cannot be measured using the methodologies described above is valued by methods deemed reasonable in good faith by the Valuation Committee, following the procedures established by the Board, to represent fair value. Under these procedures, the Fund generally uses a market-based approach which may use related or comparable assets or liabilities, recent transactions, market multiples, book values, and other relevant information. The Fund may also use an income-based valuation approach in which the anticipated future cash flows of the asset or liability are discounted to calculate fair value. Discounts may also be applied due to the nature and/or duration of any restrictions on the disposition of the asset or liability. Fair value represents a good faith approximation of the value of a security. Fair value determinations involve the consideration of a number of subjective factors, an analysis of applicable facts and circumstances and the exercise of judgment. As a result, it is possible that the fair value for a security determined in good faith in accordance with the Fund’s valuation procedures may differ from valuations for the same security determined by other funds using their own valuation procedures. Although the Fund’s valuation procedures are designed to value a security at the price the Fund may reasonably expect to receive upon its sale in an orderly transaction, there can be no assurance that any fair value determination thereunder would, in fact, approximate the amount that the Fund would actually realize upon the sale of the security or the price at which the security would trade if a reliable market price were readily available. During the six-month period ended October 31, 2016, there were no material changes to the fair value methodologies.
Equity and non-equity securities which may be valued in this manner include, but are not limited to: (i) a security for which trading has been halted or suspended; (ii) a debt security that has recently gone into default and for which there is not a current market quotation; (iii) a security of an issuer that has entered into a restructuring; (iv) a security that has been de-listed from a national exchange; (v) a security for which the market price is not readily available from a third party pricing source or, if so provided, does not, in the opinion of the Manager or Subadvisors reflect the security’s market value; (vi) a security subject to trading collars for which no or limited trading takes place; and (vii) a security whose principal market has been temporarily closed at a time when, under normal conditions, it would be open. Securities for which market quotations or observable inputs are not readily available are generally categorized as Level 3 in the hierarchy. As of October 31, 2016, securities that were fair valued in such a manner are shown in the Consolidated Portfolio of Investments.
Certain securities held by the Fund may principally trade in foreign markets. Events may occur between the time the foreign markets close and the time at which the Fund’s NAV is calculated. These events may include, but are not limited to, situations relating to a single issuer in a market sector, significant fluctuations in U.S. or foreign markets, natural disasters, armed conflicts, governmental actions or other developments not tied directly to the securities markets. Should the Manager or Subadvisors conclude that such events may have affected the accuracy of the last price of such securities reported on the local foreign market, the Sub-Committee may, pursuant to procedures adopted by the Board, adjust the value of the local price to reflect the estimated impact on the price of such securities as a result of such events. In this instance, securities are generally categorized as Level 3 in the hierarchy.
Additionally, certain foreign equity securities are also fair valued whenever the movement of a particular index exceeds certain thresholds. In such cases, the securities are fair valued by applying factors provided by a third party vendor in accordance with valuation procedures adopted by the Board and are generally categorized as Level 2 in the hierarchy.
Equity securities and shares of exchange-traded funds (“ETFs”) are valued at the last quoted sales prices as of the close of regular trading on the relevant exchange on each valuation date. Securities that are not traded on the valuation date are valued at the mean of the last quoted bid and ask prices. Prices are normally taken from the principal market in which each security trades. Futures contracts are valued at the last posted settlement price on the market where such futures are primarily traded. Options contracts are valued at the last posted settlement price on the market where such options are primarily traded. Investments in mutual funds, including money market funds, are valued at their respective NAVs as of the close of the Exchange on the valuation date. These securities are generally categorized as Level 1 in the hierarchy.
Debt securities (other than convertible and municipal bonds) are valued at the evaluated bid prices (evaluated mean prices in the case of convertible and municipal bonds) supplied by a pricing agent or brokers selected by the Manager, in consultation with the Subadvisors. Those values reflect broker/dealer supplied prices and electronic data processing techniques, if the evaluated bid or mean prices are deemed by the Manager, in consultation with the Subadvisors, to be representative of market values, at the regular close of trading of the Exchange on each valuation date. Debt securities purchased on a delayed delivery
Notes to Consolidated Financial Statements (Unaudited) (continued)
basis are marked to market daily until settlement at the forward settlement date. Debt securities, including corporate bonds, U.S. government & federal agency bonds, municipal bonds, foreign bonds, convertible bonds, asset-backed securities and mortgage-backed securities are generally categorized as Level 2 in the hierarchy.
Temporary cash investments acquired in excess of 60 days to maturity at the time of purchase are valued using the latest bid prices or using valuations based on a matrix system (which considers such factors as security prices, yields, maturities, and ratings), both as furnished by independent pricing services. Other temporary cash investments which mature in 60 days or less at the time of purchase (“Short-Term Investments”) are valued using the amortized cost method of valuation, unless the use of such method would be inappropriate. The amortized cost method involves valuing a security at its cost on the date of purchase and thereafter assuming a constant amortization to maturity of the difference between such cost and the value on maturity date. Amortized cost approximates the current fair value of a security. Securities valued using the amortized cost method are not valued using quoted prices in an active market and are generally categorized as Level 2 in the hierarchy.
Foreign currency forward contracts are valued at their fair market values measured on the basis of the mean between the last current bid and ask prices based on dealer or exchange quotations and are generally categorized as Level 2 in the hierarchy.
Total return swap contracts, which are arrangements to exchange a market-linked return for a periodic payment, are based on a notional principal amount. To the extent that the total return of the security, index or other financial measure underlying the transaction exceeds or falls short of the offsetting interest rate obligation, the fund will receive a payment from or make a payment to the counterparty. Total return swap contracts are marked to market daily based upon quotations from market makers and these securities are generally categorized as Level 2 in the hierarchy.
The information above is not intended to reflect an exhaustive list of the methodologies that may be used to value portfolio investments. The valuation procedures permit the use of a variety of valuation methodologies in connection with valuing portfolio investments. The methodology used for a specific type of investment may vary based on the market data available or other considerations. The methodologies summarized above may not represent the specific means by which portfolio investments are valued on any particular business day.
A Fund security or other asset may be determined to be illiquid under procedures approved by the Board. Illiquidity of a security might prevent the sale of such security at a time when the Manager or Subadvisors might wish to sell, and these securities could have the effect of decreasing the overall level of the Fund’s liquidity. Further, the lack of an established secondary market may make it more difficult to value illiquid securities, requiring the Fund to rely on judgments that may be somewhat subjective in measuring value, which could vary materially from the amount that the Fund could realize upon disposition. Difficulty in selling illiquid securities may result in a loss or may be costly to the Fund. Under the supervision of the Board, the Manager or Subadvisors determine the liquidity of the Fund’s investments; in doing so, the Manager or Subadvisors may consider various factors, including (i) the
frequency of trades and quotations, (ii) the number of dealers and prospective purchasers, (iii) dealer undertakings to make a market, and (iv) the nature of the security and the market in which it trades (e.g., the time needed to dispose of the security, the method of soliciting offers and the mechanics of transfer). Illiquid securities are often valued in accordance with methods deemed by the Board in good faith to be reasonable and appropriate to accurately reflect their fair value. The liquidity of the Fund’s investments, as shown in the Consolidated Portfolio of Investments, was determined as of October 31, 2016 and can change at any time in response to, among other relevant factors, market conditions or events or developments with respect to an individual issuer or instrument.
(B) Income Taxes. The Fund’s policy is to comply with the requirements of the Internal Revenue Code of 1986, as amended (the “Internal Revenue Code”), applicable to regulated investment companies and to distribute all of its taxable income to the shareholders of the Fund within the allowable time limits. Therefore, no federal, state and local income tax provisions are required.
Management evaluates the Fund’s tax positions to determine if the tax positions taken meet the minimum recognition threshold in connection with accounting for uncertainties in income tax positions taken or expected to be taken for the purposes of measuring and recognizing tax liabilities in the consolidated financial statements. Recognition of tax benefits of an uncertain tax position is permitted only to the extent the position is “more likely than not” to be sustained assuming examination by taxing authorities. Management has analyzed the Fund’s tax positions taken on federal, state and local income tax returns for all open tax years (for up to three tax years), and has concluded that no provisions for federal, state and local income tax are required in the Fund’s consolidated financial statements. The Fund’s federal, state and local income and federal excise tax returns for tax years for which the applicable statutes of limitations have not expired are subject to examination by the Internal Revenue Service and state and local departments of revenue.
For U.S. tax purposes, the Cayman Subsidiary (defined in Note 2(V)) is treated as a controlled foreign corporation (“CFC”) of the Fund under the Internal Revenue Code. As a U.S. shareholder of a CFC, the Fund is required to include its share of the Cayman Subsidiary’s earnings in its taxable income. Any net loss or deficit in earnings generated by the Cayman Subsidiary cannot be deducted by the Fund in the period incurred, nor can such loss or deficit in earnings be carried forward to offset the Fund’s taxable income and the Cayman Subsidiary’s earnings in future periods. As a Cayman Islands exempted limited company, the Cayman Subsidiary has received an undertaking from the Government of the Cayman Islands exempting it from all local income, profits and capital gains taxes. No such taxes are levied in the Cayman Islands at this time.
With respect to Fund investments in the Cayman Subsidiary, the Internal Revenue Service (“IRS”) has issued private letter rulings to regulated investment companies (but not the Fund) in which the IRS specifically concluded that income and gains earned by a regulated investment company from its investment in a wholly-owned foreign subsidiary that invests in commodity-linked instruments are qualifying gross income of a regulated investment company for purposes of compliance with Subchapter M of the Internal Revenue Code. However, the Fund is not
| | |
| 44 | | MainStay Absolute Return Multi-Strategy Fund |
able to rely on private letter rulings issued to other taxpayers. Additionally, the IRS has suspended the issuance of such private letter rulings, pending review of its position on this matter. The IRS also recently issued proposed regulations that, if finalized, would generally treat the Fund’s income inclusion with respect to the Cayman Subsidiary as qualifying income only if there is a distribution out of the earnings and profits of the Cayman Subsidiary that is attributable to such income inclusion. The proposed regulations, if adopted, would apply to taxable years beginning on or after 90 days after the regulations are published as final.
In connection with investments in the Cayman Subsidiary, the Fund has obtained an opinion of counsel that gross income derived by the Fund from its investment in the Cayman Subsidiary should constitute qualifying gross income of a regulated investment company under Subchapter M of the Internal Revenue Code. However, no assurances can be provided that the IRS would not be able to successfully assert that the gross income derived by the Fund from its investment in the Cayman Subsidiary was not qualifying gross income of a regulated investment company under Subchapter M of the Internal Revenue Code, in which case the Fund could fail to qualify as a regulated investment company under Subchapter M of the Internal Revenue Code if less than 90% of its gross income was not derived from such qualifying gross income. If the Fund failed to qualify as a regulated investment company, it would be subject to federal and state income tax on all of its taxable income at regular corporate tax rates. This would significantly adversely affect the returns to, and could cause substantial losses for, Fund shareholders.
(C) Foreign Taxes. The Fund may be subject to foreign taxes on income and other transaction-based taxes imposed by certain countries in which it invests. A portion of the taxes on gains on investments or currency purchases/repatriation may be reclaimable. The Fund will accrue such taxes and reclaims as applicable, based upon its current interpretation of tax rules and regulations that exist in the markets in which it invests.
The Fund may be subject to taxation on realized capital gains, repatriation proceeds and other transaction-based taxes imposed by certain countries in which it invests. The Fund will accrue such taxes as applicable based upon its current interpretation of tax rules and regulations that exist in the market in which it invests. Capital gains taxes relating to positions still held are reflected as a liability on the Consolidated Statement of Assets and Liabilities, as well as an adjustment to the Fund’s net unrealized appreciation (depreciation). Taxes related to capital gains realized during the six-month period ended October 31, 2016, if any, are reflected as part of net realized gain (loss) in the Consolidated Statement of Operations. Changes in tax liabilities related to capital gains taxes on unrealized investment gains, if any, are reflected as part of the change in net unrealized appreciation (depreciation) on investments in the Consolidated Statement of Operations. Transaction-based charges are generally assessed as a percentage of the transaction amount.
(D) Dividends and Distributions to Shareholders. Dividends and distributions are recorded on the ex-dividend date. The Fund intends to declare and pay dividends from net investment income and distributions from net realized capital and currency gains, if any, at least annually. Unless the shareholder elects otherwise, all dividends and distributions are reinvested in the same class of shares of the Fund, at
NAV. Dividends and distributions to shareholders are determined in accordance with federal income tax regulations and may differ from GAAP.
(E) Security Transactions and Investment Income. The Fund records security transactions on the trade date. Realized gains and losses on security transactions are determined using the identified cost method. Dividend income is recognized on the ex-dividend date; net of any foreign tax withheld at the source, and interest income is accrued
as earned using the effective interest rate method and includes any realized gains and losses from repayments of principal on mortgage-backed securities. Discounts and premiums on securities purchased, other than Short-Term Investments, for the Fund are accreted and amortized, respectively, on the effective interest rate method over the life of the respective securities or, in the case of a callable security, over the period to the first date of call. Discounts and premiums on Short-Term Investments are accreted and amortized, respectively, on the straight-line method. The straight-line method approximates the effective interest method for short-term investments. Income from payment-in-kind securities is accreted daily based on the effective interest method.
The Fund may invest in master limited partnerships (“MLPs”). To comply with Subchapter M of the Internal Revenue Code, the Fund may invest no more than 25% of its total assets in MLPs. Distributions on a MLP are generally recorded based on the characterization reported on the Fund’s Form 1065, Schedule K-1, received from the MLP. The Fund records its pro rata share of the income and deductions, and capital gains and losses allocated from each MLP on its Consolidated Statement of Operations, as well as adjusts the cost basis of each MLP accordingly, as reported on the Fund’s Consolidated Portfolio of Investments.
Distributions received from investments in energy related U.S. royalty trusts and Canadian royalty trusts and exploration and production companies (collectively, “Energy Trusts”) and MLPs generally are comprised of ordinary income, capital gains and return of capital from the Energy Trusts or MLPs. The Fund records its investment income on the ex-date of the distributions. For purposes of the consolidated financial statements, the Fund uses return of capital and income estimates to allocate the dividend income received. Such estimates are based on historical information available from each Energy Trust, MLP and other industry sources. These estimates may subsequently be revised based on information received from Energy Trusts or MLPs after their tax reporting periods are concluded, as the actual character of these distributions is not known until after the fiscal year end.
The Fund estimates the allocation of investment income and return of capital associated with distributions received from MLPs and recorded on the Consolidated Statement of Operations. For the six-month period ended October 31, 2016, the Fund estimated approximately 100% of the distributions received from MLPs to be from return of capital.
Investment income and realized and unrealized gains and losses on investments of the Fund are allocated to separate classes of shares pro rata based upon their relative net assets on the date the income is earned or realized and unrealized gains and losses are incurred.
The Fund may place a debt security on non-accrual status and reduce related interest income by ceasing current accruals and writing off all or
Notes to Consolidated Financial Statements (Unaudited) (continued)
a portion of any interest receivables when the collection of all or a portion of such interest has become doubtful. A debt security is removed from non-accrual status when the issuer resumes interest payments or when collectability of interest is reasonably assured.
(F) Expenses. Expenses of the Trust are allocated to the individual Funds in proportion to the net assets of the respective Funds when the expenses are incurred, except where direct allocations of expenses can be made. Expenses (other than transfer agent expenses and fees incurred under the shareholder services plans and/or the distribution plans further discussed in Note 3(B)) are allocated to separate classes of shares pro rata based upon their relative net assets on the date the expenses are incurred. The expenses borne by the Fund, including those of related parties to the Fund, are shown in the Consolidated Statement of Operations.
(G) Use of Estimates. In preparing the consolidated financial statements in conformity with GAAP, management makes estimates and assumptions that affect the reported amounts and disclosures in the consolidated financial statements. Actual results could differ from those estimates.
(H) Repurchase Agreements. The Fund may enter into repurchase agreements to earn income. The Fund may enter into repurchase agreements only with financial institutions that are deemed by the Manager or Subadvisors to be creditworthy, pursuant to guidelines established by the Board. During the term of any repurchase agreement, the Manager or Subadvisors will continue to monitor the creditworthiness of the seller. Under the 1940 Act, repurchase agreements are considered to be collateralized loans by the Fund to the seller secured by the securities transferred to the Fund.
When the Fund enters into repurchase agreements, the Fund’s custodian takes possession of the collateral pledged for investments in the repurchase agreement. The underlying collateral is valued daily on a mark to market basis to determine if the value, including accrued interest, exceeds the repurchase price. In the event of the seller’s default on the obligation to repurchase, the Fund has the right to liquidate the collateral and apply the proceeds in satisfaction of the obligation. Under certain circumstances, such as in the event of default or bankruptcy by the counterparty to the agreement, realization and/or retention of the collateral may be subject to legal proceedings and possible realized loss to the Fund.
(I) Futures Contracts. A futures contract is an agreement to purchase or sell a specified quantity of an underlying instrument at a specified future date and price, or to make or receive a cash payment based on the value of a financial instrument (e.g., foreign currency, interest rate, security, or securities index). The Fund is subject to risks such as market price risk and/or interest rate risk in the normal course of investing in these transactions. Upon entering into a futures contract, the Fund is required to pledge to the broker or futures commission merchant an amount of cash and/or U.S. Government securities equal to a certain percentage of the collateral amount, known as the “initial margin.” During the period the futures contract is open, changes in the value of the contract are recognized as unrealized appreciation or depreciation by marking to market such contract on a daily basis to reflect the market value of the contract at the end of each day’s trading. The Fund agrees to receive from or pay to the broker or futures commission merchant an
amount of cash equal to the daily fluctuation in the value of the contract. Such receipts or payments are known as “variation margin.” When the futures contract is closed, the Fund records a realized gain or loss equal to the difference between the proceeds from (or cost of) the closing transaction and the Fund’s basis in the contract.
The use of futures contracts involves, to varying degrees, elements of market risk in excess of the amount recognized in the Consolidated Statement of Assets and Liabilities. The contract or notional amounts and variation margin reflect the extent of the Fund’s involvement in open futures positions. There are several risks associated with the use of futures contracts as hedging techniques. There can be no assurance that a liquid market will exist at the time when the Fund seeks to close out a futures contract. If no liquid market exists, the Fund would remain obligated to meet margin requirements until the position is closed. Futures may involve a small initial investment relative to the risk assumed, which could result in losses greater than if they had not been used. Futures may be more volatile than direct investments in the instrument underlying the futures, and may not correlate to the underlying instrument, causing a given hedge not to achieve its objectives. The Fund’s activities in futures contracts have minimal counterparty risk as they are conducted through regulated exchanges that guarantee the futures against default by the counterparty. In the event of a bankruptcy or insolvency of a futures commission merchant that holds margin on behalf of the Fund, the Fund may not be entitled to the return of the entire margin owed to the Fund, potentially resulting in a loss. The Fund’s investment in futures contracts and other derivatives may increase the volatility of the Fund’s NAV and may result in a loss to the Fund.
(J) Swap Contracts. The Fund may enter into credit default, interest rate, equity, index and currency exchange rate contracts (“swaps”). In a typical swap transaction, two parties agree to exchange the future returns (or differentials in rates of future returns) earned or realized at periodic intervals on a particular investment or instrument based on a notional principal amount. Generally, the Fund will enter into a swap on a net basis, which means that the two payment streams under the swap are netted, with the Fund receiving or paying (as the case may be) only the net amount of the two payment streams. Therefore, the Fund’s current obligation under a swap generally will be equal to the net amount to be paid or received under the swap, based on the relative value of notional positions attributable to each counterparty to the swap. The payments may be adjusted for transaction costs, interest payments, the amount of interest paid on the investment or instrument or other factors. Collateral, in the form of cash or securities, may be required to be held in segregated accounts with the custodian bank or broker in accordance with the terms of the swap. Swap agreements are privately negotiated in the over the counter market (“OTC swaps”) and may be executed in a multilateral or other trade facilities platform, such as a registered commodities exchange (“centrally cleared swaps”).
Certain standardized swaps, including certain credit default and interest rate swaps, are subject to mandatory clearing and exchange-trading, and more types of standardized swaps are expected to be subject to mandatory clearing and exchange-trading, in the future. The counterparty risk for exchange-traded and cleared derivatives is expected to be generally lower than for uncleared derivatives, but cleared contracts are not risk-free. In a cleared derivative transaction, the Fund typically enters into the transaction with a financial institution counterparty, and
| | |
| 46 | | MainStay Absolute Return Multi-Strategy Fund |
performance of the transaction is effectively guaranteed by a central clearinghouse, thereby reducing or eliminating the Fund’s exposure to the credit risk of its original counterparty. The Fund will be required to post specified levels of margin with the clearinghouse or at the instruction of the clearinghouse; the margin required by a clearinghouse may be greater than the margin the Fund would be required to post in an uncleared transaction. As of October 31, 2016, all swap positions outstanding are shown in the Consolidated Portfolio of Investments.
Swaps are marked to market daily based upon quotations from pricing agents, brokers, or market makers and the change in value, if any, is recorded as unrealized appreciation or depreciation. Any payments made or received upon entering into a swap would be amortized or accreted over the life of the swap and recorded as a realized gain or loss. Early termination of a swap is recorded as a realized gain or loss. Daily changes in valuation of centrally cleared swaps, if any, are recorded as a receivable or payable for the change in value as appropriate (“variation margin”) on the Consolidated Statement of Assets and Liabilities.
The Fund bears the risk of loss of the amount expected to be received under a swap in the event of the default or bankruptcy of the swap counterparty. The Fund may be able to eliminate its exposure under a swap either by assignment or other disposition, or by entering into an offsetting swap with the same party or a similar credit-worthy party. Swaps are not actively traded on financial markets. Entering into swaps involves elements of credit, market, and documentation risk in excess of the amounts recognized on the Consolidated Statement of Assets and Liabilities. Such risks involve the possibilities that there will be no liquid market for these swaps, that the counterparty to the swaps may default on its obligation to perform or disagree as to the meaning of the contractual terms in the swaps and that there may be unfavorable changes in interest rates, the price of the index or the security underlying these transactions.
Interest Rate Swaps: An interest rate swap is an agreement between two parties where one stream of future interest payments is exchanged for another based on a specified principal amount. Interest rate swaps often exchange a fixed payment for a floating payment that is linked to an interest rate (most often the London InterBank Offered Rate (“LIBOR”)). The Fund will typically use interest rate swaps to limit, or manage, its exposure to fluctuations in interest rates, or to obtain a marginally lower interest rate than it would have been able to get without the swap.
Credit Default Swaps: The Fund may enter into credit default swaps to simulate long and short bond positions or to take an active long or short position with respect to the likelihood of a default or credit event by the issuer of the underlying reference obligation. The types of reference obligations underlying the swaps that may be entered into by the Fund include debt obligations of a single issuer of corporate or sovereign debt, a basket of obligations of different issuers or a credit index. A credit index is an equally-weighted credit default swap index that is designed to track a representative segment of the credit default swap market (e.g., investment grade, high volatility, below investment grade or emerging markets) and provides an investor with exposure to specific “baskets” of issuers of certain debt instruments. Index credit default swaps have standardized terms including a fixed spread and standard maturity dates. The composition of the obligations within a particular index changes periodically. Credit default swaps involve one party, the protection buyer, making a stream of payments to another party, the
protection seller, in exchange for the right to receive a contingent payment if there is a credit event related to the underlying reference obligation. In the event that the reference obligation matures prior to the termination date of the contract, a similar security will be substituted for the duration of the contract term. Credit events are defined under individual swap agreements and generally include bankruptcy, failure to pay, restructuring, repudiation/moratorium, obligation acceleration and obligation default. Selling protection effectively adds leverage to a portfolio up to the notional amount of the swap agreement. Potential liabilities under these contracts may be reduced by: the auction rates of the underlying reference obligations; upfront payments received at the inception of a swap; and net amounts received from credit default swaps purchased with the identical reference obligation.
Equity Swaps (Total Return Swaps): Total return swap contracts are agreements between counterparties to exchange cash flow, one based on a market-linked return of an individual asset or group of assets (such as an index), and the other on a fixed or floating rate. As a total return swap, an equity swap may be structured in different ways. For example, when the Fund enters into a “long” equity swap, the counterparty may agree to pay the Fund the amount, if any, by which the notional amount of the equity swap would have increased in value had it been invested in a particular referenced security or securities, plus the dividends that would have been received on those securities. In return, the Fund will generally agree to pay the counterparty interest on the notional amount of the equity swap plus the amount, if any, by which that notional amount would have decreased in value had it been invested in such referenced security or securities, plus, in certain instances, commissions or trading spreads on the notional amounts. Therefore, the Fund’s return on the equity swap generally should equal the gain or loss on the notional amount, plus dividends on the referenced security or securities less the interest paid by the Fund on the notional amount. Alternatively, when the Fund enters into a “short” equity swap, the counterparty will generally agree to pay the Fund the amount, if any, by which the notional amount of the equity swap would have decreased in value had the Fund sold a particular referenced security or securities short, less the dividend expense that the Fund would have incurred on the referenced security or securities, as adjusted for interest payments or other economic factors. In this situation, the Fund will generally be obligated to pay the amount, if any, by which the notional amount of the swap would have increased in value had it been invested directly in the referenced security or securities.
Equity swaps generally do not involve the delivery of securities or other referenced assets. Accordingly, the risk of loss with respect to equity swaps is normally limited to the net amount of payments that the Fund is contractually obligated to make. If the other party to an equity swap defaults, the Fund’s risk of loss consists of the net amount of payments that the Fund is contractually entitled to receive, if any. The Fund will segregate cash or liquid assets, enter into offsetting transactions or use other measures permitted by applicable law to “cover” the Fund’s current obligations. The Fund and New York Life Investments, however, believe these transactions do not constitute senior securities under the 1940 Act and, accordingly, will not treat them as being subject to the Fund’s borrowing restrictions.
Equity swaps are derivatives and their value can be very volatile. The Fund may engage in total return swaps to gain exposure to emerging markets securities, along with offsetting long total return swap positions
Notes to Consolidated Financial Statements (Unaudited) (continued)
to maintain appropriate currency balances and risk exposures across all swap positions. To the extent that the Manager, or Subadvisors do not accurately analyze and predict future market trends, the values or assets or economic factors, the Fund may suffer a loss, which may be substantial.
(K) Foreign Currency Forward Contracts. The Fund may enter into foreign currency forward contracts, which are agreements to buy or sell foreign currencies on a specified future date at a specified rate. The Fund is subject to foreign currency exchange rate risk in the normal course of investing in these transactions. During the period the forward contract is open, changes in the value of the contract are recognized as unrealized appreciation or depreciation by marking to market such contract on a daily basis to reflect the market value of the contract at the end of each day’s trading. Cash movement occurs on settlement date. When the forward contract is closed, the Fund records a realized gain or loss equal to the difference between the proceeds from (or cost of) the closing transaction and the Fund’s basis in the contract. The Fund may purchase and sell foreign currency forward contracts for purposes of seeking to enhance portfolio returns and manage portfolio risk more efficiently. Foreign currency forward contracts may also be used to gain exposure to a particular currency or to hedge against the risk of loss due to changing currency exchange rates. Foreign currency forward contracts to purchase or sell a foreign currency may also be used in anticipation of future purchases or sales of securities denominated in foreign currency, even if the specific investments have not yet been selected.
The use of foreign currency forward contracts involves, to varying degrees, elements of risk in excess of the amount recognized in the Consolidated Statement of Assets and Liabilities, including counterparty risk, market risk, and illiquidity risk. Counterparty risk is heightened for these instruments because foreign currency forward contracts are not exchange-traded and therefore no clearinghouse or exchange stands ready to meet the obligations under such contracts. Thus, the Fund faces the risk that its counterparties under such contracts may not perform their obligations. Market risk is the risk that the value of a foreign currency forward contract will depreciate due to unfavorable changes in exchange rates. Illiquidity risk arises because the secondary market for foreign currency forward contracts may have less liquidity relative to markets for other securities and financial instruments. Risks also arise from the possible movements in the foreign exchange rates underlying these instruments. While the Fund may enter into forward contracts to reduce currency exchange risks, changes in currency exchange rates may result in poorer overall performance for the Fund than if it had not engaged in such transactions. Exchange rate movements can be large, depending on the currency, and can last for extended periods of time, affecting the value of the Fund’s assets. Moreover, there may be an imperfect correlation between the Fund’s holdings of securities denominated in a particular currency and the forward contracts entered into by the Fund. Such imperfect correlation may prevent the Fund from achieving the intended hedge or expose the Fund to the risk of currency exchange loss. The unrealized appreciation (depreciation) on forward contracts also reflects the Fund’s exposure at the valuation date to credit loss in the event of a counterparty’s failure to perform its obligations.
(L) Foreign Currency Transactions. The Fund’s books and records are maintained in U.S. dollars. Prices of securities denominated in foreign currency amounts are translated into U.S. dollars at the mean between the
buying and selling rates last quoted by any major U.S. bank at the following dates:
| (i) | market value of investment securities, other assets and liabilities—at the valuation date; and |
| (ii) | purchases and sales of investment securities, income and expenses—at the date of such transactions. |
The assets and liabilities that are denominated in foreign currency amounts are presented at the exchange rates and market values at the close of the period. The realized and unrealized changes in net assets arising from fluctuations in exchange rates and market prices of securities are not separately presented.
Net realized gain (loss) on foreign currency transactions represents net gains and losses on foreign currency forward contracts, net currency gains or losses realized as a result of differences between the amounts of securities sale proceeds or purchase cost, dividends, interest and withholding taxes as recorded on the Fund’s books, and the U.S. dollar equivalent amount actually received or paid. Net currency gains or losses from valuing such foreign currency denominated assets and liabilities, other than investments at valuation date exchange rates, are reflected in unrealized foreign exchange gains or losses.
(M) Rights and Warrants. Rights are certificates that permit the holder to purchase a certain number of shares, or a fractional share, of a new stock from the issuer at a specific price. Warrants are instruments that entitle the holder to buy an equity security at a specific price for a specific period of time. These investments can provide a greater potential for profit or loss than an equivalent investment in the underlying security. Prices of these investments do not necessarily move in tandem with the prices of the underlying securities.
There is risk involved in the purchase of rights and warrants in that these investments are speculative investments. The Fund could also lose the entire value of its investment in warrants if such warrants are not exercised by the date of its expiration. The Fund is exposed to risk until the sale or exercise of each right or warrant is completed. As of October 31, 2016, the Fund did not hold any warrants.
(N) Options. The Fund may write call and put options on securities and financial derivative instruments it owns or in which it may invest. Writing put options tends to increase the Fund’s exposure to the underlying instrument. Writing call options tends to decrease the Fund’s exposure to the underlying instrument. When the Fund writes a call or put, an amount equal to the premium received is recorded as a liability and subsequently marked to market to reflect the current value of the option written. These liabilities are reflected as written options outstanding on the Consolidated Statement of Assets and Liabilities. Premiums received from writing options which expire are treated as realized gains. Premiums received from writing options which are exercised or closed are added to the proceeds or offset against amounts paid on the underlying futures, swaps, security or currency transaction to determine the realized gain or loss. Certain options may be written with premiums to be determined on a future date. The Fund, as a writer of an option has no control over whether the underlying instrument may be sold (call) or purchased (put) and as a result bears the market risk of an unfavorable change in the price of the instrument underlying the written option. There is the risk the Fund may not be able to enter into a closing transaction because of an illiquid market.
| | |
| 48 | | MainStay Absolute Return Multi-Strategy Fund |
The Fund may also purchase put and call options. Purchasing call options tends to increase the Fund’s exposure to the underlying instrument. Purchasing put options tends to decrease the Fund’s exposure to the underlying instrument. The Fund pays a premium which is included on the Fund’s Consolidated Statement of Assets and Liabilities as an investment and subsequently marked to market to reflect the current value of the option. Premiums paid for purchasing options which expire are treated as realized losses. Certain options may be purchased with premiums to be determined on a future date. The premiums for these options are based upon implied volatility parameters at specified terms. The risk associated with purchasing put and call options is limited to the premium paid. Premiums paid for purchasing options which are exercised or closed are added to the amounts paid or offset against the proceeds on the underlying investment transaction to determine the realized gain or loss when the underlying transaction is sold.
The Fund may purchase or write foreign currency options. Purchasing a foreign currency option gives the Fund the right, but not the obligation, to buy or sell a specified amount of the currency at a specified rate of exchange that may be exercised on or before the option’s expiration date. These options may be used as a short or long hedge against possible variations in foreign exchange rates or to gain exposure to foreign currencies.
During the period ended October 31, 2016, the Fund engaged in the following transactions in written options:
| | | | | | | | |
| | | Notional
Amount | | | Premium | |
Options Outstanding at April 30, 2016 | | $ | — | | | $ | — | |
Options—Written | | | 2,000,000 | | | | 15,108 | |
Options—Bought back | | | (1,000,000 | ) | | | (12,269 | ) |
Options—Exercised | | | — | | | | — | |
Options Outstanding at October 31, 2016 | | $ | 1,000,000 | | | $ | 2,839 | |
(O) Securities Sold Short. The Fund engages in sales of securities it does not own (“short sales”) as part of its investment strategy. When the Fund enters into a short sale, it must segregate or maintain with a broker the cash proceeds from the security sold short or other securities as collateral for its obligation to deliver the security upon conclusion of the sale. During the period a short position is open, depending on the nature and type of security, a short position is reflected as a liability and is marked to market in accordance with the valuation methodologies previously detailed (See Note 2(A)). Liabilities for securities sold short are closed out by purchasing the applicable securities for delivery to the counterparty broker. A gain, limited to the price at which the Fund sold the security short, or a loss, unlimited as to dollar amount, will be recognized upon termination of a short sale if the market price on the date the short position is closed out is less or greater, respectively, than the proceeds originally received. Any such gain or loss may be offset, completely or in part, by the change in the value of the hedged investments. Interest on short positions held is accrued daily, while dividends declared on short positions existing on the record date are recorded on the ex-dividend date as a dividend expense in the Consolidated Statement of Operations. Broker fees and other expenses related to securities sold short are disclosed in the Consolidated Statement of Operations. Short sales involve risk of loss in excess of the related
amounts reflected in the Consolidated Statement of Assets and Liabilities.
(P) Offering Costs. Costs were incurred by the Fund in connection with the commencement of the Fund’s operations. These costs are being amortized on a straight line basis over twelve months.
(Q) Securities Lending. In order to realize additional income, the Fund may engage in securities lending, subject to the limitations set forth in the 1940 Act and relevant guidance by the staff of the Securities and Exchange Commission (“SEC”). In the event the Fund does engage in securities lending, the Fund will lend through its custodian, State Street Bank and Trust Company (“State Street”). State Street will manage the Fund’s cash collateral in accordance with the lending agreement between the Fund and State Street, and indemnify the Fund against counterparty risk. The loans will be collateralized by cash or securities at least equal at all times to the market value of the securities loaned. Collateral will consist of U.S. government securities, cash equivalents or irrevocable letters of credit. The Fund may bear the risk of delay in recovery of, or loss of rights in, the securities loaned should the borrower of the securities experience financial difficulty. The Fund may also record a realized gain or loss on securities deemed sold due to a borrower’s inability to return securities on loan. The Fund bears the risk of any loss on investment of the collateral. The Fund will receive compensation for lending its securities in the form of fees or it will retain a portion of interest on the investment of any cash received as collateral. The Fund will also continue to receive interest and dividends on the securities loaned and any gain or loss in the market price of the securities loaned that may occur during the term of the loan will be for the account of the Fund. During the six-month period ended October 31, 2016, the Fund did not have any portfolio securities on loan.
(R) High-Yield Securities, Energy Company, and Foreign Securities Risk. The Fund may invest in high-yield debt securities (commonly referred to as ‘‘junk bonds’’), which are considered speculative because they present a greater risk of loss, including default, than higher quality debt securities. These securities pay investors a premium—a higher interest rate or yield than investment grade debt securities—because of the increased risk of loss. These securities can also be subject to greater price volatility. In times of unusual or adverse market, economic or political conditions, these securities may experience higher than normal default rates. In times of unusual or adverse market, economic or political conditions, these securities may experience higher than normal default rates.
The Fund may invest up to 25% of its total assets in securities of domestic and foreign publicly traded partnerships and/or other issuers (including U.S. and Canadian royalty trusts and Canadian energy companies) engaged in the transportation, storage, processing, refining, marketing, exploration, production or mining of crude oil, natural gas, minerals or other natural resources (“Energy Companies”). The Fund may be particularly vulnerable to adverse events affecting Energy Companies as a result of its focus in Energy Companies.
The Fund may invest as limited partners in the equity securities of MLPs. As limited partners of MLPs, holders of MLP equity securities are subject to certain risks inherent in the structure of MLPs, including (i) tax risks, (ii) the limited ability to elect or remove management or the general partner or managing member, (iii) limited voting rights, except
Notes to Consolidated Financial Statements (Unaudited) (continued)
with respect to extraordinary transactions, and (iv) conflicts of interest between the general partner or managing member and its affiliates, on the one hand, and the limited partners or members, on the other hand, including those arising from incentive distribution payments or corporate opportunities.
The Fund may invest in foreign securities, which carry certain risks that are in addition to the usual risks inherent in domestic securities. These risks include those resulting from currency fluctuations, future adverse political or economic developments and possible imposition of currency exchange blockages or other foreign governmental laws or restrictions. These risks are likely to be greater in emerging markets than in developed markets. The ability of issuers of debt securities held by the Fund to meet their obligations may be affected by economic or political developments in a specific country, industry or region.
The Fund may enter into investment transactions which may represent off-balance sheet risk. Off-balance sheet risk exists when the maximum potential loss on a particular investment is greater than the value of such investment, as reflected in the Consolidated Statement of Assets and Liabilities. Off-balance sheet risk generally arises from the use of derivative financial instruments or short sales.
(S) Counterparty Credit Risk. In order to better define its contractual rights and to secure rights that will help the Fund mitigate its counterparty risk, the Fund may enter into an International Swaps and Derivatives Association, Inc. Master Agreement (“ISDA Master Agreement”) or similar agreement with its counterparties. An ISDA Master Agreement is a bilateral agreement between the Fund and a counterparty that governs certain OTC derivatives and typically contains collateral posting terms and netting provisions. Under an ISDA Master Agreement, the Fund may, under certain circumstances, offset with the counterparty certain derivative financial instruments’ payables and/or receivables with collateral held and/or posted and create one single net payment. The provisions of the ISDA Master Agreement typically permit a single net payment in the event of default including the bankruptcy or insolvency of the counterparty. Bankruptcy or insolvency laws of a particular jurisdiction may restrict or prohibit the right of offset in bankruptcy, insolvency or other events. In addition, certain ISDA Master Agreements may contain provisions for early termination of OTC derivative transactions in the event the net assets of the Fund decline below specific levels or if the Fund fails to meet the terms of its ISDA Master Agreements. The result would cause the Fund to accelerate
payment of any net liability owed to the counterparty. For financial reporting purposes, the Fund does not offset derivative assets and derivative liabilities that are subject to netting arrangements, if any, in the Consolidated Statement of Assets and Liabilities.
(T) Indemnifications. Under the Trust’s organizational documents, its officers and trustees are indemnified against certain liabilities that may arise out of performance of their duties to the Trust. Additionally, in the normal course of business, the Fund enters into contracts with third-party service providers that contain a variety of representations and warranties and which may provide general indemnifications. The Fund’s maximum exposure under these arrangements is unknown, as this would involve future claims that may be made against the Fund that have not yet occurred. Based on experience, management is of the view that the risk of loss in connection with these potential indemnification obligations is remote. However, there can be no assurance that material liabilities related to such obligations will not arise in the future, which could adversely impact the Fund.
(U) Quantitative Disclosure of Derivative Holdings. The following tables show additional disclosures related to the Fund’s derivative and hedging activities, including how such activities are accounted for and their effect on the Fund’s financial positions, performance and cash flows. These derivatives are not accounted for as hedging instruments.
The Fund utilizes a range of derivative instruments for a variety of different purposes. Total return swaps are one form of derivative that is used. In some cases, total return swap contracts are entered into so as to affect long and short exposure to individual securities or indices within a particular strategy. In other cases, total return swap are used to gain exposure to the strategy itself, which may also use derivatives. For example, a total return swap contract is used to generate the return available from a customized index comprised of a diversified basket of exchange-traded futures. Other examples of derivative positions into which the Fund may enter include interest rate swaps, credit default swaps and option contracts. These instruments are frequently used to obtain a desired return at a lower cost to the Fund than is available when investing directly in the underlying instrument or to hedge against credit and interest rate risks. The Fund may also enter into foreign currency forward contracts to gain exposure to a particular currency or to hedge against the risk of loss due to changing currency exchange rates.
Fair value of derivative instruments as of October 31, 2016:
Asset Derivatives
| | | | | | | | | | | | | | | | | | | | | | |
| | | Consolidated Statement of Assets and Liabilities Location | | Equity
Contracts
Risk | | | Credit
Contracts
Risk | | | Foreign
Exchange
Contracts
Risk | | | Interest
Rate
Contracts
Risk | | | Total | |
Purchased Options | | Investments in securities, at value | | $ | — | | | $ | — | | | $ | — | | | $ | 15,149 | | | $ | 15,149 | |
Futures Contracts | | Net Assets—Net unrealized appreciation (depreciation) on investments and futures contracts (a) | | | — | | | | — | | | | — | | | | 9,582 | | | | 9,582 | |
Swap Contracts | | Unrealized appreciation on swap contracts (b) | | | 75,092 | | | | 221,612 | | | | — | | | | 116,157 | | | | 412,861 | |
Forward Contracts | | Unrealized appreciation on foreign
currency forward contracts | | | — | | | | — | | | | 150,667 | | | | — | | | | 150,667 | |
| | | | | | |
Total Fair Value | | | | $ | 75,092 | | | $ | 221,612 | | | $ | 150,667 | | | $ | 140,888 | | | $ | 588,259 | |
| | | | | | |
| | |
| 50 | | MainStay Absolute Return Multi-Strategy Fund |
Liability Derivatives
| | | | | | | | | | | | | | | | | | | | | | |
| | | Consolidated Statement of
Assets and Liabilities
Location | | Equity
Contracts
Risk | | | Credit
Contracts
Risk | | | Foreign
Exchange
Contracts
Risk | | | Interest
Rate
Contracts
Risk | | | Total | |
Written Option | | Investments in written option, at value | | $ | — | | | $ | — | | | $ | — | | | $ | (3,074 | ) | | $ | (3,074 | ) |
Forward Contracts | | Unrealized depreciation on foreign currency forward contracts | | | — | | | | — | | | | (104,913 | ) | | | — | | | | (104,913 | ) |
Swap Contracts | | Premiums received for OTC swap contracts | | | — | | | | (15,029 | ) | | | — | | | | — | | | | (15,029 | ) |
Swap Contracts | | Unrealized depreciation on swap contracts (b) | | | (434,330 | ) | | | (208,535 | ) | | | — | | | | — | | | | (642,865 | ) |
| | | | | | |
Total Fair Value | | | | $ | (434,330 | ) | | $ | (223,564 | ) | | $ | (104,913 | ) | | $ | (3,074 | ) | | $ | (765,881 | ) |
| | | | | | |
| (a) | Includes cumulative appreciation (depreciation) of futures contracts as reported in the Consolidated Portfolio of Investments. Only current day’s variation margin is reported within the Consolidated Statement of Assets and Liabilities. |
| (b) | Includes cumulative appreciation (depreciation) of centrally cleared swap agreements as reported in the Consolidated Portfolio of Investments. Only current day’s variation margin of centrally cleared swaps is reported within the Consolidated Statement of Assets and Liabilities. |
The effect of derivative instruments on the Consolidated Statement of Operations for the period ended October 31, 2016:
Realized Gain (Loss)
| | | | | | | | | | | | | | | | | | | | | | |
| | | Consolidated Statement of
Operations
Location | | Equity
Contracts
Risk | | | Credit
Contracts
Risk | | | Foreign
Exchange
Contracts
Risk | | | Interest
Rate
Contracts
Risk | | | Total | |
Purchased Options | | Net realized gain (loss) on
investments transactions | | $ | — | | | $ | (15,570 | ) | | $ | — | | | $ | 21,781 | | | $ | 6,211 | |
Written Option | | Net realized gain (loss) on written
option transactions | | | — | | | | — | | | | — | | | | 3,136 | | | | 3,136 | |
Futures Contracts | | Net realized gain (loss) on
futures transactions | | | — | | | | — | | | | — | | | | (49,048 | ) | | | (49,048 | ) |
Forward Contracts | | Net realized gain (loss) on
foreign currency transactions | | | — | | | | — | | | | 4,843 | | | | — | | | | 4,843 | |
Swap Contracts | | Net realized gain (loss) on
swap transactions | | | 687,017 | | | | 141,490 | | | | — | | | | 285,389 | | | | 1,113,896 | |
| | | | | | |
Total Realized Gain (Loss) | | | | $ | 687,017 | | | $ | 125,920 | | | $ | 4,843 | | | $ | 261,258 | | | $ | 1,079,038 | |
| | | | | | |
Change in Unrealized Appreciation (Depreciation)
| | | | | | | | | | | | | | | | | | | | | | |
| | | Consolidated Statement of
Operations
Location | | Equity
Contracts
Risk | | | Credit
Contracts
Risk | | | Foreign
Exchange
Contracts
Risk | | | Interest
Rate
Contracts
Risk | | | Total | |
Purchased Options | | Net change in unrealized appreciation (depreciation) on investments | | $ | — | | | $ | — | | | $ | — | | | $ | (163 | ) | | $ | (163 | ) |
Written Option | | Net change in unrealized appreciation (depreciation) on written option | | | — | | | | — | | | | — | | | | (235 | ) | | | (235 | ) |
Futures Contracts | | Net change in unrealized appreciation (depreciation) on futures contracts | | | — | | | | — | | | | — | | | | (19,182 | ) | | | (19,182 | ) |
Forward Contracts | | Net change in unrealized appreciation (depreciation) on translation of other assets and liabilities in foreign currencies and foreign currency forward contracts | | | — | | | | — | | | | 277,563 | | | | — | | | | 277,563 | |
Swap Contracts | | Net change in unrealized appreciation (depreciation) on swap contracts | | | (695,427 | ) | | | (38,560 | ) | | | — | | | | (36,716 | ) | | | (770,703 | ) |
| | | | | | |
Total Change in Unrealized Appreciation (Depreciation) | | | | $ | (695,427 | ) | | $ | (38,560 | ) | | $ | 277,563 | | | $ | (56,296 | ) | | $ | (512,720 | ) |
| | | | | | |
Notes to Consolidated Financial Statements (Unaudited) (continued)
Average Notional Amount
| | | | | | | | | | | | | | | | | | | | |
| | | Equity
Contracts
Risk | | | Credit
Contracts
Risk | | | Foreign
Exchange
Contracts
Risk | | | Interest Rate Contracts Risk | | | Total | |
Purchased Options (a) | | $ | — | | | $ | 3,000,000 | | | $ | — | | | $ | 2,500,000 | | | $ | 5,500,000 | |
Written Options (b) | | $ | — | | | $ | — | | | $ | — | | | $ | (1,000,000 | ) | | $ | (1,000,000 | ) |
Futures Contracts Short | | $ | — | | | $ | — | | | $ | — | | | $ | (4,182,341 | ) | | $ | (4,182,341 | ) |
Forward Contracts Long | | $ | — | | | $ | — | | | $ | 690,615 | | | $ | — | | | $ | 690,615 | |
Forward Contracts Short | | $ | — | | | $ | — | | | $ | (13,701,708 | ) | | $ | — | | | $ | (13,701,708 | ) |
Swap Contracts Long | | $ | 63,833,176 | | | $ | 31,714,167 | | | $ | — | | | $ | 12,825,000 | | | $ | 108,372,343 | |
Swap Contracts Short | | $ | (4,909,544 | ) | | $ | — | | | $ | — | | | $ | — | | | $ | (4,909,544 | ) |
| | | | | | | | | | | | | | | | | | | | |
| (a) | Positions were open five months during the reporting period. |
| (b) | Positions were open one month during the reporting period. |
The following table presents the Fund’s derivative assets by counterparty net of amounts available for offset under a master netting agreement, or similar agreement, and net of the related collateral received by the Fund as of October 31, 2016.
| | | | | | | | | | | | | | | | |
Counterparty | | Gross Assets in
Statement of Assets
and Liabilities | | | Derivative
Assets/(Liabilities)
Available for Offset | | | Collateral
Received | | | Net Amount
of Derivative
Assets* | |
Citibank N.A. | | $ | 19,888 | | | $ | (19,523 | ) | | $ | — | | | $ | 365 | |
Credit Suisse | | | 897 | | | | (17 | ) | | | — | | | | 880 | |
Morgan Stanley Capital Services LLC | | | 24,321 | | | | (24,321 | ) | | | — | | | | — | |
Societe Generale S.A. | | | 150,809 | | | | (150,809 | ) | | | — | | | | — | |
UBS A.G. | | | 29,986 | | | | (29,986 | ) | | | — | | | | — | |
| | | | |
| | $ | 225,901 | | | $ | (224,656 | ) | | $ | — | | | $ | 1,245 | |
| | | | |
The following table presents the Fund’s derivative liabilities by counterparty net of amounts available for offset under a master netting agreement, or similar agreement, and net of the related collateral pledged by the Fund as of October 31, 2016.
| | | | | | | | | | | | | | | | |
Counterparty | | Gross Liabilities in
Statement of Assets
and Liabilities | | | Derivative
Assets/(Liabilities)
Available for Offset | | | Collateral
Pledged | | | Net Amount
of Derivative
Liabilities† | |
BNP Paribas S.A. | | $ | 9,870 | | | $ | — | | | $ | — | | | $ | 9,870 | |
Citibank N.A. | | | 19,523 | | | | (19,523 | ) | | | — | | | | — | |
Credit Suisse | | | 17 | | | | (17 | ) | | | — | | | | — | |
Morgan Stanley Capital Services LLC | | | 105,033 | | | | (24,321 | ) | | | — | | | | 80,712 | |
Societe Generale S.A. | | | 384,204 | | | | (150,809 | ) | | | — | | | | 233,395 | |
UBS A.G. | | | 30,466 | | | | (29,986 | ) | | | — | | | | 480 | |
| | | | |
| | $ | 549,113 | | | $ | (224,656 | ) | | $ | — | | | $ | 324,457 | |
| | | | |
| * | Represents the net amount receivable from the counterparty in the event of default. |
| † | Represents the net amount payable to the counterparty in the event of default. |
(V) Basis for Consolidation for the Wholly-Owned Subsidiary. MainStay Multi-Strategy Cayman Fund Ltd. (the “Cayman Subsidiary”) is organized as an exempted limited company under the laws of the Cayman Islands, and is a wholly-owned and controlled subsidiary of the Fund. The Fund and the Cayman Subsidiary are both advised by the Manager, and are subject to the same investment restrictions and guidelines as well as follows the same compliance policies and procedures. The Cayman Subsidiary serves as an investment vehicle for the Fund to enable the Fund to gain exposure to the commodities markets, primarily through investing up to 25% in the aggregate of the Fund’s assets in the equity securities of the Cayman Subsidiary. In pursuing its investment objective, the Cayman Subsidiary is expected to invest, directly or indirectly through the use of derivatives
(including total return swaps), in securities, commodities, commodity-related instruments and other investments. Except where the context otherwise requires, the term “Fund” refers to the Fund together with the Cayman Subsidiary. As of October 31, 2016, net assets of the Cayman Subsidiary were $15,341,519, representing 11.7% of the Fund’s consolidated net assets.
Although the Cayman Subsidiary is otherwise subject to the same fundamental, non-fundamental and certain other investment restrictions as the Fund, the investment programs of the Fund and the Cayman Subsidiary are not necessarily identical. The Fund currently conducts its commodity investment activities only through the Cayman Subsidiary, but retains the ability to invest in additional Cayman Islands subsidiary
| | |
| 52 | | MainStay Absolute Return Multi-Strategy Fund |
entities in the future. The Fund is currently the sole shareholder of the Cayman Subsidiary, and it is expected that the Fund will remain the sole shareholder and will continue to control the Cayman Subsidiary. As a wholly-owned subsidiary of the Fund, all assets, liabilities, income and expenses of the Cayman Subsidiary are consolidated in the financial statements and financial highlights of the Fund, and all significant intercompany balances, revenues and expenses have been eliminated in consolidation.
(W) Commodity Futures Trading Commission Regulation. The Fund and the Cayman Subsidiary operate subject to Commodity Futures Trading Commission (“CFTC”) regulation and the Manager and Candriam France S.A.S. (“Candriam France” or “Subadvisor”) are registered with the CFTC as a commodity pool operator (“CPO”) and Commodity Trading Advisor (“CTA”), respectively, and each a member of the National Futures Association. The Manager and Candriam France act as CPO and CTA, respectively, to the Fund and the Cayman Subsidiary. Accordingly, the Fund and the Manager will comply with certain CFTC rules regarding the disclosure, reporting and recordkeeping requirements that apply with respect to the Fund as a result of the Manager’s registration as a CPO. Generally, these rules allow for substituted compliance with CFTC disclosure and shareholder reporting requirements, based on the Fund’s compliance with comparable SEC requirements. This means that for most of the CFTC’s disclosure and shareholder reporting applicable to the Manager as the Fund’s CPO, the Manager’s compliance with SEC disclosure and shareholder reporting will generally be deemed to fulfill the Manager’s CFTC compliance obligations so long as the Fund operates in compliance with the conditions of CFTC Regulation 4.12.
Candriam France operates the Cayman Subsidiary in accordance with an operational exemption from certain CFTC disclosure, reporting and recordkeeping provisions.
As a result of CFTC regulation with respect to the Fund and the Cayman Subsidiary, the Fund and the Cayman Subsidiary may incur additional compliance and other expenses. The CFTC has neither reviewed nor approved the Fund, the Cayman Subsidiary, their investment strategies, or the Fund’s Prospectus or Statement of Additional Information.
Note 3–Fees and Related Party Transactions
(A) Manager and Subadvisors. New York Life Investments, a registered investment adviser and an indirect, wholly-owned subsidiary of New York Life Insurance Company (“New York Life”), serves as the Fund’s Manager, pursuant to an Amended and Restated Management Agreement (“Management Agreement”). The Manager provides offices, conducts clerical, recordkeeping and bookkeeping services, and keeps most of the financial and accounting records required to be maintained by the Fund. Except for the portion of salaries and expenses that are the responsibility of the Fund, the Manager pays the salaries and expenses of all personnel affiliated with the Fund and certain operational expenses of the Fund. The Fund reimburses New York Life Investments in an amount equal to a portion of the compensation of the Chief Compliance Officer of the Fund. Candriam France, a registered investment adviser serves as a Subadvisor, pursuant to the terms of a Subadvisory Agreement (“Subadvisory Agreement”) between New York Life Investments and Candriam France, is responsible for the day-to-day portfolio management of a portion of the Fund and the Cayman Subsidiary.
Cornerstone Capital Management Holdings LLC (“Cornerstone Holdings” or “Subadvisor”), a registered investment adviser and an indirect, wholly-owned subsidiary of New York Life, serves as a Subadvisor, pursuant to the terms of an amended and restated Subadvisory Agreement between New York Life Investments and Cornerstone Holdings and is responsible for the day-to-day portfolio management of a portion of the Fund. Cushing® Asset Management, LP (“Cushing” or “Subadvisor”), a registered investment adviser, serves as a Subadvisor, pursuant to the terms of a Subadvisory Agreement between New York Life Investments and Cushing, is responsible for the day-to-day portfolio management of a portion of the Fund. MacKay Shields LLC (‘‘MacKay Shields’’ or “Subadvisor,” and together with Candriam France, Cornerstone Holdings and Cushing, the “Subadvisors”), a registered investment adviser and an indirect, wholly-owned subsidiary of New York Life, serves as a Subadvisor, pursuant to the terms of a Subadvisory Agreement between New York Life Investments and MacKay Shields, is responsible for the day-to-day portfolio management of a portion of the Fund. New York Life Investments pays for the services of the Subadvisors.
Under the Management Agreement, the Fund pays the Manager a monthly fee for services performed and facilities furnished at an annual rate of 1.25% of the Fund’s average daily net assets.
The Cayman Subsidiary has entered into a separate advisory agreement with New York Life Investments for the management of the Cayman Subsidiary’s portfolio pursuant to which the Cayman Subsidiary is obligated to pay New York Life Investments a management fee at the same rate that the Fund pays New York Life Investments for services provided to the Fund. New York Life Investments is contractually obligated to waive the management fee it receives from the Fund in an amount equal to the management fee paid to New York Life Investments by the Cayman Subsidiary. This waiver arrangement may not be terminated by New York Life Investments as long as its advisory agreement with the Cayman Subsidiary is in place.
New York Life Investments has contractually agreed to waive fees and/or reimburse expenses so that Total Annual Fund Operating Expenses (excluding taxes, interest, litigation, extraordinary expenses, brokerage and other transaction expenses relating to the purchase or sale of portfolio investments, and acquired (underlying) fund fees and expenses) for Class A shares do not exceed 1.80% of its average daily net assets. New York Life Investments will apply an equivalent waiver or reimbursement, in an equal number of basis points, to the other share classes of the Fund. This agreement will remain in effect until August 31, 2017, and shall renew automatically for one-year terms unless New York Life Investments provides written notice of termination prior to the start of the next term or upon approval by the Board of Trustees of the Fund.
During the six-month period ended October 31, 2016, New York Life Investments earned fees from the Fund in the amount of $859,976 and waived its fees and/or reimbursed expenses in the amount of $491,677.
State Street provides sub-administration and sub-accounting services to the Fund pursuant to an agreement with New York Life Investments. These services include calculating the daily NAVs of the Fund, maintaining the general ledger and sub-ledger accounts for the calculation of the Fund’s NAVs, and assisting New York Life Investments in
Notes to Consolidated Financial Statements (Unaudited) (continued)
conducting various aspects of the Fund’s administrative operations. For providing these services to the Fund, State Street is compensated by New York Life Investments.
(B) Distribution, Service and Shareholder Service Fees. The Trust, on behalf of the Fund, has entered into a distribution agreement with NYLIFE Distributors LLC (the ‘‘Distributor’’), an indirect, wholly-owned subsidiary of New York Life. The Fund has adopted distribution plans (the ‘‘Plans’’) in accordance with the provisions of Rule 12b-1 under the 1940 Act.
Pursuant to the Class A and Investor Class Plans, the Distributor receives a monthly distribution fee from the Class A and Investor Class shares at an annual rate of 0.25% of the average daily net assets of the Class A and Investor Class shares for distribution and/or service activities as designated by the Distributor. Pursuant to the Class C Plan, Class C shares pay the Distributor a monthly distribution fee at an annual rate of 0.75% of the average daily net assets of the Class C shares, along with a service fee at an annual rate of 0.25% of the average daily net assets of the Class C shares, for a total 12b-1 fee of 1.00%. Class I shares are not subject to a distribution and/or service fee.
The Plans provide that the distribution and service fees are payable to the Distributor regardless of the amounts actually expended by the Distributor for distribution of the Fund’s shares and service activities.
(C) Sales Charges. During the six-month period ended October 31, 2016, the Fund was advised by the Distributor that the amount of initial sales charges retained on sales of Class A and Investor Class shares were $3,100 and $1,665, respectively. During the six-month period ended October 31, 2016, the Fund was also advised that the Distributor retained CDSCs on redemptions of Class C shares of $154.
(D) Transfer, Dividend Disbursing and Shareholder Servicing Agent. NYLIM Service Company LLC, an affiliate of New York Life Investments, is the Fund’s transfer, dividend disbursing and shareholder servicing agent pursuant to an agreement between NYLIM Service Company LLC and the Trust. NYLIM Service Company LLC has entered into an agreement with Boston Financial Data Services, Inc. (“BFDS”) pursuant to which BFDS performs certain transfer agent services on behalf of NYLIM Service Company LLC. State Street is the Cayman Subsidiary’s transfer agent pursuant to an agreement between State Street and the Cayman Subsidiary. During the six-month period ended October 31, 2016, transfer agent expenses incurred by the Fund and Cayman Subsidiary were $7,500 and $10,175, respectively.
(E) Small Account Fee. Shareholders with small accounts adversely impact the cost of providing transfer agency services. In an effort to reduce total transfer agency expenses, the Fund has implemented a small account fee on certain types of accounts. Certain shareholders with an account balance of less than $1,000 are charged an annual per account fee of $20 (assessed semi-annually), the proceeds from which offset transfer agent fees as reflected in the Consolidated Statement of Operations.
Note 4–Federal Income Tax
As of April 30, 2016, for federal income tax purposes, capital loss carryforwards of $2,830,998 were available as shown in the table below, to
the extent provided by the regulations to offset future realized gains of the Fund through the years indicated.
| | | | | | | | |
Capital Loss
Available Through | | Short-Term
Capital Loss
Amounts (000’s) | | | Long-Term
Capital Loss
Amounts (000’s) | |
| Unlimited | | $ | 2,611 | | | $ | 220 | |
During the period ended April 30, 2016, the tax character of distributions paid as reflected in the Consolidated Statements of Changes in Net Assets was as follows:
| | | | |
| | | 2016 | |
Distributions paid from: | | | | |
Ordinary Income | | $ | 310,005 | |
Note 5–Custodian
State Street is the custodian of cash and securities held by the Fund. Custodial fees are charged to the Fund based on the Fund’s net assets and/or the market value of securities held by the Fund and the number of certain transactions incurred by the Fund.
Note 6–Line of Credit
The Fund and certain other funds managed by New York Life Investments, maintain a line of credit with a syndicate of banks in order to secure a source of funds for temporary purposes to meet unanticipated or excessive redemption requests.
Effective August 2, 2016, under an amended and restated credit agreement (the “Credit Agreement”), the aggregate commitment amount is $600,000,000 with an additional uncommitted amount of $100,000,000. The commitment fee is an annual rate of 0.15% of the average commitment amount payable quarterly, regardless of usage, to Bank of New York Mellon, who serves as the agent to the syndicate. The commitment fee is allocated among the Fund and certain affiliated funds based upon their respective net assets and other factors. Interest on any revolving credit loan is charged based upon the Federal Funds Advances Rate or the one month LIBOR, whichever is higher. The Credit Agreement expires on August 2, 2017, although the Fund, certain affiliated funds and the syndicate of banks may renew the Credit Agreement for an additional year on the same or different terms. Prior to August 2, 2016, the aggregate commitment amount was $600,000,000 with an additional uncommitted amount of $100,000,000, and the commitment fee was at an annual rate of 0.10% of the average commitment amount. During the six-month period ended October 31, 2016, there were no borrowings made or outstanding with respect to the Fund under the Credit Agreement.
Note 7–Interfund Lending Program
Pursuant to an exemptive order issued by the SEC, the Fund, along with certain other funds managed by New York Life Investments, may participate in an interfund lending program. The interfund lending program provides an alternate credit facility that permits the Fund and certain other funds managed by New York Life Investments to lend or borrow money for temporary purposes directly to or from one another, subject to the conditions of the exemptive order. During the six-month period
| | |
| 54 | | MainStay Absolute Return Multi-Strategy Fund |
ended October 31, 2016, there were no interfund loans made or outstanding with respect to the Fund.
Note 8–Purchases and Sales of Securities (in 000’s)
During the six-month period ended October 31, 2016, purchases of U.S. government securities were $1,817. Purchases and sales of securities, other than U.S. government securities and short-term securities, were $58,474 and $45,286, respectively.
Note 9–Capital Share Transactions
| | | | | | | | |
Class A | | Shares | | | Amount | |
Six-month period ended October 31, 2016: | | | | | | | | |
Shares sold | | | 120,801 | | | $ | 1,204,974 | |
Shares issued to shareholders in reinvestment of dividends and distributions | | | — | | | | — | |
Shares redeemed | | | (46,916 | ) | | | (470,713 | ) |
| | | | | | | | |
Net increase (decrease) in shares outstanding before conversion | | | 73,885 | | | | 734,261 | |
Shares converted into Class A (See Note 1) | | | 10,136 | | | | 100,617 | |
Shares converted from Class A (See Note 1) | | | (6,726 | ) | | | (67,626 | ) |
| | | | | | | | |
Net increase (decrease) | | | 77,295 | | | $ | 767,252 | |
| | | | | | | | |
Period ended April 30, 2016 (a): | | | | | | | | |
Shares sold | | | 639,554 | | | $ | 6,382,426 | |
Shares issued to shareholders in reinvestment of dividends and distributions | | | 337 | | | | 3,314 | |
Shares redeemed | | | (271,227 | ) | | | (2,698,654 | ) |
| | | | | | | | |
Net increase (decrease) in shares outstanding before conversion | | | 368,664 | | | | 3,687,086 | |
Shares converted into Class A (See Note 1) | | | 646 | | | | 6,415 | |
Shares converted from Class A (See Note 1) | | | (2,514 | ) | | | (24,913 | ) |
| | | | | | | | |
Net increase (decrease) | | | 366,796 | | | $ | 3,668,588 | |
| | | | | | | | |
| | |
| | | | | | | | |
Investor Class | | Shares | | | Amount | |
Six-month period ended October 31, 2016: | | | | | | | | |
Shares sold | | | 50,309 | | | $ | 500,554 | |
Shares issued to shareholders in reinvestment of dividends and distributions | | | — | | | | — | |
Shares redeemed | | | (4,875 | ) | | | (48,615 | ) |
| | | | | | | | |
Net increase (decrease) in shares outstanding before conversion | | | 45,434 | | | | 451,939 | |
Shares converted into Investor Class (See Note 1) | | | 6,751 | | | | 67,626 | |
Shares converted from Investor Class (See Note 1) | | | (10,167 | ) | | | (100,617 | ) |
| | | | | | | | |
Net increase (decrease) | | | 42,018 | | | $ | 418,948 | |
| | | | | | | | |
Period ended April 30, 2016 (a): | | | | | | | | |
Shares sold | | | 75,312 | | | $ | 748,098 | |
Shares issued to shareholders in reinvestment of dividends and distributions | | | 17 | | | | 162 | |
Shares redeemed | | | (1,647 | ) | | | (16,247 | ) |
| | | | | | | | |
Net increase (decrease) in shares outstanding before conversion | | | 73,682 | | | | 732,013 | |
Shares converted into Investor Class (See Note 1) | | | 2,519 | | | | 24,913 | |
Shares converted from Investor Class (See Note 1) | | | (647 | ) | | | (6,415 | ) |
| | | | | | | | |
Net increase (decrease) | | | 75,554 | | | $ | 750,511 | |
| | | | | | | | |
| | | | | | | | |
Class C | | Shares | | | Amount | |
Six-month period ended October 31, 2016: | | | | | | | | |
Shares sold | | | 47,290 | | | $ | 467,046 | |
Shares issued to shareholders in reinvestment of dividends and distributions | | | — | | | | — | |
Shares redeemed | | | (4,139 | ) | | | (40,994 | ) |
| | | | | | | | |
Net increase (decrease) | | | 43,151 | | | $ | 426,052 | |
| | | | | | | | |
Period ended April 30, 2016 (a): | | | | | | | | |
Shares sold | | | 38,909 | | | $ | 383,702 | |
Shares issued to shareholders in reinvestment of dividends and distributions | | | 24 | | | | 236 | |
Shares redeemed | | | (8,452 | ) | | | (83,365 | ) |
| | | | | | | | |
Net increase (decrease) | | | 30,481 | | | $ | 300,573 | |
| | | | | | | | |
| | |
| | | | | | | | |
Class I | | Shares | | | Amount | |
Six-month period ended October 31, 2016: | | | | | | | | |
Shares sold | | | 1,910,551 | | | $ | 19,270,425 | |
Shares issued to shareholders in reinvestment of dividends and distributions | | | — | | | | — | |
Shares redeemed | | | (65,908 | ) | | | (663,378 | ) |
| | | | | | | | |
Net increase (decrease) | | | 1,844,643 | | | $ | 18,607,047 | |
| | | | | | | | |
Period ended April 30, 2016 (a): | | | | | | | | |
Shares sold | | | 17,026,526 | | | $ | 169,401,113 | |
Shares issued to shareholders in reinvestment of dividends and distributions | | | 31,095 | | | | 306,293 | |
Shares redeemed | | | (6,468,639 | ) | | | (63,860,916 | ) |
| | | | | | | | |
Net increase (decrease) | | | 10,588,982 | | | $ | 105,846,490 | |
| | | | | | | | |
| (a) | The inception date of the Fund was June 18, 2015. |
Note 10–Recent Accounting Pronouncement
In October 2016, the U.S. Securities and Exchange Commission adopted new rules and amended existing rules (together, “final rules”) intended to modernize the reporting and disclosure of information by registered investment companies. In part, the final rules amend Regulation S-X and require standardized, enhanced disclosure about derivatives in investment company financial statements, as well as other amendments. The compliance date for the amendments to Regulation S-X is August 1, 2017. Management is currently evaluating the impact that the adoption of the amendments to Regulation S-X will have on the Fund’s consolidated financial statements and related disclosures.
Note 11–Subsequent Events
In connection with the preparation of the consolidated financial statements of the Fund as of and for the six-month period ended October 31, 2016, events and transactions subsequent to October 31, 2016, through the date the consolidated financial statements were issued have been evaluated by the Fund’s management for possible adjustment and/or disclosure. No subsequent events requiring financial statement adjustment or disclosure have been identified.
Proxy Voting Policies and Procedures and Proxy Voting Record
A description of the policies and procedures that New York Life Investments uses to vote proxies related to the Fund’s securities is available without charge, upon request, (i) by visiting the Fund’s website at mainstaylnvestments.com; and (ii) on the Securities and Exchange Commission’s (SEC) website at www.sec.gov.
The Fund is required to file with the SEC its proxy voting record for the 12-month period ending June 30 on Form N-PX. The Fund’s most recent Form N-PX or proxy voting record is available free of charge upon request by calling 800-MAINSTAY (624-6782); visiting the Fund’s website at mainstayinvestments.com; or on the SEC’s website at www.sec.gov.
Shareholder Reports and Quarterly Portfolio Disclosure
The Fund is required to file its complete schedule of portfolio holdings with the SEC for its first and third fiscal quarters on Form N-Q. The Fund’s Form N-Q is available without charge, on the SEC’s website at www.sec.gov or by calling MainStay Investments at 800-MAINSTAY (624-6782). You also can obtain and review copies of Form N-Q by visiting the SEC’s Public Reference Room in Washington, DC (information on the operation of the Public Reference Room may be obtained by calling 1-800-SEC-0330).
| | |
| 56 | | MainStay Absolute Return Multi-Strategy Fund |
This page intentionally left blank
This page intentionally left blank
MainStay Funds
MainStay offers a wide range of Funds for virtually any investment need. The full array of MainStay open-end offerings is listed here, with information about the manager, subadvisors, legal counsel and independent registered public accounting firm.
Equity
U.S. Equity
MainStay Common Stock Fund
MainStay Cornerstone Growth Fund
MainStay Epoch U.S. All Cap Fund
MainStay Epoch U.S. Equity Yield Fund
MainStay Epoch U.S. Small Cap Fund
MainStay ICAP Equity Fund
MainStay ICAP Select Equity Fund
MainStay Large Cap Growth Fund
MainStay MAP Fund
MainStay S&P 500 Index Fund
MainStay U.S. Equity Opportunities Fund
International/Global Equity
MainStay Emerging Markets Opportunities Fund
MainStay Epoch Capital Growth Fund
MainStay Epoch Global Choice Fund
MainStay Epoch Global Equity Yield Fund
MainStay Epoch International Small Cap Fund
MainStay ICAP International Fund
MainStay International Equity Fund
MainStay International Opportunities Fund
Income
Taxable Bond
MainStay Floating Rate Fund
MainStay Global High Income Fund
MainStay Government Fund
MainStay High Yield Corporate Bond Fund
MainStay High Yield Opportunities Fund
MainStay Indexed Bond Fund
MainStay Short Duration High Yield Fund
MainStay Total Return Bond Fund
MainStay Unconstrained Bond Fund
Municipal/Tax Advantaged Bond
MainStay California Tax Free Opportunities Fund1
MainStay High Yield Municipal Bond Fund
MainStay New York Tax Free Opportunities Fund2
MainStay Tax Advantaged Short Term Bond Fund
MainStay Tax Free Bond Fund
Money Market
MainStay Money Market Fund
Mixed Asset
MainStay Balanced Fund
MainStay Convertible Fund
MainStay Income Builder Fund
Alternative
MainStay Absolute Return Multi-Strategy Fund
MainStay Cushing Energy Income Fund
MainStay Cushing MLP Premier Fund
MainStay Cushing Renaissance Advantage Fund
Asset Allocation/Target Date
MainStay Conservative Allocation Fund
MainStay Growth Allocation Fund
MainStay Moderate Allocation Fund
MainStay Moderate Growth Allocation Fund
MainStay Retirement 2010 Fund
MainStay Retirement 2020 Fund
MainStay Retirement 2030 Fund
MainStay Retirement 2040 Fund
MainStay Retirement 2050 Fund
MainStay Retirement 2060 Fund
Manager
New York Life Investment Management LLC
New York, New York
Subadvisors
Candriam France S.A.S.3
Paris, France
Cornerstone Capital Management Holdings LLC3
New York, New York
Cushing Asset Management, LP
Dallas, Texas
Epoch Investment Partners, Inc.
New York, New York
Institutional Capital LLC3
Chicago, Illinois
MacKay Shields LLC3
New York, New York
Markston International LLC
White Plains, New York
NYL Investors LLC3
New York, New York
Winslow Capital Management, LLC
Minneapolis, Minnesota
Legal Counsel
Dechert LLP
Washington, District of Columbia
Independent Registered Public Accounting Firm
KPMG LLP
Philadelphia, Pennsylvania
1. This Fund is only registered for sale in AZ, CA, MI (Class A and Class I shares only), NV, OR, TX, UT and WA.
2. This Fund is only registered for sale in CA, CT, DE, FL, MA, NJ, NY and VT.
3. An affiliate of New York Life Investment Management LLC.
Not part of the Semiannual Report
For more information
800-MAINSTAY (624-6782)
mainstayinvestments.com
MainStay Investments® is a registered service mark and name under which New York Life Investment Management LLC does business. MainStay Investments, an indirect subsidiary of New York Life Insurance Company, New York, NY 10010, provides investment advisory products and services. The MainStay Funds® are managed by New York Life Investment Management LLC and distributed by NYLIFE Distributors LLC, 30 Hudson Street, Jersey City, NJ 07302, a wholly owned subsidiary of New York Life Insurance Company. NYLIFE Distributors LLC is a Member FINRA/SIPC.
This report may be distributed only when preceded or accompanied by a current Fund prospectus.
©2016 NYLIFE Distributors LLC. All rights reserved.
| | | | | | | | |
| Not FDIC/NCUA Insured | | Not a Deposit | | May Lose Value | | No Bank Guarantee | | Not Insured by Any Government Agency |
| | |
| 1716477 MS316-16 | | MSARM10-12/16 (NYLIM) NL269 |
MainStay Tax Advantaged Short Term Bond Fund
Message from the President and Semiannual Report
Unaudited | October 31, 2016


This page intentionally left blank
Message from the President
During the six months ended October 31, 2016, the U.S. stock and bond markets were somewhat volatile but generally ended the reporting period in positive territory. When the reporting period began, the stock market was in a broad recovery as oil prices continued to rise from their low point in mid-February 2016. Crude oil prices tended to trade in a range during the reporting period, ending October not far from where they were on May 1, 2016.
In late June, the United Kingdom voted to leave the European Union in a referendum popularly known as “Brexit.” The news caused a temporary slump in stocks around the world. Although the British pound dropped in value following the vote, stocks generally recovered through the end of the reporting period. As the reporting period progressed, however, speculation about the upcoming U.S. presidential election heightened market volatility.
According to FTSE-Russell data, U.S. stocks as a whole tended to provide positive returns during the reporting period, with small-capitalization stocks generally outperforming stocks of larger companies. Value stocks outpaced growth stocks at all capitalization levels, with the largest differences among small- to mid-cap stocks.
International and emerging-market stocks were mixed. Rocked by Brexit, European stocks as a whole declined during the reporting period, while stocks in the Asia-Pacific region (with or without Japan) tended to provide positive returns. International stocks as a whole declined, while global stocks advanced. Emerging-market stocks were considerably stronger, boosted by advances in India and Latin America and prices for oil, metals, and other commodities that were closer to historical norms.
Anticipation of a possible Federal Reserve rate hike led to volatility in the bond market, but the Federal Open Market Committee chose not to raise the federal funds target rate during the reporting period. Short-term U.S. Treasury yields rose during the reporting period, and yields on U.S. Treasury securities with maturities of five years or longer declined. Overall, the U.S. bond market provided positive returns, with longer-term bonds generally outperforming shorter-term securities. High-yield bonds in general—and lower-quality credits in particular—were strong performers. Municipal bonds generally
provided modest but positive total returns for the six months ended October 31, 2016.
Central banks around the world remained highly accommodative during the reporting period, particularly in light of Brexit. Shortly after the U.K. referendum, more than a third of all sovereign debt carried negative yields. As an asset class, emerging-market bonds provided mid-single-digit positive returns during the reporting period, and world bonds as a whole also provided positive returns.
At MainStay, we know that political, economic and market events may influence the performance of your Fund investments. While our portfolio managers often pay close attention to such events, their primary emphasis is seeking to invest for the long-term investment needs of our shareholders. With this in mind, they seek to pursue the investment objectives of their respective Funds using the principal investment strategies and investment processes outlined in the prospectus. By placing your assets in the care of our investment professionals, you gain access to their extensive market insight, strategic investment discipline and in-depth experience in risk-management over a wide range of market cycles.
The report that follows provides more detailed information about the market forces, portfolio strategies and individual securities that influenced the performance of your MainStay Fund during the six months ended October 31, 2016. We invite you to read the report carefully as part of your personal investment-review process.
We thank you for your business, and we look forward to a continuing relationship as you pursue your long-range financial goals.
Sincerely,

Stephen P. Fisher
President
The opinions expressed are as of the date of this report and are subject to change. There is no guarantee that any forecast made will come to pass. This material does not constitute investment advice and is not intended as an endorsement of any specific investment. Past performance is no guarantee of future results.
Not part of the Semiannual Report
Table of Contents
Investors should refer to the Fund’s Summary Prospectus and/or Prospectus and consider the Fund’s investment objectives, strategies, risks, charges and expenses carefully before investing. The Summary Prospectus and/or Prospectus contain this and other information about the Fund. You may obtain copies of the Fund’s Summary Prospectus, Prospectus and Statement of Additional Information free of charge, upon request, by calling toll-free 800-MAINSTAY (624-6782), by writing to NYLIFE Distributors LLC, Attn: MainStay Marketing Department, 30 Hudson Street, Jersey City, NJ 07302 or by sending an e-mail to MainStayShareholderServices@nylim.com. These documents are also available via the MainStay Funds’ website at mainstayinvestments.com/documents. Please read the Summary Prospectus and/or Prospectus carefully before investing.
Investment and Performance Comparison1 (Unaudited)
Performance data quoted represents past performance. Past performance is no guarantee of future results. Because of market volatility and other factors, current performance may be lower or higher than the figures shown. Investment return and principal value will fluctuate, and as a result, when shares are redeemed, they may be worth more or less than their original cost. The graph below depicts the historical performance of Class I shares of the Fund. Performance will vary from class to class based on differences in class-specific expenses and sales charges. For performance information current to the most recent month-end, please call 800-MAINSTAY (624-6782) or visit mainstayinvestments.com.
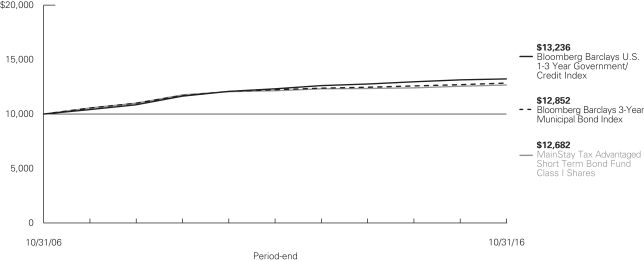
Average Annual Total Returns for the Period Ended October 31, 2016
| | | | | | | | | | | | | | | | | | | | | | | | |
| Class | | Sales Charge | | | | Six Months | | | One Year | | | Five Years | | | Ten Years | | | Gross
Expense
Ratio2 | |
| Class A Shares | | Maximum 1% Initial Sales Charge3 | | With sales charges Excluding sales charges | |
| –2.85
0.15 | %
| |
| –0.13
0.88 | %
| |
| 0.00
0.61 | %
| |
| 1.83
2.14 | %
| |
| 1.12
1.12 | %
|
| Investor Class Shares4 | | Maximum 1% Initial Sales Charge3 | | With sales charges Excluding sales charges | |
| –3.03
–0.03 |
| |
| –0.45
0.55 |
| |
| –0.36
0.25 |
| |
| 1.53
1.84 |
| |
| 1.48
1.48 |
|
| Class I Shares | | No Sales Charge | | | | | 0.28 | | | | 1.14 | | | | 0.87 | | | | 2.40 | | | | 0.87 | |
| 1. | The performance table and graph do not reflect the deduction of taxes that a shareholder would pay on distributions or Fund share redemptions. Total returns reflect maximum applicable sales charges as indicated in the table above, if any, changes in share price, and reinvestment of dividend and capital gain distributions. The graph assumes the initial investment amount shown above and reflects the deduction of all sales charges that would have applied for the period of investment. Performance figures may reflect certain fee waivers and/or expense limitations, without which total returns may have been lower. For more information on share classes and current fee waivers and/or expense limitations (if any), please refer to the notes to the financial statements. |
| 2. | The gross expense ratios presented reflect the Fund’s “Total Annual Fund Operating Expenses” from the most recent Prospectus and may differ from other expense ratios disclosed in this report. |
| 3. | The maximum initial sales charge prior to June 1, 2015 was 3.00%. |
| 4. | Performance figures for Investor Class shares, first offered on February 28, 2008, include the historical performance of Class A shares through February 27, 2008, adjusted for differences in certain fees and expenses. Unadjusted, the performance shown for the Investor Class shares would likely have been different. |
The footnotes on the next page are an integral part of the table and graph and should be carefully read in conjunction with them.
| | | | | | | | | | | | | | | | |
| Benchmark Performance | | Six
Months | | | One
Year | | | Five
Years | | | Ten
Years | |
Bloomberg Barclays 3-Year Municipal Bond Index5 | | | 0.07 | % | | | 0.82 | % | | | 1.47 | % | | | 2.84 | % |
Bloomberg Barclays U.S. 1-3 Year Government/Credit Index6 | | | 0.52 | | | | 1.31 | | | | 1.00 | | | | 2.54 | |
Average Lipper Short U.S. Government Fund7 | | | 0.32 | | | | 0.72 | | | | 0.43 | | | | 1.95 | |
| 5. | The Bloomberg Barclays 3-Year Municipal Bond Index is the Fund’s primary broad-based securities-market index for comparison purposes. The Bloomberg Barclays 3-Year Municipal Bond Index is considered representative of the broad market for investment grade, tax-exempt bonds with a maturity range of 2-4 years. Results assume reinvestment of all dividends and capital gains. An investment cannot be made directly into an index. |
| 6. | The Bloomberg Barclays U.S. 1-3 Year Government/Credit Index is the Fund’s secondary benchmark. The Bloomberg Barclays U.S. 1-3 Year Government/Credit Index includes investment grade corporate debt issues as well as debt issues of U.S. government agencies and the U.S. Treasury, |
| | with maturities of one to three years. Results assume reinvestment of all dividends and capital gains. An investment cannot be made directly in an index. |
| 7. | The Average Lipper Short U.S. Government Fund is representative of funds that invest primarily in securities issued or guaranteed by the U.S. government, its agencies, or its instrumentalities, with dollar-weighted average maturities of less than three years. This benchmark is a product of Lipper Inc. Lipper Inc. is an independent monitor of fund performance. Results are based on average total returns of similar funds with all dividend and capital gain distributions reinvested. |
The footnotes on the preceding page are an integral part of the table and graph and should be carefully read in conjunction with them.
| | |
| 6 | | MainStay Tax Advantaged Short Term Bond Fund |
Cost in Dollars of a $1,000 Investment in MainStay Tax Advantaged Short Term Bond Fund (Unaudited)
The example below is intended to describe the fees and expenses borne by shareholders during the six-month period from May 1, 2016, to October 31, 2016, and the impact of those costs on your investment.
Example
As a shareholder of the Fund, you incur two types of costs: (1) transaction costs, including exchange fees and sales charges (loads) on purchases (as applicable), and (2) ongoing costs, including management fees, distribution and/or service (12b-1) fees, and other Fund expenses (as applicable). This example is intended to help you understand your ongoing costs (in dollars) of investing in the Fund and to compare these costs with the ongoing costs of investing in other mutual funds. The example is based on an investment of $1,000 made at the beginning of the six-month period and held for the entire period from May 1, 2016, to October 31, 2016.
This example illustrates your Fund’s ongoing costs in two ways:
Actual Expenses
The second and third data columns in the table below provide information about actual account values and actual expenses. You may use the information in these columns, together with the amount you invested, to estimate the expenses that you paid during the six months ended October 31, 2016. Simply divide your account value by $1,000 (for example, an $8,600 account value divided by $1,000 = 8.6), then
multiply the result by the number under the heading entitled “Expenses Paid During Period” to estimate the expenses you paid on your account during this period.
Hypothetical Example for Comparison Purposes
The fourth and fifth data columns in the table below provide information about hypothetical account values and hypothetical expenses based on the Fund’s actual expense ratio and an assumed rate of return of 5% per year before expenses, which is not the Fund’s actual return. The hypothetical account values and expenses may not be used to estimate the actual ending account balances or expenses you paid for the six-month period shown. You may use this information to compare the ongoing costs of investing in the Fund with the ongoing costs of investing in other Funds. To do so, compare this 5% hypothetical example with the 5% hypothetical examples that appear in the shareholder reports of the other Funds.
Please note that the expenses shown in the table are meant to highlight your ongoing costs only and do not reflect any transactional costs, such as exchange fees or sales charges (loads). Therefore, the fourth and fifth data columns of the table are useful in comparing ongoing costs only and will not help you determine the relative total costs of owning different funds. In addition, if these transactional costs were included, your costs would have been higher.
| | | | | | | | | | | | | | | | | | | | |
| | | | | | | | | | | | | | | | |
| Share Class | | Beginning
Account
Value
5/1/16 | | | Ending Account
Value (Based
on Actual
Returns and
Expenses)
10/31/16 | | | Expenses
Paid
During
Period1 | | | Ending Account
Value (Based
on Hypothetical
5% Annualized
Return and
Actual Expenses)
10/31/16 | | | Expenses
Paid
During
Period1 | |
| | | | | |
| Class A Shares | | $ | 1,000.00 | | | $ | 1,001.50 | | | $ | 3.99 | | | $ | 1,021.20 | | | $ | 4.02 | |
| | | | | |
| Investor Class Shares | | $ | 1,000.00 | | | $ | 999.70 | | | $ | 5.75 | | | $ | 1,019.50 | | | $ | 5.80 | |
| | | | | |
| Class I Shares | | $ | 1,000.00 | | | $ | 1,002.80 | | | $ | 2.73 | | | $ | 1,022.50 | | | $ | 2.75 | |
| 1. | Expenses are equal to the Fund’s annualized expense ratio of each class (0.79% for Class A, 1.14% for Investor Class and 0.54% for Class I) multiplied by the average account value over the period, divided by 365 and multiplied by 184 (to reflect the six-month period). The table above represents the actual expenses incurred during the six-month period. |
Portfolio Composition as of October 31, 2016 (Unaudited)
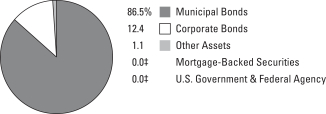
See Portfolio of Investments beginning on page 11 for specific holdings within these categories.
| ‡ | Less than one-tenth of a percent. |
Top Ten Issuers Held as of October 31, 2016 (Unaudited)
| 1. | Commonwealth of Puerto Rico, Public Improvement, Unlimited General Obligation, 4.75%–5.50%, due 7/1/17–7/1/20 |
| 2. | Illinois Finance Authority, National Louis University, Revenue Bonds, 0.63%, due 6/1/29 |
| 3. | Irvine Ranch Water District, Improvement District-Consolidated, Special Assessment, 0.46%, due 10/1/41 |
| 4. | City of New York NY, Unlimited General Obligation, 0.51%, due 6/1/44 |
| 5. | Health & Educational Facilities Authority of the State of Missouri, St. Louis University, Revenue Bonds, 0.50%, due 10/1/24 |
| 6. | County of Beaver PA, Unlimited General Obligation, 1.948%–2.18%, due 11/15/18–11/15/19 |
| 7. | Shelby County Health Educational & Housing Facilities Board, Methodist Le Bonheur Healthcare, Revenue Bonds, 0.51%, due 6/1/42 |
| 8. | Butler County General Authority, South Park School District Project, Revenue Bonds, 0.70%, due 8/1/27 |
| 9. | Iowa Higher Education Loan Authority, Private College Facility- Des Moines, Revenue Bonds, 0.53%, due 10/1/33 |
| 10. | State of Illinois, Unlimited General Obligation, 5.00%–5.50%, due 1/1/17–8/1/18 |
| | |
| 8 | | MainStay Tax Advantaged Short Term Bond Fund |
Portfolio Management Discussion and Analysis (Unaudited)
Questions answered by portfolio managers Dan Roberts, PhD, Louis N. Cohen, CFA, Claude Athaide, PhD, CFA, John Loffredo, CFA, Robert DiMella, CFA, Michael Petty, David Dowden, Scott Sprauer and Frances Lewis of MacKay Shields LLC, the Fund’s Subadvisor.
How did MainStay Tax Advantaged Short Term Bond Fund perform relative to its benchmarks and peers during the six months ended October 31, 2016?
Excluding all sales charges, MainStay Tax Advantaged Short Term Bond Fund returned 0.15% for Class A shares and –0.03% for Investor Class shares for the six months ended October 31, 2016. Over the same period, Class I shares returned 0.28%. For the six months ended October 31, 2016, the Fund’s Class A and Class I shares outperformed—and Investor Class shares underperformed—the 0.07% return of the Bloomberg Barclays 3-Year Municipal Bond Index,1 which is the Fund’s primary benchmark. Over the same period, all share classes underperformed the 0.52% return of the Bloomberg Barclays U.S. 1–3 Year Government/Credit Index,1 which is the Fund’s secondary benchmark. For the six months ended October 31, 2016, all share classes underperformed the 0.32% return of the Average Lipper2 Short U.S. Government Fund. See page 5 for Fund returns with applicable sales charges.
What factors affected the Fund’s relative performance during the reporting period?
The Fund had exposure to taxable municipal bonds and other fixed-income securities that were not represented in the Bloomberg Barclays 3-Year Municipal Bond Index. These lower-rated investment-grade taxable securities saw their prices increase and yield spreads3 tighten, which had a positive impact on relative performance as investors looked for attractive opportunities in short-maturity bonds. Overweight positions in insured Puerto Rico bonds, local general obligation bonds and California credits were positive contributors to the Fund’s performance relative to the Index. On the other hand, overweight exposure to a number of New Jersey and U.S. Virgin Island credits detracted from the Fund’s performance relative to the Bloomberg Barclays 3-Year Municipal Bond Index during the reporting period.
What was the Fund’s duration4 strategy during the reporting period?
Overall, our strategy was to keep the Fund’s duration close to that of its investable universe, which includes investment-grade
municipal bonds, taxable fixed-income bonds, and insured and uninsured bonds of U.S. territories (Puerto Rico, Guam and the U.S. Virgin Islands). At times, depending on conditions in the fixed-income markets, seasonal technicals (supply and demand), and our outlook for what lies ahead, we may adjust the Fund’s duration modestly shorter or longer. During the reporting period, the Fund’s duration was shorter than that of the Bloomberg Barclays 3-Year Municipal Bond Index because we anticipated that the Federal Reserve would raise the federal funds target rate and the potential adverse impact such action might have on short-term bond prices. The Fund ended the reporting period with a duration of 1.63 years.
What specific factors, risks or market forces prompted significant decisions for the Fund during the reporting period?
We believed that the Federal Reserve’s desire to increase the federal funds target rate—along with strong industry cash flows and strong demand for bonds with attractive yields—would produce changes in the shape of the yield curve5 and alter credit spreads. We found attractive opportunities in the primary and secondary market among bonds with maturities of less than four years with an emphasis on credits rated A and BBB,6 as spreads were elevated and dealer capital had been dramatically reduced. Insured and uninsured Puerto Rico securities performed well during the reporting period as the passage of a debt restructuring law (PROMESA) and the establishment of a federal oversight board was viewed constructively by investors who bid prices higher. The Fund maintained its Puerto Rico exposure with heavy emphasis on bonds insured by a monoline insurance company. The Fund also maintained an increased level of liquidity because of large cash inflows and our desire to take advantage of opportunities during bouts of volatility in the market.
| 1. | See footnote on page 6 for more information on this index. |
| 2. | See footnote on page 6 for more information on Lipper Inc. |
| 3. | The terms “spread” and “yield spread” may refer to the difference in yield between a security or type of security and comparable U.S. Treasury issues. The terms may also refer to the difference in yield between two specific securities or types of securities at a given time. The term “credit spread” typically refers to the difference in yield between corporate or municipal bonds (or a specific category of these bonds) and comparable U.S. Treasury issues. |
| 4. | Duration is a measure of the price sensitivity of a fixed-income investment to changes in interest rates. Duration is expressed as a number of years and is considered a more accurate sensitivity gauge than average maturity. |
| 5. | The yield curve is a line that plots the yields of various securities of similar quality—typically U.S. Treasury issues—across a range of maturities. The U.S. Treasury yield curve serves as a benchmark for other debt and is used in economic forecasting. |
| 6. | An obligation rated ‘A’ by Standard & Poor’s (“S&P”) is deemed by S&P to be somewhat more susceptible to the adverse effects of changes in circumstances and economic conditions than obligations in higher-rated categories. In the opinion of S&P, however, the obligor’s capacity to meet its financial commitment on the obligation is still strong. An obligation rated ‘BBB’ by S&P is deemed by S&P to exhibit adequate protection parameters. In the opinion of S&P, however, adverse economic conditions or changing circumstances are more likely to lead to a weakened capacity of the obligor to meet its financial commitment on the obligation. When applied to Fund holdings, ratings are based solely on the creditworthiness of the bonds in the portfolio and are not meant to represent the security or safety of the Fund. |
During the reporting period, which sectors were the strongest positive contributors to the Fund’s performance and which sectors were particularly weak?
The most substantial positive contributions to the Fund’s performance during the reporting period came from local general obligation, special tax and corporate-backed bonds. (Contributions take weightings and total returns into account.) Detracting from performance was the Fund’s exposure to education, housing and hospital-backed bonds.
How did the Fund’s sector weightings change during the reporting period?
The prevalent sectors in the Fund—such as local general obligation, special tax, lease-backed and hospital bonds—reflected our desire to construct a reasonably well-diversified Fund, include exposure to infrequent municipal issuers and maintain a bias toward individual security selection (as opposed to a top-
down approach to portfolio construction). During the reporting period, the Fund increased its exposure to special tax and higher education–backed bonds, as well as bonds issued for financial-backed companies in the corporate market. During the reporting period, the Fund reduced its exposures to hospital-backed and locally issued general obligation bonds.
How was the Fund positioned at the end of the reporting period?
As of October 31, 2016, the Fund continued to hold overweight positions relative to the Bloomberg Barclays 3-Year Municipal Bond Index in credits rated A and BBB, taxable fixed-income securities and insured Puerto Rico bonds. As of the same date, the Fund held underweight positions relative to the Index in securities rated AAA and AA+,7 prerefunded bonds and state general obligation bonds. (Prerefunded securities are securities repurchased by the issuer prior to the first call date.)
| 7. | An obligation rated ‘AAA’ has the highest rating assigned by S&P, and in the opinion of S&P, the obligor’s capacity to meet its financial commitment on the obligation is extremely strong. An obligation rated ‘AA’ by S&P is deemed by S&P to differ from the highest-rated obligations only to a small degree. In the opinion of S&P, the obligor’s capacity to meet its financial commitment on the obligation is very strong. Ratings from ‘AA’ to ‘CCC’ may be modified by the addition of a plus (+) or minus (–) sign to show relative standing within the major rating categories. When applied to Fund holdings, ratings are based solely on the creditworthiness of the bonds in the portfolio and are not meant to represent the security or safety of the Fund. |
The opinions expressed are those of the portfolio managers as of the date of this report and are subject to change. There is no guarantee that any forecasts will come to pass. This material does not constitute investment advice and is not intended as an endorsement of any specific investment.
| | |
| 10 | | MainStay Tax Advantaged Short Term Bond Fund |
Portfolio of Investments October 31, 2016
| | | | | | | | |
| | | Principal
Amount | | | Value | |
Long-Term Bonds 98.9%† Corporate Bonds 12.4% | | | | | | | | |
Agriculture 0.3% | | | | | | | | |
Japan Tobacco, Inc.
2.10%, due 7/23/18 (a) | | $ | 1,070,000 | | | $ | 1,079,818 | |
| | | | | | | | |
| | |
Auto Manufacturers 0.5% | | | | | | | | |
Daimler Finance North America LLC
1.375%, due 8/1/17 (a) | | | 380,000 | | | | 380,114 | |
Ford Motor Credit Co. LLC
2.375%, due 3/12/19 | | | 1,500,000 | | | | 1,512,869 | |
| | | | | | | | |
| | | | | | | 1,892,983 | |
| | | | | | | | |
Banks 7.0% | | | | | | | | |
Bank of America Corp. | | | | | | | | |
2.00%, due 1/11/18 | | | 305,000 | | | | 306,345 | |
2.65%, due 4/1/19 | | | 1,710,000 | | | | 1,741,792 | |
5.65%, due 5/1/18 | | | 1,000,000 | | | | 1,057,739 | |
BB&T Corp.
1.60%, due 8/15/17 | | | 915,000 | | | | 917,495 | |
Capital One Financial Corp.
2.45%, due 4/24/19 | | | 900,000 | | | | 915,224 | |
Capital One N.A.
1.50%, due 3/22/18 | | | 1,000,000 | | | | 998,790 | |
Citigroup, Inc.
2.55%, due 4/8/19 | | | 2,975,000 | | | | 3,028,732 | |
Citizens Bank N.A. | | | | | | | | |
2.30%, due 12/3/18 | | | 900,000 | | | | 909,718 | |
2.50%, due 3/14/19 | | | 310,000 | | | | 314,469 | |
Goldman Sachs Group, Inc. (The) | | | | | | | | |
2.90%, due 7/19/18 | | | 1,080,000 | | | | 1,101,903 | |
7.50%, due 2/15/19 | | | 2,000,000 | | | | 2,248,568 | |
HSBC USA, Inc.
2.25%, due 6/23/19 | | | 1,000,000 | | | | 1,006,419 | |
Huntington National Bank (The)
2.20%, due 11/6/18 | | | 2,000,000 | | | | 2,018,916 | |
JPMorgan Chase & Co.
6.30%, due 4/23/19 | | | 3,000,000 | | | | 3,325,455 | |
Morgan Stanley | | | | | | | | |
2.375%, due 7/23/19 | | | 1,225,000 | | | | 1,241,823 | |
2.45%, due 2/1/19 | | | 2,400,000 | | | | 2,436,960 | |
7.30%, due 5/13/19 | | | 1,000,000 | | | | 1,130,732 | |
Wells Fargo & Co.
2.125%, due 4/22/19 | | | 1,709,000 | | | | 1,728,045 | |
| | | | | | | | |
| | | | | | | 26,429,125 | |
| | | | | | | | |
Biotechnology 0.2% | | | | | | | | |
Celgene Corp.
2.30%, due 8/15/18 | | | 900,000 | | | | 911,214 | |
| | | | | | | | |
| | | | | | | | |
| | | Principal
Amount | | | Value | |
Food 0.3% | | | | | | | | |
J.M. Smucker Co. (The)
1.75%, due 3/15/18 | | $ | 205,000 | | | $ | 205,803 | |
Sysco Corp.
5.375%, due 3/17/19 | | | 1,000,000 | | | | 1,082,937 | |
| | | | | | | | |
| | | | | | | 1,288,740 | |
| | | | | | | | |
Health Care—Products 0.3% | | | | | | | | |
Stryker Corp.
2.00%, due 3/8/19 | | | 975,000 | | | | 983,970 | |
| | | | | | | | |
| | |
Insurance 0.7% | | | | | | | | |
American International Group, Inc.
2.30%, due 7/16/19 | | | 2,000,000 | | | | 2,029,364 | |
Voya Financial, Inc.
2.90%, due 2/15/18 | | | 763,000 | | | | 775,570 | |
| | | | | | | | |
| | | | | | | 2,804,934 | |
| | | | | | | | |
Oil & Gas 0.7% | | | | | | | | |
Chevron Corp.
4.95%, due 3/3/19 | | | 445,000 | | | | 480,333 | |
Phillips 66
2.95%, due 5/1/17 | | | 285,000 | | | | 287,909 | |
Shell International Finance B.V.
1.625%, due 11/10/18 | | | 1,000,000 | | | | 1,002,227 | |
Total Capital International S.A.
2.125%, due 1/10/19 | | | 1,000,000 | | | | 1,014,981 | |
| | | | | | | | |
| | | | | | | 2,785,450 | |
| | | | | | | | |
Pharmaceuticals 1.1% | | | | | | | | |
AbbVie, Inc.
2.00%, due 11/6/18 | | | 750,000 | | | | 755,639 | |
Express Scripts Holding Co.
2.25%, due 6/15/19 | | | 1,000,000 | | | | 1,012,060 | |
Teva Pharmaceutical Finance Netherlands III B.V.
1.70%, due 7/19/19 | | | 440,000 | | | | 436,587 | |
Zoetis, Inc.
1.875%, due 2/1/18 | | | 2,000,000 | | | | 2,003,886 | |
| | | | | | | | |
| | | | | | | 4,208,172 | |
| | | | | | | | |
Real Estate 0.3% | | | | | | | | |
Prologis, L.P. 2.
75%, due 2/15/19 | | | 1,000,000 | | | | 1,024,791 | |
| | | | | | | | |
| | |
Real Estate Investment Trusts 0.7% | | | | | | | | |
Boston Properties, L.P.
3.70%, due 11/15/18 | | | 1,000,000 | | | | 1,037,707 | |
Welltower, Inc.
4.125%, due 4/1/19 | | | 1,500,000 | | | | 1,571,991 | |
| | | | | | | | |
| | | | | | | 2,609,698 | |
| | | | | | | | |
| † | Percentages indicated are based on Fund net assets. |
| ¨ | | Among the Fund’s 10 largest issuers held, as of October 31, 2016, excluding short-term investment. May be subject to change daily. (Unaudited) |
| | | | | | |
The notes to the financial statements are an integral part of,
and should be read in conjunction with, the financial statements. | | | | | 11 | |
Portfolio of Investments October 31, 2016 (continued)
| | | | | | | | |
| | | Principal
Amount | | | Value | |
| Corporate Bonds (continued) | |
Telecommunications 0.3% | | | | | | | | |
AT&T, Inc.
5.80%, due 2/15/19 | | $ | 1,000,000 | | | $ | 1,086,288 | |
| | | | | | | | |
Total Corporate Bonds
(Cost $46,886,871) | | | | 47,105,183 | |
| | | | | | | | |
|
| Mortgage-Backed Securities 0.0%‡ | |
Commercial Mortgage Loans (Collateralized Mortgage Obligations) 0.0%‡ | |
LB-UBS Commercial Mortgage Trust
Series 2004-C1, Class A4
4.568%, due 1/15/31 | | | 46,011 | | | | 45,996 | |
| | | | | | | | |
Total Mortgage-Backed Securities
(Cost $46,694) | | | | 45,996 | |
| | | | | | | | |
|
| Municipal Bonds 86.5% | |
Alabama 0.8% | | | | | | | | |
Calhoun County Board of Education, Special Tax
Insured: BAM
3.00%, due 2/1/19 | | | 200,000 | | | | 207,580 | |
Houston County Health Care Authority, Southeast Alabama Medical, Revenue Bonds
3.00%, due 10/1/17 | | | 185,000 | | | | 187,684 | |
Industrial Development Board of the City of Mobile Alabama, Alabama Power Co.-Barry Plant, Revenue Bonds
1.625%, due 7/15/34 (b) | | | 250,000 | | | | 251,865 | |
Jasper Water & Sewer Board Inc., Revenue Bonds | |
4.00%, due 6/1/18 | | | 705,000 | | | | 736,655 | |
4.00%, due 6/1/19 | | | 500,000 | | | | 535,305 | |
Water Works Board of the City of Birmingham, Revenue Bonds
Series C
1.509%, due 1/1/19 | | | 1,000,000 | | | | 999,120 | |
| | | | | | | | |
| | | | 2,918,209 | |
| | | | | | | | |
Alaska 0.1% | |
Alaska Railroad Corp., Revenue Bonds Series A
5.00%, due 8/1/18 | | | 500,000 | | | | 531,475 | |
| | | | | | | | |
|
Arizona 1.4% | |
City of Tucson AZ, Certificates of Participation Insured: AGM
4.00%, due 7/1/20 | | | 350,000 | | | | 383,197 | |
Mohave County, Unified School District No. 20 Kingman, Unlimited General Obligation Insured: BAM
3.00%, due 7/1/20 | | | 1,505,000 | | | | 1,584,133 | |
| | | | | | | | |
| | | Principal
Amount | | | Value | |
Arizona (continued) | |
Pima County, Unified School District No. 1 Tucson, Limited General Obligation Insured: BAM
4.00%, due 7/1/20 | | $ | 580,000 | | | $ | 636,979 | |
Pima County, Unified School District No. 16 Catalina Foothills, Unlimited General Obligation | | | | | | | | |
3.00%, due 7/1/18 | | | 1,315,000 | | | | 1,355,029 | |
3.00%, due 7/1/19 | | | 1,165,000 | | | | 1,217,041 | |
| | | | | | | | |
| | | | 5,176,379 | |
| | | | | | | | |
Arkansas 0.4% | |
Arkansas Development Finance Authority, Baptist Health System Inc., Revenue Bonds Series A
4.00%, due 12/1/17 | | | 375,000 | | | | 387,364 | |
County of Baxter AR, Baxter Regional Medical Center, Revenue Bonds | | | | | | | | |
Series A
5.00%, due 9/1/17 | | | 305,000 | | | | 314,656 | |
Series A
5.00%, due 9/1/20 | | | 785,000 | | | | 878,501 | |
| | | | | | | | |
| | | | 1,580,521 | |
| | | | | | | | |
California 9.6% | |
Auburn Urban Development Authority Successor Agency, Auburn Redevelopment Project, Tax Allocation
Insured: BAM
4.00%, due 6/1/18 | | | 135,000 | | | | 141,294 | |
Insured: BAM 4.00%, due 6/1/19 | | | 140,000 | | | | 150,188 | |
Avalon Community Improvement Agency Successor Agency, Tax Allocation
Series A, Insured: AGM
4.00%, due 9/1/18 | | | 300,000 | | | | 316,473 | |
California Health Facilities Financing Authority, NV Methodist Homes, Revenue Bonds
3.00%, due 7/1/18 | | | 285,000 | | | | 294,875 | |
California Municipal Finance Authority, Harbor Regional Center Project, Revenue Bonds
4.00%, due 11/1/18 | | | 740,000 | | | | 781,048 | |
California Municipal Finance Authority, Inland Regional Center Project, Revenue Bonds
2.00%, due 6/15/18 | | | 1,205,000 | | | | 1,222,569 | |
California School Finance Authority, Aspire Public Schools, Revenue Bonds | | | | | | | | |
Series A
3.00%, due 8/1/17 (a) | | | 130,000 | | | | 131,780 | |
Series A
5.00%, due 8/1/19 (a) | | | 130,000 | | | | 142,030 | |
| | | | |
| 12 | | MainStay Tax Advantaged Short Term Bond Fund | | The notes to the financial statements are an integral part of,
and should be read in conjunction with, the financial statements. |
| | | | | | | | |
| | | Principal
Amount | | | Value | |
| Municipal Bonds (continued) | |
California (continued) | |
California Statewide Communities Development Authority, Inland Regional Center Project, Revenue Bonds
5.375%, due 12/1/37 | | $ | 50,000 | | | $ | 52,537 | |
Charter Oak Unified School District, Unlimited General Obligation
Insured: AGM
4.00%, due 8/1/18 | | | 435,000 | | | | 458,068 | |
City of Industry CA, Senior, Revenue Bonds | | | | | | | | |
Series A, Insured: AGM
1.88%, due 1/1/18 | | | 355,000 | | | | 357,662 | |
Series A, Insured: AGM
2.125%, due 1/1/19 | | | 985,000 | | | | 998,701 | |
City of Oakland CA, Revenue Bonds Insured: AGM
(zero coupon), due 12/15/19 | | | 1,000,000 | | | | 940,610 | |
City of San Francisco CA, Public Utilities Commission Water, Build America Bonds, Revenue Bonds
Series B, Insured: BAM
4.10%, due 11/1/17 | | | 315,000 | | | | 324,551 | |
Commerce Community Development Commission Successor Agency, Tax Allocation
Series B, Insured: AGM
2.00%, due 8/1/19 | | | 1,890,000 | | | | 1,897,201 | |
County of San Diego CA, Sanford Burnham Prebys Medical Discovery Institute, Revenue Bonds | | | | | | | | |
4.00%, due 11/1/17 | | | 400,000 | | | | 412,676 | |
5.00%, due 11/1/18 | | | 400,000 | | | | 431,892 | |
Del Mar Race Track Authority, Revenue Bonds
4.00%, due 10/1/18 | | | 1,230,000 | | | | 1,288,486 | |
Industry Public Finance Authority, Transportation Distribution-Industrial Redevelopment Project, Tax Allocation | | | | | | | | |
Series B, Insured: AGM
3.039%, due 1/1/19 | | | 4,000,000 | | | | 4,137,640 | |
Series A, Insured: AGM
5.00%, due 1/1/18 | | | 700,000 | | | | 733,390 | |
¨Irvine Ranch Water District, Improvement District-Consolidated, Special Assessment Series B
0.46%, due 10/1/41 (b) | | | 7,000,000 | | | | 7,000,000 | |
Monrovia Redevelopment Agency Successor Agency, Central Redevelopment Project, Tax Allocation
Series A, Insured: AGM
2.50%, due 5/1/19 | | | 600,000 | | | | 610,080 | |
| | | | | | | | |
| | | Principal
Amount | | | Value | |
California (continued) | |
Moreno Valley Public Financing Authority, Revenue Bonds
Insured: AGM
2.25%, due 11/1/18 | | $ | 105,000 | | | $ | 105,772 | |
Municipal Improvement Corp. of Los Angeles, Revenue Bonds
Series A
2.846%, due 11/1/19 | | | 5,015,000 | | | | 5,223,273 | |
Ramona Unified School District Community Facilities District No. 92-1, Certificates of Participation
Insured: BAM
4.00%, due 5/1/18 | | | 1,245,000 | | | | 1,302,121 | |
Sacramento Public Financing Authority, Golden 1 Center, Revenue Bonds
2.51%, due 4/1/18 | | | 750,000 | | | | 755,887 | |
Sacramento Redevelopment Agency Successor Agency, Tax Allocation
Series B, Insured: BAM
2.695%, due 12/1/19 | | | 965,000 | | | | 997,443 | |
San Bernardino City Unified School District, Election of 2012, Unlimited General Obligation | | | | | | | | |
Series C, Insured: AGM
4.00%, due 8/1/17 | | | 250,000 | | | | 256,025 | |
Series C, Insured: AGM
5.00%, due 8/1/18 | | | 300,000 | | | | 321,105 | |
San Diego Redevelopment Agency Successor Agency, Tax Allocation | | | | | | | | |
Series B
2.00%, due 9/1/18 | | | 250,000 | | | | 252,202 | |
Series B
2.25%, due 9/1/19 | | | 250,000 | | | | 253,900 | |
Series B
2.625%, due 9/1/20 | | | 200,000 | | | | 204,462 | |
San Francisco City & County Redevelopment Agency, Mission Bay South Redevelopment Project, Tax Allocation | | | | | | | | |
Series B
3.00%, due 8/1/18 | | | 320,000 | | | | 331,091 | |
Series C
3.00%, due 8/1/18 | | | 765,000 | | | | 791,515 | |
Series B
4.00%, due 8/1/19 | | | 520,000 | | | | 560,924 | |
Series C
4.00%, due 8/1/19 | | | 700,000 | | | | 755,090 | |
Sierra Kings Health Care District, Unlimited General Obligation | | | | | | | | |
4.00%, due 8/1/17 | | | 220,000 | | | | 224,906 | |
4.00%, due 8/1/18 | | | 200,000 | | | | 209,648 | |
Stanton Redevelopment Agency, Stanton Consol Redevelopment, Tax Allocation Series B, Insured: BAM
2.00%, due 12/1/19 | | | 260,000 | | | | 260,902 | |
| | | | | | |
The notes to the financial statements are an integral part of,
and should be read in conjunction with, the financial statements. | | | | | 13 | |
Portfolio of Investments October 31, 2016 (continued)
| | | | | | | | |
| | | Principal
Amount | | | Value | |
| Municipal Bonds (continued) | |
California (continued) | |
Stockton Public Financing Authority, Special Tax
Series A, Insured: BAM
4.00%, due 9/2/20 | | $ | 575,000 | | | $ | 632,138 | |
| | | | | | | | |
| | | | | | | 36,262,155 | |
| | | | | | | | |
Colorado 0.5% | | | | | | | | |
City of Glendale CO, Revenue Bonds
Insured: AGM
1.574%, due 12/1/17 | | | 250,000 | | | | 251,685 | |
Colorado Health Facilities Authority, Evangelical Lutheran Good, Revenue Bonds
3.00%, due 6/1/18 | | | 500,000 | | | | 513,780 | |
E-470 Public Highway Authority, Revenue Bonds | | | | | | | | |
Series A 2.00%, due 9/1/17 | | | 230,000 | | | | 231,366 | |
Series A 5.00%, due 9/1/19 | | | 1,000,000 | | | | 1,105,420 | |
| | | | | | | | |
| | | | | | | 2,102,251 | |
| | | | | | | | |
Connecticut 1.3% | | | | | | | | |
City of Bridgeport CT, Unlimited General Obligation
Series D, Insured: AGM
5.00%, due 8/15/20 | | | 1,000,000 | | | | 1,125,920 | |
City of Hartford CT, Unlimited General Obligation | | | | | | | | |
Series A, Insured: AGM
5.00%, due 7/1/18 | | | 650,000 | | | | 689,182 | |
Series C, Insured: NATL-RE
5.00%, due 9/1/18 | | | 465,000 | | | | 497,699 | |
City of New Britain CT, Unlimited General Obligation
Series A, Insured: AGM
4.00%, due 3/1/18 | | | 1,345,000 | | | | 1,397,213 | |
City of Waterbury CT, Taxable- Pension, Unlimited General Obligation
Insured: AGM
4.88%, due 12/1/16 | | | 400,000 | | | | 401,348 | |
Connecticut State Health & Educational Facility Authority, Quinnipiac University, Revenue Bonds
Series M
4.00%, due 7/1/19 | | | 800,000 | | | | 859,264 | |
| | | | | | | | |
| | | | | | | 4,970,626 | |
| | | | | | | | |
Delaware 0.1% | | | | | | | | |
Delaware State Health Facilities Authority, Beebe Medical Center, Revenue Bonds Series A
4.00%, due 6/1/18 | | | 300,000 | | | | 310,842 | |
| | | | | | | | |
| | | | | | | | |
| | | Principal
Amount | | | Value | |
District of Columbia 0.1% | | | | | | | | |
Washington Metropolitan Area Transit Authority, Revenue Bonds
Series A
4.00%, due 7/1/19 | | $ | 250,000 | | | $ | 262,235 | |
| | | | | | | | |
| | |
Florida 1.0% | | | | | | | | |
City of Lakeland FL, Lakeland Regional Health Systems, Revenue Bonds | | | | | | | | |
5.00%, due 11/15/19 | | | 265,000 | | | | 294,918 | |
5.00%, due 11/15/20 | | | 420,000 | | | | 480,060 | |
City of Tallahassee FL, Tallahassee Memorial Healthcare, Inc., Revenue Bonds | | | | | | | | |
Series A 5.00%, due 12/1/16 | | | 420,000 | | | | 421,441 | |
Series A 5.00%, due 12/1/17 | | | 435,000 | | | | 453,392 | |
Series A 5.00%, due 12/1/18 | | | 425,000 | | | | 457,529 | |
Escambia County School Board, Revenue Bonds
4.00%, due 9/1/18 | | | 300,000 | | | | 316,341 | |
Martin County Health Facilities Authority, Martin Memorial Medical Center, Revenue Bonds
Series B
2.32%, due 11/15/17 | | | 1,265,000 | | | | 1,271,123 | |
| | | | | | | | |
| | | | | | | 3,694,804 | |
| | | | | | | | |
Guam 0.7% | | | | | | | | |
Territory of Guam, Revenue Bonds | | | | | | | | |
Series D
3.00%, due 11/15/17 | | | 300,000 | | | | 304,761 | |
Series D
4.00%, due 11/15/18 | | | 275,000 | | | | 288,258 | |
Series A
5.00%, due 12/1/20 | | | 1,850,000 | | | | 2,077,624 | |
| | | | | | | | |
| | | | | | | 2,670,643 | |
| | | | | | | | |
Hawaii 0.1% | | | | | | | | |
State of Hawaii Department of Budget & Finance, Hawaii Pacific Health Obligation, Revenue Bonds
Series A
5.00%, due 7/1/18 | | | 250,000 | | | | 266,332 | |
| | | | | | | | |
| | |
Illinois 11.1% | | | | | | | | |
Chicago Board of Education, Capital Appreciation, Unlimited General Obligation Series B-1, Insured: NATL-RE
(zero coupon), due 12/1/18 | | | 1,470,000 | | | | 1,377,949 | |
| | | | |
| 14 | | MainStay Tax Advantaged Short Term Bond Fund | | The notes to the financial statements are an integral part of,
and should be read in conjunction with, the financial statements. |
| | | | | | | | |
| | | Principal
Amount | | | Value | |
| Municipal Bonds (continued) | |
Illinois (continued) | | | | | | | | |
Chicago Board of Education, Chicago School Board, Unlimited General Obligation
Series A, Insured: NATL-RE
5.25%, due 12/1/19 | | $ | 400,000 | | | $ | 427,768 | |
Chicago Board of Education, Unlimited General Obligation | | | | | | | | |
Series A, Insured: NATL-RE
5.00%, due 12/1/19 | | | 1,775,000 | | | | 1,885,227 | |
Series A, Insured: AMBAC
5.50%, due 12/1/18 | | | 220,000 | | | | 227,104 | |
City of Berwyn IL, Unlimited General Obligation
Series B, Insured: NATL-RE
5.71%, due 12/1/17 | | | 1,675,000 | | | | 1,742,971 | |
City of Chicago IL, Direct Access BD PG, Unlimited General Obligation
Series 1A, Insured: AMBAC
4.125%, due 1/1/19 | | | 275,000 | | | | 275,657 | |
City of Chicago IL, Unlimited General Obligation | | | | | | | | |
Series G, Insured: AMBAC
5.00%, due 12/1/16 | | | 170,000 | | | | 170,357 | |
Series I, Insured: AMBAC
5.00%, due 12/1/17 | | | 1,225,000 | | | | 1,229,030 | |
City of Chicago IL, Waterworks Second Lien, Revenue Bonds | | | | | | | | |
Series A-2
2.00%, due 11/1/16 | | | 1,500,000 | | | | 1,500,000 | |
4.00%, due 11/1/18 | | | 1,000,000 | | | | 1,044,160 | |
City of Freeport IL, Unlimited General Obligation | | | | | | | | |
Series A, Insured: AGM
2.00%, due 1/1/17 | | | 100,000 | | | | 100,159 | |
Series A, Insured: AGM
2.00%, due 1/1/18 | | | 100,000 | | | | 100,738 | |
City of La Salle IL, Unlimited General Obligation
Series A
3.75%, due 12/1/16 | | | 135,000 | | | | 135,251 | |
City of Peoria IL, Unlimited General Obligation Series A
3.00%, due 1/1/19 | | | 525,000 | | | | 539,563 | |
City of Rockford IL, Unlimited General Obligation | | | | | | | | |
Series A, Insured: BAM
3.00%, due 12/15/16 | | | 225,000 | | | | 225,560 | |
Series A, Insured: BAM
3.00%, due 12/15/17 | | | 240,000 | | | | 245,006 | |
Series A, Insured: BAM
3.00%, due 12/15/18 | | | 145,000 | | | | 150,061 | |
| | | | | | | | |
| | | Principal
Amount | | | Value | |
Illinois (continued) | | | | | | | | |
Cook County Community High School District No. 212 Leyden, Revenue Bonds
Series B, Insured: BAM
2.00%, due 12/1/19 | | $ | 1,140,000 | | | $ | 1,151,480 | |
Cook County School District No. 102 La Grange, Limited General Obligation
Series B, Insured: AGM
3.00%, due 12/15/17 | | | 275,000 | | | | 281,009 | |
County of Cook IL, Unlimited General Obligation
Insured: BAM
2.03%, due 11/15/18 | | | 700,000 | | | | 705,488 | |
Governors State University, Capital Improvement Project, Certificates of Participation
Insured: AGC
4.125%, due 1/1/17 | | | 110,000 | | | | 110,444 | |
¨Illinois Finance Authority, National Louis University, Revenue Bonds
Series B
0.63%, due 6/1/29 (b) | | | 7,000,000 | | | | 7,000,000 | |
Illinois Sports Facilities Authority, Capital Appreciation, Revenue Bonds Insured: AMBAC
(zero coupon), due 6/15/19 | | | 925,000 | | | | 863,913 | |
Illinois Sports Facilities Authority, Revenue Bonds
5.00%, due 6/15/18 | | | 495,000 | | | | 513,285 | |
Illinois State University, Revenue Bonds | | | | | | | | |
Insured: AGM
4.00%, due 4/1/18 | | | 1,155,000 | | | | 1,196,557 | |
Insured: AGM
5.00%, due 4/1/19 | | | 1,000,000 | | | | 1,080,890 | |
Peoria County School District No. 68 Oak Grove, Unlimited General Obligation Series C, Insured: AGM
2.00%, due 12/1/19 | | | 180,000 | | | | 183,064 | |
Public Building Commission of Chicago, Chicago School Reform, Revenue Bonds Series B, Insured: NATL-RE
5.25%, due 12/1/18 | | | 115,000 | | | | 120,709 | |
Randolph County Community Unit School District No. 140 Sparta, Unlimited General Obligation | | | | | | | | |
Insured: AGM
4.00%, due 12/1/17 | | | 200,000 | | | | 206,180 | |
Insured: AGM
4.00%, due 12/1/18 | | | 405,000 | | | | 427,972 | |
Insured: AGM
4.00%, due 12/1/19 | | | 210,000 | | | | 227,048 | |
Regional Transportation Authority, Revenue Bonds Insured: AGM
5.75%, due 6/1/18 | | | 1,000,000 | | | | 1,074,720 | |
| | | | | | |
The notes to the financial statements are an integral part of,
and should be read in conjunction with, the financial statements. | | | | | 15 | |
Portfolio of Investments October 31, 2016 (continued)
| | | | | | | | |
| | | Principal
Amount | | | Value | |
| Municipal Bonds (continued) | |
Illinois (continued) | | | | | | | | |
Southern Illinois University, Housing & Auxiliary Facilities System, Revenue Bonds Series A, Insured: AGM
5.00%, due 4/1/17 | | $ | 1,165,000 | | | $ | 1,184,188 | |
St. Clair County High School District No 201 Belleville, Unlimited General Obligation Insured: BAM
3.50%, due 4/1/19 | | | 160,000 | | | | 168,035 | |
State of Illinois, Revenue Bonds | | | | | | | | |
5.00%, due 6/15/18 | | | 545,000 | | | | 579,477 | |
5.00%, due 6/15/19 | | | 610,000 | | | | 670,530 | |
¨State of Illinois, Unlimited General Obligation | |
Insured: AGM
5.00%, due 1/1/17 | | | 750,000 | | | | 755,047 | |
Insured: AGM
5.00%, due 1/1/18 | | | 850,000 | | | | 881,841 | |
Insured: AGM
5.00%, due 4/1/18 | | | 310,000 | | | | 318,888 | |
Insured: AGM
5.365%, due 3/1/17 | | | 2,500,000 | | | | 2,532,875 | |
Insured: NATL-RE
5.50%, due 8/1/18 | | | 750,000 | | | | 795,165 | |
United City of Yorkville IL, Special Service Area No. 2005-108 & 2005-109, Special Tax
Insured: AGM
3.00%, due 3/1/19 | | | 884,000 | | | | 909,769 | |
Village of Bellwood IL, Unlimited General Obligation
Insured: AGM
3.00%, due 12/1/18 | | | 1,000,000 | | | | 1,030,640 | |
Village of Cary IL, Special Service Area No. 1, Special Tax | | | | | | | | |
Insured: BAM
1.00%, due 3/1/17 | | | 100,000 | | | | 99,985 | |
Insured: BAM
1.20%, due 3/1/18 | | | 100,000 | | | | 99,912 | |
Insured: BAM
1.50%, due 3/1/19 | | | 150,000 | | | | 149,708 | |
Village of Cary IL, Special Service Area No. 2, Special Tax | | | | | | | | |
Insured: BAM
1.00%, due 3/1/17 | | | 99,000 | | | | 98,985 | |
Insured: BAM
1.20%, due 3/1/18 | | | 99,000 | | | | 98,913 | |
Insured: BAM
1.70%, due 3/1/20 | | | 149,000 | | | | 148,568 | |
Village of Crestwood IL, Alternate Revenue Source, Unlimited General Obligation Series B, Insured: BAM
2.00%, due 12/15/19 | | | 500,000 | | | | 502,025 | |
| | | | | | | | |
| | | Principal
Amount | | | Value | |
Illinois (continued) | | | | | | | | |
Village of Rosemont IL, Corporate Purpose, Unlimited General Obligation
Series B, Insured: AGM
3.021%, due 12/1/19 | | $ | 955,000 | | | $ | 987,384 | |
Volo Village Special Service Area 3 & 6, Symphony Meadows / Lancaster, Special Tax | | | | | | | | |
Insured: AGM
3.00%, due 3/1/17 | | | 200,000 | | | | 201,180 | |
Insured: AGM
3.00%, due 3/1/18 | | | 200,000 | | | | 203,882 | |
Insured: AGM
3.00%, due 3/1/19 | | | 200,000 | | | | 205,830 | |
Western Illinois University, Revenue Bonds | | | | | | | | |
Insured: BAM
5.00%, due 4/1/17 | | | 620,000 | | | | 629,467 | |
Insured: BAM
5.00%, due 4/1/18 | | | 600,000 | | | | 629,106 | |
Insured: BAM
5.00%, due 4/1/19 | | | 870,000 | | | | 936,503 | |
Insured: BAM
5.00%, due 4/1/20 | | | 460,000 | | | | 505,669 | |
Will & Kankakee Counties Community Unit School District No. 207-U Peotone, Unlimited General Obligation
3.00%, due 12/1/16 | | | 250,000 | | | | 250,447 | |
| | | | | | | | |
| | | | 42,093,339 | |
| | | | | | | | |
Indiana 1.0% | | | | | | | | |
City of Rockport IN, Revenue Bonds
Series B
1.75%, due 6/1/25 (b) | | | 2,000,000 | | | | 2,009,720 | |
Indiana Bond Bank, Revenue Bonds
Series A
5.25%, due 10/15/18 | | | 1,000,000 | | | | 1,070,590 | |
Indiana Finance Authority, Marquette Project, Revenue Bonds
5.00%, due 3/1/19 | | | 750,000 | | | | 777,465 | |
| | | | | | | | |
| | | | 3,857,775 | |
| | | | | | | | |
Iowa 3.4% | | | | | | | | |
City of Coralville IA, Annual Appropriate Urban Renewal, Certificates of Participation Series B-1
2.00%, due 6/1/18 | | | 320,000 | | | | 321,734 | |
City of Coralville IA, Certificates of Participation | | | | | | | | |
Series E
4.00%, due 6/1/19 | | | 465,000 | | | | 490,101 | |
Series E
4.00%, due 6/1/20 | | | 500,000 | | | | 533,390 | |
| | | | |
| 16 | | MainStay Tax Advantaged Short Term Bond Fund | | The notes to the financial statements are an integral part of,
and should be read in conjunction with, the financial statements. |
| | | | | | | | |
| | | Principal
Amount | | | Value | |
| Municipal Bonds (continued) | |
Iowa (continued) | | | | | | | | |
City of Coralville IA, Corporate Purpose Bonds, Unlimited General Obligation | | | | | | | | |
Series D1
1.50%, due 5/1/18 | | $ | 510,000 | | | $ | 509,398 | |
Series D1
1.75%, due 5/1/19 | | | 270,000 | | | | 269,995 | |
Series D2
2.25%, due 5/1/18 | | | 70,000 | | | | 70,295 | |
Iowa Finance Authority, Great River Medical Center Project, Revenue Bonds
0.53%, due 6/1/27 (b) | | | 3,900,000 | | | | 3,900,000 | |
¨Iowa Higher Education Loan Authority, Private College Facility- Des Moines, Revenue Bonds
0.53%, due 10/1/33 (b) | | | 5,700,000 | | | | 5,700,000 | |
Xenia Rural Water District, Capital Loan Notes, Revenue Bonds | | | | | | | | |
2.00%, due 12/1/18 | | | 225,000 | | | | 227,113 | |
3.00%, due 12/1/19 | | | 375,000 | | | | 389,902 | |
3.00%, due 12/1/20 | | | 325,000 | | | | 339,827 | |
| | | | | | | | |
| | | | 12,751,755 | |
| | | | | | | | |
Kentucky 0.6% | | | | | | | | |
City of Ashland KY, King’s Daughters Medical Center Project, Revenue Bonds
Series A
4.00%, due 2/1/18 | | | 650,000 | | | | 669,253 | |
County of Harrison KY, Harrison Memorial Hospital, Revenue Notes
1.50%, due 5/1/17 | | | 1,000,000 | | | | 1,000,030 | |
Louisville / Jefferson County Metropolitan Government, Norton Healthcare Inc., Revenue Bonds
5.00%, due 10/1/19 | | | 500,000 | | | | 553,455 | |
| | | | | | | | |
| | | | 2,222,738 | |
| | | | | | | | |
Louisiana 1.7% | | | | | | | | |
Bossier City LA, Public Improvement Sales & Tax, Revenue Bonds | | | | | | | | |
2.00%, due 12/1/18 | | | 500,000 | | | | 507,580 | |
2.00%, due 12/1/19 | | | 650,000 | | | | 660,276 | |
2.25%, due 12/1/20 | | | 500,000 | | | | 512,560 | |
City of New Orleans LA, Water System, Revenue Bonds
3.00%, due 12/1/18 | | | 250,000 | | | | 259,063 | |
City of Shreveport LA, Airport System, Revenue Bonds
Series B, Insured: AGM
2.452%, due 1/1/19 | | | 500,000 | | �� | | 510,965 | |
Lafayette Consolidated Government, Revenue Bonds
Insured: AGM
5.00%, due 11/1/17 | | | 550,000 | | | | 571,835 | |
| | | | | | | | |
| | | Principal
Amount | | | Value | |
Louisiana (continued) | | | | | | | | |
Lafayette Public Trust Financing Authority, Ragin Cajun Facilities-Housing & Parking Project, Revenue Bonds
Insured: AGM
5.00%, due 10/1/18 | | $ | 705,000 | | | $ | 753,377 | |
Louisiana Local Government Environmental Facilities & Community Development Authority, University Student Housing, Revenue Bonds | | | | | | | | |
Series A, Insured: AGM
2.00%, due 10/1/19 | | | 555,000 | | | | 566,877 | |
Insured: AGM
3.00%, due 10/1/17 | | | 355,000 | | | | 361,443 | |
Insured: AGM
3.00%, due 10/1/18 | | | 865,000 | | | | 894,237 | |
Series A, Insured: AGM
3.00%, due 10/1/20 | | | 575,000 | | | | 610,167 | |
Louisiana Public Facilities Authority, Nineteenth Judicial District, Revenue Bonds
Insured: AGM
5.00%, due 6/1/18 | | | 245,000 | | | | 258,424 | |
| | | | | | | | |
| | | | 6,466,804 | |
| | | | | | | | |
Maryland 0.3% | | | | | | | | |
Maryland Health & Higher Educational Facilities Authority, Edenwald Issue, Revenue Bonds
3.00%, due 1/1/18 | | | 705,000 | | | | 720,771 | |
Maryland Health & Higher Educational Facilities Authority, Meritus Medical Center Issue, Revenue Bonds
5.00%, due 7/1/18 | | | 300,000 | | | | 319,395 | |
| | | | | | | | |
| | | | 1,040,166 | |
| | | | | | | | |
Massachusetts 1.3% | | | | | | | | |
Massachusetts Development Finance Agency, Caregroup, Revenue Bonds
Series H-2
1.824%, due 7/1/17 | | | 1,000,000 | | | | 1,002,530 | |
Massachusetts Development Finance Agency, UMass Boston Student Housing Project, Revenue Bonds | | | | | | | | |
5.00%, due 10/1/19 | | | 985,000 | | | | 1,078,003 | |
5.00%, due 10/1/20 | | | 760,000 | | | | 852,135 | |
Massachusetts Development Finance Agency, UMass Memorial Health Care, Revenue Bonds
Series I
5.00%, due 7/1/18 | | | 1,000,000 | | | | 1,060,880 | |
| | | | | | |
The notes to the financial statements are an integral part of,
and should be read in conjunction with, the financial statements. | | | | | 17 | |
Portfolio of Investments October 31, 2016 (continued)
| | | | | | | | |
| | | Principal
Amount | | | Value | |
| Municipal Bonds (continued) | |
Massachusetts (continued) | | | | | | | | |
Massachusetts Development Finance Agency, Western New England University, Revenue Bonds | | | | | | | | |
4.00%, due 9/1/17 | | $ | 200,000 | | | $ | 204,756 | |
5.00%, due 9/1/18 | | | 225,000 | | | | 239,731 | |
Massachusetts Development Finance Agency, WGBH Educational Foundation, Revenue Bonds | | | | | | | | |
4.00%, due 1/1/19 | | | 170,000 | | | | 180,562 | |
5.00%, due 1/1/20 | | | 200,000 | | | | 223,676 | |
| | | | | | | | |
| | | | 4,842,273 | |
| | | | | | | | |
Michigan 5.7% | |
City of Detroit MI Sewage Disposal System, Senior Lien, Revenue Bonds
Series C, Insured: AGC
5.00%, due 7/1/18 | | | 200,000 | | | | 200,310 | |
County of Genesee MI, Water Supply System, Limited General Obligation | | | | | | | | |
Series B, Insured: BAM
5.00%, due 2/1/18 | | | 150,000 | | | | 157,128 | |
Series B, Insured: BAM
5.00%, due 2/1/19 | | | 200,000 | | | | 215,796 | |
County of Wayne MI, Limited General Obligation
4.25%, due 12/1/18 | | | 2,500,000 | | | | 2,525,825 | |
Harper Woods School District, Unlimited General Obligation
Insured: AGM
5.00%, due 5/1/19 | | | 500,000 | | | | 547,915 | |
Hartland Consolidated Schools, Unlimited General Obligation
Series B
1.386%, due 5/1/18 | | | 1,500,000 | | | | 1,503,990 | |
Lincoln Consolidated School District, Unlimited General Obligation
Series A, Insured: AGM
5.00%, due 5/1/19 | | | 1,180,000 | | | | 1,287,061 | |
Livonia Public Schools, School District, Unlimited General Obligation
Insured: AGM
4.00%, due 5/1/18 | | | 210,000 | | | | 218,683 | |
Michigan Finance Authority, College for Creative Studies, Revenue Bonds | | | | | | | | |
3.00%, due 12/1/16 | | | 150,000 | | | | 150,230 | |
4.00%, due 12/1/17 | | | 200,000 | | | | 205,350 | |
5.00%, due 12/1/18 | | | 200,000 | | | | 212,976 | |
Michigan Finance Authority, Muskegon Heights Public School Academy, Revenue Bonds
5.00%, due 5/1/19 | | | 565,000 | | | | 615,048 | |
| | | | | | | | |
| | | Principal
Amount | | | Value | |
Michigan (continued) | |
Orchard View Schools, Unlimited General Obligation | | | | | | | | |
Series B
1.349%, due 5/1/17 | | $ | 1,000,000 | | | $ | 1,002,100 | |
Series B
1.78%, due 5/1/18 | | | 1,000,000 | | | | 1,006,720 | |
Series B
2.062%, due 5/1/19 | | | 1,410,000 | | | | 1,426,610 | |
Saline Area Schools, Unlimited General Obligation
1.741%, due 5/1/19 | | | 2,300,000 | | | | 2,309,062 | |
Tender Option Bond Trust Receipts / Certificates, Floaters, Limited General Obligation
Series 2016-TPG003
1.75%, due 12/1/18 (a)(b) | | | 5,000,000 | | | | 5,000,000 | |
Warren Consolidated Schools, Unlimited General Obligation | | | | | | | | |
Series B, Insured: BAM
4.00%, due 5/1/18 | | | 1,630,000 | | | | 1,700,970 | |
Series B, Insured: BAM
5.00%, due 5/1/19 | | | 1,080,000 | | | | 1,180,127 | |
| | | | | | | | |
| | | | 21,465,901 | |
| | | | | | | | |
Minnesota 0.4% | |
Housing & Redevelopment Authority of The City of St. Paul Minnesota, Healtheast Care System, Revenue Bonds
5.00%, due 11/15/18 | | | 1,350,000 | | | | 1,446,214 | |
| | | | | | | | |
|
Mississippi 1.1% | |
City of Jackson MS Water & Sewer System, Revenue Bonds | | | | | | | | |
Insured: BAM
4.00%, due 9/1/18 | | | 380,000 | | | | 396,849 | |
Insured: BAM
4.00%, due 9/1/20 | | | 625,000 | | | | 674,250 | |
Mississippi Development Bank, Biloxi Mississippi Project, Revenue Bonds Insured: BAM
4.00%, due 11/1/20 | | | 650,000 | | | | 709,332 | |
Mississippi Development Bank, Canton Public School District, Revenue Bonds | | | | | | | | |
Insured: AGM
4.00%, due 12/1/17 | | | 260,000 | | | | 268,185 | |
Insured: AGM
4.00%, due 12/1/18 | | | 935,000 | | | | 987,435 | |
Mississippi Hospital Equipment & Facilities Authority, Baptist Health System, Inc., Revenue Bonds
Class A
5.00%, due 8/15/17 | | | 1,000,000 | | | | 1,029,630 | |
| | | | | | | | |
| | | | 4,065,681 | |
| | | | | | | | |
| | | | |
| 18 | | MainStay Tax Advantaged Short Term Bond Fund | | The notes to the financial statements are an integral part of,
and should be read in conjunction with, the financial statements. |
| | | | | | | | |
| | | Principal
Amount | | | Value | |
| Municipal Bonds (continued) | |
Missouri 2.4% | |
City of Belton MO, Certificates of Participation Insured: NATL-RE
5.00%, due 3/1/17 | | $ | 150,000 | | | $ | 151,685 | |
¨Health & Educational Facilities Authority of the State of Missouri, St. Louis University, Revenue Bonds
Series B
0.50%, due 10/1/24 (b) | | | 6,930,000 | | | | 6,930,000 | |
St. Louis Municipal Finance Corp., Carnahan Courthouse, Revenue Bonds | | | | | | | | |
Series A
3.00%, due 2/15/18 | | | 460,000 | | | | 470,943 | |
Series A
4.00%, due 2/15/19 | | | 1,425,000 | | | | 1,513,549 | |
| | | | | | | | |
| | | | 9,066,177 | |
| | | | | | | | |
Nevada 0.6% | |
County of Humboldt N.V., Sierra Pacific Power Co., Revenue Bonds
Series A
1.25%, due 10/1/29 (b) | | | 2,250,000 | | | | 2,249,595 | |
| | | | | | | | |
|
New Hampshire 0.3% | |
Manchester Housing & Redevelopment Authority, Inc., Capital Appreciation, Revenue Bonds
Series B, Insured: AGC
(zero coupon), due 1/1/18 | | | 100,000 | | | | 96,953 | |
New Hampshire Health & Education Facilities Authority, Kendel At Hanover, Revenue Bonds | | | | | | | | |
2.00%, due 10/1/17 | | | 200,000 | | | | 201,710 | |
3.00%, due 10/1/18 | | | 200,000 | | | | 206,626 | |
New Hampshire Health & Education Facilities Authority, Southern New Hampshire University, Revenue Bonds
5.00%, due 1/1/19 | | | 505,000 | | | | 545,011 | |
| | | | | | | | |
| | | | 1,050,300 | |
| | | | | | | | |
New Jersey 7.2% | |
Atlantic County Improvement Authority, Stockton University Atlantic City Campus Project, Revenue Bonds
Series B, Insured: AGM
5.00%, due 9/1/20 | | | 3,745,000 | | | | 4,224,435 | |
Borough of North Plainfield NJ, Unlimited General Obligation
Insured: MAC
3.00%, due 6/1/20 | | | 330,000 | | | | 348,724 | |
| | | | | | | | |
| | | Principal
Amount | | | Value | |
New Jersey (continued) | |
Carteret Board of Education, Certificates of Participation
Insured: BAM
4.00%, due 1/15/19 | | $ | 315,000 | | | $ | 333,620 | |
Casino Reinvestment Development Authority, Revenue Bonds
5.00%, due 11/1/18 | | | 255,000 | | | | 263,214 | |
City of Bayonne NJ, Unlimited General Obligation
Insured: AGM
4.00%, due 7/15/19 | | | 1,000,000 | | | | 1,070,840 | |
Garden State Preservation Trust, Revenue Bonds | | | | | | | | |
Series C, Insured: AGM
5.125%, due 11/1/16 | | | 100,000 | | | | 100,000 | |
Series C, Insured: AGM
5.125%, due 11/1/19 | | | 3,175,000 | | | | 3,531,489 | |
Greater Egg Harbor Regional High School District, Unlimited General Obligation | | | | | | | | |
Insured: AGM
4.00%, due 2/1/19 | | | 750,000 | | | | 796,380 | |
Insured: AGM
4.00%, due 2/1/20 | | | 1,000,000 | | | | 1,085,350 | |
New Jersey Educational Facilities Authority, Kean University, Revenue Bonds
Series H
5.00%, due 7/1/19 | | | 4,045,000 | | | | 4,453,909 | |
New Jersey Health Care Facilities Financing Authority, Hackensack University Medical, Revenue Bonds
Insured: AGM
4.00%, due 1/1/17 | | | 150,000 | | | | 150,759 | |
New Jersey Health Care Facilities Financing Authority, Palisades Medical Center Obligation Group, Revenue Bonds
3.15%, due 7/1/18 | | | 1,000,000 | | | | 1,022,300 | |
New Jersey Health Care Facilities Financing Authority, Princeton Healthcare System, Revenue Bonds | | | | | | | | |
4.00%, due 7/1/17 | | | 1,000,000 | | | | 1,019,840 | |
5.00%, due 7/1/18 | | | 640,000 | | | | 680,275 | |
New Jersey Transportation Trust Fund Authority, Transportation System RMKT, Revenue Bonds
Series B-2, Insured: XLCA
5.00%, due 12/15/17 | | | 405,000 | | | | 421,682 | |
New Jersey Transportation Trust Fund Authority, Transportation System, Revenue Bonds | | | | | | | | |
Series B, Insured: NATL-RE
5.50%, due 12/15/16 | | | 1,000,000 | | | | 1,005,750 | |
Series C, Insured: AGM
5.50%, due 12/15/17 | | | 420,000 | | | | 440,068 | |
| | | | | | |
The notes to the financial statements are an integral part of,
and should be read in conjunction with, the financial statements. | | | | | 19 | |
Portfolio of Investments October 31, 2016 (continued)
| | | | | | | | |
| | | Principal
Amount | | | Value | |
| Municipal Bonds (continued) | |
New Jersey (continued) | |
Passaic Valley Water Commission, Revenue Bonds
Insured: AGM
5.00%, due 12/15/16 | | $ | 140,000 | | | $ | 140,708 | |
State of New Jersey, Unlimited General Obligation | | | | | | | | |
Series L, Insured: AMBAC
5.25%, due 7/15/18 | | | 2,045,000 | | | | 2,178,518 | |
Series M, Insured: AMBAC
5.50%, due 7/15/17 | | | 265,000 | | | | 273,329 | |
Series M, Insured: AMBAC
5.50%, due 7/15/19 | | | 225,000 | | | | 249,129 | |
Town of Hammonton NJ, Unlimited General Obligation | | | | | | | | |
Insured: AGM
2.00%, due 2/1/17 | | | 500,000 | | | | 501,345 | |
Insured: AGM
4.00%, due 2/1/18 | | | 750,000 | | | | 776,437 | |
Township of Brick NJ, Unlimited General Obligation
Series A
5.00%, due 9/1/18 | | | 1,000,000 | | | | 1,070,950 | |
Trenton Parking Authority, Revenue Bonds | | | | | | | | |
Series A, Insured: AGM
1.60%, due 10/1/17 | | | 165,000 | | | | 164,814 | |
Series B, Insured: AGM
2.00%, due 4/1/17 | | | 300,000 | | | | 301,149 | |
Series A, Insured: AGM
2.49%, due 10/1/19 | | | 170,000 | | | | 169,857 | |
Series A, Insured: AGM
2.80%, due 10/1/20 | | | 180,000 | | | | 180,031 | |
Series B, Insured: AGM
4.00%, due 4/1/19 | | | 250,000 | | | | 265,237 | |
Upper Freehold Regional School District, Unlimited General Obligation
Insured: AGM
3.60%, due 11/1/16 | | | 235,000 | | | | 235,000 | |
| | | | | | | | |
| | | | 27,455,139 | |
| | | | | | | | |
New York 4.7% | | | | | | | | |
¨City of New York NY, Unlimited General Obligation
0.51%, due 6/1/44 (b) | | | 7,000,000 | | | | 7,000,000 | |
City of Yonkers NY, Limited General Obligation
Series D
3.00%, due 8/1/17 | | | 1,000,000 | | | | 1,015,060 | |
County of Rockland NY, Limited General Obligation
Insured: AGM
2.00%, due 12/1/18 | | | 655,000 | | | | 664,366 | |
| | | | | | | | |
| | | Principal
Amount | | | Value | |
New York (continued) | |
County of Rockland NY, Public Improvement, Limited General Obligation
Series C, Insured: AGM
3.00%, due 5/1/19 | | $ | 1,435,000 | | | $ | 1,488,339 | |
New York City Transitional Finance Authority, Future Tax Secured, Revenue Bonds | | | | | | | | |
Series 2A
0.73%, due 11/1/22 (b) | | | 1,200,000 | | | | 1,200,000 | |
Series A-3
0.73%, due 8/1/23 (b) | | | 1,000,000 | | | | 1,000,000 | |
Town of Oyster Bay NY, Public Improvement, Limited General Obligation
Series A, Insured: AGM
3.00%, due 3/1/18 | | | 4,235,000 | | | | 4,336,852 | |
Westchester County Local Development Corp., Westchester Medical Center, Revenue Bonds
5.00%, due 11/1/19 | | | 1,145,000 | | | | 1,263,840 | |
| | | | | | | | |
| | | | 17,968,457 | |
| | | | | | | | |
North Carolina 0.2% | | | | | | | | |
Raleigh Durham Airport Authority, Revenue Bonds
Series B
5.00%, due 5/1/18 (c) | | | 750,000 | | | | 794,205 | |
| | | | | | | | |
| | |
North Dakota 0.6% | | | | | | | | |
City of Bowman ND, Healthcare Services Project, Revenue Notes
2.50%, due 2/15/17 | | | 1,000,000 | | | | 1,000,250 | |
North Dakota Housing Finance Agency, Revenue Bonds
1.15%, due 1/1/18 | | | 1,425,000 | | | | 1,426,311 | |
| | | | | | | | |
| | | | 2,426,561 | |
| | | | | | | | |
Ohio 1.9% | | | | | | | | |
City of Cincinnati OH, Unlimited General Obligation | | | | | | | | |
Series D
1.168%, due 12/1/16 | | | 300,000 | | | | 300,150 | |
Series D
1.837%, due 12/1/18 | | | 200,000 | | | | 202,564 | |
City of Toledo OH, Limited General Obligation Insured: AGM
4.00%, due 12/1/19 | | | 1,540,000 | | | | 1,661,691 | |
Cleveland Municipal School District, Unlimited General Obligation
Series A
3.00%, due 12/1/18 | | | 1,185,000 | | | | 1,230,160 | |
Ohio Higher Educational Facility Commission, Otterbein University Project, Revenue Bonds
Series A
4.00%, due 12/1/19 | | | 915,000 | | | | 981,429 | |
| | | | |
| 20 | | MainStay Tax Advantaged Short Term Bond Fund | | The notes to the financial statements are an integral part of,
and should be read in conjunction with, the financial statements. |
| | | | | | | | |
| | | Principal
Amount | | | Value | |
| Municipal Bonds (continued) | |
Ohio (continued) | | | | | | | | |
State of Ohio, Capital Facilities Lease-Appropriation, Revenue Bonds
Series C
0.75%, due 10/1/36 (b) | | $ | 3,000,000 | | | $ | 3,000,000 | |
| | | | | | | | |
| | | | 7,375,994 | |
| | | | | | | | |
Oklahoma 2.1% | | | | | | | | |
Cleveland County Educational Facilities Authority, Moore Public Schools Projects, Revenue Bonds
5.00%, due 6/1/19 | | | 3,000,000 | | | | 3,290,430 | |
Oklahoma County Independent School District No. 52 Midwest City-Del City, Unlimited General Obligation | | | | | | | | |
Series A
1.50%, due 1/1/18 | | | 2,210,000 | | | | 2,223,282 | |
Series A
2.00%, due 1/1/19 | | | 2,460,000 | | | | 2,507,798 | |
| | | | | | | | |
| | | | 8,021,510 | |
| | | | | | | | |
Pennsylvania 9.9% | |
Bermudian Springs School District, Limited General Obligation
Insured: BAM
4.00%, due 5/1/19 | | | 1,425,000 | | | | 1,521,529 | |
¨Butler County General Authority, South Park School District Project, Revenue Bonds Insured: AGM
0.70%, due 8/1/27 (b) | | | 6,000,000 | | | | 6,000,000 | |
Capital Region Water, Revenue Bonds Series A
5.00%, due 7/15/19 | | | 1,300,000 | | | | 1,426,971 | |
Centre County Hospital Authority, Mount Nittany Medical Center, Revenue Bonds | | | | | | | | |
Series B
3.00%, due 11/15/20 | | | 100,000 | | | | 106,953 | |
Series A
4.00%, due 11/15/18 | | | 100,000 | | | | 105,977 | |
Series A
4.00%, due 11/15/19 | | | 240,000 | | | | 259,956 | |
City of Reading PA, Unlimited General Obligation
Series A, Insured: AGM
3.50%, due 11/15/16 | | | 1,000,000 | | | | 1,000,830 | |
¨County of Beaver PA, Unlimited General Obligation | | | | | | | | |
Series B, Insured: BAM
1.948%, due 11/15/18 | | | 2,015,000 | | | | 2,029,206 | |
Series B, Insured: BAM
2.18%, due 11/15/19 | | | 4,215,000 | | | | 4,257,150 | |
| | | | | | | | |
| | | Principal
Amount | | | Value | |
Pennsylvania (continued) | |
Dauphin County General Authority, Pinnacle Health System Project, Revenue Bonds Series A
5.00%, due 6/1/20 | | $ | 500,000 | | | $ | 564,030 | |
Doylestown Hospital Authority, Revenue Bonds
Series A, Insured: AGC
5.00%, due 7/1/18 | | | 245,000 | | | | 261,724 | |
General Authority of Southcentral Pennsylvania, Hanover Hospital, Inc., Revenue Bonds | | | | | | | | |
4.00%, due 12/1/17 | | | 100,000 | | | | 103,055 | |
4.00%, due 12/1/18 | | | 185,000 | | | | 194,859 | |
Hazleton Area School District, Limited General Obligation | | | | | | | | |
Series B, Insured: BAM
2.00%, due 3/1/20 | | | 375,000 | | | | 382,016 | |
Series A, Insured: BAM
4.00%, due 3/1/20 | | | 600,000 | | | | 650,148 | |
Lancaster Higher Education Authority, Harrisburg Area Community College Project, Revenue Bonds | | | | | | | | |
Series A, Insured: BAM
5.00%, due 10/1/19 | | | 685,000 | | | | 755,226 | |
Series A, Insured: BAM
5.00%, due 10/1/20 | | | 840,000 | | | | 950,384 | |
Lycoming County, Pennsylvania College of Technology, Revenue Bonds | | | | | | | | |
4.00%, due 10/1/18 | | | 440,000 | | | | 463,698 | |
4.00%, due 10/1/19 | | | 755,000 | | | | 813,596 | |
4.00%, due 10/1/20 | | | 1,730,000 | | | | 1,898,398 | |
Pennsylvania Higher Educational Facilities Authority, Thomas Jefferson University, Revenue Bonds
Series B, Insured: AMBAC
5.25%, due 9/1/17 | | | 1,700,000 | | | | 1,760,503 | |
Philadelphia Authority for Industrial Development, Zero Coupon-Retirement System, Revenue Bonds
Series B, Insured: AMBAC
(zero coupon), due 4/15/18 | | | 360,000 | | | | 349,927 | |
Philadelphia Gas Works, 1998 General Ordinance, Revenue Bonds | | | | | | | | |
Series 14T
5.00%, due 10/1/19 | | | 750,000 | | | | 827,678 | |
Series 14T
5.00%, due 10/1/20 | | | 750,000 | | | | 847,793 | |
Pocono Mountain School District, Limited General Obligation
Series A, Insured: AGM
4.00%, due 6/15/17 | | | 1,350,000 | | | | 1,375,474 | |
| | | | | | |
The notes to the financial statements are an integral part of,
and should be read in conjunction with, the financial statements. | | | | | 21 | |
Portfolio of Investments October 31, 2016 (continued)
| | | | | | | | |
| | | Principal
Amount | | | Value | |
| Municipal Bonds (continued) | |
Pennsylvania (continued) | |
Reading School District, Unlimited General Obligation
Series C, Insured: AGM
5.00%, due 2/1/18 | | $ | 790,000 | | | $ | 825,037 | |
Riverside School District, Unlimited General Obligation
Insured: BAM
3.00%, due 10/15/17 | | | 1,155,000 | | | | 1,176,575 | |
State Public School Building Authority, Chester Upland School, Revenue Bonds Series A, Insured: AGM
5.00%, due 9/15/18 | | | 1,140,000 | | | | 1,217,383 | |
State Public School Building Authority, Harrisburg School District Project, Revenue Bonds
Insured: AGM
4.00%, due 12/1/20 | | | 910,000 | | | | 998,379 | |
State Public School Building Authority, Revenue Bonds
Series B, Insured: AGM
2.116%, due 12/1/20 | | | 2,020,000 | | | | 2,011,880 | |
Trinity Area School District, Unlimited General Obligation
Insured: AGM
4.00%, due 11/1/18 | | | 950,000 | | | | 1,001,889 | |
West Mifflin School District, Unlimited General Obligation | | | | | | | | |
Insured: AGM
4.00%, due 10/1/17 | | | 410,000 | | | | 419,992 | |
Insured: AGM
5.00%, due 10/1/18 | | | 500,000 | | | | 532,590 | |
Western Wayne School District, Limited General Obligation
Insured: BAM
4.00%, due 4/1/18 | | | 290,000 | | | | 301,142 | |
| | | | | | | | |
| | | | 37,391,948 | |
| | | | | | | | |
Puerto Rico 4.6% | | | | | | | | |
Commonwealth of Puerto Rico, Capital Appreciation, Unlimited General Obligation Insured: NATL-RE
(zero coupon), due 7/1/17 | | | 875,000 | | | | 853,282 | |
Commonwealth of Puerto Rico, CPI- Linked Bonds-Public Improvement, Unlimited General Obligation
Series A, Insured: AGC
2.145%, due 7/1/20 | | | 215,000 | | | | 212,175 | |
| | | | | | | | |
| | | Principal
Amount | | | Value | |
Puerto Rico (continued) | | | | | | | | |
Commonwealth of Puerto Rico, Public Improvement, Capital Appreciation, Unlimited General Obligation | | | | | | | | |
Insured: NATL-RE
(zero coupon), due 7/1/17 | | $ | 785,000 | | | $ | 765,516 | |
Insured: NATL-RE
(zero coupon), due 7/1/18 | | | 470,000 | | | | 441,020 | |
¨Commonwealth of Puerto Rico, Public Improvement, Unlimited General Obligation | | | | | | | | |
Series A, Insured: AGC
4.75%, due 7/1/18 | | | 95,000 | | | | 99,299 | |
Insured: AGM
5.25%, due 7/1/17 | | | 430,000 | | | | 440,668 | |
Insured: AGM
5.25%, due 7/1/18 | | | 190,000 | | | | 200,148 | |
Insured: AGM
5.25%, due 7/1/20 | | | 680,000 | | | | 733,332 | |
Insured: AGM
5.50%, due 7/1/17 | | | 1,085,000 | | | | 1,113,698 | |
Series A, Insured: NATL-RE
5.50%, due 7/1/18 | | | 1,685,000 | | | | 1,774,170 | |
Insured: AGM
5.50%, due 7/1/19 | | | 125,000 | | | | 133,693 | |
Series A, Insured: NATL-RE
5.50%, due 7/1/19 | | | 1,205,000 | | | | 1,292,327 | |
Series A, Insured: NATL-RE
5.50%, due 7/1/20 | | | 2,255,000 | | | | 2,466,496 | |
Puerto Rico Electric Power Authority, Revenue Bonds | | | | | | | | |
Series UU, Insured: NATL-RE
4.00%, due 7/1/18 | | | 75,000 | | | | 77,171 | |
Series UU, Insured: NATL-RE
4.50%, due 7/1/18 | | | 100,000 | | | | 103,708 | |
Series SS, Insured: NATL-RE
5.00%, due 7/1/18 | | | 1,525,000 | | | | 1,544,337 | |
Puerto Rico Highways & Transportation Authority, Revenue Bonds
Series E, Insured: AGM
5.50%, due 7/1/17 | | | 255,000 | | | | 261,709 | |
Puerto Rico Highways & Transportation Authority, Unrefunded, Revenue Bonds | | | | | | | | |
Series AA, Insured: NATL-RE
5.50%, due 7/1/19 | | | 715,000 | | | | 767,009 | |
Series Z, Insured: AGM
6.00%, due 7/1/18 | | | 2,035,000 | | | | 2,168,577 | |
Puerto Rico Housing Finance Authority, Sub-Capital Fund Program-Modernization, Revenue Bonds
4.625%, due 12/1/18 | | | 100,000 | | | | 106,311 | |
| | | | |
| 22 | | MainStay Tax Advantaged Short Term Bond Fund | | The notes to the financial statements are an integral part of,
and should be read in conjunction with, the financial statements. |
| | | | | | | | |
| | | Principal
Amount | | | Value | |
| Municipal Bonds (continued) | |
Puerto Rico (continued) | | | | | | | | |
Puerto Rico Municipal Finance Agency, Revenue Bonds | | | | | | | | |
Series A, Insured: AGM
5.00%, due 8/1/19 | | $ | 240,000 | | | $ | 241,762 | |
Series C, Insured: AGM
5.25%, due 8/1/17 | | | 500,000 | | | | 513,915 | |
Series A, Insured: AGM
5.25%, due 8/1/19 | | | 250,000 | | | | 253,637 | |
Series C, Insured: AGM
5.25%, due 8/1/19 | | | 650,000 | | | | 677,391 | |
Puerto Rico Public Buildings Authority, Government Facilities, Revenue Bonds Series F, Insured: AGC
5.25%, due 7/1/17 | | | 150,000 | | | | 153,722 | |
Puerto Rico Public Buildings Authority, Revenue Bonds
Series C, Insured: AGC
5.75%, due 7/1/17 | | | 50,000 | | | | 51,406 | |
| | | | | | | | |
| | | | 17,446,479 | |
| | | | | | | | |
Rhode Island 0.9% | | | | | | | | |
Rhode Island Commerce Corp., Grant Anticipation Rhode Island Department of Transportation, Revenue Bonds
Series A
5.00%, due 6/15/20 | | | 1,000,000 | | | | 1,126,490 | |
Rhode Island Health & Educational Building Corp., Hospital Financing-Lifespan Obligated Group, Revenue Bonds
5.00%, due 5/15/20 | | | 1,500,000 | | | | 1,677,270 | |
Tobacco Settlement Financing Corp., Revenue Bonds
Series A
4.00%, due 6/1/17 | | | 500,000 | | | | 509,140 | |
| | | | | | | | |
| | | | 3,312,900 | |
| | | | | | | | |
South Carolina 1.0% | | | | | | | | |
SCAGO Educational Facilities Corp. for Williamsburg School District, Revenue Bonds | | | | | | | | |
Series A, Insured: BAM
1.35%, due 12/1/16 | | | 180,000 | | | | 179,991 | |
Series A, Insured: BAM
1.87%, due 12/1/17 | | | 345,000 | | | | 344,941 | |
Series A, Insured: BAM
2.26%, due 12/1/18 | | | 555,000 | | | | 554,112 | |
Series A, Insured: BAM
2.54%, due 12/1/19 | | | 425,000 | | | | 424,452 | |
Series A, Insured: BAM
2.69%, due 12/1/20 | | | 500,000 | | | | 497,805 | |
Series A, Insured: BAM
2.92%, due 12/1/21 | | | 100,000 | | | | 99,429 | |
| | | | | | | | |
| | | Principal
Amount | | | Value | |
South Carolina (continued) | | | | | | | | |
South Carolina Jobs-Economic Development Authority, Palmetto Health, Revenue Bonds Series A
5.00%, due 8/1/18 | | $ | 350,000 | | | $ | 372,610 | |
Sumter Two School Facilities, Inc., Sumter School District Project, Revenue Bonds Insured: BAM
5.00%, due 12/1/19 | | | 1,065,000 | | | | 1,177,677 | |
| | | | | | | | |
| | | | 3,651,017 | |
| | | | | | | | |
Tennessee 2.3% | | | | | | | | |
Metropolitan Government Nashville & Davidson County Health & Educational Facilities Board, Floater-Vanderbilt University Medical Center, Revenue Bonds Series C
1.70%, due 7/1/46 (b) | | | 2,000,000 | | | | 2,000,000 | |
Metropolitan Government Nashville & Davidson County Health & Educational Facilities Board, Lipscomb University Project, Revenue Bonds | | | | | | | | |
Series A
3.00%, due 10/1/17 | | | 280,000 | | | | 284,732 | |
Series A
4.00%, due 10/1/18 | | | 250,000 | | | | 262,540 | |
Series A
4.00%, due 10/1/19 | | | 200,000 | | | | 214,392 | |
¨Shelby County Health Educational & Housing Facilities Board, Methodist Le Bonheur Healthcare, Revenue Bonds
Series A, Insured: AGM
0.51%, due 6/1/42 (b) | | | 6,185,000 | | | | 6,185,000 | |
| | | | | | | | |
| | | | 8,946,664 | |
| | | | | | | | |
Texas 2.7% | | | | | | | | |
Crane County Water District, Unlimited General Obligation
3.00%, due 2/15/17 | | | 500,000 | | | | 502,680 | |
Harris County Municipal Utility District No. 419, Unlimited General Obligation | | | | | | | | |
Insured: AGM
3.00%, due 9/1/17 | | | 100,000 | | | | 101,476 | |
Insured: AGM
3.00%, due 9/1/18 | | | 150,000 | | | | 154,455 | |
Insured: AGM
3.00%, due 9/1/19 | | | 735,000 | | | | 763,930 | |
Insured: AGM
3.00%, due 9/1/20 | | | 500,000 | | | | 523,890 | |
Harris County-Houston Sports Authority, Capital Appreciation Senior Lien, Revenue Bonds
Series A, Insured: AGM
(zero coupon), due 11/15/16 | | | 4,040,000 | | | | 4,038,141 | |
| | | | | | |
The notes to the financial statements are an integral part of,
and should be read in conjunction with, the financial statements. | | | | | 23 | |
Portfolio of Investments October 31, 2016 (continued)
| | | | | | | | |
| | | Principal
Amount | | | Value | |
| Municipal Bonds (continued) | |
Texas (continued) | | | | | | | | |
Kerrville Health Facilities Development Corp., Peterson Regional Medical Center Project, Revenue Bonds | | | | | | | | |
4.00%, due 8/15/17 | | $ | 780,000 | | | $ | 797,636 | |
4.00%, due 8/15/18 | | | 555,000 | | | | 581,307 | |
Tarrant County Cultural Education Facilities Finance Corp., Buckner Retirement Services, Revenue Bonds
Series A
3.00%, due 11/15/17 | | | 565,000 | | | | 576,543 | |
Texas State Public Finance Authority, Financing System Texas Southern University, Revenue Bonds | | | | | | | | |
Insured: BAM
4.00%, due 5/1/19 | | | 1,000,000 | | | | 1,063,400 | |
Insured: BAM
4.00%, due 5/1/20 | | | 1,000,000 | | | | 1,081,740 | |
| | | | | | | | |
| | | | 10,185,198 | |
| | | | | | | | |
U.S. Virgin Islands 1.2% | | | | | | | | |
Virgin Islands Public Finance Authority, Revenue Bonds | | | | | | | | |
Series A 5.00%, due 10/1/17 | | | 1,635,000 | | | | 1,653,345 | |
Series A 5.00%, due 10/1/19 | | | 1,810,000 | | | | 1,848,806 | |
Virgin Islands Public Finance Authority, Senior Lien-Matching Fund Loan Note, Revenue Bonds
Series B
5.00%, due 10/1/18 | | | 1,000,000 | | | | 1,012,340 | |
| | | | | | | | |
| | | | 4,514,491 | |
| | | | | | | | |
Utah 0.2% | |
City of St George UT Electric, Revenue Bonds Insured: AGM
2.00%, due 6/1/19 | | | 300,000 | | | | 306,123 | |
Utah Infrastructure Agency, Revenue Bonds
1.00%, due 10/15/18 | | | 630,000 | | | | 626,529 | |
| | | | | | | | |
| | | | | | | 932,652 | |
| | | | | | | | |
Vermont 0.1% | | | | | | | | |
Vermont Educational & Health Building Financing Agency, Saint Michael’s College-Green Bond, Revenue Bonds | | | | | | | | |
3.00%, due 10/1/17 | | | 315,000 | | | | 320,094 | |
4.00%, due 10/1/18 | | | 125,000 | | | | 131,124 | |
4.00%, due 10/1/19 | | | 130,000 | | | | 138,911 | |
| | | | | | | | |
| | | | | | | 590,129 | |
| | | | | | | | |
| | | | | | | | |
| | | Principal
Amount | | | Value | |
Virginia 0.1% | | | | | | | | |
Lexington Industrial Development Authority, Kendal At Lexington, Revenue Bonds
3.00%, due 1/1/19 | | $ | 300,000 | | | $ | 310,041 | |
| | | | | | | | |
| | |
West Virginia 0.8% | | | | | | | | |
West Virginia Economic Development Authority, Appalachian Power—Amos Project, Revenue Bonds
1.70%, due 1/1/41 (b)(c) | | | 3,000,000 | | | | 2,966,820 | |
| | | | | | | | |
Total Municipal Bonds
(Cost $327,210,755) | | | | 327,655,395 | |
| | | | | | | | |
|
| U.S. Government & Federal Agency 0.0%‡ | |
Federal National Mortgage Association
(Mortgage Pass-Through Security) 0.0%‡ | |
4.50%, due 11/1/18 | | | 18,237 | | | | 18,745 | |
| | | | | | | | |
Total U.S. Government & Federal Agency
(Cost $18,168) | | | | | | | 18,745 | |
| | | | | | | | |
Total Long-Term Bonds
(Cost $374,162,488) | | | | | | | 374,825,319 | |
| | | | | | | | |
Total Investments
(Cost $374,162,488) (d) | | | 98.9 | % | | | 374,825,319 | |
Other Assets, Less Liabilities | | | 1.1 | | | | 4,008,418 | |
Net Assets | | | 100.0 | % | | $ | 378,833,737 | |
| ‡ | Less than one-tenth of a percent. |
| (a) | May be sold to institutional investors only under Rule 144A or securities offered pursuant to Section 4(a)(2) of the Securities Act of 1933, as amended. |
| (b) | Floating rate—Rate shown was the rate in effect as of October 31, 2016. |
| (c) | Interest on these securities was subject to alternative minimum tax. |
| (d) | As of October 31, 2016, cost was $374,162,488 for federal income tax purposes and net unrealized appreciation was as follows: |
| | | | |
Gross unrealized appreciation | | $ | 1,324,643 | |
Gross unrealized depreciation | | | (661,812 | ) |
| | | | |
Net unrealized appreciation | | $ | 662,831 | |
| | | | |
| | | | |
| 24 | | MainStay Tax Advantaged Short Term Bond Fund | | The notes to the financial statements are an integral part of,
and should be read in conjunction with, the financial statements. |
As of October 31, 2016, the Fund held the following futures contracts1:
| | | | | | | | | | | | | | | | |
Type | | Number of
Contracts
(Short) | | | Expiration
Date | | | Notional
Amount2 | | | Unrealized
Appreciation
(Depreciation)3 | |
| 2-Year United States Treasury Note | | | (65 | ) | | | December 2016 | | | $ | (14,179,141 | ) | | $ | 5,953 | |
| | | | | | | | | | | | | | | | |
| | | | | | | | | | $ | (14,179,141 | ) | | $ | 5,953 | |
| | | | | | | | | | | | | | | | |
| 1. | As of October 31, 2016, cash in the amount of $30,190 was on deposit with a broker for futures transactions. |
| 2. | The combined market value of bonds and notional amount of Tax Advantaged Short Term Bond future contracts represents 95.2% of net assets. |
| 3. | Represents the difference between the value of the contracts at the time they were opened and the value as of October 31, 2016. |
The following abbreviations are used in the preceding pages:
AGC—Assured Guaranty Corp.
AGM—Assured Guaranty Municipal Corp.
AMBAC—Ambac Assurance Corp.
BAM—Build America Mutual Assurance Co.
MAC—Municipal Assurance Corp.
NATL-RE—National Public Finance Guarantee Corp.
XLCA—XL Capital Assurance, Inc.
The following is a summary of the fair valuations according to the inputs used as of October 31, 2016, for valuing the Fund’s assets and liabilities.
Asset Valuation Inputs
| | | | | | | | | | | | | | | | |
Description | | Quoted
Prices in
Active
Markets for
Identical
Assets (Level 1) | | | Significant
Other
Observable
Inputs (Level 2) | | | Significant
Unobservable
Inputs (Level 3) | | | Total | |
| Investments in Securities (a) | | | | | | | | | | | | | | | | |
| Long-Term Bonds | | | | | | | | | | | | | | | | |
Corporate Bonds | | $ | — | | | $ | 47,105,183 | | | $ | — | | | $ | 47,105,183 | |
Mortgage-Backed Securities | | | — | | | | 45,996 | | | | — | | | | 45,996 | |
Municipal Bonds | | | — | | | | 327,655,395 | | | | — | | | | 327,655,395 | |
U.S. Government & Federal Agency | | | — | | | | 18,745 | | | | — | | | | 18,745 | |
| | | | | | | | | | | | | | | | |
| Total Long-Term Bonds | | | — | | | | 374,825,319 | | | | — | | | | 374,825,319 | |
| | | | | | | | | | | | | | | | |
| Total Investments in Securities | | | — | | | | 374,825,319 | | | | — | | | | 374,825,319 | |
| | | | | | | | | | | | | | | | |
| Other Financial Instruments | | | | | | | | | | | | | | | | |
Futures Contracts Short (b) | | | 5,953 | | | | — | | | | — | | | | 5,953 | |
| | | | | | | | | | | | | | | | |
| Total Investments in Securities and Other Financial Instruments | | $ | 5,953 | | | $ | 374,825,319 | | | $ | — | | | $ | 374,831,272 | |
| | | | | | | | | | | | | | | | |
| (a) | For a complete listing of investments and their industries, see the Portfolio of Investments |
| (b) | The value listed for these securities reflects unrealized appreciation (depreciation) as shown on the Portfolio of Investments. |
The Fund recognizes transfers between the levels as of the beginning of the period.
For the period ended October, 31, 2016, the Fund did not have any transfers between Level 1 and Level 2 fair value measurements. (See Note 2)
As of October 31, 2016, the Fund did not hold any investments with significant unobservable inputs (Level 3). (See Note 2)
| | | | | | |
The notes to the financial statements are an integral part of,
and should be read in conjunction with, the financial statements. | | | | | 25 | |
Statement of Assets and Liabilities as of October 31, 2016 (Unaudited)
| | | | |
| Assets | |
Investment in securities, at value
(identified cost $374,162,488) | | $ | 374,825,319 | |
Cash | | | 317,503 | |
Cash collateral on deposit at broker | | | 30,190 | |
Receivables: | | | | |
Fund shares sold | | | 5,706,106 | |
Interest | | | 3,202,133 | |
Investment securities sold | | | 1,463,963 | |
Variation margin on futures contracts | | | 5,953 | |
Other assets | | | 68,248 | |
| | | | |
Total assets | | | 385,619,415 | |
| | | | |
|
| Liabilities | |
Payables: | | | | |
Investment securities purchased | | | 5,692,489 | |
Fund shares redeemed | | | 813,869 | |
Manager (See Note 3) | | | 117,317 | |
NYLIFE Distributors (See Note 3) | | | 34,016 | |
Transfer agent (See Note 3) | | | 33,388 | |
Professional fees | | | 25,508 | |
Shareholder communication | | | 8,618 | |
Trustees | | | 173 | |
Custodian | | | 56 | |
Accrued expenses | | | 188 | |
Dividend payable | | | 60,056 | |
| | | | |
Total liabilities | | | 6,785,678 | |
| | | | |
Net assets | | $ | 378,833,737 | |
| | | | |
|
| Composition of Net Assets | |
Shares of beneficial interest outstanding (par value of $.001 per share) unlimited number of shares authorized | | $ | 39,501 | |
Additional paid-in capital | | | 378,059,412 | |
| | | | |
| | | 378,098,913 | |
Distributions in excess of net investment income | | | (8,218 | ) |
Accumulated net realized gain (loss) on investments and futures transactions | | | 74,258 | |
Net unrealized appreciation (depreciation) on investments and futures contracts | | | 668,784 | |
| | | | |
Net assets | | $ | 378,833,737 | |
| | | | |
| | | | |
Class A | | | | |
Net assets applicable to outstanding shares | | $ | 160,918,486 | |
| | | | |
Shares of beneficial interest outstanding | | | 16,777,301 | |
| | | | |
Net asset value per share outstanding | | $ | 9.59 | |
Maximum sales charge (1.00% of offering price) | | | 0.10 | |
| | | | |
Maximum offering price per share outstanding | | $ | 9.69 | |
| | | | |
Investor Class | | | | |
Net assets applicable to outstanding shares | | $ | 3,755,408 | |
| | | | |
Shares of beneficial interest outstanding | | | 390,520 | |
| | | | |
Net asset value per share outstanding | | $ | 9.62 | |
Maximum sales charge (1.00% of offering price) | | | 0.10 | |
| | | | |
Maximum offering price per share outstanding | | $ | 9.72 | |
| | | | |
Class I | |
Net assets applicable to outstanding shares | | $ | 214,159,843 | |
| | | | |
Shares of beneficial interest outstanding | | | 22,333,623 | |
| | | | |
Net asset value and offering price per share outstanding | | $ | 9.59 | |
| | | | |
| | | | |
| 26 | | MainStay Tax Advantaged Short Term Bond Fund | | The notes to the financial statements are an integral part of,
and should be read in conjunction with, the financial statements. |
Statement of Operations for the six months ended October 31, 2016 (Unaudited)
| | | | |
| Investment Income (Loss) | |
Income | | | | |
Interest | | $ | 2,599,067 | |
| | | | |
Expenses | | | | |
Manager (See Note 3) | | | 778,704 | |
Distribution/Service—Class A (See Note 3) | | | 173,340 | |
Distribution/Service—Investor Class (See Note 3) | | | 4,600 | |
Transfer agent (See Note 3) | | | 118,633 | |
Registration | | | 75,891 | |
Professional fees | | | 35,238 | |
Shareholder communication | | | 17,029 | |
Custodian | | | 9,474 | |
Trustees | | | 4,474 | |
Interest expense | | | 25 | |
Miscellaneous | | | 7,205 | |
| | | | |
Total expenses before waiver/reimbursement | | | 1,224,613 | |
Expense waiver/reimbursement from Manager (See Note 3) | | | (88,208 | ) |
Reimbursement from custodian (a) | | | (13,373 | ) |
| | | | |
Net expenses | | | 1,123,032 | |
| | | | |
Net investment income (loss) | | | 1,476,035 | |
| | | | |
|
| Realized and Unrealized Gain (Loss) on Investments and Futures Contracts | |
Net realized gain (loss) on: | | | | |
Investment transactions | | | 73,172 | |
Futures transactions | | | (33,937 | ) |
| | | | |
Net realized gain (loss) on investments and futures transactions | | | 39,235 | |
| | | | |
Net change in unrealized appreciation (depreciation) on: | | | | |
Investments | | | (826,224 | ) |
Futures contracts | | | 5,953 | |
| | | | |
Net change in unrealized appreciation (depreciation) on investments and futures contracts | | | (820,271 | ) |
| | | | |
Net realized and unrealized gain (loss) on investments and futures transactions | | | (781,036 | ) |
| | | | |
Net increase (decrease) in net assets resulting from operations | | $ | 694,999 | |
| | | | |
| (a) | Reimbursement from custodian represents a refund for overbilling of prior years’ custody out-of-pocket fees. |
| | | | | | |
The notes to the financial statements are an integral part of,
and should be read in conjunction with, the financial statements. | | | | | 27 | |
Statements of Changes in Net Assets
for the six months ended October 31, 2016 (Unaudited), the year ended April 30, 2016 and period ended April 30, 2015.
| | | | | | | | | | | | |
| | | 2016 | | | 2016 | | | 2015 | |
| Increase (Decrease) in Net Assets | | | | | |
Operations: | | | | | | | | | | | | |
Net investment income (loss) | | $ | 1,476,035 | | | $ | 1,031,556 | | | $ | 256,058 | |
Net realized gain (loss) on investments and futures transactions | | | 39,235 | | | | 39,066 | | | | 11,051 | |
Net change in unrealized appreciation (depreciation) on investments and futures contracts | | | (820,271 | ) | | | 1,272,276 | | | | 220,791 | |
| | | | |
Net increase (decrease) in net assets resulting from operations | | | 694,999 | | | | 2,342,898 | | | | 487,900 | |
| | | | |
Dividends to shareholders: | | | | | | | | | | | | |
From net investment income: | | | | | | | | | | | | |
Class A | | | (488,669 | ) | | | (320,552 | ) | | | (91,976 | ) |
Investor Class | | | (6,619 | ) | | | (7,767 | ) | | | (5,677 | ) |
Class I | | | (980,747 | ) | | | (710,875 | ) | | | (160,721 | ) |
| | | | |
Total dividends to shareholders | | | (1,476,035 | ) | | | (1,039,194 | ) | | | (258,374 | ) |
| | | | |
Capital share transactions: | | | | | | | | | | | | |
Net proceeds from sale of shares | | | 199,087,660 | | | | 373,404,129 | | | | 51,674,735 | |
Net asset value of shares issued to shareholders in reinvestment of dividends | | | 1,179,599 | | | | 832,013 | | | | 203,446 | |
Cost of shares redeemed | | | (147,452,212 | ) | | | (101,825,492 | ) | | | (24,496,003 | ) |
| | | | |
Increase (decrease) in net assets derived from capital share transactions | | | 52,815,047 | | | | 272,410,650 | | | | 27,382,178 | |
| | | | |
Net increase (decrease) in net assets | | | 52,034,011 | | | | 273,714,354 | | | | 27,611,704 | |
| |
| Net Assets | | | | | |
Beginning of period | | | 326,799,726 | | | | 53,085,372 | | | | 53,085,372 | |
| | | | |
End of period | | $ | 378,833,737 | | | $ | 326,799,726 | | | $ | 80,697,076 | |
| | | | |
Distributions in excess of net investment income at end of period | | $ | (8,218 | ) | | $ | (8,218 | ) | | $ | (2,896 | ) |
| | | | |
| | | | |
| 28 | | MainStay Tax Advantaged Short Term Bond Fund | | The notes to the financial statements are an integral part of,
and should be read in conjunction with, the financial statements. |
Financial Highlights selected per share data and ratios
| | | | | | | | | | | | | | | | | | | | | | | | | | | | |
| | | Six months
ended
October 31, | | | Year ended
April 30, | | | November 1,
2014
through
April 30, | | | Year ended October 31, | |
| Class A | | 2016* | | | 2016 | | | 2015*** | | | 2014 | | | 2013 | | | 2012 | | | 2011 | |
Net asset value at beginning of period | | $ | 9.61 | | | $ | 9.54 | | | $ | 9.54 | | | $ | 9.59 | | | $ | 9.68 | | | $ | 9.69 | | | $ | 9.78 | |
| | | | | | | | | | | | | | | | | | | | | | | | | | | | |
Net investment income (loss) | | | 0.03 | | | | 0.07 | (a) | | | 0.01 | (a) | | | 0.04 | (a) | | | 0.05 | (a) | | | 0.09 | (a) | | | 0.11 | (a) |
Net realized and unrealized gain (loss) on investments | | | (0.02 | ) | | | 0.06 | | | | 0.01 | | | | (0.03 | ) | | | (0.05 | ) | | | 0.02 | | | | (0.06 | ) |
| | | | | | | | | | | | | | | | | | | | | | | | | | | | |
Total from investment operations | | | 0.01 | | | | 0.13 | | | | 0.02 | | | | 0.01 | | | | — | | | | 0.11 | | | | 0.05 | |
| | | | | | | | | | | | | | | | | | | | | | | | | | | | |
| Less dividends and distributions: | | | | | | | | | | | | | | | | | | | | | | | | | | | | |
From net investment income | | | (0.03 | ) | | | (0.06 | ) | | | (0.01 | ) | | | (0.04 | ) | | | (0.05 | ) | | | (0.08 | ) | | | (0.12 | ) |
From net realized gain on investments | | | — | | | | — | | | | (0.01 | ) | | | (0.02 | ) | | | (0.04 | ) | | | (0.04 | ) | | | (0.02 | ) |
| | | | | | | | | | | | | | | | | | | | | | | | | | | | |
Total dividends and distributions | | | (0.03 | ) | | | (0.06 | ) | | | (0.02 | ) | | | (0.06 | ) | | | (0.09 | ) | | | (0.12 | ) | | | (0.14 | ) |
| | | | | | | | | | | | | | | | | | | | | | | | | | | | |
Net asset value at end of period | | $ | 9.59 | | | $ | 9.61 | | | $ | 9.54 | | | $ | 9.54 | | | $ | 9.59 | | | $ | 9.68 | | | $ | 9.69 | |
| | | | | | | | | | | | | | | | | | | | | | | | | | | | |
Total investment return (b) | | | 0.15 | %(c) | | | 1.41 | % | | | 0.27 | %(c) | | | 0.09 | % | | | 0.04 | % | | | 1.13 | % | | | 0.53 | % |
| Ratios (to average net assets)/Supplemental Data: | | | | | | | | | | | | | | | | | | | | | | | | | | | | |
Net investment income (loss) | | | 0.70 | %††(d) | | | 0.69 | % | | | 0.33 | %†† | | | 0.41 | % | | | 0.57 | % | | | 0.77 | % | | | 1.23 | % |
Net expenses | | | 0.79 | %††(e) | | | 0.80 | % | | | 0.86 | %†† | | | 0.86 | % | | | 0.88 | % | | | 0.93 | % | | | 0.93 | % |
Expenses (before waiver/reimbursement) | | | 0.85 | %†† | | | 0.94 | % | | | 1.24 | %†† | | | 1.07 | % | | | 1.13 | % | | | 1.10 | % | | | 1.15 | % |
Portfolio turnover rate | | | 23 | % | | | 66 | % | | | 7 | % | | | 30 | % | | | 67 | % | | | 60 | % | | | 39 | % |
Net assets at end of period (in 000’s) | | $ | 160,918 | | | $ | 111,768 | | | $ | 18,908 | | | $ | 20,086 | | | $ | 24,657 | | | $ | 31,422 | | | $ | 31,689 | |
| *** | The Fund changed its fiscal year end from October 31 to April 30. |
| (a) | Per share data based on average shares outstanding during the period. |
| (b) | Total investment return is calculated exclusive of sales charges and assumes the reinvestment of dividends and distributions. |
| (c) | Total investment return is not annualized. |
| (d) | Without the custody fee reimbursement, net investment income (loss) would have been 0.69%. |
| (e) | Without the custody fee reimbursement, net expenses would have been 0.80%. |
| | | | | | | | | | | | | | | | | | | | | | | | | | | | |
| | | Six months
ended
October 31, | | | Year ended
April 30, | | | November 1,
2014
through
April 30, | | | Year ended October 31, | |
| Investor Class | | 2016* | | | 2016 | | | 2015*** | | | 2014 | | | 2013 | | | 2012 | | | 2011 | |
Net asset value at beginning of period | | $ | 9.64 | | | $ | 9.56 | | | $ | 9.57 | | | $ | 9.61 | | | $ | 9.71 | | | $ | 9.72 | | | $ | 9.81 | |
| | | | | | | | | | | | | | | | | | | | | | | | | | | | |
Net investment income (loss) | | | 0.02 | | | | 0.03 | (a) | | | (0.00 | )‡(a) | | | 0.01 | (a) | | | 0.02 | (a) | | | 0.04 | (a) | | | 0.08 | (a) |
Net realized and unrealized gain (loss) on investments | | | (0.02 | ) | | | 0.07 | | | | 0.00 | ‡ | | | (0.02 | ) | | | (0.06 | ) | | | 0.03 | | | | (0.06 | ) |
| | | | | | | | | | | | | | | | | | | | | | | | | | | | |
Total from investment operations | | | — | | | | 0.10 | | | | 0.00 | ‡ | | | (0.01 | ) | | | (0.04 | ) | | | 0.07 | | | | 0.02 | |
| | | | | | | | | | | | | | | | | | | | | | | | | | | | |
| Less dividends and distributions: | | | | | | | | | | | | | | | | | | | | | | | | | | | | |
From net investment income | | | (0.02 | ) | | | (0.02 | ) | | | (0.00 | )‡ | | | (0.01 | ) | | | (0.02 | ) | | | (0.04 | ) | | | (0.09 | ) |
From net realized gain on investments | | | — | | | | — | | | | (0.01 | ) | | | (0.02 | ) | | | (0.04 | ) | | | (0.04 | ) | | | (0.02 | ) |
| | | | | | | | | | | | | | | | | | | | | | | | | | | | |
Total dividends and distributions | | | (0.02 | ) | | | (0.02 | ) | | | (0.01 | ) | | | (0.03 | ) | | | (0.06 | ) | | | (0.08 | ) | | | (0.11 | ) |
| | | | | | | | | | | | | | | | | | | | | | | | | | | | |
Net asset value at end of period | | $ | 9.62 | | | $ | 9.64 | | | $ | 9.56 | | | $ | 9.57 | | | $ | 9.61 | | | $ | 9.71 | | | $ | 9.72 | |
| | | | | | | | | | | | | | | | | | | | | | | | | | | | |
Total investment return (b) | | | (0.03 | %)(c) | | | 1.06 | % | | | 0.02 | % (c) | | | (0.15 | %) | | | (0.41 | %) | | | 0.79 | % | | | 0.13 | % |
| Ratios (to average net assets)/Supplemental Data: | | | | | | | | | | | | | | | | | | | | | | | | | | | | |
Net investment income (loss) | | | 0.36 | % ††(d) | | | 0.30 | % | | | (0.03 | %)†† | | | 0.02 | % | | | 0.22 | % | | | 0.44 | % | | | 0.83 | % |
Net expenses | | | 1.14 | % ††(e) | | | 1.20 | % | | | 1.22 | % †† | | | 1.24 | % | | | 1.23 | % | | | 1.27 | % | | | 1.33 | % |
Expenses (before waiver/reimbursement) | | | 1.20 | % †† | | | 1.33 | % | | | 1.60 | % †† | | | 1.45 | % | | | 1.47 | % | | | 1.44 | % | | | 1.55 | % |
Portfolio turnover rate | | | 23 | % | | | 66 | % | | | 7 | % | | | 30 | % | | | 67 | % | | | 60 | % | | | 39 | % |
Net assets at end of period (in 000’s) | | $ | 3,755 | | | $ | 3,663 | | | $ | 3,552 | | | $ | 3,844 | | | $ | 3,965 | | | $ | 4,356 | | | $ | 4,128 | |
| ‡ | Less than one cent per share. |
| *** | The Fund changed its fiscal year end from October 31 to April 30. |
| (a) | Per share data based on average shares outstanding during the period. |
| (b) | Total investment return is calculated exclusive of sales charges and assumes the reinvestment of dividends and distributions. |
| (c) | Total investment return is not annualized. |
| (d) | Without the custody fee reimbursement, net investment income (loss) would have been 0.35%. |
| (e) | Without the custody fee reimbursement, net expenses would have been 1.15%. |
| | | | | | |
The notes to the financial statements are an integral part of,
and should be read in conjunction with, the financial statements. | | | | | 29 | |
Financial Highlights selected per share data and ratios
| | | | | | | | | | | | | | | | | | | | | | | | | | | | |
| | | Six months
ended
October 31, | | | Year ended
April 30, | | | November 1,
2014
through
April 30, | | | Year ended October 31, | |
| Class I | | 2016* | | | 2016 | | | 2015*** | | | 2014 | | | 2013 | | | 2012 | | | 2011 | |
Net asset value at beginning of period | | $ | 9.61 | | | $ | 9.54 | | | $ | 9.54 | | | $ | 9.58 | | | $ | 9.68 | | | $ | 9.69 | | | $ | 9.78 | |
| | | | | | | | | | | | | | | | | | | | | | | | | | | | |
Net investment income (loss) | | | 0.05 | | | | 0.09 | (a) | | | 0.03 | (a) | | | 0.05 | (a) | | | 0.08 | (a) | | | 0.10 | (a) | | | 0.14 | (a) |
Net realized and unrealized gain (loss) on investments | | | (0.02 | ) | | | 0.07 | | | | 0.01 | | | | (0.01 | ) | | | (0.06 | ) | | | 0.03 | | | | (0.06 | ) |
| | | | | | | | | | | | | | | | | | | | | | | | | | | | |
Total from investment operations | | | 0.03 | | | | 0.16 | | | | 0.04 | | | | 0.04 | | | | 0.02 | | | | 0.13 | | | | 0.08 | |
| | | | | | | | | | | | | | | | | | | | | | | | | | | | |
| Less dividends and distributions: | | | | | | | | | | | | | | | | | | | | | | | | | | | | |
From net investment income | | | (0.05 | ) | | | (0.09 | ) | | | (0.03 | ) | | | (0.06 | ) | | | (0.08 | ) | | | (0.10 | ) | | | (0.15 | ) |
From net realized gain on investments | | | — | | | | — | | | | (0.01 | ) | | | (0.02 | ) | | | (0.04 | ) | | | (0.04 | ) | | | (0.02 | ) |
| | | | | | | | | | | | | | | | | | | | | | | | | | | | |
Total dividends and distributions | | | (0.05 | ) | | | (0.09 | ) | | | (0.04 | ) | | | (0.08 | ) | | | (0.12 | ) | | | (0.14 | ) | | | (0.17 | ) |
| | | | | | | | | | | | | | | | | | | | | | | | | | | | |
Net asset value at end of period | | $ | 9.59 | | | $ | 9.61 | | | $ | 9.54 | | | $ | 9.54 | | | $ | 9.58 | | | $ | 9.68 | | | $ | 9.69 | |
| | | | | | | | | | | | | | | | | | | | | | | | | | | | |
Total investment return (b) | | | 0.28 | %(c) | | | 1.66 | % | | | 0.40 | %(c) | | | 0.45 | % | | | 0.19 | % | | | 1.39 | % | | | 0.78 | % |
| Ratios (to average net assets)/Supplemental Data: | | | | | | | | | | | | | | | | | | | | | | | | | | | | |
Net investment income (loss) | | | 0.96 | %††(d) | | | 0.93 | % | | | 0.56 | %†† | | | 0.66 | % | | | 0.79 | % | | | 1.03 | % | | | 1.48 | % |
Net expenses | | | 0.54 | %††(e) | | | 0.55 | % | | | 0.61 | %†† | | | 0.61 | % | | | 0.63 | % | | | 0.68 | % | | | 0.68 | % |
Expenses (before waiver/reimbursement) | | | 0.60 | %†† | | | 0.68 | % | | | 0.99 | %†† | | | 0.82 | % | | | 0.88 | % | | | 0.85 | % | | | 0.90 | % |
Portfolio turnover rate | | | 23 | % | | | 66 | % | | | 7 | % | | | 30 | % | | | 67 | % | | | 60 | % | | | 39 | % |
Net assets at end of period (in 000’s) | | $ | 214,160 | | | $ | 211,369 | | | $ | 30,626 | | | $ | 43,509 | | | $ | 60,437 | | | $ | 51,509 | | | $ | 48,193 | |
| *** | The Fund changed its fiscal year end from October 31 to April 30. |
| (a) | Per share data based on average shares outstanding during the period. |
| (b) | Total investment return is calculated exclusive of sales charges and assumes the reinvestment of dividends and distributions. Class I shares are not subject to sales charges. |
| (c) | Total investment return is not annualized. |
| (d) | Without the custody fee reimbursement, net investment income (loss) would have been 0.95%. |
| (e) | Without the custody fee reimbursement, net expenses would have been 0.55%. |
| | | | |
| 30 | | MainStay Tax Advantaged Short Term Bond Fund | | The notes to the financial statements are an integral part of,
and should be read in conjunction with, the financial statements. |
Notes to Financial Statements (Unaudited)
Note 1–Organization and Business
MainStay Funds Trust (the “Trust”) was organized as a Delaware statutory trust on April 28, 2009, and is governed by a Declaration of Trust. The Trust is registered under the Investment Company Act of 1940, as amended (the “1940 Act”), as an open-end management investment company, and is comprised of thirty-nine funds (collectively referred to as the “Funds”). These financial statements and notes relate to the MainStay Tax Advantaged Short Term Bond Fund (formerly known as MainStay Short Term Bond Fund (the “Fund”), a “diversified” fund, as that term is defined in the 1940 Act, as interpreted or modified by regulatory authorities having jurisdiction, from time to time.
The Fund currently offers three classes of shares. Class I shares commenced operations on January 2, 1991. Class A shares commenced operations on January 2, 2004. Investor Class shares commenced operations on February 28, 2008. Class A and Investor Class shares are offered at net asset value (“NAV”) per share plus an initial sales charge. No initial sales charge applies to investments of $250,000 or more (and certain other qualified purchases) in Class A and Investor Class shares, but a contingent deferred sales charge (“CDSC”) of 1.00% may be imposed on certain redemptions of such shares made within one year of the date of purchase on shares that were purchased without an initial sales charge made before January 1, 2017. Effective January 1, 2017, a CDSC of 1.00% may be imposed on certain redemptions of Class A and Investor Class shares made within 24 months of the date of purchase of such shares that were made without an initial sales charge. Class I shares are offered at NAV and are not subject to a sales charge. Depending upon eligibility, Class A shares may convert to Investor Class shares and Investor Class shares may convert to Class A shares. Under certain circumstances and as may be permitted by the Trust’s multiple class plan under Rule 18f-3 of the 1940 Act, an exchange/conversion may be made from specified share classes of the Fund to one or more other share classes of the Fund as disclosed in the capital share transactions within these notes. The three classes of shares have the same voting (except for issues that relate solely to one class), dividend, liquidation and other rights, and the same terms and conditions, except that Class A and Investor Class shares are subject to a distribution and/or service fee under a distribution plan pursuant to Rule 12b-1 under the 1940 Act. Class I shares are not subject to a distribution and/or service fee.
The Fund’s investment objective is to seek after tax total return.
Note 2–Significant Accounting Policies
The Fund is an investment company and accordingly follows the investment company accounting and reporting guidance of the Financial Accounting Standards Board (“FASB”) Accounting Standard Codification Topic 946 Financial Services—Investment Companies. The Fund prepares its financial statements in accordance with generally accepted accounting principles (“GAAP”) in the United States of America and follows the significant accounting policies described below.
(A) Securities Valuation. Investments are usually valued as of the close of regular trading on the New York Stock Exchange (the “Exchange”) (usually 4:00 p.m. Eastern time) on each day the Fund is open for business (“valuation date”).
The Board of Trustees (the “Board”) adopted procedures establishing methodologies for the valuation of the Fund’s securities and other assets and delegated the responsibility for valuation determinations under those procedures to the Valuation Committee of the Trust (the “Valuation Committee”). The Board authorized the Valuation Committee to appoint a Valuation Sub-Committee (the “Sub-Committee”) to deal in the first instance with establishing the prices of securities for which market quotations are not readily available or the prices of which are not otherwise readily determinable under these procedures. The Sub-Committee meets (in person, via electronic mail or via teleconference) on an as-needed basis. Subsequently, the Valuation Committee meets to ensure that actions taken by the Sub-Committee were appropriate. The procedures recognize that, subject to the oversight of the Board and unless otherwise noted, the responsibility for the day-to-day valuation of portfolio assets (including fair value measurements for the Fund’s assets and liabilities) rests with New York Life Investment Management LLC (“New York Life Investments” or the “Manager”), aided to whatever extent necessary by the Subadvisor (as defined in Note 3(A)) to the Fund.
To assess the appropriateness of security valuations, the Manager, Subadvisor or the Fund’s third party service provider, who is subject to oversight by the Manager, regularly compares prior day prices, prices on comparable securities, and the sale prices to the prior and current day prices and challenges prices with changes exceeding certain tolerance levels with third party pricing services or broker sources. For those securities valued through either a standardized fair valuation methodology or a fair valuation measurement, the Sub-Committee deals in the first instance with such valuation and the Valuation Committee reviews and affirms, if appropriate, the reasonableness of the valuation based on such methodologies and measurements on a regular basis after considering all relevant information that is reasonably available. Any action taken by the Sub-Committee with respect to the valuation of a portfolio security or other asset is submitted by the Valuation Committee to the Board for its review and ratification, if appropriate, at its next regularly scheduled meeting.
“Fair value” is defined as the price the Fund would reasonably expect to receive upon selling an asset or liability in an orderly transaction to an independent buyer in the principal or most advantageous market for the asset or liability. Fair value measurements are determined within a framework that establishes a three-tier hierarchy which maximizes the use of observable market data and minimizes the use of unobservable inputs to establish a classification of fair value measurements for disclosure purposes. “Inputs” refer broadly to the assumptions that market participants would use in pricing the asset or liability, including assumptions about risk, such as the risk inherent in a particular valuation technique used to measure fair value using a pricing model and/or the risk inherent in the inputs for the valuation technique. Inputs may be observable or unobservable. Observable inputs reflect the assumptions market participants would use in pricing the asset or liability based on market data obtained from sources independent of the Fund. Unobservable inputs reflect the Fund’s own assumptions about the assumptions market participants would use in pricing the asset or liability based on the information available. The inputs or methodology used for valuing assets or liabilities may not be an indication of the risks
Notes to Financial Statements (Unaudited) (continued)
associated with investing in those assets or liabilities. The three-tier hierarchy of inputs is summarized below.
| • | | Level 1—quoted prices in active markets for an identical asset or liability |
| • | | Level 2—other significant observable inputs (including quoted prices for a similar asset or liability in active markets, interest rates and yield curves, prepayment speeds, credit risk, etc.) |
| • | | Level 3—significant unobservable inputs (including the Fund’s own assumptions about the assumptions that market participants would use in measuring fair value of an asset or liability) |
The level of an asset or liability within the fair value hierarchy is based on the lowest level of an input, both individually and in the aggregate, that is significant to the fair value measurement. As of October 31, 2016, the aggregate value by input level of the Fund’s assets and liabilities is included at the end of the Fund’s Portfolio of Investments.
The Fund may use third party vendor evaluations, whose prices may be derived from one or more of the following standard inputs, among others:
| | |
• Benchmark yields | | • Reported trades |
• Broker/dealer quotes | | • Issuer spreads |
• Two-sided markets | | • Benchmark securities |
• Bids/offers | | • Reference data (corporate actions or material event notices) |
• Industry and economic events | | • Comparable bonds |
• Equity and credit default swap curves | | • Monthly payment information |
An asset or liability for which market values cannot be measured using the methodologies described above is valued by methods deemed reasonable in good faith by the Valuation Committee, following the procedures established by the Board, to represent fair value. Under these procedures, the Fund generally uses a market-based approach which may use related or comparable assets or liabilities, recent transactions, market multiples, book values, and other relevant information. The Fund may also use an income-based valuation approach in which the anticipated future cash flows of the asset or liability are discounted to calculate fair value. Discounts may also be applied due to the nature and/or duration of any restrictions on the disposition of the asset or liability. Fair value represents a good faith approximation of the value of a security. Fair value determinations involve the consideration of a number of subjective factors, an analysis of applicable facts and circumstances and the exercise of judgment. As a result, it is possible that the fair value for a security determined in good faith in accordance with the Fund’s valuation procedures may differ from valuations for the same security determined by other funds using their own valuation procedures. Although the Fund’s valuation procedures are designed to value a security at the price the Fund may reasonably expect to receive upon its sale in an orderly transaction, there can be no assurance that any fair value determination thereunder would, in fact, approximate the amount that the Fund would actually realize upon the sale of the security or the price at which the security would trade if a reliable market price were readily available. During the six-month period ended October 31, 2016, there were no material changes to the fair value methodologies.
Equity and non-equity securities which may be valued in this manner include, but are not limited to: (i) a security for which trading has been halted or suspended; (ii) a debt security that has recently gone into default and for which there is not a current market quotation; (iii) a security of an issuer that has entered into a restructuring; (iv) a security that has been de-listed from a national exchange; (v) a security for which the market price is not readily available from a third party pricing source or, if so provided, does not, in the opinion of the Manager or Subadvisor reflect the security’s market value; (vi) a security subject to trading collars for which no or limited trading takes place; and (vii) a security whose principal market has been temporarily closed at a time when, under normal conditions, it would be open. Securities for which market quotations or observable inputs are not readily available are generally categorized as Level 3 in the hierarchy. As of October 31, 2016, there were no securities held by the Fund that were fair valued in such a manner.
Debt securities (other than convertible and municipal bonds) are valued at the evaluated bid prices (evaluated mean prices in the case of convertible and municipal bonds) supplied by a pricing agent or brokers selected by the Manager, in consultation with the Subadvisor. Those values reflect broker/dealer supplied prices and electronic data processing techniques, if the evaluated bid or mean prices are deemed by the Manager, in consultation with the Subadvisor, to be representative of market values, at the regular close of trading of the Exchange on each valuation date. Debt securities purchased on a delayed delivery basis are marked to market daily until settlement at the forward settlement date. Debt securities, including corporate bonds, U.S. government & federal agency bonds, municipal bonds, foreign bonds, convertible bonds, asset-backed securities and mortgage-backed securities are generally categorized as Level 2 in the hierarchy.
Futures contracts are valued at the last posted settlement price on the market where such futures are primarily traded. Investments in mutual funds, including money market funds, are valued at their respective NAVs as of the close of the Exchange on the valuation date. These securities are generally categorized as Level 1 in the hierarchy.
Temporary cash investments acquired in excess of 60 days to maturity at the time of purchase are valued using the latest bid prices or using valuations based on a matrix system (which considers such factors as security prices, yields, maturities, and ratings), both as furnished by independent pricing services. Other temporary cash investments which mature in 60 days or less at the time of purchase (“Short-Term Investments”) are valued using the amortized cost method of valuation, unless the use of such method would be inappropriate. The amortized cost method involves valuing a security at its cost on the date of purchase and thereafter assuming a constant amortization to maturity of the difference between such cost and the value on maturity date. Amortized cost approximates the current fair value of a security. Securities valued using the amortized cost method are not valued using quoted prices in an active market and are generally categorized as Level 2 in the hierarchy.
The information above is not intended to reflect an exhaustive list of the methodologies that may be used to value portfolio investments. The valuation procedures permit the use of a variety of valuation methodologies in connection with valuing portfolio investments. The methodology used for a specific type of investment may vary based on the
| | |
| 32 | | MainStay Tax Advantaged Short Term Bond Fund |
market data available or other considerations. The methodologies summarized above may not represent the specific means by which portfolio investments are valued on any particular business day.
A Fund security or other asset may be determined to be illiquid under procedures approved by the Board. Illiquidity of a security might prevent the sale of such security at a time when the Manager or Subadvisor might wish to sell, and these securities could have the effect of decreasing the overall level of the Fund’s liquidity. Further, the lack of an established secondary market may make it more difficult to value illiquid securities, requiring the Fund to rely on judgments that may be somewhat subjective in measuring value, which could vary materially from the amount that the Fund could realize upon disposition. Difficulty in selling illiquid securities may result in a loss or may be costly to the Fund. Under the supervision of the Board, the Manager or Subadvisor determines the liquidity of the Fund’s investments; in doing so, the Manager or Subadvisor may consider various factors, including (i) the frequency of trades and quotations, (ii) the number of dealers and prospective purchasers, (iii) dealer undertakings to make a market, and (iv) the nature of the security and the market in which it trades (e.g., the time needed to dispose of the security, the method of soliciting offers and the mechanics of transfer). Illiquid securities are often valued in accordance with methods deemed by the Board in good faith to be reasonable and appropriate to accurately reflect their fair value. The liquidity of the Fund’s investments, as shown in the Portfolio of Investments, was determined as of October 31, 2016 and can change at any time in response to, among other relevant factors, market conditions or events or developments with respect to an individual issuer or instrument.
(B) Income Taxes. The Fund’s policy is to comply with the requirements of the Internal Revenue Code of 1986, as amended (the “Internal Revenue Code”), applicable to regulated investment companies and to distribute all of its taxable income to the shareholders of the Fund within the allowable time limits. Therefore, no federal, state and local income tax provisions are required.
Management evaluates the Fund’s tax positions to determine if the tax positions taken meet the minimum recognition threshold in connection with accounting for uncertainties in income tax positions taken or expected to be taken for the purposes of measuring and recognizing tax liabilities in the financial statements. Recognition of tax benefits of an uncertain tax position is permitted only to the extent the position is “more likely than not” to be sustained assuming examination by taxing authorities. Management has analyzed the Fund’s tax positions taken on federal, state and local income tax returns for all open tax years (for up to three tax years), and has concluded that no provisions for federal, state and local income tax are required in the Fund’s financial statements. The Fund’s federal, state and local income and federal excise tax returns for tax years for which the applicable statutes of limitations have not expired are subject to examination by the Internal Revenue Service and state and local departments of revenue.
(C) Dividends and Distributions to Shareholders. Dividends and distributions are recorded on the ex-dividend date. The Fund intends to declare dividends from net investment income, if any, daily and intends to pay them at least monthly and distributions from net realized capital and currency gains, if any, at least annually. Unless the shareholder elects otherwise, all dividends and distributions are
reinvested in the same class of shares of the Fund, at NAV. Dividends and distributions to shareholders are determined in accordance with federal income tax regulations and may differ from GAAP.
(D) Security Transactions and Investment Income. The Fund records security transactions on the trade date. Realized gains and losses on security transactions are determined using the identified cost method. Interest income is accrued as earned using the effective interest rate method and includes any realized gains and losses from repayments of principal on mortgage-backed securities. Discounts and premiums on securities purchased, other than Short-Term Investments, for the Fund are accreted and amortized, respectively, on the effective interest rate method over the life of the respective securities. Discounts and premiums on Short-Term Investments are accreted and amortized, respectively, on the straight-line method. The straight-line method approximates the effective interest method for Short-Term investments. Income from payment-in-kind securities is accreted daily based on the effective interest method.
Investment income and realized and unrealized gains and losses on investments of the Fund are allocated to separate classes of shares pro rata based upon their relative net assets on the date the income is earned or realized and unrealized gains and losses are incurred.
The Fund may place a debt security on non-accrual status and reduce related interest income by ceasing current accruals and writing off all or a portion of any interest receivables when the collection of all or a portion of such interest has become doubtful. A debt security is removed from non-accrual status when the issuer resumes interest payments or when collectability of interest is reasonably assured.
(E) Expenses. Expenses of the Trust are allocated to the individual Funds in proportion to the net assets of the respective Funds when the expenses are incurred, except where direct allocations of expenses can be made. Expenses (other than transfer agent expenses and fees incurred under the shareholder services plans and/or the distribution plans further discussed in Note 3(B)) are allocated to separate classes of shares pro rata based upon their relative net assets on the date the expenses are incurred. The expenses borne by the Fund, including those of related parties to the Fund, are shown in the Statement of Operations.
(F) Use of Estimates. In preparing financial statements in conformity with GAAP, management makes estimates and assumptions that affect the reported amounts and disclosures in the financial statements. Actual results could differ from those estimates.
(G) Repurchase Agreements. The Fund may enter into repurchase agreements to earn income. The Fund may enter into repurchase agreements only with financial institutions that are deemed by the Manager or Subadvisor to be creditworthy, pursuant to guidelines established by the Board. During the term of any repurchase agreement, the Manager or Subadvisor will continue to monitor the creditworthiness of the seller. Under the 1940 Act, repurchase agreements are considered to be collateralized loans by the Fund to the seller secured by the securities transferred to the Fund.
When the Fund enters into repurchase agreements, the Fund’s custodian takes possession of the collateral pledged for investments in the repurchase agreement. The underlying collateral is valued daily on a
Notes to Financial Statements (Unaudited) (continued)
mark to market basis to determine if the value, including accrued interest, exceeds the repurchase price. In the event of the seller’s default on the obligation to repurchase, the Fund has the right to liquidate the collateral and apply the proceeds in satisfaction of the obligation. Under certain circumstances, such as in the event of default or bankruptcy by the counterparty to the agreement, realization and/or retention of the collateral may be subject to legal proceedings and possible realized loss to the Fund.
(H) Dollar Rolls. The Fund may enter into dollar roll transactions in which it sells mortgage-backed securities (“MBS”) from its portfolio to a counterparty from whom it simultaneously agrees to buy a similar security on a delayed delivery basis. The Fund generally transfers MBS where the MBS are “to be announced,” therefore, the Fund accounts for these transactions as purchases and sales. The securities sold in connection with the dollar rolls are removed from the portfolio and a realized gain or loss is recognized. The securities the Fund has agreed to acquire are included at market value in the Portfolio of Investments and liabilities for such purchase commitments are included as payables for investments purchased. During the roll period, the Fund foregoes principal and interest paid on the securities. The Fund is compensated by the difference between the current sales price and the forward price for the future as well as by the earnings on the cash proceeds of the initial sale. Dollar rolls may be renewed without physical delivery of the securities subject to the contract. The Fund maintains liquid assets from its portfolio having a value not less than the repurchase price, including accrued interest. Dollar roll transactions involve certain risks, including the risk that the security returned to the Fund at the end of the roll period, while substantially similar, could be inferior to what was initially sold to the counterparty.
The Fund accounts for a dollar roll transaction as a purchase and sale whereby the difference in the sales price and purchase price of the security sold is recorded as a realized gain (loss).
(I) Futures Contracts. A futures contract is an agreement to purchase or sell a specified quantity of an underlying instrument at a specified future date and price, or to make or receive a cash payment based on the value of a financial instrument (e.g., foreign currency, interest rate, security, or securities index). The Fund is subject to risks such as equity price risk in the normal course of investing in these transactions. Upon entering into a futures contract, the Fund is required to pledge to the broker or futures commission merchant an amount of cash and/or U.S. Government securities equal to a certain percentage of the collateral amount, known as the “initial margin.” During the period the futures contract is open, changes in the value of the contract are recognized as unrealized appreciation or depreciation by marking to market such contract on a daily basis to reflect the market value of the contract at the end of each day’s trading. The Fund agrees to receive from or pay to the broker or futures commission merchant an amount of cash equal to the daily fluctuation in the value of the contract. Such receipts or payments are known as “variation margin.” When the futures contract is closed, the Fund records a realized gain or loss equal to the difference between the proceeds from (or cost of) the closing transaction and the Fund’s basis in the contract.
The use of futures contracts involves, to varying degrees, elements of market risk in excess of the amount recognized in the Statement of Assets and Liabilities. The contract or notional amounts and variation
margin reflect the extent of the Fund’s involvement in open futures positions. There are several risks associated with the use of futures contracts as hedging techniques. There can be no assurance that a liquid market will exist at the time when the Fund seeks to close out a futures contract. If no liquid market exists, the Fund would remain obligated to meet margin requirements until the position is closed. Futures may involve a small initial investment relative to the risk assumed, which could result in losses greater than if they had not been used. Futures may be more volatile than direct investments in the instrument underlying the futures, and may not correlate to the underlying instrument, causing a given hedge not to achieve its objectives. The Fund’s activities in futures contracts have minimal counterparty risk as they are conducted through regulated exchanges that guarantee the futures against default by the counterparty. In the event of a bankruptcy or insolvency of a futures commission merchant that holds margin on behalf of the Fund, the Fund may not be entitled to the return of the entire margin owed to the Fund, potentially resulting in a loss. The Fund’s investment in futures contracts and other derivatives may increase the volatility of the Fund’s NAV and may result in a loss to the Fund.
(J) Securities Lending. In order to realize additional income, the Fund may engage in securities lending, subject to the limitations set forth in the 1940 Act and relevant guidance by the staff of the Securities and Exchange Commission (“SEC”). In the event the Fund does engage in securities lending, the Fund will lend through its custodian, State Street Bank and Trust Company (“State Street”). State Street will manage the Fund’s cash collateral in accordance with the lending agreement between the Fund and State Street, and indemnify the Fund against counterparty risk. The loans will be collateralized by cash or securities at least equal at all times to the market value of the securities loaned. Collateral will consist of U.S. government securities, cash equivalents or irrevocable letters of credit. The Fund may bear the risk of delay in recovery of, or loss of rights in, the securities loaned should the borrower of the securities experience financial difficulty. The Fund may also record a realized gain or loss on securities deemed sold due to a borrower’s inability to return securities on loan. The Fund bears the risk of any loss on investment of the collateral. The Fund will receive compensation for lending its securities in the form of fees or it will retain a portion of interest on the investment of any cash received as collateral. The Fund will also continue to receive interest and dividends on the securities loaned and any gain or loss in the market price of the securities loaned that may occur during the term of the loan will be for the account of the Fund. During the six-month period ended October 31, 2016, the Fund did not have any portfolio securities on loan.
(K) Risk. The ability of issuers of debt securities held by the Fund to meet their obligations may be affected by economic or political developments in a specific country, industry or region.
(L) Indemnifications. Under the Trust’s organizational documents, its officers and trustees are indemnified against certain liabilities that may arise out of performance of their duties to the Trust. Additionally, in the normal course of business, the Fund enters into contracts with third-party service providers that contain a variety of representations and warranties and which may provide general indemnifications. The Fund’s maximum exposure under these arrangements is unknown, as this
| | |
| 34 | | MainStay Tax Advantaged Short Term Bond Fund |
would involve future claims that may be made against the Fund that have not yet occurred. Based on experience, management is of the view that the risk of loss in connection with these potential indemnification obligations is remote. However, there can be no assurance that material liabilities related to such obligations will not arise in the future, which could adversely impact the Fund.
(M) Quantitative Disclosure of Derivative Holdings. The following tables show additional disclosures related to the Fund’s derivative and hedging activities, including how such activities are accounted for and their effect on the Fund’s financial positions, performance and cash flows. The Fund entered into futures contracts in order to provide an efficient means of maintaining liquidity while remaining fully invested in the market. These derivatives are not accounted for as hedging instruments.
Fair value of derivative instruments as of October 31, 2016:
Asset Derivatives
| | | | | | | | | | |
| | | Statement of Assets and Liabilities Location | | Interest Rate Contracts Risk | | | Total | |
Futures Contracts | | Net Assets-Net unrealized appreciation (depreciation) on investments and futures contracts (a) | | $ | 5,953 | | | $ | 5,953 | |
| | | | | | |
Total Fair Value | | | | $ | 5,953 | | | $ | 5,953 | |
| | | | | | |
| (a) | Includes cumulative appreciation (depreciation) of futures contracts as reported in the Portfolio of Investments. Only current day’s variation margin is reported within the Statement of Assets and Liabilities. |
The effect of derivative instruments on the Statement of Operations for the period ended October 31, 2016:
Realized Gain (Loss)
| | | | | | | | | | |
| | | Statement of
Operations Location | | Interest Rate
Contracts Risk | | | Total | |
Futures Contracts | | Net realized gain (loss) on futures transactions | | $ | (33,937 | ) | | $ | (33,937 | ) |
| | | | | | |
Total Realized Gain (Loss) | | | | $ | (33,937 | ) | | $ | (33,937 | ) |
| | | | | | |
Change in Unrealized Appreciation (Depreciation)
| | | | | | | | | | |
| | | Statement of Operations Location | | Interest Rate
Contracts Risk | | | Total | |
Futures Contracts | | Net change in unrealized appreciation (depreciation) on futures contracts | | $ | 5,953 | | | $ | 5,953 | |
| | | | | | |
Total Change in Unrealized Appreciation (Depreciation) | | | | $ | 5,953 | | | $ | 5,953 | |
| | | | | | |
Average Notional Amount
| | | | | | | | |
| | | Interest Rate Contracts
Risk | | | Total | |
Futures Contracts Short | | $ | (14,212,250 | ) | | $ | (14,212,250 | ) |
| | | | |
Note 3–Fees and Related Party Transactions
(A) Manager and Subadvisor. New York Life Investments, a registered investment adviser and an indirect, wholly-owned subsidiary of New York Life Insurance Company (“New York Life”), serves as the Fund’s Manager, pursuant to an Amended and Restated Management Agreement (“Management Agreement”). The Manager provides offices, conducts clerical, recordkeeping and bookkeeping services, and keeps most of the financial and accounting records required to be maintained by the Fund. Except for the portion of salaries and expenses that are the responsibility of the Fund, the Manager pays the salaries and expenses of all personnel affiliated with the Fund and certain operational expenses of the Fund. The Fund reimburses New York Life Investments in an amount equal to a portion of the compensation of the Chief Compliance Officer of the Fund. MacKay Shields LLC (“MacKay Shields” or the “Subadvisor”), a registered investment adviser and an indirect, wholly-owned subsidiary of New York Life, serves as Subadvisor to the Fund and is responsible for the day-to-day portfolio management of the Fund. Pursuant to the terms of a Subadvisory Agreement (“Subadvisory Agreement”) between New York Life Investments and MacKay Shields, New York Life Investments pays for the services of the Subadvisor.
Under the Management Agreement, the Fund pays the Manager a monthly fee for services performed and facilities furnished at an annual rate of the Fund’s average daily net assets as follows: 0.45% on all assets.
New York Life Investments has contractually agreed to waive fees and/or reimburse expenses so that Total Annual Fund Operating Expenses for Class A shares do not exceed 0.80% of its average daily net assets. Total Annual Fund Operating Expenses excludes taxes, interest, litigation, extraordinary expenses, brokerage and other transaction expenses relating to the purchase or sale of portfolio investments, and acquired (underlying) fund fees and expenses. New York Life Investments will apply an equivalent waiver or reimbursement, in an equal number of basis points, to the other share classes of the Fund. This agreement will remain in effect until August 29, 2017, and shall renew
Notes to Financial Statements (Unaudited) (continued)
automatically for one-year terms unless New York Life Investments provides written notice of termination prior to the start of the next term or upon approval by the Board.
During the six-month period ended October 31, 2016, New York Life Investments earned fees from the Fund in the amount of $778,704 and waived its fees and/or reimbursed expenses in the amount of $88,208.
State Street provides sub-administration and sub-accounting services to the Fund pursuant to an agreement with New York Life Investments. These services include calculating the daily NAVs of the Fund, maintaining the general ledger and sub-ledger accounts for the calculation of the Fund’s NAVs, and assisting New York Life Investments in conducting various aspects of the Fund’s administrative operations. For providing these services to the Fund, State Street is compensated by New York Life Investments.
(B) Distribution and Service Fees. The Trust, on behalf of the Fund, has entered into a distribution agreement with NYLIFE Distributors LLC (the “Distributor”), an indirect, wholly-owned subsidiary of New York Life. The Fund has adopted distribution plans (the “Plans”) in accordance with the provisions of Rule 12b-1 under the 1940 Act.
Pursuant to the Class A and Investor Class Plans, the Distributor receives a monthly distribution fee from the Class A and Investor Class shares at an annual rate of 0.25% of the average daily net assets of the Class A and Investor Class shares for distribution and/or service activities as designated by the Distributor. Class I shares are not subject to a distribution and/or service fee.
The Plans provide that the distribution and service fees are payable to the Distributor regardless of the amounts actually expended by the Distributor for distribution of the Fund’s shares and service activities.
(C) Sales Charges. During the six-month period ended October 31, 2016, the Fund was advised by the Distributor that the amount of initial sales charges retained on sales of Class A and Investor Class shares were $1,833 and $30, respectively.
During the six-month period ended October 31, 2016, the Fund was also advised that the Distributor retained CDSCs on redemptions of Class A shares of $29,415.
(D) Transfer, Dividend Disbursing and Shareholder Servicing Agent. NYLIM Service Company LLC, an affiliate of New York Life Investments, is the Fund’s transfer, dividend disbursing and shareholder servicing agent pursuant to an agreement between NYLIM Service Company LLC and the Trust. NYLIM Service Company LLC has entered into an agreement with Boston Financial Data Services, Inc. (“BFDS”) pursuant to which BFDS performs certain transfer agent services on behalf of NYLIM Service Company LLC. During the six-month period ended October 31, 2016, transfer agent expenses incurred by the Fund were as follows:
| | | | |
Class A | | $ | 44,688 | |
Investor Class | | | 7,807 | |
Class I | | | 66,138 | |
(E) Small Account Fee. Shareholders with small accounts adversely impact the cost of providing transfer agency services. In an effort to reduce total transfer agency expenses, the Fund has
implemented a small account fee on certain types of accounts. Certain shareholders with an account balance of less than $1,000 are charged an annual per account fee of $20 (assessed semi-annually), the proceeds from which offset transfer agent fees as reflected in the Statement of Operations.
(F) Capital. As of October 31, 2016, New York Life and its affiliates beneficially held shares of the Fund with values and percentages of net assets as follows:
Note 4–Federal Income Tax
During the year ended April 30, 2016, the six-month period ended April 30, 2015 and the fiscal year ended October 31, 2014, the tax character of distributions paid as reflected in the Statements of Changes in Net Assets was as follows:
| | | | | | | | | | | | |
| | | 2016 | | | 2015 | | | 2014 | |
Distributions paid from: | | | | | | | | | | | | |
Exempt Interest Dividends | | $ | 832,614 | | | $ | — | | | $ | — | |
Ordinary Income | | | 206,580 | | | | 128,626 | | | | 436,880 | |
Long-Term Capital Gain | | | — | | | | 73,383 | | | | 160,992 | |
Total | | $ | 1,039,194 | | | $ | 202,009 | | | $ | 597,872 | |
Note 5–Custodian
State Street is the custodian of cash and securities held by the Fund. Custodial fees are charged to the Fund based on the Fund’s net assets and/or the market value of securities held by the Fund and the number of certain transactions incurred by the Fund.
Note 6–Line of Credit
The Fund and certain other funds managed by New York Life Investments, maintain a line of credit with a syndicate of banks in order to secure a source of funds for temporary purposes to meet unanticipated or excessive redemption requests.
Effective August 2, 2016, under an amended and restated credit agreement (the “Credit Agreement”), the aggregate commitment amount is $600,000,000 with an additional uncommitted amount of $100,000,000. The commitment fee is an annual rate of 0.15% of the average commitment amount payable quarterly, regardless of usage, to Bank of New York Mellon, who serves as the agent to the syndicate. The commitment fee is allocated among the Fund and certain affiliated funds based upon their respective net assets and other factors. Interest on any revolving credit loan is charged based upon the Federal Funds Advances Rate or the one month London InterBank Offered Rate, whichever is higher. The Credit Agreement expires on August 1, 2017, although the Fund, certain affiliated funds and the syndicate of banks may renew the Credit Agreement for an additional year on the same or different terms. Prior to August 2, 2016, the aggregate commitment amount was $600,000,000 with an additional uncommitted amount of $100,000,000, and the commitment fee was at an annual rate of 0.10% of the average commitment amount. During the six-month period ended October 31, 2016, there were no borrowings made or outstanding with respect to the Fund under the Credit Agreement.
| | |
| 36 | | MainStay Tax Advantaged Short Term Bond Fund |
Note 7–Interfund Lending Program
Pursuant to an exemptive order issued by the SEC, the Fund, along with certain other funds managed by New York Life Investments, may participate in an interfund lending program. The interfund lending program provides an alternate credit facility that permits the Fund and certain other funds managed by New York Life Investments to lend or borrow money for temporary purposes directly to or from one another, subject to the conditions of the exemptive order. During the six-month period ended October 31, 2016, there were no interfund loans made or outstanding with respect to the Fund.
Note 8–Purchases and Sales of Securities (in 000’s)
During the six-month period ended October 31, 2016, purchases and sales of U.S. government securities were $— and $8, respectively. Purchases and sales of securities, other than U.S. government securities and short-term securities, were $160,933 and $73,138, respectively.
Note 9–Capital Share Transactions
| | | | | | | | |
Class A | | Shares | | | Amount | |
Six-month period ended October 31, 2016: | | | | | | | | |
Shares sold | | | 9,941,078 | | | $ | 95,552,015 | |
Shares issued to shareholders in reinvestment of dividends and distributions | | | 35,290 | | | | 339,174 | |
Shares redeemed | | | (4,802,240 | ) | | | (46,137,028 | ) |
| | | | | | | | |
Net increase (decrease) in shares outstanding before conversion | | | 5,174,128 | | | | 49,754,161 | |
Shares converted into Class A (See Note 1) | | | 9,320 | | | | 89,579 | |
Shares converted from Class A (See Note 1) | | | (34,971 | ) | | | (336,204 | ) |
| | | | | | | | |
Net increase (decrease) | | | 5,148,477 | | | $ | 49,507,536 | |
| | | | | | | | |
Year ended April 30, 2016: | | | | | | | | |
Shares sold | | | 13,492,231 | | | $ | 129,166,122 | |
Shares issued to shareholders in reinvestment of dividends and distributions | | | 25,281 | | | | 242,068 | |
Shares redeemed | | | (3,865,724 | ) | | | (37,026,844 | ) |
| | | | | | | | |
Net increase (decrease) in shares outstanding before conversion | | | 9,651,788 | | | | 92,381,346 | |
Shares converted into Class A (See Note 1) | | | 3,138 | | | | 30,129 | |
Shares converted from Class A (See Note 1) | | | (8,126 | ) | | | (77,960 | ) |
| | | | | | | | |
Net increase (decrease) | | | 9,646,800 | | | $ | 92,333,515 | |
| | | | | | | | |
Year ended June 30, 2015:: | | | | | | | | |
Shares sold | | | 364,606 | | | $ | 3,474,988 | |
Shares issued to shareholders in reinvestment of dividends and distributions | | | 5,246 | | | | 49,994 | |
Shares redeemed | | | (493,037 | ) | | | (4,700,369 | ) |
| | | | | | | | |
Net increase (decrease) | | | (123,185 | ) | | $ | (1,175,387 | ) |
| | | | | | | | |
| | | | | | | | |
Investor Class | | Shares | | | Amount | |
Six-month period ended October 31, 2016: | | | | | | | | |
Shares sold | | | 32,521 | | | $ | 313,350 | |
Shares issued to shareholders in reinvestment of dividends and distributions | | | 678 | | | | 6,542 | |
Shares redeemed | | | (24,431 | ) | | | (235,414 | ) |
| | | | | | | | |
Net increase (decrease) in shares outstanding before conversion | | | 8,768 | | | | 84,478 | |
Shares converted into Investor Class (See Note 1) | | | 10,966 | | | | 105,600 | |
Shares converted from Investor Class (See Note 1) | | | (9,296 | ) | | | (89,579 | ) |
| | | | | | | | |
Net increase (decrease) | | | 10,438 | | | $ | 100,499 | |
| | | | | | | | |
Year ended April 30, 2016: | | | | | | | | |
Shares sold | | | 74,672 | | | $ | 716,213 | |
Shares issued to shareholders in reinvestment of dividends and distributions | | | 808 | | | | 7,735 | |
Shares redeemed | | | (71,857 | ) | | | (688,689 | ) |
| | | | | | | | |
Net increase (decrease) in shares outstanding before conversion | | | 3,623 | | | | 35,259 | |
Shares converted into Investor Class (See Note 1) | | | 8,109 | | | | 77,960 | |
Shares converted from Investor Class (See Note 1) | | | (3,132 | ) | | | (30,129 | ) |
| | | | | | | | |
Net increase (decrease) | | | 8,600 | | | $ | 83,090 | |
| | | | | | | | |
Year ended June 30, 2015: | | | | | | | | |
Shares sold | | | 45,517 | | | $ | 434,847 | |
Shares issued to shareholders in reinvestment of dividends and distributions | | | 486 | | | | 4,640 | |
Shares redeemed | | | (76,560 | ) | | | (731,537 | ) |
| | | | | | | | |
Net increase in shares outstanding before conversion | | | (30,557 | ) | | | (292,050 | ) |
Shares converted into Investor Class (See Note 1) | | | 5,864 | | | | 55,997 | |
Shares converted from Investor Class (See Note 1) | | | (5,728 | ) | | | (54,683 | ) |
| | | | | | | | |
Net increase (decrease) | | | (30,421 | ) | | $ | (290,736 | ) |
| | | | | | | | |
Notes to Financial Statements (Unaudited) (continued)
| | | | | | | | |
Class I | | Shares | | | Amount | |
Six-month period ended October 31, 2016: | | | | | | | | |
Shares sold | | | 10,741,605 | | | $ | 103,222,295 | |
Shares issued to shareholders in reinvestment of dividends and distributions | | | 86,757 | | | | 833,883 | |
Shares redeemed | | | (10,513,860 | ) | | | (101,079,770 | ) |
| | | | | | | | |
Net increase (decrease) in shares outstanding before conversion | | | 314,502 | | | | 2,976,408 | |
Shares converted into Class I (See Note 1) | | | 23,976 | | | | 230,604 | |
| | | | | | | | |
Net increase (decrease) | | | 338,478 | | | $ | 3,207,012 | |
| | | | | | | | |
Year ended April 30, 2016: | | | | | | | | |
Shares sold | | | 25,417,293 | | | $ | 243,521,794 | |
Shares issued to shareholders in reinvestment of dividends and distributions | | | 60,750 | | | | 582,210 | |
Shares redeemed | | | (6,694,004 | ) | | | (64,109,959 | ) |
| | | | | | | | |
Net increase (decrease) | | | 18,784,039 | | | $ | 179,994,045 | |
| | | | | | | | |
Year ended June 30, 2015: | | | | | | | | |
Shares sold | | | 1,101,344 | | | $ | 10,500,049 | |
Shares issued to shareholders in reinvestment of dividends and distributions | | | 11,710 | | | | 111,616 | |
Shares redeemed | | | (2,462,695 | ) | | | (23,465,925 | ) |
| | | | | | | | |
Net increase (decrease) | | | (1,349,641 | ) | | $ | (12,854,260 | ) |
| | | | | | | | |
Note 10–Recent Accounting Pronouncement
In October 2016, the U.S. Securities and Exchange Commission adopted new rules and amended existing rules (together, “final rules”) intended to modernize the reporting and disclosure of information by registered investment companies. In part, the final rules amend Regulation S-X and require standardized, enhanced disclosure about derivatives in investment company financial statements, as well as other amendments. The compliance date for the amendments to Regulation S-X is August 1, 2017. Management is currently evaluating the impact that the adoption of the amendments to Regulation S-X will have on the Fund’s financial statements and related disclosures.
Note 11–Subsequent Events
In connection with the preparation of the financial statements of the Fund as of and for the fiscal six-month period ended October 31, 2016, events and transactions subsequent to October 31, 2016, through the date the financial statements were issued have been evaluated by the Fund’s management for possible adjustment and/or disclosure. No subsequent events requiring financial statement adjustment or disclosure have been identified.
| | |
| 38 | | MainStay Tax Advantaged Short Term Bond Fund |
Proxy Voting Policies and Procedures and Proxy Voting Record
A description of the policies and procedures that New York Life Investments uses to vote proxies related to the Fund’s securities is available without charge, upon request, (i) by visiting the Fund’s website at mainstaylnvestments.com; and (ii) on the Securities and Exchange Commission’s (SEC) website at www.sec.gov.
The Fund is required to file with the SEC its proxy voting record for the 12-month period ending June 30 on Form N-PX. The Fund’s most recent Form N-PX or proxy voting record is available free of charge upon request by calling 800-MAINSTAY (624-6782); visiting the Fund’s website at mainstayinvestments.com; or on the SEC’s website at www.sec.gov.
Shareholder Reports and Quarterly Portfolio Disclosure
The Fund is required to file its complete schedule of portfolio holdings with the SEC for its first and third fiscal quarters on Form N-Q. The Fund’s Form N-Q is available without charge, on the SEC’s website at www.sec.gov or by calling MainStay Investments at 800-MAINSTAY (624-6782). You also can obtain and review copies of Form N-Q by visiting the SEC’s Public Reference Room in Washington, DC (information on the operation of the Public Reference Room may be obtained by calling 1-800-SEC-0330).
This page intentionally left blank
This page intentionally left blank
This page intentionally left blank
MainStay Funds
MainStay offers a wide range of Funds for virtually any investment need. The full array of MainStay open-end offerings is listed here, with information about the manager, subadvisors, legal counsel and independent registered public accounting firm.
Equity
U.S. Equity
MainStay Common Stock Fund
MainStay Cornerstone Growth Fund
MainStay Epoch U.S. All Cap Fund
MainStay Epoch U.S. Equity Yield Fund
MainStay Epoch U.S. Small Cap Fund
MainStay ICAP Equity Fund
MainStay ICAP Select Equity Fund
MainStay Large Cap Growth Fund
MainStay MAP Fund
MainStay S&P 500 Index Fund
MainStay U.S. Equity Opportunities Fund
International/Global Equity
MainStay Emerging Markets Opportunities Fund
MainStay Epoch Capital Growth Fund
MainStay Epoch Global Choice Fund
MainStay Epoch Global Equity Yield Fund
MainStay Epoch International Small Cap Fund
MainStay ICAP International Fund
MainStay International Equity Fund
MainStay International Opportunities Fund
Income
Taxable Bond
MainStay Floating Rate Fund
MainStay Global High Income Fund
MainStay Government Fund
MainStay High Yield Corporate Bond Fund
MainStay High Yield Opportunities Fund
MainStay Indexed Bond Fund
MainStay Short Duration High Yield Fund
MainStay Total Return Bond Fund
MainStay Unconstrained Bond Fund
Municipal/Tax Advantaged Bond
MainStay California Tax Free Opportunities Fund1
MainStay High Yield Municipal Bond Fund
MainStay New York Tax Free Opportunities Fund2
MainStay Tax Advantaged Short Term Bond Fund
MainStay Tax Free Bond Fund
Money Market
MainStay Money Market Fund
Mixed Asset
MainStay Balanced Fund
MainStay Convertible Fund
MainStay Income Builder Fund
Alternative
MainStay Absolute Return Multi-Strategy Fund
MainStay Cushing Energy Income Fund
MainStay Cushing MLP Premier Fund
MainStay Cushing Renaissance Advantage Fund
Asset Allocation/Target Date
MainStay Conservative Allocation Fund
MainStay Growth Allocation Fund
MainStay Moderate Allocation Fund
MainStay Moderate Growth Allocation Fund
MainStay Retirement 2010 Fund
MainStay Retirement 2020 Fund
MainStay Retirement 2030 Fund
MainStay Retirement 2040 Fund
MainStay Retirement 2050 Fund
MainStay Retirement 2060 Fund
Manager
New York Life Investment Management LLC
New York, New York
Subadvisors
Candriam France S.A.S.3
Paris, France
Cornerstone Capital Management Holdings LLC3
New York, New York
Cushing Asset Management, LP
Dallas, Texas
Epoch Investment Partners, Inc.
New York, New York
Institutional Capital LLC3
Chicago, Illinois
MacKay Shields LLC3
New York, New York
Markston International LLC
White Plains, New York
NYL Investors LLC3
New York, New York
Winslow Capital Management, LLC
Minneapolis, Minnesota
Legal Counsel
Dechert LLP
Washington, District of Columbia
Independent Registered Public Accounting Firm
KPMG LLP
Philadelphia, Pennsylvania
1. This Fund is only registered for sale in AZ, CA, MI (Class A and Class I shares only), NV, OR, TX, UT and WA.
2. This Fund is only registered for sale in CA, CT, DE, FL, MA, NJ, NY and VT.
3. An affiliate of New York Life Investment Management LLC.
Not part of the Semiannual Report
For more information
800-MAINSTAY (624-6782)
mainstayinvestments.com
MainStay Investments® is a registered service mark and name under which New York Life Investment Management LLC does business. MainStay Investments, an indirect subsidiary of New York Life Insurance Company, New York, NY 10010, provides investment advisory products and services. The MainStay Funds® are managed by New York Life Investment Management LLC and distributed by NYLIFE Distributors LLC, 30 Hudson Street, Jersey City, NJ 07302, a wholly owned subsidiary of New York Life Insurance Company. NYLIFE Distributors LLC is a Member FINRA/SIPC.
This report may be distributed only when preceded or accompanied by a current Fund prospectus.
©2016 NYLIFE Distributors LLC. All rights reserved.
| | | | | | | | |
| Not FDIC/NCUA Insured | | Not a Deposit | | May Lose Value | | No Bank Guarantee | | Not Insured by Any Government Agency |
| | |
| 1716479 MS316-16 | | MSTAS10-12/16 (NYLIM) NL0B5 |
Item 2. Code of Ethics.
Not applicable.
| Item 3. | Audit Committee Financial Expert. |
Not applicable.
| Item 4. | Principal Accountant Fees and Services. |
Not applicable.
| Item 5. | Audit Committee of Listed Registrants |
Not applicable.
| Item 6. | Schedule of Investments |
The Schedule of Investments is included as part of Item 1 of this report.
| Item 7. | Disclosure of Proxy Voting Policies and Procedures for Closed-End Management Investment Companies. |
Not applicable.
| Item 8. | Portfolio Managers of Closed-End Management Investment Companies. |
Not applicable.
| Item 9. | Purchases of Equity Securities by Closed-End Management Investment Company and Affiliated Purchasers. |
Not Applicable.
| Item 10. | Submission of Matters to a Vote of Security Holders. |
Since the Registrant’s last response to this Item, there have been no material changes to the procedures by which shareholders may recommend nominees to the Registrant’s Board of Trustees.
Item 11. Controls and Procedures.
| (a) | Based on an evaluation of the Registrant’s Disclosure Controls and Procedures (as defined in Rule 30a-3(c) under the Investment Company Act of 1940) (the “Disclosure Controls”), as of a date within 90 days prior to the filing date (the “Filing Date”) of this Form N-CSR (the “Report”), the Registrant’s principal executive officer and principal financial officer have concluded that the Disclosure Controls are reasonably designed to ensure that information required to be disclosed by the Registrant in the Report is recorded, processed, summarized and reported by the Filing Date, including ensuring that information required to be disclosed in the Report is accumulated and communicated to the Registrant’s management, including the Registrant’s principal executive officer and principal financial officer, as appropriate to allow timely decisions regarding required disclosure. |
| (b) | There were no changes in the Registrant’s internal control over financial reporting (as defined in Rule 30a-3(d)) under the Investment Company Act of 1940 that occurred during the second fiscal quarter of the period covered by this report that has materially affected, or is reasonably likely to materially affect, the Registrant’s internal control over financial reporting. |
Item 12. Exhibits.
| (a) | Certifications of principal executive officer and principal financial officer as required by Rule 30a-2 under the Investment Company Act of 1940. |
| (b) | Certifications of principal executive officer and principal financial officer as required by Section 906 of the Sarbanes-Oxley Act of 2002. |
SIGNATURES
Pursuant to the requirements of the Securities Exchange Act of 1934 and the Investment Company Act of 1940, the Registrant has duly caused this Report to be signed on its behalf by the undersigned, thereunto duly authorized.
MAINSTAY FUNDS TRUST
| | |
| By: | | /s/ Stephen P. Fisher |
| | Stephen P. Fisher President and Principal Executive Officer |
Pursuant to the requirements of the Securities Exchange Act of 1934 and the Investment Company Act of 1940, this Report has been signed below by the following persons on behalf of the Registrant and in the capacities and on the dates indicated.
| | |
| By: | | /s/ Stephen P. Fisher |
| | Stephen P. Fisher President and Principal Executive Officer |
| | |
| By: | | /s/ Jack R. Benintende |
| | Jack R. Benintende Treasurer and Principal Financial and Accounting Officer |
EXHIBIT INDEX
| (a) | Certifications of principal executive officer and principal financial officer as required by Rule 30a-2 under the Investment Company Act of 1940. |
| (b) | Certification of principal executive officer and principal financial officer as required by Section 906 of the Sarbanes-Oxley Act of 2002. |