UNITED STATES
SECURITIES AND EXCHANGE COMMISSION
Washington, D.C. 20549
Form N-CSR
CERTIFIED SHAREHOLDER REPORT OF REGISTERED MANAGEMENT
INVESTMENT COMPANIES
Investment Company Act File Number 811-22321
MAINSTAY FUNDS TRUST
(Exact name of Registrant as specified in charter)
51 Madison Avenue, New York, NY 10010
(Address of principal executive offices) (Zip code)
J. Kevin Gao, Esq.
30 Hudson Street
Jersey City, New Jersey 07302
(Name and address of agent for service)
Registrant’s telephone number, including area code: (212) 576-7000
Date of fiscal year end: November 30 (MainStay Cushing Funds only)
Date of reporting period: May 31, 2016
FORM N-CSR
The information presented in this Form N-CSR relates solely to MainStay Cushing MLP Premier Fund,
MainStay Cushing Renaissance Advantage Fund and MainStay Cushing Energy Income Fund,
series of the Registrant.
| Item 1. | Reports to Stockholders. |
MainStay Cushing® Funds
Message from the President and Semiannual Report
Unaudited | May 31, 2016

MainStay Cushing® MLP Premier Fund
MainStay Cushing® Renaissance Advantage Fund
MainStay Cushing® Energy Income Fund

This page intentionally left blank
Message from the President
The U.S. stock market experienced substantial volatility during the six months ended May 31, 2016. Stock prices varied somewhat in December 2015, then declined steadily in the early weeks of 2016. Oil prices also continued their long-standing descent through early 2016, and slowing economic growth in China continued to be a major concern for equity investors. In February, U.S. stocks began a relatively steady recovery, and they generally closed the reporting period ahead of where they began.
According to FTSE Russell data for the reporting period, mid- and large-capitalization U.S. stocks generally provided positive total returns, with mid-cap stocks taking the lead. Smaller-cap stocks tended to decline during the reporting period, and value stocks generally outperformed growth stocks at all capitalization levels.
International stocks tended to provide negative returns for the reporting period, while emerging-market stocks managed slightly positive returns. Slowing growth in China, weaker commodity prices and Brazil’s economic woes all took a toll on global stock performance, but the recovery in crude oil prices that began in early 2016 helped stabilize several markets.
Many sectors of the bond market showed relatively strong performance during the six-month reporting period. High-yield bonds were the strongest performers, followed by municipal bonds, leveraged loans and high-grade bonds in the aggregate. U.S. Treasury securities benefited as yields declined for bonds with maturities of two years or longer. Yields were mixed for shorter-term U.S. Treasury securities, and short-term government and corporate bonds provided positive returns. The convertible bond market, where bond performance is tied to the value of an underlying stock, struggled during the reporting period, as some convertible issuers faced challenges.
During the reporting period, our managers sought to maintain a long-term perspective and generally did not make decisions based on short-term volatility. For some managers this may have proved beneficial. For example, although oil prices declined substantially in a period of supply-and-demand imbalance, they eventually recovered toward levels that were more familiar and reasonable. A similar pattern was seen in the stock market.
While our portfolio managers may closely consider daily market movements, they seek to make long-term decisions on the basis of the investment objectives of their respective Funds and the investment strategies outlined in each Fund’s prospectus. In this way, they seek to offer a consistent basis for their decisions, wherever the markets may move.
The semiannual report that follows provides more detailed information about the market changes, investment decisions and individual securities that affected the MainStay Cushing Funds during the six months ended May 31, 2016. We hope that you will read the report carefully and use the information as part of your long-term investment planning and decision making.
At MainStay, we’re honored that you have chosen to invest with us, and we hope that our Funds will remain a valuable part of your investment portfolio for many years to come.
Sincerely,

Stephen P. Fisher
President
The opinions expressed are as of the date of this report and are subject to change. There is no guarantee that any forecast made will come to pass. This material does not constitute investment advice and is not intended as an endorsement of any specific investment. Past performance is no guarantee of future results.
Not part of the Semiannual Report
Table of Contents
Investors should refer to each Fund’s Summary Prospectus and/or Prospectus and consider each Fund’s investment objectives, strategies, risks, charges and expenses carefully before investing. The Summary Prospectus and/or Prospectus contain this and other information about each Fund. You may obtain copies of each Fund’s Summary Prospectus, Prospectus and Statement of Additional Information free of charge, upon request, by calling toll-free 800-MAINSTAY (624-6782), by writing to NYLIFE Distributors LLC, Attn: MainStay Marketing Department, 30 Hudson Street, Jersey City, New Jersey 07302 or by sending an e-mail to MainStayShareholderServices@nylim.com. These documents are also available via the MainStay Funds’ website at mainstayinvestments.com/documents. Please read each Summary Prospectus and/or Prospectus carefully before investing.
MainStay Cushing MLP Premier Fund
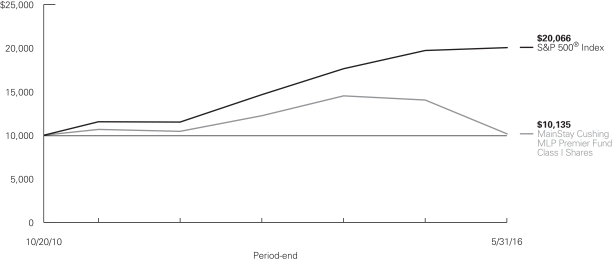
Investment and Performance Comparison1 (Unaudited)
Performance data quoted represents past performance. Past performance is no guarantee of future results. Because of market volatility, current performance may be lower or higher than the figures shown. Investment return and principal value will fluctuate, and as a result, when shares are redeemed, they may be worth more or less than their original cost. The graph below depicts the historical performance of Class I shares of the Fund. Performance will vary from class to class based on differences in class-specific expenses and sales charges. For performance information current to the most recent month-end, please call 800-MAINSTAY (624-6782) or visit mainstayinvestments.com.
Average Annual Total Returns for the Period Ended May 31, 2016
| | | | | | | | | | | | | | | | | | | | |
| Class | | Sales Charge | | | | Six Months | | | One Year | | | Since
Inception
(10/20/10) | | | Gross
Expense
Ratio2 | |
| Class A Shares3 | | Maximum 5.5% Initial Sales Charge | | With sales charge Excluding sales charge | |
| –5.55
–0.06 | %
| |
| –32.04
–28.09 | %
| |
| –1.07
–0.02 | %
| |
| 1.50
1.50 | %
|
| Investor Class Shares4 | | Maximum 5.5% Initial Sales Charge | | With sales charge Excluding sales charge | |
| –5.55
–0.06 |
| |
| –32.04
–28.09 |
| |
| –1.07
–0.02 |
| |
| 1.50
1.50 |
|
| Class C Shares3 | | Maximum 1% CDSC if Redeemed Within One Year of Purchase | | With sales charge Excluding sales charge | |
| –1.37
–0.43 |
| |
| –29.24
–28.60 |
| |
| –0.78
–0.78 |
| |
| 2.25
2.25 |
|
| Class I Shares3 | | No Sales Charge | | | | | 0.09 | | | | –27.86 | | | | 0.24 | | | | 1.25 | |
| 1. | The performance table and graph do not reflect the deduction of taxes that a shareholder would pay on distributions or Fund share redemptions. Total returns reflect maximum applicable sales charges as indicated in the table above, changes in share price, and reinvestment of dividend and capital gain distributions. The graph assumes the initial investment amount shown above and reflects the deduction of all sales charges that would have applied for the period of investment. Performance figures reflect certain fee waivers and/or expense limitations, without which total returns may have been lower. For more information on share classes and current fee waivers and/or expense limitations, please refer to the notes to the financial statements. |
| 2. | The gross expense ratios presented reflect the Fund’s “Total Annual Fund Operating Expenses” from the most recent Prospectus and may differ from other expense ratios disclosed in this report. |
| 3. | Performance figures for Class A shares, Class C shares and Class I shares reflect the historical performance of the then–existing Class A shares, Class C shares and Class I shares, respectively, of the Cushing® MLP Premier Fund (the predecessor to the Fund, which was subject to a different fee structure) for periods prior to July 11, 2014. The Cushing® MLP Premier Fund commenced operations on October 20, 2010. |
| 4. | Performance figures for Investor Class shares, first offered on July 11, 2014, include the historical performance of Class A shares through July 10, 2014, adjusted for differences in certain expenses and fees. Unadjusted, the performance shown for Investor Class shares would likely have been different. |
The footnotes on the next page are an integral part of the table and graph and should be carefully read in conjunction with them.
| | | | | | | | | | | | |
| Benchmark Performance | | Six Months | | | One Year | | | Since
Inception | |
S&P 500® Index5 | | | 1.93 | % | | | 1.72 | % | | | 13.21 | % |
Average Lipper Energy MLP Fund6 | | | 1.64 | | | | –28.42 | | | | 2.62 | |
| 5. | “S&P 500®” is a trademark of The McGraw-Hill Companies, Inc. The S&P 500® Index is widely regarded as the standard index for measuring large-cap U.S. stock market performance. The S&P 500® Index is the Fund’s primary benchmark. Results assume reinvestment of all dividends and capital gains. An investment cannot be made directly in an index. |
| 6. | The average Lipper Energy MLP Fund is representative of funds that invest primarily in Master Limited Partnerships (MLPs) engaged in the |
| | transportation, storage and processing of minerals and natural resources. This benchmark is a product of Lipper Inc. Lipper Inc. is an independent monitor of fund performance. Results are based on total returns with all dividend and capital gain distributions reinvested. |
The footnotes on the preceding page are an integral part of the table and graph and should be carefully read in conjunction with them.
| | |
| 6 | | MainStay Cushing MLP Premier Fund |
Cost in Dollars of a $1,000 Investment in MainStay Cushing MLP Premier Fund (Unaudited)
The example below is intended to describe the fees and expenses borne by shareholders during the six-month period from December 1, 2015, to May 31, 2016, and the impact of those costs on your investment.
Example
As a shareholder of the Fund, you incur two types of costs: (1) transaction costs, including exchange fees and sales charges (loads) on purchases (as applicable), and (2) ongoing costs, including management fees, distribution and/or service (12b-1) fees, and other Fund expenses (as applicable). This example is intended to help you understand your ongoing costs (in dollars) of investing in the Fund and to compare these costs with the ongoing costs of investing in other mutual funds. The example is based on an investment of $1,000 made at the beginning of the six-month period and held for the entire period from December 1, 2015, to May 31, 2016.
This example illustrates your Fund’s ongoing costs in two ways:
Actual Expenses
The second and third data columns in the table below provide information about actual account values and actual expenses. You may use the information in these columns, together with the amount you invested, to estimate the expenses that you paid during the six months ended May 31, 2016. Simply divide your account value by $1,000 (for example, an $8,600 account value divided by $1,000 = 8.6), then
multiply the result by the number under the heading entitled “Expenses Paid During Period” to estimate the expenses you paid on your account during this period.
Hypothetical Example for Comparison Purposes
The fourth and fifth data columns in the table below provide information about hypothetical account values and hypothetical expenses based on the Fund’s actual expense ratio and an assumed rate of return of 5% per year before expenses, which is not the Fund’s actual return. The hypothetical account values and expenses may not be used to estimate the actual ending account balances or expenses you paid for the six-month period shown. You may use this information to compare the ongoing costs of investing in the Fund with the ongoing costs of investing in other Funds. To do so, compare this 5% hypothetical example with the 5% hypothetical examples that appear in the shareholder reports of the other Funds.
Please note that the expenses shown in the table are meant to highlight your ongoing costs only and do not reflect any transactional costs, such as exchange fees or sales charges (loads). Therefore, the fourth and fifth data columns of the table are useful in comparing ongoing costs only and will not help you determine the relative total costs of owning different funds. In addition, if these transactional costs were included, your costs would have been higher.
| | | | | | | | | | | | | | | | | | | | |
| | | | | | | | | | | | | | | | |
| Share Class | | Beginning
Account Value
12/1/15 | | | Ending Account Value (Based
on Actual
Returns and
Expenses)
5/31/16 | | | Expenses
Paid During
Period1 | | | Ending Account
Value (Based
on Hypothetical
5% Annualized
Return and
Actual Expenses) 5/31/16 | | | Expenses
Paid During
Period1 | |
| | | | | |
| Class A Shares | | $ | 1,000.00 | | | $ | 999.40 | | | $ | 7.90 | | | $ | 1,017.10 | | | $ | 7.97 | |
| | | | | |
| Investor Class Shares | | $ | 1,000.00 | | | $ | 999.40 | | | $ | 7.95 | | | $ | 1,017.05 | | | $ | 8.02 | |
| | | | | |
| Class C Shares | | $ | 1,000.00 | | | $ | 995.70 | | | $ | 11.67 | | | $ | 1,013.30 | | | $ | 11.78 | |
| | | | | |
| Class I Shares | | $ | 1,000.00 | | | $ | 1000.90 | | | $ | 6.65 | | | $ | 1,018.35 | | | $ | 6.71 | |
| 1. | Expenses are equal to the Fund’s annualized expense ratio of each class (1.58% for Class A, 1.59% for Investor Class, 2.34% for Class C and 1.33% for Class I) multiplied by the average account value over the period, divided by 366 and multiplied by 183 for Class A, Investor Class, Class C, and Class I (to reflect the six-month period). Expenses for the six-month period ended excluded a franchise tax expense to the Fund that equaled 0.02% for Class A, 0.02% for Investor Class, 0.02% for Class C, and 0.02% for Class I. The table above represents the actual expenses incurred during the six-month period. |
Portfolio Composition as of May 31, 2016(1) (Unaudited)
(Expressed as a Percentage of Total Investments)

See Portfolio of Investments beginning on page 11 for specific holdings within these categories.
Top Ten Holdings as of May 31, 2016 (excluding short-term investments)
| 1. | Energy Transfer Partners, L.P. |
| 2. | Enterprise Products Partners, L.P. |
| 3. | Enbridge Energy Partners, L.P. |
| 4. | Williams Partners, L.P. |
| 5. | NGL Energy Partners, L.P. |
| 6. | Shell Midstream Partners, L.P. |
| 7. | EQT Midstream Partners, L.P. |
| 9. | EnLink Midstream Partners, L.P. |
| (1) | Fund holdings and sector allocations are subject to change, and there is no assurance that the Fund will continue to hold any particular security. |
| (2) | MLPs and Related Companies |
| | |
| 8 | | MainStay Cushing MLP Premier Fund |
Portfolio Management Discussion and Analysis (Unaudited)
Questions answered by portfolio managers Jerry V. Swank and Kevin P. Gallagher, CFA, of Cushing Asset Management, LP, the Fund’s Subadvisor.
How did MainStay Cushing MLP Premier Fund perform relative to its primary benchmark and peers during the six months ended May 31, 2016?
Excluding all sales charges, MainStay Cushing MLP Premier Fund returned –0.06% for Class A and Investor Class shares and –0.43% for Class C shares for the six months ended May 31, 2016. Over the same period, Class I shares returned 0.09%. For the six months ended May 31, 2016, all share classes underperformed the 1.93% return of the S&P 500® Index,1 which is the Fund’s broad-based securities-market index, and the 1.64% return of the Average Lipper2 Energy MLP Fund. See page 5 for Fund returns with applicable sales charges.
Were there any changes to the Fund during the reporting period?
Effective May 30, 2016, the Fund’s investment strategies were modified to allow the Fund to invest 80% of its net assets (net assets plus borrowings for investment purposes) in master limited partnerships (“MLPs”) and MLP-related investments, including businesses that operate and have the economic characteristics of MLP investments but are organized and taxed as “C” corporations or as limited liability companies. The Fund formerly invested 80% of its net assets (net assets plus borrowings for investment purposes) in MLPs.
What factors affected the Fund’s performance relative to the S&P 500® Index during the reporting period?
During the reporting period, the most significant factors that affected the Fund’s performance relative to the S&P 500® Index were the continued volatility in domestic and international crude oil prices and the subsequent volatility of stock prices among the energy companies held by the Fund. The S&P 500® Index includes stocks across many sectors, while the Fund’s exposure is limited to the energy sector. Declining crude oil prices had a negative impact upon the energy companies held by the Fund, which caused the Fund to underperform the S&P 500® Index during the reporting period.
The Fund’s holdings during the reporting period closely tracked the performance of other energy equities, including related oilfield services and exploration and production (“E&P”) businesses. One key driver of Fund performance is the price of crude oil. As measured by West Texas Intermediate (or “WTI”), oil prices declined 37% from $41.65 per barrel at the beginning of the reporting period to $26.21 per barrel on February 11, 2016, before rebounding significantly to $49.10 per barrel on May 31, 2016. Before the low price to date on February 11, 2016, the volatility of commodity prices (including crude oil, natural gas, natural gas liquids), driven by supply-and-demand
imbalances, weakened the operational/financial outlook of—and investor sentiment toward—the overall energy industry, including energy infrastructure MLPs. During the energy down-cycle, many MLPs experienced a slowing or a reduction of system throughput, a slowing of capital spending on organic growth projects, higher leverage, diminished access to and higher costs of debt and equity capital, and slowing distribution growth.
Which subsectors were the strongest contributors to the Fund’s absolute performance, and which subsectors were particularly weak?
The strongest positive contributors to the Fund’s absolute performance during the reporting period were the natural gas gatherers & processors, crude oil & refined products, and large-cap diversified subsectors. (Contributions take weightings and total returns into account.) The crude oil & refined products and large-cap diversified subsectors were the most heavily weighted subsectors in the Fund. The subsectors that detracted the most from the Fund’s performance were the general partners, shipping (including shipping general partners) and propane subsectors.
During the reporting period, which individual holdings made the strongest contributions to the Fund’s absolute performance and which holdings detracted the most?
The most substantial positive contributors to the Fund’s absolute performance during the reporting period were Targa Resources (a natural gas gatherer & processor), NuStar Energy, L.P. (a crude oil & refined products MLP) and ONEOK Partners, L.P. (a natural gas gatherer & processor MLP). Targa Resources and ONEOK Partners, L.P., benefited from the improvement in commodity prices. NuStar Energy, L.P., likely performed well given no expected near-term equity needs (modest capital expenditures), minimum volume commitment (“MVC”) protection and adequate cash flow coverage (greater than 1.0x), among other things. The most substantial detractor from the Fund’s absolute performance during the reporting period was Energy Transfer Equity, L.P. (an MLP general partner). This was followed by Teekay Corporation (a shipping company general partner) and The Williams Companies Inc. (an MLP general partner). Energy Transfer Equity and The Williams Companies both suffered from negative headlines and continued uncertainties related to the yet-to-be completed merger of the two entities. We sold the Fund’s position in The Williams Companies during the reporting period. We also sold the Fund’s position in Teekay Corporation following the unexpected announcement of a dividend cut.
| 1. | See footnote on page 6 for more information about the S&P 500® Index. |
| 2. | See footnote on page 6 for more information about Lipper Inc. |
Did the Fund make any significant purchases or sales during the reporting period?
Two of the Fund’s largest purchases during the reporting period were Enterprise Products Partners, L.P. (a large-cap diversified MLP) and Tesoro Logistics, L.P. (a crude oil & refined products MLP). We added to the Fund’s existing Enterprise Products Partners position because we believed that the MLP was well positioned to weather the lower-commodity-price environment during the reporting period. The MLP had a large diverse footprint of integrated assets, a relatively low cost of capital, a good backlog of contracted fee-based projects, a healthy balance sheet and sufficient cash flow coverage. We also added to the Fund’s existing position in Tesoro Logistics, L.P., because of the partnership’s attractive distribution yield and projected distribution growth driven by drop-down transactions from its supportive sponsor/parent, as well as an inventory of organic projects. Two of the Fund’s largest sales during the reporting period were Plains All American Pipeline, L.P. (a large-cap diversified MLP) and NuStar Energy, L.P. We reduced the Fund’s position in Plains All American because of uncertainty
about a potential restructuring and distribution reduction. We reduced the Fund’s position in NuStar to capture gains and normalize the position’s weighting.
How did the Fund’s subsector weightings change during the reporting period?
During the reporting period, the Fund increased exposure to the crude oil & refined products and natural gas gatherers & processors subsectors. Over the same period, the Fund decreased exposure to the general partners and shipping subsectors.
How was the Fund positioned at the end of the reporting period?
As of May 31, 2016, the Fund’s largest subsector position was in crude oil & refined products, followed by a substantial but smaller position in large-cap diversified. Together these positions represented approximately two-thirds of the Fund’s total exposure.
The opinions expressed are those of the portfolio managers as of the date of this report and are subject to change. There is no guarantee that any forecasts will come to pass. This material does not constitute investment advice and is not intended as an endorsement of any specific investment.
| | |
| 10 | | MainStay Cushing MLP Premier Fund |
Portfolio of Investments May 31, 2016 (Unaudited)
| | | | | | | | |
| | |
| | | Shares | | | Value | |
| | | | | | | |
| Common Stocks 7.1%† | |
Diversified General Partners 1.5% | |
United States 1.5% | | | | | | | | |
ONEOK, Inc. | | | 439,800 | | | $ | 19,021,350 | |
| | | | | | | | |
|
General Partners 5.6% | |
United States 5.6% | |
Crestwood Equity Partners, L.P. | | | 1,103,659 | | | | 23,816,961 | |
Kinder Morgan, Inc. | | | 1 | | | | 18 | |
Targa Resources Corporation | | | 1,050,975 | | | | 45,013,259 | |
| | | | | | | | |
| | | | | | | 68,830,238 | |
| | | | | | | | |
Total Common Stocks
(Cost $73,350,679) | | | | | | | 87,851,588 | |
| | | | | | | | |
|
| MLPs and Related Companies 87.0% | |
Crude Oil & Refined Products 31.2% | | | | | | | | |
United States 31.2% | | | | | | | | |
Blueknight Energy Partners, L.P. (a) | | | 2,161,200 | | | | 10,827,612 | |
¨Enbridge Energy Partners, L.P. | | | 3,672,800 | | | | 79,846,672 | |
¨Genesis Energy, L.P. | | | 1,340,061 | | | | 50,480,098 | |
MPLX, L.P. | | | 1,076,126 | | | | 34,328,419 | |
NuStar Energy, L.P. | | | 749,000 | | | | 36,828,330 | |
Rose Rock Midstream, L.P. | | | 263,957 | | | | 6,810,091 | |
¨Shell Midstream Partners, L.P. | | | 1,820,434 | | | | 61,439,647 | |
Sunoco Logistics Partners, L.P. | | | 1,773,400 | | | | 48,679,830 | |
¨Tesoro Logistics, L.P. | | | 1,133,600 | | | | 55,716,440 | |
| | | | | | | | |
| | | | | | | 384,957,139 | |
| | | | | | | | |
General Partners 2.2% | | | | | | | | |
United States 2.2% | | | | | | | | |
Energy Transfer Equity, L.P. | | | 1,412,200 | | | | 17,850,208 | |
Plains GP Holdings, L.P. | | | 955,000 | | | | 8,967,450 | |
| | | | | | | | |
| | | | | | | 26,817,658 | |
| | | | | | | | |
Large Cap Diversified 28.5% | | | | | | | | |
United States 28.5% | | | | | | | | |
¨Energy Transfer Partners, L.P. | | | 2,955,312 | | | | 107,159,613 | |
¨Enterprise Products Partners, L.P. | | | 2,954,750 | | | | 82,023,860 | |
Magellan Midstream Partners, L.P. | | | 456,615 | | | | 31,985,881 | |
ONEOK Partners, L.P. | | | 1,301,600 | | | | 49,395,720 | |
Plains All American Pipeline, L.P. | | | 690,905 | | | | 15,980,633 | |
¨Williams Partners, L.P. | | | 2,050,000 | | | | 65,436,000 | |
| | | | | | | | |
| | | | | | | 351,981,707 | |
| | | | | | | | |
Natural Gas Gatherers & Processors 10.5% | | | | | |
United States 10.5% | | | | | | | | |
DCP Midstream Partners, L.P. | | | 1,151,000 | | | | 38,593,030 | |
¨EnLink Midstream Partners, L.P. | | | 3,416,700 | | | | 53,778,858 | |
Western Gas Partners, L.P. | | | 738,600 | | | | 36,804,438 | |
| | | | | | | | |
| | | | | | | 129,176,326 | |
| | | | | | | | |
| | | | | | | | |
| | |
| | | Shares | | | Value | |
| | | | | | | |
Natural Gas Transportation & Storage 6.6% | | | | | |
United States 6.6% | | | | | | | | |
¨EQT Midstream Partners, L.P. | | | 795,000 | | | $ | 59,919,150 | |
Tallgrass Energy Partners, L.P. | | | 465,000 | | | | 21,045,900 | |
| | | | | | | | |
| | | | | | | 80,965,050 | |
| | | | | | | | |
Oil & Gas Storage & Transportation 1.4% | | | | | |
United States 1.4% | | | | | | | | |
Spectra Energy Partners L.P. | | | 375,000 | | | | 16,852,500 | |
| | | | | | | | |
| | |
Propane 6.0% | | | | | | | | |
United States 6.0% | | | | | | | | |
¨NGL Energy Partners, L.P. | | | 4,121,005 | | | | 61,897,495 | |
Suburban Propane Partners, L.P. | | | 360,000 | | | | 12,441,600 | |
| | | | | | | | |
| | | | | | | 74,339,095 | |
| | | | | | | | |
Shipping 0.6% | | | | | | | | |
Republic of the Marshall Islands 0.6% | | | | | |
Golar LNG Partners, L.P. | | | 458,363 | | | | 7,796,755 | |
| | | | | | | | |
Total MLPs and Related Companies (Cost $935,407,301) | | | | | | | 1,072,886,230 | |
| | | | | | | | |
|
| Preferred Stocks 1.0% | |
Crude Oil & Refined Products 1.0% | | | | | |
United States 1.0% | | | | | | | | |
Blueknight Energy Partners, L.P. (a) | | | 1,902,541 | | | | 12,994,355 | |
| | | | | | | | |
Total Preferred Stocks
(Cost $14,600,102) | | | | | | | 12,994,355 | |
| | | | | | | | |
|
| Short-Term Investments—Investment Companies 4.3% | |
United States 4.3% | | | | | | | | |
Fidelity Government Portfolio Fund—Institutional Class, 0.25% (b) | | | 10,530,132 | | | | 10,530,132 | |
Fidelity Money Market Portfolio—Institutional Class, 0.35% (b) | | | 10,530,132 | | | | 10,530,132 | |
First American Prime Obligations Fund—Class Z, 0.29% (b) | | | 10,530,132 | | | | 10,530,132 | |
Invesco Short-Term Treasury Portfolio Fund—Institutional Class, 0.21% (b) | | | 10,530,132 | | | | 10,530,132 | |
Invesco STIC Prime Portfolio, 0.32% (b) | | | 10,530,132 | | | | 10,530,132 | |
| | | | | | | | |
Total Short-Term Investments—Investment Companies
(Cost $52,650,660) | | | | | | | 52,650,660 | |
| | | | | | | | |
Total Investments
(Cost $1,076,008,742) (c) | | | 99.4 | % | | | 1,226,382,833 | |
Other Assets in Excess of Liabilities | | | 0.6 | | | | 7,343,507 | |
Net Assets | | | 100.0 | % | | $ | 1,233,726,340 | |
| † | Calculated as a percentage of net assets applicable to common shareholders. |
| ¨ | | Among the Portfolio’s 10 largest holdings or issuers held, as of May 31, 2016, excluding short-term investments. May be subject to change daily. |
| | | | | | |
The notes to the financial statements are an integral part of,
and should be read in conjunction with, the financial statements. | | | | | 11 | |
Portfolio of Investments May 31, 2016 (Unaudited) (continued)
| (a) | Illiquid security—As of May 31, 2016, the total market value of securities deemed illiquid under procedures approved by the Board of Trustees was $23,821,967, which represented 1.93% of the Fund’s net assets. |
| (b) | Rate reported is the current yield as of May 31, 2016. |
| (c) | As of May 31, 2016, cost was $1,027,297,910 for federal income tax purposes and net unrealized appreciation was as follows: |
| | | | |
Gross unrealized appreciation | | $ | 809,649,368 | |
Gross unrealized depreciation | | | (610,564,445 | ) |
| | | | |
Net unrealized appreciation | | $ | 199,084,923 | |
| | | | |
The following is a summary of the fair valuations according to the inputs used as of May 31, 2016, for valuing the Fund’s assets and liabilities.
Asset Valuation Inputs
| | | | | | | | | | | | | | | | |
Description | | Quoted
Prices in
Active
Markets for
Identical
Assets
(Level 1) | | | Significant
Other
Observable
Inputs
(Level 2) | | | Significant
Unobservable
Inputs
(Level 3) | | | Total | |
| Investments in Securities (a) | | | | | | | | | | | | | | | | |
Common Stocks | | $ | 87,851,588 | | | $ | — | | | $ | — | | | $ | 87,851,588 | |
MLPs and Related Companies | | | 1,072,886,230 | | | | — | | | | — | | | | 1,072,886,230 | |
Preferred Stocks | | | 12,994,355 | | | | — | | | | — | | | | 12,994,355 | |
Short-Term Investments | | | 52,650,660 | | | | — | | | | — | | | | 52,650,660 | |
| | | | | | | | | | | | | | | | |
| Total Investments in Securities | | $ | 1,226,382,833 | | | $ | — | | | $ | — | | | $ | 1,226,382,833 | |
| | | | | | | | | | | | | | | | |
| (a) | For a complete listing of investments and their industries, see the Portfolio of Investments. |
The Fund recognizes transfers between the levels as of the beginning of the period.
For the period ended May 31, 2016, the Fund did not have any transfers between Level 1 and Level 2 fair value measurements (See Note 2).
As of May 31, 2016, the Fund did not hold any investments with significant unobservable inputs (Level 3) (See Note 2).
| | | | |
| 12 | | Mainstay Cushing MLP Premier Fund | | The notes to the financial statements are an integral part of,
and should be read in conjunction with, the financial statements. |
Statement of Assets and Liabilities as of May 31, 2016 (Unaudited)
| | | | |
| Assets | |
Investments, at value
(identified cost $1,076,008,742) | | $ | 1,226,382,833 | |
Receivables: | | | | |
Investments sold | | | 66,950,780 | |
Fund shares sold | | | 4,346,809 | |
Dividends and interest | | | 8,614 | |
Prepaid expenses | | | 69,245 | |
| | | | |
Total assets | | | 1,297,758,281 | |
| | | | |
| |
| Liabilities | | | | |
Payables: | | | | |
Investments purchased | | | 59,227,941 | |
Fund shares redeemed | | | 2,307,680 | |
Advisory fees (See Note 3) | | | 1,127,748 | |
NYLIFE Distributors (See Note 3) | | | 477,104 | |
Transfer agent (See Note 3) | | | 344,695 | |
Professional fees | | | 86,682 | |
Shareholder communication | | | 56,286 | |
Custodian | | | 4,769 | |
Trustees | | | 2,919 | |
Other | | | 70 | |
Accrued expenses | | | 95,682 | |
Franchise taxes | | | 300,365 | |
| | | | |
Total liabilities | | | 64,031,941 | |
| | | | |
Net assets | | $ | 1,233,726,340 | |
| | | | |
| |
| Composition of Net Assets | | | | |
Shares of beneficial interest outstanding (par value of $.001 per share) unlimited number of shares authorized | | $ | 91,706 | |
Additional paid-in capital | | | 1,603,405,221 | |
| | | | |
| | | 1,603,496,927 | |
Accumulated net investment loss, net of income taxes | | | (75,914,749 | ) |
Accumulated net realized gain (loss) on investments, net of income taxes | | | (384,936,320 | ) |
Net unrealized appreciation (depreciation) on investments, net of income taxes | | | 91,080,482 | |
| | | | |
Net assets | | $ | 1,233,726,340 | |
| | | | |
| | | | |
Class A | | | | |
Net assets applicable to outstanding shares | | $ | 298,796,424 | |
| | | | |
Shares of beneficial interest outstanding | | | 21,848,683 | |
| | | | |
Net asset value per share outstanding | | $ | 13.68 | |
Maximum sales charge (5.50% of offering price) | | | 0.80 | |
| | | | |
Maximum offering price per share outstanding | | $ | 14.48 | |
| | | | |
Investor Class | | | | |
Net assets applicable to outstanding shares | | $ | 3,696,817 | |
| | | | |
Shares of beneficial interest outstanding | | | 270,363 | |
| | | | |
Net asset value per share outstanding | | $ | 13.67 | |
Maximum sales charge (5.50% of offering price) | | | 0.80 | |
| | | | |
Maximum offering price per share outstanding | | $ | 14.47 | |
| | | | |
Class C | | | | |
Net assets applicable to outstanding shares | | $ | 500,780,721 | |
| | | | |
Shares of beneficial interest outstanding | | | 38,638,247 | |
| | | | |
Net asset value per share outstanding | | $ | 12.96 | |
| | | | |
Class I | | | | |
Net assets applicable to outstanding shares | | $ | 430,452,378 | |
| | | | |
Shares of beneficial interest outstanding | | | 30,948,878 | |
| | | | |
Net asset value per share outstanding | | $ | 13.91 | |
| | | | |
| | | | | | |
The notes to the financial statements are an integral part of,
and should be read in conjunction with, the financial statements. | | | | | 13 | |
Statement of Operations for the six months ended May 31, 2016 (Unaudited)
| | | | |
| Investment Income (Loss) | |
Income | | | | |
Dividends and distributions
(Net of return of capital of $35,264,212) | | $ | 3,409,339 | |
Interest | | | 41,233 | |
| | | | |
Total income | | | 3,450,572 | |
| | | | |
Expenses | | | | |
Manager (See Note 3) | | | 5,782,405 | |
Distribution/Service—Class A (See Note 3) | | | 314,872 | |
Distribution/Service—Investor Class (See Note 3) | | | 3,343 | |
Distribution/Service—Class C (See Note 3) | | | 2,136,199 | |
Transfer agent (See Note 3) | | | 806,207 | |
Shareholder communication | | | 175,619 | |
Professional fees | | | 130,866 | |
Franchise tax | | | 129,612 | |
Registration | | | 73,249 | |
Trustees | | | 19,303 | |
Custodian | | | 8,381 | |
Miscellaneous | | | 19,914 | |
| | | | |
Net expenses | | | 9,599,970 | |
| | | | |
Net investment income (loss) | | | (6,149,398 | ) |
| | | | |
|
| Realized and Unrealized Gain (Loss) on Investments | |
Net realized gain (loss) on investments | | | (328,717,503 | ) |
Net change in unrealized appreciation (depreciation) | | | 317,675,638 | |
| | | | |
Net realized and unrealized gain (loss) on investments | | | (11,041,865 | ) |
| | | | |
Net increase (decrease) in net assets resulting from operations | | $ | (17,191,263 | ) |
| | | | |
| | | | |
| 14 | | MainStay Cushing MLP Premier Fund | | The notes to the financial statements are an integral part of,
and should be read in conjunction with, the financial statements. |
Statements of Changes in Net Assets
| | | | | | | | |
| | | Six months
ended
May 31,
2016
(Unaudited) | | | Year
ended
November 30,
2015 | |
| Increase (Decrease) in Net Assets | |
Operations: | | | | | | | | |
Net investment income (loss) | | $ | (6,149,398 | ) | | $ | (2,181,087 | ) |
Net realized gain (loss) on investments | | | (328,717,503 | ) | | | (80,243,577 | ) |
Net change in unrealized appreciation (depreciation) on investments | | | 317,675,638 | | | | (505,890,333 | ) |
| | | | |
Net increase (decrease) in net assets resulting from operations | | | (17,191,263 | ) | | | (588,314,997 | ) |
| | | | |
Dividends and distributions to shareholders: | | | | | | | | |
From return of capital: | | | | | | | | |
Class A | | | (14,105,383 | ) | | | (31,601,906 | ) |
Investor Class | | | (152,837 | ) | | | (172,126 | ) |
Class C | | | (25,007,742 | ) | | | (55,256,642 | ) |
Class I | | | (20,476,221 | ) | | | (38,732,047 | ) |
| | | | |
| | | (59,742,183 | ) | | | (125,762,721 | ) |
| | | | |
Total dividends and distributions to shareholders | | | (59,742,183 | ) | | | (125,762,721 | ) |
| | | | |
Capital share transactions: | | | | | | | | |
Net proceeds from sale of shares | | | 298,852,848 | | | | 753,559,128 | |
Net asset value of shares issued to shareholders in reinvestment of dividends and distributions | | | 56,412,380 | | | | 116,970,153 | |
Cost of shares redeemed | | | (368,786,407 | ) | | | (803,926,743 | ) |
| | | | |
Increase (decrease) in net assets derived from capital share transactions | | | (13,521,179 | ) | | | 66,602,538 | |
| | | | |
Net increase (decrease) in net assets | | | (90,454,625 | ) | | | (647,475,180 | ) |
|
| Net Assets | |
Beginning of period | | | 1,324,180,965 | | | | 1,971,656,145 | |
| | | | |
End of period | | $ | 1,233,726,340 | | | $ | 1,324,180,965 | |
| | | | |
Accumulated net investment loss, net of income taxes | | $ | (75,914,749 | ) | | $ | (69,765,351 | ) |
| | | | |
| | | | | | |
The notes to the financial statements are an integral part of,
and should be read in conjunction with, the financial statements. | | | | | 15 | |
Financial Highlights selected per share data and ratios
| | | | | | | | | | | | | | | | | | | | | | | | |
| | | Six months
ended
May 31, 2016 | | | Year ended November 30, | |
| Class A | | (Unaudited) | | | 2015 | | | 2014 | | | 2013*** | | | 2012*** | | | 2011*** | |
Net asset value at beginning of period | | $ | 14.47 | | | $ | 22.15 | | | $ | 21.36 | | | $ | 19.48 | | | $ | 19.92 | | | $ | 20.28 | |
| | | | | | | | | | | | | | | | | | | | | | | | |
Net investment income (loss) (a) | | | (0.06 | ) | | | 0.03 | | | | (0.09 | ) | | | (0.12 | ) | | | (0.13 | ) | | | (0.14 | ) |
Net realized and unrealized gain (loss) on investments | | | (0.06 | ) | | | (6.37 | ) | | | 2.21 | | | | 3.34 | | | | 1.02 | | | | 1.07 | |
| | | | | | | | | | | | | | | | | | | | | | | | |
Total from investment operations | | | (0.12 | ) | | | (6.34 | ) | | | 2.12 | | | | 3.22 | | | | 0.89 | | | | 0.93 | |
| | | | | | | | | | | | | | | | | | | | | | | | |
| Less dividends and distributions: | | | | | | | | | | | | | | | | | | | | | | | | |
From net investment income | | | — | | | | — | | | | (0.59 | ) | | | — | | | | — | | | | — | |
From return of capital | | | (0.67 | ) | | | (1.34 | ) | | | (0.75 | ) | | | (1.34 | ) | | | (1.34 | ) | | | (1.30 | ) |
| | | | | | | | | | | | | | | | | | | | | | | | |
Total dividends and distributions | | | (0.67 | ) | | | (1.34 | ) | | | (1.34 | ) | | | (1.34 | ) | | | (1.34 | ) | | | (1.30 | ) |
| | | | | | | | | | | | | | | | | | | | | | | | |
Redemption fees retained (a)(b) | | | — | | | | — | | | | 0.01 | | | | 0.00 | ‡ | | | 0.01 | | | | 0.01 | |
| | | | | | | | | | | | | | | | | | | | | | | | |
Net asset value at end of period | | $ | 13.68 | | | $ | 14.47 | | | $ | 22.15 | | | $ | 21.36 | | | $ | 19.48 | | | $ | 19.92 | |
| | | | | | | | | | | | | | | | | | | | | | | | |
Total investment return (c) | | | (0.06 | %)(d) | | | (29.92 | %) | | | 10.00 | % | | | 16.91 | % | | | 4.56 | % | | | 4.55 | % |
| Ratios (to average net assets)/Supplemental Data: | | | | | | | | | | | | | | | | | | | | | | | | |
Net investment income (loss) (including net deferred income tax benefit (expense)) (e) | | | (0.95 | %)(f)†† | | | 8.32 | % (f) | | | (6.46 | %) | | | (9.12 | %) | | | (2.95 | %) | | | (1.95 | %) |
Net investment income (loss) (excluding net deferred income tax benefit (expense)) (e) | | | (0.93 | %)(f)†† | | | (0.24 | %)(f) | | | (0.97 | %) | | | (1.18 | %) | | | (1.23 | %) | | | (1.29 | %) |
Net expenses (including net deferred income tax (benefit) expense) (e)(g) | | | 1.60 | % (f)†† | | | (7.07 | %)(f) | | | 7.08 | % | | | 9.59 | % | | | 3.37 | % | | | 2.32 | % |
Expenses (before waiver/recoupment, including net deferred income tax (benefit) expense) (e)(g) | | | 1.60 | % (f)†† | | | (7.07 | %)(f) | | | 7.03 | % | | | 9.57 | % | | | 3.43 | % | | | 3.29 | % |
Portfolio turnover rate | | | 38.30 | % | | | 32.35 | % | | | 20.70 | % | | | 27.29 | % | | | 43.32 | % | | | 72.32 | % |
Net assets at end of period (in 000’s) | | $ | 298,796 | | | $ | 317,903 | | | $ | 531,607 | | | $ | 487,318 | | | $ | 306,054 | | | $ | 81,865 | |
| *** | These years were audited by a predecessor audit firm whose opinion was unqualified. |
| ‡ | Less than one cent per share. |
| (a) | Per share data based on average shares outstanding during the period. |
| (b) | Redemption fees were only applicable prior to reorganization. (See Note 1) |
| (c) | Total investment return is calculated exclusive of sales charges and assumes the reinvestment of dividends and distributions. |
| (d) | Total investment return is not annualized. |
| (e) | For the year ended November 30, 2015, the Fund accrued $154,807,419 in net deferred income tax benefit, of which $39,834,200 is attributable to Class A. |
| | For the year ended November 30, 2014, the Fund accrued $70,224,241 in net deferred income tax expense, of which $30,305,000 is attributable to Class A. |
| | For the year ended November 30, 2013, the Fund accrued $77,002,011 in net deferred income tax expense, of which $31,765,943 is attributable to Class A. |
| | For the year ended November 30, 2012, the Fund accrued $7,120,938 in net deferred income tax expense, of which $3,616,649 is attributable to Class A. |
| | For the year ended November 30, 2011, the Fund accrued $452,365 in net deferred tax expense, of which $212,282 is attributable to Class A. |
| (f) | Ratios including/excluding net deferred income tax benefit (expense) includes applicable franchise tax expense for the period. |
| | For the period from December 1, 2015 to May 31, 2016, the Fund accrued $129,612 in franchise tax expense, of which $31,046 is attributable to Class A. |
| | For the year ended November 30, 2015, the Fund accrued $517,762 in franchise tax expense, of which $128,449 is attributable to Class A. |
| (g) | The ratio of expenses excluding net deferred income tax expense to average net assets before waiver and recoupment was 1.58%, 1.49%, 1.54%, 1.63%, 1.71% and 2.62% for the period from December 1, 2015 to May 31, 2016 and fiscal years ended November 30, 2015, 2014, 2013, 2012 and 2011, respectively. The ratio of expenses excluding net deferred income tax expense to average net assets after waiver and recoupment was 1.58%, 1.49%, 1.59%, 1.65%, 1.65%, and 1.65% for the period from December 1, 2015 to May 31, 2016 and fiscal years ended November 30, 2015, 2014, 2013, 2012 and 2011, respectively. |
| | | | |
| 16 | | MainStay Cushing MLP Premier Fund | | The notes to the financial statements are an integral part of,
and should be read in conjunction with, the financial statements. |
Financial Highlights selected per share data and ratios
| | | | | | | | | | | | |
| Investor Class | | Six months
ended
May 31, 2016
(Unaudited) | | | Year ended
November 30,
2015 | | | July 12, 2014**
through
November 30,
2014 | |
Net asset value at beginning of period | | $ | 14.47 | | | $ | 22.15 | | | $ | 24.02 | |
| | | | | | | | | | | | |
Net investment income (loss) (a) | | | (0.06 | ) | | | (0.00 | )‡ | | | (0.03 | ) |
Net realized and unrealized gain (loss) on investments | | | (0.07 | ) | | | (6.34 | ) | | | (1.17 | ) |
| | | | | | | | | | | | |
Total from investment operations | | | (0.13 | ) | | | (6.34 | ) | | | (1.20 | ) |
| | | | | | | | | | | | |
| Less dividends and distributions: | | | | | | | | | | | | |
From net investment income | | | — | | | | — | | | | (0.29 | ) |
From return of capital | | | (0.67 | ) | | | (1.34 | ) | | | (0.38 | ) |
| | | | | | | | | | | | |
Total dividends and distributions | | | (0.67 | ) | | | (1.34 | ) | | | (0.67 | ) |
| | | | | | | | | | | | |
Net asset value at end of period | | $ | 13.67 | | | $ | 14.47 | | | $ | 22.15 | |
| | | | | | | | | | | | |
Total investment return (b) | | | (0.06 | %)(c) | | | (29.91 | %)(d) | | | (5.12 | %)(c)(d) |
| Ratios (to average net assets)/Supplemental Data: | | | | | | | | | | | | |
Net investment income (loss) (including net deferred income tax benefit (expense)) (e) | | | (0.97 | %)(f)†† | | | 8.17 | % (f) | | | 2.79 | % †† |
Net investment income (loss) (excluding net deferred income tax benefit (expense)) (e) | | | (0.94 | %)(f)†† | | | (0.38 | %)(f) | | | (0.52 | %)†† |
Net expenses (including net deferred income tax (benefit) expense) (e)(g) | | | 1.62 | % (f)†† | | | (7.05 | %)(f) | | | (1.80 | %)†† |
Expenses (before waiver/recoupment, including net deferred income tax (benefit) expense) (e)(g) | | | 1.62 | % (f)†† | | | (7.05 | %)(f) | | | (1.80 | %)†† |
Portfolio turnover rate | | | 38.30 | % | | | 32.35 | % | | | 20.70 | % |
Net assets at end of period (in 000’s) | | $ | 3,697 | | | $ | 2,631 | | | $ | 1,310 | |
| ‡ | Less than one cent per share. |
| (a) | Per share data based on average shares outstanding during the period. |
| (b) | Total investment return is calculated exclusive of sales charges and assumes the reinvestment of dividends and distributions. |
| (c) | Total investment return is not annualized. |
| (d) | Total investment return may reflect adjustments to conform to generally accepted accounting principles. |
| (e) | For the year ended November 30, 2015, the Fund accrued $154,807,419 in net deferred income tax benefit, of which $202,049 is attributable to Investor Class. |
| | For the period from July 12, 2014 to November 30, 2014, the Fund accrued $70,224,241 in net deferred income tax expense, of which $17,830 of deferred income tax benefit is attributable to Investor Class. |
| (f) | Ratios including/excluding net deferred income tax benefit (expense) includes applicable franchise tax expense for the period. |
| | For the period from December 1, 2015 to May 31, 2016, the Fund accrued $129,612 in franchise tax expense, of which $328 is attributable to Investor Class. |
| | For the year ended November 30, 2015, the Fund accrued $517,762 in franchise tax expense, of which $830 is attributable to Investor Class. |
| (g) | The ratio of expenses excluding net deferred income tax expense to average net assets before waiver and recoupment was 1.59%, 1.50% and 1.51%, for the period from December 1, 2015 to May 31, 2016, year ended November 30, 2015, and the period from July 12, 2014 to November 30, 2014, respectively. The ratio of expenses excluding net deferred income tax expense to average net assets after waiver and recoupment was 1.59%, 1.50% and 1.51% for the period from December 1, 2015 to May 31, 2016, year ended November 30, 2015, and the period from July 12, 2014 to November 30, 2014, respectively. |
| | | | | | |
The notes to the financial statements are an integral part of,
and should be read in conjunction with, the financial statements. | | | | | 17 | |
Financial Highlights selected per share data and ratios
| | | | | | | | | | | | | | | | | | | | | | | | |
| | | Six months
ended
May 31, 2016 | | | Year ended November 30, | |
| Class C | | (Unaudited) | | | 2015 | | | 2014 | | | 2013*** | | | 2012*** | | | 2011*** | |
Net asset value at beginning of period | | $ | 13.81 | | | $ | 21.36 | | | $ | 20.79 | | | $ | 19.14 | | | $ | 19.73 | | | $ | 20.26 | |
| | | | | | | | | | | | | | | | | | | | | | | | |
Net investment income (loss) (a) | | | (0.10 | ) | | | (0.12 | ) | | | (0.25 | ) | | | (0.27 | ) | | | (0.27 | ) | | | (0.29 | ) |
Net realized and unrealized gain (loss) on investments | | | (0.08 | ) | | | (6.09 | ) | | | 2.16 | | | �� | 3.26 | | | | 1.02 | | | | 1.06 | |
| | | | | | | | | | | | | | | | | | | | | | | | |
Total from investment operations | | | (0.18 | ) | | | (6.21 | ) | | | 1.91 | | | | 2.99 | | | | 0.75 | | | | 0.77 | |
| | | | | | | | | | | | | | | | | | | | | | | | |
| Less dividends and distributions: | | | | | | | | | | | | | | | | | | | | | | | | |
From net investment income | | | — | | | | — | | | | (0.59 | ) | | | — | | | | — | | | | — | |
From return of capital | | | (0.67 | ) | | | (1.34 | ) | | | (0.75 | ) | | | (1.34 | ) | | | (1.34 | ) | | | (1.30 | ) |
| | | | | | | | | | | | | | | | | | | | | | | | |
Total dividends and distributions | | | (0.67 | ) | | | (1.34 | ) | | | (1.34 | ) | | | (1.34 | ) | | | (1.34 | ) | | | (1.30 | ) |
| | | | | | | | | | | | | | | | | | | | | | | | |
Redemption fees retained (a)(b) | | | — | | | | — | | | | 0.00 | ‡ | | | 0.00 | ‡ | | | 0.00 | ‡ | | | 0.00 | ‡ |
| | | | | | | | | | | | | | | | | | | | | | | | |
Net asset value at end of period | | $ | 12.96 | | | $ | 13.81 | | | $ | 21.36 | | | $ | 20.79 | | | $ | 19.14 | | | $ | 19.73 | |
| | | | | | | | | | | | | | | | | | | | | | | | |
Total investment return (c) | | | (0.43 | %)(d) | | | (30.43 | %) | | | 9.19 | % | | | 16.05 | % | | | 3.82 | % | | | 3.69 | % |
| Ratios (to average net assets)/Supplemental Data: | | | | | | | | | | | | | | | | | | | | | | | | |
Net investment income (loss) (including net deferred income tax benefit (expense)) (e) | | | (1.72 | %)(f)†† | | | 7.56 | % (f) | | | (5.80 | %) | | | (9.87 | %) | | | (3.70 | %) | | | (2.70 | %) |
Net investment income (loss) (excluding net deferred income tax benefit (expense)) (e) | | | (1.69 | %)(f)†† | | | (1.00 | %)(f) | | | (1.68 | %) | | | (1.93 | %) | | | (1.98 | %) | | | (2.04 | %) |
Net expenses (including net deferred income tax (benefit) expense) (e)(g) | | | 2.37 | % (f)†† | | | (6.32 | %)(f) | | | 6.46 | % | | | 10.34 | % | | | 4.12 | % | | | 3.07 | % |
Expenses (before waiver/recoupment, including net deferred income tax (benefit) expense) (e)(g) | | | 2.37 | % (f)†† | | | (6.32 | %)(f) | | | 6.41 | % | | | 10.32 | % | | | 4.18 | % | | | 4.04 | % |
Portfolio turnover rate | | | 38.30 | % | | | 32.35 | % | | | 20.70 | % | | | 27.29 | % | | | 43.32 | % | | | 72.32 | % |
Net assets at end of period (in 000’s) | | $ | 500,781 | | | $ | 553,892 | | | $ | 859,193 | | | $ | 568,837 | | | $ | 252,473 | | | $ | 50,321 | |
| *** | These years were audited by a predecessor audit firm whose opinion was unqualified. |
| ‡ | Less than one cent per share. |
| (a) | Per share data based on average shares outstanding during the period. |
| (b) | Redemption fees were only applicable prior to reorganization. (See Note 1) |
| (c) | Total investment return is calculated exclusive of sales charges and assumes the reinvestment of dividends and distributions. |
| (d) | Total investment return is not annualized. |
| (e) | For the year ended November 30, 2015, the Fund accrued $154,807,419 in net deferred income tax benefit, of which $66,219,265 is attributable to Class C. |
| | For the year ended November 30, 2014, the Fund accrued $70,224,241 in net deferred income tax expense, of which $31,069,447 is attributable to Class C. |
| | For the year ended November 30, 2013, the Fund accrued $77,002,011 in net deferred income tax expense, of which $33,095,235 is attributable to Class C. |
| | For the year ended November 30, 2012, the Fund accrued $7,120,938 in net deferred income tax expense, of which $147,543 is attributable to Class C. |
| | For the year ended November 30, 2011, the Fund accrued $452,365 in net deferred income tax expense, of which $147,543 is attributable to Class C. |
| (f) | Ratios including/excluding net deferred income tax benefit (expense) includes applicable franchise tax expense for the period. |
| | For the period from December 1, 2015 to May 31, 2016, the Fund accrued $129,612 in franchise tax expense, of which $52,624 is attributable to Class C. |
| | For the year ended November 30, 2015, the Fund accrued $517,762 in franchise tax expense, of which $220,745 is attributable to Class C. |
| (g) | The ratio of expenses excluding net deferred income tax expense to average net assets before waiver and recoupment was 2.34%, 2.24% 2.29%, 2.38%, 2.46% and 3.37% for the period from December 1, 2015 to May 31, 2016 and the fiscal years ended November 30, 2015, 2014, 2013, 2012 and 2011, respectively. The ratio of expenses excluding net deferred income tax expense to average net assets after waiver and recoupment was 2.34%, 2.24%, 2.34%, 2.40%, 2.40% and 2.40% for the period from December 1, 2015 to May 31, 2016 and the fiscal years ended November 30, 2015, 2014, 2013, 2012 and 2011, respectively. |
| | | | |
| 18 | | MainStay Cushing MLP Premier Fund | | The notes to the financial statements are an integral part of,
and should be read in conjunction with, the financial statements. |
Financial Highlights selected per share data and ratios
| | | | | | | | | | | | | | | | | | | | | | | | |
| | | Six months
ended
May 31, 2016 | | | Year ended November 30, | |
| Class I | | (Unaudited) | | | 2015 | | | 2014 | | | 2013*** | | | 2012*** | | | 2011*** | |
Net asset value at beginning of period | | $ | 14.69 | | | $ | 22.40 | | | $ | 21.54 | | | $ | 19.57 | | | $ | 19.96 | | | $ | 20.28 | |
| | | | | | | | | | | | | | | | | | | | | | | | |
Net investment income (loss) (a) | | | (0.04 | ) | | | 0.07 | | | | (0.03 | ) | | | (0.07 | ) | | | (0.08 | ) | | | (0.09 | ) |
Net realized and unrealized gain (loss) on investments | | | (0.07 | ) | | | (6.44 | ) | | | 2.22 | | | | 3.36 | | | | 1.02 | | | | 1.07 | |
| | | | | | | | | | | | | | | | | | | | | | | | |
Total from investment operations | | | (0.11 | ) | | | (6.37 | ) | | | 2.19 | | | | 3.29 | | | | 0.94 | | | | 0.98 | |
| | | | | | | | | | | | | | | | | | | | | | | | |
| Less dividends and distributions: | | | | | | | | | | | | | | | | | | | | | | | | |
From net investment income | | | — | | | | — | | | | (0.59 | ) | | | — | | | | — | | | | — | |
From return of capital | | | (0.67 | ) | | | (1.34 | ) | | | (0.75 | ) | | | (1.34 | ) | | | (1.34 | ) | | | (1.30 | ) |
| | | | | | | | | | | | | | | | | | | | | | | | |
Total dividends and distributions | | | (0.67 | ) | | | (1.34 | ) | | | (1.34 | ) | | | (1.34 | ) | | | (1.34 | ) | | | (1.30 | ) |
| | | | | | | | | | | | | | | | | | | | | | | | |
Redemption fees retained (a)(b) | | | — | | | | — | | | | 0.01 | | | | 0.02 | | | | 0.01 | | | | 0.00 | ‡ |
| | | | | | | | | | | | | | | | | | | | | | | | |
Net asset value at end of period | | $ | 13.91 | | | $ | 14.69 | | | $ | 22.40 | | | $ | 21.54 | | | $ | 19.57 | | | $ | 19.96 | |
| | | | | | | | | | | | | | | | | | | | | | | | |
Total investment return (c) | | | 0.09 | % (d) | | | (29.71 | %) | | | 10.25 | % | | | 17.37 | % | | | 4.81 | % | | | 4.75 | % |
| Ratios (to average net assets)/Supplemental Data: | | | | | | | | | | | | | | | | | | | | | | | | |
Net investment income (loss) (including net deferred income tax benefit (expense)) (e) | | | (0.69 | %)(f)†† | | | 8.53 | % (f) | | | (2.90 | %) | | | (8.87 | %) | | | (2.70 | %) | | | (1.70 | %) |
Net investment income (loss) (excluding net deferred income tax benefit (expense)) (e) | | | (0.67 | %)(f)†† | | | (0.02 | %)(f) | | | (0.62 | %) | | | (0.93 | %) | | | (0.98 | %) | | | (1.04 | %) |
Net expenses (including net deferred income tax (benefit) expense) (e)(g) | | | 1.35 | % (f)†† | | | (7.31 | %)(f) | | | 3.61 | % | | | 9.34 | % | | | 3.12 | % | | | 2.07 | % |
Expenses (before waiver/recoupment, including net deferred income tax (benefit) expense) (e)(g) | | | 1.35 | % (f)†† | | | (7.31 | %)(f) | | | 3.57 | % | | | 9.32 | % | | | 3.18 | % | | | 3.04 | % |
Portfolio turnover rate | | | 38.30 | % | | | 32.35 | % | | | 20.70 | % | | | 27.29 | % | | | 43.32 | % | | | 72.32 | % |
Net assets at end of period (in 000’s) | | $ | 430,452 | | | $ | 449,755 | | | $ | 579,546 | | | $ | 221,196 | | | $ | 92,104 | | | $ | 27,847 | |
| *** | These years were audited by a predecessor audit firm whose opinion was unqualified. |
| ‡ | Less than one cent per share. |
| (a) | Per share data based on average shares outstanding during the period. |
| (b) | Redemption fees were only applicable prior to reorganization. (See Note 1) |
| (c) | Total investment return is calculated exclusive of sales charges and assumes the reinvestment of dividends and distributions. Class I shares are not subject to sales charges. |
| (d) | Total investment return is not annualized. |
| (e) | For the year ended November 30, 2015, the Fund accrued $154,807,419 in net deferred income tax benefit, of which $48,551,905 is attributable to Class I. |
| | For the year ended November 30, 2014, the Fund accrued $70,224,241 in net deferred income tax expense, of which $8,867,624 is attributable to Class I. |
| | For the year ended November 30, 2013, the Fund accrued $77,002,011 in net deferred income tax expense, of which $12,140,833 is attributable to Class I. |
| | For the year ended November 30, 2012, the Fund accrued $7,120,938 in net deferred income tax expense, of which $1,072,968 is attributable to Class I. |
| | For the year ended November 30, 2011, the Fund accrued $452,365 in net deferred income tax expense, of which $92,540 is attributable to Class I. |
| (f) | Ratios including/excluding net deferred income tax benefit (expense) includes applicable franchise tax expense for the period. |
| | For the period from December 1, 2015 to May 31, 2016, the Fund accrued $129,612 in franchise tax expense, of which $45,614 is attributable to Class I. |
| | For the year ended November 30, 2015, the Fund accrued $517,762 in franchise tax expense, of which $167,738 is attributable to Class I. |
| (g) | The ratio of expenses excluding net deferred income tax expense to average net assets before waiver and recoupment was 1.33%, 1.24%, 1.29%, 1.38%, 1.46% and 2.37% for the period from December 1, 2015 to May 31, 2016 and the fiscal years ended November 30, 2015, 2014, 2013, 2012 and 2011, respectively. The ratio of expenses excluding net deferred income tax expense to average net assets after waiver and recoupment was 1.33%, 1.24%, 1.33%, 1.40%, 1.40% and 1.40% for the period from December 1, 2015 to May 31, 2016 and the fiscal years ended November 30, 2015, 2014, 2013, 2012 and 2011, respectively. |
| | | | | | |
The notes to the financial statements are an integral part of,
and should be read in conjunction with, the financial statements. | | | | | 19 | |
MainStay Cushing Renaissance Advantage Fund
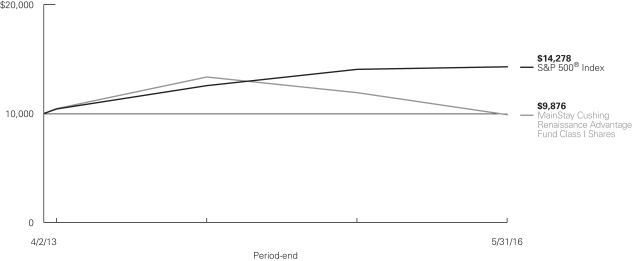
Investment and Performance Comparison1 (Unaudited)
Performance data quoted represents past performance. Past performance is no guarantee of future results. Because of market volatility, current performance may be lower or higher than the figures shown. Investment return and principal value will fluctuate, and as a result, when shares are redeemed, they may be worth more or less than their original cost. The graph below depicts the historical performance of Class I shares of the Fund. Performance will vary from class to class based on differences in class-specific expenses and sales charges. For performance information current to the most recent month-end, please call 800-MAINSTAY (624-6782) or visit mainstayinvestments.com.
Average Annual Total Returns for the Period Ended May 31, 2016
| | | | | | | | | | | | | | | | | | | | |
| Class | | Sales Charge | | | | Six Months | | | One Year | | | Since
Inception
(4/2/13) | | | Gross Expense Ratio2 | |
| Class A Shares3 | | Maximum 5.5% Initial Sales Charge | | With sales charge Excluding sales charge | |
| –8.12
–2.77 | %
| |
| –21.81
–17.26 | %
| |
| –2.47
–0.63 | %
| |
| 1.74
1.74 | %
|
| Investor Class Shares4 | | Maximum 5.5% Initial Sales Charge | | With sales charge Excluding sales charge | |
| –8.17
–2.82 |
| |
| –21.90
–17.35 |
| |
| –2.50
–0.66 |
| |
| 1.88
1.88 |
|
| Class C Shares3 | | Maximum 1% CDSC if Redeemed Within One Year of Purchase | | With sales charge Excluding sales charge | |
| –4.16
–3.21 |
| |
| –18.79
–17.99 |
| |
| –1.38
–1.38 |
| |
| 2.60
2.60 |
|
| Class I Shares3 | | No Sales Charge | | | | | –2.59 | | | | –16.97 | | | | –0.39 | | | | 1.46 | |
| 1. | The performance table and graph do not reflect the deduction of taxes that a shareholder would pay on distributions or Fund share redemptions. Total returns reflect maximum applicable sales charges as indicated in the table above, changes in share price, and reinvestment of dividend and capital gain distributions. The graph assumes the initial investment amount shown above and reflects the deduction of all sales charges that would have applied for the period of investment. Performance figures reflect certain fee waivers and/or expense limitations, without which total returns may have been lower. For more information on share classes and current fee waivers and/or expense limitations, please refer to the notes to the financial statements. |
| 2. | The gross expense ratios presented reflect the Fund’s “Total Annual Fund Operating Expenses” from the most recent Prospectus and may differ from other expense ratios disclosed in this report. |
| 3. | Performance figures for Class A shares, Class C shares and Class I shares reflect the historical performance of the then-existing Class A shares, Class C shares and Class I shares, respectively, of the Cushing® Renaissance Advantage Fund (the predecessor to the Fund, which was subject to a different fee structure) for periods prior to July 11, 2014. The Cushing® Renaissance Advantage Fund commenced operations on April 2, 2013. |
| 4. | Performance figures for Investor Class shares, first offered on July 11, 2014, include the historical performance of Class A shares through July 10, 2014, adjusted for differences in certain expenses and fees. Unadjusted, the performance for Investor Class shares would likely have been different. |
The footnotes on the next page are an integral part of the table and graph and should be carefully read in conjunction with them.
| | |
| 20 | | MainStay Cushing Renaissance Advantage Fund |
| | | | | | | | | | | | |
| Benchmark Performance | | Six Months | | | One
Year | | | Since
Inception | |
S&P 500® Index5 | | | 1.93 | % | | | 1.72 | % | | | 11.92 | % |
Average Lipper Natural Resources Fund6 | | | –1.02 | | | | –18.47 | | | | –5.61 | |
| 5. | “S&P 500®” is a trademark of The McGraw-Hill Companies, Inc. The S&P 500® Index is widely regarded as the standard index for measuring large-cap U.S. stock market performance. The S&P 500® Index is the Fund’s primary benchmark. Results assume reinvestment of all dividends and capital gains. An investment cannot be made directly in an index. |
| 6. | The average Lipper Natural Resources Fund is representative of funds that invest primarily in the equity securities of domestic companies engaged in |
| | the exploration, development, production, or distribution of natural resources (including oil, natural gas, and base minerals) and/or alternative energy sources (including solar, wind, hydro, tidal, and geothermal). This benchmark is a product of Lipper Inc. Lipper Inc. is an independent monitor of fund performance. Results are based on total returns with all dividend and capital gain distributions reinvested. |
The footnotes on the preceding page are an integral part of the table and graph and should be carefully read in conjunction with them.
Cost in Dollars of a $1,000 Investment in MainStay Cushing Renaissance Advantage Fund (Unaudited)
The example below is intended to describe the fees and expenses borne by shareholders during the six-month period from December 1, 2015, to May 31, 2016, and the impact of those costs on your investment.
Example
As a shareholder of the Fund, you incur two types of costs: (1) transaction costs, including exchange fees and sales charges (loads) on purchases (as applicable), and (2) ongoing costs, including management fees, distribution and/or service (12b-1) fees, and other Fund expenses (as applicable). This example is intended to help you understand your ongoing costs (in dollars) of investing in the Fund and to compare these costs with the ongoing costs of investing in other mutual funds. The example is based on an investment of $1,000 made at the beginning of the six-month period and held for the entire period from December 1, 2015, to May 31, 2016.
This example illustrates your Fund’s ongoing costs in two ways:
Actual Expenses
The second and third data columns in the table below provide information about actual account values and actual expenses. You may use the information in these columns, together with the amount you invested, to estimate the expenses that you paid during the six months ended May 31, 2016. Simply divide your account value by $1,000 (for example, an $8,600 account value divided by $1,000 = 8.6), then
multiply the result by the number under the heading entitled “Expenses Paid During Period” to estimate the expenses you paid on your account during this period.
Hypothetical Example for Comparison Purposes
The fourth and fifth data columns in the table below provide information about hypothetical account values and hypothetical expenses based on the Fund’s actual expense ratio and an assumed rate of return of 5% per year before expenses, which is not the Fund’s actual return. The hypothetical account values and expenses may not be used to estimate the actual ending account balances or expenses you paid for the six-month period shown. You may use this information to compare the ongoing costs of investing in the Fund with the ongoing costs of investing in other Funds. To do so, compare this 5% hypothetical example with the 5% hypothetical examples that appear in the shareholder reports of the other Funds.
Please note that the expenses shown in the table are meant to highlight your ongoing costs only and do not reflect any transactional costs, such as exchange fees or sales charges (loads). Therefore, the fourth and fifth data columns of the table are useful in comparing ongoing costs only and will not help you determine the relative total costs of owning different funds. In addition, if these transactional costs were included, your costs would have been higher.
| | | | | | | | | | | | | | | | | | | | |
| | | | | | | | | | | | | | | | |
| Share Class | | Beginning
Account Value
12/1/15 | | | Ending Account Value (Based
on Actual
Returns and
Expenses)
5/31/16 | | | Expenses
Paid During
Period1 | | | Ending Account
Value (Based
on Hypothetical
5% Annualized
Return and
Actual Expenses)
5/31/16 | | | Expenses
Paid During
Period1 | |
| | | | | |
| Class A Shares | | $ | 1,000.00 | | | $ | 972.30 | | | $ | 8.38 | | | $ | 1,016.50 | | | $ | 8.57 | |
| | | | | |
| Investor Class Shares | | $ | 1,000.00 | | | $ | 971.80 | | | $ | 9.17 | | | $ | 1,015.70 | | | $ | 9.37 | |
| | | | | |
| Class C Shares | | $ | 1,000.00 | | | $ | 967.90 | | | $ | 12.89 | | | $ | 1,011.90 | | | $ | 13.18 | |
| | | | | |
| Class I Shares | | $ | 1,000.00 | | | $ | 974.10 | | | $ | 7.16 | | | $ | 1,017.75 | | | $ | 7.31 | |
| 1. | Expenses are equal to the Fund’s annualized expense ratio of each class (1.70% for Class A, 1.86% for Investor Class, 2.62% for Class C and 1.45% for Class I) multiplied by the average account value over the period, divided by 366 and multiplied by 183 for Class A, Investor Class, Class C, and Class I (to reflect the six-month period). The table above represents the actual expenses incurred during the six-month period. |
| | |
| 22 | | MainStay Cushing Renaissance Advantage Fund |
Portfolio Composition as of May 31, 2016(1) (Unaudited)
(Expressed as a Percentage of Total Investments)
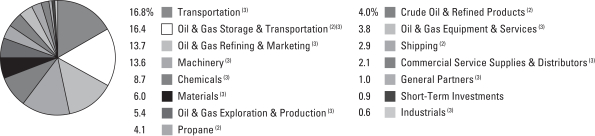
See Portfolio of Investments beginning on page 25 for specific holdings within these categories.
Top Ten Holdings as of May 31, 2016 (excluding short-term investments)
| 3. | Sunoco Logistics Partners, L.P. |
| 4. | Norfolk Southern Corporation |
| 5. | NGL Energy Partners, L.P. |
| 6. | Marathon Petroleum Corporation |
| 7. | Axalta Coating Systems Ltd. |
| (1) | Fund holdings and sector allocations are subject to change, and there is no assurance that the Fund will continue to hold any particular security. |
| (2) | MLPs and Related Companies |
Portfolio Management Discussion and Analysis (Unaudited)
Questions answered by portfolio managers Jerry V. Swank, Matthew A. Lemme, CFA, and Saket Kumar of Cushing Asset Management, LP, the Fund’s Subadvisor.
How did MainStay Cushing Renaissance Advantage Fund perform relative to its primary benchmark and peers during the six months ended May 31, 2016?
Excluding all sales charges, MainStay Cushing Renaissance Advantage Fund returned –2.77% for Class A shares, –2.82% for Investor Class shares and –3.21% for Class C shares for the six months ended May 31, 2016. Over the same period, Class I shares returned –2.59%. For the six months ended May 31, 2016, all share classes underperformed the 1.93% return of the S&P 500® Index,1 which is the Fund’s broad-based securities-market index, and the –1.02% return of the Average Lipper2 Natural Resources Fund. See page 20 for Fund returns with applicable sales charges.
What factors affected the Fund’s performance relative to the S&P 500® Index during the reporting period?
The Fund underperformed relative to the S&P 500® Index during the reporting period because the Index was widely diversified across sectors while the Fund was primarily weighted in the energy sector. During the reporting period, energy stocks in general underperformed the S&P 500® Index.
Which subsectors were the strongest contributors to the Fund’s relative performance, and which subsectors were particularly weak?
The subsectors that made the strongest contributions to the Fund’s performance relative to the S&P 500® Index during the reporting period were midstream, exploration & production and utilities. (Contributions take weightings and total returns into account.) Over the same period, the most substantial detractors were refiners, transportation and chemicals.
During the reporting period, which individual holdings made the strongest contributions to the Fund’s absolute performance and which holdings detracted the most?
The securities that made the strongest contributions to the Fund’s absolute performance were exploration & production companies Energen and Hess and midstream master limited partnership (“MLP”) Enterprise Product Partners, L.P. Each of these companies rallied when crude oil prices improved. The Fund purchased these companies after the crude oil market downturn and benefitted from the eventual bounce back in prices during the reporting period.
The largest detractors from the Fund’s absolute performance were refiner Marathon Petroleum Corporation, chemical company Westlake Chemical and shipping company Capital Product Partners L.P. Each of these companies had specific issues that led to negative performance. Marathon’s affiliate, MPLX L.P., cut its guidance for growth, which meant less cash flow to parent Marathon; Westlake announced a proposed acquisition of chemicals company Axiall, which hurt Westlake’s performance; and Capital Product Partners decided on a distribution cut, which stemmed from financing and customer-liquidity issues.
Did the Fund make any significant purchases or sales during the reporting period?
The Fund’s largest additions during the reporting period were new positions in railroad Norfolk Southern and midstream MLP NGL Energy Partners, L.P. The Fund purchased Norfolk Southern because of the company’s renewed focus on margins and exposure to end markets such as automobiles. The Fund added NGL Energy Partners seeking to benefit from improved operations after the company’s announced partnership with Oaktree Capital Management.
The largest sales during the reporting period came when the Fund exited positions in utilities Sempra Energy and Dominion Resources on concerns that performance would be negatively affected if interest rates rose.
How did the Fund’s subsector weightings change during the reporting period?
The largest subsector increases were in midstream and industrial companies. These purchases were very company specific, as we identified organizations that we believed were oversold during the early 2016 market sell-off. The Fund sold chemical and utility companies that had been relative outperformers during the aforementioned market sell-off.
How was the Fund positioned at the end of the reporting period?
At the end of the reporting period, the Fund held positions in companies that are less sensitive to crude oil prices. As of May 31, 2016, transportation, midstream, and industrial companies accounted for the majority of the Fund’s exposure.
| 1. | See footnote on page 21 for more information on the S&P 500® Index. |
| 2. | See footnote on page 21 for more information on Lipper Inc. |
The opinions expressed are those of the portfolio managers as of the date of this report and are subject to change. There is no guarantee that any forecasts will come to pass. This material does not constitute investment advice and is not intended as an endorsement of any specific investment.
| | |
| 24 | | MainStay Cushing Renaissance Advantage Fund |
Portfolio of Investments May 31, 2016 (Unaudited)
| | | | | | | | |
| | |
| | | Shares | | | Value | |
| | | | | | | | |
| Common Stocks 76.8%† | |
Chemicals 8.4% | |
Bermuda 3.5% | |
¨Axalta Coating Systems Ltd. (a) | | | 223,853 | | | $ | 6,301,462 | |
Netherlands 1.4% | |
LyondellBasell Industries NV | | | 31,406 | | | | 2,555,192 | |
United States 3.5% | |
PPG Industries, Inc. | | | 15,877 | | | | 1,709,636 | |
Westlake Chemical Corporation | | | 105,671 | | | | 4,663,261 | |
| | | | | | | | |
| | | | | | | 15,229,551 | |
| | | | | | | | |
Commercial Service Supplies & Distributors 2.1% | |
United States 2.1% | |
MRC Global Inc. (a) | | | 262,186 | | | | 3,720,419 | |
| | | | | | | | |
|
General Partners 1.0% | |
United States 1.0% | |
Targa Resources Corporation | | | 41,461 | | | | 1,775,775 | |
| | | | | | | | |
|
Industrials 0.6% | |
United States 0.6% | |
Team, Inc. (a) | | | 34,481 | | | | 1,045,464 | |
| | | | | | | | |
|
Machinery 13.2% | |
Ireland 2.5% | |
Pentair Plc | | | 74,242 | | | | 4,472,338 | |
United States 10.7% | |
Allison Transmission, Inc. | | | 72,316 | | | | 2,031,356 | |
Flowserve Corporation | | | 62,846 | | | | 3,024,778 | |
ITT, Inc. | | | 91,839 | | | | 3,261,203 | |
Oshkosh Corporation | | | 39,248 | | | | 1,801,876 | |
Terex Corporation | | | 241,252 | | | | 5,109,717 | |
Wabtec Corporation | | | 53,596 | | | | 4,147,259 | |
| | | | | | | | |
| | | | | | | 23,848,527 | |
| | | | | | | | |
Materials 5.8% | |
United States 5.8% | |
¨Sealed Air Corporation | | | 126,349 | | | | 5,867,647 | |
Summit Materials, Inc. (a) | | | 209,377 | | | | 4,553,950 | |
| | | | | | | | |
| | | | | | | 10,421,597 | |
| | | | | | | | |
Oil & Gas Equipment & Services 3.7% | |
Ireland 1.7% | |
Weatherford International Plc (a) | | | 546,231 | | | | 3,064,356 | |
Luxembourg 1.0% | |
Tenaris | | | 67,071 | | | | 1,772,686 | |
United States 1.0% | |
Baker Hughes, Inc. | | | 38,486 | | | | 1,784,981 | |
| | | | | | | | |
| | | | | | | 6,622,023 | |
| | | | | | | | |
| | | | | | | | |
| | |
| | | Shares | | | Value | |
| | | | | | | | |
Oil & Gas Exploration & Production 5.3% | |
United States 5.3% | |
Devon Energy Corporation | | | 73,599 | | | $ | 2,656,188 | |
Energen Corporation | | | 34,184 | | | | 1,627,842 | |
PDC Energy, Inc. (a) | | | 51,678 | | | | 2,999,908 | |
Synergy Resources Corporation (a) | | | 362,414 | | | | 2,188,981 | |
| | | | | | | | |
| | | | | | | 9,472,919 | |
| | | | | | | | |
Oil & Gas Refining & Marketing 13.2% | |
United States 13.2% | |
¨Marathon Petroleum Corporation | | | 205,711 | | | | 7,164,914 | |
PBF Energy, Inc. | | | 151,361 | | | | 3,991,389 | |
¨Phillips 66 | | | 112,597 | | | | 9,048,295 | |
Rice Energy Inc. (a) | | | 91,248 | | | | 1,847,772 | |
Western Refining Inc. | | | 85,407 | | | | 1,814,045 | |
| | | | | | | | |
| | | | | | | 23,866,415 | |
| | | | | | | | |
Oil & Gas Storage & Transportation 7.2% | |
Bermuda 5.5% | |
GasLog Ltd. | | | 97,772 | | | | 1,217,261 | |
¨Golar LNG Ltd. | | | 505,868 | | | | 8,802,103 | |
Republic of the Marshall Islands 0.7% | | | | | | | | |
Scorpio Tankers, Inc. | | | 205,508 | | | | 1,208,387 | |
United States 1.0% | |
Cheniere Energy, Inc. (a) | | | 55,297 | | | | 1,776,693 | |
| | | | | | | | |
| | | | | | | 13,004,444 | |
| | | | | | | | |
Transportation 16.3% | |
United States 16.3% | |
CSX Corporation | | | 192,144 | | | | 5,078,366 | |
Knight Transportation, Inc. | | | 88,742 | | | | 2,317,941 | |
¨Norfolk Southern Corporation | | | 92,935 | | | | 7,812,116 | |
Old Dominion Freight Line, Inc. (a) | | | 63,122 | | | | 4,061,901 | |
¨Ryder Systems, Inc. | | | 77,488 | | | | 5,394,715 | |
XPO Logistics, Inc. (a) | | | 162,140 | | | | 4,744,216 | |
| | | | | | | | |
| | | | | | | 29,409,255 | |
| | | | | | | | |
Total Common Stocks
(Cost $134,459,517) | | | | | | | 138,416,389 | |
| | | | | | | | |
|
| MLPs and Related Companies 19.3% | |
Crude Oil & Refined Products 3.9% | |
United States 3.9% | |
¨MPLX, L.P. | | | 161,377 | | | | 5,147,926 | |
Shell Midstream Partners, L.P. | | | 54,048 | | | | 1,824,120 | |
| | | | | | | | |
| | | | | | | 6,972,046 | |
| | | | | | | | |
Oil & Gas Storage & Transportation 8.6% | |
United States 8.6% | |
Energy Transfer Equity, L.P. | | | 253,337 | | | | 3,202,180 | |
Phillips 66 Partners, L.P. | | | 66,264 | | | | 3,639,881 | |
¨Sunoco Logistics Partners, L.P. | | | 318,724 | | | | 8,748,974 | |
| | | | | | | | |
| | | | | | | 15,591,035 | |
| | | | | | | | |
| † | Calculated as a percentage of net assets applicable to common shareholders. |
| ¨ | | Among the Portfolio’s 10 largest holdings or issuers held, as of May 31, 2016, excluding short-term investments. May be subject to change daily. |
| | | | | | |
The notes to the financial statements are an integral part of,
and should be read in conjunction with, the financial statements. | | | | | 25 | |
Portfolio of Investments May 31, 2016 (Unaudited) (continued)
| | | | | | | | |
| | |
| | | Shares | | | Value | |
| | | | | | | | |
| MLPs and Related Companies (continued) | |
Propane 4.0% | |
United States 4.0% | |
¨NGL Energy Partners, L.P. | | | 481,676 | | | $ | 7,234,774 | |
| | | | | | | | |
| | |
Shipping 2.8% | | | | | | | | |
Republic of the Marshall Islands 2.8% | | | | | | | | |
Golar LNG Partners, L.P. | | | 298,143 | | | | 5,071,412 | |
| | | | | | | | |
Total MLPs and Related Companies
(Cost $31,826,066) | | | | | | | 34,869,267 | |
| | | | | | | | |
|
| Short-Term Investments—Investment Companies 0.9% | |
United States 0.9% | |
Fidelity Government Portfolio Fund—Institutional Class, 0.25% (b) | | | 321,011 | | | | 321,011 | |
Fidelity Money Market Portfolio—Institutional Class, 0.35% (b) | | | 321,011 | | | | 321,011 | |
First American Prime Obligations Fund—Class Z, 0.29% (b) | | | 321,011 | | | | 321,011 | |
Invesco Short-Term Treasury Portfolio Fund—Institutional Class, 0.21% (b) | | | 321,011 | | | | 321,011 | |
| | | | | | | | |
| | |
| | | Shares | | | Value | |
| | | | | | | | |
United States (continued) | |
Invesco STIC Prime Portfolio, 0.32% (b) | | | 321,011 | | | $ | 321,011 | |
| | | | | | | | |
Total Short-Term Investments—Investment Companies
(Cost $1,605,055) | | | | | | | 1,605,055 | |
| | | | | | | | |
Total Investments
(Cost $167,890,638) (c) | | | 97.0 | % | | | 174,890,711 | |
Other Assets in Excess of Liabilities | | | 3.0 | | | | 5,423,279 | |
Net Assets | | | 100.0 | % | | $ | 180,313,990 | |
| (a) | No distribution or dividend was made during the period ended May 31, 2016. As such, it is classified as a non-income producing security as of May 31, 2016. |
| (b) | Rate reported is the current yield as of May 31, 2016. |
| (c) | As of May 31, 2016, cost was $170,929,037 for federal income tax purposes and net unrealized appreciation was as follows: |
| | | | |
Gross unrealized appreciation | | $ | 13,551,074 | |
Gross unrealized depreciation | | | (9,589,400 | ) |
| | | | |
Net unrealized appreciation | | $ | 3,961,674 | |
| | | | |
The following is a summary of the fair valuations according to the inputs used as of May 31, 2016, for valuing the Fund’s assets and liabilities.
Asset Valuation Inputs
| | | | | | | | | | | | | | | | |
Description | | Quoted
Prices in
Active
Markets for
Identical
Assets
(Level 1) | | | Significant
Other
Observable
Inputs
(Level 2) | | | Significant
Unobservable
Inputs
(Level 3) | | | Total | |
| Investments in Securities (a) | | | | | | | | | | | | | | | | |
Common Stock | | $ | 138,416,389 | | | $ | — | | | $ | — | | | $ | 138,416,389 | |
MLPs and Related Companies | | | 34,869,267 | | | | — | | | | — | | | | 34,869,267 | |
Short-Term Investments | | | 1,605,055 | | | | — | | | | — | | | | 1,605,055 | |
| | | | | | | | | | | | | | | | |
| Total Investments in Securities | | $ | 174,890,711 | | | $ | — | | | $ | — | | | $ | 174,890,711 | |
| | | | | | | | | | | | | | | | |
| (a) | For a complete listing of investments and their industries, see the Portfolio of Investments. |
The Fund recognizes transfers between the levels as of the beginning of the period.
For the period ended May 31, 2016, the Fund did not have any transfers between Level 1 and Level 2 fair value measurements (See Note 2).
As of May 31, 2016, the Fund did not hold any investments with significant unobservable inputs (Level 3) (See Note 2).
| | | | |
| 26 | | MainStay Cushing Renaissance Advantage Fund | | The notes to the financial statements are an integral part of,
and should be read in conjunction with, the financial statements. |
Statement of Assets and Liabilities as of May 31, 2016 (Unaudited)
| | | | |
| Assets | | | | |
Investments, at value
(identified cost $167,890,638) | | $ | 174,890,711 | |
Receivables: | | | | |
Investments sold | | | 11,645,391 | |
Dividends and interest | | | 449,560 | |
Fund shares sold | | | 42,389 | |
Prepaid expenses | | | 25,149 | |
| | | | |
Total assets | | | 187,053,200 | |
| | | | |
| |
| Liabilities | | | | |
Payables: | | | | |
Investments purchased | | | 6,273,691 | |
Fund shares redeemed | | | 98,414 | |
Manager fees (See Note 3) | | | 174,681 | |
Transfer agent (See Note 3) | | | 54,032 | |
NYLIFE Distributors (See Note 3) | | | 30,532 | |
Shareholder communication | | | 19,438 | |
Professional fees | | | 26,157 | |
Custodian | | | 1,575 | |
Trustees | | | 740 | |
Accrued expenses | | | 59,950 | |
| | | | |
Total liabilities | | | 6,739,210 | |
| | | | |
Net assets | | $ | 180,313,990 | |
| | | | |
| |
| Composition of Net Assets | | | | |
Shares of beneficial interest outstanding (par value of $.001 per share) unlimited number of shares authorized | | $ | 9,961 | |
Additional paid-in capital | | | 268,512,690 | |
| | | | |
| | | 268,522,651 | |
Distributions in excess of net investment income | | | 256,903 | |
Accumulated net realized gain (loss) on investments | | | (95,465,637 | ) |
Net unrealized appreciation (depreciation) on investments | | | 7,000,073 | |
| | | | |
Net assets | | $ | 180,313,990 | |
| | | | |
| | | | |
Class A | | | | |
Net assets applicable to outstanding shares | | $ | 36,714,393 | |
| | | | |
Shares of beneficial interest outstanding | | | 2,029,789 | |
| | | | |
Net asset value per share outstanding | | $ | 18.09 | |
Maximum sales charge (5.50% of offering price) | | | 1.05 | |
| | | | |
Maximum offering price per share outstanding | | $ | 19.14 | |
| | | | |
Investor Class | | | | |
Net assets applicable to outstanding shares | | $ | 3,447,846 | |
| | | | |
Shares of beneficial interest outstanding | | | 190,883 | |
| | | | |
Net asset value per share outstanding | | $ | 18.06 | |
Maximum sales charge (5.50% of offering price) | | | 1.05 | |
| | | | |
Maximum offering price per share outstanding | | $ | 19.11 | |
| | | | |
Class C | | | | |
Net assets applicable to outstanding shares | | $ | 25,941,514 | |
| | | | |
Shares of beneficial interest outstanding | | | 1,471,333 | |
| | | | |
Net asset value per share outstanding | | $ | 17.63 | |
| | | | |
Class I | | | | |
Net assets applicable to outstanding shares | | $ | 114,210,237 | |
| | | | |
Shares of beneficial interest outstanding | | | 6,268,942 | |
| | | | |
Net asset value per share outstanding | | $ | 18.22 | |
| | | | |
| | | | | | |
The notes to the financial statements are an integral part of,
and should be read in conjunction with, the financial statements. | | | | | 27 | |
Statement of Operations for the six months ended May 31, 2016 (Unaudited)
| | | | |
| Investment Income (Loss) | |
Income | | | | |
Dividends and distributions
(Net of return of capital of $926,111) (a) | | $ | 1,685,140 | |
Interest | | | 12,258 | |
| | | | |
Total income | | | 1,697,398 | |
| | | | |
Expenses | | | | |
Manager (See Note 3) | | | 1,065,180 | |
Distribution/Service—Class A (See Note 3) | | | 43,246 | |
Distribution/Service—Investor Class (See Note 3) | | | 3,492 | |
Distribution/Service—Class C (See Note 3) | | | 132,805 | |
Transfer agent (See Note 3) | | | 120,536 | |
Registration | | | 46,735 | |
Shareholder communication | | | 30,780 | |
Professional fees | | | 28,634 | |
Custodian | | | 3,460 | |
Trustees | | | 3,174 | |
Miscellaneous | | | 4,120 | |
Insurance | | | 497 | |
| | | | |
Total expenses | �� | | 1,482,659 | |
Expense waiver/reimbursement from Manager (See Note 3) | | | (42,599 | ) |
| | | | |
Net expenses | | | 1,440,060 | |
| | | | |
Net investment income (loss) | | | 257,338 | |
| | | | |
|
| Realized and Unrealized Gain (Loss) on Investments | |
Net realized gain (loss) on investments (b) | | | (25,709,516 | ) |
Net change in unrealized appreciation (depreciation) | | | 17,160,238 | |
| | | | |
Net realized and unrealized gain (loss) on investments | | | (8,549,278 | ) |
| | | | |
Net increase (decrease) in net assets resulting from operations | | $ | (8,291,940 | ) |
| | | | |
| (a) | Dividends and distributions recorded net of foreign withholding taxes in the amount of $7,668. |
| | | | |
| 28 | | MainStay Cushing Renaissance Advantage Fund | | The notes to the financial statements are an integral part of,
and should be read in conjunction with, the financial statements. |
Statements of Changes in Net Assets
| | | | | | | | |
| | | Six months
ended May 31, 2016
(Unaudited) | | | Year ended
November 30,
2015 | |
| Increase (Decrease) in Net Assets | |
Operations: | | | | | | | | |
Net investment income (loss) | | $ | 257,338 | | | $ | 466,428 | |
Net realized gain (loss) on investments | | | (25,709,516 | ) | | | (62,213,466 | ) |
Net change in unrealized appreciation (depreciation) on investments | | | 17,160,238 | | | | 12,008,633 | |
| | | | |
Net increase (decrease) in net assets resulting from operations | | | (8,291,940 | ) | | | (49,738,405 | ) |
| | | | |
Dividends and distributions to shareholders: | | | | | | | | |
From net investment income: | | | | | | | | |
Class A | | | — | | | | (76,432 | ) |
Investor Class | | | — | | | | (3,845 | ) |
Class C | | | — | | | | (63,830 | ) |
Class I | | | — | | | | (313,328 | ) |
| | | | |
| | | — | | | | (457,435 | ) |
| | | | |
From return of capital: | | | | | | | | |
Class A | | | (572,433 | ) | | | (1,271,864 | ) |
Investor Class | | | (47,143 | ) | | | (63,988 | ) |
Class C | | | (445,961 | ) | | | (1,062,162 | ) |
Class I | | | (1,790,126 | ) | | | (5,213,897 | ) |
| | | | |
| | | (2,855,663 | ) | | | (7,611,911 | ) |
| | | | |
Total dividends and distributions to shareholders | | | (2,855,663 | ) | | | (8,069,346 | ) |
| | | | |
Capital share transactions: | | | | | | | | |
Net proceeds from sale of shares | | | 29,769,588 | | | | 178,269,549 | |
Net asset value of shares issued to shareholders in reinvestment of dividends and distributions | | | 2,619,312 | | | | 7,363,670 | |
Cost of shares redeemed (a) | | | (51,127,168 | ) | | | (333,773,516 | ) |
| | | | |
Increase (decrease) in net assets derived from capital share transactions | | | (18,738,268 | ) | | | (148,140,297 | ) |
| | | | |
Net increase (decrease) in net assets | | | (29,885,871 | ) | | | (205,948,048 | ) |
| | |
| Net Assets | | | | | | | | |
Beginning of period | | | 210,199,861 | | | | 416,147,909 | |
| | | | |
End of period | | $ | 180,313,990 | | | $ | 210,199,861 | |
| | | | |
Distributions in excess of net investment income at end of year | | $ | 256,903 | | | $ | (435 | ) |
| | | | |
| (a) | Includes an in-kind redemption in the amount of $106,860,629 during the year ended November 30, 2015 (See Note 9). |
| | | | | | |
The notes to the financial statements are an integral part of,
and should be read in conjunction with, the financial statements. | | | | | 29 | |
Financial Highlights selected per share data and ratios
| | | | | | | | | | | | | | | | |
| | | Six months
ended
May 31,
2016 | | | Year ended November 30, | | | April 2,
2013**
through
November 30, | |
| Class A | | (Unaudited) | | | 2015 | | | 2014 | | | 2013*** | |
Net asset value at beginning of period | | $ | 18.91 | | | $ | 23.29 | | | $ | 22.65 | | | $ | 20.00 | |
| | | | | | | | | | | | | | | | |
Net investment income (loss) (a) | | | 0.02 | | | | 0.03 | | | | 0.01 | | | | (0.12 | ) |
Net realized and unrealized gain (loss) on investments | | | (0.56 | ) | | | (3.85 | ) | | | 1.19 | | | | 3.09 | |
| | | | | | | | | | | | | | | | |
Total from investment operations | | | (0.54 | ) | | | (3.82 | ) | | | 1.20 | | | | 2.97 | |
| | | | | | | | | | | | | | | | |
| Less dividends and distributions: | | | | | | | | | | | | | | | | |
From net investment income | | | — | | | | (0.03 | ) | | | (0.03 | ) | | | — | |
From net realized gain on investment | | | — | | | | — | | | | — | | | | (0.02 | ) |
From return of capital | | | (0.28 | ) | | | (0.53 | ) | | | (0.53 | ) | | | (0.30 | ) |
| | | | | | | | | | | | | | | | |
Total dividends and distributions | | | (0.28 | ) | | | (0.56 | ) | | | (0.56 | ) | | | (0.32 | ) |
| | | | | | | | | | | | | | | | |
Redemption fees retained (a)(b) | | | — | | | | — | | | | 0.00 | ‡ | | | 0.00 | ‡ |
| | | | | | | | | | | | | | | | |
Net asset value at end of period | | $ | 18.09 | | | $ | 18.91 | | | $ | 23.29 | | | $ | 22.65 | |
| | | | | | | | | | | | | | | | |
Total investment return (c) | | | (2.77 | %)(d) | | | (16.57 | %) | | | 5.14 | % | | | 14.92 | % (d) |
| Ratios (to average net assets)/Supplemental Data: | | | | | | | | | | | | | | | | |
Net investment income (loss) | | | 0.29 | % †† | | | 0.15 | % | | | 0.03 | % | | | (0.83 | %)†† |
Net expenses | | | 1.70 | % †† | | | 1.69 | % | | | 1.80 | % | | | 2.00 | % †† |
Expenses (before waiver/reimbursement) | | | 1.75 | % †† | | | 1.73 | % | | | 1.81 | % | | | 5.65 | % †† |
Portfolio turnover rate | | | 170.39 | % | | | 149.12 | % | | | 115.22 | % | | | 23.44 | % |
Net assets at end of period (in 000’s) | | $ | 36,714 | | | $ | 42,135 | | | $ | 51,472 | | | $ | 6,867 | |
| *** | This period was audited by a predecessor audit firm whose opinion was unqualified. |
| ‡ | Less than one cent per share. |
| (a) | Per share data based on average shares outstanding during the period. |
| (b) | Redemption fees were only applicable prior to reorganization. (See Note 1) |
| (c) | Total investment return is calculated exclusive of sales charges and assumes the reinvestment of dividends and distributions. |
| (d) | Total investment return is not annualized. |
| | | | |
| 30 | | MainStay Cushing Renaissance Advantage Fund | | The notes to the financial statements are an integral part of,
and should be read in conjunction with, the financial statements. |
Financial Highlights selected per share data and ratios
| | | | | | | | | | | | |
| Investor Class | | Six months
ended
May 31,
2016
(Unaudited) | | | Year ended
November 30,
2015 | | | July 12,
2014**
through
November 30,
2014 | |
Net asset value at beginning of period | | $ | 18.90 | | | $ | 23.30 | | | $ | 26.80 | |
| | | | | | | | | | | | |
Net investment income (loss) (a) | | | 0.01 | | | | 0.00 | ‡ | | | 0.03 | |
Net realized and unrealized gain (loss) on investments | | | (0.57 | ) | | | (3.84 | ) | | | (3.25 | ) |
| | | | | | | | | | | | |
Total from investment operations | | | (0.56 | ) | | | (3.84 | ) | | | (3.22 | ) |
| | | | | | | | | | | | |
| Less dividends and distributions: | | | | | | | | | | | | |
From net investment income | | | — | | | | (0.03 | ) | | | (0.02 | ) |
From return of capital | | | (0.28 | ) | | | (0.53 | ) | | | (0.26 | ) |
| | | | | | | | | | | | |
Total dividends and distributions | | | (0.28 | ) | | | (0.56 | ) | | | (0.28 | ) |
| | | | | | | | | | | | |
Net asset value at end of period | | $ | 18.06 | | | $ | 18.90 | | | $ | 23.30 | |
| | | | | | | | | | | | |
Total investment return (b)(c) | | | (2.82 | %)(d) | | | (16.68 | %) | | | (12.10 | %)(d) |
| Ratios (to average net assets)/Supplemental Data: | | | | | | | | | | | | |
Net investment income (loss) | | | 0.17 | % †† | | | 0.01 | % | | | 0.31 | % †† |
Net expenses | | | 1.86 | % †† | | | 1.83 | % | | | 1.70 | % †† |
Expenses (before waiver/reimbursement) | | | 1.91 | % †† | | | 1.87 | % | | | 1.70 | % †† |
Portfolio turnover rate | | | 170.39 | % | | | 149.12 | % | | | 115.22 | % |
Net assets at end of period (in 000’s) | | $ | 3,448 | | | $ | 2,989 | | | $ | 1,651 | |
| ‡ | Less than one cent per share. |
| (a) | Per share data based on average shares outstanding during the period. |
| (b) | Total investment return is calculated exclusive of sales charges and assumes the reinvestment of dividends and distributions. |
| (c) | Total investment return may reflect adjustments to conform to generally accepted accounting principles. |
| (d) | Total investment return is not annualized. |
| | | | | | |
The notes to the financial statements are an integral part of,
and should be read in conjunction with, the financial statements. | | | | | 31 | |
Financial Highlights selected per share data and ratios
| | | | | | | | | | | | | | | | |
| | | Six months
ended
May 31,
2016 | | | Year ended November 30, | | | April 2,
2013**
through
November 30, | |
| Class C | | (Unaudited) | | | 2015 | | | 2014 | | | 2013*** | |
Net asset value at beginning of period | | $ | 18.53 | | | $ | 23.02 | | | $ | 22.56 | | | $ | 20.00 | |
| | | | | | | | | | | | | | | | |
Net investment income (loss) (a) | | | (0.05 | ) | | | (0.15 | ) | | | (0.16 | ) | | | (0.23 | ) |
Net realized and unrealized gain (loss) on investments | | | (0.57 | ) | | | (3.78 | ) | | | 1.18 | | | | 3.11 | |
| | | | | | | | | | | | | | | | |
Total from investment operations | | | (0.62 | ) | | | (3.93 | ) | | | 1.02 | | | | 2.88 | |
| | | | | | | | | | | | | | | | |
| Less dividends and distributions: | | | | | | | | | | | | | | | | |
From net investment income | | | — | | | | (0.03 | ) | | | (0.03 | ) | | | — | |
From net realized gain on investment | | | — | | | | — | | | | — | | | | (0.02 | ) |
From return of capital | | | (0.28 | ) | | | (0.53 | ) | | | (0.53 | ) | | | (0.30 | ) |
| | | | | | | | | | | | | | | | |
Total dividends and distributions | | | (0.28 | ) | | | (0.56 | ) | | | (0.56 | ) | | | (0.32 | ) |
| | | | | | | | | | | | | | | | |
Redemption fees retained (a)(b) | | | — | | | | — | | | | 0.00 | ‡ | | | — | |
| | | | | | | | | | | | | | | | |
Net asset value at end of period | | $ | 17.63 | | | $ | 18.53 | | | $ | 23.02 | | | $ | 22.56 | |
| | | | | | | | | | | | | | | | |
Total investment return (c) | | | (3.21 | %)(d) | | | (17.28 | %) | | | 4.40 | % | | | 14.47 | % (d) |
| Ratios (to average net assets)/Supplemental Data: | | | | | | | | | | | | | | | | |
Net investment income (loss) | | | (0.66 | %)†† | | | (0.72 | %) | | | (0.65 | %) | | | (1.58 | %)†† |
Net expenses | | | 2.62 | % †† | | | 2.56 | % | | | 2.52 | % | | | 2.75 | % †† |
Expenses (before waiver/reimbursement) | | | 2.67 | % †† | | | 2.60 | % | | | 2.53 | % | | | 6.40 | % †† |
Portfolio turnover rate | | | 170.39 | % | | | 149.12 | % | | | 115.22 | % | | | 23.44 | % |
Net assets at end of period (in 000’s) | | $ | 25,942 | | | $ | 35,398 | | | $ | 47,022 | | | $ | 2,263 | |
| *** | This period was audited by a predecessor audit firm whose opinion was unqualified. |
| ‡ | Less than one cent per share. |
| (a) | Per share data based on average shares outstanding during the period. |
| (b) | Redemption fees were only applicable prior to reorganization. (See Note 1) |
| (c) | Total investment return is calculated exclusive of sales charges and assumes the reinvestment of dividends and distributions. |
| (d) | Total investment return is not annualized. |
| | | | |
| 32 | | MainStay Cushing Renaissance Advantage Fund | | The notes to the financial statements are an integral part of,
and should be read in conjunction with, the financial statements. |
Financial Highlights selected per share data and ratios
| | | | | | | | | | | | | | | | |
| | | Six months
ended
May 31,
2016 | | | Year ended November 30, | | | April 2,
2013**
through
November 30, | |
| Class I | | (Unaudited) | | | 2015 | | | 2014 | | | 2013*** | |
Net asset value at beginning of period | | $ | 19.02 | | | $ | 23.36 | | | $ | 22.66 | | | $ | 20.00 | |
| | | | | | | | | | | | | | | | |
Net investment income (loss) (a) | | | 0.05 | | | | 0.07 | | | | 0.09 | | | | (0.08 | ) |
Net realized and unrealized gain (loss) on investments | | | (0.57 | ) | | | (3.85 | ) | | | 1.17 | | | | 3.06 | |
| | | | | | | | | | | | | | | | |
Total from investment operations | | | (0.52 | ) | | | (3.78 | ) | | | 1.26 | | | | 2.98 | |
| | | | | | | | | | | | | | | | |
| Less dividends and distributions: | | | | | | | | | | | | | | | | |
From net investment income | | | — | | | | (0.03 | ) | | | (0.03 | ) | | | — | |
From net realized gain on investment | | | — | | | | — | | | | — | | | | (0.02 | ) |
From return of capital | | | (0.28 | ) | | | (0.53 | ) | | | (0.53 | ) | | | (0.30 | ) |
| | | | | | | | | | | | | | | | |
Total dividends and distributions | | | (0.28 | ) | | | (0.56 | ) | | | (0.56 | ) | | | (0.32 | ) |
| | | | | | | | | | | | | | | | |
Redemption fees retained (a)(b) | | | — | | | | — | | | | 0.00 | ‡ | | | 0.00 | ‡ |
| | | | | | | | | | | | | | | | |
Net asset value at end of period | | $ | 18.22 | | | $ | 19.02 | | | $ | 23.36 | | | $ | 22.66 | |
| | | | | | | | | | | | | | | | |
Total investment return (c) | | | (2.59 | %)(d) | | | (16.34 | %) | | | 5.41 | % | | | 14.97 | % (d) |
| Ratios (to average net assets)/Supplemental Data: | | | | | | | | | | | | | | | | |
Net investment income (loss) | | | 0.55 | % †† | | | 0.34 | % | | | 0.37 | % | | | (0.58 | %)†† |
Net expenses | | | 1.45 | % †† | | | 1.43 | % | | | 1.51 | % | | | 1.75 | % †† |
Expenses (before waiver/reimbursement) | | | 1.50 | % †† | | | 1.46 | % | | | 1.52 | % | | | 5.40 | % †† |
Portfolio turnover rate | | | 170.39 | % | | | 149.12 | % | | | 115.22 | % | | | 23.44 | % |
Net assets at end of period (in 000’s) | | $ | 114,210 | | | $ | 129,677 | | | $ | 316,002 | | | $ | 16,779 | |
| *** | This period was audited by a predecessor audit firm whose opinion was unqualified. |
| ‡ | Less than one cent per share. |
| (a) | Per share data based on average shares outstanding during the period. |
| (b) | Redemption fees were only applicable prior to reorganization. (See Note 1) |
| (c) | Total investment return is calculated exclusive of sales charges and assumes the reinvestment of dividends and distributions. Class I shares are not subject to sales charges. |
| (d) | Total investment return is not annualized. |
| | | | | | |
The notes to the financial statements are an integral part of,
and should be read in conjunction with, the financial statements. | | | | | 33 | |
MainStay Cushing Energy Income Fund (formerly, MainStay Cushing Royalty Energy Income Fund)
Investment and Performance Comparison1 (Unaudited)
Performance data quoted represents past performance. Past performance is no guarantee of future results. Because of market volatility, current performance may be lower or higher than the figures shown. Investment return and principal value will fluctuate, and as a result, when shares are redeemed, they may be worth more or less than their original cost. The graph below depicts the historical performance of Class I shares of the Fund. Performance will vary from class to class based on differences in class-specific expenses and sales charges. For performance information current to the most recent month-end, please call 800-MAINSTAY (624-6782) or visit mainstayinvestments.com.
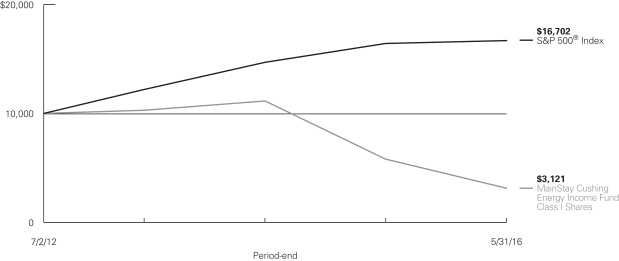
Average Annual Total Returns for the Period Ended May 31, 2016
| | | | | | | | | | | | | | | | | | | | |
| Class | | Sales Charge | | | | Six Months | | | One Year | | | Since
Inception
(7/2/12) | | | Gross Expense Ratio2 | |
| Class A Shares3 | | Maximum 5.5% Initial Sales Charge | | With sales charge Excluding sales charge | |
| –14.27
–9.28 | %
| |
| –49.35
–46.40 | %
| |
| –27.03
–25.92 | %
| |
| 1.60
1.60 | %
|
| Investor Class Shares4 | | Maximum 5.5% Initial Sales Charge | | With sales charge Excluding sales charge | |
| –14.46
–9.48 |
| |
| –49.46
–46.51 |
| |
| –27.07
–25.96 |
| |
| 1.77
1.77 |
|
| Class C Shares3 | | Maximum 1% CDSC if Redeemed Within One Year of Purchase | | With sales charge Excluding sales charge | |
| –10.55
–9.71 |
| |
| –47.33
–46.87 |
| |
| –26.50
–26.50 |
| |
| 2.41
2.41 |
|
| Class I Shares3 | | No Sales Charge | | | | | –9.14 | | | | –46.28 | | | | –25.73 | | | | 1.33 | |
| 1. | The performance table and graph do not reflect the deduction of taxes that a shareholder would pay on distributions or Fund share redemptions. Total returns reflect maximum applicable sales charges as indicated in the table above, changes in share price, and reinvestment of dividend and capital gain distributions. The graph assumes the initial investment amount shown above and reflects the deduction of all sales charges that would have applied for the period of investment. Performance figures reflect certain fee waivers and/or expense limitations, without which total returns may have been lower. For more information on share classes and current fee waivers and/or expense limitations, please refer to the notes to the financial statements. |
| 2. | The gross expense ratios presented reflect the Fund’s “Total Annual Fund Operating Expenses” from the most recent Prospectus and may differ from other expense ratios disclosed in this report. |
| 3. | Performance figures for Class A shares, Class C shares and Class I shares reflect the historical performance of the then-existing Class A shares, Class C shares and Class I shares, respectively, of the Cushing® Energy Income Fund (the predecessor to the Fund, which was subject to a different fee structure) for periods prior to July 11, 2014. The Cushing® Energy Income Fund commenced operations on July 2, 2012. |
| 4. | Performance figures for Investor Class shares, first offered on July 11, 2014, include the historical performance of Class A shares through July 10, 2014, adjusted to reflect differences in certain fees and expenses. Unadjusted, the performance for Investor Class shares would likely have been different. |
The footnotes on the next page are an integral part of the table and graph and should be carefully read in conjunction with them.
| | |
| 34 | | MainStay Cushing Energy Income Fund |
| | | | | | | | | | | | |
| Benchmark Performance | | Six
Months | | | One
Year | | | Since
Inception | |
S&P 500® Index5 | | | 1.93 | % | | | 1.72 | % | | | 14.01 | % |
Average Lipper Energy MLP Fund6 | | | 1.64 | | | | –28.42 | | | | –2.28 | |
| 5. | “S&P 500®” is a trademark of The McGraw-Hill Companies, Inc. The S&P 500® Index is widely regarded as the standard index for measuring large-cap U.S. stock market performance. The S&P 500® Index is the Fund’s primary benchmark. Results assume reinvestment of all dividends and capital gains. An investment cannot be made directly in an index. |
| 6. | The average Lipper Energy MLP Fund is representative of funds that invest primarily in Master Limited Partnerships (MLPs) engaged in the |
| | transportation, storage and processing of minerals and natural resources. This benchmark is a product of Lipper Inc. Lipper Inc. is an independent monitor of fund performance. Results are based on total returns with all dividend and capital gain distributions reinvested. |
The footnotes on the preceding page are an integral part of the table and graph and should be carefully read in conjunction with them.
Cost in Dollars of a $1,000 Investment in MainStay Cushing Energy Income Fund (Unaudited)
The example below is intended to describe the fees and expenses borne by shareholders during the six-month period from December 1, 2015, to May 31, 2016, and the impact of those costs on your investment.
Example
As a shareholder of the Fund, you incur two types of costs: (1) transaction costs, including exchange fees and sales charges (loads) on purchases (as applicable), and (2) ongoing costs, including management fees, distribution and/or service (12b-1) fees, and other Fund expenses (as applicable). This example is intended to help you understand your ongoing costs (in dollars) of investing in the Fund and to compare these costs with the ongoing costs of investing in other mutual funds. The example is based on an investment of $1,000 made at the beginning of the six-month period and held for the entire period from December 1, 2015, to May 31, 2016.
This example illustrates your Fund’s ongoing costs in two ways:
Actual Expenses
The second and third data columns in the table below provide information about actual account values and actual expenses. You may use the information in these columns, together with the amount you invested, to estimate the expenses that you paid during the six months ended May 31, 2016. Simply divide your account value by $1,000 (for example, an $8,600 account value divided by $1,000 = 8.6), then
multiply the result by the number under the heading entitled “Expenses Paid During Period” to estimate the expenses you paid on your account during this period.
Hypothetical Example for Comparison Purposes
The fourth and fifth data columns in the table below provide information about hypothetical account values and hypothetical expenses based on the Fund’s actual expense ratio and an assumed rate of return of 5% per year before expenses, which is not the Fund’s actual return. The hypothetical account values and expenses may not be used to estimate the actual ending account balances or expenses you paid for the six-month period shown. You may use this information to compare the ongoing costs of investing in the Fund with the ongoing costs of investing in other Funds. To do so, compare this 5% hypothetical example with the 5% hypothetical examples that appear in the shareholder reports of the other Funds.
Please note that the expenses shown in the table are meant to highlight your ongoing costs only and do not reflect any transactional costs, such as exchange fees or sales charges (loads). Therefore, the fourth and fifth data columns of the table are useful in comparing ongoing costs only and will not help you determine the relative total costs of owning different funds. In addition, if these transactional costs were included, your costs would have been higher.
| | | | | | | | | | | | | | | | | | | | |
| | | | | | | | | | | | | | | | |
| Share Class | | Beginning
Account Value
12/1/15 | | | Ending Account Value (Based
on Actual
Returns and
Expenses)
5/31/16 | | | Expenses
Paid
(Received) During
Period1 | | | Ending Account
Value (Based
on Hypothetical
5% Annualized
Return and
Actual Expenses)
5/31/16 | | | Expenses
Paid During
Period1 | |
| | | | | |
| Class A Shares | | $ | 1,000.00 | | | $ | 907.20 | | | $ | 7.77 | | | $ | 1,016.85 | | | $ | 8.22 | |
| | | | | |
| Investor Class Shares | | $ | 1,000.00 | | | $ | 905.20 | | | $ | 8.19 | | | $ | 1,016.40 | | | $ | 8.67 | |
| | | | | |
| Class C Shares | | $ | 1,000.00 | | | $ | 902.90 | | | $ | 11.85 | | | $ | 1,012.55 | | | $ | 12.53 | |
| | | | | |
| Class I Shares | | $ | 1,000.00 | | | $ | 908.60 | | | $ | 6.63 | | | $ | 1,018.05 | | | $ | 7.01 | |
| 1. | Expenses are equal to the Fund’s annualized expense ratio of each class (1.63% for Class A, 1.72% for Investor Class, 2.49% for Class C and 1.39% for Class I) multiplied by the average account value over the period, divided by 366 and multiplied by 183 for Class A, Investor Class, Class C, and Class I (to reflect the six-month period). The table above represents the actual expenses incurred during the six-month period. |
| | |
| 36 | | MainStay Cushing Energy Income Fund |
Portfolio Composition as of May 31, 2016(1) (Unaudited)
(Expressed as a Percentage of Total Investments)

See Portfolio of Investments beginning on page 40 for specific holdings within these categories.
Top Ten Holdings as of May 31, 2016 (excluding short-term investments)
| 1. | Exxon Mobil Corporation |
| 3. | Pioneer Natural Resource Company |
| 7. | Occidental Petroleum Corporation |
| 9. | Targa Resources Corporation |
| (1) | Fund holdings and sector allocations are subject to change, and there is no assurance that the Fund will continue to hold any particular security. |
| (2) | MLPs and Related Companies |
Portfolio Management Discussion and Analysis (Unaudited)
Questions answered by portfolio managers Jerry V. Swank and Judd B. Cryer of Cushing Asset Management, LP, the Fund’s Subadvisor.
How did MainStay Cushing Energy Income Fund perform relative to its primary benchmark and peers during the six months ended May 31, 2016?
Excluding all sales charges, MainStay Cushing Energy Income Fund returned –9.28% for Class A shares, –9.48% for Investor Class shares and –9.71% for Class C shares for the six months ended May 31, 2016. Over the same period, Class I shares returned –9.14%. For the six months ended May 31, 2016, all share classes underperformed the 1.93% return of the S&P 500® Index,1 which is the Fund’s broad-based securities-market index, and the 1.64% return of the Average Lipper2 Energy MLP Fund. See page 34 for Fund returns with applicable sales charges.
Were there any changes to the Fund during the reporting period?
Effective May 30, 2016, MainStay Cushing Royalty Energy Income Fund was renamed MainStay Cushing Energy Income Fund. Effective the same date, the Fund’s investment strategies were modified to focus on a wider array of energy companies and the Fund implemented a 25% limitation on investment in master limited partnerships (“MLPs”) which are considered publicly traded partnerships under the Internal Revenue Code. (See Notes 3 and 4 beginning on page 53 for more information about fee reduction and tax status changes.)
What factors affected the Fund’s performance relative to the S&P 500® Index during the reporting period?
During the reporting period, the most significant factors that affected the Fund’s performance relative to the S&P 500® Index were the continued volatility in domestic and international crude oil prices and the subsequent volatility of stock prices among the energy companies held by the Fund. The S&P 500® Index includes stocks across many sectors, while the Fund’s exposure is limited to the energy sector. Declining crude oil prices early in the reporting period had a negative impact upon the energy companies held by the Fund, which caused the Fund to underperform the S&P 500® Index during the reporting period, even though crude oil prices began to rebound during the reporting period.
Which subsectors were the strongest contributors to the Fund’s absolute performance, and which subsectors were particularly weak?
Because of the continued decline in crude oil prices since November 2014 and the resulting impact on certain subsectors of the energy sector, the Manager and Subadvisor determined to shift the Fund’s investment focus away from upstream MLPs, U.S. royalty trusts, and Canadian exploration and production (“E&P”) companies, to a broader range of energy companies.
During the reporting period, the Fund focused its investments in four primary areas, including integrated energy companies, large-capitalization (large-cap) E&P companies, midstream MLPs, and bonds and preferred stocks of energy companies.
The strongest positive contributors to the Fund’s relative performance during the reporting period were the midstream MLPs and integrated energy companies. (Contributions take weightings and total returns into account.) On average, these subsectors represented the second- and third-highest weightings in the Fund during the reporting period.
The subsectors with the weakest contributions to the Fund’s absolute performance during the reporting period were upstream MLPs and large-cap E&P companies. The upstream MLPs sector had the fourth-highest weighting in the Fund, while the large cap E&P subsector had the highest weighting. Holdings in each of these subsectors detracted from absolute performance during the reporting period.
By the end of the reporting period, as crude oil prices began to recover, performance of holdings in all of the Fund’s subsectors began to show signs of improvement.
During the reporting period, which individual holdings made the strongest contributions to the Fund’s absolute performance and which holdings detracted the most?
The strongest positive contribution to the Fund’s absolute performance during the reporting period came from natural gas gatherer & processor Targa Resources, followed by crude oil transportation MLP Rose Rock Midstream, L.P., and integrated energy company Chevron. Each of these positions had positive absolute performance during the reporting period, driven by improving crude oil prices. The most substantial detractors from the Fund’s absolute performance during the reporting period were upstream MLPs Vanguard Natural Resources, L.L.C., and Legacy Reserves, L.P., followed by petroleum-product shipping MLP Capital Product Partners, L.P. Each of these detractors had negative absolute performance during the reporting period because of deteriorating financial fundamentals.
Did the Fund make any significant purchases or sales during the reporting period?
During the reporting period, upstream MLPs in general came under significant pressure as a result of the decline in crude oil prices. They also faced difficult fundamentals and strained balance sheets. Because of this extraordinary volatility and the decline in fundamentals for the subsector, we sold all remaining positions in upstream MLPs and Canadian E&P companies and replaced the assets with exposure to energy through investments in integrated energy companies and certain large-cap oil and natural gas E&P companies. Purchases were focused on
| 1. | See footnote on page 35 for more information about the S&P 500® Index. |
| 2. | See footnote on page 35 for more information about Lipper Inc. |
| | |
| 38 | | MainStay Cushing Energy Income Fund |
increasing position size in integrated energy companies. We added to existing positions in these companies because of their size, more-conservative balance sheets and exposure to crude oil prices.
During the reporting period, large sales included Vanguard Natural Resources, LLC, and Legacy Reserves, L.P. (both upstream MLPs) and ConocoPhillips (a large-cap E&P company). We sold the Fund’s upstream MLP positions because of their high debt levels and distressed fundamentals that stemmed from the collapse in the prices of crude oil and natural gas liquids. ConocoPhillips was sold because of its valuation relative to its peer group.
How did the Fund’s subsector weightings change during the reporting period?
During the reporting period, we decreased the Fund’s exposure to the upstream MLP and the U.S. royalty trust sectors. Over the
same period, we increased the Fund’s exposure to other energy companies, including integrated energy companies, oil and natural gas E&P companies and midstream MLPs. We exited positions in Canadian E&P companies during the reporting period because of their high relative valuations.
How was the Fund positioned at the end of the reporting period?
As of May 31, 2016, the Fund’s largest subsector position was in integrated energy companies, followed by large-cap E&P companies and midstream MLPs.
The opinions expressed are those of the portfolio managers as of the date of this report and are subject to change. There is no guarantee that any forecasts will come to pass. This material does not constitute investment advice and is not intended as an endorsement of any specific investment.
Portfolio of Investments May 31, 2016 (Unaudited)
| | | | | | | | |
| | |
Shares | | | Value | |
| | | | | | | | |
| Common Stocks 65.7%† | |
General Partners 4.5% | |
United States 4.5% | |
¨Targa Resources Corporation | | | 76,782 | | | $ | 3,288,573 | |
| | | | | | | | |
|
Integrated Oil & Gas 38.8% | |
France 4.7% | |
¨Total S.A. | | | 71,500 | | | | 3,469,180 | |
Netherlands 5.7% | |
¨Royal Dutch Shell Plc | | | 86,700 | | | | 4,204,083 | |
Norway 5.7% | |
¨Statoil ASA | | | 263,000 | | | | 4,144,880 | |
United Kingdom 3.1% | |
BP Plc | | | 73,194 | | | | 2,298,292 | |
United States 19.6% | |
¨Chevron Corporation | | | 51,400 | | | | 5,191,400 | |
¨Exxon Mobil Corporation | | | 59,400 | | | | 5,287,788 | |
¨Occidental Petroleum Corporation | | | 51,800 | | | | 3,907,792 | |
| | | | | | | | |
| | | | | | | 28,503,415 | |
| | | | | | | | |
Oil & Gas Exploration & Production 22.4% | |
United States 22.4% | |
Anadarko Petroleum Corporation | | | 32,800 | | | | 1,701,008 | |
Devon Energy Corporation | | | 70,111 | | | | 2,530,306 | |
¨EOG Resources, Inc. | | | 48,656 | | | | 3,958,652 | |
Hess Corporation | | | 28,900 | | | | 1,731,977 | |
Noble Energy, Inc. | | | 37,000 | | | | 1,322,750 | |
¨Pioneer Natural Resource Company | | | 27,638 | | | | 4,430,924 | |
Synergy Resources Corporation (a) | | | 125,000 | | | | 755,000 | |
| | | | | | | | |
| | | | | | | 16,430,617 | |
| | | | | | | | |
Total Common Stocks
(Cost $49,545,571) | | | | | | | 48,222,605 | |
| | | | | | | | |
|
| MLPs and Related Companies 27.0% | |
Crude Oil & Refined Products 7.7% | |
United States 7.7% | |
Genesis Energy, L.P. | | | 20,000 | | | | 753,400 | |
¨NuStar Energy, L.P. | | | 54,500 | | | | 2,679,765 | |
Rose Rock Midstream, L.P. | | | 85,859 | | | | 2,215,162 | |
| | | | | | | | |
| | | | | | | 5,648,327 | |
| | | | | | | | |
Large Cap Diversified 9.3% | |
United States 9.3% | |
Energy Transfer Partners, L.P. | | | 70,072 | | | | 2,540,811 | |
ONEOK Partners, L.P. | | | 54,300 | | | | 2,060,685 | |
Williams Partners, L.P. | | | 69,100 | | | | 2,205,672 | |
| | | | | | | | |
| | | | | | | 6,807,168 | |
| | | | | | | | |
| | | | | | | | |
| | |
Shares | | | Value | |
| | | | | | | | |
Natural Gas Gatherers & Processors 1.0% | |
United States 1.0% | |
EnLink Midstream Partners, L.P. | | | 45,000 | | | $ | 708,300 | |
| | | | | | | | |
|
Propane 2.8% | |
United States 2.8% | | | | | | | | |
NGL Energy Partners, L.P. | | | 136,500 | | | | 2,050,230 | |
| | | | | | | | |
|
Shipping 5.3% | |
Republic of the Marshall Islands 5.3% | |
GasLog Partners, L.P. | | | 65,000 | | | | 1,320,800 | |
Golar LNG Partners, L.P. | | | 153,500 | | | | 2,611,035 | |
| | | | | | | | |
| | | | | | | 3,931,835 | |
| | | | | | | | |
Upstream 0.9% | |
United States 0.9% | |
Dorchester Minerals, L.P. | | | 49,598 | | | | 644,278 | |
| | | | | | | | |
Total MLPs and Related Companies
(Cost $22,859,961) | | | | | | | 19,790,138 | |
| | | | | | | | |
| | |
| | | | | | | | |
| | |
Principal | | | | |
| Fixed Income 3.3% | |
Oil & Gas Exploration & Production 2.0% | |
United States 2.0% | |
Sanchez Energy Corporation
6.13%, 01/15/2023 | | | 2,000,000 | | | | 1,450,000 | |
| | | | | | | | |
|
Upstream 1.3% | |
United States 1.3% | |
Legacy Reserves, L.P.
6.63%, 12/01/2021 | | | 1,500,000 | | | | 502,500 | |
Memorial Production Partners, L.P.
6.88%, 08/01/2022 | | | 1,000,000 | | | | 475,000 | |
| | | | | | | | |
| | | | | | | 977,500 | |
| | | | | | | | |
Total Fixed Income
(Cost $3,244,865) | | | | | | | 2,427,500 | |
| | | | | | | | |
| † | Calculated as a percentage of net assets applicable to common shareholders. |
| ¨ | | Among the Portfolio’s 10 largest holdings or issuers held, as of May 31, 2016, excluding short-term investments. May be subject to change daily. |
| | | | |
| 40 | | MainStay Cushing Energy Income Fund | | The notes to the financial statements are an integral part of,
and should be read in conjunction with, the financial statements. |
Portfolio of Investments May 31, 2016 (Unaudited) (continued)
| | | | | | | | |
| | |
Shares | | | Value | |
| | | | | | | | |
| Short-Term Investments—Investment Companies 4.3% | |
United States 4.3% | | | | | | | | |
Fidelity Government Portfolio Fund—Institutional Class, 0.25% (b) | | | 633,099 | | | $ | 633,099 | |
Fidelity Money Market Portfolio—Institutional Class, 0.35% (b) | | | 633,098 | | | | 633,098 | |
First American Prime Obligations Fund—Class Z, 0.29% (b) | | | 633,098 | | | | 633,098 | |
Invesco Short-Term Treasury Portfolio Fund—Institutional Class, 0.21% (b) | | | 633,098 | | | | 633,098 | |
Invesco STIC Prime Portfolio, 0.32% (b) | | | 633,098 | | | | 633,098 | |
| | | | | | | | |
Total Short-Term Investments—Investment Companies
(Cost $3,165,491) | | | | | | | 3,165,491 | |
| | | | | | | | |
Total Investments
(Cost $78,815,888) (c) | | | 100.3 | % | | | 73,605,734 | |
Liabilities in Excess of Other Assets | | | (0.3 | ) | | | (179,611 | ) |
Net Assets | | | 100.0 | % | | $ | 73,426,123 | |
| (a) | No distribution or dividend was made during the period ended May 31, 2016. As such, it is classified as a non-income producing security as of May 31, 2016. |
| (b) | Rate reported is the current yield as of May 31, 2016. |
| (c) | As of May 31, 2016, cost was $83,650,628 for federal income tax purposes and net unrealized appreciation was as follows: |
| | | | |
Gross unrealized appreciation | | $ | 5,910,733 | |
Gross unrealized depreciation | | | (15,955,627 | ) |
| | | | |
Net unrealized depreciation | | $ | (10,044,894 | ) |
| | | | |
The following is a summary of the fair valuations according to the inputs used as of May 31, 2016, for valuing the Fund’s assets and liabilities.
Asset Valuation Inputs
| | | | | | | | | | | | | | | | |
Description | | Quoted
Prices in
Active
Markets
for
Identical
Assets
(Level 1) | | | Significant
Other
Observable
Inputs
(Level 2) | | | Significant
Unobservable
Inputs
(Level 3) | | | Total | |
| Investments in Securities (a) | | | | | | | | | | | | | | | | |
Common Stock | | $ | 48,222,605 | | | $ | — | | | $ | — | | | $ | 48,222,605 | |
Fixed Income | | | 2,427,500 | | | | — | | | | — | | | | 2,427,500 | |
MLPs and Related Companies | | | 19,790,138 | | | | — | | | | — | | | | 19,790,138 | |
Short-Term Investments | | | 3,165,491 | | | | — | | | | — | | | | 3,165,491 | |
| | | | | | | | | | | | | | | | |
| Total Investments in Securities | | $ | 73,605,734 | | | $ | — | | | $ | — | | | $ | 73,605,734 | |
| | | | | | | | | | | | | | | | |
| (a) | For a complete listing of investments and their industries, see the Portfolio of Investments. |
The Fund recognizes transfers between the levels as of the beginning of the period.
For the period ended May 31, 2016, the Fund did not have any transfers between Level 1 and Level 2 fair value measurements (See Note 2).
As of May 31, 2016, the Fund did not hold any investments with significant unobservable inputs (Level 3) (see Note 2).
| | | | | | |
The notes to the financial statements are an integral part of,
and should be read in conjunction with, the financial statements. | | | | | 41 | |
Statement of Assets and Liabilities as of May 31, 2016 (Unaudited)
| | | | |
| Assets | |
Investments, at value
(identified cost $78,815,888) | | $ | 73,605,734 | |
Receivables: | | | | |
Investments sold | | | 343,493 | |
Fund shares sold | | | 197,808 | |
Dividends and interest | | | 338,074 | |
Prepaid expenses | | | 79,257 | |
| | | | |
Total assets | | | 74,564,366 | |
| | | | |
| |
| Liabilities | | | | |
Payables: | | | | |
Investments purchased | | | 732,388 | |
Fund shares redeemed | | | 102,076 | |
Advisory fees (See Note 3) | | | 34,468 | |
NYLIFE Distributors (See Note 3) | | | 42,088 | |
Transfer agent (See Note 3) | | | 61,275 | |
Professional fees | | | 44,083 | |
Custodian | | | 3,054 | |
Trustees | | | 1,165 | |
Franchise taxes | | | 75,284 | |
Accrued expenses | | | 42,362 | |
| | | | |
Total liabilities | | | 1,138,243 | |
| | | | |
Net assets | | $ | 73,426,123 | |
| | | | |
| |
| Composition of Net Assets | | | | |
Shares of beneficial interest outstanding (par value of $.001 per share) unlimited number of shares authorized | | $ | 17,695 | |
Additional paid-in capital | | | 331,276,872 | |
| | | | |
| | | 331,294,567 | |
Accumulated net investment loss, net of income taxes | | | (1,134,729 | ) |
Accumulated net realized gain (loss) on investments, net of income taxes | | | (250,953,222 | ) |
Net unrealized appreciation (depreciation) on investments, net of income taxes | | | (5,780,493 | ) |
| | | | |
Net assets | | $ | 73,426,123 | |
| | | | |
| | | | |
Class A | | | | |
Net assets applicable to outstanding shares | | $ | 39,915,881 | |
| | | | |
Shares of beneficial interest outstanding | | | 9,546,653 | |
| | | | |
Net asset value per share outstanding | | $ | 4.18 | |
Maximum sales charge (5.50% of offering price) | | | 0.24 | |
| | | | |
Maximum offering price per share outstanding | | $ | 4.42 | |
| | | | |
Investor Class | | | | |
Net assets applicable to outstanding shares | | $ | 2,967,657 | |
| | | | |
Shares of beneficial interest outstanding | | | 711,248 | |
| | | | |
Net asset value per share outstanding | | $ | 4.17 | |
Maximum sales charge (5.50% of offering price) | | | 0.24 | |
| | | | |
Maximum offering price per share outstanding | | $ | 4.41 | |
| | | | |
Class C | | | | |
Net assets applicable to outstanding shares | | $ | 18,527,956 | |
| | | | |
Shares of beneficial interest outstanding | | | 4,596,264 | |
| | | | |
Net asset value per share outstanding | | $ | 4.03 | |
| | | | |
Class I | | | | |
Net assets applicable to outstanding shares | | $ | 12,014,629 | |
| | | | |
Shares of beneficial interest outstanding | | | 2,840,736 | |
| | | | |
Net asset value per share outstanding | | $ | 4.23 | |
| | | | |
| | | | |
| 42 | | MainStay Cushing Energy Income Fund | | The notes to the financial statements are an integral part of,
and should be read in conjunction with, the financial statements. |
Statement of Operations for the six months ended May 31, 2016 (Unaudited)
| | | | |
| Investment Income (Loss) | |
Income | | | | |
Dividends and distributions | | | | |
(Net of return of capital of $1,092,412) (a) | | $ | 543,488 | |
Interest | | | 271,668 | |
| | | | |
Total Income | | | 815,156 | |
| | | | |
Expenses | | | | |
Manager (See Note 3) | | | 411,737 | |
Distribution/Service—Class A (See Note 3) | | | 44,517 | |
Distribution/Service—Investor Class (See Note 3) | | | 2,733 | |
Distribution/Service—Class C (See Note 3) | | | 84,613 | |
Transfer agent (See Note 3) | | | 134,576 | |
Registration | | | 52,411 | |
Professional fees | | | 60,477 | |
Franchise tax | | | 27,192 | |
Shareholder communication | | | 28,202 | |
Custodian | | | 6,507 | |
Trustees | | | 2,031 | |
Miscellaneous | | | 3,227 | |
Insurance | | | 258 | |
| | | | |
Total expenses before waiver/reimbursement | | | 858,481 | |
Expense waiver/reimbursement from Manager (see Note 3) | | | (218,760 | ) |
| | | | |
Net expenses | | | 639,721 | |
| | | | |
Net investment income (loss) | | | 175,435 | |
| | | | |
|
| Realized and Unrealized Gain (Loss) on Investments | |
Net realized gain (loss) on: | | | | |
Investments | | | (117,377,605 | ) |
Foreign currency transactions | | | (850 | ) |
| | | | |
Net realized gain (loss) on investments | | | (117,378,455 | ) |
| | | | |
Net change in unrealized appreciation (depreciation) on: | | | | |
Investments | | | 105,029,974 | |
Foreign currency translations | | | 576 | |
| | | | |
Net change in unrealized appreciation (depreciation) | | | 105,030,550 | |
| | | | |
Net realized and unrealized gain (loss) on investments | | | (12,347,905 | ) |
| | | | |
Net increase (decrease) in net assets resulting from operations | | $ | (12,172,470 | ) |
| | | | |
| (a) | Dividends and distributions recorded net of foreign withholding taxes in the amount of $40,751. |
| | | | | | |
The notes to the financial statements are an integral part of,
and should be read in conjunction with, the financial statements. | | | | | 43 | |
Statements of Changes in Net Assets
| | | | | | | | |
| | | Six months
ended
May 31,
2016
(Unaudited) | | | Year ended
November 30,
2015 | |
| Increase (Decrease) in Net Assets | |
Operations: | | | | | | | | |
Net investment income (loss) | | $ | 175,435 | | | $ | (696,403 | ) |
Net realized gain (loss) on investments | | | (117,378,455 | ) | | | (128,676,300 | ) |
Net change in unrealized appreciation (depreciation) on investments | | | 105,030,550 | | | | (39,320,183 | ) |
| | | | |
Net increase (decrease) in net assets resulting from operations | | | (12,172,470 | ) | | | (168,692,886 | ) |
| | | | |
Dividends and distributions to shareholders: | | | | | | | | |
From return of capital: | | | | | | | | |
Class A | | | (2,375,349 | ) | | | (8,767,937 | ) |
Investor Class | | | (137,925 | ) | | | (258,515 | ) |
Class C | | | (1,144,818 | ) | | | (4,440,784 | ) |
Class I | | | (860,885 | ) | | | (5,828,475 | ) |
| | | | |
| | | (4,518,977 | ) | | | (19,295,711 | ) |
| | | | |
Total dividends and distributions to shareholders | | | (4,518,977 | ) | | | (19,295,711 | ) |
| | | | |
Capital share transactions: | | | | | | | | |
Net proceeds from sale of shares | | | 11,033,898 | | | | 203,781,690 | |
Net asset value of shares issued to shareholders in reinvestment of dividends and distributions | | | 4,149,388 | | | | 17,565,971 | |
Cost of shares redeemed | | | (27,718,782 | ) | | | (211,200,248 | ) |
| | | | |
Increase (decrease) in net assets derived from capital share transactions | | | (12,535,496 | ) | | | 10,147,413 | |
| | | | |
Net increase (decrease) in net assets | | | (29,226,943 | ) | | | (177,841,184 | ) |
|
| Net Assets | |
Beginning of year | | | 102,653,066 | | | | 280,494,250 | |
| | | | |
End of year | | $ | 73,426,123 | | | $ | 102,653,066 | |
| | | | |
Accumulated net investment loss, net of income taxes | | $ | (1,134,729 | ) | | $ | (1,310,164 | ) |
| | | | |
| | | | |
| 44 | | MainStay Cushing Energy Income Fund | | The notes to the financial statements are an integral part of,
and should be read in conjunction with, the financial statements. |
Financial Highlights selected per share data and ratios
| | | | | | | | | | | | | | | | | | | | |
| | | Six months
ended
May 31,
2016 | | | Year ended November 30, | | | July 2,
2012**
through
November 30, | |
| Class A | | (Unaudited) | | | 2015 | | | 2014 | | | 2013*** | | | 2012*** | |
Net asset value at beginning of period | | $ | 4.96 | | | $ | 12.99 | | | $ | 18.23 | | | $ | 19.58 | | | $ | 20.00 | |
| | | | | | | | | | | | | | | | | | | | |
Net investment income (loss) (a) | | | 0.01 | | | | (0.02 | ) | | | (0.08 | ) | | | 0.03 | | | | 0.07 | |
Net realized and unrealized gain (loss) on investments | | | (0.53 | ) | | | (7.21 | ) | | | (3.56 | ) | | | 0.22 | | | | 0.31 | |
| | | | | | | | | | | | | | | | | | | | |
Total from investment operations | | | (0.52 | ) | | | (7.23 | ) | | | (3.64 | ) | | | 0.25 | | | | 0.38 | |
| | | | | | | | | | | | | | | | | | | | |
| Less dividends and distributions: | | | | | | | | | | | | | | | | | | | | |
From return of capital | | | (0.26 | ) | | | (0.80 | ) | | | (1.60 | ) | | | (1.60 | ) | | | (0.80 | ) |
| | | | | | | | | | | | | | | | | | | | |
Total dividends and distributions | | | (0.26 | ) | | | (0.80 | ) | | | (1.60 | ) | | | (1.60 | ) | | | (0.80 | ) |
| | | | | | | | | | | | | | | | | | | | |
Redemption fees retained (a)(b) | | | — | | | | — | | | | 0.00 | ‡ | | | — | | | | — | |
| | | | | | | | | | | | | | | | | | | | |
Net asset value at end of period | | $ | 4.18 | | | $ | 4.96 | | | $ | 12.99 | | | $ | 18.23 | | | $ | 19.58 | |
| | | | | | | | | | | | | | | | | | | | |
Total investment return (c) | | | (9.28 | %)(d) | | | (57.56 | %) | | | (22.12 | %) | | | 1.23 | % | | | 1.81 | %(d) |
| Ratios (to average net assets)/Supplemental Data: | | | | | | | | | | | | | | | | | | | | |
Net investment income (loss) (including net deferred income tax benefit (expense)) (e) | | | 0.71 | % (f)†† | | | (0.24 | %)(f) | | | 1.75 | % | | | (0.19 | %) | | | 0.55 | %†† |
Net investment income (loss) (excluding net deferred income tax benefit (expense)) (e) | | | 0.79 | % (f)†† | | | (0.19 | %)(f) | | | (0.53 | %) | | | 0.10 | % | | | 0.50 | %†† |
Net expenses (including net deferred income tax (benefit)expense) (e)(g) | | | 1.71 | % (f)†† | | | 1.79 | % (f) | | | 3.02 | % | | | 2.29 | % | | | 1.95 | %†† |
Expenses (before waiver/reimbursement, including net deferred income tax (benefit) expense) (e)(g) | | | 2.34 | % (f)†† | | | 2.04 | % (f) | | | 3.19 | % | | | 3.80 | % | | | 439.62 | %†† |
Portfolio turnover rate | | | 39.25 | % | | | 94.70 | % | | | 26.81 | % | | | 61.96 | % | | | 17.31 | % |
Net assets at end of period (in 000’s) | | $ | 39,916 | | | $ | 48,885 | | | $ | 136,037 | | | $ | 50,565 | | | $ | 297 | |
| *** | These years were audited by a predecessor audit firm whose opinion was unqualified. |
| ‡ | Less than one cent per share. |
| (a) | Per share data based on average shares outstanding during the period. |
| (b) | Redemption fees were only applicable prior to reorganization. (See Note 1) |
| (c) | Total investment return is calculated exclusive of sales charges and assumes the reinvestment of dividends and distributions. |
| (d) | Total investment return is not annualized. |
| (e) | For the year ended November 30, 2015, the Fund received a tax refund in the amount of $6,000, of which $2,773 is attributable to Class A. |
| | For the year ended November 30, 2014, the Fund accrued $65,316 in net current and deferred income tax benefit, of which $(978,230) is attributable to Class A. |
| | For the year ended November 30, 2013, the Fund accrued $71,348 in net current and deferred income tax expense, of which $58,510 is attributable to Class A. |
| | For the period from July 2, 2012 to November 30, 2012, the Fund accrued $31 in net current and deferred income tax benefit, of which $13 is attributable to Class A. |
| (f) | Ratios including/excluding net deferred income tax benefit (expense) includes applicable franchise tax expense for the period. |
| | For the period from December 1, 2015 to May 31, 2016, the Fund accrued $27,192 in franchise tax expense, of which $14,182 is attributable to Class A. |
| | For the year ended November 30, 2015, the Fund accrued $109,516 in franchise tax expense, of which $51,919 is attributable to Class A. |
| (g) | The ratio of expenses excluding net current and deferred income tax benefit to average net assets before waiver was 2.26%, 1.98%, 1.97%, 3.26% and 439.42% for the period from December 1, 2015 to May 31, 2016, fiscal years ended November 30, 2015, 2014, 2013 and the period from July 2, 2012 to November 30, 2012, respectively. The ratio of expenses excluding deferred income tax benefit to average net assets after waiver was 1.63%, 1.73% 1.80%, 1.75% and 1.75% for the period from December 1, 2015 to May 31, 2016, fiscal years ended November 30, 2015, 2014, 2013 and the period from July 2, 2012 to November 30, 2012, respectively. |
| | | | | | |
The notes to the financial statements are an integral part of,
and should be read in conjunction with, the financial statements. | | | | | 45 | |
Financial Highlights selected per share data and ratios
| | | | | | | | | | | | |
| Investor Class | | Six months
ended
May 31,
2016
(Unaudited) | | | Year ended
November 30,
2015 | | | July 12,
2014**
through
November 30,
2014 | |
Net asset value at beginning of period | | $ | 4.95 | | | $ | 12.99 | | | $ | 19.15 | |
| | | | | | | | | | | | |
Net investment income (loss) (a) | | | 0.01 | | | | (0.04 | ) | | | (0.02 | ) |
Net realized and unrealized gain (loss) on investments | | | (0.53 | ) | | | (7.20 | ) | | | (5.34 | ) |
| | | | | | | | | | | | |
Total from investment operations | | | (0.52 | ) | | | (7.24 | ) | | | (5.36 | ) |
| | | | | | | | | | | | |
| Less dividends and distributions: | | | | | | | | | | | | |
From return of capital | | | (0.26 | ) | | | (0.80 | ) | | | (0.80 | ) |
| | | | | | | | | | | | |
Total dividends and distributions | | | (0.26 | ) | | | (0.80 | ) | | | (0.80 | ) |
| | | | | | | | | | | | |
Net asset value at end of period | | $ | 4.17 | | | $ | 4.95 | | | $ | 12.99 | |
| | | | | | | | | | | | |
Total investment return (b)(c) | | | (9.48 | %)(d) | | | (57.56 | %) | | | (28.99 | %)(d) |
| Ratios (to average net assets)/Supplemental Data: | | | | | | | | | | | | |
Net investment income (loss) (including net deferred income tax benefit (expense)) (e) | | | 0.68 | % (f)†† | | | (0.48 | %)(f) | | | 1.97 | % †† |
Net investment income (loss) (excluding net deferred income tax benefit (expense)) (e) | | | 0.76 | % (f)†† | | | (0.39 | %)(f) | | | (0.20 | %)†† |
Net expenses (including net deferred income tax (benefit) expense) (e)(g) | | | 1.80 | % (f)†† | | | 1.91 | % (f) | | | (0.55 | %)†† |
Expenses (before waiver/reimbursement, including net deferred income tax (benefit) expense) (e)(g) | | | 2.42 | % (f)†† | | | 2.24 | % (f) | | | (0.45 | %)†† |
Portfolio turnover rate | | | 39.25 | % | | | 94.70 | % | | | 26.81 | % |
Net assets at end of period (in 000’s) | | $ | 2,968 | | | $ | 2,554 | | | $ | 908 | |
| (a) | Per share data based on average shares outstanding during the period. |
| (b) | Total investment return is calculated exclusive of sales charges and assumes the reinvestment of dividends and distributions. |
| (c) | Total investment return may reflect adjustments to conform to generally accepted accounting principles. |
| (d) | Total investment return is not annualized. |
| (e) | For the year ended November 30, 2015, the Fund received a tax refund in the amount of $6,000, of which $70 is attributable to Investor Class. |
| | For the year ended November 30, 2014, the Fund accrued $65,316 in net current and deferred income tax benefit, of which $8,533 is attributable to Investor Class. |
| (f) | Ratios including/excluding net deferred income tax benefit (expense) includes applicable franchise tax expense for the period. |
| | For the period from December 1, 2015 to May 31, 2016, the Fund accrued $27,192 in franchise tax expense, of which $866 is attributable to Investor Class. |
| | For the year ended November 30, 2015, the Fund accrued $109,516 in franchise tax expense, of which $2,175 is attributable to Investor Class. |
| (g) | The ratio of expenses excluding net current and deferred income tax benefit to average net assets before waiver was 2.34%, 2.15% and 1.72% for the period from December 1, 2015 to May 31, 2016, year ended November 30, 2015 and the period from July 12, 2014 to November 30, 2014, respectively. The ratio of expenses excluding deferred income tax benefit to average net assets after waiver was 1.72%, 1.82% and 1.62% for the period from December 1, 2015 to May 31, 2016, the year ended November 30, 2015 and the period from July 12, 2014 to November 30, 2014, respectively. |
| | | | |
| 46 | | MainStay Cushing Energy Income Fund | | The notes to the financial statements are an integral part of,
and should be read in conjunction with, the financial statements. |
Financial Highlights selected per share data and ratios
| | | | | | | | | | | | | | | | | | | | | | |
| | | Six months
ended
May 31, 2016 | | | | | Year ended November 30, | | | July 2,
2012**
through
November 30, | |
| Class C | | (Unaudited) | | | | | 2015 | | | 2014 | | | 2013*** | | | 2012*** | |
Net asset value at beginning of period | | $ | 4.80 | | | | | $ | 12.74 | | | $ | 18.04 | | | $ | 19.53 | | | $ | 20.00 | |
| | | | | | | | | | | | | | | | | | | | | | |
Net investment income (loss) (a) | | | (0.00 | )‡ | | | | | (0.08 | ) | | | (0.20 | ) | | | (0.11 | ) | | | 0.01 | |
Net realized and unrealized gain (loss) on investments | | | (0.52 | ) | | | | | (7.06 | ) | | | (3.50 | ) | | | 0.22 | | | | 0.32 | |
| | | | | | | | | | | | | | | | | | | | | | |
Total from investment operations | | | (0.52 | ) | | | | | (7.14 | ) | | | (3.70 | ) | | | 0.11 | | | | 0.33 | |
| | | | | | | | | | | | | | | | | | | | | | |
| Less dividends and distributions: | | | | | | | | | | | | | | | | | | | | | | |
From return of capital | | | (0.25 | ) | | | | | (0.80 | ) | | | (1.60 | ) | | | (1.60 | ) | | | (0.80 | ) |
| | | | | | | | | | | | | | | | | | | | | | |
Total dividends and distributions | | | (0.25 | ) | | | | | (0.80 | ) | | | (1.60 | ) | | | (1.60 | ) | | | (0.80 | ) |
| | | | | | | | | | | | | | | | | | | | | | |
Redemption fees retained (a)(b) | | | — | | | | | | — | | | | 0.00 | ‡ | | | — | | | | — | |
| | | | | | | | | | | | | | | | | | | | | | |
Net asset value at end of period | | $ | 4.03 | | | | | $ | 4.80 | | | $ | 12.74 | | | $ | 18.04 | | | $ | 19.53 | |
| | | | | | | | | | | | | | | | | | | | | | |
Total investment return (c) | | | (9.71 | %)(d) | | | | | (57.93 | %) | | | (22.71 | %) | | | 0.48 | % | | | 1.56 | % (d) |
| Ratios (to average net assets)/Supplemental Data: | | | | | | | | | | | | | | | | | | | | | | |
Net investment income (loss) (including net deferred income tax benefit (expense)) (e) | | | (0.17 | %)(f)†† | | | | | (1.04 | %)(f) | | | (0.93 | %) | | | (0.94 | %) | | | (0.20 | %)†† |
Net investment income (loss) (excluding net deferred income tax benefit (expense)) (e) | | | (0.09 | %)(f)†† | | | | | (0.98 | %)(f) | | | (1.21 | %) | | | (0.65 | %) | | | (0.25 | %)†† |
Net expenses (including net deferred income tax (benefit) expense) (e)(g) | | | 2.57 | % (f)†† | | | | | 2.59 | % (f) | | | 2.23 | % | | | 3.04 | % | | | 2.70 | % †† |
Expenses (before waiver/reimbursement, including net deferred income tax (benefit) expense) (e)(g) | | | 3.21 | % (f)†† | | | | | 2.85 | % (f) | | | 2.38 | % | | | 4.55 | % | | | 440.37 | % †† |
Portfolio turnover rate | | | 39.25 | % | | | | | 94.70 | % | | | 26.81 | % | | | 61.96 | % | | | 17.31 | % |
Net assets at end of period (in 000’s) | | $ | 18,528 | | | | | $ | 25,053 | | | $ | 48,574 | | | $ | 8,379 | | | $ | 401 | |
| *** | These years were audited by a predecessor audit firm whose opinion was unqualified. |
| ‡ | Less than one cent per share. |
| (a) | Per share data based on average shares outstanding during the period. |
| (b) | Redemption fees were only applicable prior to reorganization. (See Note 1) |
| (c) | Total investment return is calculated exclusive of sales charges and assumes the reinvestment of dividends and distributions. |
| (d) | Total investment return is not annualized. |
| (e) | For the year ended November 30, 2015, the Fund received a tax refund in the amount of $6,000, of which $1,344 is attributable to Class C. |
| | For the year ended November 30, 2014, the Fund accrued $65,316 in net current and deferred income tax benefit, of which $62,248 is attributable to Class C. |
| | For the year ended November 30, 2013, the Fund accrued $71,348 in net current and deferred income tax expense, of which $10,203 is attributable to Class C. |
| | For the period from July 2, 2012 to November 30, 2012, the Fund accrued $31 in net current and deferred income tax benefit, of which $10 is attributable to Class C. |
| (f) | Ratios including/excluding net deferred income tax benefit (expense) includes applicable franchise tax expense for the period. |
| | For the period from December 1, 2015 to May 31, 2016, the Fund accrued $27,192 in franchise tax expense, of which $6,746 is attributable to Class C. |
| | For the year ended November 30, 2015, the Fund accrued $109,516 in franchise tax expense, of which $26,603 is attributable to Class C. |
| (g) | The ratio of expenses excluding net current and deferred income tax benefit to average net assets before waiver was 3.13%, 2.79%, 2.66%, 4.26% and 440.42% for the period from December 1, 2015 to May 31, 2016, the fiscal years ended November 30, 2015, 2014, 2013 and the period from July 2, 2012 to November 30, 2012, respectively. The ratio of expenses excluding deferred income tax benefit to average net assets after waiver was 2.49%, 2.53%, 2.51%, 2.75% and 2.75% for the period from December 1, 2015 to May 31, 2016, the fiscal years ended November 30, 2015, 2014, 2013 and the period from July 2, 2012 to November 30, 2012, respectively. |
| | | | | | |
The notes to the financial statements are an integral part of,
and should be read in conjunction with, the financial statements. | | | | | 47 | |
Financial Highlights selected per share data and ratios
| | | | | | | | | | | | | | | | | | | | | | |
| | | Six months
ended
May 31,
2016 | | | | | Year ended November 30, | | | July 2,
2012**
through
November 30, | |
| Class I | | (Unaudited) | | | | | 2015 | | | 2014 | | | 2013*** | | | 2012*** | |
Net asset value at beginning of period | | $ | 5.01 | | | | | $ | 13.08 | | | $ | 18.30 | | | $ | 19.60 | | | $ | 20.00 | |
| | | | | | | | | | | | | | | | | | | | | | |
Net investment income (loss) (a) | | | 0.02 | | | | | | (0.00 | )‡ | | | (0.02 | ) | | | 0.08 | | | | 0.10 | |
Net realized and unrealized gain (loss) on investments | | | (0.54 | ) | | | | | (7.27 | ) | | | (3.60 | ) | | | 0.22 | | | | 0.30 | |
| | | | | | | | | | | | | | | | | | | | | | |
Total from investment operations | | | (0.52 | ) | | | | | (7.27 | ) | | | (3.62 | ) | | | 0.30 | | | | 0.40 | |
| | | | | | | | | | | | | | | | | | | | | | |
| Less dividends and distributions: | | | | | | | | | | | | | | | | | | | | | | |
From return of capital | | | (0.26 | ) | | | | | (0.80 | ) | | | (1.60 | ) | | | (1.60 | ) | | | (0.80 | ) |
| | | | | | | | | | | | | | | | | | | | | | |
Total dividends and distributions | | | (0.26 | ) | | | | | (0.80 | ) | | | (1.60 | ) | | | (1.60 | ) | | | (0.80 | ) |
| | | | | | | | | | | | | | | | | | | | | | |
Redemption fees retained (a)(b) | | | — | | | | | | — | | | | — | | | | — | | | | — | |
| | | | | | | | | | | | | | | | | | | | | | |
Net asset value at end of period | | $ | 4.23 | | | | | $ | 5.01 | | | $ | 13.08 | | | $ | 18.30 | | | $ | 19.60 | |
| | | | | | | | | | | | | | | | | | | | | | |
Total investment return (c) | | | (9.14 | %)(d) | | | | | (57.47 | %) | | | (21.92 | %) | | | 1.49 | % | | | 1.91 | %(d) |
| Ratios (to average net assets)/Supplemental Data: | | | | | | | | | | | | | | | | | | | | | | |
Net investment income (loss) (including net deferred income tax benefit (expense)) (e) | | | 0.83 | % (f)†† | | | | | (0.03 | %)(f) | | | 4.33 | % | | | 0.06 | % | | | 0.80 | %†† |
Net investment income (loss) (excluding net deferred income tax benefit (expense)) (e) | | | 0.91 | % (f)†† | | | | | 0.02 | % (f) | | | (0.01 | %) | | | 0.35 | % | | | 0.75 | %†† |
Net expenses (including net deferred income tax (benefit) expense) (e)(g) | | | 1.47 | % (f)†† | | | | | 1.54 | % (f) | | | (2.94 | %) | | | 2.04 | % | | | 1.70 | %†† |
Expenses (before waiver/reimbursement, including net deferred income tax (benefit) expense) (e)(g) | | | 2.13 | % (f)†† | | | | | 1.76 | % (f) | | | (2.83 | %) | | | 3.55 | % | | | 439.37 | %†† |
Portfolio turnover rate | | | 39.25 | % | | | | | 94.70 | % | | | 26.81 | % | | | 61.96 | % | | | 17.31 | % |
Net assets at end of period (in 000’s) | | $ | 12,015 | | | | | $ | 26,161 | | | $ | 94,975 | | | $ | 1,667 | | | $ | 77 | |
| *** | These years were audited by a predecessor audit firm whose opinion was unqualified. |
| ‡ | Less than one cent per share. |
| (a) | Per share data based on average shares outstanding during the period. |
| (b) | Redemption fees were only applicable prior to reorganization. (See Note 1) |
| (c) | Total investment return is calculated exclusive of sales charges and assumes the reinvestment of dividends and distributions. Class I shares are not subject to sales charges. |
| (d) | Total investment return is not annualized. |
| (e) | For the year ended November 30, 2015, the Fund received a tax refund in the amount of $6,000, of which $1,813 is attributable to Class I. |
| | For the year ended November 30, 2014, the Fund accrued $65,316 in net current and deferred income tax benefit, of which $972,765 is attributable to Class I. |
| | For the year ended November 30, 2013, the Fund accrued $71,348 in net current and deferred income tax expense, of which $2,635 is attributable to Class I. |
| | For the period from July 2, 2012 to November 30, 2012, the Fund accrued $31 in net current and deferred income tax benefit, of which $8 is attributable to Class I. |
| (f) | Ratios including/excluding net deferred income tax benefit (expense) includes applicable franchise tax expense for the period. |
| | For the period from December 1, 2015 to May 31, 2016, the Fund accrued $27,192 in franchise tax expense, of which $5,398 is attributable to Class I. |
| | For the year ended November 30, 2015, the Fund accrued $109,516 in franchise tax expense, of which $28,819 is attributable to Class I. |
| (g) | The ratio of expenses excluding net current and deferred income tax benefit to average net assets before waiver was 2.05%, 1.71%, 1.52%, 3.26% and 439.42% for the period from December 1, 2015 to May 31, 2016, the fiscal years ended November 30, 2015, 2014, 2013 and the period from July 2, 2012 to November 30, 2012, respectively. The ratio of expenses excluding deferred income tax benefit to average net assets after waiver was 1.39%, 1.48%, 1.41%, 1.75% and 1.75% for the period from December 1, 2015 to May 31, 2016, fiscal years ended November 30, 2015, 2014, 2013 and the period from July 2, 2012 to November 30, 2012, respectively. |
| | | | |
| 48 | | MainStay Cushing Energy Income Fund | | The notes to the financial statements are an integral part of,
and should be read in conjunction with, the financial statements. |
Notes to Financial Statements (Unaudited)
Note 1–Organization and Business
MainStay Funds Trust (the “Trust”) was organized as a Delaware statutory trust on April 28, 2009 and is governed by a Declaration of Trust. The Trust is registered under the Investment Company Act of 1940, as amended (the “1940 Act”), as an open-end management investment company, and is comprised of thirty-eight funds (collectively referred to as the “Funds” and each individually, referred to as a “Fund”). These financial statements and notes relate to the MainStay Cushing MLP Premier Fund, MainStay Cushing Renaissance Advantage Fund and MainStay Cushing Energy Income Fund (formerly MainStay Cushing Royalty Energy Income Fund) (collectively referred to as the “MainStay Cushing Funds” and each individually referred to as a “MainStay Cushing Fund”). Each MainStay Cushing Fund is the successor to the corresponding series of The Cushing® Funds Trust (collectively referred to as the “Predecessor Funds” and each individually referred to as a “Predecessor Fund”), for which Cushing® Asset Management, LP, a Texas limited partnership and the MainStay Cushing Funds’ Subadvisor (as defined in Note 3(A)), served as investment adviser. The financial statements of the MainStay Cushing Funds reflect the historical results of the Predecessor Funds prior to their reorganization on July 11, 2014. Upon the completion of the reorganization, Class A, Class C and Class I shares of each MainStay Cushing Fund assumed the performance, financial and other information of the Predecessor Funds. All information and references to periods prior to July 11, 2014 refer to the Predecessor Funds.
The MainStay Cushing MLP Premier Fund offers four classes of shares. Class A, Class C and Class I shares commenced operations on October 20, 2010. Investor Class shares commenced operations on July 11, 2014. The investment objective is to seek current income and capital appreciation. In seeking current income, the Fund intends to pay current cash distributions to shareholders, regardless of the character of such distributions for tax or accounting purposes.
The MainStay Cushing Renaissance Advantage Fund offers four classes of shares. Class A, Class C and Class I shares commenced operations on April 2, 2013. Investor Class shares commenced operations on July 11, 2014. The investment objective is to seek total return.
The MainStay Cushing Energy Income Fund offers four classes of shares. Class A, Class C and Class I shares commenced operations on July 2, 2012. Investor Class shares commenced operations on July 11, 2014. The investment objective is to seek current income and capital appreciation.
Class A and Investor Class shares are offered at net asset value (“NAV”) per share plus an initial sales charge. No sales charge applies to investments of $1 million or more (and certain other qualified purchases) in Class A and Investor Class shares, but a contingent deferred sales charge (“CDSC”) is imposed on certain redemptions of such shares made within one year of the date of purchase. Class C shares are offered at NAV without an initial sales charge, although a 1.00% CDSC may be imposed on redemptions of such shares made within one year of the date of purchase of Class C shares. Class I shares are offered at NAV and are not subject to a sales charge. Depending upon eligibility, Class A shares may convert to Investor Class shares and Investor Class shares may convert to Class A shares. Each class of shares has the same voting (except for issues that relate solely to one
class), dividend, liquidation and other rights, and the same terms and conditions, except that Class C shares are subject to higher distribution and/or service fee rates than Class A and Investor Class shares under a distribution plan pursuant to Rule 12b-1 under the 1940 Act. Class I shares are not subject to a distribution and/or service fee.
Note 2–Significant Accounting Policies
The MainStay Cushing Funds are investment companies and accordingly follow the investment company accounting and reporting guidance of the Financial Accounting Standards Board (“FASB”) Accounting Standard Codification Topic 946 Financial Services—Investment Companies. The MainStay Cushing Funds prepare their financial statements in accordance with generally accepted accounting principles (“GAAP”) in the United States of America and follow the significant accounting policies described below.
(A) Securities Valuation. Investments are usually valued as of the close of regular trading on the New York Stock Exchange (the “Exchange”) (generally 4:00 p.m. Eastern time) on each day the MainStay Cushing Funds are open for business (“valuation date”).
The Board of Trustees (the “Board”) of the MainStay Funds Trust adopted procedures establishing methodologies for the valuation of each MainStay Cushing Fund’s securities and other assets and delegated the responsibility for valuation determinations under those procedures to the Valuation Committee of the Trust (the “Valuation Committee”). The Board authorized the Valuation Committee to appoint a Valuation Sub-Committee (the “Sub-Committee”) to deal in the first instance with establishing the prices of securities for which market quotations are not readily available or the prices of which are not otherwise readily determinable under these procedures. The Sub-Committee meets (in person, via electronic mail or via teleconference) on an as-needed basis. Subsequently, the Valuation Committee meets to ensure that actions taken by the Sub-Committee were appropriate. The procedures recognize that, subject to the oversight of the Board and unless otherwise noted, the responsibility for day-to-day valuation of portfolio assets (including fair value measurement for the MainStay Cushing Funds’ assets and liabilities) rests with New York Life Investment Management LLC (“New York Life Investments” or the “Manager”), aided to whatever extent necessary by the Subadvisor (as defined in Note 3(A)) to each MainStay Cushing Fund.
To assess the appropriateness of security valuations, the Manager, Subadvisor, or the MainStay Cushing Funds’ third party service provider, who is subject to oversight by the Manager, regularly compares prior day prices, prices on comparable securities, and the sale prices to the prior and current day prices and challenges prices with changes exceeding certain tolerance levels with third party pricing services or broker sources. For those securities valued through either a standardized fair valuation methodology or a fair valuation measurement, the Sub-Committee deals in the first instance with such valuation and the Valuation Committee reviews and affirms, if appropriate, the reasonableness of the valuation based on such methodologies and measurements on a regular basis after considering all relevant information that is reasonably available. Any action taken by the Sub-Committee with respect to the valuation of a portfolio security is submitted by the Valuation Committee to the Board for its review and ratification, if appropriate, at its next regularly scheduled meeting.
Notes to Financial Statements (Unaudited) (continued)
“Fair value” is defined as the price a MainStay Cushing Fund would receive upon selling an asset or liability in an orderly transaction to an independent buyer in the principal or most advantageous market for the asset or liability. Fair value measurements are determined within a framework that establishes a three-tier hierarchy which maximizes the use of observable market data and minimizes the use of unobservable inputs to establish a classification of fair value measurements for disclosure purposes. “Inputs” refer broadly to the assumptions that market participants would use in pricing the asset or liability, including assumptions about risk, such as the risk inherent in a particular valuation technique used to measure fair value using a pricing model and/or the risk inherent in the inputs for the valuation technique. Inputs may be observable or unobservable. Observable inputs reflect the assumptions market participants would use in pricing the asset or liability based on market data obtained from sources independent of each MainStay Cushing Fund. Unobservable inputs reflect each MainStay Cushing Fund’s own assumptions about the assumptions market participants would use in pricing the asset or liability based on the information available. The inputs or methodology used for valuing assets or liabilities may not be an indication of the risks associated with investing in those assets or liabilities. The three-tier hierarchy of inputs is summarized below.
| • | | Level 1—quoted prices in active markets for an identical asset or liability |
| • | | Level 2—other significant observable inputs (including quoted prices for a similar asset or liability in active markets, interest rates and yield curves, prepayment speeds, credit risk, etc.) |
| • | | Level 3—significant unobservable inputs (including each MainStay Cushing Fund’s own assumptions about the assumptions that market participants would use in measuring fair value of an asset or liability) |
The level of an asset or liability within the fair value hierarchy is based on the lowest level of an input, both individually and in the aggregate, that is significant to the fair value measurement. As of May 31, 2016, the aggregate value by input level of each MainStay Cushing Fund’s assets and liabilities is included at the end of each MainStay Cushing Fund’s Portfolio of Investments.
The MainStay Cushing Funds may use third party vendor evaluations, whose prices may be derived from one or more of the following standard inputs, among others:
| | |
• Benchmark Yields | | • Reported Trades |
• Broker/Dealer Quotes | | • Issuer Spreads |
• Two-sided markets | | • Benchmark securities |
• Bids/Offers | | • Reference Data (corporate actions or material event notices) |
• Industry and economic events | | • Monthly payment information |
• Comparable bonds | | |
An asset or liability for which market values cannot be measured using the methodologies described above is valued by methods deemed reasonable in good faith by the Valuation Committee, following the procedures established by the Board, to represent fair value. Under these procedures, the MainStay Cushing Funds generally use a market-based approach which may use related or comparable assets or
liabilities, recent transactions, market multiples, book values, and other relevant information. The MainStay Cushing Funds may also use an income-based valuation approach in which the anticipated future cash flows of the asset or liability are discounted to calculate fair value. Discounts may also be applied due to the nature and/or duration of any restrictions on the disposition of the asset or liability. Fair value represents a good faith approximation of the value of the security. Fair value determinations involve the consideration of a number of subjective factors, an analysis of applicable facts and circumstances and the exercise of judgment. As a result, it is possible that the fair value for a security determined in good faith in accordance with the Funds’ valuation procedures may differ from valuations for the same security determined by other funds using their own valuation procedures. Although the Funds’ valuation procedures are designed to value a security at the price a Fund may reasonably expect to receive upon its sale in an orderly transaction, there can be no assurance that any fair value determination there under would, in fact, approximate the amount that a Fund would actually realize upon the sale of the security or the price at which the security would trade if a reliable market price were readily available. For the six-months ended May 31, 2016, there were no material changes to the fair value methodologies.
Equity and non-equity securities which may be valued in this manner include, but are not limited to: (i) a security for which trading has been halted or suspended; (ii) a debt security that has recently gone into default and for which there is not a current market quotation; (iii) a security of an issuer that has entered into a restructuring; (iv) a security that has been de-listed from a national exchange; (v) a security for which the market price is not readily available from a third party pricing source or, if so provided, does not, in the opinion of the Manager or Subadvisor reflect the security’s market value; (vi) a security subject to trading collars for which no or limited trading takes place; and (vii) a security whose principal market has been temporarily closed at a time when, under normal conditions, it would be open. Securities for which market quotations or observable inputs are not readily available are generally categorized as Level 3 in the hierarchy. As of May 31, 2016, the MainStay Cushing Funds did not hold any securities that were fair valued in such a manner.
Equity securities and shares of Exchange-Traded Funds are valued at the last quoted sales prices as of the close of regular trading on the relevant exchange on each valuation date. Securities that are not traded on the valuation date are valued at the mean of the last quoted bid and ask prices. Prices are normally taken from the principal market in which each security trades. Investments in mutual funds, including money market funds, are valued at their respective NAVs as of the close of the Exchange on the valuation date. The amortized cost method involves valuing a security at its cost on the date of purchase and thereafter assuming a constant amortization to maturity of the difference between such cost and the value on maturity date. Amortized cost approximates the current fair value of a security. Securities valued at amortized cost are not valued using quoted prices in an active market and are generally categorized as Level 2 in the hierarchy.
Debt securities (other than convertible and municipal bonds) are valued at the evaluated bid prices (evaluated mean prices in the case of convertible and municipal bonds) supplied by a pricing agent or broker selected by the Manager, in consultation with the Subadvisor. Those
| | |
| 50 | | MainStay Cushing Funds |
values reflect broker/dealer supplied prices and electronic data processing techniques, if the evaluated bid or mean prices are deemed by the Manager, in consultation with the Subadvisor, to be representative of market values, at the regular close of trading of the Exchange on each valuation date. Debt securities purchased on a delayed delivery basis are marked to market daily until settlement at the forward settlement date. Debt securities, including corporate bonds, U.S. government & federal agency bonds, municipal bonds, foreign bonds, convertible bonds, asset-backed securities and mortgage-backed securities are generally categorized as Level 2 in the hierarchy.
Temporary cash investments acquired in excess of 60 days to maturity at the time of purchase are valued using the latest bid prices or using valuations based on a matrix system (which considers such factors as security prices, yields, maturities, and ratings), both as furnished by independent pricing services. Other temporary cash investments which mature in 60 days or less at the time of purchase (“Short-Term Investments”) are valued using the amortized cost method of valuation, unless the use of such method would be inappropriate. The amortized cost method involves valuing a security at its cost on the date of purchase and thereafter assuming a constant amortization to maturity of the difference between such cost and the value on maturity date. Amortized cost approximates the current fair value of a security. These securities are generally categorized as Level 2 in the hierarchy.
A MainStay Cushing Fund security or other asset may be determined to be illiquid under procedures approved by the Board. Illiquidity of a security might prevent the sale of such security at a time when the Manager or Subadvisor might wish to sell, and these securities could have the effect of decreasing the overall level of a MainStay Cushing Fund’s liquidity. Further, the lack of an established secondary market may make it more difficult to value illiquid securities, requiring a Fund to rely on judgments that may be somewhat subjective in measuring value, which could vary from the amount that a MainStay Cushing Fund could realize upon disposition. Difficulty in selling illiquid securities may result in a loss or may be costly to a MainStay Cushing Fund. Under the supervision of the Board, the Manager or Subadvisor measure the liquidity of a MainStay Cushing Fund’s investments; in doing so, the Manager or Subadvisor may consider various factors, including (i) the frequency of trades and quotations, (ii) the number of dealers and prospective purchasers, (iii) dealer undertakings to make a market, and (iv) the nature of the security and the market in which it trades (e.g., the time needed to dispose of the security, the method of soliciting offers and the mechanics of transfer). Illiquid securities generally will be valued by methods deemed reasonable in good faith in such a manner as the Board deems appropriate to reflect their fair value. The liquidity of each MainStay Cushing Fund’s investments, as shown in their respective Portfolio of Investments, was measured as of May 31, 2016 and can change at any time in response to, among other relevant factors, market conditions or events or developments with respect to an individual issuer or instrument. As of May 31, 2016, securities deemed to be illiquid under procedures approved by the Board are shown in the applicable MainStay Cushing Fund’s Portfolio of Investments.
(B) Income Taxes. The MainStay Cushing MLP Premier Fund is taxed as a corporation and is obligated to pay federal and state income tax on its taxable income. Currently, the maximum marginal regular federal income tax rate for a corporation is 35%. The MainStay Cushing MLP Premier Fund may be subject to a 20% federal alternative
minimum tax on its federal alternative minimum taxable income to the extent that its alternative minimum tax exceeds their respective regular federal income tax.
The MainStay Cushing MLP Premier Fund invests its assets in master limited partnerships (“MLPs”), which generally are treated as partnerships for federal income tax purposes. As a limited partner in MLPs, The MainStay Cushing MLP Premier Fund reports its allocable share of each MLP’s taxable income in computing its own taxable income.
The MainStay Cushing MLP Premier Fund tax expense or benefit is included in the Statements of Operations based on the component of income or gains (losses) to which such expense or benefit relates. Deferred income taxes reflect the net tax effects of temporary differences between the carrying amounts of assets and liabilities for financial reporting purposes and the amounts used for income tax purposes. A valuation allowance is recognized if, based on the weight of available evidence, it is more likely than not that some portion or all of the deferred income tax asset will not be realized.
The MainStay Cushing Energy Income Fund invests its assets in a portfolio of energy companies involved in exploring, developing, producing, transporting, gathering and processing, storing, refining, distributing, mining or marketing natural gas, natural gas liquids (including propane), crude oil, refined products or coal. The MainStay Cushing Energy Income Fund intends to qualify and intends to elect to be subject to tax as a regulated investment company (“RIC”) under Subchapter M of the Internal Revenue Code of 1986, as amended (the “Internal Revenue Code”). Consistent with that intention, the MainStay Cushing Equity Income Fund intends to invest no more than 25% of its total assets in securities of energy MLPs.
The MainStay Cushing Energy Income Fund intends to comply with the requirements of the Internal Revenue Code applicable to RICs, and to distribute all of its taxable income to its shareholders within allocable time limits. Since the MainStay Cushing Energy Income Fund intends to elect to be subject to tax as a RIC, effective for its fiscal and taxable year ending November 30, 2016, no federal, state and local income tax provisions are required. Prior to May 31, 2016, the Fund was operated as a corporation for tax purposes.
The MainStay Cushing Renaissance Advantage Fund’s policy is to comply with the requirements of the Internal Revenue Code applicable to RICs and to distribute all of the taxable income to the shareholders of the Fund within the allowable time limits. Therefore, no federal, state, and local income tax provisions are required.
Management evaluates each MainStay Cushing Fund’s tax positions to determine if the tax positions taken meet the minimum recognition threshold in connection with accounting for uncertainties in income tax positions taken or expected to be taken for the purposes of measuring and recognizing tax liabilities in the financial statements. Recognition of tax benefits of an uncertain tax position is required only when the position is “more likely than not” to be sustained assuming examination by taxing authorities. Management has analyzed the MainStay Cushing Funds’ tax positions taken on federal, state and local income tax returns for all open tax years (for up to three tax years). Management has concluded that no provisions for federal, state and local income tax are required in the MainStay Cushing Renaissance Advantage Fund and the MainStay Cushing Energy Income Fund’s financial statements as they
Notes to Financial Statements (Unaudited) (continued)
intend to qualify each year for special tax treatment afforded to a RIC. Management has concluded that provisions for federal, state and local income tax are required to be included in the financial statements for the MainStay Cushing MLP Premier Fund which is taxed as a corporation and obligated to pay federal and state income tax on its taxable income. The MainStay Cushing Funds’ federal, state and local income and federal excise tax returns for tax years for which the applicable statutes of limitations have not expired are subject to examination by the Internal Revenue Service and state and local departments of revenue.
(C) Dividends and Distributions to Shareholders. Dividends and distributions are recorded on the ex-dividend date. The MainStay Cushing MLP Premier Fund intends to declare and pay distributions, if any, at least quarterly. On a book basis, all realized capital gains net of applicable taxes will be retained by the MainStay Cushing MLP Premier Fund. The MainStay Renaissance Advantage Fund and the MainStay Cushing Energy Income Fund intend to declare and pay distributions from net investment income quarterly and from net capital gains, if any, annually. Unless the shareholder elects otherwise, all dividends and distributions are reinvested in the same class of shares of the respective MainStay Cushing Fund, at NAV. Dividends and distributions to shareholders are determined in accordance with federal income tax regulations and may differ from GAAP.
(D) Security Transactions and Investment Income. The MainStay Cushing Funds record security transactions on the trade date. Realized gains and losses on security transactions are determined using the identified cost method. Dividend income is recognized on the ex-dividend date, net of any foreign tax withheld at the source, and interest income is accrued as earned using the effective interest rate method. Discounts and premiums on Short-Term Investments are accreted and amortized, respectively, on the straight-line method. The straight-line method approximates the effective interest method for short-term investments. Income from payment-in-kind securities is recorded daily based on the effective interest method of accrual. Distributions on an MLP are generally recorded based on the characterization reported on the MainStay Cushing Fund’s Form 1065, Schedule K-1, received from each MLP. The MainStay Cushing Funds record their pro rata share of the income and deductions, and capital gains and losses allocated from each MLP, as well as adjusting the cost basis of each MLP accordingly.
Distributions received from each of the MainStay Cushing Fund’s investments in energy related U.S. royalty trusts and Canadian royalty trusts and exploration and production companies (collectively, “Energy Trusts”) and MLPs generally are comprised of ordinary income, capital gains and return of capital from the Energy Trusts or MLPs. The MainStay Cushing Funds record investment income on the ex-date of the distributions. For financial statement purposes, the MainStay Cushing Funds use return of capital and income estimates to allocate the dividend income received. Such estimates are based on historical information available from each Energy Trust, MLP and other industry sources. These estimates may subsequently be revised based on information received from Energy Trusts or MLPs after their tax reporting periods are concluded, as the actual character of these distributions is not known until after the fiscal year end of the Funds.
Each MainStay Cushing Fund estimates the allocation of investment income and return of capital for the distributions received from MLPs within the Statements of Operations. For the six-months ended May 31,
2016, each MainStay Cushing Fund estimated approximately 100% of the distributions received from MLPs to be from return of capital. Investment income and realized and unrealized gains and losses on investments of the MainStay Cushing Funds are allocated to separate classes of shares pro rata based upon their relative net assets on the date the income is earned or realized and unrealized gains and losses are incurred.
(E) Expenses. Expenses of the Trust are allocated to the individual MainStay Cushing Funds in proportion to the net assets of the respective Funds when the expenses are incurred, except where direct allocations of expenses can be made. Expenses (other than transfer agent expenses and fees incurred under the shareholder services plans and/or the distribution plans further discussed in Note 3(B)) are allocated to separate classes of shares pro rata based upon their relative net assets on the date the expenses are incurred. The expenses borne by the MainStay Cushing Funds, including those of related parties to the MainStay Cushing Funds, are shown in the Statement of Operations.
(F) Use of Estimates. In preparing financial statements in conformity with GAAP, management makes estimates and assumptions that affect the reported amounts and disclosures in the financial statements. Actual results could differ from those estimates.
(G) Concentration of Risk. The MainStay Cushing MLP Premier Fund, under normal market conditions, invests at least 80% of its assets (net assets plus any borrowings for investment purposes) in a portfolio of MLPs and MLP-related investments. Under normal market conditions, the MainStay Cushing Energy Income Fund invests at least 80% of its assets (net assets plus any borrowings for investment purposes) in a portfolio of energy companies involved in exploring, developing, producing, transporting, gathering and processing, storing, refining, distributing, mining or marketing natural gas, natural gas liquids (including propane), crude oil, refined products or coal. Under normal market conditions, the MainStay Cushing Renaissance Advantage Fund invests at least 80% of its assets (net assets plus any borrowings for investment purposes) in a portfolio of (i) companies across the energy supply chain spectrum, including upstream, midstream and downstream energy companies, as well as oil and gas services companies, (ii) energy-intensive chemical, metal and industrial and manufacturing companies and engineering and construction companies that the Subadvisor expects to benefit from growing energy production and lower feedstock costs relative to global costs and, (iii) transportation and logistics companies providing solutions to the U.S. manufacturing industry. Therefore the MainStay Cushing Funds may be subject to more risks than if they were more broadly diversified over numerous industries and sectors of the economy. General changes in market sentiment towards companies in the sectors in which they invest may adversely affect the MainStay Cushing Funds, and the performance of such sectors may lag behind the broader market as a whole.
The MainStay Cushing Funds are also subject to MLP structure risk. Holders of MLP units are subject to certain risks inherent in the structure of MLPs, including (i) tax risks, (ii) the limited ability to elect or remove management or the general partner or managing member, (iii) limited voting rights, except with respect to extraordinary transactions, and (iv) conflicts of interest between the general partner or managing member and its affiliates, on the one hand, and the limited partners or members, on the other hand, including those arising from incentive distribution payments or corporate opportunities.
| | |
| 52 | | MainStay Cushing Funds |
(H) Indemnifications. Under the Trust’s organizational documents, its officers and trustees are indemnified against certain liabilities that may arise out of performance of their duties to the Trust. Additionally, in the normal course of business, the MainStay Cushing Funds enter into contracts with third-party service providers that contain a variety of representations and warranties and which may provide general indemnifications. The MainStay Cushing Funds’ maximum exposure under these arrangements is unknown, as this would involve future claims that may be made against the MainStay Cushing Funds that have not yet occurred. Based on experience, management is of the view that the risk of loss in connection with these potential indemnification obligations is remote. However, there can be no assurance that material liabilities related to such obligations will not arise in the future, which could adversely impact the MainStay Cushing Funds.
Note 3–Fees and Related Party Transactions
(A) Manager and Subadvisor. New York Life Investments, a registered investment adviser and an indirect, wholly-owned subsidiary of New York Life Insurance Company (“New York Life”), serves as the MainStay Cushing Funds’ Manager, pursuant to an Amended and Restated Management Agreement, (“Management Agreement”). The Manager provides offices, conducts clerical, recordkeeping and bookkeeping services, and keeps most of the financial and accounting records required to be maintained by the MainStay Cushing Funds. Except for the portion of salaries and expenses that are the responsibility of the MainStay Cushing Funds, the Manager pays the salaries and expenses of all personnel affiliated with the MainStay Cushing Funds and certain operational expenses of the MainStay Cushing Funds. The MainStay Cushing Funds reimburse New York Life Investments in an amount equal to a portion of the compensation of the Chief Compliance Officer of the MainStay Cushing Funds. Cushing® Asset Management, LP (“Cushing® Asset Management” or the “Subadvisor”), a registered investment adviser, serves as Subadvisor to the MainStay Cushing Funds and is responsible for the day-to-day portfolio management of the MainStay Cushing Funds. Pursuant to the terms of a Subadvisory Agreement (“Subadvisory Agreement”) between New York Life Investments and Cushing® Asset Management, New York Life Investments pays for the services of the Subadvisor.
Under the Management Agreement, the MainStay Cushing MLP Premier Fund pays the Manager a monthly fee for services performed and facilities furnished at an annual rate of the Fund’s average daily net assets as follows: 1.10% up to $3 billion and 1.05% over $3 billion. Prior to March 31, 2016, the Fund paid the Manager a monthly fee for services performed and facilities furnished at an annual rate of 1.10% of the Fund’s average daily net assets.
Under the Management Agreement, the MainStay Cushing Renaissance Advantage Fund pays the Manager a monthly fee for services performed and facilities furnished at an annual rate of 1.25% of the Fund’s average daily net assets.
Under the Management Agreement, the MainStay Cushing Energy Income Fund pays the Manager a monthly fee for services performed and facilities furnished at an annual rate of 0.95% of the Fund’s average daily net assets. Prior to March 31, 2016, the Fund paid the Manager a monthly fee for services performed and facilities furnished at an annual rate of 1.35% of the Fund’s average daily net assets.
In connection with the discussion below regarding expense limitation agreements, Total Annual Fund Operating Expenses excludes taxes, interest, litigation, extraordinary expenses, brokerage and other transaction expenses relating to the purchase or sale of portfolio investments, acquired (underlying) fund fees and expenses and deferred income tax expenses for the MainStay Cushing MLP Premier Fund and the MainStay Cushing Energy Income Fund.
MainStay Cushing MLP Premier Fund
New York Life Investments has contractually agreed to waive a portion of the MainStay Cushing MLP Premier Fund’s management fees and/or reimburse expenses so that Total Annual Fund Operating Expenses do not exceed the following percentages of average daily net assets: Class A, 1.60%; Class C, 2.35%; and Class I, 1.35%. This agreement will remain in effect until July 11, 2016.
MainStay Cushing Renaissance Advantage Fund
New York Life Investments has contractually agreed to waive a portion of the MainStay Cushing Renaissance Advantage Fund’s management fees and/or reimburse expenses so that Total Annual Fund Operating Expenses for Class A shares do not exceed 1.61% of its average daily net assets. New York Life Investments will apply an equivalent waiver or reimbursement, in an equal number of basis points, to the other share classes. This agreement will remain in effect until April 1, 2017 unless extended by New York Life Investments and approved by the Board.
New York Life Investments has contractually agreed to waive fees and/or reimburse expenses so that MainStay Cushing Renaissance Advantage Fund’s Total Annual Fund Operating Expenses of a class do not exceed the following percentages of average daily net assets: Class A, 1.90%; Class C, 2.65% and Class I, 1.65%. Based on the waiver or reimbursement with respect to Class A shares, New York Life Investments will apply an equivalent waiver or reimbursement, in an equal number of basis points, to Investor Class shares. This expense limitation agreement will remain in effect until July 11, 2016.
Prior to April 1, 2016, New York Life Investments had contractually agreed to waive fees and/or reimburse expenses so that Total Annual Fund Operating Expenses for Class A shares did not exceed 1.75% of its average daily net assets. New York Life Investments would have applied an equivalent waiver or reimbursement, in an equal number of basis points, to other share classes.
MainStay Cushing Energy Income Fund
New York Life Investments has contractually agreed to waive a portion of the MainStay Cushing Energy Income Fund’s management fees and/or reimburse expenses so that Total Annual Fund Operating Expenses for Class A shares do not exceed 1.45% of its average daily net assets. New York Life Investments will apply an equivalent waiver or reimbursement, in an equal number of basis points, to the other share classes. This agreement will remain in effect until April 1, 2017 unless extended by New York Life Investments and approved by the Board.
New York Life Investments has contractually agreed to waive fees and/or reimburse expenses so that MainStay Cushing Energy Income Fund’s Total Annual Fund Operating Expenses of a class do not exceed the following percentages of average daily net assets: Class A, 1.90%,
Notes to Financial Statements (Unaudited) (continued)
Class C, 2.65% and Class I, 1.65%. Based on the waiver or reimbursement with respect to Class A shares, New York Life Investments will apply an equivalent waiver or reimbursement, in an equal number of basis points, to Investor Class shares. This expense limitation agreement will remain in effect until July 11, 2016.
Prior to April 1, 2016, New York Life Investments had contractually agreed to waive a portion of its management fee so that the management fee did not exceed 1.25% of the Fund’s average daily net assets.
Prior to April 1, 2016, New York Life Investments had contractually agreed to waive fees and/or reimburse expenses so that Total Annual Fund Operating Expenses for Class A shares did not exceed 1.73% of its average daily net assets. New York Life Investments would have applied an equivalent waiver or reimbursement, in an equal number of basis points, to the other share classes.
For the six-months ended May 31, 2016, New York Life Investments earned fees from the MainStay Cushing Funds and waived its fees and/or reimbursed expenses as follows:
| | | | | | |
| | | Fees earned | | Fees
waived/ reimbursed | |
MainStay Cushing MLP Premier Fund | | $5,782,405 | | $ | — | |
MainStay Cushing Renaissance Advantage Fund | | 1,065,180 | | | 42,599 | |
MainStay Cushing Energy Income Fund | | 411,737 | | | 218,760 | |
U.S. Bancorp Fund Services, LLC (“U.S. Bancorp”) provides sub-administration and sub-accounting services to the MainStay Cushing Funds pursuant to an agreement with New York Life Investments. These services include calculating the daily NAVs of the MainStay Cushing Funds, maintaining the general ledger and sub-ledger accounts for the calculation of the MainStay Cushing Funds’ respective NAVs, and assisting New York Life Investments in conducting various aspects of the MainStay Cushing Funds’ administrative operations. For providing these services to the MainStay Cushing Funds, U.S. Bancorp is compensated by New York Life Investments.
(B) Distribution and Service Fees. The Trust, on behalf of the MainStay Cushing Funds, has entered into a distribution agreement with NYLIFE Distributors LLC (the ‘‘Distributor’’), an indirect, wholly-owned subsidiary of New York Life. The MainStay Cushing Funds have adopted distribution plans (the ‘‘Plans’’) in accordance with the provisions of Rule 12b-1 under the 1940 Act.
Pursuant to the Class A and Investor Class Plans, the Distributor receives a monthly distribution fee from the Class A and Investor Class shares, at an annual rate of 0.25% of the average daily net assets of the Class A and Investor Class shares for distribution and/or service activities as designated by the Distributor. Pursuant to the Class C Plan, Class C shares pay the Distributor a monthly distribution fee at an annual rate of 0.75% of the average daily net assets of the Class C shares, along with a service fee at an annual rate of 0.25% of the average daily net assets of the Class C shares, for a total 12b-1 fee of 1.00%. Class I shares are not subject to a distribution and/or service fee.
The Plans provide that the distribution and service fees are payable to the Distributor regardless of the amounts actually expended by the
Distributor for distribution of the MainStay Cushing Funds’ shares and service activities.
(C) Sales Charges. The MainStay Cushing Funds were advised by the Distributor that the amount of initial sales charges retained on sales of Class A and Investor Class shares for the six-months ended May 31, 2016, were as follows:
| | | | |
MainStay Cushing MLP Premier Fund | | | | |
Class A | | $ | 105,060 | |
Investor Class | | | 2,437 | |
| |
| | | | |
MainStay Cushing Renaissance Advantage Fund | | | | |
Class A | | $ | 5,007 | |
Investor Class | | | 2,479 | |
| |
| | | | |
MainStay Cushing Energy Income Fund | | | | |
Class A | | $ | 10,654 | |
Investor Class | | | 4,348 | |
The MainStay Cushing Funds were also advised that the Distributor retained CDSCs on redemptions of Class A, Investor Class and Class C shares, for the six-months ended May 31, 2016, were as follows:
| | | | |
MainStay Cushing MLP Premier Fund | | | | |
Class A | | $ | 1,775 | |
Investor Class | | | — | |
Class C | | | 72,752 | |
| |
| | | | |
MainStay Cushing Renaissance Advantage Fund | |
Class A | | $ | 2 | |
Investor Class | | | — | |
Class C | | | 4,032 | |
| |
| | | | |
MainStay Cushing Energy Income Fund | |
Class A | | $ | 238 | |
Investor Class | | | — | |
Class C | | | 4,711 | |
(D) Transfer, Dividend Disbursing and Shareholder Servicing Agent. NYLIM Service Company LLC, an affiliate of New York Life Investments, is the MainStay Cushing Funds’ transfer, dividend disbursing and shareholder servicing agent pursuant to an agreement between NYLIM Service Company LLC and the Trust. NYLIM Service Company LLC has entered into an agreement with Boston Financial Data Services, Inc. (“BFDS”) pursuant to which BFDS performs certain transfer agent services on behalf of NYLIM Service Company LLC. Transfer agent expenses incurred by the MainStay Cushing Funds’ share classes for the six-months ended May 31, 2016, were as follows:
| | | | |
MainStay Cushing MLP Premier Fund | | | | |
Class A | | $ | 185,900 | |
Investor Class | | | 2,170 | |
Class C | | | 345,607 | |
Class I | | | 272,530 | |
| | |
| 54 | | MainStay Cushing Funds |
| | | | |
MainStay Cushing Renaissance Advantage Fund | | | | |
Class A | | $ | 19,735 | |
Investor Class | | | 3,876 | |
Class C | | | 36,708 | |
Class I | | | 60,217 | |
| |
| | | | |
MainStay Cushing Energy Income Fund | | | | |
Class A | | $ | 64,763 | |
Investor Class | | | 5,116 | |
Class C | | | 39,914 | |
Class I | | | 24,783 | |
(E) Small Account Fee. Shareholders with small accounts adversely impact the cost of providing transfer agency services. In an effort to reduce total transfer agency expenses, the MainStay Cushing Funds have implemented a small account fee on certain types of accounts. Certain shareholders with an account balance of less than $1,000 are charged an annual per account fee of $20 (assessed semi-annually), the proceeds from which offset transfer agent fees as reflected in the Statement of Operations.
Note 4–Federal Income Tax
MainStay Cushing MLP Premier Fund
Deferred income taxes reflect the net tax effect of temporary differences between the carrying amount of assets and liabilities for financial reporting and tax purposes. Components of the MainStay Cushing MLP Premier Fund deferred tax assets as of May 31, 2016 are as follows:
| | | | |
MainStay Cushing MLP Premier Fund | |
Deferred tax assets: | | | | |
Net operating loss carryforward | | $ | 39,902,677 | |
Capital loss carryforward | | | 162,296,026 | |
| Total deferred tax assets | | | 202,198,703 | |
Less valuation allowance | | | 130,675,324 | |
Less deferred tax liabilities: | | | | |
Net unrealized appreciation on investments in securities | | | 71,523,379 | |
| Net deferred tax asset | | $ | — | |
The MainStay Cushing MLP Premier Fund periodically reviews the recoverability of its deferred tax asset, if any, based on the weight of available evidence. When assessing the recoverability of the MainStay Cushing MLP Premier Fund’s deferred tax asset, significant weight is given to the effects of potential future realized and unrealized gains on investments, and the period over which this deferred tax asset can be realized. Unexpected significant decreases in cash distributions from the MainStay Cushing MLP Premier Fund’s MLP investments or significant declines in the fair value of its investments may change the MainStay Cushing MLP Premier Fund’s assessment regarding the recoverability of its deferred tax assets and may result in a valuation allowance. The MainStay Cushing MLP Premier Fund will continue to assess the need to record a valuation allowance in the future. If a valuation allowance is required to reduce any deferred tax asset in the future, it could have a material impact on the MainStay Cushing MLP Premier Fund’s net asset value and results of operations in the period it is recovered.
The MainStay Cushing MLP Premier Fund may rely, to some extent, on information provided by the MLPs, which may not necessarily be timely, to estimate taxable income allocable to MLP units held in its portfolio, and to estimate its associated deferred tax benefit (liability). Such estimates are made in good faith. From time to time, as new information becomes available, the MainStay Cushing MLP Premier Fund will modify its estimates or assumptions regarding its tax benefit (liability).
The MainStay Cushing MLP Premier Fund’s net operating loss carryforward and capital loss carryforward are available to offset its future taxable income. For corporations, capital losses can only be used to offset capital gains and cannot be used to offset ordinary income. The capital loss may be carried forward for five years and, accordingly, would begin to expire as of November 30, 2020. The net operating loss can be carried forward for 20 years and, accordingly, would begin to expire as of November 30, 2032. The MainStay Cushing MLP Premier Fund has the following net operating loss carryover and capital loss carryover amounts:
| | | | | | |
| MainStay Cushing MLP Premier Fund |
Fiscal Year Ended
Net Operating Loss | | Amount | | | Expiration |
November 30, 2012 | | $ | 1,359,119 | | | November 30, 2032 |
| November 30, 2013 | | | 22,865,115 | | | November 30, 2033 |
| November 30, 2014 | | | 29,334,750 | | | November 30, 2034 |
| November 30, 2015 | | | 51,787,076 | | | November 30, 2035 |
| | | | | | |
| Total | | $ | 105,346,060 | | | |
| | | | | | |
| | |
| | | | | | |
Fiscal Year Ended Capital Loss | | Amount | | | Expiration |
November 30, 2015 | | $ | 93,603,558 | | | November 30, 2020 |
| November 30, 2016 | | | 341,230,659 | | | November 30, 2021 |
| | | | | | |
| Total | | $ | 434,834,217 | | | |
| | | | | | |
Total income tax benefit (current and deferred) differs from the amount computed by applying the federal statutory income tax rate of 35% to net investment income and realized and unrealized gains (losses) on investments before taxes for the six-months ended May 31, 2016, as follows:
| | | | |
| | | MainStay
Cushing MLP
Premier Fund | |
Income tax provision (benefit) at the federal statutory rate of 35% | | $ | (6,016,941 | ) |
| State income tax (benefit), net of federal benefit | | | (418,129 | ) |
| Permanent differences, net | | | (802,081 | ) |
| Change in valuation allowance | | | 7,237,151 | |
| | | | |
| Total tax expense (benefit) | | $ | — | |
| | | | |
MainStay Cushing Energy Income Fund
The MainStay Cushing Energy Income Fund intends to change its tax status from a taxable C corporation to a RIC under the Internal Revenue Code, effective December 1, 2015. The change in tax status requires the MainStay Cushing Energy Income Fund to satisfy certain periodic income and asset composition requirements as well as certain distribution requirements in order to permit it to be subject to tax as a RIC. The MainStay Cushing Energy Income Fund has determined that it is more likely than not that it will be able to qualify and elect to be subject to tax as a RIC, effective as of its fiscal year ending November 30, 2016.
Notes to Financial Statements (Unaudited) (continued)
The MainStay Cushing Energy Income Fund intends to elect to be subject to tax as a RIC in connection with the filing of its taxable year ending November 30, 2016 federal income tax return, and such election would be effective December 1, 2015. If the MainStay Cushing Energy Income Fund satisfies the required qualification tests and timely elects to be subject to tax as a RIC, it generally will not be subject to federal income or excise taxes on any income and gains timely distributed to its shareholders.
As of May 31, 2016, the MainStay Cushing Energy Income Fund had no tax expense recorded as the Fund is not expected to be subject to federal income or excise taxes during its fiscal year ending November 30, 2016.
Since the MainStay Cushing Energy Income Fund expects to qualify and elect to be subject to tax as a RIC for its fiscal year ending November 30, 2016 in connection with the filing of its taxable year ending November 30, 2016 federal income tax return, no portion of the $3,915,438 of net operating losses available for carryforward at November 30, 2015 will be available for future use.
As of November 30, 2015, for federal income tax purposes, capital loss carryforwards of $135,103,273 were available as shown in the table below, to the extent provided by the Internal Revenue Code, to offset future realized capital gains through the years indicated:
| | | | | | |
Fiscal Year Ended Capital Loss | | Amount | | | Expiration |
November 30, 2012 | | $ | 2,914 | | | November 30, 2017 |
| November 30, 2013 | | | 1,371,868 | | | November 30, 2018 |
| November 30, 2014 | | | 3,090,784 | | | November 30, 2019 |
| November 30, 2015 | | | 130,637,707 | | | November 30, 2020 |
| | | | | | |
| Total | | $ | 135,103,273 | | | |
| | | | | | |
MainStay Cushing Renaissance Advantage Fund
As of November 30, 2015, for federal income tax purposes, capital loss carryforwards of $66,717,722 were available as shown in the table below, to the extent provided by the Internal Revenue Code, to offset future realized capital gains through the years indicated.
| | | | | | | | |
Capital Loss
Available Through | | Short-Term Capital Loss
Amounts (000’s) | | | Long-Term Capital Loss
Amounts (000’s) | |
| Unlimited | | $ | 63,856 | | | $ | 2,862 | |
The tax character of distributions paid by the MainStay Cushing Funds during the year ended November 30, 2015 shown in the Statements of Changes in Net Assets was as follows:
| | | | | | | | | | | | |
| | | 2015 | | | | |
| | | Tax Based
Distributions
from Ordinary
Income | | | Tax Based
Distributions
from Return
of Capital | | | Total | |
MainStay Cushing MLP Premier Fund | | $ | — | | | $ | 125,762,721 | | | $ | 125,762,721 | |
MainStay Cushing Renaissance Advantage Fund | | | 457,435 | | | | 7,611,911 | | | | 8,069,346 | |
MainStay Cushing Energy Income Fund | | | — | | | | 19,295,711 | | | | 19,295,711 | |
Note 5–Custodian
U.S. Bank, N.A. is the custodian of cash and securities held by the MainStay Cushing Funds. Custodial fees are charged to the MainStay Cushing Funds based on the MainStay Cushing Fund’s net assets and/or the market value of securities held by the MainStay Cushing Funds and the number of certain cash transactions incurred by the MainStay Cushing Funds.
Note 6–Line of Credit
The MainStay Cushing Funds and certain affiliated funds, maintain a line of credit with a syndicate of banks in order to secure a source of funds for temporary purposes to meet unanticipated or excessive redemption requests.
Effective August 4, 2015, under an amended and restated credit agreement (the “Credit Agreement”), the aggregate commitment amount is $600,000,000 with an additional uncommitted aggregate amount of $100,000,000. The commitment fee is an annual rate of 0.10% of the average commitment amount payable quarterly, regardless of usage, to Bank of New York Mellon, who serves as the agent to the syndicate. The commitment fee is allocated among the MainStay Cushing Funds and certain affiliated funds based upon their respective net assets and other factors. Interest on any revolving credit loan is charged based upon the Federal Funds Advances Rate or the one month London InterBank Offered Rate, whichever is higher. The Credit Agreement expires on August 2, 2016, although the Funds, certain affiliated funds and the syndicate of banks may renew the Credit Agreement for an additional year on the same or different terms. Prior to August 4, 2015, the aggregate commitment amount was $600,000,000 with an additional uncommitted amount of $100,000,000, and the commitment fee was at an annual rate of 0.08% of the average commitment amount. There were no borrowings made or outstanding with respect to any of the Funds under the Credit Agreement during the period ended May 31, 2016.
Note 7–Purchases and Sales of Securities (in 000’s)
For the six-months ended May 31, 2016, purchases and sales of securities, other than short-term securities, were as follows:
| | | | | | | | |
| | | Purchases | | | Sales | |
MainStay Cushing MLP Premier Fund | | $ | 415,964 | | | $ | 468,720 | |
MainStay Cushing Renaissance Advantage Fund | | | 285,909 | | | | 307,521 | |
MainStay Cushing Energy Income Fund | | | 27,115 | | | | 43,707 | |
| | |
| 56 | | MainStay Cushing Funds |
Note 8–Capital Share Transactions
MainStay Cushing MLP Premier Fund
| | | | | | | | |
Class A | | Shares | | | Amount | |
Six-month period ended May 31, 2016: | | | | | | | | |
Shares sold | | | 4,583,287 | | | $ | 55,001,552 | |
Shares issued to shareholders in reinvestment of dividends and distributions | | | 1,022,128 | | | | 12,001,258 | |
Shares redeemed | | | (5,701,768 | ) | | | (67,968,545 | ) |
| | | | |
Net increase (decrease) in shares before conversion | | | (96,353 | ) | | | (965,735 | ) |
Shares converted into Class A (See Note 1) | | | 9,446 | | | | 110,518 | |
Shares converted from Class A (See Note 1) | | | (32,229 | ) | | | (356,770 | ) |
| | | | |
Net increase (decrease) | | | (119,136 | ) | | $ | (1,211,987 | ) |
| | | | |
Year ended November 30, 2015: | | | | | | | | |
Shares sold | | | 8,852,245 | | | $ | 173,834,708 | |
Shares issued to shareholders in reinvestment of dividends and distributions | | | 1,386,793 | | | | 26,302,684 | |
Shares redeemed | | | (12,249,286 | ) | | | (235,291,686 | ) |
| | | | |
Net increase (decrease) in shares before conversion | | | (2,010,248 | ) | | | (35,154,294 | ) |
Shares converted into Class A (See Note 1) | | | 10,947 | | | | 227,801 | |
Shares converted from Class A (See Note 1) | | | (36,070 | ) | | | (614,337 | ) |
| | | | |
Net increase (decrease) | | | (2,035,371 | ) | | $ | (35,540,830 | ) |
| | | | |
| | |
| | | | | | | | |
Investor Class | | Shares | | | Amount | |
Six-month period ended May 31, 2016: | | | | | | | | |
Shares sold | | | 89,533 | | | $ | 1,066,058 | |
Shares issued to shareholders in reinvestment of dividends and distributions | | | 11,620 | | | | 138,490 | |
Shares redeemed | | | (35,395 | ) | | | (424,183 | ) |
| | | | | | | | |
Net increase (decrease) in shares before conversion | | | 65,758 | | | | 780,365 | |
Shares converted into Investor Class (See Note 1) | | | 32,229 | | | | 356,770 | |
Shares converted from Investor Class (See Note 1) | | | (9,446 | ) | | | (110,518 | ) |
| | | | |
Net increase (decrease) | | | 88,541 | | | $ | 1,026,617 | |
| | | | | | | | |
Year ended November 30, 2015: | | | | | | | | |
Shares sold | | | 112,126 | | | $ | 2,257,859 | |
Shares issued to shareholders in reinvestment of dividends and distributions | | | 8,653 | | | | 159,342 | |
Shares redeemed | | | (23,241 | ) | | | (449,129 | ) |
| | | | |
Net increase (decrease) in shares before conversion | | | 97,538 | | | | 1,968,072 | |
Shares converted into Investor Class (See Note 1) | | | 36,070 | | | | 614,337 | |
Shares converted from Investor Class (See Note 1) | | | (10,947 | ) | | | (227,801 | ) |
| | | | |
Net increase (decrease) | | | 122,661 | | | $ | 2,354,608 | |
| | | | |
| | | | | | | | |
Class C | | Shares | | | Amount | |
Six-month period ended May 31, 2016: | | | | | | | | |
Shares sold | | | 5,935,823 | | | $ | 67,655,708 | |
Shares issued to shareholders in reinvestment of dividends and distributions | | | 2,140,126 | | | | 23,872,736 | |
Shares redeemed | | | (9,552,865 | ) | | | (108,312,660 | ) |
| | | | |
Net increase (decrease) | | | (1,476,916 | ) | | $ | (16,784,216 | ) |
| | | | | | | | |
Year ended November 30, 2015: | | | | | | | | |
Shares sold | | | 9,207,415 | | | $ | 172,131,750 | |
Shares issued to shareholders in reinvestment of dividends and distributions | | | 2,879,975 | | | | 52,076,346 | |
Shares redeemed | | | (12,205,895 | ) | | | (217,409,245 | ) |
| | | | |
Net increase (decrease) | | | (118,505 | ) | | $ | 6,798,851 | |
| | | | |
| | |
| | | | | | | | |
Class I | | Shares | | | Amount | |
Six-month period ended May 31, 2016: | | | | | | | | |
Shares sold | | | 14,577,699 | | | $ | 175,129,530 | |
Shares issued to shareholders in reinvestment of dividends and distributions | | | 1,711,612 | | | | 20,399,896 | |
Shares redeemed | | | (15,964,645 | ) | | | (192,081,019 | ) |
| | | | |
Net increase (decrease) | | | 324,666 | | | $ | 3,448,407 | |
| | | | |
Year ended November 30, 2015: | | | | | | | | |
Shares sold | | | 21,188,120 | | | $ | 405,334,811 | |
Shares issued to shareholders in reinvestment of dividends and distributions | | | 2,017,902 | | | | 38,431,781 | |
Shares redeemed | | | (18,454,724 | ) | | | (350,776,683 | ) |
| | | | |
Net increase (decrease) | | | 4,751,298 | | | $ | 92,989,909 | |
| | | | |
MainStay Cushing Renaissance Advantage Fund
| | | | | | | | |
Class A | | Shares | | | Amount | |
Six-month period ended May 31, 2016: | | | | | | | | |
Shares sold | | | 202,842 | | | $ | 3,420,059 | |
Shares issued to shareholders in reinvestment of dividends and distributions | | | 31,169 | | | | 516,578 | |
Shares redeemed | | | (430,856 | ) | | | (7,074,435 | ) |
| | | | |
Net increase (decrease) in shares before conversion | | | (196,845 | ) | | | (3,137,798 | ) |
Shares converted into Class A (See Note 1) | | | 5,680 | | | | 98,722 | |
Shares converted from Class A (See Note 1) | | | (6,973 | ) | | | (117,009 | ) |
| | | | |
Net increase (decrease) | | | (198,138 | ) | | $ | (3,156,085 | ) |
| | | | |
Year ended November 30, 2015: | | | | | | | | |
Shares sold | | | 1,183,043 | | | $ | 25,949,416 | |
Shares issued to shareholders in reinvestment of dividends and distributions | | | 56,416 | | | | 1,176,048 | |
Shares redeemed | | | (1,205,869 | ) | | | (25,461,423 | ) |
| | | | |
Net increase (decrease) in shares before conversion | | | 33,590 | | | | 1,664,041 | |
Shares converted into Class A (See Note 1) | | | 10,014 | | | | 226,475 | |
Shares converted from Class A (See Note 1) | | | (25,675 | ) | | | (503,253 | ) |
| | | | |
Net increase (decrease) | | | 17,929 | | | $ | 1,387,263 | |
| | | | |
Notes to Financial Statements (Unaudited) (continued)
| | | | | | | | |
Investor Class | | Shares | | | Amount | |
Six-month period ended May 31, 2016: | | | | | | | | |
Shares sold | | | 48,700 | | | $ | 805,487 | |
Shares issued to shareholders in reinvestment of dividends and distributions | | | 2,780 | | | | 46,494 | |
Shares redeemed | | | (20,043 | ) | | | (334,200 | ) |
| | | | | | | | |
Net increase (decrease) in shares before conversion | | | 31,437 | | | | 517,781 | |
Shares converted into Investor Class (See Note 1) | | | 6,977 | | | | 117,009 | |
Shares converted from Investor Class (See Note 1) | | | (5,687 | ) | | | (98,722 | ) |
| | | | |
Net increase (decrease) | | | 32,727 | | | $ | 536,068 | |
| | | | | | | | |
Year ended November 30, 2015: | | | | | | | | |
Shares sold | | | 91,536 | | | $ | 1,967,027 | |
Shares issued to shareholders in reinvestment of dividends and distributions | | | 3,232 | | | | 66,683 | |
Shares redeemed | | | (23,127 | ) | | | (486,823 | ) |
| | | | |
Net increase (decrease) in shares before conversion | | | 71,641 | | | | 1,546,887 | |
Shares converted into Investor Class (See Note 1) | | | 25,671 | | | | 503,253 | |
Shares converted from Investor Class (See Note 1) | | | (10,011 | ) | | | (226,475 | ) |
| | | | |
Net increase (decrease) | | | 87,301 | | | $ | 1,823,665 | |
| | | | |
| | |
| | | | | | | | |
Class C | | Shares | | | Amount | |
Six-month period ended May 31, 2016: | | | | | | | | |
Shares sold | | | 316,993 | | | $ | 5,229,925 | |
Shares issued to shareholders in reinvestment of dividends and distributions | | | 23,754 | | | | 382,774 | |
Shares redeemed | | | (780,025 | ) | | | (12,392,197 | ) |
| | | | |
Net increase (decrease) | | | (439,278 | ) | | $ | (6,779,498 | ) |
| | | | | | | | |
Year ended November 30, 2015: | | | | | | | | |
Shares sold | | | 830,996 | | | $ | 17,450,401 | |
Shares issued to shareholders in reinvestment of dividends and distributions | | | 44,954 | | | | 923,053 | |
Shares redeemed | | | (1,007,570 | ) | | | (20,752,873 | ) |
| | | | |
Net increase (decrease) | | | (131,620 | ) | | $ | (2,379,419 | ) |
| | | | |
| | | | | | | | |
Class I | | Shares | | | Amount | |
Six-month period ended May 31, 2016: | | | | | | | | |
Shares sold | | | 1,248,820 | | | $ | 20,314,117 | |
Shares issued to shareholders in reinvestment of dividends and distributions | | | 100,300 | | | | 1,673,466 | |
Shares redeemed | | | (1,896,962 | ) | | | (31,326,336 | ) |
| | | | |
Net increase (decrease) | | | (547,842 | ) | | $ | (9,338,753 | ) |
| | | | |
Year ended November 30, 2015: | | | | | | | | |
Shares sold | | | 6,190,512 | | | $ | 132,902,705 | |
Shares issued to shareholders in reinvestment of dividends and distributions | | | 244,706 | | | | 5,197,886 | |
Shares redeemed (a) | | | (13,148,112 | ) | | | (287,072,397 | ) |
| | | | |
Net increase (decrease) | | | (6,712,894 | ) | | $ | (148,971,806 | ) |
| | | | |
| (a) | Includes an in-kind redemption in the amount of $106,860,629 during the year ended November 30, 2015 (See Note 9). |
MainStay Cushing Energy Income Fund
| | | | | | | | |
Class A | | Shares | | | Amount | |
Six-month period ended May 31, 2016: | | | | | | | | |
Shares sold | | | 1,563,627 | | | $ | 5,640,028 | |
Shares issued to shareholders in reinvestment of dividends and distributions | | | 625,752 | | | | 2,122,125 | |
Shares redeemed | | | (2,507,638 | ) | | | (9,449,630 | ) |
| | | | |
Net increase (decrease) in shares before conversion | | | (318,259 | ) | | | (1,687,477 | ) |
Shares converted into Class A (See Note 1) | | | 81,925 | | | | 301,485 | |
Shares converted from Class A (See Note 1) | | | (81,755 | ) | | | (291,864 | ) |
| | | | |
Net increase (decrease) | | | (318,089 | ) | | $ | (1,677,856 | ) |
| | | | |
Year ended November 30, 2015: | | | | | | | | |
Shares sold | | | 7,603,673 | | | $ | 72,399,720 | |
Shares issued to shareholders in reinvestment of dividends and distributions | | | 1,018,316 | | | | 7,714,694 | |
Shares redeemed | | | (9,111,676 | ) | | | (80,018,612 | ) |
| | | | |
Net increase (decrease) in shares before conversion | | | (489,687 | ) | | | 95,802 | |
Shares converted into Class A (See Note 1) | | | 23,156 | | | | 200,767 | |
Shares converted from Class A (See Note 1) | | | (137,914 | ) | | | (967,494 | ) |
| | | | |
Net increase (decrease) | | | (604,445 | ) | | $ | (670,925 | ) |
| | | | |
| | |
| 58 | | MainStay Cushing Funds |
| | | | | | | | |
Investor Class | | Shares | | | Amount | |
Six-month period ended May 31, 2016: | | | | | | | | |
Shares sold | | | 260,402 | | | $ | 948,046 | |
Shares issued to shareholders in reinvestment of dividends and distributions | | | 37,730 | | | | 128,773 | |
Shares redeemed | | | (102,564 | ) | | | (406,564 | ) |
| | | | | | | | |
Net increase (decrease) in shares before conversion | | | 195,568 | | | | 670,255 | |
Shares converted into Investor Class (See Note 1) | | | 81,984 | | | | 291,864 | |
Shares converted from Investor Class (See Note 1) | | | (81,925 | ) | | | (301,485 | ) |
| | | | |
Net increase (decrease) | | | 195,627 | | | $ | 660,634 | |
| | | | | | | | |
Year ended November 30, 2015: | | | | | | | | |
Shares sold | | | 348,203 | | | $ | 3,011,717 | |
Shares issued to shareholders in reinvestment of dividends and distributions | | | 34,560 | | | | 240,717 | |
Shares redeemed | | | (51,759 | ) | | | (383,302 | ) |
| | | | |
Net increase (decrease) in shares before conversion | | | 331,004 | | | | 2,869,132 | |
Shares converted into Investor Class (See Note 1) | | | 137,914 | | | | 967,494 | |
Shares converted from Investor Class (See Note 1) | | | (23,211 | ) | | | (200,767 | ) |
| | | | |
Net increase (decrease) | | | 445,707 | | | $ | 3,635,859 | |
| | | | |
| | |
| | | | | | | | |
Class C | | Shares | | | Amount | |
Six-month period ended May 31, 2016: | | | | | | | | |
Shares sold | | | 551,123 | | | $ | 1,963,339 | |
Shares issued to shareholders in reinvestment of dividends and distributions | | | 319,216 | | | | 1,040,288 | |
Shares redeemed | | | (1,488,645 | ) | | | (5,446,098 | ) |
| | | | |
Net increase (decrease) | | | (618,306 | ) | | $ | (2,442,471 | ) |
| | | | | | | | |
Year ended November 30, 2015: | | | | | | | | |
Shares sold | | | 3,870,735 | | | $ | 36,589,735 | |
Shares issued to shareholders in reinvestment of dividends and distributions | | | 527,097 | | | | 3,812,461 | |
Shares redeemed | | | (2,997,312 | ) | | | (23,353,763 | ) |
| | | | |
Net increase (decrease) | | | 1,400,520 | | | $ | 17,048,433 | |
| | | | |
| | |
| | | | | | | | |
Class I | | Shares | | | Amount | |
Six-month period ended May 31, 2016: | | | | | | | | |
Shares sold | | | 647,502 | | | $ | 2,482,485 | |
Shares issued to shareholders in reinvestment of dividends and distributions | | | 251,611 | | | | 858,202 | |
Shares redeemed | | | (3,283,464 | ) | | | (12,416,490 | ) |
| | | | |
Net increase (decrease) | | | (2,384,351 | ) | | $ | (9,075,803 | ) |
| | | | |
Year ended November 30, 2015: | | | | | | | | |
Shares sold | | | 9,620,946 | | | $ | 91,780,518 | |
Shares issued to shareholders in reinvestment of dividends and distributions | | | 736,692 | | | | 5,798,099 | |
Shares redeemed | | | (12,393,613 | ) | | | (107,444,571 | ) |
| | | | |
Net increase (decrease) | | | (2,035,975 | ) | | $ | (9,865,954 | ) |
| | | | |
Note 9–In Kind Transfer of Securities
During the year ended November 30, 2015, the MainStay Cushing Renaissance Advantage Fund redeemed shares of beneficial interest in exchange for securities. The securities were transferred at their current value on the date of transaction.
| | | | | | | | | | | | |
Transaction Date | | Shares | | | Value | | | Gain (Loss) | |
4/30/2015 | | | 4,707,392 | | | $ | 106,860,629 | | | $ | (2,678,381 | ) |
Note 10–Subsequent Events
In connection with the preparation of the financial statements of the MainStay Cushing Funds as of and for the six-month period ended May 31, 2016, events and transactions subsequent to May 31, 2016, through the date the financial statements were issued have been evaluated by the MainStay Cushing Funds’ management for possible adjustment and/or disclosure. No subsequent events requiring financial statement adjustment or disclosure have been identified other than the notice of quarterly distributions declared by the MainStay Cushing Funds.
On July 22, 2016 the MainStay Cushing MLP Premier Fund declared a distribution payable of $0.335 per share, to Class A shareholders, Investor Class shareholders, Class C shareholders and Class I shareholders of record on July 21, 2016, and payable on July 22, 2016.
On July 22, 2016 the MainStay Cushing Renaissance Advantage Fund declared a distribution payable of $0.14 per share, to Class A shareholders, Investor Class shareholders, Class C shareholders and Class I shareholders of record on July 21, 2016, and payable on July 22, 2016.
On July 22, 2016 the MainStay Cushing Energy Income Fund declared distributions of $0.046, 0.046, 0.039 and 0.049 per share, to Class A shareholders, Investor Class shareholders, Class C shareholders and Class I shareholders of record on July 21, 2016, and payable on July 22, 2016.
Board Consideration and Approval of Management Agreement and
Subadvisory Agreement (Unaudited)
Section 15 of the Investment Company Act of 1940, as amended (the “1940 Act”), requires that each mutual fund’s board of trustees annually review and approve the fund’s investment advisory agreement(s). At its December 8-10, 2015 meeting, the Board of Trustees of the MainStay Group of Funds (“Board”) unanimously approved the Management Agreement with respect to the MainStay Cushing MLP Premier Fund, MainStay Cushing Renaissance Advantage Fund and MainStay Cushing Energy Income Fund (formerly, MainStay Cushing Royalty Energy Income Fund) (the “Funds”) and New York Life Investment Management LLC (“New York Life Investments”) and the Subadvisory Agreement between New York Life Investments and Cushing Asset Management, LP (“Cushing”) with respect to the Funds.
In reaching its decision to approve the Agreements, the Board considered information furnished by New York Life Investments and Cushing in connection with a contract review process that took place at various meetings of the Board and its Contracts Committee between September 2015 and December 2015, as well as other relevant information furnished to the Board throughout the year. Information requested by and furnished to the Board in connection with the contract review process included, among other items, reports on the Funds and “peer funds” prepared by Strategic Insight Mutual Fund Research and Consulting, LLC (“Strategic Insight”), an independent third-party service provider engaged by the Board to report objectively on the Funds’ investment performance, management fee and total expenses. The Board also considered information on the fees charged to any other investment advisory clients of New York Life Investments and Cushing (including institutional separate accounts) that follow investment strategies similar to the Funds and the rationale for any differences in the Funds’ management and subadvisory fees and the fees charged to those other investment advisory clients. In addition, the Board requested and received information on the profitability of the Funds to New York Life Investments and its affiliates and Cushing and responses from New York Life Investments and Cushing to a series of questions encompassing a variety of topics prepared on behalf of the Board by independent legal counsel to the Board and its Trustees who are not “interested persons” (as such term is defined under the 1940 Act) of the Funds (the “Independent Trustees”). Information provided to the Board at its meetings throughout the year included, among other items, detailed investment performance reports on the Funds prepared by the Investment Consulting Group at New York Life Investments. The structure and format for this regular reporting were developed in consultation with the Board. The Board also received from New York Life Investments throughout the year, among other items, periodic reports on legal and compliance matters, risk management, portfolio turnover, and sales and marketing activity. At various meetings, the Independent Trustees also met in executive session with their independent legal counsel, and met with senior management of New York Life Investments without other representatives of New York Life Investments present.
Throughout the year and specifically in connection with its June meeting each year, the Board also received an overview of the Funds’ distribution arrangements. In addition, the Board received information regarding the Funds’ asset levels, share purchase and redemption activity and the payment of Rule 12b-1 distribution and service fees by the Funds. New York Life Investments also provided the Board with information regarding the revenue sharing payments made to intermediaries that promote the sale, distribution, and/or servicing of the Funds’ shares.
In considering the Agreements, the Trustees comprehensively reviewed and evaluated all of the information and factors they believed to be relevant and appropriate in light of legal advice furnished to them by independent legal counsel and through the exercise of their own business judgment. The broad factors considered by the Board are described in greater detail below and included, among other items: (i) the nature, extent and quality of the services provided to the Funds by New York Life Investments and Cushing; (ii) the investment performance of the Funds, New York Life Investments and Cushing; (iii) the costs of the services provided, and profits realized, by New York Life Investments and Cushing from their relationships with the Funds; (iv) the extent to which economies of scale have been realized or may be realized if the Funds grow and the extent to which economies of scale have benefited or may benefit the Funds’ shareholders; and (v) the reasonableness of the Funds’ management and subadvisory fees and overall total ordinary operating expenses, particularly as compared to any similar funds and accounts managed by New York Life Investments and Cushing. The Board also considered the reasonableness of the Funds’ management fees and overall total ordinary operating expenses as compared to the peer funds identified by Strategic Insight.
While individual Trustees may have weighed certain factors or information differently, the Board’s decision to approve the Agreements was based on a consideration of the information provided to the Trustees throughout the year, as well as information furnished specifically in connection with the contract review process. The Board’s conclusions with respect to the Agreements may have been based, in part, on the Board’s consideration of the MainStay Group of Funds’ advisory agreements in prior years. In addition to considering the above-referenced factors, the Board observed that in the marketplace there are a range of investment options available to shareholders of the Funds and that the Funds’ shareholders, having had the opportunity to consider other investment options, have chosen to invest in the Funds. The factors that figured prominently in the Board’s decision to approve the Agreements are summarized in more detail below.
Nature, Extent and Quality of Services to Be Provided by New York Life Investments and Cushing
The Board examined the nature, extent and quality of the services that New York Life Investments provides to the Funds. The Board evaluated New York Life Investments’ experience and capabilities in serving as manager of the Funds, noting that New York Life Investments manages other mutual funds, serves a variety of other investment advisory clients, including other pooled investment vehicles, and has experience with overseeing mutual fund service providers, including subadvisors. The Board considered the experience of senior personnel at New York Life Investments providing management and administrative services to the Funds as well as New York Life Investments’ reputation and financial condition. The Board also considered the full range of services that New York Life Investments supplies to the Funds under the terms of the Management Agreements, including: (i) fund accounting and on-going oversight services provided by New York Life Investments’ Fund Administration and Accounting Group; (ii) investment oversight and analytical services provided by New York Life Investments’ Investment Consulting Group; (iii) compliance services provided by the Funds’ Chief Compliance Officer as well as New York Life Investments’ Compliance Department, including oversight and implementation of the Funds’ compliance pro-
| | |
| 60 | | MainStay Cushing Funds |
gram; (iv) legal services provided by New York Life Investments’ Office of the General Counsel; and (v) risk management and portfolio trading oversight and analysis by compliance and investment personnel. Additional information about the non-advisory services provided by New York Life Investments is set forth in the Funds’ Management Agreements. The Board also considered New York Life Investments’ willingness to invest in personnel, infrastructure, technology, operational enhancements, cyber security, information security and shareholder privacy resources that benefit the Funds and noted that New York Life Investments is responsible for compensating the Funds’ officers. The Board also considered benefits to shareholders of being part of the MainStay Group of Funds, including the privilege of exchanging investments between the same class of shares without the imposition of a sales charge, as described more fully in the Funds’ prospectus.
The Board also examined the nature, extent and quality of the investment advisory services that Cushing provides to the Funds. The Board evaluated Cushing’s experience in serving as subadvisor to the Funds and managing other portfolios. It examined Cushing’s track records and experience in providing investment advisory services, the experience of investment advisory, senior management and administrative personnel at Cushing, and Cushing’s overall legal and compliance environment. The Board further considered New York Life Investments’ policies, procedures and systems to reasonably assure compliance with applicable laws and regulations. In addition, the Board considered the policies and procedures in place with respect to matters that may involve conflicts of interest between the Funds’ investments and those of other accounts managed by Cushing. The Board also reviewed Cushing’s willingness to invest in personnel that benefit the Funds. In this regard, the Board considered the experience of the Funds’ portfolio managers, the number of accounts managed by the portfolio managers and the method for compensating portfolio managers.
Based on these considerations, the Board concluded, within the context of its overall determinations regarding the Agreements, that the Funds should continue to benefit from the nature, extent and quality of these services as a result of New York Life Investments’ and Cushing’s experience, personnel, operations and resources.
Investment Performance
In evaluating the Funds’ investment performance, the Board considered investment performance results in light of the Funds’ investment objectives, strategies and risks, as disclosed in the Funds’ prospectus. The Board particularly considered detailed investment reports on the Funds’ performance provided to the Board throughout the year by the Investment Consulting Group of New York Life Investments. These reports include, among other items, information on the Funds’ gross and net returns, the Funds’ investment performance relative to relevant investment categories and the Funds’ benchmarks, the Funds’ risk-adjusted investment performance and the Funds’ investment performance as compared to peer funds, as appropriate, and in light of market conditions. The Board also considered information provided by Strategic Insight showing the investment performance of the Funds as compared to peer funds.
In considering the Funds’ investment performance, the Board focused principally on the long-term performance track records of the Funds and
their respective predecessor Funds. The Board also gave weight to its ongoing discussions with senior management at New York Life Investments concerning the Funds’ investment performance as well as discussions between the Funds’ portfolio managers and the Board’s Investment Committee that occur regularly, generally on an annual basis, and with the Board’s Alternative and Closed-End Funds Oversight Committee that occur regularly with respect to the Funds. In addition, the Board considered any specific actions that New York Life Investments or Cushing had taken, or had agreed with the Board to take, to enhance Fund investment performance and the results of those actions. The Board noted that the Funds had recently underperformed relative to peers and considered its discussions with representatives from New York Life Investments regarding such underperformance and the volatility of the energy markets.
Based on these considerations, the Board concluded, within the context of its overall determinations regarding the Agreements, that the long-term investment performance of the Funds, along with ongoing efforts by New York Life Investments and Cushing to enhance investment returns, supported a determination to approve the Agreements. The Funds disclose more information about investment performance in the Portfolio Management Discussion and Analysis, Investment and Performance Comparison and Financial Highlights sections of this Semiannual Report and in the Funds’ prospectus.
Costs of the Services Provided, and Profits Realized, by New York Life Investments and Cushing
The Board considered the costs of the services provided by New York Life Investments and Cushing under the Agreements and the profits realized by New York Life Investments and its affiliates and Cushing due to their relationships with the Funds. Because Cushing’s subadvisory fees are negotiated at arm’s-length by New York Life Investments and are paid by New York Life Investments, not the Funds, the Board primarily considered the profits realized by New York Life Investments and its affiliates with respect to the Funds.
In evaluating the costs of the services provided by New York Life Investments and Cushing and profits realized by New York Life Investments and its affiliates and Cushing, the Board considered, among other factors, each party’s investments in personnel, systems, equipment and other resources necessary to manage the Funds, and that New York Life Investments is responsible for paying the subadvisory fees for the Funds. The Board acknowledged that New York Life Investments and Cushing must be in a position to pay and retain experienced professional personnel to provide services to the Funds and that the ability to maintain a strong financial position is important in order for New York Life Investments and Cushing to continue to provide high-quality services to the Funds. The Board also recognized that the Funds benefit from the allocation of certain fixed costs across the MainStay Group of Funds, among other benefits resulting from their relationships with New York Life Investments.
In addition, the Board acknowledged the difficulty in obtaining reliable comparative data about mutual fund managers’ profitability, since such information generally is not publicly available and may be impacted by numerous factors, including the structure of a fund manager’s organization, the types of funds it manages, the methodology used to allocate certain fixed costs to specific funds, and the manager’s capital structure and costs of capital. In connection with the annual fund profit-
Board Consideration and Approval of Management Agreement and
Subadvisory Agreement (Unaudited) (continued)
ability analysis that New York Life Investments presents to the Board, the Board in 2014 engaged Bobroff Consulting, Inc., an independent third-party consultant, to review the methods used to allocate costs to the MainStay Funds, and among individual Funds. As part of this engagement, the consultant analyzed: (i) the various New York Life Investments’ business units and affiliated Subadvisers that provide services to the MainStay Funds; (ii) how costs are allocated to the Funds and other funds managed by New York Life Investments, and to other lines of businesses; and (iii) how New York Life Investments’ cost allocation methods and profitability reports compare to industry practices. The Board noted that the independent consultant had concluded that New York Life Investments’ methods for allocating costs and procedures for estimating overall profitability of the funds in the MainStay Group of Funds, including the Funds, are reasonable, consistent with industry practice and likely to produce reasonable profitability estimates. While recognizing the difficulty in evaluating a manager’s profitability with respect to the Funds and noting that other profitability methodologies may also be reasonable, the Board concluded that the profitability methodology presented by New York Life Investments to the Board was reasonable in all material respects.
In considering the costs and profitability of the Funds, the Board also considered certain fall-out benefits that may be realized by New York Life Investments and its affiliates due to their relationships with the Funds. The Board recognized, for example, the benefits to Cushing from legally permitted “soft-dollar” arrangements by which brokers provide research and other services to Cushing in exchange for commissions paid by the Fund with respect to trades on the Fund’s portfolio securities. In this regard, the Board also requested and received information from New York Life Investments and Cushing concerning other business relationships between Cushing and its affiliates and New York Life Investments and its affiliates.
The Board further considered that, in addition to fees earned by New York Life Investments for managing the Funds, New York Life Investments’ affiliates also earn revenues from serving the Funds in various other capacities, including as the Funds’ transfer agent and distributor. The Board observed that information about these other revenues, and their impact on the profitability of the Funds to New York Life Investments and its affiliates, was furnished to the Board as part of the 15(c) process. The Board noted that, although it assessed the overall profitability of the Funds to New York Life Investments and its affiliates as part of the contract review process, when considering the reasonableness of the fees to be paid to New York Life Investments and its affiliates under the Agreements, the Board considered the profitability of New York Life Investments’ relationships with the Funds on a pre-tax basis and without regard to distribution expenses.
After evaluating the information presented to the Board, the Board concluded, within the context of its overall determinations regarding the Agreements, that any profits realized by New York Life Investments and its affiliates due to their relationships with the Funds supported the Board’s decision to approve the Agreements. With respect to Cushing, the Board concluded that any profits realized by Cushing due to its relationship with the Funds are the result of arm’s-length negotiations between New York Life Investments and Cushing and are based on fees paid to Cushing by New York Life Investments, not the Funds.
Extent to Which Economies of Scale May Be Realized as the Funds Grow
The Board considered whether the Funds’ expense structures permit economies of scale to be shared with the Funds’ investors. The Board also considered a report from New York Life Investments, prepared at the request of the Board, that addressed economies of scale in the mutual fund business generally, the changing economics of the mutual fund business and the various ways in which the benefits of economies of scale may be shared with the Funds and other funds in the MainStay Group of Funds. While recognizing the difficulty of determining economies of scale with precision, the Board acknowledged that economies of scale may be shared with the Funds in a number of ways, including, for example, through the imposition of management fee breakpoints and by initially setting relatively low management fees. The Board reviewed information from New York Life Investments showing how the Funds’ management fee schedules compared to fee schedules of other funds and accounts managed by New York Life Investments. The Board also reviewed information from Strategic Insight showing how the Funds’ management fee schedules hypothetically would compare with fees paid for similar services by peer funds at varying asset levels. Additionally, the Board considered New York Life Investments’ assessment of the extent economies of scale existed for Funds that had experienced significant increases of assets during the year.
Based on this information, the Board concluded, within the context of its overall determinations regarding the Agreements, that the Funds’ expense structures appropriately reflect economies of scale for the benefit of the Funds’ investors. The Board noted, however, that it would continue to evaluate the reasonableness of the Funds’ expense structures as the Funds grow over time.
Management and Subadvisory Fees and Total Ordinary Operating Expenses
The Board evaluated the reasonableness of the fees to be paid under the Agreements and the Funds’ expected total ordinary operating expenses. The Board primarily considered the reasonableness of the management fees paid by the Funds to New York Life Investments, because the fees paid to Cushing are paid by New York Life Investments, not the Funds.
In assessing the reasonableness of the Funds’ fees and expenses, the Board primarily considered comparative data provided by Strategic Insight on the fees and expenses charged by similar mutual funds managed by other investment advisers. In addition, the Board considered information provided by New York Life Investments and Cushing on fees charged to other investment advisory clients, including institutional separate accounts and other funds with similar investment objectives as the Funds. The Board particularly considered differences in the contractual management fee schedules of the retail MainStay Funds and similarly-managed MainStay VP Portfolios, taking into account New York Life Investments’ rationale for any differences in fee schedules. The Board also took into account explanations provided by New York Life Investments about the different scope of services provided to registered investment companies as compared with other investment advisory clients. Additionally, the Board considered the impact of any contractual breakpoints, voluntary waivers and expense limitation arrangements on the Funds’ net management fee and expenses. The Board noted favor-
| | |
| 62 | | MainStay Cushing Funds |
ably that New York Life Investments had proposed to extend the period of Cushing Energy Income Fund’s contractual expense limitation for an additional year. The Board also noted that New York Life Investments proposed to add a new management fee breakpoint for MainStay Cushing MLP Premier Fund. In addition, the Board considered and approved New York Life Investments’ proposal to remove MainStay Cushing MLP Premier Fund’s contractual expense limitation arrangement, observing that the Fund’s total expenses were below the limit provided for under the arrangement. With respect to MainStay Cushing Renaissance Advantage Fund, the Board noted favorably that New York Life Investments proposed to revise the Fund’s expense limitation arrangement to implement a lower limitation on expenses.
The Board noted that, outside of the Funds’ management fee and the fees charged under a share class’s Rule 12b-1 and/or shareholder services plans, a share class’s most significant “other expenses” are transfer agent fees. Transfer agent fees are charged to the Funds based on the number of shareholder accounts (a “per-account” fee) as compared with certain other fees (e.g., management fees), which are charged based on the Funds’ average net assets. The Board took into account information from New York Life Investments showing that the Funds’ transfer agent fee schedule is reasonable, including industry data demonstrating that the per-account fees that NYLIM Service Company LLC, the Funds’ transfer agent, charges the Funds are within the range of per-account fees charged by transfer agents to other mutual funds. In addition, the Board considered NYLIM Service Company LLC’s profitability in connection with the transfer agent services it provides to the Funds. The Board also noted information received from NYLIM Service Company LLC regarding the sub-transfer agency payments it made to intermediaries in connection with the services it provides to the Funds.
The Board considered that, because the Funds’ transfer agent fees are billed on a per-account basis, the impact of transfer agent fees on a share class’s expense ratio may be more significant in cases where the share class has a high number of accounts with limited assets (i.e., small accounts). The Board observed that transfer agent fees are a significant portion of total expenses of a number of funds in the MainStay Group of Funds. The impact of transfer agent fees on the expense ratios of these MainStay Funds tend to be greater than for other open-end retail funds, because the MainStay Group of Funds generally has a significant number of small accounts relative to competitor funds. The Board acknowledged the role that the MainStay Group of Funds historically has played in serving the investment needs of New York Life Insurance Company (“New York Life”) policyholders, who often maintain smaller account balances than other fund investors. The Board also recognized measures that it and New York Life Investments have taken in recent years to mitigate the effect of small accounts on the expense ratios of the Funds’ share classes, including: (i) encouraging New York Life agents to consolidate multiple small accounts held by the same investor into one MainStay Asset Allocation Fund account; (ii) introducing Investor Class shares for certain MainStay Funds in early 2008 to consolidate smaller account investors; (iii) closing small accounts with balances below $250 in Investor Class shares or $750 in all other classes of shares; (iv) eliminating an exception with no minimum investment amount with respect to AutoInvest accounts with subsequent monthly purchases of $100; (v) since 2007, charging an annual $20.00 small account fee on certain accounts with balances
below $1,000; and (vi) modifying the approach for billing transfer agent expenses to reduce the degree of subsidization by large accounts of smaller accounts. The Board also considered that NYLIM Service Company LLC had waived its cost of living adjustments in 2014, 2015 and 2016. In addition, the Board acknowledged New York Life Investments’ continued efforts to encourage intermediaries to consolidate small accounts in multiple Funds held by the same investor into a single Asset Allocation Fund account, if appropriate under the circumstances, in an effort to mitigate the effect of small accounts on the funds in the MainStay Group of Funds.
After considering all of the factors outlined above, the Board concluded that the Funds’ management and subadvisory fees and total ordinary operating expenses were within a range that is competitive and, within the context of the Board’s overall conclusions regarding the Agreements, support a conclusion that these fees and expenses are reasonable.
Conclusion
On the basis of the information and factors summarized above and the evaluation thereof, the Board as a whole, including the Independent Trustees who are not parties to the Agreements or “interested persons” of any such party voting separately, unanimously voted to approve the Agreements.
Proxy Voting Policies and Procedures and Proxy Voting Record (Unaudited)
A description of the policies and procedures that New York Life Investments uses to vote proxies related to the Funds’ securities is available without charge, upon request, (i) by visiting the Funds’ website at mainstayinvestments.com; and (ii) on the Securities and Exchange Commission’s (“SEC”) website at www.sec.gov.
The Funds are required to file with the SEC its proxy voting record for the 12-month period ending June 30 on Form N-PX. The Funds’ most recent Form N-PX is available free of charge upon request by calling 800-MAINSTAY (624-6782); visiting the Fund’s website at mainstayinvestments.com; or on the SEC’s website at www.sec.gov.
Shareholder Reports and Quarterly Portfolio Disclosure (Unaudited)
Each Cushing Fund is required to file its complete schedule of portfolio holdings with the SEC for its first and third fiscal quarters on Form N-Q. Each Cushing Fund’s Form N-Q is available without charge, on the SEC’s website at www.sec.gov or by calling MainStay Investments at 800-MAINSTAY (624-6782). You also can obtain and review copies of Form N-Q by visiting the SEC’s Public Reference Room in Washington, DC (information on the operation of the Public Reference Room may be obtained by calling 1-800-SEC-0330).
| | |
| 64 | | MainStay Cushing Funds |
This page intentionally left blank
This page intentionally left blank
MainStay Funds
MainStay offers a wide range of Funds for virtually any investment need. The full array of MainStay open-end offerings is listed here, with information about the manager, subadvisors, legal counsel and independent registered public accounting firms.
Equity
U.S. Equity
MainStay Common Stock Fund
MainStay Cornerstone Growth Fund
MainStay Epoch U.S. All Cap Fund
MainStay Epoch U.S. Equity Yield Fund
MainStay Epoch U.S. Small Cap Fund
MainStay ICAP Equity Fund
MainStay ICAP Select Equity Fund
MainStay Large Cap Growth Fund
MainStay MAP Fund
MainStay S&P 500 Index Fund
MainStay U.S. Equity Opportunities Fund
International/Global Equity
MainStay Emerging Markets Opportunities Fund
MainStay Epoch Capital Growth Fund
MainStay Epoch Global Choice Fund
MainStay Epoch Global Equity Yield Fund
MainStay Epoch International Small Cap Fund
MainStay ICAP International Fund
MainStay International Equity Fund
MainStay International Opportunities Fund
Income
Taxable Bond
MainStay Floating Rate Fund
MainStay Global High Income Fund
MainStay Government Fund
MainStay High Yield Corporate Bond Fund
MainStay High Yield Opportunities Fund
MainStay Indexed Bond Fund
MainStay Short Duration High Yield Fund
MainStay Total Return Bond Fund
MainStay Unconstrained Bond Fund
Municipal/Tax Advantaged Bond
MainStay California Tax Free Opportunities Fund1
MainStay High Yield Municipal Bond Fund
MainStay New York Tax Free Opportunities Fund2
MainStay Tax Advantaged Short Term Bond Fund
MainStay Tax Free Bond Fund
Money Market
MainStay Money Market Fund
Mixed Asset
MainStay Balanced Fund
MainStay Convertible Fund
MainStay Income Builder Fund
Alternative
MainStay Absolute Return Multi-Strategy Fund
MainStay Cushing Energy Income Fund
MainStay Cushing MLP Premier Fund
MainStay Cushing Renaissance Advantage Fund
Asset Allocation/Target Date
MainStay Conservative Allocation Fund
MainStay Growth Allocation Fund
MainStay Moderate Allocation Fund
MainStay Moderate Growth Allocation Fund
MainStay Retirement 2010 Fund
MainStay Retirement 2020 Fund
MainStay Retirement 2030 Fund
MainStay Retirement 2040 Fund
MainStay Retirement 2050 Fund
MainStay Retirement 2060 Fund
Manager
New York Life Investment Management LLC
New York, New York
Subadvisors
Candriam France S.A.S.3
Paris, France
Cornerstone Capital Management Holdings LLC3
New York, New York
Cornerstone Capital Management LLC3
Bloomington, Minnesota
Cushing Asset Management, LP
Dallas, Texas
Epoch Investment Partners, Inc.
New York, New York
Institutional Capital LLC3
Chicago, Illinois
MacKay Shields LLC3
New York, New York
Markston International LLC
White Plains, New York
NYL Investors LLC3
New York, New York
Winslow Capital Management LLC
Minneapolis, Minnesota
Legal Counsel
Dechert LLP
Independent Registered Public Accounting Firms
KPMG LLP
1. This Fund is only registered for sale in AZ, CA, NV, OR, UT, and WA.
2. This Fund is only registered for sale in CT, DE, FL, MA, NJ, NY, and VT.
3. An affiliate of New York Life Investment Management LLC.
Not part of the Semiannual Report
For more information
800-MAINSTAY (624-6782)
mainstayinvestments.com
MainStay Investments® is a registered service mark and name under which New York Life Investment Management LLC does business. MainStay Investments, an indirect subsidiary of New York Life Insurance Company, New York, NY 10010, provides investment advisory products and services. The MainStay Funds® are managed by New York Life Investment Management LLC and distributed through NYLIFE Distributors LLC, 30 Hudson Street, Jersey City, NJ 07302, a wholly owned subsidiary of New York Life Insurance Company. NYLIFE Distributors LLC is a Member FINRA/SIPC.
©2016 NYLIFE Distributors LLC. All rights reserved.
| | | | | | | | |
| Not FDIC/NCUA Insured | | Not a Deposit | | May Lose Value | | No Bank Guarantee | | Not Insured by Any Government Agency |
| | |
| 1699355 MS239-16 | | MSCU10-07/16 (NYLIM) NL266 |
Not applicable.
| Item 3. | Audit Committee Financial Expert. |
Not applicable.
| Item 4. | Principal Accountant Fees and Services. |
Not applicable.
| Item 5. | Audit Committee of Listed Registrants |
Not applicable.
| Item 6. | Schedule of Investments |
The Schedule of Investments is included as part of Item 1 of this report.
| Item 7. | Disclosure of Proxy Voting Policies and Procedures for Closed-End Management Investment Companies. |
Not applicable.
| Item 8. | Portfolio Managers of Closed-End Management Investment Companies. |
Not applicable.
| Item 9. | Purchases of Equity Securities by Closed-End Management Investment Company and Affiliated Purchasers. |
Not Applicable.
| Item 10. | Submission of Matters to a Vote of Security Holders. |
Since the Registrant’s last response to this Item, there have been no material changes to the procedures by which shareholders may recommend nominees to the Registrant’s Board of Trustees.
| Item 11. | Controls and Procedures. |
| (a) | Based on an evaluation of the Registrant’s Disclosure Controls and Procedures (as defined in Rule 30a-3(c) under the Investment Company Act of 1940) (the “Disclosure Controls”), as of a date within 90 days prior to the filing date (the “Filing Date”) of this Form N-CSR (the “Report”), the Registrant’s principal executive officer and principal financial officer have concluded that the Disclosure Controls are reasonably designed to ensure that information required to be disclosed by the Registrant in the Report is recorded, processed, summarized and reported by the Filing Date, including ensuring that information required to be disclosed in the Report is accumulated and communicated to the Registrant’s management, including the Registrant’s principal executive officer and principal financial officer, as appropriate to allow timely decisions regarding required disclosure. |
| (b) | There were no changes in the Registrant’s internal control over financial reporting (as defined in Rule 30a-3(d)) under the Investment Company Act of 1940 that occurred during the second fiscal quarter of the period covered by this report that has materially affected, or is reasonably likely to materially affect, the Registrant’s internal control over financial reporting. |
Item 12. Exhibits.
| (a) | Certifications of principal executive officer and principal financial officer as required by Rule 30a-2 under the Investment Company Act of 1940. |
| (b) | Certifications of principal executive officer and principal financial officer as required by Section 906 of the Sarbanes-Oxley Act of 2002. |
SIGNATURES
Pursuant to the requirements of the Securities Exchange Act of 1934 and the Investment Company Act of 1940, the Registrant has duly caused this Report to be signed on its behalf by the undersigned, thereunto duly authorized.
MAINSTAY FUNDS TRUST
| | |
| By: | | /s/ Stephen P. Fisher |
| | Stephen P. Fisher President and Principal Executive Officer |
| |
| Date: | | August 5, 2016 |
Pursuant to the requirements of the Securities Exchange Act of 1934 and the Investment Company Act of 1940, this Report has been signed below by the following persons on behalf of the Registrant and in the capacities and on the dates indicated.
| | |
| By: | | /s/ Stephen P. Fisher |
| | Stephen P. Fisher President and Principal Executive Officer |
| |
| Date: | | August 5, 2016 |
| |
| By: | | /s/ Jack R. Benintende |
| | Jack R. Benintende Treasurer and Principal Financial and Accounting Officer |
| |
| Date: | | August 5, 2016 |
EXHIBIT INDEX
| (a) | Certifications of principal executive officer and principal financial officer as required by Rule 30a-2 under the Investment Company Act of 1940. |
| (b) | Certification of principal executive officer and principal financial officer as required by Section 906 of the Sarbanes-Oxley Act of 2002. |