UNITED STATES
SECURITIES AND EXCHANGE COMMISSION
Washington, D.C. 20549
Form N-CSR
CERTIFIED SHAREHOLDER REPORT OF REGISTERED MANAGEMENT
INVESTMENT COMPANIES
Investment Company Act File Number 811-22321
MAINSTAY FUNDS TRUST
(Exact name of Registrant as specified in charter)
51 Madison Avenue, New York, NY 10010
(Address of principal executive offices) (Zip code)
J. Kevin Gao, Esq.
30 Hudson Street
Jersey City, New Jersey 07302
(Name and address of agent for service)
Registrant’s telephone number, including area code: (212) 576-7000
Date of fiscal year end: April 30
(MainStay Absolute Return Multi-Strategy Fund and MainStay MacKay Short Term Municipal Fund)
Date of reporting period: October 31, 2018
FORM N-CSR
The information presented in this Form N-CSR relates solely to the
MainStay Absolute Return Multi-Strategy Fund and MainStay MacKay Short Term Municipal
Fund, series of the Registrant.
Item 1. Reports to Stockholders.
MainStay MacKay Short Term Municipal Fund
(Formerly known as MainStay MacKay Tax Advantaged Short Term Bond Fund)
Message from the President and Semiannual Report
Unaudited | October 31, 2018

| | | | | | | | |
| Not FDIC/NCUA Insured | | Not a Deposit | | May Lose Value | | No Bank Guarantee | | Not Insured by Any Government Agency |

This page intentionally left blank
Message from the President
U.S. stocks provided mixed returns during the six months ended October 31, 2018.
Within the U.S. stock market, large-cap stocks tended to outperform their smaller-cap counterparts, while growth stocks outperformed value-oriented issues. Among large-cap industry sectors, consumer staples and health care led the market’s advance, followed by utilities, real estate and information technology. Basic materials and energy underperformed broad market averages by the greatest margin, with financials, industrials and consumer discretionary lagging to a lesser degree. Communications services ended the reporting period unchanged.
Strong U.S. economic growth and rising levels of corporate earnings supported the stock market’s gains during the first five months of the reporting period. U.S. gross domestic product (GDP), a measure of economic growth, expanded at its fastest rate since 2000 during the reporting period, while wages surged and unemployment dipped to levels not seen in 49 years. U.S. corporate sales and earnings also significantly exceeded expectations, supported, in part, by a business-friendly tax bill signed into law on December 22, 2017. According to FactSet, a financial data and analytics provider, in the third quarter of 2018, 78% of S&P 500® companies reported a positive earnings-per-share (EPS) surprise, while 61% reported a positive sales surprise.
Economic growth in the rest of the world proved more moderate. Despite gradual improvements since the 2007 financial crisis, much of the developed world outside of the United States continued to exhibit relatively modest GDP growth rates and high levels of unemployment. International stock markets were further undermined by increasingly protectionist U.S. trade policies. European Union and Japanese attempts to negotiate settlements of their trade conflicts with the United States achieved only limited success, while tensions between the United States and China escalated toward an all-out trade war, with each country imposing significant tariffs on a widening range of the other’s goods. In the environment, most international stocks ended the reporting period with significant losses. Emerging-market stocks were hit especially hard by trade uncertainties and the rising value of the U.S. dollar.
Domestic and international bonds suffered in an environment of rising interest rates and increasing inflationary pressures. In contrast to central banks in many other developed nations which maintained low interest rates and accommodative fiscal policies,
the U.S. Federal Reserve (the Fed) raised the benchmark federal funds rate 25 basis points (0.25%) two times during the reporting period. Shortly after its September rate hike, the Fed signaled that additional increases were likely, and might rise above the so-called normalized levels previously expected. The Fed’s aggressive stance drove bonds lower in the final month of the reporting period. All types and durations of bonds suffered in this environment, with longer-term instruments tending to underperform shorter-term ones, and with all grades of corporate bonds underperforming more conservative government bonds. While municipal bonds produced mildly negative returns as well, most outperformed their taxable government and corporate counterparts.
October 2018 also proved volatile for equities, with several broad U.S. market indices retreating sharply from record levels set the previous month. Several factors contributed to market volatility, among them mounting trade tensions between the United States and China, the potential for rising inflation, an increase in disappointing corporate earnings forecasts, signs of faltering global economic growth and concerns that the U.S. economy might slow significantly in 2019.
High levels of market volatility are generally regarded as a sign of investor uncertainty. As a MainStay investor, you can rely on the discipline and dedication of our portfolio managers as they pursue the objectives of their individual Funds using the investment strategies and processes outlined in the prospectus. Our market experience and professional insight free you to focus on your long-term investment goals, while we work to maximize your returns and manage the continually changing risks associated with your investments.
The report that follows contains additional information on the market events, investment decisions and specific securities that shaped your Fund’s performance during the six months ended October 31, 2018. We encourage you to read the report carefully and use it to evaluate your Fund’s performance in light of your long-range financial plan.
Sincerely,

Kirk C. Lehneis
President
The opinions expressed are as of the date of this report and are subject to change. There is no guarantee that any forecast made will come to pass. This material does not constitute investment advice and is not intended as an endorsement of any specific investment. Past performance is no guarantee of future results.
Not part of the Semiannual Report
Table of Contents
Investors should refer to the Fund’s Summary Prospectus and/or Prospectus and consider the Fund’s investment objectives, strategies, risks, charges and expenses carefully before investing. The Summary Prospectus and/or Prospectus contain this and other information about the Fund. You may obtain copies of the Fund’s Summary Prospectus, Prospectus and Statement of Additional Information free of charge, upon request, by calling toll-free 800-MAINSTAY (624-6782), by writing to NYLIFE Distributors LLC, Attn: MainStay Marketing Department, 30 Hudson Street, Jersey City, NJ 07302 or by sending an e-mail to MainStayShareholderServices@nylim.com. These documents are also available via the MainStay Funds’ website at nylinvestments.com/funds. Please read the Summary Prospectus and/or Prospectus carefully before investing.
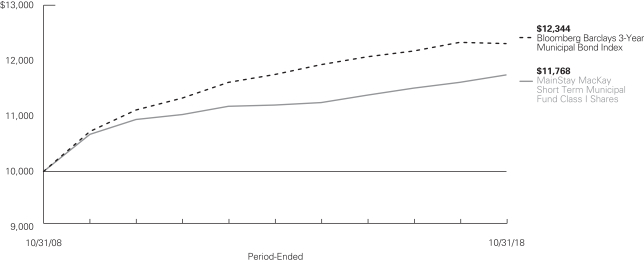
Investment and Performance Comparison1 (Unaudited)
Performance data quoted represents past performance. Past performance is no guarantee of future results. Because of market volatility and other factors, current performance may be lower or higher than the figures shown. Investment return and principal value will fluctuate, and as a result, when shares are redeemed, they may be worth more or less than their original cost. The graph below depicts the historical performance of Class I shares of the Fund. Performance will vary from class to class based on differences in class-specific expenses and sales charges. For performance information current to the most recent month-end, please call 800-MAINSTAY (624-6782) or visit nylinvestments.com/funds.
Average Annual Total Returns for the Period-Ended October 31, 2018
| | | | | | | | | | | | | | | | | | | | | | | | | | | | |
| Class | | Sales Charge | | | | Inception
Date | | | Six
Months | | | One
Year | | | Five
Years | | | Ten
Years | | | Gross
Expense
Ratio2 | |
| Class A Shares | | Maximum 1% Initial Sales Charge3 | | With sales charges Excluding sales charges | |
| 1/2/2004
|
| |
| –0.31
0.69 | %
| |
| –0.17
0.84 | %
| |
| 0.06
0.67 | %
| |
| 1.07
1.37 | %
| |
| 0.74
0.74 | %
|
| Investor Class Shares | | Maximum 1% Initial Sales Charge3 | | With sales charges Excluding sales charges | |
| 2/28/2008
|
| |
| –0.44
0.56 |
| |
| –0.64
0.37 |
| |
| –0.32
0.29 |
| |
| 0.69
0.99 |
| |
| 1.26
1.26 |
|
| Class I Shares | | No Sales Charge | | | | | 1/2/1991 | | | | 0.95 | | | | 1.14 | | | | 0.97 | | | | 1.64 | | | | 0.49 | |
| 1. | The performance table and graph do not reflect the deduction of taxes that a shareholder would pay on distributions or Fund share redemptions. Total returns reflect maximum applicable sales charges as indicated in the table above, if any, changes in share price, and reinvestment of dividend and capital gain distributions. The graph assumes the initial investment amount shown above and reflects the deduction of all sales charges that would have applied for the period of investment. Performance figures may reflect certain fee waivers and/or expense limitations, without which total returns may have |
| | been lower. For more information on share classes and current fee waivers and/or expense limitations (if any), please refer to the Notes to Financial Statements. |
| 2. | The gross expense ratios presented reflect the Fund’s “Total Annual Fund Operating Expenses” from the most recent Prospectus, as supplemented, and may differ from other expense ratios disclosed in this report. |
| 3. | The maximum initial sales charge prior to June 1, 2015 was 3.00%. |
The footnotes on the next page are an integral part of the table and graph and should be carefully read in conjunction with them.
| | | | | | | | | | | | | | | | |
| Benchmark Performance | | Six
Months | | | One
Year | | | Five Years | | | Ten
Years | |
Bloomberg Barclays 3-Year Municipal Bond Index4 | | | 0.77 | % | | | –0.16 | % | | | 0.95 | % | | | 2.13 | % |
Morningstar Muni National Short Category Average5 | | | 0.55 | | | | 0.05 | | | | 0.82 | | | | 1.85 | |
| 4. | The Bloomberg Barclays 3-Year Municipal Bond Index is the Fund’s primary broad-based securities-market index for comparison purposes. The Bloomberg Barclays 3-Year Municipal Bond Index is considered representative of the broad-based market for investment grade, tax-exempt bonds with a maturity range of 2-4 years. Results assume reinvestment of all dividends and capital gains. An investment cannot be made directly into an index. |
| 5. | The Morningstar Muni National Short Category Average is representative of funds that invest in bonds issued by state and local governments to fund |
| | public projects. The income from these bonds is generally free from federal taxes and/or from state taxes in the issuing state. To lower risk, some of these portfolios spread their assets across many states and sectors. Other portfolios buy bonds from only one state in order to get the state-tax benefit. These portfolios have durations of less than 4.5 years. Results are based on average total returns of similar funds with all dividends and capital gain distributions reinvested. |
The footnotes on the preceding page are an integral part of the table and graph and should be carefully read in conjunction with them.
| | |
| 6 | | MainStay MacKay Short Term Municipal Fund |
Cost in Dollars of a $1,000 Investment in Mainstay MacKay Short Term Municipal Fund (Unaudited)
The example below is intended to describe the fees and expenses borne by shareholders during the six-month period from May 1, 2018, to October 31, 2018, and the impact of those costs on your investment.
Example
As a shareholder of the Fund you incur two types of costs: (1) transaction costs, including exchange fees and sales charges (loads) on purchases (as applicable), and (2) ongoing costs, including management fees, distribution and/or service (12b-1) fees, and other Fund expenses (as applicable). This example is intended to help you understand your ongoing costs (in dollars) of investing in the Fund and to compare these costs with the ongoing costs of investing in other mutual funds. The example is based on an investment of $1,000 made at the beginning of the six-month period and held for the entire period from May 1, 2018, to October 31, 2018.
This example illustrates your Fund’s ongoing costs in two ways:
Actual Expenses
The second and third data columns in the table below provide information about actual account values and actual expenses. You may use the information in these columns, together with the amount you invested, to estimate the expenses that you paid during the six months ended October 31, 2018. Simply divide your account value by $1,000 (for example, an $8,600 account value divided by $1,000 = 8.6), then
multiply the result by the number under the heading entitled “Expenses Paid During Period” to estimate the expenses you paid on your account during this period.
Hypothetical Example for Comparison Purposes
The fourth and fifth data columns in the table below provide information about hypothetical account values and hypothetical expenses based on the Fund’s actual expense ratio and an assumed rate of return of 5% per year before expenses, which is not the Fund’s actual return. The hypothetical account values and expenses may not be used to estimate the actual ending account balances or expenses you paid for the six-month period shown. You may use this information to compare the ongoing costs of investing in the Fund with the ongoing costs of investing in other mutual funds. To do so, compare this 5% hypothetical example with the 5% hypothetical examples that appear in the shareholder reports of the other mutual funds.
Please note that the expenses shown in the table are meant to highlight your ongoing costs only and do not reflect any transactional costs, such as exchange fees or sales charges (loads). Therefore, the fourth and fifth data columns of the table are useful in comparing ongoing costs only and will not help you determine the relative total costs of owning different funds. In addition, if these transactional costs were included, your costs would have been higher.
| | | | | | | | | | | | | | | | | | | | | | |
| | | | | | | | | | | | | | | | | | |
| Share Class | | Beginning
Account
Value
5/1/18 | | | Ending Account
Value (Based
on Actual
Returns and
Expenses)
10/31/18 | | | Expenses
Paid
During
Period1 | | | Ending Account
Value (Based
on Hypothetical
5% Annualized
Return and
Actual Expenses)
10/31/18 | | | Expenses
Paid
During
Period1 | | | Net Expense
Ratio
During
Period2 |
| | | | | | |
| Class A Shares | | $ | 1,000.00 | | | $ | 1,006.90 | | | $ | 3.59 | | | $ | 1,021.63 | | | $ | 3.62 | | | 0.71% |
| | | | | | |
| Investor Class Shares | | $ | 1,000.00 | | | $ | 1,005.60 | | | $ | 5.97 | | | $ | 1,019.26 | | | $ | 6.01 | | | 1.18% |
| | | | | | |
| Class I Shares | | $ | 1,000.00 | | | $ | 1,009.50 | | | $ | 2.08 | | | $ | 1,023.14 | | | $ | 2.09 | | | 0.41% |
| 1. | Expenses are equal to the Fund’s annualized expense ratio of each class multiplied by the average account value over the period, divided by 365 and multiplied by 184 (to reflect the six-month period). The table above represents the actual expenses incurred during the six-month period. |
| 2. | Expenses are equal to the Fund’s annualized expense ratio to reflect the six-month period. |
Portfolio Composition as of October 31, 2018 (Unaudited)
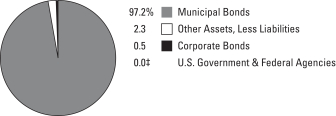
See Portfolio of Investments beginning on page 11 for specific holdings within these categories. The Fund’s portfolio is subject to change.
| ‡ | Less than one-tenth of a percent. |
Top Ten Issuers Held as of October 31, 2018 (Unaudited)
| 1. | Territory of Guam, Revenue Bonds, 4.00%–5.00%, due 11/15/18–12/1/21 |
| 2. | State of Ohio, Capital Facilities Lease-Appropriation, Revenue Bonds, 1.70%, due 10/1/36 |
| 3. | County of Weber UT, Weber County Hospital, IHC Health Services, Inc., Revenue Bonds, 1.67%, due 2/15/35 |
| 4. | Eastern Municipal Water District, Water & Wastewater, Revenue Bonds, 1.38%, due 7/1/46 |
| 5. | Tender Option Bond Trust Receipts, Revenue Bonds, 1.90%, due 12/1/48 |
| 6. | Minneapolis Health Care System, Fairview Health Services, Revenue Bonds, 1.62%, due 11/15/48 |
| 7. | State of Texas, Revenue Notes, 4.00%, due 8/29/19 |
| 8. | New Jersey Turnpike Authority, Revenue Bonds, 2.059%, due 1/1/22 |
| 9. | Albemarle County Economic Development Authority, Sentara Martha Jefferson Hospital, Revenue Bonds, 1.61%, due 10/1/48 |
| 10. | Arizona Health Facilities Authority, Banner Health, Revenue Bonds, 1.64%, due 1/1/46 |
| 11. | University of California, Revenue Bonds, 1.35%, due 5/15/48 |
| | |
| 8 | | MainStay MacKay Short Term Municipal Fund |
Portfolio Management Discussion and Analysis (Unaudited)
Questions answered by portfolio managers John Loffredo, CFA, Robert DiMella, CFA, Michael Petty, David Dowden, Scott Sprauer and Frances Lewis of MacKay Shields LLC, the Fund’s Subadvisor.
How did MainStay MacKay Short Term Municipal Fund perform relative to its benchmark and peer group during the six months ended October 31, 2018?
For the six months ended October 31, 2018, Class I shares of MainStay MacKay Short Term Municipal Fund returned 0.95%, outperforming the 0.77% return of the Fund’s primary benchmark, the Bloomberg Barclays 3-Year Municipal Bond Index. Over the same period, Class I shares also outperformed the 0.55% return of the Morningstar Muni National Short Category Average.1
What factors affected the Fund’s relative performance during the reporting period?
The Fund’s conservative positioning and shorter duration2 helped it outperform the Bloomberg Barclays 3-Year Municipal Bond Index during the reporting period as interest rates rose.
Were there any changes to the Fund during the reporting period?
Effective May 22, 2018, MainStay MacKay Tax Advantaged Short Term Bond Fund was renamed MainStay MacKay Short Term Municipal Fund. On that date, the Fund’s principal investment strategy, investment process, fee structure and investment policies were changed, and the Fund’s secondary benchmark was removed. Effective that same date, Dan Roberts, Louis Cohen and Claude Athaide were removed from the Fund. For more information on these changes, refer to the prospectus supplement dated March 23, 2018.
What was the Fund’s duration strategy during the reporting period?
The Fund maintained a shorter duration posture than its benchmark, the Bloomberg Barclays 3-Year Municipal Bond Index, in response to ongoing Federal Reserve rate hikes and expectations of rising rate targets. This positioning accounted for most of the Fund’s outperformance relative to its benchmark. As of the end of the reporting period, the Fund’s duration was .86 years compared to a duration of 2.57 years for the benchmark.
During the reporting period, which sectors were the strongest positive contributors to the Fund’s relative performance and which sectors were particularly weak?
The strongest contributors to the Fund’s performance relative to the Bloomberg Barclays 3-Year Municipal Bond Index were underweight exposures to the state general obligation and pre-refunded sectors. (Contributions take weightings and total returns into account.) Overweight exposure to the hospital and leasing sectors were the largest detractors to the Fund’s relative performance.
What were some of the Fund’s largest purchases and sales during the reporting period?
A number of the Fund’s largest purchases, specifically Weber Hospital in Utah and Eastern Municipal Water in California, were tax-exempt municipal variable rate notes, which are considered cash equivalents in the municipal money market space. These securities earned an attractive yield while keeping the Fund’s duration short and maintaining a high degree of liquidity. This strategy proved effective in light of the Federal Reserve’s continuing emphasis on a steady rate hike path. Conversely, two of the largest sales of the period, Illinois State general obligation and Industry California public facilities, were initiated to avoid price depreciation in anticipation of spread3 widening in these two securities.
How did the Fund’s sector weightings change during the reporting period?
The Fund changed its investment mandate to one more focused on municipal securities. As a result, the portfolio’s taxable fixed-income exposure decreased significantly during the period. The Fund decreased its exposure among municipals, local government obligation and special tax bonds sectors and increased its exposure in the hospital and water/sewer sectors.
| 1. | See page 5 for other share class returns, which may be higher or lower than Class I share returns. See page 6 for more information on benchmark and peer group returns. |
| 2. | Duration is a measure of the price sensitivity of a fixed-income investment to changes in interest rates. Duration is expressed as a number of years and is considered a more accurate sensitivity gauge than average maturity. |
| 3. | The terms “spread” and “yield spread” may refer to the difference in yield between a security or type of security and comparable U.S. Treasury issues. The terms may also refer to the difference in yield between two specific securities or types of securities at a given time. |
How was the Fund positioned at the end of the reporting period?
As of October 31, 2018, the Fund held overweight positions relative to the Bloomberg Barclays 3-Year Municipal Bond Index
in the hospital, housing and industrial development revenue/pollution control revenue sectors, and in bonds rated AA and BBB. As of the same date, the Fund held underweight exposure to the state general obligation, pre-refunded and electric sectors, as well as AAA- and AA-rated securities.4
| 4. | An obligation rated ‘AAA’ has the highest rating assigned by Standard & Poor’s (“S&P”), and in the opinion of S&P, the obligor’s capacity to meet its financial commitment on the obligation is extremely strong. An obligation rated ‘AA’ by S&P is deemed by S&P to differ from the highest-rated obligations only to a small degree. In the opinion of S&P, the obligor’s capacity to meet its financial commitment on the obligation is very strong. An obligation rated ‘BBB’ by S&P is deemed by S&P to exhibit adequate protection parameters. In the opinion of S&P, however, adverse economic conditions or changing circumstances are more likely to lead to a weakened capacity of the obligor to meet its financial commitment on the obligation. Ratings from ‘AA’ to ‘CCC may be modified by the addition of a plus (+) or minus (–) sign to show relative standing within the major rating categories. When applied to Fund holdings, ratings are based solely on the creditworthiness of the bonds in the portfolio and are not meant to represent the security or safety of the Fund. |
The opinions expressed are those of the portfolio managers as of the date of this report and are subject to change. There is no guarantee that any forecasts will come to pass. This material does not constitute investment advice and is not intended as an endorsement of any specific investment.
| | |
| 10 | | MainStay MacKay Short Term Municipal Fund |
Portfolio of Investments October 31, 2018 (Unaudited)
| | | | | | | | |
| | | Principal
Amount | | | Value | |
Long-Term Bonds 97.7%† Corporate Bonds 0.5% | |
Banks 0.5% | | | | | | | | |
Huntington National Bank
2.20%, due 11/6/18 | | $ | 2,000,000 | | | $ | 1,999,877 | |
| | | | | | | | |
Total Corporate Bonds
(Cost $2,000,065) | | | | | | | 1,999,877 | |
| | | | | | | | |
|
| Municipal Bonds 97.2% | |
Alabama 0.6% | |
Calhoun County Board of Education, Special Tax
Insured: BAM
3.00%, due 2/1/19 | | | 200,000 | | | | 200,484 | |
Industrial Development Board of the City of Mobile Alabama, Pollution Control Electric Power Co.-Barry Plant, Revenue Bonds 1st Series
1.71%, due 6/1/34 (a) | | | 1,900,000 | | | | 1,900,000 | |
| | | | | | | | |
| | | | | | | 2,100,484 | |
| | | | | | | | |
Arizona 2.0% | |
Industrial Development Authority of the City of Phoenix, Downtown Phoenix Student LLC, Revenue Bonds
Series A
5.00%, due 7/1/23 | | | 50,000 | | | | 54,275 | |
Arizona Health Facilities Authority, Banner Health, Revenue Bonds
Series B
1.64%, due 1/1/46 (a) | | | 6,000,000 | | | | 6,000,000 | |
City of Tucson AZ, Certificates of Participation Insured: AGM
4.00%, due 7/1/20 | | | 350,000 | | | | 360,171 | |
Pima County Unified School District No. 16 Catalina Foothills, Unlimited General Obligation
3.00%, due 7/1/19 | | | 1,165,000 | | | | 1,172,468 | |
| | | | | | | | |
| | | | | | | 7,586,914 | |
| | | | | | | | |
California 10.2% | |
Auburn Urban Development Authority Successor Agency, Auburn Redevelopment Project, Tax Allocation
Insured: BAM
4.00%, due 6/1/19 | | | 140,000 | | | | 141,655 | |
California Health Facilities Financing Authority, Los Angeles Biomedical Research Institute, Revenue Bonds | | | | | | | | |
3.00%, due 9/1/20 | | | 215,000 | | | | 217,563 | |
4.00%, due 9/1/21 | | | 275,000 | | | | 286,426 | |
4.00%, due 9/1/22 | | | 300,000 | | | | 315,324 | |
4.00%, due 9/1/23 | | | 310,000 | | | | 327,840 | |
| | | | | | | | |
| | | Principal
Amount | | | Value | |
California (continued) | |
California Municipal Finance Authority, California Lutheran University, Revenue Bonds | | | | | | | | |
5.00%, due 10/1/20 | | $ | 325,000 | | | $ | 342,020 | |
5.00%, due 10/1/21 | | | 250,000 | | | | 268,840 | |
California Municipal Finance Authority, Community Medical Centers, Revenue Bonds
Series A
5.00%, due 2/1/21 | | | 1,100,000 | | | | 1,161,666 | |
California Municipal Finance Authority, Harbor Regional Center Project, Revenue Bonds
4.00%, due 11/1/18 | | | 740,000 | | | | 740,000 | |
California Municipal Finance Authority, LAX Integrated Express Solutions Project, Revenue Bonds
Series A
5.00%, due 12/31/23 (b) | | | 800,000 | | | | 877,584 | |
California School Finance Authority, Aspire Public Schools, Revenue Bonds
Series A
5.00%, due 8/1/19 (c) | | | 130,000 | | | | 132,386 | |
California State Educational Facilities Authority, Art Center College of Design, Revenue Bonds | | | | | | | | |
Series A
5.00%, due 12/1/18 | | | 100,000 | | | | 100,245 | |
Series A
5.00%, due 12/1/19 | | | 125,000 | | | | 128,946 | |
Series A
5.00%, due 12/1/21 | | | 290,000 | | | | 313,513 | |
Series A
5.00%, due 12/1/22 | | | 200,000 | | | | 220,258 | |
Series A
5.00%, due 12/1/23 | | | 215,000 | | | | 240,383 | |
California State Health Facilities Financing Authority, Dignity Health, Revenue Bonds
Series D, Insured: NATL-RE
3.005%, due 7/1/21 | | | 2,700,000 | | | | 2,700,000 | |
City of Industry CA, Senior, Revenue Bonds
Series A, Insured: AGM
2.125%, due 1/1/19 | | | 985,000 | | | | 984,084 | |
City of Los Angeles CA, Revenue Notes
Series B
4.00%, due 6/27/19 | | | 5,000,000 | | | | 5,072,250 | |
City of Oakland CA, Revenue Bonds Insured: AGM
(zero coupon), due 12/15/19 | | | 1,000,000 | | | | 960,620 | |
County of San Diego CA, Sanford Burnham Prebys Medical, Revenue Bonds
5.00%, due 11/1/18 | | | 400,000 | | | | 400,000 | |
| | | | | | |
The notes to the financial statements are an integral part of,
and should be read in conjunction with, the financial statements. | | | | | 11 | |
Portfolio of Investments October 31, 2018 (Unaudited) (continued)
| | | | | | | | |
| | | Principal
Amount | | | Value | |
| Municipal Bonds (continued) | | | | | | | | |
California (continued) | |
Eastern Municipal Water District, Water & Wastewater, Revenue Bonds
Series A
1.38%, due 7/1/46 (a) | | $ | 7,500,000 | | | $ | 7,500,000 | |
Inglewood Unified School District, Unlimited General Obligation | | | | | | | | |
Series B, Insured: BAM
4.00%, due 8/1/19 | | | 500,000 | | | | 507,070 | |
Series B, Insured: BAM
4.00%, due 8/1/20 | | | 1,000,000 | | | | 1,029,440 | |
Los Angeles Department of Water & Power, Revenue Bonds
Subseries B-2
1.28%, due 7/1/35 (a) | | | 3,100,000 | | | | 3,100,000 | |
Metropolitan Water District of Southern California, Revenue Bonds
Series B-3
1.32%, due 7/1/35 (a) | | | 1,700,000 | | | | 1,700,000 | |
Monrovia Redevelopment Agency Successor Agency, Central Redevelopment Project, Tax Allocation
Series A, Insured: AGM
2.50%, due 5/1/19 | | | 600,000 | | | | 598,002 | |
Moreno Valley Public Financing Authority, Revenue Bonds
Insured: AGM
2.25%, due 11/1/18 | | | 105,000 | | | | 105,000 | |
Sacramento County Sanitation District Financing Authority, Revenue Bonds
Series B
2.239%, due 12/1/19 | | | 2,000,000 | | | | 1,984,320 | |
San Diego Redevelopment Agency Successor Agency, Tax Allocation
Series B
2.25%, due 9/1/19 | | | 250,000 | | | | 248,790 | |
University of California, Revenue Bonds
Series AL-1
1.35%, due 5/15/48 (a) | | | 6,000,000 | | | | 6,000,000 | |
| | | | | | | | |
| | | | | | | 38,704,225 | |
| | | | | | | | |
Colorado 2.2% | |
E-470 Public Highway Authority, Revenue Bonds
Series A
5.00%, due 9/1/19 | | | 1,000,000 | | | | 1,023,890 | |
Tender Option Bond Trust Receipts, Revenue Bonds
Series 2018-ZF0691
1.90%, due 12/1/48 (a)(b)(c) | | | 7,355,000 | | | | 7,355,000 | |
| | | | | | | | |
| | | | | | | 8,378,890 | |
| | | | | | | | |
| | | | | | | | |
| | | Principal
Amount | | | Value | |
Connecticut 1.8% | |
City of Bridgeport CT, Unlimited General Obligation
Series D, Insured: AGM
5.00%, due 8/15/20 | | $ | 1,000,000 | | | $ | 1,043,190 | |
City of Hartford CT, Unlimited General Obligation
Series A, Insured: AGM
5.00%, due 4/1/22 | | | 1,000,000 | | | | 1,076,200 | |
Connecticut State Health & Educational Facility Authority, Quinnipiac University, Revenue Bonds
Series M
4.00%, due 7/1/19 | | | 800,000 | | | | 809,896 | |
State of Connecticut, Unlimited General Obligation | | | | | | | | |
Series C
4.00%, due 6/15/22 | | | 2,210,000 | | | | 2,306,820 | |
Series C
5.00%, due 6/15/23 | | | 1,500,000 | | | | 1,635,900 | |
| | | | | | | | |
| | | | | | | 6,872,006 | |
| | | | | | | | |
District of Columbia 0.3% | |
District of Columbia, Tranche 1, Revenue Bonds
Series A
1.63%, due 8/15/38 (a) | | | 1,155,000 | | | | 1,155,000 | |
| | | | | | | | |
|
Florida 1.5% | |
City of Lakeland FL, Lakeland Regional Health Systems, Revenue Bonds
5.00%, due 11/15/19 | | | 265,000 | | | | 272,722 | |
City of Tallahassee FL, Tallahassee Memorial Healthcare, Inc., Revenue Bonds
Series A
5.00%, due 12/1/18 | | | 425,000 | | | | 425,901 | |
County of Miami-Dade Seaport Department, Revenue Bonds
Series A
5.00%, due 10/1/19 | | | 2,140,000 | | | | 2,190,354 | |
Escambia County, Gulf Power Co. Project, Revenue Bonds
2nd Series
1.73%, due 4/1/39 (a) | | | 2,000,000 | | | | 2,000,000 | |
Miami-Dade County Industrial Development Authority, Florida Power & Light Co., Revenue Bonds
1.70%, due 6/1/21 (a) | | | 800,000 | | | | 800,000 | |
| | | | | | | | |
| | | | | | | 5,688,977 | |
| | | | | | | | |
Georgia 3.0% | |
Heard County Development Authority, Georgia Power Co. Plant Wansley, Revenue Bonds
1.88%, due 12/1/37 (a)(b) | | | 4,500,000 | | | | 4,500,000 | |
| | | | |
| 12 | | MainStay MacKay Short Term Municipal Fund | | The notes to the financial statements are an integral part of,
and should be read in conjunction with, the financial statements. |
| | | | | | | | |
| | | Principal
Amount | | | Value | |
| Municipal Bonds (continued) | | | | | | | | |
Georgia (continued) | |
Main Street Natural Gas, Inc., Revenue Bonds
Series B
2.262%, due 4/1/48 (d) | | $ | 5,000,000 | | | $ | 4,967,250 | |
State of Georgia, Unlimited General Obligation
Series F
5.00%, due 7/1/19 | | | 1,925,000 | | | | 1,964,270 | |
| | | | | | | | |
| | | | | | | 11,431,520 | |
| | | | | | | | |
Guam 4.2% | |
Guam Government Waterworks Authority, Water & Wastewater Systems Revenue, Revenue Bonds
Series A
5.00%, due 7/1/20 | | | 400,000 | | | | 413,532 | |
Port Authority of Guam, Revenue Bonds | | | | | | | | |
Series C
3.587%, due 7/1/20 | | | 500,000 | | | | 498,105 | |
Series C
3.783%, due 7/1/21 | | | 500,000 | | | | 496,995 | |
Series B
5.00%, due 7/1/19 (b) | | | 250,000 | | | | 253,665 | |
Series B
5.00%, due 7/1/22 (b) | | | 400,000 | | | | 424,972 | |
Territory of Guam, Revenue Bonds | | | | | | | | |
Series D
4.00%, due 11/15/18 | | | 275,000 | | | | 275,160 | |
Series D
5.00%, due 11/15/19 | | | 1,000,000 | | | | 1,025,820 | |
Series A
5.00%, due 1/1/20 | | | 660,000 | | | | 678,408 | |
Series D
5.00%, due 11/15/20 | | | 2,740,000 | | | | 2,868,999 | |
Series A
5.00%, due 12/1/20 | | | 3,230,000 | | | | 3,375,253 | |
Series A
5.00%, due 12/1/21 | | | 5,295,000 | | | | 5,618,683 | |
| | | | | | | | |
| | | | | | | 15,929,592 | |
| | | | | | | | |
Illinois 8.0% | |
Chicago Board of Education, Chicago School Board, Unlimited General Obligation
Series A, Insured: NATL-RE
5.25%, due 12/1/19 | | | 400,000 | | | | 408,200 | |
Chicago Board of Education, School Reform, Unlimited General Obligation
Series B-1, Insured: NATL-RE
(zero coupon), due 12/1/18 | | | 1,495,000 | | | | 1,491,846 | |
Chicago Board of Education, Unlimited General Obligation | | | | | | | | |
Series A, Insured: NATL-RE
5.00%, due 12/1/19 | | | 1,775,000 | | | | 1,806,719 | |
| | | | | | | | |
| | | Principal
Amount | | | Value | |
Illinois (continued) | |
Chicago Board of Education, Unlimited General Obligation (continued) | | | | | | | | |
Series A, Insured: AGM
5.00%, due 12/1/23 | | $ | 1,600,000 | | | $ | 1,734,016 | |
Series A, Insured: AMBAC
5.50%, due 12/1/18 | | | 220,000 | | | | 220,387 | |
Chicago Park District, Limited General Obligation | | | | | | | | |
Series C
3.357%, due 1/1/21 | | | 955,000 | | | | 954,847 | |
Series C
3.545%, due 1/1/22 | | | 450,000 | | | | 450,108 | |
Series C
5.00%, due 1/1/19 | | | 105,000 | | | | 105,483 | |
Series E
5.00%, due 11/15/20 | | | 750,000 | | | | 785,767 | |
Series E
5.00%, due 11/15/21 | | | 800,000 | | | | 851,600 | |
City of Chicago IL, Waterworks Second Lien, Revenue Bonds | | | | | | | | |
4.00%, due 11/1/18 | | | 1,000,000 | | | | 1,000,000 | |
5.00%, due 11/1/19 | | | 245,000 | | | | 251,436 | |
City of Peoria IL, Unlimited General Obligation
Series A
3.00%, due 1/1/19 | | | 525,000 | | | | 524,874 | |
City of Rockford IL, Unlimited General Obligation
Series A, Insured: BAM
3.00%, due 12/15/18 | | | 145,000 | | | | 145,164 | |
Cook County Community High School District No. 212 Leyden, Revenue Bonds
Series B, Insured: BAM
2.00%, due 12/1/19 | | | 1,140,000 | | | | 1,126,160 | |
Cook County School District, No. 81 Schiller Park, Limited General Obligation
Series B
4.00%, due 12/1/19 | | | 570,000 | | | | 579,969 | |
County of Cook IL, Unlimited General Obligation
Series D, Insured: BAM
2.03%, due 11/15/18 | | | 700,000 | | | | 699,734 | |
Illinois Development Finance Authority, NorthShore University HealthSystem, Revenue Bonds
Series C
1.65%, due 5/1/31 (a) | | | 2,500,000 | | | | 2,500,000 | |
Illinois Finance Authority, Edward Elmhurst Obligated Group, Revenue Bonds
5.00%, due 1/1/21 | | | 300,000 | | | | 313,560 | |
Illinois Finance Authority, Rosalind Franklin University of Medicine & Science, Revenue Bonds
Series B
3.20%, due 8/1/19 | | | 250,000 | | | | 248,860 | |
| | | | | | |
The notes to the financial statements are an integral part of,
and should be read in conjunction with, the financial statements. | | | | | 13 | |
Portfolio of Investments October 31, 2018 (Unaudited) (continued)
| | | | | | | | |
| | | Principal
Amount | | | Value | |
| Municipal Bonds (continued) | | | | | | | | |
Illinois (continued) | |
Illinois Sports Facilities Authority, Revenue Bonds
Insured: AMBAC
(zero coupon), due 6/15/19 | | $ | 925,000 | | | $ | 904,779 | |
Illinois State University, Auxiliary Facilities System, Revenue Bonds | | | | | | | | |
Series A, Insured: AGM
5.00%, due 4/1/21 | | | 505,000 | | | | 528,816 | |
Series B, Insured: AGM
5.00%, due 4/1/21 | | | 250,000 | | | | 261,790 | |
Series A, Insured: AGM
5.00%, due 4/1/22 | | | 425,000 | | | | 451,240 | |
Series B, Insured: AGM
5.00%, due 4/1/22 | | | 645,000 | | | | 684,822 | |
Madison Macoupin Etc Counties Illinois Community College District No. 536, Lewis & Clark Community College, Unlimited General Obligation | | | | | | | | |
4.50%, due 5/1/20 | | | 305,000 | | | | 314,272 | |
5.00%, due 11/1/22 | | | 420,000 | | | | 443,953 | |
Madison Macoupin Etc Counties Illinois Community College District No. 536, Unlimited General Obligation | | | | | | | | |
Series A
5.00%, due 11/1/20 | | | 150,000 | | | | 155,420 | |
Series A
5.00%, due 11/1/21 | | | 70,000 | | | | 73,451 | |
Peoria County School District No. 68 Oak Grove, Unlimited General Obligation
Series C, Insured: AGM
2.00%, due 12/1/19 | | | 180,000 | | | | 179,186 | |
Randolph County Community Unit School District No. 140 Sparta, Unlimited General Obligation | | | | | | | | |
Insured: AGM
4.00%, due 12/1/18 | | | 405,000 | | | | 405,616 | |
Insured: AGM
4.00%, due 12/1/19 | | | 210,000 | | | | 213,786 | |
Round Lake IL, Lakewood Grove Special Service Area No. 3 & 4, Special Tax Insured: BAM
2.65%, due 3/1/21 | | | 499,000 | | | | 491,390 | |
St. Clair County High School District No 201 Belleville, Unlimited General Obligation Insured: BAM
3.50%, due 4/1/19 | | | 160,000 | | | | 160,269 | |
State of Illinois, Junior Obligation, Revenue Bonds
5.00%, due 6/15/19 | | | 610,000 | | | | 619,565 | |
| | | | | | | | |
| | | Principal
Amount | | | Value | |
Illinois (continued) | |
State of Illinois, Unlimited General Obligation
Series B
5.00%, due 11/1/19 | | $ | 5,000,000 | | | $ | 5,109,900 | |
United City of Yorkville IL, Special Service Area No. 2005-108 & 2005-109,
Special Tax
Insured: AGM
3.00%, due 3/1/19 | | | 884,000 | | | | 886,935 | |
Village of Cary IL, Special Service Area No. 1, Special Tax
Insured: BAM
1.50%, due 3/1/19 | | | 150,000 | | | | 149,357 | |
Village of Cary IL, Special Service Area No. 2, Special Tax
Insured: BAM
1.70%, due 3/1/20 | | | 149,000 | | | | 146,625 | |
Village of Crestwood IL, Alternate Revenue Source, Unlimited General Obligation
Series B, Insured: BAM
2.00%, due 12/15/19 | | | 500,000 | | | | 497,080 | |
Volo Village Special Service Area 3 & 6, Symphony Meadows / Lancaster,
Special Tax
Insured: AGM
3.00%, due 3/1/19 | | | 200,000 | | | | 200,254 | |
Western Illinois University, Revenue Bonds | | | | | | | | |
Insured: BAM
5.00%, due 4/1/19 | | | 870,000 | | | | 878,404 | |
Insured: BAM
5.00%, due 4/1/20 | | | 460,000 | | | | 474,053 | |
| | | | | | | | |
| | | | | | | 30,429,693 | |
| | | | | | | | |
Indiana 4.1% | |
City of Indianapolis IN, Economic Development, Revenue Bonds
Series A
1.72%, due 7/1/55 (a) | | | 5,900,000 | | | | 5,900,000 | |
City of Whiting IN, Environmental Facilities, BP Products North America, Revenue Bonds
2.35%, due 12/1/44 (b)(d) | | | 5,000,000 | | | | 5,008,950 | |
Indiana Finance Authority, Duke Energy Indiana Project, Revenue Bonds
Series A-4
1.69%, due 12/1/39 (a) | | | 2,375,000 | | | | 2,375,000 | |
Indiana Finance Authority, Marquette Project, Revenue Bonds
5.00%, due 3/1/19 | | | 270,000 | | | | 272,184 | |
Indiana Finance Authority, Sisters of St. Francis, Health Services, Revenue Bonds
Series I
1.65%, due 11/1/37 (a) | | | 2,100,000 | | | | 2,100,000 | |
| | | | | | | | |
| | | | | | | 15,656,134 | |
| | | | | | | | |
| | | | |
| 14 | | MainStay MacKay Short Term Municipal Fund | | The notes to the financial statements are an integral part of,
and should be read in conjunction with, the financial statements. |
| | | | | | | | |
| | | Principal
Amount | | | Value | |
| Municipal Bonds (continued) | |
Iowa 2.0% | |
City of Coralville IA, Certificates of Participation | | | | | | | | |
Series E
4.00%, due 6/1/19 | | $ | 465,000 | | | $ | 465,758 | |
Series E
4.00%, due 6/1/20 | | | 500,000 | | | | 501,050 | |
City of Coralville IA, Corporate Purpose Bonds, Unlimited General Obligation
Series D1
1.75%, due 5/1/19 | | | 270,000 | | | | 267,835 | |
Iowa Finance Authority, Health System Obligation, Revenue Bonds
Series B-2
1.62%, due 2/15/39 (a) | | | 5,900,000 | | | | 5,900,000 | |
Xenia Rural Water District, Capital Loan Notes, Revenue Bonds | | | | | | | | |
2.00%, due 12/1/18 | | | 225,000 | | | | 224,928 | |
3.00%, due 12/1/19 | | | 375,000 | | | | 376,582 | |
| | | | | | | | |
| | | | | | | 7,736,153 | |
| | | | | | | | |
Kansas 0.5% | |
Kansas Development Finance Authority, KU Health System, Revenue Bonds
Series J
1.68%, due 3/1/41 (a) | | | 2,000,000 | | | | 2,000,000 | |
| | | | | | | | |
|
Kentucky 2.4% | |
City of Berea KY, Berea College Project, Revenue Bonds
Series A
1.56%, due 6/1/32 (a) | | | 1,585,000 | | | | 1,585,000 | |
Kentucky Bond Development Corp., Lexington Center Corp. Project, Revenue Bonds
Series A
5.00%, due 9/1/22 | | | 550,000 | | | | 599,071 | |
Kentucky Bond Development Corp., Revenue Bonds | | | | | | | | |
5.00%, due 9/1/19 | | | 390,000 | | | | 399,220 | |
5.00%, due 9/1/21 | | | 325,000 | | | | 347,519 | |
Louisville / Jefferson County Metropolitan Government, Norton Healthcare, Revenue Bonds
Series B
1.65%, due 10/1/39 (a) | | | 5,995,000 | | | | 5,995,000 | |
| | | | | | | | |
| | | | | | | 8,925,810 | |
| | | | | | | | |
Louisiana 0.8% | |
Bossier City LA, Public Improvement Sales & Tax, Revenue Bonds
2.00%, due 12/1/18 | | | 500,000 | | | | 499,770 | |
| | | | | | | | |
| | | Principal
Amount | | | Value | |
Louisiana (continued) | |
City of New Orleans LA, Water System, Revenue Bonds
3.00%, due 12/1/18 | | $ | 250,000 | | | $ | 250,180 | |
City of Shreveport LA, Airport System, Revenue Bonds
Series B, Insured: AGM
2.452%, due 1/1/19 | | | 500,000 | | | | 499,520 | |
Louisiana Local Government Environmental Facilities & Community Development Authority, University Student Housing, Revenue Bonds
Series A, Insured: AGM
2.00%, due 10/1/19 | | | 555,000 | | | | 553,779 | |
Louisiana Public Facilities Authority, Willis-Knighton Medical Center, Revenue Bonds
Series 1993, Insured: AMBAC
3.061%, due 9/1/23 | | | 1,400,000 | | | | 1,400,000 | |
| | | | | | | | |
| | | | | | | 3,203,249 | |
| | | | | | | | |
Maryland 0.5% | |
Maryland Health & Higher Educational Facilities Authority, Broadmead Issue, Revenue Bonds
Series B
2.875%, due 7/1/23 | | | 1,750,000 | | | | 1,745,800 | |
| | | | | | | | |
|
Massachusetts 2.7% | |
Massachusetts Development Finance Agency, Boston University, Revenue Bonds
Series U-6E
1.60%, due 10/1/42 (a) | | | 1,000,000 | | | | 1,000,000 | |
Massachusetts Development Finance Agency, UMass Boston Student Housing Project, Revenue Bonds
5.00%, due 10/1/19 | | | 985,000 | | | | 1,006,188 | |
Massachusetts Health & Educational Facilities Authority, Baystate Medical Center, Revenue Bonds
Series K
1.60%, due 7/1/39 (a) | | | 800,000 | | | | 800,000 | |
Massachusetts Housing Finance Agency, Revenue Bonds
Series B
2.60%, due 12/1/39 | | | 2,535,000 | | | | 2,516,114 | |
Massachusetts Water Resources Authority, Revenue Bonds
Series C
1.62%, due 8/1/20 (a) | | | 4,775,000 | | | | 4,775,000 | |
| | | | | | | | |
| | | | | | | 10,097,302 | |
| | | | | | | | |
| | | | | | |
The notes to the financial statements are an integral part of,
and should be read in conjunction with, the financial statements. | | | | | 15 | |
Portfolio of Investments October 31, 2018 (Unaudited) (continued)
| | | | | | | | |
| | | Principal
Amount | | | Value | |
| Municipal Bonds (continued) | |
Michigan 1.0% | |
County of Genesee MI, Water Supply System, Limited General Obligation
Series B, Insured: BAM
5.00%, due 2/1/19 | | $ | 200,000 | | | $ | 201,458 | |
Harper Woods School District, Unlimited General Obligation
Insured: AGM
5.00%, due 5/1/19 | | | 500,000 | | | | 507,735 | |
Lincoln Consolidated School District, Unlimited General Obligation
Series A, Insured: AGM
5.00%, due 5/1/19 | | | 1,180,000 | | | | 1,197,487 | |
Michigan Finance Authority, College for Creative Studies, Revenue Bonds
5.00%, due 12/1/18 | | | 200,000 | | | | 200,396 | |
Michigan Finance Authority, Wayne County Criminal Justice Center Project, Revenue Bonds
5.00%, due 11/1/22 | | | 500,000 | | | | 549,065 | |
Warren Consolidated Schools, Unlimited General Obligation
Series B, Insured: BAM
5.00%, due 5/1/19 | | | 1,080,000 | | | | 1,095,466 | |
| | | | | | | | |
| | | | | | | 3,751,607 | |
| | | | | | | | |
Minnesota 4.2% | |
City of Minneapolis MN/St. Paul Housing & Redevelopment Authority, Children’s Health Care, Revenue Bonds
Series A, Insured: AGM
1.70%, due 8/15/37 (a) | | | 4,875,000 | | | | 4,875,000 | |
Housing & Redevelopment Authority of The City of St. Paul Minnesota, Healtheast Care System Project, Revenue Bonds
5.00%, due 11/15/18 | | | 1,350,000 | | | | 1,351,512 | |
Kanabec County MN, FirstLight Health System, Revenue Bonds
2.75%, due 12/1/19 | | | 2,750,000 | | | | 2,743,868 | |
Minneapolis Health Care System, Fairview Health Services, Revenue Bonds
Series C
1.62%, due 11/15/48 (a) | | | 7,000,000 | | | | 7,000,000 | |
| | | | | | | | |
| | | | | | | 15,970,380 | |
| | | | | | | �� | |
Mississippi 0.7% | |
City of Jackson MS Water & Sewer System, Revenue Bonds
Insured: BAM
4.00%, due 9/1/20 | | | 625,000 | | | | 638,613 | |
Mississippi Development Bank, Canton Public School District, Revenue Bonds Insured: AGM
4.00%, due 12/1/18 | | | 935,000 | | | | 936,496 | |
| | | | | | | | |
| | | Principal
Amount | | | Value | |
Mississippi (continued) | |
Mississippi Hospital Equipment & Facilities Authority, Baptist Health System, Inc., Revenue Bonds
Series B-2
2.125%, due 9/1/22 (a) | | $ | 1,000,000 | | | $ | 999,060 | |
| | | | | | | | |
| | | | | | | 2,574,169 | |
| | | | | | | | |
Missouri 1.5% | |
Missouri Health & Educational Facilities Authority, St. Louis University, Revenue Bonds
Series B-2
1.58%, due 10/1/35 (a) | | | 5,815,000 | | | | 5,815,000 | |
| | | | | | | | |
|
Montana 0.2% | |
Montana Facilities Finance Authority, Kalispell Regional Medical Center, Revenue Bonds
Series A
4.378%, due 7/1/22 | | | 915,000 | | | | 914,982 | |
| | | | | | | | |
|
Nebraska 1.1% | |
Douglas County Hospital Authority No. 2, Children’s Hospital, Revenue Bonds
Series A
1.68%, due 8/15/32 (a) | | | 2,300,000 | | | | 2,300,000 | |
Hospital Authority No. 1 of Lancaster County, Bryan Health Medical Center, Revenue Bonds
Series B-1
1.68%, due 6/1/31 (a) | | | 2,000,000 | | | | 2,000,000 | |
| | | | | | | | |
| | | | | | | 4,300,000 | |
| | | | | | | | |
New Hampshire 0.8% | |
New Hampshire Business Finance Authority, United Illuminating Co., Revenue Bonds
Series A
2.80%, due 10/1/33 | | | 3,000,000 | | | | 2,971,350 | |
| | | | | | | | |
|
New Jersey 9.6% | |
Atlantic County Improvement Authority, Stockton University Atlantic City, Revenue Bonds
Series B, Insured: AGM
5.00%, due 9/1/20 | | | 3,745,000 | | | | 3,942,399 | |
Borough of North Plainfield NJ, Unlimited General Obligation
Insured: MAC
3.00%, due 6/1/20 | | | 330,000 | | | | 334,280 | |
Carteret Board of Education, Certificates of Participation
Insured: BAM
4.00%, due 1/15/19 | | | 315,000 | | | | 316,295 | |
| | | | |
| 16 | | MainStay MacKay Short Term Municipal Fund | | The notes to the financial statements are an integral part of,
and should be read in conjunction with, the financial statements. |
| | | | | | | | |
| | | Principal
Amount | | | Value | |
| Municipal Bonds (continued) | |
New Jersey (continued) | |
Casino Reinvestment Development Authority, Revenue Bonds
5.00%, due 11/1/18 | | $ | 255,000 | | | $ | 255,000 | |
City of Atlantic City NJ, Tax Appeal, Unlimited General Obligation
Series B, Insured: AGM
5.00%, due 3/1/20 | | | 200,000 | | | | 206,496 | |
City of Bayonne NJ, Unlimited General Obligation
Insured: AGM
4.00%, due 7/15/19 | | | 1,000,000 | | | | 1,013,440 | |
Essex County Improvement Authority, Revenue Bonds Insured: County Guaranteed
5.00%, due 10/1/19 | | | 500,000 | | | | 514,015 | |
Garden State Preservation Trust, Revenue Bonds
Series C, Insured: AGM
5.125%, due 11/1/19 | | | 3,175,000 | | | | 3,265,773 | |
Greater Egg Harbor Regional High School District, Unlimited General Obligation | | | | | | | | |
Insured: AGM
4.00%, due 2/1/19 | | | 750,000 | | | | 753,652 | |
Insured: AGM
4.00%, due 2/1/20 | | | 1,000,000 | | | | 1,022,370 | |
New Jersey Economic Development Authority, School Facilities Construction, Revenue Bonds | | | | | | | | |
Series K; Insured: AMBAC
5.25%, due 12/15/20 | | | 300,000 | | | | 315,900 | |
Series K; Insured: AMBAC
5.50%, due 12/15/19 | | | 2,000,000 | | | | 2,065,760 | |
New Jersey State Economic Development Authority, Revenue Bonds
Series A, Insured: BAM
5.00%, due 7/1/27 | | | 2,525,000 | | | | 2,846,054 | |
New Jersey Transportation Trust Fund Authority, Transportation System,
Revenue Bonds
Series B, Insured: NATL-RE
5.50%, due 12/15/20 | | | 5,000,000 | | | | 5,306,550 | |
New Jersey Turnpike Authority, Revenue Bonds
Series C-2
2.059%, due 1/1/22 (d) | | | 6,000,000 | | | | 6,008,040 | |
Passaic Valley Sewerage Commissioners, Sewer System, Revenue Bonds
Series H, Insured: AGM
5.00%, due 12/1/23 | | | 2,190,000 | | | | 2,427,593 | |
| | | | | | | | |
| | | Principal
Amount | | | Value | |
New Jersey (continued) | |
State of New Jersey, Unlimited General Obligation
Series M, Insured: AMBAC
5.50%, due 7/15/19 | | $ | 225,000 | | | $ | 230,254 | |
Tobacco Settlement Financing Corp., Revenue Bonds | | | | | | | | |
Series A
5.00%, due 6/1/19 | | | 500,000 | | | | 507,730 | |
Series A
5.00%, due 6/1/20 | | | 2,500,000 | | | | 2,597,000 | |
Series A
5.00%, due 6/1/21 | | | 500,000 | | | | 529,625 | |
Series A
5.00%, due 6/1/22 | | | 1,250,000 | | | | 1,347,025 | |
Series A
5.00%, due 6/1/23 | | | 250,000 | | | | 273,148 | |
Trenton Parking Authority, Revenue Bonds | | | | | | | | |
Series A, Insured: AGM
2.49%, due 10/1/19 | | | 170,000 | | | | 168,232 | |
Series B, Insured: AGM
4.00%, due 4/1/19 | | | 250,000 | | | | 251,870 | |
| | | | | | | | |
| | | | | | | 36,498,501 | |
| | | | | | | | |
New York 9.0% | |
City of New York, Unlimited
General Obligation
Subseries H-5
1.76%, due 3/1/34 (a) | | | 3,080,000 | | | | 3,080,000 | |
County of Rockland NY, Public
Improvement, Limited
General Obligation
Insured: AGM
2.00%, due 12/1/18 | | | 655,000 | | | | 655,052 | |
Metropolitan Transportation Authority, Revenue Bonds | | | | | | | | |
Subseries D-2
1.66%, due 11/1/35 (a) | | | 2,050,000 | | | | 2,050,000 | |
Series B-1A
5.00%, due 5/15/20 | | | 3,500,000 | | | | 3,648,540 | |
New York City Water & Sewer System,
2nd General Resolution,
Revenue Bonds
Series BB-1
1.68%, due 6/15/39 (a) | | | 1,200,000 | | | | 1,200,000 | |
New York State Housing Finance
Agency, 25 Washington Street, Revenue Bonds
Series A
1.65%, due 11/1/44 (a) | | | 5,900,000 | | | | 5,900,000 | |
New York State Housing Finance Agency,
350 West 34th Street, Revenue Bonds
Series A
1.74%, due 11/1/34 (a)(b) | | | 3,800,000 | | | | 3,800,000 | |
| | | | | | |
The notes to the financial statements are an integral part of,
and should be read in conjunction with, the financial statements. | | | | | 17 | |
Portfolio of Investments October 31, 2018 (Unaudited) (continued)
| | | | | | | | |
| | | Principal
Amount | | | Value | |
| Municipal Bonds (continued) | |
New York (continued) | |
New York Transportation Development Corp., LaGuardia Airport Terminals C&D Redevelopment Project, Revenue Bonds
5.00%, due 1/1/22 (b) | | $ | 5,000,000 | | | $ | 5,327,550 | |
Niagara Frontier Transportation Authority, Buffalo Niagara International Airport, Revenue Bonds
Series C, Insured: AGM
4.40%, due 4/1/24 | | | 3,100,000 | | | | 3,100,000 | |
Triborough Bridge & Tunnel Authority, Revenue Bonds
Series C
1.64%, due 1/1/32 (a) | | | 4,240,000 | | | | 4,240,000 | |
Westchester County Local Development Corp., Westchester Medical Center, Revenue Bonds
5.00%, due 11/1/19 | | | 1,145,000 | | | | 1,173,591 | |
| | | | | | | | |
| | | | | | | 34,174,733 | |
| | | | | | | | |
North Carolina 0.4% | |
Raleigh Durham Airport Authority, Revenue Bonds
Series C
1.56%, due 5/1/36 (a) | | | 1,400,000 | | | | 1,400,000 | |
| | | | | | | | |
|
Ohio 4.4% | |
City of Cincinnati OH, Unlimited General Obligation
Series D
1.837%, due 12/1/18 | | | 200,000 | | | | 199,830 | |
City of Toledo OH, Limited General Obligation Insured: AGM
4.00%, due 12/1/19 | | | 1,540,000 | | | | 1,570,584 | |
Cleveland Department of Public Utilities Division of Public Power, Revenue Bonds
Series A, Insured: AGM
5.00%, due 11/15/20 | | | 3,000,000 | | | | 3,155,910 | |
Lucas County Ohio Hospital Revenue, ProMedica Healthcare Obligated Group, Revenue Bonds
Series A
5.00%, due 11/15/19 | | | 500,000 | | | | 512,495 | |
Ohio Higher Educational Facilities Commission, Cleveland Clinic Health System, Revenue Bonds
Series B-2
1.70%, due 1/1/39 (a) | | | 1,400,000 | | | | 1,400,000 | |
Ohio Higher Educational Facility Commission, Otterbein University Project, Revenue Bonds
Series A
4.00%, due 12/1/19 | | | 915,000 | | | | 932,376 | |
| | | | | | | | |
| | | Principal
Amount | | | Value | |
Ohio (continued) | |
State of Ohio, Capital Facilities Lease-Appropriation, Revenue Bonds
Series C
1.70%, due 10/1/36 (a) | | $ | 8,800,000 | | | $ | 8,800,000 | |
| | | | | | | | |
| | | | | | | 16,571,195 | |
| | | | | | | | |
Pennsylvania 2.4% | |
Capital Region Water, Revenue Bonds
Series A
5.00%, due 7/15/19 | | | 1,300,000 | | | | 1,326,494 | |
Centre County Hospital Authority, Mount Nittany Medical Center, Revenue Bonds | | | | | | | | |
Series A
4.00%, due 11/15/18 | | | 100,000 | | | | 100,071 | |
Series A
4.00%, due 11/15/19 | | | 240,000 | | | | 244,500 | |
City of Reading PA, Unlimited General Obligation
Insured: BAM
4.00%, due 11/1/19 | | | 620,000 | | | | 629,474 | |
Commonwealth of Pennsylvania, Certificates of Participation | | | | | | | | |
Series A
5.00%, due 7/1/20 | | | 300,000 | | | | 311,940 | |
Series A
5.00%, due 7/1/21 | | | 350,000 | | | | 371,192 | |
Series A
5.00%, due 7/1/22 | | | 300,000 | | | | 323,145 | |
County of Beaver PA, Unlimited General Obligation
Series B, Insured: BAM
1.948%, due 11/15/18 | | | 730,000 | | | | 729,723 | |
Dauphin County General Authority, Pinnacle Health System Project, Revenue Bonds
Series A
5.00%, due 6/1/20 | | | 500,000 | | | | 520,115 | |
General Authority of Southcentral Pennsylvania, Hanover Hospital, Inc., Revenue Bonds
4.00%, due 12/1/18 | | | 185,000 | | | | 185,296 | |
Hazleton Area School District, Limited General Obligation | | | | | | | | |
Series B, Insured: BAM
2.00%, due 3/1/20 | | | 375,000 | | | | 374,066 | |
Series A, Insured: BAM
4.00%, due 3/1/20 | | | 600,000 | | | | 614,148 | |
Lancaster Higher Education Authority, Harrisburg Area Community, Revenue Bonds
Series A, Insured: BAM
5.00%, due 10/1/19 | | | 685,000 | | | | 702,687 | |
Lycoming County Authority, Pennsylvania College of Technology, Revenue Bonds
4.00%, due 10/1/19 | | | 755,000 | | | | 767,012 | |
| | | | |
| 18 | | MainStay MacKay Short Term Municipal Fund | | The notes to the financial statements are an integral part of,
and should be read in conjunction with, the financial statements. |
| | | | | | | | |
| | | Principal
Amount | | | Value | |
| Municipal Bonds (continued) | |
Pennsylvania (continued) | |
Philadelphia Gas Works Co., 1998 General Ordinance, Revenue Bonds
Series 14T
5.00%, due 10/1/19 | | $ | 750,000 | | | $ | 768,952 | |
Trinity Area School District, Unlimited General Obligation
Insured: AGM
4.00%, due 11/1/18 | | | 950,000 | | | | 950,000 | |
| | | | | | | | |
| | | | | | | 8,918,815 | |
| | | | | | | | |
Puerto Rico 2.9% | |
Commonwealth of Puerto Rico, CPI-Linked Bonds-Public Improvement, Unlimited General Obligation
Series A, Insured: AGC
3.483%, due 7/1/20 | | | 655,000 | | | | 656,637 | |
Commonwealth of Puerto Rico, Public Improvement, Unlimited General Obligation | | | | | | | | |
Insured: AGM
5.25%, due 7/1/20 | | | 900,000 | | | | 934,227 | |
Series A, Insured: NATL-RE
5.50%, due 7/1/19 | | | 3,545,000 | | | | 3,596,792 | |
Insured: AGM
5.50%, due 7/1/19 | | | 525,000 | | | | 534,623 | |
Series A, Insured: NATL-RE
5.50%, due 7/1/20 | | | 420,000 | | | | 433,440 | |
Puerto Rico Electric Power Authority, Revenue Bonds | | | | | | | | |
Series UU, Insured: NATL-RE
5.00%, due 7/1/19 | | | 290,000 | | | | 293,294 | |
Series MM, Insured: NATL-RE
5.00%, due 7/1/19 | | | 230,000 | | | | 232,613 | |
Series MM, Insured: NATL-RE
5.00%, due 7/1/20 | | | 275,000 | | | | 281,597 | |
Series N, Insured: NATL-RE
5.25%, due 7/1/19 | | | 620,000 | | | | 628,048 | |
Series L, Insured: NATL-RE
5.50%, due 7/1/19 | | | 60,000 | | | | 60,877 | |
Puerto Rico Highway & Transportation Authority, Revenue Bonds
Series AA, Insured: NATL-RE
5.50%, due 7/1/19 | | | 1,100,000 | | | | 1,116,071 | |
Puerto Rico Housing Finance Authority, Sub-Capital Fund
Program-Modernization,
Revenue Bonds
4.625%, due 12/1/18 | | | 100,000 | | | | 100,192 | |
Puerto Rico Municipal Finance Agency, Revenue Bonds | | | | | | | | |
Series A, Insured: AGM
5.00%, due 8/1/19 | | | 240,000 | | | | 244,536 | |
| | | | | | | | |
| | | Principal
Amount | | | Value | |
Puerto Rico (continued) | |
Puerto Rico Municipal Finance Agency, Revenue Bonds (continued) | | | | | | | | |
Series A, Insured: AGM
5.25%, due 8/1/19 | | $ | 250,000 | | | $ | 255,258 | |
Series C, Insured: AGM
5.25%, due 8/1/19 | | | 965,000 | | | | 983,113 | |
Puerto Rico Public Buildings Authority, Government Facilities, Revenue Bonds
Series F, Insured: NATL-RE
5.25%, due 7/1/19 | | | 800,000 | | | | 810,384 | |
| | | | | | | | |
| | | | | | | 11,161,702 | |
| | | | | | | | |
Rhode Island 0.7% | |
Rhode Island Commerce Corp., Grant Anticipation Rhode Island Department, Revenue Bonds
Series A
5.00%, due 6/15/20 | | | 1,000,000 | | | | 1,044,930 | |
Rhode Island Health & Educational Building Corp., Hospital Financing-Lifespan Obligated Group, Revenue Bonds
5.00%, due 5/15/20 | | | 1,500,000 | | | | 1,555,005 | |
| | | | | | | | |
| | | | | | | 2,599,935 | |
| | | | | | | | |
South Carolina 0.4% | |
SCAGO Educational Facilities Corp. for Williamsburg School District, Revenue Bonds
Series A, Insured: BAM
2.26%, due 12/1/18 | | | 555,000 | | | | 554,506 | |
Sumter Two School Facilities, Inc., Sumter School District Project, Revenue Bonds Insured: BAM
5.00%, due 12/1/19 | | | 1,065,000 | | | | 1,094,000 | |
| | | | | | | | |
| | | | | | | 1,648,506 | |
| | | | | | | | |
Tennessee 1.5% | |
Metropolitan Government Nashville & Davidson County Health & Educational Facilities Board, Lipscomb University Project, Revenue Bonds
Series A
4.00%, due 10/1/19 | | | 200,000 | | | | 202,982 | |
Shelby County Health Educational & Housing Facilities Board, Methodist Le Bonheur Healthcare, Revenue Bonds
Series A, Insured: AGM
1.65%, due 6/1/42 (a) | | | 5,400,000 | | | | 5,400,000 | |
| | | | | | | | |
| | | | | | | 5,602,982 | |
| | | | | | | | |
Texas 4.5% | |
City of Dallas TX, Waterworks & Sewer Systems, Revenue Bonds
Series B
2.485%, due 10/1/21 | | | 3,500,000 | | | | 3,424,260 | |
| | | | | | |
The notes to the financial statements are an integral part of,
and should be read in conjunction with, the financial statements. | | | | | 19 | |
Portfolio of Investments October 31, 2018 (Unaudited) (continued)
| | | | | | | | |
| | | Principal
Amount | | | Value | |
| Municipal Bonds (continued) | |
Texas (continued) | |
City of Houston TX, Utility System, Revenue Bonds
Series E
2.81%, due 11/15/20 | | $ | 450,000 | | | $ | 448,483 | |
Harris County Cultural Education Facilities Finance Corp., Houston Methodist Hospital, Revenue Bonds
Subseries C-2
1.70%, due 12/1/27 (a) | | | 900,000 | | | | 900,000 | |
Harris County Municipal Utility District No. 419, Unlimited
General Obligation
Insured: AGM
3.00%, due 9/1/19 | | | 735,000 | | | | 740,285 | |
State of Texas, Revenue Notes
4.00%, due 8/29/19 | | | 6,000,000 | | | | 6,095,400 | |
Texas State Public Finance Authority, Financing System Texas Southern University, Revenue Bonds | | | | | | | | |
Insured: BAM
4.00%, due 5/1/19 | | | 1,000,000 | | | | 1,008,160 | |
Insured: BAM
4.00%, due 5/1/20 | | | 1,500,000 | | | | 1,531,305 | |
Viridian Municipal Management District, Road Improvement, Unlimited General Obligation | | | | | | | | |
Insured: AGM
4.00%, due 12/1/20 | | | 505,000 | | | | 521,089 | |
Insured: AGM
4.00%, due 12/1/21 | | | 300,000 | | | | 312,894 | |
Insured: AGM
4.00%, due 12/1/22 | | | 550,000 | | | | 578,094 | |
Insured: AGM
4.00%, due 12/1/23 | | | 300,000 | | | | 316,641 | |
Viridian Municipal Management District, Utility Improvement, Unlimited General Obligation | | | | | | | | |
Insured: AGM
4.00%, due 12/1/20 | | | 260,000 | | | | 268,284 | |
Insured: AGM
4.00%, due 12/1/21 | | | 225,000 | | | | 234,670 | |
Insured: AGM
4.00%, due 12/1/22 | | | 395,000 | | | | 415,177 | |
Insured: AGM
4.00%, due 12/1/23 | | | 305,000 | | | | 321,918 | |
| | | | | | | | |
| | | | | | | 17,116,660 | |
| | | | | | | | |
U.S. Virgin Islands 0.5% | |
Virgin Islands Public Finance Authority, Revenue Bonds
Series A
5.00%, due 10/1/19 | | | 1,810,000 | | | | 1,800,950 | |
| | | | | | | | |
| | | | | | | | |
| | | Principal
Amount | | | Value | |
Utah 2.0% | |
County of Weber UT, Weber County Hospital, IHC Health Services, Inc., Revenue Bonds
Series C
1.67%, due 2/15/35 (a) | | $ | 7,500,000 | | | $ | 7,500,000 | |
| | | | | | | | |
|
Vermont 0.0%‡ | |
Vermont Educational & Health Building Financing Agency, Saint Michael’s College-Green Bond, Revenue Bonds
4.00%, due 10/1/19 | | | 130,000 | | | | 131,478 | |
| | | | | | | | |
|
Virginia 1.7% | |
Albemarle County Economic Development Authority, Sentara Martha Jefferson Hospital, Revenue Bonds
Series B
1.61%, due 10/1/48 (a) | | | 6,000,000 | | | | 6,000,000 | |
Lexington Industrial Development Authority, Kendal At Lexington, Revenue Bonds
3.00%, due 1/1/19 | | | 300,000 | | | | 300,306 | |
| | | | | | | | |
| | | | | | | 6,300,306 | |
| | | | | | | | |
Wisconsin 0.9% | |
Wisconsin State Health & Educational Facilities Authority, Advocate Aurora Health Credit Group, Revenue Bonds
Series C-2
2.05%, due 8/15/54 (d) | | | 3,500,000 | | | | 3,501,085 | |
| | | | | | | | |
Total Municipal Bonds
(Cost $369,962,808) | | | | | | | 368,866,085 | |
| | | | | | | | |
|
| U.S. Government & Federal Agencies 0.0%‡ | |
Federal National Mortgage Association
(Mortgage Pass-Through Security) 0.0%‡ | |
4.50%, due 11/1/18 | | | 28 | | | | 29 | |
| | | | | | | | |
Total U.S. Government & Federal Agencies
(Cost $28) | | | | | | | 29 | |
| | | | | | | | |
Total Long-Term Bonds
(Cost $371,962,901) | | | | | | | 370,865,991 | |
| | | | | | | | |
Total Investments
(Cost $371,962,901) | | | 97.7 | % | | | 370,865,991 | |
Other Assets, Less Liabilities | | | 2.3 | | | | 8,573,033 | |
Net Assets | | | 100.0 | % | | $ | 379,439,024 | |
| † | Percentages indicated are based on Fund net assets. |
| ‡ | Less than one-tenth of a percent. |
| (a) | Variable-rate demand notes (VRDNs)—Provide the right to sell the security at face value on either that day or within the rate-reset period. VRDNs will normally trade as if the maturity is the earlier put date, even though stated maturity is longer. The interest rate is reset on the put date |
| | | | |
| 20 | | MainStay MacKay Short Term Municipal Fund | | The notes to the financial statements are an integral part of,
and should be read in conjunction with, the financial statements. |
| | at a stipulated daily, weekly, monthly, quarterly, or other specified time interval to reflect current market conditions. These securities do not indicate a reference rate and spread in their description. The maturity date shown is the final maturity. |
| (b) | Interest on these securities was subject to alternative minimum tax. |
| (c) | May be sold to institutional investors only under Rule 144A or securities offered pursuant to Section 4(a)(2) of the Securities Act of 1933, as amended. |
| (d) | Coupon rate may change based on changes of the underlying collateral or prepayments of principal. The coupon rate shown represents the rate at period end. |
The following abbreviations are used in the preceding pages:
AGC—Assured Guaranty Corp.
AGM—Assured Guaranty Municipal Corp.
AMBAC—Ambac Assurance Corp.
BAM—Build America Mutual Assurance Co.
NATL-RE—National Public Finance Guarantee Corp.
The following is a summary of the fair valuations according to the inputs used as of October 31, 2018, for valuing the Fund’s assets:
Asset Valuation Inputs
| | | | | | | | | | | | | | | | |
Description | | Quoted
Prices in
Active
Markets for
Identical
Assets (Level 1) | | | Significant
Other
Observable
Inputs (Level 2) | | | Significant
Unobservable
Inputs (Level 3) | | | Total | |
| Investments in Securities (a) | | | | | | | | | | | | | | | | |
| Long-Term Bonds | | | | | | | | | | | | | | | | |
Corporate Bonds | | $ | — | | | $ | 1,999,877 | | | $ | — | | | $ | 1,999,877 | |
Municipal Bonds | | | — | | | | 368,866,085 | | | | — | | | | 368,866,085 | |
U.S. Government & Federal Agencies | | | — | | | | 29 | | | | — | | | | 29 | |
| | | | | | | | | | | | | | | | |
| Total Long-Term Bonds | | | — | | | | 370,865,991 | | | | — | | | | 370,865,991 | |
| | | | | | | | | | | | | | | | |
| Total Investments in Securities | | $ | — | | | $ | 370,865,991 | | | $ | — | | | $ | 370,865,991 | |
| | | | | | | | | | | | | | | | |
| (a) | For a complete listing of investments and their industries, see the Portfolio of Investments. |
| | | | | | |
The notes to the financial statements are an integral part of,
and should be read in conjunction with, the financial statements. | | | | | 21 | |
Statement of Assets and Liabilities as of October 31, 2018 (Unaudited)
| | | | |
| Assets | | | | |
Investment in securities, at value
(identified cost $371,962,901) | | $ | 370,865,991 | |
Cash | | | 1,974,747 | |
Receivables: | | | | |
Fund shares sold | | | 5,017,426 | |
Interest | | | 2,882,128 | |
Investment securities sold | | | 25,000 | |
Other assets | | | 40,822 | |
| | | | |
Total assets | | | 380,806,114 | |
| | | | |
| |
| Liabilities | | | | |
Payables: | | | | |
Fund shares redeemed | | | 1,055,186 | |
Manager (See Note 3) | | | 99,026 | |
Professional fees | | | 42,337 | |
Shareholder communication | | | 21,294 | |
NYLIFE Distributors (See Note 3) | | | 20,619 | |
Transfer agent (See Note 3) | | | 20,067 | |
Custodian | | | 2,963 | |
Trustees | | | 11 | |
Accrued expenses | | | 5,994 | |
Dividend payable | | | 99,593 | |
| | | | |
Total liabilities | | | 1,367,090 | |
| | | | |
Net assets | | $ | 379,439,024 | |
| | | | |
| |
| Composition of Net Assets | | | | |
Shares of beneficial interest outstanding (par value of $.001 per share) unlimited number of shares authorized | | $ | 39,817 | |
Additional paid-in capital | | | 381,165,007 | |
| | | | |
| | | 381,204,824 | |
Total distributable earnings (loss) | | | (1,765,800 | ) |
| | | | |
Net assets | | $ | 379,439,024 | |
| | | | |
| | | | |
Class A | | | | |
Net assets applicable to outstanding shares | | $ | 98,993,951 | |
| | | | |
Shares of beneficial interest outstanding | | | 10,386,438 | |
| | | | |
Net asset value per share outstanding | | $ | 9.53 | |
Maximum sales charge (1.00% of offering price) | | | 0.10 | |
| | | | |
Maximum offering price per share outstanding | | $ | 9.63 | |
| | | | |
Investor Class | | | | |
Net assets applicable to outstanding shares | | $ | 3,312,362 | |
| | | | |
Shares of beneficial interest outstanding | | | 346,608 | |
| | | | |
Net asset value per share outstanding | | $ | 9.56 | |
Maximum sales charge (1.00% of offering price) | | | 0.10 | |
| | | | |
Maximum offering price per share outstanding | | $ | 9.66 | |
| | | | |
Class I | | | | |
Net assets applicable to outstanding shares | | $ | 277,132,711 | |
| | | | |
Shares of beneficial interest outstanding | | | 29,083,976 | |
| | | | |
Net asset value and offering price per share outstanding | | $ | 9.53 | |
| | | | |
| | | | |
| 22 | | MainStay MacKay Short Term Municipal Fund | | The notes to the financial statements are an integral part of,
and should be read in conjunction with, the financial statements. |
Statement of Operations for the six months ended October 31, 2018 (Unaudited)
| | | | |
| Investment Income (Loss) | |
Income | | | | |
Interest | | $ | 2,871,135 | |
Other | | | 13 | |
| | | | |
Total income | | | 2,871,148 | |
| | | | |
Expenses | | | | |
Manager (See Note 3) | | | 550,601 | |
Distribution/Service—Class A (See Note 3) | | | 121,170 | |
Distribution/Service—Investor Class (See Note 3) | | | 4,197 | |
Transfer agent (See Note 3) | | | 59,616 | |
Registration | | | 40,329 | |
Professional fees | | | 37,304 | |
Shareholder communication | | | 17,205 | |
Custodian | | | 3,649 | |
Trustees | | | 3,111 | |
Miscellaneous | | | 8,416 | |
| | | | |
Total expenses before waiver/reimbursement | | | 845,598 | |
Expense waiver/reimbursement from Manager (See Note 3) | | | (60,183 | ) |
| | | | |
Net expenses | | | 785,415 | |
| | | | |
Net investment income (loss) | | | 2,085,733 | |
| | | | |
|
| Realized and Unrealized Gain (Loss) on Investments | |
Net realized gain (loss) on investments | | | (277,821 | ) |
Net change in unrealized appreciation (depreciation) on investments | | | 510,747 | |
| | | | |
Net realized and unrealized gain (loss) on investments | | | 232,926 | |
| | | | |
Net increase (decrease) in net assets resulting from operations | | $ | 2,318,659 | |
| | | | |
| | | | | | |
The notes to the financial statements are an integral part of,
and should be read in conjunction with, the financial statements. | | | | | 23 | |
Statements of Changes in Net Assets
for the six months ended October 31, 2018 (Unaudited) and the year ended April 30, 2018
| | | | | | | | |
| | | 2018 | | | 2018 | |
| Increase (Decrease) in Net Assets | |
Operations: | | | | | | | | |
Net investment income (loss) | | $ | 2,085,733 | | | $ | 3,518,928 | |
Net realized gain (loss) on investments and futures transactions | | | (277,821 | ) | | | (261,068 | ) |
Net change in unrealized appreciation (depreciation) on investments and futures contracts | | | 510,747 | | | | (1,241,965 | ) |
| | | | |
Net increase (decrease) in net assets resulting from operations | | | 2,318,659 | | | | 2,015,895 | |
| | | | |
Distributions to shareholders(1): | | | | | | | | |
Class A | | | (563,314 | ) | | | | |
Investor Class | | | (11,664 | ) | | | | |
Class I | | | (1,510,680 | ) | | | | |
| | | | | | | | |
| | | (2,085,658 | ) | | | | |
| | | | | | | | |
Dividends to shareholders from net investment income: | | | | | | | | |
Class A | | | | | | | (1,323,485 | ) |
Investor Class | | | | | | | (18,646 | ) |
Class I | | | | | | | (2,176,761 | ) |
| | | | | | | | |
| | | | | | | (3,518,892 | ) |
| | | | |
Total dividends and distributions to shareholders | | | (2,085,658 | ) | | | (3,518,892 | ) |
| | | | |
Capital share transactions: | | | | | | | | |
Net proceeds from sale of shares | | | 205,799,255 | | | | 199,137,746 | |
Net asset value of shares issued to shareholders in reinvestment of dividends | | | 1,547,864 | | | | 2,701,265 | |
Cost of shares redeemed | | | (88,433,769 | ) | | | (255,509,908 | ) |
| | | | |
Increase (decrease) in net assets derived from capital share transactions | | | 118,913,350 | | | | (53,670,897 | ) |
| | | | |
Net increase (decrease) in net assets | | | 119,146,351 | | | | (55,173,894 | ) |
| | |
| Net Assets | | | | | | | | |
Beginning of period | | | 260,292,673 | | | | 315,466,567 | |
| | | | |
End of period(2) | | $ | 379,439,024 | | | $ | 260,292,673 | |
| | | | |
| (1) | For the six-months ended October 31, 2018, the requirement to disclose dividends and distributions paid to shareholders from net investments income and/or net realized gain on investments was modified and are now presented together as distributions to shareholders. |
| (2) | End of year net assets includes undistributed (overdistributed) net investment income of $(8,709) in April 30, 2018. |
| | | | |
| 24 | | MainStay MacKay Short Term Municipal Fund | | The notes to the financial statements are an integral part of,
and should be read in conjunction with, the financial statements. |
Financial Highlights selected per share data and ratios
| | | | | | | | | | | | | | | | | | | | | | | | | | | | | | | | |
| | | Six months
ended
October 31, | | | | | | Year ended April 30, | | | November 1,
2014 through
April 30, | | | | | | Year ended
October 31, | |
| Class A | | 2018* | | | | | | 2018 | | | 2017 | | | 2016 | | | 2015** | | | | | | 2014 | |
Net asset value at beginning of period | | $ | 9.51 | | | | | | | $ | 9.56 | | | $ | 9.61 | | | $ | 9.54 | | | $ | 9.54 | | | | | | | $ | 9.59 | |
| | | | | | | | | | | | | | | | | | | | | | | | | | | | | | | | |
Net investment income (loss) (a) | | | 0.06 | | | | | | | | 0.10 | | | | 0.08 | | | | 0.07 | | | | 0.01 | | | | | | | | 0.04 | |
Net realized and unrealized gain (loss) on investments | | | 0.01 | | | | | | | | (0.05 | ) | | | (0.05 | ) | | | 0.06 | | | | 0.01 | | | | | | | | (0.03 | ) |
| | | | | | | | | | | | | | | | | | | | | | | | | | | | | | | | |
Total from investment operations | | | 0.07 | | | | | | | | 0.05 | | | | 0.03 | | | | 0.13 | | | | 0.02 | | | | | | | | 0.01 | |
| | | | | | | | | | | | | | | | | | | | | | | | | | | | | | | | |
| Less dividends and distributions: | | | | | | | | | | | | | | | | | | | | | | | | | | | | | | | | |
From net investment income | | | (0.05 | ) | | | | | | | (0.10 | ) | | | (0.08 | ) | | | (0.06 | ) | | | (0.01 | ) | | | | | | | (0.04 | ) |
From net realized gain on investments | | | — | | | | | | | | — | | | | (0.00 | )‡ | | | — | | | | (0.01 | ) | | | | | | | (0.02 | ) |
| | | | | | | | | | | | | | | | | | | | | | | | | | | | | | | | |
Total dividends and distributions | | | (0.05 | ) | | | | | | | (0.10 | ) | | | (0.08 | ) | | | (0.06 | ) | | | (0.02 | ) | | | | | | | (0.06 | ) |
| | | | | | | | | | | | | | | | | | | | | | | | | | | | | | | | |
Net asset value at end of period | | $ | 9.53 | | | | | | | $ | 9.51 | | | $ | 9.56 | | | $ | 9.61 | | | $ | 9.54 | | | | | | | $ | 9.54 | |
| | | | | | | | | | | | | | | | | | | | | | | | | | | | | | | | |
Total investment return (b) | | | 0.69 | % | | | | | | | 0.54 | % | | | 0.27 | % | | | 1.41 | % | | | 0.27 | % | | | | | | | 0.09 | % |
| Ratios (to average net assets)/Supplemental Data: | | | | | | | | | | | | | | | | | | | | | | | | | | | | | | | | |
Net investment income (loss) | | | 1.16 | %†† | | | | | | | 1.06 | % | | | 0.79 | % | | | 0.69 | % | | | 0.33 | %†† | | | | | | | 0.41 | % |
Net expenses | | | 0.71 | %†† | | | | | | | 0.80 | % | | | 0.80 | % | | | 0.80 | % | | | 0.86 | %†† | | | | | | | 0.86 | % |
Expenses (before waiver/reimbursement) | | | 0.72 | %†† | | | | | | | 0.84 | % | | | 0.84 | % | | | 0.94 | % | | | 1.24 | %†† | | | | | | | 1.07 | % |
Portfolio turnover rate | | | 38 | % | | | | | | | 69 | % | | | 85 | % | | | 66 | % | | | 7 | % | | | | | | | 30 | % |
Net assets at end of period (in 000’s) | | $ | 98,994 | | | | | | | $ | 98,982 | | | $ | 147,029 | | | $ | 111,768 | | | $ | 18,908 | | | | | | | $ | 20,086 | |
| ‡ | Less than one cent per share. |
| ** | The Fund changed its fiscal year end from October 31 to April 30. |
| (a) | Per share data based on average shares outstanding during the period. |
| (b) | Total investment return is calculated exclusive of sales charges and assumes the reinvestment of dividends and distributions. For periods of less than one year, total return is not annualized. |
| | | | | | | | | | | | | | | | | | | | | | | | | | | | | | | | |
| | | Six months
ended
October 31, | | | | | | Year ended April 30, | | | November 1,
2014 through April 30, | | | | | | Year ended
October 31, | |
| Investor Class | | 2018* | | | | | | 2018 | | | 2017 | | | 2016 | | | 2015** | | | | | | 2014 | |
Net asset value at beginning of period | | $ | 9.54 | | | | | | | $ | 9.59 | | | $ | 9.64 | | | $ | 9.56 | | | $ | 9.57 | | | | | | | $ | 9.61 | |
| | | | | | | | | | | | | | | | | | | | | | | | | | | | | | | | |
Net investment income (loss) (a) | | | 0.03 | | | | | | | | 0.06 | | | | 0.04 | | | | 0.03 | | | | (0.00 | )‡ | | | | | | | 0.01 | |
Net realized and unrealized gain (loss) on investments | | | 0.02 | | | | | | | | (0.05 | ) | | | (0.05 | ) | | | 0.07 | | | | 0.00 | ‡ | | | | | | | (0.02 | ) |
| | | | | | | | | | | | | | | | | | | | | | | | | | | | | | | | |
Total from investment operations | | | 0.05 | | | | | | | | 0.01 | | | | (0.01 | ) | | | 0.10 | | | | 0.00 | ‡ | | | | | | | (0.01 | ) |
| | | | | | | | | | | | | | | | | | | | | | | | | | | | | | | | |
| Less dividends and distributions: | | | | | | | | | | | | | | | | | | | | | | | | | | | | | | | | |
From net investment income | | | (0.03 | ) | | | | | | | (0.06 | ) | | | (0.04 | ) | | | (0.02 | ) | | | (0.00 | )‡ | | | | | | | (0.01 | ) |
From net realized gain on investments | | | — | | | | | | | | — | | | | (0.00 | )‡ | | | — | | | | (0.01 | ) | | | | | | | (0.02 | ) |
| | | | | | | | | | | | | | | | | | | | | | | | | | | | | | | | |
Total dividends and distributions | | | (0.03 | ) | | | | | | | (0.06 | ) | | | (0.04 | ) | | | (0.02 | ) | | | (0.01 | ) | | | | | | | (0.03 | ) |
| | | | | | | | | | | | | | | | | | | | | | | | | | | | | | | | |
Net asset value at end of period | | $ | 9.56 | | | | | | | $ | 9.54 | | | $ | 9.59 | | | $ | 9.64 | | | $ | 9.56 | | | | | | | $ | 9.57 | |
| | | | | | | | | | | | | | | | | | | | | | | | | | | | | | | | |
Total investment return (b) | | | 0.56 | % | | | | | | | 0.08 | % | | | (0.09 | %) | | | 1.06 | % | | | 0.02 | % | | | | | | | (0.15 | %) |
| Ratios (to average net assets)/Supplemental Data: | | | | | | | | | | | | | | | | | | | | | | | | | | | | | | | | |
Net investment income (loss) | | | 0.70 | %†† | | | | | | | 0.60 | % | | | 0.42 | % | | | 0.30 | % | | | (0.03 | %)†† | | | | | | | 0.02 | % |
Net expenses | | | 1.18 | %†† | | | | | | | 1.26 | % | | | 1.17 | % | | | 1.20 | % | | | 1.22 | %†† | | | | | | | 1.24 | % |
Expenses (before waiver/reimbursement) | | | 1.30 | %†† | | | | | | | 1.36 | % | | | 1.22 | % | | | 1.33 | % | | | 1.60 | %†† | | | | | | | 1.45 | % |
Portfolio turnover rate | | | 38 | % | | | | | | | 69 | % | | | 85 | % | | | 66 | % | | | 7 | % | | | | | | | 30 | % |
Net assets at end of period (in 000’s) | | $ | 3,312 | | | | | | | $ | 3,366 | | | $ | 3,639 | | | $ | 3,663 | | | $ | 3,552 | | | | | | | $ | 3,844 | |
| ‡ | Less than one cent per share. |
| ** | The Fund changed its fiscal year end from October 31 to April 30. |
| (a) | Per share data based on average shares outstanding during the period. |
| (b) | Total investment return is calculated exclusive of sales charges and assumes the reinvestment of dividends and distributions. For periods of less than one year, total return is not annualized. |
| | | | | | |
The notes to the financial statements are an integral part of,
and should be read in conjunction with, the financial statements. | | | | | 25 | |
Financial Highlights selected per share data and ratios
| | | | | | | | | | | | | | | | | | | | | | | | | | | | | | | | |
| | | Six months
ended
October 31, | | | | | | Year ended April 30, | | | November 1,
2014 through April 30, | | | | | | Year ended
October 31, | |
| Class I | | 2018* | | | | | | 2018 | | | 2017 | | | 2016 | | | 2015** | | | | | | 2014 | |
Net asset value at beginning of period | | $ | 9.51 | | | | | | | $ | 9.56 | | | $ | 9.61 | | | $ | 9.54 | | | $ | 9.54 | | | | | | | $ | 9.58 | |
| | | | | | | | | | | | | | | | | | | | | | | | | | | | | | | | |
Net investment income (loss) (a) | | | 0.07 | | | | | | | | 0.13 | | | | 0.10 | | | | 0.09 | | | | 0.03 | | | | | | | | 0.05 | |
Net realized and unrealized gain (loss) on investments | | | 0.01 | | | | | | | | (0.05 | ) | | | (0.05 | ) | | | 0.07 | | | | 0.01 | | | | | | | | (0.01 | ) |
| | | | | | | | | | | | | | | | | | | | | | | | | | | | | | | | |
Total from investment operations | | | 0.08 | | | | | | | | 0.08 | | | | 0.05 | | | | 0.16 | | | | 0.04 | | | | | | | | 0.04 | |
| | | | | | | | | | | | | | | | | | | | | | | | | | | | | | | | |
| Less dividends and distributions: | | | | | | | | | | | | | | | | | | | | | | | | | | | | | | | | |
From net investment income | | | (0.06 | ) | | | | | | | (0.13 | ) | | | (0.10 | ) | | | (0.09 | ) | | | (0.03 | ) | | | | | | | (0.06 | ) |
From net realized gain on investments | | | — | | | | | | | | — | | | | (0.00 | )‡ | | | — | | | | (0.01 | ) | | | | | | | (0.02 | ) |
| | | | | | | | | | | | | | | | | | | | | | | | | | | | | | | | |
Total dividends and distributions | | | (0.06 | ) | | | | | | | (0.13 | ) | | | (0.10 | ) | | | (0.09 | ) | | | (0.04 | ) | | | | | | | (0.08 | ) |
| | | | | | | | | | | | | | | | | | | | | | | | | | | | | | | | |
Net asset value at end of period | | $ | 9.53 | | | | | | | $ | 9.51 | | | $ | 9.56 | | | $ | 9.61 | | | $ | 9.54 | | | | | | | $ | 9.54 | |
| | | | | | | | | | | | | | | | | | | | | | | | | | | | | | | | |
Total investment return (b) | | | 0.95 | % | | | | | | | 0.84 | % | | | 0.54 | % | | | 1.66 | % | | | 0.40 | % | | | | | | | 0.45 | % |
| Ratios (to average net assets)/Supplemental Data: | | | | | | | | | | | | | | | | | | | | | | | | | | | | | | | | |
Net investment income (loss) | | | 1.47 | %†† | | | | | | | 1.36 | % | | | 1.04 | % | | | 0.93 | % | | | 0.56 | %†† | | | | | | | 0.66 | % |
Net expenses | | | 0.41 | %†† | | | | | | | 0.50 | % | | | 0.54 | % | | | 0.55 | % | | | 0.61 | %†† | | | | | | | 0.61 | % |
Expenses (before waiver/reimbursement) | | | 0.46 | %†† | | | | | | | 0.59 | % | | | 0.59 | % | | | 0.68 | % | | | 0.99 | %†† | | | | | | | 0.82 | % |
Portfolio turnover rate | | | 38 | % | | | | | | | 69 | % | | | 85 | % | | | 66 | % | | | 7 | % | | | | | | | 30 | % |
Net assets at end of period (in 000’s) | | $ | 277,133 | | | | | | | $ | 157,945 | | | $ | 164,798 | | | $ | 211,369 | | | $ | 30,626 | | | | | | | $ | 43,509 | |
| ‡ | Less than one cent per share. |
| ** | The Fund changed its fiscal year end from October 31 to April 30. |
| (a) | Per share data based on average shares outstanding during the period. |
| (b) | Total investment return is calculated exclusive of sales charges and assumes the reinvestment of dividends and distributions. Class I shares are not subject to sales charges. For periods of less than one year, total return is not annualized. |
| | | | |
| 26 | | MainStay MacKay Short Term Municipal Fund | | The notes to the financial statements are an integral part of,
and should be read in conjunction with, the financial statements. |
Notes to Financial Statements (Unaudited)
Note 1–Organization and Business
MainStay Funds Trust (the “Trust”) was organized as a Delaware statutory trust on April 28, 2009, and is governed by a Declaration of Trust. The Trust is registered under the Investment Company Act of 1940, as amended (the “1940 Act”), as an open-end management investment company, and is comprised of thirty-seven funds (collectively referred to as the “Funds”). These financial statements and notes relate to the Mainstay MacKay Short Term Municipal Fund (formerly known as MainStay MacKay Tax Advantaged Short Term Bond Fund) (the “Fund”), a “diversified” fund, as that term is defined in the 1940 Act, as interpreted or modified by regulatory authorities having jurisdiction, from time to time.
The Fund currently has five classes of shares registered for sale. Class I shares commenced operations on January 2, 1991. Class A shares commenced operations on January 2, 2004. Investor Class shares commenced operations on February 28, 2008. Class R6 and Class T shares were registered for sale effective as of February 28, 2017. As of October 31, 2018, Class R6 and Class T shares were not yet offered for sale.
Class A and Investor Class shares are offered at net asset value (“NAV”) per share plus an initial sales charge. No initial sales charge applies to investments of $250,000 or more (and certain other qualified purchases) in Class A and Investor Class shares. Effective August 1, 2017, a contingent deferred sales charge (“CDSC”) of 0.50% may be imposed on certain redemptions of Class A and Investor Class shares made within 12 months of the date of purchase on shares that were purchased without an initial sales charge. For purchases of Class A and Investor Class shares made from January 1, 2017, through July 31, 2017, a CDSC of 1.00% may be imposed on certain redemptions of such shares made within 24 months of the date of purchase on shares that were purchased without an initial sales charge. For purchases of Class A and Investor Class shares made prior to January 1, 2017, a CDSC of 1.00% may be imposed on certain redemptions of such shares made within one year of the date of purchase on shares that were purchased without an initial sales charge. Class I shares are offered at NAV without a sales charge. Class T shares are currently expected to be offered at NAV plus an initial sales charge. Class R6 shares are currently expected to be offered at NAV without a sales charge. As disclosed in the Fund’s prospectus, Class A shares may convert automatically to Investor Class shares and Investor Class shares may convert automatically to Class A shares. Under certain circumstances and as may be permitted by the Trust’s multiple class plan pursuant to Rule 18f-3 under the 1940 Act, specified share classes of the Fund may be converted to one or more other share classes of the Fund as disclosed in the capital share transactions within these Notes. The classes of shares have the same voting (except for issues that relate solely to one class), dividend, liquidation and other rights, and the same terms and conditions, except that under distribution plans pursuant to Rule 12b-1 under the 1940 Act, Class A, Investor Class and Class T shares are subject to a distribution and/or service fee. Class I and Class R6 shares are not subject to a distribution and/or service fee.
The Fund’s investment objective is to seek after tax total return.
Note 2–Significant Accounting Policies
The Fund is an investment company and accordingly follows the investment company accounting and reporting guidance of the Financial Accounting Standards Board (“FASB”) Accounting Standard Codification Topic 946 Financial Services—Investment Companies. The Fund prepares its financial statements in accordance with generally accepted accounting principles (“GAAP”) in the United States of America and follows the significant accounting policies described below.
(A) Securities Valuation. Investments are usually valued as of the close of regular trading on the New York Stock Exchange (the “Exchange”) (usually 4:00 p.m. Eastern time) on each day the Fund is open for business (“valuation date”).
The Board of Trustees of the Trust (the “Board”) adopted procedures establishing methodologies for the valuation of the Fund’s securities and other assets and delegated the responsibility for valuation determinations under those procedures to the Valuation Committee of the Trust (the “Valuation Committee”). The Board authorized the Valuation Committee to appoint a Valuation Subcommittee (the “Subcommittee”) to deal in the first instance with establishing the prices of securities for which market quotations are not readily available or the prices of which are not otherwise readily determinable under these procedures. The Subcommittee meets (in person, via electronic mail or via teleconference) on an as-needed basis. Subsequently, the Valuation Committee meets to ensure that actions taken by the Subcommittee were appropriate. The procedures state that, subject to the oversight of the Board and unless otherwise noted, the responsibility for the day-to-day valuation of portfolio assets (including fair value measurements for the Fund’s assets and liabilities) rests with New York Life Investment Management LLC (“New York Life Investments” or the “Manager”), aided to whatever extent necessary by the Subadvisor (as defined in Note 3(A)).
To assess the appropriateness of security valuations, the Manager, the Subadvisor or the Fund’s third-party service provider, who is subject to oversight by the Manager, regularly compares prior day prices, prices on comparable securities and the sale prices to the prior and current day prices and challenges prices with changes exceeding certain tolerance levels with third-party pricing services or broker sources. For those securities valued through either a standardized fair valuation methodology or a fair valuation measurement, the Subcommittee deals in the first instance with such valuation and the Valuation Committee reviews and affirms, if appropriate, the reasonableness of the valuation based on such methodologies and measurements on a regular basis after considering information that is reasonably available and deemed relevant by the Valuation Committee. Any action taken by the Subcommittee with respect to the valuation of a portfolio security or other asset is submitted for review and ratification (if appropriate) to the Valuation Committee and the Board at the next regularly scheduled meeting.
“Fair value” is defined as the price the Fund would reasonably expect to receive upon selling an asset or liability in an orderly transaction to an independent buyer in the principal or most advantageous market for the asset or liability. Fair value measurements are determined within a framework that establishes a three-tier hierarchy which maximizes the use of observable market data and minimizes the use of unobservable inputs to establish a classification of fair value measurements for
Notes to Financial Statements (Unaudited) (continued)
disclosure purposes. “Inputs” refer broadly to the assumptions that market participants would use in pricing the asset or liability, including assumptions about risk, such as the risk inherent in a particular valuation technique used to measure fair value using a pricing model and/or the risk inherent in the inputs for the valuation technique. Inputs may be observable or unobservable. Observable inputs reflect the assumptions market participants would use in pricing the asset or liability based on market data obtained from sources independent of the Fund. Unobservable inputs reflect the Fund’s own assumptions about the assumptions market participants would use in pricing the asset or liability based on the information available. The inputs or methodology used for valuing assets or liabilities may not be an indication of the risks associated with investing in those assets or liabilities. The three-tier hierarchy of inputs is summarized below.
| • | | Level 1—quoted prices in active markets for an identical asset or liability |
| • | | Level 2—other significant observable inputs (including quoted prices for a similar asset or liability in active markets, interest rates and yield curves, prepayment speeds, credit risk, etc.) |
| • | | Level 3—significant unobservable inputs (including the Fund’s own assumptions about the assumptions that market participants would use in measuring fair value of an asset or liability) |
The level of an asset or liability within the fair value hierarchy is based on the lowest level of an input, both individually and in the aggregate, that is significant to the fair value measurement. As of October 31, 2018, the aggregate value by input level of the Fund’s assets and liabilities is included at the end of the Fund’s Portfolio of Investments.
The Fund may use third-party vendor evaluations, whose prices may be derived from one or more of the following standard inputs, among others:
| | |
• Benchmark yields | | • Reported trades |
• Broker/dealer quotes | | • Issuer spreads |
• Two-sided markets | | • Benchmark securities |
• Bids/offers | | • Reference data (corporate actions or material event notices) |
• Industry and economic events | | • Comparable bonds |
• Monthly payment information | | |
An asset or liability for which market values cannot be measured using the methodologies described above is valued by methods deemed reasonable in good faith by the Valuation Committee, following the procedures established by the Board, to represent fair value. Under these procedures, the Fund generally uses a market-based approach which may use related or comparable assets or liabilities, recent transactions, market multiples, book values and other relevant information. The Fund may also use an income-based valuation approach in which the anticipated future cash flows of the asset or liability are discounted to calculate fair value. Discounts may also be applied due to the nature and/or duration of any restrictions on the disposition of the asset or liability. Fair value represents a good faith approximation of the value of a security. Fair value determinations involve the consideration of a number of subjective factors, an analysis of applicable facts and circumstances and the exercise of judgment. As a result, it is possible that the fair value for a security determined in good faith in accordance
with the Fund’s valuation procedures may differ from valuations for the same security determined by other funds using their own valuation procedures. Although the Fund’s valuation procedures are designed to value a security at the price the Fund may reasonably expect to receive upon the security’s sale in an orderly transaction, there can be no assurance that any fair value determination thereunder would, in fact, approximate the amount that the Fund would actually realize upon the sale of the security or the price at which the security would trade if a reliable market price were readily available. During the six-month period ended October 31, 2018, there were no material changes to the fair value methodologies.
Securities which may be valued in this manner include, but are not limited to: (i) a security for which trading has been halted or suspended; (ii) a debt security that has recently gone into default and for which there is not a current market quotation; (iii) a security of an issuer that has entered into a restructuring; (iv) a security that has been delisted from a national exchange; (v) a security for which the market price is not readily available from a third-party pricing source or, if so provided, does not, in the opinion of the Manager or the Subadvisor, reflect the security’s market value; (vi) a security subject to trading collars for which no or limited trading takes place; and (vii) a security whose principal market has been temporarily closed at a time when, under normal conditions, it would be open. Securities valued in this manner are generally categorized as Level 3 in the hierarchy. As of October 31, 2018, there were no securities held by the Fund that were fair valued in such a manner.
Municipal debt securities are valued at the evaluated mean prices supplied by a pricing agent or broker selected by the Manager, in consultation with the Subadvisor. Those values reflect broker-dealer supplied prices and electronic data processing techniques, if the evaluated bid or mean prices are deemed by the Manager, in consultation with the Subadvisor, to be representative of market values, at the regular close of trading of the Exchange on each valuation date. Debt securities purchased on a delayed delivery basis are marked to market daily until settlement at the forward settlement date. Municipal debt securities are generally categorized as Level 2 in the hierarchy.
Investments in mutual funds, including money market funds, are valued at their respective NAVs as of the close of the Exchange on the valuation date. These securities are generally categorized as Level 1 in the hierarchy.
Temporary cash investments acquired in excess of 60 days to maturity at the time of purchase are valued using the latest bid prices or using valuations based on a matrix system (which considers such factors as security prices, yields, maturities and ratings), both as furnished by independent pricing services. Other temporary cash investments which mature in 60 days or less at the time of purchase (“Short-Term Investments”) are valued using the amortized cost method of valuation, unless the use of such method would be inappropriate. The amortized cost method involves valuing a security at its cost on the date of purchase and thereafter assuming a constant amortization to maturity of the difference between such cost and the value on maturity date. Amortized cost approximates the current fair value of a security. Securities valued using the amortized cost method are not valued using quoted prices in an active market and are generally categorized as Level 2 in the hierarchy.
| | |
| 28 | | MainStay MacKay Short Term Municipal Fund |
The information above is not intended to reflect an exhaustive list of the methodologies that may be used to value portfolio investments. The valuation procedures permit the use of a variety of valuation methodologies in connection with valuing portfolio investments. The methodology used for a specific type of investment may vary based on the market data available or other considerations. The methodologies summarized above may not represent the specific means by which portfolio investments are valued on any particular business day.
(B) Income Taxes. The Fund’s policy is to comply with the requirements of the Internal Revenue Code of 1986, as amended (the “Internal Revenue Code”), applicable to regulated investment companies and to distribute all of its taxable income to the shareholders of the Fund within the allowable time limits. Therefore, no federal, state and local income tax provisions are required.
Management evaluates the Fund’s tax positions to determine if the tax positions taken meet the minimum recognition threshold in connection with accounting for uncertainties in income tax positions taken or expected to be taken for the purposes of measuring and recognizing tax liabilities in the financial statements. Recognition of tax benefits of an uncertain tax position is permitted only to the extent the position is “more likely than not” to be sustained assuming examination by taxing authorities. Management has analyzed the Fund’s tax positions taken on federal, state and local income tax returns for all open tax years (for up to three tax years) and has concluded that no provisions for federal, state and local income tax are required in the Fund’s financial statements. The Fund’s federal, state and local income tax and federal excise tax returns for tax years for which the applicable statutes of limitations have not expired are subject to examination by the Internal Revenue Service and state and local departments of revenue.
(C) Dividends and Distributions to Shareholders. Dividends and distributions are recorded on the ex-dividend date. The Fund intends to declare dividends from net investment income, if any, daily and intends to pay them at least monthly and distributions from net realized capital and currency gains, if any, at least annually. Unless the shareholder elects otherwise, all dividends and distributions are reinvested in the same class of shares of the Fund, at NAV. Dividends and distributions to shareholders are determined in accordance with federal income tax regulations and may differ from determinations using GAAP.
(D) Security Transactions and Investment Income. The Fund records security transactions on the trade date. Realized gains and losses on security transactions are determined using the identified cost method. Interest income is accrued as earned using the effective interest rate method and includes any realized gains and losses from repayments of principal on mortgage-backed securities. Discounts and premiums on securities purchased, other than Short Term Investments, for the Fund are accreted and amortized, respectively, on the effective interest rate method over the life of the respective securities. Discounts and premiums on Short-Term Investments are accreted and amortized, respectively, on the straight-line method. The straight-line method approximates the effective interest method for Short-Term Investments.
Investment income and realized and unrealized gains and losses on investments of the Fund are allocated pro rata to the separate classes of shares based upon their relative net assets on the date the income is earned or realized and unrealized gains and losses are incurred.
The Fund may place a debt security on non-accrual status and reduce related interest income by ceasing current accruals and writing off all or a portion of any interest receivables when the collection of all or a portion of such interest has become doubtful. A debt security is removed from non-accrual status when the issuer resumes interest payments or when collectability of interest is reasonably assured.
(E) Expenses. Expenses of the Trust are allocated to the individual Funds in proportion to the net assets of the respective Funds when the expenses are incurred, except where direct allocations of expenses can be made. Expenses (other than transfer agent expenses and fees incurred under the shareholder services plans and/or the distribution plans further discussed in Note 3(B)) are allocated to separate classes of shares pro rata based upon their relative net assets on the date the expenses are incurred. The expenses borne by the Fund, including those of related parties to the Fund, are shown in the Statement of Operations.
(F) Use of Estimates. In preparing financial statements in conformity with GAAP, management makes estimates and assumptions that affect the reported amounts and disclosures in the financial statements. Actual results could differ from those estimates.
(G) Repurchase Agreements. The Fund may enter into repurchase agreements (i.e., buy a security from another party with the agreement that it be sold back in the future) to earn income. The Fund may enter into repurchase agreements only with counterparties, usually financial institutions, that are deemed by the Manager or the Subadvisors to be creditworthy, pursuant to guidelines established by the Board. During the term of any repurchase agreement, the Manager or the Subadvisors will continue to monitor the creditworthiness of the counterparty. Under the 1940 Act, repurchase agreements are considered to be collateralized loans by the Fund to the counterparty secured by the securities transferred to the Fund.
Repurchase agreements are subject to counterparty risk, meaning the Fund could lose money by the counterparty’s failure to perform under the terms of the agreement. The Fund mitigates this risk by ensuring the repurchase agreement is collateralized by cash, U.S. government securities, fixed income securities and/or other securities. The collateral is held by the Fund’s custodian and valued daily on a mark to market basis to determine if the value, including accrued interest, exceeds the repurchase price. In the event of the counterparty’s default on the obligation to repurchase, the Fund has the right to liquidate the collateral and apply the proceeds in satisfaction of the obligation. Under certain circumstances, such as in the event of default or bankruptcy by the counterparty, realization and/or retention of the collateral may be limited or subject to delay, to legal proceedings and possible realized loss to the Fund. As of October 31, 2018, the fund did not hold any repurchase agreements.
(H) Dollar Rolls. The Fund may enter into dollar roll transactions in which it sells mortgage-backed securities (“MBS”) from its portfolio to a counterparty from whom it simultaneously agrees to buy a similar security on a delayed delivery basis. The Fund generally transfers MBS where the MBS are “to be announced,” therefore, the Fund accounts for these transactions as purchases and sales.
The securities sold in connection with the dollar rolls are removed from the portfolio and a realized gain or loss is recognized. The securities the
Notes to Financial Statements (Unaudited) (continued)
Fund has agreed to acquire are included at market value in the Portfolio of Investments and liabilities for such purchase commitments are included as payables for investments purchased. During the roll period, the Fund foregoes principal and interest paid on the securities. The Fund is compensated by the difference between the current sales price and the forward price for the future as well as by the earnings on the cash proceeds of the initial sale. Dollar rolls may be renewed without physical delivery of the securities subject to the contract. The Fund maintains liquid assets from its portfolio having a value not less than the repurchase price, including accrued interest. Dollar roll transactions involve certain risks, including the risk that the securities returned to the Fund at the end of the roll period, while substantially similar, could be inferior to what was initially sold to the counterparty. The Fund accounts for a dollar roll transaction as a purchase and sale whereby the difference in the sales price and purchase price of the security sold is recorded as a realized gain (loss).
(I) Securities Lending. In order to realize additional income, the Fund may engage in securities lending, subject to the limitations set forth in the 1940 Act and relevant guidance by the staff of the Securities and Exchange Commission (“SEC”). In the event the Fund does engage in securities lending, the Fund will lend through its custodian, State Street Bank and Trust Company (“State Street”). State Street will manage the Fund’s collateral in accordance with the lending agreement between the Fund and State Street, and indemnify the Fund against counterparty risk. The loans will be collateralized by U.S. Treasury securities and/or U.S. Government Agency securities issued or guaranteed by the United States government or its agencies or instrumentalities at least equal at all times to the market value of the securities loaned. The Fund may bear the risk of delay in recovery of, or loss of rights in, the securities loaned should the borrower of the securities experience financial difficulty. The Fund may also record a realized gain or loss on securities deemed sold due to a borrower’s inability to return securities on loan. The Fund bears the risk of any loss on investment of the collateral. The Fund will receive compensation for lending its securities in the form of fees or it will retain a portion of interest on the investment of any cash received as collateral. The Fund will also continue to receive interest and dividends on the securities loaned and any gain or loss in the market price of the securities loaned that may occur during the term of the loan will be for the account of the Fund. As of October 31, 2018, the Fund did not have any portfolio securities on loan.
(J) Debt Securities Risk. The ability of issuers of debt securities held by the Fund to meet their obligations may be affected by, among other things, economic or political developments in a specific country, industry or region.
(K) Municipal Bond Risk. The Fund may invest a substantial amount of its assets in municipal bonds whose interest is paid solely from revenues of similar projects. If the Fund concentrates its investments in this manner, it assumes the legal and economic risks relating to such projects that may have a significant impact on the Fund’s investment performance. In addition, the Fund may invest more heavily in bonds from certain cities, states or regions than others, which may increase the Fund’s exposure to losses resulting from economic, political, or regulatory occurrences impacting these particular cities, states or regions.
Certain of the issuers in which the Fund may invest have recently experienced, or may experience, significant financial difficulties and repeated credit rating downgrades. On May 3, 2017, the Commonwealth of Puerto Rico began proceedings to seek bankruptcy-type protections from approximately $74 billion in debt and approximately $48 billion in unfunded pension obligations. Puerto Rico’s debt restructuring of $122 billion is significantly larger than the previous largest U.S. public bankruptcy, which covered approximately $18 billion of debt for the city of Detroit. Puerto Rico’s debt restructuring process and other economic factors or developments could occur rapidly and may significantly affect the value of municipal securities of Puerto Rico. The Fund’s vulnerability to potential losses associated with such developments may be reduced through investing in municipal securities that feature credit enhancements (such as bond insurance). The bond insurance provider pays both principal and interest when due to the bond holder. The magnitude of Puerto Rico’s debt restructuring or other adverse economic developments could pose significant strains on the ability of municipal securities insurers to meet all future claims. As of October 31, 2018, 94.4% of the Puerto Rico municipal securities held by the Fund were insured.
(L) Indemnifications. Under the Trust’s organizational documents, its officers and trustees are indemnified against certain liabilities that may arise out of performance of their duties to the Trust. Additionally, in the normal course of business, the Fund enters into contracts with third-party service providers that contain a variety of representations and warranties and which may provide general indemnifications. The Fund’s maximum exposure under these arrangements is unknown, as this would involve future claims that may be made against the Fund that have not yet occurred. Based on experience, management is of the view that the risk of loss in connection with these potential indemnification obligations is remote. However, there can be no assurance that material liabilities related to such obligations will not arise in the future, which could adversely impact the Fund.
Note 3–Fees and Related Party Transactions
(A) Manager and Subadvisor. New York Life Investments, a registered investment adviser and an indirect, wholly-owned subsidiary of New York Life Insurance Company (“New York Life”), serves as the Fund’s Manager, pursuant to an Amended and Restated Management Agreement (“Management Agreement”). The Manager provides offices, conducts clerical, recordkeeping and bookkeeping services and keeps most of the financial and accounting records required to be maintained by the Fund. Except for the portion of salaries and expenses that are the responsibility of the Fund, the Manager pays the salaries and expenses of all personnel affiliated with the Fund and certain operational expenses of the Fund. The Fund reimburses New York Life Investments in an amount equal to a portion of the compensation of the Chief Compliance Officer attributable to the Fund. MacKay Shields LLC (“MacKay Shields” or the “Subadvisor”), a registered investment adviser and an indirect, wholly-owned subsidiary of New York Life, serves as Subadvisor to the Fund and is responsible for the day-to-day portfolio management of the Fund. Pursuant to the terms of an Amended and Restated Subadvisory Agreement (“Subadvisory Agreement”) between New York Life Investments and MacKay Shields, New York Life Investments pays for the services of the Subadvisor.
Under the Management Agreement, the Fund pays the Manager a monthly fee for the services performed and the facilities furnished at an
| | |
| 30 | | MainStay MacKay Short Term Municipal Fund |
annual rate of the Fund’s average daily net assets as follows: 0.35% on all assets. Prior to May 22, 2018, the Fund paid the Manager a monthly fee for the services performed and the facilities furnished at 0.45% on all assets. During the six-month period ended October 31, 2018, the effective management fee rate was 0.36%.
New York Life Investments has contractually agreed to waive fees and/or reimburse expenses so that Total Annual Fund Operating Expenses (excluding taxes, interest, litigation, extraordinary expenses, brokerage and other transaction expenses relating to the purchase or sale of portfolio investments and acquired (underlying) fund fees and expenses) do not exceed: Class A, 0.70% and Class I, 0.40% of its average daily net assets. New York Life Investments will apply an equivalent waiver or reimbursement, in an equal number of basis points of the Class A shares waiver/reimbursement, to Investor Class shares. New York Life Investments will waive fees and/or reimburse expenses so that Class R6 fees and expenses do not exceed those of Class I. This agreement will remain in effect until August 28, 2019, and shall renew automatically for one-year terms unless New York Life Investments provides written notice of termination prior to the start of the next term or upon approval of the Board.
Prior to May 22, 2018, New York Life Investments had contractually agreed to waive fees and/or reimburse expenses so that Total Annual Fund Operating Expenses did not exceed the following percentages of average daily net assets: Class A, 0.80% and Class I, 0.50% of its average daily net assets. New York Life Investments applied an equivalent waiver or reimbursement based on Class A, in an equal number of basis points to Investor Class. New York Life Investments waive fees and/or reimburse expenses so that Class R6 fees and expenses did not exceed those of Class I.
During the six-month period ended October 31, 2018, New York Life Investments earned fees from the Fund in the amount of $550,601 and waived its fees and/or reimbursed expenses in the amount of $60,183.
State Street provides sub-administration and sub-accounting services to the Fund pursuant to an agreement with New York Life Investments. These services include calculating the daily NAVs of the Fund, maintaining the general ledger and sub-ledger accounts for the calculation of the Fund’s NAVs and assisting New York Life Investments in conducting various aspects of the Fund’s administrative operations. For providing these services to the Fund, State Street is compensated by New York Life Investments.
Effective December 22, 2017, pursuant to an agreement between the Trust and New York Life Investments, New York Life Investments is responsible for providing or procuring certain regulatory reporting services for the Fund. The Fund will reimburse New York Life Investments for the actual costs incurred by New York Life Investments in connection with providing or procuring these services for the Fund.
(B) Distribution and Service Fees. The Trust, on behalf of the Fund, has entered into a distribution agreement with NYLIFE Distributors LLC (the “Distributor”), an indirect, wholly-owned subsidiary of New York Life. The Fund has adopted distribution plans (the “Plans”) in accordance with the provisions of Rule 12b-1 under the 1940 Act.
Pursuant to the Class A and Investor Class Plans, the Distributor receives a monthly distribution fee from the Class A and Investor Class
shares at an annual rate of 0.25% of the average daily net assets of the Class A and Investor Class shares for distribution and/or service activities as designated by the Distributor. Class I shares are not subject to a distribution and/or service fee.
The Plans provide that the distribution and service fees are payable to the Distributor regardless of the amounts actually expended by the Distributor for distribution of the Fund’s shares and service activities.
(C) Sales Charges. During the six-month period ended October 31, 2018, the Fund was advised by the Distributor that the amount of initial sales charges retained on sales of Class A and Investor Class shares were $5,350 and $457, respectively.
During the six-month period ended October 31, 2018, the Fund was also advised that the Distributor retained CDSCs on redemptions of Class A and Investor Class shares of $7,507 and $21, respectively.
(D) Transfer, Dividend Disbursing and Shareholder Servicing Agent. NYLIM Service Company LLC, an affiliate of New York Life Investments, is the Fund’s transfer, dividend disbursing and shareholder servicing agent pursuant to an agreement between NYLIM Service Company LLC and the Trust. NYLIM Service Company LLC has entered into an agreement with DST Asset Manager Solutions, Inc. (“DST”), pursuant to which DST performs certain transfer agent services on behalf of NYLIM Service Company LLC. During the six-month period ended October 31, 2018, transfer agent expenses incurred by the Fund were as follows:
| | | | |
Class A | | $ | 15,994 | |
Investor Class | | | 10,288 | |
Class I | | | 33,334 | |
(E) Small Account Fee. Shareholders with small accounts adversely impact the cost of providing transfer agency services. In an effort to reduce total transfer agency expenses, the Fund has implemented a small account fee on certain types of accounts. Certain shareholders with an account balance of less than $1,000 are charged an annual per account fee of $20 (assessed semi-annually), the proceeds from which offset transfer agent fees as reflected in the Statement of Operations.
(F) Capital. As of October 31, 2018, New York Life and its affiliates beneficially held shares of the Fund with the values and percentages of net assets as follows:
| | | | | | | | |
Class A | | $ | 15,648,235 | | | | 15.8 | % |
Note 4–Federal Income Tax
As of October 31, 2018, the cost and unrealized appreciation (depreciation) of the Fund’s investment portfolio, including applicable derivative contracts and other financial instruments, as determined on a federal income tax basis, were as follows:
| | | | | | | | | | | | | | | | |
| | | Federal Tax
Cost | | | Gross
Unrealized
Appreciation | | | Gross
Unrealized
(Depreciation) | | | Net
Unrealized
Appreciation/
(Depreciation) | |
Investments in
Securities | | $ | 371,962,900 | | | $ | 121,663 | | | $ | (1,218,572 | ) | | $ | (1,096,909 | ) |
Notes to Financial Statements (Unaudited) (continued)
As of April 30, 2018, for federal income tax purposes, capital loss carryforwards of $382,435 were available as shown in the table below, to the extent provided by the regulations to offset future realized gains of the Fund through the years indicated. To the extent that these capital loss carryforwards are used to offset future capital gains, it is probable that the capital gains so offset will not be distributed to shareholders. No capital gain distributions shall be made until any capital loss carryforwards have been fully utilized.
| | | | |
Capital Loss
Available Through | | Short-Term
Capital Loss
Amounts (000’s) | | Long-Term
Capital Loss
Amounts (000’s) |
| Unlimited | | $229 | | $153 |
During the year ended April 30, 2018, the tax character of distributions paid as reflected in the Statements of Changes in Net Assets were as follows:
| | | | |
| | | 2018 | |
Distributions paid from: | | | | |
Ordinary Income | | $ | 650,578 | |
Exempt Interest Dividends | | | 2,868,314 | |
| Total | | $ | 3,518,892 | |
Note 5–Custodian
State Street is the custodian of cash and securities held by the Fund. Custodial fees are charged to the Fund based on the Fund’s net assets and/or the market value of securities held by the Fund and the number of certain transactions incurred by the Fund.
Note 6–Line of Credit
The Fund and certain other funds managed by New York Life Investments maintain a line of credit with a syndicate of banks in order to secure a source of funds for temporary purposes to meet unanticipated or excessive redemption requests.
Effective July 31, 2018, under the credit agreement (the “Credit Agreement”), the aggregate commitment amount is $600,000,000 with an additional uncommitted amount of $100,000,000. The commitment fee is an annual rate of 0.15% of the average commitment amount payable quarterly, regardless of usage, to State Street, who serves as the agent to the syndicate. The commitment fee is allocated among the Fund and certain other funds managed by New York Life Investments based upon their respective net assets and other factors. Interest on any revolving credit loan is charged based upon the Federal Funds Rate or the one-month London Interbank Offered Rate (“LIBOR”), whichever is higher. The Credit Agreement expires on July 30, 2019, although the Fund, certain other funds managed by New York Life Investments and the syndicate of banks may renew the Credit Agreement for an additional year on the same or different terms. Prior to July 31, 2018, the aggregate commitment amount and the commitment fee were the same as those under the current Credit Agreement. During the six-month period ended October 31, 2018, there were no borrowings made or outstanding with respect to the Fund under the Credit Agreement.
Note 7–Interfund Lending Program
Pursuant to an exemptive order issued by the SEC, the Fund, along with certain other funds managed by New York Life Investments, may participate in an interfund lending program. The interfund lending program provides an alternative credit facility that permits the Fund and certain other funds managed by New York Life Investments to lend or borrow money for temporary purposes directly to or from one another subject to the conditions of the exemptive order. During the six-month period ended October 31, 2018, there were no interfund loans made or outstanding with respect to the Fund.
Note 8–Purchases and Sales of Securities (in 000’s)
During the six-month period ended October 31, 2018, purchases and sales of U.S. government securities were $2 and $0, respectively. Purchases and sales of securities, other than U.S. government securities and short-term securities, were $212,272 and $115,027, respectively.
Note 9–Capital Share Transactions
| | | | | | | | |
Class A | | Shares | | | Amount | |
Six-month period ended October 31, 2018: | | | | | | | | |
Shares sold | | | 4,146,527 | | | $ | 39,568,924 | |
Shares issued to shareholders in reinvestment of dividends and distributions | | | 52,050 | | | | 496,903 | |
Shares redeemed | | | (4,246,641 | ) | | | (40,538,265 | ) |
| | | | | | | | |
Net increase (decrease) in shares outstanding before conversion | | | (48,064 | ) | | | (472,438 | ) |
Shares converted into Class A (See Note 1) | | | 63,133 | | | | 602,654 | |
Shares converted from Class A (See Note 1) | | | (31,341 | ) | | | (299,130 | ) |
| | | | | | | | |
Net increase (decrease) | | | (16,272 | ) | | $ | (168,914 | ) |
| | | | | | | | |
Year ended April 30, 2018: | | | | | | | | |
Shares sold | | | 8,984,696 | | | $ | 85,804,850 | |
Shares issued to shareholders in reinvestment of dividends and distributions | | | 120,693 | | | | 1,152,427 | |
Shares redeemed | | | (14,220,228 | ) | | | (135,757,525 | ) |
| | | | | | | | |
Net increase (decrease) in shares outstanding before conversion | | | (5,114,839 | ) | | | (48,800,248 | ) |
Shares converted into Class A (See Note 1) | | | 168,731 | | | | 1,615,538 | |
Shares converted from Class A (See Note 1) | | | (23,019 | ) | | | (219,630 | ) |
| | | | | | | | |
Net increase (decrease) | | | (4,969,127 | ) | | $ | (47,404,340 | ) |
| | | | | | | | |
| | |
| 32 | | MainStay MacKay Short Term Municipal Fund |
| | | | | | | | |
Investor Class | | Shares | | | Amount | |
Six-month period ended October 31, 2018: | | | | | | | | |
Shares sold | | | 166,402 | | | $ | 1,592,989 | |
Shares issued to shareholders in reinvestment of dividends and distributions | | | 1,150 | | | | 11,003 | |
Shares redeemed | | | (135,224 | ) | | | (1,294,061 | ) |
| | | | | | | | |
Net increase (decrease) in shares outstanding before conversion | | | 32,328 | | | | 309,931 | |
Shares converted into Investor Class (See Note 1) | | | 24,447 | | | | 233,961 | |
Shares converted from Investor Class (See Note 1) | | | (62,968 | ) | | | (602,654 | ) |
| | | | | | | | |
Net increase (decrease) | | | (6,193 | ) | | $ | (58,762 | ) |
| | | | | | | | |
Year ended April 30, 2018: | | | | | | | | |
Shares sold | | | 295,685 | | | $ | 2,827,195 | |
Shares issued to shareholders in reinvestment of dividends and distributions | | | 1,842 | | | | 17,635 | |
Shares redeemed | | | (178,863 | ) | | | (1,710,869 | ) |
| | | | | | | | |
Net increase (decrease) in shares outstanding before conversion | | | 118,664 | | | | 1,133,961 | |
Shares converted into Investor Class (See Note 1) | | | 22,971 | | | | 219,630 | |
Shares converted from Investor Class (See Note 1) | | | (168,362 | ) | | | (1,615,538 | ) |
| | | | | | | | |
Net increase (decrease) | | | (26,727 | ) | | $ | (261,947 | ) |
| | | | | | | | |
| | |
| | | | | | | | |
Class I | | Shares | | | Amount | |
Six-month period ended October 31, 2018: | | | | | | | | |
Shares sold | | | 17,251,150 | | | $ | 164,637,342 | |
Shares issued to shareholders in reinvestment of dividends and distributions | | | 108,948 | | | | 1,039,958 | |
Shares redeemed | | | (4,886,895 | ) | | | (46,601,443 | ) |
| | | | | | | | |
Net increase (decrease) in shares outstanding before conversion | | | 12,473,203 | | | | 119,075,857 | |
Shares converted into Class I (See Note 1) | | | 6,817 | | | | 65,169 | |
| | | | | | | | |
Net increase (decrease) | | | 12,480,020 | | | $ | 119,141,026 | |
| | | | | | | | |
Year ended April 30, 2018: | | | | | | | | |
Shares sold | | | 11,577,783 | | | $ | 110,505,701 | |
Shares issued to shareholders in reinvestment of dividends and distributions | | | 160,452 | | | | 1,531,203 | |
Shares redeemed | | | (12,369,327 | ) | | | (118,041,514 | ) |
| | | | | | | | |
Net increase (decrease) | | | (631,092 | ) | | $ | (6,004,610 | ) |
| | | | | | | | |
Note 10–Recent Accounting Pronouncement
In March 2017, the Financial Accounting Standards Board issued an Accounting Standards Update, ASU 2017-08, which amends the amortization period for certain callable debt securities that are held at a premium. The amendment requires the premium to be amortized to the earliest call date. This amendment does not require an accounting change for securities held at a discount. This guidance is effective for fiscal years beginning after December 15, 2018. Management is currently evaluating the potential impact of this guidance to the financial statements.
Note 11–Subsequent Events
In connection with the preparation of the financial statements of the Fund as of and for the six-month period ended October 31, 2018, events and transactions subsequent to October 31, 2018, through the date the financial statements were issued have been evaluated by the Fund’s management for possible adjustment and/or disclosure. No subsequent events requiring financial statement adjustment or disclosure have been identified.
Proxy Voting Policies and Procedures and Proxy Voting Record
A description of the policies and procedures that New York Life Investments uses to vote proxies related to the Fund’s securities is available without charge, upon request, by visiting the MainStay Funds’ website at nylinvestments.com/funds or on the SEC’s website at www.sec.gov.
The Fund is required to file with the SEC its proxy voting records for the 12-month period ending June 30 on Form N-PX. The most recent Form N-PX or proxy voting record is available free of charge upon request by calling 800-MAINSTAY (624-6782); visiting the MainStay Funds’ website at nylinvestments.com/funds; or on the SEC’s website at www.sec.gov.
Shareholder Reports and Quarterly Portfolio Disclosure
The Fund is required to file its complete schedule of portfolio holdings with the SEC for its first and third fiscal quarters on Form N-Q. The Fund’s Form N-Q is available without charge, on the SEC’s website at www.sec.gov or by calling New York Life Investments at 800-MAINSTAY (624-6782).
| | |
| 34 | | MainStay MacKay Short Term Municipal Fund |
MainStay Funds
Equity
U.S. Equity
MainStay Epoch U.S. All Cap Fund
MainStay Epoch U.S. Equity Yield Fund
MainStay Epoch U.S. Small Cap Fund
MainStay Large Cap Growth Fund
MainStay MacKay Common Stock Fund
MainStay MacKay Growth Fund
MainStay MacKay S&P 500 Index Fund
MainStay MacKay U.S. Equity Opportunities Fund
MainStay MAP Equity Fund
International Equity
MainStay Epoch International Choice Fund
MainStay MacKay International Equity Fund
MainStay MacKay International Opportunities Fund
Emerging Markets Equity
MainStay Candriam Emerging Markets Equity Fund
MainStay MacKay Emerging Markets Equity Fund
Global Equity
MainStay Epoch Capital Growth Fund
MainStay Epoch Global Choice Fund
MainStay Epoch Global Equity Yield Fund
Fixed Income
Taxable Income
MainStay Floating Rate Fund
MainStay Indexed Bond Fund
MainStay MacKay Emerging Markets Debt Fund
MainStay MacKay Government Fund
MainStay MacKay High Yield Corporate Bond Fund
MainStay MacKay Short Duration High Yield Fund
MainStay MacKay Total Return Bond Fund
MainStay MacKay Unconstrained Bond Fund
Tax-Exempt Income
MainStay MacKay California Tax Free Opportunities Fund1
MainStay MacKay High Yield Municipal Bond Fund
MainStay MacKay New York Tax Free Opportunities Fund2
MainStay MacKay Short Term Municipal Fund3
MainStay MacKay Tax Free Bond Fund
Money Market
MainStay Money Market Fund
Mixed Asset
MainStay Absolute Return Multi-Strategy Fund4
MainStay Balanced Fund
MainStay Income Builder Fund
MainStay MacKay Convertible Fund
Speciality
MainStay Cushing Energy Income Fund
MainStay Cushing MLP Premier Fund
MainStay Cushing Renaissance Advantage Fund
Asset Allocation/Target Date
MainStay Conservative Allocation Fund
MainStay Growth Allocation Fund
MainStay Moderate Allocation Fund
MainStay Moderate Growth Allocation Fund
MainStay Retirement 2010 Fund
MainStay Retirement 2020 Fund
MainStay Retirement 2030 Fund
MainStay Retirement 2040 Fund
MainStay Retirement 2050 Fund
MainStay Retirement 2060 Fund
Manager
New York Life Investment Management LLC
New York, New York
Subadvisors
Candriam Belgium S.A.5
Brussels, Belgium
Candriam France S.A.S.5
Paris, France
Cushing Asset Management, LP
Dallas, Texas
Epoch Investment Partners, Inc.
New York, New York
MacKay Shields LLC5
New York, New York
Markston International LLC
White Plains, New York
NYL Investors LLC5
New York, New York
Winslow Capital Management, LLC
Minneapolis, Minnesota
Legal Counsel
Dechert LLP
Washington, District of Columbia
Independent Registered Public Accounting Firm
KPMG LLP
Philadelphia, Pennsylvania
| 1. | | Class A and Class I shares of this Fund are registered for sale in AZ, CA, MI, NV, OR, TX, UT and WA. Class I shares are registered for sale in CO, FL, GA, HI, ID, MA, MD, NH, NJ and NY. |
2. This Fund is registered for sale in CA, CT, DE, FL, MA, NJ, NY and VT.
3. Formerly known as MainStay MacKay Tax Advantaged Short Term Bond Fund.
4. This Fund was liquidated on November 30, 2018.
5. An affiliate of New York Life Investment Management LLC.
Not part of the Semiannual Report
For more information
800-MAINSTAY (624-6782)
nylinvestments.com/funds
New York Life Investments is a service mark and name under which New York Life Investment Management LLC does business. New York Life Investments, an indirect subsidiary of New York Life Insurance Company, New York, NY 10010, provides investment advisory products and services. The MainStay Funds® are managed by New York Life Investment Management LLC and distributed by NYLIFE Distributors LLC, 30 Hudson Street, Jersey City, NJ 07302, a wholly owned subsidiary of New York Life Insurance Company. NYLIFE Distributors LLC is a Member FINRA/SIPC.
This report may be distributed only when preceded or accompanied by a current Fund prospectus.
©2018 NYLIFE Distributors LLC. All rights reserved.
| | |
| 1716479 MS293-18 | | MSTAS10-12/18 (NYLIM) NL0B5 |
MainStay Absolute Return Multi-Strategy Fund
Message from the President and Semiannual Report
Unaudited | October 31, 2018

| | | | | | | | |
| Not FDIC/NCUA Insured | | Not a Deposit | | May Lose Value | | No Bank Guarantee | | Not Insured by Any Government Agency |

This page intentionally left blank
Message from the President
U.S. stocks provided mixed returns during the six months ended October 31, 2018.
Within the U.S. stock market, large-cap stocks tended to outperform their smaller-cap counterparts, while growth stocks outperformed value-oriented issues. Among large-cap industry sectors, consumer staples and health care led the market’s advance, followed by utilities, real estate and information technology. Basic materials and energy underperformed broad market averages by the greatest margin, with financials, industrials and consumer discretionary lagging to a lesser degree. Communications services ended the reporting period unchanged.
Strong U.S. economic growth and rising levels of corporate earnings supported the stock market’s gains during the first five months of the reporting period. U.S. gross domestic product (GDP), a measure of economic growth, expanded at its fastest rate since 2000 during the reporting period, while wages surged and unemployment dipped to levels not seen in 49 years. U.S. corporate sales and earnings also significantly exceeded expectations, supported, in part, by a business-friendly tax bill signed into law on December 22, 2017. According to FactSet, a financial data and analytics provider, in the third quarter of 2018, 78% of S&P 500® companies reported a positive earnings-per-share (EPS) surprise, while 61% reported a positive sales surprise.
Economic growth in the rest of the world proved more moderate. Despite gradual improvements since the 2007 financial crisis, much of the developed world outside of the United States continued to exhibit relatively modest GDP growth rates and high levels of unemployment. International stock markets were further undermined by increasingly protectionist U.S. trade policies. European Union and Japanese attempts to negotiate settlements of their trade conflicts with the United States achieved only limited success, while tensions between the United States and China escalated toward an all-out trade war, with each country imposing significant tariffs on a widening range of the other’s goods. In the environment, most international stocks ended the reporting period with significant losses. Emerging-market stocks were hit especially hard by trade uncertainties and the rising value of the U.S. dollar.
Domestic and international bonds suffered in an environment of rising interest rates and increasing inflationary pressures. In contrast to central banks in many other developed nations which maintained low interest rates and accommodative fiscal policies,
the U.S. Federal Reserve (the Fed) raised the benchmark federal funds rate 25 basis points (0.25%) two times during the reporting period. Shortly after its September rate hike, the Fed signaled that additional increases were likely, and might rise above the so-called normalized levels previously expected. The Fed’s aggressive stance drove bonds lower in the final month of the reporting period. All types and durations of bonds suffered in this environment, with longer-term instruments tending to underperform shorter-term ones, and with all grades of corporate bonds underperforming more conservative government bonds. While municipal bonds produced mildly negative returns as well, most outperformed their taxable government and corporate counterparts.
October 2018 also proved volatile for equities, with several broad U.S. market indices retreating sharply from record levels set the previous month. Several factors contributed to market volatility, among them mounting trade tensions between the United States and China, the potential for rising inflation, an increase in disappointing corporate earnings forecasts, signs of faltering global economic growth and concerns that the U.S. economy might slow significantly in 2019.
High levels of market volatility are generally regarded as a sign of investor uncertainty. As a MainStay investor, you can rely on the discipline and dedication of our portfolio managers as they pursue the objectives of their individual Funds using the investment strategies and processes outlined in the prospectus. Our market experience and professional insight free you to focus on your long-term investment goals, while we work to maximize your returns and manage the continually changing risks associated with your investments.
We encourage you to read the following report carefully and use it to evaluate your Fund’s performance in light of your long-range financial plan.
Sincerely,

Kirk C. Lehneis
President
The opinions expressed are as of the date of this report and are subject to change. There is no guarantee that any forecast made will come to pass. This material does not constitute investment advice and is not intended as an endorsement of any specific investment. Past performance is no guarantee of future results.
Not part of the Semiannual Report
Table of Contents
Investors should refer to the Fund’s Summary Prospectus and/or Prospectus and consider the Fund’s investment objectives, strategies, risks, charges and expenses carefully before investing. The Summary Prospectus and/or Prospectus contain this and other information about the Fund. You may obtain copies of the Fund’s Summary Prospectus, Prospectus and Statement of Additional Information free of charge, upon request, by calling toll-free 800-MAINSTAY (624-6782), by writing to NYLIFE Distributors LLC, Attn: MainStay Marketing Department, 30 Hudson Street, Jersey City, NJ 07302 or by sending an e-mail to MainStayShareholderServices@nylim.com. These documents are also available via the MainStay Funds’ website at nylinvestments.com/funds. Please read the Summary Prospectus and/or Prospectus carefully before investing.
Investment and Performance Comparison1 (Unaudited)
Performance data quoted represents past performance. Past performance is no guarantee of future results. Because of market volatility and other factors, current performance may be lower or higher than the figures shown. Investment return and principal value will fluctuate, and as a result, when shares are redeemed, they may be worth more or less than their original cost. The graph below depicts the historical performance of Class I shares of the Fund. Performance will vary from class to class based on differences in class-specific expenses and sales charges. For performance information current to the most recent month-end, please call 800-MAINSTAY (624-6782) or visit nylinvestments.com/funds.
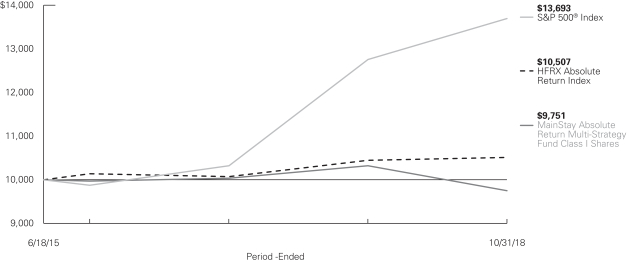
Average Annual Total Returns for the Period-Ended October 31, 2018
| | | | | | | | | | | | | | | | | | | | | | | | |
| Class | | Sales Charge | | | | Inception
Date | | | Six Months | | | One Year | | | Since
Inception | | | Gross
Expense
Ratio2 | |
| Class A Shares | | Maximum 5.5% Initial Sales Charge | | With sales charges
Excluding sales charges | | | 6/18/2015 | | |
| –8.37
–3.03 | %
| |
| –10.97
–5.79 | %
| |
| –2.62
–0.98 | %
| |
| 3.46
3.46 | %
|
| Investor Class Shares | | Maximum 5.5% Initial Sales Charge | | With sales charges
Excluding sales charges | | | 6/18/2015 | | |
| –8.47
–3.14 |
| |
| –11.10
–5.92 |
| |
| –2.85
–1.20 |
| |
| 3.71
3.71 |
|
| Class C Shares | | Maximum 1% CDSC if Redeemed Within One Year of Purchase | | With sales charges
Excluding sales charges | | | 6/18/2015 | | |
| –4.46
–3.49 |
| |
| –7.54
–6.62 |
| |
| –1.96
–1.96 |
| |
| 4.46
4.46 |
|
| Class I Shares | | No Sales Charge | | | | | 6/18/2015 | | | | –2.92 | | | | –5.53 | | | | –0.75 | | | | 3.23 | |
| | | | | | | | | | | | |
| Benchmark Performance | | Six
Months | | | One
Year | | | Since
Inception | |
HFRX Absolute Return Index3 | | | 0.50 | % | | | 0.59 | % | | | 1.48 | % |
S&P 500® Index4 | | | 3.40 | | | | 7.35 | | | | 9.77 | |
Morningstar Multialternative Category Average5 | | | –1.76 | | | | –1.76 | | | | –0.12 | |
| 1. | The performance table and graph do not reflect the deduction of taxes that a shareholder would pay on distributions or Fund share redemptions. Total returns reflect maximum applicable sales charges as indicated in the table above, if any, changes in share price, and reinvestment of dividend and capital gain distributions. The graph assumes the initial investment amount shown above and reflects the deduction of all sales charges that would have applied for the period of investment. Performance figures may reflect certain fee waivers and/or expense limitations, without which total returns may have been lower. For more information on share classes and current fee waivers and/or expense limitations (if any), please refer to the Notes to Consolidated Financial Statements. |
| 2. | The gross expense ratios presented reflect the Fund’s “Total Annual Fund Operating Expenses” from the most recent Prospectus and may differ from other expense ratios disclosed in this report. |
| 3. | The HFRX Absolute Return Index is the Fund’s primary broad-based securities market index for comparison purposes. The HFRX Absolute Return Index is designed to be representative of the overall composition of the |
| | hedge fund universe. It is comprised of eligible hedge fund strategies; including but not limited to convertible arbitrage, distressed securities, equity hedge, equity market neutral, event driven, macro, merger arbitrage, and relative value arbitrage. Results assume reinvestment of all dividends and capital gains. An investment cannot be made directly in an index. |
| 4. | The S&P 500® Index is the Fund’s secondary benchmark index for comparison purposes. “S&P 500®” is a trademark of the McGraw-Hill Companies, Inc. The S&P 500® Index is widely regarded as the standard index for measuring large-cap U.S. stock market performance. Results assume reinvestment of all dividends and capital gains. An investment cannot be made directly in an index. |
| 5. | The Morningstar Multialternative Category Average is representative of funds that have a majority of their assets exposed to alternative strategies. Funds in this category include both funds with static allocations to alternative strategies and funds tactically allocating among alternative strategies and asset classes. Results are based on average total returns of similar funds with all dividends and capital gain distributions reinvested. |
The footnotes are an integral part of the table and graph and should be carefully read in conjunction with them.
Cost in Dollars of a $1,000 Investment in MainStay Absolute Return Multi-Strategy Fund (Unaudited)
The example below is intended to describe the fees and expenses borne by shareholders during the six-month period from May 1, 2018, to October 31, 2018, and the impact of those costs on your investment.
Example
As a shareholder of the Fund you incur two types of costs: (1) transaction costs, including exchange fees and sales charges (loads) on purchases (as applicable), and (2) ongoing costs, including management fees, distribution and/or service (12b-1) fees, and other Fund expenses (as applicable). This example is intended to help you understand your ongoing costs (in dollars) of investing in the Fund and to compare these costs with the ongoing costs of investing in other mutual funds. The example is based on an investment of $1,000 made at the beginning of the six-month period and held for the entire period from May 1, 2018, to October 31, 2018.
This example illustrates your Fund’s ongoing costs in two ways:
Actual Expenses
The second and third data columns in the table below provide information about actual account values and actual expenses. You may use the information in these columns, together with the amount you invested, to estimate the expenses that you paid during the six months ended October 31, 2018. Simply divide your account value by $1,000 (for example, an $8,600 account value divided by $1,000 = 8.6), then
multiply the result by the number under the heading entitled “Expenses Paid During Period” to estimate the expenses you paid on your account during this period.
Hypothetical Example for Comparison Purposes
The fourth and fifth data columns in the table below provide information about hypothetical account values and hypothetical expenses based on the Fund’s actual expense ratio and an assumed rate of return of 5% per year before expenses, which is not the Fund’s actual return. The hypothetical account values and expenses may not be used to estimate the actual ending account balances or expenses you paid for the six-month period shown. You may use this information to compare the ongoing costs of investing in the Fund with the ongoing costs of investing in other mutual funds. To do so, compare this 5% hypothetical example with the 5% hypothetical examples that appear in the shareholder reports of the other mutual funds.
Please note that the expenses shown in the table are meant to highlight your ongoing costs only and do not reflect any transactional costs, such as exchange fees or sales charges (loads). Therefore, the fourth and fifth data columns of the table are useful in comparing ongoing costs only and will not help you determine the relative total costs of owning different funds. In addition, if these transactional costs were included, your costs would have been higher.
| | | | | | | | | | | | | | | | | | | | | | |
| | | | | | | | | | | | | | | | | | |
| Share Class | | Beginning
Account
Value
5/1/18 | | | Ending Account
Value (Based
on Actual
Returns and
Expenses)
10/31/18 | | | Expenses
Paid
During
Period1 | | | Ending Account
Value (Based
on Hypothetical
5% Annualized
Return and
Actual Expenses)
10/31/18 | | | Expenses
Paid
During
Period1 | | | Net Expense
Ratio
During
Period2,3 |
| | | | | | |
| Class A Shares | | $ | 1,000.00 | | | $ | 969.70 | | | $ | 15.44 | | | $ | 1,009.53 | | | $ | 15.75 | | | 3.11% |
| | | | | | |
| Investor Class Shares | | $ | 1,000.00 | | | $ | 968.60 | | | $ | 16.67 | | | $ | 1,008.27 | | | $ | 17.01 | | | 3.36% |
| | | | | | |
| Class C Shares | | $ | 1,000.00 | | | $ | 965.10 | | | $ | 20.06 | | | $ | 1,004.84 | | | $ | 20.47 | | | 4.05% |
| | | | | | |
| Class I Shares | | $ | 1,000.00 | | | $ | 970.80 | | | $ | 14.60 | | | $ | 1,010.44 | | | $ | 14.90 | | | 2.94% |
| 1. | Expenses are equal to the Fund’s annualized expense ratio of each class multiplied by the average account value over the period, divided by 365 and multiplied by 184 (to reflect the six-month period). The table above represents the actual expenses incurred during the six-month period. |
| 2. | Expenses are equal to the Fund’s annualized expense ratio to reflect the six-month period. |
| 3. | Expenses are inclusive of dividends and interest on investments sold short. |
| | |
| 6 | | MainStay Absolute Return Multi-Strategy Fund |
Strategy Allocation as of October 31, 20181 (Unaudited)

| 1 | Percentages based on total net assets. |
Equity Market Neutral: This strategy seeks to profit by detecting and exploiting perceived pricing inefficiencies in individual equity securities and neutralizing exposure to market risk by maintaining approximately equal value exposure in long and short positions. The strategy will identify investment opportunities based on a model that reflects the input of relevant factors, including relative value, market sentiment, and the Subadvisor’s forecasts as to anticipated market volatility. The strategy may engage in short sales in order to generate returns that are independent of the direction of the market.
Risk Arbitrage: This strategy implements event-driven arbitrage strategies on securities of companies that experience certain “special situations,” which are corporate events that are likely to create discontinuity in the price of a given security. The Fund’s risk arbitrage strategy consists primarily of an announced merger arbitrage strategy. An announced merger arbitrage strategy buys or sells the securities of companies involved in a merger based on the Subadvisor’s anticipation of the merger’s outcome. The strategy may also invest in securities of companies based on other event-driven strategies, such as holding discount arbitrage, share class arbitrage, spin-offs, asset sales, initial public offerings, minority buyouts, auctions or rights issues. Share class arbitrage involves capitalizing on perceived pricing inefficiencies of a particular share class in a multiple share class issuer. Discount arbitrage is when a discount option is purchased while an opposite transaction is taken in the underlying security.
Managed Futures: This strategy primarily takes long and short positions in futures contracts (directly or through derivatives, including total return swaps) across asset classes globally. The strategy seeks to exploit market trends and generate absolute returns utilizing a quantitative and systematic investment approach, which consists of analyzing financial markets through statistical models. These quantitative models produce buy or sell signals looking to benefit from the upward and downward movements of the asset classes covered based on market trends and patterns and contrarian views (i.e., instruments and strategies that may be out of favor in the broader market). The managed futures strategy will be implemented through (i) investment in derivative instruments, including swap agreements, exchange-traded futures and option and forward contracts, to gain exposure to a wide variety of global markets for currencies, interest rates, stock market indices, energy resources, metals and agricultural products and to hedge price risk, (ii) investment in swap agreements that reflect the return of securities, derivatives and commodity interests selected by the Subadvisor, or (iii) investment in some combination of (i) and (ii). This strategy will involve the use of one or more wholly-owned subsidiaries formed under
the laws of the Cayman Islands (each, a “Cayman Subsidiary”). See “Subsidiary Risk” below for more information.
Master Limited Partnerships (“MLPs”) and Other Energy Companies: This strategy seeks to deliver both high current income and total return by investing in a portfolio of domestic and foreign publicly traded partnerships and/or other issuers (including U.S. and Canadian royalty trusts and Canadian energy companies) engaged in the transportation, storage, processing, refining, marketing, exploration, production or mining of crude oil, natural gas, natural gas liquids, minerals or other natural resources. The Subadvisor implements this strategy by identifying companies it believes will benefit from increased crude oil, natural gas or natural gas liquids production resulting in greater energy infrastructure needs. The Fund will invest no more than 25% of its total assets in securities of MLPs that are qualified publicly traded partnerships (“QPTPs”), which are treated as partnerships for U.S. federal income tax purposes.
Credit Long/Short or Non-Traditional Fixed-Income: This strategy seeks to exploit opportunities in the global fixed-income markets based on top-down and bottom-up analysis. The strategy may invest in various credit strategies that involve being long and short different financial instruments, and the credit instruments involved will range from high grade to high yield (known as “junk bonds”) and distressed debt. The strategy may also invest in credit derivatives, including credit default swaps, options and indices. The Subadvisors responsible for this strategy dynamically allocate capital to the sectors and securities that they believe offer the best balance of risk and return, unrestricted by benchmark constraints.
Global Macro: This strategy seeks to obtain exposure to a broad spectrum of investments and countries or regions, based on discrete strategies that employ a variety of techniques, both discretionary and systematic analysis, combinations of top down and bottom up theses, and quantitative and fundamental approaches, designed to effectively identify and assess factors that affect businesses and economies broadly (e.g., monetary and fiscal policy, regulatory changes, demographics) and their impact on securities markets. The strategy may also employ arbitrage techniques and seek long and short exposure (directly or through derivatives, including total return swaps) across diversified asset classes globally. The strategy may be exposed significantly to interest rate and foreign currency futures. In addition, the strategy may involve the use of one or more Cayman Subsidiaries to obtain certain commodities market exposure.
Tactical Allocation: This strategy, which is managed by the Manager, may invest in a range of asset classes, including equity securities, fixed-income instruments, futures, options, currency forward contracts and swaps (including total return swaps) and affiliated and unaffiliated open-end funds, closed-end funds and exchange-traded funds, to manage or gain access to certain market exposures, including exposure to asset classes or strategies in which the Fund is not otherwise invested, to exploit perceived structural inefficiencies in the markets or to manage cash flows. Additionally, positions may be pursued on a long or short basis either to take advantage of perceived investment opportunities or to counter exposure from other strategies in the Fund.
Other Strategies: The Manager may modify the strategies summarized above and allocate the Fund’s assets among or to other strategies developed or implemented to further optimize risk reward expectations based on, among other factors, changing market conditions. In addition to the instruments described above, such other strategies may include taking long and/or short positions in a wide range of instruments, including, but not limited to, commodities and real estate investment trusts (“REITs”). Such investments may be made without restriction as to issuer capitalization, country (including emerging markets), currency, maturity or credit rating and within the context of a range of investment programs or strategies, including, but not limited to, carry strategies, relative value strategies, and various forms arbitrage.
| | |
| 8 | | MainStay Absolute Return Multi-Strategy Fund |
Manager Allocation as of October 31, 20181 (Unaudited)
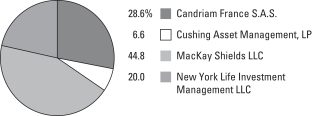
| 1 | Percentages based on total net assets. |
Top Ten Holdings as of October 31, 2018 (excluding short-term investments) (Unaudited)
| 1. | IQ Global Resources ETF |
| 3. | Enterprise Products Partners, L.P. |
| 9. | Plains GP Holdings, L.P., Class A |
Top Five Short Positions as of October 31, 2018 (Unaudited)
| 1. | United States Oil Fund, L.P. |
| 3. | Liberty Broadband Corp. |
| 4. | Liberty Media Corp-Liberty Formula One |
| 5. | White Mountains Insurance Group, Ltd. |
Consolidated Portfolio of Investments October 31, 2018 (Unaudited)
| | | | | | | | |
| | | Principal
Amount | | | Value | |
Long-Term Bonds 0.8%† Corporate Bonds 0.8% | |
Banks 0.3% | | | | | | | | |
Bank of America Corp. | | | | | | | | |
3.004%, due 12/20/23 (a) | | $ | 24,000 | | | $ | 23,093 | |
4.20%, due 8/26/24 | | | 25,000 | | | | 24,802 | |
Citigroup, Inc.
4.60%, due 3/9/26 | | | 25,000 | | | | 24,806 | |
Goldman Sachs Group, Inc. | | | | | | | | |
3.50%, due 11/16/26 | | | 30,000 | | | | 28,025 | |
5.375%, due 3/15/20 | | | 25,000 | | | | 25,668 | |
Morgan Stanley
5.00%, due 11/24/25 | | | 25,000 | | | | 25,562 | |
| | | | | | | | |
| | | | | | | 151,956 | |
| | | | | | | | |
Food 0.1% | |
Kraft Heinz Foods Co.
2.80%, due 7/2/20 | | | 45,000 | | | | 44,537 | |
Tyson Foods, Inc.
3.95%, due 8/15/24 | | | 35,000 | | | | 34,814 | |
| | | | | | | | |
| | | | | | | 79,351 | |
| | | | | | | | |
Health Care—Products 0.1% | |
Boston Scientific Corp.
2.85%, due 5/15/20 | | | 35,000 | | | | 34,711 | |
| | | | | | | | |
|
Health Care—Services 0.1% | |
Laboratory Corporation of America Holdings
2.625%, due 2/1/20 | | | 35,000 | | | | 34,681 | |
| | | | | | | | |
|
Home Builders 0.0%‡ | |
TRI Pointe Group, Inc. / TRI Pointe Homes, Inc.
5.875%, due 6/15/24 | | | 20,000 | | | | 18,675 | |
| | | | | | | | |
|
Oil & Gas 0.1% | |
Petrobras Global Finance B.V.
7.375%, due 1/17/27 | | | 30,000 | | | | 31,090 | |
Petroleos Mexicanos
6.75%, due 9/21/47 | | | 25,000 | | | | 21,458 | |
| | | | | | | | |
| | | | | | | 52,548 | |
| | | | | | | | |
Private Equity 0.0%‡ | |
Icahn Enterprises, L.P. / Icahn Enterprises Finance Corp.
5.875%, due 2/1/22 | | | 25,000 | | | | 25,003 | |
| | | | | | | | |
|
Retail 0.1% | |
O’Reilly Automotive, Inc.
3.80%, due 9/1/22 | | | 35,000 | | | | 35,069 | |
| | | | | | | | |
| | | | | | | | |
| | | Principal
Amount | | | Value | |
Telecommunications 0.0%‡ | |
T-Mobile USA, Inc.
6.375%, due 3/1/25 | | $ | 25,000 | | | $ | 25,781 | |
| | | | | | | | |
Total Long-Term Bonds
(Cost $471,825) | | | | | | | 457,775 | |
| | | | | | | | |
| | |
| | | | | | | | |
| | |
Shares | | | | |
| Affiliated Investment Companies 0.9% | |
IQ Global Resources ETF (b) | | | 19,295 | | | | 515,176 | |
| | | | | | | | |
Total Affiliated Investment Companies
(Cost $555,413) | | | | | | | 515,176 | |
| | | | | | | | |
|
| Common Stocks 24.3% | |
Aerospace & Defense 0.1% | |
Leonardo S.p.A. (b)(c) | | | 6,030 | | | | 65,499 | |
| | | | | | | | |
|
Air Freight & Logistics 0.1% | |
Royal Mail PLC | | | 11,121 | | | | 51,031 | |
| | | | | | | | |
|
Airlines 0.2% | |
Deutsche Lufthansa A.G., Registered (c) | | | 3,461 | | | | 69,621 | |
International Consolidated Airlines Group S.A. (c) | | | 8,459 | | | | 65,343 | |
| | | | | | | | |
| | | | | | | 134,964 | |
| | | | | | | | |
Automobiles 0.4% | |
Fiat Chrysler Automobiles N.V. (b)(c) | | | 4,591 | | | | 69,940 | |
Peugeot S.A. (c) | | | 3,033 | | | | 72,245 | |
Thor Industries, Inc. (c) | | | 900 | | | | 62,676 | |
| | | | | | | | |
| | | | | | | 204,861 | |
| | | | | | | | |
Banks 0.5% | |
Bancorp, Inc. (b)(c) | | | 3,200 | | | | 33,600 | |
Bank OZK (c) | | | 1,900 | | | | 51,984 | |
Customers Bancorp, Inc. (b)(c) | | | 2,800 | | | | 57,372 | |
Metropolitan Bank Holding Corp. (b)(c) | | | 300 | | | | 11,058 | |
OFG Bancorp (c) | | | 4,200 | | | | 71,778 | |
Raiffeisen Bank International A.G. (c) | | | 2,532 | | | | 69,116 | |
| | | | | | | | |
| | | | | | | 294,908 | |
| | | | | | | | |
Beverages 0.0%‡ | |
Primo Water Corp. (b)(c) | | | 1,100 | | | | 18,337 | |
| | | | | | | | |
|
Biotechnology 0.2% | |
CSL, Ltd. (c) | | | 510 | | | | 67,897 | |
Swedish Orphan Biovitrum A.B. (b) | | | 2,630 | | | | 53,686 | |
| | | | | | | | |
| | | | | | | 121,583 | |
| | | | | | | | |
| | | | |
| 10 | | MainStay Absolute Return Multi-Strategy Fund | | The notes to the consolidated financial statements are an integral part of,
and should be read in conjunction with, the consolidated financial statements. |
| | | | | | | | |
| | |
Shares | | | Value | |
| Common Stocks (continued) | | | | | | | | |
Building Products 0.1% | |
Armstrong Flooring, Inc. (b)(c) | | | 1,600 | | | $ | 24,880 | |
NCI Building Systems, Inc. (b)(c) | | | 4,200 | | | | 51,450 | |
| | | | | | | | |
| | | | | | | 76,330 | |
| | | | | | | | |
Capital Markets 0.5% | |
Evercore, Inc., Class A (c) | | | 800 | | | | 65,352 | |
Flow Traders (c)(d) | | | 1,118 | | | | 35,608 | |
Legg Mason, Inc. (c) | | | 1,400 | | | | 39,508 | |
Leonteq A.G. (b)(c) | | | 181 | | | | 8,547 | |
LPL Financial Holdings, Inc. (c) | | | 1,100 | | | | 67,760 | |
Swissquote Group Holding S.A., Registered (c) | | | 953 | | | | 49,583 | |
| | | | | | | | |
| | | | | | | 266,358 | |
| | | | | | | | |
Chemicals 0.4% | |
Chemours Co. (c) | | | 2,000 | | | | 66,020 | |
Covestro A.G. (c)(d) | | | 899 | | | | 58,163 | |
Huntsman Corp. (c) | | | 2,800 | | | | 61,264 | |
Mosaic Co. (c) | | | 800 | | | | 24,752 | |
| | | | | | | | |
| | | | | | | 210,199 | |
| | | | | | | | |
Commercial Services & Supplies 0.1% | |
Essendant, Inc. | | | 2,500 | | | | 31,850 | |
| | | | | | | | |
|
Communications Equipment 0.3% | |
EchoStar Corp., Class A (b)(c) | | | 1,600 | | | | 64,880 | |
Juniper Networks, Inc. (c) | | | 2,400 | | | | 70,248 | |
NetScout Systems, Inc. (b)(c) | | | 1,200 | | | | 30,312 | |
| | | | | | | | |
| | | | | | | 165,440 | |
| | | | | | | | |
Construction & Engineering 0.4% | |
ACS Actividades de Construccion y Servicios S.A. (c) | | | 1,950 | | | | 73,129 | |
Chip Eng Seng Corp., Ltd. | | | 19,400 | | | | 9,384 | |
HOCHTIEF A.G. (c) | | | 443 | | | | 65,731 | |
Keller Group PLC (c) | | | 807 | | | | 6,684 | |
Maire Tecnimont S.p.A. | | | 8,475 | | | | 37,130 | |
Mota-Engil SGPS S.A. (b) | | | 10,768 | | | | 21,441 | |
Peab A.B. | | | 1,837 | | | | 16,180 | |
Sacyr S.A. | | | 8,970 | | | | 21,691 | |
| | | | | | | | |
| | | | | | | 251,370 | |
| | | | | | | | |
Consumer Finance 0.2% | |
Curo Group Holdings Corp. (b)(c) | | | 100 | | | | 1,407 | |
Enova International, Inc. (b)(c) | | | 2,100 | | | | 49,665 | |
EZCORP, Inc., Class A (b)(c) | | | 5,500 | | | | 54,670 | |
FlexiGroup, Ltd. | | | 5,274 | | | | 5,733 | |
| | | | | | | | |
| | | | | | | 111,475 | |
| | | | | | | | |
Containers & Packaging 0.0%‡ | |
Papeles y Cartones de Europa S.A. | | | 662 | | | | 12,522 | |
| | | | | | | | |
| | | | | | | | |
| | |
Shares | | | Value | |
Distributors 0.0%‡ | | | | | | | | |
Inchcape PLC (c) | | | 2,948 | | | $ | 20,386 | |
| | | | | | | | |
|
Diversified Consumer Services 0.2% | |
American Public Education, Inc. (b)(c) | | | 400 | | | | 13,092 | |
H&R Block, Inc. (c) | | | 2,700 | | | | 71,658 | |
K12, Inc. (b)(c) | | | 900 | | | | 19,269 | |
| | | | | | | | |
| | | | | | | 104,019 | |
| | | | | | | | |
Diversified Financial Services 0.3% | |
AMP, Ltd. | | | 15,661 | | | | 27,393 | |
Banca IFIS S.p.A. | | | 1,200 | | | | 21,122 | |
EXOR N.V. | | | 1,271 | | | | 72,037 | |
Plus500, Ltd. (c) | | | 3,590 | | | | 62,132 | |
| | | | | | | | |
| | | | | | | 182,684 | |
| | | | | | | | |
Diversified Telecommunication Services 0.0%‡ | |
Cincinnati Bell, Inc. (b)(c) | | | 900 | | | | 12,771 | |
Telstra Corp., Ltd. | | | 3,411 | | | | 7,440 | |
| | | | | | | | |
| | | | | | | 20,211 | |
| | | | | | | | |
Electrical Equipment 0.3% | |
Allied Motion Technologies, Inc. (c) | | | 1,300 | | | | 56,758 | |
Atkore International Group, Inc. (b)(c) | | | 2,600 | | | | 50,076 | |
Mersen S.A. (c) | | | 126 | | | | 4,160 | |
TPI Composites, Inc. (b)(c) | | | 2,400 | | | | 60,624 | |
| | | | | | | | |
| | | | | | | 171,618 | |
| | | | | | | | |
Electronic Equipment, Instruments & Components 0.4% | |
AT&S Austria Technologie & Systemtechnik A.G. (c) | | | 1,456 | | | | 34,549 | |
Insight Enterprises, Inc. (b)(c) | | | 1,300 | | | | 67,197 | |
Jabil, Inc. (c) | | | 2,700 | | | | 66,771 | |
Mycronic A.B. (e) | | | 1,477 | | | | 18,513 | |
Sanmina Corp. (b)(c) | | | 800 | | | | 20,240 | |
| | | | | | | | |
| | | | | | | 207,270 | |
| | | | | | | | |
Energy Equipment & Services 0.7% | |
BW Offshore, Ltd. (b) | | | 8,638 | | | | 55,436 | |
FTS International, Inc. (b)(c) | | | 4,900 | | | | 62,769 | |
Mammoth Energy Services, Inc. (c) | | | 2,200 | | | | 54,912 | |
Matrix Service Co. (b)(c) | | | 2,800 | | | | 56,924 | |
Patterson-UTI Energy, Inc. (c) | | | 2,500 | | | | 41,600 | |
Petrofac, Ltd. (c) | | | 7,290 | | | | 53,877 | |
Pioneer Energy Services Corp. (b) | | | 100 | | | | 297 | |
TETRA Technologies, Inc. (b) | | | 1,300 | | | | 3,861 | |
TGS NOPEC Geophysical Co. ASA (c) | | | 1,558 | | | | 52,286 | |
Unit Corp. (b)(c) | | | 800 | | | | 18,504 | |
| | | | | | | | |
| | | | | | | 400,466 | |
| | | | | | | | |
Entertainment 0.2% | |
AMC Entertainment Holdings, Inc., Class A (c) | | | 3,200 | | | | 61,632 | |
Viacom, Inc., Class B (c) | | | 1,600 | | | | 51,168 | |
| | | | | | | | |
| | | | | | | 112,800 | |
| | | | | | | | |
| | | | | | |
The notes to the consolidated financial statements are an integral part of,
and should be read in conjunction with, the consolidated financial statements. | | | | | 11 | |
Consolidated Portfolio of Investments October 31, 2018 (Unaudited) (continued)
| | | | | | | | |
| | |
Shares | | | Value | |
| Common Stocks (continued) | | | | | | | | |
Food & Staples Retailing 0.3% | |
Casino Guichard Perrachon S.A. (c) | | | 1,634 | | | $ | 72,179 | |
J Sainsbury PLC | | | 17,395 | | | | 69,193 | |
Rallye S.A. | | | 624 | | | | 6,937 | |
| | | | | | | | |
| | | | | | | 148,309 | |
| | | | | | | | |
Food Products 0.4% | |
Austevoll Seafood ASA | | | 4,150 | | | | 66,756 | |
Grieg Seafood ASA (c) | | | 1,087 | | | | 15,848 | |
Pilgrim’s Pride Corp. (b)(c) | | | 4,100 | | | | 72,406 | |
Select Harvests, Ltd. | | | 3,759 | | | | 13,735 | |
TreeHouse Foods, Inc. (b)(c) | | | 1,500 | | | | 68,340 | |
| | | | | | | | |
| | | | | | | 237,085 | |
| | | | | | | | |
Health Care Equipment & Supplies 0.5% | |
Accuray, Inc. (b) | | | 6,800 | | | | 30,532 | |
AngioDynamics, Inc. (b)(c) | | | 1,100 | | | | 22,473 | |
GN Store Nord A/S (c) | | | 1,047 | | | | 44,459 | |
ICU Medical, Inc. (b)(c) | | | 321 | | | | 81,768 | |
Lantheus Holdings, Inc. (b)(c) | | | 4,600 | | | | 64,262 | |
Surmodics, Inc. (b)(c) | | | 300 | | | | 19,029 | |
Varex Imaging Corp. (b)(c) | | | 300 | | | | 7,788 | |
| | | | | | | | |
| | | | | | | 270,311 | |
| | | | | | | | |
Health Care Providers & Services 0.6% | |
Australian Pharmaceutical Industries, Ltd. | | | 21,905 | | | | 23,734 | |
Centene Corp. (b)(c) | | | 500 | | | | 65,160 | |
Diplomat Pharmacy, Inc. (b)(c) | | | 3,100 | | | | 61,504 | |
RadNet, Inc. (b)(c) | | | 3,000 | | | | 44,400 | |
Sigma Healthcare, Ltd. | | | 37,372 | | | | 13,762 | |
Summerset Group Holdings, Ltd. | | | 1,796 | | | | 7,805 | |
Triple-S Management Corp., Class B (b)(c) | | | 3,500 | | | | 60,060 | |
WellCare Health Plans, Inc. (b)(c) | | | 200 | | | | 55,198 | |
| | | | | | | | |
| | | | | | | 331,623 | |
| | | | | | | | |
Hotels, Restaurants & Leisure 0.5% | |
Betsson A.B. (b) | | | 7,830 | | | | 68,023 | |
BJ’s Restaurants, Inc. (c) | | | 900 | | | | 55,062 | |
Carrols Restaurant Group, Inc. (b)(c) | | | 2,200 | | | | 28,952 | |
Chipotle Mexican Grill, Inc. (b)(c) | | | 100 | | | | 46,033 | |
Crown Resorts, Ltd. (c) | | | 7,104 | | | | 62,934 | |
Red Robin Gourmet Burgers, Inc. (b)(c) | | | 800 | | | | 24,160 | |
Scandic Hotels Group A.B. (d) | | | 359 | | | | 3,281 | |
| | | | | | | | |
| | | | | | | 288,445 | |
| | | | | | | | |
Household Durables 0.5% | |
Berkeley Group Holdings PLC (c) | | | 1,691 | | | | 75,672 | |
JM A.B. | | | 3,347 | | | | 63,621 | |
Kaufman & Broad S.A. (c) | | | 453 | | | | 18,605 | |
Persimmon PLC (c) | | | 1,158 | | | | 33,955 | |
Redrow PLC (c) | | | 6,688 | | | | 45,179 | |
ZAGG, Inc. (b)(c) | | | 3,700 | | | | 44,807 | |
| | | | | | | | |
| | | | | | | 281,839 | |
| | | | | | | | |
| | | | | | | | |
| | |
Shares | | | Value | |
Independent Power & Renewable Electricity Producers 0.2% | |
Falck Renewables S.p.A. | | | 15,949 | | | $ | 32,300 | |
NRG Energy, Inc. (c) | | | 2,000 | | | | 72,380 | |
| | | | | | | | |
| | | | | | | 104,680 | |
| | | | | | | | |
Insurance 0.5% | |
American National Insurance Co. (c) | | | 100 | | | | 12,324 | |
AXA S.A. (c) | | | 1,191 | | | | 29,867 | |
Genworth Financial, Inc., Class A (b) | | | 15,700 | | | | 67,196 | |
Just Group PLC | | | 56,107 | | | | 63,648 | |
Poste Italiane S.p.A. (d) | | | 4,460 | | | | 32,078 | |
Societa Cattolica di Assicurazioni S.C. | | | 7,106 | | | | 57,507 | |
| | | | | | | | |
| | | | | | | 262,620 | |
| | | | | | | | |
Interactive Media & Services 0.2% | |
Care.com, Inc. (b)(c) | | | 3,500 | | | | 61,600 | |
QuinStreet, Inc. (b)(c) | | | 3,000 | | | | 47,700 | |
| | | | | | | | |
| | | | | | | 109,300 | |
| | | | | | | | |
Internet & Direct Marketing Retail 0.4% | |
1-800-Flowers.com, Inc., Class A (b)(c) | | | 3,400 | | | | 35,530 | |
Expedia Group, Inc. (c) | | | 600 | | | | 75,258 | |
Groupon, Inc. (b) | | | 17,700 | | | | 57,879 | |
Lands’ End, Inc. (b)(c) | | | 1,700 | | | | 27,727 | |
| | | | | | | | |
| | | | | | | 196,394 | |
| | | | | | | | |
IT Services 0.5% | |
Afterpay Touch Group, Ltd. (b)(c) | | | 4,612 | | | | 40,792 | |
Alliance Data Systems Corp. (c) | | | 400 | | | | 82,472 | |
Appen, Ltd. (c) | | | 7,711 | | | | 58,100 | |
Conduent, Inc. (b)(c) | | | 600 | | | | 11,460 | |
First Data Corp., Class A (b)(c) | | | 1,000 | | | | 18,740 | |
Softcat PLC (c) | | | 314 | | | | 2,589 | |
Teradata Corp. (b)(c) | | | 1,900 | | | | 69,160 | |
| | | | | | | | |
| | | | | | | 283,313 | |
| | | | | | | | |
Leisure Products 0.2% | |
Brunswick Corp. (c) | | | 1,100 | | | | 57,189 | |
Vista Outdoor, Inc. (b)(c) | | | 4,000 | | | | 50,000 | |
| | | | | | | | |
| | | | | | | 107,189 | |
| | | | | | | | |
Life Sciences Tools & Services 0.5% | |
Bruker Corp. (c) | | | 2,200 | | | | 68,926 | |
Medpace Holdings, Inc. (b)(c) | | | 1,200 | | | | 62,520 | |
Nanostring Technologies, Inc. (b)(c) | | | 1,700 | | | | 26,197 | |
PRA Health Sciences, Inc. (b)(c) | | | 800 | | | | 77,496 | |
Syneos Health, Inc. (b)(c) | | | 1,400 | | | | 63,882 | |
| | | | | | | | |
| | | | | | | 299,021 | |
| | | | | | | | |
Machinery 0.8% | |
Andritz A.G. (c) | | | 119 | | | | 6,168 | |
CNH Industrial N.V. (c) | | | 6,121 | | | | 63,686 | |
Deutz A.G. | | | 7,845 | | | | 58,468 | |
Greenbrier Cos., Inc. (c) | | | 900 | | | | 42,705 | |
Metso OYJ (c) | | | 1,603 | | | | 50,674 | |
| | | | |
| 12 | | MainStay Absolute Return Multi-Strategy Fund | | The notes to the consolidated financial statements are an integral part of,
and should be read in conjunction with, the consolidated financial statements. |
| | | | | | | | |
| | |
Shares | | | Value | |
| Common Stocks (continued) | | | | | | | | |
Machinery (continued) | |
Oshkosh Corp. (c) | | | 1,000 | | | $ | 56,140 | |
Terex Corp. (c) | | | 2,100 | | | | 70,119 | |
Trinity Industries, Inc. (c) | | | 1,900 | | | | 54,245 | |
Wacker Neuson S.E. | | | 82 | | | | 1,824 | |
Yangzijiang Shipbuilding Holdings, Ltd. | | | 81,300 | | | | 72,781 | |
| | | | | | | | |
| | | | | | | 476,810 | |
| | | | | | | | |
Media 0.5% | |
Entravision Communications Corp., Class A | | | 3,800 | | | | 18,772 | |
Eutelsat Communications S.A. (c) | | | 2,936 | | | | 59,559 | |
Nine Entertainment Co. Holdings, Ltd. | | | 46,350 | | | | 55,470 | |
ProSiebenSat.1 Media S.E. (c) | | | 2,751 | | | | 63,627 | |
Seven West Media, Ltd. | | | 22,945 | | | | 12,674 | |
SKY Network Television, Ltd. | | | 3,324 | | | | 4,859 | |
Tribune Publishing Co. (b)(c) | | | 3,500 | | | | 52,815 | |
| | | | | | | | |
| | | | | | | 267,776 | |
| | | | | | | | |
Metals & Mining 1.2% | |
Alumina, Ltd. | | | 39,957 | | | | 72,154 | |
Anglo American PLC (c) | | | 3,333 | | | | 71,368 | |
BlueScope Steel, Ltd. (c) | | | 6,630 | | | | 67,468 | |
Eramet (c) | | | 681 | | | | 62,825 | |
Evraz PLC (c) | | | 8,801 | | | | 61,084 | |
Ferrexpo PLC | | | 20,639 | | | | 55,109 | |
Fortescue Metals Group, Ltd. | | | 4,173 | | | | 11,820 | |
Granges A.B. | | | 884 | | | | 9,351 | |
Northern Star Resources, Ltd. (c) | | | 1,775 | | | | 11,036 | |
Rio Tinto, Ltd. (c) | | | 1,301 | | | | 70,388 | |
Ryerson Holding Corp. (b)(c) | | | 2,600 | | | | 23,868 | |
South32, Ltd. | | | 27,975 | | | | 71,714 | |
United States Steel Corp. (c) | | | 2,400 | | | | 63,672 | |
| | | | | | | | |
| | | | | | | 651,857 | |
| | | | | | | | |
Multiline Retail 0.0%‡ | |
Macy’s, Inc. (c) | | | 100 | | | | 3,429 | |
| | | | | | | | |
|
Oil, Gas & Consumable Fuels 5.5% | |
Abraxas Petroleum Corp. (b) | | | 4,000 | | | | 7,360 | |
Antero Midstream GP, L.P. (c) | | | 7,050 | | | | 113,576 | |
Cheniere Energy, Inc. (b)(c) | | | 3,200 | | | | 193,312 | |
Chesapeake Energy Corp. (b) | | | 16,200 | | | | 56,862 | |
CNX Midstream Partners, L.P. | | | 5,450 | | | | 99,463 | |
Delek U.S. Holdings, Inc. (c) | | | 1,700 | | | | 62,424 | |
Denbury Resources, Inc. (b) | | | 10,600 | | | | 36,570 | |
DNO ASA | | | 29,412 | | | | 56,627 | |
Energy Transfer, L.P. (c) | | | 15,648 | | | | 243,170 | |
EnLink Midstream LLC (c) | | | 5,050 | | | | 65,650 | |
EnQuest PLC (b) | | | 17,984 | | | | 6,275 | |
Enterprise Products Partners, L.P. (c) | | | 7,700 | | | | 206,514 | |
EQGP Holdings, L.P. (c) | | | 4,100 | | | | 64,370 | |
Gulf Keystone Petroleum, Ltd. (b) | | | 2,656 | | | | 7,554 | |
| | | | | | | | |
| | |
Shares | | | Value | |
Oil, Gas & Consumable Fuels (continued) | |
HollyFrontier Corp. (c) | | | 200 | | | $ | 13,488 | |
Kinder Morgan, Inc. (c) | | | 9,050 | | | | 154,031 | |
Laredo Petroleum, Inc. (b)(c) | | | 5,100 | | | | 26,724 | |
MPLX, L.P. (c) | | | 5,550 | | | | 186,535 | |
Noble Midstream Partners, L.P. | | | 3,200 | | | | 109,248 | |
ONEOK, Inc. (c) | | | 1,800 | | | | 118,080 | |
Par Pacific Holdings, Inc. (b)(c) | | | 3,300 | | | | 58,344 | |
PBF Energy, Inc., Class A (c) | | | 800 | | | | 33,480 | |
Peabody Energy Corp. (c) | | | 1,800 | | | | 63,810 | |
Phillips 66 Partners, L.P. (c) | | | 2,050 | | | | 100,266 | |
Plains All American Pipeline, L.P. | | | 3,850 | | | | 83,815 | |
Plains GP Holdings, L.P., Class A (b)(c) | | | 6,050 | | | | 129,288 | |
QEP Resources, Inc. (b)(c) | | | 6,500 | | | | 57,915 | |
Renewable Energy Group, Inc. (b)(c) | | | 2,200 | | | | 68,376 | |
Sandridge Energy, Inc. (b)(c) | | | 2,000 | | | | 17,900 | |
Santos, Ltd. | | | 10,810 | | | | 50,830 | |
Shell Midstream Partners, L.P. (c) | | | 4,650 | | | | 95,046 | |
Targa Resources Corp. (c) | | | 3,850 | | | | 198,929 | |
W&T Offshore, Inc. (b)(c) | | | 8,100 | | | | 54,594 | |
Western Gas Equity Partners, L.P. (c) | | | 2,350 | | | | 67,586 | |
Whitehaven Coal, Ltd. | | | 15,286 | | | | 52,500 | |
Williams Cos., Inc. (c) | | | 6,379 | | | | 155,201 | |
| | | | | | | | |
| | | | | | | 3,115,713 | |
| | | | | | | | |
Paper & Forest Products 0.4% | |
Altri SGPS S.A. | | | 6,614 | | | | 58,058 | |
Domtar Corp. (c) | | | 1,200 | | | | 55,572 | |
Ence Energia y Celulosa S.A. | | | 6,313 | | | | 53,092 | |
Stora Enso OYJ, Class R (c) | | | 3,144 | | | | 47,380 | |
| | | | | | | | |
| | | | | | | 214,102 | |
| | | | | | | | |
Pharmaceuticals 1.0% | |
Akorn, Inc. (b)(c) | | | 3,800 | | | | 25,346 | |
Almirall S.A. | | | 3,006 | | | | 54,510 | |
Amphastar Pharmaceuticals, Inc. (b)(c) | | | 1,300 | | | | 23,335 | |
Assertio Therapeutics, Inc. (b)(c) | | | 7,100 | | | | 34,470 | |
Collegium Pharmaceutical, Inc. (b) | | | 3,700 | | | | 59,385 | |
Endo International PLC (b)(c) | | | 3,500 | | | | 59,290 | |
Horizon Pharma PLC (b)(c) | | | 3,400 | | | | 61,914 | |
Mallinckrodt PLC (b)(c) | | | 2,319 | | | | 58,114 | |
Mithra Pharmaceuticals S.A. (b)(e) | | | 325 | | | | 8,927 | |
Mylan N.V. (b)(c) | | | 100 | | | | 3,125 | |
Pacira Pharmaceuticals, Inc. (b)(c) | | | 1,400 | | | | 68,446 | |
Phibro Animal Health Corp., Class A (c) | | | 1,400 | | | | 60,088 | |
Recipharm A.B., Class B (b) | | | 2,266 | | | | 33,528 | |
| | | | | | | | |
| | | | | | | 550,478 | |
| | | | | | | | |
Professional Services 0.2% | |
Barrett Business Services, Inc. (c) | | | 1,000 | | | | 62,920 | |
ManpowerGroup, Inc. (c) | | | 800 | | | | 61,032 | |
| | | | | | | | |
| | | | | | | 123,952 | |
| | | | | | | | |
| | | | | | |
The notes to the consolidated financial statements are an integral part of,
and should be read in conjunction with, the consolidated financial statements. | | | | | 13 | |
Consolidated Portfolio of Investments October 31, 2018 (Unaudited) (continued)
| | | | | | | | |
| | |
Shares | | | Value | |
| Common Stocks (continued) | | | | | | | | |
Road & Rail 0.3% | |
Go-Ahead Group PLC (c) | | | 296 | | | $ | 5,811 | |
Nobina A.B. (d) | | | 5,152 | | | | 34,399 | |
Ryder System, Inc. (c) | | | 1,000 | | | | 55,310 | |
Schneider National, Inc., Class B (c) | | | 2,900 | | | | 63,423 | |
| | | | | | | | |
| | | | | | | 158,943 | |
| | | | | | | | |
Semiconductors & Semiconductor Equipment 0.5% | |
Cohu, Inc. (c) | | | 1,100 | | | | 22,880 | |
MKS Instruments, Inc. (c) | | | 1,000 | | | | 73,690 | |
ON Semiconductor Corp. (b)(c) | | | 4,500 | | | | 76,500 | |
Siltronic A.G. (c) | | | 502 | | | | 46,101 | |
Synaptics, Inc. (b)(c) | | | 1,700 | | | | 63,818 | |
| | | | | | | | |
| | | | | | | 282,989 | |
| | | | | | | | |
Software 0.9% | |
Altium, Ltd. (c) | | | 3,098 | | | | 47,979 | |
Atlassian Corp. PLC, Class A (b)(c) | | | 200 | | | | 15,182 | |
CDK Global, Inc. (c) | | | 1,200 | | | | 68,688 | |
CyberArk Software, Ltd. (b)(c) | | | 800 | | | | 54,608 | |
Five9, Inc. (b)(c) | | | 1,400 | | | | 55,104 | |
LogMeIn, Inc. (c) | | | 800 | | | | 68,896 | |
Nuance Communications, Inc. (b)(c) | | | 4,100 | | | | 71,299 | |
SPS Commerce, Inc. (b)(c) | | | 600 | | | | 55,854 | |
Symantec Corp. (c) | | | 3,400 | | | | 61,710 | |
| | | | | | | | |
| | | | | | | 499,320 | |
| | | | | | | | |
Specialty Retail 0.7% | |
Abercrombie & Fitch Co., Class A (c) | | | 2,200 | | | | 43,340 | |
Accent Group, Ltd. | | | 28,980 | | | | 25,550 | |
Ascena Retail Group, Inc. (b) | | | 9,100 | | | | 35,035 | |
AutoNation, Inc. (b)(c) | | | 700 | | | | 28,336 | |
Best Buy Co., Inc. (c) | | | 100 | | | | 7,016 | |
Chico’s FAS, Inc. (c) | | | 2,400 | | | | 18,408 | |
Express, Inc. (b)(c) | | | 4,700 | | | | 41,407 | |
Foot Locker, Inc. (c) | | | 200 | | | | 9,428 | |
Gap, Inc. (c) | | | 900 | | | | 24,570 | |
Genesco, Inc. (b)(c) | | | 300 | | | | 12,837 | |
Matas A/S | | | 68 | | | | 656 | |
Mekonomen A.B. | | | 1,245 | | | | 14,557 | |
Office Depot, Inc. | | | 13,200 | | | | 33,792 | |
Pets at Home Group PLC | | | 33,436 | | | | 47,012 | |
Shoe Carnival, Inc. (c) | | | 400 | | | | 16,292 | |
Signet Jewelers, Ltd. (c) | | | 300 | | | | 16,815 | |
Super Retail Group, Ltd. (c) | | | 752 | | | | 3,845 | |
| | | | | | | | |
| | | | | | | 378,896 | |
| | | | | | | | |
Technology Hardware, Storage & Peripherals 0.2% | |
Immersion Corp. (b)(c) | | | 800 | | | | 8,008 | |
Neopost S.A. (c) | | | 762 | | | | 24,511 | |
Western Digital Corp. (c) | | | 1,300 | | | | 55,991 | |
| | | | | | | | |
| | | | | | | 88,510 | |
| | | | | | | | |
| | | | | | | | |
| | |
Shares | | | Value | |
Textiles, Apparel & Luxury Goods 0.5% | |
Fossil Group, Inc. (b)(c) | | | 3,000 | | | $ | 65,130 | |
Michael Kors Holdings, Ltd. (b)(c) | | | 1,100 | | | | 60,951 | |
Pandora A/S (c) | | | 1,142 | | | | 71,448 | |
Under Armour, Inc., Class A (b)(c) | | | 3,500 | | | | 77,385 | |
| | | | | | | | |
| | | | | | | 274,914 | |
| | | | | | | | |
Thrifts & Mortgage Finance 0.2% | |
Charter Court Financial Services Group PLC (d) | | | 2,175 | | | | 8,079 | |
Deutsche Pfandbriefbank A.G. (c)(d) | | | 2,299 | | | | 30,596 | |
Genworth Mortgage Insurance Australia, Ltd. (e) | | | 24,268 | | | | 38,667 | |
OneSavings Bank PLC | | | 6,081 | | | | 29,008 | |
Paragon Banking Group PLC (c) | | | 3,020 | | | | 16,429 | |
| | | | | | | | |
| | | | | | | 122,779 | |
| | | | | | | | |
Tobacco 0.0%‡ | |
Turning Point Brands, Inc. (c) | | | 600 | | | | 24,660 | |
| | | | | | | | |
|
Trading Companies & Distributors 0.2% | |
Ashtead Group PLC (c) | | | 1,750 | | | | 43,294 | |
Ramirent OYJ | | | 1,130 | | | | 8,256 | |
United Rentals, Inc. (b)(c) | | | 400 | | | | 48,028 | |
Veritiv Corp. (b)(c) | | | 1,200 | | | | 40,008 | |
| | | | | | | | |
| | | | | | | 139,586 | |
| | | | | | | | |
Transportation Infrastructure 0.0%‡ | |
ASTM S.p.A. | | | 506 | | | | 10,041 | |
Societa Iniziative Autostradali e Servizi S.p.A. | | | 469 | | | | 6,619 | |
| | | | | | | | |
| | | | | | | 16,660 | |
| | | | | | | | |
Wireless Telecommunication Services 0.3% | |
Telephone & Data Systems, Inc. (c) | | | 2,300 | | | | 70,909 | |
United States Cellular Corp. (b)(c) | | | 1,600 | | | | 76,432 | |
| | | | | | | | |
| | | | | | | 147,341 | |
| | | | | | | | |
Total Common Stocks
(Cost $14,939,772) | | | | | | | 13,695,025 | |
| | | | | | | | |
|
| Preferred Stocks 0.0%‡ | |
Auto Components 0.0%‡ | |
Schaeffler A.G. (c) | | | 107 | | | | 1,131 | |
| | | | | | | | |
Total Preferred Stocks
(Cost $1,313) | | | | | | | 1,131 | |
| | | | | | | | |
|
| Short-Term Investments 84.4% | |
Affiliated Investment Company 9.4% | |
MainStay U.S. Government Liquidity Fund, 2.075% (f) | | | 5,266,916 | | | | 5,266,916 | |
| | | | | | | | |
Total Affiliated Investment Companies
(Cost $5,266,916) | | | | | | | 5,266,916 | |
| | | | | | | | |
| | | | |
| 14 | | MainStay Absolute Return Multi-Strategy Fund | | The notes to the consolidated financial statements are an integral part of,
and should be read in conjunction with, the consolidated financial statements. |
| | | | | | | | |
| | | Principal
Amount | | | Value | |
| Short-Term Investments (continued) | |
Repurchase Agreements 24.8% | |
Fixed Income Clearing Corp.
1.05%, dated 10/31/18
due 11/1/18
Proceeds at Maturity $13,097,613 (Collateralized by United States Treasury Notes with rate 2.750% and maturity date 5/31/23,with a Principal Amount of $13,315,000 and a Market Value of $13,368,260) | | $ | 13,097,231 | | | $ | 13,097,231 | |
State Street Bank and Trust Co.
0.05%, dated 10/31/18
due 11/1/18
Proceeds at Maturity $903,533 (Collateralized by a Federal National Mortgage Association security with a rate of 3.50% and a maturity date of 8/1/47, with a Principal Amount of $1,030,000 and a Market Value of
$925,002) (g) | | | 903,533 | | | | 903,533 | |
| | | | | | | | |
Total Repurchase Agreements
(Cost $14,000,764) | | | | | | | 14,000,764 | |
| | | | | | | | |
|
U.S. Governments 50.2% | |
United States Treasury Bills (h) | | | | | | | | |
2.053%, due 11/15/18 (c)(g) | | | 2,700,000 | | | | 2,697,884 | |
2.10%, due 11/15/18 (c) | | | 6,780,000 | | | | 6,774,555 | |
2.119%, due 11/29/18 (c) | | | 8,370,000 | | | | 8,355,930 | |
2.137%, due 12/13/18 (c) | | | 890,000 | | | | 887,823 | |
2.162%, due 11/15/18 | | | 5,500,000 | | | | 5,495,444 | |
2.451%, due 4/25/19 (c)(g) | | | 4,114,000 | | | | 4,065,954 | |
| | | | | | | | |
Total U.S. Governments
(Cost $28,282,927) | | | | | | | 28,277,590 | |
| | | | | | | | |
Total Short-Term Investments
(Cost $47,550,607) | | | | | | | 47,545,270 | |
| | | | | | | | |
Total Investments, Before Investments Sold Short
(Cost $63,518,930) | | | 110.4 | % | | | 62,214,377 | |
| | | | | | | | |
| | |
| | | | | | | | |
| | |
Shares | | | | |
Investments Sold Short (21.6%) Common Stocks Sold Short (20.3%) | |
Aerospace & Defense (0.1%) | | | | | | | | |
HEICO Corp. | | | (800 | ) | | | (67,064 | ) |
| | | | | | | | |
|
Air Freight & Logistics (0.1%) | |
Bollore S.A. | | | (7,106 | ) | | | (30,118 | ) |
| | | | | | | | |
| | | | | | | | |
| | |
Shares | | | Value | |
Airlines (0.1%) | |
Norwegian Air Shuttle ASA (b) | | | (2,516 | ) | | $ | (64,170 | ) |
| | | | | | | | |
|
Auto Components (0.3%) | |
ARB Corp., Ltd. | | | (3,180 | ) | | | (38,981 | ) |
Motorcar Parts of America, Inc. (b) | | | (2,200 | ) | | | (46,596 | ) |
Pirelli & C. S.p.A (b)(d) | | | (10,268 | ) | | | (75,525 | ) |
| | | | | | | | |
| | | | | | | (161,102 | ) |
| | | | | | | | |
Banks (0.6%) | |
Banco de Sabadell S.A. | | | (50,928 | ) | | | (67,202 | ) |
BOK Financial Corp. | | | (800 | ) | | | (68,584 | ) |
Liberbank S.A. (b) | | | (35,024 | ) | | | (16,431 | ) |
Live Oak Bancshares, Inc. | | | (2,400 | ) | | | (44,160 | ) |
Metro Bank PLC (b) | | | (1,756 | ) | | | (49,918 | ) |
Western Alliance Bancorp. (b) | | | (1,300 | ) | | | (62,712 | ) |
| | | | | | | | |
| | | | | | | (309,007 | ) |
| | | | | | | | |
Beverages (0.1%) | |
Remy Cointreau S.A. | | | (558 | ) | | | (66,299 | ) |
| | | | | | | | |
|
Biotechnology (0.3%) | |
Basilea Pharmaceutica A.G., Registered (b) | | | (1,029 | ) | | | (49,695 | ) |
DBV Technologies S.A. (b) | | | (1,328 | ) | | | (49,216 | ) |
Pharming Group N.V. (b) | | | (53,911 | ) | | | (58,742 | ) |
Zealand Pharma A/S (b) | | | (1,670 | ) | | | (21,272 | ) |
| | | | | | | | |
| | | | | | | (178,925 | ) |
| | | | | | | | |
Building Products (0.3%) | |
Allegion PLC | | | (900 | ) | | | (77,157 | ) |
Caesarstone, Ltd. | | | (400 | ) | | | (6,316 | ) |
Dormakaba Holding A.G. (b) | | | (68 | ) | | | (49,085 | ) |
Tarkett S.A. | | | (2,374 | ) | | | (52,326 | ) |
| | | | | | | | |
| | | | | | | (184,884 | ) |
| | | | | | | | |
Capital Markets (0.4%) | |
Avanza Bank Holding A.B. | | | (153 | ) | | | (8,182 | ) |
EFG International A.G. (b) | | | (1,506 | ) | | | (10,632 | ) |
GAM Holding A.G. (b) | | | (2,177 | ) | | | (12,645 | ) |
Hargreaves Lansdown PLC | | | (3,192 | ) | | | (76,215 | ) |
MarketAxess Holdings, Inc. | | | (400 | ) | | | (83,868 | ) |
Pinnacle Investment Management Group, Ltd. | | | (1,328 | ) | | | (5,172 | ) |
Sanne Group PLC | | | (1,422 | ) | | | (10,179 | ) |
| | | | | | | | |
| | | | | | | (206,893 | ) |
| | | | | | | | |
Chemicals (0.4%) | |
Bio-On S.p.A. (b) | | | (600 | ) | | | (37,989 | ) |
Chr. Hansen Holding A/S | | | (774 | ) | | | (78,235 | ) |
Nufarm, Ltd. | | | (5,194 | ) | | | (20,965 | ) |
Orica, Ltd. | | | (2,232 | ) | | | (27,123 | ) |
Valvoline, Inc. | | | (3,800 | ) | | | (75,696 | ) |
| | | | | | | | |
| | | | | | | (240,008 | ) |
| | | | | | | | |
| | | | | | |
The notes to the consolidated financial statements are an integral part of,
and should be read in conjunction with, the consolidated financial statements. | | | | | 15 | |
Consolidated Portfolio of Investments October 31, 2018 (Unaudited) (continued)
| | | | | | | | |
| | |
Shares | | | Value | |
| Common Stocks Sold Short (continued) | |
Commercial Services & Supplies (0.2%) | |
Clean TeQ Holdings, Ltd. (b) | | | (48,148 | ) | | $ | (14,320 | ) |
Fila S.p.A | | | (646 | ) | | | (11,502 | ) |
Mitie Group PLC | | | (3,695 | ) | | | (6,863 | ) |
Multi-Color Corp. | | | (900 | ) | | | (47,844 | ) |
Nl Industries, Inc. (b) | | | (400 | ) | | | (2,120 | ) |
Serco Group PLC (b) | | | (746 | ) | | | (916 | ) |
| | | | | | | | |
| | | | | | | (83,565 | ) |
| | | | | | | | |
Communications Equipment (0.3%) | |
Acacia Communications, Inc. (b) | | | (1,600 | ) | | | (55,152 | ) |
Casa Systems, Inc. (b) | | | (4,600 | ) | | | (66,240 | ) |
Ubiquiti Networks, Inc. | | | (700 | ) | | | (65,163 | ) |
| | | | | | | | |
| | | | | | | (186,555 | ) |
| | | | | | | | |
Construction & Engineering (0.3%) | |
Ameresco, Inc., Class A (b) | | | (1,400 | ) | | | (22,918 | ) |
Argan, Inc. | | | (1,400 | ) | | | (61,628 | ) |
Burkhalter Holding A.G. | | | (9 | ) | | | (703 | ) |
Monadelphous Group, Ltd. | | | (112 | ) | | | (1,141 | ) |
NV5 Global, Inc. (b) | | | (200 | ) | | | (15,614 | ) |
Salini Impregilo S.p.A | | | (4,877 | ) | | | (10,761 | ) |
Valmont Industries, Inc. | | | (500 | ) | | | (62,155 | ) |
| | | | | | | | |
| | | | | | | (174,920 | ) |
| | | | | | | | |
Construction Materials (0.0%)‡ | |
Fletcher Building, Ltd. (b) | | | (4,982 | ) | | | (19,636 | ) |
| | | | | | | | |
|
Consumer Finance (0.3%) | |
Axactor S.E. (b) | | | (6,826 | ) | | | (17,895 | ) |
Navient Corp. | | | (6,000 | ) | | | (69,480 | ) |
Provident Financial PLC (b) | | | (8,659 | ) | | | (56,491 | ) |
| | | | | | | | |
| | | | | | | (143,866 | ) |
| | | | | | | | |
Containers & Packaging (0.2%) | |
Ardagh Group S.A. | | | (200 | ) | | | (2,636 | ) |
Crown Holdings, Inc. (b) | | | (1,500 | ) | | | (63,435 | ) |
Graphic Packaging Holding Co. | | | (5,900 | ) | | | (64,959 | ) |
| | | | | | | | |
| | | | | | | (131,030 | ) |
| | | | | | | | |
Distributors (0.1%) | |
D’ieteren S.A. | | | (75 | ) | | | (2,968 | ) |
Funko, Inc., Class A (b) | | | (2,400 | ) | | | (45,240 | ) |
| | | | | | | | |
| | | | | | | (48,208 | ) |
| | | | | | | | |
Diversified Consumer Services (0.1%) | |
InvoCare, Ltd. | | | (3,441 | ) | | | (29,558 | ) |
| | | | | | | | |
|
Diversified Financial Services (0.1%) | |
Ferroglobe Representation & Warranty Insurance Trust (b)(i)(j)(k) | | | (3,200 | ) | | | 0 | |
GRENKE A.G. | | | (495 | ) | | | (47,544 | ) |
Wendel S.A. | | | (134 | ) | | | (17,394 | ) |
| | | | | | | | |
| | | | | | | (64,938 | ) |
| | | | | | | | |
| | | | | | | | |
| | |
Shares | | | Value | |
Diversified Telecommunication Services (0.4%) | |
Iliad S.A. | | | (598 | ) | | $ | (69,257 | ) |
Intelsat S.A. (b) | | | (1,200 | ) | | | (31,272 | ) |
TalkTalk Telecom Group PLC | | | (35,831 | ) | | | (54,959 | ) |
Vocus Group, Ltd. (b) | | | (27,854 | ) | | | (67,656 | ) |
| | | | | | | | |
| | | | | | | (223,144 | ) |
| | | | | | | | |
Electric Utilities (0.1%) | |
Evergy, Inc. | | | (300 | ) | | | (16,797 | ) |
Orsted A/S (d) | | | (654 | ) | | | (41,552 | ) |
| | | | | | | | |
| | | | | | | (58,349 | ) |
| | | | | | | | |
Electrical Equipment (0.5%) | |
Babcock & Wilcox Enterprises, Inc. (b) | | | (6,200 | ) | | | (6,061 | ) |
GrafTech International, Ltd. | | | (3,900 | ) | | | (69,732 | ) |
Osram Licht A.G. | | | (1,843 | ) | | | (74,773 | ) |
Plug Power, Inc. (b) | | | (33,000 | ) | | | (61,050 | ) |
SGL Carbon S.E. (b) | | | (771 | ) | | | (7,742 | ) |
Vivint Solar, Inc. (b) | | | (10,700 | ) | | | (55,533 | ) |
| | | | | | | | |
| | | | | | | (274,891 | ) |
| | | | | | | | |
Electronic Equipment, Instruments & Components (0.4%) | |
Cognex Corp. | | | (1,300 | ) | | | (55,692 | ) |
Comet Holding A.G. (b) | | | (623 | ) | | | (62,971 | ) |
Fitbit, Inc., Class A (b) | | | (12,800 | ) | | | (60,544 | ) |
IPG Photonics Corp. (b) | | | (200 | ) | | | (26,710 | ) |
Kudelski S.A. (b) | | | (992 | ) | | | (6,984 | ) |
| | | | | | | | |
| | | | | | | (212,901 | ) |
| | | | | | | | |
Energy Equipment & Services (0.4%) | |
Forum Energy Technologies, Inc. (b) | | | (5,900 | ) | | | (52,864 | ) |
Frank’s International N.V. (b) | | | (7,500 | ) | | | (53,250 | ) |
NCS Multistage Holdings, Inc. (b) | | | (3,000 | ) | | | (33,900 | ) |
SEACOR Marine Holdings, Inc. (b) | | | (400 | ) | | | (7,312 | ) |
Solaris Oilfield Infrastructure, Inc., Class A (b) | | | (3,600 | ) | | | (47,520 | ) |
Weatherford International PLC (b) | | | (27,000 | ) | | | (36,450 | ) |
| | | | | | | | |
| | | | | | | (231,296 | ) |
| | | | | | | | |
Entertainment (0.5%) | |
Juventus Football Club S.p.A (b) | | | (35,326 | ) | | | (37,471 | ) |
Liberty Media Corp-Liberty Formula One | |
Class A (b) | | | (900 | ) | | | (28,521 | ) |
Class C (b) | | | (2,100 | ) | | | (69,468 | ) |
Madison Square Garden Co., Class A (b) | | | (200 | ) | | | (55,324 | ) |
Technicolor S.A., Registered (b) | | | (50,787 | ) | | | (64,945 | ) |
| | | | | | | | |
| | | | | | | (255,729 | ) |
| | | | | | | | |
Food & Staples Retailing (0.1%) | |
Rite Aid Corp. (b) | | | (59,100 | ) | | | (70,920 | ) |
| | | | | | | | |
|
Food Products (0.6%) | |
a2 Milk Co., Ltd. (b) | | | (3,505 | ) | | | (23,833 | ) |
Aryzta A.G. (b) | | | (2,587 | ) | | | (24,104 | ) |
Australian Agricultural Co., Ltd. (b) | | | (22,448 | ) | | | (20,983 | ) |
Bellamy’s Australia, Ltd. (b) | | | (8,400 | ) | | | (43,007 | ) |
| | | | |
| 16 | | MainStay Absolute Return Multi-Strategy Fund | | The notes to the consolidated financial statements are an integral part of,
and should be read in conjunction with, the consolidated financial statements. |
| | | | | | | | |
| | |
Shares | | | Value | |
| Common Stocks Sold Short (continued) | | | | | |
Food Products (continued) | |
Costa Group Holdings, Ltd. | | | (13,756 | ) | | $ | (59,422 | ) |
Freshpet, Inc. (b) | | | (1,700 | ) | | | (64,770 | ) |
Suedzucker A.G. | | | (3,251 | ) | | | (50,263 | ) |
Wessanen N.V. | | | (3,877 | ) | | | (40,641 | ) |
| | | | | | | | |
| | | | | | | (327,023 | ) |
| | | | | | | | |
Health Care Equipment & Supplies (0.7%) | |
ABIOMED, Inc. (b) | | | (200 | ) | | | (68,240 | ) |
Cochlear, Ltd. | | | (105 | ) | | | (13,204 | ) |
Insulet Corp. (b) | | | (700 | ) | | | (61,747 | ) |
Ion Beam Applications (b) | | | (1,499 | ) | | | (26,402 | ) |
Nanosonics, Ltd. (b) | | | (25,497 | ) | | | (54,167 | ) |
Penumbra, Inc. (b) | | | (500 | ) | | | (68,000 | ) |
Senseonics Holdings, Inc. (b) | | | (13,500 | ) | | | (50,085 | ) |
TransEnterix, Inc. (b) | | | (7,400 | ) | | | (24,198 | ) |
| | | | | | | | |
| | | | | | | (366,043 | ) |
| | | | | | | | |
Health Care Providers & Services (0.8%) | |
Acadia Healthcare Co., Inc. (b) | | | (2,100 | ) | | | (87,150 | ) |
Henry Schein, Inc. (b) | | | (900 | ) | | | (74,700 | ) |
PetIQ, Inc. (b) | | | (1,800 | ) | | | (56,988 | ) |
Premier, Inc., Class A (b) | | | (1,700 | ) | | | (76,500 | ) |
Ramsay Health Care, Ltd. | | | (1,836 | ) | | | (73,095 | ) |
Spire Healthcare Group PLC (d) | | | (5,338 | ) | | | (8,010 | ) |
Surgery Partners, Inc. (b) | | | (4,400 | ) | | | (59,796 | ) |
| | | | | | | | |
| | | | | | | (436,239 | ) |
| | | | | | | | |
Health Care Technology (0.1%) | |
Pro Medicus, Ltd. | | | (903 | ) | | | (5,832 | ) |
Veeva Systems, Inc., Class A (b) | | | (666 | ) | | | (60,839 | ) |
| | | | | | | | |
| | | | | | | (66,671 | ) |
| | | | | | | | |
Hotels, Restaurants & Leisure (0.6%) | |
Bluegreen Vacations Corp. | | | (900 | ) | | | (11,790 | ) |
Caesars Entertainment Corp. (b) | | | (7,100 | ) | | | (60,989 | ) |
Domino’s Pizza Enterprises, Ltd. | | | (1,929 | ) | | | (73,779 | ) |
Evolution Gaming Group A.B. (d) | | | (598 | ) | | | (44,991 | ) |
International Game Technology PLC | | | (1,200 | ) | | | (22,260 | ) |
LeoVegas A.B. (d) | | | (3,874 | ) | | | (22,649 | ) |
NetEnt A.B. (b) | | | (9,357 | ) | | | (48,057 | ) |
Wingstop, Inc. | | | (900 | ) | | | (56,358 | ) |
| | | | | | | | |
| | | | | | | (340,873 | ) |
| | | | | | | | |
Household Durables (0.6%) | |
Bang & Olufsen A/S (b) | | | (316 | ) | | | (6,573 | ) |
Husqvarna A.B. | | | (8,662 | ) | | | (65,425 | ) |
LGI Homes, Inc. (b) | | | (1,600 | ) | | | (68,464 | ) |
Neinor Homes S.A. (b)(d) | | | (2,217 | ) | | | (35,657 | ) |
Newell Brands, Inc. | | | (3,600 | ) | | | (57,168 | ) |
Roku, Inc. (b) | | | (800 | ) | | | (44,480 | ) |
Skyline Champion Corp. | | | (2,400 | ) | | | (57,192 | ) |
Universal Electronics, Inc. (b) | | | (100 | ) | | | (3,127 | ) |
| | | | | | | | |
| | | | | | | (338,086 | ) |
| | | | | | | | |
| | | | | | | | |
| | |
Shares | | | Value | |
Independent Power & Renewable Electricity Producers (0.0%)‡ | |
Scatec Solar ASA (d) | | | (1,747 | ) | | $ | (11,896 | ) |
| | | | | | | | |
|
Industrial Conglomerates (0.1%) | |
Smiths Group PLC | | | (3,766 | ) | | | (67,271 | ) |
| | | | | | | | |
|
Insurance (0.8%) | |
Brighthouse Financial, Inc. (b) | | | (200 | ) | | | (7,926 | ) |
eHealth, Inc. (b) | | | (1,400 | ) | | | (48,104 | ) |
Gjensidige Forsikring ASA | | | (4,680 | ) | | | (72,506 | ) |
Goosehead Insurance, Inc., Class A (b) | | | (100 | ) | | | (3,428 | ) |
Greenlight Capital Re, Ltd., Class A (b) | | | (1,300 | ) | | | (15,067 | ) |
MBIA, Inc. (b) | | | (6,500 | ) | | | (64,350 | ) |
Medibank Pvt, Ltd. | | | (26,652 | ) | | | (52,657 | ) |
RenaissanceRe Holdings, Ltd. | | | (600 | ) | | | (73,296 | ) |
Trupanion, Inc. (b) | | | (1,800 | ) | | | (45,468 | ) |
White Mountains Insurance Group, Ltd. | | | (100 | ) | | | (88,667 | ) |
| | | | | | | | |
| | | | | | | (471,469 | ) |
| | | | | | | | |
Interactive Media & Services (0.3%) | |
Catena Media PLC (b) | | | (3,147 | ) | | | (35,077 | ) |
Match Group, Inc. (b) | | | (1,300 | ) | | | (67,236 | ) |
Solocal Group (b) | | | (15,726 | ) | | | (12,762 | ) |
Zillow Group, Inc., Class C (b) | | | (1,800 | ) | | | (72,468 | ) |
| | | | | | | | |
| | | | | | | (187,543 | ) |
| | | | | | | | |
Internet & Direct Marketing Retail (0.4%) | |
Kogan.com, Ltd. | | | (1,006 | ) | | | (2,016 | ) |
Ocado Group PLC (b) | | | (5,982 | ) | | | (65,390 | ) |
On the Beach Group PLC (d) | | | (5,265 | ) | | | (28,837 | ) |
Zalando S.E. (b)(d) | | | (1,974 | ) | | | (76,466 | ) |
zooplus A.G. (b) | | | (292 | ) | | | (48,354 | ) |
| | | | | | | | |
| | | | | | | (221,063 | ) |
| | | | | | | | |
IT Services (0.2%) | |
Econocom Group S.A. | | | (1,281 | ) | | | (4,010 | ) |
GTT Communications, Inc. (b) | | | (1,600 | ) | | | (57,440 | ) |
Okta, Inc. (b) | | | (1,000 | ) | | | (58,360 | ) |
| | | | | | | | |
| | | | | | | (119,810 | ) |
| | | | | | | | |
Leisure Products (0.1%) | |
Mattel, Inc. (b) | | | (5,200 | ) | | | (70,616 | ) |
| | | | | | | | |
|
Life Sciences Tools & Services (0.1%) | |
Accelerate Diagnostics, Inc. (b) | | | (3,800 | ) | | | (56,772 | ) |
Genfit (b) | | | (942 | ) | | | (22,001 | ) |
| | | | | | | | |
| | | | | | | (78,773 | ) |
| | | | | | | | |
Machinery (0.7%) | |
Aumann A.G. (d) | | | (647 | ) | | | (31,951 | ) |
Energy Recovery, Inc. (b) | | | (6,800 | ) | | | (51,000 | ) |
Middleby Corp. (b) | | | (600 | ) | | | (67,380 | ) |
NN, Inc. | | | (4,100 | ) | | | (47,560 | ) |
Outotec OYJ (b) | | | (5,520 | ) | | | (21,383 | ) |
| | | | | | |
The notes to the consolidated financial statements are an integral part of,
and should be read in conjunction with, the consolidated financial statements. | | | | | 17 | |
Consolidated Portfolio of Investments October 31, 2018 (Unaudited) (continued)
| | | | | | | | |
| | |
Shares | | | Value | |
| Common Stocks Sold Short (continued) | |
Machinery (continued) | |
Sembcorp Marine, Ltd. | | | (40,800 | ) | | $ | (47,128 | ) |
SLM Solutions Group A.G. (b) | | | (1,157 | ) | | | (20,050 | ) |
Weir Group PLC | | | (3,188 | ) | | | (64,628 | ) |
Welbilt, Inc. (b) | | | (3,500 | ) | | | (65,520 | ) |
| | | | | | | | |
| | | | | | | (416,600 | ) |
| | | | | | | | |
Marine (0.1%) | |
A.P. Moller—Maersk A/S, Class A | | | (30 | ) | | | (35,707 | ) |
Hapag-Lloyd A.G. (d) | | | (8 | ) | | | (296 | ) |
| | | | | | | | |
| | | | | | | (36,003 | ) |
| | | | | | | | |
Media (0.7%) | |
Boston Omaha Corp., Class A (b) | | | (1,200 | ) | | | (33,216 | ) |
Cardlytics, Inc. (b) | | | (1,600 | ) | | | (33,856 | ) |
Entercom Communications Corp., Class A | | | (7,800 | ) | | | (50,622 | ) |
GCI Liberty, Inc., Class A (b) | | | (1,600 | ) | | | (75,728 | ) |
HT&E, Ltd. | | | (10,906 | ) | | | (14,944 | ) |
Liberty Broadband Corp. | | | | | | | | |
Class A (b) | | | (900 | ) | | | (74,511 | ) |
Class C (b) | | | (300 | ) | | | (24,879 | ) |
Loral Space & Communications, Inc. (b) | | | (300 | ) | | | (13,398 | ) |
Schibsted ASA, Class B | | | (2,072 | ) | | | (65,627 | ) |
| | | | | | | | |
| | | | | | | (386,781 | ) |
| | | | | | | | |
Metals & Mining (1.1%) | |
Acacia Mining PLC (b) | | | (22,630 | ) | | | (44,357 | ) |
Constellium N.V., Class A (b) | | | (6,100 | ) | | | (55,266 | ) |
Fresnillo PLC | | | (6,215 | ) | | | (67,413 | ) |
Galaxy Resources, Ltd. (b) | | | (33,275 | ) | | | (51,604 | ) |
Hill & Smith Holdings PLC | | | (244 | ) | | | (3,089 | ) |
Lynas Corp., Ltd. (b) | | | (17,898 | ) | | | (26,363 | ) |
Newcrest Mining, Ltd. | | | (2,723 | ) | | | (39,742 | ) |
Nyrstar N.V. (b) | | | (1,060 | ) | | | (1,914 | ) |
Orocobre, Ltd. (b) | | | (18,369 | ) | | | (43,317 | ) |
Petra Diamonds, Ltd. (b) | | | (18,543 | ) | | | (9,277 | ) |
Pilbara Minerals, Ltd. (b) | | | (109,315 | ) | | | (60,768 | ) |
Royal Gold, Inc. | | | (900 | ) | | | (68,967 | ) |
Syrah Resources, Ltd. (b) | | | (38,221 | ) | | | (43,306 | ) |
thyssenkrupp A.G. | | | (3,237 | ) | | | (68,103 | ) |
Tubacex S.A. (b) | | | (909 | ) | | | (3,223 | ) |
| | | | | | | | |
| | | | | | | (586,709 | ) |
| | | | | | | | |
Multiline Retail (0.1%) | |
Dollar Tree, Inc. (b) | | | (400 | ) | | | (33,720 | ) |
| | | | | | | | |
|
Oil, Gas & Consumable Fuels (1.4%) | |
Alta Mesa Resources, Inc. (b) | | | (7,500 | ) | | | (23,625 | ) |
Amyris, Inc. (b) | | | (8,300 | ) | | | (61,835 | ) |
Cabot Oil & Gas Corp. | | | (3,100 | ) | | | (75,113 | ) |
Centennial Resource Development, Inc., Class A (b) | | | (3,500 | ) | | | (67,060 | ) |
| | | | | | | | |
| | |
Shares | | | Value | |
Oil, Gas & Consumable Fuels (continued) | |
Concho Resources, Inc. (b) | | | (500 | ) | | $ | (69,545 | ) |
Diamondback Energy, Inc. | | | (500 | ) | | | (56,180 | ) |
Dorian LPG, Ltd. (b) | | | (2,600 | ) | | | (20,670 | ) |
EQT Corp. | | | (800 | ) | | | (27,176 | ) |
Golar LNG, Ltd. | | | (2,400 | ) | | | (64,272 | ) |
Halcon Resources Corp. (b) | | | (15,500 | ) | | | (51,460 | ) |
International Seaways, Inc. (b) | | | (1,800 | ) | | | (38,718 | ) |
Kosmos Energy, Ltd. (b) | | | (7,200 | ) | | | (46,728 | ) |
Origin Energy, Ltd. (b) | | | (12,125 | ) | | | (62,594 | ) |
Scorpio Tankers, Inc. | | | (35,300 | ) | | | (63,187 | ) |
Teekay Corp. | | | (3,200 | ) | | | (21,216 | ) |
Tellurian, Inc. (b) | | | (4,700 | ) | | | (37,600 | ) |
| | | | | | | | |
| | | | | | | (786,979 | ) |
| | | | | | | | |
Personal Products (0.2%) | |
BWX, Ltd. | | | (2,679 | ) | | | (4,819 | ) |
Ontex Group N.V. | | | (1,544 | ) | | | (29,625 | ) |
Revlon, Inc., Class A (b) | | | (2,400 | ) | | | (50,400 | ) |
| | | | | | | | |
| | | | | | | (84,844 | ) |
| | | | | | | | |
Pharmaceuticals (1.0%) | |
Aclaris Therapeutics, Inc. (b) | | | (4,200 | ) | | | (49,938 | ) |
Akcea Therapeutics, Inc. (b) | | | (1,300 | ) | | | (29,016 | ) |
COSMO Pharmaceuticals N.V. (b) | | | (159 | ) | | | (20,018 | ) |
Dova Pharmaceuticals, Inc. (b) | | | (3,200 | ) | | | (59,392 | ) |
Eloxx Pharmaceuticals, Inc. (b) | | | (1,500 | ) | | | (18,045 | ) |
Evolus, Inc. (b) | | | (200 | ) | | | (2,964 | ) |
Nektar Therapeutics (b) | | | (1,200 | ) | | | (46,416 | ) |
Omeros Corp. (b) | | | (1,900 | ) | | | (29,013 | ) |
Optinose, Inc. (b) | | | (5,200 | ) | | | (55,016 | ) |
Revance Therapeutics, Inc. (b) | | | (1,200 | ) | | | (26,124 | ) |
TherapeuticsMD, Inc. (b) | | | (11,200 | ) | | | (54,768 | ) |
Theravance Biopharma, Inc. (b) | | | (1,200 | ) | | | (29,124 | ) |
Tricida, Inc. (b) | | | (900 | ) | | | (24,300 | ) |
WaVe Life Sciences, Ltd. (b) | | | (1,300 | ) | | | (60,697 | ) |
Zogenix, Inc. (b) | | | (1,500 | ) | | | (62,640 | ) |
| | | | | | | | |
| | | | | | | (567,471 | ) |
| | | | | | | | |
Professional Services (0.1%) | |
Capita PLC (b) | | | (38,581 | ) | | | (63,443 | ) |
| | | | | | | | |
|
Road & Rail (0.0%)‡ | |
Europcar Mobility Group (d) | | | (393 | ) | | | (3,730 | ) |
| | | | | | | | |
|
Semiconductors & Semiconductor Equipment (0.6%) | |
Ambarella, Inc. (b) | | | (1,600 | ) | | | (55,648 | ) |
Aquantia Corp. (b) | | | (1,600 | ) | | | (15,296 | ) |
Impinj, Inc. (b) | | | (100 | ) | | | (1,960 | ) |
IQE PLC (b) | | | (26,561 | ) | | | (30,725 | ) |
MACOM Technology Solutions Holdings, Inc., Class H (b) | | | (2,600 | ) | | | (36,582 | ) |
Meyer Burger Technology A.G. (b) | | | (31,503 | ) | | | (16,516 | ) |
| | | | |
| 18 | | MainStay Absolute Return Multi-Strategy Fund | | The notes to the consolidated financial statements are an integral part of,
and should be read in conjunction with, the consolidated financial statements. |
| | | | | | | | |
| | |
Shares | | | Value | |
| Common Stocks Sold Short (continued) | |
Semiconductors & Semiconductor Equipment (continued) | |
Smart Global Holdings, Inc. (b) | | | (300 | ) | | $ | (8,403 | ) |
SOITEC (b) | | | (517 | ) | | | (37,038 | ) |
SunPower Corp. (b) | | | (9,100 | ) | | | (54,691 | ) |
u-blox Holding A.G. (b) | | | (323 | ) | | | (40,473 | ) |
Veeco Instruments, Inc. (b) | | | (5,400 | ) | | | (51,354 | ) |
| | | | | | | | |
| | | | | | | (348,686 | ) |
| | | | | | | | |
Software (0.6%) | |
2U, Inc. (b) | | | (1,000 | ) | | | (62,910 | ) |
DocuSign, Inc. (b) | | | (200 | ) | | | (8,388 | ) |
ForeScout Technologies, Inc. (b) | | | (2,100 | ) | | | (57,834 | ) |
Paycom Software, Inc. (b) | | | (500 | ) | | | (62,600 | ) |
Pluralsight, Inc. (b) | | | (200 | ) | | | (4,482 | ) |
RIB Software S.E. | | | (615 | ) | | | (10,644 | ) |
RingCentral, Inc., Class A (b) | | | (800 | ) | | | (62,184 | ) |
ShotSpotter, Inc. (b) | | | (1,200 | ) | | | (46,416 | ) |
Temenos A.G. (b) | | | (125 | ) | | | (17,189 | ) |
| | | | | | | | |
| | | | | | | (332,647 | ) |
| | | | | | | | |
Specialty Retail (0.5%) | |
Camping World Holdings, Inc. | | | (3,000 | ) | | | (51,450 | ) |
Carvana Co. (b) | | | (1,419 | ) | | | (54,986 | ) |
Clas Ohlson A.B., Class B | | | (2,175 | ) | | | (18,313 | ) |
Industria de Diseno Textil S.A. | | | (2,618 | ) | | | (73,924 | ) |
Lumber Liquidators Holdings, Inc. (b) | | | (1,100 | ) | | | (13,156 | ) |
Tile Shop Holdings, Inc. | | | (4,100 | ) | | | (26,650 | ) |
XXL ASA (d) | | | (6,879 | ) | | | (35,416 | ) |
| | | | | | | | |
| | | | | | | (273,895 | ) |
| | | | | | | | |
Technology Hardware, Storage & Peripherals (0.1%) | |
3D Systems Corp. (b) | | | (700 | ) | | | (8,456 | ) |
Pure Storage, Inc., Class A (b) | | | (2,900 | ) | | | (58,522 | ) |
USA Technologies, Inc. (b) | | | (1,000 | ) | | | (5,800 | ) |
| | | | | | | | |
| | | | | | | (72,778 | ) |
| | | | | | | | |
Textiles, Apparel & Luxury Goods (0.4%) | |
Brunello Cucinelli S.p.A. | | | (1,184 | ) | | | (40,567 | ) |
Luxottica Group S.p.A | | | (684 | ) | | | (43,013 | ) |
Puma S.E. | | | (156 | ) | | | (80,219 | ) |
Salvatore Ferragamo S.p.A. | | | (2,546 | ) | | | (60,299 | ) |
Ted Baker PLC | | | (613 | ) | | | (14,354 | ) |
| | | | | | | | |
| | | | | | | (238,452 | ) |
| | | | | | | | |
Thrifts & Mortgage Finance (0.1%) | |
TFS Financial Corp. | | | (3,800 | ) | | | (55,898 | ) |
| | | | | | | | |
|
Trading Companies & Distributors (0.1%) | |
CAI International, Inc. (b) | | | (1,000 | ) | | | (24,910 | ) |
SIG PLC | | | (824 | ) | | | (1,182 | ) |
Textainer Group Holdings, Ltd. (b) | | | (1,000 | ) | | | (11,730 | ) |
| | | | | | | | |
| | | | | | | (37,822 | ) |
| | | | | | | | |
| | | | | | | | |
| | |
Shares | | | Value | |
Transportation Infrastructure (0.2%) | |
Getlink, Registered | | | (4,340 | ) | | $ | (54,638 | ) |
Transurban Group | | | (9,683 | ) | | | (77,759 | ) |
| | | | | | | | |
| | | | | | | (132,397 | ) |
| | | | | | | | |
Water Utilities (0.1%) | |
Aqua America, Inc. | | | (2,000 | ) | | | (65,060 | ) |
| | | | | | | | |
|
Wireless Telecommunication Services (0.1%) | |
1&1 Drillisch A.G. | | | (1,754 | ) | | | (78,354 | ) |
| | | | | | | | |
Total Common Stocks Sold Short (Proceeds $12,769,199) | | | | | | | (11,423,621 | ) |
| | | | | | | | |
|
| Exchange-Traded Funds Sold Short (1.3%) | |
SPDR S&P 500 ETF Trust | | | (1,000 | ) | | | (270,630 | ) |
United States Oil Fund, L.P. (b) | | | (35,100 | ) | | | (484,029 | ) |
| | | | | | | | |
Total Exchange-Traded Funds Sold Short (Proceeds $749,698) | | | | | | | (754,659 | ) |
| | | | | | | | |
Total Investments Sold Short (Proceeds $13,518,897) (l) | | | | | | | (12,178,280 | ) |
| | | | | | | | |
Total Investments, Net of Investments Sold Short
(Cost $50,000,033) | | | 88.8 | % | | | 50,036,097 | |
Other Assets, Less Liabilities | | | 11.2 | | | | 6,327,570 | |
Net Assets | | | 100.0 | % | | $ | 56,363,667 | |
| † | Percentages indicated are based on Fund net assets. |
| ‡ | Less than one-tenth of a percent. |
| (a) | Fixed to floating rate—Rate shown was the rate in effect as of October 31, 2018. |
| (b) | Non-income producing security. |
| (c) | Security, or a portion thereof, was maintained in a segregated account at the Fund’s custodian as collateral for securities Sold Short (See Note 2(N)). |
| (d) | May be sold to institutional investors only under Rule 144A or securities offered pursuant to Section 4(a)(2) of the Securities Act of 1933, as amended. |
| (e) | All or a portion of this security was held on loan. As of October 31, 2018, the market value of securities loaned was $40,018 and the Fund received non-cash collateral in the form of U.S. Treasury securities with a value of $41,174 (See Note 2(O)). |
| (f) | Current yield as of October 31, 2018. |
| (g) | Security, or a portion thereof, was held in the MainStay Multi-Strategy Cayman Fund Ltd., which is a wholly-owned subsidiary of the MainStay Absolute Return Multi-Strategy Fund. |
| (h) | Interest rate shown represents yield to maturity. |
| (i) | Fair valued security—Represents fair value as measured in good faith under procedures approved by the Board of Trustees. As of October 31, |
| | | | | | |
The notes to the consolidated financial statements are an integral part of,
and should be read in conjunction with, the consolidated financial statements. | | | | | 19 | |
Consolidated Portfolio of Investments October 31, 2018 (Unaudited) (continued)
| | 2018, the total market value of fair valued security was $0, which represented less than one-tenth of a percent of the Fund’s net assets. |
| (j) | Security in which significant unobservable inputs (Level 3) were used in determining fair value. |
| (k) | Illiquid security—As of October 31, 2018, the total market value of the security deemed illiquid under procedures approved by the Board of |
| | Trustees was $0, which represented less than one-tenth of a percent of the Fund’s net assets. |
| (l) | As of October 31, 2018, cash in the amount of $5,986,680 was on deposit with broker for short sale transactions. |
As of October 31, 2018, the Fund held the following futures contracts1:
| | | | | | | | | | | | | | | | | | | | |
Type | | Number of
Contracts
(Short) | | | Expiration
Date | | | Value at Trade
Date | | | Current Notional
Amount | | | Unrealized
Appreciation
(Depreciation)2 | |
| Euro Bund | | | (1 | ) | | | December 2018 | | | $ | (181,619 | ) | | $ | (181,519 | ) | | $ | 100 | |
| | | | | | | | | | | | | | | | | | | | |
| 1. | As of October 31, 2018, cash in the amount of $3,081 was on deposit with a broker or futures commission merchant for futures transactions. |
| 2. | Represents the difference between the value of the contracts at the time they were opened and the value as of October 31, 2018. |
Swap Contracts
As of October 31, 2018, the Fund held the following centrally cleared interest rate swap agreements1:
| | | | | | | | | | | | | | | | | | | | | | | | | | | | | | | | | | |
Notional
Amount | | | Currency | | | Expiration
Date | | | Payments
made by Fund | | | Payments
Received by Fund | | | Payment
Frequency
Paid/ Received | | | Upfront
Premiums
Received/
(Paid) | | | Value | | | Unrealized
Appreciation/
(Depreciation) | |
| | $1,400,000 | | | | USD | | | | 8/8/2019 | | | | Fixed 1.621% | | | | 3-Month USD-LIBOR | | |
| Semi-Annually/
Quarterly |
| | $ | (307 | ) | | $ | 13,052 | | | $ | 12,745 | |
| | 730,000 | | | | USD | | | | 6/23/2025 | | | | 3-Month USD-LIBOR | | | | Fixed 2.366% | | |
| Quarterly/
Semi-Annually |
| | | — | | | | (35,121 | ) | | | (35,121 | ) |
| | 165,000 | | | | USD | | | | 1/22/2026 | | | | 3-Month USD-LIBOR | | | | Fixed 1.83% | | |
| Quarterly/
Semi-Annually |
| | | — | | | | (14,398 | ) | | | (14,398 | ) |
| | 1,200,000 | | | | USD | | | | 7/11/2028 | | | | Fixed 2.962% | | | | 3-Month USD-LIBOR | | |
| Semi-Annually/
Quarterly |
| | | — | | | | 27,220 | | | | 27,220 | |
| | | | | | | | | | | | | | | | | | | | | | | | | $ | (307 | ) | | $ | (9,247 | ) | | $ | (9,554 | ) |
As of October 31, 2018, the Fund held the following centrally cleared credit default swap contracts1:
| | | | | | | | | | | | | | | | | | | | | | | | | | | | | | | | |
Reference Entity | | Termination
Date | | | Buy/Sell
Protection2 | | | Notional
Amount
(000)3 | | | (Pay)/
Receive
Fixed
Rate4 | | | Payment
Frequency
Paid/ Received | | | Upfront
Premiums
Received/
(Paid) | | | Value | | | Unrealized
Appreciation/
(Depreciation)5 | |
Markit CDX North American High Yield Series 30 | | | 6/20/2023 | | | | Buy | | | $ | 3,000 | | | | 5.00% | | | | Quarterly | | | $ | (151,172 | ) | | $ | 182,156 | | | $ | 30,984 | |
Markit CDX North American High Yield Series 30 | | | 6/20/2023 | | | | Buy | | | | 8,495 | | | | 1.00% | | | | Quarterly | | | | (136,256 | ) | | | 136,035 | | | | (221 | ) |
| | | | $ | (287,428 | ) | | $ | 318,191 | | | $ | 30,763 | |
| 1. | As of October 31, 2018, cash in the amount of $332,834 was on deposit with a broker for centrally cleared swap agreements. |
| 2. | Buy—Fund pays premium and buys credit protection. If a credit event occurs, as defined under the terms of that particular swap agreement, the Fund will either (i) receive from the seller of protection an amount equal to the notional amount of the swap and deliver the referenced obligation or underlying securities comprising the referenced index or (ii) receive a net settlement amount in the form of cash or securities equal to the notional amount of the swap less the recovery value of the referenced obligation or underlying securities comprising the referenced index. |
| | Sell—Fund receives premium and sells credit protection. If a credit event occurs, as defined under the terms of that particular swap agreement, the Fund will either (i) pay to the buyer of protection an amount equal to the notional amount of the swap and take delivery of the referenced obligation or underlying securities comprising the referenced index or (ii) pay a net settlement amount in the form of cash or securities equal to the notional amount of the swap less the recovery value of the referenced obligation or underlying securities comprising the referenced index. |
| 3. | The maximum potential amount the Fund could be required to pay as a seller of credit protection or receive as a buyer of credit protection if a credit event occurs as defined under the terms of that particular swap contract. |
| | | | |
| 20 | | MainStay Absolute Return Multi-Strategy Fund | | The notes to the consolidated financial statements are an integral part of,
and should be read in conjunction with, the consolidated financial statements. |
| 4. | The annual fixed rate represents the interest received by the Fund (as a seller of protection) or paid by the Fund (as a buyer of protection) annually on the notional amount of the credit default swap contract. |
| 5. | Represents the difference between the value of the credit default swap contracts at the time they were opened and the value at October 31, 2018. |
Open OTC total return basket swap contracts as of October 31, 2018 were as follows:
| | | | | | | | | | | | | | | | | | | | |
Swap Counterparty | | Reference Obligation | | Rate(s)
(Paid)/Received
by the Fund | | Termination
Date | | | Payment
Frequency
Paid/Received | | | Notional
Amount
(000)* | | | Unrealized
Appreciation/
(Depreciation) | |
Bank of America Merrill Lynch | | BofA ML 4x Leveraged MCXSX6L Excess Return Index ** | | 1.00% | | | 5/31/2019 | | | | Monthly | | | $ | 5,152 | | | $ | 4,259 | |
Bank of America Merrill Lynch | | BofA ML Commodity Excess Return Index (MLBX7HCA) ** | | 0.00% | | | 5/31/2019 | | | | N/A | | | | 2,407 | | | | 30,451 | |
Bank of America Merrill Lynch | | BofA ML MLCVDK1X Excess Return Index ** | | 0.00% | | | 5/31/2019 | | | | N/A | | | | 1,683 | | | | 7,976 | |
Citigroup | | Citi Equity Long-Short 4x Index | | 0.00% | | | 3/29/2019 | | | | N/A | | | | 1,520 | | | | (12,837 | ) |
Citigroup | | Citi Equity Volatility Congestion Index | | 0.00% | | | 3/29/2019 | | | | N/A | | | | 914 | | | | 11,597 | |
Credit Suisse | | Credit Suisse Backwardation Long/Short Excess Return Index ** | | 0.60% | | | 5/31/2019 | | | | Monthly | | | | 5,919 | | | | (86,903 | ) |
Societe Generale | | SGI NYLIM Custom US Sector Reversal Index | | 0.00% | | | 5/31/2019 | | | | N/A | | | | 4,308 | | | | 91,086 | |
| | | | | | | | | | | | | | | $ | 21,903 | | | $ | 45,629 | |
The following table represents the basket holdings underlying the total return swap with BofA ML 4x Leveraged MCXSX6L Excess Return Index as of October 31, 2018
BofA ML 4x Leveraged MCXSX6L Excess Return Index
| | | | | | | | | | | | |
Security Description | | Number of
Contracts | | | Market Value as of October 31, 2018 | | | Percent of Basket Net Assets | |
Aluminum | | | — | ^ | | $ | (981,741 | ) | | | (19.20 | )% |
Aluminum | | | — | ^ | | | 1,001,369 | | | | 19.50 | % |
Brent Crude Oil | | | (18 | ) | | | (2,097,152 | ) | | | (40.90 | )% |
Brent Crude Oil | | | 18 | | | | 2,128,299 | | | | 41.50 | % |
Coffee | | | 300 | | | | 567,110 | | | | 11.10 | % |
Coffee | | | (314 | ) | | | (562,364 | ) | | | (11.00 | )% |
Copper | | | — | ^ | | | 1,496,341 | | | | 29.20 | % |
Copper | | | — | ^ | | | (1,485,315 | ) | | | (29.00 | )% |
Corn | | | 259 | | | | 1,577,676 | | | | 30.80 | % |
Corn | | | (271 | ) | | | (1,560,904 | ) | | | (30.50 | )% |
Cotton | | | 288 | | | | 363,409 | | | | 7.10 | % |
Cotton | | | (289 | ) | | | (352,404 | ) | | | (6.90 | )% |
Gasoline RBOB | | | (322 | ) | | | (894,547 | ) | | | (17.50 | )% |
Gasoline RBOB | | | (326 | ) | | | 913,141 | | | | 17.80 | % |
Heating Oil | | | (278 | ) | | | (992,425 | ) | | | (19.40 | )% |
Heating Oil | | | 280 | | | | 995,926 | | | | 19.40 | % |
Kansas Wheat | | | 45 | | | | 381,600 | | | | 7.40 | % |
Kansas Wheat | | | (46 | ) | | | (361,963 | ) | | | (7.10 | )% |
Lean Hogs | | | 376 | | | | 419,820 | | | | 8.20 | % |
Lean Hogs | | | (450 | ) | | | (418,006 | ) | | | (8.20 | )% |
Live Cattle | | | 542 | | | | 1,062,169 | | | | 20.70 | % |
Live Cattle | | | (560 | ) | | | (1,040,361 | ) | | | (20.30 | )% |
Natural Gas | | | (452 | ) | | | (2,371,933 | ) | | | (46.30 | )% |
| | | | | | |
The notes to the consolidated financial statements are an integral part of,
and should be read in conjunction with, the consolidated financial statements. | | | | | 21 | |
Consolidated Portfolio of Investments October 31, 2018 (Unaudited) (continued)
| | | | | | | | | | | | |
Security Description | | Number of
Contracts | | | Market Value as of October 31, 2018 | | | Percent of Basket Net Assets | |
Natural Gas | | | 444 | | | $ | 2,092,977 | | | | 40.90 | % |
Nickel | | | — | ^ | | | (623,691 | ) | | | (12.20 | )% |
Nickel | | | — | ^ | | | 627,627 | | | | 12.30 | % |
Soybean Meal | | | (1 | ) | | | (715,091 | ) | | | (14.00 | )% |
Soybean Meal | | | 1 | | | | 727,002 | | | | 14.20 | % |
Soybean Oil | | | (1,261 | ) | | | (565,602 | ) | | | (11.00 | )% |
Soybean Oil | | | 1,250 | | | | 571,033 | | | | 11.10 | % |
Soybeans | | | 92 | | | | 1,297,662 | | | | 25.30 | % |
Soybeans | | | (95 | ) | | | (1,286,595 | ) | | | (25.10 | )% |
Sugar | | | (3,648 | ) | | | (764,147 | ) | | | (14.90 | )% |
Sugar | | | 3,652 | | | | 771,349 | | | | 15.10 | % |
Wheat | | | 114 | | | | 968,383 | | | | 18.90 | % |
Wheat | | | (117 | ) | | | (931,679 | ) | | | (18.20 | )% |
WTI Crude Oil | | | (18 | ) | | | (1,919,060 | ) | | | (37.50 | )% |
WTI Crude Oil | | | 19 | | | | 1,950,290 | | | | 38.10 | % |
Zinc | | | — | ^ | | | (566,287 | ) | | | (11.10 | )% |
Zinc | | | — | ^ | | | 578,084 | | | | 11.30 | % |
The following table represents the basket holdings underlying the total return swap with BofA ML Commodity Excess Return Index (MLBX7HCA) as of October 31, 2018
BofA ML Commodity Excess Return Index (MLBX7HCA)
| | | | | | | | | | | | |
Security Description | | Number of
Contracts | | | Market Value as of
October 31, 2018 | | | Percent of
Basket
Net Assets | |
Aluminum | | | — | ^ | | $ | (552,665 | ) | | | (22.70 | )% |
Aluminum | | | — | ^ | | | 552,162 | | | | 22.70 | % |
Brent Crude Oil | | | (20 | ) | | | (1,181,509 | ) | | | (48.50 | )% |
Brent Crude Oil | | | — | * | | | (1,635 | ) | | | (0.10 | )% |
Brent Crude Oil | | | 20 | | | | 1,192,694 | | | | 48.90 | % |
Coffee | | | — | ^ | | | 303 | | | | 0.00 | % |
Coffee | | | 289 | | | | 275,909 | | | | 11.30 | % |
Coffee | | | (304 | ) | | | (275,013 | ) | | | (11.30 | )% |
Copper Comex | | | — | ^ | | | (169 | ) | | | (0.00 | )% |
Copper Comex | | | 371 | | | | 800,763 | | | | 32.90 | % |
Copper Comex | | | (375 | ) | | | (800,572 | ) | | | (32.80 | )% |
Corn | | | — | ^ | | | 242 | | | | 0.00 | % |
Corn | | | 280 | | | | 861,444 | | | | 35.30 | % |
Corn | | | (294 | ) | | | (857,299 | ) | | | (35.20 | )% |
Cotton | | | — | ^ | | | 140 | | | | 0.00 | % |
Cotton | | | 312 | | | | 199,259 | | | | 8.20 | % |
Cotton | | | (321 | ) | | | (198,261 | ) | | | (8.10 | )% |
Gasoline RBOB | | | (370 | ) | | | (530,893 | ) | | | (21.80 | )% |
Gasoline RBOB | | | 338 | | | | 541,322 | | | | 22.20 | % |
| | | | |
| 22 | | MainStay Absolute Return Multi-Strategy Fund | | The notes to the consolidated financial statements are an integral part of,
and should be read in conjunction with, the consolidated financial statements. |
| | | | | | | | | | | | |
Security Description | | Number of
Contracts | | | Market Value as of
October 31, 2018 | | | Percent of
Basket
Net Assets | |
Heating Oil | | | (305 | ) | | $ | (548,759 | ) | | | (22.50 | )% |
Heating Oil | | | 308 | | | | 548,262 | | | | 22.50 | % |
Kansas Wheat | | | — | ^ | | | 228 | | | | 0.00 | % |
Kansas Wheat | | | 48 | | | | 204,013 | | | | 8.40 | % |
Kansas Wheat | | | (51 | ) | | | (202,626 | ) | | | (8.30 | )% |
Lean Hogs | | | 4 | | | | 2,300 | | | | 0.10 | % |
Lean Hogs | | | 404 | | | | 228,067 | | | | 9.40 | % |
Lean Hogs | | | (505 | ) | | | (236,899 | ) | | | (9.70 | )% |
Live Cattle | | | 2 | | | | 1,817 | | | | 0.10 | % |
Live Cattle | | | 596 | | | | 590,650 | | | | 24.20 | % |
Live Cattle | | | (625 | ) | | | (587,366 | ) | | | (24.10 | )% |
Natural Gas | | | (488 | ) | | | (1,163,318 | ) | | | (47.70 | )% |
Natural Gas | | | 562 | | | | 1,198,474 | | | | 49.20 | % |
Nickel | | | — | ^ | | | (342,196 | ) | | | (14.00 | )% |
Nickel | | | — | ^ | | | 342,309 | | | | 14.00 | % |
Soybean Meal | | | (2 | ) | | | (393,471 | ) | | | (16.10 | )% |
Soybean Meal | | | 2 | | | | 396,969 | | | | 16.30 | % |
Soybean Oil | | | (1,369 | ) | | | (313,287 | ) | | | (12.90 | )% |
Soybean Oil | | | 1,356 | | | | 313,458 | | | | 12.90 | % |
Soybeans | | | (101 | ) | | | (701,859 | ) | | | (28.80 | )% |
Soybeans | | | 100 | | | | 702,903 | | | | 28.80 | % |
Sugar | | | (3,374 | ) | | | (357,346 | ) | | | (14.70 | )% |
Sugar | | | 3,346 | | | | 357,297 | | | | 14.70 | % |
Wheat | | | — | ^ | | | 1,451 | | | | 0.10 | % |
Wheat | | | 122 | | | | 518,126 | | | | 21.30 | % |
Wheat | | | (130 | ) | | | (523,120 | ) | | | (21.50 | )% |
WTI Crude Oil | | | (21 | ) | | | (1,095,592 | ) | | | (44.90 | )% |
WTI Crude Oil | | | 21 | | | | 1,101,475 | | | | 45.20 | % |
Zinc | | | — | ^ | | | (304,879 | ) | | | (12.50 | )% |
Zinc | | | — | ^ | | | 304,606 | | | | 12.50 | % |
The following table represents the basket holdings underlying the total return swap with BofA ML MLCVDK1X Excess Return Index as of October 31, 2018
BofA ML MLCVDK1X Excess Return Index
| | | | | | | | | | | | |
Security Description | | Number of
Contracts | | | Market Value as of
October 31, 2018 | | | Percent of
Basket
Net Assets | |
Brent Crude Oil | | | — | ^ | | $ | (4,393 | ) | | | (0.30 | )% |
Brent Crude Oil | | | — | ^ | | | 35,462 | | | | 2.10 | % |
Brent Crude Oil | | | — | ^ | | | (24,407 | ) | | | (1.40 | )% |
Brent Crude Oil | | | — | ^ | | | (65,904 | ) | | | (3.90 | )% |
Copper | | | — | ^ | | | (4,343 | ) | | | (0.30 | )% |
Copper | | | — | ^ | | | (28,348 | ) | | | (1.70 | )% |
| | | | | | |
The notes to the consolidated financial statements are an integral part of,
and should be read in conjunction with, the consolidated financial statements. | | | | | 23 | |
Consolidated Portfolio of Investments October 31, 2018 (Unaudited) (continued)
| | | | | | | | | | | | |
Security Description | | Number of
Contracts | | | Market Value as of
October 31, 2018 | | | Percent of
Basket
Net Assets | |
Copper | | | — | ^ | | $ | (75,957 | ) | | | (4.50 | )% |
Copper | | | — | ^ | | | (24,595 | ) | | | (1.50 | )% |
Corn | | | 1 | | | | 34,337 | | | | 2.00 | % |
Corn | | | (1 | ) | | | (28,662 | ) | | | (1.70 | )% |
Gold | | | — | ^ | | | 26,532 | | | | 1.60 | % |
Gold | | | — | ^ | | | (101,171 | ) | | | (6.00 | )% |
Natural Gas | | | 1 | | | | 29,684 | | | | 1.80 | % |
Natural Gas | | | — | ^ | | | 6,176 | | | | 0.40 | % |
Natural Gas | | | 8 | | | | 187,320 | | | | 11.10 | % |
Soybeans | | | 1 | | | | 78,785 | | | | 4.70 | % |
Soybeans | | | — | ^ | | | 18,199 | | | | 1.10 | % |
Wheat | | | — | ^ | | | (7,398 | ) | | | (0.40 | )% |
Wheat | | | (1 | ) | | | (25,084 | ) | | | (1.50 | )% |
WTI Crude Oil | | | — | ^ | | | (29,058 | ) | | | (1.70 | )% |
WTI Crude Oil | | | — | ^ | | | (59,759 | ) | | | (3.50 | )% |
WTI Crude Oil | | | — | ^ | | | (30,339 | ) | | | (1.80 | )% |
WTI Crude Oil | | | — | ^ | | | (94,658 | ) | | | (5.60 | )% |
The following table represents the basket holdings underlying the total return swap with Citi Equity Long-Short 4x Index as of October 31, 2018
Citi Equity Long-Short 4x Index
| | | | | | | | | | | | |
Security Description | | Number of
Shares | | | Market Value as of
October 31, 2018 | | | Percent of Basket Net Assets | |
Aetna, Inc. | | | 270 | | | $ | 53,545 | | | | 3.60 | % |
Aflac, Inc. | | | 1,878 | | | | 80,882 | | | | 5.40 | % |
Ageas | | | 413 | | | | 20,687 | | | | 1.40 | % |
Allianz SE | | | 330 | | | | 68,903 | | | | 4.60 | % |
Altria Group, Inc. | | | 778 | | | | 50,616 | | | | 3.40 | % |
Alumina, Ltd. | | | 10,311 | | | | 18,636 | | | | 1.20 | % |
Ameriprise Financial, Inc. | | | 363 | | | | 46,219 | | | | 3.10 | % |
Amgen, Inc. | | | 437 | | | | 84,207 | | | | 5.60 | % |
Antero Resources Corp. | | | 1,615 | | | | 25,668 | | | | 1.70 | % |
Apple, Inc. | | | 165 | | | | 36,017 | | | | 2.40 | % |
ArcelorMittal | | | 1,162 | | | | 29,022 | | | | 1.90 | % |
Arista Networks, Inc. | | | 63 | | | | 14,487 | | | | 1.00 | % |
Asahi Kasei Corp. | | | 2,936 | | | | 35,301 | | | | 2.30 | % |
Athene Holding Ltd. | | | 825 | | | | 37,722 | | | | 2.50 | % |
Atmos Energy Corp. | | | 308 | | | | 28,660 | | | | 1.90 | % |
Automatic Data Processing, Inc. | | | 599 | | | | 86,334 | | | | 5.70 | % |
Aviva PLC | | | 7,550 | | | | 41,336 | | | | 2.70 | % |
AXA SA | | | 734 | | | | 18,413 | | | | 1.20 | % |
Best Buy Co., Inc. | | | 1,260 | | | | 88,403 | | | | 5.90 | % |
Biogen, Inc. | | | 68 | | | | 20,778 | | | | 1.40 | % |
| | | | |
| 24 | | MainStay Absolute Return Multi-Strategy Fund | | The notes to the consolidated financial statements are an integral part of,
and should be read in conjunction with, the consolidated financial statements. |
| | | | | | | | | | | | |
Security Description | | Number of
Shares | | | Market Value as of
October 31, 2018 | | | Percent of Basket Net Assets | |
Bristol-Myers Squibb Co. | | | 1,413 | | | $ | 71,429 | | | | 4.70 | % |
Canadian National Railway Co. | | | 930 | | | | 79,692 | | | | 5.30 | % |
Cash | | | 1,497,706 | | | | 1,497,706 | | | | 99.40 | % |
Celgene Corp. | | | 364 | | | | 26,069 | | | | 1.70 | % |
Check Point Software Technolog | | | 528 | | | | 58,621 | | | | 3.90 | % |
Cie Generale des Etablissements Michelin SCA | | | 223 | | | | 22,924 | | | | 1.50 | % |
Cigna Corp. | | | 106 | | | | 22,645 | | | | 1.50 | % |
Cisco Systems, Inc. | | | 897 | | | | 41,056 | | | | 2.70 | % |
Cognizant Technology Solutions Corp. | | | 393 | | | | 27,158 | | | | 1.80 | % |
Consolidated Edison, Inc. | | | 877 | | | | 66,633 | | | | 4.40 | % |
Costco Wholesale Corp. | | | 119 | | | | 27,287 | | | | 1.80 | % |
Covestro AG | | | 664 | | | | 42,942 | | | | 2.80 | % |
Daito Trust Construction Co., Ltd. | | | 443 | | | | 58,504 | | | | 3.90 | % |
Darden Restaurants, Inc. | | | 382 | | | | 40,649 | | | | 2.70 | % |
Dollar General Corp. | | | 698 | | | | 77,734 | | | | 5.20 | % |
Eaton Corp. PLC | | | 369 | | | | 26,475 | | | | 1.80 | % |
Eni SpA | | | 4,502 | | | | 80,112 | | | | 5.30 | % |
Exelon Corp. | | | 384 | | | | 16,843 | | | | 1.10 | % |
F5 Networks, Inc. | | | 430 | | | | 75,441 | | | | 5.00 | % |
Facebook, Inc. | | | 343 | | | | 52,113 | | | | 3.50 | % |
Fortinet, Inc. | | | 835 | | | | 68,617 | | | | 4.60 | % |
Garmin, Ltd. | | | 265 | | | | 17,525 | | | | 1.20 | % |
General Dynamics Corp. | | | 332 | | | | 57,252 | | | | 3.80 | % |
Goodman Group | | | 3,166 | | | | 23,289 | | | | 1.50 | % |
Humana, Inc. | | | 232 | | | | 74,432 | | | | 4.90 | % |
IHS Markit, Ltd. | | | 1,391 | | | | 73,085 | | | | 4.80 | % |
Imperial Brands PLC | | | 1,573 | | | | 53,331 | | | | 3.50 | % |
Interpublic Group of Cos., Inc. | | | 2,422 | | | | 56,086 | | | | 3.70 | % |
Intuit, Inc. | | | 283 | | | | 59,711 | | | | 4.00 | % |
Intuitive Surgical, Inc. | | | 56 | | | | 29,198 | | | | 1.90 | % |
Jack Henry & Associates, Inc. | | | 136 | | | | 20,397 | | | | 1.40 | % |
Japan Airlines Co., Ltd. | | | 976 | | | | 34,727 | | | | 2.30 | % |
JFE Holdings, Inc. | | | 860 | | | | 16,247 | | | | 1.10 | % |
Jones Lang LaSalle, Inc. | | | 184 | | | | 24,292 | | | | 1.60 | % |
Koninklijke Ahold NV | | | 3,640 | | | | 83,428 | | | | 5.50 | % |
Legal & General Group PLC | | | 10,860 | | | | 34,900 | | | | 2.30 | % |
Lincoln National Corp. | | | 992 | | | | 59,729 | | | | 4.00 | % |
Lululemon Athletica, Inc. | | | 164 | | | | 23,061 | | | | 1.50 | % |
Manulife Financial Corp. | | | 5,052 | | | | 79,745 | | | | 5.30 | % |
Marubeni Corp. | | | 2,882 | | | | 23,401 | | | | 1.60 | % |
Maxim Integrated Products, Inc. | | | 1,419 | | | | 70,991 | | | | 4.70 | % |
McKesson Corp. | | | 304 | | | | 37,935 | | | | 2.50 | % |
Medtronic PLC | | | 226 | | | | 20,276 | | | | 1.30 | % |
MetLife, Inc. | | | 1,417 | | | | 58,371 | | | | 3.90 | % |
| | | | | | |
The notes to the consolidated financial statements are an integral part of,
and should be read in conjunction with, the consolidated financial statements. | | | | | 25 | |
Consolidated Portfolio of Investments October 31, 2018 (Unaudited) (continued)
| | | | | | | | | | | | |
Security Description | | Number of
Shares | | | Market Value as of
October 31, 2018 | | | Percent of Basket Net Assets | |
MSCI Daily TR Gross World USD | | | (683 | ) | | $ | (5,674,757 | ) | | | (376.50 | )% |
NetApp, Inc. | | | 582 | | | | 45,673 | | | | 3.00 | % |
Nippon Telegraph & Telephone Co. | | | 2,040 | | | | 85,882 | | | | 5.70 | % |
Occidental Petroleum Corp. | | | 1,094 | | | | 73,390 | | | | 4.90 | % |
Omnicom Group, Inc. | | | 256 | | | | 19,053 | | | | 1.30 | % |
Paychex, Inc. | | | 1,249 | | | | 81,770 | | | | 5.40 | % |
Pearson PLC | | | 2,041 | | | | 23,439 | | | | 1.60 | % |
Persimmon PLC | | | 715 | | | | 20,966 | | | | 1.40 | % |
Peugeot SA | | | 1,089 | | | | 25,942 | | | | 1.70 | % |
Pfizer, Inc. | | | 1,979 | | | | 85,206 | | | | 5.70 | % |
Principal Financial Group, Inc. | | | 1,054 | | | | 49,593 | | | | 3.30 | % |
Procter & Gamble Co. | | | 1,082 | | | | 95,911 | | | | 6.40 | % |
ProSiebenSat.1 Media S.E. | | | 628 | | | | 14,530 | | | | 1.00 | % |
Prudential Financial, Inc. | | | 519 | | | | 48,695 | | | | 3.20 | % |
Publicis Groupe SA | | | 597 | | | | 34,640 | | | | 2.30 | % |
Raytheon Co. | | | 134 | | | | 23,469 | | | | 1.60 | % |
Red Hat, Inc. | | | 195 | | | | 33,438 | | | | 2.20 | % |
Reinsurance Group of America, Inc. | | | 217 | | | | 30,956 | | | | 2.10 | % |
Repsol SA | | | 4,143 | | | | 74,279 | | | | 4.90 | % |
Rio Tinto, Ltd. | | | 749 | | | | 40,581 | | | | 2.70 | % |
Rolls-Royce Holdings PLC | | | 3,993 | | | | 42,806 | | | | 2.80 | % |
Ross Stores, Inc. | | | 926 | | | | 91,685 | | | | 6.10 | % |
Safran SA | | | 700 | | | | 90,468 | | | | 6.00 | % |
Sandvik AB | | | 1,016 | | | | 16,114 | | | | 1.10 | % |
Sony Corp. | | | 1,155 | | | | 62,840 | | | | 4.20 | % |
Sun Life Financial, Inc. | | | 1,213 | | | | 44,517 | | | | 3.00 | % |
Swiss Life Holding AG | | | 138 | | | | 52,281 | | | | 3.50 | % |
Take-Two Interactive Software | | | 468 | | | | 60,248 | | | | 4.00 | % |
TD Ameritrade Holding Corp. | | | 346 | | | | 17,875 | | | | 1.20 | % |
Tesco PLC | | | 7,240 | | | | 19,733 | | | | 1.30 | % |
Texas Instruments, Inc. | | | 337 | | | | 31,308 | | | | 2.10 | % |
TJX Cos Inc. (The) | | | 808 | | | | 88,742 | | | | 5.90 | % |
Tokio Marine Holdings, Inc. | | | 817 | | | | 38,706 | | | | 2.60 | % |
Toll Brothers, Inc. | | | 933 | | | | 31,401 | | | | 2.10 | % |
Torchmark Corp. | | | 354 | | | | 29,965 | | | | 2.00 | % |
ULTA Beauty, Inc. | | | 95 | | | | 26,029 | | | | 1.70 | % |
Unum Group | | | 1,187 | | | | 43,025 | | | | 2.90 | % |
UPM-Kymmene OYJ | | | 481 | | | | 15,483 | | | | 1.00 | % |
Veeva Systems, Inc. | | | 954 | | | | 87,151 | | | | 5.80 | % |
Vertex Pharmaceuticals, Inc. | | | 100 | | | | 17,005 | | | | 1.10 | % |
Visa, Inc. | | | 560 | | | | 77,186 | | | | 5.10 | % |
VMware, Inc. | | | 273 | | | | 38,571 | | | | 2.60 | % |
Walgreens Boots Alliance, Inc. | | | 573 | | | | 45,686 | | | | 3.00 | % |
Waters Corp. | | | 226 | | | | 42,818 | | | | 2.80 | % |
| | | | |
| 26 | | MainStay Absolute Return Multi-Strategy Fund | | The notes to the consolidated financial statements are an integral part of,
and should be read in conjunction with, the consolidated financial statements. |
| | | | | | | | | | | | |
Security Description | | Number of
Shares | | | Market Value as of
October 31, 2018 | | | Percent of Basket Net Assets | |
Wm Morrison Supermarkets PLC | | | 8,976 | | | $ | 28,455 | | | | 1.90 | % |
Xilinx, Inc. | | | 475 | | | | 40,521 | | | | 2.70 | % |
Yahoo Japan Corp. | | | 5,536 | | | | 17,413 | | | | 1.20 | % |
Zurich Insurance Group AG | | | 285 | | | | 88,668 | | | | 5.90 | % |
The following table represents the basket holdings underlying the total return swap with Citi Equity Volatility Congestion Index as of October 31, 2018
Citi Equity Volatility Congestion Index
| | | | | | | | | | | | |
Security Description | | Number of
Contracts | | | Market Value as of
October 31, 2018 | | | Percent of Basket
Net Assets | |
Cash | | | 930,061 | | | $ | 930,061 | | | | 100.50 | % |
CBOE VIX Future Dec18 | | | (20 | ) | | | (397 | ) | | | (0.00 | )% |
CBOE VIX Future Nov18 | | | (192 | ) | | | (3,885 | ) | | | (0.40 | )% |
The following table represents the basket holdings underlying the total return swap with Credit Suisse Backwardation Long/Short Excess Return Index as of October 31, 2018
Credit Suisse Backwardation Long/Short Excess Return Index
| | | | | | | | | | | | |
Security Description | | Number of
Contracts | | | Market Value as of
October 31, 2018 | | | Percent of Basket
Net Assets | |
Cattle (Live Cattle) Future | | | (14 | ) | | $ | (583,567 | ) | | | (10.00 | )% |
Cattle (Live Cattle) Future | | | 7 | | | | 347,692 | | | | 6.00 | % |
Cattle (Live Cattle) Future | | | 5 | | | | 235,875 | | | | 4.00 | % |
Corn | | | (32 | ) | | | (583,567 | ) | | | (10.00 | )% |
Gasoline RBOB Future | | | (8 | ) | | | (583,567 | ) | | | (10.00 | )% |
Heating Oil | | | 2 | | | | 161,736 | | | | 2.80 | % |
Heating Oil | | | 5 | | | | 421,831 | | | | 7.20 | % |
Lean Hogs Future | | | (25 | ) | | | (583,567 | ) | | | (10.00 | )% |
Low Sulphur Gasoil Future | | | 2 | | | | 157,848 | | | | 2.70 | % |
Low Sulphur Gasoil Future | | | 6 | | | | 425,719 | | | | 7.30 | % |
Natural Gas Future | | | 5 | | | | 147,683 | | | | 2.50 | % |
Natural Gas Future | | | 8 | | | | 208,473 | | | | 3.60 | % |
Natural Gas Future | | | 6 | | | | 167,012 | | | | 2.90 | % |
Natural Gas Future | | | 2 | | | | 60,399 | | | | 1.00 | % |
Wheat Future | | | (24 | ) | | | (583,567 | ) | | | (10.00 | )% |
Zinc Future | | | 2 | | | | 152,556 | | | | 2.60 | % |
Zinc Future | | | 3 | | | | 212,531 | | | | 3.60 | % |
Zinc Future | | | 3 | | | | 160,736 | | | | 2.80 | % |
Zinc Future | | | 1 | | | | 57,743 | | | | 1.00 | % |
| | | | | | |
The notes to the consolidated financial statements are an integral part of,
and should be read in conjunction with, the consolidated financial statements. | | | | | 27 | |
Consolidated Portfolio of Investments October 31, 2018 (Unaudited) (continued)
The following table represents the basket holdings underlying the total return swap with SGI NYLIM Custom US Sector Reversal Index as of October 31, 2018
SGI NYLIM Custom US Sector Reversal Index
| | | | | | | | | | | | |
Security Description | | Number of
Contracts | | | Market
Value as of
October 31, 2018 | | | Percent of
Net Assets | |
S&P 500 Energy Sector TR | | | 5,094 | | | $ | 4,490,711 | | | | 102.00 | % |
S&P 500 Industrial Sector TR | | | 4,733 | | | | 4,490,711 | | | | 102.00 | % |
S&P 500 Total Return | | | (1,689 | ) | | | (9,069,476 | ) | | | (206.00 | )% |
Open OTC Candriam proprietary total return swap contracts as of October 31, 2018 were as follows:
| | | | | | | | |
Swap Counterparty | | Reference Obligation | | Description | | Unrealized
Appreciation/
(Depreciation) | |
Societe Generale Newedge UK Limited | | Candriam IG Diversified Futures Index ** | | Total return swap with Societe Generale Newedge UK Limited (“SG Newedge UK”).The swap provides exposure to the total returns of the Candriam Alternative ReturnSystemat program, calculated on a daily basis with a reference to a managed account owned SG Newedge UK, a company formed under the laws of England. (Notional Amount $7,095,831)*** | | $ | 23,755 | |
Societe Generale Newedge UK Limited | | Candriam Global Alpha Index | | Total return swap with SG Newedge UK. The swap provides exposure to the returns of the exchange-traded derivatives and OTC foreign exchange forwards for the Candriam Global Alpha strategy, calculated on a daily basis with a reference to a managed account owned by SG Newedge UK, a company formed under the laws of England. (Notional Amount $8,888,406)**** | | | (16,177 | ) |
| | | | | | | $ | 7,578 | |
The summaries below provide breakdown of the derivative contracts comprising the index of the above Candriam proprietary total return swaps as of October 31, 2018:
Candriam IG Diversified Futures Index
| | | | |
Category | | % Breakdown | |
Physical Commodity Future | | | 1,105.94 | % |
Physical Index Future | | | 85.11 | |
Foreign Currency | | | 4.03 | |
Currency | | | (3.09 | ) |
Currency Future | | | (137.16 | ) |
Financial Commodity Future | | | (954.83 | ) |
Total | | | 100.00 | % |
| | | | | | | | | | | | | | | | | | |
Description | | Sector | | Number of
Contracts | | | Notional
Amount
(000)* | | | Unrealized
Appreciation
(Depreciation) | | | Percent of
Basket
Net Assets | |
3-Month Euribor Jun20 | | Financial Commodity Future | | | 547,844 | | | | 62,036 | | | $ | (3,172 | ) | | | (907.79 | )% |
90Day Euro Future Jun20 | | Financial Commodity Future | | | (251,797 | ) | | | (24,371 | ) | | | 11,047 | | | | 356.64 | |
90Day Sterling Future Jun20 | | Financial Commodity Future | | | 86,787 | | | | 10,954 | | | | (10,727 | ) | | | (160.30 | ) |
AUD/USD Currency Future Dec18 | | Currency Future | | | (11,191 | ) | | | (792 | ) | | | 3,380 | | | | 11.60 | |
Australian Dollar | | Foreign Currency | | | (65,520 | ) | | | (46 | ) | | | 170 | | | | 0.68 | |
BP Currency Future Dec18 | | Currency Future | | | 1,356 | | | | 174 | | | | 1,102 | | | | (2.54 | ) |
Brent Crude Future Jan19 | | Physical Commodity Future | | | (228 | ) | | | (17 | ) | | | (631 | ) | | | 0.25 | |
British Pound Sterling | | Foreign Currency | | | (47,702 | ) | | | (61 | ) | | | (353 | ) | | | 0.89 | |
CAC40 10 Euro Future Nov18 | | Physical Index Future | | | (9 | ) | | | (53 | ) | | | (1,188 | ) | | | 0.77 | |
| | | | |
| 28 | | MainStay Absolute Return Multi-Strategy Fund | | The notes to the consolidated financial statements are an integral part of,
and should be read in conjunction with, the consolidated financial statements. |
| | | | | | | | | | | | | | | | | | |
Description | | Sector | | Number of
Contracts | | | Notional
Amount
(000)* | | | Unrealized
Appreciation
(Depreciation) | | | Percent of
Basket
Net Assets | |
Canadian Currency Future Dec18 | | Currency Future | | | (7,308 | ) | | | (555 | ) | | $ | 1,667 | | | | 8.13 | % |
CBOE VIX Future Nov18 | | Physical Index Future | | | 1,599 | | | | 32 | | | | (1,039 | ) | | | (0.47 | ) |
Copper Future Dec18 | | Physical Commodity Future | | | (771 | ) | | | (205 | ) | | | 311 | | | | 3.00 | |
Corn Future Dec18 | | Physical Commodity Future | | | (80 | ) | | | (2,904 | ) | | | 120 | | | | 42.49 | |
Cotton No. 2 Future Dec18 | | Physical Commodity Future | | | (6,566 | ) | | | (505 | ) | | | 247 | | | | 7.39 | |
DAX Index Future Dec18 | | Physical Index Future | | | (17 | ) | | | (222 | ) | | | (3,104 | ) | | | 3.25 | |
DJIA MINI e-CBOT Dec18 | | Physical Index Future | | | 2 | | | | 4,295 | | | | 373 | | | | (62.86 | ) |
EMINI Russell 2000 Dec18 | | Physical Index Future | | | (80 | ) | | | (121 | ) | | | (21 | ) | | | 1.77 | |
Euro | | Foreign Currency | | | (137,832 | ) | | | (156 | ) | | | 255 | | | | 2.28 | |
Euro FX Currency Future Dec18 | | Currency Future | | | (799,355 | ) | | | (908 | ) | | | 2,330 | | | | 13.28 | |
Euro Stoxx 50 Dec18 | | Physical Index Future | | | 25 | | | | 91 | | | | 1,984 | | | | (1.33 | ) |
Euro-BTP Future Dec18 | | Financial Commodity Future | | | (4,682 | ) | | | (645 | ) | | | (1,791 | ) | | | 9.44 | |
Euro-Bund Future Dec18 | | Financial Commodity Future | | | 11,305 | | | | 2,052 | | | | (2,322 | ) | | | (30.03 | ) |
Euro-OAT Future Dec18 | | Financial Commodity Future | | | 19,299 | | | | 3,322 | | | | (1,527 | ) | | | (48.61 | ) |
EURO/JPY Future Dec18 | | Currency Future | | | (499,597 | ) | | | (5,665 | ) | | | 1,013 | | | | 82.89 | |
FTSE 100 Index Future Dec18 | | Physical Index Future | | | 11 | | | | 104 | | | | 2,401 | | | | (1.52 | ) |
Gasoline RBOB Future Dec18 | | Physical Commodity Future | | | (1,199 | ) | | | (210 | ) | | | 6,103 | | | | 3.07 | |
Gold 100 OZ Future Dec18 | | Physical Commodity Future | | | (491 | ) | | | (597 | ) | | | 486 | | | | 8.73 | |
Hang Seng Index Future Nov18 | | Physical Index Future | | | (108 | ) | | | (34,461 | ) | | | (4,339 | ) | | | 504.28 | |
Hong Kong Dollar | | Foreign Currency | | | 70,932 | | | | 9 | | | | 2 | | | | (0.13 | ) |
Japan 10 Year Bond (OSE) Dec18 | | Financial Commodity Future | | | 6,623,226 | | | | 8,842 | | | | (4,808 | ) | | | (129.38 | ) |
Japanese Yen | | Foreign Currency | | | (38,108,943 | ) | | | (338 | ) | | | (433 | ) | | | 4.94 | |
Japanese Yen Currency Future Dec18 | | Currency Future | | | (11,562 | ) | | | (1,026 | ) | | | 916 | | | | 15.02 | |
Korea 3 Year Bond Future Dec18 | | Financial Commodity Future | | | 78,565,162 | | | | 7,496 | | | | (4,708 | ) | | | (109.69 | ) |
Live Cattle Future Dec18 | | Physical Commodity Future | | | 6,212 | | | | 727 | | | | 1,151 | | | | (10.63 | ) |
Mexican Peso Future Dec18 | | Currency Future | | | (34,829 | ) | | | (17 | ) | | | 525 | | | | 0.25 | |
Natural Gas Future Dec18 | | Physical Commodity Future | | | 44,535 | | | | 145 | | | | 3,296 | | | | (2.13 | ) |
New Zealand Dollar Future Dec18 | | Currency Future | | | (12,447 | ) | | | (812 | ) | | | 4,356 | | | | 11.88 | |
Nikkei 225 (SGX) Dec18 | | Physical Index Future | | | 1,256 | | | | 24,308 | | | | 4,172 | | | | (355.70 | ) |
Norwegian Krone Currency Future Dec18 | | Currency Future | | | 15,987 | | | | 18,994 | | | | (1,349 | ) | | | (277.95 | ) |
NY Harbor ULSD Future Dec18 | | Physical Commodity Future | | | 528 | | | | 119 | | | | (422 | ) | | | (1.74 | ) |
Primary Aluminium Future | | Physical Commodity Future | | | (331 | ) | | | (645 | ) | | | 4,162 | | | | 9.44 | |
S&P500 EMINI Future Dec18 | | Physical Index Future | | | 57 | | | | 155 | | | | 5,384 | | | | (2.27 | ) |
Silver Future Dec18 | | Physical Commodity Future | | | (40,539 | ) | | | (6 | ) | | | 6,936 | | | | 0.08 | |
South African Rand Currency (CME) Future Dec18 | | Currency Future | | | (32,545 | ) | | | (22 | ) | | | 1,357 | | | | 0.32 | |
South Korean Won | | Foreign Currency | | | 361,704,113 | | | | 317 | | | | (84 | ) | | | (4.64 | ) |
Soybean Future Jan19 | | Physical Commodity Future | | | (451 | ) | | | (38,419 | ) | | | (2,841 | ) | | | 562.20 | |
SPI 200 Future Dec18 | | Physical Index Future | | | 54 | | | | 223 | | | | 1,007 | | | | (3.26 | ) |
Sugar #11 (WORLD) Mar19 | | Physical Commodity Future | | | 21,615 | | | | 285 | | | | (2,805 | ) | | | (4.17 | ) |
Topix Index Future Dec18 | | Physical Index Future | | | (11,419 | ) | | | (166 | ) | | | (3,130 | ) | | | 2.43 | |
U.S. 10 Year Note (CBT) Future Dec18 | | Financial Commodity Future | | | (13,361 | ) | | | (1,582 | ) | | | 2,616 | | | | 23.16 | |
U.S. 5 Year Note (CBT) Dec18 | | Financial Commodity Future | | | (13,475 | ) | | | (1,514 | ) | | | 2,473 | | | | 22.16 | |
U.S. Long Bond (CBT) Dec18 | | Financial Commodity Future | | | (9,821 | ) | | | (1,356 | ) | | | 4,675 | | | | 19.85 | |
United States Dollar | | Currency | | | 210,906 | | | | 211 | | | | — | | | | (3.09 | ) |
| | | | | | |
The notes to the consolidated financial statements are an integral part of,
and should be read in conjunction with, the consolidated financial statements. | | | | | 29 | |
Consolidated Portfolio of Investments October 31, 2018 (Unaudited) (continued)
| | | | | | | | | | | | | | | | | | |
Description | | Sector | | Number of
Contracts | | | Notional
Amount
(000)* | | | Unrealized
Appreciation
(Depreciation) | | | Percent of
Basket
Net Assets | |
Wheat Future (CBT) Dec18 | | Physical Commodity Future | | | (662 | ) | | | (33,149 | ) | | $ | (368 | ) | | | 485.08 | % |
WTI Crude Future Dec18 | | Physical Commodity Future | | | 3,312 | | | | 216 | | | | (1,442 | ) | | | (3.16 | ) |
Zinc LME Future Nov18 | | Physical Commodity Future | | | (154 | ) | | | (393 | ) | | | 6,788 | | | | 5.75 | |
| | | | | | | | | | | | $ | 30,201 | | | | | |
| | | | | | | | | | | | | | | | | | |
Net Cash and Other Receivables/Payables | | | | | | | | | | | | | (6,446 | ) | | | | |
| | | | | | | | | | | | | | | | | | |
Swaps, at Value | | | | | | | | | | | | $ | 23,755 | | | | | |
| | | | | | | | | | | | | | | | | | |
Candriam Global Alpha Index
| | | | |
Category | | % Breakdown | |
Currency Future | | | 325.71 | % |
Foreign Currency | | | 16.52 | |
Financial Index Future | | | 11.29 | |
Currency | | | 9.13 | |
Physical Commodity Future Option | | | (0.53 | ) |
Financial Commodity Option | | | (1.14 | ) |
Physical Index Option | | | (2.82 | ) |
Currency Option | | | (4.57 | ) |
Physical Index Future | | | (5.90 | ) |
Index Option | | | (62.39 | ) |
Financial Commodity Future | | | (185.30 | ) |
Total | | | 100.00 | % |
| | | | | | | | | | | | | | | | | | |
Description | | Sector | | Number of
Contracts | | | Notional
Amount
(000)* | | | Unrealized
Appreciation
(Depreciation) | | | Percent of
Basket
Net Assets | |
3.5% Fuel Oil Swap Med 22000 | | Physical Commodity Future Option | | | (3,881 | ) | | | (22 | ) | | $ | (7,555 | ) | | | (0.46 | )% |
3.5% Fuel Oil Swap Med 22500 | | Physical Commodity Future Option | | | (4,109 | ) | | | (4 | ) | | | (2,164 | ) | | | (0.09 | ) |
90Day Euro Future Dec19 | | Financial Commodity Future | | | 232,834 | | | | 22,537 | | | | (11,642 | ) | | | 460.32 | |
90Day Euro Future Dec21 | | Financial Commodity Future | | | (232,834 | ) | | | (22,545 | ) | | | 10,478 | | | | (460.49 | ) |
90Day Euro Future Mar19 | | Financial Commodity Future | | | (50,504 | ) | | | (4,904 | ) | | | 1,010 | | | | (100.18 | ) |
AUD/USD Currency Future Dec18 | | Currency Future | | | (4,109 | ) | | | (291 | ) | | | 1,233 | | | | (5.94 | ) |
AUD/USD Euro 2PM Option Dec18C 73 | | Currency Option | | | (16,778 | ) | | | (2 | ) | | | 839 | | | | (0.05 | ) |
AUD/USD Euro 2PM Option Dec18P 70.5 | | Currency Option | | | (8,218 | ) | | | (6 | ) | | | (740 | ) | | | (0.12 | ) |
AUD/USD Euro 2PM Option Dec18P 73 | | Currency Option | | | (13,354 | ) | | | (31 | ) | | | 1,602 | | | | (0.64 | ) |
AUD/USD Euro 2PM Option Jan19P 71 | | Currency Option | | | (7,419 | ) | | | (8 | ) | | | 742 | | | | (0.17 | ) |
AUD/USD Euro 2PM Option Nov18C 71 | | Currency Option | | | (4,109 | ) | | | (1 | ) | | | 822 | | | | (0.03 | ) |
AUD/USD Euro 2PM Option Nov18P 71 | | Currency Option | | | (10,729 | ) | | | (6 | ) | | | (1,073 | ) | | | (0.12 | ) |
AUD/USD Euro 2PM Option Nov18P 73 | | Currency Option | | | (5,250 | ) | | | (12 | ) | | | (1,418 | ) | | | (0.25 | ) |
Australian Dollar | | Foreign Currency | | | 15,129 | | | | 11 | | | | (39 | ) | | | 0.22 | |
BP Currency Future Dec18 | | Currency Future | | | 71 | | | | 9 | | | | 49 | | | | 0.19 | |
British Pound Currency 2PM Option Dec18P 131.5 | | Currency Option | | | (8,346 | ) | | | (33 | ) | | | 4,590 | | | | (0.67 | ) |
British Pound Currency 2PM Option Feb19C 132 | | Currency Option | | | (8,346 | ) | | | (11 | ) | | | (1,836 | ) | | | (0.23 | ) |
British Pound Currency 2PM Option Nov18C 132 | | Currency Option | | | (15,194 | ) | | | — | | | | — | | | | (0.01 | ) |
British Pound Sterling | | Foreign Currency | | | 136,278 | | | | 174 | | | | 1,008 | | | | 3.56 | |
| | | | |
| 30 | | MainStay Absolute Return Multi-Strategy Fund | | The notes to the consolidated financial statements are an integral part of,
and should be read in conjunction with, the consolidated financial statements. |
| | | | | | | | | | | | | | | | | | |
Description | | Sector | | Number of
Contracts | | | Notional
Amount
(000)* | | | Unrealized
Appreciation
(Depreciation) | | | Percent of
Basket
Net Assets | |
Canadian Currency 2PM Option Dec18C 78 | | Currency Option | | | (15,180 | ) | | | (2 | ) | | $ | 607 | | | | (0.03 | ) % |
E-MINI Russell 2000 Option Dec18C 1545 | | Physical Index Option | | | (285 | ) | | | (10 | ) | | | 770 | | | | (0.21 | ) |
E-MINI Russell EOM Option Nov18C 1625 | | Physical Index Option | | | (302 | ) | | | (1 | ) | | | 333 | | | | (0.03 | ) |
E-MINI Russell EOM Option Nov18P 1550 | | Physical Index Option | | | (588 | ) | | | (36 | ) | | | 1,646 | | | | (0.73 | ) |
E-MINI Russell EOM Option Oct18P 1690 | | Physical Index Option | | | 1,198 | | | | 213 | | | | (106,658 | ) | | | 4.36 | |
EMINI Russell 2000 Dec18 | | Physical Index Future | | | (599 | ) | | | (906 | ) | | | 106,718 | | | | (18.50 | ) |
Euro | | Foreign Currency | | | 354,549 | | | | 402 | | | | (656 | ) | | | 8.20 | |
Euro Currency 2PM Option Dec18C 1.18 | | Currency Option | | | (1,540,811 | ) | | | (1 | ) | | | 308 | | | | (0.02 | ) |
Euro Currency 2PM Option Dec18P 1.16 | | Currency Option | | | (2,111,482 | ) | | | (48 | ) | | | (4,434 | ) | | | (0.98 | ) |
Euro Currency 2PM Option Dec18P 1.17 | | Currency Option | | | (1,469,477 | ) | | | (46 | ) | | | (3,674 | ) | | | (0.93 | ) |
Euro FX Currency Future Dec18 | | Currency Future | | | 342,403 | | | | 389 | | | | (993 | ) | | | 7.94 | |
Euro Stoxx 50 Dec18 | | Physical Index Future | | | (105 | ) | | | (380 | ) | | | (14,701 | ) | | | (7.76 | ) |
Euro Stoxx 50 Price EUR 2800 P | | Index Option | | | (197 | ) | | | (4 | ) | | | 1,814 | | | | (0.09 | ) |
Euro Stoxx 50 Price EUR 2900 P | | Index Option | | | (970 | ) | | | (20 | ) | | | 10,875 | | | | (0.41 | ) |
Euro Stoxx 50 Price EUR 3100 C | | Index Option | | | (74 | ) | | | (12 | ) | | | (2,385 | ) | | | (0.25 | ) |
Euro Stoxx 50 Price EUR 3100 P | | Index Option | | | (148 | ) | | | (8 | ) | | | 3,763 | | | | (0.17 | ) |
Euro Stoxx 50 Price EUR 3150 C | | Index Option | | | (60 | ) | | | (7 | ) | | | (1,651 | ) | | | (0.15 | ) |
Euro Stoxx 50 Price EUR 3200 C | | Index Option | | | (96 | ) | | | (5 | ) | | | 3,557 | | | | (0.10 | ) |
Euro Stoxx 50 Price EUR 3200 P | | Index Option | | | (114 | ) | | | (11 | ) | | | 4,116 | | | | (0.22 | ) |
Euro Stoxx 50 Price EUR 3350 C | | Index Option | | | 419 | | | | 9 | | | | 2,690 | | | | 0.18 | |
Euro Stoxx 50 Price EUR 3500 C | | Index Option | | | (1,169 | ) | | | (3 | ) | | | (682 | ) | | | (0.07 | ) |
Euro Stoxx 50 Price EUR 3600 C | | Index Option | | | (1,017 | ) | | | (1 | ) | | | (126 | ) | | | (0.02 | ) |
Euro Stoxx Banks Price EUR 100 P | | Index Option | | | (3,047 | ) | | | (19 | ) | | | 1,746 | | | | (0.38 | ) |
Euro Stoxx Banks Price EUR 115 C | | Index Option | | | 9,119 | | | | 2 | | | | 15 | | | | 0.03 | |
Euro Stoxx Banks Price EUR 115 P | | Index Option | | | (2,385 | ) | | | (50 | ) | | | 1,259 | | | | (1.01 | ) |
Euro Stoxx Banks Price EUR 95 P | | Index Option | | | (6,072 | ) | | | (21 | ) | | | 2,772 | | | | (0.42 | ) |
Euro STOXX Constr Dec18 | | Physical Index Future | | | 1,392 | | | | 625 | | | | 6,055 | | | | 12.76 | |
Euro-Bobl Option Dec18P 130.5 | | Financial Commodity Option | | | (23,512 | ) | | | (1 | ) | | | 125 | | | | (0.02 | ) |
Euro-Bobl Option Dec18P 131.5 | | Financial Commodity Option | | | (22,827 | ) | | | (8 | ) | | | (509 | ) | | | (0.17 | ) |
Euro-BTP Future Dec18 | | Financial Commodity Future | | | 2,739 | | | | 377 | | | | 1,303 | | | | 7.71 | |
Euro-Bund Future Dec18 | | Financial Commodity Future | | | (4,451 | ) | | | (808 | ) | | | 908 | | | | (16.50 | ) |
FTSE 100 Index Option 7600 | | Index Option | | | (84 | ) | | | (2,494 | ) | | | (8,171 | ) | | | (50.94 | ) |
FTSE MIB Index Option 19500 (FTMIBX8C) | | Index Option | | | (25 | ) | | | (5 | ) | | | 1,085 | | | | (0.10 | ) |
FTSE MIB Index Option 19500 (FTMIBX8P) | | Index Option | | | (25 | ) | | | (18 | ) | | | 2,493 | | | | (0.36 | ) |
FTSE MIB Index Option 21500 (FTMIBZ8C) | | Index Option | | | (39 | ) | | | (1 | ) | | | 857 | | | | (0.03 | ) |
FTSE MIB Index Option 21500 (FTMIBZ8P) | | Index Option | | | (36 | ) | | | (104 | ) | | | 2,183 | | | | (2.12 | ) |
Hong Kong Dollar | | Foreign Currency | | | (245,437 | ) | | | (31 | ) | | | (6 | ) | | | (0.64 | ) |
Japanese Yen | | Foreign Currency | | | 13,141,483 | | | | 116 | | | | 149 | | | | 2.38 | |
Japanese Yen 2PM Option Dec18C 89 | | Currency Option | | | (999 | ) | | | (1 | ) | | | 561 | | | | (0.01 | ) |
Japanese Yen 2PM Option Dec18C 89.5 | | Currency Option | | | (21,971 | ) | | | (11 | ) | | | (576 | ) | | | (0.23 | ) |
Japanese Yen 2PM Option Dec18C 91 | | Currency Option | | | (7,704 | ) | | | (2 | ) | | | 231 | | | | (0.03 | ) |
Japanese Yen 2PM Option Dec18P 85 | | Currency Option | | | (18,404 | ) | | | — | | | | 184 | | | | (0.01 | ) |
Japanese Yen 2PM Option Dec18P 86 | | Currency Option | | | (135,106 | ) | | | (8 | ) | | | 1,351 | | | | (0.17 | ) |
Japanese Yen 2PM Option Dec18P 87 | | Currency Option | | | (15,408 | ) | | | (3 | ) | | | — | | | | (0.05 | ) |
Japanese Yen 2PM Option Dec18P 89 | | Currency Option | | | 11,271 | | | | 10 | | | | 2,340 | | | | 0.21 | |
| | | | | | |
The notes to the consolidated financial statements are an integral part of,
and should be read in conjunction with, the consolidated financial statements. | | | | | 31 | |
Consolidated Portfolio of Investments October 31, 2018 (Unaudited) (continued)
| | | | | | | | | | | | | | | | | | |
Description | | Sector | | Number of
Contracts | | | Notional
Amount
(000)* | | | Unrealized
Appreciation
(Depreciation) | | | Percent of
Basket
Net Assets | |
Japanese Yen 2PM Option Nov18C 89 | | Currency Option | | | (7,133 | ) | | | (2 | ) | | $ | 2,002 | | | | (0.05 | ) % |
Japanese Yen 2PM Option Nov18C 90.5 | | Currency Option | | | 11,841 | | | | 1 | | | | (355 | ) | | | 0.02 | |
Japanese Yen 2PM Option Nov18C 91.5 | | Currency Option | | | (25,966 | ) | | | (1 | ) | | | 260 | | | | (0.02 | ) |
Japanese Yen Currency Future Dec18 | | Currency Future | | | 7,419 | | | | 658 | | | | (556 | ) | | | 13.45 | |
Mexican Peso Future Dec18 | | Currency Future | | | (109,569 | ) | | | (54 | ) | | | 5,478 | | | | (1.09 | ) |
MSCI Emerging Market Future Dec18 | | Physical Index Future | | | 1,010 | | | | 966 | | | | 11,111 | | | | 19.74 | |
NASDAQ 100 E-MINI Future Dec18 | | Physical Index Future | | | (196 | ) | | | (1,369 | ) | | | (31,459 | ) | | | (27.97 | ) |
NASDAQ 100 E-MINI Future Option Dec18C 6900 | | Physical Index Option | | | (228 | ) | | | (69 | ) | | | (19,060 | ) | | | (1.40 | ) |
NASDAQ 100 E-MINI Future Option Dec18P 6550 | | Physical Index Option | | | (267 | ) | | | (33 | ) | | | 13,287 | | | | (0.68 | ) |
NASDAQ 100 E-MINI Option Mar19C 7300 | | Physical Index Option | | | (114 | ) | | | (26 | ) | | | (6,905 | ) | | | (0.54 | ) |
NASDAQ 100 E-MINI Option Mar19P 6900 | | Physical Index Option | | | (78 | ) | | | (26 | ) | | | 5,607 | | | | (0.53 | ) |
Norwegian Krone | | Foreign Currency | | | 12,825 | | | | 2 | | | | (3 | ) | | | 0.03 | |
Norwegian Krone Currency Future Dec18 | | Currency Future | | | (20,544 | ) | | | (24,409 | ) | | | 616 | | | | (498.54 | ) |
OMX Stockholm 30 Index 1510 | | Index Option | | | — | | | | — | | | | 2,727 | | | | 0.00 | |
OMX Stockholm 30 Index 1570 | | Index Option | | | (9,701 | ) | | | (23 | ) | | | (7,110 | ) | | | (0.47 | ) |
S&P500 E-MINI Option Dec18C 2700 | | Physical Index Option | | | — | | | | — | | | | (5,954 | ) | | | 0.00 | |
S&P500 E-MINI Option Dec18C 2800 | | Physical Index Option | | | (959 | ) | | | (30 | ) | | | (1,245 | ) | | | (0.62 | ) |
S&P500 E-MINI Option Dec18P 2400 | | Physical Index Option | | | (1,712 | ) | | | (22 | ) | | | 7,533 | | | | (0.45 | ) |
S&P500 E-MINI Option Dec18P 2550 | | Physical Index Option | | | (588 | ) | | | (17 | ) | | | 5,055 | | | | (0.35 | ) |
S&P500 E-MINI Option Dec18P 2600 | | Physical Index Option | | | (742 | ) | | | (29 | ) | | | 7,790 | | | | (0.59 | ) |
S&P500 E-MINI Option Dec18P 2780 | | Physical Index Option | | | — | | | | — | | | | (2,062 | ) | | | 0.00 | |
S&P500 E-MINI Option Mar19C 2850 | | Physical Index Option | | | (1,039 | ) | | | (52 | ) | | | (6,439 | ) | | | (1.05 | ) |
SGD/USD Forward Dec18 | | Forward | | | (548,733 | ) | | | (759 | ) | | | 142 | | | | (15.51 | ) |
Singapore Dollar | | Foreign Currency | | | 1,051 | | | | 1 | | | | — | | | | 0.02 | |
South African Rand Currency (CME) Future Dec18 | | Currency Future | | | (61,062 | ) | | | (41 | ) | | | 2,595 | | | | (0.84 | ) |
South Korean Won | | Foreign Currency | | | 3,720,490 | | | | 3 | | | | (1 | ) | | | 0.07 | |
Soybean Meal Option 8400 | | Index Option | | | (379 | ) | | | (1 | ) | | | 655 | | | | (0.01 | ) |
Soybean Meal Option 8600 | | Index Option | | | 379 | | | | 10 | | | | (11,278 | ) | | | 0.20 | |
Soybean Meal Option 8800 | | Index Option | | | (195 | ) | | | (63 | ) | | | (15,835 | ) | | | (1.28 | ) |
Stoxx 600 Industrials Dec18 | | Physical Index Future | | | (74 | ) | | | (42 | ) | | | (1,051 | ) | | | (0.86 | ) |
STOXX 600 Oil Dec18 | | Physical Index Future | | | 211 | | | | 81 | | | | 2,331 | | | | 1.65 | |
STOXX 600 Telecommunications Dec18 | | Physical Index Future | | | 1,917 | | | | 515 | | | | 3,484 | | | | 10.53 | |
Stoxx 600 Utilities Dec18 | | Physical Index Future | | | 708 | | | | 221 | | | | (394 | ) | | | 4.52 | |
Stoxx Europe 600 Automobiles 560 | | Index Option | | | (1,010 | ) | | | — | | | | (12 | ) | | | 0.00 | |
Stoxx Europe 600 Automobiles 570 | | Index Option | | | (1,524 | ) | | | (131 | ) | | | 4,294 | | | | (2.67 | ) |
Stoxx Europe 600 Automobiles 590 | | Index Option | | | (1,524 | ) | | | (1 | ) | | | (26 | ) | | | (0.01 | ) |
STOXX Europe 600 Insurance 290 | | Index Option | | | (3,047 | ) | | | (7 | ) | | | (3,126 | ) | | | (0.15 | ) |
Stoxx Europe 600 Oil & Gas 340 | | Index Option | | | (1,997 | ) | | | (26 | ) | | | 14,278 | | | | (0.54 | ) |
Stoxx Europe 600 Oil & Gas 350 | | Index Option | | | (1,569 | ) | | | (9 | ) | | | (3,734 | ) | | | (0.17 | ) |
Stoxx Europe 600 Oil & Gas 360 | | Index Option | | | (1,524 | ) | | | (1 | ) | | | (877 | ) | | | (0.02 | ) |
STOXX Europe 600 Telecommunications 250 | | Index Option | | | (457 | ) | | | — | | | | (1 | ) | | | (0.01 | ) |
Stoxx Europe 600 Utilities 275 | | Index Option | | | (2,637 | ) | | | (18 | ) | | | (886 | ) | | | (0.37 | ) |
Stoxx Europe 600 Utilities 280 | | Index Option | | | (2,637 | ) | | | (13 | ) | | | 273 | | | | (0.27 | ) |
Swedish Krona | | Foreign Currency | | | 580,093 | | | | 63 | | | | 176 | | | | 1.29 | |
Swedish Krona Future Dec18 | | Currency Future | | | 36,523 | | | | 40,018 | | | | 767 | | | | 817.37 | |
| | | | |
| 32 | | MainStay Absolute Return Multi-Strategy Fund | | The notes to the consolidated financial statements are an integral part of,
and should be read in conjunction with, the consolidated financial statements. |
| | | | | | | | | | | | | | | | | | |
Description | | Sector | | Number of
Contracts | | | Notional
Amount
(000)* | | | Unrealized
Appreciation
(Depreciation) | | | Percent of
Basket
Net Assets | |
Swiss Franc | | Foreign Currency | | | 67,237 | | | | 67 | | | $ | (139 | ) | | | 1.36 | % |
Swiss Franc Future Dec18 | | Currency Future | | | (3,995 | ) | | | (398 | ) | | | 1,278 | | | | (8.12 | ) |
SX5E Dividend Future Dec20 | | Financial Index Future | | | 4,052 | | | | 553 | | | | 4,166 | | | | 11.29 | |
TRY/USD Future Dec18 | | Currency Future | | | 399,470 | | | | 69 | | | | (1,378 | ) | | | 1.42 | |
Turkish Lira | | Foreign Currency | | | 3,174 | | | | 1 | | | | (13 | ) | | | 0.01 | |
U.S. 10 Year Future Option Dec18P 117.5 | | Financial Commodity Option | | | (24,425 | ) | | | (4 | ) | | | (763 | ) | | | (0.08 | ) |
U.S. 10 Year Future Option Feb19P 118 | | Financial Commodity Option | | | (28,534 | ) | | | (23 | ) | | | (5,061 | ) | | | (0.47 | ) |
U.S. 2 Year Note (CBT) Future Dec18 | | Financial Commodity Future | | | 5,250 | | | | 553 | | | | (328 | ) | | | 11.29 | |
U.S. 5 Year Future Option Dec18P 113 | | Financial Commodity Option | | | (28,534 | ) | | | (20 | ) | | | (4,290 | ) | | | (0.41 | ) |
U.S. 5 Year Note (CBT) Dec18 | | Financial Commodity Future | | | (38,121 | ) | | | (4,284 | ) | | | 9,067 | | | | (87.50 | ) |
United States Dollar | | Currency | | | 446,678 | | | | 447 | | | | — | | | | 9.12 | |
USD/SGD Forward Dec18 | | Forward | | | 548,665 | | | | 759 | | | | (142 | ) | | | 15.51 | |
| | | | | | | | | | | | $ | (12,013 | ) | | | | |
| | | | | | | | | | | | | | | | | | |
Net Cash and Other Receivables/Payables | | | | | | | | | | | | | (4,164 | ) | | | | |
| | | | | | | | | | | | | | | | | | |
Swaps, at Value | | | | | | | | | | | | $ | (16,177 | ) | | | | |
| | | | | | | | | | | | | | | | | | |
| * | Notional amounts reflected as a positive value indicate a long position held by the Fund or Index and a negative value indicates a short position. |
| ** | The total return swap is held in the MainStay Multi-Strategy Cayman Fund Ltd., which is a wholly-owned subsidiary of the MainStay Absolute Return Multi-Strategy Fund. |
| *** | The investment portfolio of the managed account is comprised at any given time of trading positions selected by Candriam France S.A.S. that include exchange traded futures in relation to any commodity, currency, interest rate, bond or equity index traded on certain exchanges. Under the terms of the swap, the advisor has the ability to periodically adjust the notional level of the swap. The swap was effective on June 24, 2015 and has an open ended term unless terminated by one of the parties. In addition, the terms of the swap provide for a payment to the SG Newedge UK based upon 0.4% per annum accrued on the full notional level of the swap, plus a floating rate (based on LIBOR and Fed Funds) accrued on 15% of the notional of the swap. |
| **** | The investment portfolio of the managed account is comprised at any given time of trading positions selected by Candriam France S.A.S. that include exchange traded derivatives and over the counter derivatives. Under the terms of the swap, the advisor has the ability to periodically adjust the notional level of the swap. The swap was effective on February 26, 2016 and has an open ended term unless terminated by one of the parties. In addition, the terms of the swap provide for a payment to the SG Newedge UK based upon 0.4% per annum accrued on the full notional level of the swap, plus a floating rate (based on LIBOR and Fed Funds) accrued on 15% of the notional of the swap. |
The following abbreviations are used in the preceding pages:
AUD—Australian Dollar
BTP—Buoni del Tesoro Poliennali (Eurex Exchange index)
CAC—Cotation Assiste´e en Continu (French stock market index)
CBOE—Chicago Board Options Exchange
CMX—Carbon Mercantile Exchange
DAX—Deutscher Aktienindex Index (German stock market index)
DJIA—Dow Jones Industrial Average
ETF—Exchange-Traded Fund
JPY—Japanese Yen
LIBOR—London Interbank Offered Rate
LME—London Metal Exchange
MIB—Milano Italia Borsa (Italian national stock exchange)
OAT—Obligation assimilable du Trésor
SGD—Singapore Dollar
SPDR—Standard & Poor’s Depositary Receipt
TRY—Turkish Lira
USD—United States Dollar
VIX—CBOE Volatility Index
| | | | | | |
The notes to the consolidated financial statements are an integral part of,
and should be read in conjunction with, the consolidated financial statements. | | | | | 33 | |
Consolidated Portfolio of Investments October 31, 2018 (Unaudited) (continued)
The following is a summary of the fair valuations according to the inputs used as of October 31, 2018, for valuing the Fund’s assets and liabilities:
Asset Valuation Inputs
| | | | | | | | | | | | | | | | |
Description | | Quoted
Prices in
Active
Markets for
Identical
Assets
(Level 1) | | | Significant
Other
Observable
Inputs
(Level 2) | | | Significant
Unobservable
Inputs
(Level 3) | | | Total | |
| Investments in Securities (a) | | | | | | | | | | | | | | | | |
| Long-Term Bonds | | | | | | | | | | | | | | | | |
Corporate Bonds | | $ | — | | | $ | 457,775 | | | $ | — | | | $ | 457,775 | |
| Affiliated Investment Companies | | | | | | | | | | | | | | | | |
Equity Funds | | | 515,176 | | | | — | | | | — | | | | 515,176 | |
| Common Stocks | | | 13,695,025 | | | | — | | | | — | | | | 13,695,025 | |
| Preferred Stocks | | | 1,131 | | | | — | | | | — | | | | 1,131 | |
| Short-Term Investments | | | | | | | | | | | | | | | | |
Affiliated Investment Company | | | 5,266,916 | | | | — | | | | — | | | | 5,266,916 | |
Repurchase Agreements | | | — | | | | 14,000,764 | | | | — | | | | 14,000,764 | |
U.S. Governments | | | — | | | | 28,277,590 | | | | — | | | | 28,277,590 | |
| | | | | | | | | | | | | | | | |
| Total Short-Term Investments | | | 5,266,916 | | | | 42,278,354 | | | | — | | | | 47,545,270 | |
| | | | | | | | | | | | | | | | |
| Total Investments in Securities | | | 19,478,248 | | | | 42,736,129 | | | | — | | | | 62,214,377 | |
| Other Financial Instruments | | | | | | | | | | | | | | | | |
Candriam Proprietary Total Return Swap Contracts (b) | | | — | | | | 23,755 | | | | — | | | | 23,755 | |
Credit Default Swap Contracts (b) | | | — | | | | 30,984 | | | | — | | | | 30,984 | |
Futures Contracts (b) | | | 100 | | | | — | | | | — | | | | 100 | |
Interest Rate Swap Contracts (b) | | | — | | | | 39,965 | | | | — | | | | 39,965 | |
Total Return Basket Swap Contracts (b) | | | — | | | | — | | | | — | | | | — | |
| | | | | | | | | | | | | | | | |
| Total Other Financial Instruments | | | 100 | | | | 240,073 | | | | — | | | | 240,073 | |
| | | | | | | | | | | | | | | | |
| Total Investments in Securities and Other Financial Instruments | | $ | 19,478,348 | | | $ | 42,976,202 | | | $ | — | | | $ | 62,454,550 | |
| | | | | | | | | | | | | | | | |
| | | | |
| Liability Valuation Inputs | | | | | | | | | | | | | | | | |
| Common Stocks Sold Short | | $ | (11,423,621 | ) | | $ | — | | | $ | — | | | $ | (11,423,621 | ) |
| Exchange-Traded Funds Sold Short | | | (754,659 | ) | | | — | | | | — | | | | (754,659 | ) |
| Other Financial Instruments | | | | | | | | | | | | | | | | |
Candriam Proprietary Total Return Swap Contracts (b) | | | — | | | | (16,177 | ) | | | — | | | | (16,177 | ) |
Credit Default Swap Contracts (b) | | | — | | | | (221 | ) | | | — | | | | (221 | ) |
Interest Rate Swap Contracts (b) | | | — | | | | (49,519 | ) | | | — | | | | (49,519 | ) |
Total Return Basket Swap Contracts (b) | | | — | | | | (99,740 | ) | | | — | | | | (99,740 | ) |
| | | | | | | | | | | | | | | | |
| Total Other Financial Instruments | | | — | | | | (165,657 | ) | | | — | | | | (165,657 | ) |
| | | | | | | | | | | | | | | | |
| Total Investments in Securities Sold Short and Other Financial Instruments | | $ | (12,178,280 | ) | | $ | (165,657 | ) | | $ | — | | | $ | (12,343,937 | ) |
| | | | | | | | | | | | | | | | |
| (a) | For a complete listing of investments and their industries, see the Consolidated Portfolio of Investments. |
| (b) | The value listed for these securities reflects unrealized appreciation (depreciation) as shown on the Consolidated Portfolio of Investments. |
| | | | |
| 34 | | MainStay Absolute Return Multi-Strategy Fund | | The notes to the consolidated financial statements are an integral part of,
and should be read in conjunction with, the consolidated financial statements. |
Consolidated Statement of Assets and Liabilities as of October 31, 2018 (Unaudited)
| | | | |
| Assets | |
Investment in securities and unaffiliated investment companies before investments sold short, at value (identified cost $43,695,837) including securities on loan of $40,018 | | $ | 42,431,521 | |
Repurchase agreements, at value
(identified cost $14,000,764) | | | 14,000,764 | |
Investment in affiliated investment companies, at value (identified cost $5,822,329) | | | 5,782,092 | |
Cash collateral on deposit at broker for securities sold short | | | 5,986,680 | |
Cash collateral on deposit at broker for swap contracts | | | 332,834 | |
Cash denominated in foreign currencies
(identified cost $86,576) | | | 85,503 | |
Cash collateral on deposit at broker for futures contracts | | | 3,081 | |
Receivables: | | | | |
Investment securities sold | | | 102,142 | |
Variation margin on centrally cleared swap contracts | | | 59,223 | |
Dividends and interest | | | 53,605 | |
Securities lending income | | | 453 | |
Unrealized appreciation on OTC swap contracts | | | 169,124 | |
Other assets | | | 1,088 | |
| | | | |
Total assets | | | 69,008,110 | |
| | | | |
| |
| Liabilities | | | | |
Investments sold short (proceeds $13,518,897) | | | 12,178,280 | |
Due to custodian | | | 7,466 | |
Payables: | | | | |
Custodian | | | 124,806 | |
Investment securities purchased | | | 81,828 | |
Professional fees | | | 41,527 | |
Manager (See Note 3) | | | 37,871 | |
Broker fees and charges on short sales | | | 27,162 | |
Shareholder communication | | | 12,707 | |
Transfer agent (See Note 3) | | | 7,398 | |
Dividends on investments sold short | | | 3,622 | |
NYLIFE Distributors (See Note 3) | | | 856 | |
Trustees | | | 260 | |
Variation margin on futures contracts | | | 102 | |
Accrued expenses | | | 4,641 | |
Unrealized depreciation on OTC swap contracts | | | 115,917 | |
| | | | |
Total liabilities | | | 12,644,443 | |
| | | | |
Net assets | | $ | 56,363,667 | |
| | | | |
| |
| Composition of Net Assets | | | | |
Shares of beneficial interest outstanding (par value of $.001 per share) unlimited number of shares authorized | | $ | 6,062 | |
Additional paid-in capital | | | 63,577,361 | |
| | | | |
| | | 63,583,423 | |
Total distributable earnings (loss) | | | (7,219,756 | ) |
| | | | |
Net assets | | $ | 56,363,667 | |
| | | | |
| | | | |
Class A | | | | |
Net assets applicable to outstanding shares | | $ | 1,535,726 | |
| | | | |
Shares of beneficial interest outstanding | | | 165,719 | |
| | | | |
Net asset value per share outstanding | | $ | 9.27 | |
Maximum sales charge (5.50% of offering price) | | | 0.54 | |
| | | | |
Maximum offering price per share outstanding | | $ | 9.81 | |
| | | | |
Investor Class | | | | |
Net assets applicable to outstanding shares | | $ | 466,550 | |
| | | | |
Shares of beneficial interest outstanding | | | 50,477 | |
| | | | |
Net asset value per share outstanding | | $ | 9.24 | |
Maximum sales charge (5.50% of offering price) | | | 0.54 | |
| | | | |
Maximum offering price per share outstanding | | $ | 9.78 | |
| | | | |
Class C | | | | |
Net assets applicable to outstanding shares | | $ | 372,756 | |
| | | | |
Shares of beneficial interest outstanding | | | 40,868 | |
| | | | |
Net asset value and offering price per share outstanding | | $ | 9.12 | |
| | | | |
Class I | | | | |
Net assets applicable to outstanding shares | | $ | 53,988,635 | |
| | | | |
Shares of beneficial interest outstanding | | | 5,804,757 | |
| | | | |
Net asset value and offering price per share outstanding | | $ | 9.30 | |
| | | | |
| | | | | | |
The notes to the consolidated financial statements are an integral part of,
and should be read in conjunction with, the consolidated financial statements. | | | | | 35 | |
Consolidated Statement of Operations for the six months ended October 31, 2018 (Unaudited)
| | | | |
| Investment Income (Loss) | |
Income | | | | |
Interest | | $ | 514,086 | |
Dividends—Unaffiliated (a) | | | 337,141 | |
Dividends—Affiliated | | | 41,673 | |
Securities lending | | | 4,224 | |
Other | | | 11 | |
| | | | |
Total income | | | 897,135 | |
| | | | |
Expenses | | | | |
Manager (See Note 3) | | | 561,401 | |
Broker fees and charges on short sales | | | 291,905 | |
Dividends and interest on investments sold short | | | 204,505 | |
Custodian | | | 189,918 | |
Registration | | | 49,987 | |
Professional fees | | | 32,691 | |
Transfer agent (See Note 3) | | | 17,208 | |
Shareholder communication | | | 14,143 | |
Distribution/Service—Class A (See Note 3) | | | 3,366 | |
Distribution/Service—Investor Class (See Note 3) | | | 944 | |
Distribution/Service—Class C (See Note 3) | | | 2,616 | |
Interest expense | | | 3,437 | |
Trustees | | | 1,018 | |
Miscellaneous | | | 5,233 | |
| | | | |
Total expenses before waiver/reimbursement | | | 1,378,372 | |
Expense waiver/reimbursement from Manager (See Note 3) | | | (277,644 | ) |
| | | | |
Net expenses | | | 1,100,728 | |
| | | | |
Net investment income (loss) | | | (203,593 | ) |
| | | | |
|
| Realized and Unrealized Gain (Loss) on Investments, Futures Contracts, Swap Contracts and Foreign Currency Transactions | |
| |
Net realized gain (loss) on: | | | | |
Unaffiliated investments | | | 443,269 | |
Affiliated investments | | | 4,050 | |
Investments sold short | | | (2,730,303 | ) |
Futures transactions | | | 165,599 | |
Swap transactions | | | (1,482,801 | ) |
Foreign currency transactions | | | (1,201 | ) |
| | | | |
Net realized gain (loss) on investments, investments sold short, futures transactions, swap transactions, and foreign currency transactions | | | (3,601,387 | ) |
| | | | |
Net change in unrealized appreciation (depreciation) on: | | | | |
Unaffiliated investments | | | (877,522 | ) |
Affiliated investments | | | (26,636 | ) |
Investments sold short | | | 2,195,057 | |
Futures contracts | | | (119,559 | ) |
Swap contracts | | | 140,707 | |
Translation of other assets and liabilities in foreign currencies | | | (2,163 | ) |
| | | | |
Net change in unrealized appreciation (depreciation) on investments, investments sold short, futures contracts, swap contracts and foreign currency transactions | | | 1,309,884 | |
| | | | |
Net realized and unrealized gain (loss) on investments, investments sold short, futures transactions, swap transactions and foreign currency transactions | | | (2,291,503 | ) |
| | | | |
Net increase (decrease) in net assets resulting from operations | | $ | (2,495,096 | ) |
| | | | |
| (a) | Dividends recorded net of foreign withholding taxes in the amount of $15,499. |
| | | | |
| 36 | | MainStay Absolute Return Multi-Strategy Fund | | The notes to the consolidated financial statements are an integral part of,
and should be read in conjunction with, the consolidated financial statements. |
Consolidated Statements of Changes in Net Assets
for the six months ended October 31, 2018 (Unaudited) and the year ended April 30, 2018
| | | | | | | | |
| | | 2018 | | | 2018 | |
| Increase (Decrease) in Net Assets | |
Operations: | | | | | | | | |
Net investment income (loss) | | $ | (203,593 | ) | | $ | (894,638 | ) |
Net realized gain (loss) on investments, investments sold short, futures transactions, swap transactions, written option transactions, and foreign currency transactions | | | (3,601,387 | ) | | | 2,831,783 | |
Net change in unrealized appreciation (depreciation) on investments, investments sold short, futures contracts, swap contracts and foreign currency transactions | | | 1,309,884 | | | | (3,996,037 | ) |
| | | | |
Net increase (decrease) in net assets resulting from operations | | | (2,495,096 | ) | | | (2,058,892 | ) |
| | | | |
Distributions to shareholders: | | | | | | | | |
Dividends to shareholders from net investment: | | | | | | | | |
Class A | | | | | | | (81,151 | ) |
Investor Class | | | | | | | (12,251 | ) |
Class C | | | | | | | (2,540 | ) |
Class I | | | | | | | (1,892,696 | ) |
| | | | | | | | |
| | | | | | | (1,988,638 | ) |
| | | | | | | | |
Distributions to shareholders from net realized gain: | | | | | | | | |
Class A | | | | | | | (42,036 | ) |
Investor Class | | | | | | | (7,969 | ) |
Class C | | | | | | | (5,102 | ) |
Class I | | | | | | | (846,508 | ) |
| | | | | | | | |
| | | | | | | (901,615 | ) |
| | | | | | | | |
Total dividends and distributions to shareholders | | | | | | | (2,890,253 | ) |
| | | | | | | | |
Capital share transactions: | | | | | | | | |
Net proceeds from sale of shares | | | 139,760 | | | | 4,570,959 | |
Net asset value of shares issued to shareholders in reinvestment of dividends and distributions | | | — | | | | 2,890,133 | |
Cost of shares redeemed | | | (42,963,916 | ) | | | (36,483,422 | ) |
| | | | |
Increase (decrease) in net assets derived from capital share transactions | | | (42,824,156 | ) | | | (29,022,330 | ) |
| | | | |
Net increase (decrease) in net assets | | | (45,319,252 | ) | | | (33,971,475 | ) |
|
| Net Assets | |
Beginning of period | | | 101,682,919 | | | | 135,654,394 | |
| | | | |
End of period(1) | | $ | 56,363,667 | | | $ | 101,682,919 | |
| | | | |
| (1) | End of period net assets includes undistributed (overdistributed) net investment income of $(2,534,654) in 2017. The requirement to disclose the corresponding amount as of October 31, 2018 was eliminated. See Note 4 for tax basis of distributable earnings. |
| | | | | | |
The notes to the consolidated financial statements are an integral part of,
and should be read in conjunction with, the consolidated financial statements. | | | | | 37 | |
Consolidated Financial Highlights selected per share data and ratios
| | | | | | | | | | | | | | | | |
| | | Six months
ended
October 31, | | | Year ended April 30, | | | June 18,
2015**
through
April 30, | |
| Class A | | 2018* | | | 2018 | | | 2017 | | | 2016 | |
Net asset value at beginning of period | | $ | 9.56 | | | $ | 10.01 | | | $ | 9.92 | | | $ | 10.00 | |
| | | | | | | | | | | | | | | | |
Net investment income (loss) (a) | | | (0.03 | ) | | | (0.11 | ) | | | (0.12 | ) | | | (0.08 | ) |
Net realized and unrealized gain (loss) on investments | | | (0.26 | ) | | | (0.02 | ) | | | 0.30 | | | | 0.05 | |
Net realized and unrealized gain (loss) on foreign currency transactions | | | (0.00 | )‡ | | | (0.08 | ) | | | 0.07 | | | | (0.02 | ) |
| | | | | | | | | | | | | | | | |
Total from investment operations | | | (0.29 | ) | | | (0.21 | ) | | | 0.25 | | | | (0.05 | ) |
| | | | | | | | | | | | | | | | |
| Less dividends and distributions: | | | | | | | | | | | | | | | | |
From net investment income | | | — | | | | (0.16 | ) | | | (0.16 | ) | | | — | |
From net realized gain on investments | | | — | | | | (0.08 | ) | | | — | | | | (0.03 | ) |
| | | | | | | | | | | | | | | | |
Total dividends and distributions | | | — | | | | (0.24 | ) | | | (0.16 | ) | | | (0.03 | ) |
| | | | | | | | | | | | | | | | |
Net asset value at end of period | | $ | 9.27 | | | $ | 9.56 | | | $ | 10.01 | | | $ | 9.92 | |
| | | | | | | | | | | | | | | | |
Total investment return (b) | | | (3.03 | %) | | | (2.16 | %) | | | 2.48 | % | | | (0.49 | %) |
| Ratios (to average net assets)/Supplemental Data: | | | | | | | | | | | | | | | | |
Net investment income (loss) | | | (0.71 | %)†† | | | (1.07 | %) | | | (1.22 | %) | | | (0.97 | %)†† |
Net expenses (excluding short sale expenses) (c) | | | 1.80 | % †† | | | 1.80 | % | | | 1.80 | % | | | 1.80 | % †† |
Expenses (including short sales expenses, before waiver/reimbursement) (c) | | | 3.85 | % †† | | | 3.62 | % | | | 3.53 | % | | | 3.64 | % †† |
Short sale expenses | | | 1.31 | % †† | | | 1.12 | % | | | 0.98 | % | | | 0.88 | % †† |
Portfolio turnover rate | | | 137 | % (d) | | | 240 | % | | | 168 | % | | | 164 | % (d) |
Net assets at end of period (in 000’s) | | $ | 1,536 | | | $ | 3,361 | | | $ | 5,462 | | | $ | 3,638 | |
| ‡ | Less than one cent per share. |
| (a) | Per share data based on average shares outstanding during the period. |
| (b) | Total investment return is calculated exclusive of sales charges and assumes the reinvestment of dividends and distributions. For periods of less than one year, total return is not annualized. |
| (c) | In addition to the fees and expenses which the Fund bears directly, the Fund indirectly bears a pro-rata share of the fees and expenses of the Underlying Funds in which it invests. Such indirect expenses are not included in the above expense ratios. |
| (d) | Portfolio turnover rate is not annualized. |
| | | | |
| 38 | | MainStay Absolute Return Multi-Strategy Fund | | The notes to the consolidated financial statements are an integral part of,
and should be read in conjunction with, the consolidated financial statements. |
Consolidated Financial Highlights selected per share data and ratios
| | | | | | | | | | | | | | | | |
| | | Six months
ended
October 31, | | | Year ended April 30, | | | June 18,
2015**
through
April 30, | |
| Investor Class | | 2018* | | | 2018 | | | 2017 | | | 2016 | |
Net asset value at beginning of period | | $ | 9.54 | | | $ | 9.98 | | | $ | 9.90 | | | $ | 10.00 | |
| | | | | | | | | | | | | | | | |
Net investment income (loss) (a) | | | (0.04 | ) | | | (0.12 | ) | | | (0.15 | ) | | | (0.10 | ) |
Net realized and unrealized gain (loss) on investments | | | (0.26 | ) | | | (0.02 | ) | | | 0.30 | | | | 0.05 | |
Net realized and unrealized gain (loss) on foreign currency transactions | | | 0.00 | ‡ | | | (0.09 | ) | | | 0.07 | | | | (0.02 | ) |
| | | | | | | | | | | | | | | | |
Total from investment operations | | | (0.30 | ) | | | (0.23 | ) | | | 0.22 | | | | (0.07 | ) |
| | | | | | | | | | | | | | | | |
| Less dividends and distributions: | | | | | | | | | | | | | | | | |
From net investment income | | | — | | | | (0.13 | ) | | | (0.14 | ) | | | — | |
From net realized gain on investments | | | — | | | | (0.08 | ) | | | — | | | | (0.03 | ) |
| | | | | | | | | | | | | | | | |
Total dividends and distributions | | | — | | | | (0.21 | ) | | | (0.14 | ) | | | (0.03 | ) |
| | | | | | | | | | | | | | | | |
Net asset value at end of period | | $ | 9.24 | | | $ | 9.54 | | | $ | 9.98 | | | $ | 9.90 | |
| | | | | | | | | | | | | | | | |
Total investment return (b) | | | (3.14 | %) | | | (2.38 | %) | | | 2.24 | % | | | (0.69 | %) |
| Ratios (to average net assets)/Supplemental Data: | | | | | | | | | | | | | | | | |
Net investment income (loss) | | | (0.96 | %)†† | | | (1.24 | %) | | | (1.49 | %) | | | (1.18 | %)†† |
Net expenses (excluding short sale expenses) (c) | | | 2.06 | % †† | | | 2.04 | % | | | 2.07 | % | | | 1.95 | % †† |
Expenses (including short sales expenses, before waiver/reimbursement) (c) | | | 4.10 | % †† | | | 3.87 | % | | | 3.80 | % | | | 3.82 | % †† |
Short sale expenses | | | 1.31 | % †† | | | 1.13 | % | | | 0.98 | % | | | 0.92 | % †† |
Portfolio turnover rate | | | 137 | % (d) | | | 240 | % | | | 168 | % | | | 164 | % (d) |
Net assets at end of period (in 000’s) | | $ | 467 | | | $ | 934 | | | $ | 1,256 | | | $ | 748 | |
| ‡ | Less than one cent per share. |
| (a) | Per share data based on average shares outstanding during the period. |
| (b) | Total investment return is calculated exclusive of sales charges and assumes the reinvestment of dividends and distributions. For periods of less than one year, total return is not annualized. |
| (c) | In addition to the fees and expenses which the Fund bears directly, the Fund indirectly bears a pro-rata share of the fees and expenses of the Underlying Funds in which it invests. Such indirect expenses are not included in the above expense ratios. |
| (d) | Portfolio turnover rate is not annualized. |
| | | | | | |
The notes to the consolidated financial statements are an integral part of,
and should be read in conjunction with, the consolidated financial statements. | | | | | 39 | |
Consolidated Financial Highlights selected per share data and ratios
| | | | | | | | | | | | | | | | |
| | | Six months
ended
October 31, | | | Year ended April 30, | | | June 18,
2015**
through
April 30, | |
| Class C | | 2018* | | | 2018 | | | 2017 | | | 2016 | |
Net asset value at beginning of period | | $ | 9.45 | | | $ | 9.87 | | | $ | 9.83 | | | $ | 10.00 | |
| | | | | | | | | | | | | | | | |
Net investment income (loss) (a) | | | (0.08 | ) | | | (0.19 | ) | | | (0.22 | ) | | | (0.17 | ) |
Net realized and unrealized gain (loss) on investments | | | (0.25 | ) | | | (0.02 | ) | | | 0.29 | | | | 0.05 | |
Net realized and unrealized gain (loss) on foreign currency transactions | | | (0.00 | )‡ | | | (0.09 | ) | | | 0.07 | | | | (0.02 | ) |
| | | | | | | | | | | | | | | | |
Total from investment operations | | | (0.33 | ) | | | (0.30 | ) | | | 0.14 | | | | (0.14 | ) |
| | | | | | | | | | | | | | | | |
| Less dividends and distributions: | | | | | | | | | | | | | | | | |
From net investment income | | | — | | | | (0.04 | ) | | | (0.10 | ) | | | — | |
From net realized gain on investments | | | — | | | | (0.08 | ) | | | — | | | | (0.03 | ) |
| | | | | | | | | | | | | | | | |
Total dividends and distributions | | | — | | | | (0.12 | ) | | | (0.10 | ) | | | (0.03 | ) |
| | | | | | | | | | | | | | | | |
Net asset value at end of period | | $ | 9.12 | | | $ | 9.45 | | | $ | 9.87 | | | $ | 9.83 | |
| | | | | | | | | | | | | | | | |
Total investment return (b) | | | (3.49 | %) | | | (3.05 | %) | | | 1.38 | % | | | (1.39 | %) |
| Ratios (to average net assets)/Supplemental Data: | | | | | | | | | | | | | | | | |
Net investment income (loss) | | | (1.67 | %)†† | | | (1.96 | %) | | | (2.25 | %) | | | (1.95 | %)†† |
Net expenses (excluding short sale expenses) (c) | | | 2.79 | % †† | | | 2.79 | % | | | 2.82 | % | | | 2.70 | % †† |
Expenses (including short sales expenses, before waiver/reimbursement) (c) | | | 4.80 | % †† | | | 4.62 | % | | | 4.55 | % | | | 4.54 | % †† |
Short sale expenses | | | 1.26 | % †† | | | 1.13 | % | | | 0.98 | % | | | 0.89 | % †† |
Portfolio turnover rate | | | 137 | % (d) | | | 240 | % | | | 168 | % | | | 164 | % (d) |
Net assets at end of period (in 000’s) | | $ | 373 | | | $ | 605 | | | $ | 766 | | | $ | 299 | |
| ‡ | Less than one cent per share. |
| (a) | Per share data based on average shares outstanding during the period. |
| (b) | Total investment return is calculated exclusive of sales charges and assumes the reinvestment of dividends and distributions. For periods of less than one year, total return is not annualized. |
| (c) | In addition to the fees and expenses which the Fund bears directly, the Fund indirectly bears a pro-rata share of the fees and expenses of the Underlying Funds in which it invests. Such indirect expenses are not included in the above expense ratios. |
| (d) | Portfolio turnover rate is not annualized. |
| | | | |
| 40 | | MainStay Absolute Return Multi-Strategy Fund | | The notes to the consolidated financial statements are an integral part of,
and should be read in conjunction with, the consolidated financial statements. |
Consolidated Financial Highlights selected per share data and ratios
| | | | | | | | | | | | | | | | |
| | | Six months
ended
October 31, | | | Year ended April 30, | | | June 18,
2015**
through
April 30, | |
| Class I | | 2018* | | | 2018 | | | 2017 | | | 2016 | |
Net asset value at beginning of period | | $ | 9.58 | | | $ | 10.02 | | | $ | 9.93 | | | $ | 10.00 | |
| | | | | | | | | | | | | | | | |
Net investment income (loss) (a) | | | (0.02 | ) | | | (0.07 | ) | | | (0.10 | ) | | | (0.07 | ) |
Net realized and unrealized gain (loss) on investments | | | (0.26 | ) | | | (0.02 | ) | | | 0.30 | | | | 0.05 | |
Net realized and unrealized gain (loss) on foreign currency transactions | | | (0.00 | )‡ | | | (0.09 | ) | | | 0.07 | | | | (0.02 | ) |
| | | | | | | | | | | | | | | | |
Total from investment operations | | | (0.28 | ) | | | (0.18 | ) | | | 0.27 | | | | (0.04 | ) |
| | | | | | | | | | | | | | | | |
| Less dividends and distributions: | | | | | | | | | | | | | | | | |
From net investment income | | | — | | | | (0.18 | ) | | | (0.18 | ) | | | — | |
From net realized gain on investments | | | — | | | | (0.08 | ) | | | — | | | | (0.03 | ) |
| | | | | | | | | | | | | | | | |
Total dividends and distributions | | | — | | | | (0.26 | ) | | | (0.18 | ) | | | (0.03 | ) |
| | | | | | | | | | | | | | | | |
Net asset value at end of period | | $ | 9.30 | | | $ | 9.58 | | | $ | 10.02 | | | $ | 9.93 | |
| | | | | | | | | | | | | | | | |
Total investment return (b) | | | (2.92 | %) | | | (1.91 | %) | | | 2.80 | % | | | (0.39 | %) |
| Ratios (to average net assets)/Supplemental Data: | | | | | | | | | | | | | | | | |
Net investment income (loss) | | | (0.53 | %)†† | | | (0.74 | %) | | | (0.99 | %) | | | (0.78 | %)†† |
Net expenses (excluding short sale expenses) (c) | | | 1.59 | % †† | | | 1.55 | % | | | 1.57 | % | | | 1.55 | % †† |
Expenses (including short sales expenses, before waiver/reimbursement) (c) | | | 3.68 | % †† | | | 3.38 | % | | | 3.30 | % | | | 3.36 | % †† |
Short sale expenses | | | 1.35 | % †† | | | 1.13 | % | | | 0.97 | % | | | 0.85 | % †† |
Portfolio turnover rate | | | 137 | % (d) | | | 240 | % | | | 168 | % | | | 164 | % (d) |
Net assets at end of period (in 000’s) | | $ | 53,989 | | | $ | 96,782 | | | $ | 128,171 | | | $ | 105,112 | |
| ‡ | Less than one cent per share. |
| (a) | Per share data based on average shares outstanding during the period. |
| (b) | Total investment return is calculated exclusive of sales charges and assumes the reinvestment of dividends and distributions. Class I shares are not subject to sales charges. For periods of less than one year, total return is not annualized. |
| (c) | In addition to the fees and expenses which the Fund bears directly, the Fund indirectly bears a pro-rata share of the fees and expenses of the Underlying Funds in which it invests. Such indirect expenses are not included in the above expense ratios. |
| (d) | Portfolio turnover rate is not annualized. |
| | | | | | |
The notes to the consolidated financial statements are an integral part of,
and should be read in conjunction with, the consolidated financial statements. | | | | | 41 | |
Notes to Consolidated Financial Statements (Unaudited)
Note 1–Organization and Business
MainStay Funds Trust (the “Trust”) was organized as a Delaware statutory trust on April 28, 2009, and is governed by a Declaration of Trust. The Trust is registered under the Investment Company Act of 1940, as amended (the “1940 Act”), as an open-end management investment company, and is comprised of thirty-seven funds (collectively referred to as the “Funds”). These consolidated financial statements and notes relate to the MainStay Absolute Return Multi-Strategy Fund (the “Fund”), a “diversified” fund, as that term is defined in the 1940 Act, as interpreted or modified by regulatory authorities having jurisdiction, from time to time.
The Fund currently has six classes of shares registered for sale. Investor Class, Class A, Class C and Class I shares have an inception date of June 18, 2015. Class R6 and Class T shares were registered for sale effective as of February 28, 2017. As of October 31, 2018, Class R6 and Class T shares were not yet offered for sale.
Class A and Investor Class shares are offered at net asset value (“NAV”) per share plus an initial sales charge. No initial sales charge applies to investments of $1 million or more (and certain other qualified purchases) in Investor Class and Class A shares. Effective August 1, 2017, a contingent deferred sales charge (“CDSC”) of 1.00% may be imposed on certain redemptions of Class A and Investor Class shares made within 18 months of the date of purchase on shares that were purchased without an initial sales charge. For purchases of Class A and Investor Class shares made from January 1, 2017, through July 31, 2017, a CDSC of 1.00% may be imposed on certain redemptions of such shares made within 24 months of the date of purchase on shares that were purchased without an initial sales charge. For purchases of Class A and Investor Class shares made prior to January 1, 2017, a CDSC of 1.00% may be imposed on redemptions made within one year of the date of purchase on shares that were purchased without an initial sales charge. Class C shares are offered at NAV without an initial sales charge, although a 1.00% CDSC may be imposed on redemptions made within one year of the date of purchase of Class C shares. Class T shares are currently expected to be offered at NAV plus an initial sales charge. Class I shares are offered at NAV without a sales charge. Class R6 shares are currently expected to be offered at NAV without a sales charge. Additionally, as disclosed in the Fund’s prospectus, Investor Class shares may convert automatically to Class A shares and Class A shares may convert automatically to Investor Class shares. Under certain circumstances and as may be permitted by the Trust’s multiple class plan pursuant to Rule 18f-3 under the 1940 Act, specified share classes of the Fund may be converted to one or more other share classes of the Fund as disclosed in the capital share transactions within these notes. The classes of shares have the same voting (except for issues that relate solely to one class), dividend, liquidation and other rights, and the same terms and conditions, except that under a distribution plan pursuant to Rule 12b-1 under the 1940 Act, Class C shares are subject to higher distribution and/or service fees than Investor Class, Class A and Class T shares. Class I and Class R6 shares are not subject to a distribution and/or service fee.
The Fund’s investment objective is to seek long-term growth of capital.
Note 2–Significant Accounting Policies
The Fund is an investment company and accordingly follows the investment company accounting and reporting guidance of the Financial Accounting Standards Board (“FASB”) Accounting Standard Codification Topic 946 Financial Services—Investment Companies. The Fund prepares its consolidated financial statements in accordance with generally accepted accounting principles (“GAAP”) in the United States of America and follows the significant accounting policies described below.
(A) Securities Valuation. Investments are usually valued as of the close of regular trading on the New York Stock Exchange (the “Exchange”) (usually 4:00 p.m. Eastern time) on each day the Fund is open for business (“valuation date”).
The Board of Trustees of the Trust (the “Board”) adopted procedures establishing methodologies for the valuation of the Fund’s securities and other assets and delegated the responsibility for valuation determinations under those procedures to the Valuation Committee of the Trust (the “Valuation Committee”). The Board authorized the Valuation Committee to appoint a Valuation Subcommittee (the “Subcommittee”) to deal in the first instance with establishing the prices of securities for which market quotations are not readily available or the prices of which are not otherwise readily determinable under these procedures. The Subcommittee meets (in person, via electronic mail or via teleconference) on an as-needed basis. Subsequently, the Valuation Committee meets to ensure that actions taken by the Subcommittee were appropriate. The procedures state that, subject to the oversight of the Board and unless otherwise noted, the responsibility for the day-to-day valuation of portfolio assets (including fair value measurements for the Fund’s assets and liabilities) rests with New York Life Investment Management LLC (“New York Life Investments” or the “Manager”), aided to whatever extent necessary by the Subadvisors (as defined in Note 3(A)).
To assess the appropriateness of security valuations, the Manager, the Subadvisors or the Fund’s third-party service provider, who is subject to oversight by the Manager, regularly compares prior day prices, prices on comparable securities and the sale prices to the prior and current day prices and challenges prices with changes exceeding certain tolerance levels with third-party pricing services or broker sources. For those securities valued through either a standardized fair valuation methodology or a fair valuation measurement, the Subcommittee deals in the first instance with such valuation and the Valuation Committee reviews and affirms, if appropriate, the reasonableness of the valuation based on such methodologies and measurements on a regular basis after considering information that is reasonably available and deemed relevant by the Valuation Committee. Any action taken by the Subcommittee with respect to the valuation of a portfolio security or other asset is submitted for review and ratification (if appropriate) to the Valuation Committee and the Board at the next regularly scheduled meeting.
“Fair value” is defined as the price the Fund would reasonably expect to receive upon selling an asset or liability in an orderly transaction to an independent buyer in the principal or most advantageous market for the asset or liability. Fair value measurements are determined within a framework that establishes a three-tier hierarchy which maximizes the use of observable market data and minimizes the use of unobservable inputs to establish a classification of fair value measurements for
| | |
| 42 | | MainStay Absolute Return Multi-Strategy Fund |
disclosure purposes. “Inputs” refer broadly to the assumptions that market participants would use in pricing the asset or liability, including assumptions about risk, such as the risk inherent in a particular valuation technique used to measure fair value using a pricing model and/or the risk inherent in the inputs for the valuation technique. Inputs may be observable or unobservable. Observable inputs reflect the assumptions market participants would use in pricing the asset or liability based on market data obtained from sources independent of the Fund. Unobservable inputs reflect the Fund’s own assumptions about the assumptions market participants would use in pricing the asset or liability based on the information available. The inputs or methodology used for valuing assets or liabilities may not be an indication of the risks associated with investing in those assets or liabilities. The three-tier hierarchy of inputs is summarized below.
| • | | Level 1—quoted prices in active markets for an identical asset or liability |
| • | | Level 2—other significant observable inputs (including quoted prices for a similar asset or liability in active markets, interest rates and yield curves, prepayment speeds, credit risk, etc.) |
| • | | Level 3—significant unobservable inputs (including the Fund’s own assumptions about the assumptions that market participants would use in measuring fair value of an asset or liability) |
The level of an asset or liability within the fair value hierarchy is based on the lowest level of an input, both individually and in the aggregate, that is significant to the fair value measurement. As of October 31, 2018, the aggregate value by input level of the Fund’s assets and liabilities is included at the end of the Fund’s Consolidated Portfolio of Investments.
The Fund may use third-party vendor evaluations, whose prices may be derived from one or more of the following standard inputs, among others:
| | |
• Benchmark yields | | • Reported trades |
• Broker/dealer quotes | | • Issuer spreads |
• Two-sided markets | | • Benchmark securities |
• Bids/offers | | • Reference data (corporate actions or material event notices) |
• Industry and economic events | | • Comparable bonds |
• Monthly payment information | | |
An asset or liability for which market values cannot be measured using the methodologies described above is valued by methods deemed reasonable in good faith by the Valuation Committee, following the procedures established by the Board, to represent fair value. Under these procedures, the Fund generally uses a market-based approach which may use related or comparable assets or liabilities, recent transactions, market multiples, book values and other relevant information. The Fund may also use an income-based valuation approach in which the anticipated future cash flows of the asset or liability are discounted to calculate fair value. Discounts may also be applied due to the nature and/or duration of any restrictions on the disposition of the asset or liability. Fair value represents a good faith approximation of the value of a security. Fair value determinations involve the consideration of a number of subjective factors, an analysis of applicable facts and
circumstances and the exercise of judgment. As a result, it is possible that the fair value for a security determined in good faith in accordance with the Fund’s valuation procedures may differ from valuations for the same security determined by other funds using their own valuation procedures. Although the Fund’s valuation procedures are designed to value a security at the price the Fund may reasonably expect to receive upon the security’s sale in an orderly transaction, there can be no assurance that any fair value determination thereunder would, in fact, approximate the amount that the Fund would actually realize upon the sale of the security or the price at which the security would trade if a reliable market price were readily available. During the six-month period ended October 31, 2018, there were no material changes to the fair value methodologies.
Securities which may be valued in this manner include, but are not limited to: (i) a security for which trading has been halted or suspended; (ii) a debt security that has recently gone into default and for which there is not a current market quotation; (iii) a security of an issuer that has entered into a restructuring; (iv) a security that has been delisted from a national exchange; (v) a security for which the market price is not readily available from a third-party pricing source or, if so provided, does not, in the opinion of the Manager or the Subadvisors, reflect the security’s market value; (vi) a security subject to trading collars for which no or limited trading takes place; and (vii) a security whose principal market has been temporarily closed at a time when, under normal conditions, it would be open. Securities valued in this manner are generally categorized as Level 3 in the hierarchy. As of October 31, 2018, a security that were fair valued in such a manner are shown in the Consolidated Portfolio of Investments.
Certain securities held by the Fund may principally trade in foreign markets. Events may occur between the time the foreign markets close and the time at which the Fund’s NAVs are calculated. These events may include, but are not limited to, situations relating to a single issuer in a market sector, significant fluctuations in U.S. or foreign markets, natural disasters, armed conflicts, governmental actions or other developments not tied directly to the securities markets. Should the Manager or the Subadvisors conclude that such events may have affected the accuracy of the last price of such securities reported on the local foreign market, the Subcommittee may, pursuant to procedures adopted by the Board, adjust the value of the local price to reflect the estimated impact on the price of such securities as a result of such events. In this instance, securities are generally categorized as Level 3 in the hierarchy. Additionally, certain foreign equity securities are also fair valued whenever the movement of a particular index exceeds certain thresholds. In such cases, the securities are fair valued by applying factors provided by a third-party vendor in accordance with valuation procedures adopted by the Board and are generally categorized as Level 2 in the hierarchy. As of October 31, 2018, securities that were fair valued in such a manner are shown in the Consolidated Portfolio of Investments.
Equity securities, including shares of exchange-traded funds (“ETFs”), are valued at the last quoted sales prices as of the close of regular trading on the relevant exchange on each valuation date. Securities that are not traded on the valuation date are valued at the mean of the last quoted bid and ask prices. Prices are normally taken from the principal market in which each security trades. Futures contracts are valued at
Notes to Consolidated Financial Statements (Unaudited) (continued)
the last posted settlement price on the market where such futures are primarily traded. Options contracts are valued at the last posted settlement price on the market where such options are primarily traded.
Investments in mutual funds, including money market funds, are valued at their respective NAVs as of the close of the Exchange on the valuation date. These securities are generally categorized as Level 1 in the hierarchy.
Debt securities (other than convertible and municipal bonds) are valued at the evaluated bid prices (evaluated mean prices in the case of convertible and municipal bonds) supplied by a pricing agent or brokers selected by the Manager, in consultation with the Subadvisors. The evaluations are market-based measurements processed through a pricing application and represents the pricing agent’s good faith determination as to what a holder may receive in an orderly transaction under market conditions. The rules based logic utilizes valuation techniques that reflect participants’ assumptions and vary by asset class and per methodology, maximizing the use of relevant observable data including quoted prices for similar assets, benchmark yield curves and market corroborated inputs. The evaluated bid or mean prices are deemed by the Manager, in consultation with the Subadvisors, to be representative of market values at the regular close of trading of the Exchange on each valuation date. Debt securities purchased on a delayed delivery basis are marked to market daily until settlement at the forward settlement date. Debt securities, including corporate bonds, U.S. government and federal agency bonds, municipal bonds, foreign bonds, convertible bonds, asset-backed securities and mortgage-backed securities are generally categorized as Level 2 in the hierarchy.
Foreign currency forward contracts are valued at their fair market values measured on the basis of the mean between the last current bid and ask prices based on dealer or exchange quotations and are generally categorized as Level 2 in the hierarchy.
Total return swap contracts, which are arrangements to exchange a market-linked return for a periodic payment, are based on a notional principal amount. To the extent that the total return of the security, index or other financial measure underlying the transaction exceeds or falls short of the offsetting interest rate obligation, the Fund will receive a payment from or make a payment to the counterparty. Total return swap contracts are marked to market daily based upon quotations from market makers and these securities are generally categorized as Level 2 in the hierarchy.
Temporary cash investments acquired in excess of 60 days to maturity at the time of purchase are valued using the latest bid prices or using valuations based on a matrix system (which considers such factors as security prices, yields, maturities and ratings), both as furnished by independent pricing services. Other temporary cash investments which mature in 60 days or less at the time of purchase (“Short-Term Investments”) are valued using the amortized cost method of valuation, unless the use of such method would be inappropriate. The amortized cost method involves valuing a security at its cost on the date of purchase and thereafter assuming a constant amortization to maturity of the difference between such cost and the value on maturity date. Amortized cost approximates the current fair value of a security. Securities valued using the amortized cost method are not valued using quoted prices in an active market and are generally categorized as Level 2 in the hierarchy.
The information above is not intended to reflect an exhaustive list of the methodologies that may be used to value portfolio investments. The valuation procedures permit the use of a variety of valuation methodologies in connection with valuing portfolio investments. The methodology used for a specific type of investment may vary based on the market data available or other considerations. The methodologies summarized above may not represent the specific means by which portfolio investments are valued on any particular business day.
A portfolio security or other asset may be determined to be illiquid under procedures approved by the Board. Illiquidity of a security might prevent the sale of such security at a time when the Manager or the Subadvisors might wish to sell, and these securities could have the effect of decreasing the overall level of the Fund’s liquidity. Further, the lack of an established secondary market may make it more difficult to value illiquid securities, requiring the Fund to rely on judgments that may be somewhat subjective in measuring value, which could vary materially from the amount that the Fund could realize upon disposition. Difficulty in selling illiquid securities may result in a loss or may be costly to the Fund. Under the supervision of the Board, the Manager or the Subadvisors determine the liquidity of the Fund’s investments; in doing so, the Manager or the Subadvisors may consider various factors, including: (i) the frequency of trades and quotations; (ii) the number of dealers and prospective purchasers; (iii) dealer undertakings to make a market; and (iv) the nature of the security and the market in which it trades (e.g., the time needed to dispose of the security, the method of soliciting offers and the mechanics of transfer). Illiquid securities are often valued in accordance with methods deemed by the Board in good faith to be reasonable and appropriate to accurately reflect their fair value. The liquidity of the Fund’s investments, as shown in the Consolidated Portfolio of Investments, was determined as of October 31, 2018 and can change at any time in response to, among other relevant factors, market conditions or events or developments with respect to an individual issuer or instrument. As of October 31, 2018, securities deemed to be illiquid under procedures approved by the Board are shown in the Consolidated Portfolio of Investments.
(B) Income Taxes. The Fund’s policy is to comply with the requirements of the Internal Revenue Code of 1986, as amended (the “Internal Revenue Code”), applicable to regulated investment companies and to distribute all of its taxable income to the shareholders of the Fund within the allowable time limits. Therefore, no federal, state and local income tax provisions are required.
Management evaluates the Fund’s tax positions to determine if the tax positions taken meet the minimum recognition threshold in connection with accounting for uncertainties in income tax positions taken or expected to be taken for the purposes of measuring and recognizing tax liabilities in the consolidated financial statements. Recognition of tax benefits of an uncertain tax position is permitted only to the extent the position is “more likely than not” to be sustained assuming examination by taxing authorities. Management has analyzed the Fund’s tax positions taken on federal, state and local income tax returns for all open tax years (for up to three tax years) and has concluded that no provisions for federal, state and local income tax are required in the Fund’s consolidated financial statements. The Fund’s federal, state and local income tax and federal excise tax returns for tax years for which the applicable statutes of limitations have not expired are subject to exami-
| | |
| 44 | | MainStay Absolute Return Multi-Strategy Fund |
nation by the Internal Revenue Service and state and local departments of revenue.
For U.S. tax purposes, the Cayman Subsidiary (defined in Note 2(T)) is treated as a controlled foreign corporation (“CFC”) of the Fund under the Internal Revenue Code. As a U.S. shareholder of a CFC, the Fund is required to include its share of the Cayman Subsidiary’s earnings in its taxable income. Any net loss or deficit in earnings generated by the Cayman Subsidiary cannot be deducted by the Fund in the period incurred, nor can such loss or deficit in earnings be carried forward to offset the Fund’s taxable income and the Cayman Subsidiary’s earnings in future periods. As a Cayman Islands exempted limited company, the Cayman Subsidiary has received an undertaking from the Government of the Cayman Islands exempting it from all local income, profits and capital gains taxes. No such taxes are levied in the Cayman Islands at this time.
With respect to Fund investments in the Cayman Subsidiary, the Internal Revenue Service (“IRS”) has issued private letter rulings to regulated investment companies (but not the Fund) in which the IRS specifically concluded that income and gains earned by a regulated investment company from its investment in a wholly-owned foreign subsidiary that invests in commodity-linked instruments are qualifying gross income of a regulated investment company for purposes of compliance with Subchapter M of the Internal Revenue Code. However, the Fund is not able to rely on private letter rulings issued to other taxpayers. Additionally, the IRS has suspended the issuance of such private letter rulings, pending review of its position on this matter. The IRS also recently issued proposed regulations that, if finalized, would generally treat the Fund’s income inclusion with respect to the Cayman Subsidiary as qualifying income only if there is a distribution out of the earnings and profits of the Cayman Subsidiary that is attributable to such income inclusion. The proposed regulations, if adopted, would apply to taxable years beginning on or after 90 days after the regulations are published as final.
In connection with investments in the Cayman Subsidiary, the Fund has obtained an opinion of counsel that gross income derived by the Fund from its investment in the Cayman Subsidiary should constitute qualifying gross income of a regulated investment company under Subchapter M of the Internal Revenue Code. However, no assurances can be provided that the IRS would not be able to successfully assert that the gross income derived by the Fund from its investment in the Cayman Subsidiary was not qualifying gross income of a regulated investment company under Subchapter M of the Internal Revenue Code, in which case the Fund could fail to qualify as a regulated investment company under Subchapter M of the Internal Revenue Code if less than 90% of its gross income was not derived from such qualifying gross income. If the Fund failed to qualify as a regulated investment company, it would be subject to federal and state income tax on all of its taxable income at regular corporate tax rates. This would significantly adversely affect the returns to, and could cause substantial losses for, Fund shareholders.
(C) Foreign Taxes. The Fund may be subject to foreign taxes on income and other transaction-based taxes imposed by certain countries in which it invests. A portion of the taxes on gains on investments or currency purchases/repatriation may be reclaimable. The Fund will accrue such taxes and reclaims as applicable, based upon its current
interpretation of tax rules and regulations that exist in the markets in which it invests.
The Fund may be subject to taxation on realized capital gains, repatriation proceeds and other transaction-based taxes imposed by certain countries in which it invests. The Fund will accrue such taxes as applicable based upon its current interpretation of tax rules and regulations that exist in the market in which it invests. Capital gains taxes relating to positions still held are reflected as a liability on the Consolidated Statement of Assets and Liabilities, as well as an adjustment to the Fund’s net unrealized appreciation (depreciation). Taxes related to capital gains realized, if any, are reflected as part of net realized gain (loss) in the Consolidated Statement of Operations. Changes in tax liabilities related to capital gains taxes on unrealized investment gains, if any, are reflected as part of the change in net unrealized appreciation (depreciation) on investments in the Consolidated Statement of Operations. Transaction-based charges are generally assessed as a percentage of the transaction amount.
(D) Dividends and Distributions to Shareholders. Dividends and distributions are recorded on the ex-dividend date. The Fund intends to declare and pay dividends from net investment income and distributions from net realized capital and currency gains, if any, at least annually. Unless the shareholder elects otherwise, all dividends and distributions are reinvested in the same class of shares of the Fund, at NAV. Dividends and distributions to shareholders are determined in accordance with federal income tax regulations and may differ from determinations using GAAP.
(E) Security Transactions and Investment Income. The Fund records security transactions on the trade date. Realized gains and losses on security transactions are determined using the identified cost method. Dividend income is recognized on the ex-dividend date; net of any foreign tax withheld at the source, and interest income is accrued as earned using the effective interest rate method. Discounts and premiums on securities purchased, other than Short-Term Investments, for the Fund are accreted and amortized, respectively, on the effective interest rate method over the life of the respective securities or, in the case of a callable security, over the period to the first date of call.
The Fund may invest in master limited partnerships (“MLPs”). To comply with Subchapter M of the Internal Revenue Code, the Fund may invest no more than 25% of its total assets in MLPs. Distributions on a MLP are generally recorded based on the characterization reported on the Fund’s Form 1065, Schedule K-1, received from the MLP. The Fund records its pro rata share of the income and deductions, and capital gains and losses allocated from each MLP on its Consolidated Statement of Operations, as well as adjusts the cost basis of each MLP accordingly, as reported on the Fund’s Consolidated Portfolio of Investments.
Distributions received from investments in energy related U.S. royalty trusts and Canadian royalty trusts and exploration and production companies (collectively, “Energy Trusts”) and MLPs generally are comprised of ordinary income, capital gains and return of capital from the Energy Trusts or MLPs. The Fund records its investment income on the ex-date of the distributions. For purposes of the consolidated financial statements, the Fund uses return of capital and income estimates to allocate the dividend income received. Such estimates are based on
Notes to Consolidated Financial Statements (Unaudited) (continued)
historical information available from each Energy Trust, MLP and other industry sources. These estimates may subsequently be revised based on information received from Energy Trusts or MLPs after their tax reporting periods are concluded, as the actual character of these distributions is not known until after the fiscal year end.
The Fund estimates the consolidated allocation of investment income and return of capital associated with distributions received from MLPs and recorded on the Consolidated Statement of Operations. For the six-month period ended October 31, 2018, the Fund estimated approximately 100% of the distributions received from MLPs to be from return of capital.
Investment income and realized and unrealized gains and losses on investments of the Fund are allocated pro rata to the separate classes of shares based upon their relative net assets on the date the income is earned or realized and unrealized gains and losses are incurred.
The Fund may place a debt security on non-accrual status and reduce related interest income by ceasing current accruals and writing off all or a portion of any interest receivables when the collection of all or a portion of such interest has become doubtful. A debt security is removed from non-accrual status when the issuer resumes interest payments or when collectability of interest is reasonably assured.
(F) Expenses. Expenses of the Trust are allocated to the individual Funds in proportion to the net assets of the respective Funds when the expenses are incurred, except where direct allocations of expenses can be made. Expenses (other than transfer agent expenses and fees incurred under the shareholder services plans and/or the distribution plans further discussed in Note 3(B)) are allocated to separate classes of shares pro rata based upon their relative net assets on the date the expenses are incurred. The expenses borne by the Fund, including those of related parties to the Fund, are shown in the Consolidated Statement of Operations.
Additionally, the Fund may invest in ETFs and mutual funds, which are subject to management fees and other fees that may increase the costs of investing in ETFs and mutual funds versus the costs of owning the underlying securities directly. These indirect expenses of ETFs and mutual funds are not included in the amounts shown as expenses in the Fund’s Consolidated Statement of Operations or in the expense ratios included in the Consolidated Financial Highlights.
(G) Use of Estimates. In preparing the consolidated financial statements in conformity with GAAP, management makes estimates and assumptions that affect the reported amounts and disclosures in the consolidated financial statements. Actual results could differ from those estimates.
(H) Repurchase Agreements. The Fund may enter into repurchase agreements (i.e., buy a security from another party with the agreement that it be sold back in the future) to earn income. The Fund may enter into repurchase agreements only with counterparties, usually financial institutions, that are deemed by the Manager or the Subadvisors to be creditworthy, pursuant to guidelines established by the Board. During the term of any repurchase agreement, the Manager or the Subadvisors will continue to monitor the creditworthiness of the counterparty. Under the 1940 Act, repurchase agreements are considered to be collateralized loans by the Fund to the counterparty secured by the securities transferred to the Fund.
Repurchase agreements are subject to counterparty risk, meaning the Fund could lose money by the counterparty’s failure to perform under the terms of the agreement. The Fund mitigates this risk by ensuring the repurchase agreement is collateralized by cash, U.S. government securities, fixed income securities and/or other securities. The collateral is held by the Fund’s custodian and valued daily on a mark to market basis to determine if the value, including accrued interest, exceeds the repurchase price. In the event of the counterparty’s default on the obligation to repurchase, the Fund has the right to liquidate the collateral and apply the proceeds in satisfaction of the obligation. Under certain circumstances, such as in the event of default or bankruptcy by the counterparty, realization and/or retention of the collateral may be limited or subject to delay, to legal proceedings and possible realized loss to the Fund.
(I) Futures Contracts. A futures contract is an agreement to purchase or sell a specified quantity of an underlying instrument at a specified future date and price, or to make or receive a cash payment based on the value of a financial instrument (e.g., foreign currency, interest rate, security or securities index). The Fund is subject to risks such as market price risk and/or interest rate risk in the normal course of investing in these transactions. Upon entering into a futures contract, the Fund is required to pledge to the broker or futures commission merchant an amount of cash and/or U.S. government securities equal to a certain percentage of the collateral amount, known as the “initial margin.” During the period the futures contract is open, changes in the value of the contract are recognized as unrealized appreciation or depreciation by marking to market such contract on a daily basis to reflect the market value of the contract at the end of each day’s trading. The Fund agrees to receive from or pay to the broker or futures commission merchant an amount of cash equal to the daily fluctuation in the value of the contract. Such receipts or payments are known as “variation margin.” When the futures contract is closed, the Fund records a realized gain or loss equal to the difference between the proceeds from (or cost of) the closing transaction and the Fund’s basis in the contract.
The use of futures contracts involves, to varying degrees, elements of market risk in excess of the amount recognized in the Consolidated Statement of Assets and Liabilities. The contract or notional amounts and variation margin reflect the extent of the Fund’s involvement in open futures positions. There are several risks associated with the use of futures contracts as hedging techniques. There can be no assurance that a liquid market will exist at the time when the Fund seeks to close out a futures contract. If no liquid market exists, the Fund would remain obligated to meet margin requirements until the position is closed. Futures may involve a small initial investment relative to the risk assumed, which could result in losses greater than if they had not been used. Futures may be more volatile than direct investments in the instrument underlying the futures and may not correlate to the underlying instrument, causing a given hedge not to achieve its objectives. The Fund’s activities in futures contracts have minimal counterparty risk as they are conducted through regulated exchanges that guarantee the futures against default by the counterparty. In the event of a bankruptcy or insolvency of a futures commission merchant that holds margin on behalf of the Fund, the Fund may not be entitled to the return of the entire margin owed to the Fund, potentially resulting in a loss. The Fund’s investment in futures contracts and other derivatives may
| | |
| 46 | | MainStay Absolute Return Multi-Strategy Fund |
increase the volatility of the Fund’s NAVs and may result in a loss to the Fund. As of October 31, 2018, open futures contracts are shown in the Consolidated Portfolio of Investments.
(J) Swap Contracts. The Fund may enter into credit default, interest rate, equity, index and currency exchange rate swap contracts (“swaps”). In a typical swap transaction, two parties agree to exchange the future returns (or differentials in rates of future returns) earned or realized at periodic intervals on a particular investment or instrument based on a notional principal amount. Generally, the Fund will enter into a swap on a net basis, which means that the two payment streams under the swap are netted, with the Fund receiving or paying (as the case may be) only the net amount of the two payment streams. Therefore, the Fund’s current obligation under a swap generally will be equal to the net amount to be paid or received under the swap, based on the relative value of notional positions attributable to each counterparty to the swap. The payments may be adjusted for transaction costs, interest payments, the amount of interest paid on the investment or instrument or other factors. Collateral, in the form of cash or securities, may be required to be held in segregated accounts with the custodian bank or broker in accordance with the terms of the swap. Swap agreements are privately negotiated in the over the counter (“OTC”) market and may be executed in a multilateral or other trade facilities platform, such as a registered commodities exchange (“centrally cleared swaps”).
Certain standardized swaps, including certain credit default and interest rate swaps, are subject to mandatory clearing and exchange-trading, and more types of standardized swaps are expected to be subject to mandatory clearing and exchange-trading in the future. The counterparty risk for exchange-traded and cleared derivatives is expected to be generally lower than for uncleared derivatives, but cleared contracts are not risk-free. In a cleared derivative transaction, the Fund typically enters into the transaction with a financial institution counterparty, and performance of the transaction is effectively guaranteed by a central clearinghouse, thereby reducing or eliminating the Fund’s exposure to the credit risk of its original counterparty. The Fund will be required to post specified levels of margin with the clearinghouse or at the instruction of the clearinghouse; the margin required by a clearinghouse may be greater than the margin the Fund would be required to post in an uncleared transaction. As of October 31, 2018, all swap positions outstanding are shown in the Consolidated Portfolio of Investments.
Swaps are marked to market daily based upon quotations from pricing agents, brokers or market makers and the change in value, if any, is recorded as unrealized appreciation or depreciation. Any payments made or received upon entering into a swap would be amortized or accreted over the life of the swap and recorded as a realized gain or loss. Early termination of a swap is recorded as a realized gain or loss. Daily changes in valuation of centrally cleared swaps, if any, are recorded as a receivable or payable for the change in value as appropriate on the Consolidated Statement of Assets and Liabilities.
The Fund bears the risk of loss of the amount expected to be received under a swap in the event of the default or bankruptcy of the swap counterparty. The Fund may be able to eliminate its exposure under a swap either by assignment or other disposition, or by entering into an offsetting swap with the same party or a similar credit-worthy party. Swaps are not actively traded on financial markets. Entering into swaps involves elements of credit, market and documentation risk in excess of
the amounts recognized on the Consolidated Statement of Assets and Liabilities. Such risks involve the possibilities that there will be no liquid market for these swaps, that the counterparty to the swaps may default on its obligation to perform or disagree as to the meaning of the contractual terms in the swaps and that there may be unfavorable changes in interest rates, the price of the index or the security underlying these transactions.
Interest Rate Swaps: An interest rate swap is an agreement between two parties where one stream of future interest payments is exchanged for another based on a specified principal amount. Interest rate swaps often exchange a fixed payment for a floating payment that is linked to an interest rate (most often LIBOR). The Fund will typically use interest rate swaps to limit, or manage, its exposure to fluctuations in interest rates, or to obtain a marginally lower interest rate than it would have been able to get without the swap.
Credit Default Swaps: The Fund may enter into credit default swaps to simulate long and short bond positions or to take an active long or short position with respect to the likelihood of a default or credit event by the issuer of the underlying reference obligation. The types of reference obligations underlying the swaps that may be entered into by the Fund include debt obligations of a single issuer of corporate or sovereign debt, a basket of obligations of different issuers or a credit index. A credit index is an equally-weighted credit default swap index that is designed to track a representative segment of the credit default swap market (e.g., investment grade, high volatility, below investment grade or emerging markets) and provides an investor with exposure to specific “baskets” of issuers of certain debt instruments. Index credit default swaps have standardized terms including a fixed spread and standard maturity dates. The composition of the obligations within a particular index changes periodically. Credit default swaps involve one party, the protection buyer, making a stream of payments to another party, the protection seller, in exchange for the right to receive a contingent payment if there is a credit event related to the underlying reference obligation. In the event that the reference obligation matures prior to the termination date of the contract, a similar security will be substituted for the duration of the contract term. Credit events are defined under individual swap agreements and generally include bankruptcy, failure to pay, restructuring, repudiation/moratorium, obligation acceleration and obligation default. Selling protection effectively adds leverage to a portfolio up to the notional amount of the swap agreement. Potential liabilities under these contracts may be reduced by: the auction rates of the underlying reference obligations; upfront payments received at the inception of a swap; and net amounts received from credit default swaps purchased with the identical reference obligation.
Equity Swaps (Total Return Swaps): Total return swap contracts are agreements between counterparties to exchange cash flow, one based on a market-linked return of an individual asset or group of assets (such as an index), and the other on a fixed or floating rate. As a total return swap, an equity swap may be structured in different ways. For example, when the Fund enters into a “long” equity swap, the counterparty may agree to pay the Fund the amount, if any, by which the notional amount of the equity swap would have increased in value had it been invested in a particular referenced security or securities, plus the dividends that would have been received on those securities. In return, the Fund will generally agree to pay the counterparty interest on the notional amount
Notes to Consolidated Financial Statements (Unaudited) (continued)
of the equity swap plus the amount, if any, by which that notional amount would have decreased in value had it been invested in such referenced security or securities, plus, in certain instances, commissions or trading spreads on the notional amounts. Therefore, the Fund’s return on the equity swap generally should equal the gain or loss on the notional amount, plus dividends on the referenced security or securities less the interest paid by the Fund on the notional amount. Alternatively, when the Fund enters into a “short” equity swap, the counterparty will generally agree to pay the Fund the amount, if any, by which the notional amount of the equity swap would have decreased in value had the Fund sold a particular referenced security or securities short, less the dividend expense that the Fund would have incurred on the referenced security or securities, as adjusted for interest payments or other economic factors. In this situation, the Fund will generally be obligated to pay the amount, if any, by which the notional amount of the swap would have increased in value had it been invested directly in the referenced security or securities.
Equity swaps generally do not involve the delivery of securities or other referenced assets. Accordingly, the risk of loss with respect to equity swaps is normally limited to the net amount of payments that the Fund is contractually obligated to make. If the other party to an equity swap defaults, the Fund’s risk of loss consists of the net amount of payments that the Fund is contractually entitled to receive, if any. The Fund will segregate cash or liquid assets, enter into offsetting transactions or use other measures permitted by applicable law to “cover” the Fund’s current obligations. The Fund and New York Life Investments, however, believe these transactions do not constitute senior securities under the 1940 Act and, accordingly, will not treat them as being subject to the Fund’s borrowing restrictions.
Equity swaps are derivatives and their value can be very volatile. The Fund may engage in total return swaps to gain exposure to emerging markets securities, along with offsetting long total return swap positions to maintain appropriate currency balances and risk exposures across all swap positions. To the extent that the Manager, or the Subadvisors do not accurately analyze and predict future market trends, the values or assets or economic factors, the Fund may suffer a loss, which may be substantial.
Proprietary Basket Swaps: The Fund may enter into total return swaps to obtain exposure to a portfolio of long and short derivative instruments without owning such securities. Under the terms of the contract, the swap is designed to function as a portfolio of direct investments in long and short derivative instruments. This means that the Fund has the ability to trade in and out of these long and short positions within the swap and will receive the economic benefits and risks equivalent to direct investment in these positions, subject to certain adjustments due to events related to the counterparty. Benefits and risks include capital appreciation (depreciation), which are reflected in the swap’s market value. The market value also includes interest charges and credits related to the notional values of the long and short positions and cash balances within the swap. Positions within the swap are reset periodically. During a reset, any unrealized appreciation (depreciation) on positions become available for cash settlement between the Fund and the counterparty. The amounts that are available for cash settlement are recorded as realized gains or losses in the Consolidated Statements of Operations. Cash settlement in and out of the swap may occur at a
reset date or any other date, at the discretion of the Fund and the counterparty, over the life of the agreement.
(K) Foreign Currency Forward Contracts. The Fund may enter into foreign currency forward contracts, which are agreements to buy or sell foreign currencies on a specified future date at a specified rate. The Fund is subject to foreign currency exchange rate risk in the normal course of investing in these transactions. During the period the forward contract is open, changes in the value of the contract are recognized as unrealized appreciation or depreciation by marking to market such contract on a daily basis to reflect the market value of the contract at the end of each day’s trading. Cash movement occurs on settlement date. When the forward contract is closed, the Fund records a realized gain or loss equal to the difference between the proceeds from (or cost of) the closing transaction and the Fund’s basis in the contract. The Fund may purchase and sell foreign currency forward contracts for purposes of seeking to enhance portfolio returns and manage portfolio risk more efficiently. Foreign currency forward contracts may also be used to gain exposure to a particular currency or to hedge against the risk of loss due to changing currency exchange rates. Foreign currency forward contracts to purchase or sell a foreign currency may also be used in anticipation of future purchases or sales of securities denominated in foreign currency, even if the specific investments have not yet been selected.
The use of foreign currency forward contracts involves, to varying degrees, elements of risk in excess of the amount recognized in the Consolidated Statement of Assets and Liabilities, including counterparty risk, market risk and illiquidity risk. Counterparty risk is heightened for these instruments because foreign currency forward contracts are not exchange-traded and therefore no clearinghouse or exchange stands ready to meet the obligations under such contracts. Thus, the Fund faces the risk that its counterparties under such contracts may not perform their obligations. Market risk is the risk that the value of a foreign currency forward contract will depreciate due to unfavorable changes in exchange rates. Illiquidity risk arises because the secondary market for foreign currency forward contracts may have less liquidity relative to markets for other securities and financial instruments. Risks also arise from the possible movements in the foreign exchange rates underlying these instruments. While the Fund may enter into forward contracts to reduce currency exchange risks, changes in currency exchange rates may result in poorer overall performance for the Fund than if it had not engaged in such transactions. Exchange rate movements can be large, depending on the currency, and can last for extended periods of time, affecting the value of the Fund’s assets. Moreover, there may be an imperfect correlation between the Fund’s holdings of securities denominated in a particular currency and forward contracts entered into by the Fund. Such imperfect correlation may prevent the Fund from achieving the intended hedge or expose the Fund to the risk of currency exchange loss. The unrealized appreciation (depreciation) on forward contracts also reflects the Fund’s exposure at the valuation date to credit loss in the event of a counterparty’s failure to perform its obligations.
(L) Foreign Currency Transactions. The Fund’s books and records are maintained in U.S. dollars. Prices of securities denominated in foreign currency amounts are translated into U.S. dollars at the mean
| | |
| 48 | | MainStay Absolute Return Multi-Strategy Fund |
between the buying and selling rates last quoted by any major U.S. bank at the following dates:
| (i) | market value of investment securities, other assets and liabilities—at the valuation date; and |
| (ii) | purchases and sales of investment securities, income and expenses—at the date of such transactions. |
The assets and liabilities that are denominated in foreign currency amounts are presented at the exchange rates and market values at the close of the period. The realized and unrealized changes in net assets arising from fluctuations in exchange rates and market prices of securities are not separately presented.
Net realized gain (loss) on foreign currency transactions represents net gains and losses on foreign currency forward contracts, net currency gains or losses realized as a result of differences between the amounts of securities sale proceeds or purchase cost, dividends, interest and withholding taxes as recorded on the Fund’s books, and the U.S. dollar equivalent amount actually received or paid. Net currency gains or losses from valuing such foreign currency denominated assets and liabilities, other than investments at valuation date exchange rates, are reflected in unrealized foreign exchange gains or losses.
(M) Rights and Warrants. Rights are certificates that permit the holder to purchase a certain number of shares, or a fractional share, of a new stock from the issuer at a specific price. Warrants are instruments that entitle the holder to buy an equity security at a specific price for a specific period of time. These investments can provide a greater potential for profit or loss than an equivalent investment in the underlying security. Prices of these investments do not necessarily move in tandem with the prices of the underlying securities.
There is risk involved in the purchase of rights and warrants in that these investments are speculative investments. The Fund could also lose the entire value of its investment in warrants if such warrants are not exercised by the date of its expiration. The Fund is exposed to risk until the sale or exercise of each right or warrant is completed. As of October 31, 2018, the Fund did not hold any rights or warrants.
(N) Securities Sold Short. The Fund may engage in sales of securities it does not own (“short sales”) as part of its investment strategies. When the Fund enters into a short sale, it must segregate or maintain with a broker the cash proceeds from the security sold short or other securities as collateral for its obligation to deliver the security upon conclusion of the sale. During the period a short position is open, depending on the nature and type of security, a short position is reflected as a liability and is marked to market in accordance with the valuation methodologies previously detailed (See Note 2(A)). Liabilities for securities sold short are closed out by purchasing the applicable securities for delivery to the counterparty broker. A gain, limited to the price at which the Fund sold the security short, or a loss, unlimited as to dollar amount, will be recognized upon termination of a short sale if the market price on the date the short position is closed out is less or greater, respectively, than the proceeds originally received. Any such gain or loss may be offset, completely or in part, by the change in the value of the hedged investments. Interest on short positions held is accrued daily, while dividends declared on short positions existing on the record date are recorded on the ex-dividend date as a dividend expense in the Consolidated Statement of Operations. Broker fees and
other expenses related to securities sold short are disclosed in the Consolidated Statement of Operations. Short sales involve risk of loss in excess of the related amounts reflected in the Consolidated Statement of Assets and Liabilities.
(O) Securities Lending. In order to realize additional income, the Fund may engage in securities lending, subject to the limitations set forth in the 1940 Act and relevant guidance by the staff of the Securities and Exchange Commission (“SEC”). In the event the Fund does engage in securities lending, the Fund will lend through its custodian, State Street Bank and Trust Company (“State Street”). State Street will manage the Fund’s collateral in accordance with the lending agreement between the Fund and State Street, and indemnify the Fund against counterparty risk. The loans will be collateralized by U.S. Treasury securities and/or U.S. Government Agency securities issued or guaranteed by the United States government or its agencies or instrumentalities at least equal at all times to the market value of the securities loaned. The Fund may bear the risk of delay in recovery of, or loss of rights in, the securities loaned should the borrower of the securities experience financial difficulty. The Fund may also record a realized gain or loss on securities deemed sold due to a borrower’s inability to return securities on loan. The Fund bears the risk of any loss on investment of the collateral. The Fund will receive compensation for lending its securities in the form of fees or it will retain a portion of interest on the investment of any cash received as collateral. The Fund will also continue to receive interest and dividends on the securities loaned and any gain or loss in the market price of the securities loaned that may occur during the term of the loan will be for the account of the Fund. Income earned from securities lending activity, if any, is reflected in the Consolidated Statement of Operations. As of October 31, 2018, the Fund had securities on loan with a value of $40,018 and had received non-cash collateral in the form of U.S. Treasury securities with a value of $41,174.
(P) High-Yield Securities, Energy Company, and Foreign Securities Risk. The Fund may invest in high-yield debt securities (commonly referred to as “junk bonds”), which are considered speculative because they present a greater risk of loss, including default, than higher quality debt securities. These securities pay investors a premium—a higher interest rate or yield than investment grade debt securities—because of the increased risk of loss. These securities can also be subject to greater price volatility. In times of unusual or adverse market, economic or political conditions, these securities may experience higher than normal default rates.
The Fund may invest up to 25% of its total assets in securities of domestic and foreign publicly traded partnerships and/or other issuers (including U.S. and Canadian royalty trusts and Canadian energy companies) engaged in the transportation, storage, processing, refining, marketing, exploration, production or mining of crude oil, natural gas, minerals or other natural resources (“Energy Companies”). The Fund may be particularly vulnerable to adverse events affecting Energy Companies as a result of its focus in Energy Companies.
The Fund may invest as limited partners in the equity securities of MLPs. As limited partners of MLPs, holders of MLP equity securities are subject to certain risks inherent in the structure of MLPs, including (i) tax risks, (ii) the limited ability to elect or remove management or the general partner or managing member, (iii) limited voting rights, except with respect to extraordinary transactions, and (iv) conflicts of interest between the
Notes to Consolidated Financial Statements (Unaudited) (continued)
general partner or managing member and its affiliates, on the one hand, and the limited partners or members, on the other hand, including those arising from incentive distribution payments or corporate opportunities.
The Fund may invest in foreign securities, which carry certain risks that are in addition to the usual risks inherent in domestic securities. These risks include those resulting from currency fluctuations, future adverse political or economic developments and possible imposition of currency exchange blockages or other foreign governmental laws or restrictions. These risks are likely to be greater in emerging markets than in developed markets. The ability of issuers of debt securities held by the Fund to meet their obligations may be affected by, among other things, economic or political developments in a specific country, industry or region.
The Fund may enter into investment transactions which may represent off-balance sheet risk. Off-balance sheet risk exists when the maximum potential loss on a particular investment is greater than the value of such investment, as reflected in the Consolidated Statement of Assets and Liabilities. Off-balance sheet risk generally arises from the use of derivative financial instruments or short sales.
(Q) Counterparty Credit Risk. In order to better define its contractual rights and to secure rights that will help the Fund mitigate its counterparty risk, the Fund may enter into an International Swaps and Derivatives Association, Inc. Master Agreement (“ISDA Master Agreement”) or similar agreement with its counterparties. An ISDA Master Agreement is a bilateral agreement between the Fund and a counterparty that governs certain OTC derivatives and typically contains collateral posting terms and netting provisions. Under an ISDA Master Agreement, the Fund may, under certain circumstances, offset with the counterparty certain derivative financial instruments’ payables and/or receivables with collateral held and/or posted and create one single net payment. The provisions of the ISDA Master Agreement typically permit a single net payment in the event of default including the bankruptcy or insolvency of the counterparty. Bankruptcy or insolvency laws of a particular jurisdiction may restrict or prohibit the right of offset in bankruptcy, insolvency or other events. In addition, certain ISDA Master Agreements may contain provisions for early termination of OTC derivative transactions in the event the net assets of the Fund decline below specific levels or if the Fund fails to meet the terms of its ISDA Master Agreements. The result would cause the Fund to accelerate payment of any net liability owed to the counterparty.
For financial reporting purposes, the Fund does not offset derivative assets and derivative liabilities that are subject to netting arrangements, if any, in the Consolidated Statement of Assets and Liabilities.
(R) Indemnifications. Under the Trust’s organizational documents, its officers and trustees are indemnified against certain liabilities that may arise out of performance of their duties to the Trust. Additionally, in the normal course of business, the Fund enters into contracts with third-party service providers that contain a variety of representations and warranties and which may provide general indemnifications. The Fund’s maximum exposure under these arrangements is unknown, as this would involve future claims that may be made against the Fund that have not yet occurred. Based on experience, management is of the view that the risk of loss in connection with these potential indemnification obligations is remote. However, there can be no assurance that material liabilities related to such obligations will not arise in the future, which could adversely impact the Fund.
(S) Quantitative Disclosure of Derivative Holdings. The following tables show additional disclosures related to the Fund’s derivative and hedging activities, including how such activities are accounted for and their effect on the Fund’s financial positions, performance and cash flows. The Fund entered into futures contracts in order to provide an efficient means of maintaining liquidity while remaining fully invested in the market.
The Fund utilizes a range of derivative instruments for a variety of different purposes. Total return swaps (“TRS”) are one form of derivative that is used. In some cases, TRS contracts are entered into so as to affect long and short exposure to individual securities or indices within a particular strategy. In other cases, TRS are used to gain exposure to the strategy itself, which may also use derivatives. For example, a TRS contract is used to generate the return available from a customized index comprised of a diversified basket of exchange-traded futures. Other examples of derivative positions into which the Fund may enter include interest rate swaps, credit default swaps and option contracts. These instruments are frequently used to obtain a desired return at a lower cost to the Fund than is available when investing directly in the underlying instrument or to hedge against credit and interest rate risks. The Fund may also enter into foreign currency forward contracts to gain exposure to a particular currency or to hedge against the risk of loss due to changing currency exchange rates. These derivatives are not accounted for as hedging instruments.
Fair value of derivative instruments as of October 31, 2018:
Asset Derivatives
| | | | | | | | | | | | | | | | | | | | | | |
| | | Consolidated Statement of
Assets and Liabilities
Location | | Foreign
Exchange
Contracts
Risk | | | Equity
Contracts
Risk | | | Credit
Contracts
Risk | | | Interest
Rate
Contracts
Risk | | | Total | |
Futures Contracts | | Net Assets—Net unrealized appreciation on investments, swap contracts and futures contracts (a) | | $ | — | | | $ | — | | | $ | — | | | $ | 100 | | | $ | 100 | |
OTC Swap Contracts | | Unrealized appreciation on OTC swap contracts | | | — | | | | 169,124 | | | | — | | | | — | | | | 169,124 | |
Centrally Cleared Swap Contracts | | Net Assets—Net unrealized appreciation on investments, swap contracts and futures contracts (b) | | | — | | | | — | | | | 30,984 | | | | 39,965 | | | | 70,949 | |
| | | | | | | | | | | | | | |
Total Fair Value | | | | $ | — | | | $ | 169,124 | | | $ | 30,984 | | | $ | 40,065 | | | $ | 240,173 | |
| | | | | | | | | | | | | | |
| | |
| 50 | | MainStay Absolute Return Multi-Strategy Fund |
Liability Derivatives
| | | | | | | | | | | | | | | | | | | | | | |
| | | Consolidated Statement of
Assets and Liabilities
Location | | Foreign
Exchange
Contracts
Risk | | | Equity
Contracts
Risk | | | Credit
Contracts
Risk | | | Interest
Rate
Contracts
Risk | | | Total | |
OTC Swap Contracts | | Unrealized depreciation on OTC swap contracts | | $ | — | | | $ | (115,917 | ) | | $ | — | | | $ | — | | | $ | (115,917 | ) |
Centrally Cleared Swap Contracts | | Net Assets—Net unrealized depreciation on investments, swap contracts and futures contracts (b) | | | — | | | | — | | | | (221 | ) | | | (49,519 | ) | | | (49,740 | ) |
| | | | | | | | | | | | | | | | | | | | | | |
Total Fair Value | | | | $ | — | | | $ | (115,917 | ) | | $ | (221 | ) | | $ | (49,519 | ) | | $ | (165,657 | ) |
| | | | | | | | | | | | | | |
| (a) | Includes cumulative appreciation (depreciation) of futures contracts as reported in the Consolidated Portfolio of Investments. Only current day’s variation margin is reported within the Consolidated Statement of Assets and Liabilities. |
| (b) | Includes cumulative appreciation (depreciation) of centrally cleared swap agreements as reported in the Consolidated Portfolio of Investments. Only the current day’s variation margin is reported within the Consolidated Statement of Assets and Liabilities. |
The effect of derivative instruments on the Consolidated Statement of Operations for the period ended October 31, 2018:
Realized Gain (Loss)
| | | | | | | | | | | | | | | | | | |
| | | Consolidated Statement of
Operations
Location | | Equity
Contracts
Risk | | | Credit
Contracts
Risk | | | Interest
Rate
Contracts
Risk | | | Total | |
Futures Contracts | | Net realized gain (loss) on futures transactions | | $ | 172,307 | | | $ | — | | | $ | (6,708 | ) | | $ | 165,599 | |
Swap Contracts | | Net realized gain (loss) on swap transactions | | | (1,284,285 | ) | | | (67,819 | ) | | | (130,697 | ) | | | (1,482,801 | ) |
| | | | | | | | | | |
Total Realized Gain (Loss) | | | | $ | (1,111,978 | ) | | $ | (67,819 | ) | | $ | (137,405 | ) | | $ | (1,317,202 | ) |
| | | | | | | | | | |
Change in Unrealized Appreciation (Depreciation)
| | | | | | | | | | | | | | | | | | |
| | | Consolidated Statement of
Operations
Location | | Equity
Contracts
Risk | | | Credit
Contracts
Risk | | | Interest
Rate
Contracts
Risk | | | Total | |
Futures Contracts | | Net change in unrealized appreciation (depreciation) on futures contracts | | $ | (121,520 | ) | | $ | — | | | $ | 1,961 | | | $ | (119,559 | ) |
Swap Contracts | | Net change in unrealized appreciation (depreciation) on swap contracts | | | 140,677 | | | | (14,675 | ) | | | 14,705 | | | | 140,707 | |
| | | | | | | | | | |
Total Change in Unrealized Appreciation (Depreciation) | | | | $ | 19,157 | | | $ | (14,675 | ) | | $ | 16,666 | | | $ | 21,148 | |
| | | | | | | | | | |
Average Notional Amount
| | | | | | | | | | | | | | | | | | |
| | | | | Equity
Contracts
Risk | | | Credit
Contracts
Risk | | | Interest
Rate
Contracts
Risk | | | Total | |
Futures Contracts Short | | | | $ | — | | | $ | — | | | $ | (187,286 | ) | | $ | (187,286 | ) |
Swap Contracts Long | | | | $ | 54,476,281 | | | $ | 11,495,000 | | | $ | 3,095,000 | | | $ | 69,066,281 | |
| | | | | | | | | | |
(T) Basis for Consolidation for the Wholly-Owned Subsidiary. MainStay Multi-Strategy Cayman Fund Ltd. (the “Cayman Subsidiary”) is organized as an exempted limited company under the laws of the Cayman Islands, and is a wholly-owned and controlled subsidiary of the Fund. The Fund and the Cayman Subsidiary are both advised by the Manager, and are subject to the same investment restrictions and guidelines as well as follow the same compliance policies and procedures. The Cayman Subsidiary serves as an investment vehicle for the Fund to enable the Fund to gain exposure to the commodities markets, primarily through investing up to 25% in the
aggregate of the Fund’s assets in the equity securities of the Cayman Subsidiary. In pursuing its investment objective, the Cayman Subsidiary is expected to invest, directly or indirectly through the use of derivatives (including total return swaps), in securities, commodities, commodity-related instruments and other investments. Except where the context otherwise requires, the term “Fund” refers to the Fund together with the Cayman Subsidiary. As of October 31, 2018, net assets of the Cayman Subsidiary were $11,219,152 representing 19.9% of the Fund’s consolidated net assets.
Notes to Consolidated Financial Statements (Unaudited) (continued)
Although the Cayman Subsidiary is otherwise subject to the same fundamental, non-fundamental and certain other investment restrictions as the Fund, the investment programs of the Fund and the Cayman Subsidiary are not necessarily identical. The Fund currently conducts its commodity investment activities only through the Cayman Subsidiary, but retains the ability to invest in additional Cayman Islands subsidiary entities in the future. The Fund is currently the sole shareholder of the Cayman Subsidiary, and it is expected that the Fund will remain the sole shareholder and will continue to control the Cayman Subsidiary. As a wholly-owned subsidiary of the Fund, all assets, liabilities, income and expenses of the Cayman Subsidiary are consolidated in the financial statements and financial highlights of the Fund, and all significant intercompany balances, revenues and expenses have been eliminated in consolidation.
(U) Commodity Futures Trading Commission Regulation. The Fund and the Cayman Subsidiary operate subject to Commodity Futures Trading Commission (“CFTC”) regulation and the Manager and Candriam France S.A.S. (“Candriam France” or “Subadvisor”) are registered with the CFTC as a commodity pool operator (“CPO”) and Commodity Trading Advisor (“CTA”), respectively, and each is a member of the National Futures Association. The Manager and Candriam France act as CPO and CTA, respectively, to the Fund and the Cayman Subsidiary. Accordingly, the Fund and the Manager will comply with certain CFTC rules regarding the disclosure, reporting and recordkeeping requirements that apply with respect to the Fund as a result of the Manager’s registration as a CPO. Generally, these rules allow for substituted compliance with CFTC disclosure and shareholder reporting requirements, based on the Fund’s compliance with comparable SEC requirements. This means that for most of the CFTC’s disclosure and shareholder reporting applicable to the Manager as the Fund’s CPO, the Manager’s compliance with SEC disclosure and shareholder reporting will generally be deemed to fulfill the Manager’s CFTC compliance obligations so long as the Fund operates in compliance with the conditions of CFTC Regulation 4.12.
Candriam France operates the Cayman Subsidiary in accordance with an operational exemption from certain CFTC disclosure, reporting and recordkeeping provisions.
As a result of CFTC regulation with respect to the Fund and the Cayman Subsidiary, the Fund and the Cayman Subsidiary may incur additional compliance and other expenses. The CFTC has neither reviewed nor approved the Fund, the Cayman Subsidiary, their investment strategies, or the Fund’s Prospectus or Statement of Additional Information.
Note 3–Fees and Related Party Transactions
(A) Manager and Subadvisors. New York Life Investments, a registered investment adviser and an indirect, wholly-owned subsidiary of New York Life Insurance Company (“New York Life”), serves as the Fund’s Manager, pursuant to an Amended and Restated Management Agreement (“Management Agreement”). The Manager provides offices, conducts clerical, recordkeeping and bookkeeping services and keeps most of the financial and accounting records required to be maintained by the Fund. Except for the portion of salaries and expenses that are the responsibility of the Fund, the Manager pays the salaries and expenses of all personnel affiliated with the Fund and certain operational expenses of the Fund. The Fund reimburses New York Life Investments in an
amount equal to a portion of the compensation of the Chief Compliance Officer attributable to the Fund. Candriam France, a registered investment adviser, serves as a Subadvisor to the Fund, pursuant to the terms of a Subadvisory Agreement (“Subadvisory Agreement”) between New York Life Investments and Candriam France, and is responsible for the day-to-day portfolio management of a portion of the Fund and the Cayman Subsidiary. Cushing® Asset Management, LP (“Cushing” or the “Subadvisor”), a registered investment adviser, serves as a Subadvisor to the Fund, pursuant to the terms of a Subadvisory Agreement between New York Life Investments and Cushing, is responsible for the day-to-day portfolio management of a portion of the Fund. MacKay Shields LLC (‘‘MacKay Shields’’ or the “Subadvisor,” and together with Candriam France and Cushing, the “Subadvisors”), a registered investment adviser and an indirect, wholly-owned subsidiary of New York Life, serves as a Subadvisor to the Fund, pursuant to the terms of a Subadvisory Agreement between New York Life Investments and MacKay Shields, and is responsible for the day-to-day portfolio management of a portion of the Fund. Prior to January 1, 2018, Cornerstone Capital Management Holdings LLC served as a Subadvisor to the Fund. Effective January 1, 2018, all investment personnel of Cornerstone Capital Management Holdings LLC transitioned to MacKay Shields due to an organizational restructuring. New York Life Investments pays for the services of the Subadvisors.
Under the Management Agreement, the Fund pays the Manager a monthly fee for the services performed and the facilities furnished at an annual rate of 1.25% of the Fund’s average daily net assets.
The Cayman Subsidiary has entered into a separate advisory agreement with New York Life Investments for the management of the Cayman Subsidiary’s portfolio pursuant to which the Cayman Subsidiary is obligated to pay New York Life Investments a management fee at the same rate that the Fund pays New York Life Investments for services provided to the Fund. New York Life Investments is contractually obligated to waive the management fee it receives from the Fund in an amount equal to the management fee paid to New York Life Investments by the Cayman Subsidiary. This waiver arrangement may not be terminated by New York Life Investments as long as its advisory agreement with the Cayman Subsidiary is in place.
New York Life Investments has contractually agreed to waive fees and/or reimburse expenses so the total annual operating expenses (excluding taxes, interest, litigation, extraordinary expenses, brokerage and other transaction expenses relating to the purchase or sale of portfolio investments and acquired (underlying) fund fees and expenses) for Class A shares do not exceed 1.80% of its average daily net assets. New York Life Investments will apply an equivalent waiver or reimbursement, in an equal number of basis points, to the other share classes of the Fund, except Class R6. New York Life Investments will waive fees and/or reimburse expenses so that Class R6 fees and expenses do not exceed those of Class I. This agreement will remain in effect until August 29, 2019, and shall renew automatically for one-year terms unless New York Life Investments provides written notice of termination prior to the start of the next term or upon approval of the Board.
During the six-month period ended October 31, 2018, New York Life Investments earned fees from the Fund in the amount of $561,401 and waived its fees and/or reimbursed expenses in the amount of $277,644.
| | |
| 52 | | MainStay Absolute Return Multi-Strategy Fund |
State Street provides sub-administration and sub-accounting services to the Fund pursuant to an agreement with New York Life Investments. These services include calculating the daily NAVs of the Fund, maintaining the general ledger and sub-ledger accounts for the calculation of the Fund’s NAVs and assisting New York Life Investments in conducting various aspects of the Fund’s administrative operations. For providing these services to the Fund, State Street is compensated by New York Life Investments.
Effective December 22, 2017, pursuant to an agreement between the Trust and New York Life Investments, New York Life Investments is responsible for providing or procuring certain regulatory reporting services for the Fund. The Fund will reimburse New York Life Investments for the actual costs incurred by New York Life Investments in connection with providing or procuring these services for the Fund.
(B) Distribution and Service Fees. The Trust, on behalf of the Fund, has entered into a distribution agreement with NYLIFE Distributors LLC (the “Distributor”), an indirect, wholly-owned subsidiary of New York Life. The Fund has adopted distribution plans (the “Plans”) in accordance with the provisions of Rule 12b-1 under the 1940 Act.
Pursuant to the Class A, Investor Class and Class T Plans, the Distributor receives a monthly distribution fee from the Class A, Investor Class and Class T shares at an annual rate of 0.25% of the average daily net assets of the Class A, Investor Class and Class T shares for distribution and/or service activities as designated by the Distributor. Pursuant to the Class C Plan, Class C shares pay the Distributor a monthly distribution fee at an annual rate of 0.75% of the average daily net assets of the Class C shares, along with a service fee at an annual rate of 0.25% of the average daily net assets of the Class C shares, for a total 12b-1 fee of 1.00%. Class I and Class R6 shares are not subject to a distribution and/or service fee.
The Plans provide that the distribution and service fees are payable to the Distributor regardless of the amounts actually expended by the Distributor for distribution of the Fund’s shares and service activities.
(C) Sales Charges. During the six-month period ended October 31, 2018, the Fund was advised by the Distributor that the amount of initial sales charges retained on sales of Class A and Investor Class shares were $292 and $202, respectively.
During the six-month period ended October 31, 2018, the Fund was also advised that the Distributor retained CDSCs on redemptions of Class A and Class C shares of $1,269 and $52, respectively.
(D) Transfer, Dividend Disbursing and Shareholder Servicing Agent. NYLIM Service Company LLC, an affiliate of New York Life Investments, is the Fund’s transfer, dividend disbursing and shareholder servicing agent pursuant to an agreement between NYLIM Service Company LLC and the Trust. NYLIM Service Company LLC has entered into an agreement with DST Asset Manager Solutions, Inc. (“DST”), pursuant to which DST performs certain transfer agent services on behalf of NYLIM Service Company LLC. State Street is the Cayman Subsidiary’s transfer agent pursuant to an agreement between State Street and the Cayman Subsidiary. During the six-month period ended October 31, 2018, transfer agent expenses incurred by the Fund and Cayman Subsidiary were $7,183 and $10,025, respectively.
(E) Small Account Fee. Shareholders with small accounts adversely impact the cost of providing transfer agency services. In an effort to reduce total transfer agency expenses, the Fund has implemented a small account fee on certain types of accounts. Certain shareholders with an account balance of less than $1,000 are charged an annual per account fee of $20 (assessed semi-annually), the proceeds from which offset transfer agent fees as reflected in the Consolidated Statement of Operations.
(F) Investments in Affiliates (in 000’s). During the six-month period ended October 31, 2018, purchases and sales transactions, income earned from investments and shares held of investment companies managed by New York Life Investments or its affiliates were as follows:
| | | | | | | | | | | | | | | | | | | | | | | | | | | | | | | | | | | | |
Affiliated Investment Companies | | Value,
Beginning of
Period | | | Purchases
at Cost | | | Proceeds from
Sales | | | Net
Realized
Gain/(Loss)
on sales | | | Change in
Unrealized
Appreciation/
Depreciation | | | Value,
End of
Period | | | Dividend
Income | | | Other
Distributions | | | Shares
End of
Period | |
IQ Global Resources ETF | | $ | 1,069 | | | $ | — | | | $ | (531 | ) | | $ | 4 | | | $ | (27 | ) | | $ | 515 | | | $ | 42 | | | $ | — | | | | 19 | |
MainStay U.S. Government Liquidity Fund | | | — | | | | 46,960 | | | | (41,693 | ) | | | — | | | | — | | | | 5,267 | | | | — | | | | — | | | | 5,267 | |
| | | | |
| | $ | 1,069 | | | $ | 46,960 | | | $ | (42,224 | ) | | $ | 4 | | | $ | (27 | ) | | $ | 5,782 | | | $ | 42 | | | $ | — | | | | | |
| | | | | | | | |
(G) Capital. As of October 31, 2018, New York Life and its affiliates beneficially held shares of the Fund with the values and percentages of net assets as follows:
| | | | | | | | |
Investor Class | | $ | 23,999 | | | | 5.1 | % |
Class C | | | 23,385 | | | | 6.3 | |
Class I | | | 32,331,415 | | | | 59.9 | |
Note 4–Federal Income Tax
As of October 31, 2018, the cost and unrealized appreciation (depreciation) of the Fund’s investment portfolio, including applicable
derivative contracts and other financial instruments, as determined on a federal income tax basis, were as follows:
| | | | | | | | | | | | | | | | |
| | | Federal Tax
Cost | | | Gross
Unrealized
Appreciation | | | Gross
Unrealized
(Depreciation) | | | Net
Unrealized
Appreciation/
(Depreciation) | |
Investments in Securities | | $ | 50,279,217 | | | $ | 2,096,653 | | | $ | (2,339,773 | ) | | $ | (243,120 | ) |
As of October 31, 2018, for federal income tax purposes, capital loss carryforwards of $623,344 as shown in the table below, were available to the extent provided by the regulations to offset future realized gains
Notes to Consolidated Financial Statements (Unaudited) (continued)
of the Fund through the years indicated. Accordingly, no capital gains distributions are expected to be paid to shareholders until net gains have been realized in excess of such amounts.
| | | | | | | | |
Capital Loss Available Through | | Short-Term Capital Loss Amounts (000’s) | | | Long-Term Capital Loss Amounts (000’s) | |
| Unlimited | | $ | 623 | | | $ | — | |
During the year ended April 30, 2018, the tax character of distributions paid as reflected in the Consolidated Statements of Changes in Net Assets was as follows:
| | | | | | | | |
| | | | | | 2018 | |
Distributions paid from: | | | | | | | | |
Ordinary Income | | | | | | $ | 1,988,638 | |
Long-Term Capital Gain | | | | | | | 901,615 | |
Total | | | | | | $ | 2,890,253 | |
Note 5–Custodian
State Street is the custodian of cash and securities held by the Fund. Custodial fees are charged to the Fund based on the Fund’s net assets and/or the market value of securities held by the Fund and the number of certain transactions incurred by the Fund.
Note 6–Line of Credit
The Fund and certain other funds managed by New York Life Investments maintain a line of credit with a syndicate of banks in order to secure a source of funds for temporary purposes to meet unanticipated or excessive redemption requests.
Effective July 31, 2018, under the credit agreement (the “Credit Agreement”), the aggregate commitment amount is $600,000,000 with an additional uncommitted amount of $100,000,000. The commitment fee is an annual rate of 0.15% of the average commitment amount payable quarterly, regardless of usage, to State Street, who serves as the agent to the syndicate. The commitment fee is allocated among the Fund and certain other funds managed by New York Life Investments based upon their respective net assets and other factors. Interest on any revolving credit loan is charged based upon the Federal Funds Rate or the one-month London Interbank Offered Rate (“LIBOR”), whichever is higher. The Credit Agreement expires on July 30, 2019, although the Fund, certain other funds managed by New York Life Investments and the syndicate of banks may renew the Credit Agreement for an additional year on the same or different terms. Prior to July 31, 2018, the aggregate commitment amount and the commitment fee were the same as those under the current Credit Agreement. During the six-month period ended October 31, 2018, there were no borrowings made or outstanding with respect to the Fund under the Credit Agreement.
Note 7–Interfund Lending Program
Pursuant to an exemptive order issued by the SEC, the Fund, along with certain other funds managed by New York Life Investments, may participate in an interfund lending program. The interfund lending program provides an alternative credit facility that permits the Fund and certain other funds managed by New York Life Investments to lend or borrow
money for temporary purposes directly to or from one another subject to the conditions of the exemptive order. During the six-month period ended October 31, 2018, there were no interfund loans made or outstanding with respect to the Fund.
Note 8–Purchases and Sales of Securities (in 000’s)
During the six-month period ended October 31, 2018, purchases and sales of securities, other than short-term securities, were $31,252 and $49,810, respectively.
Note 9–Capital Share Transactions
| | | | | | | | |
Class A | | Shares | | | Amount | |
Six-month period ended October 31, 2018: | | | | | | | | |
Shares sold | | | 5,027 | | | $ | 46,949 | |
Shares redeemed | | | (194,193 | ) | | | (1,808,109 | ) |
| | | | |
Net increase (decrease) in shares outstanding before conversion | | | (189,166 | ) | | | (1,761,160 | ) |
Shares converted into Class A (See Note 1) | | | 3,242 | | | | 30,367 | |
| | | | |
Net increase (decrease) | | | (185,924 | ) | | $ | (1,730,793 | ) |
| | | | |
Year ended April 30, 2018: | | | | | | | | |
Shares sold | | | 35,602 | | | $ | 352,821 | |
Shares issued to shareholders in reinvestment of dividends and distributions | | | 12,532 | | | | 123,187 | |
Shares redeemed | | | (251,418 | ) | | | (2,479,331 | ) |
| | | | |
Net increase (decrease) in shares outstanding before conversion | | | (203,284 | ) | | | (2,003,323 | ) |
Shares converted into Class A (See Note 1) | | | 14,921 | | | | 150,112 | |
Shares converted from Class A (See Note 1) | | | (5,473 | ) | | | (52,901 | ) |
| | | | |
Net increase (decrease) | | | (193,836 | ) | | $ | (1,906,112 | ) |
| | | | |
| | |
| | | | | | | | |
Investor Class | | Shares | | | Amount | |
Six-month period ended October 31, 2018: | | | | | | | | |
Shares sold | | | 3,680 | | | $ | 34,455 | |
Shares redeemed | | | (47,868 | ) | | | (445,325 | ) |
| | | | |
Net increase (decrease) in shares outstanding before conversion | | | (44,188 | ) | | | (410,870 | ) |
Shares converted from Investor Class (See Note 1) | | | (3,249 | ) | | | (30,367 | ) |
| | | | |
Net increase (decrease) | | | (47,437 | ) | | $ | (441,237 | ) |
| | | | |
Year ended April 30, 2018: | | | | | | | | |
Shares sold | | | 23,713 | | | $ | 235,053 | |
Shares issued to shareholders in reinvestment of dividends and distributions | | | 2,051 | | | | 20,117 | |
Shares redeemed | | | (44,267 | ) | | | (440,218 | ) |
| | | | |
Net increase (decrease) in shares outstanding before conversion | | | (18,503 | ) | | | (185,048 | ) |
Shares converted into Investor Class (See Note 1) | | | 5,485 | | | | 52,901 | |
Shares converted from Investor Class (See Note 1) | | | (14,993 | ) | | | (150,112 | ) |
| | | | |
Net increase (decrease) | | | (28,011 | ) | | $ | (282,259 | ) |
| | | | |
| | |
| | | | | | | | |
| | |
| 54 | | MainStay Absolute Return Multi-Strategy Fund |
| | | | | | | | |
Class C | | Shares | | | Amount | |
Six-month period ended October 31, 2018: | | | | | | | | |
Shares sold | | | 48 | | | $ | 393 | |
Shares redeemed | | | (23,233 | ) | | | (213,982 | ) |
| | | | |
Net increase (decrease) | | | (23,185 | ) | | $ | (213,589 | ) |
| | | | |
Year ended April 30, 2018: | | | | | | | | |
Shares sold | | | 8,180 | | | $ | 80,101 | |
Shares issued to shareholders in reinvestment of dividends and distributions | | | 783 | | | | 7,625 | |
Shares redeemed | | | (22,467 | ) | | | (220,806 | ) |
| | | | |
Net increase (decrease) | | | (13,504 | ) | | $ | (133,080 | ) |
| | | | |
| | |
| | | | | | | | |
Class I | | Shares | | | Amount | |
Six-month period ended October 31, 2018: | | | | | | | | |
Shares sold | | | 6,957 | | | $ | 57,963 | |
Shares redeemed | | | (4,304,560 | ) | | | (40,496,500 | ) |
| | | | |
Net increase (decrease) | | | (4,297,603 | ) | | $ | (40,438,537 | ) |
| | | | |
Year ended April 30, 2018: | | | | | | | | |
Shares sold | | | 390,115 | | | $ | 3,902,984 | |
Shares issued to shareholders in reinvestment of dividends and distributions | | | 278,658 | | | | 2,739,204 | |
Shares redeemed | | | (3,352,807 | ) | | | (33,343,067 | ) |
| | | | |
Net increase (decrease) | | | (2,684,034 | ) | | $ | (26,700,879 | ) |
| | | | |
Note 10–Subsequent Events
In connection with the preparation of the consolidated financial statements of the Fund as of and for the six-month period ended October 31, 2018, events and transactions subsequent to October 31, 2018, through the date the consolidated financial statements were issued have been evaluated by the Fund’s management for possible adjustment and/or disclosure. No subsequent events requiring financial statement adjustment or disclosure have been identified, other than the following:
At a meeting held on June 19-21, 2018, the Board of the Trustees approved a proposal to liquidate the Fund pursuant to the terms of a plan of liquidation (the “Liquidation”). Shareholders who owned shares of the Fund received a supplement dated June 22, 2018 to the Fund’s Prospectus containing further information regarding the Liquidation which took place on November 30, 2018.
Proxy Voting Policies and Procedures and Proxy Voting Record
A description of the policies and procedures that New York Life Investments uses to vote proxies related to the Fund’s securities is available without charge, upon request, by visiting the MainStay Funds’ website at nylinvestments.com/funds or on the SEC’s website at www.sec.gov.
The Fund is required to file with the SEC its proxy voting records for the 12-month period ending June 30 on Form N-PX. The most recent Form N-PX or proxy voting record is available free of charge upon request by calling 800-MAINSTAY (624-6782); visiting the MainStay Funds’ website at nylinvestments.com/funds; or on the SEC’s website at www.sec.gov.
Shareholder Reports and Quarterly Portfolio Disclosure
The Fund is required to file its complete schedule of portfolio holdings with the SEC for its first and third fiscal quarters on Form N-Q. The Fund’s Form N-Q is available without charge, on the SEC’s website at www.sec.gov or by calling New York Life Investments at 800-MAINSTAY (624-6782).
| | |
| 56 | | MainStay Absolute Return Multi-Strategy Fund |
For more information
800-MAINSTAY (624-6782)
nylinvestments.com/funds
New York Life Investments is a service mark and name under which New York Life Investment Management LLC does business. New York Life Investments, an indirect subsidiary of New York Life Insurance Company, New York, NY 10010, provides investment advisory products and services. The MainStay Funds® are managed by New York Life Investment Management LLC and distributed by NYLIFE Distributors LLC, 30 Hudson Street, Jersey City, NJ 07302, a wholly owned subsidiary of New York Life Insurance Company. NYLIFE Distributors LLC is a Member FINRA/SIPC.
This report may be distributed only when preceded or accompanied by a current Fund prospectus.
©2018 NYLIFE Distributors LLC. All rights reserved.
| | |
| 1716477 MS293-18 | | MSARM10-12/18 (NYLIM) NL269 |
Item 2. Code of Ethics.
Not applicable.
| Item 3. | Audit Committee Financial Expert. |
Not applicable.
| Item 4. | Principal Accountant Fees and Services. |
Not applicable.
| Item 5. | Audit Committee of Listed Registrants |
Not applicable.
| Item 6. | Schedule of Investments |
The Schedule of Investments is included as part of Item 1 of this report.
| Item 7. | Disclosure of Proxy Voting Policies and Procedures for Closed-End Management Investment Companies. |
Not applicable.
| Item 8. | Portfolio Managers of Closed-End Management Investment Companies. |
Not applicable.
| Item 9. | Purchases of Equity Securities by Closed-End Management Investment Company and Affiliated Purchasers. |
Not Applicable.
| Item 10. | Submission of Matters to a Vote of Security Holders. |
Since the Registrant’s last response to this Item, there have been no material changes to the procedures by which shareholders may recommend nominees to the Registrant’s Board of Trustees.
Item 11. Controls and Procedures.
| (a) | Based on an evaluation of the Registrant’s Disclosure Controls and Procedures (as defined in Rule 30a-3(c) under the Investment Company Act of 1940) (the “Disclosure Controls”), as of a date within 90 days prior to the filing date (the “Filing Date”) of this Form N-CSR (the “Report”), the Registrant’s principal executive officer and principal financial officer have concluded that the Disclosure Controls are reasonably designed to ensure that information required to be disclosed by the Registrant in the Report is recorded, processed, summarized and reported by the Filing Date, including ensuring that information required to be disclosed in the Report is accumulated and communicated to the Registrant’s management, including the Registrant’s principal executive officer and principal financial officer, as appropriate to allow timely decisions regarding required disclosure. |
| (b) | There were no changes in the Registrant’s internal control over financial reporting (as defined in Rule 30a-3(d)) under the Investment Company Act of 1940 that occurred during the second fiscal quarter of the period covered by this report that has materially affected, or is reasonably likely to materially affect, the Registrant’s internal control over financial reporting. |
Item 12. Exhibits.
| (a) | Certifications of principal executive officer and principal financial officer as required by Rule 30a-2 under the Investment Company Act of 1940. |
| (b) | Certifications of principal executive officer and principal financial officer as required by Section 906 of the Sarbanes-Oxley Act of 2002. |
SIGNATURES
Pursuant to the requirements of the Securities Exchange Act of 1934 and the Investment Company Act of 1940, the Registrant has duly caused this Report to be signed on its behalf by the undersigned, thereunto duly authorized.
MAINSTAY FUNDS TRUST
| | |
| By: | | /s/ Kirk C. Lehneis |
| | Kirk C. Lehneis |
| | President and Principal Executive Officer |
| |
| Date: | | January 4, 2019 |
Pursuant to the requirements of the Securities Exchange Act of 1934 and the Investment Company Act of 1940, this Report has been signed below by the following persons on behalf of the Registrant and in the capacities and on the dates indicated.
| | |
| By: | | /s/ Kirk C. Lehneis |
| | Kirk C. Lehneis |
| | President and Principal Executive Officer |
| |
| Date: | | January 4, 2019 |
| |
| By: | | /s/ Jack R. Benintende |
| | Jack R. Benintende |
| | Treasurer and Principal Financial and Accounting Officer |
| |
| Date: | | January 4, 2019 |
EXHIBIT INDEX
| (a) | Certifications of principal executive officer and principal financial officer as required by Rule 30a-2 under the Investment Company Act of 1940. |
| (b) | Certification of principal executive officer and principal financial officer as required by Section 906 of the Sarbanes-Oxley Act of 2002. |