UNITED STATES
SECURITIES AND EXCHANGE COMMISSION
Washington, D.C. 20549
FormN-CSR
CERTIFIED SHAREHOLDER REPORT OF REGISTERED MANAGEMENT
INVESTMENT COMPANIES
Investment Company Act File Number811-22321
MAINSTAY FUNDS TRUST
(Exact name of Registrant as specified in charter)
51 Madison Avenue, New York, NY 10010
(Address of principal executive offices) (Zip code)
J. Kevin Gao, Esq.
30 Hudson Street
Jersey City, New Jersey 07302
(Name and address of agent for service)
Registrant’s telephone number, including area code: (212)576-7000
Date of fiscal year end: November 30 (MainStay Cushing Energy Income Fund, MainStay Cushing MLP Premier Fund, MainStay Cushing Renaissance Advantage Fund)
Date of reporting period: May 31, 2019
FORMN-CSR
The information presented in this FormN-CSR relates solely to MainStay Cushing Energy Income Fund, MainStay Cushing MLP Premier Fund and MainStay Cushing Renaissance Advantage Fund
series of the Registrant.
Item 1. Reports to Stockholders.
MainStay Cushing® Funds
Message from the President and Semiannual Report
Unaudited | May 31, 2019

MainStay Cushing® Energy Income Fund
MainStay Cushing® MLP Premier Fund
MainStay Cushing® Renaissance Advantage Fund
Beginning on January 1, 2021, paper copies of MainStay Fund annual and semiannual shareholder reports will no longer be sent by mail, unless you specifically request paper copies of the reports from MainStay Funds or from your financial intermediary. Instead, the reports will be made available on the MainStay Funds’ website. You will be notified by mail and provided with a website address to access the report each time a new report is posted to the website.
If you already elected to receive shareholder reports electronically, you will not be affected by this change and you need not take any action. At any time, you may elect to receive reports and other communications from MainStay Funds electronically by calling toll-free 800-624-6782, by sending an e-mail to MainStayShareholderServices@nylim.com, or by contacting your financial intermediary.
You may elect to receive all future shareholder reports in paper form free of charge. If you hold shares of a MainStay Fund directly, you can inform MainStay Funds that you wish to receive paper copies of reports by calling toll-free 800-624-6782 or by sending an e-mail to MainStayShareholderServices@nylim.com. If you hold shares of a MainStay Fund through a financial intermediary, please contact the financial intermediary to make this election. Your election to receive reports in paper form will apply to all MainStay Funds in which you are invested and may apply to all funds held with your financial intermediary.
| | | | | | | | |
| | | | | |
| Not FDIC/NCUA Insured | | Not a Deposit | | May Lose Value | | No Bank Guarantee | | Not Insured by Any Government Agency |

This page intentionally left blank
Message from the President
Macroeconomic and political uncertainties unsettled financial markets during the six-month period ended May 31, 2019, leading to rising levels of volatility and mixed results for stocks and bonds.
U.S. equities and fixed-income instruments fell in December 2018 over concerns regarding the pace of economic growth, a government shutdown and the potential impact of trade disputes between the United States and other nations, particularly China. U.S. markets recovered quickly in January 2019 as trade tensions eased, the government reopened and the U.S. Federal Reserve Board (Fed) adopted a more accommodative tone regarding the future direction of interest rates. The next three months saw further gains across a wide spectrum of stocks and bonds, supported by encouraging economic data and generally strong corporate earnings. However, investor sentiment turned negative again in May 2019 in response to deepening tensions between the United States and China and renewed concerns regarding slowing global economic growth.
Macroeconomic uncertainties drove crude oil prices sharply lower in May 2019, taking a particularly heavy toll on energy-related stocks. Within the S&P 500® Index, only the energy sector ended the reporting period in negative territory, with declines in the closing month responsible for most of the slump. Yield-oriented energy investments generally sustained milder
losses as falling yields bolstered midstream equities in the latter part of the reporting period. High-yield energy stocks tended to fare worse with investors growing increasingly risk averse.
Rising levels of market volatility serve as a reminder of the importance of maintaining a long-term investment perspective. We are dedicated to providing you, as a MainStay investor, with vigilant and disciplined fund management, freeing you to focus on the wider picture of your long-term financial goals. Your financial professional remains an excellent resource to help you review your investment strategy and make any necessary updates or revisions. We encourage you to discuss with them any questions you may have regarding the report that follows, and to seek their advice in meeting your evolving financial goals. We also invite you to visit our website at nylinvestments.com/funds for more information on investing and the MainStay Funds.
Sincerely,

Kirk C. Lehneis
President
The opinions expressed are as of the date of this report and are subject to change. There is no guarantee that any forecast made will come to pass. This material does not constitute investment advice and is not intended as an endorsement of any specific investment. Past performance is no guarantee of future results.
Not part of the Semiannual Report
Table of Contents
Investors should refer to each Fund’s Summary Prospectus and/or Prospectus and consider each Fund’s investment objectives, strategies, risks, charges and expenses carefully before investing. The Summary Prospectus and/or Prospectus contain this and other information about each Fund. You may obtain copies of each Fund’s Summary Prospectus, Prospectus and Statement of Additional Information free of charge, upon request, by calling toll-free800-624-6782, by writing to NYLIFE Distributors LLC, Attn: MainStay Marketing Department, 30 Hudson Street, Jersey City, New Jersey 07302 or by sending ane-mail to MainStayShareholderServices@nylim.com. These documents are also available via the MainStay Funds’ website at nylinvestments.com/funds. Please read each Summary Prospectus and/or Prospectus carefully before investing.
MainStay Cushing Energy Income Fund
Investment and Performance Comparison1(Unaudited)
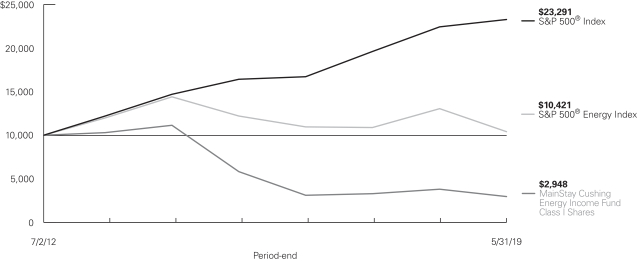
Performance data quoted represents past performance. Past performance is no guarantee of future results. Because of market volatility and other factors, current performance may be lower or higher than the figures shown. Investment return and principal value will fluctuate, and as a result, when shares are redeemed, they may be worth more or less than their original cost. The graph below depicts the historical performance of Class I shares of the Fund. Performance will vary from class to class based on differences in class-specific expenses and sales charges. For performance information current to the most recent month-end, please call800-624-6782 or visit nylinvestments.com/funds.
Average Annual Total Returns for the Period Ended May 31, 2019
| | | | | | | | | | | | | | | | | | | | | | | | | | | | |
| Class | | Sales Charge | | | | Inception
Date | | | Six
Months | | | One Year | | | Five Years or Since
Inception | | | Since Inception | | | Gross Expense
Ratio2 | |
| | | | | | | | |
| Class A Shares3 | | Maximum 5.5% Initial Sales Charge | | With sales charge Excluding sales charge | | | 7/2/2012 | | |
| –16.54
–11.68 | %
| |
| –27.25
–23.01 | %
| |
| –24.42
–23.56 | %
| |
| –17.11
–16.43 | %
| |
| 1.69
1.69 | %
|
| Investor Class Shares | | Maximum 5.5% Initial Sales Charge | | With sales charge Excluding sales charge | | | 7/11/2014 | | |
| –16.38
–11.51 |
| |
| –27.23
–22.99 |
| |
| –24.49
–23.63 |
| |
| –24.49
–23.63 |
| |
| 1.84
1.84 |
|
| Class C Shares3 | | Maximum 1% CDSC if Redeemed Within One Year of Purchase | | With sales charge Excluding sales charge | |
| 7/2/2012
|
| |
| –12.87
–12.01 |
| |
| –24.29
–23.55 |
| |
| –24.20
–24.20 |
| |
| –17.10
–17.10 |
| |
| 2.59
2.59 |
|
| Class I Shares3 | | No Sales Charge | | | | | 7/2/2012 | | | | –11.41 | | | | –22.72 | | | | –23.34 | | | | –16.19 | | | | 1.44 | |
| 1. | The performance table and graph do not reflect the deduction of taxes that a shareholder would pay on distributions or Fund share redemptions. Total returns reflect maximum applicable sales charges as indicated in the table above, if any, changes in share price, and reinvestment of dividend and capital gain distributions. The graph assumes the initial investment amount shown above and reflects the deduction of all sales charges that would have applied for the period of investment. Performance figures may reflect certain fee waivers and/or expense limitations, without which total returns may have been lower. For more information on share classes and current fee waivers and/or expense limitations (if any), please refer to the Notes to Financial Statements. |
| 2. | The gross expense ratios presented reflect the Fund’s “Total Annual Fund Operating Expenses” from the most recent Prospectus and may differ from other expense ratios disclosed in this report. |
| 3. | Performance figures for Class A shares, Class C shares and Class I shares reflect the historical performance of the then-existing Class A shares, Class C shares and Class I shares, respectively, of the Cushing® Energy Income Fund (the predecessor to the Fund, which was subject to a different fee structure) for periods prior to July 12, 2014. The Cushing® Energy Income Fund commenced operations on July 2, 2012. |
The footnotes on the next page are an integral part of the table and graph and should be carefully read in conjunction with them.
| | | | | | | | | | | | | | | | |
| Benchmark Performance | | Six
Months | | | One Year | | | Five Years | | | Since Inception | |
| | | | |
S&P 500® Index4 | | | 0.74 | % | | | 3.78 | % | | | 9.66 | % | | | 13.01 | % |
| | | | |
S&P 500® Energy Index5 | | | –9.59 | | | | –20.05 | | | | –6.28 | | | | 0.60 | |
| | | | |
Morningstar Equity Energy Category Average6 | | | –13.03 | | | | –30.19 | | | | –14.59 | | | | –4.28 | |
| 4. | The S&P 500® Index is the Fund’s primary benchmark. “S&P 500®” is a trademark of The McGraw-Hill Companies, Inc. The S&P 500® Index is widely regarded as the standard index for measuring large-cap U.S. stock market performance. Results assume reinvestment of all dividends and capital gains. An investment cannot be made directly in an index. |
| 5. | The S&P 500® Energy Index is the Fund’s secondary benchmark. The S&P 500® Energy Index comprises those companies included in the S&P 500® Index that are classified as members of the GICS® Energy Sector. |
| 6. | The Morningstar Equity Energy Category Average is representative of funds that invest primarily in equity securities of U.S. or non-U.S. companies who conduct business primarily in energy-related industries. This includes and is not limited to companies in alternative energy, coal, exploration, oil and gas services, pipelines, natural gas services, and refineries. Results are based on average total returns of similar funds with all dividends and capital gain distributions reinvested. |
The footnotes on the preceding page are an integral part of the table and graph and should be carefully read in conjunction with them.
| | |
| 6 | | MainStay Cushing Energy Income Fund |
Cost in Dollars of a $1,000 Investment in MainStay Cushing Energy Income Fund (Unaudited)
The example below is intended to describe the fees and expenses borne by shareholders during the six-month period from December 1, 2018, to May 31, 2019, and the impact of those costs on your investment.
Example
As a shareholder of the Fund, you incur two types of costs: (1) transaction costs, including exchange fees and sales charges (loads) on purchases (as applicable), and (2) ongoing costs, including management fees, distribution and/or service (12b-1) fees, and other Fund expenses (as applicable). This example is intended to help you understand your ongoing costs (in dollars) of investing in the Fund and to compare these costs with the ongoing costs of investing in other mutual funds. The example is based on an investment of $1,000 made at the beginning of the six-month period and held for the entire period from December 1, 2018, to May 31, 2019.
This example illustrates your Fund’s ongoing costs in two ways:
Actual Expenses
The second and third data columns in the table below provide information about actual account values and actual expenses. You may use the information in these columns, together with the amount you invested, to estimate the expenses that you paid during the six months ended May 31, 2019. Simply divide your account value by $1,000 (for example, an $8,600 account value divided by $1,000 = 8.6), then
multiply the result by the number under the heading entitled “Expenses Paid During Period” to estimate the expenses you paid on your account during this period.
Hypothetical Example for Comparison Purposes
The fourth and fifth data columns in the table below provide information about hypothetical account values and hypothetical expenses based on the Fund’s actual expense ratio and an assumed rate of return of 5% per year before expenses, which is not the Fund’s actual return. The hypothetical account values and expenses may not be used to estimate the actual ending account balances or expenses you paid for thesix-month period shown. You may use this information to compare the ongoing costs of investing in the Fund with the ongoing costs of investing in other mutual funds. To do so, compare this 5% hypothetical example with the 5% hypothetical examples that appear in the shareholder reports of the other Funds.
Please note that the expenses shown in the table are meant to highlight your ongoing costs only and do not reflect any transactional costs, such as exchange fees or sales charges (loads). Therefore, the fourth and fifth data columns of the table are useful in comparing ongoing costs only and will not help you determine the relative total costs of owning different funds. In addition, if these transactional costs were included, your costs would have been higher.
| | | | | | | | | | | | | | | | | | | | | | |
| | | | | | | | | | | | | | | | | | |
| Share Class | | Beginning
Account
Value
12/1/18 | | | Ending Account
Value (Based
on Actual
Returns and
Expenses)
5/31/19 | | | Expenses
Paid
During
Period1 | | | Ending Account
Value (Based
on Hypothetical
5% Annualized
Return and
Actual Expenses)
5/31/19 | | | Expenses
Paid
During
Period1 | | | Net Expense
Ratio
During
Period2 |
| | | | | | |
| Class A Shares | | $ | 1,000.00 | | | $ | 883.20 | | | $ | 6.81 | | | $ | 1,017.70 | | | $ | 7.29 | | | 1.45% |
| | | | | | |
| Investor Class Shares | | $ | 1,000.00 | | | $ | 884.90 | | | $ | 7.71 | | | $ | 1,016.75 | | | $ | 8.25 | | | 1.64% |
| | | | | | |
| Class C Shares | | $ | 1,000.00 | | | $ | 879.90 | | | $ | 11.20 | | | $ | 1,013.01 | | | $ | 11.99 | | | 2.39% |
| | | | | | |
| Class I Shares | | $ | 1,000.00 | | | $ | 885.90 | | | $ | 5.64 | | | $ | 1,018.95 | | | $ | 6.04 | | | 1.20% |
| 1. | Expenses are equal to the Fund’s annualized expense ratio of each class multiplied by the average account value over the period, divided by 365 and multiplied by 182 (to reflect the six-month period). The table above represents the actual expenses incurred during the six-month period. |
| 2. | Expenses are equal to the Fund’s annualized expense ratio to reflect the six-month period. |
Portfolio Composition as of May 31, 2019(1)(Unaudited)
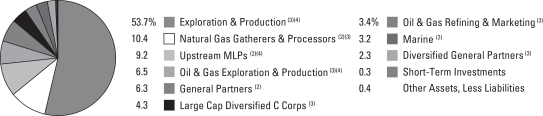
See Portfolio of Investments beginning on page 10 for specific holdings within these categories.
Top Ten Holdings as of May 31, 2019(excluding short-term investments) (Unaudited)
| 5. | DCP Midstream Partners, L.P. |
| 6. | Targa Resources Corporation |
| 9. | Viper Energy Partners, L.P. |
| 10. | Kimbell Royalty Partners, L.P. |
| (1) | Fund holdings and sector allocations are subject to change, and there is no assurance that the Fund will continue to hold any particular security. |
| (2) | MLPs and Related Companies |
| | |
| 8 | | MainStay Cushing Energy Income Fund |
Portfolio Management Discussion and Analysis(Unaudited)
Questions answered by portfolio managers Jerry V. Swank, Matthew A. Lemme, CFA, and Nick English of Cushing Asset Management, LP, the Fund’s Subadvisor.
How did MainStay Cushing Energy Income Fund perform relative to its benchmarks and peer group during the six months ended May 31, 2019?
For the six months ended May 31, 2019, Class I shares of MainStay Cushing Energy Income Fund returned –11.41%, underperforming the 0.74% return of the Fund’s primary benchmark, the S&P 500® Index. Over the same period, Class I shares underperformed the –9.59% return of the S&P 500® Energy Index, which is the Fund’s secondary benchmark, and outperformed the –13.03% return of the Morningstar Equity Energy Category Average.1
What factors affected the Fund’s relative performance during the reporting period?
During the reporting period, the Fund underperformed relative to its primary benchmark, the S&P 500® Index, largely due to adverse commodity price movements. While oil prices stood at similar levels at the beginning and end of the reporting period, they were very volatile in between, climbing as much as 30%, only to lose those gains by May 31, 2019. Conversely, prices for natural gas and natural gas liquids started the same period with strong gains but faded rapidly. In this challenging environment, the energy sector underperformed all other sectors within the Index.
During the reporting period, which subsectors were the strongest positive contributors to the Fund’s relative performance and which subsectors were particularly weak?
Due to the particularly weak returns generated by energy stocks during the reporting period, all the Fund’s subsectors detracted from performance relative to the S&P 500® Index. The subsectors providing the weakest relative performance were exploration & production, followed by midstream, and transportation.
During the reporting period, which individual stocks made the strongest positive contributions to the Fund’s absolute performance and which stocks detracted the most?
The holdings making the strongest contributions to the Fund’s absolute performance during the reporting period included Royal Dutch Shell PLC, BP PLC and ONEOK, Inc. (Contributions take weightings and total returns into account.)
The three largest detractors from absolute performance during the same period included a Legacy Reserves, L.P., bond, EOG Resources, Inc., stock, and a Sanchez Energy Corporation bond.
What were some of the Fund’s largest purchases and sales during the reporting period?
During the reporting period, the Fund initiated positions in exploration and production companies Diamondback Energy, Inc., ConocoPhillips, and Marathon Oil. Diamondback stock had been punished for a late 2018 acquisition of another public company, making it, in our opinion, an undervalued opportunity. The decline in energy stocks early in the reporting period also provided an opportunity to increase the quality of the Fund’s holdings, with Conoco and Marathon representing the largest positions initiated at that time.
The Fund reduced its exposure to natural gas producer Cabot Oil & Gas Corporation after natural gas prices spiked in late 2018 on colder than normal weather. The Fund also sold its position in Extraction Oil & Gas, Inc., a Colorado oil and gas producer that fared poorly after state-level regulations (driven by a change in political power) became more onerous. Lastly, the Fund reduced its position in integrated oil and gas company Suncor Energy, Inc., after the stock achieved its price objective.
How did the Fund’s subsector weightings change during the reporting period?
The Fund is invested almost exclusively in the energy sector. Weightings among the energy subsectors in which the Fund is invested changed slightly during the reporting period as it reduced exposure to midstream holdings and increased exploration & production exposure.
How was the Fund positioned at the end of the reporting period?
Within the energy sector, the Fund’s largest exposures at the end of the reporting period included the integrated oil, exploration and production, and natural gas transportation subsectors. The Fund’s smallest subsector exposures at the end of the reporting period were shipping and pipelines.
| 1. | See page 5 for other share class returns, which may be higher or lower than Class I share returns. See page 6 for more information on benchmark and peer group returns. |
The opinions expressed are those of the portfolio managers as of the date of this report and are subject to change. There is no guarantee that any forecasts will come to pass. This material does not constitute investment advice and is not intended as an endorsement of any specific investment.
Portfolio of InvestmentsMay 31, 2019 (Unaudited)
| | | | | | | | |
| | |
| | | Shares | | | Value | |
| Common Stocks 71.0%† | |
Diversified General Partners 2.3% | |
United States 2.3% | |
Marathon Oil Corporation | | | 50,000 | | | $ | 657,500 | |
| | | | | | | | |
| | |
Exploration & Production 50.4% | | | | | | | | |
Canada 11.0% | | | | | | | | |
Canadian Natural Resources Ltd. | | | 35,707 | | | | 963,732 | |
Encana Corporation | | | 140,000 | | | | 737,800 | |
Suncor Energy, Inc. | | | 27,733 | | | | 854,176 | |
Vermillion Energy, Inc. | | | 26,937 | | | | 564,600 | |
France 6.4% | |
Total S.A. | | | 35,358 | | | | 1,820,937 | |
United Kingdom 6.7% | |
BP PLC | | | 46,713 | | | | 1,902,153 | |
United States 26.3% | |
Cabot Oil & Gas Corporation | | | 27,480 | | | | 687,549 | |
Chevron Corporation | | | 18,000 | | | | 2,049,300 | |
EOG Resources, Inc. | | | 15,356 | | | | 1,257,349 | |
Equinor ASA | | | 40,000 | | | | 766,000 | |
Noble Energy, Inc. | | | 37,455 | | | | 801,537 | |
Parsley Energy, Inc. (a) | | | 53,649 | | | | 956,562 | |
Pioneer Natural Resource Company | | | 6,835 | | | | 970,297 | |
| | | | | | | | |
| | | | | | | 14,331,992 | |
| | | | | | | | |
Large Cap Diversified C Corps 4.3% | |
United States 4.3% | |
ONEOK, Inc. | | | 19,000 | | | | 1,208,780 | |
| | | | | | | | |
|
Natural Gas Gatherers & Processors 4.9% | |
United States 4.9% | |
Targa Resources Corporation | | | 36,082 | | | | 1,387,714 | |
| | | | | | | | |
|
Oil & Gas Exploration & Production 5.7% | |
United States 5.7% | |
ConocoPhillips Company | | | 12,000 | | | | 707,520 | |
Diamondback Energy, Inc. | | | 9,429 | | | | 924,608 | |
| | | | | | | | |
| | | | | | | 1,632,128 | |
| | | | | | | | |
Oil & Gas Refining & Marketing 3.4% | |
United States 3.4% | |
WPX Energy, Inc. (a) | | | 91,000 | | | | 979,160 | |
| | | | | | | | |
Total Common Stocks
(Cost $19,998,056) | | | | | | | 20,197,274 | |
| | | | | | | | |
|
| MLP Investments and Related Companies 23.6% | |
General Partners 6.3% | |
United States 6.3% | |
Energy Transfer, L.P. | | | 131,099 | | | | 1,801,300 | |
| | | | | | | | |
|
Marine 3.2% | |
Republic of the Marshall Islands 3.2% | |
GasLog Partners, L.P. | | | 43,698 | | | | 923,339 | |
| | | | | | | | |
| | | | | | | | |
| | |
| | | Shares | | | Value | |
Natural Gas Gatherers & Processors 5.5% | |
United States 5.5% | |
DCP Midstream Partners, L.P. | | | 51,000 | | | $ | 1,551,420 | |
| | | | | | | | |
|
Upstream MLPs 8.6% | |
United States 8.6% | |
Kimbell Royalty Partners, L.P. | | | 65,900 | | | | 1,114,369 | |
Mid-Con Energy Partners, L.P. (a)(b)(c) | | | 348,837 | | | | 177,558 | |
Viper Energy Partners, L.P. | | | 41,169 | | | | 1,152,732 | |
| | | | | | | | |
| | | | | | | 2,444,659 | |
| | | | | | | | |
Total MLP Investments and Related Companies
(Cost $7,470,408) | | | | | | | 6,720,718 | |
| | | | | | | | |
| | |
| | | | | | | | |
| | | Principal
Amount | | | | |
| Fixed Income 4.7% | |
Exploration & Production 3.3% | |
United States 3.3% | |
HighPoint Resources | | | | | | | | |
7.00%, 10/15/2022 | | $ | 500,000 | | | | 482,500 | |
QEP Resources, Inc. | | | | | | | | |
5.63%, 03/01/2026 | | | 500,000 | | | | 453,750 | |
| | | | | | | | |
| | | | | | | 936,250 | |
| | | | | | | | |
Oil & Gas Exploration & Production 0.8% | |
United States 0.8% | |
Sanchez Energy Corporation | | | | | | | | |
6.13%, 01/15/2023 | | | 2,000,000 | | | | 230,000 | |
| | | | | | | | |
|
Upstream MLPs 0.6% | |
United States 0.6% | |
Legacy Reserves, L.P. (c) | | | | | | | | |
6.63%, 12/01/2021 | | | 1,500,000 | | | | 168,750 | |
| | | | | | | | |
Total Fixed Income
(Cost $4,303,768) | | | | | | | 1,335,000 | |
| | | | | | | | |
| | |
| | | | | | | | |
| | |
| | | Shares | | | | |
| Short-Term Investments—Investment Companies 0.3% | |
United States 0.3% | |
First American Government Obligations Fund—Class X, 2.32% (d) | | | 43,812 | | | | 43,812 | |
First American Treasury Obligations Fund—Class Z, 2.31% (d) | | | 43,811 | | | | 43,811 | |
| | | | | | | | |
TotalShort-Term Investments—Investment Companies
(Cost $87,623) | | | | 87,623 | |
| | | | | | | | |
Total Investments
(Cost $31,859,855) | | | 99.6 | % | | | 28,340,615 | |
Other Assets, Less Liabilities | | | 0.4 | | | | 106,397 | |
Net Assets | | | 100.0 | % | | $ | 28,447,012 | |
| | | | |
| 10 | | MainStay Cushing Energy Income Fund | | The notes to the financial statements are an integral part of,
and should be read in conjunction with, the financial statements. |
| † | Calculated as a percentage of net assets applicable to common shareholders. |
| (a) | Non-income producing security. |
| (b) | Illiquid security—As of May 31, 2019, the total market value of securities deemed illiquid under procedures approved by the Board of Trustees was $177,558, which represented 0.6% of the Fund’s net assets. |
| (c) | Fair Value Security—represents fair value measured in good faith under procedures approved by the Board of Trustees. As of May 31, 2019, the total market value of these securities was $346,308, which represented 1.2% of the Fund’s net assets. |
| (d) | Current yield as of May 31, 2019. |
The following is a summary of the fair valuations according to the inputs used as of May 31, 2019, for valuing the Fund’s assets.
| | | | | | | | | | | | | | | | |
Description | | Quoted
Prices in
Active
Markets for
Identical
Assets
(Level 1) | | | Significant
Other
Observable
Inputs
(Level 2) | | | Significant
Unobservable
Inputs
(Level 3) | | | Total | |
| | | | |
Asset Valuation Inputs | | | | | | | | | | | | | | | | |
| Investments in Securities (a) | | | | | | | | | | | | | | | | |
Common Stocks | | $ | 20,197,274 | | | $ | — | | | $ | — | | | $ | 20,197,274 | |
MLP Investments and Related Companies (b) | | | 6,543,160 | | | | 177,558 | | | | — | | | | 6,720,718 | |
Fixed Income (c) | | | — | | | | 1,166,250 | | | | 168,750 | | | | 1,335,000 | |
Short-Term Investments—Investment Companies | | | 87,623 | | | | — | | | | — | | | | 87,623 | |
| | | | | | | | | | | | | | | | |
| Total Investments in Securities | | $ | 26,828,057 | | | $ | 1,343,808 | | | $ | 168,750 | | | $ | 28,340,615 | |
| | | | | | | | | | | | | | | | |
| (a) | For a complete listing of investments and their industries, see the Portfolio of Investments. |
| (b) | The Level 2 security valued at $177,558, is held in Upstream within the MLP Investments and Related Companies section of the Portfolio of Investments. |
| (c) | The Level 3 security valued at $168,750, is held in Upstream MLPs within the Fixed Income section of the Portfolio of Investments. |
The following is a reconciliation of investments in which significant unobservable inputs (Level 3) were used in determining value:
| | | | | | | | | | | | | | | | | | | | | | | | | | | | | | | | | | | | | | | | |
Investments in
Securities | | Balance
as of
December 1,
2018 | | | Accured
Discounts
(Premiums) | | | Realized
Gain/
(Loss) | | | Change in
Unrealized
Appreciation/
(Depreciation) | | | Purchases | | | Sales
Proceeds | | | Transfers
into
Level 3 | | | Transfers
out of
Level 3 | | | Balance
as of
May 31,
2019 | | | Change in
Unrealized
Appreciation/
(Depreciation)
from
Investments
Still Held as of
May 31,
2019 (a) | |
| Fixed Income | | | | | | | | | | | | | | | | | | | | | | | | | | | | | | | | | | | | | | | | |
Upstream MLPs | | $ | — | | | $ | — | | | $ | — | | | $ | (1,046,250 | ) | | $ | — | | | $ | — | | | $ | 1,215,000 | | | $ | — | | | $ | 168,750 | | | $ | — | |
| | | | | | | | | | | | | | | | | | | | | | | | | | | | | | | | | | | | | | | | |
| (a) | Included in “Net change in unrealized appreciation (depreciation) on investments” in the Statement of Operations. |
| | | | | | |
The notes to the financial statements are an integral part of,
and should be read in conjunction with, the financial statements. | | | | | 11 | |
Statement of Assets and Liabilitiesas of May 31, 2019 (Unaudited)
| | | | |
| Assets | |
Investments, at value
(identified cost $31,859,855) | | $ | 28,340,615 | |
Receivables: | | | | |
Dividends and interest | | | 329,849 | |
Fund shares sold | | | 1,010 | |
Prepaid expenses | | | 44,798 | |
| | | | |
Total assets | | | 28,716,272 | |
| | | | |
| |
| Liabilities | | | | |
Due to custodian | | | 152,831 | |
Payables: | | | | |
Professional fees | | | 39,200 | |
Transfer agent (See Note 3) | | | 23,987 | |
Fund shares redeemed | | | 20,771 | |
Shareholder communication | | | 12,714 | |
NYLIFE Distributors (See Note 3) | | | 10,453 | |
Manager fees (See Note 3) | | | 7,772 | |
Dividends payable | | | 687 | |
Custodian | | | 438 | |
Trustees | | | 407 | |
| | | | |
Total liabilities | | | 269,260 | |
| | | | |
Net assets | | $ | 28,447,012 | |
| | | | |
| |
| Composition of Net Assets | | | | |
Shares of beneficial interest outstanding (par value of $.001 per share) unlimited number of shares authorized | | $ | 8,437 | |
Additional paid-in capital | | | 269,526,027 | |
| | | | |
| | | 269,534,464 | |
Total distributable earnings (loss) | | | (241,087,452 | ) |
| | | | |
Net assets | | $ | 28,447,012 | |
| | | | |
| | | | |
Class A | | | | |
Net assets applicable to outstanding shares | | $ | 16,216,664 | |
| | | | |
Shares of beneficial interest outstanding | | | 4,764,639 | |
| | | | |
Net asset value per share outstanding | | $ | 3.40 | |
Maximum sales charge (5.50% of offering price) | | | 0.20 | |
| | | | |
Maximum offering price per share outstanding | | $ | 3.60 | |
| | | | |
Investor Class | | | | |
Net assets applicable to outstanding shares | | $ | 1,786,737 | |
| | | | |
Shares of beneficial interest outstanding | | | 527,279 | |
| | | | |
Net asset value per share outstanding | | $ | 3.39 | |
Maximum sales charge (5.50% of offering price) | | | 0.20 | |
| | | | |
Maximum offering price per share outstanding | | $ | 3.59 | |
| | | | |
Class C | | | | |
Net assets applicable to outstanding shares | | $ | 6,866,164 | |
| | | | |
Shares of beneficial interest outstanding | | | 2,107,720 | |
| | | | |
Net asset value per share outstanding | | $ | 3.26 | |
| | | | |
Class I | | | | |
Net assets applicable to outstanding shares | | $ | 3,577,447 | |
| | | | |
Shares of beneficial interest outstanding | | | 1,037,402 | |
| | | | |
Net asset value per share outstanding | | $ | 3.45 | |
| | | | |
| | | | |
| 12 | | MainStay Cushing Energy Income Fund | | The notes to the financial statements are an integral part of,
and should be read in conjunction with, the financial statements. |
Statement of Operationsfor the six months ended May 31, 2019 (Unaudited)
| | | | |
| Investment Income (Loss) | | | | |
Income | | | | |
Dividends and distributions
(Net of return of capital of $468,892) (a) | | $ | 235,712 | |
Interest | | | 307,162 | |
| | | | |
Total Income | | | 542,874 | |
| | | | |
Expenses | | | | |
Manager (See Note 3) | | | 160,745 | |
Distribution/Service—Class A (See Note 3) | | | 23,533 | |
Distribution/Service—Investor Class (See Note 3) | | | 2,432 | |
Distribution/Service—Class C (See Note 3) | | | 40,080 | |
Transfer agent (See Note 3) | | | 50,833 | |
Registration | | | 35,630 | |
Professional fees | | | 35,558 | |
Shareholder communication | | | 12,058 | |
Custodian | | | 1,218 | |
Trustees | | | 523 | |
Miscellaneous | | | 2,987 | |
| | | | |
Total expenses before waiver/reimbursement | | | 365,597 | |
Expense waiver/reimbursement from Manager (see Note 3) | | | (87,174 | ) |
| | | | |
Net expenses | | | 278,423 | |
| | | | |
Net investment income (loss) | | | 264,451 | |
| | | | |
|
| Realized and Unrealized Gain (Loss) on Investments | |
Net realized gain (loss) on: | | | | |
Investments | | | (45,727 | ) |
Foreign currency transactions | | | (456 | ) |
| | | | |
Net realized gain (loss) on investments | | | (46,183 | ) |
| | | | |
Net change in unrealized appreciation (depreciation) on investments | | | (4,029,875 | ) |
| | | | |
Net realized and unrealized gain (loss) on investments | | | (4,076,058 | ) |
| | | | |
Net increase (decrease) in net assets resulting from operations | | $ | (3,811,607 | ) |
| | | | |
| (a) | Dividends and distributions recorded net of foreign withholding taxes in the amount of $21,871. |
| | | | | | |
The notes to the financial statements are an integral part of,
and should be read in conjunction with, the financial statements. | | | | | 13 | |
Statements of Changes in Net Assets
| | | | | | | | |
| | | Six months
ended
May 31,
2019
(Unaudited) | | | Year ended
November 30,
2018 | |
| Increase (Decrease) in Net Assets | |
Operations: | | | | | | | | |
Net investment income (loss) | | $ | 264,451 | | | $ | 845,723 | |
Net realized gain (loss) on investments | | | (46,183 | ) | | | 978,408 | |
Net change in unrealized appreciation (depreciation) on investments | | | (4,029,875 | ) | | | (1,972,411 | ) |
| | | | |
Net increase (decrease) in net assets resulting from operations | | | (3,811,607 | ) | | | (148,280 | ) |
| | | | |
Distributions to shareholders: | | | | | | | | |
Class A | | | (124,187 | ) | | | (526,118 | ) |
Investor Class | | | (12,797 | ) | | | (49,926 | ) |
Class C | | | (46,202 | ) | | | (193,054 | ) |
Class I | | | (34,531 | ) | | | (137,018 | ) |
| | | | |
| | | (217,717 | ) | | | (906,116 | ) |
| | | | |
Distributions to shareholders from return of capital: | | | | | | | | |
Class A | | | (372,560 | ) | | | (768,622 | ) |
Investor Class | | | (38,391 | ) | | | (72,939 | ) |
Class C | | | (138,606 | ) | | | (282,039 | ) |
Class I | | | (103,595 | ) | | | (200,172 | ) |
| | | | |
| | | (653,152 | ) | | | (1,323,772 | ) |
| | | | |
Total distributions to shareholders | | | (870,869 | ) | | | (2,229,888 | ) |
| | | | |
Capital share transactions: | | | | | | | | |
Net proceeds from sale of shares | | | 6,505,495 | | | | 4,291,030 | |
Net asset value of shares issued to shareholders in reinvestment of dividends and distributions | | | 850,009 | | | | 2,168,873 | |
Cost of shares redeemed | | | (11,865,832 | ) | | | (23,360,410 | ) |
| | | | |
Increase (decrease) in net assets derived from capital share transactions | | | (4,510,328 | ) | | | (16,900,507 | ) |
| | | | |
Net increase (decrease) in net assets | | | (9,192,804 | ) | | | (19,278,675 | ) |
| | |
| Net Assets | | | | | | | | |
Beginning of period | | | 37,639,816 | | | | 56,918,491 | |
| | | | |
End of period | | $ | 28,447,012 | | | $ | 37,639,816 | |
| | | | |
| | | | |
| 14 | | MainStay Cushing Energy Income Fund | | The notes to the financial statements are an integral part of,
and should be read in conjunction with, the financial statements. |
Financial Highlightsselected per share data and ratios
| | | | | | | | | | | | | | | | | | | | | | | | |
| | |
| | | Six months
ended
May 31,
2019 | | | Year ended November 30, | |
| | | | | | |
| Class A | | (Unaudited) | | | 2018 | | | 2017 | | | 2016 | | | 2015 | | | 2014 | |
| | | | | | |
Net asset value at beginning of period | | $ | 3.94 | | | $ | 4.28 | | | $ | 4.61 | | | $ | 4.96 | | | $ | 12.99 | | | $ | 18.23 | |
| | | | | | | | | | | | | | | | | | | | | | | | |
| | | | | | |
Net investment income (loss) (a) | | | 0.03 | | | | 0.09 | | | | 0.07 | | | | 0.06 | | | | (0.02 | ) | | | (0.08 | ) |
| | | | | | |
Net realized and unrealized gain (loss) on investments | | | (0.47 | ) | | | (0.21 | ) | | | (0.20 | ) | | | (0.06 | ) | | | (7.21 | ) | | | (3.56 | ) |
| | | | | | | | | | | | | | | | | | | | | | | | |
| | | | | | |
Total from investment operations | | | (0.44 | ) | | | (0.12 | ) | | | (0.13 | ) | | | 0.00 | | | | (7.23 | ) | | | (3.64 | ) |
| | | | | | | | | | | | | | | | | | | | | | | | |
| | | | | | |
| Less distributions: | | | | | | | | | | | | | | | | | | | | | | | | |
| | | | | | |
From net investment income | | | (0.03 | ) | | | (0.09 | ) | | | — | | | | (0.02 | ) | | | — | | | | — | |
| | | | | | |
From return of capital | | | (0.07 | ) | | | (0.13 | ) | | | (0.20 | ) | | | (0.33 | ) | | | (0.80 | ) | | | (1.60 | ) |
| | | | | | | | | | | | | | | | | | | | | | | | |
| | | | | | |
Total dividends and distributions | | | (0.10 | ) | | | (0.22 | ) | | | (0.20 | ) | | | (0.35 | ) | | | (0.80 | ) | | | (1.60 | ) |
| | | | | | | | | | | | | | | | | | | | | | | | |
| | | | | | |
Redemption fees retained (a)(b) | | | — | | | | — | | | | — | | | | — | | | | — | | | | 0.00 | ‡ |
| | | | | | | | | | | | | | | | | | | | | | | | |
| | | | | | |
Net asset value at end of period | | $ | 3.40 | | | $ | 3.94 | | | $ | 4.28 | | | $ | 4.61 | | | $ | 4.96 | | | $ | 12.99 | |
| | | | | | | | | | | | | | | | | | | | | | | | |
| | | | | | |
Total investment return (c) | | | (11.68 | %) | | | (3.48 | %)(d) | | | (2.77 | %) | | | 2.17 | % | | | (57.56 | %) | | | (22.12 | %) |
| | | | | | |
| Ratios (to average net assets)/Supplemental Data: | | | | | | | | | | | | | | | | | | | | | | | | |
| | | | | | |
Net investment income (loss) (including net deferred income tax benefit (expense)) | | | 1.78 | % †† | | | 1.98 | % | | | 1.57 | % (e) | | | 1.39 | %(e)(f) | | | (0.24 | %)(e)(f) | | | 1.75 | % (f) |
| | | | | | |
Net investment income (loss) (excluding net deferred income tax benefit (expense)) | | | 1.78 | % †† | | | 1.98 | % | | | 1.56 | % (e) | | | 1.33 | %(e)(f) | | | (0.19 | %)(e)(f) | | | (0.53 | %)(f) |
| | | | | | |
Net expenses (including net deferred income tax (benefit) expense) (g) | | | 1.45 | % †† | | | 1.45 | % | | | 1.44 | % (e) | | | 1.47 | %(e)(f) | | | 1.79 | % (e)(f) | | | 3.02 | % (f) |
| | | | | | |
Expenses (before waiver/reimbursement, including net deferred income tax (benefit) expense) (g) | | | 1.97 | % †† | | | 1.69 | % | | | 1.65 | % (e) | | | 1.85 | %(e)(f) | | | 2.04 | % (e)(f) | | | 3.19 | % (f) |
| | | | | | |
Portfolio turnover rate | | | 24 | % | | | 32 | % | | | 51 | % | | | 64 | % | | | 95 | % | | | 27 | % |
| | | | | | |
Net assets at end of period (in 000’s) | | $ | 16,217 | | | $ | 21,450 | | | $ | 30,582 | | | $ | 42,712 | | | $ | 48,885 | | | $ | 136,037 | |
| ‡ | Less than one cent per share. |
| (a) | Per share data based on average shares outstanding during the period. |
| (b) | Redemption fees were only applicable prior to reorganization. (See Note 1) |
| (c) | Total investment return is calculated exclusive of sales charges and assumes the reinvestment of dividends and distributions. |
| | For periods of less than one year, total return is not annualized. |
| (d) | Total investment return may reflect adjustments to conform to generally accepted accounting principles. |
| (e) | Ratios including/excluding net deferred income tax benefit (expense) includes applicable franchise tax expense for the period. |
| | For the year ended November 30, 2017, the Fund received a franchise tax refund in the amount of $10,487, of which $5,634 is attributable to Class A. |
| | For the year ended November 30, 2016, the Fund accrued $55,919 in franchise tax benefit, of which $29,562 is attributable to Class A. |
| | For the year ended November 30, 2015, the Fund accrued $(109,516) in franchise tax expense, of which $(51,919) is attributable to Class A. |
| (f) | For the year ended November 30, 2016, the Fund accrued $13,006 in net current tax expense, of which $6,919 is attributable to Class A. |
| | For the year ended November 30, 2015, the Fund received a tax refund in the amount of $6,000, of which $2,773 is attributable to Class A. |
| | For the year ended November 30, 2014, the Fund accrued $65,316 in net current and deferred income tax benefit, of which $(978,230) is attributable to Class A. |
| (g) | The ratio of expenses excluding net current and deferred income tax benefit to average net assets before waiver was 1.97%, 1.69%, 1.66%, 1.91%, 1.98% and 1.97% for the period from December 1, 2018 to May 31, 2019 and fiscal years ended November 30, 2018, 2017, 2016, 2015 and 2014, respectively. The ratio of expenses excluding deferred income tax benefit to average net assets after waiver was 1.45%, 1.45%, 1.45%, 1.53%, 1.73% and 1.80% for the period from December 1, 2018 to May 31, 2019 and fiscal years ended November 30, 2018, 2017, 2016, 2015 and 2014, respectively. |
| | | | | | |
The notes to the financial statements are an integral part of,
and should be read in conjunction with, the financial statements. | | | | | 15 | |
Financial Highlightsselected per share data and ratios
| | | | | | | | | | | | | | | | | | | | | | | | |
| | | |
| | | Six months
ended
May 31,
2019 | | | Year ended November 30, | | | July 12,
2014**
through
November 30, | |
| | | | | | |
| Investor Class | | (Unaudited) | | | 2018 | | | 2017 | | | 2016 | | | 2015 | | | 2014 | |
| | | | | | |
Net asset value at beginning of period | | $ | 3.93 | | | $ | 4.26 | | | $ | 4.60 | | | $ | 4.95 | | | $ | 12.99 | | | $ | 19.15 | |
| | | | | | | | | | | | | | | | | | | | | | | | |
| | | | | | |
Net investment income (loss) (a) | | | 0.03 | | | | 0.08 | | | | 0.06 | | | | 0.05 | | | | (0.04 | ) | | | (0.02 | ) |
| | | | | | |
Net realized and unrealized gain (loss) on investments | | | (0.47 | ) | | | (0.20 | ) | | | (0.20 | ) | | | (0.05 | ) | | | (7.20 | ) | | | (5.34 | ) |
| | | | | | | | | | | | | | | | | | | | | | | | |
| | | | | | |
Total from investment operations | | | (0.44 | ) | | | (0.12 | ) | | | (0.14 | ) | | | 0.00 | | | | (7.24 | ) | | | (5.36 | ) |
| | | | | | | | | | | | | | | | | | | | | | | | |
| | | | | | |
| Less distributions: | | | | | | | | | | | | | | | | | | | | | | | | |
| | | | | | |
From net investment income | | | (0.02 | ) | | | (0.09 | ) | | | — | | | | (0.02 | ) | | | — | | | | — | |
| | | | | | |
From return of capital | | | (0.08 | ) | | | (0.12 | ) | | | (0.20 | ) | | | (0.33 | ) | | | (0.80 | ) | | | (0.80 | ) |
| | | | | | | | | | | | | | | | | | | | | | | | |
| | | | | | |
Total dividends and distributions | | | (0.10 | ) | | | (0.21 | ) | | | (0.20 | ) | | | (0.35 | ) | | | (0.80 | ) | | | (0.80 | ) |
| | | | | | | | | | | | | | | | | | | | | | | | |
| | | | | | |
Net asset value at end of period | | $ | 3.39 | | | $ | 3.93 | | | $ | 4.26 | | | $ | 4.60 | | | $ | 4.95 | | | $ | 12.99 | |
| | | | | | | | | | | | | | | | | | | | | | | | |
| | | | | | |
Total investment return (b) | | | (11.51 | %) | | | (3.38 | %) | | | (3.09 | %)(c) | | | 1.97 | %(c) | | | (57.56 | %)(c) | | | (28.99 | %)(c) |
| | | | | | |
| Ratios (to average net assets)/Supplemental Data: | | | | | | | | | | | | | | | | | | | | | | | | |
| | | | | | |
Net investment income (loss) (including net deferred income tax benefit (expense)) | | | 1.58 | % †† | | | 1.78 | % | | | 1.47 | % (d) | | | 1.25 | %(d)(e) | | | (0.48 | %)(d)(e) | | | 1.97 | % (e)†† |
| | | | | | |
Net investment income (loss) (excluding net deferred income tax benefit (expense)) | | | 1.58 | % †† | | | 1.78 | % | | | 1.46 | % (d) | | | 1.19 | %(d)(e) | | | (0.39 | %)(d)(e) | | | (0.20 | %)(e)†† |
| | | | | | |
Net expenses (including net deferred income tax (benefit) expense) (f) | | | 1.64 | % †† | | | 1.60 | % | | | 1.56 | % (d) | | | 1.58 | %(d)(e) | | | 1.91 | % (d)(e) | | | (0.55 | %)(e)†† |
| | | | | | |
Expenses (before waiver/reimbursement, including net deferred income tax (benefit) expense) (f) | | | 2.15 | % †† | | | 1.84 | % | | | 1.78 | % (d) | | | 1.93 | %(d)(e) | | | 2.24 | % (d)(e) | | | (0.45 | %)(e)†† |
| | | | | | |
Portfolio turnover rate | | | 24 | % | | | 32 | % | | | 51 | % | | | 64 | % | | | 95 | % | | | 27 | % |
| | | | | | |
Net assets at end of period (in 000’s) | | $ | 1,787 | | | $ | 2,058 | | | $ | 2,788 | | | $ | 3,513 | | | $ | 2,554 | | | $ | 908 | |
| (a) | Per share data based on average shares outstanding during the period. |
| (b) | Total investment return is calculated exclusive of sales charges and assumes the reinvestment of dividends and distributions. |
| | For periods of less than one year, total return is not annualized. |
| (c) | Total investment return may reflect adjustments to conform to generally accepted accounting principles. |
| (d) | Ratios including/excluding net deferred income tax benefit (expense) includes applicable franchise tax expense for the period. |
| | For the year ended November 30, 2017, the Fund received a franchise tax refund in the amount of $10,487, of which $514 is attributable to Investor Class. |
| | For the year ended November 30, 2016, the Fund accrued $55,919 in franchise tax benefit, of which $2,115 is attributable to Investor Class. |
| | For the year ended November 30, 2015, the Fund accrued $(109,516) in franchise tax expense, of which $(2,175) is attributable to Investor Class. |
| (e) | For the year ended November 30, 2016, the Fund accrued $13,006 in net current tax expense, of which $490 is attributable to Investor Class. |
| | For the year ended November 30, 2015, the Fund received a tax refund in the amount of $6,000, of which $70 is attributable to Investor Class. |
| | For the year ended November 30, 2014, the Fund accrued $65,316 in net current and deferred income tax benefit, of which $8,533 is attributable to Investor Class. |
| (f) | The ratio of expenses excluding net current and deferred income tax benefit to average net assets before waiver was 2.15%, 1.84%, 1.79%, 1.99%, 2.15% and 1.72% for the period from December 1, 2018 to May 31, 2019 and fiscal years ended November 30, 2018, 2017, 2016, 2015 and the period from July 12, 2014 to November 30, 2014, respectively. The ratio of expenses excluding deferred income tax benefit to average net assets after waiver was 1.64%, 1.60%, 1.57%, 1.64%, 1.82% and 1.62% for the period from December 1, 2018 to May 31, 2019 and fiscal years ended November 30, 2018, 2017, 2016, 2015 and the period from July 12, 2014 to November 30, 2014, respectively. |
| | | | |
| 16 | | MainStay Cushing Energy Income Fund | | The notes to the financial statements are an integral part of,
and should be read in conjunction with, the financial statements. |
Financial Highlightsselected per share data and ratios
| | | | | | | | | | | �� | | | | | | | | | | | | | |
| | |
| | | Six months
ended
May 31,
2019 | | | Year ended November 30, | |
| | | | | | |
| Class C | | (Unaudited) | | | 2018 | | | 2017 | | | 2016 | | | 2015 | | | 2014 | |
| | | | | | |
Net asset value at beginning of period | | $ | 3.78 | | | $ | 4.11 | | | $ | 4.44 | | | $ | 4.80 | | | $ | 12.74 | | | $ | 18.04 | |
| | | | | | | | | | | | | | | | | | | | | | | | |
| | | | | | |
Net investment income (loss) (a) | | | 0.02 | | | | 0.04 | | | | 0.03 | | | | 0.02 | | | | (0.08 | ) | | | (0.20 | ) |
| | | | | | |
Net realized and unrealized gain (loss) on investments | | | (0.46 | ) | | | (0.19 | ) | | | (0.19 | ) | | | (0.05 | ) | | | (7.06 | ) | | | (3.50 | ) |
| | | | | | | | | | | | | | | | | | | | | | | | |
| | | | | | |
Total from investment operations | | | (0.44 | ) | | | (0.15 | ) | | | (0.16 | ) | | | (0.03 | ) | | | (7.14 | ) | | | (3.70 | ) |
| | | | | | | | | | | | | | | | | | | | | | | | |
| | | | | | |
| Less distributions: | | | | | | | | | | | | | | | | | | | | | | | | |
| | | | | | |
From net investment income | | | (0.02 | ) | | | (0.07 | ) | | | — | | | | (0.02 | ) | | | — | | | | — | |
| | | | | | |
From return of capital | | | (0.06 | ) | | | (0.11 | ) | | | (0.17 | ) | | | (0.31 | ) | | | (0.80 | ) | | | (1.60 | ) |
| | | | | | | | | | | | | | | | | | | | | | | | |
| | | | | | |
Total dividends and distributions | | | (0.08 | ) | | | (0.18 | ) | | | (0.17 | ) | | | (0.33 | ) | | | (0.80 | ) | | | (1.60 | ) |
| | | | | | | | | | | | | | | | | | | | | | | | |
| | | | | | |
Redemption fees retained (a)(b) | | | — | | | | — | | | | — | | | | — | | | | — | | | | 0.00 | ‡ |
| | | | | | | | | | | | | | | | | | | | | | | | |
| | | | | | |
Net asset value at end of period | | $ | 3.26 | | | $ | 3.78 | | | $ | 4.11 | | | $ | 4.44 | | | $ | 4.80 | | | $ | 12.74 | |
| | | | | | | | | | | | | | | | | | | | | | | | |
| | | | | | |
Total investment return (c) | | | (12.01 | %) | | | (4.22 | %)(d) | | | (3.71 | %) | | | 1.29 | % | | | (57.93 | %) | | | (22.71 | %) |
| | | | | | |
| Ratios (to average net assets)/Supplemental Data: | | | | | | | | | | | | | | | | | | | | | | | | |
| | | | | | |
Net investment income (loss) (including net deferred income tax benefit (expense)) | | | 0.84 | % †† | | | 1.05 | % | | | 0.73 | % (e) | | | 0.53 | %(e)(f) | | | (1.04 | %)(e)(f) | | | (0.93 | %)(f) |
| | | | | | |
Net investment income (loss) (excluding net deferred income tax benefit (expense)) | | | 0.84 | % †† | | | 1.05 | % | | | 0.72 | % (e) | | | 0.47 | %(e)(f) | | | (0.98 | %)(e)(f) | | | (1.21 | %)(f) |
| | | | | | |
Net expenses (including net deferred income tax (benefit) expense) (g) | | | 2.39 | % †† | | | 2.35 | % | | | 2.31 | % (e) | | | 2.35 | %(e)(f) | | | 2.59 | % (e)(f) | | | 2.23 | % (f) |
| | | | | | |
Expenses (before waiver/reimbursement, including net deferred income tax (benefit) expense) (g) | | | 2.90 | % †† | | | 2.59 | % | | | 2.53 | % (e) | | | 2.73 | %(e)(f) | | | 2.85 | % (e)(f) | | | 2.38 | % (f) |
| | | | | | |
Portfolio turnover rate | | | 24 | % | | | 32 | % | | | 51 | % | | | 64 | % | | | 95 | % | | | 27 | % |
| | | | | | |
Net assets at end of period (in 000’s) | | $ | 6,866 | | | $ | 8,842 | | | $ | 12,644 | | | $ | 19,075 | | | $ | 25,053 | | | $ | 48,574 | |
| ‡ | Less than one cent per share. |
| (a) | Per share data based on average shares outstanding during the period. |
| (b) | Redemption fees were only applicable prior to reorganization. (See Note 1) |
| (c) | Total investment return is calculated exclusive of sales charges and assumes the reinvestment of dividends and distributions. |
| | For periods of less than one year, total return is not annualized. |
| (d) | Total investment return may reflect adjustments to conform to generally accepted accounting principles. |
| (e) | Ratios including/excluding net deferred income tax benefit (expense) includes applicable franchise tax expense for the period. |
| | For the year ended November 30, 2017, the Fund received a franchise tax refund in the amount of $10,487, of which $2,338 is attributable to Class C. |
| | For the year ended November 30, 2016, the Fund accrued $55,919 in franchise tax benefit, of which $13,411 is attributable to Class C. |
| | For the year ended November 30, 2015, the Fund accrued $(109,516) in franchise tax expense, of which $(26,603) is attributable to Class C. |
| (f) | For the year ended November 30, 2016, the Fund accrued $13,006 in net current tax expense, of which $3,142 is attributable to Class C. |
| | For the year ended November 30, 2015, the Fund received a tax refund in the amount of $6,000, of which $1,344 is attributable to Class C. |
| | For the year ended November 30, 2014, the Fund accrued $65,316 in net current and deferred income tax benefit, of which $62,248 is attributable to Class C. |
| (g) | The ratio of expenses excluding net current and deferred income tax benefit to average net assets before waiver was 2.90%, 2.59%, 2.54%, 2.79%, 2.79% and 2.66% for the period from December 1, 2018 to May 31, 2019 and fiscal years ended November 30, 2018, 2017, 2016, 2015 and 2014, respectively. The ratio of expenses excluding deferred income tax benefit to average net assets after waiver was 2.39%, 2.35%, 2.32%, 2.41%, 2.53% and 2.51% for the period from December 1, 2018 to May 31, 2019 and fiscal years ended November 30, 2018, 2017, 2016, 2015 and 2014, respectively. |
| | | | | | |
The notes to the financial statements are an integral part of,
and should be read in conjunction with, the financial statements. | | | | | 17 | |
Financial Highlightsselected per share data and ratios
| | | | | | | | | | | | | | | | | | | | | | | | |
| | |
| | | Six months
ended
May 31,
2019 | | | Year ended November 30, | |
| | | | | | |
| Class I | | (Unaudited) | | | 2018 | | | 2017 | | | 2016 | | | 2015 | | | 2014 | |
| | | | | | |
Net asset value at beginning of period | | $ | 3.99 | | | $ | 4.33 | | | $ | 4.67 | | | $ | 5.01 | | | $ | 13.08 | | | $ | 18.30 | |
| | | | | | | | | | | | | | | | | | | | | | | | |
| | | | | | |
Net investment income (loss) (a) | | | 0.04 | | | | 0.09 | | | | 0.09 | | | | 0.06 | | | | (0.00 | )‡ | | | (0.02 | ) |
| | | | | | |
Net realized and unrealized gain (loss) on investments | | | (0.48 | ) | | | (0.20 | ) | | | (0.22 | ) | | | (0.04 | ) | | | (7.27 | ) | | | (3.60 | ) |
| | | | | | | | | | | | | | | | | | | | | | | | |
| | | | | | |
Total from investment operations | | | (0.44 | ) | | | (0.11 | ) | | | (0.13 | ) | | | 0.02 | | | | (7.27 | ) | | | (3.62 | ) |
| | | | | | | | | | | | | | | | | | | | | | | | |
| | | | | | |
| Less distributions: | | | | | | | | | | | | | | | | | | | | | | | | |
| | | | | | |
From net investment income | | | (0.02 | ) | | | (0.09 | ) | | | — | | | | (0.02 | ) | | | — | | | | — | |
| | | | | | |
From return of capital | | | (0.08 | ) | | | (0.14 | ) | | | (0.21 | ) | | | (0.34 | ) | | | (0.80 | ) | | | (1.60 | ) |
| | | | | | | | | | | | | | | | | | | | | | | | |
| | | | | | |
Total dividends and distributions | | | (0.10 | ) | | | (0.23 | ) | | | (0.21 | ) | | | (0.36 | ) | | | (0.80 | ) | | | (1.60 | ) |
| | | | | | | | | | | | | | | | | | | | | | | | |
| | | | | | |
Net asset value at end of period | | $ | 3.45 | | | $ | 3.99 | | | $ | 4.33 | | | $ | 4.67 | | | $ | 5.01 | | | $ | 13.08 | |
| | | | | | | | | | | | | | | | | | | | | | | | |
| | | | | | |
Total investment return (b) | | | (11.41 | %) | | | (3.15 | %)(c) | | | (2.69 | %) | | | 2.54 | % | | | (57.47 | %) | | | (21.92 | %) |
| | | | | | |
| Ratios (to average net assets)/Supplemental Data: | | | | | | | | | | | | | | | | | | | | | | | | |
| | | | | | |
Net investment income (loss) (including net deferred income tax benefit (expense)) | | | 1.88 | % †† | | | 2.13 | % | | | 2.03 | % (d) | | | 1.53 | %(d)(e) | | | (0.03 | %)(d)(e) | | | 4.33 | % (e) |
| | | | | | |
Net investment income (loss) (excluding net deferred income tax benefit (expense)) | | | 1.88 | % †† | | | 2.13 | % | | | 2.02 | % (d) | | | 1.47 | %(d)(e) | | | 0.02 | % (d)(e) | | | (0.01 | %)(e) |
| | | | | | |
Net expenses (including net deferred income tax (benefit) expense) (f) | | | 1.20 | % †† | | | 1.20 | % | | | 1.19 | % (d) | | | 1.23 | %(d)(e) | | | 1.54 | % (d)(e) | | | (2.94 | %)(e) |
| | | | | | |
Expenses (before waiver/reimbursement, including net deferred income tax (benefit) expense) (f) | | | 1.72 | % †† | | | 1.44 | % | | | 1.41 | % (d) | | | 1.62 | %(d)(e) | | | 1.76 | % (d)(e) | | | (2.83 | %)(e) |
| | | | | | |
Portfolio turnover rate | | | 24 | % | | | 32 | % | | | 51 | % | | | 64 | % | | | 95 | % | | | 27 | % |
| | | | | | |
Net assets at end of period (in 000’s) | | $ | 3,577 | | | $ | 5,289 | | | $ | 10,904 | | | $ | 17,831 | | | $ | 26,161 | | | $ | 94,975 | |
| ‡ | Less than one cent per share. |
| (a) | Per share data based on average shares outstanding during the period. |
| (b) | Total investment return is calculated exclusive of sales charges and assumes the reinvestment of dividends and distributions. Class I shares are not subject to sales charges. For periods of less than one year, total return is not annualized. |
| (c) | Total investment return may reflect adjustment to conform to generally accepted accounting principles. |
| (d) | Ratios including/excluding net deferred income tax benefit (expense) includes applicable franchise tax expense for the period. |
| | For the year ended November 30, 2017, the Fund received a franchise tax refund in the amount of $10,487, of which $2,001 is attributable to Class I. |
| | For the year ended November 30, 2016, the Fund accrued $55,919 in franchise tax benefit, of which $10,831 is attributable to Class I. |
| | For the year ended November 30, 2015, the Fund accrued $(109,516) in franchise tax expense, of which $(28,819) is attributable to Class I. |
| (e) | For the year ended November 30, 2016, the Fund accrued $13,006 in net current tax expense, of which $2,455 is attributable to Class I. |
| | For the year ended November 30, 2015, the Fund received a tax refund in the amount of $6,000, of which $1,813 is attributable to Class I. |
| | For the year ended November 30, 2014, the Fund accrued $65,316 in net current and deferred income tax benefit, of which $972,765 is attributable to Class I. |
| (f) | The ratio of expenses excluding net current and deferred income tax benefit to average net assets before waiver was 1.72%, 1.44%, 1.42% 1.68%, 1.71% and 1.52% for the period from December 1, 2018 to May 31, 2019 and fiscal years ended November 30, 2018, 2017, 2016, 2015 and 2014, respectively. The ratio of expenses excluding deferred income tax benefit to average net assets after waiver was 1.20%, 1.20%, 1.20%, 1.29%, 1.48% and 1.41% for the period from December 1, 2018 to May 31, 2019 and fiscal years ended November 30, 2018, 2017, 2016, 2015 and 2014, respectively. |
| | | | |
| 18 | | MainStay Cushing Energy Income Fund | | The notes to the financial statements are an integral part of,
and should be read in conjunction with, the financial statements. |
MainStay Cushing MLP Premier Fund
Investment and Performance Comparison1(Unaudited)
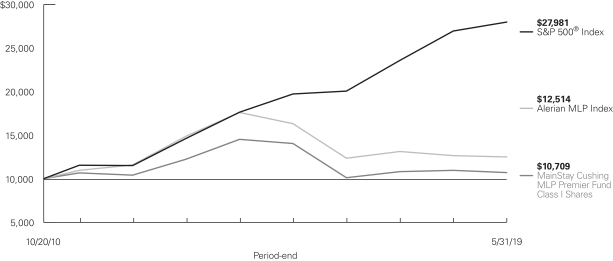
Performance data quoted represents past performance. Past performance is no guarantee of future results. Because of market volatility and other factors, current performance may be lower or higher than the figures shown. Investment return and principal value will fluctuate, and as a result, when shares are redeemed, they may be worth more or less than their original cost. The graph below depicts the historical performance of Class I shares of the Fund. Performance will vary from class to class based on differences in class-specific expenses and sales charges. For performance information current to the most recent month-end, please call800-624-6782 or visit nylinvestments.com/funds.
Average Annual Total Returns for the Period Ended May 31, 2019
| | | | | | | | | | | | | | | | | | | | | | | | | | | | |
| Class | | Sales Charge | | | | Inception
Date | | | Six
Months | | | One
Year | | | Five Years
or Since
Inception | | | Since
Inception | | | Gross
Expense
Ratio2 | |
| | | | | | | | |
| Class A Shares3 | | Maximum 5.5% Initial Sales Charge | | With sales charge Excluding sales charge | |
| 10/20/2010
|
| |
| –2.60
3.07 | %
| |
| –7.82
–2.45 | %
| |
| –7.19
–6.14 | %
| |
| –0.11
0.55 | %
| |
| 1.51
1.51 | %
|
| Investor Class Shares | | Maximum 5.5% Initial Sales Charge | | With sales charge Excluding sales charge | |
| 7/11/2014
|
| |
| –2.60
3.06 |
| |
| –7.82
–2.45 |
| |
| –7.18
–6.12 |
| |
| –7.18
–6.12 |
| |
| 1.53
1.53 |
|
| Class C Shares3 | | Maximum 1% CDSC if Redeemed Within One Year of Purchase | | With sales charge Excluding sales charge | |
| 10/20/2010
|
| |
| 1.77
2.74 |
| |
| –4.02
–3.16 |
| |
| –6.84
–6.84 |
| |
| –0.22
–0.22 |
| |
| 2.28
2.28 |
|
| Class I Shares3 | | No Sales Charge | | | | | 10/20/2010 | | | | 3.26 | | | | –2.21 | | | | –5.90 | | | | 0.80 | | | | 1.26 | |
| 1. | The performance table and graph do not reflect the deduction of taxes that a shareholder would pay on distributions or Fund share redemptions. Total returns reflect maximum applicable sales charges as indicated in the table above, if any, changes in share price, and reinvestment of dividend and capital gain distributions. The graph assumes the initial investment amount shown above and reflects the deduction of all sales charges that would have applied for the period of investment. Performance figures may reflect certain fee waivers and/or expense limitations, without which total returns may have been lower. For more information on share classes and current fee waivers and/or expense limitations (if any), please refer to the Notes to Financial Statements. |
| 2. | The gross expense ratios presented reflect the Fund’s “Total Annual Fund Operating Expenses” from the most recent Prospectus and may differ from other expense ratios disclosed in this report. |
| 3. | Performance figures for Class A shares, Class C shares and Class I shares reflect the historical performance of the then–existing Class A shares, Class C shares and Class I shares, respectively, of the Cushing® MLP Premier Fund (the predecessor to the Fund, which was subject to a different fee structure) for periods prior to July 12, 2014. The Cushing® MLP Premier Fund commenced operations on October 20, 2010. |
The footnotes on the next page are an integral part of the table and graph and should be carefully read in conjunction with them.
| | | | | | | | | | | | | | | | |
| Benchmark Performance | | Six
Months | | | One
Year | | | Five
Years | | | Since
Inception | |
Alerian MLP Index4 | | | 3.29 | % | | | –1.12 | % | | | –6.62 | % | | | 2.64 | % |
Alerian U.S. Midstream Energy Index5 | | | 5.33 | | | | 0.71 | | | | N/A | | | | N/A | |
| | | | |
S&P 500® Index6 | | | 0.74 | | | | 3.78 | | | | 9.66 | | | | 12.69 | |
Morningstar Energy Limited Partnership Category Average7 | | | 3.39 | | | | –3.28 | | | | –6.06 | | | | 1.67 | |
| 4. | Effective March 29, 2019, the Alerian MLP Index is the Fund’s primary benchmark. The Alerian MLP Index is an unmanaged, capped, float-adjusted, capitalization-weighted index and a leading gauge of energy MLPs. |
| 5. | Alerian U.S. Midstream Energy Index is the Fund’s secondary benchmark. The Alerian U.S. Midstream Energy Index is a broad-based composite of U.S. energy infrastructure companies. The capped, float-adjusted, capitalization-weighted index, is comprised of constituents who earn the majority of their cash flow from midstream activities involving energy commodities. The inception date for the Alerian U.S. Midstream Energy Index is June 25, 2018. Data prior to that date reflects the application of the then-current index methodology to each historical rebalancing date to select and weight index constituents. |
| 6. | Prior to March 29, 2019, the S&P 500® Index was the Fund’s primary benchmark. “S&P 500®” is a trademark of The McGraw-Hill Companies, Inc. The S&P 500® Index is widely regarded as the standard index for measuring large-cap U.S. stock market performance. Results assume reinvestment of all dividends and capital gains. An investment cannot be made directly in an index. |
| 7. | The Morningstar Energy Limited Partnership Category Average is representative of funds that invest primarily a significant amount of their portfolio in energy master limited partnerships. These include but are not limited to limited partnerships specializing in midstream operations in the energy industry. Results are based on average total returns of similar funds with all dividends and capital gain distributions reinvested. |
The footnotes on the preceding page are an integral part of the table and graph and should be carefully read in conjunction with them.
| | |
| 20 | | MainStay Cushing MLP Premier Fund |
Cost in Dollars of a $1,000 Investment in MainStay Cushing MLP Premier Fund (Unaudited)
The example below is intended to describe the fees and expenses borne by shareholders during the six-month period from December 1, 2018, to May 31, 2019, and the impact of those costs on your investment.
Example
As a shareholder of the Fund, you incur two types of costs: (1) transaction costs, including exchange fees and sales charges (loads) on purchases (as applicable), and (2) ongoing costs, including management fees, distribution and/or service (12b-1) fees, and other Fund expenses (as applicable). This example is intended to help you understand your ongoing costs (in dollars) of investing in the Fund and to compare these costs with the ongoing costs of investing in other mutual funds. The example is based on an investment of $1,000 made at the beginning of the six-month period and held for the entire period from December 1, 2018, to May 31, 2019.
This example illustrates your Fund’s ongoing costs in two ways:
Actual Expenses
The second and third data columns in the table below provide information about actual account values and actual expenses. You may use the information in these columns, together with the amount you invested, to estimate the expenses that you paid during the six months ended May 31, 2019. Simply divide your account value by $1,000 (for example, an $8,600 account value divided by $1,000 = 8.6), then
multiply the result by the number under the heading entitled “Expenses Paid During Period” to estimate the expenses you paid on your account during this period.
Hypothetical Example for Comparison Purposes
The fourth and fifth data columns in the table below provide information about hypothetical account values and hypothetical expenses based on the Fund’s actual expense ratio and an assumed rate of return of 5% per year before expenses, which is not the Fund’s actual return. The hypothetical account values and expenses may not be used to estimate the actual ending account balances or expenses you paid for thesix-month period shown. You may use this information to compare the ongoing costs of investing in the Fund with the ongoing costs of investing in other mutual funds. To do so, compare this 5% hypothetical example with the 5% hypothetical examples that appear in the shareholder reports of the other Funds.
Please note that the expenses shown in the table are meant to highlight your ongoing costs only and do not reflect any transactional costs, such as exchange fees or sales charges (loads). Therefore, the fourth and fifth data columns of the table are useful in comparing ongoing costs only and will not help you determine the relative total costs of owning different funds. In addition, if these transactional costs were included, your costs would have been higher.
| | | | | | | | | | | | | | | | | | | | | | |
| | | | | | | | | | | | | | | | | | |
| Share Class | | Beginning
Account
Value
12/1/18 | | | Ending Account
Value (Based
on Actual
Returns and
Expenses)
5/31/19 | | | Expenses
Paid
During
Period1 | | | Ending Account
Value (Based
on Hypothetical
5% Annualized
Return and
Actual Expenses)
5/31/19 | | | Expenses
Paid
During
Period1 | | | Net Expense
Ratio
During
Period2 |
| | | | | | |
| Class A Shares | | $ | 1,000.00 | | | $ | 1,030.70 | | | $ | 7.70 | | | $ | 1,017.35 | | | $ | 7.64 | | | 1.52% |
| | | | | | |
| Investor Class Shares | | $ | 1,000.00 | | | $ | 1,030.60 | | | $ | 7.75 | | | $ | 1,017.30 | | | $ | 7.70 | | | 1.53% |
| | | | | | |
| Class C Shares | | $ | 1,000.00 | | | $ | 1,027.40 | | | $ | 11.52 | | | $ | 1,013.56 | | | $ | 11.45 | | | 2.28% |
| | | | | | |
| Class I Shares | | $ | 1,000.00 | | | $ | 1,032.60 | | | $ | 6.44 | | | $ | 1,018.60 | | | $ | 6.39 | | | 1.27% |
| 1. | Expenses are equal to the Fund’s annualized expense ratio of each class multiplied by the average account value over the period, divided by 365 and multiplied by 182 (to reflect the six-month period). The table above represents the actual expenses incurred during the six-month period. |
| 2. | Expenses are equal to the Fund’s annualized expense ratio to reflect the six-month period. |
Portfolio Composition as of May 31, 2019(1)(Unaudited)
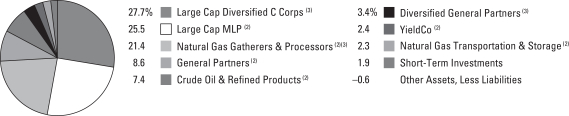
See Portfolio of Investments beginning on page 25 for specific holdings within these categories.
Top Ten Holdings as of May 31, 2019(excluding short-term investments) (Unaudited)
| 1. | Enterprise Products Partners, L.P. |
| 2. | Williams Companies, Inc. |
| 5. | Targa Resources Corporation |
| 6. | Plains All American Pipeline, L.P. |
| 8. | Magellan Midstream Partners, L.P. |
| 9. | Pembina Pipeline Corporation |
| (1) | Fund holdings and sector allocations are subject to change, and there is no assurance that the Fund will continue to hold any particular security. |
| (2) | MLPs and Related Companies |
| | |
| 22 | | MainStay Cushing MLP Premier Fund |
Portfolio Management Discussion and Analysis(Unaudited)
Questions answered by portfolio managers Jerry V. Swank and Kevin P. Gallagher, CFA, of Cushing Asset Management, LP, the Fund’s Subadvisor.
How did MainStay Cushing MLP Premier Fund perform relative to its benchmarks and peer group during the six months ended May 31, 2019?
For the six months ended May 31, 2019, Class I shares of MainStay Cushing MLP Premier Fund returned 3.26%, underperforming the 3.29% return of the Fund’s primary benchmark, the Alerian MLP Index. Class I shares underperformed the 5.33% return of the Alerian U.S. Midstream Energy Index, which is the Fund’s secondary benchmark, and underperformed the 3.39% return of the Morningstar Energy Limited Partnership Category Average. The Fund’s former primary benchmark, the S&P 500® Index, returned 0.74% during the same period.1
Were there any changes to the Fund during the reporting period?
Effective March 29, 2019, the Fund selected the Alerian MLP Index as its primary benchmark, replacing the S&P 500® Index. We believe that the Alerian MLP Index is more reflective of the Fund’s principal investment strategies. On the same date, the Fund selected the Alerian U.S. Midstream Energy Index as its secondary benchmark.
What factors affected the Fund’s relative performance during the reporting period?
Like the broader equity market, the midstream energy sector, as measured by the performance of the primary benchmark, the Alerian MLP Index, dipped sharply in December 2018 and then rebounded strongly in January 2019. After this recovery, the Alerian MLP Index remained relatively flat for the remainder of the reporting period, showing little sign of the structural, governance and regulatory setbacks experienced over the past several quarters. We believe that a simple lack of distractions allowed investors to refocus their attention on the sector’s many positive underlying fundamentals.
During the reporting period, the Fund’s relative performance generally mirrored that of the Alerian MLP Index. The Fund benefited from its holding oflarge-cap diversified C corporation holdings (which are not in the Alerian MLP Index), asC-corporation structured midstream companies appeared to remain the primary focus for “generalist” investors interested in allocating capital to the midstream sector. Conversely, the Fund’s holdings in the crude oil & refined products subsector underperformed the Alerian MLP Index, largely due to the Fund’s smaller relative weighting in Buckeye Partners, which was the subject of an announced acquisition during the reporting period for a 27.5% premium over the prior price of the company’s shares.
During the reporting period, which subsectors were the strongest positive contributors to the Fund’s relative performance and which subsectors were particularly weak?
The subsectors making the strongest positive contributions to the Fund’s performance relative to the Alerian MLP Index during the reporting period includedlarge-cap diversified C corporations and Canadian midstream companies. (Contributions take weightings and total returns into account.) The subsectors that made the weakest contributions to the Fund’s relative performance included crude oil & refined products and natural gas transportation & storage.
During the reporting period, which individual stocks made the strongest positive contributions to the Fund’s absolute performance and which stocks detracted the most?
The stocks that made the strongest positive contributions to the Fund’s absolute performance during the reporting period included Kinder Morgan, Inc., alarge-cap diversified C corporation, and Enterprise Products Partners, L.P., alarge-cap diversified MLP. Each company benefited from continued healthy business fundamentals driven by large integrated asset footprints, as well as simple financial structures with appealing metrics.
The two holdings that detracted most from the Fund’s absolute performance were natural gas gatherers and processors Targa Resources Corporation and Antero Midstream Partners, L.P. A weak price environment for natural gas and natural gas liquids negatively affected both holdings, while Targa also contended with low dividend coverage, high leverage and capital expenditure funding concerns.
What were some of the Fund’s largest purchases and sales during the reporting period?
The Fund significantly increased its holdings of Williams Companies, Inc. alarge-cap diversified C corporation that successfully conducted a variety of transactions resulting in improved leverage metrics. The Fund also established a new position inlarge-cap diversified C corporation Cheniere Energy, Inc., a leading operator of domestic liquefied natural gas export terminals. We believe that Cheniere, which had already established an impressive track record of generating long-term stable cash flows through contracting capacity, disclosed an attractive capital allocation plan.
| 1. | See page 19 for other share class returns, which may be higher or lower than Class I share returns. See page 20 for more information on benchmark and peer group returns. |
During the reporting period, the Fund reduced the size of its positions inlarge-cap diversified C corporations Kinder Morgan and Enbridge, Inc., to capture gains in both and, in the case of Enbridge, out of concern regarding regulatory and environmentally related resistance the company faced on certain key projects.
How did the Fund’s subsector weightings change during the reporting period?
During the reporting period, the Fund increased its exposure to thelarge-cap diversified MLP and crude oil & refined products subsectors. The Fund reduced its exposure to the coal andsmall-cap midstream subsectors.
How was the Fund positioned at the end of the reporting period?
As of May 31, 2019, the Fund held its most overweight subsector exposure relative to the Alerian MLP Index inlarge-cap diversified C corporations (because this subsector was not included in the Alerian MLP Index) and natural gas gatherers & processors. The Fund’s most underweight subsector exposures relative to the Index includedlarge-cap diversified MLPs and crude oil & refined products.
The opinions expressed are those of the portfolio managers as of the date of this report and are subject to change. There is no guarantee that any forecasts will come to pass. This material does not constitute investment advice and is not intended as an endorsement of any specific investment.
| | |
| 24 | | MainStay Cushing MLP Premier Fund |
Portfolio of InvestmentsMay 31, 2019 (Unaudited)
| | | | | | | | |
| | |
Shares | | | Value | |
| Common Stocks 41.8%† | |
Diversified General Partners 3.4% | |
Canada 3.4% | |
Enbridge, Inc. | | | 1,125,000 | | | $ | 41,478,750 | |
| | | | | | | | |
|
Large Cap Diversified C Corps 27.7% | |
Canada 4.2% | |
Pembina Pipeline Corporation | | | 1,435,000 | | | | 51,186,450 | |
United States 23.5% | |
Cheniere Energy Inc. (a) | | | 575,000 | | | | 36,328,500 | |
Kinder Morgan, Inc. | | | 2,515,000 | | | | 50,174,250 | |
ONEOK, Inc. | | | 1,502,876 | | | | 95,612,971 | |
Williams Companies, Inc. | | | 4,013,964 | | | | 105,888,370 | |
| | | | | | | | |
| | | | | | | 339,190,541 | |
| | | | | | | | |
Natrual Gas Gatherers & Processors 10.7% | |
United States 10.7% | |
Antero Midstream Corporation | | | 2,014,832 | | | | 24,621,247 | |
EnLink Midstream LLC | | | 2,946,955 | | | | 30,589,393 | |
Targa Resources Corporation | | | 1,979,975 | | | | 76,149,839 | |
| | | | | | | | |
| | | | | | | 131,360,479 | |
| | | | | | | | |
Total Common Stocks
(Cost $481,289,664) | | | | | | | 512,029,770 | |
| | | | | | | | |
|
| MLP Investments and Related Companies 56.9% | |
Crude Oil & Refined Products 7.4% | |
United States 7.4% | |
Genesis Energy, L.P. | | | 1,140,000 | | | | 24,874,800 | |
NuStar Energy, L.P. | | | 475,000 | | | | 12,806,000 | |
Phillips 66 Partners, L.P. | | | 302,978 | | | | 14,536,884 | |
Shell Midstream Partners, L.P. | | | 1,800,000 | | | | 37,854,000 | |
| | | | | | | | |
| | | | | | | 90,071,684 | |
| | | | | | | | |
General Partners 8.6% | |
United States 8.6% | |
Energy Transfer, L.P. | | | 7,675,352 | | | | 105,459,336 | |
| | | | | | | | |
|
Large Cap MLP 25.5% | |
United States 25.5% | |
Enterprise Products Partners, L.P. | | | 3,909,750 | | | | 109,042,928 | |
Magellan Midstream Partners, L.P. | | | 874,340 | | | | 53,771,910 | |
MPLX, L.P. | | | 2,393,126 | | | | 73,181,793 | |
Plains All American Pipeline, L.P. | | | 3,347,905 | | | | 75,696,132 | |
| | | | | | | | |
| | | | | | | 311,692,763 | |
| | | | | | | | |
Natural Gas Gatherers & Processors 10.7% | |
United States 10.7% | |
Crestwood Equity Partners, L.P. | | | 1,230,000 | | | | 43,701,900 | |
DCP Midstream Partners, L.P. | | | 1,320,123 | | | | 40,158,142 | |
Enable Midstream Partners, L.P. | | | 1,375,000 | | | | 17,861,250 | |
Western Midstream Partners, L.P. | | | 1,019,615 | | | | 29,762,562 | |
| | | | | | | | |
| | | | | | | 131,483,854 | |
| | | | | | | | |
| | | | | | | | |
| | |
Shares | | | Value | |
Natural Gas Transportation & Storage 2.3% | |
United States 2.3% | |
EQM Midstream Partners, L.P. | | | 662,500 | | | $ | 28,553,750 | |
| | | | | | | | |
|
YieldCo 2.4% | |
United States 2.4% | |
NextEra Energy Partners, L.P. | | | 650,000 | | | | 28,762,500 | |
| | | | | | | | |
Total MLP Investments and Related Companies (Cost $538,131,269) | | | | | | | 696,023,887 | |
| | | | | | | | |
|
| Short-Term Investments—Investment Companies 1.9% | |
United States 1.9% | |
First American Government Obligations Fund—Class X, 2.32% (b) | | | 11,875,347 | | | | 11,875,347 | |
First American Treasury Obligations Fund—Class X, 2.31% (b) | | | 11,875,346 | | | | 11,875,346 | |
| | | | | | | | |
TotalShort-Term Investments—Investment Companies (Cost $23,750,693) | | | | 23,750,693 | |
| | | | | | | | |
Total Investments
(Cost $1,043,171,626) | | | 100.6 | % | | | 1,231,804,350 | |
Other Assets, Less Liabilities | | | (0.6 | ) | | | (7,681,047 | ) |
Net Assets | | | 100.0 | % | | $ | 1,224,123,303 | |
| † | Calculated as a percentage of net assets applicable to common shareholders. |
| (a) | Non-income producing security. |
| (b) | Current yield as of May 31, 2019. |
| | | | | | |
The notes to the financial statements are an integral part of,
and should be read in conjunction with, the financial statements. | | | | | 25 | |
Portfolio of InvestmentsMay 31, 2019 (Unaudited) (continued)
The following is a summary of the fair valuations according to the inputs used as of May 31, 2019, for valuing the Fund’s assets.
| | | | | | | | | | | | | | | | |
Description | | Quoted
Prices in
Active
Markets for
Identical
Assets
(Level 1) | | | Significant
Other
Observable
Inputs
(Level 2) | | | Significant
Unobservable
Inputs
(Level 3) | | | Total | |
| | | | |
Asset Valuation Inputs | | | | | | | | | | | | | | | | |
| Investments in Securities (a) | | | | | | | | | | | | | | | | |
Common Stocks | | $ | 512,029,770 | | | $ | — | | | $ | — | | | $ | 512,029,770 | |
MLP Investments and Related Companies | | | 696,023,887 | | | | — | | | | — | | | | 696,023,887 | |
Short-Term Investments—Investment Companies | | | 23,750,693 | | | | — | | | | — | | | | 23,750,693 | |
| | | | | | | | | | | | | | | | |
| Total Investments in Securities | | $ | 1,231,804,350 | | | $ | — | | | $ | — | | | $ | 1,231,804,350 | |
| | | | | | | | | | | | | | | | |
| (a) | For a complete listing of investments and their industries, see the Portfolio of Investments. |
| | | | |
| 26 | | MainStay Cushing MLP Premier Fund | | The notes to the financial statements are an integral part of,
and should be read in conjunction with, the financial statements. |
Statement of Assets and Liabilitiesas of May 31, 2019 (Unaudited)
| | | | |
| Assets | | | | |
Investments, at value
(identified cost $1,043,171,626) | | $ | 1,231,804,350 | |
Receivables: | | | | |
Fund shares sold | | | 2,246,831 | |
Investments sold | | | 3,869,832 | |
Dividends and interest | | | 1,133,016 | |
Prepaid expenses | | | 81,401 | |
| | | | |
Total assets | | | 1,239,135,430 | |
| | | | |
| |
| Liabilities | | | | |
Payables: | | | | |
Investments purchased | | | 7,492,333 | |
Fund shares redeemed | | | 5,167,876 | |
Manager fees (See Note 3) | | | 1,197,424 | |
NYLIFE Distributors (See Note 3) | | | 387,356 | |
Transfer agent (See Note 3) | | | 272,094 | |
Distributions payable | | | 126,353 | |
Dividends payable | | | 124,510 | |
Professional fees | | | 49,793 | |
Shareholder communication | | | 49,531 | |
Trustees | | | 6,177 | |
Custodian | | | 4,307 | |
Franchise taxes | | | 121,211 | |
Accrued expenses | | | 13,162 | |
| | | | |
Total liabilities | | | 15,012,127 | |
| | | | |
Net assets | | $ | 1,224,123,303 | |
| | | | |
| |
| Composition of Net Assets | | | | |
Shares of beneficial interest outstanding (par value of $.001 per share) unlimited number of shares authorized | | $ | 118,970 | |
Additional paid-in capital | | | 1,557,493,980 | |
| | | | |
| | | 1,557,612,950 | |
Total distributable earnings (loss), net of income taxes | | | (333,489,647 | ) |
| | | | |
Net assets | | $ | 1,224,123,303 | |
| | | | |
| | | | |
Class A | | | | |
Net assets applicable to outstanding shares | | $ | 271,386,157 | |
| | | | |
Shares of beneficial interest outstanding | | | 25,919,064 | |
| | | | |
Net asset value per share outstanding | | $ | 10.47 | |
Maximum sales charge (5.50% of offering price) | | | 0.61 | |
| | | | |
Maximum offering price per share outstanding | | $ | 11.08 | |
| | | | |
Investor Class | | | | |
Net assets applicable to outstanding shares | | $ | 2,650,540 | |
| | | | |
Shares of beneficial interest outstanding | | | 252,897 | |
| | | | |
Net asset value per share outstanding | | $ | 10.48 | |
Maximum sales charge (5.50% of offering price) | | | 0.61 | |
| | | | |
Maximum offering price per share outstanding | | $ | 11.09 | |
| | | | |
Class C | | | | |
Net assets applicable to outstanding shares | | $ | 369,802,442 | |
| | | | |
Shares of beneficial interest outstanding | | | 39,110,687 | |
| | | | |
Net asset value per share outstanding | | $ | 9.46 | |
| | | | |
Class I | | | | |
Net assets applicable to outstanding shares | | $ | 580,284,164 | |
| | | | |
Shares of beneficial interest outstanding | | | 53,687,320 | |
| | | | |
Net asset value per share outstanding | | $ | 10.81 | |
| | | | |
| | | | | | |
The notes to the financial statements are an integral part of,
and should be read in conjunction with, the financial statements. | | | | | 27 | |
Statement of Operationsfor the six months ended May 31, 2019 (Unaudited)
| | | | |
| Investment Income (Loss) | | | | |
Income | | | | |
Dividends and distributions
(Net of return of capital of $33,305,229) (a) | | $ | 6,290,566 | |
Interest | | | 563,939 | |
| | | | |
Total income | | | 6,854,505 | |
| | | | |
Expenses | | | | |
Manager (See Note 3) | | | 7,051,260 | |
Distribution/Service—Class A (See Note 3) | | | 348,880 | |
Distribution/Service—Investor Class (See Note 3) | | | 3,340 | |
Distribution/Service—Class C (See Note 3) | | | 1,926,436 | |
Transfer agent (See Note 3) | | | 692,719 | |
Shareholder communication | | | 142,637 | |
Professional fees | | | 114,532 | |
Registration | | | 81,564 | |
Franchise tax | | | 72,985 | |
Trustees | | | 15,578 | |
Custodian | | | 8,052 | |
Insurance | | | 6,486 | |
Miscellaneous | | | 19,605 | |
| | | | |
Net expenses | | | 10,484,074 | |
| | | | |
Net investment income (loss) | | | (3,629,569 | ) |
| | | | |
|
| Realized and Unrealized Gain (Loss) on Investments | |
Net realized gain (loss) on: | | | | |
Investments, before income taxes | | | (2,764,134 | ) |
Foreign currency transactions | | | 2,402 | |
| | | | |
Net realized gain (loss) on investments | | | (2,761,732 | ) |
| | | | |
Net change in unrealized appreciation (depreciation) on investments | | | 40,339,397 | |
Net realized and unrealized gain (loss) on investments | | | 37,577,665 | |
| | | | |
Net increase (decrease) in net assets resulting from operations | | $ | 33,948,096 | |
| | | | |
| (a) | Dividends and distributions recorded net of foreign withholding taxes in the amount of $366,460. |
| | | | |
| 28 | | MainStay Cushing MLP Premier Fund | | The notes to the financial statements are an integral part of,
and should be read in conjunction with, the financial statements. |
Statements of Changes in Net Assets
| | | | | | | | |
| | | Six months
ended
May 31,
2019
(Unaudited) | | | Year ended
November 30,
2018 | |
| Increase (Decrease) in Net Assets | |
Operations: | | | | | | | | |
Net investment income (loss) | | $ | (3,629,569 | ) | | $ | (10,969,853 | ) |
Net realized gain (loss) on investments | | | (2,761,732 | ) | | | 29,903,906 | |
Net change in unrealized appreciation (depreciation) on investments | | | 40,339,397 | | | | (4,289,768 | ) |
| | | | |
Net increase (decrease) in net assets resulting from operations | | | 33,948,096 | | | | 14,644,285 | |
| | | | |
Distributions to shareholders from return of capital: | | | | | | | | |
Class A | | | (12,644,309 | ) | | | (32,785,520 | ) |
Investor Class | | | (120,687 | ) | | | (313,648 | ) |
Class C | | | (19,171,431 | ) | | | (54,327,132 | ) |
Class I | | | (26,739,781 | ) | | | (70,360,314 | ) |
| | | | |
Total distributions to shareholers | | | (58,676,208 | ) | | | (157,786,614 | ) |
| | | | |
Capital share transactions: | | | | | | | | |
Net proceeds from sale of shares | | | 236,487,772 | | | | 618,432,296 | |
Net asset value of shares issued to shareholders in reinvestment of dividends and distributions | | | 57,840,881 | | | | 155,830,208 | |
Cost of shares redeemed | | | (387,336,216 | ) | | | (538,599,614 | ) |
| | | | |
Increase (decrease) in net assets derived from capital share transactions | | | (93,007,563 | ) | | | 235,662,890 | |
| | | | |
Net increase (decrease) in net assets | | | (117,735,675 | ) | | | 92,520,561 | |
|
| Net Assets | |
Beginning of period | | | 1,341,858,978 | | | | 1,249,338,417 | |
| | | | |
End of period | | $ | 1,224,123,303 | | | $ | 1,341,858,978 | |
| | | | |
| | | | | | |
The notes to the financial statements are an integral part of,
and should be read in conjunction with, the financial statements. | | | | | 29 | |
Financial Highlightsselected per share data and ratios
| | | | | | | | | | | | | | | | | | | | | | | | | | | | |
| | | |
| | | Six months
ended
May 31,
2018 | | | | | | Year ended November 30, | |
| | | | | | | |
| Class A | | (Unaudited) | | | | | | 2018 | | | 2017 | | | 2016 | | | 2015 | | | 2014 | |
| | | | | | | |
Net asset value at beginning of period | | $ | 10.64 | | | | | | | $ | 11.71 | | | $ | 14.09 | | | $ | 14.47 | | | $ | 22.15 | | | $ | 21.36 | |
| | | | | | | | | | | | | | | | | | | | | | | | | | | | |
| | | | | | | |
Net investment income (loss) (a) | | | (0.02 | ) | | | | | | | (0.08 | ) | | | (0.17 | ) | | | (0.16 | ) | | | 0.03 | | | | (0.09 | ) |
| | | | | | | |
Net realized and unrealized gain (loss) on investments | | | 0.34 | | | | | | | | 0.35 | | | | (0.87 | ) | | | 1.23 | | | | (6.37 | ) | | | 2.21 | |
| | | | | | | | | | | | | | | | | | | | | | | | | | | | |
| | | | | | | |
Total from investment operations | | | 0.32 | | | | | | | | 0.27 | | | | (1.04 | ) | | | 1.07 | | | | (6.34 | ) | | | 2.12 | |
| | | | | | | | | | | | | | | | | | | | | | | | | | | | |
| | | | | | | |
| Less distributions: | | | | | | | | | | | | | | | | | | | | | | | | | | | | |
| | | | | | | |
From net investment income | | | — | | | | | | | | — | | | | — | | | | — | | | | — | | | | (0.59 | ) |
| | | | | | | |
From return of capital | | | (0.49 | ) | | | | | | | (1.34 | ) | | | (1.34 | ) | | | (1.45 | ) | | | (1.34 | ) | | | (0.75 | ) |
| | | | | | | | | | | | | | | | | | | | | | | | | | | | |
| | | | | | | |
Total dividends and distributions | | | (0.49 | ) | | | | | | | (1.34 | ) | | | (1.34 | ) | | | (1.45 | ) | | | (1.34 | ) | | | (1.34 | ) |
| | | | | | | | | | | | | | | | | | | | | | | | | | | | |
| | | | | | | |
Redemption fees retained (a)(b) | | | — | | | | | | | | — | | | | — | | | | — | | | | — | | | | 0.01 | |
| | | | | | | | | | | | | | | | | | | | | | | | | | | | |
| | | | | | | |
Net asset value at end of period | | $ | 10.47 | | | | | | | $ | 10.64 | | | $ | 11.71 | | | $ | 14.09 | | | $ | 14.47 | | | $ | 22.15 | |
| | | | | | | | | | | | | | | | | | | | | | | | | | | | |
| | | | | | | |
Total investment return (c) | | | 3.07 | % | | | | | | | 1.90 | % | | | (8.19 | %) | | | 8.75 | % | | | (29.92 | %) | | | 10.00 | % |
| | | | | | | |
| Ratios (to average net assets)/Supplemental Data: | | | | | | | | | | | | | | | | | | | | | | | | | | | | |
| | | | | | | |
Net investment income (loss) (including net deferred income tax benefit (expense)) | | | (0.46 | %)(d)†† | | | | | | | (0.67 | %)(d) | | | (1.21 | %)(d) | | | (1.21 | %)(d) | | | 8.32 | % (d)(e) | | | (6.46 | %)(e) |
| | | | | | | |
Net investment income (loss) (excluding net deferred income tax benefit (expense)) | | | (0.45 | %)(d)†† | | | | | | | (0.66 | %)(d) | | | (1.20 | %)(d) | | | (1.22 | %)(d) | | | (0.24 | %)(d)(e) | | | (0.97 | %)(e) |
| | | | | | | |
Net expenses (including net deferred income tax (benefit) expense) (f) | | | 1.53 | % (d)†† | | | | | | | 1.51 | % (d) | | | 1.51 | % (d) | | | 1.52 | % (d) | | | (7.07 | %)(d)(e) | | | 7.08 | % (e) |
| | | | | | | |
Expenses (before waiver/recoupment, including net deferred income tax (benefit) expense) (f) | | | 1.53 | % (d)†† | | | | | | | 1.51 | % (d) | | | 1.51 | % (d) | | | 1.52 | % (d) | | | (7.07 | %)(d)(e) | | | 7.03 | % (e) |
| | | | | | | |
Portfolio turnover rate | | | 37 | % | | | | | | | 50 | % | | | 29 | % | | | 52 | % | | | 32 | % | | | 21 | % |
| | | | | | | |
Net assets at end of period (in 000’s) | | $ | 271,386 | | | | | | | $ | 278,507 | | | $ | 264,449 | | | $ | 360,473 | | | $ | 317,903 | | | $ | 531,607 | |
| (a) | Per share data based on average shares outstanding during the period. |
| (b) | Redemption fees were only applicable prior to reorganization. (See Note 1) |
| (c) | Total investment return is calculated exclusive of sales charges and assumes the reinvestment of dividends and distributions. |
| | For periods of less than one year, total return is not anualized. |
| (d) | Ratios including/excluding net deferred income tax benefit (expense) includes applicable franchise tax expense for the period. |
| | For the period from December 1, 2018 to May 31, 2019, the Fund accrued $72,985 in franchise tax benefit, of which $15,903 is attributable to Class A. |
| | For the year ended November 30, 2018, the Fund accrued $(107,814) in franchise tax expense, of which $(22,756) is attributable to Class A. |
| | For the year ended November 30, 2017, the Fund accrued $(131,121) in franchise tax expense, of which $(29,083) is attributable to Class A. |
| | For the year ended November 30, 2016, the Fund accrued $43,881 in franchise tax benefit, of which $14,819 is attributable to Class A. |
| | For the year ended November 30, 2015, the Fund accrued $(517,762) in franchise tax expense, of which $(128,449) is attributable to Class A. |
| (e) | For the year ended November 30, 2015, the Fund accrued $154,807,419 in net deferred income tax benefit, of which $39,834,200 is attributable to Class A. |
| | For the year ended November 30, 2014, the Fund accrued $70,224,241 in net deferred income tax expense, of which $30,305,000 is attributable to Class A. |
| (f) | The ratio of expenses excluding net deferred income tax expense to average net assets before waiver and recoupment was 1.52%, 1.50%, 1.50%, 1.53%, 1.49% and 1.54% for the period from December 1, 2018 to May 31, 2019 and fiscal years ended November 30, 2018, 2017, 2016, 2015 and 2014, respectively. The ratio of expenses excluding net deferred income tax expense to average net assets after waiver and recoupment was 1.52%, 1.50%, 1.50%, 1.53%, 1.49% and 1.59% for the period from December 1, 2018 to May 31, 2019 and fiscal years ended November 30, 2018, 2017, 2016, 2015 and 2014, respectively. The Predecessor Fund recouped waived expenses for the period from December 1, 2013 through July 11, 2014. |
| | | | |
| 30 | | MainStay Cushing MLP Premier Fund | | The notes to the financial statements are an integral part of,
and should be read in conjunction with, the financial statements. |
Financial Highlightsselected per share data and ratios
| | | | | | | | | | | | | | | | | | | | | | | | | | | | |
| | | | |
| | | Six months
ended May 31,
2019 | | | | | | Year ended November 30, | | | July 12,
2014**
through
November 30, | |
| | | | | | | |
| Investor Class | | (Unaudited) | | | | | | 2018 | | | 2017 | | | 2016 | | | 2015 | | | 2014 | |
| | | | | | | |
Net asset value at beginning of period | | $ | 10.65 | | | | | | | $ | 11.71 | | | $ | 14.09 | | | $ | 14.47 | | | $ | 22.15 | | | $ | 24.02 | |
| | | | | | | | | | | | | | | | | | | | | | | | | | | | |
| | | | | | | |
Net investment income (loss) (a) | | | (0.02 | ) | | | | | | | (0.08 | ) | | | (0.17 | ) | | | (0.15 | ) | | | (0.00 | )‡ | | | (0.03 | ) |
| | | | | | | |
Net realized and unrealized gain (loss) on investments | | | 0.34 | | | | | | | | 0.36 | | | | (0.87 | ) | | | 1.22 | | | | (6.34 | ) | | | (1.17 | ) |
| | | | | | | | | | | | | | | | | | | | | | | | | | | | |
| | | | | | | |
Total from investment operations | | | 0.32 | | | | | | | | 0.28 | | | | (1.04 | ) | | | 1.07 | | | | (6.34 | ) | | | (1.20 | ) |
| | | | | | | | | | | | | | | | | | | | | | | | | | | | |
| | | | | | | |
| Less distributions: | | | | | | | | | | | | | | | | | | | | | | | | | | | | |
| | | | | | | |
From net investment income | | | — | | | | | | | | — | | | | — | | | | — | | | | — | | | | (0.29 | ) |
| | | | | | | |
From return of capital | | | (0.49 | ) | | | | | | | (1.34 | ) | | | (1.34 | ) | | | (1.45 | ) | | | (1.34 | ) | | | (0.38 | ) |
| | | | | | | | | | | | | | | | | | | | | | | | | | | | |
| | | | | | | |
Total dividends and distributions | | | (0.49 | ) | | | | | | | (1.34 | ) | | | (1.34 | ) | | | (1.45 | ) | | | (1.34 | ) | | | (0.67 | ) |
| | | | | | | | | | | | | | | | | | | | | | | | | | | | |
| | | | | | | |
Net asset value at end of period | | $ | 10.48 | | | | | | | $ | 10.65 | | | $ | 11.71 | | | $ | 14.09 | | | $ | 14.47 | | | $ | 22.15 | |
| | | | | | | | | | | | | | | | | | | | | | | | | | | | |
| | | | | | | |
Total investment return (b) | | | 3.06 | % | | | | | | | 1.99 | % | | | (8.19 | %) | | | 8.75 | % | | | (29.91 | %)(c) | | | (5.12 | %)(c) |
| | | | | | | |
| Ratios (to average net assets)/Supplemental Data: | | | | | | | | | | | | | | | | | | | | | | | | | | | | |
| | | | | | | |
Net investment income (loss) (including net deferred income tax benefit (expense)) | | | (0.46 | %)(d)†† | | | | | | | (0.71 | %)(d) | | | (1.22 | %)(d) | | | (1.16 | %)(d) | | | 8.17 | % (d)(e) | | | 2.79 | % (e)†† |
| | | | | | | |
Net investment income (loss) (excluding net deferred income tax benefit (expense)) | | | (0.45 | %)(d)†† | | | | | | | (0.70 | %)(d) | | | (1.21 | %)(d) | | | (1.16 | %)(d) | | | (0.38 | %)(d)(e) | | | (0.52 | %)(e)†† |
| | | | | | | |
Net expenses (including net deferred income tax (benefit) expense) (f) | | | 1.54 | % (d)†† | | | | | | | 1.53 | % (d) | | | 1.53 | % (d) | | | 1.55 | % (d) | | | (7.05 | %)(d)(e) | | | (1.80 | %)(e)†† |
| | | | | | | |
Expenses (before waiver, including net deferred income tax (benefit) expense) (f) | | | 1.54 | % (d)†† | | | | | | | 1.53 | % (d) | | | 1.53 | % (d) | | | 1.55 | % (d) | | | (7.05 | %)(d)(e) | | | (1.80 | %)(e)†† |
| | | | | | | |
Portfolio turnover rate | | | 37 | % | | | | | | | 50 | % | | | 29 | % | | | 52 | % | | | 32 | % | | | 21 | % |
| | | | | | | |
Net assets at end of period (in 000’s) | | $ | 2,651 | | | | | | | $ | 2,575 | | | $ | 2,616 | | | $ | 3,157 | | | $ | 2,631 | | | $ | 1,310 | |
| ‡ | Less than one cent per share. |
| (a) | Per share data based on average shares outstanding during the period. |
| (b) | Total investment return is calculated exclusive of sales charges and assumes the reinvestment of dividends and distributions. |
| | For periods of less than one year, total return is not annualized. |
| (c) | Total investment return may reflect adjustments to conform to generally accepted accounting principles. |
| (d) | Ratios including/excluding net deferred income tax benefit (expense) includes applicable franchise tax expense for the period. |
| | For the period from December 1, 2018 to May 31, 2019, the Fund accrued $72,985 in franchise tax benefit, of which $152 is attributable to Investor Class. |
| | For the year ended November 30, 2018, the Fund accrued $(107,814) in franchise tax expense, of which $(218) is attributable to Investor Class. |
| | For the year ended November 30, 2017, the Fund accrued $(131,121) in franchise tax expense, of which $(333) is attributable to Investor Class. |
| | For the year ended November 30, 2016, the Fund accrued $43,881 in franchise tax benefit, of which $50 is attributable to Investor Class. |
| | For the year ended November 30, 2015, the Fund accrued $(517,762) in franchise tax expense, of which $(830) is attributable to Investor Class. |
| (e) | For the year ended November 30, 2015, the Fund accrued $154,807,419 in net deferred income tax benefit, of which $202,049 is attributable to Investor Class. |
| | For the period from July 12, 2014 to November 30, 2014, the Fund accrued $70,224,241 in net deferred income tax expense, of which $17,830 of deferred income tax benefit is attributable to Investor Class. |
| (f) | The ratio of expenses excluding net deferred income tax expense to average net assets before waiver was 1.53%, 1.52%, 1.52%, 1.55%, 1.50% and 1.51%, for the period from December 1, 2018 to May 31, 2019 and fiscal years ended November 30, 2018, 2017, 2016, 2015 and the period from July 12, 2014 to November 30, 2014, respectively. The ratio of expenses excluding net deferred income tax expense to average net assets after waiver was 1.53%, 1.52%, 1.52%, 1.55%, 1.50% and 1.51% for the period from December 1, 2018 to May 31, 2019 and fiscal years ended November 30, 2018, 2017, 2016, 2015 and the period from July 12, 2014 to November 30, 2014, respectively. |
| | | | | | |
The notes to the financial statements are an integral part of,
and should be read in conjunction with, the financial statements. | | | | | 31 | |
Financial Highlightsselected per share data and ratios
| | | | | | | | | | | | | | | | | | | | | | | | | | | | |
| | | |
| | | Six months
ended
May 31, 2019 | | | | | | Year ended November 30, | |
| | | | | | | |
| Class C | | (Unaudited) | | | | | | 2018 | | | 2017 | | | 2016 | | | 2015 | | | 2014 | |
| | | | | | | |
Net asset value at beginning of period | | $ | 9.69 | | | | | | | $ | 10.86 | | | $ | 13.26 | | | $ | 13.81 | | | $ | 21.36 | | | $ | 20.79 | |
| | | | | | | | | | | | | | | | | | | | | | | | | | | | |
| | | | | | | |
Net investment income (loss) (a) | | | (0.06 | ) | | | | | | | (0.16 | ) | | | (0.25 | ) | | | (0.24 | ) | | | (0.12 | ) | | | (0.25 | ) |
| | | | | | | |
Net realized and unrealized gain (loss) on investments | | | 0.32 | | | | | | | | 0.33 | | | | (0.81 | ) | | | 1.14 | | | | (6.09 | ) | | | 2.16 | |
| | | | | | | | | | | | | | | | | | | | | | | | | | | | |
| | | | | | | |
Total from investment operations | | | 0.26 | | | | | | | | 0.17 | | | | (1.06 | ) | | | 0.90 | | | | (6.21 | ) | | | 1.91 | |
| | | | | | | | | | | | | | | | | | | | | | | | | | | | |
| | | | | | | |
| Less distributions: | | | | | | | | | | | | | | | | | | | | | | | | | | | | |
| | | | | | | |
From net investment income | | | — | | | | | | | | — | | | | — | | | | — | | | | — | | | | (0.59 | ) |
| | | | | | | |
From return of capital | | | (0.49 | ) | | | | | | | (1.34 | ) | | | (1.34 | ) | | | (1.45 | ) | | | (1.34 | ) | | | (0.75 | ) |
| | | | | | | | | | | | | | | | | | | | | | | | | | | | |
| | | | | | | |
Total dividends and distributions | | | (0.49 | ) | | | | | | | (1.34 | ) | | | (1.34 | ) | | | (1.45 | ) | | | (1.34 | ) | | | (1.34 | ) |
| | | | | | | | | | | | | | | | | | | | | | | | | | | | |
| | | | | | | |
Redemption fees retained (a)(b) | | | — | | | | | | | | — | | | | — | | | | — | | | | — | | | | 0.00 | ‡ |
| | | | | | | | | | | | | | | | | | | | | | | | | | | | |
| | | | | | | |
Net asset value at end of period | | $ | 9.46 | | | | | | | $ | 9.69 | | | $ | 10.86 | | | $ | 13.26 | | | $ | 13.81 | | | $ | 21.36 | |
| | | | | | | | | | | | | | | | | | | | | | | | | | | | |
| | | | | | | |
Total investment return (c) | | | 2.74 | % | | | | | | | 1.09 | % | | | (8.88 | %) | | | 7.89 | % | | | (30.43 | %) | | | 9.19 | % |
| | | | | | | |
| Ratios (to average net assets)/Supplemental Data: | | | | | | | | | | | | | | | | | | | | | | | | | | | | |
| | | | | | | |
Net investment income (loss) (including net deferred income tax benefit (expense)) | | | (1.22 | %)(d)†† | | | | | | | (1.45 | %)(d) | | | (1.99 | %)(d) | | | (1.95 | %)(d) | | | 7.56 | % (d)(e) | | | (5.80 | %)(e) |
| | | | | | | |
Net investment income (loss) (excluding net deferred income tax benefit (expense)) | | | (1.21 | %)(d)†† | | | | | | | (1.44 | %)(d) | | | (1.98 | %)(d) | | | (1.95 | %)(d) | | | (1.00 | %)(d)(e) | | | (1.68 | %)(e) |
| | | | | | | |
Net expenses (including net deferred income tax (benefit) expense) (f) | | | 2.29 | % (d)†† | | | | | | | 2.28 | % (d) | | | 2.28 | % (d) | | | 2.30 | % (d) | | | (6.32 | %)(d)(e) | | | 6.46 | % (e) |
| | | | | | | |
Expenses (before waiver/recoupment, including net deferred income tax (benefit) expense) (f) | | | 2.29 | % (d)†† | | | | | | | 2.28 | % (d) | | | 2.28 | % (d) | | | 2.30 | % (d) | | | (6.32 | %)(d)(e) | | | 6.41 | % (e) |
| | | | | | | |
Portfolio turnover rate | | | 37 | % | | | | | | | 50 | % | | | 29 | % | | | 52 | % | | | 32 | % | | | 21 | % |
| | | | | | | |
Net assets at end of period (in 000’s) | | $ | 369,802 | | | | | | | $ | 397,557 | | | $ | 445,524 | | | $ | 538,336 | | | $ | 553,892 | | | $ | 859,193 | |
| ‡ | Less than one cent per share. |
| (a) | Per share data based on average shares outstanding during the period. |
| (b) | Redemption fees were only applicable prior to reorganization. (See Note 1) |
| (c) | Total investment return is calculated exclusive of sales charges and assumes the reinvestment of dividends and distributions. |
| | For periods of less than one year, total return is not annualized. |
| (d) | Ratios including/excluding net deferred income tax benefit (expense) includes applicable franchise tax expense for the period. |
| | For the period from December 1, 2018 to May 31, 2019, the Fund accrued $72,985 in franchise tax benefit, of which $21,943 is attributable to Class C. |
| | For the year ended November 30, 2018, the Fund accrued $(107,814) in franchise tax expense, of which $(34,832) is attributable to Class C. |
| | For the year ended November 30, 2017, the Fund accrued $(131,121) in franchise tax expense, of which $(50,302) is attributable to Class C. |
| | For the year ended November 30, 2016, the Fund accrued $43,881 in franchise tax benefit, of which $14,231 is attributable to Class C. |
| | For the year ended November 30, 2015, the Fund accrued $(517,762) in franchise tax expense, of which $(220,745) is attributable to Class C. |
| (e) | For the year ended November 30, 2015, the Fund accrued $154,807,419 in net deferred income tax benefit, of which $66,219,265 is attributable to Class C. |
| | For the year ended November 30, 2014, the Fund accrued $70,224,241 in net deferred income tax expense, of which $31,069,447 is attributable to Class C. |
| (f) | The ratio of expenses excluding net deferred income tax expense to average net assets before waiver and recoupment was 2.28%, 2.27%, 2.27%, 2.30%, 2.24% and 2.29% for the period from December 1, 2018 to May 31, 2019 and fiscal years ended November 30, 2018, 2017, 2016, 2015 and 2014, respectively. The ratio of expenses excluding net deferred income tax expense to average net assets after waiver and recoupment was 2.28%, 2.27%, 2.27%, 2.30%, 2.24% and 2.34% for the period from December 1, 2018 to May 31, 2019 and fiscal years ended November 30, 2018, 2017, 2016, 2015 and 2014, respectively. The Predecessor Fund recouped waived expenses for the period from December 1, 2013 through July 11, 2014. |
| | | | |
| 32 | | MainStay Cushing MLP Premier Fund | | The notes to the financial statements are an integral part of,
and should be read in conjunction with, the financial statements. |
Financial Highlightsselected per share data and ratios
| | | | | | | | | | | | | | | | | | | | | | | | | | | | |
| | | |
| | | Six months
ended
May 31,
2019 | | | | | | Year ended November 30, | |
| | | | | | | |
| Class I | | (Unaudited) | | | | | | 2018 | | | 2017 | | | 2016 | | | 2015 | | | 2014 | |
| | | | | | | |
Net asset value at beginning of period | | $ | 10.95 | | | | | | | $ | 11.99 | | | $ | 14.36 | | | $ | 14.69 | | | $ | 22.40 | | | $ | 21.54 | |
| | | | | | | | | | | | | | | | | | | | | | | | | | | | |
| | | | | | | |
Net investment income (loss) (a) | | | (0.01 | ) | | | | | | | (0.05 | ) | | | (0.14 | ) | | | (0.12 | ) | | | 0.07 | | | | (0.03 | ) |
| | | | | | | |
Net realized and unrealized gain (loss) on investments | | | 0.36 | | | | | | | | 0.35 | | | | (0.89 | ) | | | 1.24 | | | | (6.44 | ) | | | 2.22 | |
| | | | | | | | | | | | | | | | | | | | | | | | | | | | |
| | | | | | | |
Total from investment operations | | | 0.35 | | | | | | | | 0.30 | | | | (1.03 | ) | | | 1.12 | | | | (6.37 | ) | | | 2.19 | |
| | | | | | | | | | | | | | | | | | | | | | | | | | | | |
| | | | | | | |
| Less distributions: | | | | | | | | | | | | | | | | | | | | | | | | | | | | |
| | | | | | | |
From net investment income | | | — | | | | | | | | — | | | | — | | | | — | | | | — | | | | (0.59 | ) |
| | | | | | | |
From return of capital | | | (0.49 | ) | | | | | | | (1.34 | ) | | | (1.34 | ) | | | (1.45 | ) | | | (1.34 | ) | | | (0.75 | ) |
| | | | | | | | | | | | | | | | | | | | | | | | | | | | |
| | | | | | | |
Total dividends and distributions | | | (0.49 | ) | | | | | | | (1.34 | ) | | | (1.34 | ) | | | (1.45 | ) | | | (1.34 | ) | | | (1.34 | ) |
| | | | | | | | | | | | | | | | | | | | | | | | | | | | |
| | | | | | | |
Redemption fees retained (a)(b) | | | — | | | | | | | | — | | | | — | | | | — | | | | — | | | | 0.01 | |
| | | | | | | | | | | | | | | | | | | | | | | | | | | | |
| | | | | | | |
Net asset value at end of period | | $ | 10.81 | | | | | | | $ | 10.95 | | | $ | 11.99 | | | $ | 14.36 | | | $ | 14.69 | | | $ | 22.40 | |
| | | | | | | | | | | | | | | | | | | | | | | | | | | | |
| | | | | | | |
Total investment return (c) | | | 3.26 | % | | | | | | | 2.12 | % | | | (7.95 | %) | | | 8.97 | % | | | (29.71 | %) | | | 10.25 | % |
| | | | | | | |
| Ratios (to average net assets)/Supplemental Data: | | | | | | | | | | | | | | | | | | | | | | | | | | | | |
| | | | | | | |
Net investment income (loss) (including net deferred income tax benefit (expense)) | | | (0.21 | %)(d)†† | | | | | | | (0.41 | %)(d) | | | (1.01 | %)(d) | | | (0.93 | %)(d) | | | 8.53 | % (d)(e) | | | (2.90 | %)(e) |
| | | | | | | |
Net investment income (loss) (excluding net deferred income tax benefit (expense)) | | | (0.19 | %)(d)†† | | | | | | | (0.40 | %)(d) | | | (1.00 | %)(d) | | | (0.93 | %)(d) | | | (0.02 | %)(d)(e) | | | (0.62 | %)(e) |
| | | | | | | |
Net expenses (including net deferred income tax (benefit) expense) (f) | | | 1.28 | % (d)†† | | | | | | | 1.26 | % (d) | | | 1.26 | % (d) | | | 1.28 | % (d) | | | (7.31 | %)(d)(e) | | | 3.61 | % (e) |
| | | | | | | |
Expenses (before waiver/recoupment, including net deferred income tax (benefit) expense) (f) | | | 1.28 | % (d)†† | | | | | | | 1.26 | % (d) | | | 1.26 | % (d) | | | 1.28 | % (d) | | | (7.31 | %)(d)(e) | | | 3.57 | % (e) |
| | | | | | | |
Portfolio turnover rate | | | 37 | % | | | | | | | 50 | % | | | 29 | % | | | 52 | % | | | 32 | % | | | 21 | % |
| | | | | | | |
Net assets at end of period (in 000’s) | | $ | 580,284 | | | | | | | $ | 663,220 | | | $ | 536,749 | | | $ | 481,819 | | | $ | 449,755 | | | $ | 579,546 | |
| (a) | Per share data based on average shares outstanding during the period. |
| (b) | Redemption fees were only applicable prior to reorganization. (See Note 1) |
| (c) | Total investment return is calculated exclusive of sales charges and assumes the reinvestment of dividends and distributions. Class I shares are not subject to sales charges. |
| | For periods of less than one year, total return is not annualized. |
| (d) | Ratios including/excluding net deferred income tax benefit (expense) includes applicable franchise tax expense for the period. |
| | For the period from December 1, 2018 to May 31, 2019, the Fund accrued $72,985 in franchise tax benefit, of which $34,987 is attributable to Class I. |
| | For the year ended November 30, 2018, the Fund accrued $(107,814) in franchise tax expenses, of which $(50,008) is attributable to Class I. |
| | For the year ended November 30, 2017, the Fund accrued $(131,121) in franchise tax expense, of which $(51,403) is attributable to Class I. |
| | For the year ended November 30, 2016, the Fund accrued $43,881 in franchise tax benefit, of which $14,781 is attributable to Class I. |
| | For the year ended November 30, 2015, the Fund accrued $(517,762) in franchise tax expense, of which $(167,738) is attributable to Class I. |
| (e) | For the year ended November 30, 2015, the Fund accrued $154,807,419 in net deferred income tax benefit, of which $48,551,905 is attributable to Class I. |
| | For the year ended November 30, 2014, the Fund accrued $70,224,241 in net deferred income tax expense, of which $8,867,624 is attributable to Class I. |
| (f) | The ratio of expenses excluding net deferred income tax expense to average net assets before waiver and recoupment was 1.27%, 1.25%, 1.25%, 1.28%, 1.24% and 1.29% for the period from December 1, 2018 to May 31, 2019 and the fiscal years ended November 30, 2018, 2017, 2016, 2015 and 2014, respectively. The ratio of expenses excluding net deferred income tax expense to average net assets after waiver and recoupment was 1.27%, 1.25%, 1.25%, 1.28%, 1.24% and 1.33% for the period from December 1, 2018 to May 31, 2019 and the fiscal years ended November 30, 2018, 2017, 2016, 2015 and 2014, respectively. The Predecessor Fund recouped waived expenses for the period from December 1, 2013 through July 11, 2014. |
| | | | | | |
The notes to the financial statements are an integral part of,
and should be read in conjunction with, the financial statements. | | | | | 33 | |
MainStay Cushing Renaissance Advantage Fund
Investment and Performance Comparison1(Unaudited)
Performance data quoted represents past performance. Past performance is no guarantee of future results. Because of market volatility and other factors, current performance may be lower or higher than the figures shown. Investment return and principal value will fluctuate, and as a result, when shares are redeemed, they may be worth more or less than their original cost. The graph below depicts the historical performance of Class I shares of the Fund. Performance will vary from class to class based on differences in class-specific expenses and sales charges. For performance information current to the most recent month-end, please call800-624-6782 or visit nylinvestments.com/funds.
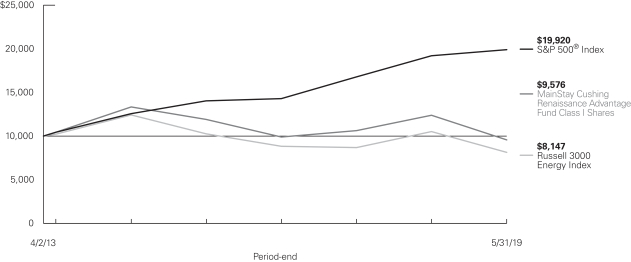
Average Annual Total Returns for the Period Ended May 31, 2019
| | | | | | | | | | | | | | | | | | | | | | | | | | | | |
| Class | | Sales Charge | | | | Inception
Date | | | Six
Months | | | One
Year | | | Five Years
or Since
Inception | | | Since
Inception | | | Gross
Expense
Ratio2 | |
| | | | | | | | |
| Class A Shares3 | | Maximum 5.5% Initial Sales Charge | | With sales charge Excluding sales charge | | | 4/2/2013 | | |
| –14.87
–9.91 | %
| |
| –27.13
–22.89 | %
| |
| –7.72
–6.67 | %
| |
| –1.83
–0.93 | %
| |
| 1.58
1.58 | %
|
| Investor Class Shares | | Maximum 5.5% Initial Sales Charge | | With sales charge Excluding sales charge | | | 7/11/2014 | | |
| –14.92
–9.96 |
| |
| –27.23
–22.99 |
| |
| –7.81
–6.76 |
| |
| –7.81
–6.76 |
| |
| 1.70
1.70 |
|
| Class C Shares3 | | Maximum 1% CDSC if Redeemed Within One Year of Purchase | | With sales charge Excluding sales charge | | | 4/2/2013 | | |
| –11.25
–10.37 |
| |
| –24.35
–23.61 |
| |
| –7.49
–7.49 |
| |
| –1.75
–1.75 |
| |
| 2.45
2.45 |
|
| Class I Shares3 | | No Sales Charge | | | | | 4/2/2013 | | | | –9.83 | | | | –22.73 | | | | –6.43 | | | | –0.70 | | | | 1.33 | |
| 1. | The performance table and graph do not reflect the deduction of taxes that a shareholder would pay on distributions or Fund share redemptions. Total returns reflect maximum applicable sales charges as indicated in the table above, if any, changes in share price, and reinvestment of dividend and capital gain distributions. The graph assumes the initial investment amount shown above and reflects the deduction of all sales charges that would have applied for the period of investment. Performance figures may reflect certain fee waivers and/or expense limitations, without which total returns may have been lower. For more information on share classes and current fee waivers and/or expense limitations (if any), please refer to the Notes to Financial Statements. |
| 2. | The gross expense ratios presented reflect the Fund’s “Total Annual Fund Operating Expenses” from the most recent Prospectus and may differ from other expense ratios disclosed in this report. |
| 3. | Performance figures for Class A shares, Class C shares and Class I shares reflect the historical performance of the then-existing Class A shares, Class C shares and Class I shares, respectively, of the Cushing® Renaissance Advantage Fund (the predecessor to the Fund, which was subject to a different fee structure) for periods prior to July 12, 2014. The Cushing® Renaissance Advantage Fund commenced operations on April 2, 2013. |
The footnotes on the next page are an integral part of the table and graph and should be carefully read in conjunction with them.
| | |
| 34 | | MainStay Cushing Renaissance Advantage Fund |
| | | | | | | | | | | | | | | | |
| Benchmark Performance | | Six
Months | | | One
Year | | | Five
Years | | | Since
Inception | |
| | | | |
S&P 500® Index4 | | | 0.74 | % | | | 3.78 | % | | | 9.66 | % | | | 11.83 | % |
Russell 3000 Energy Index5 | | | –10.69 | | | | –22.44 | | | | –8.09 | | | | –3.27 | |
Morningstar Natural Resources Category Average6 | | | –5.71 | | | | –16.66 | | | | –3.63 | | | | –2.44 | |
| 4. | The S&P 500® Index is the Fund’s primary benchmark. “S&P 500®” is a trademark of The McGraw-Hill Companies, Inc. The S&P 500® Index is widely regarded as the standard index for measuring large-cap U.S. stock market performance. Results assume reinvestment of all dividends and capital gains. An investment cannot be made directly in an index. |
| 5. | The Russell 3000 Energy Index is the Fund’s secondary benchmark. The Russell 3000 Energy Index represents the energy sector of the Russell 3000 Index, an index that measures the performance of the largest 3,000 U.S. companies representing approximately 98% of the investable U.S. equity market. |
| 6. | The Morningstar Natural Resources Category Average is representative of funds that invest primarily on Commodity-based industries such as energy, chemicals, minerals, and forest products in the United States or outside of the United States. Some portfolios invest across this spectrum to offer broad natural-resources exposure. Others concentrate heavily or even exclusively in specific industries. Portfolios that concentrate primarily in energy-related industries are part of the equity energy category. Results are based on average total returns of similar funds with all dividends and capital gain distributions reinvested. |
The footnotes on the preceding page are an integral part of the table and graph and should be carefully read in conjunction with them.
Cost in Dollars of a $1,000 Investment in MainStay Cushing Renaissance Advantage Fund (Unaudited)
The example below is intended to describe the fees and expenses borne by shareholders during thesix-month period from December 1, 2018, to May 31, 2019, and the impact of those costs on your investment.
Example
As a shareholder of the Fund, you incur two types of costs: (1) transaction costs, including exchange fees and sales charges (loads) on purchases (as applicable), and (2) ongoing costs, including management fees, distribution and/or service(12b-1) fees, and other Fund expenses (as applicable). This example is intended to help you understand your ongoing costs (in dollars) of investing in the Fund and to compare these costs with the ongoing costs of investing in other mutual funds. The example is based on an investment of $1,000 made at the beginning of thesix-month period and held for the entire period from December 1, 2018, to May 31, 2019.
This example illustrates your Fund’s ongoing costs in two ways:
Actual Expenses
The second and third data columns in the table below provide information about actual account values and actual expenses. You may use the information in these columns, together with the amount you invested, to estimate the expenses that you paid during the six months ended May 31, 2019. Simply divide your account value by $1,000 (for example, an $8,600 account value divided by $1,000 = 8.6), then
multiply the result by the number under the heading entitled “Expenses Paid During Period” to estimate the expenses you paid on your account during this period.
Hypothetical Example for Comparison Purposes
The fourth and fifth data columns in the table below provide information about hypothetical account values and hypothetical expenses based on the Fund’s actual expense ratio and an assumed rate of return of 5% per year before expenses, which is not the Fund’s actual return. The hypothetical account values and expenses may not be used to estimate the actual ending account balances or expenses you paid forthe six-month period shown. You may use this information to compare the ongoing costs of investing in the Fund with the ongoing costs of investing in other mutual funds. To do so, compare this 5% hypothetical example with the 5% hypothetical examples that appear in the shareholder reports of the other Funds.
Please note that the expenses shown in the table are meant to highlight your ongoing costs only and do not reflect any transactional costs, such as exchange fees or sales charges (loads). Therefore, the fourth and fifth data columns of the table are useful in comparing ongoing costs only and will not help you determine the relative total costs of owning different funds. In addition, if these transactional costs were included, your costs would have been higher.
| | | | | | | | | | | | | | | | | | | | | | |
| | | | | | | | | | | | | | | | | | |
| Share Class | | Beginning
Account Value
12/1/18 | | | Ending Account Value (Based
on Actual
Returns and
Expenses)
5/31/19 | | | Expenses
Paid During
Period1 | | | Ending Account
Value (Based
on Hypothetical
5% Annualized
Return and
Actual Expenses)
5/31/19 | | | Expenses
Paid During
Period1 | | | Net Expense
Ratio
During
Period2 |
| | | | | | |
| Class A Shares | | $ | 1,000.00 | | | $ | 900.90 | | | $ | 7.63 | | | $ | 1,016.90 | | | $ | 8.10 | | | 1.61% |
| | | | | | |
| Investor Class Shares | | $ | 1,000.00 | | | $ | 900.40 | | | $ | 8.48 | | | $ | 1,016.01 | | | $ | 9.00 | | | 1.79% |
| | | | | | |
| Class C Shares | | $ | 1,000.00 | | | $ | 896.30 | | | $ | 12.01 | | | $ | 1,012.27 | | | $ | 12.74 | | | 2.54% |
| | | | | | |
| Class I Shares | | $ | 1,000.00 | | | $ | 901.70 | | | $ | 6.45 | | | $ | 1,018.15 | | | $ | 6.84 | | | 1.36% |
| 1. | Expenses are equal to the Fund’s annualized expense ratio of each class multiplied by the average account value over the period, divided by 365 and multiplied by 182 (to reflect thesix-month period). The table above represents the actual expenses incurred during thesix-month period. |
| 2. | Expenses are equal to the Fund’s annualized expense ratio to reflect thesix-month period. |
| | |
| 36 | | MainStay Cushing Renaissance Advantage Fund |
Portfolio Composition as of May 31, 2019(1)(Unaudited)
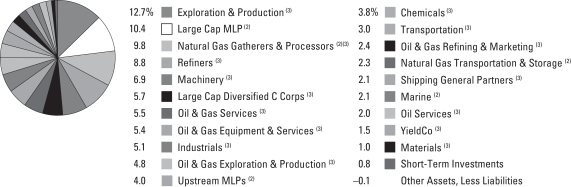
See Portfolio of Investments beginning on page 39 for specific holdings within these categories.
Top Ten Holdings as of May 31, 2019(excluding short-term investments)(Unaudited)
| 2. | Targa Resources Corporation |
| 4. | DCP Midstream Partners, L.P. |
| 5. | Viper Energy Partners, L.P. |
| 6. | Valero Energy Corporation |
| 7. | Diamondback Energy, Inc. |
| 8. | New Fortress Energy LLC |
| 9. | Plains All American Pipeline, L.P. |
| 10. | Jacobs Engineering Group, Inc. |
| (1) | Fund holdings and sector allocations are subject to change, and there is no assurance that the Fund will continue to hold any particular security. |
| (2) | MLPs and Related Companies |
Portfolio Management Discussion and Analysis(Unaudited)
Questions answered by portfolio managers Jerry V. Swank, Matthew A. Lemme, CFA, and Saket Kumar of Cushing Asset Management, LP, the Fund’s Subadvisor.
How did MainStay Cushing Renaissance Advantage Fund perform relative to its benchmarks and peer group during the six months ended May 31, 2019?
For the six months ended May 31, 2019, Class I shares of MainStay Cushing Renaissance Advantage Fund returned –9.83%, underperforming the 0.74% return of the Fund’s primary benchmark, the S&P 500® Index. Over the same period, Class I shares outperformed the –10.69% return of the Russell 3000® Energy Index, which is the Fund’s secondary benchmark, and underperformed the –5.71% return of the Morningstar Natural Resources Category Average.1
What factors affected the Fund’s relative performance during the reporting period?
During the reporting period, the Fund underperformed relative to its primary benchmark, the S&P 500® Index, because the Fund’s investment strategy focuses on companies in the energy, industrial and manufacturing sectors. By comparison, the Index tracks the performance of stocks in a wide variety of sectors. The energy sector components of the Index declined –9.59% for the reporting period, compared to the Index’s overall 0.74% gain for the same period.
During the reporting period, which subsectors were the strongest positive contributors to the Fund’s relative performance and which subsectors were particularly weak?
The subsectors making the largest positive contributions to the Fund’s performance relative to the S&P 500® Index included midstream, materials and utilities. (Contributions take weightings and total returns into account.) The most significant laggards included the exploration & production, oil services, and transportation subsectors.
During the reporting period, which individual stocks made the strongest positive contributions to the Fund’s absolute performance and which stocks detracted the most?
Holdings in liquefied natural gas (LNG) producer Tellurian, Inc., provided the strongest positive contribution to the Fund’s absolute performance when the company rallied on the commercial progress of their proposed export facility in Louisiana. Railroad Union Pacific Corporation made a similarly positive contribution to the Fund’s absolute performance after the company hired new personnel and revamped its business plan to improve margins.
The most substantial detractor from the Fund’s absolute performance was transportation and shipping logistics provider
XPO Logistics, Inc., which suffered after twice guiding earnings estimates lower because of declining demand, especially in Europe. Additionally, shares of refiner Marathon Petroleum declined in response to shrinking margins and concerns about global crude oil demand.
What were some of the Fund’s largest purchases and sales during the reporting period?
The Fund’s largest purchase during the reporting period was shares of midstream oil and gas producer Viper Energy Partners, L.P., reflecting our view that the company’s stock was undervalued relative to oil prices in early 2019. The Fund also acquired shares in LNG importer New Fortress Energy, which, in our opinion, occupied a unique market position to profit from declining LNG prices.
The Fund’s largest sales during the reporting period included exits from XPO Logistics and Union Pacific. The Fund sold its XPO holdings in response to the company’s lack of execution and sold its position in Union Pacific to capitalize on the stock’s strong gains.
How did the Fund’s subsector weightings change during the reporting period?
The Fund’s largest subsector increases occurred in the midstream and exploration & production subsectors based on our belief that valuations within these subsectors did not accurately reflect improving commodity prices. The Fund sought to purchase companies with good balance sheets in both subsectors.
The Fund’s most substantial subsector decreases during the reporting period occurred in industrials and transportation. In response to strong performance early in 2019, along with management commentary during the same period that indicated slowing growth prospects, the Fund reduced its holdings in these subsectors.
How was the Fund positioned at the end of the reporting period?
As of May 31, 2019, we saw signs that near-term growth prospects for companies within the Fund’s universe were slowing, but we believed growth rates were likely to remain positive through the remainder of 2019. Considering these conditions, we viewed the recent selloff in energy stocks as a good opportunity for the Fund to buy shares in companies with strong balance sheets and growth prospects at discounted prices. We continued to believe the Fund’s focus on companies with strong balance sheets and growth prospects was a prudent strategy in the prevailing choppy market environment.
| 1. | See page 34 for other share class returns, which may be higher or lower than Class I share returns. See page 35 for more information on benchmark and peer group returns. |
The opinions expressed are those of the portfolio managers as of the date of this report and are subject to change. There is no guarantee that any forecasts will come to pass. This material does not constitute investment advice and is not intended as an endorsement of any specific investment.
| | |
| 38 | | MainStay Cushing Renaissance Advantage Fund |
Portfolio of InvestmentsMay 31, 2019 (Unaudited)
| | | | | | | | |
| | |
| | | Shares | | | Value | |
| | | | | | | | |
| Common Stocks 76.1%† | |
Chemicals 3.8% | |
Netherlands 1.5% | |
LyondellBasell Industries NV | | | 11,602 | | | $ | 861,448 | |
United States 2.3% | |
Dow, Inc. | | | 20,194 | | | | 944,272 | |
Westlake Chemical Corporation | | | 7,959 | | | | 455,971 | |
| | | | | | | | |
| | | | | | | 2,261,691 | |
| | | | | | | | |
Exploration & Production 12.7% | |
Canada 1.9% | |
Encana Corporation | | | 208,511 | | | | 1,098,853 | |
United States 10.8% | |
Concho Resources, Inc. | | | 11,873 | | | | 1,163,673 | |
Matador Resource Company (a) | | | 43,874 | | | | 721,289 | |
Occidental Petroleum Corporation | | | 12,722 | | | | 633,174 | |
Parsley Energy, Inc. (a) | | | 72,733 | | | | 1,296,829 | |
Pioneer Natural Resource Company | | | 8,598 | | | | 1,220,572 | |
Rosehill Resources, Inc. (a) | | | 180,470 | | | | 557,652 | |
Tellurian, Inc. (a) | | | 100,088 | | | | 769,677 | |
| | | | | | | | |
| | | | | | | 7,461,719 | |
| | | | | | | | |
Industrials 5.1% | |
Ireland 1.3% | |
Eaton Corporation PLC | | | 10,621 | | | | 791,158 | |
United States 3.8% | |
Jacobs Engineering Group, Inc. | | | 20,104 | | | | 1,513,630 | |
United Rentals, Inc. (a) | | | 6,445 | | | | 709,595 | |
| | | | | | | | |
| | | | | | | 3,014,383 | |
| | | | | | | | |
Large Cap Diversified C Corps 5.7% | |
Canada 1.3% | |
Pembina Pipeline Corporation | | | 21,183 | | | | 755,598 | |
United States 4.4% | |
Cheniere Energy, Inc. (a) | | | 41,447 | | | | 2,618,621 | |
| | | | | | | | |
| | | | | | | 3,374,219 | |
| | | | | | | | |
Machinery 6.9% | |
United States 6.9% | |
Cactus, Inc. (a) | | | 30,000 | | | | 976,500 | |
Oshkosh Corporation | | | 17,377 | | | | 1,237,069 | |
Wabtec Corporation | | | 17,625 | | | | 1,099,447 | |
Xylem, Inc. | | | 10,000 | | | | 742,200 | |
| | | | | | | | |
| | | | | | | 4,055,216 | |
| | | | | | | | |
Materials 1.0% | |
United States 1.0% | |
Allegheny Technologies, Inc. (a) | | | 27,978 | | | | 599,009 | |
| | | | | | | | |
|
Natrual Gas Gatherers & Processors 5.4% | |
United States 5.4% | |
EnLink Midstream LLC | | | 39,856 | | | | 413,705 | |
Targa Resources Corporation | | | 72,080 | | | | 2,772,197 | |
| | | | | | | | |
| | | | | | | 3,185,902 | |
| | | | | | | | |
| | | | | | | | |
| | |
| | | Shares | | | Value | |
| | | | | | | | |
Oil & Gas Equipment & Services 5.4% | |
Panama 0.9% | |
McDermott International, Inc. (a) | | | 83,514 | | | $ | 504,425 | |
United States 4.5% | |
Apergy Corporation (a) | | | 40,435 | | | | 1,253,889 | |
FTS International, Inc. (a) | | | 57,151 | | | | 351,479 | |
Select Energy Services, Inc. (a) | | | 65,417 | | | | 699,962 | |
U.S. Well Services, Inc. (a) | | | 50,719 | | | | 362,387 | |
| | | | | | | | |
| | | | | | | 3,172,142 | |
| | | | | | | | |
Oil & Gas Exploration & Production 4.8% | |
United States 4.8% | |
Cimarex Energy Company | | | 11,725 | | | | 670,553 | |
Diamondback Energy, Inc. | | | 22,162 | | | | 2,173,205 | |
| | | | | | | | |
| | | | | | | 2,843,758 | |
| | | | | | | | |
Oil & Gas Refining & Marketing 2.4% | |
United States 2.4% | |
WPX Energy, Inc. (a) | | | 132,229 | | | | 1,422,784 | |
| | | | | | | | |
|
Oil & Gas Services 5.5% | |
Netherlands Antilles 1.1% | |
Schlumberger Limited | | | 19,135 | | | | 663,793 | |
United States 4.4% | |
New Fortress Energy LLC (a) | | | 176,834 | | | | 1,923,954 | |
Patterson Utilities Energy, Inc. | | | 60,335 | | | | 641,361 | |
| | | | | | | | |
| | | | | | | 3,229,108 | |
| | | | | | | | |
Oil Services 2.0% | |
United States 2.0% | |
Halliburton Company | | | 55,954 | | | | 1,191,261 | |
| | | | | | | | |
|
Refiners 8.8% | |
United States 8.8% | |
HollyFrontier Corporation | | | 18,912 | | | | 718,278 | |
Marathon Petroleum Corporation | | | 29,638 | | | | 1,363,052 | |
Phillips 66 | | | 11,702 | | | | 945,521 | |
Valero Energy Corporation | | | 31,078 | | | | 2,187,891 | |
| | | | | | | | |
| | | | | | | 5,214,742 | |
| | | | | | | | |
Shipping General Partners 2.1% | |
Bermuda 2.1% | |
Golar LNG Ltd. | | | 69,228 | | | | 1,259,257 | |
| | | | | | | | |
|
Transportation 3.0% | |
United States 3.0% | |
Kirby Corporation (a) | | | 6,000 | | | | 464,280 | |
Southwest Airlines Company | | | 27,652 | | | | 1,316,235 | |
| | | | | | | | |
| | | | | | | 1,780,515 | |
| | | | | | | | |
YieldCo 1.5% | |
United States 1.5% | |
Clearway Energy, Inc. | | | 59,327 | | | | 889,905 | |
| | | | | | | | |
Total Common Stocks
(Cost $50,491,824) | | | | | | | 44,955,611 | |
| | | | | | | | |
| | | | | | |
The notes to the financial statements are an integral part of,
and should be read in conjunction with, the financial statements. | | | | | 39 | |
Portfolio of InvestmentsMay 31, 2019 (Unaudited) (continued)
| | | | | | | | |
| | |
| | | Shares | | | Value | |
| | | | | | | | |
| MLP Investments and Related Companies 23.2% | |
Large Cap MLP 10.4% | |
United States 10.4% | |
Energy Transfer, L.P. | | | 212,877 | | | $ | 2,924,930 | |
Enterprise Products Partners, L.P. | | | 48,258 | | | | 1,345,916 | |
Plains All American Pipeline, L.P. | | | 82,377 | | | | 1,862,544 | |
| | | | | | | | |
| | | | | | | 6,133,390 | |
| | | | | | | | |
Marine 2.1% | |
Republic of the Marshall Islands 2.1% | |
GasLog Partners, L.P. | | | 57,051 | | | | 1,205,488 | |
| | | | | | | | |
|
Natural Gas Gatherers & Processors 4.4% | |
United States 4.4% | |
DCP Midstream Partners, L.P. | | | 86,060 | | | | 2,617,945 | |
| | | | | | | | |
|
Natural Gas Transportation & Storage 2.3% | |
United States 2.3% | |
EQM Midstream Partners, L.P. | | | 17,045 | | | | 734,639 | |
Tallgrass Energy, L.P. | | | 26,924 | | | | 640,522 | |
| | | | | | | | |
| | | | | | | 1,375,161 | |
| | | | | | | | |
Upstream MLPs 4.0% | |
United States 4.0% | |
Viper Energy Partners, L.P. | | | 83,704 | | | | 2,343,712 | |
| | | | | | | | |
Total MLP Investments and Related Companies (Cost $13,897,113) | | | | | | | 13,675,696 | |
| | | | | | | | |
| | | | | | | | |
| | |
| | | Shares | | | Value | |
| Short-Term Investments—Investment Companies 0.8% | |
United States 0.8% | |
First American Government Obligations Fund—Class X, 2.32% (b) | | | 232,958 | | | $ | 232,958 | |
First American Treasury Obligations Fund—Class X, 2.31% (b) | | | 232,958 | | | | 232,958 | |
| | | | | | | | |
TotalShort-Term Investments—Investment Companies (Cost $465,916) | | | | 465,916 | |
| | | | | | | | |
Total Investments
(Cost $64,854,853) | | | 100.1 | % | | | 59,097,223 | |
Other Assets, Less Liabilities | | | (0.1 | ) | | | (37,828 | ) |
Net Assets | | | 100.0 | % | | $ | 59,059,395 | |
| † | Calculated as a percentage of net assets applicable to common shareholders. |
| (a) | Non-income producing security. |
| (b) | Current yield as of May 31, 2019. |
The following is a summary of the fair valuations according to the inputs used as of May 31, 2019, for valuing the Fund’s assets.
| | | | | | | | | | | | | | | | |
Description | | Quoted
Prices in
Active
Markets for
Identical
Assets
(Level 1) | | | Significant
Other
Observable
Inputs
(Level 2) | | | Significant
Unobservable
Inputs
(Level 3) | | | Total | |
| | | | |
Asset Valuation Inputs | | | | | | | | | | | | | | | | |
| Investments in Securities (a) | | | | | | | | | | | | | | | | |
Common Stocks | | $ | 44,955,611 | | | $ | — | | | $ | — | | | $ | 44,955,611 | |
MLP Investments and Related Companies | | | 13,675,696 | | | | — | | | | — | | | | 13,675,696 | |
Short-Term Investments—Investment Companies | | | 465,916 | | | | — | | | | — | | | | 465,916 | |
| | | | | | | | | | | | | | | | |
| Total Investments in Securities | | $ | 59,097,223 | | | $ | — | | | $ | — | | | $ | 59,097,223 | |
| | | | | | | | | | | | | | | | |
| (a) | For a complete listing of investments and their industries, see the Portfolio of Investments. |
| | | | |
| 40 | | MainStay Cushing Renaissance Advantage Fund | | The notes to the financial statements are an integral part of,
and should be read in conjunction with, the financial statements. |
Statement of Assets and Liabilitiesas of May 31, 2019 (Unaudited)
| | | | |
| Assets | | | | |
Investments, at value (identified cost $64,854,853) | | $ | 59,097,223 | |
Receivables: | | | | |
Dividends and interest | | | 115,456 | |
Fund shares sold | | | 1,409 | |
Prepaid expenses | | | 18,937 | |
| | | | |
Total assets | | | 59,233,025 | |
| | | | |
| |
| Liabilities | | | | |
Payables: | | | | |
Manager fees (See Note 3) | | | 60,232 | |
Transfer agent (See Note 3) | | | 32,548 | |
Fund shares redeemed | | | 31,981 | |
Professional fees | | | 16,955 | |
Shareholder communication | | | 14,988 | |
NYLIFE Distributors (See Note 3) | | | 11,961 | |
Custodian | | | 3,350 | |
Trustees | | | 1,124 | |
Dividends payable | | | 473 | |
Accrued expenses | | | 18 | |
| | | | |
Total liabilities | | | 173,630 | |
| | | | |
Net assets | | $ | 59,059,395 | |
| | | | |
| |
| Composition of Net Assets | | | | |
Shares of beneficial interest outstanding (par value of $.001 per share) unlimited number of shares authorized | | $ | 3,692 | |
Additional paid-in capital | | | 129,246,198 | |
| | | | |
| | | 129,249,890 | |
Total distributable earnings (loss) | | | (70,190,495 | ) |
| | | | |
Net assets | | $ | 59,059,395 | |
| | | | |
| | | | |
Class A | | | | |
Net assets applicable to outstanding shares | | $ | 16,058,796 | |
| | | | |
Shares of beneficial interest outstanding | | | 1,004,373 | |
| | | | |
Net asset value per share outstanding | | $ | 15.99 | |
Maximum sales charge (5.50% of offering price) | | | 0.93 | |
| | | | |
Maximum offering price per share outstanding | | $ | 16.92 | |
| | | | |
Investor Class | | | | |
Net assets applicable to outstanding shares | | $ | 2,179,369 | |
| | | | |
Shares of beneficial interest outstanding | | | 137,071 | |
| | | | |
Net asset value per share outstanding | | $ | 15.90 | |
Maximum sales charge (5.50% of offering price) | | | 0.93 | |
| | | | |
Maximum offering price per share outstanding | | $ | 16.83 | |
| | | | |
Class C | | | | |
Net assets applicable to outstanding shares | | $ | 8,073,963 | |
| | | | |
Shares of beneficial interest outstanding | | | 533,870 | |
| | | | |
Net asset value per share outstanding | | $ | 15.12 | |
| | | | |
Class I | | | | |
Net assets applicable to outstanding shares | | $ | 32,747,267 | |
| | | | |
Shares of beneficial interest outstanding | | | 2,016,492 | |
| | | | |
Net asset value per share outstanding | | $ | 16.24 | |
| | | | |
| | | | | | |
The notes to the financial statements are an integral part of,
and should be read in conjunction with, the financial statements. | | | | | 41 | |
Statement of Operationsfor the six months ended May 31, 2019 (Unaudited)
| | | | |
| Investment Income (Loss) | | | | |
Income | | | | |
Dividends and distributions
(Net of return of capital of $757,404) (a) | | $ | 431,018 | |
Interest | | | 41,153 | |
| | | | |
Total income | | | 472,171 | |
| | | | |
Expenses | | | | |
Manager (See Note 3) | | | 447,700 | |
Distribution/Service—Class A (See Note 3) | | | 22,747 | |
Distribution/Service—Investor Class (See Note 3) | | | 2,911 | |
Distribution/Service—Class C (See Note 3) | | | 47,297 | |
Transfer agent (See Note 3) | | | 64,468 | |
Registration | | | 40,778 | |
Professional fees | | | 23,265 | |
Shareholder communication | | | 17,728 | |
Custodian | | | 4,200 | |
Trustees | | | 1,527 | |
Insurance | | | 591 | |
Miscellaneous | | | 4,186 | |
| | | | |
Net total expenses | | | 677,398 | |
Expense waiver/reimbursement from Manager (See Note 3) | | | (42,290 | ) |
| | | | |
Net expenses | | | 635,108 | |
| | | | |
Net investment income (loss) | | | (162,937 | ) |
| | | | |
|
| Realized and Unrealized Gain (Loss) on Investments | |
Net realized gain (loss) on: | | | | |
Investments | | | (2,792,973 | ) |
Foreign currency transactions | | | 3 | |
| | | | |
Net realized gain (loss) on investments | | | (2,792,970 | ) |
| | | | |
Net change in unrealized appreciation (depreciation) | | | (3,399,700 | ) |
| | | | |
Net realized and unrealized gain (loss) on investments | | | (6,192,670 | ) |
| | | | |
Net increase (decrease) in net assets resulting from operations | | $ | (6,355,607 | ) |
| | | | |
| (a) | Dividends and distributions recorded net of foreign withholding taxes in the amount of $2,498. |
| | | | |
| 42 | | MainStay Cushing Renaissance Advantage Fund | | The notes to the financial statements are an integral part of,
and should be read in conjunction with, the financial statements. |
Statements of Changes in Net Assets
| | | | | | | | |
| | | Six months
ended
May 31,
2019
(Unaudited) | | | Year ended
November 30,
2018 | |
| Increase (Decrease) in Net Assets | |
Operations: | | | | | | | | |
Net investment income (loss) | | $ | (162,937 | ) | | $ | (1,139,175 | ) |
Net realized gain (loss) on investments | | | (2,792,970 | ) | | | 10,353,711 | |
Net change in unrealized appreciation (depreciation) on investments | | | (3,399,700 | ) | | | (17,559,398 | ) |
| | | | |
Net increase (decrease) in net assets resulting from operations | | | (6,355,607 | ) | | | (8,344,862 | ) |
| | | | |
Distributions to shareholders from return of capital: | | | | | | | | |
Class A | | | (293,193 | ) | | | (677,117 | ) |
Investor Class | | | (38,034 | ) | | | (79,671 | ) |
Class C | | | (158,878 | ) | | | (429,454 | ) |
Class I | | | (836,168 | ) | | | (2,006,034 | ) |
| | | | |
Total distributions to shareholders | | | (1,326,273 | ) | | | (3,192,276 | ) |
| | | | |
Capital share transactions: | | | | | | | | |
Net proceeds from sale of shares | | | 12,854,014 | | | | 21,261,821 | |
Net asset value of shares issued to shareholders in reinvestment of dividends and distributions | | | 1,285,175 | | | | 3,075,212 | |
Cost of shares redeemed | | | (37,539,658 | ) | | | (86,003,681 | ) |
| | | | |
Increase (decrease) in net assets derived from capital share transactions | | | (23,400,469 | ) | | | (61,666,648 | ) |
| | | | |
Net increase (decrease) in net assets | | | (31,082,349 | ) | | | (73,203,786 | ) |
| | |
| Net Assets | | | | | | | | |
Beginning of period | | | 90,141,744 | | | | 163,345,530 | |
| | | | |
End of period | | $ | 59,059,395 | | | $ | 90,141,744 | |
| | | | |
| | | | | | |
The notes to the financial statements are an integral part of,
and should be read in conjunction with, the financial statements. | | | | | 43 | |
Financial Highlightsselected per share data and ratios
| | | | | | | | | | | | | | | | | | | | | | | | |
| | |
| | | Six months
ended
May 31,
2019 | | | Year ended November 30, | |
| | | | | | |
| Class A | | (Unaudited) | | | 2018 | | | 2017 | | | 2016 | | | 2015 | | | 2014 | |
| | | | | | |
Net asset value at beginning of period | | $ | 18.03 | | | $ | 20.75 | | | $ | 20.95 | | | $ | 18.91 | | | $ | 23.29 | | | $ | 22.65 | |
| | | | | | | | | | | | | | | | | | | | | | | | |
| | | | | | |
Net investment income (loss) (a) | | | (0.04 | ) | | | (0.20 | ) | | | (0.21 | ) | | | (0.01 | ) | | | 0.03 | | | | 0.01 | |
| | | | | | |
Net realized and unrealized gain (loss) on investments | | | (1.72 | ) | | | (1.96 | ) | | | 0.57 | | | | 2.61 | | | | (3.85 | ) | | | 1.19 | |
| | | | | | | | | | | | | | | | | | | | | | | | |
| | | | | | |
Total from investment operations | | | (1.76 | ) | | | (2.16 | ) | | | 0.36 | | | | 2.60 | | | | (3.82 | ) | | | 1.20 | |
| | | | | | | | | | | | | | | | | | | | | | | | |
| | | | | | |
| Less distributions: | | | | | | | | | | | | | | | | | | | | | | | | |
| | | | | | |
From net investment income | | | — | | | | — | | | | — | | | | — | | | | (0.03 | ) | | | (0.03 | ) |
| | | | | | |
From return of capital | | | (0.28 | ) | | | (0.56 | ) | | | (0.56 | ) | | | (0.56 | ) | | | (0.53 | ) | | | (0.53 | ) |
| | | | | | | | | | | | | | | | | | | | | | | | |
| | | | | | |
Total dividends and distributions | | | (0.28 | ) | | | (0.56 | ) | | | (0.56 | ) | | | (0.56 | ) | | | (0.56 | ) | | | (0.56 | ) |
| | | | | | | | | | | | | | | | | | | | | | | | |
| | | | | | |
Redemption fees retained (a)(b) | | | — | | | | — | | | | — | | | | — | | | | — | | | | 0.00 | ‡ |
| | | | | | | | | | | | | | | | | | | | | | | | |
| | | | | | |
Net asset value at end of period | | $ | 15.99 | | | $ | 18.03 | | | $ | 20.75 | | | $ | 20.95 | | | $ | 18.91 | | | $ | 23.29 | |
| | | | | | | | | | | | | | | | | | | | | | | | |
| | | | | | |
Total investment return (c) | | | (9.91 | %) | | | (10.77 | %) | | | 1.87 | % | | | 14.35 | % | | | (16.57 | %) | | | 5.14 | % |
| | | | | | |
| Ratios (to average net assets)/Supplemental Data: | | | | | | | | | | | | | | | | | | | | | | | | |
| | | | | | |
Net investment income (loss) | | | (0.43 | %)†† | | | (0.97 | %) | | | (1.05 | %) | | | (0.06 | %) | | | 0.15 | % | | | 0.03 | % |
| | | | | | |
Net expenses | | | 1.61 | % †† | | | 1.61 | % | | | 1.59 | % | | | 1.65 | % | | | 1.69 | % | | | 1.80 | % |
| | | | | | |
Expenses (before waiver/reimbursement) | | | 1.71 | % †† | | | 1.62 | % | | | 1.59 | % | | | 1.68 | % | | | 1.73 | % | | | 1.81 | % |
| | | | | | |
Portfolio turnover rate | | | 75 | % | | | 137 | % | | | 166 | % | | | 314 | % | | | 149 | % | | | 115 | % |
| | | | | | |
Net assets at end of period (in 000’s) | | $ | 16,059 | | | $ | 19,587 | | | $ | 27,303 | | | $ | 38,686 | | | $ | 42,135 | | | $ | 51,472 | |
| ‡ | Less than one cent per share. |
| (a) | Per share data based on average shares outstanding during the period. |
| (b) | Redemption fees were only applicable prior to reorganization. (See Note 1) |
| (c) | Total investment return is calculated exclusive of sales charges and assumes the reinvestment of dividends and distributions. |
| | For periods of less than one year, total return is not annualized. |
| | | | |
| 44 | | MainStay Cushing Renaissance Advantage Fund | | The notes to the financial statements are an integral part of,
and should be read in conjunction with, the financial statements. |
Financial Highlightsselected per share data and ratios
| | | | | | | | | | | | | | | | | | | | | | | | |
| | | |
| | | Six months
ended
May 31,
2019 | | | Year ended November 30, | | | July 12,
2014**
through
November 30, | |
| | | | | | |
| Investor Class | | (Unaudited) | | | 2018 | | | 2017 | | | 2016 | | | 2015 | | | 2014 | |
| | | | | | |
Net asset value at beginning of period | | $ | 17.94 | | | $ | 20.67 | | | $ | 20.90 | | | $ | 18.90 | | | $ | 23.30 | | | $ | 26.80 | |
| | | | | | | | | | | | | | | | | | | | | | | | |
| | | | | | |
Net investment income (loss) (a) | | | (0.05 | ) | | | (0.22 | ) | | | (0.24 | ) | | | (0.04 | ) | | | 0.00 | ‡ | | | 0.03 | |
| | | | | | |
Net realized and unrealized gain (loss) on investments | | | (1.71 | ) | | | (1.95 | ) | | | 0.57 | | | | 2.60 | | | | (3.84 | ) | | | (3.25 | ) |
| | | | | | | | | | | | | | | | | | | | | | | | |
| | | | | | |
Total from investment operations | | | (1.76 | ) | | | (2.17 | ) | | | 0.33 | | | | 2.56 | | | | (3.84 | ) | | | (3.22 | ) |
| | | | | | | | | | | | | | | | | | | | | | | | |
| | | | | | |
| Less distributions: | | | | | | | | | | | | | | | | | | | | | | | | |
| | | | | | |
From net investment income | | | — | | | | — | | | | — | | | | — | | | | (0.03 | ) | | | (0.02 | ) |
| | | | | | |
From return of capital | | | (0.28 | ) | | | (0.56 | ) | | | (0.56 | ) | | | (0.56 | ) | | | (0.53 | ) | | | (0.26 | ) |
| | | | | | | | | | | | | | | | | | | | | | | | |
| | | | | | |
Total dividends and distributions | | | (0.28 | ) | | | (0.56 | ) | | | (0.56 | ) | | | (0.56 | ) | | | (0.56 | ) | | | (0.28 | ) |
| | | | | | | | | | | | | | | | | | | | | | | | |
| | | | | | |
Net asset value at end of period | | $ | 15.90 | | | $ | 17.94 | | | $ | 20.67 | | | $ | 20.90 | | | $ | 18.90 | | | $ | 23.30 | |
| | | | | | | | | | | | | | | | | | | | | | | | |
| | | | | | |
Total investment return (b) | | | (9.96 | %) | | | (10.87 | %) | | | 1.73 | % (c) | | | 14.15 | % (c) | | | (16.68 | %)(c) | | | (12.10 | %)(c) |
| | | | | |
| Ratios (to average net assets)/Supplemental Data: | | | | | | | | | | | | | | | | | | | | | |
| | | | | | |
Net investment income (loss) | | | (0.61 | %)†† | | | (1.07 | %) | | | (1.21 | %) | | | (0.25 | %) | | | 0.01 | % | | | 0.31 | % †† |
| | | | | | |
Net expenses | | | 1.79 | % †† | | | 1.72 | % | | | 1.74 | % | | | 1.80 | % | | | 1.83 | % | | | 1.70 | % †† |
| | | | | | |
Expenses (before waiver/reimbursement) | | | 1.89 | % †† | | | 1.73 | % | | | 1.74 | % | | | 1.83 | % | | | 1.87 | % | | | 1.70 | % †† |
| | | | | | |
Portfolio turnover rate | |
| 75
| %
| | | 137 | % | | | 166 | % | | | 314 | % | | | 149 | % | | | 115 | % |
| | | | | | |
Net assets at end of period (in 000’s) | | $ | 2,179 | | | $ | 2,427 | | | $ | 3,382 | | | $ | 3,985 | | | $ | 2,989 | | | $ | 1,651 | |
| ‡ | Less than one cent per share. |
| (a) | Per share data based on average shares outstanding during the period. |
| (b) | Total investment return is calculated exclusive of sales charges and assumes the reinvestment of dividends and distributions. |
| | For periods of less than one year, total return is not annualized. |
| (c) | Total investment return may reflect adjustments to conform to generally accepted accounting principles. |
| | | | | | |
The notes to the financial statements are an integral part of,
and should be read in conjunction with, the financial statements. | | | | | 45 | |
Financial Highlightsselected per share data and ratios
| | | | | | | | | | | | | | | | | | | | | | | | |
| | |
| | | Six months
ended
May 31,
2019 | | | Year ended November 30, | |
| | | | | | |
| Class C | | (Unaudited) | | | 2018 | | | 2017 | | | 2016 | | | 2015 | | | 2014 | |
| | | | | | |
Net asset value at beginning of period | | $ | 17.15 | | | $ | 19.93 | | | $ | 20.32 | | | $ | 18.53 | | | $ | 23.02 | | | $ | 22.56 | |
| | | | | | | | | | | | | | | | | | | | | | | | |
| | | | | | |
Net investment income (loss) (a) | | | (0.11 | ) | | | (0.37 | ) | | | (0.37 | ) | | | (0.16 | ) | | | (0.15 | ) | | | (0.16 | ) |
| | | | | | |
Net realized and unrealized gain (loss) on investments | | | (1.64 | ) | | | (1.85 | ) | | | 0.54 | | | | 2.51 | | | | (3.78 | ) | | | 1.18 | |
| | | | | | | | | | | | | | | | | | | | | | | | |
| | | | | | |
Total from investment operations | | | (1.75 | ) | | | (2.22 | ) | | | 0.17 | | | | 2.35 | | | | (3.93 | ) | | | 1.02 | |
| | | | | | | | | | | | | | | | | | | | | | | | |
| | | | | | |
| Less distributions: | | | | | | | | | | | | | | | | | | | | | | | | |
| | | | | | |
From net investment income | | | — | | | | — | | | | — | | | | — | | | | (0.03 | ) | | | (0.03 | ) |
| | | | | | |
From return of capital | | | (0.28 | ) | | | (0.56 | ) | | | (0.56 | ) | | | (0.56 | ) | | | (0.53 | ) | | | (0.53 | ) |
| | | | | | | | | | | | | | | | | | | | | | | | |
| | | | | | |
Total dividends and distributions | | | (0.28 | ) | | | (0.56 | ) | | | (0.56 | ) | | | (0.56 | ) | | | (0.56 | ) | | | (0.56 | ) |
| | | | | | | | | | | | | | | | | | | | | | | | |
| | | | | | |
Redemption fees retained (a)(b) | | | — | | | | — | | | | — | | | | — | | | | — | | | | 0.00 | ‡ |
| | | | | | | | | | | | | | | | | | | | | | | | |
| | | | | | |
Net asset value at end of period | | $ | 15.12 | | | $ | 17.15 | | | $ | 19.93 | | | $ | 20.32 | | | $ | 18.53 | | | $ | 23.02 | |
| | | | | | | | | | | | | | | | | | | | | | | | |
| | | | | | |
Total investment return (c) | | | (10.37 | %) | | | (11.53 | %) | | | 0.98 | % | | | 13.28 | % | | | (17.28 | %) | | | 4.40 | % |
| | | | | | |
| Ratios (to average net assets)/Supplemental Data: | | | | | | | | | | | | | | | | | | | | | | | | |
| | | | | | |
Net investment income (loss) | | | (1.36 | %)†† | | | (1.85 | %) | | | (1.92 | %) | | | (0.93 | %) | | | (0.72 | %) | | | (0.65 | %) |
| | | | | | |
Net expenses | | | 2.54 | % †† | | | 2.47 | % | | | 2.49 | % | | | 2.55 | % | | | 2.56 | % | | | 2.52 | % |
| | | | | | |
Expenses (before waiver/reimbursement) | | | 2.64 | % †† | | | 2.48 | % | | | 2.49 | % | | | 2.58 | % | | | 2.60 | % | | | 2.53 | % |
| | | | | | |
Portfolio turnover rate | | | 75 | % | | | 137 | % | | | 166 | % | | | 314 | % | | | 149 | % | | | 115 | % |
| | | | | | |
Net assets at end of period (in 000’s) | | $ | 8,074 | | | $ | 11,174 | | | $ | 17,216 | | | $ | 26,223 | | | $ | 35,398 | | | $ | 47,022 | |
| ‡ | Less than one cent per share. |
| (a) | Per share data based on average shares outstanding during the period. |
| (b) | Redemption fees were only applicable prior to reorganization. (See Note 1) |
| (c) | Total investment return is calculated exclusive of sales charges and assumes the reinvestment of dividends and distributions. |
| | For periods of less than one year, total return is not annualized. |
| | | | |
| 46 | | MainStay Cushing Renaissance Advantage Fund | | The notes to the financial statements are an integral part of,
and should be read in conjunction with, the financial statements. |
Financial Highlightsselected per share data and ratios
| | | | | | | | | | | | | | | | | | | | | | | | |
| | |
| | | Six months
ended
May 31,
2019 | | | Year ended November 30, | |
| | | | | | |
| Class I | | (Unaudited) | | | 2018 | | | 2017 | | | 2016 | | | 2015 | | | 2014 | |
| | | | | | |
Net asset value at beginning of period | | $ | 18.29 | | | $ | 20.98 | | | $ | 21.13 | | | $ | 19.02 | | | $ | 23.36 | | | $ | 22.66 | |
| | | | | | | | | | | | | | | | | | | | | | | | |
| | | | | | |
Net investment income (loss) (a) | | | (0.02 | ) | | | (0.16 | ) | | | (0.16 | ) | | | 0.02 | | | | 0.07 | | | | 0.09 | |
| | | | | | |
Net realized and unrealized gain (loss) on investments | | | (1.75 | ) | | | (1.97 | ) | | | 0.57 | | | | 2.65 | | | | (3.85 | ) | | | 1.17 | |
| | | | | | | | | | | | | | | | | | | | | | | | |
| | | | | | |
Total from investment operations | | | (1.77 | ) | | | (2.13 | ) | | | 0.41 | | | | 2.67 | | | | (3.78 | ) | | | 1.26 | |
| | | | | | | | | | | | | | | | | | | | | | | | |
| | | | | | |
| Less distributions: | | | | | | | | | | | | | | | | | | | | | | | | |
| | | | | | |
From net investment income | | | — | | | | — | | | | — | | | | — | | | | (0.03 | ) | | | (0.03 | ) |
| | | | | | |
From return of capital | | | (0.28 | ) | | | (0.56 | ) | | | (0.56 | ) | | | (0.56 | ) | | | (0.53 | ) | | | (0.53 | ) |
| | | | | | | | | | | | | | | | | | | | | | | | |
| | | | | | |
Total dividends and distributions | | | (0.28 | ) | | | (0.56 | ) | | | (0.56 | ) | | | (0.56 | ) | | | (0.56 | ) | | | (0.56 | ) |
| | | | | | | | | | | | | | | | | | | | | | | | |
| | | | | | |
Redemption fees retained (a)(b) | | | — | | | | — | | | | — | | | | — | | | | — | | | | 0.00 | ‡ |
| | | | | | | | | | | | | | | | | | | | | | | | |
| | | | | | |
Net asset value at end of period | | $ | 16.24 | | | $ | 18.29 | | | $ | 20.98 | | | $ | 21.13 | | | $ | 19.02 | | | $ | 23.36 | |
| | | | | | | | | | | | | | | | | | | | | | | | |
| | | | | | |
Total investment return (c) | | | (9.83 | %)(d) | | | (10.51 | %)(d) | | | 2.14 | % | | | 14.64 | % | | | (16.34 | %) | | | 5.41 | % |
| | | | | |
| Ratios (to average net assets)/Supplemental Data: | | | | | | | | | | | | | | | | | | | | | |
| | | | | | |
Net investment income (loss) | | | (0.21 | %)†† | | | (0.73 | %) | | | (0.80 | %) | | | 0.12 | % | | | 0.34 | % | | | 0.37 | % |
| | | | | | |
Net expenses | | | 1.36 | % †† | | | 1.36 | % | | | 1.34 | % | | | 1.40 | % | | | 1.43 | % | | | 1.51 | % |
| | | | | | |
Expenses (before waiver/reimbursement) | | | 1.46 | % †† | | | 1.37 | % | | | 1.34 | % | | | 1.43 | % | | | 1.46 | % | | | 1.52 | % |
| | | | | | |
Portfolio turnover rate | | | 75 | % | | | 137 | % | | | 166 | % | | | 314 | % | | | 149 | % | | | 115 | % |
| | | | | | |
Net assets at end of period (in 000’s) | | $ | 32,747 | | | $ | 56,953 | | | $ | 115,445 | | | $ | 148,250 | | | $ | 129,677 | | | $ | 316,002 | |
| ‡ | Less than one cent per share. |
| (a) | Per share data based on average shares outstanding during the period. |
| (b) | Redemption fees were only applicable prior to reorganization. (See Note 1) |
| (c) | Total investment return is calculated exclusive of sales charges and assumes the reinvestment of dividends and distributions. Class I shares are not subject to sales charges. For periods of less than one year, total return is not annualized. |
| (d) | Total investment return may reflect adjustments to conform to generally accepted accounting principles. |
| | | | | | |
The notes to the financial statements are an integral part of,
and should be read in conjunction with, the financial statements. | | | | | 47 | |
Notes to Financial Statements(Unaudited)
Note 1–Organization and Business
MainStay Funds Trust (the “Trust”) was organized as a Delaware statutory trust on April 28, 2009 and is governed by a Declaration of Trust. The Trust is registered under the Investment Company Act of 1940, as amended (the “1940 Act”), as an open-end management investment company, and is comprised of thirty-five funds (collectively referred to as the “Funds” and each individually, referred to as a “Fund”). These financial statements and Notes relate to the MainStay Cushing Energy Income Fund, MainStay Cushing MLP Premier Fund and MainStay Cushing Renaissance Advantage Fund (collectively referred to as the “MainStay Cushing Funds” and each individually referred to as a “MainStay Cushing Fund”). The MainStay Cushing Renaissance Advantage Fund is a “diversified” portfolio and the MainStay Cushing Energy Income Fund and the MainStay Cushing MLP Premier Fund are each a “non-diversified” portfolio, as each term is defined in the 1940 Act, as interpreted or modified by regulatory authorities having jurisdiction, from time to time. Each MainStay Cushing Fund is the successor to the corresponding series of The Cushing® Funds Trust (collectively referred to as the “Predecessor Funds” and each individually referred to as a “Predecessor Fund”), for which Cushing® Asset Management, LP, a Texas limited partnership and the MainStay Cushing Funds’ Subadvisor (as defined in Note 3(A)), served as investment adviser. The financial statements of the MainStay Cushing Funds reflect the historical results of the Predecessor Funds prior to their reorganization on July 11, 2014. Upon the completion of the reorganizations, Class A, Class C and Class I shares of each MainStay Cushing Fund assumed the performance, financial and other information of the Predecessor Funds. All information and references to periods prior to July 11, 2014 refer to the Predecessor Funds.
TheMainStay Cushing Energy Income Fund currently has five classes of shares registered for sale. Class A, Class C and Class I shares commenced operations on July 2, 2012. Investor Class shares commenced operations on July 11, 2014. Class R6 shares of the Fund were registered for sale effective as of March 31, 2017. As of May 31, 2019, Class R6 shares were not yet offered for sale. The Fund’s investment objective is to seek current income and capital appreciation.
TheMainStay Cushing MLP Premier Fund currently has five classes of shares registered for sale. Class A, Class C and Class I shares commenced operations on October 20, 2010. Investor Class shares commenced operations on July 11, 2014. Class R6 shares of the Fund were registered for sale effective as of March 31, 2017. As of May 31, 2019, Class R6 shares were not yet offered for sale. The Fund’s investment objective is to seek current income and capital appreciation. In seeking current income, the Fund intends to pay current cash distributions to shareholders, regardless of the character of such distributions for tax or accounting purposes.
TheMainStay Cushing Renaissance Advantage Fund currently has five classes of shares registered for sale. Class A, Class C and Class I shares commenced operations on April 2, 2013. Investor Class shares commenced operations on July 11, 2014. Class R6 shares of the Fund were registered for sale effective as of March 31, 2017. As of May 31, 2019, Class R6 shares were not yet offered for sale. The Fund’s investment objective is to seek total return.
Class A and Investor Class shares are offered at net asset value (“NAV”) per share plus an initial sales charge. No initial sales charge applies to investments of $1 million or more (and certain other qualified
purchases) in Class A and Investor Class shares. Effective August 1, 2017, a contingent deferred sales charge (“CDSC”) of 1.00% may be imposed on certain redemptions of Class A and Investor Class shares made within 18 months of the date of purchase on shares that were purchased without an initial sales charge. For purchases of Class A and Investor Class shares made from January 1, 2017, through July 31, 2017, a CDSC of 1.00% may be imposed on certain redemptions of such shares made within 24 months of the date of purchase on shares that were purchased without an initial sales charge. Class C shares are offered at NAV without an initial sales charge, although a 1.00% CDSC may be imposed on certain redemptions of such shares made within one year of the date of purchase of Class C shares. Class I shares are offered at NAV without a sales charge. Class R6 shares are currently expected to be offered at NAV without a sales charge. Class A shares may convert automatically to Investor Class shares and Investor Class shares may convert automatically to Class A shares. In addition, depending upon eligibility, Class C shares convert to either Class A or Investor Class shares at the end of the calendar quarter ten years after the date they were purchased. Under certain circumstances and as may be permitted by the Trust’s multiple class plan pursuant to Rule 18f-3 under the 1940 Act, specified share classes of a MainStay Cushing Fund may be converted to one or more other share classes of the MainStay Cushing Fund as disclosed in the capital share transactions within these notes. The classes of shares have the same voting (except for issues that relate solely to one class), dividend, liquidation and other rights, and the same terms and conditions, except that, under distribution plans pursuant to Rule 12b-1 under the 1940 Act, Class C shares are subject to higher distribution and/or service fees than Class A and Investor Class shares. Class I and Class R6 shares are not subject to a distribution and/or service fee.
Note 2–Significant Accounting Policies
The MainStay Cushing Funds are investment companies and accordingly follow the investment company accounting and reporting guidance of the Financial Accounting Standards Board (“FASB”) Accounting Standard CodificationTopic 946 Financial Services—Investment Companies. The MainStay Cushing Funds prepare their financial statements in accordance with generally accepted accounting principles (“GAAP”) in the United States and follow the significant accounting policies described below.
(A) Securities Valuation. Investments are usually valued as of the close of regular trading on the New York Stock Exchange (the “Exchange”) (usually 4:00 p.m. Eastern time) on each day the MainStay Cushing Funds are open for business (“valuation date”).
The Board of Trustees of the MainStay Funds Trust (the “Board”) adopted procedures establishing methodologies for the valuation of each MainStay Cushing Fund’s securities and other assets and delegated the responsibility for valuation determinations under those procedures to the Valuation Committee of the MainStay Funds Trust (the “Valuation Committee”). The Board authorized the Valuation Committee to appoint a Valuation Subcommittee (the “Subcommittee”) to deal in the first instance with establishing the prices of securities for which market quotations are not readily available or the prices of which are not otherwise readily determinable under these procedures. The Subcommittee meets (in person, via electronic mail or via teleconference) on an as-needed basis.
| | |
| 48 | | MainStay Cushing Funds |
Subsequently, the Valuation Committee meets to ensure that actions taken by the Subcommittee were appropriate. The procedures state that, subject to the oversight of the Board and unless otherwise noted, the responsibility for theday-to-day valuation of portfolio assets (including fair value measurements for the MainStay Cushing Funds’ assets and liabilities) rests with New York Life Investment Management LLC (“New York Life Investments” or the “Manager”), aided to whatever extent necessary by the Subadvisor (as defined in Note 3(A)).
To assess the appropriateness of security valuations, the Manager, the Subadvisor, or the MainStay Cushing Funds’ third-party service provider, who is subject to oversight by the Manager, regularly compares prior day prices, prices on comparable securities, and the sale prices to the prior and current day prices and challenges prices with changes exceeding certain tolerance levels with third party pricing services or broker sources. For those securities valued through either a standardized fair valuation methodology or a fair valuation measurement, the Subcommittee deals in the first instance with such valuation and the Valuation Committee reviews and affirms, if appropriate, the reasonableness of the valuation based on such methodologies and measurements on a regular basis after considering information that is reasonably available and deemed relevant by the Valuation Committee. Any action taken by the Subcommittee with respect to the valuation of a portfolio security or other asset is submitted for review and ratification (if appropriate) to the Valuation Committee and the Board at the next regularly scheduled meeting.
“Fair value” is defined as the price a MainStay Cushing Fund would reasonably expect to receive upon selling an asset or liability in an orderly transaction to an independent buyer in the principal or most advantageous market for the asset or liability. Fair value measurements are determined within a framework that establishes a three-tier hierarchy which maximizes the use of observable market data and minimizes the use of unobservable inputs to establish a classification of fair value measurements for disclosure purposes. “Inputs” refer broadly to the assumptions that market participants would use in pricing the asset or liability, including assumptions about risk, such as the risk inherent in a particular valuation technique used to measure fair value using a pricing model and/or the risk inherent in the inputs for the valuation technique. Inputs may be observable or unobservable. Observable inputs reflect the assumptions market participants would use in pricing the asset or liability based on market data obtained from sources independent of each MainStay Cushing Fund. Unobservable inputs reflect each MainStay Cushing Fund’s own assumptions about the assumptions market participants would use in pricing the asset or liability based on the information available. The inputs or methodology used for valuing assets or liabilities may not be an indication of the risks associated with investing in those assets or liabilities. The three-tier hierarchy of inputs is summarized below.
| • | | Level 1—quoted prices in active markets for an identical asset or liability |
| • | | Level 2—other significant observable inputs (including quoted prices for a similar asset or liability in active markets, interest rates and yield curves, prepayment speeds, credit risk, etc.) |
| • | | Level 3—significant unobservable inputs (including each MainStay Cushing Fund’s own assumptions about the assumptions that market participants would use in measuring fair value of an asset or liability) |
The level of an asset or liability within the fair value hierarchy is based on the lowest level of an input, both individually and in the aggregate, that is significant to the fair value measurement. As of May 31, 2019, the aggregate value by input level of each MainStay Cushing Fund’s assets and liabilities is included at the end of each MainStay Cushing Fund’s Portfolio of Investments.
The MainStay Cushing Funds may use third party vendor evaluations, whose prices may be derived from one or more of the following standard inputs, among others:
| | |
• Benchmark Yields | | • Reported Trades |
• Broker/Dealer Quotes | | • Issuer Spreads |
• Two-sided markets | | • Benchmark securities |
• Bids/Offers | | • Reference Data (corporate actions or material event notices) |
• Industry and economic events | | • Monthly payment information |
• Comparable bonds | | |
An asset or liability for which market values cannot be measured using the methodologies described above is valued by methods deemed reasonable in good faith by the Valuation Committee, following the procedures established by the Board, to represent fair value. Under these procedures, the MainStay Cushing Funds generally use a market-based approach which may use related or comparable assets or liabilities, recent transactions, market multiples, book values, and other relevant information. The MainStay Cushing Funds may also use an income-based valuation approach in which the anticipated future cash flows of the asset or liability are discounted to calculate fair value. Discounts may also be applied due to the nature and/or duration of any restrictions on the disposition of the asset or liability. Fair value represents a good faith approximation of the value of a security. Fair value determinations involve the consideration of a number of subjective factors, an analysis of applicable facts and circumstances and the exercise of judgment. As a result, it is possible that the fair value for a security determined in good faith in accordance with the MainStay Cushing Funds’ valuation procedures may differ from valuations for the same security determined by other funds using their own valuation procedures. Although the MainStay Cushing Funds’ valuation procedures are designed to value a security at the price a MainStay Cushing Fund may reasonably expect to receive upon the security’s sale in an orderly transaction, there can be no assurance that any fair value determination thereunder would, in fact, approximate the amount that a MainStay Cushing Fund would actually realize upon the sale of the security or the price at which the security would trade if a reliable market price were readily available. For the six months ended May 31, 2019, there were no material changes to the fair value methodologies.
Certain securities held by the MainStay Cushing Funds may principally trade in foreign markets. Events may occur between the time the foreign markets close and the time at which the MainStay Cushing Funds’ NAVs are calculated. These events may include, but are not limited to, situations relating to a single issuer in a market sector, significant fluctuations in U.S. or foreign markets, natural disasters, armed conflicts, governmental actions or other developments not tied directly to the securities markets. Should the Manager or Subadvisor conclude that such events may have affected the accuracy of the last price of such securities reported on the local foreign market, the Subcommittee may,
Notes to Financial Statements(Unaudited) (continued)
pursuant to procedures adopted by the Board, adjust the value of the local price to reflect the estimated impact on the price of such securities as a result of such events. In this instance, securities are generally categorized as Level 3 in the hierarchy. Additionally, certain foreign equity securities are also fair valued whenever the movement of a particular index exceeds certain thresholds. In such cases, the securities are fair valued by applying factors provided by a third party vendor in accordance with valuation procedures adopted by the Board and are generally categorized as Level 2 in the hierarchy. As of May 31, 2019, securities that were fair valued in such a manner are shown in the applicable MainStay Cushing Fund’s Portfolio of Investments.
Securities which may be valued in this manner include, but are not limited to: (i) a security for which trading has been halted or suspended; (ii) a debt security that has recently gone into default and for which there is not a current market quotation; (iii) a security of an issuer that has entered into a restructuring; (iv) a security that has been de-listed from a national exchange; (v) a security for which the market price is not readily available from a third party pricing source or, if so provided, does not, in the opinion of the Manager or Subadvisor reflect the security’s market value; (vi) a security subject to trading collars for which no or limited trading takes place; and (vii) a security whose principal market has been temporarily closed at a time when, under normal conditions, it would be open. Securities for which market quotations or observable inputs are not readily available are generally categorized as Level 3 in the hierarchy. As of May 31, 2019, securities that were fair valued in such a manner are shown in the applicable MainStay Cushing Fund’s Portfolio of Investments.
Equity securities, including exchange-traded funds are valued at the last quoted sales prices as of the close of regular trading on the relevant exchange on each valuation date. Securities that are not traded on the valuation date are valued at the mean of the last quoted bid and ask prices. Prices are normally taken from the principal market in which each security trades.
Investments in mutual funds, including money market funds, are valued at their respective NAVs as of the close of the Exchange on the valuation date. The securities are generally categorized as Level 1 in the hierarchy.
Debt securities (other than convertible and municipal bonds) are valued at the evaluated bid prices (evaluated mean prices in the case of convertible and municipal bonds) supplied by a pricing agent or broker selected by the Manager, in consultation with the Subadvisor. Those values reflect broker/dealer supplied prices and electronic data processing techniques, if the evaluated bid or mean prices are deemed by the Manager, in consultation with the Subadvisor, to be representative of market values, at the regular close of trading of the Exchange on each valuation date. Debt securities purchased on a delayed delivery basis are marked to market daily until settlement at the forward settlement date. Debt securities, including corporate bonds, U.S. government & federal agency bonds, municipal bonds, foreign bonds, convertible bonds, asset-backed securities and mortgage-backed securities are generally categorized as Level 2 in the hierarchy.
Temporary cash investments acquired in excess of 60 days to maturity at the time of purchase are valued using the latest bid prices or using valuations based on a matrix system (which considers such factors as security prices, yields, maturities, and ratings), both as furnished by independent pricing services. Other temporary cash investments which mature in 60 days or less at the time of purchase (“Short-Term
Investments”) are valued using the amortized cost method of valuation, unless the use of such method would be inappropriate. The amortized cost method involves valuing a security at its cost on the date of purchase and thereafter assuming a constant amortization to maturity of the difference between such cost and the value on maturity date. Amortized cost approximates the current fair value of a security. Securities valued at amortized cost are not valued using quoted prices in an active market and are generally categorized as Level 2 in the hierarchy.
The information above is not intended to reflect an exhaustive list of the methodologies that may be used to value portfolio investments. The valuation procedures permit the use of a variety of valuation methodologies in connection with valuing portfolio investments. The methodology used for a specific type of investment may vary based on the market data available or other considerations. The methodologies summarized above may not represent the specific means by which portfolio investments are valued on any particular business day.
A portfolio security or other asset may be determined to be illiquid under procedures approved by the Board. Illiquidity of a security might prevent the sale of such security at a time when the Manager or Subadvisor might wish to sell, and these securities could have the effect of decreasing the overall level of a MainStay Cushing Fund’s liquidity. Further, the lack of an established secondary market may make it more difficult to value illiquid securities, requiring a MainStay Cushing Fund to rely on judgments that may be somewhat subjective in measuring value, which could vary materially from the amount that a MainStay Cushing Fund could realize upon disposition. Difficulty in selling illiquid securities may result in a loss or may be costly to a MainStay Cushing Fund. Under the supervision of the Board, the Manager or Subadvisor determine the liquidity of a MainStay Cushing Fund’s investments; in doing so, the Manager or Subadvisor may consider various factors, including (i) the frequency of trades and quotations, (ii) the number of dealers and prospective purchasers, (iii) dealer undertakings to make a market, and (iv) the nature of the security and the market in which it trades (e.g., the time needed to dispose of the security, the method of soliciting offers and the mechanics of transfer). Illiquid securities are often valued in accordance with methods deemed by the Board in good faith to be reasonable and appropriate to accurately reflect their fair value. The liquidity of each MainStay Cushing Fund’s investments, as shown in their respective Portfolio of Investments, was determined as of May 31, 2019 and can change at any time in response to, among other relevant factors, market conditions or events or developments with respect to an individual issuer or instrument. As of May 31, 2019, securities deemed to be illiquid under procedures approved by the Board are shown in the applicable MainStay Cushing Fund’s Portfolio of Investments.
(B) Income Taxes. The MainStay Cushing Energy Income Fund invests its assets in a portfolio of energy companies involved in exploring, developing, producing, transporting, gathering and processing, storing, refining, distributing, mining or marketing natural gas, natural gas liquids (including propane), crude oil, refined products or coal. The MainStay Cushing Energy Income Fund has elected to be treated as a regulated investment company (“RIC”) under Subchapter M of the Internal Revenue Code of 1986, as amended (the “Internal Revenue Code”). Consistent with that intention, the MainStay Cushing Energy Income Fund intends to invest no more than 25% of its total assets in securities of energy MLPs.
| | |
| 50 | | MainStay Cushing Funds |
The MainStay Cushing Energy Income Fund also intends to comply with the requirements of the Internal Revenue Code applicable to RICs, and to distribute all of its taxable income to its shareholders within allowable time limits. Since the MainStay Cushing Energy Income Fund has elected to be subject to tax as a RIC, effective with its fiscal and taxable year ended November 30, 2016, no federal, state and local income tax provisions are required.
The MainStay Cushing MLP Premier Fund is taxed as a C-corporation and is subject to federal and state income tax on its taxable income. As of May 31, 2019, the federal income tax rate in effect for a corporation is 21%. For its taxable years ending on or before November 30, 2019, MainStay Cushing MLP Premier Fund may be subject to a 20% federal alternative minimum tax on its federal alternative minimum taxable income to the extent that its alternative minimum tax liability exceeds its regular federal income tax liability.
The MainStay Cushing MLP Premier Fund invests a majority of its assets in the equity securities of master limited partnerships (“MLPs”), which generally are treated as partnerships for federal income tax purposes. As a limited partner in MLPs, The MainStay Cushing MLP Premier Fund includes its allocable share of each MLP’s taxable income in computing its own taxable income.
The MainStay Cushing MLP Premier Fund’s tax expense or benefit is included in the Statement of Operations based on the component of income or gains (losses) to which such expense or benefit relates. Deferred income taxes reflect the net tax effects of temporary differences between the carrying amounts of assets and liabilities for financial reporting purposes and the amounts used for income tax purposes. A deferred income tax liability balance will be accrued at the effective federal corporate income tax rate (at 35% through December 22, 2017 and remeasured to 21% thereafter) plus an estimated state and local income tax rate for any future tax liability associated capital appreciation of MLP investments and distributions received on MLP investments considered to be a return of capital as well as for any net operating income or gains. A deferred income tax asset balance may also be accrued, which reflects an estimate of future tax benefits associated with net operating losses and/or unrealized losses. A valuation allowance is recognized if, based on the weight of available evidence, it is more likely than not that some portion or all of any deferred income tax asset will not be realized. The factors considered in assessing whether a valuation allowance is recognized include the nature, frequency and magnitude of current and cumulative losses, the duration of the statutory carryforward periods as well as the associated risks that operating and capital loss carryforwards may expire unused. As new information becomes available, the MainStay Cushing MLP Premier Fund may periodically modify its estimates and assumptions regarding its deferred income tax liability or deferred income tax asset balances.
The MainStay Cushing Renaissance Advantage Fund’s policy is to comply with the requirements of the Internal Revenue Code applicable to RICs and to distribute all of the taxable income to the shareholders of the Fund within the allowable time limits. Therefore, no federal, state, and local income tax provisions are required.
Management evaluates each MainStay Cushing Fund’s tax positions to determine if the tax positions taken meet the minimum recognition threshold in connection with accounting for uncertainties in income tax positions taken or expected to be taken for the purposes of measuring
and recognizing tax liabilities in the financial statements. Recognition of tax benefits of an uncertain tax position is permitted only to the extent the position is “more likely than not” to be sustained assuming examination by taxing authorities. Management has analyzed the MainStay Cushing Funds’ tax positions taken on federal, state and local income tax returns for all open tax years. Management has concluded that no provisions for federal, state and local income tax are required in the MainStay Cushing Energy Income Fund and the MainStay Cushing Renaissance Advantage Fund’s financial statements. Management has concluded that provisions for federal, state and local income tax are required to be included in the financial statements for the MainStay Cushing MLP Premier Fund which is taxed as a corporation and is subject to federal and state income tax on its taxable income. The MainStay Cushing Funds’ federal, state and local income tax and federal excise tax returns for tax years for which the applicable statutes of limitations have not expired are subject to examination by the Internal Revenue Service (“IRS”) and state and local departments of revenue.
(C) Foreign Taxes. The Fund may be subject to foreign taxes on income and other transaction-based taxes imposed by certain countries in which it invests. A portion of the taxes on gains on investments or currency purchases/repatriation may be reclaimable. The Fund will accrue such taxes and reclaims as applicable, based upon its current interpretation of tax rules and regulations that exist in the markets in which it invests. The Fund may be subject to taxation on realized capital gains, repatriation proceeds and other transaction-based taxes imposed by certain countries in which it invests. The Fund will accrue such taxes as applicable based upon its current interpretation of tax rules and regulations that exist in the market in which it invests. Capital gains taxes relating to positions still held are reflected as a liability on the Statement of Assets and Liabilities, as well as an adjustment to the Fund’s net unrealized appreciation (depreciation). Taxes related to capital gains realized, if any, are reflected as part of net realized gain (loss) in the Statement of Operations. Changes in tax liabilities related to capital gains taxes on unrealized investment gains, if any, are reflected as part of the change in net unrealized appreciation (depreciation) on investments in the Statement of Operations. Transaction-based charges are generally assessed as a percentage of the transaction amount.
(D) Dividends and Distributions to Shareholders. Dividends and distributions are recorded on the ex-dividend date. The MainStay Cushing Energy Income Fund and the MainStay Cushing Renaissance Advantage Fund intend to declare and pay distributions from net investment income quarterly and from net capital gains, if any, annually. The MainStay Cushing MLP Premier Fund intends to declare and pay distributions, if any, at least monthly. On a book basis, all realized capital gains net of applicable taxes will be retained by the MainStay Cushing MLP Premier Fund. Unless the shareholder elects otherwise, all dividends and distributions are reinvested in the same class of shares of the respective MainStay Cushing Fund, at NAV. Dividends and distributions to shareholders are determined in accordance with federal income tax regulations and may differ from determinations using GAAP.
The actual tax characterization of the distributions made during the current year will not be determined until after the end of the fiscal year when the Fund can determine its earnings and profits and, therefore, may differ from the preliminary estimates.
Notes to Financial Statements(Unaudited) (continued)
(E) Security Transactions and Investment Income. The MainStay Cushing Funds record security transactions on the trade date. Realized gains and losses on security transactions are determined using the identified cost method. Dividend income is recognized on the ex-dividend date, net of any foreign tax withheld at the source, interest income is accrued as earned, and discounts and premiums onShort-Term Investments are accreted and amortized, respectively. Income frompayment-in-kind securities is accreted daily based on the effective interest method of accrual. Distributions from MLPs are generally recorded based on the characterization reported on the MainStay Cushing Fund’s IRS Form 1065, Schedule K-1, received from each MLP. The MainStay Cushing Funds record their pro rata share of the income and deductions, and capital gains and losses allocated from each MLP, as well as adjusting the cost basis of each MLP accordingly.
Distributions received from each of the MainStay Cushing Fund’s investments in energy related U.S. royalty trusts and Canadian royalty trusts and exploration and production companies (collectively, “Energy Trusts”) and MLPs generally are comprised of ordinary income, capital gains and return of capital from the Energy Trusts and MLPs. The MainStay Cushing Funds record investment income on the ex-date of the distributions. For financial statement purposes, the MainStay Cushing Funds use return of capital and income estimates to allocate the dividend income received. Each MainStay Cushing Fund estimates approximately 100% of the distributions received from MLPs to be from return of capital. Such estimates are based on historical information available from each Energy Trust, MLP and other industry sources. These estimates may subsequently be revised based on information received from Energy Trusts or MLPs after their tax reporting periods are concluded, as the actual character of these distributions is not known until after the MainStay Cushing Funds’ fiscal year end.
Each MainStay Cushing Fund estimates the allocation of investment income and return of capital for the distributions received from MLPs within the Statements of Operations. Investment income and realized and unrealized gains and losses on investments of the MainStay Cushing Funds are allocated pro rata to the separate classes of shares based upon their relative net assets on the date the income is earned or realized and unrealized gains and losses are incurred.
(F) Expenses. Expenses of the Trust are allocated to the individual MainStay Cushing Funds in proportion to the net assets of the respective MainStay Cushing Funds when the expenses are incurred, except where direct allocations of expenses can be made. Expenses (other than transfer agent expenses and fees incurred under the shareholder services plans and/or the distribution plans further discussed in Note 3(B)) are allocated to separate classes of shares pro rata based upon their relative net assets on the date the expenses are incurred. The expenses borne by the MainStay Cushing Funds, including those of related parties to the MainStay Cushing Funds, are shown in the Statement of Operations.
Additionally, the Fund may invest in mutual funds, which are subject to management fees and other fees that may cause the costs of investing in mutual funds to be greater than the costs of owning the underlying securities directly. These indirect expenses of mutual funds are not included in the amounts shown as expenses in the Fund’s Statement of Operations or in the expense ratios included in the financial highlights.
(G) Use of Estimates. In preparing financial statements in conformity with GAAP, management makes estimates and assumptions that affect the reported amounts and disclosures in the financial statements. Actual results could differ from those estimates.
(H) Concentration of Risk. The MainStay Cushing Energy Income Fund, under normal market conditions, invests at least 80% of its assets (net assets plus any borrowings for investment purposes) in a portfolio of energy companies involved in exploring, developing, producing, transporting, gathering and processing, storing, refining, distributing, mining or marketing natural gas, natural gas liquids (including propane), crude oil, refined products or coal. Under normal market conditions, the MainStay Cushing MLP Premier Fund invests at least 80% of its assets (net assets plus any borrowings for investment purposes) in a portfolio of MLPs and MLP-related investments. Under normal market conditions, the MainStay Cushing Renaissance Advantage Fund invests at least 80% of its assets (net assets plus any borrowings for investment purposes) in a portfolio of (i) companies across the energy supply chain spectrum, including upstream, midstream and downstream energy companies, as well as oil and gas services companies, (ii) energy-intensive chemical, metal and industrial and manufacturing companies and engineering and construction companies that the Subadvisor expects to benefit from growing energy production and lower feedstock costs relative to global costs and, (iii) transportation and logistics companies providing solutions to the U.S. manufacturing industry. Therefore the MainStay Cushing Funds may be subject to more risks than if they were more broadly diversified over numerous industries and sectors of the economy. General changes in market sentiment towards companies in the sectors in which they invest may adversely affect the MainStay Cushing Funds, and the performance of such sectors may lag behind the broader market as a whole.
The MainStay Cushing Funds are also subject to MLP structure risk. Holders of MLP units are subject to certain risks inherent in the structure of MLPs, including (i) tax risks, (ii) the limited ability to elect or remove management or the general partner or managing member, (iii) limited voting rights, except with respect to extraordinary transactions, and (iv) conflicts of interest between the general partner or managing member and its affiliates, on the one hand, and the limited partners or members, on the other hand, including those arising from incentive distribution payments or corporate opportunities.
(I) Indemnifications. Under the Trust’s organizational documents, its officers and trustees are indemnified against certain liabilities that may arise out of performance of their duties to the Trust. Additionally, in the normal course of business, the MainStay Cushing Funds enter into contracts with third-party service providers that contain a variety of representations and warranties and which may provide general indemnifications. The MainStay Cushing Funds’ maximum exposure under these arrangements is unknown, as this would involve future claims that may be made against the MainStay Cushing Funds that have not yet occurred. Based on experience, management is of the view that the risk of loss in connection with these potential indemnification obligations is remote. However, there can be no assurance that material liabilities related to such obligations will not arise in the future, which could adversely impact the MainStay Cushing Funds.
| | |
| 52 | | MainStay Cushing Funds |
Note 3–Fees and Related Party Transactions
(A) Manager and Subadvisor. New York Life Investments, a registered investment adviser and an indirect,wholly-owned subsidiary of New York Life Insurance Company (“New York Life”), serves as the MainStay Cushing Funds’ Manager, pursuant to an Amended and Restated Management Agreement, (“Management Agreement”). The Manager provides offices, conducts clerical, recordkeeping and bookkeeping services, and keeps most of the financial and accounting records required to be maintained by the MainStay Cushing Funds. Except for the portion of salaries and expenses that are the responsibility of the MainStay Cushing Funds, the Manager pays the salaries and expenses of all personnel affiliated with the MainStay Cushing Funds and certain operational expenses of the MainStay Cushing Funds. The MainStay Cushing Funds reimburse New York Life Investments in an amount equal to a portion of the compensation of the Chief Compliance Officer attributable to the MainStay Cushing Funds. Cushing® Asset Management, LP (“Cushing® Asset Management” or the “Subadvisor”), a registered investment adviser and awholly-owned investment advisory subsidiary of Swank Capital, serves as Subadvisor to the MainStay Cushing Funds and is responsible for theday-to-day portfolio management of the MainStay Cushing Funds. Pursuant to the terms of a Subadvisory Agreement (“Subadvisory Agreement”) between New York Life Investments and Cushing® Asset Management LP, New York Life Investments pays for the services of the Subadvisor.
Under the Management Agreement, the MainStay Cushing Energy Income Fund pays the Manager a monthly fee for services performed and facilities furnished at an annual rate of 0.95% of the Fund’s average daily net assets.
Under the Management Agreement, the MainStay Cushing MLP Premier Fund pays the Manager a monthly fee for services performed and facilities furnished at an annual rate of the Fund’s average daily net assets as follows: 1.10% up to $3 billion and 1.05% over $3 billion.
Under the Management Agreement, the MainStay Cushing Renaissance Advantage Fund pays the Manager a monthly fee for services performed and facilities furnished at an annual rate of the Fund’s average daily net assets as follows: 1.10% up to $500 million and 1.05% over $500 million.
MainStay Cushing Energy Income Fund
New York Life Investments has contractually agreed to waive a portion of the MainStay Cushing Energy Income Fund’s management fees and/or reimburse expenses so that Total Annual Fund Operating Expenses (excluding taxes, deferred income tax expenses, interest, litigation, extraordinary expenses, brokerage and other transaction expenses relating to the purchase or sale of portfolio investments and acquired (underlying) fund fees and expenses) of Class A shares do not exceed 1.45% of its average daily net assets. New York Life Investments will apply an equivalent waiver or reimbursement, in an equal number of basis points, to the other share classes. This agreement will remain in effect until March 31, 2020, and shall renew automatically for one-year terms unless New York Life Investments provides written notice of termination prior to the start of the next term or upon approval of the Board.
MainStay Cushing MLP Premier Fund
New York Life Investments has contractually agreed to waive a portion of the MainStay Cushing MLP Premier Fund’s management fees and/or reimburse expenses so that Total Annual Fund Operating Expenses (excluding taxes, interest, litigation, extraordinary expenses, brokerage and other transaction expenses relating to the purchase or sale of portfolio investments, and acquired (underlying) fund fees and expenses) of Class R6 do not exceed those of Class I. This agreement will remain in effect until March 31, 2020, and shall renew automatically for one-year terms unless New York Life Investments provides written notice of termination prior to the start of the next term or upon approval of the Board.
MainStay Cushing Renaissance Advantage Fund
New York Life Investments has contractually agreed to waive a portion of the MainStay Cushing Renaissance Advantage Fund’s management fees and/or reimburse expenses so that Total Annual Fund Operating Expenses (excluding taxes, interest, litigation, extraordinary expenses, brokerage and other transaction expenses relating to the purchase or sale of portfolio investments and acquired (underlying) fund fees and expenses) of Class A shares do not exceed 1.61% of its average daily net assets. New York Life Investments will apply an equivalent waiver or reimbursement, in an equal number of basis points, to the other share classes. This agreement will remain in effect until March 31, 2020, and shall renew automatically for one-year terms unless New York Life Investments provides written notice of termination prior to the start of the next term or upon approval of the Board.
For the six months ended May 31, 2019, New York Life Investments earned fees from the MainStay Cushing Funds, waived its fees and/or reimbursed expenses, and paid the Subadvisor as follows:
| | | | | | | | | | | | |
| | | Fees
Earned | | | Fees
Waived/
Reimbursed | | | Subadvisor
Payments | |
MainStay Cushing Energy Income Fund | | $ | 160,745 | | | $ | 87,174 | | | $ | 36,786 | |
MainStay Cushing MLP Premier Fund | | | 7,051,260 | | | | — | | | | 3,525,630 | |
MainStay Cushing Renaissance Advantage Fund | | | 447,700 | | | | 42,290 | | | | 203,445 | |
U.S. Bancorp Fund Services, LLC, d/b/a U.S. Bank Global Fund Services (“Fund Services”) providessub-administration andsub-accounting services to the MainStay Cushing Funds pursuant to an agreement with New York Life Investments. These services include calculating the daily NAVs of the MainStay Cushing Funds, maintaining the general ledger andsub-ledger accounts for the calculation of the MainStay Cushing Funds’ respective NAVs, and assisting New York Life Investments in conducting various aspects of the MainStay Cushing Funds’ administrative operations. For providing these services to the MainStay Cushing Funds, Fund Services is compensated by New York Life Investments.
(B) Distribution and Service Fees. The Trust, on behalf of the MainStay Cushing Funds, has entered into a distribution agreement with NYLIFE Distributors LLC (the “Distributor”), an indirect,wholly-owned subsidiary of New York Life. The MainStay Cushing Funds have adopted
Notes to Financial Statements(Unaudited) (continued)
distribution plans (the “Plans”) in accordance with the provisions of Rule 12b-1 under the 1940 Act.
Pursuant to the Class A and Investor Class Plans, the Distributor receives a monthly distribution fee from the Class A and Investor Class shares, at an annual rate of 0.25% of the average daily net assets of the Class A and Investor Class shares for distribution and/or service activities as designated by the Distributor. Pursuant to the Class C Plan, Class C shares pay the Distributor a monthly distribution fee at an annual rate of 0.75% of the average daily net assets of the Class C shares, along with a service fee at an annual rate of 0.25% of the average daily net assets of the Class C shares, for a total 12b-1 fee of 1.00%. Class I and Class R6 shares are not subject to a distribution and/or service fee.
The Plans provide that the distribution and service fees are payable to the Distributor regardless of the amounts actually expended by the Distributor for distribution of the MainStay Cushing Funds’ shares and service activities.
(C) Sales Charges. The MainStay Cushing Funds were advised by the Distributor that the amounts of initial sales charges retained on sales of Class A and Investor Class shares for the six months ended May 31, 2019, were as follows:
| | | | |
MainStay Cushing Energy Income Fund | | | | |
| |
Class A | | $ | 467 | |
Investor Class | | | 228 | |
| |
| | | | |
MainStay Cushing MLP Premier Fund | |
| |
Class A | | $ | 54,244 | |
Investor Class | | | 864 | |
| |
| | | | |
MainStay Cushing Renaissance Advantage Fund | |
| |
Class A | | $ | 1,462 | |
Investor Class | | | 285 | |
The MainStay Cushing Funds were also advised that the Distributor retained CDSCs on redemptions of Class A, Investor Class and Class C shares, for the six months ended May 31, 2019, were as follows:
| | | | |
MainStay Cushing Energy Income Fund | |
Class C | | $ | 472 | |
| |
| | | | |
MainStay Cushing MLP Premier Fund | |
| |
Class A | | $ | 28,925 | |
Class C | | | 37,008 | |
| |
| | | | |
MainStay Cushing Renaissance Advantage Fund | |
| |
Class A | | $ | 100 | |
Class C | | | 70 | |
(D) Transfer, Dividend Disbursing and Shareholder Servicing Agent. NYLIM Service Company LLC, an affiliate of New York Life Investments, is the MainStay Cushing Funds’ transfer, dividend disbursing and shareholder servicing agent pursuant to an agreement between NYLIM Service Company LLC and the Trust. NYLIM Service Company LLC has entered into an agreement with DST Asset
Manager Solutions, Inc. (“DST”), formerly known as Boston Financial Data Services, Inc. pursuant to which DST performs certain transfer agent services on behalf of NYLIM Service Company LLC. Transfer agent expenses incurred by the MainStay Cushing Funds’ share classes for the six months ended May 31, 2019, were as follows:
| | | | |
MainStay Cushing Energy Income Fund | |
| |
Class A | | $ | 23,089 | |
Investor Class | | | 4,209 | |
Class C | | | 17,338 | |
Class I | | | 6,197 | |
| |
| | | | |
MainStay Cushing MLP Premier Fund | |
| |
Class A | | $ | 146,168 | |
Investor Class | | | 1,546 | |
Class C | | | 222,935 | |
Class I | | | 322,070 | |
| |
| | | | |
MainStay Cushing Renaissance Advantage Fund | |
| |
Class A | | $ | 12,071 | |
Investor Class | | | 3,614 | |
Class C | | | 14,679 | |
Class I | | | 34,104 | |
(E) Small Account Fee. Shareholders with small accounts adversely impact the cost of providing transfer agency services. In an effort to reduce total transfer agency expenses, the MainStay Cushing Funds have implemented a small account fee on certain types of accounts. Certain shareholders with an account balance of less than $1,000 are charged an annual per account fee of $20 (assessed semi-annually), the proceeds from which offset transfer agent fees as reflected in the Statement of Operations.
Note 4–Federal Income Tax
MainStay Cushing Energy Income Fund
As of May 31, 2019, the cost and unrealized appreciation (depreciation) of the Fund’s investment portfolio, including other financial instruments, as determined on a federal income tax basis, were as follows:
| | | | | | | | | | | | | | | | |
| | | Federal Tax
Cost | | | Gross
Unrealized
Appreciation | | | Gross
Unrealized
Depreciation | | | Net
Unrealized
Appreciation/
(Depreciation) | |
Investments in Securities | | $ | 31,859,855 | | | $ | 2,435,321 | | | $ | (5,954,561 | ) | | $ | (3,519,240 | ) |
Under the Regulated Investment Company Modernization Act of 2010, the Fund is permitted to carry forward capital losses incurred in taxable years beginning with November 30, 2016 (the Fund’s initial year electing to be taxed as a Regulated Investment Company) for an unlimited period. However, any losses incurred during future years will be required to be utilized prior to the losses incurred in its previous tax years when it was taxed as a C-corporation. As a result of this ordering rule, prior year capital loss carryforwards subject to expiration may be more likely to expire unused. Additionally, future capital losses that are
| | |
| 54 | | MainStay Cushing Funds |
carried forward will retain their character as eithershort-term orlong-term capital losses rather than being considered allshort-term as under previous law.
As of November 30, 2018, for federal income tax purposes, capital loss carryforwards of $235,385,925 were available as shown in the table below, to the extent provided by the Internal Revenue Code, to offset future realized capital gains through the years indicated:
| | | | | | | | |
Capital Loss
Available Through | | Short-Term
Capital Loss
Amounts (000’s) | | | Long-Term
Capital Loss
Amounts (000’s) | |
| 2019 | | $ | 3,091 | | | $ | — | |
| 2020 | | | 117,036 | | | | — | |
| | |
| Unlimited | | | 53,768 | | | | 61,491 | |
| | |
| Total | | $ | 173,895 | | | $ | 61,491 | |
The Fund had $1,371,868 of capital loss carryforwards that expired during the year ended November 30, 2018.
MainStay Cushing MLP Premier Fund
As of May 31, 2019, the cost and unrealized appreciation (depreciation) of the Fund’s investment portfolio, including other financial instruments, as determined on a federal income tax basis, were as follows:
| | | | | | | | | | | | | | | | |
| | | Federal Tax
Cost | | | Gross
Unrealized
Appreciation | | | Gross
Unrealized
Depreciation | | | Net
Unrealized
Appreciation/
(Depreciation) | |
Investments in Securities | | $ | 987,277,688 | | | $ | 265,236,663 | | | $ | (20,710,001 | ) | | $ | 244,526,662 | |
Deferred income taxes reflect the net tax effect of temporary differences between the carrying amount of assets and liabilities for financial reporting and tax purposes. Components of the MainStay Cushing MLP Premier Fund deferred tax assets as of May 31, 2019, are as follows:
| | | | |
MainStay Cushing MLP Premier Fund | |
| |
Deferred tax assets | | | | |
Federal net operating loss carryforward | | $ | 36,859,546 | |
State net operating loss carryforward | | | 4,632,853 | |
Capital loss carryforward | | | 91,914,538 | |
| Total deferred tax assets | | | 133,406,937 | |
Less deferred tax liabilities Net unrealized appreciation on investment in securities | | | 60,731,558 | |
Net deferred tax asset (liability) before valuation allowance Less: valuation allowance | | | 72,675,379 | |
Total net deferred tax asset (liability) | | $ | — | |
The MainStay Cushing MLP Premier Fund periodically reviews the recoverability of its deferred tax asset, if any, based on the weight of available evidence. When assessing the recoverability of the MainStay Cushing MLP Premier Fund’s deferred tax asset, significant weight is given to the effects of potential future realized and unrealized gains on investments, and the period over which this deferred tax asset can be realized. Unexpected significant decreases in cash distributions from the MainStay Cushing MLP Premier Fund’s MLP investments or significant declines in the fair value of its investments may change the MainStay
Cushing MLP Premier Fund’s assessment regarding the recoverability of its deferred tax assets and may result in a valuation allowance. The MainStay Cushing MLP Premier Fund will continue to assess the need to record a valuation allowance in the future. If a valuation allowance is required to reduce any deferred tax asset in the future, it could have a material impact on the MainStay Cushing MLP Premier Fund’s net asset value and results of operations in the period it is recovered.
The MainStay Cushing MLP Premier Fund may rely, to some extent, on information provided by the MLPs, which may not necessarily be timely, to estimate taxable income allocable to MLP units held in its portfolio and to estimate its associated deferred tax benefit (liability). Such estimates are made in good faith. From time to time, as new information becomes available, the MainStay Cushing MLP Premier Fund will modify its estimates or assumptions regarding its tax benefit (liability).
The MainStay Cushing MLP Premier Fund’s net operating loss carryforward and capital loss carryforward are available to offset its future taxable income. For C-corporations, capital losses can only be used to offset capital gains and cannot be used to offset ordinary income. Capital losses of C-corporations may be carried forward for five years and, accordingly, would begin to expire as of November 30, 2020. Net operating losses of C-corporations prior to The Tax Cuts and Jobs Act of 2017 can be carried forward for 20 years and, accordingly, would begin to expire as of November 30, 2030. Any net operating losses arising in tax years ending after December 31, 2017 will have an indefinite carryforward period. Further, as the MainStay Cushing MLP Premier Fund is a fiscal year taxpayer, the 80% limitation on the use of Federal net operating losses will begin to apply for Federal net operating losses created in the tax year ended November 30, 2019. Further, as the MainStay Cushing MLP Premier Fund is a fiscal year taxpayer, the 80% limitation on the use of Federal net operating losses will begin to apply for Federal net operating losses created in the tax year ended November 30, 2019. The MainStay Cushing MLP Premier Fund has state net operating losses with various expiration dates. The MainStay Cushing MLP Premier Fund has the following net operating loss carryover and capital loss carryover amounts:
| | | | | | |
| MainStay Cushing MLP Premier Fund |
Fiscal Year Ended
Net Operating Loss | | Amount | | | Expiration |
| November 30, 2014 | | $ | 28,547,292 | | | November 30, 2034 |
| November 30, 2015 | | | 51,787,077 | | | November 30, 2035 |
| November 30, 2016 | | | 21,362,379 | | | November 30, 2036 |
| November 30, 2017 | | | 56,386,418 | | | November 30, 2037 |
| November 30, 2018 | | | — | | | Indefinite |
| November 30, 2019 | | | 17,438,480 | | | Indefinite |
| | | | | | |
| Total | | $ | 175,521,646 | | | |
| | | | | | |
| | | | | | |
Fiscal Year Ended Capital Loss | | Amount | | | Expiration |
| | |
November 30, 2015 | | $ | 61,574,275 | | | November 30, 2020 |
| November 30, 2016 | | | 308,877,920 | | | November 30, 2021 |
| November 30, 2017 | | | — | | | November 30, 2022 |
| November 30, 2018 | | | — | | | November 30, 2023 |
| November 30, 2019 | | | 18,365,796 | | | November 30, 2024 |
| | | | | | |
| Total | | $ | 388,817,991 | | | |
| | | | | | |
The MainStay Cushing MLP Premier Fund’s total income tax benefit (current and deferred) differs from the amount computed by applying the federal statutory income tax rate of 21% to net investment income
Notes to Financial Statements(Unaudited) (continued)
and realized and unrealized gains (losses) on investments before taxes as of May 31, 2019, as follows:
| | | | |
| | | MainStay
Cushing MLP
Premier Fund | |
| |
Income tax provision (benefit) at the federal statutory rate of 21% | | $ | 7,129,100 | |
State income tax (benefit), net of federal benefit | | | 896,052 | |
Permanent differences, net | | | (587,825 | ) |
Change in valuation allowance from current activity | | | (7,437,327 | ) |
| | | | |
Total tax expense (benefit) | | $ | — | |
| | | | |
MainStay Cushing Renaissance Advantage Fund
As of May 31, 2019, the cost and unrealized appreciation (depreciation) of the Fund’s investment portfolio, including other financial instruments, as determined on a federal income tax basis, were as follows:
| | | | | | | | | | | | | | | | |
| | | Federal Tax
Cost | | | Gross
Unrealized
Appreciation | | | Gross
Unrealized
Depreciation | | | Net
Unrealized
Appreciation/
(Depreciation) | |
Investments in Securities | | $ | 64,854,853 | | | $ | 2,616,677 | | | $ | (8,374,307 | ) | | $ | (5,757,630 | ) |
As of November 30, 2018, for federal income tax purposes, capital loss carryforwards of $55,682,889 were available as shown in the table below, to the extent provided by the Internal Revenue Code, to offset future realized capital gains through the years indicated.
| | | | |
Capital Loss
Available Through | | Short-Term
Capital Loss
Amounts (000’s) | | Long-Term
Capital Loss
Amounts (000’s) |
| | |
| Unlimited | | $51,903 | | $3,780 |
The tax character of distributions paid by the MainStay Cushing Funds during the year ended November 30, 2018 shown in the Statements of Changes in Net Assets was as follows:
| | | | | | | | | | | | |
| |
| | | 2018 | |
| | | Tax Based
Distributions
from Ordinary
Income | | | Tax Based
Distributions
from Return
of Capital | | | Total | |
MainStay Cushing Energy Income Fund | | $ | 906,116 | | | $ | 1,323,772 | | | $ | 2,229,888 | |
MainStay Cushing MLP Premier Fund | | | — | | | | 157,786,614 | | | | 157,786,614 | |
MainStay Cushing Renaissance Advantage Fund | | | — | | | | 3,192,276 | | | | 3,192,276 | |
Note 5–Custodian
U.S. Bank, N.A. is the custodian of cash and securities held by the MainStay Cushing Funds. Custodial fees are charged to the MainStay Cushing Funds based on the MainStay Cushing Fund’s net assets and/or the market value of securities held by the MainStay Cushing Funds and the number of certain cash transactions incurred by the MainStay Cushing Funds.
Note 6–Line of Credit
The MainStay Cushing Funds and certain other funds managed by New York Life Investments maintain a line of credit with a syndicate of banks in order to secure a source of funds for temporary purposes to meet unanticipated or excessive redemption requests.
Effective July 31, 2018, under the credit agreement (the “Credit Agreement”), the aggregate commitment amount is $600,000,000 with an additional uncommitted amount of $100,000,000. The commitment fee is an annual rate of 0.15% of the average commitment amount payable quarterly, regardless of usage, to State Street, who serves as the agent to the syndicate. The commitment fee is allocated among each MainStay Cushing Fund and certain other funds managed by New York Life Investments based upon their respective net assets and other factors. Interest on any revolving credit loan is charged based upon the Federal Funds Rate or the one month London InterBank Offered Rate, whichever is higher. The Credit Agreement expires on July 30, 2019, although the MainStay Cushing Funds, certain other funds managed by New York Life Investments and the syndicate of banks may renew the Credit Agreement for an additional year on the same or different terms. During the six months ended May 31, 2019, there were no borrowings made or outstanding with respect to the MainStay Cushing Funds under the Credit Agreement.
Note 7–Interfund Lending Program
Pursuant to an exemptive order issued by the SEC, the MainStay Cushing Funds, along with certain other funds managed by New York Life Investments, may participate in an interfund lending program. The interfund lending program provides an alternative credit facility that permits the MainStay Cushing Funds and certain other funds managed by New York Life Investments to lend or borrow money for temporary purposes directly to or from one another, subject to the conditions of the exemptive order. During the six months ended May 31, 2019, there were no interfund loans made or outstanding with respect to the MainStay Cushing Funds.
Note 8–Purchases and Sales of Securities (in 000’s)
For the six months ended May 31, 2019, purchases and sales of securities, other thanshort-term securities, were as follows:
| | | | | | | | |
| | | Purchases | | | Sales | |
MainStay Cushing Energy Income Fund | | $ | 7,888 | | | $ | 12,067 | |
MainStay Cushing MLP Premier Fund | | | 451,440 | | | | 518,265 | |
MainStay Cushing Renaissance Advantage Fund | | | 57,823 | | | | 81,780 | |
| | |
| 56 | | MainStay Cushing Funds |
Note 9–Capital Share Transactions
MainStay Cushing Energy Income Fund
| | | | | | | | |
Class A | | Shares | | | Amount | |
| | |
Six-month period ended May 31, 2019: | | | | | | | | |
Shares sold | | | 165,128 | | | $ | 617,129 | |
Shares issued to shareholders in reinvestment of dividends and distributions | | | 126,973 | | | | 484,678 | |
Shares redeemed | | | (945,412 | ) | | | (3,511,861 | ) |
| | | | | | | | |
Net increase (decrease) in shares before conversion | | | (653,311 | ) | | | (2,410,054 | ) |
Shares converted into Class A (See Note 1) | | | 24,344 | | | | 92,366 | |
Shares converted from Class A (See Note 1) | | | (46,919 | ) | | | (177,822 | ) |
| | | | | | | | |
Net increase (decrease) | | | (675,886 | ) | | $ | (2,495,510 | ) |
| | | | | | | | |
Year ended November 30, 2018: | | | | | | | | |
Shares sold | | | 317,858 | | | $ | 1,427,849 | |
Shares issued to shareholders in reinvestment of dividends and distributions | | | 273,141 | | | | 1,258,545 | |
Shares redeemed | | | (2,371,474 | ) | | | (10,609,363 | ) |
| | | | | | | | |
Net increase (decrease) in shares before conversion | | | (1,780,475 | ) | | | (7,922,969 | ) |
Shares converted into Class A (See Note 1) | | | 76,892 | | | | 345,711 | |
Shares converted from Class A (See Note 1) | | | (9,527 | ) | | | (42,068 | ) |
| | | | | | | | |
Net increase (decrease) | | | (1,713,110 | ) | | $ | (7,619,326 | ) |
| | | | | | | | |
| | |
| | | | | | | | |
Investor Class | | Shares | | | Amount | |
Six-month period ended May 31, 2019: | | | | | | | | |
Shares sold | | | 11,242 | | | $ | 42,149 | |
Shares issued to shareholders in reinvestment of dividends and distributions | | | 12,680 | | | | 48,235 | |
Shares redeemed | | | (59,616 | ) | | | (222,950 | ) |
| | | | | | | | |
Net increase (decrease) in shares before conversion | | | (35,694 | ) | | | (132,566 | ) |
Shares converted into Investor Class (See Note 1) | | | 59,162 | | | | 222,802 | |
Shares converted from Investor Class (See Note 1) | | | (20,090 | ) | | | (75,949 | ) |
| | | | | | | | |
Net increase (decrease) | | | 3,378 | | | $ | 14,287 | |
| | | | | | | | |
Year ended November 30, 2018: | | | | | | | | |
Shares sold | | | 31,136 | | | $ | 140,622 | |
Shares issued to shareholders in reinvestment of dividends and distributions | | | 25,002 | | | | 114,760 | |
Shares redeemed | | | (118,888 | ) | | | (534,326 | ) |
| | | | | | | | |
Net increase (decrease) in shares before conversion | | | (62,750 | ) | | | (278,944 | ) |
Shares converted into Investor Class (See Note 1) | | | 9,555 | | | | 42,068 | |
Shares converted from Investor Class (See Note 1) | | | (77,193 | ) | | | (345,711 | ) |
| | | | | | | | |
Net increase (decrease) | | | (130,388 | ) | | $ | (582,587 | ) |
| | | | | | | | |
| | | | | | | | |
Class C | | Shares | | | Amount | |
Six-month period ended May 31, 2019: | | | | | | | | |
Shares sold | | | 373,316 | | | $ | 1,288,386 | |
Shares issued to shareholders in reinvestment of dividends and distributions | | | 48,949 | | | | 178,970 | |
Shares redeemed | | | (636,858 | ) | | | (2,254,225 | ) |
| | | | | | | | |
Net increase (decrease) in shares before conversion | | | (214,593 | ) | | | (786,869 | ) |
Shares converted from Class C (See Note 1) | | | (16,992 | ) | | | (61,397 | ) |
| | | | | | | | |
Net increase (decrease) | | | (231,585 | ) | | | (848,266 | ) |
| | | | | | | | |
Year ended November 30, 2018: | | | | | | | | |
Shares sold | | | 199,695 | | | $ | 847,854 | |
Shares issued to shareholders in reinvestment of dividends and distributions | | | 103,656 | | | | 458,596 | |
Shares redeemed | | | (1,041,987 | ) | | | (4,518,937 | ) |
| | | | | | | | |
Net increase (decrease) | | | (738,636 | ) | | $ | (3,212,487 | ) |
| | | | | | | | |
| | |
| | | | | | | | |
Class I | | Shares | | | Amount | |
Six-month period ended May 31, 2019: | | | | | | | | |
Shares sold | | | 1,239,854 | | | $ | 4,557,831 | |
Shares issued to shareholders in reinvestment of dividends and distributions | | | 35,724 | | | | 138,126 | |
Shares redeemed | | | (1,562,593 | ) | | | (5,876,796 | ) |
| | | | | | | | |
Net increase (decrease) | | | (287,015 | ) | | $ | (1,180,839 | ) |
| | | | | | | | |
Year ended November 30, 2018: | | | | | | | | |
Shares sold | | | 413,811 | | | $ | 1,874,705 | |
Shares issued to shareholders in reinvestment of dividends and distributions | | | 72,285 | | | | 336,972 | |
Shares redeemed | | | (1,679,563 | ) | | | (7,697,784 | ) |
| | | | | | | | |
Net increase (decrease) | | | (1,193,467 | ) | | $ | (5,486,107 | ) |
| | | | | | | | |
|
| MainStay Cushing MLP Premier Fund | |
Class A | | Shares | | | Amount | |
| | |
Six-month period ended May 31, 2019: | | | | | | | | |
Shares sold | | | 2,992,219 | | | $ | 32,005,173 | |
Shares issued to shareholders in reinvestment of dividends and distributions | | | 1,173,756 | | | | 12,287,170 | |
Shares redeemed | | | (4,433,751 | ) | | | (46,791,849 | ) |
| | | | | | | | |
Net increase (decrease) in shares before conversion | | | (267,776 | ) | | | (2,499,506 | ) |
Shares converted into Class A (See Note 1) | | | 11,913 | | | | 130,238 | |
Shares converted from Class A (See Note 1) | | | (4,414 | ) | | | (49,111 | ) |
| | | | | | | | |
Net increase (decrease) | | | (260,277 | ) | | $ | (2,418,379 | ) |
| | | | | | | | |
Year ended November 30, 2018: | | | | | | | | |
Shares sold | | | 9,464,495 | | | $ | 112,910,979 | |
Shares issued to shareholders in reinvestment of dividends and distributions | | | 2,755,086 | | | | 32,018,777 | |
Shares redeemed | | | (8,727,644 | ) | | | (103,054,310 | ) |
| | | | | | | | |
Net increase (decrease) in shares before conversion | | | 3,491,937 | | | | 41,875,446 | |
Shares converted into Class A (See Note 1) | | | 142,515 | | | | 1,697,297 | |
Shares converted from Class A (See Note 1) | | | (33,565 | ) | | | (383,629 | ) |
| | | | | | | | |
Net increase (decrease) | | | 3,600,887 | | | $ | 43,189,114 | |
| | | | | | | | |
Notes to Financial Statements(Unaudited) (continued)
| | | | | | | | |
Investor Class | | Shares | | | Amount | |
Six-month period ended May 31, 2019: | | | | | | | | |
Shares sold | | | 29,272 | | | $ | 320,418 | |
Shares issued to shareholders in reinvestment of dividends and distributions | | | 10,949 | | | | 114,792 | |
Shares redeemed | | | (25,374 | ) | | | (275,538 | ) |
| | | | | | | | |
Net increase (decrease) in shares before conversion | | | 14,847 | | | | 159,672 | |
Shares converted into Investor Class (See Note 1) | | | 2,318 | | | | 25,685 | |
Shares converted from Investor Class (See Note 1) | | | (6,048 | ) | | | (65,557 | ) |
| | | | | | | | |
Net increase (decrease) | | | 11,117 | | | $ | 119,800 | |
| | | | | | | | |
Year ended November 30, 2018: | | | | | | | | |
Shares sold | | | 64,915 | | | $ | 772,734 | |
Shares issued to shareholders in reinvestment of dividends and distributions | | | 25,691 | | | | 298,831 | |
Shares redeemed | | | (42,332 | ) | | | (500,791 | ) |
| | | | | | | | |
Net increase (decrease) in shares before conversion | | | 48,274 | | | | 570,774 | |
Shares converted into Investor Class (See Note 1) | | | 18,185 | | | | 198,590 | |
Shares converted from Investor Class (See Note 1) | | | (48,046 | ) | | | (562,959 | ) |
| | | | | | | | |
Net increase (decrease) | | | 18,413 | | | $ | 206,405 | |
| | | | | | | | |
| | |
| | | | | | | | |
Class C | | Shares | | | Amount | |
Six-month period ended May 31, 2019: | | | | | | | | |
Shares sold | | | 2,774,186 | | | $ | 26,654,164 | |
Shares issued to shareholders in reinvestment of dividends and distributions | | | 1,978,256 | | | | 18,762,182 | |
Shares redeemed | | | (6,651,105 | ) | | | (63,283,899 | ) |
| | | | | | | | |
Net increase (decrease) in shares before conversion | | | (1,898,663 | ) | | | (17,867,553 | ) |
Shares converted from Class C (See Note 1) | | | (20,743 | ) | | | (206,788 | ) |
| | | | | | | | |
Net increase (decrease) | | | (1,919,406 | ) | | $ | (18,074,341 | ) |
| | | | | | | | |
Year ended November 30, 2018: | | | | | | | | |
Shares sold | | | 8,349,085 | | | $ | 92,347,339 | |
Shares issued to shareholders in reinvestment of dividends and distributions | | | 4,991,445 | | | | 53,323,283 | |
Shares redeemed | | | (13,288,958 | ) | | | (144,336,678 | ) |
| | | | | | | | |
Net increase (decrease) in shares before conversion | | | 51,572 | | | | 1,333,944 | |
Shares converted into Class C (See Note 1) | | | 1,618 | | | | 17,620 | |
Shares converted from Class C (See Note 1) | | | (48,459 | ) | | | (558,792 | ) |
| | | | | | | | |
Net increase (decrease) | | | 4,731 | | | $ | 792,772 | |
| | | | | | | | |
| | | | | | | | |
Class I | | Shares | | | Amount | |
Six-month period ended May 31, 2019: | | | | | | | | |
Shares sold | | | 16,527,062 | | | $ | 177,508,017 | |
Shares issued to shareholders in reinvestment of dividends and distributions | | | 2,471,758 | | | | 26,676,737 | |
Shares redeemed | | | (25,877,544 | ) | | | (276,984,930 | ) |
| | | | | | | | |
Net increase (decrease) in shares before conversion | | | (6,878,724 | ) | | | (72,800,176 | ) |
Shares converted into Class I (See Note 1) | | | 14,540 | | | | 165,533 | |
| | | | | | | | |
Net increase (decrease) | | | (6,864,184 | ) | | $ | (72,634,643 | ) |
| | | | | | | | |
Year ended November 30, 2018: | | | | | | | | |
Shares sold | | | 33,983,472 | | | $ | 412,401,244 | |
Shares issued to shareholders in reinvestment of dividends and distributions | | | 5,884,972 | | | | 70,189,317 | |
Shares redeemed | | | (24,038,261 | ) | | | (290,707,835 | ) |
| | | | | | | | |
Net increase (decrease) in shares before conversion | | | 15,830,183 | | | | 191,882,726 | |
Shares converted into Class I (See Note 1) | | | 58,150 | | | | 743,831 | |
Shares converted from Class I (See Note 1) | | | (93,314 | ) | | | (1,151,958 | ) |
| | | | | | | | |
Net increase (decrease) | | | 15,795,019 | | | $ | 191,474,599 | |
| | | | | | | | |
|
| MainStay Cushing Renaissance Advantage Fund | |
Class A | | Shares | | | Amount | |
| | |
Six-month period ended May 31, 2019: | | | | | | | | |
Shares sold | | | 109,846 | | | $ | 1,836,744 | |
Shares issued to shareholders in reinvestment of dividends and distributions | | | 16,116 | | | | 286,478 | |
Shares redeemed | | | (203,877 | ) | | | (3,465,962 | ) |
| | | | | | | | |
Net increase (decrease) in shares before conversion | | | (77,915 | ) | | | (1,342,740 | ) |
Shares converted into Class A (See Note 1) | | | 8,046 | | | | 140,435 | |
Shares converted from Class A (See Note 1) | | | (12,100 | ) | | | (210,653 | ) |
| | | | | | | | |
Net increase (decrease) | | | (81,969 | ) | | $ | (1,412,958 | ) |
| | | | | | | | |
Year ended November 30, 2018: | | | | | | | | |
Shares sold | | | 224,700 | | | $ | 4,872,353 | |
Shares issued to shareholders in reinvestment of dividends and distributions | | | 30,822 | | | | 651,908 | |
Shares redeemed | | | (510,639 | ) | | | (10,825,751 | ) |
| | | | | | | | |
Net increase (decrease) in shares before conversion | | | (255,117 | ) | | | (5,301,490 | ) |
Shares converted into Class A (See Note 1) | | | 28,844 | | | | 616,036 | |
Shares converted from Class A (See Note 1) | | | (3,391 | ) | | | (70,804 | ) |
| | | | | | | | |
Net increase (decrease) | | | (229,664 | ) | | $ | (4,756,258 | ) |
| | | | | | | | |
| | |
| 58 | | MainStay Cushing Funds |
| | | | | | | | |
Investor Class | | Shares | | | Amount | |
Six-month period ended May 31, 2019: | | | | | | | | |
Shares sold | | | 4,719 | | | $ | 81,423 | |
Shares issued to shareholders in reinvestment of dividends and distributions | | | 2,140 | | | | 37,873 | |
Shares redeemed | | | (11,739 | ) | | | (205,426 | ) |
| | | | | | | | |
Net increase (decrease) in shares before conversion | | | (4,880 | ) | | | (86,130 | ) |
Shares converted into Investor Class (See Note 1) | | | 13,569 | | | | 234,928 | |
Shares converted from Investor Class (See Note 1) | | | (6,866 | ) | | | (118,943 | ) |
| | | | | | | | |
Net increase (decrease) | | | 1,823 | | | $ | 29,855 | |
| | | | | | | | |
Year ended November 30, 2018: | | | | | | | | |
Shares sold | | | 17,984 | | | $ | 378,915 | |
Shares issued to shareholders in reinvestment of dividends and distributions | | | 3,785 | | | | 79,505 | |
Shares redeemed | | | (24,577 | ) | | | (514,994 | ) |
| | | | | | | | |
Net increase (decrease) in shares before conversion | | | (2,808 | ) | | | (56,574 | ) |
Shares converted into Investor Class (See Note 1) | | | 3,405 | | | | 70,804 | |
Shares converted from Investor Class (See Note 1) | | | (28,961 | ) | | | (616,036 | ) |
| | | | | | | | |
Net increase (decrease) | | | (28,364 | ) | | $ | (601,806 | ) |
| | | | | | | | |
| | |
| | | | | | | | |
Class C | | Shares | | | Amount | |
Six-month period ended May 31, 2019: | | | | | | | | |
Shares sold | | | 10,904 | | | $ | 172,573 | |
Shares issued to shareholders in reinvestment of dividends and distributions | | | 8,893 | | | | 149,862 | |
Shares redeemed | | | (134,793 | ) | | | (2,123,729 | ) |
| | | | | | | | |
Net increase (decrease) in shares before conversion | | | (114,996 | ) | | | (1,801,294 | ) |
Shares converted from Class C (See Note 1) | | | (2,759 | ) | | | (45,767 | ) |
| | | | | | | | |
Net increase (decrease) | | | (117,755 | ) | | | (1,847,061 | ) |
| | | | | | | | |
Year ended November 30, 2018: | | | | | | | | |
Shares sold | | | 140,151 | | | $ | 2,906,622 | |
Shares issued to shareholders in reinvestment of dividends and distributions | | | 19,936 | | | | 403,263 | |
Shares redeemed | | | (372,360 | ) | | | (7,538,711 | ) |
| | | | | | | | |
Net increase (decrease) | | | (212,273 | ) | | $ | (4,228,826 | ) |
| | | | | | | | |
| | |
| | | | | | | | |
Class I | | Shares | | | Amount | |
Six-month period ended May 31, 2019: | | | | | | | | |
Shares sold | | | 676,265 | | | $ | 10,763,274 | |
Shares issued to shareholders in reinvestment of dividends and distributions | | | 44,994 | | | | 810,962 | |
Shares redeemed | | | (1,818,966 | ) | | | (31,744,541 | ) |
| | | | | | | | |
Net increase (decrease) in shares before conversion | | | (1,097,707 | ) | | | (20,170,305 | ) |
| | | | | | | | |
Net increase (decrease) | | | (1,097,707 | ) | | $ | (20,170,305 | ) |
| | | | | | | | |
Year ended November 30, 2018: | | | | | | | | |
Shares sold | | | 611,218 | | | $ | 13,103,931 | |
Shares issued to shareholders in reinvestment of dividends and distributions | | | 90,569 | | | | 1,940,536 | |
Shares redeemed | | | (3,088,888 | ) | | | (67,124,225 | ) |
| | | | | | | | |
Net increase (decrease) in shares before conversion | | | (2,387,101 | ) | | | (52,079,758 | ) |
| | | | | | | | |
Net increase (decrease) | | | (2,387,101 | ) | | $ | (52,079,758 | ) |
| | | | | | | | |
Note 10–Recent Accounting Pronouncement
To improve the effectiveness of fair value disclosure requirements, the Financial Accounting Standards Board recently issued Accounting Standard Update (ASU)2018-13, Fair Value Measurement Disclosure Framework—Changes to the Disclosure Requirements for Fair Value Measurement (ASU2018-13), which adds, removes, and modifies certain aspects relating to fair value disclosure. ASU2018-13 is effective for interim and annual reporting periods beginning after December 15, 2019; early adoption of the additions relating to ASU2018-13 is not required. Management has evaluated the implications of certain other provisions of the ASU and has determined to early adopt aspects related to the removal and modifications of certain fair value measurement disclosures under the ASU effective immediately. At this time, management is evaluating the implications of certain other provisions of the ASU related to new disclosure requirements and any impact on the financial statement disclosures has not yet been determined.
Note 11–Subsequent Events
In connection with the preparation of the financial statements of the MainStay Cushing Funds as of and for the six months ended May 31, 2019, events and transactions subsequent to May 31, 2019, through the date the financial statements were issued have been evaluated by the MainStay Cushing Funds’ management for possible adjustment and/or disclosure. No subsequent events requiring financial statement adjustment or disclosure have been identified other than the following:
On July 19, 2019 the MainStay Cushing Energy Income Fund declared distributions of $0.0403, $0.0387, $0.0324 and $0.0429 per share, to Class A shareholders, Investor Class shareholders, Class C shareholders and Class I shareholders of record on July 18, 2019, and payable on July 19, 2019.
On June 28, 2019, the MainStay Cushing MLP Premier Fund declared a distribution payable of $0.0750 per share, to Class A shareholders, Investor Class shareholders, Class C shareholders and Class I shareholders of record on June 27, 2019, and payable on June 28, 2019.
On July 19, 2019 the MainStay Cushing Renaissance Advantage Fund declared a distribution payable of $0.1400 per share, to Class A shareholders, Investor Class shareholders, Class C shareholders and Class I shareholders of record on July 18, 2019, and payable on July 19, 2019.
Board Consideration and Approval of Management Agreement and
Subadvisory Agreement(Unaudited)
The continuation of the Management Agreement with respect to the MainStay Cushing Energy Income Fund, MainStay Cushing MLP Premier Fund and MainStay Cushing Renaissance Advantage Fund (“Funds”) and New York Life Investment Management LLC (“New York Life Investments”) and the Subadvisory Agreement between New York Life Investments and Cushing Asset Management, LP (“Cushing”) with respect to the Funds (together, “Advisory Agreements”), following an initial term of up to two years, is subject to annual review and approval by the Board of Trustees of MainStay Funds Trust (the “Board” of the “Trust”) in accordance with Section 15 of the Investment Company Act of 1940, as amended (“1940 Act”). At its December10-12, 2018in-person meeting, the Board, including the Trustees who are not “interested persons” (as such term is defined in the 1940 Act) of the Trust (“Independent Trustees”) voting separately, unanimously approved for aone-year period the continuation of the Advisory Agreements.
In reaching the decision to approve the Advisory Agreements, the Board considered information furnished by New York Life Investments and Cushing in connection with an annual contract review process undertaken by the Board that took place at various meetings of the Board and its Contracts Committee between October 2018 and December 2018, as well as other information furnished to the Board throughout the year as deemed relevant by the Trustees. Information requested by and furnished to the Board for consideration in connection with the contract review process included, among other items, reports on each Fund and “peer funds” prepared by Strategic Insight Mutual Fund Research and Consulting, LLC (“Strategic Insight”), an independent third-party service provider engaged by the Board to report objectively on each Fund’s investment performance, management fee and total expenses. The Board also considered information on the fees charged to other investment advisory clients of New York Life Investments and/or Cushing (including institutional separate accounts) that follow investment strategies similar to each Fund, if any, and, when applicable, the rationale for any differences in each Fund’s management and subadvisory fees and the fees charged to those other investment advisory clients. In addition, the Board considered information furnished by New York Life Investments and Cushing in response to requests prepared on behalf of, and in consultation with, the Board by independent legal counsel to the Independent Trustees, which encompassed a variety of topics, including those summarized below. The Board took into account information provided in advance of and during its meetings throughout the year, including, among other items, information regarding the legal standards and fiduciary obligations applicable to its consideration of the Advisory Agreements and investment performance reports on each Fund prepared by the Investment Consulting Group of New York Life Investments as well as presentations from New York Life Investments and Cushing personnel, such as portfolio managers. The Board also took into account other information received from New York Life Investments throughout the year, including, among other items, periodic reports on legal and compliance matters, risk management, portfolio turnover and brokerage commissions, sales and marketing activity, andnon-advisory services provided to each Fund by New York Life Investments. The overall annual contract review process, including the structure and format for materials provided to the Board, was developed in consultation with the Board. At various meetings, the Independent Trustees also met in executive session with their independent legal counsel, and met with senior
management of New York Life Investments without other representatives of New York Life Investments present.
In addition to information provided to the Board throughout the year, the Board received information provided specifically in response to requests prepared on behalf of, and in consultation with, the Board by independent legal counsel regarding each Fund’s distribution arrangements in connection with its June 2018 meeting. In addition, the Board received information regarding each Fund’s asset levels, share purchase and redemption activity and the payment of Rule12b-1 distribution and service fees by applicable share classes of each Fund. In connection with this June meeting, New York Life Investments also provided the Board with information regarding the revenue sharing payments made by New York Life Investments from its own resources to intermediaries that promote the sale or distribution of Fund shares or that provide servicing to Fund shareholders.
In considering the continuation of the Advisory Agreements, the Trustees reviewed and evaluated all of the information and factors they believed to be relevant and appropriate in light of legal advice furnished to them by independent legal counsel and through the exercise of their own business judgment. The broad factors considered by the Board are described in greater detail below and included, among other factors: (i) the nature, extent and quality of the services provided to each Fund by New York Life Investments and Cushing; (ii) the qualifications of the portfolio managers of each Fund and the historical investment performance of each Fund, New York Life Investments and Cushing; (iii) the costs of the services provided, and profits realized, by New York Life Investments and Cushing from their relationships with each Fund; (iv) the extent to which economies of scale have been realized or may be realized if each Fund grows and the extent to which economies of scale have benefited or may benefit Fund shareholders; and (v) the reasonableness of each Fund’s management and subadvisory fees and overall total ordinary operating expenses, particularly as compared to any similar funds and accounts managed by New York Life Investments and/or Cushing. Although the Board recognized that the comparisons between each Fund’s fees and expenses and those of other funds are imprecise given different terms of agreements, variations in fund strategies and other factors, the Board considered the reasonableness of each Fund’s management fee and overall total ordinary operating expenses as compared to the peer funds identified by Strategic Insight. Throughout their considerations, the Trustees acknowledged the overall commitment of New York Life Investments and its affiliates to serve the MainStay Group of Funds, as well as their capacity, experience, resources, financial stability and reputations.
Although individual Trustees may have weighed certain factors or information differently, the Board’s decision to approve the continuation of the Advisory Agreements was based on a consideration of the information provided to the Trustees throughout the year, as well as information furnished specifically in connection with the contract review process. The Trustees noted that, throughout the year, the Trustees are also afforded an opportunity to ask questions of and request additional information or materials from New York Life Investments and Cushing. The Board’s conclusions with respect to the Advisory Agreements may have also been based, in part, on the Board’s knowledge of New York Life Investments and Cushing resulting from, among other things, the Board’s consideration of the Advisory Agreements in prior years, the
| | |
| 60 | | MainStay Cushing Funds |
advisory agreements for other funds in the MainStay Group of Funds in prior years, the Board’s regular review throughout the year of the performance and operations of other funds in the MainStay Group of Funds and the Board’s business judgment and industry experience. In addition to considering the above-referenced factors, the Board observed that in the marketplace there are a range of investment options available to shareholders of each Fund and that each Fund’s shareholders, having had the opportunity to consider other investment options, have chosen to invest in each Fund. The factors that figured prominently in the Board’s decision to approve the continuation of the Advisory Agreements during its December10-12, 2018in-person meeting are summarized in more detail below. The Board evaluated the information available to it on aFund-by-Fund basis, and its decision was made separately with respect to each Fund.
Nature, Extent and Quality of Services Provided by New York Life Investments and Cushing
The Board examined the nature, extent and quality of the services that New York Life Investments provides to each Fund. The Board evaluated New York Life Investments’ experience and capabilities in serving as manager of each Fund and managing Fund operations in amanager-of-managers structure, noting that New York Life Investments manages other mutual funds, serves a variety of other investment advisory clients, including other pooled investment vehicles, and has experience with overseeing mutual fund service providers, including subadvisors. The Board considered the experience of senior personnel at New York Life Investments providing management and administrative and othernon-advisory services to each Fund as well as New York Life Investments’ reputation and financial condition. The Board observed that New York Life Investments devotes significant resources and time to providing advisory andnon-advisory services to each Fund, including New York Life Investments’ supervision and due diligence reviews of Cushing and ongoing analysis of, and interactions with, Cushing with respect to, among other things, Fund investment performance and risk as well as Cushing’s investment capabilities and subadvisory services with respect to each Fund.
The Board also considered the full range of services that New York Life Investments provides to each Fund under the terms of the Management Agreement, including: (i) fund accounting and ongoing supervisory services provided by New York Life Investments’ Fund Administration and Accounting Group; (ii) investment supervisory and analytical services provided by New York Life Investments’ Investment Consulting Group; (iii) compliance services provided by the Trust’s Chief Compliance Officer as well as New York Life Investments’ Compliance Department, including supervision and implementation of each Fund’s compliance program; (iv) legal services provided by New York Life Investments’ Office of the General Counsel; and (v) risk management and portfolio trading monitoring and analysis by compliance and investment personnel. The Board noted that certainnon-advisory services provided by New York Life Investments are set forth in the Management Agreement. In addition, the Board considered New York Life Investments’ willingness to invest in personnel, infrastructure, technology, operational enhancements, cyber security, information security, shareholder privacy resources and business continuity planning that are designed to benefit each Fund, and noted that New York Life Investments is responsible for compensating the Trust’s officers, except
for a portion of the salary of the Trust’s Chief Compliance Officer. The Board recognized that New York Life Investments has provided an increasingly broad array ofnon-advisory services to the MainStay Group of Funds as a result of regulatory and other developments, including in connection with the designation of New York Life Investments as the administrator of the MainStay Group of Funds’ liquidity risk management program adopted under the 1940 Act. The Board considered benefits to shareholders of being part of the MainStay Group of Funds, including the privilege of exchanging investments between the same class of shares without the imposition of a sales charge, as described more fully in the Funds’ prospectus.
The Board also examined the nature, extent and quality of the investment advisory services that Cushing provides to each Fund. The Board evaluated Cushing’s experience in serving as subadvisor to each Fund and managing other portfolios and Cushing’s track record and experience in providing investment advisory services, the experience of investment advisory, senior management and administrative personnel at Cushing, and Cushing’s overall legal and compliance environment, resources and history. In addition to information provided in connection with its quarterly meetings with the Trust’s Chief Compliance Officer, the Board considered that New York Life Investments and Cushing believes the compliance policies, procedures and systems are reasonably designed to prevent violation of the federal securities laws, and acknowledged their continued commitment to further developing and strengthening compliance programs relating to each Fund. In addition, the Board considered the policies and procedures in place with respect to matters that may involve conflicts of interest between each Fund’s investments and those of other accounts managed by Cushing. The Board reviewed Cushing’s ability to attract and retain qualified investment professionals and willingness to invest in personnel to service and support each Fund. In this regard, the Board considered the experience of each Fund’s portfolio managers, the number of accounts managed by the portfolio managers and the method for compensating the portfolio managers.
Based on these considerations, the Board concluded, within the context of its overall determinations regarding the Advisory Agreements, that each Fund would likely continue to benefit from the nature, extent and quality of these services as a result of New York Life Investments’ and Cushing’s experience, personnel, operations and resources.
Investment Performance
In evaluating each Fund’s investment performance, the Board considered investment performance results over various periods in light of each Fund’s investment objective, strategies and risks, as disclosed in the Funds’ prospectus. The Board particularly considered investment reports on and analysis of each Fund’s performance provided to the Board throughout the year by the Investment Consulting Group of New York Life Investments. These reports include, among other items, information on each Fund’s gross and net returns, each Fund’s investment performance compared to relevant investment categories and each Fund’s benchmarks, each Fund’s risk-adjusted investment performance and each Fund’s investment performance as compared to peer funds, as appropriate, as well as portfolio attribution information and commentary on the effect of current and recent market conditions. The Board also considered information provided by Strategic Insight
Board Consideration and Approval of Management Agreement and
Subadvisory Agreement(Unaudited) (continued)
showing the investment performance of each Fund as compared to peer funds.
In considering each Fund’s investment performance, the Board generally placed greater emphasis on each Fund’s long-term performance track record. The Board also gave weight to its ongoing discussions with senior management at New York Life Investments concerning each Fund’s investment performance as well as discussions between each Fund’s portfolio managers and the Board’s Investment Committee that occur regularly, generally on an annual basis. In addition, the Board considered any specific actions that New York Life Investments or Cushing had taken, or had agreed with the Board to take, to seek to enhance Fund investment performance and the results of those actions. In considering the investment performance of the MainStay Cushing Energy Income Fund, the Board noted that the Fund performed in line with its benchmark index and peer funds over the recent period and underperformed its benchmark index and peer funds over longer-term periods. The Board considered its discussions with representatives from New York Life Investments and Cushing regarding the Fund’s investment performance relative to that of its benchmark index and peer funds.
Based on these considerations, the Board concluded, within the context of its overall determinations regarding the Advisory Agreements, that the long-term investment performance of each Fund, along with ongoing efforts by New York Life Investments and Cushing to seek to enhance investment returns, supported a determination to approve the continuation of the Advisory Agreements. Each Fund discloses more information about investment performance in the Portfolio Management Discussion and Analysis, Investment and Performance Comparison and Financial Highlights sections of this Semiannual Report and in the Funds’ prospectus.
Costs of the Services Provided, and Profits Realized, by New York Life Investments and Cushing
The Board considered the costs of the services provided by New York Life Investments and Cushing under the Advisory Agreements and the profits realized by New York Life Investments and its affiliates and Cushing, due to their relationships with each Fund. The Board considered that Cushing’s subadvisory fees are negotiated atarm’s-length by New York Life Investments and that these fees are paid by New York Life Investments, not each Fund. On this basis, the Board primarily considered the profits realized by New York Life Investments and its affiliates with respect to each Fund.
In addition, the Board acknowledged the difficulty in obtaining reliable comparative data about mutual fund managers’ profitability, because such information generally is not publicly available and may be impacted by numerous factors, including the structure of a fund manager’s organization, the types of funds it manages, the methodology used to allocate certain fixed costs to specific funds, and the manager’s capital structure and costs of capital.
In evaluating the costs of the services provided by New York Life Investments and Cushing and profits realized by New York Life Investments and its affiliates and Cushing, the Board considered, among other factors, each party’s continuing investments in personnel, systems, equipment and other resources and infrastructure to support and further
enhance the management of each Fund, and that New York Life Investments is responsible for paying the subadvisory fees for each Fund. The Board considered the financial resources of New York Life Investments and Cushing and acknowledged that New York Life Investments and Cushing must be in a position to attract and retain experienced professional personnel and to maintain a strong financial position for New York Life Investments and Cushing to continue to provide high-quality services to each Fund. The Board also recognized that each Fund benefits from the allocation of certain fixed costs across the MainStay Group of Funds, among other expected benefits resulting from its relationship with New York Life Investments.
In connection with the annual fund profitability analysis that New York Life Investments presents to the Board, the Board considers information provided by New York Life Investments regarding its methodology for calculating profitability and allocating costs. In 2014, the Board engaged Bobroff Consulting, Inc., an independent third-party consultant, to review the methods used to allocate costs to the funds in the MainStay Group of Funds and among individual funds in the MainStay Group of Funds. As part of this engagement, the consultant analyzed: (i) the various New York Life Investments business units and affiliated subadvisors that provide services to the funds in the MainStay Group of Funds; (ii) how costs are allocated to the funds in the MainStay Group of Funds and to other lines of businesses; and (iii) how New York Life Investments’ cost allocation methods and profitability reports compare to industry practices. The Board noted that the independent consultant had concluded that New York Life Investments’ methods for allocating costs and procedures for estimating overall profitability of the funds in the MainStay Group of Funds are reasonable, consistent with industry practice and likely to produce reasonable profitability estimates. Although the Board recognized the difficulty in evaluating a manager’s profitability with respect to each Fund and noting that other profitability methodologies may also be reasonable, the Board concluded that the profitability methodology presented by New York Life Investments to the Board was reasonable in all material respects.
In considering the costs and profitability of each Fund, the Board also considered certainfall-out benefits that may be realized by New York Life Investments and its affiliates and Cushing due to their relationships with each Fund, including reputational and other indirect benefits. The Board recognized, for example, the benefits to Cushing from legally permitted “soft-dollar” arrangements by which brokers provide research and other services to Cushing in exchange for commissions paid by each Fund with respect to trades on each Fund’s portfolio securities. In this regard, the Board also requested and received information from New York Life Investments concerning other material business relationships between Cushing and its affiliates and New York Life Investments and its affiliates. In addition, the Board reviewed information regarding a money market fund advised by New York Life Investments and an affiliated subadvisor that serves as an investment option for the Funds, including the rationale for and costs associated with investments in this money market fund by the Funds, if any, and considered information from New York Life Investments that the nature and type of specific investment advisory services provided to this money market fund are distinct from or in addition to the investment advisory services provided to the Funds. The Board observed that, in addition to fees earned by New York Life Investments for managing each Fund, New York Life Investments’ affiliates also earn revenues from serving each Fund in
| | |
| 62 | | MainStay Cushing Funds |
various other capacities, including as each Fund’s transfer agent and distributor. The Board considered information about these other revenues, and their impact on the profitability of each Fund to New York Life Investments and its affiliates, which was furnished to the Board as part of the annual contract review process. The Board noted that, although it assessed the overall profitability of each Fund to New York Life Investments and its affiliates as part of the contract review process, when considering the reasonableness of the fees to be paid to New York Life Investments and its affiliates under the Advisory Agreements, the Board considered the profitability of New York Life Investments’ relationship with each Fund on apre-tax basis and without regard to distribution expenses incurred by New York Life Investments from its own resources.
After evaluating the information deemed relevant by the Trustees, the Board concluded, within the context of its overall determinations regarding the Advisory Agreements, that any profits realized by New York Life Investments and its affiliates due to their relationships with each Fund were not excessive. With respect to Cushing, the Board considered that any profits realized by Cushing due to its relationship with each Fund are the result ofarm’s-length negotiations between New York Life Investments and Cushing, acknowledging that any such profits are based on fees paid to Cushing by New York Life Investments, not each Fund.
Management and Subadvisory Fees and Total Ordinary Operating Expenses
The Board evaluated the reasonableness of the fees paid under the Advisory Agreements and each Fund’s total ordinary operating expenses. The Board primarily considered the reasonableness of the management fee paid by each Fund to New York Life Investments, because the subadvisory fees paid to Cushing are paid by New York Life Investments, not each Fund. The Board also considered the reasonableness of the subadvisory fees to be paid by New York Life Investments and the amount of the management fee retained by New York Life Investments.
In assessing the reasonableness of each Fund’s fees and expenses, the Board primarily considered comparative data provided by Strategic Insight on the fees and expenses charged by similar mutual funds managed by other investment advisers. In addition, the Board considered information provided by New York Life Investments and Cushing on fees charged to other investment advisory clients, including institutional separate accounts and other funds that follow investment strategies similar to those of each Fund, if any. The Board considered the similarities and differences in the contractual management fee schedules of each Fund and these similarly-managed funds, taking into account New York Life Investments’ rationale for any differences in fee schedules. The Board took into account explanations provided by New York Life Investments about the more extensive scope of services provided to registered investment companies, such as each Fund, as compared with other investment advisory clients. Additionally, the Board considered the impact of any contractual breakpoints, voluntary waivers and expense limitation arrangements on each Fund’s net management fee and expenses. The Board also considered that in proposing fees for each Fund, New York Life Investments considers the competitive marketplace for financial products. The Board considered its discussions with repre-
sentatives from New York Life Investments regarding the management fee paid by the MainStay Cushing Renaissance Advantage Fund. The Board noted that New York Life Investments had proposed, and the Board had approved, a reduction in the management fee for the MainStay Cushing Renaissance Advantage Fund, effective March 31, 2018.
The Board noted that, outside of each Fund’s management fee and the fees charged under a share class’s Rule12b-1 and/or shareholder services plans, a share class’s most significant “other expenses” are transfer agent fees. Transfer agent fees are charged to each Fund based on the number of shareholder accounts (a“per-account” fee) as compared with certain other fees (e.g., management fees) that are charged based on each Fund’s average net assets. The Board took into account information from New York Life Investments regarding the reasonableness of each Fund’s transfer agent fee schedule, including industry data demonstrating that theper-account fees that NYLIM Service Company LLC, an affiliate of New York Life Investments and each Fund’s transfer agent, charges each Fund are within the range ofper-account fees charged by transfer agents to other mutual funds. In addition, the Board considered NYLIM Service Company LLC’s profitability in connection with the transfer agent services it provides to each Fund. The Board also took into account information received from NYLIM Service Company LLC regarding thesub-transfer agency payments it made to intermediaries in connection with the provision ofsub-transfer agency services to each Fund.
The Board considered that, because each Fund’s transfer agent fees are billed on aper-account basis, the impact of transfer agent fees on a share class’s expense ratio may be more significant in cases where the share class has a high number of accounts with limited assets (i.e., small accounts). The Board considered the extent to which transfer agent fees comprised total expenses of each Fund. The Board acknowledged the role that the MainStay Group of Funds historically has played in serving the investment needs of New York Life Insurance Company (“New York Life”) customers, who often maintain smaller account balances than other shareholders of funds, and the impact of small accounts on the expense ratios of Fund share classes. The Board also recognized measures that it and New York Life Investments have taken to mitigate the effect of small accounts on the expense ratios of Fund share classes. The Board noted that, for purposes of allocating transfer agency fees and expenses, each retail fund in the MainStay Group of Funds combines the shareholder accounts of its Class A, I, R1, R2, and Class R3 shares (as applicable) into one group and the shareholder accounts of its Investor Class and Class B and C shares (as applicable) into another group. The Board also noted that theper-account fees attributable to each group of share classes is then allocated among the constituent share classes based on relative net assets and that a MainStay Fund’s Class R6 shares, if any, are not combined with any other share class for this purpose. The Board considered New York Life Investments’ rationale with respect to these groupings and received a report from an independent consultant engaged to conduct comparative analysis of these groupings. The Board also considered that NYLIM Service Company LLC had waived its contractual cost of living adjustments during the past five years.
After considering all of the factors outlined above, the Board concluded that each Fund’s management fees and total ordinary operating expenses were within a range that is competitive and, within the context
Board Consideration and Approval of Management Agreement and
Subadvisory Agreement(Unaudited) (continued)
of the Board’s overall conclusions regarding the Advisory Agreements, support a conclusion that these fees and expenses are reasonable.
Extent to Which Economies of Scale May Be Realized as each Fund Grows
The Board considered whether each Fund’s expense structure permits economies of scale to be shared with Fund shareholders. The Board also considered a report from New York Life Investments, previously prepared at the request of the Board, that addressed economies of scale in the mutual fund business generally, the changing economics of the mutual fund business and the various ways in which the benefits of economies of scale may be shared with each Fund and other funds in the MainStay Group of Funds. Although the Board recognized the difficulty of determining future economies of scale with precision, the Board acknowledged that economies of scale may be shared with each Fund in a number of ways, including, for example, through the imposition of management fee breakpoints, initially setting management fee rates at scale or making additional investments to enhance shareholder services. The Board reviewed information from New York Life Investments showing how each Fund’s management fee schedule compared to fee schedules of other funds and accounts managed by New York Life Investments. The Board also reviewed information from Strategic Insight showing how each Fund’s management fee schedule hypothetically would compare with fees paid for similar services by peer funds at varying asset levels.
Based on this information, the Board concluded, within the context of its overall determinations regarding the Advisory Agreements, that each Fund’s expense structure appropriately reflects economies of scale for the benefit of Fund shareholders at current asset levels. The Board noted, however, that it would continue to evaluate the reasonableness of each Fund’s expense structure over time.
Conclusion
On the basis of the information and factors summarized above and the evaluation thereof, the Board as a whole, including the Independent Trustees voting separately, unanimously voted to approve the continuation of the Advisory Agreements.
| | |
| 64 | | MainStay Cushing Funds |
Proxy Voting Policies and Procedures and Proxy Voting Record(Unaudited)
A description of the policies and procedures that New York Life Investments uses to vote proxies related to the Cushing Funds’ securities is available without charge, upon request, (i) by visiting the MainStay Funds’ website atnylinvestments.com/funds; and (ii) on the Securities and Exchange Commission’s (“SEC”) website atwww.sec.gov.
The Cushing Funds are required to file with the SEC its proxy voting record for the 12-month period ending June 30 on Form N-PX. The Cushing Funds’ most recent Form N-PX is available free of charge upon request by calling 800-624-6782; visiting the MainStay Funds’ website atnylinvestments.com/funds; or on the SEC’s website atwww.sec.gov.
Shareholder Reports and Quarterly Portfolio Disclosure(Unaudited)
Each Cushing Fund is required to file its complete schedule of portfolio holdings with the SEC for its first and third fiscal quarters on Form N-Q or Part F of Form N-PORT (beginning with filings after March 31, 2019). Each Cushing Fund’s Form N-Q or Part F of Form N-PORT is available without charge, on the SEC’s website atwww.sec.gov or by calling New York Life Investments at 800-624-6782.
MainStay Funds
Equity
U.S. Equity
MainStay Epoch U.S. All Cap Fund
MainStay Epoch U.S. Equity Yield Fund
MainStay Large Cap Growth Fund
MainStay MacKay Common Stock Fund
MainStay MacKay Growth Fund
MainStay MacKay S&P 500 Index Fund
MainStay MacKay Small Cap Core Fund
MainStay MacKay U.S. Equity Opportunities Fund
MainStay MAP Equity Fund
International Equity
MainStay Epoch International Choice Fund
MainStay MacKay International Equity Fund
MainStay MacKay International Opportunities Fund
Emerging Markets Equity
MainStay Candriam Emerging Markets Equity Fund
MainStay MacKay Emerging Markets Equity Fund
Global Equity
MainStay Epoch Capital Growth Fund
MainStay Epoch Global Equity Yield Fund
Fixed Income
Taxable Income
MainStay Candriam Emerging Markets Debt Fund
MainStay Floating Rate Fund
MainStay Indexed Bond Fund
MainStay MacKay High Yield Corporate Bond Fund
MainStay MacKay Infrastructure Bond Fund
MainStay MacKay Short Duration High Yield Fund
MainStay MacKay Total Return Bond Fund
MainStay MacKay Unconstrained Bond Fund
Tax-Exempt Income
MainStay MacKay California Tax Free Opportunities Fund1
MainStay MacKay High Yield Municipal Bond Fund
MainStay MacKay New York Tax Free Opportunities Fund2
MainStay MacKay Short Term Municipal Fund
MainStay MacKay Tax Free Bond Fund
Money Market
MainStay Money Market Fund
Mixed Asset
MainStay Balanced Fund
MainStay Income Builder Fund
MainStay MacKay Convertible Fund
Speciality
MainStay Cushing Energy Income Fund
MainStay Cushing MLP Premier Fund
MainStay Cushing Renaissance Advantage Fund
Asset Allocation
MainStay Conservative Allocation Fund
MainStay Growth Allocation Fund
MainStay Moderate Allocation Fund
MainStay Moderate Growth Allocation Fund
Manager
New York Life Investment Management LLC
New York, New York
Subadvisors
Candriam Belgium S.A.3
Brussels, Belgium
Candriam Luxembourg S.C.A.3
Strassen, Luxembourg
Cushing Asset Management, LP
Dallas, Texas
Epoch Investment Partners, Inc.
New York, New York
MacKay Shields LLC3
New York, New York
Markston International LLC
White Plains, New York
NYL Investors LLC3
New York, New York
Winslow Capital Management, LLC
Minneapolis, Minnesota
Legal Counsel
Dechert LLP
Washington, District of Columbia
Independent Registered Public Accounting Firm
KPMG LLP
Philadelphia, Pennsylvania
| 1. | Class A and Class I shares of this Fund are registered for sale in AZ, CA, MI, NV, OR, TX, UT and WA. Class I shares are registered for sale in CO, FL, GA, HI, ID, MA, MD, NH, NJ and NY. |
| 2. | This Fund is registered for sale in CA, CT, DE, FL, MA, NJ, NY and VT. |
| 3. | An affiliate of New York Life Investment Management LLC. |
Not part of the Semiannual Report
For more information
800-624-6782
nylinvestments.com/funds
“New York Life Investments” is both a service mark, and the common trade name, of the investment advisors affiliated with New York Life Insurance Company. The MainStay Funds® are managed by New York Life Investment Management LLC and distributed by NYLIFE Distributors LLC, 30 Hudson Street, Jersey City, NJ 07302, a wholly owned subsidiary of New York Life Insurance Company. NYLIFE Distributors LLC is a Member FINRA/SIPC.
©2019 NYLIFE Distributors LLC. All rights reserved.
| | |
| 1740752 MS085-19 | | MSCU10-07/19 (NYLIM) NL258 |
Item 2. Code of Ethics.
Not applicable.
| Item 3. | Audit Committee Financial Expert. |
Not applicable.
| Item 4. | Principal Accountant Fees and Services. |
Not applicable.
| Item 5. | Audit Committee of Listed Registrants |
Not applicable.
| Item 6. | Schedule of Investments |
The Schedule of Investments is included as part of Item 1 of this report.
| Item 7. | Disclosure of Proxy Voting Policies and Procedures forClosed-End Management Investment Companies. |
Not applicable.
| Item 8. | Portfolio Managers ofClosed-End Management Investment Companies. |
Not applicable.
| Item 9. | Purchases of Equity Securities byClosed-End Management Investment Company and Affiliated Purchasers. |
Not Applicable.
| Item 10. | Submission of Matters to a Vote of Security Holders. |
Since the Registrant’s last response to this Item, there have been no material changes to the procedures by which shareholders may recommend nominees to the Registrant’s Board of Trustees.
Item 11. Controls and Procedures.
| (a) | Based on an evaluation of the Registrant’s Disclosure Controls and Procedures (as defined in Rule30a-3(c) under the Investment Company Act of 1940) (the “Disclosure Controls”), as of a date within 90 days prior to the filing date (the “Filing Date”) of this FormN-CSR (the “Report”), the Registrant’s principal executive officer and principal financial officer have concluded that the Disclosure Controls are reasonably designed to ensure that information required to be disclosed by the Registrant in the Report is recorded, processed, summarized and reported by the Filing Date, including ensuring that information required to be disclosed in the Report is accumulated and communicated to the Registrant’s management, including the Registrant’s principal executive officer and principal financial officer, as appropriate to allow timely decisions regarding required disclosure. |
| (b) | There were no changes in the Registrant’s internal control over financial reporting (as defined in Rule30a-3(d)) under the Investment Company Act of 1940 that occurred during the second fiscal quarter of the period covered by this report that has materially affected, or is reasonably likely to materially affect, the Registrant’s internal control over financial reporting. |
Item 12. Exhibits.
| (a) | Certifications of principal executive officer and principal financial officer as required by Rule30a-2 under the Investment Company Act of 1940. |
| (b) | Certifications of principal executive officer and principal financial officer as required by Section 906 of the Sarbanes-Oxley Act of 2002. |
SIGNATURES
Pursuant to the requirements of the Securities Exchange Act of 1934 and the Investment Company Act of 1940, the Registrant has duly caused this Report to be signed on its behalf by the undersigned, thereunto duly authorized.
MAINSTAY FUNDS TRUST
| | |
| By: | | /s/ Kirk C. Lehneis |
| | Kirk C. Lehneis President and Principal Executive Officer |
| |
| Date: | | August 2, 2019 |
Pursuant to the requirements of the Securities Exchange Act of 1934 and the Investment Company Act of 1940, this Report has been signed below by the following persons on behalf of the Registrant and in the capacities and on the dates indicated.
| | |
| By: | | /s/ Kirk C. Lehneis |
| | Kirk C. Lehneis President and Principal Executive Officer |
| |
| Date: | | August 2, 2019 |
| |
| By: | | /s/ Jack R. Benintende |
| | Jack R. Benintende Treasurer and Principal Financial and Accounting Officer |
| |
| Date: | | August 2, 2019 |
EXHIBIT INDEX
| (a) | Certifications of principal executive officer and principal financial officer as required by Rule30a-2 under the Investment Company Act of 1940. |
| (b) | Certification of principal executive officer and principal financial officer as required by Section 906 of the Sarbanes-Oxley Act of 2002. |