Exhibit 99.9
GLOSSARY
AECO | | a storage and pricing hub for Canadian natural gas markets |
/d | | per day |
boe | | barrels of oil equivalent (6 mcf of natural gas = 1 barrel of oil equivalent) |
bbl or bbls | | barrels |
GORR | | gross overriding royalty |
mboe | | thousand boe |
mcf | | thousand cubic feet |
mmboe | | million barrels of oil equivalent |
mmbtu | | million British thermal units |
mmcf | | million cubic feet |
NGL | | natural gas liquids (ethane, propane, butane and condensate) |
OK | | Oklahoma |
WTI | | West Texas Intermediate, a benchmark crude oil used for pricing comparison |
NI 51-101 | | National Instrument 51-101 |
TABLE OF CONTENTS
2 | | Highlights |
4 | | Report to Shareholders |
8 | | Management’s Discussion and Analysis |
36 | | Consolidated Financial Statements |
36 | | Consolidated Balance Sheets |
37 | | Consolidated Statements of Comprehensive Income |
38 | | Consolidated Statements of Shareholder’s Equity |
39 | | Consolidated Statements of Cash Flows |
40 | | Notes to the Consolidated Financial Statements |
74 | | Corporate Information |
1
HIGHLIGHTS
Forward-Looking Statements
This financial report contains forward-looking statements. Please refer to our cautionary language on forward-looking statements and the other matters set forth at the beginning of the management’s discussion and analysis attached to this financial report.
Effective January 1, 2011, Bellatrix began reporting its financial results in accordance with International Financial Reporting Standards (“IFRS”). Prior year comparative amounts have been restated to reflect results as if Bellatrix had always prepared its financial results using IFRS. Please see additional discussion regarding IFRS later in this financial report.
| | Three months ended March 31, | |
| | 2011 | | 2010 | |
FINANCIAL (unaudited)
(CDN$000s except share and per share amounts) | | | | | |
Revenue (before royalties and risk management (1)) | | 40,535 | | 26,929 | |
Funds flow from operations (2) | | 17,027 | | 10,198 | |
Per basic share (5) | | $ | 0.17 | | $ | 0.12 | |
Per diluted share (5) | | $ | 0.16 | | $ | 0.11 | |
Cash flow from operating activities | | 15,718 | | 13,456 | |
Per basic share (5) | | $ | 0.16 | | $ | 0.15 | |
Per diluted share (5) | | $ | 0.15 | | $ | 0.15 | |
Net income (loss) (7) | | (5,487 | ) | 3,969 | |
Per basic share (5) | | $ | (0.06 | ) | $ | 0.04 | |
Per diluted share (5) | | $ | (0.06 | ) | $ | 0.04 | |
Exploration and development | | 55,486 | | 18,311 | |
Corporate and property acquisitions | | 3,631 | | 35 | |
Capital expenditures - cash | | 59,117 | | 18,346 | |
Property dispositions - cash | | 130 | | 47 | |
Non-cash items | | 513 | | 288 | |
Total capital expenditures - net | | 59,760 | | 18,681 | |
Long-term debt | | 70,298 | | — | |
Convertible debentures (3) | | 47,951 | | 82,186 | |
Working capital deficiency (excess) | | 11,921 | | (8,572 | ) |
Total net debt (3) | | 130,170 | | 73,614 | |
Total assets (7) | | 525,579 | | 436,964 | |
Shareholders’ equity (7) | | 292,976 | | 285,901 | |
OPERATING | | | | | |
Average daily sales volumes | | | | | |
Crude oil, condensate and NGLs (bbls/d) | | 3,860 | | 1,907 | |
Natural gas (mcf/d) | | 37,346 | | 32,044 | |
Total oil equivalent (boe/d) | | 10,084 | | 7,248 | |
Average prices | | | | | |
Light crude oil and condensate ($/bbl) | | 83.75 | | 77.91 | |
NGLs ($/bbl) | | 51.27 | | 44.14 | |
Heavy oil ($/bbl) | | 59.55 | | 64.85 | |
Crude oil, condensate and NGLs ($/bbl) | | 77.36 | | 66.71 | |
Crude oil, condensate and NGLs (including risk management (1)) ($/bbl) | | 74.61 | | 66.71 | |
Natural gas ($/mcf) | | 3.94 | | 5.18 | |
Natural gas (including risk management (1)) ($/mcf) | | 3.94 | | 6.04 | |
Total oil equivalent ($/boe) | | 44.20 | | 40.44 | |
Total oil equivalent (including risk management (1)) ($/boe) | | 43.14 | | 44.26 | |
Statistics | | | | | |
Operating netback (4) ($/boe) | | 23.33 | | 17.79 | |
Operating netback (4) (including risk management (1)) ($/boe) | | 22.28 | | 21.61 | |
Transportation ($/boe) | | 1.29 | | 1.24 | |
Production expenses ($/boe) | | 12.45 | | 13.36 | |
General and administrative ($/boe) | | 2.50 | | 3.89 | |
Royalties as a % of sales after transportation | | 17% | | 21% | |
2
| | Three months ended March 31, | |
| | 2011 | | 2010 | |
COMMON SHARES | | | | | |
Common shares outstanding | | 97,463,302 | | 92,474,372 | |
Share options outstanding | | 5,903,601 | | 4,133,533 | |
Shares issuable on conversion of convertible debentures (6) | | 9,821,429 | | 5,305,250 | |
Diluted common shares outstanding | | 113,188,332 | | 101,913,155 | |
Diluted weighted average shares (5) | | 97,448,078 | | 88,212,802 | |
SHARE TRADING STATISTICS
(CDN$, except volumes) based on intra-day trading | | | | | |
High | | 6.19 | | 4.60 | |
Low | | 4.61 | | 3.00 | |
Close | | 5.64 | | 3.78 | |
Average daily volume | | 546,747 | | 901,994 | |
(1) The Company has entered into various commodity price risk management contracts which are considered to be economic hedges. Per unit metrics after risk management includes only the realized portion of gains or losses on commodity contracts.
The Company does not apply hedge accounting to these contracts. As such, these contracts are revalued to fair value at the end of each reporting date. This results in recognition of unrealized gains or losses over the term of these contracts which is reflected each reporting period until these contracts are settled, at which time realized gains or losses are recorded. These unrealized gains or losses on commodity contracts are not included for purposes of per share metrics calculations disclosed.
(2) The highlights section contains the term “funds flow from operations” which should not be considered an alternative to, or more meaningful than cash flow from operating activities as determined in accordance with generally accepted accounting principles (“GAAP”) as an indicator of the Company’s performance. Therefore reference to diluted funds flow from operations or funds flow from operations per share may not be comparable with the calculation of similar measures for other entities. Management uses funds flow from operations to analyze operating performance and leverage and considers funds flow from operations to be a key measure as it demonstrates the Company’s ability to generate the cash necessary to fund future capital investments and to repay debt. The reconciliation between cash flow from operating activities and funds flow from operations can be found in the Management Discussion and Analysis (“MD&A”). Funds flow from operations per share is calculated using the weighted average number of common shares for the period.
(3) Net debt and total net debt are considered non-GAAP terms. The Company’s calculation of net debt includes the net working capital deficiency (excess) before short-term commodity contract assets and liabilities and current finance lease obligation. Total net debt also includes the liability component of convertible debentures and excludes deferred liabilities, decommissioning liabilities, long-term finance lease obligation and the deferred tax assets and liabilities. A reconciliation between total liabilities under GAAP and total net debt as calculated by the Company is found in the MD&A.
(4) Operating netbacks are calculated by subtracting royalties, transportation, and operating costs from revenues before other income.
(5) Basic weighted average shares for the three months ended were 97,448,078 (2010: 88,212,802).
In computing weighted average diluted earnings per share for the three months ended March 31, 2011 a total of 5,903,601 (2010: 4,133,433) share options and 9,821,429 (2010: 5,305,250) common shares issuable on conversion of convertible debentures were excluded from the calculation as they were not dilutive.
In computing weighted average diluted cash flow from operations and funds flow from operations for the three months ended March 31, 2011 a total of 2,221,592 (2010: 1,901,131) shares were added to the denominator as a consequence of applying the treasury stock method to the Company’s outstanding share options and a total of 9,821,429 (2010: nil) common shares issuable on conversion of convertible debentures were also added to the denominator as they were dilutive, resulting in diluted weighted average common shares of 109,491,099. As a consequence, a total of $0.7 million for interest accretion expense (net of income tax effect) was added to the numerator.
(6) Shares issuable on conversion of convertible debentures are calculated as the $55.0 million principal amount of the convertible debentures divided by the conversion price of $5.60 per share.
(7) As of January 1, 2011, Bellatrix prepares its consolidated financial statements in accordance with IFRS, IFRS 1- First-time adoption of International Financial Reporting Standards (“IFRS 1”) and International Accounting Standard 34- Interim Financial Reporting, as issued by the International Accounting Standards Board. Previously, Bellatrix’s financial statements were prepared in accordance with Canadian generally accepted accounting principles (“previous GAAP”). Reconciliations between previous GAAP and IFRS financial information can be found in the consolidated financial statements for the three months ended March 31, 2011.
3
REPORT TO SHAREHOLDERS
Bellatrix Exploration Ltd. was extremely active in directing a capital expenditure budget of $59.1 million in the first quarter of 2011. The program was focused on exploiting our Cardium Oil and Notikewin liquid rich gas resources by drilling 21 gross (12.1 net) wells coupled with increasing our undeveloped acreage on the Cardium play by 14,042 net acres (21.9 sections), which replaces more than the inventory drilled to date.
Increased unscheduled facility and well downtime and infrastructure construction delays occurred in the first quarter associated with the extremely frigid weather experienced in Alberta. As a result, sales volumes in Q1 2011 were flat with Q4 2010 at 10,084 boe/d (approximately 39% oil and liquids). The estimated field production level for the month of April 2011 has increased dramatically to 12,134 boe/d (39% oil & liquids) as a direct result of the first quarter drilling success.
OPERATIONS
Operational highlights for the quarter ended March 31, 2011 include:
· The Company established 100% drill bit success drilling 21 gross (12.07 net) wells consisting of 15 gross (9.67 net) oil wells and 6 gross (2.4 net) liquids rich gas wells.
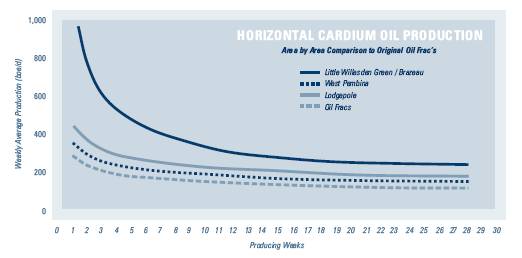
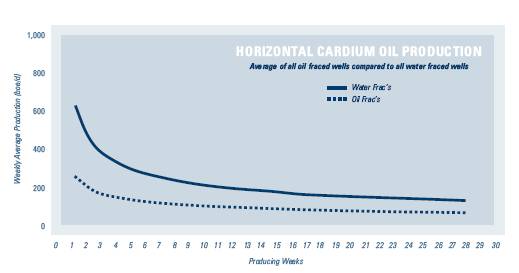
· Bellatrix implemented a modification in our fracturing proppant carrying fluid from oil based to water based, in May 2010, as a component of our ongoing optimization program. The results exceeded our expectation reflected by reduced well costs by $500,000, while more than doubling the post frac production rates. The population of wells tested was in 4 different quadrants of the Cardium embankment (Norbuck, Lodgepole, Willesden Green and West Pembina).
Below is a table comparing average IP rates for 30 days followed by graphical presentation of the comparable rates over a 28 week period:
Cardium Production Test Results
| | *Oil Fraced Wells | | **Water Fraced Wells | | ***Q1 2011 Wells | |
| | boe/d | | # Wells | | boe/d | | # Wells | | boe/d | | # Wells | |
IP7 (1) | | 214 | | 13 | | 699 | | 21 | | 671 | | 9 | |
IP15 (1) | | 203 | | 13 | | 614 | | 21 | | 562 | | 9 | |
IP30 (1) | | 177 | | 13 | | 515 | | 19 | | 484 | | 7 | |
(1) IP represents average boe/d for 7, 15 and 30 days.
*All wells fraced with oil in the aforementioned 4 areas of the pool.
**All wells fraced with water in 3 areas (Lodgepole, Willesden Green & West Pembina).
***All wells in Q1 2011 were water fraced in 3 areas (Lodgepole, Willesden Green & West Pembina).
4
· In the March 28, 2011 CIBC Resource Play Watch, the author listed 5 of Bellatrix’s Cardium producers in the top 8 producing wells based on “Peak IP rate” which represents the maximum “monthly producing rate” in a wells first 8 months of production. The population of wells reviewed was 497.
· In Q1 2011 the Company drilled or participated in drilling 13 gross (7.66 net) Cardium Oil tests, 2 gross (2 net) McLaren heavy oil tests and 6 gross (2.4 net) Notikewin/Fahler liquids rich gas tests.
· All 6 gross (2.4 net) Notikewin wells drilled in Q1 tested at rates at or above 10 MMcf/d with 35 bbls of liquids per MMcf. Four gross (1.85 net) were placed on production in Q1 at various rates between 7 and 10 MMcf/d with approximately 35 bbls liquids per MMcf while the remaining 2 gross (0.55 net) wells are expected to commence production during May.
· As at March 31, 2011 Bellatrix had over 220,290 net undeveloped acres of land in Alberta, British Columbia and Saskatchewan up from 211,893 net acres as at December 31, 2010.
· Q1 2011 sales volumes averaged 10,084 boe/d (weighted approximately 39% to oil and natural gas liquids).
· For the month of April 2011 production volumes are estimated to average 12,134 boe/d (weighted 39% to oil and natural gas liquids).
5
FINANCIAL
Financial highlights for the quarter ended March 31, 2011 include:
· Bellatrix spent $59.1 million in Q1 2011 consisting of $39.5 million capital on drilling and completions, $5.7 million capital on facilities and equipment, $13.7 million capital on property and lease acquisitions and retention with the remaining $0.2 million spent on other items.
· Q1 2011 revenue of $40.5 million up from $26.9 million in Q1 2010.
· Funds flow from operations was $17.0 million, up from $10.2 million in Q1 2010.
· Crude oil and NGLs produced 67% of revenue in Q1 2011.
· Production expenses totalled $11.3 million ($12.45/boe) which included adjustments relating to changes in previous estimates totalling $1.2 million ($1.80/boe).
· Net debt as of March 31, 2011 was $130.2 million.
· On May 11, 2011, Bellatrix closed a $55 million bought deal equity financing. In addition, an over-allotment option to purchase up to 1.5 million common shares for gross proceeds of $8.2 million is available to the underwriters until 30 days following closing. The financing facilitates acceleration of our inventory of 320 net Cardium locations and 100 net Notikewin locations which represents $1.5 billion of development capital exceeding 10 years of cash flow at current levels.
· Increased 2011 capital expenditures program from $100 million to $170 million.
· As of May 10, 2011, the banking syndicate has agreed, subject to and effective upon final documentation, to increase the borrowing base from $100 million to $140 million through to November 30, 2011 and extend the revolving period of the credit facility from June 28, 2011 to June 26, 2012.
· Increased estimated exit rate guidance from 13,000 boe/d to 15,000 boe/d.
COMMODITY PRICE RISK MANAGEMENT
During the first quarter 2011, Bellatrix financially sold 18.2 MMcf/d of natural gas for the period of April 01 to October 31, 2011 at an average fixed price of CAD$4.15/mcf. Additionally, Bellatrix sold a call on 833 bbl/d of crude oil for calendar 2012 at a price of US$110/bbl and used the proceeds to enter into a financial fixed price swap on 4.55 MMcf/d of natural gas for the term of May 1 to December 31, 2011 at a price of CAD$6.92/mcf. Bellatrix also entered into fixed price swaps for 500 bbl/d of crude oil for the term of February 1 to December 31, 2011 at a price of US$95.00/bbl and 500 bbl/d of crude oil for the term of March 1 to December 31, 2011 at a fixed price of US$97.50/bbl.
OUTLOOK
As a result of the successful completion of the May 2011 equity offering, Bellatrix has revised its capital expenditure budget for 2011 from $100 million to $170 million, which includes the $59.1 million spent in the first quarter of 2011 on capital expenditures. Bellatrix will use cash flow, the proceeds of the financing, and to the extent necessary, bank indebtedness to fund its 2011 capital expenditures budget.
6
In 2011, Bellatrix anticipates drilling 63 gross (47.57 net) wells. Of the 63 gross wells, the Company anticipates drilling 9 gross (9.0 net) potential McLaren heavy oil wells in the Frog Lake area of Alberta and a total of 54 gross (38.57 net) Cardium (85%) and Notikewin (15%) wells in the Pembina and Ferrier areas of Alberta, for an approximate cost of $138.7 million. In addition, the Corporation anticipates spending approximately $2.2 million on land and seismic acquisitions, $12.2 million on well site equipping and field facilities, $13.7 million related to the acquisition of property interests and $3.2 million in costs associated with ongoing abandonment of wells. In addition, over and above the $170 million capital expenditure program, Bellatrix anticipates utilizing up to $10.0 million from a joint venture partner that would earn a non-convertible gross overriding royalty in any resulting production. As a result of the expansion of its 2011 capital program, Bellatrix has revised its guidance on 2011 exit production from 13,000 boe/d to 15,000 boe/d.
The second quarter will be relatively quiet on the operations side of our business due to road restrictions and expected spring wet weather. By the end of Q2 2011, Bellatrix anticipates to be drilling our Cardium play inventory with four drilling rigs.
Bellatrix is focused on expanding the oil side of our business and is always staunchly devoted to providing growth in shareholder value.
/s/ Raymond G. Smith, P. Eng. | |
Raymond G. Smith, P. Eng. | |
President and CEO | |
May 11, 2011 | |
7
MANAGEMENT’S DISCUSSION AND ANALYSIS
May 11, 2011 - The following Management’s Discussion and Analysis of financial results as provided by the management of Bellatrix Exploration Ltd. (“Bellatrix” or the “Company”) should be read in conjunction with the unaudited interim consolidated financial statements of the Company for the three months ended March 31, 2010 and the audited consolidated financial statements of the Company for the years ended December 31, 2010 and 2009 and the related Management’s Discussion and Analysis of financial results, as disclosure which is unchanged from such Management’s Discussion and Analysis may not be repeated herein. This commentary is based on information available to, and is dated as of, May 11, 2011. The financial data presented is in Canadian dollars, except where indicated otherwise. As of January 1, 2011, Bellatrix prepares its consolidated financial statements in accordance with International Financial Reporting Standards (“IFRS”), IFRS 1- First-time adoption of International Financial Reporting Standards (“IFRS 1”) and International Accounting Standard 34- Interim Financial Reporting, as issued by the International Accounting Standards Board. Previously, Bellatrix’s financial statements were prepared in accordance with Canadian generally accepted accounting principles (“previous GAAP”). Reconciliations between previous GAAP and IFRS financial information can be found in the consolidated financial statements for the three months ended March 31, 2011.
CONVERSION: The term barrels of oil equivalent (“boe”) may be misleading, particularly if used in isolation. A boe conversion ratio of six thousand cubic feet of natural gas to one barrel of oil equivalent (6 mcf/bbl) is based on an energy equivalency conversion method primarily applicable at the burner tip and does not represent a value equivalency at the wellhead. All boe conversions in this report are derived from converting gas to oil in the ratio of six thousand cubic feet of gas to one barrel of oil.
NON-GAAP MEASURES: This Management’s Discussion and Analysis contains the term “funds flow from operations” which should not be considered an alternative to, or more meaningful than “cash flow from operating activities” as determined in accordance with generally accepted accounting principles (“GAAP”) as an indicator of the Company’s performance. Therefore reference to funds flow from operations or funds flow from operations per share may not be comparable with the calculation of similar measures for other entities. Management uses funds flow from operations to analyze operating performance and leverage and considers funds flow from operations to be a key measure as it demonstrates the Company’s ability to generate the cash necessary to fund future capital investments and to repay debt. The reconciliation between cash flow from operating activities and funds flow from operations can be found in the Management’s Discussion and Analysis. Funds flow from operations per share is calculated using the weighted average number of shares for the period.
This Management’s Discussion and Analysis also contains other terms such as total net debt and operating netbacks, which are not recognized measures under GAAP. Total net debt is calculated as long-term debt plus the liability component of the convertible debentures and the net working capital deficiency (excess) before short-term commodity contract assets and liabilities and current finance lease obligation. Operating netbacks are calculated by subtracting royalties, transportation, and operating expenses from revenues before other income. Management believes these measures are useful supplemental measures of firstly, the total amount of current and long-term debt and secondly, the amount of revenues received after transportation, royalties and operating expenses. Readers are cautioned, however, that these measures should not be construed as an alternative to other terms such as current and long-term debt or net income determined in accordance with GAAP as measures of performance. Bellatrix’s method of calculating these measures may differ from other entities, and accordingly, may not be comparable to measures used by other trusts or companies.
Additional information relating to the Company, including the Bellatrix’s Annual Information Form, is available on SEDAR at www.sedar.com.
FORWARD LOOKING STATEMENTS: Certain information contained herein may contain forward looking statements including management’s assessment of future plans and operations, drilling plans and the timing thereof, commodity price risk management strategies, expected 2011 average production and exit rate, expected first quarter 2011 average production and production to be tied in, timing of completion and tie-in of wells, anticipated liquidity of the Company and various matters that may impact such liquidity, expected 2011 operating expenses and general and administrative expenses, 2011 capital expenditures budget and the nature of capital expenditures and the timing and method of financing thereof, method of funding drilling commitments, commodity prices and expected volatility thereof, estimated amount and timing of incurring decommissioning liabilities, use of proceeds from recent financings and activity levels, may constitute forward-looking statements under applicable securities laws and necessarily involve risks including, without limitation, risks associated with oil and gas exploration, development, exploitation, production, marketing and transportation, loss of markets, volatility of commodity prices, currency fluctuations, imprecision of reserve estimates, environmental risks, competition from other producers, inability to retain drilling rigs and other services, incorrect assessment of the value of acquisitions, failure to realize the anticipated benefits of acquisitions, delays resulting from or inability to obtain required regulatory approvals and ability to access sufficient capital from internal and external sources. The recovery and reserve estimates of Bellatrix’s reserves provided herein are estimates only and there is no guarantee that the estimated reserves will be recovered. Events or circumstances may cause actual results to differ materially from those predicted, as a result of the risk factors set out and other known and unknown risks, uncertainties, and other factors, many of which are beyond the control of Bellatrix. In addition, forward-looking statements or information are based on a number of factors and assumptions which have been used to develop such statements and information but which may prove to be incorrect. In addition, forward-looking statements or information are based on a number of factors and assumptions which have been used to develop such statements and information in order to provide shareholders with a more complete perspective on Bellatrix’s future operations. Such information may prove to be incorrect and readers are cautioned that the information may not be appropriate for other purposes. Although the Company believes that the expectations reflected in such forward-looking statements or information are reasonable, undue reliance should not be placed on forward-looking statements because the Company can give no assurance that such expectations will prove to be correct. In addition to other factors and assumptions which may be identified herein, assumptions have been made regarding, among other things: the impact of increasing competition; the general stability of the economic and political environment in which the Company operates; the timely receipt of any required regulatory approvals; the ability of the Company to obtain qualified staff, equipment and services in a timely and cost efficient manner; drilling results; the ability of the operator of the projects which the Company has an interest in to operate the field in a safe, efficient and effective manner; the ability of the Company to obtain financing on acceptable terms; field production rates and decline rates; the ability to replace and expand oil and natural gas reserves through acquisition, development of exploration; the timing and costs of pipeline, storage and facility construction and expansion and the ability of the Company to secure adequate product transportation; future commodity gas prices; currency, exchange and interest rates; the regulatory framework regarding royalties, taxes and environmental matters in the jurisdictions in which the Company operates; and the ability of the Company to successfully market its oil and natural gas products. Readers are cautioned that the foregoing list is not exhaustive of all factors and assumptions which have been used. As a consequence, actual results may differ materially from those anticipated in the forward-looking statements. Additional information on these and other factors that could effect Bellatrix’s operations and financial results are included in reports on file with Canadian securities regulatory authorities and may be accessed through the SEDAR website (www.sedar.com), at Bellatrix’s website (www.bellatrixexploration.com). Furthermore, the forward-looking statements contained herein are made as at the date hereof and Bellatrix does not undertake any obligation to update publicly or to revise any of the included forward-looking statements, whether as a result of new information, future events or otherwise, except as may be required by applicable securities laws.
8
The reader is further cautioned that the preparation of financial statements in accordance with GAAP requires management to make certain judgments and estimates that affect the reported amounts of assets, liabilities, revenues and expenses. Estimating reserves is also critical to several accounting estimates and requires judgments and decisions based upon available geological, geophysical, engineering and economic data. These estimates may change, having either a negative or positive effect on net earnings as further information becomes available, and as the economic environment changes.
OVERVIEW AND DESCRIPTION OF THE BUSINESS
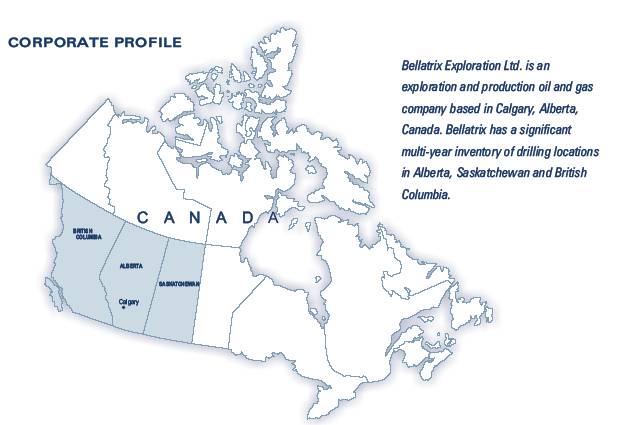
Bellatrix is a Western Canadian based growth oriented oil and gas company engaged in the exploration for, and the acquisition, development and production, of oil and natural gas reserves in the provinces of Alberta, British Columbia and Saskatchewan.
Bellatrix is the continuing corporation resulting from the reorganization effective November 1, 2009 pursuant to a plan of arrangement involving, among others, True Energy Trust (the “Trust” or “True”), Bellatrix Exploration Ltd. (“Bellatrix” or the “Company”) and securityholders of the Trust.
Bellatrix’s common shares and convertible debentures are listed on the Toronto Stock Exchange under the symbols BXE and BXE.DB.A, respectively.
CHANGES IN ACCOUNTING POLICIES
As of January 1, 2011, Bellatrix prepares its financial statements in accordance with International Financial Reporting Standards (“IFRS”), IFRS 1- First-time adoption of International Financial Reporting Standards (“IFRS 1”) and International Accounting Standard 34- Interim Financial Reporting, as issued by the International Accounting Standards Board. Previously, Bellatrix’s financial statements were prepared in accordance with Canadian generally accepted accounting principles (“previous GAAP”). Unless otherwise noted, 2010 comparative information has been prepared in accordance with IFRS.
The adoption of IFRS has not had an impact on the Company’s operations, strategic decisions and cash flow. The most significant area of impact was the adoption of the IFRS property, plant and equipment accounting principles, the related decomissioning liabilities and resulting deferred tax adjustments on transition. Further information on the IFRS impacts is provided in the Accounting Policies and Estimates Section of this Management’s Discussion and Analysis.
FIRST QUARTER 2011 FINANCIAL AND OPERATIONAL RESULTS
ACQUISITIONS AND DISPOSITIONS
The Company’s goal is to provide consistent growth by drilling and developing its extensive land position to maximize the value of its reserve and resource potential. Bellatrix has been working on a number of internal initiatives to streamline and optimize our ongoing operations, specifically the ability to expand and accelerate the drilling of its Cardium oil and the liquid rich Notikewin gas resource.
On January 25, 2011, Bellatrix acquired the interest in a section of Frog Lake First Nation lands from a joint venture partner for a net purchase price of $2.2 million after adjustments. The transaction had an effective date of January 1, 2011. These assets consists of approximately 130 boe/d of net production; an additional 20% interest in the Colony formation in these lands (Bellatrix already has 13.75%WI) and an additional 50% WI in the McLaren formation in these lands (Bellatrix already has a 50% WI) except for a 1/4 section (which Bellatrix already has a 13.75% WI).
On January 25, 2011, Bellatrix exercised a right of first refusal increasing its interest in a joint venture property in the Brazeau area of West Central Alberta for approximately $1.5 million. The asset acquisition consisted of approximately 3,200 gross (1,102.8 net) acres of Cardium rights providing the Company with up to 6.3 additional net Cardium locations and included 15 boe/d of production.
9
SALES VOLUMES
Sales volumes for the three months ended March 31, 2011 averaged 10,084 boe/d compared to 7,248 boe/d for the same period in 2010, representing a 39% increase. Total crude oil, condensate and NGLs averaged approximately 39% of sales volumes for the three months ended March 31, 2011 compared to 26% of sales volumes in the same period in 2010. The increase in sales is primarily a result of a year over year increased capital program. Capital expenditures on exploration and development for the year ended December 31, 2009 were $15.8 million, compared to $98.4 million for the same period in 2010. By comparison, Bellatrix’s capital expenditures on exploration and development for the three months ended March 31, 2011, increased by approximately 203% when compared to the same period in 2010.
| | Three months ended March 31, | |
Sales Volumes | | 2011 | | 2010 | |
Light oil and condensate (bbls/d) | | 3,031 | | 1,054 | |
NGLs (bbls/d) | | 556 | | 494 | |
Heavy oil (bbls/d) | | 273 | | 359 | |
Total crude oil, condensate and NGLs (bbls/d) | | 3,860 | | 1,907 | |
Natural gas (mcf/d) | | 37,346 | | 32,044 | |
Total (boe/d, 6:1) | | 10,084 | | 7,248 | |
In the first quarter of 2011 Bellatrix drilled and participated in 21 gross (12.07 net) successful wells. Bellatrix completed and tied in 14 (10.33 net) of the 15 gross operated wells drilled in the quarter. The remaining 1 gross (0.33 net) well will be completed following break up. The Company participated in 6 gross (1.41 net) successful non-operated wells which includes one gross (0.06 net) joint venture Cardium well, which is expected to be completed and tied in after break up.
By comparison, Bellatrix drilled or participated in 14 gross (8.06 net) wells in the first quarter of 2010, which consisted of 11 gross (6.01 net) oil wells and 3 gross (2.05 net) gas wells.
For the three months ended March 31, 2011, the weighting towards crude oil, condensate and NGLs increased by approximately 102% averaging 3,860 bbl/d compared to 1,907 bbl/d in the same period in 2010. The increase is a direct result of the Company’s efforts to balance production by exploiting the Company’s crude oil drilling locations. For the three months ended March 31, 2011, crude oil, condensate and NGLs averaged approximately 38% of sales volumes compared to an average of approximately 26% of sales volumes in the same period in 2010.
Sales of natural gas averaged 37.4 Mmcf/d for the first quarter of 2011, compared to 32.4 Mmcf/d in the same 2010 period, an increase of approximately 17%. The weighting towards natural gas sales volumes averaged approximately 61% for the three months ended March 31, 2011 compared to 74% in the same period in 2010.
Based on the timing of proposed expenditures, downtime for anticipated plant turnarounds and normal production declines, execution of the 2011 budget is anticipated to provide 2011 average daily production of approximately 12,000 boe/d to 12,500 boe/d. Bellatrix has revised its capital expenditure program for 2011 from $100 million to $170 million as a result of the recently closed May 2011 financing. Due to the increased capital expenditure program for 2011, Bellatrix has increased its previously estimated exit production guidance for 2011 of 13,000 boe/d to 15,000 boe/d. The 2011 capital budget is expected to be directed primarily towards horizontal drilling and completions activities in the Cardium and Notikewin resource plays.
10
COMMODITY PRICES
| | Three months ended March 31, | | | |
Average Commodity Prices | | 2011 | | 2010 | | % Change | |
Exchange rate (US$/Cdn$) | | 1.0147 | | 0.9615 | | 6 | |
Crude oil: | | | | | | | |
WTI (US$/bbl) | | 94.60 | | 78.88 | | 20 | |
Edmonton par - light oil ($/bbl) | | 88.45 | | 80.31 | | 10 | |
Bow River - medium/heavy oil ($/bbl) | | 71.30 | | 73.44 | | (3 | ) |
Hardisty Heavy - heavy oil ($/bbl) | | 61.43 | | 68.78 | | (11 | ) |
Bellatrix’s average prices ($/bbl) | | | | | | | |
Light crude oil and condensate | | 83.75 | | 77.91 | | 7 | |
NGLs | | 51.27 | | 44.14 | | 16 | |
Heavy crude oil | | 59.55 | | 64.85 | | (8 | ) |
Total crude oil and NGLs | | 77.36 | | 66.71 | | 16 | |
Total crude oil and NGLs (including risk management (1)) | | 74.61 | | 66.71 | | 12 | |
Natural gas: | | | | | | | |
NYMEX (US$/mmbtu) | | 4.20 | | 4.99 | | (16 | ) |
AECO daily index (CDN$/mcf) | | 3.76 | | 4.95 | | (24 | ) |
AECO monthly index (CDN$/mcf) | | 3.77 | | 5.36 | | (30 | ) |
Bellatrix’s average price ($/mcf) | | 3.94 | | 5.18 | | (24 | ) |
Bellatrix’s average price (including risk management (1)) ($/mcf) | | 3.94 | | 6.04 | | (35 | ) |
(1) Per unit metrics including risk management include realized gains or losses on commodity contracts and exclude unrealized gains or losses on commodity contracts.
For light oil and condensate, Bellatrix recorded an average $83.75/bbl before commodity price risk management contracts during the first quarter of 2011, 7% higher than the average price received in the same period in 2010. In comparison, the Edmonton par price increased by 10% over the same period. The average WTI crude oil US dollar based price increased 20% from the first quarter of 2010 to that in 2011. The average US$/CDN$ foreign exchange rate was 1.0147 for the three months ended March 31, 2011 compared to 0.9615 in the same period in 2010.
For heavy crude oil, Bellatrix received an average price before transportation of $59.55/bbl in the 2011 first quarter, a decrease of 8% over prices in the same 2010 period. The Bow River reference price decreased by 3% and the Hardisty Heavy reference price decreased by 11% from the first quarter of 2010 to that in 2011. The majority of Bellatrix’s heavy crude oil density ranges between 11 and 16 degrees API consistent with the Hardisty Heavy reference price.
Bellatrix’s natural gas sales are priced with reference to the daily or monthly AECO indices. During the 2011 first quarter, the AECO daily and monthly reference price decreased by 24% and 30%, respectively, compared to the same period in 2010. Bellatrix’s natural gas average sales price before commodity price risk management contracts for the 2011 first quarter decreased by 24% compared to the same period in 2010. Bellatrix’s natural gas average price after including commodity price risk management contracts for the first quarter in 2011 was $3.94/mcf compared to $6.04/mcf for the same period in 2010.
REVENUE
Revenue before other income, royalties and commodity price risk management contracts for the three month period ended March 31, 2011 was $40.1 million, 52% higher than the $26.4 million in the same period in 2010.
Revenue before other income, royalties and commodity price risk management contracts for crude oil and NGLs for the three months ended March 31, 2011 increased approximately 135% as a result of higher sales volumes in conjunction with higher light crude oil, condensate and NGL prices. In the 2011 first quarter, total crude oil, condensate and NGL revenues contributed 67% of total revenue (before other) compared to 43% in the same period in 2010. Light crude oil, condensate and NGL revenues in the first quarter of 2011 contributed 95% of total crude oil, condensate and NGL revenue (before other) compared to 82% in the same period in 2010.
11
Revenue before other income, royalties and commodity price risk management contracts for natural gas for the three months ended March 31, 2011 decreased approximately 11% as a result of weaker prices when compared to the same period in 2010.
| | Three months ended March 31, | |
($000s) | | 2011 | | 2010 | |
Light crude oil and condensate | | 22,844 | | 7,394 | |
NGLs | | 2,564 | | 1,961 | |
Heavy oil | | 1,464 | | 2,099 | |
Crude oil and NGLs | | 26,872 | | 11,454 | |
Natural gas | | 13,240 | | 14,928 | |
Total revenue before other | | 40,112 | | 26,382 | |
Other (1) | | 423 | | 547 | |
Total revenue before royalties and risk management | | 40,535 | | 26,929 | |
(1) Other revenue primarily consists of processing and other third party income.
Revenues for the remainder of 2011 are currently expected to be higher than the corresponding period in 2010 due to expected increased sales volumes and higher crude oil prices. While sales volumes and crude oil and liquid prices for 2011 are expected to be higher than 2010, natural gas prices remain relatively weak.
COMMODITY PRICE RISK MANAGEMENT
The Company has a formal commodity price risk management policy which permits management to use specified price risk management strategies including fixed price contracts, collars and the purchase of floor price options and other derivative financial instruments and physical delivery sales contracts to reduce the impact of price volatility for a maximum of eighteen months beyond the transaction date. The program is designed to provide price protection on a portion of the Company’s future production in the event of adverse commodity price movement, while retaining significant exposure to upside price movements. By doing this, the Company seeks to provide a measure of stability to funds flow from operations, as well as, to ensure Bellatrix realizes positive economic returns from its capital development and acquisition activities. The Company plans to continue its commodity price risk management strategies focusing on maintaining sufficient cash flow to fund Bellatrix’s capital expenditure program. Any remaining production is realized at market prices.
A summary of the financial commodity price risk management volumes and average prices by quarter currently outstanding as of May 11, 2011 is shown in the following tables:
Natural Gas
Average Volumes (GJ/d)
| | Q2 2011 | | Q3 2011 | | Q4 2011 | |
Fixed | | 23,352 | | 25,000 | | 11,739 | |
Total (GJ/d) | | 23,352 | | 25,000 | | 11,739 | |
Average Price ($/GJ AECO C)
| | Q2 2011 | | Q3 2011 | | Q4 2011 | |
Fixed | | 4.14 | | 4.29 | | 4.85 | |
Crude Oil and Liquids
Average Volumes (bbls/d)
| | Q2 2011 | | Q3 2011 | | Q4 2011 | |
Fixed (CDN$/bbl) | | 1,500 | | 1,500 | | 1,500 | |
Fixed (US$/bbl) | | 1,500 | | 1,500 | | 1,500 | |
Total (bbls/d) | | 3,000 | | 3,000 | | 3,000 | |
12
Average Price ($/bbl WTI)
| | Q2 2011 | | Q3 2011 | | Q4 2011 | |
Fixed price (CDN$/bbl) | | 88.45 | | 88.45 | | 88.45 | |
Fixed price (US$/bbl) | | 93.87 | | 93.87 | | 93.87 | |
Average Volumes (bbls/d)
| | Q1 2012 | | Q2 2012 | | Q3 2012 | | Q4 2012 | |
Call option | | 833 | | 833 | | 833 | | 833 | |
Total (bbls/d) | | 833 | | 833 | | 833 | | 833 | |
Average Price ($/bbl WTI)
| | Q1 2012 | | Q2 2012 | | Q3 2012 | | Q4 2012 | |
Call option (ceiling price) (US$/bbl) | | 110.00 | | 110.00 | | 110.00 | | 110.00 | |
Included in the above natural gas table is a fixed price contract of $6.30/GJ at 5,000 GJ/d from May 1, 2011 to October 31, 2011 which was funded by selling a call option of 833 bbl/d at US$110.00 for the 2012 calendar year.
As of March 31, 2011, the fair value of Bellatrix’s outstanding commodity contracts is a net unrealized liability of $13.0 million as reflected in the financial statements. The fair value or mark-to-market value of these contracts is based on the estimated amount that would have been received or paid to settle the contracts as at March 31, 2011 and may be different from what will eventually be realized. Changes in the fair value of the commodity contracts are recognized in the Consolidated Statements of Comprehensive Income within the financial statements.
The following is a summary of the gain (loss) on commodity contracts for the three months ended March 31, 2011 and 2010 as reflected in the Consolidated Statements of Comprehensive Income in the financial statements:
Commodity Contracts
| | Crude Oil | | Natural | | 2011 | |
($000s) | | & Liquids | | Gas | | Total | |
Realized cash loss on contracts | | (956 | ) | — | | (956 | ) |
Unrealized gain (loss) on contracts (1) | | (12,962 | ) | 3,734 | | (9,228 | ) |
Total gain (loss) on commodity contracts | | (13,918 | ) | 3,734 | | (10,184 | ) |
| | Crude Oil | | Natural | | 2010 | |
($000s) | | & Liquids | | Gas | | Total | |
Realized cash gain on contracts | | — | | 2,492 | | 2,492 | |
Unrealized gain (loss) on contracts (1) | | (7 | ) | 7,263 | | 7,256 | |
Total gain (loss) on commodity contracts | | (7 | ) | 9,755 | | 9,748 | |
(1) Unrealized gain (loss) commodity contracts represent non-cash adjustments for changes in the fair value of these contracts during the period.
ROYALTIES
For the three months ended March 31, 2011, total royalties were $6.5 million, compared to $5.3 million incurred in the same 2010 period. Overall royalties as a percentage of revenue (after transportation costs) in the first quarter of 2011 were 17%, compared with 21% in the same 2010 period.
The decrease in light oil, condensate and NGL royalties’ percentage from the first quarter of 2010 to 2011 is primarily due to increased production from recently drilled light oil wells which take advantage of Alberta royalty incentive programs. The heavy oil royalty rate increased as a result of the sale of Saskatchewan heavy oil assets with lower royalty rates in December 2010 and recently added heavy oil production in Frog Lake, Alberta with higher crown royalty rates.
13
Royalties by Commodity Type
| | Three months ended March 31, | |
($000s, except where noted) | | 2011 | | 2010 | |
Light crude oil, condensate and NGLs | | 4,044 | | 2,499 | |
$/bbl | | 12.53 | | 17.93 | |
Average light crude oil, condensate and NGLs royalty rate (%) | | 16 | | 27 | |
Heavy oil | | 717 | | 547 | |
$/bbl | | 29.16 | | 16.93 | |
Average heavy oil royalty rate (%) | | 49 | | 27 | |
Natural gas | | 1,710 | | 2,204 | |
$/mcf | | 0.51 | | 0.76 | |
Average natural gas royalty rate (%) | | 14 | | 15 | |
Total | | 6,471 | | 5,250 | |
$/boe | | 7.13 | | 8.05 | |
Average total royalty rate (%) | | 17 | | 21 | |
Royalties, by Type
| | Three months ended March 31, | |
($000s) | | 2011 | | 2010 | |
Crown royalties | | 2,663 | | 1,346 | |
Indian Oil and Gas Canada royalties | | 1,182 | | 921 | |
Freehold & GORR | | 2,626 | | 2,983 | |
Total | | 6,471 | | 5,250 | |
Expenses
| | Three months ended March 31, | |
($000s) | | 2011 | | 2010 | |
Production | | 11,298 | | 8,717 | |
Transportation | | 1,167 | | 808 | |
General and administrative | | 2,267 | | 2,536 | |
Interest and financing charges (1) | | 1,701 | | 2,414 | |
Share-based compensation | | 495 | | 192 | |
(1) Does not include financing charges in relation to the Company’s unwinding of decommissioning liabilities.
Expenses per boe
| | Three months ended March 31, | |
($ per boe) | | 2011 | | 2010 | |
Production | | 12.45 | | 13.36 | |
Transportation | | 1.29 | | 1.24 | |
General and administrative | | 2.50 | | 3.89 | |
Interest and financing charges | | 1.87 | | 3.70 | |
Share-based compensation | | 0.55 | | 0.29 | |
14
PRODUCTION EXPENSES
For the three months ended March 31, 2011, production expenses totaled $11.3 million ($12.45/boe), compared to $8.7 million ($13.36/boe) recorded in the same period in 2010. The decrease in production expenses in 2011 on a boe basis is due to increased production from 2010 and continued 2011 drilling in areas with lower production expenses and the Company’s continued efforts to streamline operations and field optimization projects. Production expenses for the three months ended March 31, 2011 include approximately $1.2 million (2010: $0.3 million) of adjustments relating to changes in previous estimates.
Bellatrix is targeting operating costs of approximately $51.6 million ($11.78/boe) in 2011. This is based upon assumptions of estimated 2011 average production of approximately 12,000 boe/d, continued field optimization work and planned capital expenditures in producing areas which are anticipated to have lower operating costs.
Production Expenses, by Commodity Type
| | Three months ended March 31, | |
($000s, except where noted) | | 2011 | | 2010 | |
Light crude oil, condensate and NGLs | | 4,509 | | 2,378 | |
$/bbl | | 13.97 | | 17.07 | |
Heavy oil | | 787 | | 313 | |
$/bbl | | 32.03 | | 9.69 | |
Natural gas | | 6,002 | | 6,026 | |
$/mcf | | 1.79 | | 2.09 | |
Total | | 11,298 | | 8,717 | |
$/boe | | 12.45 | | 13.36 | |
Total | | 11,298 | | 8,717 | |
Processing and other third party income(1) | | (423 | ) | (547 | ) |
Total after deducting processing and other third party income | | 10,875 | | 8,170 | |
$/boe | | 11.98 | | 12.52 | |
(1) Processing and other third party income is included within petroleum and natural gas sales on the Consolidated Statements of Comprehensive Income.
TRANSPORTATION
Transportation expenses for the three months ended March 31, 2011 were $1.2 million ($1.29/boe) compared to $0.8 million ($1.24/boe) in the same 2010 period.
OPERATING NETBACK
Field Operating Netback - Corporate (before risk management)
| | Three months ended March 31, | |
($/boe) | | 2011 | | 2010 | |
Sales | | 44.20 | | 40.44 | |
Transportation | | (1.29 | ) | (1.24 | ) |
Royalties | | (7.13 | ) | (8.05 | ) |
Production expense | | (12.45 | ) | (13.36 | ) |
Field operating netback | | 23.33 | | 17.79 | |
For first quarter of 2011, corporate field operating netback (before commodity price risk management contracts) was $23.33/boe compared to $17.79/boe in the same 2010 period. This was primarily the result of an increase in crude oil, condensate and natural gas liquids commodity prices, as well as a decrease in production expenses and royalties offset by an increase in transportation expenses. After including commodity price risk management contracts, the corporate field operating netback for the first quarter of 2011 was $22.28/boe compared to $21.61/boe in the same 2010 period. In comparison, fourth quarter 2010, corporate field operating netback (before commodity price risk management contracts) was $19.71/boe.
15
Field Operating Netback - Crude Oil, Condensate and NGLs (before risk management)
| | Three months ended March 31, | |
($/bbl) | | 2011 | | 2010 | |
Sales | | 77.35 | | 66.71 | |
Transportation | | (1.52 | ) | (0.97 | ) |
Royalties | | (13.70 | ) | (17.74 | ) |
Production expense | | (15.24 | ) | (15.68 | ) |
Field operating netback | | 46.89 | | 32.32 | |
Field operating netback for crude oil, condensate and NGLs averaged $46.89/bbl for the three month period ended March 31, 2011, up 45% compared to $32.32/bbl for the same period in 2010. The significant increase is primarily due to the increase in commodity prices for crude oil, condensate and natural gas liquids, as well as decreases in royalties and production expenses, offset by an increase in transportation. After including commodity price risk management contracts, field operating netback for crude oil and NGLs for the first quarter in 2011 was $44.13/boe compared to $32.32/boe in the same period in 2010.
Field Operating Netback - Natural Gas (before risk management)
| | Three months ended March 31, | |
($/mcf) | | 2011 | | 2010 | |
Sales | | 3.94 | | 5.18 | |
Transportation | | (0.19 | ) | (0.22 | ) |
Royalties | | (0.51 | ) | (0.76 | ) |
Production expense | | (1.79 | ) | (2.09 | ) |
Field operating netback | | 1.45 | | 2.11 | |
Field operating netback for natural gas in the first quarter of 2011 decreased 31% to $1.45/mcf, compared to $2.11/mcf in the same period in 2010, reflecting weaker natural gas prices experienced offset by lower transportation, royalties and production expenses. After including commodity price risk management contracts, field operating netback for natural gas for the three month period ended March 31, 2011 was $1.45/mcf compared to $2.96/mcf in the same period in 2010.
GENERAL AND ADMINISTRATIVE
General and administrative (“G&A”) expenses (after capitalized G&A and recoveries) for the period ended March 31, 2011 were $2.3 million ($2.50/boe) compared to $2.5 million ($3.89/boe) for the same period in 2010. The decrease in the G&A expense for the first quarter of 2011 from the same period in 2010 reflects higher compensation and base costs, offset by an increase in capitalized G&A and recoveries which are consistent with Bellatrix’s higher 2011 capital program.
For 2011, the Company is anticipating G&A costs after capitalization to be approximately $12.0 million ($2.74/boe) based on estimated 2011 average production volumes of approximately 12,000 boe/d.
General and Administrative Expenses
| | Three months ended March 31, | |
($000s, except where noted) | | 2011 | | 2010 | |
Gross expenses | | 4,265 | | 3,192 | |
Capitalized | | (844 | ) | (364 | ) |
Recoveries | | (1,154 | ) | (292 | ) |
G&A expenses | | 2,267 | | 2,536 | |
G&A expenses, per unit ($/boe) | | 2.50 | | 3.89 | |
16
INTEREST AND FINANCING CHARGES
Bellatrix recorded $1.7 million of interest and financing charges related to bank debt and its debentures for the three months ended March 31, 2011 compared to $2.4 million in the same period in 2010. The reduction in interest and financing charges is primarily due to the Company’s issuance of its 4.75% Convertible Unsecured Subordinated Debentures due April 30, 2015 (the “4.75% Debentures”) in April 2010 which facilitated the redemption of Bellatrix’s 7.5% Convertible Unsecured Subordinated Debentures (the “7.5% Debentures”) which were outstanding during the first quarter of 2010. The decrease in interest and financing charges in the 2011 first quarter was offset by a higher average debt balance when compared to the same period in 2010.
Bellatrix’s total net debt at March 31, 2011 of $130.2 million includes the $48.0 million liability portion of 4.75% Debentures, $70.3 million of bank debt and the net balance of a working capital deficiency. The 4.75% Debentures have a maturity date of April 30, 2015.
Interest and Financing Charges (1)
| | Three months ended March 31, | |
($000s, except where noted) | | 2011 | | 2010 | |
Interest and financing charges | | 1,701 | | 2,414 | |
Interest and financing charges ($/boe) | | 1.87 | | 3.70 | |
(1) Does not include financing charges in relation to the Company’s unwinding of decommissioning liabilities.
| | Three months ended March 31, | |
($000s, except where noted) | | 2011 | | 2010 | |
Debt to funds flow from operations (1) ratio annualized (3) | | | | | |
Funds flow from operations (1) (annualized) | | 68,108 | | 40,792 | |
Total net debt (2) at period end | | 130,170 | | 73,614 | |
Total net debt to periods funds flow from operations ratio annualized (3) | | 1.9x | | 1.8x | |
| | | | | |
Net debt(2) (excluding convertible debentures) at period end | | 82,219 | | — | |
Net debt to periods funds flow from operations ratio annualized (3) | | 1.2x | | — | |
| | | | | |
Debt to funds flow from operations(1) ratio (trailing)(4) | | | | | |
Funds flow from operations (1) ratio trailing | | 59,871 | | 39,734 | |
Total net debt(2) to funds flow from operations trailing | | 2.2x | | 1.9x | |
| | | | | |
Net debt(2) (excluding convertible debentures) to funds flow from operations for the period | | 1.4x | | — | |
(1) As detailed previously in this Management’s Discussion and Analysis, funds flow from operations is a term that does not have any standardized meaning under GAAP. Funds flow from operations is calculated as cash flow from operating activities, decomissioning costs incurred and changes in non-cash working capital incurred.
(2) Net debt includes the net working capital deficiency (excess) before short-term commodity contract assets and liabilities and current finance lease obligation. Total net debt also includes the liability component of convertible debentures and excludes deferred liabilities, finance lease obligation, decommissioning liabilities and deferred tax assets and liabilities. Total net debt is a non-GAAP measure; refer to the following reconciliation of total liabilities to total net debt.
(3) Total net debt and net debt to periods funds flow from operations ratio (annualized) is calculated based upon first quarter funds flow from operations annualized.
(4) Trailing periods funds flow from operations ratio annualized is based on the twelve-months period ended March 31, 2011 and March 31, 2010.
17
Reconciliation of Total Liabilities to Total Net Debt
| | As at March 31, | |
($000s, except where noted) | | 2011 | | 2010 | |
Total liabilities per financial statements | | 232,603 | | 151,063 | |
Current liabilities included within working capital calculation | | (70,403 | ) | (29,354 | ) |
Deferred liability - flow-through shares | | (3,288 | ) | — | |
Decommissioning liabilities | | (39,256 | ) | (39,523 | ) |
Finance lease obligation | | (1,407 | ) | — | |
Working capital | | | | | |
Current assets | | (45,375 | ) | (48,556 | ) |
Current liabilities | | 70,403 | | 29,354 | |
Current portion of finance lease | | (147 | ) | — | |
Net commodity contract asset (liability) | | (12,960 | ) | 10,630 | |
| | 11,921 | | (8,572 | ) |
Total net debt | | 130,170 | | 73,614 | |
SHARE-BASED COMPENSATION
Non-cash share-based compensation expense for the three months ended March 31, 2011 was an expense of $0.5 million compared to $0.2 million in the same period in 2010. The increase in expense from the first quarter of 2010 compared to 2011 is primarily due to 2.3 million share options granted subsequent to March 31, 2010 with an average exercise price of $3.92 and an average fair value of $1.96 per option.
DEPLETION AND DEPRECIATION
Depletion and depreciation expense for the first quarter in 2011 was $13.8 million ($15.16/boe) compared to $10.1 million ($15.55/boe) in the same period in 2010. The decrease in depletion and depreciation expense per boe from the first quarter in 2010 to that in 2011 is primarily due to a 58% increase in the reserve base used for depletion, offset by a higher cost base and future development costs.
For the three months ended March 31, 2011 Bellatrix has included a total $254.1 million (2010: $94.1 million) for future development costs in the depletion calculation and excluded from the depletion calculation a total of $34.9 million (2010: $27.8 million) for estimated salvage.
Depletion and Depreciation
| | Three months ended March 31, | |
($000s, except where noted) | | 2011 | | 2010 | |
Depletion and depreciation | | 13,759 | | 10,146 | |
Per unit ($/boe) | | 15.16 | | 15.55 | |
INCOME TAXES
Deferred income taxes arise from differences between the accounting and tax bases of the Company’s assets and liabilities. For the three months ended March 31, 2011, the Company recognized a deferred income tax recovery of $1.5 million compared to an expense of $2.0 million in the same period in 2010, which is consistent with the pre-tax loss of $7.0 million for the three months ended March 31, 2011 and the pre-tax profit of $6.0 million for three months ended March 31, 2010.
As at March 31, 2011, the Company had a total net deferred tax asset balance of $15.8 million. IFRS requires that a deferred tax asset be recorded when the tax pools exceeds the book value of assets, to the extent the amount is probable to be realized.
18
At March 31, 2011, Bellatrix had approximately $489 million in tax pools available for deduction against future income as follows:
($000s) | | Rate % | | 2011 | | 2010 | |
Intangible resource pools: | | | | | | | |
Canadian exploration expenses | | 100 | | 44,300 | | 43,800 | |
Canadian development expenses | | 30 | | 325,300 | | 225,700 | |
Canadian oil and gas property expenses | | 10 | | 17,200 | | 15,300 | |
Foreign resource expenses | | 10 | | 800 | | 1,100 | |
Attributed Canadian Royalty Income | | 100 (Alberta) | | 16,100 | | 16,100 | |
Undepreciated capital cost | | 6 - 55 | (1) | 82,700 | | 102,100 | |
Non-capital losses (expire through 2027) | | 100 | | 300 | | 4,800 | |
Financing costs | | 20 straight line | | 2,200 | | 2,000 | |
| | | | 488,900 | | 410,900 | |
(1) Approximately $78 million of undepreciated capital cost pools are class 41, which is claimed at a 25% rate.
As a result of the issuance of the common shares issued on a “flow-through” basis (“Flow-Through Shares”) on August 12, 2010, Bellatrix is committed to incur approximately $20.0 million in qualifying Canadian Exploration Expenses (“CEE”) on or prior to December 31, 2011. As of March 31, 2011, Bellatrix has satisfied approximately $2.5 million of this commitment, reducing its remaining commitment to $17.5 million.
CASH FLOW FROM OPERATING ACTIVITIES, FUNDS FLOW FROM OPERATIONS AND NET PROFIT (LOSS)
As detailed previously in this Management’s Discussion and Analysis, funds flow from operations is a term that does not have any standardized meaning under GAAP. Funds flow from operations is calculated as cash flow from operating activities before decommissioning costs incurred and changes in non-cash working capital incurred.
Reconciliation of Cash Flow from Operating Activities and Funds Flow from Operations
| | Three months ended March 31, | |
($000s) | | 2011 | | 2010 | |
Cash flow from operating activities | | 15,718 | | 13,456 | |
Decommissioning costs incurred | | 149 | | 162 | |
Change in non-cash working capital | | 1,160 | | (3,420 | ) |
Funds flow from operations | | 17,027 | | 10,198 | |
Bellatrix’s cash flow from operating activities of $15.7 million ($0.15 per diluted share) for the three months ended March 31, 2011 increased approximately 17% from the $13.5 million ($0.15 per diluted share) generated in the same 2010 period. Bellatrix generated funds flow from operations of $17.0 million ($0.16 per diluted share) for the three months ended March 31, 2011, up 67% from $10.2 million ($0.11 per diluted share) for the same period in 2010. The increase in cash flow from operating activities and funds flow from operations for the first quarter of 2011 compared to the first quarter of 2010 was primarily the result of higher sales volumes in conjunction with higher prices received for light crude oil, condensate and natural gas liquids, as well as a reduction in finance and interest charges for the Company’s long term debt and convertible debentures. The increase was offset by a realized loss of $1.0 million for commodity risk management contracts in the first quarter of 2011 when compared to a realized gain of $2.5 million in the same period in 2010 and higher operating expenses.
Bellatrix maintains a commodity price risk management program to provide a measure of stability to funds flow from operations. Unrealized mark-to-market gains or losses are non-cash adjustments to the current fair market value of the contract over its entire term and are included in the calculation of net income.
19
The net loss for the three month period ended March 31, 2011 was $5.5 million ($0.06 per diluted share) compared to a net profit of $4.0 million ($0.04 per diluted share) for the same period in 2010. The net loss recorded in the first quarter of 2011 compared to net profit in the first quarter of 2010 is primarily a consequence of a $16.5 million non-cash difference between a $7.3 million unrealized gain on commodity risk management contracts in Q1 2010 compared to a $9.2 million unrealized loss on commodity risk management contracts recorded in Q1 2011, higher operating expenses, offset by an increase in sales and a reduction in royalties.
Cash Flow from Operating Activities, Funds Flow from Operations and Net Profit (Loss)
| | Three months ended March 31, | |
($000s, except per share amounts) | | 2011 | | 2010 | |
Cash flow from operating activities | | 15,718 | | 13,456 | |
Basic ($/share) | | 0.16 | | 0.15 | |
Diluted ($/share) | | 0.15 | | 0.15 | |
Funds flow from operations | | 17,027 | | 10,198 | |
Basic ($/share) | | 0.17 | | 0.12 | |
Diluted ($/share) | | 0.16 | | 0.11 | |
Net profit (loss) | | (5,487 | ) | 3,969 | |
Basic ($/share) | | (0.06 | ) | 0.04 | |
Diluted ($/share) | | (0.06 | ) | 0.04 | |
CAPITAL EXPENDITURES
Bellatrix invested $55.5 million on exploration and development activities during the first quarter of 2011 compared to $21.0 million in the same 2010 period. The increase in these expenditures during the period is consistent with the higher capital budget for 2011.
Capital Expenditures
| | Three months ended March 31, | |
($000s) | | 2011 | | 2010 | |
Lease acquisitions and retention | | 9,996 | | 199 | |
Geological and geophysical | | 293 | | 603 | |
Drilling and completion costs | | 39,468 | | 18,736 | |
Facilities and equipment | | 5,729 | | 1,417 | |
| | 55,486 | | 20,955 | |
Drilling incentive credits | | — | | (2,644 | ) |
Exploration and development (1) | | 55,486 | | 18,311 | |
Corporate (2) | | 59 | | 35 | |
Property acquisitions | | 3,572 | | — | |
Total capital expenditures - cash | | 59,117 | | 18,346 | |
Property dispositions - cash | | 130 | | 47 | |
Total net capital expenditures - cash | | 59,247 | | 18,393 | |
Other - non-cash(3) | | 513 | | 288 | |
Total net capital expenditures | | 59,760 | | 18,681 | |
(1) Excludes capitalized costs related to decommissioning liabilities expenditures incurred during the period.
(2) Corporate costs include office furniture, fixtures and equipment and other costs.
(3) Other includes non-cash adjustments for current period’s decommissioning liabilities and share based compensation.
20
In the first quarter of 2011 Bellatrix drilled and participated in 21 gross (12.07 net) successful wells. Bellatrix completed and tied in 14 (10.33 net) of the 15 gross operated wells drilled in the quarter. The remaining 1 gross (0.33 net) well will be completed following break up. The Company participated in 6 gross (1.41 net) successful non-operated wells which includes one gross (0.06 net) joint venture Cardium well, which is expected to be completed and tied in after break up.
During the first quarter of 2011, Bellatrix entered into an agreement to acquire 20 net sections of Cardium rights.
The $59.2 million capital program, for the three months ended March 31, 2011 was financed with funds flow from operations and bank debt.
Based on the current economic conditions and Bellatrix’s operating forecast for 2011, the Company budgets a capital program of $170 million funded from the Company’s cash flows, proceeds from the May 2011 offering and to the extent necessary, bank indebtedness.
IMPAIRMENT OF ASSETS
The Company calculates an impairment test on a quarterly basis in accordance with IFRS. The impairment test is performed at the asset or cash generating unit (“CGU”) level. IAS 36 - “Impairment of Assets” (“IAS 36”) is a one step process for testing and measuring impairment of assets. Under IAS 36, the asset or CGU’s carrying value is compared to the higher of: value-in-use and fair value less costs to sell. Value in use is defined as the present value of future cash flows expected to be derived from the asset or CGU.
For the three months ended March 31, 2011, Bellatrix performed an impairment test in accordance with IAS 36 resulting in recoverable amounts to be greater than the carrying value of Bellatrix’s assets or CGU. Consequently, no impairment in oil and gas assets was identified as at March 31, 2011.
The impairment test will be based upon fair market values for the Company’s properties, including but not limited to an updated external reserve engineering report which incorporates a full evaluation of reserves on an annual basis or internal reserve updates at quarterly periods, and the latest commodity pricing deck. Estimating reserves is very complex, requiring many judgments based on available geological, geophysical, engineering and economic data. Changes in these judgments could have a material impact on the estimated reserves. These estimates may change, having either a negative or positive effect on net earnings as further information becomes available and as the economic environment changes.
DECOMMISSIONING LIABILITIES
As at March 31, 2011, Bellatrix has recorded decommissioning liabilities of $39.3 million, compared to $38.7 million at December 31, 2010, for future abandonment and reclamation of the Company’s properties. For the three months ended March 31, 2011, the liability increased by $0.5 million as a result of $0.6 million incurred on property acquisitions and development activities, $0.3 million as a result of charges for the unwinding of the discount rates used for fair valuing the liabilities, offset by a reduction of $0.03 million for liabilities reversed on dispositions, $0.1 million for liabilities settled during the year and $0.2 million for changes in estimates.
Unwinding of Decommissioning Liabilities
| | Three months ended March 31, | |
($000s, except where noted) | | 2011 | | 2010 | |
Unwinding of decommissioning liabilities | | 279 | | 281 | |
Per unit ($/boe) | | 0.31 | | 0.43 | |
21
LIQUIDITY AND CAPITAL RESOURCES
As an oil and gas business, Bellatrix has a declining asset base and therefore relies on ongoing development and acquisitions to replace production and add additional reserves. Future oil and natural gas production and reserves are highly dependent on the success of exploiting the Company’s existing asset base and in acquiring additional reserves. To the extent Bellatrix is successful or unsuccessful in these activities, cash flow could be increased or reduced.
Bellatrix is focused on growing oil and natural gas production from its diversified portfolio of existing and emerging resource plays in Western Canada. Bellatrix remains highly focused on key business objectives of maintaining financial strength, optimizing capital investments attained through a disciplined approach to capital spending, a flexible investment program and financial stewardship. Natural gas prices are primarily driven by North American supply and demand, with weather being the key factor in the short term. Bellatrix believes that natural gas represents an abundant, secure, long-term supply of energy to meet North American needs. Bellatrix’s results are affected by external market and risk factors, such as fluctuations in the prices of crude oil and natural gas, movements in foreign currency exchange rates and inflationary pressures on service costs.
Liquidity risk is the risk that Bellatrix will not be able to meet its financial obligations as they fall due. Bellatrix actively manages its liquidity through daily and longer-term cash, debt and equity management strategies. Such strategies encompass, among other factors: having adequate sources of financing available through its bank credit facilities, estimating future cash generated from operations based on reasonable production and pricing assumptions, analysis of economic risk management opportunities, and maintaining sufficient cash flows for compliance with operating debt covenants. Bellatrix is fully compliant with all of its operating debt covenants.
Bellatrix generally relies on operating cash flows and its credit facilities to fund capital requirements and provide liquidity. Future liquidity depends primarily on cash flow generated from operations, existing credit facilities and the ability to access debt and equity markets. From time to time, the Company accesses capital markets to meet its additional financing needs and to maintain flexibility in funding its capital programs. While Bellatrix recently completed a May 2011, $55 million offering on a bought deal basis (the “financing”), there can be no assurance that future debt or equity financing, or cash generated by operations will be available or sufficient to meet these requirements or for other corporate purposes or, if debt or equity financing is available, that it will be on terms acceptable to Bellatrix.
Credit risk is the risk of financial loss to Bellatrix if a customer or counterparty to a financial instrument fails to meet its contractual obligations, and arises principally from Bellatrix’s trade receivables from joint venture partners, petroleum and natural gas marketers, and financial derivative counterparties.
A substantial portion of Bellatrix’s accounts receivable are with customers and joint interest partners in the petroleum and natural gas industry and are subject to normal industry credit risks. Bellatrix sells substantially all of its production to six primary purchasers under standard industry sale and payment terms. Purchasers of Bellatrix’s natural gas, crude oil and natural gas liquids are subject to a periodic internal credit review to minimize the risk of non-payment. Bellatrix has continued to closely monitor and reassess the creditworthiness of its counterparties, including financial institutions. This has resulted in Bellatrix reducing or mitigating its exposures to certain counterparties where it is deemed warranted and permitted under contractual terms.
Bellatrix may be exposed to third party credit risk through its contractual arrangements with its current or future joint venture partners, marketers of its petroleum and natural gas production and other parties. In the event such entities fail to meet their contractual obligations to Bellatrix, such failures may have a material adverse effect on the Company’s business, financial condition, results of operations and prospects. In addition, poor credit conditions in the industry and of joint venture partners may impact a joint venture partner’s willingness to participate in Bellatrix’s ongoing capital program, potentially delaying the program and the results of such program until Bellatrix finds a suitable alternative partner.
22
During 2010, Bellatrix concentrated on executing its considerable drilling program and improving its balance sheet. Bellatrix took advantage of several financial opportunities that improved the Company’s financial flexibility. In 2011, Bellatrix continues to focus on its drilling program and maintaining a strong balance sheet. In May 2011, Bellatrix closed an equity issuance of 9.8 million common shares on a bought deal basis at a price of $5.60 per share for gross proceeds of $55.0 million (net proceeds of $52.3 million after underwriter fees and before other closing costs). In connection with this financing, Bellatrix has granted to the underwriters an over-allotment option exercisable in whole or in part from time to time until 30 days following closing of the financing to purchase up to an additional 1.5 million common shares at a price of $5.60 per common share for gross proceeds of $8.2 million (net proceeds of $7.8 million after underwriting fees). The net proceeds from this financing will be used to temporarily reduce outstanding indebtedness, thereby freeing up borrowing capacity that may be redrawn to fund Bellatrix’s ongoing capital expenditures program and general corporate purposes.
Total net debt levels at March 31, 2011 have increased $42.3 million from $87.4 million at December 31, 2010, primarily as a consequence of Bellatrix’s considerable drilling program. Total net debt includes the liability component of the convertible debentures and excludes unrealized commodity contract assets and liabilities, deferred taxes, finance lease obligations, deferred liabilities and decommissioning liabilities.
Funds flow from operations represents 29% of the funding requirements for Bellatrix’s capital expenditures for the three months ended March 31, 2011. The remainder has been funded through bank indebtedness.
The Company’s facilities consists of a $15 million demand operating facility provided by a Canadian bank and an $85 million extendible revolving term credit facility provided by a Canadian bank and a Canadian financial institution. Amounts borrowed under the credit facility will bear interest at a floating rate based on the applicable Canadian prime rate, U.S. base rate or LIBOR rate, plus between 1.25% and 4.25%, depending on the type of borrowing and the Company’s debt to cash ratio. The credit facilities are secured by a $400 million debenture containing a first ranking charge and security interest. Bellatrix has provided a negative pledge and undertaking to provide fixed charges over major petroleum and natural gas reserves in certain circumstances. A standby fee is charged of between 0.55% and 1.02% on the undrawn portion of the credit facilities, depending on the Company’s debt to cash flow ratio.
On June 8, 2010, Bellatrix executed an amending agreement with its banking syndicate that provided for the extension of the revolving period of existing credit facility from June 29, 2010 to June 28, 2011. Should the facility not be extended it will convert to a non-revolving term facility with the full amount outstanding due 366 days after the last day of the revolving period of June 28, 2011. The Company’s borrowing base will be subject to re-determination on May 30, 2011. Thereafter, a semi-annual re-determination of the borrowing base will occur, with the next such re-determination occurring on November 30, 2011. As of May 10, 2011, the banking syndicate has agreed, subject to and effective upon final documentation, to increase the borrowing base from $100 million to $140 million through to November 30, 2011 and extend the revolving period of the credit facility from June 28, 2011 to June 26, 2012.
As at March 31, 2011, approximately $29.7 million was undrawn under the existing credit facilities.
As an added layer of protection of its cash flows, during the first quarter of 2011, Bellatrix financially sold 18.2 MMcf/d of natural gas for the period of April 1 to October 31, 2011 at an average fixed price of CAD$4.15/mcf. Additionally, Bellatrix sold a call on 833 bbl/d of crude oil for calendar 2012 at a price of US$110/bbl and used the proceeds to enter into a financial fixed price swap on 4.55 MMcf/d of natural gas for the term of May 1 to December 31, 2011 at a price of CAD$6.92/mcf. Bellatrix also entered into fixed price swaps for 500 bbl/d of crude oil for the term of February 1 to December 31, 2011 at a price of US$95.00/bbl and 500 bbl/d of crude oil for the term of March 1 to December 31, 2011 at a fixed price of US$97.50/bbl. Contracts entered into in 2010 provide for 1,500 bbl/d of crude oil at an average price of CAD$88.45/bbl and 500 bbl/d of crude oil at fixed price of US$89.10/bbl for the remainder of 2011.
23
Bellatrix currently has commitments associated with its credit facilities outlined above and the commitments outlined under the “Commitments” section. Bellatrix continually monitors its capital spending program in light of the recent volatility with respect to commodity prices and Canadian dollar exchange rates with the aim of ensuring the Company will be able to meet future anticipated obligations incurred from normal ongoing operations with funds flow from operations and draws on Bellatrix’s credit facility, as necessary. Bellatrix has the ability to fund its 2011 capital program of $170 million by utilizing cash flow, the proceeds of the May 2011 financing, and to the extent necessary, bank indebtedness.
As at April 29, 2011, Bellatrix had outstanding a total of 5,818,099 options exercisable at an average exercise price of $2.73 per share, $55.0 million principal amount of 4.75% Debentures convertible into common shares (at a conversion price of $5.60 per share) and 97,533,134 common shares.
COMMITMENTS
As at March 31, 2011, Bellatrix committed to drill 8 gross (6.4 net) wells pursuant to farm-in agreements. Bellatrix expects to satisfy these drilling commitments at an estimated cost of approximately $20.9 million. In addition, on February 1, 2011, Bellatrix entered into a joint venture agreement which includes a minimum commitment for the Company to drill 3 gross (3.0 net) wells per year for 2011 to 2015 for a total estimated cost of approximately $52.5 million.
As a result of the issuance of the Flow-Through Shares on August 12, 2010, Bellatrix is committed to incur approximately $20.0 million in CEE on or before December 31, 2011. As of March 31, 2011, the Company has incurred approximately $2.5 million on CEE, reducing its remaining commitment to $17.5 million.
The following are the contractual maturities of financial liabilities as at March 31, 2011:
Financial Liability ($000s) | | < 1 Year | | 1-2 Years | | 2-5 Years | | Thereafter | |
Accounts payable and accrued liabilities (1) | | $ | 53,562 | | $ | — | | $ | — | | $ | — | |
Bank debt - principal (2) | | — | | 70,298 | | — | | — | |
Convertible debentures - principal | | — | | — | | 55,000 | | — | |
Convertible debentures - interest (3) | | 2,620 | | 2,612 | | 5,440 | | — | |
Finance lease obligation | | 365 | | 359 | | 973 | | 1,447 | |
Total | | $ | 56,557 | | $ | 73,269 | | $ | 61,413 | | $ | 1,447 | |
(1) As at March 31, 2011, $1.1 million of accrued coupon interest payable in relation to the 4.75% Debentures and $0.01 million of accrued interest payable in relation to the credit facilities is included in Accounts Payable and Accrued Liabilities.
(2) Bank debt is based on a revolving term which is reviewed annually and converts to a 366 day non-revolving facility if not renewed.
(3) The 4.75% Debentures outstanding at March 31, 2011 bear interest at a coupon rate of 4.75%, which currently requires total annual interest payments of $2.6 million.
Interest due on the bank credit facility is calculated based upon floating rates.
The Company estimates the total undiscounted amount of cash flows required to settle its decommissioning liabilities to be approximately $41.6 million which is estimated to be incurred between 2013 and 2053.
Off-Balance Sheet Arrangements
The Company has certain fixed term lease agreements, including primarily office space leases, which were entered into in the normal course of operations. All leases have been treated as operating leases whereby the lease payments are included in operating expenses or G&A expenses depending on the nature of the lease. The lease agreements do not currently provide for early termination. No asset or liability value has been assigned to these leases in the balance sheet as of March 31, 2011.
24
BUSINESS PROSPECTS AND 2011 YEAR OUTLOOK
Bellatrix continues to develop its core assets and conducts exploration programs utilizing its large inventory of geological prospects. As at March 31, 2011, Bellatrix has approximately 220,290 net undeveloped acres with in excess of 700 exploitation drilling opportunities identified, representing over 10 years of drilling inventory.
In May 2011, Bellatrix closed an equity issuance of 9.8 million common shares on a bought deal basis at a price of $5.60 per share for gross proceeds of $55.0 million (net proceeds of $52.3 million after underwriter fees and before other closing costs). In connection with this financing, Bellatrix has granted to the underwriters an over-allotment option exercisable in whole or in part from time to time until 30 days following closing of the financing to purchase up to an additional 1.5 million common shares at a price of $5.60 per common share for gross proceeds of $8.2 million (net proceeds of $7.8 million after underwriting fees). The net proceeds from this financing will be used to temporarily reduce outstanding indebtedness, thereby freeing up borrowing capacity that may be redrawn to fund Bellatrix’s ongoing capital expenditure program and for general purposes. Bellatrix has revised its capital expenditure budget for 2011 from $100 million to $170 million, which includes the $59.1 million spent in the first quarter of 2011 on capital expenditures. Bellatrix will use cash flow, the proceeds of the financing, and to the extent necessary, bank indebtedness to fund its 2011 capital expenditures budget.
In 2011, Bellatrix anticipates drilling 63 gross (47.57 net) wells. Of the 63 gross wells, Bellatrix anticipates drilling 9 gross (9.0 net) potential McLaren heavy oil wells in the Frog Lake area of Alberta and a total of 54 gross (38.57 net) Cardium and Notikewin wells in the Pembina and Ferrier areas of Alberta.
The estimated field production level for the month of April 2011 is approximately 12,134 boe/d, weighted 39% crude oil, condensate and natural gas liquids and 61% natural gas.
As an added layer of protection of its cash flows, during the first quarter of 2011, Bellatrix financially sold 18.2 MMcf/d of natural gas for the period of April 1 to October 31, 2011 at an average fixed price of CAD$4.15/mcf. Additionally, Bellatrix sold a call on 833 bbl/d of crude oil for calendar 2012 at a price of US$110/bbl and used the proceeds to enter into a financial fixed price swap on 4.55 MMcf/d of natural gas for the term of May 1 to December 31, 2011 at a price of CAD$6.92/mcf. Bellatrix also entered into fixed price swaps for 500 bbl/d of crude oil for the term of February 1 to December 31, 2011 at a price of US$95.00/bbl and 500 bbl/d of crude oil for the term of March 1 to December 31, 2011 at a fixed price of US$97.50/bbl. Contracts entered into in 2010 provide for 1,500 bbl/d of crude oil at an average price of CAD$88.45/bbl and 500 bbl/d of crude oil at fixed price of US$89.10/bbl for the remainder of 2011.
FINANCIAL REPORTING UPDATE
Adoption of International Financial Reporting Standards
As of January 1, 2011, Bellatrix prepares its interim consolidated financial statements and comparative information in accordance with IFRS, “IFRS 1” and International Accounting Standard 34 - Interim Financial Reporting, as issued by the International Accounting Standards Board. Previously, Bellatrix’s financial statements were prepared in accordance with previous GAAP.
The Company’s IFRS accounting policies are provided in Note 3 to the Interim Consolidated Financial Statements. In addition, Note 22 to the Interim Consolidated Financial Statements presents reconciliations between the Company’s 2010 previous GAAP results and the 2010 IFRS results. The Company presents reconciliations of equity as at January 1, 2010, March 31, 2010 and December 31, 2010, and reconciliations of Total Comprehensive Income for the three months ended March 31, 2010 and for the year ended December 31, 2010.
25
Accounting Policy Changes
The following discussion explains the significant differences between Bellatrix’s previous GAAP accounting policies and those applied by the Company under IFRS and specifically, IFRS 1. IFRS policies have been retrospectively and consistently applied except where specific IFRS 1 optional and mandatory exemptions permitted an alternative treatment upon transition to IFRS for first-time adopters.
The most significant changes to the Company’s accounting policies relate to the accounting for petroleum and natural gas expenditures. Under previous GAAP, Bellatrix followed the Canadian Institute of Chartered Accountants (“CICA”) guideline on full cost accounting in which all costs directly associated with the acquisition of, the exploration for, and the development of crude oil, natural gas liquids and natural gas reserves were capitalized on a cost centre basis. Under previous GAAP, Bellatrix only had one cost centre. Costs accumulated within the cost centre were depleted using the unit-of-production method based on proved reserves determined using estimated future prices and costs. Upon transition to IFRS, Bellatrix was required to adopt new accounting policies for petroleum and natural gas expenditures, including exploration and evaluation (“E&E”) costs and development costs.
Under IFRS, exploration and evaluation costs are those expenditures for an area where technical feasibility and commercial viability has not yet been determined. Development costs include those expenditures for areas where technical feasibility and commercial viability has been determined. Bellatrix adopted the IFRS 1 exemption whereby the Company deemed its January 1, 2010 property, plant and equipment (“PP&E) costs to be equal to its previous GAAP historical PP&E net book value. Accordingly, exploration and evaluation costs were deemed equal to the unproved properties balance and the development costs were deemed equal to the remaining PP&E balance. Under IFRS, exploration and evaluation costs are presented as exploration and evaluation assets and development costs of reserves are presented within property, plant and equipment on the Consolidated Balance Sheet.
Exploration and Evaluation
E&E assets as at January 1, 2010 of $20.5 million represent the unproved properties balance under previous GAAP. This resulted in a reclassification of $20.5 million from PP&E to E&E assets on Bellatrix’s Consolidated Balance Sheet as at January 1, 2010. As at December 31, 2010, Bellatrix’s E&E assets were $18.5 million.
Under previous GAAP, Bellatrix would capitalize all expenditures associated with unproved properties. Under IFRS, E&E expenditures can only be capitalized once the legal right to explore has been obtained. Once technical feasibility and commercial viability has been determined, the capitalized costs are transferred from E&E assets to PP&E and are subject to an impairment test.
Bellatrix has adopted an accounting policy whereby E&E assets will not be subject to depletion. Costs associated with unproved properties under previous GAAP were not subject to depletion.
Depletion and Depreciation
Previous GAAP provided specific guidelines on the depletion calculation for oil and natural gas properties. Depletion was calculated based on proved reserves. Under IFRS, the Company has a choice in the reserve base to use for its depletion calculations. Bellatrix has adopted a policy of depleting its oil and natural gas properties using its proved plus probable reserve base. In addition, depletion calculations under previous GAAP were done on a cost centre basis, for which under previous GAAP, the Company only had one. Under IFRS, the Company is required to calculate depletion based on individual components for which the company has identified to be at the area level. The IFRS 1 exemption permitted Bellatrix to allocate PP&E costs to the area level using proved plus probable reserve values as at January 1, 2010.
As a result of using proved plus probable reserves and depleting at the area level for its depletion calculation, depreciation and depletion expense was reduced by $24.8 million for the year ended December 31, 2010.
26
Impairments
IFRS requires an asset impairment test to be conducted on transition date and when indicators of impairment are present. Under previous GAAP, impairment of long-lived assets is assessed on the basis of an asset’s estimated undiscounted future cash flows compared with the asset’s carrying amount and if impairment is indicated, discounted cash flows are prepared to quantify the amount of impairment. The impairment test under previous GAAP is done at the cost centre level. Under previous GAAP, Bellatrix had one cost centre for impairment test purposes. Impairments recognized under previous GAAP were not reserved.
IFRS requires the impairment test to occur at the asset level or at the cash generating unit (“CGU”) level. Bellatrix currently has 6 CGUs. The carrying amount of the asset or CGU is compared to its recoverable amount which is the higher of discounted cash flows or fair value less costs to sell. Under IFRS, impairments recognized are reversed when there has been a subsequent increase in the recoverable amount. In the case of an impairment reversal, the carrying amount of the asset or CGU is limited to the original carrying amount less depreciation, depletion and amortization as if no impairment had been recognized for the asset or CGU for prior periods.
Bellatrix performed an impairment test on transition to IFRS on January 1, 2010 based on fair value less costs to sell. Fair value less costs to sell was based on merger and acquisition transactions on oil and gas properties similar to those owned by Bellatrix. The Company experienced transitional write-downs on its non-core and certain heavy oil properties with an offsetting entry to Bellatrix’s January 1, 2010 deficit. Based on the assessment, the carrying amount of the following CGU’s were impaired, with an offsetting entry to the January 1, 2010 deficit:
($000s) | | | | | |
Cash Generating Unit | | Product (1) | | Transitional Impairment (2) | |
South East Alberta | | 100% Natural Gas | | $ | 5,366 | |
North East Alberta | | 89% Natural Gas | | 10,895 | |
Meekwap | | 75% Oil and NGL’s | | 4,093 | |
Saskatchewan | | 100% Heavy Oil | | 23,441 | |
Total | | | | $ | 43,795 | |
(1) Based on 2009 year end proved and probable reserves.
(2) Includes impairment related to corporate assets assigned to each CGU on a pro-rata basis.
Due to the continued weakening of natural gas prices, Bellatrix performed impairment tests on its oil and gas properties for all of the quarterly reporting periods in 2010. Fair value less costs to sell was used as the recoverable amount, using market transactions and the company’s proved and probable reserves. The following impairments and impairment reversals were recorded in 2010:
($000s) | | | | | |
Cash Generating Unit | | Product (1) | | Impairment (Reversal) (2) | |
Meekwap | | 75% Oil and NGL’s | | $ | 336 | |
Meekwap | | 70% Oil and NGL’s | | 1,286 | |
South East Alberta | | 100% Natural Gas | | 4,988 | |
North East Alberta | | 81% Natural Gas | | (9,848 | ) |
Total reversal | | | | $ | (3,238 | ) |
(1) Based on applicable year end proved and probable reserves.
(2) Includes impairment (reversal) related to corporate assets assigned to each CGU on a pro-rata basis.
Natural gas properties were further impaired in 2010, as well as another non-core oil property. Bellatrix experienced an impairment reversal in the fourth quarter of 2010 in its North East Alberta CGU as recent transactions in the CGU have increased the fair value of the properties written down on transition.
27
Asset Divestitures
Under previous GAAP, proceeds of a divestiture are deducted from the country cost centre pool without recognition of a gain or loss unless such a deduction resulted in a change to the depletion rate of 20% or greater. Under IFRS, proceeds of a divestiture are deducted from the carrying value of the asset and a gain or loss is recognized in earnings.
As a result of divestitures during 2010, including property swaps and prior period adjustments relating to divested properties, Bellatrix recognized a net gain on dispositions of $1.4 million for the year ended December 31, 2010.
Decommissioning Liabilities
IAS 37 - “Provisions, Contingent Liabilities and Contingent Assets,” will govern how the Company accounts for its decommissioning liabilities (previously referred to as asset retirement obligations). The discount rate used for the decommissioning liability will be a risk free rate as the estimated provision is adjusted to reflect risks specific to the liability. Under previous GAAP, the Company used a credit-adjusted risk free rate. Therefore, under IFRS, the decommissioning liabilities are higher due to lower discount rates used. IFRS 1 provides an exemption that the Company has elected which allows Bellatrix to measure decommissioning liabilities as at the date of transition of January 1, 2010 to IFRS in accordance with IAS 37 and recognize directly in the Company’s deficit any difference between that amount and the carrying amount of those liabilities at the date of transition to IFRS determined under previous GAAP.
As a result of applying this exemption, an increase of $13.3 million has been made to decommissioning liabilities and Bellatrix’s deficit on January 1, 2010.
Under IFRS, the liability is to be re-measured each reporting period in order to reflect interest rates in effect at that time. As a result of re-measuring the decommissioning liabilities each reporting period, on a cumulative basis in 2010, PP&E and decommissioning liabilities decreased $0.2 million for the year ended December 31, 2010. The decrease in discount rates used under IFRS versus previous GAAP caused a decrease of $1.1 million in accretion expense for the year ended December 31, 2010.
Share Based Payments
Differences in the accounting for the Company’s share option plan under previous GAAP and IFRS exist. IFRS 2 - “Share-based Payments,” requires the Company to estimate the number of options expected to vest when a grant of equity instruments do not vest immediately. IFRS 2 does not allow the recognition of the expense on a straight-line basis and requires each installment to be treated as a separate arrangement. Under previous GAAP, the Company accounted for forfeitures as they occurred and recognized share-based compensation expense using the graded method, which is the method required under IFRS. IFRS 1 provides an elective exemption, which the Company has elected, which allows Bellatrix to apply IFRS 2 to the unvested options outstanding on transition date.
An adjustment of $0.05 million has been made on transition date to contributed surplus, with an offsetting entry to the January 1, 2010 deficit, as a result of applying this exemption.
As a result of applying IFRS 2, a reduction of share-based compensation of $0.03 million has been made to the Statement of Comprehensive Income for the year ended December 31, 2010.
Due to differences in the accounting for share-based compensation under previous GAAP and IFRS, adjustments are required in the amount of capitalized share-based compensation. For the year ended December 31, 2010, the Company capitalized $0.03 million less for share-based compensation under IFRS when compared to previous GAAP.
28
Flow-through Shares
Under previous GAAP, the accounting treatment of flow-through shares was addressed by EIC 146 “Flow-Through Shares”. Under previous GAAP, the proceeds received for the flow-through shares are credited to shareholders’ capital and the deferred tax liability is recognized when the Company files the renouncement documents with the tax authorities to renounce the tax credits associated with the expenditures.
Under IFRS, Bellatrix set up a liability for the difference between the proceeds received and the market price of the shares on the date of the transaction (the “premium”). As the expenditures are made, Bellatrix will record the related tax liability associated with the renouncement of the tax benefits and remove the deferred liability originally set up. The difference between the deferred tax liability and the original liability set up will go through profit or loss.
As a result of the issuance of the Flow-Through Shares in the third quarter of 2010, the Company set up a deferred liability of $3.7 million with an offsetting adjustment to share capital. No qualifying CEE was made in 2010.
Convertible Debentures
Convertible debentures have both a debt and equity component under IFRS and previous GAAP. As a consequence of the Company having status as an income trust in 2009, and no IFRS 1 exemption related to the conversion feature of convertible debentures for trust units, the Company has treated the 7.5% Debentures as a financial derivative instrument (the “instrument”). As a result, the fair value of the instrument was determined to be nil. The offsetting entry was made to share capital as a result of the Company’s deficit elimination effective November 1, 2009. In addition, this IFRS difference has caused a $1.6 million increase to the Company’s deficit as a result of the 7.5% Debenture redemption in the second quarter of 2010, as opposed to the $2.9 million reduction in the deficit under previous GAAP.
Also, the allocation of deferred tax on the convertible debentures differs under previous GAAP and IFRS. Under previous GAAP, the tax basis of the liability is considered to be the same as its carrying amount; therefore, no temporary difference exists. IFRS does not contain this special exemption and requires the temporary difference to be recognized. The deferred tax adjustment is charged directly to the carrying amount of the equity component of the convertible debentures.
Bellatrix recorded a deferred tax adjustment of $0.5 million related to its 7.5% Debentures on transition to IFRS with an offsetting entry to the January 1, 2010 deficit.
Upon the issuance of its 4.75% Debentures in the second quarter of 2010, the Company recognized an adjustment of $1.5 million to the equity component of its 4.75% Debentures with an offsetting entry to the deferred tax asset.
Deferred Taxes
Deferred income taxes have been adjusted to reflect the tax effect arising from the differences between IFRS and previous GAAP. Upon transition to IFRS, the Company recognized a $14.2 million increase in the deferred income tax balance with a corresponding increase to the January 1, 2010 deficit. For the year ended December 31, 2010, the application of the IFRS adjustments discussed above resulted in a $8.7 million decrease to Bellatrix’s deferred income tax asset and an expense of $8.0 million to Bellatrix’s previous GAAP net loss.
Business Combinations
An exemption under IFRS 1 provides the entity with relief on the restatement of business combinations prior to the transition date. Under IFRS 3 - “Business Combinations,” the determination of the fair value of share consideration differs from the determination under current Canadian accounting standards. Any difference in the fair value calculation would have a resulting impact on the carrying amount of net assets acquired, non-controlling interest and any goodwill. The Company made this election under IFRS 1, allowing Bellatrix to be exempt from restating business combinations that occurred prior to the transition date to IFRS.
29
Future Accounting Pronouncements
All accounting standards effective for periods beginning on or after January 1, 2011 have been adopted as part of the transition to IFRS. The following new IFRS pronouncement has been issued but is not yet effective:
As of January 1, 2013, Bellatrix will be required to adopt IFRS 9, Financial Instruments, which is the result of the first phase of the IASB’s project to replace IAS 39, Financial Instruments: Recognition and Measurement. The new standard replaces the current multiple classification and measurement models for financial assets and liabilities with a single model that has only two classification categories: amortized cost and fair value. The adoption of this standard should not have a material impact on Bellatrix’s Consolidated Financial Statements.
BUSINESS RISKS AND UNCERTAINTIES
The reader is advised that Bellatrix continues to be subject to various types of business risks and uncertainties as described in the Company’s Management, Discussion and Analysis for the year ended December 31, 2010 and the Company’s Annual Information Form for the year ended December 31, 2010.
CRITICAL ACCOUNTING ESTIMATES
The reader is advised that the critical accounting estimates, policies, and practices as described herein continue to be critical in determining Bellatrix’s financial results.
The reader is cautioned that the preparation of financial statements in accordance with GAAP requires management to make certain judgments and estimates that affect the reported amounts of assets, liabilities, revenues and expenses. The following discussion outlines accounting policies and practices that are critical to determining Bellatrix’s financial results.
Accounts Receivable
Accounts receivable are recorded at the estimated recoverable amount which involves the estimate of uncollectable accounts.
Derivatives
The fair value of commodity contracts are based on published market prices as at the balance sheet date and may differ from what will eventually be realized. Changes in the fair value of the commodity contracts are recognized in profit or loss. The actual gains and losses realized on eventual cash settlement can vary due to subsequent fluctuations in commodity prices.
Oil and Gas Reserves
Reserves and resources are used in the units of production calculation for depreciation, depletion and amortization and the impairment analysis which affect net income. There are numerous uncertainties inherent in estimating oil and gas reserves. Estimating reserves is very complex, requiring many judgments based on geological, geophysical, engineering and economic data. Changes in these judgments could have a material impact on the estimated reserves. These estimates may change, having either a negative or positive effect on net earnings as further information becomes available and as the economic environment changes.
30
Depreciation and Depletion
Depletion of petroleum and natural gas properties is provided using the unit-of-production method based on production volumes before royalties in relation to total estimated proved and probable reserves as determined annually by independent engineers and determined in accordance with National Instrument 51-101. Natural gas reserves and production are converted at the energy equivalent of six thousand cubic feet to one barrel of oil.
Calculations for depletion and depreciation of production equipment are based on total capitalized costs plus estimated future development costs of proved and probable undeveloped reserves less the estimated net realizable value of production equipment and facilities after the proved reserves are fully produced. The costs of acquiring and evaluating unproved properties are excluded from depletion calculations.
Recoverability of Asset Carrying Values
The Company assesses its oil and gas properties, including exploration and evaluation assets, for possible impairment if there are events or changes in circumstances that indicate that carrying values of the assets may not be recoverable, or at least at every reporting date.
The assessment of any impairment of property, plant and equipment is dependent upon estimates of recoverable amount that take into account factors such as reserves, economic and market conditions, timing of cash flows, the useful lives of assets and their related salvage values.
Liability Component of Convertible Debentures
The Company’s liability component of its convertible debentures has been determined by estimating a market rate of interest by reference to similar liabilities that do not have a conversion option.
Decommissioning Obligations
Provisions for decommissioning obligations associated with the Company’s drilling operations are based on current legal and constructive requirements, technology, price levels and expected plans for remediation. Actual costs and cash outflows can differ from estimates because of changes in laws and regulations, public expectations, prices, discover and analysis of site conditions and changes in clean up technology.
Share-based Compensation
The fair value of stock options granted is measured using a Black Scholes model. Measurement inputs include share price on measurement date, exercise price of the option, expected volatility, expected life of the options, expected dividends and the risk-free rate. The Company estimates volatility based on historical share price excluding specific time frames in which volatility was affected by specific transactions that are not considered to be indicative of the Company’s expected share price volatility. The expected life of the options is based on historical experience and general option holder behaviour. Dividends were not taken into consideration as the Company does not expect to pay dividends. Management also makes an estimate of the number of options that will forfeit and the rate is adjusted to reflect the actual number of options that actually vest.
Income Taxes
Related assets and liabilities are recognized for the estimated tax consequences between amounts included in the financial statements and their tax base using substantively enacted future income tax rates. Timing of future revenue streams and future capital spending changes can affect the timing of any temporary differences, and accordingly affect the amount of the deferred income tax asset or liability calculated at a point in time. These differences could materially impact earnings.
31
Legal, Environmental Remediation and Other Contingent Matters
The Company is involved in various claims and litigation arising in the normal course of business. While the outcome of these matters is uncertain and there can be no assurance that such matters will be resolved in the Company’s favor, the Company does not currently believe that the outcome of adverse decisions in any pending or threatened proceeding related to these and other matters or any amount which it may be required to pay by reason thereof would have a material adverse impact on its financial position or results of operations.
The Company reviews legal, environmental remediation and other contingent matters to both determine whether a loss is probable based on judgment and interpretation of laws and regulations and determine that the loss can reasonably be estimated. When the loss is determined, it is charged to earnings. The Company’s management monitor known and potential contingent matters and make appropriate provisions by charges to earnings when warranted by the circumstances.
CONTROLS AND PROCEDURES
Disclosure Controls and Procedures
The Company’s Chief Executive Officer and Chief Financial Officer have designed, or caused to be designed under their supervision, disclosure controls and procedures to provide reasonable assurance that: (i) material information relating to the Company is made known to the Company’s Chief Executive Officer and Chief Financial Officer by others, particularly during the period in which the annual and interim filings are being prepared; and (ii) information required to be disclosed by the Company in its annual filings, interim filings or other reports filed or submitted by it under securities legislation is recorded, processed, summarized and reported within the time period specified in securities legislation.
Internal Control over Financial Reporting
The Company’s Chief Executive Officer and Chief Financial Officer have designed, or caused to be designed under their supervision, internal control over financial reporting to provide reasonable assurance regarding the reliability of the Company’s financial reporting and the preparation of financial statements for external purposes in accordance with GAAP.
The Company is required to disclose herein any change in the Company’s internal control over financial reporting that occurred during the period beginning on January 1, 2011 and ended on March 31, 2011 that has materially affected, or is reasonably likely to materially affect, the Company’s internal control over financial reporting. No material changes in the Company’s internal control over financial reporting were identified during such period that has materially affected, or are reasonably likely to materially affect, the Company’s internal control over financial reporting.
In conjunction with its conversion to IFRS, the Company completed an assessment of its information systems and based on this review no significant changes to the information systems were required as part of the IFRS conversion process. In addition, the effects of the adoption of IFRS on the Company’s business activities and internal controls, including disclosure controls and procedures, were reviewed and no significant changes to the Corporation’s business activities and internal control environment were required.
It should be noted that a control system, including the Company’s disclosure and internal controls and procedures, no matter how well conceived, can provide only reasonable, but not absolute, assurance that the objectives of the control system will be met and it should not be expected that the disclosure and internal controls and procedures will prevent all errors or fraud.
32
Sensitivity Analysis
The table below shows sensitivities to funds flow from operations as a result of product price and operational changes. This is based on actual average prices received for the first quarter of 2011 and average production volumes of 10,084 boe/d during that period, as well as the same level of debt outstanding at March 31, 2011. Diluted weighted average shares are based upon the first quarter of 2011. These sensitivities are approximations only, and not necessarily valid under other significantly different production levels or product mixes. Commodity price risk management activities can significantly affect these sensitivities. Changes in any of these parameters will affect funds flow as shown in the table below:
| | Funds Flow from Operations (1) | | Funds Flow from Operations (1) | |
| | (annualized) | | Per Diluted Share | |
Sensitivity Analysis | | ($000s) | | ($) | |
Change of US $1/bbl WTI | | 1,100 | | 0.01 | |
Change of $0.10/ mcf | | 1,200 | | 0.01 | |
Change of US $0.01 CDN/ US exchange rate | | 900 | | 0.01 | |
Change in prime of 1% | | 700 | | 0.01 | |
(1) The term “funds flow from operations” should not be considered an alternative to, or more meaningful than cash flow from operating activities as determined in accordance with GAAP as an indicator of the Company’s performance. Therefore reference to diluted funds flow from operations or funds flow from operations per share may not be comparable with the calculation of similar measures for other entities. Management uses funds flow from operations to analyze operating performance and leverage and considers funds flow from operations to be a key measure as it demonstrates the Company’s ability to generate the cash necessary to fund future capital investments and to repay debt. The reconciliation between cash flow from operating activities and funds flow from operations can be found elsewhere herein. Funds flow from operations per share is calculated using the weighted average number of common shares for the period.
33
SELECTED QUARTERLY CONSOLIDATED INFORMATION
The following table sets forth selected consolidated financial information of the Company for the most recently completed quarter ended March 31, 2011 and for the quarters in 2010 and 2009. The adoption date of IFRS of January 1, 2011 requires restatement for comparative purposes, of the Company’s opening balance sheet as at January 1, 2010, all interim quarterly periods in 2010 and for its year ended December 31, 2010. As a result, 2009 comparative information has not been restated and is in accordance with previous GAAP.
2011 - Quarter ended (unaudited)
($000s, except per share amounts) | | March 31 | |
Revenues before royalties and risk management | | 40,535 | |
Cash flow from operating activities | | 15,718 | |
Cash flow from operating activities per share | | | |
Basic | | $ | 0.16 | |
Diluted | | $ | 0.15 | |
Funds flow from operations (1) | | 17,027 | |
Funds flow from operations per share (1) | | | |
Basic | | $ | 0.17 | |
Diluted | | $ | 0.16 | |
Net loss | | (5,487 | ) |
Net loss per share | | | |
Basic and diluted | | $ | 0.06 | |
Net capital expenditures (cash) | | 59,247 | |
2010 - Quarter ended (unaudited)
($000s, except per share amounts) | | March 31 | | June 30 | | Sept. 30 | | Dec. 31 | |
Revenues before royalties and risk management | | 26,929 | | 25,574 | | 27,344 | | 37,826 | |
Cash flow from operating activities | | 13,456 | | 6,065 | | 13,466 | | 11,285 | |
Cash flow from operating activities per share | | | | | | | | | |
Basic | | $ | 0.15 | | $ | 0.07 | | $ | 0.14 | | $ | 0.12 | |
Diluted | | $ | 0.15 | | $ | 0.07 | | $ | 0.14 | | $ | 0.11 | |
Funds flow from operations (1) | | 10,198 | | 10,610 | | 16,342 | | 15,892 | |
Funds flow from operations per share (1) | | | | | | | | | |
Basic | | $ | 0.12 | | $ | 0.11 | | $ | 0.17 | | $ | 0.16 | |
Diluted | | $ | 0.11 | | $ | 0.11 | | $ | 0.17 | | $ | 0.15 | |
Net income (loss) | | 3,969 | | (6,350 | ) | (3,321 | ) | (57 | ) |
Net income (loss) per share | | | | | | | | | |
Basic | | $ | 0.04 | | $ | (0.07 | ) | $ | (0.03 | ) | $ | (0.00 | ) |
Diluted | | $ | 0.04 | | $ | (0.07 | ) | $ | (0.03 | ) | $ | (0.00 | ) |
Net capital expenditures (cash) | | 18,393 | | 17,656 | | 30,416 | | 25,716 | |
34
Previous GAAP 2009 - Quarter ended (unaudited)
($000s, except per share amounts) | | March 31 | | June 30 | | Sept. 30 | | Dec. 31 | |
Revenues before royalties and risk management | | 31,345 | | 29,805 | | 23,860 | | 24,004 | |
Cash flow from operating activities | | 9,311 | | 6,467 | | 12,150 | | 2,743 | |
Cash flow from operating activities per share | | | | | | | | | |
Basic and diluted | | $ | 0.12 | | $ | 0.08 | | $ | 0.15 | | $ | 0.03 | |
Funds flow from operations (1) | | 6,489 | | 10,765 | | 11,090 | | 7,681 | |
Funds flow from operations per share (1) | | | | | | | | | |
Basic and diluted | | $ | 0.08 | | $ | 0.14 | | $ | 0.14 | | $ | 0.10 | |
Net loss | | (9,056 | ) | (99,715 | ) | (9,363 | ) | (8,216 | ) |
Net loss per share | | | | | | | | | |
Basic and diluted | | $ | (0.12 | ) | $ | (1.27 | ) | $ | (0.12 | ) | $ | (0.10 | ) |
Net capital expenditures (cash) | | 2,764 | | (7,138 | ) | (81,986 | ) | 9,926 | |
Distributions declared | | 1,570 | | — | | — | | — | |
Distributions per share | | $ | 0.02 | | — | | — | | — | |
(1) Refer to “Non-GAAP Measures” in respect of the term “funds flow from operations” and “funds flow from operations per share”.
35
CONSOLIDATED BALANCE SHEETS
(unaudited, expressed in Canadian dollars)
| | As at | | As at | | As at | |
| | March 31, | | December 31, | | January 1, | |
($000s) | | 2011 | | 2010 | | 2010 | |
| | | | (note 22) | | (note 22) | |
ASSETS | | | | | | | |
Current assets | | | | | | | |
Accounts receivable | | $ | 36,400 | | $ | 39,500 | | $ | 20,722 | |
Deposits and prepaid expenses | | 5,241 | | 4,619 | | 4,940 | |
Commodity contract asset (note 20) | | 3,734 | | — | | 3,374 | |
| | 45,375 | | 44,119 | | 29,036 | |
Exploration and evaluation assets (note 6) | | 27,776 | | 18,535 | | 20,542 | |
Property, plant and equipment (note 7) | | 436,580 | | 399,580 | | 346,229 | |
Deferred taxes (note 16) | | 15,848 | | 14,820 | | 14,602 | |
Total assets | | $ | 525,579 | | $ | 477,054 | | $ | 410,409 | |
| | | | | | | |
LIABILITIES | | | | | | | |
Current liabilities | | | | | | | |
Accounts payable and accrued liabilities | | $ | 53,562 | | $ | 42,792 | | $ | 23,345 | |
Current portion of finance lease obligation (note 11) | | 147 | | 146 | | — | |
Commodity contract liability (note 20) | | 16,694 | | 3,732 | | — | |
| | 70,403 | | 46,670 | | 23,345 | |
Deferred liability- flow-through shares (note 8) | | 3,288 | | 3,768 | | — | |
Long-term debt (note 9) | | 70,298 | | 41,172 | | 27,902 | |
Convertible debentures (note 10) | | 47,951 | | 47,599 | | 81,684 | |
Finance lease obligation (note 11) | | 1,407 | | 1,443 | | — | |
Decommissioning Liabilities (note 12) | | 39,256 | | 38,710 | | 39,001 | |
Total liabilities | | 232,603 | | 179,362 | | 171,932 | |
| | | | | | | |
SHAREHOLDERS’ EQUITY | | | | | | | |
Shareholders’ capital (note13) | | 316,819 | | 316,779 | | 257,629 | |
Equity component of convertible debentures (note 10) | | 4,378 | | 4,378 | | — | |
Contributed surplus (note 14) | | 31,220 | | 30,489 | | 28,186 | |
Deficit | | (59,441 | ) | (53,954 | ) | (47,338 | ) |
Total shareholders’ equity | | 292,976 | | 297,692 | | 238,477 | |
Total liabilities and shareholders’ equity | | $ | 525,579 | | $ | 477,054 | | $ | 410,409 | |
COMMITMENTS (note 19) and SUBSEQUENT EVENT (note 21)
See accompanying notes to the consolidated financial statements.
36
CONSOLIDATED STATEMENTS OF COMPREHENSIVE INCOME
(unaudited, expressed in Canadian dollars)
For the three months ended March 31, ($000s) | | 2011 | | 2010 | |
| | | | (note 22) | |
REVENUES | | | | | |
Petroleum and natural gas sales | | $ | 40,112 | | $ | 26,382 | |
Other income | | 423 | | 547 | |
Royalties | | (6,471 | ) | (5,250 | ) |
Total revenues | | 34,064 | | 21,679 | |
Gain (loss) on commodity contracts (note 20) | | (10,184 | ) | 9,748 | |
| | 23,880 | | 31,427 | |
EXPENSES | | | | | |
Production | | 11,298 | | 8,717 | |
Transportation | | 1,167 | | 808 | |
General and administrative | | 2,267 | | 2,536 | |
Share-based compensation (notes 13 and 14) | | 495 | | 192 | |
Depletion and depreciation | | 13,759 | | 10,146 | |
Loss (gain) on property dispositions | | (91 | ) | 322 | |
| | 28,895 | | 22,721 | |
| | | | | |
NET PROFIT (LOSS) BEFORE FINANCE AND TAXES | | (5,015 | ) | 8,706 | |
| | | | | |
Finance expenses (note 17) | | 1,980 | | 2,695 | |
| | | | | |
NET PROFIT(LOSS) BEFORE TAXES | | (6,995 | ) | 6,011 | |
| | | | | |
TAXES | | | | | |
Deferred tax expense (recovery) (note 16) | | (1,508 | ) | 2,042 | |
| | | | | |
NET PROFIT (LOSS) AND COMPREHENSIVE INCOME (LOSS) | | (5,487 | ) | 3,969 | |
| | | | | |
Net loss per share | | | | | |
Basic | | $ | (0.06 | ) | $ | 0.04 | |
Diluted | | $ | (0.06 | ) | $ | 0.04 | |
See accompanying notes to the consolidated financial statements.
37
CONSOLIDATED STATEMENTS OF SHAREHOLDERS’ EQUITY
(unaudited, expressed in Canadian dollars)
For the three months ended March 31, ($000s) | | 2011 | | 2010 | |
| | | | (note 22) | |
SHAREHOLDERS’ CAPITAL | | | | | |
Common shares | | | | | |
Balance, beginning of period | | 316,779 | | 257,629 | |
Issued for cash, net of transaction costs | | — | | 43,168 | |
Issued on exercise of share options | | 30 | | 64 | |
Contributed surplus transferred on exercised options | | 10 | | 22 | |
Balance, end of period | | 316,819 | | 300,883 | |
| | | | | |
EQUITY COMPONENT OF CONVERTIBLE DEBENTURES | | | | | |
Balance, beginning and end of period (note 10) | | 4,378 | | — | |
| | | | | |
CONTRIBUTED SURPLUS | | | | | |
Balance, beginning of period | | 30,489 | | 28,186 | |
Share-based compensation expense (note 13 and 14) | | 747 | | 223 | |
Adjustment of share-based compensation expense for forfeitures of unvested share options | | (6 | ) | — | |
Transfer to share capital for exercised options | | (10 | ) | (22 | ) |
Balance, end of period | | 31,220 | | 28,387 | |
| | | | | |
DEFICIT | | | | | |
Balance, beginning of period | | (53,954 | ) | (47,338 | ) |
Net loss | | (5,487 | ) | 3,969 | |
Balance, end of period | | (59,441 | ) | (43,369 | ) |
| | | | | |
TOTAL SHAREHOLDERS’ EQUITY | | $ | 292,976 | | $ | 285,901 | |
| | | | | | | |
See accompanying notes to the consolidated financial statements.
38
CONSOLIDATED STATEMENTS OF CASH FLOWS
(unaudited, expressed in Canadian dollars)
For the three months ended March 31, ($000s) | | 2011 | | 2010 | |
| | | | (note 22) | |
Cash provided by (used in): | | | | | |
| | | | | |
CASH FLOW FROM OPERATING ACTIVITIES | | | | | |
Profit (loss) | | $ | (5,487 | ) | $ | 3,969 | |
Adjustments for: | | | | | |
Depletion and depreciation | | 13,759 | | 10,146 | |
Finance expenses (note 17) | | 631 | | 783 | |
Share-based compensation (notes 13 and 14) | | 495 | | 192 | |
Unrealized loss (gain) on commodity contracts (note 20) | | 9,228 | | (7,256 | ) |
Loss (gain) on property dispositions | | (91 | ) | 322 | |
Deferred tax expense (recovery) (note 16) | | (1,508 | ) | 2,042 | |
Decommissioning costs incurred (note 12) | | (149 | ) | (162 | ) |
Change in non-cash working capital (note 15) | | (1,160 | ) | 3,420 | |
| | 15,718 | | 13,456 | |
CASH FLOW FROM (USED IN) FINANCING ACTIVITIES | | | | | |
Issuance of share capital, net of share issue costs | | 30 | | 42,514 | |
Advances from loans and borrowings | | 104,376 | | 3,095 | |
Repayment of loans and borrowings | | (75,250 | ) | (30,997 | ) |
Obligations under finance lease (note 11) | | (35 | ) | — | |
| | 29,121 | | 14,612 | |
Change in non-cash working capital (note 15) | | 639 | | 1,554 | |
| | 29,760 | | 16,166 | |
CASH FLOW FROM (USED IN) INVESTING ACTIVITIES | | | | | |
Expenditure on exploration and evaluation assets | | (9,996 | ) | (143 | ) |
Additions to property, plant and equipment | | (49,121 | ) | (18,203 | ) |
Proceeds on sale of property, plant and equipment | | (130 | ) | (47 | ) |
| | (59,247 | ) | (18,393 | ) |
Change in non-cash working capital (note 15) | | 13,769 | | (2,232 | ) |
| | (45,478 | ) | (20,625 | ) |
| | | | | |
Change in cash | | — | | 8,997 | |
| | | | | |
Cash, beginning of period | | — | | — | |
| | | | | |
Cash, end of period | | $ | — | | $ | 8,997 | |
| | | | | |
Cash paid: | | | | | |
Interest | | $ | 572 | | $ | 214 | |
Taxes | | — | | — | |
See accompanying notes to the consolidated financial statements.
39
NOTES TO THE CONSOLIDATED FINANCIAL STATEMENTS
(unaudited, expressed in Canadian dollars)
1. CORPORATE INFORMATION
Bellatrix Exploration Ltd. (the “Company” or “Bellatrix”) is a growth oriented, public exploration and production company. The Company resulted from a reorganization (the “Reorganization) effective November 1, 2009 pursuant to a plan of arrangement (the “Arrangement”) involving, among others, True Energy Trust (the “Trust” or “True”), Bellatrix Exploration Ltd. and securityholders of the Trust.
The Arrangement involved the exchange, on a one-for-one basis of trust units and exchangeable shares, after accounting for the conversion factor applicable to the exchangeable shares, for common shares of Bellatrix. All outstanding incentive unit rights to acquire Trust units of True became share options to acquire an equal number of common shares of Bellatrix Exploration Ltd. on the same terms and conditions, including as to exercise price, vesting and expiry dates.
In connection with the Reorganization, the unitholders’ capital was reduced by the deficit of the Trust as of October 31, 2009 and trust units were exchanged for common shares of Bellatrix.
2. BASIS OF PREPARATION
These consolidated interim financial statements are unaudited and have been prepared using accounting policies consistent with International Financial Reporting Standards (“IFRS”) and in accordance with International Accounting Standard (“IAS”) 34 -“Interim Financial Reporting” and IFRS 1 - “First-time Adoption of IFRS”, as they are part of the period covered by the Company’s first IFRS financial statements for the year ended December 31, 2011. The interim consolidated financial statements of the Company were authorized by the Board of Directors on May 11, 2011.
Previously, the Company prepared its consolidated annual and consolidated interim financial statements in accordance with Canadian Generally Accepted Accounting Principles (“Previous GAAP”). Previous GAAP differs in some areas from IFRS. The comparative figures from 2010 were restated to reflect these adjustments. Certain information and footnote disclosure which are considered material to the understanding of the Company’s interim financial statements and which are normally included in annual financial statements prepared in accordance with IFRS are provided in note 22 along with reconciliation and descriptions of the effect of the transition from previous GAAP to IFRS on equity, earnings and comprehensive income.
As these are the Company’s first set of consolidated interim financial statements in accordance with IFRS, the Company’s disclosures exceed the minimum requirements under IAS 34. The Company has elected to exceed the minimum requirements in order to present the Company’s accounting policies in accordance with IFRS and the additional disclosures required under IFRS, which also highlight the changes from the Company’s 2010 annual consolidated financial statements prepared in accordance with previous GAAP. In 2011 and beyond, the Company may not provide the same amount of disclosure in the Company’s interim consolidated financial statements which will be prepared in accordance with IFRS.
The preparation of financial statements in accordance with IAS 34 requires the use of certain critical accounting estimates. It requires management to make estimates and assumptions that affect the amounts reported in the consolidated interim financial statements and accompanying notes. Actual results may differ from these estimates.
The consolidated financial statements are presented in Canadian dollars, the Company’s functional currency, and have been prepared on the historical cost basis except for derivative financial instruments measured at fair value. The consolidated financial statements have, in management’s opinion, been properly prepared using careful judgment and reasonable limits of materiality and within the framework of the significant policies summarized in note 3. The areas involving a higher degree of judgment or complexity, or areas where assumptions and estimates are significant to the financial statements are disclosed in note 5.
40
NOTES TO THE CONSOLIDATED FINANCIAL STATEMENTS
(unaudited, expressed in Canadian dollars)
3. SIGNIFICANT ACCOUNTING POLICIES
a. Principles of Consolidation
The consolidated financial statements include the accounts of the Company and its subsidiary. Any reference to the “Company” throughout these consolidated financial statements refers to the Company and its subsidiary. All inter-entity transactions have been eliminated.
b. Revenue Recognition
Revenues from the sale of petroleum and natural gas are recorded when title to the products transfers to the purchasers based on volumes delivered and contracted delivery points and prices. Royalty income is recognized as it accrues in accordance with the terms of the overriding royalty agreements and is included with petroleum and natural gas sales.
Processing charges to other entities for use of facilities owned by the Company are recognized as revenue as they accrue in accordance with the terms of the service agreements and are presented as other income.
c. Joint Interests
A significant portion of the Company’s exploration and development activities are conducted jointly with others as established by contractual agreements and requiring unanimous consent for strategic financial and operating decisions. The financial statements reflect only the Company’s proportionate share of the assets, liabilities, revenues, expenses and cash flows from these activities.
d. Property, Plant and Equipment and Exploration and Evaluation Assets
I. Pre-exploration expenditures
Expenditures made by the Company before acquiring the legal right to explore in a specific area do not meet the definition of an asset and therefore are expensed by the Company as incurred.
II. Exploration and evaluation expenditures
Costs incurred once the legal right to explore has been acquired are capitalized as exploration and evaluation assets. These costs include, but are not limited to, exploration license expenditures, leasehold property acquisition costs, evaluation costs, including drilling costs directly attributable to an identifiable well and directly attributable general and administrative costs. These costs are accumulated in cost centres by property and are not subject to depletion until technical feasibility and commercial viability has been determined.
Exploration and evaluation assets are assessed for impairment when facts and circumstances suggest that the carrying amount exceeds the recoverable amount. For purposes of impairment testing, exploration and evaluation assets are grouped together with developing and producing assets and are tested at an aggregated cash-generating unit (“CGU”) level.
The technical feasibility and commercial viability of extracting a mineral resource is considered to be determinable when proven and probable reserves are determined to exist. A review of each exploration license or field is carried out, at least annually, to ascertain whether proven and probable reserves have been discovered. Upon determination of proven and probable reserves, exploration and evaluation assets attributable to those reserves are tested for impairment and reclassified from exploration and evaluation assets to oil and natural gas interests.
III. Developing and production costs
Items of property, plant and equipment, which include oil and gas development and production assets, are measured at cost less accumulated depletion and depreciation and accumulated impairment losses. Development and production assets are grouped into CGU’s for impairment testing. A CGU’s recoverable amount is the higher of its fair value less costs to sell and its value in use. Where the carrying amount of a CGU exceeds its recoverable amount, the asset group is considered impaired and is written down to its recoverable amount.
41
NOTES TO THE CONSOLIDATED FINANCIAL STATEMENTS
(unaudited, expressed in Canadian dollars)
Gains and losses on disposal of an item of property, plant and equipment, including oil and natural gas interests, are determined by comparing the proceeds from disposal with the carrying amount of property, plant and equipment and are recognized net within the Consolidated Statements of Comprehensive Income.
IV. Subsequent costs
Costs incurred subsequent to the determination of technical feasibility and commercial viability and the costs of replacing parts of property, plant and equipment are recognized as oil and natural gas interests only when they increase the future economic benefits embodied in the specific asset to which they relate. All other expenditures are recognized in profit or loss as incurred. Such capitalized oil and natural gas interests generally represent costs incurred in developing proved and/or probable reserves and bringing in or enhancing production from such reserves, and are accumulated on a field or geotechnical area basis. The carrying amount of any replaced or sold component is derecognized. The costs of the day-to-day servicing of property, plant and equipment are recognized in profit or loss as incurred.
V. Depletion and depreciation
Depletion of petroleum and natural gas properties is provided using the unit-of-production method based on production volumes in relation to total estimated proven and probable reserves as determined annually by independent engineers and determined in accordance with National Instrument 51-101. Natural gas reserves and production are converted at the energy equivalent of six thousand cubic feet to one barrel of oil.
Calculations for depletion and depreciation of production equipment are based on total capitalized costs plus estimated future development costs of proven and probable undeveloped reserves less the estimated net realizable value of production equipment and facilities after the proved and probable reserves are fully produced.
Proven and probable reserves are estimated using independent reserve engineer reports and represent the estimated quantities of crude oil, natural gas and natural gas liquids which geological, geophysical and engineering data demonstrate with a specified degree of certainty to be recoverable in future years from known reservoirs and which are considered commercially producible. There should be a 50 percent statistical probability that the actual quantity of recoverable reserves will be more than the amount estimated as proven and probable and a 50 percent statistical probability that it will be less. The equivalent statistical probabilities for the proven component of proven and probable reserves are 90 percent and 10 percent, respectively.
Such reserves may be considered commercially producible if management has the intention of developing and producing them and such intention is based upon:
· a reasonable assessment of the future economics of such production;
· a reasonable expectation that there is a market for all or substantially all the expected oil and natural gas production; and
· evidence that the necessary production, transmission and transportation facilities are available or can be made available.
Reserves may only be considered proven and probable if supported by either actual production or conclusive formation tests. The area of reservoir considered proven includes (a) that portion delineated by drilling and defined by gas-oil and/or oil-water contacts, if any, or both, and (b) the immediately adjoining portions not yet drilled, but which can be reasonably judged as economically productive on the basis of available geophysical, geological and engineering data. In the absence of information on fluid contacts, the lowest known structural occurrence of oil and natural gas controls the lower proved limit of the reservoir.
Reserves which can be produced economically through application of improved recovery techniques (such as fluid injection) are only included in the proven and probable classification when successful testing by a pilot project, the operation of an installed program in the reservoir, or other reasonable evidence (such as, experience of the same techniques on similar reservoirs or reservoir simulation studies) provides support for the engineering analysis on which the project or program was based.
Depreciation of office furniture and equipment is provided for on a 20% declining balance basis.
Depreciation methods, useful lives and residual values are reviewed at each reporting date.
42
NOTES TO THE CONSOLIDATED FINANCIAL STATEMENTS
(unaudited, expressed in Canadian dollars)
e. Impairment
I. Financial assets
A financial asset is assessed at each reporting date to determine whether there is any objective evidence that it is impaired. A financial asset is considered to be impaired if objective evidence indicates that one or more events have had a negative effect on the estimated future cash flows of that asset.
An impairment loss in respect of a financial asset measured at amortized cost is calculated as the difference between its carrying amount and the present value of the estimated future cash flows discounted at the original effective interest rate.
All impairment losses are recognized in profit or loss.
An impairment loss is reversed if the reversal can be related objectively to an event occurring after the impairment loss was recognized. For financial assets measured at amortized cost the reversal is recognized in profit or loss.
In relation to trade receivables, a provision for impairment is made and an impairment loss is recognized in profit and loss when there is objective evidence (such as the probability of insolvency or significant financial difficulties of the debtor) that the Company will not be able to collect all of the amounts due under the original terms of the invoice. The carrying amount of the receivable is reduced through use of an allowance account. Impaired debts are written off against the allowance account when they are assessed as uncollectible.
II. Non-financial assets
Exploration and evaluation assets are assessed for impairment when they are reclassified to developing and producing assets, as oil and natural gas interests, and also if facts and circumstances suggest that the carrying amount exceeds the recoverable amount.
For the purpose of impairment testing, assets are grouped together into the smallest group of assets that generates cash inflows from continuing use that are largely independent of the cash inflows of other assets or groups of assets (the “cash-generating unit” or “CGU”). The recoverable amount of an asset or a CGU is the greater of its value in use and its fair value less costs to sell.
Fair value less costs to sell is determined to be the amount for which the asset could be sold in an arm’s length transaction. Fair value less costs to sell can be determined by using an observable market or by using discounted future net cash flows of proved and probable reserves using forecasted prices and costs. Value in use is determined by estimated the present value of the future net cash flows expected to be derived from the continued use of the asset or cash generating unit.
Exploration and evaluation assets are grouped together with the Company’s CGU’s when they are assessed for impairment, both at the time of any triggering facts and circumstances as well as upon their eventual reclassification to producing assets (oil and natural gas interests in property, plant and equipment).
An impairment loss is recognized if the carrying amount of an asset or its CGU exceeds its estimated recoverable amount. Impairment losses are recognized in profit or loss. Impairment losses recognized in respect of CGU’s are allocated first to reduce the carrying amount of any goodwill, if any, allocated to the units and then to reduce the carrying amounts of the other assets in the unit (group of units) on a pro rata basis.
Impairment losses recognized in prior years are assessed at each reporting date for any indications that the loss has decreased or no longer exists. An impairment loss is reversed if there has been a change in the estimates used to determine the recoverable amount. An impairment loss is reversed only to the extent that the asset’s carrying amount does not exceed the carrying amount that would have been determined, net of depletion and depreciation or amortization, if no impairment loss had been recognized.
43
NOTES TO THE CONSOLIDATED FINANCIAL STATEMENTS
(unaudited, expressed in Canadian dollars)
f. Provisions
Provisions are recognized when the Company has a present legal or constructive obligation as a result of a past event, it is probable that an outflow of economic benefits will be required to settle the obligation and a reliable estimate can be made of the amount of the obligation. Provisions are determined by discounting the expected cash flows at a pre-tax rate that reflects current market assessments of the time value of money and the risks specific to the liability if the risks have not been incorporated into the estimate of cash flows. The increase in the provision due to the passage of time is recognized within finance costs.
I. Decommissioning obligations
The Company’s activities give rise to dismantling, decommissioning and site disturbance re-mediation activities. A provision is made for the estimated cost of site restoration and capitalized in the relevant asset category.
Decommissioning obligations are measured at the present value of management’s best estimate of the expenditure required to settle the present obligation at the balance sheet date. Changes in the present value of the estimated expenditure are reflected as an adjustment to the provision and the relevant asset. The unwinding of the discount on the decommissioning provision is recognized as a finance cost. Actual costs incurred upon settlement of the decommissioning liabilities is charged against the provision to the extent the provision was recognized.
II. Environmental liabilities
The Company records liabilities on an undiscounted basis for environmental remediation efforts that are likely to occur and where the cost can be reasonably estimated. The estimates, including associated legal costs, are based on available information using existing technology and enacted laws and regulations. The estimates are subject to revision in future periods based on actual costs incurred or new circumstances. Any amounts expected to be recovered from other parties, including insurers, are recorded as an asset separate from the associated liability.
g. Share-based Compensation Plan
Bellatrix accounts for options issued under the Company’s share option plan to employees, directors, officers, consultants and other service providers by reference to the fair value of the equity instruments granted. The fair value of each share option is estimated on the date of the grant using the Black-Scholes options pricing model and charged to earnings over the vesting period with a corresponding increase to contributed surplus. The Company estimates a forfeiture rate on the grant date and the rate is adjusted to reflect the actual number of options that actually vest. The expected life of the options granted is adjusted, based on the Company’s best estimate, for the effects of non-transferability, exercise restrictions and behavioural considerations.
h. Income Taxes
Income tax expense comprises of current and deferred tax. Income tax expense is recognized in profit or loss except to the extent that it relates to items recognized directly in equity, in which case it is recognized in equity.
I. Current income tax
Current income tax assets and liabilities for the current and prior periods are measured at the amount expected to be recovered from or paid to the taxation authorities. The tax rates and tax laws used to compute the amount are those that are enacted or substantively enacted by the date of the statement of financial position.
II. Deferred income tax
Deferred tax is recognized using the balance sheet method, providing for temporary differences between the carrying amounts of assets and liabilities for financial reporting purposes and the amounts used for taxation purposes. Deferred tax is not recognized on the initial recognition of assets or liabilities in a transaction that is not a business combination. In addition, deferred tax is not recognized for taxable temporary differences arising on the initial recognition of goodwill.
44
NOTES TO THE CONSOLIDATED FINANCIAL STATEMENTS
(unaudited, expressed in Canadian dollars)
Deferred tax is measured at the tax rates that are expected to be applied to temporary differences when they reverse, based on the laws that have been enacted or substantively enacted by the reporting date. Deferred tax assets and liabilities are offset if there is a legally enforceable right to offset, and they relate to income taxes levied by the same tax authority on the same taxable entity, or on different tax entities, but they intend to settle current tax liabilities and assets on a net basis or their tax assets and liabilities will be realized simultaneously.
A deferred tax asset is recognized to the extent that it is probable that future taxable profits will be available against which the temporary difference can be utilized. Deferred tax assets are reviewed at each reporting date and are reduced to the extent that it is no longer probable that the related tax benefit will be realized.
i. Financial Instruments
All financial instruments, including all derivatives, are recognized on the balance sheet initially at fair value. Subsequent measurement of all financial assets and liabilities except those held-for-trading and available for sale are measured at amortized cost determined using the effective interest rate method. Held-for-trading financial assets are measured at fair value with changes in fair value recognized in income. Available-for-sale financial assets are measured at fair value with changes in fair value recognized in comprehensive income and reclassified to income when derecognized or impaired. The Company has the following classifications:
Financial Assets and Liabilities | | Category | | Subsequent Measurement |
Cash and cash equivalents | | Held-for-trading | | Fair value through profit or loss |
Accounts receivable | | Loans and receivables | | Amortized cost |
Commodity risk management contracts | | Held-for-trading | | Fair value through profit or loss |
Accounts payable and accrued liabilities | | Other liabilities | | Amortized cost |
Deferred liability | | Other liabilities | | Amortized cost |
Long-term debt | | Other liabilities | | Amortized cost |
Convertible debentures | | Other liabilities | | Amortized cost |
Capital lease obligation | | Other liabilities | | Amortized cost |
Transaction costs attributable to financial instruments classified as other than held-for-trading are included in the recognized amount of the related financial instrument and recognized over the life of the resulting financial instrument using the effective interest rate method.
The Company utilizes financial derivatives and non-financial derivatives, such as commodity sales contracts requiring physical delivery, to manage the price risk attributable to anticipated sale of petroleum and natural gas production and foreign exchange exposures. The Company does not enter into derivative financial instruments for trading or speculative purposes. The Company has not designated its financial derivative contracts as effective accounting hedges, and thus not applied hedge accounting, even though the Company considers all commodity contracts to be economic hedges. As a result, financial derivatives are classified as fair value through profit or loss and are recorded on the balance sheet at fair value.
The derivative financial instruments are initiated within the guidelines of the Company’s commodity price risk management policy. This includes linking all derivatives to specific assets and liabilities on the balance sheet or to specific firm commitments or forecasted transactions.
The Company accounts for its commodity sales and purchase contracts, which were entered into and continue to be held for the purpose of receipt or delivery of non-financial items in accordance with its expected purchase, sale or usage requirements as executory contracts. As such, physical sales and purchase contracts are not recorded at fair value on the balance sheet. Settlements on these physical sales contracts are recognized in petroleum and natural gas sales.
45
NOTES TO THE CONSOLIDATED FINANCIAL STATEMENTS
(unaudited, expressed in Canadian dollars)
Financial instruments measured at fair value on the balance sheet require classification into one of the following levels of the fair value hierarchy:
Level 1 | - | Quoted prices (unadjusted) in active markets for identical assets or liabilities |
Level 2 | - | Inputs other than quoted prices included in level 1 that are observable for the asset or liability, either directly or indirectly. |
Level 3 | - | inputs for the asset or liability that are not based on observable market data. |
The fair value hierarchy level at which a fair value measurement is categorized is determined on the basis of the lowest level input that is significant to the fair value measurement in its entirety. The Company has categorized its financial instruments that are fair valued on the balance sheet according to the fair value hierarchy (note 20).
j. Compound Financial Instruments
The Company’s compound financial instruments comprise of its convertible debentures that can be converted to common shares at the option of the holder, and the number of shares to be issued does not vary with changes in fair value.
The liability component of the convertible debentures is recognized initially at the fair value of a similar liability that does not have an equity conversion option. The equity component is recognized initially as the difference between the fair value of the convertible debenture and the fair value of the liability component. Any directly attributable transaction costs are allocated to the liability and equity components in proportion to their initial carrying amounts.
Subsequent to initial recognition, the liability component of the convertible debentures is measured at amortized cost using the effective interest method. The equity component the convertible debenture is not re-measured subsequent to initial recognition.
k. Flow-through Shares
Resource expenditures for income tax purposes related to exploration and development activities funded by flow-through share arrangements are renounced to investors in accordance with income tax legislation. A deferred liability is recognized for the premium on the flow-through shares and is subsequently reversed as the Company incurs qualifying expenditures. Any difference between the deferred liability set up for the premium on the flow-through shares and the tax effect on the renounced expenditures is recognized in profit or loss.
l. Obligations Under Lease
Leases which effectively transfer substantially all of the risks and rewards of ownership to the Company are classified as capital leases and are accounted for as an acquisition of an asset and an assumption of an obligation at the inception of the lease, measured as the present value of minimum lease payments to a maximum of the asset’s fair value. The asset is amortized in accordance with the Company’s depletion and depreciation policy. The obligations recorded under capital lease payments are reduced by the lease payments made.
m. Basic and Diluted per Share Calculations
Basic per share amounts are calculated using the weighted average number of shares outstanding during the period. The Company uses the treasury share method to determine the dilutive effect of share options. Under the treasury share method, only “in the money” dilutive instruments impact the diluted calculations in computing diluted per share amounts. The Company uses the “if-converted” method to determine the dilutive effect of convertible debentures.
n. Finance Income and Expenses
Finance income is recognized as it accrues in profit or loss, using the effective interest method. Finance expense comprises interest expense on borrowings, accretion of the discount rate on provisions, accretion of the liability component of the convertible debentures and impairment losses recognized on financial assets.
46
NOTES TO THE CONSOLIDATED FINANCIAL STATEMENTS
(unaudited, expressed in Canadian dollars)
Borrowing costs incurred for the construction of qualifying assets are capitalized during the period of time that is required to complete and prepare the assets for their intended use or sale. Qualifying assets are assets that necessarily take a substantial period of time to get ready for their intended use. All other borrowing costs are recognized in profit or loss using the effective interest method. The capitalization rate used to determine the amount of borrowing costs to be capitalized is the weighted average interest rate applicable to the Company’s outstanding borrowings during the period.
o. Cash and Cash Equivalents
Cash and cash equivalents include cash and short-term investments with original maturities of three months or less.
4. NEW STANDARDS AND INTERPRETATIONS NOT YET ADOPTED
Effective January 1, 2013, Bellatrix will be required to adopt IFRS 9, “Financial Instruments”, which is the result of the first phase of the IASB’s project to replace IAS 39, “Financial Instruments: Recognition and Measurement”. The new standard replaces the current multiple classification and measurement models for financial assets and liabilities with a single model that has only two classification categories: amortized cost and fair value.
5. CRITICAL JUDGMENTS AND ACCOUNTING ESTIMATES
The consolidated financial statements of the Company have been prepared by management in accordance with International Financial Reporting Standards. The preparation of consolidated financial statements in conformity with IFRS requires management to make estimates and assumptions that affect the amounts reported in the consolidated financial statements and accompanying notes. By their nature, these estimates are subject to measurement uncertainty and the effect on the financial statements of changes in such estimates in future periods could be material. The consolidated financial statements have, in management’s opinion, been properly prepared using careful judgment and reasonable limits of materiality and within the framework of the significant policies summarized below.
I. Accounts receivable
Accounts receivable are recorded at the estimated recoverable amount which involves the estimate of uncollectible accounts.
II. Derivatives
The fair value of commodity contracts are based on published market prices as at the balance sheet date and may differ from what will eventually be realized. Changes in the fair value of the commodity contracts are recognized in profit or loss. The actual gains and losses realized on eventual cash settlement can vary due to subsequent fluctuations in commodity prices.
III. Oil and gas reserves
Reserves and resources are used in the units of production calculation for depreciation, depletion and amortization and the impairment analysis which affect net income. There are numerous uncertainties inherent in estimating oil and gas reserves. Estimating reserves is very complex, requiring many judgments based on geological, geophysical, engineering and economic data. Changes in these judgments could have a material impact on the estimated reserves. These estimates may change, having either a negative or positive effect on net earnings as further information becomes available and as the economic environment changes.
IV. Depreciation and depletion
Depletion of petroleum and natural gas properties is provided using the unit-of-production method based on production volumes before royalties in relation to total estimated proved and probable reserves as determined annually by independent engineers and internal reserve evaluations on a quarterly basis determined in accordance with National Instrument 51-101. Natural gas reserves and production are converted at the energy equivalent of six thousand cubic feet to one barrel of oil.
Calculations for depletion and depreciation of production equipment are based on total capitalized costs plus estimated future development costs of proved and probable undeveloped reserves less the estimated net realizable value of production equipment and facilities after the proved reserves are fully produced. The costs of acquiring and evaluating unproved properties are excluded from depletion calculations.
47
NOTES TO THE CONSOLIDATED FINANCIAL STATEMENTS
(unaudited, expressed in Canadian dollars)
V. Recoverability of asset carrying values
The Company assesses its oil and gas properties, including exploration and evaluation assets, for possible impairment if there are events or changes in circumstances that indicate that carrying values of the assets may not be recoverable, or at least at every reporting date.
The assessment of any impairment of property, plant and equipment is dependent upon estimates of recoverable amount that take into account factors such as reserves, economic and market conditions, timing of cash flows, the useful lives of assets and their related salvage values.
VI. Liability component of convertible debentures
The Company’s liability component of its convertible debentures has been determined by estimating a market rate of interest by reference to similar liabilities that do not have a conversion option.
VII. Decommissioning obligations
Provisions for decommissioning obligations associated with the Company’s drilling operations are based on current legal and constructive requirements, technology, price levels and expected plans for remediation. Actual costs and cash outflows can differ from estimates because of changes in laws and regulations, public expectations, prices, discovery and analysis of site conditions and changes in clean up technology.
VIII. Share-based compensation
The fair value of stock options granted is measured using a Black Scholes model. Measurement inputs include share price on measurement date, exercise price of the option, expected volatility, expected life of the options, expected dividends and the risk-free rate. The Company estimates volatility based on historical share price excluding specific time frames in which volatility was affected by specific transactions that are not considered to be indicative of the Company’s expected share price volatility. The expected life of the options is based on historical experience and general option holder behavior. Dividends were not taken into consideration as the Company does not expect to pay dividends. Management also makes an estimate of the number of options that will forfeit and the rate is adjusted to reflect the actual number of options that actually vest.
IX. Income taxes
Related assets and liabilities are recognized for the estimated tax consequences between amounts included in the financial statements and their tax base using substantively enacted future income tax rates. Timing of future revenue streams and future capital spending changes can affect the timing of any temporary differences, and accordingly affect the amount of the deferred tax asset or liability calculated at a point in time. These differences could materially impact earnings.
6. EXPLORATION AND EVALUATION ASSETS
($000s) | | | |
Deemed cost (note 22) | | | |
Balance, January 1, 2010 | | $ | 20,542 | |
Additions | | 481 | |
Transfer to oil and natural gas properties | | (1,809 | ) |
Disposals | | (679 | ) |
Balance, December 31, 2010 | | 18,535 | |
Additions | | 9,996 | |
Transfer to oil and natural gas properties | | (755 | ) |
Disposals | | — | |
Balance, March 31, 2011 | | $ | 27,776 | |
Exploration and evaluation (“E&E”) assets consist of the Company’s exploration projects which are pending the determination of proven or probable reserves. For the three months ended March 31, 2011 $0.8 million was transferred to property, plant, and equipment following the successful discovery of proven and probable reserves.
48
NOTES TO THE CONSOLIDATED FINANCIAL STATEMENTS
(unaudited, expressed in Canadian dollars)
7. PROPERTY, PLANT AND EQUIPMENT
| | Oil and | | Office | | | |
| | natural gas | | furniture and | | | |
($000s) | | properties | | equipment | | Total | |
Deemed cost (note 22) | | | | | | | |
Balance, January 1, 2010 | | $ | 388,276 | | $ | 1,748 | | $ | 390,024 | |
Additions | | 112,145 | | 488 | | 112,633 | |
Transfer from exploration and evaluation assets | | 1,809 | | — | | 1,809 | |
Disposals (1) | | (17,630 | ) | — | | (17,630 | ) |
Balance, December 31, 2010 | | 484,600 | | 2,236 | | 486,836 | |
Additions | | 53,114 | | 59 | | 53,173 | |
Transfer from exploration and evaluation assets | | 755 | | — | | 755 | |
Disposals(1) | | (3,169 | ) | — | | (3,169 | ) |
Balance, March 31, 2011 | | $ | 535,300 | | $ | 2,295 | | $ | 537,595 | |
| | | | | | | |
Accumulated Depletion, Depreciation and Impairment losses | | | | | | | |
Balance, January 1, 2010 (note 22) | | $ | 43,193 | | $ | 602 | | $ | 43,795 | |
Charge for time period | | 47,650 | | 251 | | 47,901 | |
Impairment loss | | 6,489 | | 121 | | 6,610 | |
Impairment reversal | | (9,648 | ) | (200 | ) | (9,848 | ) |
Disposals (1) | | (1,202 | ) | — | | (1,202 | ) |
Balance, December 31, 2010 | | $ | 86,482 | | $ | 774 | | $ | 87,256 | |
Charge for time period | | 13,687 | | 72 | | 13,759 | |
Impairment loss | | — | | — | | — | |
Disposals (1) | | — | | — | | — | |
Balance, March 31, 2011 | | $ | 100,169 | | $ | 846 | | $ | 101,015 | |
(1) Disposals include swaps.
Carrying amounts | | | | | | | |
At January 1, 2010 | | $ | 345,083 | | $ | 1,146 | | $ | 346,229 | |
At December 31, 2010 | | $ | 398,118 | | $ | 1,462 | | $ | 399,580 | |
March 31, 2011 | | $ | 435,131 | | $ | 1,449 | | $ | 436,580 | |
Bellatrix has included $254.1 million (2010: $288.8 million) for future development costs and excluded $34.9 million (2010: $32.6 million) for estimated salvage from the depletion calculation during the three months ended March 31, 2011.
For the three months ended March 31, 2011, the Company capitalized $0.9 million (2010: $0.3 million) of general and administrative expenses and $0.2 million (2010: $.03 million) of share-based compensation expense directly related to exploration and development activities.
Bellatrix’s credit facilities are secured against all of the assets of the Corporation by a $400 million debenture containing a first ranking charge and security interest. The Corporation has provided a negative pledge and undertaking to provide fixed charges over major petroleum and natural gas reserves in certain circumstances.
Exploration and evaluation (“E&E”) assets consist of the Company’s exploration projects which are pending the determination of proven or probable reserves. For the three months ended March 31, 2011 $0.8 million was transferred to property, plant, and equipment following the successful discovery of proven and probable reserves.
49
NOTES TO THE CONSOLIDATED FINANCIAL STATEMENTS
(unaudited, expressed in Canadian dollars)
8. DEFERRED LIABILITY
On August 12, 2010, Bellatrix issued 4,710,000 common shares on a flow-through basis (“Flow-Through Shares”) at $4.25 each. As a result of the Flow-Through Shares, the Company is committed to incur $20.0 million of Canadian Eligible Expenses (“CEE”) on or before December 31, 2011.
Bellatrix has recognized a deferred liability based on the premium received on the Flow-Through Shares compared to the Company’s closing share price on the date of the issuance. The deferred liability is de-recognized as the CEE expenditures are incurred by the Company. For the three months ended March 31, 2011, the Company has satisfied approximately $2.5 million of its $20.0 million commitment; as a result, the deferred liability has been reduced to $3.3 million and a deferred tax expense of $0.2 million has been recognized.
9. LONG-TERM DEBT
($000s) | | March 31, 2011 | | December 31, 2010 | |
Operating facility | | $ | 4,298 | | $ | 6,172 | |
Revolving term facility | | 66,000 | | 35,000 | |
Balance, end of year | | $ | 70,298 | | $ | 41,172 | |
The Company’s credit facilities consist of a $15 million demand operating facility provided by a Canadian bank and an $85 million extendible revolving term credit facility provided by a Canadian bank and a Canadian financial institution. Amounts borrowed under the credit facility will bear interest at a floating rate based on the applicable Canadian prime rate, U.S. base rate or LIBOR rate, plus between 1.25% and 4.25%, depending on the type of borrowing and the Company’s debt to cash ratio. The credit facilities are secured by a $400 million debenture containing a first ranking charge and security interest. Bellatrix has provided a negative pledge and undertaking to provide fixed charges over major petroleum and natural gas reserves in certain circumstances. A standby fee is charged of between 0.55% and 1.02% on the undrawn portion of the credit facilities, depending on the Company’s debt to cash flow ratio.
The current revolving period of the existing credit facilities is June 28, 2011. Should the facility not be extended it will convert to a non-revolving term facility with the full amount outstanding due 366 days after the last day of the revolving period of June 28, 2011. The Company’s borrowing base will be subject to re-determination on May 30, 2011. Thereafter, a semi-annual re-determination of the borrowing base will occur, with the next such re-determination occurring on November 30, 2011. As of May 10, 2011, the banking syndicate has agreed, subject to and effective upon final documentation, to increase the borrowing base from $100 million to $140 million through to November 30, 2011 and extend the revolving period of the credit facility from June 28, 2011 to June 26, 2012.
Payment will not be required under the revolving term facility for more than 365 days from March 31, 2011 and as there is sufficient availability under the revolving term credit facility to cover the operating facility, the entire amounts owing on the credit facilities have been classified as long-term.
Pursuant to Bellatrix’s credit facilities, the Company is permitted to pay the semi-annual interest payments on the Debentures, and payments by the Company to debenture holders in relation to the redemption of Debentures and in relation to debenture normal course issuer bids approved by the Toronto Stock Exchange, provided that the aggregate of all such normal course issuer bids and redemptions do not exceed $10.0 million in any fiscal year.
As at March 31, 2011, approximately $29.7 million was not drawn under the existing facilities and Bellatrix was fully compliant with all of its operating debt covenants.
50
NOTES TO THE CONSOLIDATED FINANCIAL STATEMENTS
(unaudited, expressed in Canadian dollars)
10. CONVERTIBLE DEBENTURES
The following table sets forth a reconciliation of the convertible debentures:
Convertible Debentures
($000s except number of debentures) | | 4.75% | |
Number of Debentures | | | |
Balance, December 31, 2010 | | 55,000 | |
Issued | | — | |
Redeemed | | — | |
Balance, March 31, 2011 | | 55,000 | |
Debt Component | | | |
Balance, December 31, 2010 | | $ | 47,599 | |
Accretion | | 352 | |
Redeemed | | — | |
Balance, March 31, 2011 | | $ | 47,951 | |
Equity Component | | | |
Balance, December 31, 2010 | | $ | 4,378 | |
Balance, March 31, 2011 | | $ | 4,378 | |
On April 20, 2010, Bellatrix issued $55 million of convertible unsecured subordinated debentures (the “4.75% Debentures”) on a bought deal basis. The 4.75% Debentures have a face value of $1,000 each, bear interest at the rate of 4.75% per annum payable semi-annually in arrears on the last day of April and October of each year commencing on October 31, 2010 and mature on April 30, 2015 (the “Maturity Date”). The 4.75% Debentures are convertible at the holder’s option and at any time prior to the close of business on the earlier of the close of business on the business day immediately preceding the Maturity Date and the date specified by the Corporation for redemption of the 4.75% Debentures into common shares of the Corporation at a conversion price of $5.60 per common share (the “Conversion Price”), subject to adjustment in certain events. The 4.75% Debentures are not redeemable by the Corporation before April 30, 2013. On and after April 13, 2013 and prior to April 30, 2014, the 4.75% Debentures are redeemable at the Corporation’s option, in whole or in part, at par plus accrued and unpaid interest if the weighted average trading price of the common shares for the specified period is not less than 125% of the Conversion Price. On and after April 30, 2014, the 4.75% Debentures are redeemable at the Corporation’s option, in whole or in part, at any time at par plus accrued and unpaid interest. The 4.75% Debentures are listed and posted for trading on the TSX under the symbol “BXE.DB.A”.
As the 4.75% Debentures are convertible into common shares, the liability and equity components are presented separately. The initial carrying amount of the financial liability is determined by discounting the stream of future payments of interest and principal and has been determined to be $48.8 million. A total of $2.2 million of issue costs has been allocated to the liability component of the debentures. Using the residual method, the carrying amount of the conversion feature is the difference between the principal amount and the carrying value of the financial liability. Within the Shareholder’s Equity section of the consolidated financial statements, $4.4 million has been recorded as the carrying amount of the conversion feature of the debentures, net of $0.3 million of issue costs and $1.5 million of deferred taxes. The 4.75% Debentures, net of the equity component and issue costs, of $46.6 million, is accreted using the effective interest rate method over the term of the 4.75% Debentures such that the carrying amount of the financial liability will equal the principal balance at maturity.
On April 20, 2010, Bellatrix deposited with Computershare Trust Company of Canada, the trustee (the “Trustee”) for Bellatrix’s previously outstanding series of debentures, being the 7.5% convertible unsecured subordinated debentures due June 30, 2011 (the “7.5% Debentures”), sufficient funds to satisfy the principal amount and interest owing on the 7.5% Debentures and on May 3, 2010 the trustee provided notice to the registered holders of the 7.5% Debentures of its intention to redeem the 7.5% Debentures on July 2, 2010. The 7.5% Debentures were redeemed for an amount of $1,025 for each $1,000 principal amount of the 7.5% Debentures plus accrued and unpaid interest, or a total of $88.0 million. Proceeds from the issuance of the 4.75% Debentures have been used by Bellatrix to partially fund the redemption of the 7.5% Debentures and the balance of the redemption amount has been funded through bank indebtedness. The funds deposited with the Trustee on April 20, 2010 and acknowledgment by the Trustee thereof discharged and extinguished the Company’s financial liability for the 7.5% Debentures as of that date.
51
NOTES TO THE CONSOLIDATED FINANCIAL STATEMENTS
(unaudited, expressed in Canadian dollars)
11. FINANCE LEASE OBLIGATION
Bellatrix entered into an agreement with a certain joint venture (“Joint Venture”) for the use of certain facilities which will expire in year 2030 or earlier if certain circumstances are met. At the end of the term of the agreement, ownership of the facilities is transferred to the Company. The agreement is accounted for as a finance lease in accordance with International Accounting Standard 17- “Leases”. Assets under finance lease at March 31, 2011 totaled $1.6 million with accumulated depreciation of $0.1 million.
The following is a schedule of future minimum lease payments under the finance lease obligation:
Period ending March 31, | | ($000s) | |
2012 | | $ | 375 | |
2013 | | 359 | |
2014 | | 343 | |
2015 | | 327 | |
Thereafter | | 1,750 | |
Total lease payments | | 3,154 | |
Amount representing implicit interest at 15.28% | | (1,600 | ) |
| | 1,554 | |
Current portion of capital lease obligation | | (147 | ) |
Capital lease obligation | | $ | 1,407 | |
12. DECOMMISSIONING LIABILITIES
The Company’s decommissioning liabilities result from net ownership interests in petroleum and natural gas assets including well sites, gathering systems and processing facilities. The Company estimates the total undiscounted amount of cash flows required to settle its decommissioning liabilities is approximately $41.6 million which will be incurred between 2013 and 2053. A risk-free rate between 1.82% - 3.75% percent and an inflation rate of 2 percent were used to calculate the fair value of the decommissioning liabilities.
($000s) | | March 31, 2011 | | December 31, 2010 | |
Balance, beginning of period (note 22) | | $ | 38,710 | | $ | 39,001 | |
Incurred on development activities | | 660 | | 2,140 | |
Revisions on estimates | | (213 | ) | 1,182 | |
Reversed on dispositions | | (31 | ) | (3,302 | ) |
Settled during the period | | (149 | ) | (1,373 | ) |
Accretion expense | | 279 | | 1,062 | |
Balance, end of period | | $ | 39,256 | | $ | 38,710 | |
13. SHAREHOLDERS’ EQUITY
a. Common Shares
Bellatrix is authorized to issue an unlimited number of common shares. All shares issued are fully paid and have no par value. The common shareholders are entitled to dividends declared by the Board of Directors; Bellatrix does not anticipate paying dividends.
52
NOTES TO THE CONSOLIDATED FINANCIAL STATEMENTS
(unaudited, expressed in Canadian dollars)
| | March 31, 2011 | | December 31, 2010 | |
| | | | Amount | | | | Amount | |
| | Number | | ($000s) | | Number | | ($000s) | |
Common shares, opening balance | | 97,446,026 | | $ | 316,779 | | 78,809,039 | | $ | 252,629 | |
Shares issued for cash, net of transaction costs and tax effect | | — | | — | | 18,350,000 | | 62,358 | |
Premium on flow-through shares classified as a deferred liability | | — | | — | | — | | (3,768 | ) |
Shares issued on exercise of options | | 17,276 | | 30 | | 286,987 | | 434 | |
Contributed surplus transferred on exercised options | | — | | 10 | | — | | 126 | |
Balance, end of period | | 97,463,302 | | $ | 316,819 | | 97,446,026 | | $ | 316,779 | |
Subsequent to March 31, 2011, Bellatrix issued 9,822,000 common shares on a bought deal basis as discussed in note 21.
b. Share Option Plan
Bellatrix has a share option plan where the Company may grant share options to its directors, officers, employees and service providers. Under this plan, the exercise price of each share option is not less than the volume weighted average trading price of the Company’s share price for the five trading days immediately preceding the date of grant. The maximum term of an option grant is five years. Option grants are non-transferable or assignable except in accordance with the share option plan and the holding of share options shall not entitle a holder to any rights as a shareholder of Bellatrix. Share options, entitling the holder to purchase common shares of the Company, have been granted to directors, officers, employees and service providers of Bellatrix. One third of the initial grant of share options normally vests on each of the first, second, and third anniversary from the date of grant.
The following tables summarize information regarding Bellatrix’s Share Option Plan:
Share Options Continuity
| | Weighted Average
Exercise Price | | Number | |
Balance, December 31, 2010 | | | | | |
Granted | | $ | 2.69 | | 5,823,377 | |
Exercised | | $ | 5.35 | | 100,000 | |
Forfeited and cancelled | | $ | 1.75 | | (17,276 | ) |
Balance, March 31, 2011 | | $ | 5.06 | | (2,500 | ) |
| | $ | 2.74 | | 5,903,601 | |
As of March 31, 2011, a total of 9,720,186 share options were reserved, leaving an additional 3,816,585 available for future grants.
53
NOTES TO THE CONSOLIDATED FINANCIAL STATEMENTS
(unaudited, expressed in Canadian dollars)
Share Options Outstanding, March 31, 2011
| | | | | |
| | Outstanding | | | | Exercisable | |
| | | | Weighted | | | |
Exercise Price | | At
March 31, 2011 | | Weighted
Average
Exercise Price | | Average
Remaining
Contractual Life | | At
March 31, 2011 | | Exercise Price | |
$ 0.65 - $ 0.83 | | 333,076 | | $ | 0.70 | | 3.0 | | 179,050 | | $ | 0.68 | |
$ 1.07 - $ 1.50 | | 882,626 | | $ | 1.36 | | 3.1 | | 476,830 | | $ | 1.38 | |
$ 1.64 - $ 2.00 | | 1,731,732 | | $ | 1.88 | | 3.1 | | 975,153 | | $ | 1.87 | |
$ 2.47 - $ 3.94 | | 2,404,667 | | $ | 3.64 | | 3.7 | | 378,333 | | $ | 2.52 | |
$ 3.98 - $ 5.57 | | 551,500 | | $ | 4.97 | | 2.2 | | 392,000 | | $ | 4.96 | |
$ 0.65 - $ 5.57 | | 5,903,601 | | $ | 2.74 | | 3.2 | | 2,401,366 | | $ | 2.29 | |
14. CONTRIBUTED SURPLUS
($000s) | | March 31, 2011 | | December 31, 2010 | |
Balance, beginning of period | | $ | 30,489 | | $ | 28,186 | |
Share-based compensation expense | | 747 | | 2,429 | |
Transfer to share capital for exercised options | | (10 | ) | (126 | ) |
Adjustment of share-based compensation expense for forfeitures of unvested options | | (6 | ) | — | |
Balance, end of period | | $ | 31,220 | | $ | 30,489 | |
Share-based Compensation Expense
During the three months ended March 31, 2011, Bellatrix granted 100,000 (2010: nil) share options. During the three months ended March 31, 2011, the Company recorded share-based compensation of $0.7 million, of which $0.2 million was capitalized to property, plant and equipment.
The fair values of all share options granted are estimated on the date of grant using the Black-Scholes option-pricing model. The weighted average fair market value of share options granted during the three months ended March 31, 2011 and the weighted average assumptions used in their determination are as noted below:
| | March 31, 2011 | |
Inputs: | | | |
Share price | | 5.35 | |
Exercise price | | 5.35 | |
Risk free interest rate (%) | | 1.7 - 2.0 | |
Option life (years) | | 2 - 3.5 | |
Option volatility (%) | | 64 - 66 | |
Results: | | | |
Weighted average fair value of each share option granted | | 2.30 | |
Bellatrix calculates volatility based on historical share price excluding particular time frames in which specific transactions affected the company’s share price. These time frames are excluded as they are not considered to be indicative of the Company’s expected share price volatility. A forfeiture rate between 3% to 10% (2010: 3% to 10%) is used when recording stock based compensation. This estimate is adjusted to the actual forfeiture rate on the option’s vesting date. In the three months ended March 31, 2011, a total of 17,276 options (2010: 25,333) were exercised; the weighted average share price for the quarter was $5.60 (2010: $3.88) .
54
NOTES TO THE CONSOLIDATED FINANCIAL STATEMENTS
(unaudited, expressed in Canadian dollars)
15. SUPPLEMENTAL CASH FLOW INFORMATION
Change in Non-cash Working Capital
| | Three months ended March 31, | |
($000s) | | 2011 | | 2010 | |
Changes in non-cash working capital items: | | | | | |
Accounts receivable | | $ | 3,100 | | $ | (4,654 | ) |
Deposits and prepaid expenses | | (622 | ) | 1,387 | |
Accounts payable and accrued liabilities | | 10,770 | | 6,009 | |
| | $ | 13,248 | | $ | 2,742 | |
Changes related to: | | | | | |
Operating activities | | $ | (1,160 | ) | $ | 3,420 | |
Financing activities | | 639 | | 1,554 | |
Investing activities | | 13,769 | | (2,232 | ) |
| | $ | 13,248 | | $ | 2,742 | |
16. INCOME TAXES
Bellatrix is a corporation as defined under the Income Tax Act (Canada) and is subject to Canadian federal and provincial taxes. Bellatrix is subject to provincial taxes in Alberta, British Columbia and Saskatchewan as the Company operates in those jurisdictions.
Deferred taxes reflect the tax effects of differences between the carrying amounts of assets and liabilities for financial reporting purposes and the amounts reported for tax purposes. As March 31, 2011, Bellatrix has approximately $489 million in tax pools available for deduction against future income. Included in this tax basis are estimated non-capital loss carry forwards of approximately $0.3 million that expire in years through 2027.
The provision for income taxes differs from the expected amount calculated by applying the combined Federal and Provincial corporate income tax rate of 26.5% (2010: 28.39%) to loss before taxes. This difference results from the following items:
| | Three months ended March 31, | |
($000s) | | 2011 | | 2010 | |
Expected income tax recovery | | $ | (1,854 | ) | $ | 1,707 | |
Share based compensation expense | | 131 | | 55 | |
Change in tax rates | | (59 | ) | 280 | |
Other | | 274 | | — | |
Deferred tax recovery | | $ | (1,508 | ) | $ | 2,042 | |
The components of the net deferred tax asset at March 31 are as follows:
($000s) | | 2011 | |
Deferred income tax liabilities: | | | |
Equity component of 4.75% Debentures | | $ | (1,330 | ) |
Deferred income tax assets: | | | |
Petroleum and natural gas properties | | 1,575 | |
Commodity contract liability | | 3,434 | |
Future site restoration / decommissioning liabilities | | 9,866 | |
Share issue costs | | 564 | |
Non-capital losses | | 79 | |
Attributed Canadian Royalty Income | | 1,209 | |
Other | | 451 | |
Deferred income tax asset | | $ | 15,848 | |
55
NOTES TO THE CONSOLIDATED FINANCIAL STATEMENTS
(unaudited, expressed in Canadian dollars)
17. FINANCE INCOME AND EXPENSES
| | Three months ended March 31, | |
($000s) | | 2011 | | 2010 | |
Finance expense | | | | | |
Interest on long-term debt | | 704 | | 555 | |
Interest on convertible debentures | | 645 | | 1,357 | |
Accretion on convertible debentures | | 352 | | 502 | |
Provisions: accretion on decommissioning liabilities | | 279 | | 281 | |
Finance expense | | $ | 1,980 | | $ | 2,695 | |
| | | | | | | |
18. PER SHARE AMOUNTS
The calculation of basic earnings per share at March 31, 2011 was based on a loss of $5.5 million (2010 profit: $4.0 million) and a weighted average number of common shares outstanding of 97,448,078 (2010: 88,212,802).
A total of 5,903,601 (2010: 4,133,533) share options and 9,821,429 (2010: 5,305,250) common shares issuable pursuant to the conversion of convertible debentures were excluded from the calculation for the three months ended March 31, 2011 as they were not dilutive.
19. COMMITMENTS
The Company is committed to payments under fixed term operating leases which do not currently provide for early termination. The Company’s commitment for office space is as follows:
($000s) | | Gross | | Expected | | Net | |
Year | | Amount | | Recoveries | | Amount | |
2011 | | $ | 1,652 | | $ | 771 | | $ | 881 | |
2012 | | 2,203 | | 1,062 | | 1,141 | |
2013 | | 2,218 | | 1,103 | | 1,115 | |
2014 | | 1,469 | | 753 | | 716 | |
| | | | | | | | | | |
As at March 31, 2011, Bellatrix committed to drill 8 gross (6.4 net) wells pursuant to farm-in agreements. Bellatrix expects to satisfy these drilling commitments at an estimated cost of approximately $20.9 million. In addition, on February 1, 2011, Bellatrix entered into a joint venture agreement which includes a minimum commitment for the Company to drill 3 gross (3.0 net) wells per year for 2011 to 2015 for a total estimated cost of approximately $52.5 million.
As a result of the issuance of the Flow-Through Shares on August 12, 2010, Bellatrix is committed to incur approximately $20.0 million in CEE on or before December 31, 2011. As of March 31, 2011, the Company has incurred approximately $2.5 million on CEE, reducing its remaining commitment to $17.5 million.
56
NOTES TO THE CONSOLIDATED FINANCIAL STATEMENTS
(unaudited, expressed in Canadian dollars)
20. FINANCIAL RISK MANAGEMENT
a. Credit risk
As at March 31, 2011, accounts receivable was comprised of the following:
| | Not Past Due | | Past Due | | | |
Aging ($000s) | | (less than 90 days) | | (90 days or more) | | Total | |
Joint venture and other trade accounts receivable | | 11,131 | | 2,727 | | 13,858 | |
Amounts due from government agencies | | 672 | | 1,137 | | 1,809 | |
Revenue and other accruals | | 18,186 | | 318 | | 18,504 | |
Cash call receivables | | — | | 607 | | 607 | |
Plant revenue allocation receivable | | — | | 2,855 | | 2,855 | |
Less: Allowance for doubtful accounts | | — | | (1,233 | ) | (1,233 | ) |
Total accounts receivable | | 29,989 | | 6,411 | | 36,400 | |
Less: | | | | | | | |
Accounts payable due to same partners | | (1,101 | ) | (148 | ) | (1,249 | ) |
Subsequent receipts | | (15,331 | ) | (1,618 | ) | (16,949 | ) |
| | 13,557 | | 4,645 | | 18,202 | |
Amounts due from government agencies include drilling royalty credits, Alberta Royalty Tax Credit, GST and royalty and other adjustments. Plant revenue allocation receivable includes amounts under dispute over plant revenue allocations, net of expenses, from an operator. The Company has commenced legal action for collection of these amounts. Accounts payable due to same partners includes amounts which may be available for offset against certain receivables.
Cash calls receivables consist of advances paid to joint interest partners for capital projects.
The carrying amount of accounts receivable and derivative assets represents the maximum credit exposure. The Company has an allowance for doubtful accounts as at March 31, 2011 of $1.2 million.
b. Liquidity risk
The following are the contractual maturities of financial liabilities as at March 31, 2011:
Financial Liability ($000s) | | < 1 Year | | 1-2 Years | | 2-5 Years | | Thereafter | |
Accounts payable and accrued liabilities (1) | | $ | 53,562 | | $ | — | | $ | — | | $ | — | |
Bank debt - principal (2) | | — | | 70,298 | | — | | — | |
Convertible debentures - principal | | — | | — | | 55,000 | | — | |
Convertible debentures - interest (3) | | 2,620 | | 2,612 | | 5,440 | | — | |
Finance lease obligation | | 375 | | 359 | | 973 | | 1,447 | |
Total | | $ | 56,557 | | $ | 73,269 | | $ | 61,413 | | $ | 1,447 | |
(1) As at March 31, 2011, $1.1 million of accrued coupon interest payable in relation to the 4.75% Debentures and $0.01 million of accrued interest payable in relation to the credit facilities is included in Accounts Payable and Accrued Liabilities.
(2) Bank debt is based on a revolving term which is reviewed annually and converts to a 366 day non-revolving facility if not renewed.
(3) The 4.75% Debentures outstanding at March 31, 2011 bear interest at a coupon rate of 4.75%, which currently requires total annual interest payments of $2.6 million.
Interest due on the bank credit facility is calculated based upon floating rates.
57
NOTES TO THE CONSOLIDATED FINANCIAL STATEMENTS
(unaudited, expressed in Canadian dollars)
c. Commodity price risk
Commodity price risk is the risk that the fair value or future cash flows will fluctuate as a result of changes in commodity prices. Commodity prices for petroleum and natural gas are impacted by not only the relationship between the Canadian and United States dollar, as outlined above, but also world economic events that dictate the levels of supply and demand.
The Company utilizes both financial derivatives and physical delivery sales contracts to manage commodity price risks. All such transactions are conducted in accordance with the commodity price risk management policy that has been approved by the Board of Directors.
The Company’s formal commodity price risk management policy permits management to use specified price risk management strategies including fixed price contracts, costless collars and the purchase of floor price options, other derivative financial instruments, and physical delivery sales contracts to reduce the impact of price volatility and ensure minimum prices for a maximum of eighteen months beyond the current date. The program is designed to provide price protection on a portion of the Company’s future production in the event of adverse commodity price movement, while retaining significant exposure to upside price movements. By doing this, the Company seeks to provide a measure of stability to cash flows from operating activities, as well as, to ensure Bellatrix realizes positive economic returns from its capital developments and acquisition activities.
As at March 31, 2011, the Company had entered into commodity price risk management arrangements as follows:
Type | | Period | | Volume | | Price Floor | | Price Ceiling | | Index | |
Oil fixed | | January 1, 2011 to Dec. 31, 2011 | | 1,000 bbl/d | | $ | 88.18 CDN | | $ | 88.18 CDN | | WTI | |
Oil fixed | | January 1, 2011 to Dec. 31, 2011 | | 500 bbl/d | | $ | 89.00 CDN | | $ | 89.00 CDN | | WTI | |
Oil fixed | | January 1, 2011 to Dec. 31, 2011 | | 500 bbl/d | | $ | 89.10 US | | $ | 89.10 US | | WTI | |
Oil fixed | | February 1, 2011 to Dec. 31, 2011 | | 500 bbl/d | | $ | 95.00 US | | $ | 95.00 US | | WTI | |
Oil fixed | | March 1, 2011 to Dec. 31, 2011 | | 500 bbl/d | | $ | 97.50 US | | $ | 97.50 US | | WTI | |
Oil call option | | January 1, 2012 to Dec. 31, 2012 | | 833 bbl/d | | — | | $ | 110.00 US | | WTI | |
Natural gas fixed | | April 1, 2011 to Oct. 31, 2011 | | 5,000 GJ/d | | $ | 3.87 CDN | | $ | 3.87 CDN | | AECO | |
Natural gas fixed | | April 1, 2011 to Oct. 31, 2011 | | 5,000 GJ/d | | $ | 3.65 CDN | | $ | 3.65 CDN | | AECO | |
Natural gas fixed | | April 1, 2011 to Oct. 31, 2011 | | 5,000 GJ/d | | $ | 3.805 CDN | | $ | 3.805 CDN | | AECO | |
Natural gas fixed | | April 1, 2011 to Oct. 31, 2011 | | 5,000 GJ/d | | $ | 3.80 CDN | | $ | 3.80 CDN | | AECO | |
Natural gas fixed | | May 1, 2011 to Oct. 31, 2011 | | 5,000 GJ/d | | $ | 6.30 CDN | | $ | 6.30 CDN | | AECO | |
For three months ended March 31, 2011 and 2010, the gain (loss) on commodity contracts was comprised of the following:
($000s) | | 2011 | | 2010 | |
Gain (loss) on commodity contracts | | | | | |
Realized (1) | | $ | (956 | ) | $ | 2,492 | |
Unrealized (2) | | (9,228 | ) | 7,256 | |
| | $ | (10,184 | ) | $ | 9,748 | |
(1) Realized gains and losses on commodity contracts represent actual cash settlements and other amounts paid under these contracts.
(2) Unrealized gains and losses on commodity contracts represent non-cash adjustments for changes in the fair value of these contracts during the period. The estimated fair values of the contracts have been determined on the amounts the Company would pay to terminate the contracts as at March 31, 2011 and 2010.
58
NOTES TO THE CONSOLIDATED FINANCIAL STATEMENTS
(unaudited, expressed in Canadian dollars)
d. Interest rate risk
The Company had no interest rate swap or financial contracts in place as at or during the three months ended March 31, 2011.
e. Capital management
The Company’s policy is to maintain a strong capital base so as to maintain investor, creditor and market confidence and to sustain the future development of the business. The Company manages its capital structure and makes adjustments to it in the light of changes in economic conditions and the risk characteristics of the underlying petroleum and natural gas assets. The Company considers its capital structure to include shareholders’ equity, bank debt, convertible debentures and working capital. In order to maintain or adjust the capital structure, the Company may from time to time issue common shares, issue convertible debentures, adjust its capital spending, and/or dispose of certain assets to manage current and projected debt levels.
The Company monitors capital based on the ratio of total net debt to annualized funds flow (the “ratio”). This ratio is calculated as total net debt, defined as outstanding bank debt, plus the liability component of convertible debentures, plus or minus working capital (excluding commodity contract assets and liabilities and deferred tax assets or liabilities), divided by funds flow from operations (cash flow from operating activities before changes in non-cash working capital and deductions for decommissioning costs) for the most recent calendar quarter, annualized (multiplied by four). The total net debt to annualized funds flow ratio may increase at certain times as a result of acquisitions, fluctuations in commodity prices, timing of capital expenditures and other factors. In order to facilitate the management of this ratio, the Company prepares annual capital expenditure budgets which are reviewed and updated as necessary depending on varying factors including current and forecast prices, successful capital deployment and general industry conditions. The annual and updated budgets are approved by the Board of Directors. Bellatrix does not pay dividends.
Subsequent to March 31, 2011 (note 21), Bellatrix closed an equity issuance on a bought deal basis to further the Company’s financial flexibility.
The Company’s long-term strategy is to target a total net debt to annualized funds flow ratio of 1.2 times. As at March 31, 2011 the Company’s ratio of total net debt to annualized funds flow based on first quarter results was 1.9 times. The total net debt to annualized funds flow ratio as at March 31, 2011 increased from that at March 31, 2010 of 1.8 times due an increase in total net debt resulting from the timing of the Company’s 2011 capital expenditure program, offset by higher annualized funds flow. Bellatrix expects the total net debt to annualized funds flow ratio to improve as a result of the May 2011 financing. The total net debt to annualized funds flow as at March 31, 2011, of 1.9 times increased in comparison to the ratio of 1.4 times as at December 31, 2010 as total net debt levels increased, offset by slightly higher annualized funds flow. Bellatrix continues to take a balanced approach to the priority use of funds flows. The 4.75% Debentures have a maturity date of April 30, 2015. Upon maturity, the Company may settle the principal in cash or issuance of additional common shares.
Excluding the 4.75% Debentures, net debt to annualized funds flow based on first quarter results was 1.2 times.
59
NOTES TO THE CONSOLIDATED FINANCIAL STATEMENTS
(unaudited, expressed in Canadian dollars)
Bellatrix’s capital structure and calculation of total net debt and total net debt to funds flow ratios as defined by the Company is as follows:
| | Three months ended March 31, | |
($000s, except where noted) | | 2011 | | 2010 | |
Shareholders’ equity | | 292,976 | | 285,901 | |
| | | | | |
Long-term debt | | 70,298 | | — | |
Convertible debentures (liability component) | | 47,951 | | 82,186 | |
Working capital (surplus) deficiency | | 11,921 | | (8,572 | ) |
Total net debt (1) at year end | | 130,170 | | 73,614 | |
| | | | | |
Debt to funds flow from operations ratio (annualized) (2) | | | | | |
Funds flow from operations (annualized) | | 68,108 | | 40,792 | |
Total net debt (1) to periods funds flow from operations ratio (annualized) | | 1.9x | | 1.8x | |
| | | | | |
Net debt (1) (excluding convertible debentures) at quarter end | | 82,219 | | — | |
Net debt to periods funds flow from operations ratio (annualized) | | 1.2x | | — | |
| | | | | |
Debt to funds flow from operations ratio (trailing) (3) | | | | | |
Funds flow from operations ratio trailing | | 59,871 | | 39,734 | |
Total net debt (1) to periods funds flow from operations trailing | | 2.2x | | 1.9x | |
| | | | | |
Net debt (1) (excluding convertible debentures) to funds flow from operations for the year | | 1.4x | | — | |
(1) | Net debt and total net debt are non-GAAP terms. Net debt includes the net working capital deficiency (excess) before short-term commodity contract assets and liabilities. Total net debt also includes the liability component of convertible debentures and excludes deferred liabilities, decommissioning liabilities and the deferred tax liability. |
(2) | Funds flow from operations is a non-GAAP term. Debt to funds flow from operations ratio annualized is calculated based upon fourth quarter funds flow from operations annualized. |
(3) | Trailing periods funds flow from operations is based on the twelve-months period ended March 31, 2011 and March 31, 2010. |
The Company’s credit facility is based on petroleum and natural gas reserves (see note 6). The credit facility outlines limitations on percentages of forecasted production, from external reserve engineer data, which may be hedged through financial commodity price risk management contracts.
f. Fair value of financial instruments
The Company’s financial instruments as at March 31, 2011 include accounts receivable, deposits, commodity contract asset, accounts payable and accrued liabilities, long-term debt and convertible debentures. The fair value of accounts receivable, deposits, accounts payable and accrued liabilities approximate their carrying amounts due to their short-terms to maturity.
The fair value of commodity contracts is determined by discounting the difference between the contracted price and published forward price curves as at the balance sheet date, using the remaining contracted petroleum and natural gas volumes. The fair value of commodity contracts as at March 31, 2011 was liability of $13.0 million (2010: $3.7 million). The commodity contracts are classified as level 2 within the fair value hierarchy.
Long-term bank debt bears interest at a floating market rate and the credit and market premiums therein are indicative of current rates; accordingly the fair market value approximates the carrying value.
The fair value of the convertible debentures of $64.0 million is based on exchange traded values. The convertible debentures are classified as level 1 within the fair value hierarchy.
60
NOTES TO THE CONSOLIDATED FINANCIAL STATEMENTS
(unaudited, expressed in Canadian dollars)
21. SUBSEQUENT EVENT
On May 11, 2011, Bellatrix closed an equity issuance of 9.8 million common shares on a bought deal basis at a price of $5.60 per share for gross proceeds of $55.0 million (net proceeds of $52.3 million after underwriter fees and before other closing costs). In addition, Bellatrix has granted to the underwriters an over-allotment option exercisable in whole or in part from time to time until 30 days following closing of the issuance to purchase up to an additional 1.5 million common shares at a price of $5.60 per common share for gross proceeds of $8.2 million (net proceeds of $7.8 million after underwriter fees). The net proceeds from this financing will be used to temporarily reduce outstanding indebtedness, thereby freeing up borrowing capacity that may be redrawn to fund the Company’s ongoing capital expenditures program and general corporate purposes.
22. TRANSITION TO INTERNATIONAL FINANCIAL REPORTING STANDARDS
On February 13, 2008 the CICA Accounting Standards Board announced that Canadian public reporting issuers will be required to report under IFRS, replacing Canadian GAAP for years beginning on or after January 1, 2011.
The adoption date of January 1, 2011 requires restatement for comparative purposes, of the Company’s opening balance sheet as at January 1, 2010, all interim quarterly periods in 2010 and for its year ended December 31, 2010.
The Company has prepared reconciliations of equity as at January 1, 2010, March 31, 2010 and December 31, 2010 and reconciliations of Total Comprehensive Income for the three months ended March 31, 2010 and the year ended December 31, 2010, using the accounting policies in note 3 and the following IFRS 1 - “First-time Adoption of International Financial Reporting Standards” (“IFRS 1”) exemptions:
Key First-time Adoption Exemptions Applied and Comparative Period Adjustments
IFRS 1 is the standard that governs mandatory exceptions and optional exemptions that an entity may elect for its transition to IFRS in order to assist the entity with the transition process. This standard is only applicable to the opening balance sheet of the entity on the transition date of January 1, 2010. All adjustments made as a result of adoption of IFRS are offset against Bellatrix’s January 1, 2010 deficit.
a. Business Combinations
An exemption under IFRS 1 provides the entity with relief on the restatement of business combinations prior to the transition date. Under IFRS 3 - “Business Combinations,” the determination of the fair value of share consideration differs from the determination under Canadian accounting standards. Any difference in the fair value calculation would have a resulting impact on the carrying amount of net assets acquired, non-controlling interest and any goodwill. The Company has taken advantage of this election, allowing Bellatrix to be exempt from restating business combinations prior to the transition date to IFRS.
b. Property, Plant and Equipment (“PP&E”)
The adopter has the option to elect fair value at the date of transition as the deemed cost for its PP&E or to use a revalued amount according to its previous Canadian GAAP if the revaluation, at the date of revaluation, is comparable to fair value or depreciated cost in accordance with IFRS or to measure oil and gas assets at the date of transition to IFRS at the amount previously determined under previous Canadian GAAP.
Bellatrix has elected to value its PP&E as previously determined by previous Canadian GAAP. The measurement upon transition to IFRS is as follows:
· | exploration and evaluation assets were reclassified from the full cost pool to exploration and evaluation (“E&E”) assets at the amount that was recorded under previous Canadian GAAP; and |
· | the remaining full cost pool was allocated to development and producing assets on a pro rata basis using reserve values for its proved plus probable company interest reserves. |
This resulted in $20.5 million in exploration and evaluation assets and $390.1 million in property, plant and equipment.
61
NOTES TO THE CONSOLIDATED FINANCIAL STATEMENTS
(unaudited, expressed in Canadian dollars)
c. Share Based Payments
Differences in the accounting for the Company’s share option plan under previous Canadian GAAP and IFRS exist. IFRS 2 - “Share-based Payments,” requires the Company to estimate the number of options expected to vest when a grant of equity instruments do not vest immediately. IFRS 2 does not allow the recognition of the expense on a straight-line basis and requires each installment to be treated as a separate arrangement. Under previous Canadian GAAP, the Company accounted for forfeitures as they occurred and recognized share-based compensation expense using the graded method, which is the method required under IFRS. IFRS 1 provides an elective exemption, which the Company has elected, which allows Bellatrix to apply IFRS 2 to the unvested options outstanding on transition date.
An adjustment of $0.05 million has been made on transition date to contributed surplus, with an offsetting entry to the January 1, 2010 deficit, as a result of applying this exemption.
As a result of applying IFRS 2, a reduction of share-based compensation of $0.07 million and $0.03 million has been made to the Statement of Comprehensive Income for the three months ended March 31, 2010 and the year ended December 31, 2010, respectively.
Due to differences in the accounting for share-based compensation under previous Canadian GAAP and IFRS, adjustments are required in the amount of capitalized share-based compensation. For the three months ended March 31, 2010, the Company capitalized $0.02 million less for share-based compensation under IFRS when compared to previous Canadian GAAP. For the year ended December 31, 2010, Bellatrix capitalized $0.3 million less under IFRS when compared to previous Canadian GAAP.
d. Decommissioning Liabilities
IAS 37 - “Provisions, Contingent Liabilities and Contingent Assets,” will govern how the Company accounts for its decommissioning liabilities (previously referred to as asset retirement obligations). The discount rate used for the decommissioning liability will be a risk free rate as the estimated provision is adjusted to reflect risks specific to the liability. Under previous Canadian GAAP, the Company used a credit-adjusted risk free rate. Therefore, under IFRS, the decommissioning liabilities are higher due to lower discount rates used. IFRS 1 provides an exemption that the Company has elected which allows Bellatrix to measure decommissioning liabilities as at the date of transition of January 1, 2010 to IFRS in accordance with IAS 37 and recognize directly in the Company’s deficit any difference between that amount and the carrying amount of those liabilities at the date of transition to IFRS determined under previous Canadian GAAP.
As a result of applying this exemption, an increase of $13.3 million has been made to decommissioning liabilities and Bellatrix’s deficit on January 1, 2010.
Under IFRS, the liability is to be re-measured each reporting period in order to reflect interest rates in effect at that time. As at March 31, 2010, Bellatrix re-measured the decommissioning liabilities based on an average increase in discount rates from 2.82% to 2.90% which decreased PP&E and decommissioning liabilities by $0.8 million. As a result of lower interest rates used for the discounting and unwinding of decommissioning liabilities, accretion expense for the three months ended March 31, 2010 decreased by $0.2 million when compared to accretion expense under previous GAAP.
As a result of re-measuring the decommissioning liabilities each reporting period, on a cumulative basis in 2010, PP&E and decommissioning liabilities decreased $0.2 million for the year ended December 31, 2010. The decrease in discount rates used under IFRS versus previous GAAP caused a decrease of $1.1 million in accretion expense for the year ended December 31, 2010.
62
NOTES TO THE CONSOLIDATED FINANCIAL STATEMENTS
(unaudited, expressed in Canadian dollars)
e. Depletion Policy
Previous GAAP provided specific guidelines on the depletion calculation for oil and natural gas properties. Depletion was calculated based on proved reserves. Under IFRS, the Company has a choice as to the reserve base to use for its depletion calculations. Bellatrix has adopted a policy of depleting its oil and natural gas properties using its proved plus probable reserve base. In addition, depletion calculations under previous GAAP were done on a cost centre basis, for which under previous GAAP, the Company only had one. Under IFRS, the Company is required to calculate depletion based on individual components for which the company has identified to be at the area level.
The adoption of this policy was effective January 1, 2010.
As a result of using proved plus probable reserves for its depletion calculation, depreciation and depletion expense decreased by $5.3 million and $24.8 million for the three months ended March 31, 2010 and the year ended December 31, 2010, respectively.
f. Impairment Test
IFRS requires an asset impairment test to be conducted on transition date and when indicators of impairment are present. Under previous GAAP, impairment of long-lived assets is assessed on the basis of an asset’s estimated undiscounted future cash flows compared with the asset’s carrying amount and if impairment is indicated, discounted cash flows are prepared to quantify the amount of impairment. The impairment test under previous GAAP is done at the cost centre level. Under previous GAAP, Bellatrix had one cost centre for impairment test purposes.
IFRS requires the impairment test to occur at the asset level or at the cash generating unit (“CGU”) level when long-lived assets exist that do not generate largely independent cash inflows. The carrying amount of the asset or CGU is compared to its recoverable amount which is the higher of value in use or fair value less costs to sell.
Bellatrix performed an impairment test on transition to IFRS on January 1, 2010 based on fair value less costs to sell. Fair value less costs to sell was based on merger and acquisition transactions on oil and gas properties similar to those owned by Bellatrix. The Company experienced transitional write-downs on its non-core and certain heavy oil properties with an offsetting entry to Bellatrix’s January 1, 2010 deficit.
Based on the assessment, the carrying amount of the following CGU’s were impaired, with an offsetting entry to the January 1, 2010 deficit:
($000s) | | | | | |
Cash Generating Unit | | Product (1) | | Transitional Impairment (2) | |
South East Alberta | | 100% Natural Gas | | $ | 5,366 | |
North East Alberta | | 89% Natural Gas | | 10,895 | |
Meekwap | | 75% Oil and NGL’s | | 4,093 | |
Saskatchewan | | 100% Heavy Oil | | 23,441 | |
Total | | | | $ | 43,795 | |
(1) Based on 2009 year end proved and probable reserves.
(2) Includes impairment related to corporate assets assigned to each CGU on a pro-rata basis.
Due to the continued weakening of natural gas prices, Bellatrix performed impairment tests on its oil and gas properties for all of the quarterly reporting periods in 2010. Fair value less costs to sell was used as the recoverable amount, using market transactions and the company’s proved and probable reserves.
63
NOTES TO THE CONSOLIDATED FINANCIAL STATEMENTS
(unaudited, expressed in Canadian dollars)
The following impairments and impairment reversals were recorded in 2010:
($000s) | | | | | |
Cash Generating Unit | | Product (1) | | Impairment (Reversal)(2) | |
Meekwap | | 75% Oil and NGL’s | | $ | 336 | |
Meekwap | | 70% Oil and NGL’s | | 1,286 | |
South East Alberta | | 100% Natural Gas | | 4,988 | |
North East Alberta | | 81% Natural Gas | | (9,848 | ) |
Total reversal | | | | $ | (3,238 | ) |
(1) Based on applicable year end proved and probable reserves.
(2) Includes impairment (reversal) related to corporate assets assigned to each CGU on a pro-rata basis.
Natural gas properties were further impaired in 2010, as well as another non-core oil property. Bellatrix experienced an impairment reversal in the fourth quarter of 2010 in its North East AB CGU as recent transactions in the CGU have increased the fair value of the properties written down on transition. In the case of an impairment reversal, the carrying amount of the asset or CGU is limited to the original carrying amount less depreciation, depletion and amortization as if no impairment had been recognized for the asset or CGU for prior periods.
g. Asset Divestitures
Under previous GAAP, proceeds of a divestiture are deducted from the country cost centre pool without recognition of a gain or loss unless such a deduction resulted in a change to the depletion rate of 20% or greater. Under IFRS, proceeds of a divestiture are deducted from the carrying value of the asset and a gain or loss is recognized in earnings.
As a result of divestitures during 2010, including property swaps and prior period adjustments relating to divested properties, Bellatrix recognized a loss on dispositions of $0.3 million for the three months ended March 31, 2010 and a net gain on dispositions of $1.4 million for the year ended December 31, 2010.
h. Flow-through Shares
Under previous GAAP, the accounting treatment of flow-through shares was addressed by EIC 146 “Flow-Through Shares”. Under previous GAAP, the proceeds received for the flow-through shares are credited to shareholders’ capital and the deferred tax liability is recognized when the Company files the renouncement documents with the tax authorities to renounce the tax credits associated with the expenditures.
Under IFRS, Bellatrix set up a liability for the difference between the proceeds received and the market price of the shares on the date of the transaction (the “premium”). As the expenditures are made, Bellatrix will record the related tax liability associated with the renouncement of the tax benefits and remove the deferred liability originally set up. The difference between the deferred tax liability and the original liability set up will go through profit or loss.
As a result of the issuance of Flow-Through Shares in the third quarter of 2010, the Company set up a deferred liability of $3.7 million with an offsetting adjustment to share capital. No qualifying CEE was made in 2010.
i. Convertible Debentures
Convertible debentures have both a debt and equity component under IFRS and previous GAAP. As a consequence of the Company having status as an income trust in 2009, and no IFRS 1 exemption related to the conversion feature of convertible debentures for trust units, the Company has treated the 7.5% debentures as a financial derivative instrument (the “instrument”). As a result, the fair value of the instrument was determined to be nil. The offsetting entry was made to share capital as a result of the Company’s deficit elimination effective November 1, 2009. In addition, this IFRS difference has caused a $1.6 million increase to the Company’s deficit as a result of the 7.5% Debenture redemption in the second quarter of 2010, as opposed to the $2.9 million reduction in the deficit under previous GAAP.
64
NOTES TO THE CONSOLIDATED FINANCIAL STATEMENTS
(unaudited, expressed in Canadian dollars)
Also, the allocation of deferred tax on the convertible debentures differs under previous GAAP and IFRS. Under previous GAAP, the tax basis of the liability is considered to be the same as its carrying amount; therefore, no temporary difference exists. IFRS does not contain this special exemption and requires the temporary difference to be recognized. The deferred tax adjustment is charged directly to the carrying amount of the equity component of the convertible debentures.
Bellatrix recorded a deferred tax adjustment of $0.5 million related to its 7.5% Debentures on transition to IFRS with an offsetting entry to the January 1, 2010 deficit.
Upon the issuance of its 4.75% Debentures in the second quarter of 2010, the Company recognized an adjustment of $1.5 million to the equity component of its 4.75% Debentures with an offsetting entry to the deferred tax asset.
j. Income Taxes
IFRS does not use the terminology of future income taxes; IFRS refers to deferred income taxes.
Under IFRS, all tax assets and liabilities must be classified as non-current. All of the recognized IFRS conversion adjustments as discussed in this transition note have related effects on deferred taxes. The tax impact of the above changes increased (decreased) the deferred tax asset as follows:
| | | | For the year ended | | As at | |
($000s) | | January 1, 2010 | | December 31, 2010 | | December 31, 2010 | |
Impairment (reversal) of assets | | $ | 11,251 | | $ | (908 | ) | $ | 10,343 | |
Depletion and depreciation | | — | | (7,033 | ) | (7,033 | ) |
Convertible debentures | | (491 | ) | (864 | ) | (1,355 | ) |
Decommissioning liabilities | | 3,434 | | (308 | ) | 3,126 | |
Gain on property dispositions | | — | | 399 | | 399 | |
Increase in deferred tax asset | | $ | 14,194 | | $ | (8,714 | ) | $ | 5,480 | |
k. Presentation
Certain presentation and classification differs under IFRS in comparison with the Company’s previous GAAP as follows:
· Interest and finance charges - the net finance income or expense is presented separately from operating expenses. These charges also include the unwinding of the discount rate on decommissioning liabilities that were presented as part of depletion, depreciation and accretion under previous GAAP.
· Deferred income taxes - all tax assets and liabilities are classified as non-current. The amount of income taxes paid during a period must be disclosed on the face of the statements of cash flows instead of within the notes to the financial statements.
· Loans and borrowings - the cash inflow and outflow associated with loans and borrowings have been disclosed separately on the statements of cash flows. Previously, the Company netted these amounts.
· No material changes have occurred in the Consolidated Statements of Cash Flows as a result of the adoption of IFRS.
65
RECONCILIATION OF EQUITY
(Date of Transition to IFRS) (unaudited)
| | | | Effect of | | | |
| | Previous | | transition to | | | |
As at January 1, 2010 ($000s) | | GAAP | | IFRS | | IFRS | |
ASSETS | | | | | | | |
Current assets | | | | | | | |
Accounts receivable | | $ | 20,722 | | $ | — | | $ | 20,722 | |
Deposits and prepaid expenses | | 4,940 | | — | | 4,940 | |
Commodity contract asset | | 3,374 | | — | | 3,374 | |
| | 29,036 | | — | | 29,036 | |
Exploration and evaluation assets | | — | | 20,542 | | 20,542 | |
Property, plant and equipment | | 410,566 | | | | 346,229 | |
Transfer to exploration and evaluation assets (note b) | | | | (20,542 | ) | | |
Transitional impairment to property, plant and equipment (note f) | | | | (43,795 | ) | | |
Deferred taxes | | 1,368 | | | | 14,602 | |
Re-class from current liabilities (note k) | | | | (960 | ) | | |
Due to transitional adjustments (note j) | | 14,194 | | | | | |
Total assets | | $ | 440,970 | | $ | (30,561 | ) | $ | 410,409 | |
| | | | | | | |
LIABILITIES | | | | | | | |
Current liabilities | | | | | | | |
Accounts payable and accrued liabilities | | $ | 23,345 | | $ | — | | $ | 23,345 | |
Deferred taxes (note k) | | 960 | | (960 | ) | — | |
| | 24,305 | | (960 | ) | 23,345 | |
| | | | | | | |
Long-term debt | | 27,902 | | — | | 27,902 | |
Convertible debentures | | 81,684 | | — | | 81,684 | |
Decommissioning liabilities (note d) | | 25,728 | | 13,273 | | 39,001 | |
Total liabilities | | 159,619 | | 12,313 | | 171,932 | |
| | | | | | | |
SHAREHOLDERS’ EQUITY | | | | | | | |
Shareholders’ capital (note i) | | 252,592 | | 5,037 | | 257,629 | |
Equity component of convertible debentures (note i) | | 5,037 | | (5,037 | ) | — | |
Contributed surplus (note c) | | 28,232 | | (46 | ) | 28,186 | |
Deficit | | (4,510 | ) | (42,828 | ) | (47,338 | ) |
Total shareholders’ equity | | 281,351 | | (42,874 | ) | 238,477 | |
Total liabilities and shareholders’ equity | | $ | 440,970 | | $ | (30,561 | ) | $ | 410,409 | |
66
RECONCILIATION OF EQUITY
(unaudited)
| | | | Effect of | | | |
| | Previous | | transition to | | | |
As at March 31, 2010 ($000s) | | GAAP | | IFRS | | IFRS | |
ASSETS | | | | | | | |
Current assets | | | | | | | |
Cash and cash equivalents | | $ | 8,997 | | $ | — | | $ | 8,997 | |
Accounts receivable | | 25,376 | | | | 25,376 | |
Deposits and prepaid expenses | | 3,553 | | — | | 3,553 | |
Commodity contract asset | | 10,630 | | — | | 10,630 | |
| | 48,556 | | — | | 48,556 | |
Exploration and evaluation assets | | — | | 20,490 | | 20,490 | |
Property, plant and equipment | | 413,945 | | | | 354,641 | |
Transfer to exploration and evaluation assets (note b) | | | | (20,490 | ) | | |
Transitional impairment to property, plant and equipment (note f) | | | | (43,795 | ) | | |
Q1 2010 adjustments (notes c, d, e, g) | | | | 4,981 | | | |
Deferred taxes | | 3,296 | | | | 13,277 | |
Re-class from current liabilities (note k) | | | | (3,020 | ) | | |
Due to transitional adjustments (note j) | | | | 14,194 | | | |
Q1 2010 adjustments | | | | (1,193 | ) | | |
Total assets | | $ | 465,797 | | $ | (28,833 | ) | $ | 436,964 | |
| | | | | | | |
LIABILITIES | | | | | | | |
Current liabilities | | | | | | | |
Accounts payable and accrued liabilities | | $ | 29,354 | | $ | — | | $ | 29,354 | |
Deferred taxes (note g and h) | | 3,020 | | (3,020 | ) | — | |
| | 32,374 | | (3,020 | ) | 29,354 | |
Convertible debentures | | 82,186 | | — | | 82,186 | |
Decommissioning liabilities | | 26,480 | | | | 39,523 | |
Opening adjustment (note d) | | | | 13,273 | | | |
Q1 2010 adjustments (note d) | | | | (230 | ) | | |
Total liabilities | | 141,040 | | 10,023 | | 151,063 | |
| | | | | | | |
SHAREHOLDERS’ EQUITY | | | | | | | |
Shareholders’ capital (note i) | | 295,846 | | 5,037 | | 300,883 | |
Equity component of convertible debentures (note i) | | 5,037 | | (5,037 | ) | — | |
Contributed surplus | | 28,377 | | | | 28,387 | |
Opening adjustment (note c) | | | | (46 | ) | | |
Q1 2010 adjustment (note c) | | | | 56 | | | |
Deficit | | (4,503 | ) | | | (43,369 | ) |
Opening adjustment | | | | (42,828 | ) | | |
Q1 2010 adjustments to profit | | | | 3,962 | | | |
Total shareholders’ equity | | 324,757 | | (38,856 | ) | 285,901 | |
Total liabilities and shareholders’ equity | | $ | 465,797 | | $ | (28,833 | ) | $ | 436,964 | |
67
RECONCILIATION OF EQUITY
(unaudited)
| | | | Effect of | | | |
| | Previous | | transition to | | | |
As at December 31, 2010 ($000s) | | GAAP | | IFRS | | IFRS | |
ASSETS | | | | | | | |
Current assets | | | | | | | |
Accounts receivable | | $ | 39,500 | | $ | — | | $ | 39,500 | |
Deposits and prepaid expenses | | 4,619 | | — | | 4,619 | |
Deferred taxes (note g) | | 989 | | (989 | ) | — | |
| | 45,108 | | (989 | ) | 44,119 | |
Exploration and evaluation assets | | — | | 18,535 | | 18,535 | |
Property, plant and equipment | | 433,697 | | | | 399,580 | |
Transfer to exploration and evaluation assets (note b) | | | | (18,535 | ) | | |
Transitional impairment to property, plant and equipment (note f) | | | | (43,795 | ) | | |
2010 adjustments (notes c, d, e, g) | | | | 28,213 | | | |
Deferred taxes (note g) | | 8,351 | | | | 14,820 | |
Re-class from current assets (note k) | | | | 989 | | | |
Due to transitional adjustments (note j) | | | | 14,194 | | | |
2010 adjustments | | | | (8,714 | ) | | |
Total assets | | $ | 487,156 | | $ | (10,102 | ) | 477,054 | |
| | | | | | | |
LIABILITIES | | | | | | | |
Current liabilities | | | | | | | |
Accounts payable and accrued liabilities | | $ | 42,792 | | $ | — | | $ | 42,792 | |
Current portion of capital lease obligation | | 146 | | — | | 146 | |
Commodity contract liability | | 3,732 | | — | | 3,732 | |
| | 46,670 | | — | | 46,670 | |
Deferred liability, flow-through shares (note h) | | — | | 3,768 | | 3,768 | |
Long-term debt | | 41,172 | | — | | 41,172 | |
Convertible debentures | | 47,599 | | — | | 47,599 | |
Capital lease obligation | | 1,443 | | — | | 1,443 | |
Decommissioning liabilities | | 27,483 | | — | | 38,710 | |
Opening adjustment (note d) | | | | 13,273 | | | |
2010 adjustments (note d) | | | | (2,046 | ) | | |
Total liabilities | | 164,367 | | 14,995 | | 179,362 | |
| | | | | | | |
SHAREHOLDERS’ EQUITY | | | | | | | |
Shareholders’ capital | | 315,510 | | | | 316,779 | |
Opening adjustment (note i) | | | | 5,037 | | | |
Flow-through shares (note h) | | | | (3,768 | ) | | |
Equity component of convertible debentures | | 5,881 | | — | | 4,378 | |
Opening adjustment (note i) | | | | (5,037 | ) | | |
2010 adjustments (note i) | | | | 3,534 | | | |
Contributed surplus (note c) | | 30,526 | | — | | 30,489 | |
Opening adjustment (note c) | | | | (46 | ) | | |
2010 adjustment (note c) | | | | 9 | | | |
Deficit | | (29,128 | ) | — | | (53,954 | ) |
Opening adjustment | | | | (42,828 | ) | | |
Adjustment for repurchase of 7.5% Debentures (note i) | | | | (4,546 | ) | | |
2010 adjustments to profit | | | | 22,548 | | | |
Total shareholders’ equity | | 322,789 | | (25,097 | ) | 297,692 | |
Total liabilities and shareholders’ equity | | $ | 487,156 | | $ | (10,102 | ) | $ | 477,054 | |
68
RECONCILIATION OF TOTAL COMPREHENSIVE INCOME
(unaudited, expressed in Canadian dollars)
| | | | Effect of | | | |
| | Previous | | transition to | | | |
For the three months ended March 31, 2010 ($000s) | | GAAP | | IFRS | | IFRS | |
REVENUES | | | | | | | |
Petroleum and natural gas sales | | $ | 26,929 | | $ | (547 | ) | $ | 26,382 | |
Other income | | | | 547 | | 547 | |
Royalties | | (5,250 | ) | — | | (5,250 | ) |
Total revenues | | 21,679 | | | | 21,679 | |
Gain on commodity contracts (note k) | | 9,748 | | — | | 9,748 | |
| | 31,427 | | — | | 31,427 | |
EXPENSES | | | | | | | |
Production | | 8,717 | | — | | 8,717 | |
Transportation | | 808 | | — | | 808 | |
General and administrative | | 2,536 | | — | | 2,536 | |
Interest and financing charges (note k) | | 2,414 | | (2,414 | ) | — | |
Share-based compensation (note c) | | 120 | | 72 | | 192 | |
Depletion and depreciation and accretion | | 15,976 | | — | | 10,146 | |
Q1 2010 depletion and depreciation adjustments (note e) | | | | (5,318 | ) | | |
Re-class of unwinding of decommissioning liabilities (note k) | | | | (512 | ) | | |
Loss on dispositions (note g) | | — | | 322 | | 322 | |
| | 30,571 | | (7,850 | ) | 22,721 | |
| | | | | | | |
NET PROFIT BEFORE FINANCE AND TAXES | | 856 | | 7,850 | | 8,706 | |
| | | | | | | |
Finance expenses | | | | | | 2,695 | |
Interest and financing charges (note k) | | — | | 2,414 | | | |
Unwinding of decommissioning liabilities (note d,k) | | | | 281 | | | |
NET PROFIT BEFORE TAXES | | 856 | | 5,155 | | 6,011 | |
| | | | | | | |
TAXES | | | | | | | |
Deferred tax expense (note j) | | 849 | | 1,193 | | 2,042 | |
NET PROFIT AND COMPREHENSIVE INCOME | | 7 | | 3,962 | | 3,969 | |
| | | | | | | | | | |
69
RECONCILIATION OF TOTAL COMPREHENSIVE INCOME
(unaudited, expressed in Canadian dollars)
| | | | Effect of | | | |
| | Previous | | transition to | | | |
For the year ended December 31, 2010 ($000s) | | GAAP | | IFRS | | IFRS | |
REVENUES | | | | | | | |
Petroleum and natural gas sales | | $ | 117,673 | | $ | (1,997 | ) | $ | 115,676 | |
Other income | | | | 1,997 | | 1,997 | |
Royalties | | (22,914 | ) | — | | (22,914 | ) |
Total revenues | | 94,759 | | — | | 94,759 | |
Gain on commodity contracts (note k) | | 8,282 | | — | | 8,282 | |
| | 103,041 | | — | | 103,041 | |
EXPENSES | | | | | | | |
Production | | 37,964 | | — | | 37,964 | |
Transportation | | 3,723 | | — | | 3,723 | |
General and administrative | | 9,414 | | — | | 9,414 | |
Interest and financing charges (note k) | | 7,403 | | (7,403 | ) | — | |
Share-based compensation (note c) | | 1,618 | | 31 | | 1,649 | |
Depletion and depreciation and accretion | | 74,856 | | | | 47,901 | |
2010 depletion and depreciation adjustments (note e) | | | | (24,801 | ) | | |
Re-class of unwinding of decommissioning liabilities (note k) | | | | (2,154 | ) | | |
Provision for uncollectible accounts | | 250 | | — | | 250 | |
Loss on redemption of 7.5% Debentures | | 3,514 | | — | | 3,514 | |
Writedown (reversal) of property, plant and equipment (note i) | | — | | (3,238 | ) | (3,238 | ) |
Net gain on dispositions (note g) | | — | | (1,425 | ) | (1,425 | ) |
| | 138,742 | | (38,990 | ) | 99,752 | |
| | | | | | | |
NET INCOME (LOSS) BEFORE FINANCE AND TAXES | | (35,701 | ) | 38,990 | | 3,289 | |
| | | | | | | |
Finance expenses | | — | | | | 8,465 | |
Interest and financing charges (note k) | | | | 7,403 | | | |
Unwinding of decommissioning liabilities (note d,k) | | | | 1,062 | | | |
NET LOSS BEFORE TAXES | | (35,701 | ) | 30,525 | | (5,176 | ) |
| | | | | | | |
TAXES | | | | | | | |
Deferred tax expense (note j) | | (8,168 | ) | 7,977 | | (191 | ) |
NET LOSS AND COMPREHENSIVE LOSS | | (27,533 | ) | 22,548 | | (4,985 | ) |
| | | | | | | | | | |
70
| | | | CORPORATE INFORMATION |
| | | | |
BOARD OF DIRECTORS | | OFFICERS | | BANKERS |
| | | | |
W.C. (Mickey) Dunn, Chairman | | Raymond G. Smith, P. Eng. | | National Bank of Canada |
Independent Businessman | | President and CEO | | Alberta Treasury Branches |
Edmonton, Alberta | | | | |
| | Edward J. Brown, CA | | EVALUATION ENGINEERS |
John H. Cuthbertson, Q.C. | | Vice President, Finance and CFO | | |
Partner | | | | GLJ Petroleum Consultants |
Burnet, Duckworth & Palmer LLP | | Ving Y. Woo, P. Eng. | | |
Calgary, Alberta | | Vice President, Engineering and COO | | REGISTRAR AND TRANSFER AGENT |
| | | | |
Murray B. Todd, B. Sc., P. Eng. | | Russell G. Oicle, P. Geol. | | Computershare Trust Company of Canada |
President | | Vice President, Exploration | | |
Canada Hibernia Holding Corporation | | | | HEAD OFFICE |
Calgary, Alberta | | Timothy A. Blair | | 
|
| | Vice President, Land | |
Raymond G. Smith, P. Eng. | | | |
President and CEO | | STOCK EXCHANGE LISTING | |
Bellatrix Exploration Ltd. | | | | |
Palm Desert, California | | The Toronto Stock Exchange | | 2300, 530 - 8th Avenue S.W. |
| | Trading symbol: BXE | | Calgary, Alberta, Canada T2P 3S8 |
Murray L. Cobbe | | Debentures: BXE.DB.A | | Phone: (403) 266-8670 |
Executive Chairman | | | | Fax: (403) 264-8163 |
Trican Well Service Ltd. | | LEGAL COUNSEL | | Email: general.info@bellatrixexp.com |
Calgary, Alberta | | | | Website: www.bellatrixexploration.com |
| | Burnet, Duckworth & Palmer LLP | | |
Doug Baker, FCA | | | | |
Independent Businessman | | AUDITORS | | |
Calgary, Alberta | | | | |
| | KPMG LLP | | |
Keith E. Macdonald, CA | | | | |
Independent Businessman | | | | |
Calgary, Alberta | | | | |
| | | | |
Melvin M. Hawkrigg, BA, FCA, LL.D (Hon.) | | |
Chairman | | | | |
Orlick Industries Limited | | | | |
Waterdown, Ontario | | | | |
| | | | |
Robert A. Johnson, P. Geol. | | | | |
Independent Businessman | | | | |
Calgary, Alberta | | | | |
74

2300, 530 - 8th Avenue S.W.
Calgary, Alberta, Canada T2P 3S8
Phone: (403) 266-8670
Fax: (403) 264-8163
www.bellatrixexploration.com