Exhibit 99.50

For Immediate Release
TSX: BXE
BELLATRIX EXPLORATION LTD. ANNOUNCES YEAR END 2011 FINANCIAL RESULTS
March 8, 2012 — (TSX: BXE) Bellatrix Exploration Ltd. (“Bellatrix” or the “Company”) announces its financial and operating results for the year ended December 31, 2011.
Forward-Looking Statements
This press release, including the report to shareholders, contains forward-looking statements. Please refer to our cautionary language on forward-looking statements and the other matters set forth at the beginning of the management’s discussion and analysis (the “MD&A”) attached to this press release.
Effective January 1, 2011, Bellatrix began reporting its financial results in accordance with International Financial Reporting Standards (“IFRS”). Prior year comparative amounts have been restated to reflect results as if Bellatrix had always prepared its financial results using IFRS. Please see additional discussion regarding IFRS later in this press release.
HIGHLIGHTS
| | Years ended December 31, | |
| | 2011 | | 2010 | |
FINANCIAL (unaudited) | | | | | |
(CDN$000s except share and per share amounts) | | | | | |
Revenue (before royalties and risk management (1)) | | 202,318 | | 117,673 | |
Funds flow from operations (2) | | 94,237 | | 53,042 | |
Per basic share (6) | | $ | 0.91 | | $ | 0.57 | |
Per diluted share (6) | | $ | 0.84 | | $ | 0.54 | |
Cash flow from operating activities | | 98,192 | | 44,272 | |
Per basic share (6) | | $ | 0.95 | | $ | 0.47 | |
Per diluted share (6) | | $ | 0.87 | | $ | 0.46 | |
Net profit (loss) before non-cash impairment loss and unrealized loss on commodity contracts (5) | | 18,403 | | (2,084 | ) |
Per basic share (6) | | $ | 0.18 | | $ | (0.02 | ) |
Per diluted share (6) | | $ | 0.17 | | $ | (0.02 | ) |
Net loss (8) | | (5,949 | ) | (4,985 | ) |
Per basic share (6) | | $ | (0.06 | ) | $ | (0.05 | ) |
Per diluted share (6) | | $ | (0.06 | ) | $ | (0.05 | ) |
Exploration and development | | 175,495 | | 98,387 | |
Corporate and property acquisitions | | 4,066 | | 8,361 | |
Capital expenditures — cash | | 179,561 | | 106,748 | |
Property dispositions — cash | | (4,203 | ) | (14,567 | ) |
Non-cash items | | 10,575 | | 1,027 | |
Total capital expenditures — net | | 185,933 | | 93,208 | |
Long-term debt | | 56,701 | | 41,172 | |
Convertible debentures (3) | | 49,076 | | 47,599 | |
Adjusted working capital deficiency (surplus) | | 13,473 | | (1,327 | ) |
Total net debt (3) | | 119,250 | | 87,444 | |
Total assets (8) | | 580,422 | | 477,054 | |
Shareholders’ equity (8) | | 348,405 | | 297,692 | |
1
| | | | Years ended December 31, | |
OPERATING | | | | 2011 | | 2010 | |
| | | | | | | |
Average daily sales volumes | | | | | | | |
Crude oil, condensate and NGLs | | (bbls/d) | | 4,540 | | 2,550 | |
Natural gas | | (mcf/d) | | 44,484 | | 35,814 | |
Total oil equivalent | | (boe/d) | | 11,954 | | 8,519 | |
Average prices | | | | | | | |
Light crude oil and condensate | | ($/bbl) | | 92.51 | | 76.25 | |
NGLs | | ($/bbl) | | 53.54 | | 39.81 | |
Heavy oil | | ($/bbl) | | 68.23 | | 60.50 | |
Crude oil, condensate and NGLs | | ($/bbl) | | 83.89 | | 65.47 | |
Crude oil, condensate and NGLs (including risk management (1)) | | ($/bbl) | | 81.47 | | 66.59 | |
Natural gas | | ($/mcf) | | 3.77 | | 4.19 | |
Natural gas (including risk management (1)) | | ($/mcf) | | 4.05 | | 5.28 | |
Total oil equivalent | | ($/boe) | | 45.88 | | 37.20 | |
Total oil equivalent (including risk management (1)) | | ($/boe) | | 46.01 | | 42.15 | |
| | | | | | | |
Statistics | | | | | | | |
Operating netback (4) | | ($/boe) | | 25.09 | | 16.42 | |
Operating netback (4) (including risk management (1)) | | ($/boe) | | 25.22 | | 21.37 | |
Transportation | | ($/boe) | | 1.31 | | 1.20 | |
Production expenses | | ($/boe) | | 11.53 | | 12.21 | |
General & administrative | | ($/boe) | | 2.83 | | 3.03 | |
Royalties as a % of sales after Transportation | | | | 18% | | 20% | |
| | | | | | | |
COMMON SHARES | | | | | | | |
Common shares outstanding | | | | 107,407,241 | | 97,446,026 | |
Share options outstanding | | | | 7,985,320 | | 5,823,377 | |
Shares issuable on conversion of convertible debentures (7) | | | | 9,821,429 | | 9,821,429 | |
Diluted common shares outstanding | | | | 125,213,990 | | 113,090,832 | |
Diluted weighted average shares — net profit (loss) (6) | | | | 103,857,689 | | 93,286,554 | |
Diluted weighted average shares — funds flow from operations and cash flow from operating activities (2) (6) | | | | 116,046,595 | | 101,232,086 | |
| | | | Years ended December 31, | |
SHARE TRADING STATISTICS | | 2011 | | 2010 | |
(CDN$, except volumes) based on intra-day trading | | | | | |
High | | 6.19 | | 5.05 | |
Low | | 3.15 | | 2.53 | |
Close | | 4.91 | | 4.80 | |
Average daily volume | | 522,047 | | 544,435 | |
(1) The Company has entered into various commodity price risk management contracts which are considered to be economic hedges. Per unit metrics after risk management include only the realized portion of gains or losses on commodity contracts.
The Company does not apply hedge accounting to these contracts. As such, these contracts are revalued to fair value at the end of each reporting date. This results in recognition of unrealized gains or losses over the term of these contracts which is reflected each
2
reporting period until these contracts are settled, at which time realized gains or losses are recorded. These unrealized gains or losses on commodity contracts are not included for purposes of per unit metrics calculations disclosed.
(2) The highlights section contains the term “funds flow from operations” which should not be considered an alternative to, or more meaningful than cash flow from operating activities as determined in accordance with generally accepted accounting principles (“GAAP”) as an indicator of the Company’s performance. Therefore reference to diluted funds flow from operations or funds flow from operations per share may not be comparable with the calculation of similar measures for other entities. Management uses funds flow from operations to analyze operating performance and leverage and considers funds flow from operations to be a key measure as it demonstrates the Company’s ability to generate the cash necessary to fund future capital investments and to repay debt. The reconciliation between cash flow from operating activities and funds flow from operations can be found in the MD&A. Funds flow from operations per share is calculated using the weighted average number of common shares for the period.
(3) Net debt and total net debt are considered non-GAAP terms. The Company’s calculation of total net debt includes the liability component of convertible debentures and excludes deferred liabilities, long-term commodity contract liabilities, decommissioning liabilities, long-term finance lease obligations and the deferred tax liability. Net debt and total net debt include the net working capital deficiency (excess) before short-term commodity contract assets and liabilities and current finance lease obligations. Net debt also excludes the liability component of convertible debentures. A reconciliation between total liabilities under GAAP and total net debt and net debt as calculated by the Company is found in the MD&A.
(4) Operating netbacks is considered a non-GAAP term. Operating netbacks are calculated by subtracting royalties, transportation, and operating costs from revenues before other income.
(5) Net profit (loss) before non-cash impairment loss and unrealized loss on commodity contracts is considered a non-GAAP term. Net profit (loss) before non-cash impairment loss and unrealized loss on commodity contracts is calculated as net profit (loss) per the Consolidated Statement of Comprehensive Income, excluding the impairment loss (reversal) on property, plant and equipment and unrealized loss on commodity contracts, net of deferred tax impacts on each item. The Company’s reconciliation between the net loss and net profit (loss) before non-cash impairment loss and unrealized loss on commodity contracts is found in the MD&A.
(6) Basic weighted average shares for the year ended December 31, 2011 were 103,857,689 (2010: 93,286,554).
In computing weighted average diluted earnings per share for the year ended December 31, 2011 a total of 7,985,320 (2010: 5,823,377) share options and a total of 9,821,429 (2010: 9,821,429) common shares issuable on conversion of convertible debentures were excluded from the calculation as they were not dilutive.
In computing weighted average diluted net profit (loss) before non-cash impairment loss and unrealized loss on commodity contracts per share for the year ended December 31, 2011, a total of 2,367,477 common shares were added to the denominator as a consequence of applying the treasury stock method to the Company’s outstanding share options as they were dilutive, and a total of 9,821,429 common shares issuable on conversion of convertible debentures were excluded from the denominator as they were not dilutive, resulting in diluted weighted average shares of 106,225,166. For the year ended December 31, 2010, a total of 5,823,377 common shares and 9,821,429 common shares issuable on conversion of convertible debentures were excluded from the calculation as they were not dilutive.
In computing weighted average diluted cash flow from operating activities and funds flow from operations for the year ended December 31, 2011 a total of 2,367,477 (2010: 1,083,985) common shares were added to the denominator as a consequence of applying the treasury stock method to the Company’s outstanding share options and a total of 9,821,429 (2010: 6,861,546) common shares issuable on conversion of convertible debentures were also added to the denominator as they were dilutive, resulting in diluted weighted average common shares of 116,046,595 (2010: 101,232,085). As a consequence, a total of $3.0 million (2010: $2.0 million) for interest accretion expense (net of income tax effect) was added to the numerator.
(7) Shares issuable on conversion of convertible debentures are calculated by dividing the $55.0 million principal amount of the convertible debentures by the conversion price of $5.60 per share.
(8) As of January 1, 2011, Bellatrix prepares its consolidated financial statements in accordance with IFRS, IFRS 1 - First-time adoption of International Financial Reporting Standards (“IFRS 1”) and International Accounting Standard 34 - Interim Financial Reporting, as issued by the International Accounting Standards Board. Previously, Bellatrix’s financial statements were prepared in accordance with Canadian generally accepted accounting principles (“previous GAAP”). Reconciliations between previous GAAP and IFRS financial information can be found in the consolidated financial statements for the year ended December 31, 2011.
3
REPORT TO SHAREHOLDERS
Bellatrix continues to provide exceptional organic growth while reducing operating costs, posting industry leading F&D costs and maintaining a strong balance sheet. The Company has been able to excogitate a business development plan focused on low risk, high rate of return resource development projects. The staff of Bellatrix has tenaciously executed the business plan delivering industry leading metrics.
The following corroborative bullet points highlight the Company’s very successful 2011.
Operational highlights for the three months and year ended December 31, 2011 include:
· During the month of December, field production averaged 16,141 boe/d which exceeded Bellatrix’s 2011 exit rate guidance of 15,000 boe/d. Bellatrix exited 2011 with production volumes weighted 40% to crude oil, condensate and liquids.
· During 2011, Bellatrix drilled or participated in a total of 54 gross (34.84 net) wells consisting of 39 gross (29.04 net) oil wells, 14 gross (5.79 net) liquids rich gas wells, and 1 gross (0.007 net) dry hole.
· In Q4 2011, Bellatrix drilled or participated in 12 gross wells (7.64 net). The Company successfully drilled 8 gross (6.68 net) Cardium light oil horizontal wells, 3 gross (0.95 net) Notikewin condensate-rich horizontal natural gas wells in the West Central area of Alberta, and participated in 1 gross (0.007 net) dry hole that was drilled in a non-operated oil unit.
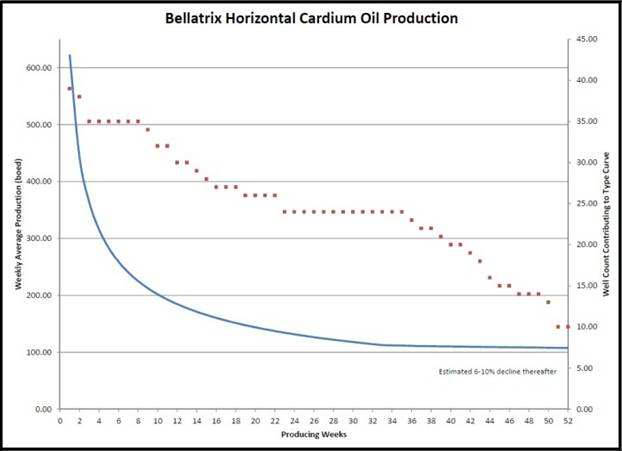
· In Q4 2011, the Company operated 7 light oil wells in the Cardium consisting of 2 wells in Willesden Green, 3 wells in Brazeau, 1 well in Pembina and 1 well in West Pembina. The following average initial production (“IP”) rates for the first 7 days (“IP 7”), for the first 15 days (“IP 15”) and the first 30 days (“IP 30”) were achieved:
Time | | # of wells | | Boe/d | |
IP 7 | | 7 | | 693 | |
IP 15 | | 7 | | 613 | |
IP 30 | | 6 | | 574 | |
4
· The following graph provides our “Cardium Oil Type Curve” representing the average of all of Bellatrix’s water fraced Cardium oil wells over their first 12 months of production.
· 2011 annual sales volumes averaged 11,954 boe/d (weighted 38% to oil, condensate and NGLs and 62% to natural gas), a 40% increase over 2010 annual average sales volumes of 8,519 boe/d.
· Q4 2011 sales volumes averaged 14,209 boe/d (weighted 38% to oil, condensate and NGLs and 62% to natural gas). This represents a 42% increase from the fourth quarter 2010 average sales volumes of 10,002 boe/d and a 20% increase from third quarter 2011 average sales volumes of 11,837 boe/d.
· For the year, Bellatrix has added 40 gross and net contiguous sections in the Ferrier area which includes highly prospective Cardium and Duvernay mineral rights. During the first quarter of 2011, Bellatrix entered into an agreement to acquire 20 net sections. In August 2011, Bellatrix added an additional 20 gross and net contiguous sections in the Ferrier area.
· The Company’s drilling success and mapping revisions have resulted in increased Cardium and Notikewin inventory. The Company now has 377 net locations in the Cardium light gravity oil play and 174 locations in the Notikewin condensate rich gas resource play yielding over $2.1 billion in future development expenditures based on current costs of drilling.
5
· In addition the Company now controls 44 gross (43 net) sections of Duvernay rights in West Central Alberta.
· As at December 31, 2011 Bellatrix had approximately 224,559 net undeveloped acres of land in Alberta, British Columbia and Saskatchewan.
· On January 25, 2011, Bellatrix acquired an interest in a section of Frog Lake First Nations lands from a joint venture partner for a net purchase price of $2.2 million after adjustments.
· On January 25, 2011, Bellatrix exercised a right of first refusal increasing its interest in a joint venture property in the Brazeau Area of West Central Alberta for approximately $1.5 million.
· On September 22, 2011, Bellatrix sold a minor property in the Meekwap area of Alberta for $4.2 million, after purchase adjustments and closing costs.
FINANCIAL
Financial highlights for the three months and year ended December 31, 2011 include:
· Q4 2011 revenue increased to $59.2 million, 57% higher than the $37.8 million recorded in Q4 2010. Revenue for year ended December 31, 2011 was $202.3 million up from $117.7 million in the in 2010. The increase in revenues is a result of higher sales volumes in conjunction with higher light crude oil, condensate and NGL prices, offset partially by lower natural gas prices, for 2011 compared to 2010.
· Crude oil, condensate and NGLs produced 73% and 69% of revenue for the three and twelve month periods ended December 31, 2011, respectively.
· Funds flow from operations for Q4 2011 increased to $30.1 million, up 89% from $15.9 million in Q4 2010 and up 25% when compared to $24.0 million generated in Q3 2011. Funds flow from operations for the year ended December 31, 2011 climbed to $94.2 million, up 78% from $53.0 million in 2010.
· For the three months and year ended December 31, 2011, net profit before the non-cash impairment loss (reversal) on property, plant and equipment and the unrealized loss on commodity contracts, net of associated deferred tax impacts, was $7.9 million and $18.4 million, compared to $0.6 million net profit and a $2.1 million net loss in 2010 periods, respectively.
· Bellatrix spent $179.6 million on capital projects during the year ended December 31, 2011 compared to $106.7 million in in 2010. During the fourth quarter of 2011, Bellatrix spent $47.3 million on capital projects compared to $39.7 million in Q4 2010.
· Production expenses for Q4 2011 were $10.78/boe ($14.1 million), compared to $11.31/boe ($10.4 million) for Q4 2010. Production expenses for the year ended December 31, 2011 were $11.53/boe ($50.3 million), compared to $12.21/boe ($38.0 million) in 2010.
· Operating netbacks before risk management continue to grow in response to the Company’s improved liquids mix to $26.00/boe in Q4 2011, up 32% from $19.71/boe in Q4 2010. This was up from Q3 2011 operating netbacks before risk management of $23.89 due primarily to higher overall realized commodity prices and slightly lower operating expenses during Q4 2011.
6
· Operating netbacks before risk management for the year ended December 31, 2011 were $25.09/boe, up dramatically from $16.42/boe in 2010. The improved netback was primarily the result of an increase in the average sales volumes weighted toward oil, condensate and natural gas liquids, in conjunction with an increase in oil, condensate, and NGL commodity prices and decrease in production expenses, offset by an increase in transportation expenses and royalties.
· Total net debt as of December 31, 2011 was $119.3 million, including the liability component of convertible debentures drawn against the Company’s credit capacity of $225 million.
· On May 11, 2011, Bellatrix closed a $55 million bought deal equity financing.
· Effective November 25, 2011, the Company’s borrowing base was increased from $140 million to $170 million.
· As at December 31, 2011, Bellatrix had $56.7 million drawn on its total $170.0 million credit facility.
· As at December 31, 2011, Bellatrix has approximately $514 million in tax pools available for deduction against future income.
COMMODITY PRICE RISK MANAGEMENT
In January 2012, Bellatrix entered into two additional fixed price risk management contracts that provide for a total of 20,000 GJ/d of natural gas at an average price of CAD$4.11/GJ spanning from April 1 to October 31, 2012, which were funded by two additional call options of a total of 2,000 bbls/d at US$110.00 for the 2013 calendar year.
As at March 7, 2012, the Company has entered into commodity price risk management arrangements as follows:
Type | | Period | | Volume | | Price Floor | | Price Ceiling | | Index | |
Crude oil fixed | | January 1, 2012 to Dec. 31, 2012 | | 1,000 bbl/d | | $ | 90.00 CAD | | $ | 90.00 CDN | | WTI | |
Crude oil fixed | | January 1, 2012 to Dec. 31, 2012 | | 1,000 bbl/d | | $ | 90.49 CAD | | $ | 90.49 CDN | | WTI | |
Crude oil fixed | | January 1, 2012 to Dec. 31, 2012 | | 1,000 bbl/d | | $ | 96.40 CAD | | $ | 96.40 CDN | | WTI | |
Crude oil call option | | January 1, 2012 to Dec. 31, 2012 | | 833 bbl/d | | –– | | $ | 110.00 US | | WTI | |
Crude oil call option | | January 1, 2013 to Dec. 31, 2013 | | 1,000 bbl/d | | –– | | $ | 110.00 US | | WTI | |
Crude oil call option | | January 1, 2013 to Dec. 31, 2013 | | 1,000 bbl/d | | –– | | $ | 110.00 US | | WTI | |
Crude oil call option | | January 1, 2013 to Dec. 31, 2013 | | 1,000 bbl/d | | –– | | $ | 110.00 US | | WTI | |
Natural gas fixed | | April 1, 2012 to Oct. 31, 2012 | | 10,000 GJ/d | | $ | 4.10 CAD | | $ | 4.10 CDN | | AECO | |
Natural gas fixed | | April 1, 2012 to Oct. 31, 2012 | | 10,000 GJ/d | | $ | 4.10 CAD | | $ | 4.10 CDN | | AECO | |
Natural gas fixed | | April 1, 2012 to Oct. 31, 2012 | | 10,000 GJ/d | | $ | 4.11 CAD | | $ | 4.11 CDN | | AECO | |
RESERVES
Highlights from Bellatrix’s December 31, 2011 reserves include:
Total proved plus probable company interest reserves, including all royalties receivable but before deducting royalty burdens, as evaluated by Sproule Associates Limited. (“Sproule”) at December 31, 2011 were 67,550 mboe (gas converted 6:1). This represents a 59% increase from the 42,560 mboe of 2P reserves as at December 31, 2010 (as evaluated by GLJ Petroleum Consultants Ltd.). By commodity type, natural gas makes up 63%, oil and natural gas
7
liquids 37% of total reserves. At December 31, 2011, the Company’s total proved company interest reserves were 41,818 mboe, an increase of 68% compared to 24,930 mboe at December 31, 2010.
· Including properties which were disposed in 2011, proved and probable company interest reserve additions in 2011 replaced 673% of production.
· The net present value of future net revenue of reserves (which does not represent fair market value) at a 10% discount rate improved to $722.5 million up from $481.54 million posted in 2010 representing an increase of 50%.
· Bellatrix’s net asset value, as at December 31, 2011, based on the Sproule evaluation at a 10% discount rate, internal estimates of the value of undeveloped lands and seismic, and 107.4 million common shares outstanding, equates to $7.01 per basic share outstanding and is $9.73 per basic share outstanding at a 5% discount rate.
· The Company’s reserve life index has extended to 8 years for total company interest proved reserves up from 7.2 years in 2010 with total company interest proved and probable reserve life index of 10 years compared to 11.2 years presented in 2010. These 2011 indices were based on first year production as set forth in Sproule Report with 2012 company interest production of 14,335 boe/d and 18,512 boe/d for total company interest proved reserves and proved and probable reserves, respectively.
· 2011 finding, development and acquisition costs (“FD&A”) including changes to future development capital (“FDC”) for total proved plus probable reserves were $9.29 /boe. The three year average FD&A including FDC is $10.59/boe.
· 2011 FD&A including changes to FDC for proved reserves equated to $13.00 /boe.
· The Company established recycle ratios, after commodity price risk management contracts and excluding future development costs of 3.01 times on a proved basis and 4.16 times on a proved and probable basis.
The Company recorded all-in annual FD&A cost of $8.37 per boe in 2011 before consideration of FDC for proved reserves category. The three year average FD&A cost is $8.23 per boe for the proved category before FDC; including FDC, the three year average FD&A cost is $13.69 per boe.
In addition to the information disclosed herein, more detailed information on the Company’s reserves will be included in the Company’s Annual Information Form.
For additional information please refer to the reserves news release dated February 28, 2012 (posted on www.sedar.com).
The Company has experienced several years of positive revisions to its established reserve base as reserve confidence increases with production history and expects this trend to continue. Additionally, reserves expected from the Company’s developing Cardium and Notikewin resource plays are only partially evaluated due to the early stage of development of the play and the horizontal drilling and completion technologies involved. Specifically, the reserve evaluation includes 19.1 net undeveloped Notikewin horizontal gas locations at Ferrier and 57.3 net undeveloped Cardium horizontal oil locations at Pembina.
8
OUTLOOK
Bellatrix has drilled 93 wells in our two core resource plays to date, establishing a 100% success rate coupled with experimentation in different completion techniques leading to optimized well performance. As a result, the Company has progressed to the manufacturing phase to exploit its extensive inventory in the Cardium light oil play (377 net locations) and the Notikewin condensate rich play (174 net locations).
With the spudding of the Company’s first (100% WI) Duvernay well in the first quarter, we are embarking on development of our third resource play in the potentially high impact Duvernay Shale. Combining our legacy land position with recent acquisitions, the Company has expanded its ownership to 43 net sections on the play. Success in the Duvernay will increase our development drilling inventory by 170 to 250 net locations, extending future capital requirements to drill the Company’s inventory to over $4 billion. Based on 2012 cash flow expectations, harvesting the Company’s inventory would require in excess of 25 years.
An initial capital budget of $180 million has been set for fiscal 2012. Based on the timing of proposed expenditures, downtime for anticipated plant turnarounds and normal production declines, execution of the 2012 budget is anticipated to provide 2012 average daily production of approximately 16,500 to 17,000 boe/d and an exit rate of approximately 18,000 to 18,500 boe/d.
Bellatrix’s management and staff are dedicated to providing perpetual long term growth in shareholder value fueled by our extensive drilling inventory. I would like to thank and congratulate our staff on their sagacity and for providing another outstanding year in 2011.
Raymond G. Smith, P. Eng.
President and CEO
March 8, 2012
Note:
A conference call to discuss Bellatrix’s annual financial and reserves results will be held on March 8, 2012 at 2:30 pm MDT/4:30 pm EDT. To participate, please call toll-free 1-888-231-8191 or 647-427-7450. The conference call will also be recorded and available by calling 1-855-859-2056 or 416-849-0833 and entering passcode 55541091 followed by the pound sign.
Bellatrix’s annual meeting is scheduled for 3:00 pm on May 22, 2012 in the Devonian Room at the Calgary Petroleum Club.
9

MANAGEMENT’S DISCUSSION AND ANALYSIS
March 7, 2012 — The following Management’s Discussion and Analysis of financial results as provided by the management of Bellatrix Exploration Ltd. (“Bellatrix” or the “Company”) should be read in conjunction with the audited consolidated financial statements of the Company for the years ended December 31, 2011 and 2010. This commentary is based on information available to, and is dated as of, March 7, 2012. The financial data presented is in Canadian dollars, except where indicated otherwise. As of January 1, 2011, Bellatrix prepares its consolidated financial statements in accordance with International Financial Reporting Standards (“IFRS”), IFRS 1 - First-time adoption of International Financial Reporting Standards (“IFRS 1”) and International Accounting Standard 34 - Interim Financial Reporting, as issued by the International Accounting Standards Board. Previously, Bellatrix’s financial statements were prepared in accordance with previous Canadian generally accepted accounting principles (“previous GAAP”). Reconciliations between previous GAAP and IFRS financial information can be found in the consolidated financial statements for the year ended December 31, 2011.
CONVERSION: The term barrels of oil equivalent (“boe”) may be misleading, particularly if used in isolation. A boe conversion ratio of six thousand cubic feet of natural gas to one barrel of oil equivalent (6 mcf/bbl) is based on an energy equivalency conversion method primarily applicable at the burner tip and does not represent a value equivalency at the wellhead. Given that the value ratio based on the current price of crude oil as compared to natural gas is significantly different from the energy equivalency of 6:1, utilizing a conversion on a 6:1 basis may be misleading as an indication of value. All boe conversions in this report are derived from converting gas to oil in the ratio of six thousand cubic feet of gas to one barrel of oil.
NON-GAAP MEASURES: This Management’s Discussion and Analysis and the accompanying report to shareholders contains the term “funds flow from operations” which should not be considered an alternative to, or more meaningful than “cash flow from operating activities” as determined in accordance with generally accepted accounting principles (“GAAP”) as an indicator of the Company’s performance. Therefore reference to funds flow from operations or funds flow from operations per share may not be comparable with the calculation of similar measures for other entities. Management uses funds flow from operations to analyze operating performance and leverage and considers funds flow from operations to be a key measure as it demonstrates the Company’s ability to generate the cash necessary to fund future capital investments and to repay debt. The reconciliation between cash flow from operating activities and funds flow from operations can be found in this Management’s Discussion and Analysis. Funds flow from operations per share is calculated using the weighted average number of shares for the period.
This Management’s Discussion and Analysis and the accompanying report to shareholders also contains other terms such as net profit (loss) before impairment and unrealized loss on commodity contracts, total net debt, and operating netbacks, which are not recognized measures under GAAP. Net profit (loss) before non-cash impairment loss and unrealized loss on commodity contracts is calculated as net profit (loss) per the Consolidated Statement of Comprehensive Income, excluding the impairment loss (reversal) on property, plant and equipment and unrealized loss on commodity contracts, net of deferred tax impacts on each item. Total net debt is calculated as long-term debt plus the liability component of the convertible debentures and the net working capital deficiency (excess) before short-term commodity contract assets and liabilities and current finance lease obligations. Net debt is calculated as long-term debt plus the net working capital deficiency (excess) before short-term commodity contract assets and liabilities and current finance lease obligations. Operating netbacks are calculated by subtracting royalties, transportation, and operating expenses from revenues before other income. Management believes these measures are useful supplemental measures of firstly, the total amount of current and long-term debt and secondly, the amount of revenues received after transportation, royalties and operating expenses. Readers are cautioned, however, that these measures should not be construed as an alternative to other terms such as current and long-term debt or net income determined in accordance with GAAP as measures of performance. Bellatrix’s method of calculating these measures may differ from other entities, and accordingly, may not be comparable to measures used by other companies.
Additional information relating to the Company, including the Bellatrix’s Annual Information Form, is available on SEDAR at www.sedar.com.
10
FORWARD LOOKING STATEMENTS: Certain information contained herein and in the accompanying report to shareholders may contain forward looking statements including management’s assessment of future plans and operations, drilling plans and the timing thereof, commodity price risk management strategies, expected 2012 average production and exit rates, timing of completion and tie-in of wells, anticipated liquidity of the Company and various matters that may impact such liquidity, expected 2012 operating expenses and general and administrative expenses, 2012 capital expenditures budget and the nature of capital expenditures and the timing and method of financing thereof, method of funding drilling commitments, commodity prices and expected volatility thereof, estimated amount and timing of incurring decommissioning liabilities, use of proceeds from recent financings and activity levels, expectations with respect to revenues for early 2012 compared to the corresponding period of 2011, expectations of future development drilling locations and the capital expenditures associated with such drilling opportunities, estimated costs to satisfy drilling commitments, and the expectation that the increased confidence in reserves will continue, may constitute forward-looking statements under applicable securities laws and necessarily involve risks including, without limitation, risks associated with oil and gas exploration, development, exploitation, production, marketing and transportation, loss of markets, volatility of commodity prices, currency fluctuations, imprecision of reserve estimates, environmental risks, competition from other producers, inability to retain drilling rigs and other services, incorrect assessment of the value of acquisitions, failure to realize the anticipated benefits of acquisitions, delays resulting from or inability to obtain required regulatory approvals and ability to access sufficient capital from internal and external sources. The recovery and reserve estimates of Bellatrix’s reserves provided herein are estimates only and there is no guarantee that the estimated reserves will be recovered. Events or circumstances may cause actual results to differ materially from those predicted, as a result of the risk factors set out and other known and unknown risks, uncertainties, and other factors, many of which are beyond the control of Bellatrix. In addition, forward-looking statements or information are based on a number of factors and assumptions which have been used to develop such statements and information but which may prove to be incorrect and which have been used to develop such statements and information in order to provide shareholders with a more complete perspective on Bellatrix’s future operations. Such information may prove to be incorrect and readers are cautioned that the information may not be appropriate for other purposes. Although the Company believes that the expectations reflected in such forward-looking statements or information are reasonable, undue reliance should not be placed on forward-looking statements because the Company can give no assurance that such expectations will prove to be correct. In addition to other factors and assumptions which may be identified herein, assumptions have been made regarding, among other things: the impact of increasing competition; the general stability of the economic and political environment in which the Company operates; the timely receipt of any required regulatory approvals; the ability of the Company to obtain qualified staff, equipment and services in a timely and cost efficient manner; drilling results; the ability of the operator of the projects which the Company has an interest in to operate the field in a safe, efficient and effective manner; the ability of the Company to obtain financing on acceptable terms; field production rates and decline rates; the ability to replace and expand oil and natural gas reserves through acquisition, development of exploration; the timing and costs of pipeline, storage and facility construction and expansion and the ability of the Company to secure adequate product transportation; future commodity gas prices; currency, exchange and interest rates; the regulatory framework regarding royalties, taxes and environmental matters in the jurisdictions in which the Company operates; and the ability of the Company to successfully market its oil and natural gas products. Readers are cautioned that the foregoing list is not exhaustive of all factors and assumptions which have been used. As a consequence, actual results may differ materially from those anticipated in the forward-looking statements. Additional information on these and other factors that could effect Bellatrix’s operations and financial results are included in reports on file with Canadian securities regulatory authorities and may be accessed through the SEDAR website (www.sedar.com), and at Bellatrix’s website (www.bellatrixexploration.com). Furthermore, the forward-looking statements contained herein are made as at the date hereof and Bellatrix does not undertake any obligation to update publicly or to revise any of the included forward-looking statements, whether as a result of new information, future events or otherwise, except as may be required by applicable securities laws.
The reader is further cautioned that the preparation of financial statements in accordance with GAAP requires management to make certain judgments and estimates that affect the reported amounts of assets, liabilities, revenues and expenses. Estimating reserves is also critical to several accounting estimates and requires judgments and decisions based upon available geological, geophysical, engineering and economic data. These estimates may change, having either a negative or positive effect on net earnings as further information becomes available, and as the economic environment changes.
11
Overview and Description of the Business
Bellatrix is a Western Canadian based growth oriented oil and gas company engaged in the exploration for, and the acquisition, development and production, of oil and natural gas reserves in the provinces of Alberta, British Columbia and Saskatchewan.
Bellatrix is the continuing corporation resulting from the reorganization (the “Reorganization”) effective November 1, 2009 pursuant to a plan of arrangement involving, among others, True Energy Trust (the “Trust” or “True”), Bellatrix Exploration Ltd. (“Bellatrix” or the “Company”) and securityholders of the Trust.
Bellatrix’s common shares and convertible debentures are listed on the Toronto Stock Exchange under the symbols BXE and BXE.DB.A, respectively.
Changes in Accounting Policies
As of January 1, 2011, Bellatrix prepares its financial statements in accordance with IFRS, IFRS 1 and International Accounting Standard 34 - Interim Financial Reporting, as issued by the International Accounting Standards Board. Previously, Bellatrix’s financial statements were prepared in accordance with previous GAAP. Unless otherwise noted, 2010 comparative information has been prepared in accordance with IFRS.
The adoption of IFRS has not had an impact on the Company’s operations, strategic decisions and cash flow. The most significant area of impact was the adoption of the IFRS property, plant and equipment accounting principles, the related decommissioning liabilities and resulting deferred tax adjustments on transition. Further information on the IFRS impacts is provided in the Accounting Policies and Estimates Section of this Management’s Discussion and Analysis.
Fourth Quarter 2011
HIGHLIGHTS | | Three months ended December 31, | |
(CDN$000s except share and per share amounts) | | 2011 | | 2010 | |
FINANCIAL | | | | | |
Revenue (before royalties and risk management (1)) | | 59,194 | | 37,826 | |
| | | | | |
Funds flow from operations (2) | | 30,120 | | 15,892 | |
Per basic share (3) | | $ | 0.28 | | $ | 0.16 | |
Per diluted share (3) | | $ | 0.26 | | $ | 0.15 | |
Cash flow from operating activities | | 30,626 | | 11,285 | |
Per basic share (3) | | $ | 0.28 | | $ | 0.12 | |
Per diluted share (3) | | $ | 0.26 | | $ | 0.11 | |
Net profit before non-cash impairment loss and unrealized loss on commodity contracts (5) | | 7,923 | | 578 | |
Per basic share (3) | | $ | 0.07 | | $ | 0.01 | |
Per diluted share (3) | | $ | 0.07 | | $ | 0.01 | |
Net loss (7) | | (13,597 | ) | (57 | ) |
Per basic share (3) | | $ | (0.13 | ) | $ | (0.00 | ) |
Per diluted share (3) | | $ | (0.13 | ) | $ | (0.00 | ) |
Exploration and development | | 47,141 | | 34,884 | |
Corporate and property acquisitions | | 121 | | 4,812 | |
Capital expenditures — cash | | 47,262 | | 39,696 | |
Property dispositions — cash | | (22 | ) | (13,980 | ) |
Non-cash items | | 6,165 | | (1,681 | ) |
Total capital expenditures — net | | 53,405 | | 24,035 | |
12
| | | | Three months ended December 31, | |
(CDN$000s except share and per share amounts) | | | | 2011 | | 2010 | |
OPERATING | | | | | | | |
Average daily sales volumes | | | | | | | |
Crude oil, condensate and NGLs | | (bbls/d) | | 5,420 | | 3,821 | |
Natural gas | | (mcf/d) | | 52,734 | | 37,083 | |
Total oil equivalent | | (boe/d) | | 14,209 | | 10,002 | |
Average prices | | | | | | | |
Light crude oil and condensate | | ($/bbl) | | 95.18 | | 77.48 | |
NGLs | | ($/bbl) | | 54.31 | | 42.80 | |
Heavy oil | | ($/bbl) | | 74.30 | | 57.83 | |
Crude oil, condensate and NGLs | | ($/bbl) | | 85.09 | | 69.22 | |
Crude oil, condensate and NGLs (including risk management (1)) | | ($/bbl) | | 82.90 | | 69.94 | |
Natural gas | | ($/mcf) | | 3.30 | | 3.79 | |
Natural gas (including risk management (1)) | | ($/mcf) | | 3.62 | | 3.79 | |
Total oil equivalent | | ($/boe) | | 44.69 | | 40.51 | |
Total oil equivalent (including risk management (1)) | | ($/boe) | | 45.07 | | 40.79 | |
Statistics | | | | | | | |
Operating netback (4) | | ($/boe) | | 26.00 | | 19.71 | |
Operating netback (4) (including risk management (1)) | | ($/boe) | | 26.38 | | 19.99 | |
Transportation | | ($/boe) | | 1.21 | | 1.18 | |
Production expenses | | ($/boe) | | 10.78 | | 11.31 | |
General & administrative | | ($/boe) | | 2.88 | | 1.92 | |
Royalties as a % of sales after transportation | | | | 15% | | 21% | |
DILUTED WEIGHTED AVERAGE SHARES | | | | | | | |
Diluted weighted average shares — net profit (loss) (6) | | | | 109,349,045 | | 98,325,051 | |
Diluted weighted average shares — funds flow from operations and cash flow from operating activities (2) (6) | | | | 119,170,474 | | 108,146,480 | |
SHARE TRADING STATISTICS | | | | | | | |
(CDN$, except volumes) based on intra-day trading | | | | | | | |
High | | | | 5.05 | | 5.05 | |
Low | | | | 3.15 | | 3.45 | |
Close | | | | 4.91 | | 4.80 | |
Average daily volume | | | | 409,687 | | 358,869 | |
(1) The Company has entered into various commodity price risk management contracts which are considered to be economic hedges. Per unit metrics after risk management includes only the realized portion of gains or losses on commodity contracts.
The Company does not apply hedge accounting to these contracts. As such, these contracts are revalued to fair value at the end of each reporting date. This results in recognition of unrealized gains or losses over the term of these contracts which is reflected each reporting period until these contracts are settled, at which time realized gains or losses are recorded. These unrealized gains or losses on commodity contracts are not included for purposes of per share metrics calculations disclosed.
(2) The highlights section contains the term “funds flow from operations” which should not be considered an alternative to, or more meaningful than cash flow from operating activities as determined in accordance with generally accepted accounting principles (“GAAP”) as an indicator of the Company’s performance. Therefore reference to diluted funds flow from operations or funds flow from operations per share may not be comparable with the calculation of similar measures for other entities. Management uses funds flow from operations to analyze operating performance and leverage and considers funds flow from operations to be a key measure as it demonstrates the Company’s ability to generate the cash necessary to fund future capital investments and to repay debt. The reconciliation between cash flow from operating activities and funds flow from operations can be found further in the MD&A. Funds flow from operations per share is calculated using the weighted average number of common shares for the period.
(3) Net debt and total net debt are considered non-GAAP terms. The Company’s calculation of total net debt includes the liability component of convertible debentures and excludes deferred liabilities, long-term commodity contract liabilities, decommissioning
13
liabilities, long-term finance lease obligations and the deferred tax liability. Net debt and total net debt include the net working capital deficiency (excess) before short-term commodity contract assets and liabilities and current finance lease obligations. Net debt also excludes the liability component of convertible debentures. A reconciliation between total liabilities under GAAP and total net debt and net debt as calculated by the Company is found further in the MD&A.
(4) Operating netbacks is considered a non-GAAP term. Operating netbacks are calculated by subtracting royalties, transportation, and operating costs from revenues before other income.
(5) Net profit (loss) before non-cash impairment loss and unrealized loss on commodity contracts is considered a non-GAAP term. Net profit (loss) before non-cash impairment loss and unrealized loss on commodity contracts is calculated as net profit (loss) per the Consolidated Statement of Comprehensive Income, excluding the impairment loss (reversal) on property, plant and equipment and unrealized loss on commodity contracts, net of deferred tax impacts on each item. The Company’s reconciliation between the net loss and net profit (loss) before non-cash impairment loss and unrealized loss on commodity contracts is found in this MD&A.
(6) Basic weighted average shares for the three months ended December 31, 2011 were 107,397,265 (2010: 97,332,859).
In computing weighted average diluted earnings per share for the three months ended December 31, 2011 a total of 7,985,320 (2010: 992,192) share options and 9,821,429 (2010: 9,821,429) common shares issuable on conversion of convertible debentures were excluded from the calculation as they were not dilutive
In computing weighted average diluted net profit (loss) before non-cash impairment loss and unrealized loss on commodity contracts per share for the three months ended December 31, 2011 a total of 1,951,780 (2010: 992,192) common shares were added to the denominator as a consequence of applying the treasury stock method to the Company’s outstanding share options as they were dilutive, and a total of 9,821,429 (2010: 9,821,429) common shares issuable on conversion of convertible debentures were excluded from the denominator as they were not dilutive, resulting in diluted weighted average common shares of 109,349,045.
In computing weighted average diluted cash flow from operating activities and funds flow from operations for the three months ended December 31, 2011 a total of 1,951,780 (2010: 992,192) common shares were added to the denominator as a consequence of applying the treasury stock method to the Company’s outstanding share options and a total of 9,821,429 (2010: 9,821,429) common shares issuable on conversion of convertible debentures were also added to the denominator as they were dilutive, resulting in diluted weighted average common shares of 119,170,474. As a consequence, a total of $0.8 million for interest accretion expense (net of income tax effect) was added to the numerator.
(7) As of January 1, 2011, Bellatrix prepares its consolidated financial statements in accordance with IFRS, IFRS 1 - First-time adoption of International Financial Reporting Standards (“IFRS 1”) and International Accounting Standard 34 - Interim Financial Reporting, as issued by the International Accounting Standards Board. Previously, Bellatrix’s financial statements were prepared in accordance with Canadian generally accepted accounting principles (“previous GAAP”). Reconciliations between previous GAAP and IFRS financial information can be found in the consolidated financial statements for the year ended December 31, 2011.
As detailed previously in this Management’s Discussion and Analysis, funds flow from operations is a term that does not have any standardized meaning under GAAP. Funds flow from operations is calculated as cash flow from operating activities before asset retirement costs incurred and changes in non-cash working capital incurred.
Reconciliation of Cash Flow from Operating Activities to Funds Flow from Operations
| | Three months ended December 31, | |
($000s) | | 2011 | | 2010 | |
Cash flow from operating activities | | 30,626 | | 11,285 | |
Decommissioning costs incurred | | 186 | | 466 | |
Change in non-cash working capital | | (692 | ) | 4,141 | |
Funds flow from operations | | 30,120 | | 15,892 | |
Funds flow from operations during the fourth quarter of 2011 was $30.1 million, an increase of 90% compared to $15.9 million for the fourth quarter of 2010. The increase is primarily reflective of higher overall sales volumes and increased pricing for light and heavy oil, condensate and NGL’s, offset slightly by a decline in natural gas pricing. Increases in oil prices and decreases to gas prices during the fourth quarter of 2011 resulted in an increase in net realized gains on commodity risk contracts by approximately $0.2 million compared to 2010. Interest expense for the 2011 fourth quarter increased by approximately $0.1 million compared to the 2010 fourth quarter, which is primarily reflective of the Company’s increased bank debt over the period, offset by a lower bank interest rate over the period. Cash flow from operating activities during the fourth quarter of 2011 was $30.5 million, compared to $11.3 million for the fourth quarter of 2010. This increase was further reflective of an increase in cash from changes in working capital, offset by a decrease in decommissioning costs incurred. In the fourth quarter of 2011, Bellatrix realized a net loss of $13.6 million compared to
14
a net loss of $0.1 million in the fourth quarter of 2010. The net loss recorded in the fourth quarter of 2011 compared to the net loss in the fourth quarter of 2010 is primarily a consequence of a $13.3 million higher non-cash unrealized loss on commodity risk management, $3.7 million of additional depletion and depreciation expense, a $11.0 million non-cash impairment loss on oil and gas properties in Q4 2011 compared to a $3.6 million impairment reversal in Q4 2010, offset partially by higher cash flows as noted above and a $4.0 million deferred tax recovery in Q4 2011 compared to a $0.3 million deferred tax expense in Q4 2010.
As previously noted in this MD&A, net profit before non-cash impairment loss and unrealized loss on commodity contracts is a non-GAAP measure. A reconciliation between this measure and net loss per the Consolidated Statement of Comprehensive Income is provided below.
For the fourth quarter of 2011, net profit before the non-cash impairment loss (reversal) on property, plant and equipment and the unrealized loss on commodity contracts, net of associated deferred tax impacts, was $7.9 million compared to $0.6 million in 2010.
Reconciliation of Net Loss to Net Profit before impairment and unrealized loss on commodity contracts
| | Three months ended December 31, | |
($000s) | | 2011 | | 2010 | |
Net loss per financial statements | | (13,597 | ) | (57 | ) |
Items subject to reversal | | | | | |
Impairment loss (reversal) on property, plant and equipment | | 11,018 | | (3,574 | ) |
Unrealized loss on commodity contracts | | 17,676 | | 4,421 | |
Deferred tax impact of above items | | (7,174 | ) | (212 | ) |
Net profit before non-cash impairment loss and unrealized loss on commodity contracts | | 7,923 | | 578 | |
Sales Volumes
| | | | Three months ended December 31, | |
| | | | 2011 | | 2010 | |
Light oil and condensate | | (bbls/d) | | 3,925 | | 2,706 | |
NGLs | | (bbls/d) | | 1,173 | | 643 | |
Heavy oil | | (bbls/d) | | 322 | | 472 | |
Total crude oil, condensate and NGLs | | (bbls/d) | | 5,420 | | 3,821 | |
| | | | | | | |
Natural gas | | (mcf/d) | | 52,734 | | 37,083 | |
| | | | | | | |
Total boe/d | | (6:1) | | 14,209 | | 10,002 | |
Sales volumes for the three months ended December 31, 2011 averaged 14,209 boe/d, up 42% from the 10,002 boe/d sold in the fourth quarter of 2010. The weighting toward crude oil, condensate and NGLs sales volumes remained consistent at 38% in the 2011 fourth quarter, compared to 38% in the corresponding period in 2010. Fourth quarter 2011 sales volumes were higher than the same period in 2010 primarily due to the success achieved from an expanded drilling program in 2011. Sales volumes for the month of December 2011 averaged approximately 16,141 boe/d, resulting in a 54% increase over December 2010 production of 10,500 boe/d. Bellatrix exited 2011 with production volumes weighted 40% to crude oil, condensate and NGLs and 60% to natural gas.
15
Natural gas sales averaged 52.7 Mmcf/d during the fourth quarter of 2011, compared to 37.1 Mmcf/d in the fourth quarter of 2010. The weighting toward natural gas sales volumes averaged 62% in the fourth quarter, consistent with the 62% weighting realized in the corresponding period in 2010. Crude oil, condensate and NGL sales volumes averaged 5,420 bbls/d in the fourth quarter of 2011 compared to 3,821 bbls/d during the same period of 2010.
Revenue
| | Three months ended December
31, | |
($000s) | | 2011 | | 2010 | |
Light crude oil and condensate | | 34,366 | | 19,288 | |
NGLs | | 5,862 | | 2,533 | |
Heavy oil | | 2,204 | | 2,512 | |
Crude oil and NGLs | | 42,432 | | 24,333 | |
Natural gas | | 15,995 | | 12,946 | |
Total revenue before other | | 58,247 | | 37,279 | |
Other (1) | | 767 | | 547 | |
Total revenue before royalties and risk management | | 59,194 | | 37,826 | |
(1) Other revenue primarily consists of processing and other third party income.
During the fourth quarter of 2011, Bellatrix experienced an overall increase of 10% in commodity prices, based on an increase in light and heavy oil, condensate and NGL pricing, offset by a decrease in natural gas pricing, as compared to the same period in 2010. The average daily and monthly AECO indices for natural gas during this quarter were 12% and 3%, respectively, lower than in the same period in 2010. For the three months ending December 31, 2011, Bellatrix received an average natural gas price, before transportation and commodity price risk management contracts, of $3.30/mcf, 13% lower than $3.79/mcf in the same period in 2010 and 16% lower than $3.91/mcf in the third quarter of 2011. For heavy crude oil, Bellatrix received an average price before transportation of $74.30/bbl during the fourth quarter of 2011, 28% higher than $57.83/bbl in the same period in 2010 and 16% higher than $64.19/bbl in the third quarter of 2011. In comparison, the average reference price for Hardisty Heavy crude in the fourth quarter of 2011 was 25% higher than the average 2010 price in the same period. For light oil and condensate, Bellatrix received an average price of $95.18/bbl before transportation and commodity price risk management contracts for the fourth quarter in 2011, compared to $77.48 during the same 2010 period, representing a 23% increase in price. In comparison, the Edmonton par reference price increased by 21% in the fourth quarter of 2011, compared to the same time period in 2010. In the 2011 fourth quarter, Bellatrix received an average price of $54.31/bbl for NGLs, before transportation and commodity price risk management contracts, representing a 27% increase when compared to fourth quarter of 2010. During the fourth quarter of 2011, revenue before other income and commodity price risk management contracts of $58.4 million was 57% higher than the corresponding 2010 period.
In the fourth quarter of 2011, average sales volumes increased 20% from the third quarter 2010 average volumes of 11,837 boe/d. The increase is due to the success achieved from an expanded drilling program in 2011.
During the fourth quarter of 2011, Bellatrix spent $47.1 million on capital projects, excluding corporate and asset acquisitions and dispositions, compared to $34.9 million in 2010. In the fourth quarter of 2011, Bellatrix drilled or participated in 12 gross wells (7.64 net). The Company successfully drilled 8 gross (6.68 net) Cardium light oil horizontal wells, 3 gross (0.95 net) Notikewin condensate-rich horizontal natural gas wells in the West Central area of Alberta, and participated in 1 gross (0.007 net) dry hole that was drilled in a non-operated oil unit. In the fourth quarter of 2009, Bellatrix drilled or participated in 14 (7.81 net) wells including 7.31 net oil wells, and a net 0.5 natural gas well.
In the fourth quarter of 2011, the Company paid $8.8 million in royalties, compared to $7.7 million in the same period in 2010. As a percentage of pre-commodity price risk management sales (after transportation costs), royalties were 15% in the fourth quarter of 2011 compared to 21% in the same period in 2010. The reduction in royalties is primarily due to increased production from recently drilled light oil and natural gas wells that utilize Alberta royalty incentive frameworks.
16
Royalties for the fourth quarter of 2011 were reduced by $1.5 million in adjustments relating to previous quarter estimates, primarily for wells under the new Alberta royalty incentive programs. Excluding these adjustments, the average royalty rate percentage for the fourth quarter of 2011 would be 18%. In this same period of 2011, operating costs totaled $14.1 million, compared to $10.4 million recorded in the same period of 2010. During the fourth quarter of 2011, operating costs averaged $10.78/boe, down from the $11.31/boe incurred during the fourth quarter of 2010. The decrease was primarily due to increased production from recent drilling in areas with lower production expenses and the Company’s continued efforts to streamline operations and field optimization projects. In comparison, operating costs for the third quarter of 2011 averaged $11.71/boe. During the fourth quarter of 2011, the Company’s field operating netbacks before commodity risk management contracts increased by 32% to $26.00/boe compared to 2010, driven primarily by a 5% reduction in production expenses, 19% reduction in royalties, and a 10% increase in overall commodity prices, offset slightly by higher transportation costs. In comparison, the Company’s field operating netback before commodity risk management contracts for the third quarter of 2011 was $23.89/boe. Field operating netbacks for natural gas before commodity price risk management contracts during the fourth quarter of 2011 of $1.22/mcf were 10% higher than the $1.11/mcf recorded in the same period in 2010. The increase is primarily a result of lower transportation, royalties, and production expenses, despite weaker natural gas prices experienced. In comparison, the field operating netback for natural gas before commodity risk management contracts for the third quarter of 2011 was $1.66/mcf. Field operating netbacks before commodity price risk management contracts for crude oil, condensate and NGLs during the fourth quarter of 2011 averaged $56.26/bbl, up from $40.78/bbl during the fourth quarter of 2010, primarily as a result of reductions in production expenses and royalties, as well as increased pricing. In comparison, the field operating netback for crude oil, condensate and NGLs for the third quarter of 2010 was $47.31/bbl.
In the fourth quarter of 2011, general and administrative expenses (“G&A”), net of capitalized G&A and recoveries, were $3.8 million, compared to $1.8 million in the comparable 2010 period. The increase to net G&A was primarily attributable to increases in staffing costs between the periods. The overall increase in G&A expenses was offset slightly by higher capitalized G&A and recoveries as a result of the increase in capital activity in the fourth quarter of 2011 compared to the fourth quarter of 2010.
Depletion, depreciation and accretion expense for the fourth quarter of 2011 was $17.6 million ($13.48/boe), compared to $14.0 million ($15.17/boe) in 2010. The increase in depletion, depreciation and accretion expense from the 2010 fourth quarter to that in 2011 is reflective of the 42% increase in sales volumes in the same comparative period, offset by the additional reserves achieved through the Company’s drilling success.
2011 Annual Financial and Operational Results
Financing
In May 2011, Bellatrix closed an equity issuance of 9.8 million common shares on a bought deal basis at a price of $5.60 per share for gross proceeds of $55.0 million (net proceeds of $51.9 million after transaction costs). The net proceeds from this financing were used to temporarily reduce outstanding indebtedness, thereby freeing up borrowing capacity that could be redrawn to fund Bellatrix’s ongoing capital expenditures program and general corporate purposes.
Acquisitions and Dispositions
The Company’s goal is to provide consistent growth by drilling and developing its extensive land position to maximize the value of its reserve and resource potential. Bellatrix has been working on a number of internal initiatives to streamline and optimize its ongoing operations, specifically the ability to expand and accelerate the drilling of its Cardium oil and the liquid rich Notikewin gas resource.
On January 25, 2011, Bellatrix acquired an interest in a section of Frog Lake First Nation lands from a joint venture partner for a net purchase price of $2.2 million after adjustments. The transaction had an effective date of January 1,
17
2011. At the time of acquisition, these assets consisted of approximately 130 boe/d of net production; an additional 20% interest in the Colony formation in these lands (Bellatrix already had a 13.75% WI) and an additional 50% WI in the McLaren formation in these lands (Bellatrix already has a 50% WI) except for a ¼ section (in which Bellatrix already had a 13.75% WI).
On January 25, 2011, Bellatrix exercised a right of first refusal increasing its interest in a joint venture property in the Brazeau area of West Central Alberta for approximately $1.5 million. The asset acquisition consisted of approximately 3,200 gross (1,102.8 net) acres of Cardium rights providing the Company with up to 6.3 additional net Cardium locations and included 15 boe/d of production.
During the second quarter of 2011, Bellatrix closed two transactions consisting of the sale of a minor property interest in Saskatchewan (160 gross and 14 net acres) and a swap of interests where Bellatrix increased its Cardium exposure in 3.5 gross (1.7 net) sections in the Greater Pembina area. There was no production associated with the acreages sold in the second quarter of 2011.
Effective September 22, 2011, Bellatrix sold the Meekwap, Alberta property for $4.2 million, after purchase adjustments and closing costs. The property sold included approximately 65 boe/d of production. The net proceeds were used to temporarily reduce the Company’s outstanding indebtedness.
Sales Volumes
Sales volumes for the year ended December 31, 2011 averaged 11,954 boe/d compared to 8,519 boe/d for the 2010 year, representing a 40% increase. Total crude oil, condensate and NGLs averaged approximately 38% of sales volumes for the year ended December 31, 2011 compared to 30% of sales volumes for the 2010 year. The increase in sales is primarily a result of a year over year increased capital program and the associated drilling success achieved in the Cardium and Notikewin resource plays. Capital expenditures on exploration and development for the year ended December 31, 2011 were $175.5 million, compared to $98.4 million for the 2010 year.
Sales Volumes
| | | | Years ended December 31, | |
| | | | 2011 | | 2010 | |
Light oil and condensate | | (bbls/d) | | 3,416 | | 1,563 | |
NGLs | | (bbls/d) | | 808 | | 577 | |
Heavy oil | | (bbls/d) | | 316 | | 410 | |
Total crude oil, condensate and NGLs | | (bbls/d) | | 4,540 | | 2,550 | |
| | | | | | | |
Natural gas | | (mcf/d) | | 44,484 | | 35,814 | |
| | | | | | | |
Total boe/d | | (6:1) | | 11,954 | | 8,519 | |
During 2011, Bellatrix drilled or participated in a total of 54 gross (34.84 net) wells consisting of 39 gross (29.04 net) oil wells, 14 gross (5.79 net) liquids rich gas wells, and 1 gross (0.007 net) dry hole.
By comparison, Bellatrix drilled or participated in 48 gross (28.8 net) wells during the 2010 year, including 21.5 net oil wells, 6.3 net natural gas wells, and one dry hole.
For the year ended December 31, 2011, crude oil, condensate and NGL sales volumes increased by approximately 78% averaging 4,540 bbl/d compared to 2,550 bbl/d in the 2010 year. The weighting towards crude oil, condensate and NGLs increased by approximately 8% in the 2011 year, compared to the 2010 year. For the year ended December 31, 2011, sales volumes for crude oil, condensate and NGLs averaged approximately 38% of total sales volumes compared to approximately 30% of total sales volumes in the 2010 year. The increase is a direct result of the Company’s efforts to balance production by exploiting the Company’s crude oil drilling locations.
18
Sales of natural gas averaged 44.5 Mmcf/d for the year ended December 31, 2011, compared to 35.8 Mmcf/d in the 2010 year, an increase of approximately 24%. The weighting towards natural gas sales volumes averaged approximately 62% for the year ended December 31, 2011 compared to 70% in the 2010 year.
For 2012, Bellatrix will continue to be active in drilling its two core resource plays, the Cardium oil and Notikewin condensate-rich gas, utilizing horizontal drilling multi-fracturing technology. In addition, with the spudding of Bellatrix’s first (100% WI) Duvernay well in the first quarter of 2012, the Company is embarking on development of its third resource play in the potentially high impact Duvernay Shale. An initial capital budget of $180 million has been set for fiscal 2012. Based on the timing of proposed expenditures, downtime for anticipated plant turnarounds and normal production declines, execution of the 2012 budget is anticipated to provide 2012 average daily production of approximately 16,500 boe/d to 17,000 boe/d and an exit rate of approximately 18,000 boe/d to 18,500 boe/d.
Commodity Prices
Average Commodity Prices
| | Years ended December 31, | |
| | 2011 | | 2010 | | % Change | |
| | | | | | | |
Average exchange rate (US$/Cdn$) | | 1.0111 | | 0.9709 | | 4 | |
| | | | | | | |
Crude oil: | | | | | | | |
WTI (US$/bbl) | | 95.12 | | 79.58 | | 20 | |
Edmonton par — light oil ($/bbl) | | 95.16 | | 77.81 | | 22 | |
Bow River — medium/heavy oil ($/bbl) | | 78.30 | | 68.26 | | 15 | |
Hardisty Heavy — heavy oil ($/bbl) | | 69.10 | | 62.29 | | 11 | |
Bellatrix’s average prices ($/bbl) | | | | | | | |
Light crude oil and condensate | | 92.51 | | 76.25 | | 21 | |
NGLs | | 53.54 | | 39.81 | | 35 | |
Heavy crude oil | | 68.23 | | 60.50 | | 13 | |
Total crude oil and NGLs | | 83.89 | | 65.47 | | 28 | |
Total crude oil and NGLs (including risk management (1)) | | 81.47 | | 66.59 | | 22 | |
| | | | | | | |
Natural gas: | | | | | | | |
NYMEX (US$/mmbtu) | | 4.03 | | 4.38 | | (8 | ) |
AECO daily index (CDN$/mcf) | | 3.62 | | 4.00 | | (10 | ) |
AECO monthly index (CDN$/mcf) | | 3.67 | | 4.28 | | (14 | ) |
Bellatrix’s average price ($/mcf) | | 3.77 | | 4.19 | | (10 | ) |
Bellatrix’s average price (including risk management (1)) ($/mcf) | | 4.05 | | 5.28 | | (23 | ) |
(1) Per unit metrics including risk management include realized gains or losses on commodity contracts and exclude unrealized gains or losses on commodity contracts.
For light oil and condensate, Bellatrix recorded an average $92.51/bbl before commodity price risk management contracts during the year ended December 31, 2011, 21% higher than the average price received in the 2010 year. In comparison, the Edmonton par price increased by 22% over the same period. The average WTI crude oil US dollar based price increased 20% in the year ended December 31, 2011 compared to the 2010 year. The average US$/CDN$ foreign exchange rate was 1.0111 for the year ended December 31, 2011 compared to 0.9709 in the 2010 year.
For heavy crude oil, Bellatrix received an average price before transportation of $68.23/bbl in the 2011 year, an increase of 13% over prices in the 2010 year. In comparison, the Bow River reference price increased by 15%, and the Hardisty Heavy reference price increased by 11% in the year ended December 31, 2011 compared to the 2010 year. The majority of Bellatrix’s heavy crude oil density ranges between 11 and 16 degrees API, consistent with the Hardisty Heavy reference price.
19
Bellatrix’s natural gas sales are priced with reference to the daily or monthly AECO indices. During the 2011 year, the AECO daily reference price decreased by approximately 10% and the AECO monthly reference price decreased by approximately 14%, compared to the 2010 year. Bellatrix’s natural gas average sales price before commodity price risk management contracts for the 2011 year decreased by 10% compared to the 2010 year. Bellatrix’s natural gas average price after including commodity price risk management contracts for the year ended December 31, 2011 was $4.05/mcf, compared to $5.28/mcf for the year ended December 31, 2010.
Revenue
Revenue before other income, royalties and commodity price risk management contracts for the year ended December 31, 2011 was $200.2 million, 73% higher than the $115.7 million in the 2010 year.
Revenue before other income, royalties and commodity price risk management contracts for crude oil and NGLs for the year ended December 31, 2011 increased by approximately 128%, resulting from higher sales volumes in conjunction with higher light crude oil, condensate and NGL prices when compared to the 2010 year. In the 2011 year, total crude oil, condensate and NGL revenues contributed 69% of total revenue (before other) compared to 53% in the same period in 2010. Light crude oil, condensate and NGL revenues in the 2011 year comprised 94% of total crude oil, condensate and NGL revenues (before other) compared to 85% in the 2010 year.
Natural gas revenue before other income, royalties and commodity price risk management contracts for the year ended December 31, 2011 increased by approximately 12% compared to the 2010 year as a result of an approximate 24% increase in sales volumes offset by a weaker natural gas prices between the years.
| | Years ended December 31, | |
($000s) | | 2011 | | 2010 | |
Light crude oil and condensate | | 115,353 | | 43,502 | |
NGLs | | 15,782 | | 8,383 | |
Heavy oil | | 7,866 | | 9,062 | |
Crude oil and NGLs | | 139,001 | | 60,947 | |
Natural gas | | 61,186 | | 54,729 | |
Total revenue before other | | 200,187 | | 115,676 | |
Other (1) | | 2,131 | | 1,997 | |
Total revenue before royalties and risk management | | 202,318 | | 117,673 | |
(1) Other revenue primarily consists of processing and other third party income.
Revenues for 2012 are uncertain due to volatile commodity prices. While sales volumes, crude oil prices, and liquid prices for 2012 are expected to be higher than 2011, natural gas prices are anticipated to remain relatively weak.
Commodity Price Risk Management
The Company has a formal commodity price risk management policy which permits management to use specified price risk management strategies including fixed price contracts, collars and the purchase of floor price options and other derivative financial instruments and physical delivery sales contracts to reduce the impact of price volatility for a maximum of eighteen months beyond the transaction date. The program is designed to provide price protection on a portion of the Company’s future production in the event of adverse commodity price movement, while retaining significant exposure to upside price movements. By doing this, the Company seeks to provide a measure of stability to funds flow from operations, as well as to ensure Bellatrix realizes positive economic returns from its capital development and acquisition activities. The Company plans to continue its commodity price risk management strategies focusing on maintaining sufficient cash flow to fund Bellatrix’s capital expenditure program. Any remaining production is realized at market prices.
20
A summary of the financial commodity price risk management volumes and average prices by quarter currently outstanding as of March 7, 2012 is shown in the following tables:
Natural gas
Average Volumes (GJ/d)
| | Q1 2012 | | Q2 2012 | | Q3 2012 | | Q4 2012 | |
Fixed | | — | | 30,000 | | 30,000 | | 19,800 | |
Total GJ/d | | — | | 30,000 | | 30,000 | | 19,800 | |
Average Price ($/GJ AECO C)
| | Q1 2012 | | Q2 2012 | | Q3 2012 | | Q4 2012 | |
Fixed | | — | | 4.10 | | 4.10 | | 4.10 | |
Crude oil and liquids
Average Volumes (bbls/d)
| | Q1 2012 | | Q2 2012 | | Q3 2012 | | Q4 2012 | |
Call option | | 833 | | 833 | | 833 | | 833 | |
Fixed | | 3,000 | | 3,000 | | 3,000 | | 3,000 | |
Total bbls/d | | 3,833 | | 3,833 | | 3,833 | | 3,833 | |
| | Q1 2013 | | Q2 2013 | | Q3 2013 | | Q4 2013 | |
Call option | | 3,000 | | 3,000 | | 3,000 | | 3,000 | |
Average Price ($/bbl WTI)
| | Q1 2012 | | Q2 2012 | | Q3 2012 | | Q4 2012 | |
Call option (ceiling price) (US$/bbl) | | $ | 110.00 | | $ | 110.00 | | $ | 110.00 | | $ | 110.00 | |
Fixed price (CDN$/bbl) | | 92.30 | | 92.30 | | 92.30 | | 92.30 | |
| | | | | | | | | | | | | |
| | Q1 2013 | | Q2 2013 | | Q3 2013 | | Q4 2013 | |
Call option (ceiling price) (US$/bbl) | | $ | 110.00 | | $ | 110.00 | | $ | 110.00 | | $ | 110.00 | |
| | | | | | | | | | | | | |
Included in the above natural gas table are fixed price contracts of an average of $4.10/GJ at 30,000 GJ/d from April 1, 2012 to October 31, 2012 which were funded by selling call options of 3,000 bbl/d at US$110.00 for the 2013 calendar year.
As of December 31, 2011, the fair value of Bellatrix’s outstanding commodity contracts is a net unrealized liability of $10.6 million as reflected in the financial statements. The fair value or mark-to-market value of these contracts is based on the estimated amount that would have been received or paid to settle the contracts as at December 31, 2011 and may be different from what will eventually be realized. Changes in the fair value of the commodity contracts are recognized in the Consolidated Statements of Comprehensive Income within the financial statements.
21
The following is a summary of the gain (loss) on commodity contracts for the years ended December 31, 2011 and 2010 as reflected in the Consolidated Statements of Comprehensive Income in the financial statements:
Commodity contracts
($000s) | | Crude Oil
& Liquids | | Natural
Gas | | 2011 Total | |
Realized cash gain on contracts | | (4,015 | ) | 4,582 | | 567 | |
Unrealized loss on contracts (1) | | (9,879 | ) | 2,979 | | (6,900 | ) |
Total gain (loss) on commodity contracts | | (13,894 | ) | 7,561 | | (6,333 | ) |
Commodity contracts
($000s) | | Crude Oil
& Liquids | | Natural
Gas | | 2010 Total | |
Realized cash gain (loss) on contracts | | 1,036 | | 14,352 | | 15,388 | |
Unrealized gain (loss) on contracts (1) | | (3,785 | ) | (3,321 | ) | (7,106 | ) |
Total gain on commodity contracts | | (2,749 | ) | 11,031 | | 8,282 | |
(1) Unrealized gain (loss) on commodity contracts represent non-cash adjustments for changes in the fair value of these contracts during the period.
Royalties
For the year ended December 31, 2011, total royalties were $34.7 million compared to $22.9 million incurred in the 2010 year. Overall royalties as a percentage of revenue (after transportation costs) in the 2011 year were 18%, compared with 20% in the 2010 year.
The decrease in the royalty percentage for light oil, condensate and NGLs between the year ended December 31, 2011 and the comparative 2010 year is primarily due to increased production from recently drilled light oil wells which take advantage of Alberta royalty incentive programs. The heavy oil royalty rate for the 2011 year was higher compared to the 2010 year as a result of the sale of Saskatchewan heavy oil assets with lower royalty rates in December 2010, and recently added heavy oil production in Frog Lake, Alberta with higher crown royalty rates. The decrease in the royalty percentage for natural gas royalties between 2010 and 2011 is also primarily due to increased production from recently drilled wells which take advantage of Alberta royalty incentive programs.
Royalties by Commodity Type
| | Years ended December 31, | |
($000s, except where noted) | | 2011 | | 2010 | |
Light crude oil, condensate and NGLs | | 23,065 | | 11,695 | |
$/bbl | | 14.96 | | 14.97 | |
Average light crude oil, condensate and NGLs royalty rate (%) | | 18 | | 23 | |
| | | | | |
Heavy Oil | | 3,538 | | 2,012 | |
$/bbl | | 30.69 | | 13.44 | |
Average heavy oil royalty rate (%) | | 46 | | 23 | |
| | | | | |
Natural Gas | | 8,095 | | 9,207 | |
$/mcf | | 0.50 | | 0.70 | |
Average natural gas royalty rate (%) | | 14 | | 18 | |
| | | | | |
Total | | 34,698 | | 22,914 | |
$/boe | | 7.95 | | 7.37 | |
Average total royalty rate (%) | | 18 | | 20 | |
22
Royalties, by Type
| | Years ended December 31, | |
($000s) | | 2011 | | 2010 | |
Crown royalties | | 12,264 | | 7,216 | |
Indian Oil and Gas Canada royalties | | 8,346 | | 4,199 | |
Freehold & GORR | | 14,088 | | 11,499 | |
Total | | 34,698 | | 22,914 | |
Expenses
| | Years ended December 31, | |
($000s) | | 2011 | | 2010 | |
Production | | 50,313 | | 37,964 | |
Transportation | | 5,715 | | 3,723 | |
General and administrative | | 12,358 | | 9,414 | |
Interest and financing charges (1) | | 7,041 | | 7,403 | |
Share-based compensation | | 2,939 | | 1,618 | |
(1) Does not include financing charges in relation to the Company’s unwinding of decommissioning liabilities.
Expenses per boe
| | Years ended December 31, | |
($ per boe) | | 2011 | | 2010 | |
Production | | 11.53 | | 12.21 | |
Transportation | | 1.31 | | 1.20 | |
General and administrative | | 2.83 | | 3.03 | |
Interest and financing charges | | 1.61 | | 2.38 | |
Share-based compensation | | 0.67 | | 0.52 | |
Production Expenses
For the year ended December 31, 2011, production expenses totaled $50.3 million ($11.53/boe), compared to $38.0 million ($12.21/boe) recorded in the 2010 year. For the year ended December 31, 2011, production expenses increased overall but decreased on a per boe basis when compared to the 2010 year. The decrease in production expenses in 2011 on a boe basis is due to increased production which is a result of 2010 and 2011 drilling in areas with lower production expenses in conjunction with the Company’s continued efforts to streamline operations and field optimization projects.
Bellatrix is targeting operating costs of approximately $70.2 million ($11.00/boe) in 2012. This is based upon assumptions of estimated 2012 average production of approximately 16,500 boe/d to 17,000 boe/d, continued field optimization work and planned capital expenditures in producing areas which are anticipated to have lower operating costs.
23
Production Expenses, by Commodity Type
| | Years ended December 31, | |
($000s, except where noted) | | 2011 | | 2010 | |
Light crude oil, condensate and NGLs | | 20,536 | | 12,142 | |
$/bbl | | 13.32 | | 15.54 | |
| | | | | |
Heavy oil | | 2,587 | | 2,644 | |
$/bbl | | 22.44 | | 17.67 | |
| | | | | |
Natural gas | | 27,190 | | 23,178 | |
$/mcf | | 1.67 | | 1.77 | |
| | | | | |
Total | | 50,313 | | 37,964 | |
$/boe | | 11.53 | | 12.21 | |
| | | | | |
Total | | 50,313 | | 37,964 | |
Processing and other third party income (1) | | (2,131 | ) | (1,997 | ) |
Total after deducting processing and other third party income | | 48,182 | | 35,967 | |
$/boe | | 11.04 | | 11.57 | |
(1) Processing and other third party income is included within petroleum and natural gas sales on the Consolidated Statements of Comprehensive Income.
Transportation
Transportation expenses for the year ended December 31, 2011 were $5.7 million ($1.31/boe), compared to $3.7 million ($1.20/boe) in the 2010 year. The slight overall increase to per boe costs is reflective of increased oil hauling charges, offset somewhat by reduced gas transportation fees resulting from the acquisition of an ownership interest in certain processing facilities earlier in 2011.
Operating Netback
Field Operating Netback — Corporate (before risk management)
| | For the years ended December 31, | |
($/boe) | | 2011 | | 2010 | |
Sales | | 45.88 | | 37.20 | |
Transportation | | (1.31 | ) | (1.20 | ) |
Royalties | | (7.95 | ) | (7.37 | ) |
Production expense | | (11.53 | ) | (12.21 | ) |
Field operating netback | | 25.09 | | 16.42 | |
For the year ended December 31, 2011, corporate field operating netback (before commodity price risk management contracts) was $25.09/boe compared to $16.42/boe in the comparative 2010 year. The improved netback was primarily the result of an approximate 8% increase in the average sales volumes weighted toward oil, condensate and natural gas liquids, in conjunction with an increase in oil, condensate, and NGL commodity prices and decrease in production expenses, offset by an increase in transportation expenses and royalties. After including commodity price risk management contracts, the corporate field operating netback for 2011 was $25.22/boe compared to $21.37/boe in 2010.
Field Operating Netback — Crude Oil, Condensate and NGLs (before risk management)
| | Years ended December 31, | |
($/bbl) | | 2011 | | 2010 | |
Sales | | 83.89 | | 65.46 | |
Transportation | | (1.86 | ) | (0.95 | ) |
Royalties | | (16.06 | ) | (14.72 | ) |
Production expense | | (13.96 | ) | (15.88 | ) |
Field operating netback | | 52.01 | | 33.93 | |
24
Field operating netback for crude oil, condensate and NGLs averaged $52.01/bbl for the year ended December 31, 2011, up 53% compared to $33.93/bbl for the 2010 year. The significant increase is primarily due to the combination of higher average sales volumes for light oil, condensate and NGLs and an increase in commodity prices for crude oil, condensate and NGLs. The weighting toward light oil, condensate and NGLs sales volumes for the 2011 year increased approximately 8% in comparison to the 2010 year. In 2011, Bellatrix’s combined crude oil and NGLs average price (before risk management) increased approximately 28% compared to the 2010 year. A reduction in production expenses also contributed to the higher netback, which was partially offset by an increase in transportation and royalties. After including commodity price risk management contracts, field operating netback for crude oil and NGLs for the 2011 year was $49.58/boe compared to $35.03/boe in the 2010 year.
Field Operating Netback — Natural Gas (before risk management)
| | Years ended December 31, | |
($/mcf) | | 2011 | | 2010 | |
Sales | | 3.77 | | 4.19 | |
Transportation | | (0.16 | ) | (0.22 | ) |
Royalties | | (0.50 | ) | (0.71 | ) |
Production expense | | (1.67 | ) | (1.77 | ) |
Field operating netback | | 1.44 | | 1.49 | |
Field operating netback for natural gas in the 2011 year decreased 3% to $1.44/mcf, compared to $1.49/mcf in the 2010 year, reflecting depressed natural gas prices offset partially by lower transportation, royalties and production expenses. After including commodity price risk management contracts, field operating netback for natural gas for the year ended December 31, 2011 was $1.72/mcf compared to $2.59/mcf in the 2010 year.
General and Administrative
General and administrative (“G&A”) expenses (after capitalized G&A and recoveries) for the year ended December 31, 2011 were $12.4 million ($2.83/boe), compared to $9.4 million ($3.03/boe) for the same period in 2010. The increase in the G&A expense for the 2011 year from the 2010 year reflects higher compensation and base costs, partially offset by an increase in recoveries and an increase in capitalized G&A, which are consistent with Bellatrix’s higher 2011 capital program. G&A on a boe basis for the 2011 year decreased by approximately 7% when compared to the 2010 year primarily as a result of higher average sales volumes.
For 2012, the Company is anticipating G&A expenses after capitalization to be approximately $14.4 million ($2.26/boe) based on estimated 2012 average production volumes of approximately 16,500 boe/d to 17,000 boe/d.
General and Administrative Expenses
| | Years ended December 31, | |
($000s, except where noted) | | 2011 | | 2010 | |
Gross expenses | | 18,582 | | 14,154 | |
Capitalized | | (3,553 | ) | (1,977 | ) |
Recoveries | | (2,671 | ) | (2,763 | ) |
G&A expenses | | 12,358 | | 9,414 | |
G&A expenses, per unit ($/boe) | | 2.83 | | 3.03 | |
Interest and Financing Charges
Bellatrix recorded $7.0 million of interest and financing charges related to bank debt and its debentures for the year ended December 31, 2011 compared to $7.4 million in the 2010 year. The decrease in interest and financing charges is primarily due to lower interest and accretion charges in relation to the Company’s outstanding debentures, partially offset by higher interest charges related to the Company’s long-term debt as the Company carried a higher average debt
25
balance in the 2011 year compared to the 2010 year. Bellatrix’s total net debt at December 31, 2011 of $119.3 million includes the $49.1 million liability portion of its $55 million principal amount of 4.75% convertible unsecured subordinated debentures (the “4.75% Debentures”), $56.7 million of bank debt and the net balance of a working capital deficiency. The 4.75% Debentures have a maturity date of April 30, 2015.
Interest and Financing Charges (1)
| | Years ended December 31, | |
($000s, except where noted) | | 2011 | | 2010 | |
Interest and financing charges | | 7,041 | | 7,403 | |
Interest and financing charges ($/boe) | | 1.61 | | 2.38 | |
(1) Does not include financing charges in relation to the Company’s unwinding of decommissioning liabilities
Debt to Funds Flow from Operations Ratio
| | Years ended December 31, | |
($000s, except where noted) | | 2011 | | 2010 | |
| | | | | |
Debt to funds flow from operations (1) ratio annualized (3) | | | | | |
Funds flow from operations (1) (annualized) | | 120,480 | | 63,568 | |
Total net debt (2) at year end | | 119,250 | | 87,444 | |
Total net debt to periods funds flow from operations ratio annualized (3) | | 1.0x | | 1.4x | |
| | | | | |
Net debt (2) (excluding convertible debentures) at year end | | 70,174 | | 39,845 | |
Net debt to periods funds flow from operations ratio annualized (3) | | 0.6x | | 0.6x | |
| | | | | |
Debt to funds flow from operations (1) ratio | | | | | |
Funds flow from operations (1) for the year | | 94,237 | | 53,042 | |
Total net debt (2) to funds flow from operations for the year | | 1.3x | | 1.6x | |
| | | | | |
Net debt (2) (excluding convertible debentures) to funds flow from operations for the period | | 0.7x | | 0.8x | |
(1) As detailed previously in this Management’s Discussion and Analysis, funds flow from operations is a term that does not have any standardized meaning under GAAP. Funds flow from operations is calculated as cash flow from operating activities, decommissioning costs incurred and changes in non-cash working capital incurred. Refer to the reconciliation of cash flow from operating activities to funds flow from operations appearing elsewhere herein.
(2) Net debt and total net debt are considered non-GAAP terms. The Company’s calculation of total net debt includes the liability component of convertible debentures and excludes deferred liabilities, long-term commodity contract liabilities, decommissioning liabilities, long-term finance lease obligation and the deferred tax liability. Net debt and total net debt include the net working capital deficiency (excess) before short-term commodity contract assets and liabilities and current finance lease obligation. Net debt also excludes the liability component of convertible debentures. Total net debt and net debt are non-GAAP measures; refer to the following reconciliation of total liabilities to total net debt and net debt.
(3) Total net debt and net debt to periods funds flow from operations ratio (annualized) is calculated based upon fourth quarter funds flow from operations annualized.
26
Reconciliation of Total Liabilities to Total Net Debt and Net Debt
| | As at December 31, | |
($000s, except where noted) | | 2011 | | 2010 | |
Total liabilities per financial statements | | 232,017 | | 179,362 | |
Current liabilities included within working capital calculation | | (73,578 | ) | (46,670 | ) |
Deferred liability — flow-through shares | | — | | (3,768 | ) |
Commodity contract liability | | (2,944 | ) | — | |
Decommissioning Liabilities | | (45,091 | ) | (38,710 | ) |
Finance lease obligation | | (4,627 | ) | (1,443 | ) |
| | | | | |
Working Capital | | | | | |
Current assets | | (51,927 | ) | (44,119 | ) |
Current liabilities | | 73,578 | | 46,670 | |
Current portion of finance lease | | (490 | ) | (146 | ) |
Net commodity contract asset (liability) | | (7,688 | ) | (3,732 | ) |
| | 13,473 | | (1,327 | ) |
Total net debt | | 119,250 | | 87,444 | |
Convertible debentures | | (49,076 | ) | (47,599 | ) |
Net debt | | 70,174 | | 39,845 | |
Share-Based Compensation
Non-cash share-based compensation expense for the year ended December 31, 2011 was an expense of $2.9 million compared to $1.6 million in the 2010 year. The increase in non-cash share-based compensation expense between 2010 and 2011 is primarily a result of an increase in share options granted at a higher weighted average fair value as well as a $0.8 million expense related to the Deferred Share Unit Plan (the “Plan”) which was approved by the Board of Directors of Bellatrix on May 11, 2011. The Plan allows the Company to grant to non-employee directors Deferred Share Units (“DSUs”), each DSU being a right to receive, on a deferred payment basis, a cash payment equivalent to the volume weighted average trading price of the Company’s common shares for the five trading days immediately preceding the redemption date of such DSU. Participants of the Plan may also elect to receive their annual remuneration in the form of DSUs in lieu of cash. Subject to Toronto Stock Exchange and shareholder approval, Bellatrix may elect to deliver common shares from treasury in satisfaction in whole or in part of any payment to be made upon the redemption of the DSUs. The DSUs vest immediately and must be redeemed by December 1st of the calendar year immediately following the year in which the participant ceases to hold all positions with Bellatrix or earlier if the participant elects to have the DSUs redeemed at an earlier date (provided that the DSUs may not be redeemed prior to the date that the participant ceases to hold all positions with Bellatrix). The Plan was adopted to better align non-employee directors remuneration with that of shareholders. On a go forward basis, it is intended that in the event of a share based award, non-employee directors would receive DSU grants instead of share option grants as has been the past practice.
Depletion and Depreciation
Depletion and depreciation expense for the year ended December 31, 2011 was $63.4 million ($14.53/boe), compared to $47.9 million ($15.40/boe) recognized in the 2010 year. The increase in depletion and depreciation expense is primarily a result of a higher cost base and increased future development costs, partially offset by an increase in the reserve base used for the depletion calculation. Depletion and depreciation for the 2011 year on a per boe basis has decreased in comparison to the 2010 comparative period as a result of higher average sales volumes.
For the year ended December 31, 2011 Bellatrix has included a total of $376.8 million (2010: $288.8 million) for future development costs in the depletion calculation and excluded from the depletion calculation a total of $35.1 million (2010: $32.6 million) for estimated salvage.
27
Depletion and Depreciation
| | Years ended December 31, | |
($000s, except where noted) | | 2011 | | 2010 | |
Depletion and Depreciation | | 63,384 | | 47,901 | |
Per unit ($/boe) | | 14.53 | | 15.40 | |
Income Taxes
Deferred income taxes arise from differences between the accounting and tax bases of the Company’s assets and liabilities. For year ended December 31, 2011, the Company recognized a deferred income tax expense of $768 thousand compared to a recovery of $191 thousand in the 2010 year.
As at December 31, 2011, the Company had a total net deferred tax asset balance of $11.1 million. IFRS requires that a deferred tax asset be recorded when the tax pools exceeds the book value of assets, to the extent the amount is probable to be realized.
At December 31, 2011, Bellatrix had approximately $514 million in tax pools available for deduction against future income as follows:
($000s) | | Rate % | | 2011 | | 2010 | |
Intangible resource pools: | | | | | | | |
Canadian exploration expenses | | 100 | | 47,600 | | 44,000 | |
Canadian development expenses | | 30 | | 326,900 | | 286,500 | |
Canadian oil and gas property expenses | | 10 | | 25,100 | | 9,100 | |
Foreign resource expenses | | 10 | | 800 | | 900 | |
Attributed Canadian Royalty Income | | (Alberta) 100 | | 16,100 | | 16,100 | |
Undepreciated capital cost (1) | | 6 – 55 | | 83,100 | | 89,100 | |
Non-capital losses (expire through 2027) | | 100 | | 10,000 | | 300 | |
Financing costs | | 20 S.L. | | 4,700 | | 3,000 | |
| | | | 514,300 | | 449,000 | |
(1) Approximately $76 million of undepreciated capital cost pools are class 41, which is claimed at a 25% rate.
As a result of the issuance of the common shares issued on a “flow-through” basis on August 12, 2010, Bellatrix was committed to incur approximately $20 million in qualifying Canadian exploration expenses prior to December 31, 2011. Bellatrix has satisfied this commitment as of December 31, 2011.
Cash Flow from Operating Activities, Funds Flow from Operations and Net Profit (Loss)
As detailed previously in this Management’s Discussion and Analysis, funds flow from operations is a term that does not have any standardized meaning under GAAP. Funds flow from operations is calculated as cash flow from operating activities before realization of imputed interest costs on the 7.5% convertible unsecured subordinated debentures (the “7.5% Debentures”), decommissioning costs incurred and changes in non-cash working capital incurred.
28
Reconciliation of Cash Flow from Operating Activities and Funds Flow from Operations
| | Years ended December 31, | |
($000s) | | 2011 | | 2010 | |
Cash flow from operating activities | | 98,192 | | 44,272 | |
Realization of imputed interest costs on 7.5% Debentures | | — | | 5,050 | |
Decommissioning costs incurred | | 569 | | 1,373 | |
Change in non-cash working capital | | (4,524 | ) | 2,347 | |
Funds flow from operations | | 94,237 | | 53,042 | |
As previously noted in this MD&A, net profit before non-cash impairment loss and unrealized loss on commodity contracts is a non-GAAP measure. A reconciliation between this measure and net loss per the Consolidated Statement of Comprehensive Income is provided below.
For the year ended December 31, 2011, net profit before the non-cash impairment loss (reversal) on property, plant and equipment and the unrealized loss on commodity contracts, net of associated deferred tax impacts, was $18.4 million compared to a net loss of $2.1 million in 2010.
Reconciliation of Net Loss to Net Profit (Loss) before impairment and unrealized loss on commodity contracts
| | Years ended December 31, | |
($000s) | | 2011 | | 2010 | |
Net loss per financial statements | | (5,949 | ) | (4,985 | ) |
Items subject to reversal | | | | | |
Impairment loss (reversal) on property, plant and equipment | | 25,569 | | (3,238 | ) |
Unrealized loss on commodity contracts | | 6,900 | | 7,106 | |
Deferred tax impact of above items | | (8,117 | ) | (967 | ) |
Net profit (loss) before non-cash impairment loss and unrealized loss on commodity contracts | | 18,403 | | (2,084 | ) |
Bellatrix’s cash flow from operating activities of $98.2 million ($0.94 per basic share and $0.87 per diluted share) for the year ended December 31, 2011 increased approximately 122% from the $44.3 million ($0.47 per basic share and $0.46 per diluted share) generated in the 2010 year. Bellatrix generated funds flow from operations of $94.2 million ($0.91 per basic share and $0.84 per diluted share) for the year ended December 31, 2011, up 78% from $53.0 million ($0.57 per basic share and $0.54 per diluted share) for the 2010 year. The increase is principally due to higher operating netbacks for crude oil, condensate and NGLs as the weighting toward light oil, condensate and natural gas liquids sales volumes increased in combination with improved pricing for crude oil, condensate and NGLs and a reduction in interest and finance charges. The increase between years was partially offset by a significant reduction in net realized gains on the Company’s commodity risk management contracts, as well as an increase in G&A expenses.
Bellatrix maintains a commodity price risk management program to provide a measure of stability to funds flow from operations. Unrealized mark—to—market gains or losses are non-cash adjustments to the current fair market value of the contract over its entire term and are included in the calculation of net profit.
A net loss of $5.9 million ($0.06 per diluted share) was recognized for the year ended December 31, 2011, compared to a net loss of $5.0 million ($0.05 per diluted share) in the 2010 year. The net loss recorded in the year ended December
29
31, 2011 compared to the net loss in 2010 is primarily a consequence of $15.4 million increase in depletion and depreciation expenses, a $25.6 million non-cash impairment loss on oil and gas properties in 2011 compared to a $3.2 million impairment reversal in 2010 and $1.0 million higher deferred tax expense, offset partially by higher cash flows as noted above.
Cash Flow from Operating Activities, Funds Flow from Operations and Net Profit (Loss)
| | Years ended December 31, | |
($000s, except per share amounts) | | 2011 | | 2010 | |
Cash flow from operating activities | | 98,192 | | 44,272 | |
Basic ($/share) | | 0.95 | | 0.47 | |
Diluted ($/share) | | 0.87 | | 0.46 | |
| | | | | |
Funds flow from operations | | 94,237 | | 53,042 | |
Basic ($/share) | | 0.91 | | 0.57 | |
Diluted ($/share) | | 0.84 | | 0.54 | |
| | | | | |
Net profit (loss) | | (5,949 | ) | (4,985 | ) |
Basic ($/share) | | (0.06 | ) | (0.05 | ) |
Diluted ($/share) | | (0.06 | ) | (0.05 | ) |
Capital Expenditures
Bellatrix invested $176 million on exploration and development activities (before drilling credits) during the year ended December 31, 2011 compared to $102 million in the comparative 2010 year. The increase in these expenditures during the period is consistent with the higher capital budget for 2011.
Capital Expenditures
| | Years ended December 31, | |
($000s) | | 2011 | | 2010 | |
Lease acquisitions and retention | | 16,367 | | 480 | |
Geological and geophysical | | 433 | | 737 | |
Drilling and completion costs | | 141,051 | | 90,914 | |
Facilities and equipment | | 18,471 | | 9,384 | |
| | 176,322 | | 101,515 | |
Drilling incentive credits | | (827 | ) | (3,128 | ) |
Exploration and development (1) | | 175,495 | | 98,387 | |
Corporate (2) | | 268 | | 521 | |
Property acquisitions | | 3,798 | | 7,840 | |
Total capital expenditures — cash | | 179,561 | | 106,748 | |
Property dispositions — cash | | (4,203 | ) | (14,567 | ) |
Total net capital expenditures — cash | | 175,358 | | 92,181 | |
Capital lease additions — non-cash | | 3,700 | | 1,600 | |
Other — non-cash (3) | | 6,875 | | (573 | ) |
Total non-cash | | 10,575 | | 1,027 | |
Total net capital expenditures | | 185,933 | | 93,208 | |
(1) Excludes capitalized costs related to decommissioning liabilities expenditures incurred during the year.
(2) Corporate includes office furniture, fixtures and equipment.
(3) Other includes non-cash adjustments for the current year’s decommissioning liabilities and share based compensation.
In the year ended December 31, 2011, Bellatrix drilled or participated in a total of 54 gross (34.84 net) wells consisting of 39 gross (29.04 net) oil wells, 14 gross (5.79 net) liquids rich gas wells and 1 gross (0.007 net) dry hole.
During the 2011 year, Bellatrix has added 40 gross and net contiguous sections in the Ferrier area which includes highly prospective Cardium and Duvernay mineral rights. During the first quarter of 2011, Bellatrix entered into an agreement
30
to acquire 20 net sections of Cardium rights. In August 2011, Bellatrix added an additional 20 gross and net contiguous sections in the Ferrier area.
By comparison, Bellatrix drilled or participated in 48 gross (28.8 net) wells in the 2010 year, including 21.5 net oil wells, 6.3 net natural gas wells, and one dry hole.
The $179.6 million capital program for the year ended December 31, 2011 was financed from funds flow from operations, and the proceeds from the May 2011 equity financing and bank debt.
Based on the current economic conditions and Bellatrix’s operating forecast for 2012, the Company budgets a capital program of $180 million funded from the Company’s cash flows and to the extent necessary, bank indebtedness. The 2012 capital budget is expected to be directed primarily towards horizontal drilling and completions activities in the Cardium and Notikewin areas. In addition, with the spudding of Bellatrix’s first (100% WI) Duvernay well in the first quarter of 2012, the Company is embarking on development of its third resource play in the potentially high impact Duvernay Shale.
Impairment of Assets
The Company calculates an impairment test in accordance with IFRS. If there are indicators of impairment, the impairment test is performed at the asset or cash generating unit (“CGU”) level. IAS 36 — “Impairment of Assets” (“IAS 36”) is a one step process for testing and measuring impairment of assets. Under IAS 36, the asset or CGU’s carrying value is compared to the higher of: value-in-use and fair value less costs to sell. Value in use is defined as the present value of future cash flows expected to be derived from the asset or CGU.
The following impairments were recorded in 2011:
($000s) | | Oil and natural
gas properties | | Office furniture
and equipment | | Total | |
Q3 2011 impairment | | $ | 14,496 | | $ | 55 | | $ | 14,551 | |
Q4 2011 impairment | | 13,543 | | 139 | | 13,682 | |
Q4 2011 impairment reversal | | (2,664 | ) | — | | (2,664 | ) |
Total | | $ | 25,375 | | $ | 194 | | $ | 25,569 | |
Bellatrix engaged an external reserve evaluator to prepare an updated company reserve report effective December 31, 2011, and previously at June 30, 2011. Overall corporate proved and probable reserve volumes increased significantly at December 31, 2011 and June 30, 2011 compared to the previous reserve evaluation report effective December 31, 2010 as a result of the Company’s successful 2011 drilling program in its core West Central Alberta properties. However, the reserves in respect of the North East Alberta CGU as at December 31, 2011 and the South East Alberta CGU and remaining properties in the Meekwap CGU as at September 30, 2011 were subject to significant reductions resulting in an indicator of impairment. The reduction of reserves in these CGUs was predominantly due to weak future natural gas prices which truncated the reserves. The recoverable amount of these CGUs therefore decreased as a result of this reduction in the reserve base used in the impairment tests. No reserves have been assigned to the remaining properties within the Company’s Meekwap CGU.
The impairments as at December 31, 2011 and September 30, 2011 are as follows:
As at December 31, 2011, Bellatrix performed an impairment test in accordance with IAS 36 resulting in an excess of the carrying value of one non-core CGU over its recoverable amount. The Company’s North East Alberta CGU was impaired by $13.7 million, resulting in a non-cash $13.7 million impairment loss recognized in the fourth quarter of 2011.
31
As at September 30, 2011, Bellatrix performed an impairment test in accordance with IAS 36 resulting in an excess of the carrying value of two non-core CGUs over their recoverable amount. The Company’s South East Alberta CGU and the remaining properties in its Meekwap CGU were impaired by $13.5 million and $1.1 million, respectively, resulting in a non-cash $14.6 million impairment loss recognized in the third quarter of 2011.
IAS 36 requires impairment losses to be reversed when there has been a subsequent increase in the recoverable amount. In the case of an impairment loss reversal, the carrying amount of the asset or CGU is limited to the original carrying amount less depreciation, depletion and amortization as if no impairment had been recognized for the asset or CGU for prior periods. In the fourth quarter of 2011, a partial reversal of impairment was recognized relating to the Q3 2011 impairment for the Company`s South East Alberta CGU. As a result of the reversal, impairment expense for the 2011 year was reduced by $2.7 million.
The impairment test is based upon fair market values for the Company’s properties, including but not limited to an updated external reserve engineering report which incorporates a full evaluation of reserves on an annual basis or internal reserve updates at quarterly periods, and the latest commodity pricing deck. Estimating reserves is very complex, requiring many judgments based on available geological, geophysical, engineering and economic data. Changes in these judgments could have a material impact on the estimated reserves. These estimates may change, having either a negative or positive effect on net earnings as further information becomes available and as the economic environment changes.
Decommissioning Liabilities
As at December 31, 2011, Bellatrix has recorded decommissioning liabilities of $45.1 million, compared to $38.7 million at December 31, 2010, for future abandonment and reclamation of the Company’s properties. For the year ended December 31, 2011, the liability increased by $6.4 million as a result of $1.7 million incurred on property acquisitions and development activities, $0.9 million as a result of charges for the unwinding of the discount rates used for fair valuing the liabilities, and $4.7 million for changes in estimates, offset by a reduction of $0.3 million for liabilities reversed on dispositions and $0.6 million for liabilities settled during the year. The $4.7 million increase as a result of changes in estimates is primarily due to a lower risk-free discount rate at December 31, 2011 compared to 2010, in addition to other abandonment liability revisions.
Liquidity and Capital Resources
As an oil and gas business, Bellatrix has a declining asset base and therefore relies on ongoing development and acquisitions to replace production and add additional reserves. Future oil and natural gas production and reserves are highly dependent on the success of exploiting the Company’s existing asset base and in acquiring additional reserves. To the extent Bellatrix is successful or unsuccessful in these activities, cash flow could be increased or reduced.
Bellatrix is focused on growing oil and natural gas production from its diversified portfolio of existing and emerging resource plays in Western Canada. Bellatrix remains highly focused on key business objectives of maintaining financial strength, optimizing capital investments — attained through a disciplined approach to capital spending, a flexible investment program and financial stewardship. Natural gas prices are primarily driven by North American supply and demand, with weather being the key factor in the short term. Bellatrix believes that natural gas represents an abundant, secure, long-term supply of energy to meet North American needs. Bellatrix’s results are affected by external market and risk factors, such as fluctuations in the prices of crude oil and natural gas, movements in foreign currency exchange rates and inflationary pressures on service costs. Market conditions have resulted in Bellatrix recently experiencing an upward trend in crude oil pricing and an opposite trend in natural gas pricing.
Liquidity risk is the risk that Bellatrix will not be able to meet its financial obligations as they become due. Bellatrix actively manages its liquidity through daily and longer-term cash, debt and equity management strategies. Such strategies encompass, among other factors: having adequate sources of financing available through its bank credit
32
facilities, estimating future cash generated from operations based on reasonable production and pricing assumptions, analysis of economic risk management opportunities, and maintaining sufficient cash flows for compliance with operating debt covenants. Bellatrix is fully compliant with all of its operating debt covenants.
Bellatrix generally relies on operating cash flows and its credit facilities to fund capital requirements and provide liquidity. Future liquidity depends primarily on cash flow generated from operations, existing credit facilities and the ability to access debt and equity markets. From time to time, the Company accesses capital markets to meet its additional financing needs and to maintain flexibility in funding its capital programs. While Bellatrix recently completed a $55 million equity financing on a bought deal basis in May of 2011, there can be no assurance that future debt or equity financing, or cash generated by operations will be available or sufficient to meet these requirements or for other corporate purposes or, if debt or equity financing is available, that it will be on terms acceptable to Bellatrix.
Credit risk is the risk of financial loss to Bellatrix if a customer or counterparty to a financial instrument fails to meet its contractual obligations, and arises principally from Bellatrix’s trade receivables from joint venture partners, petroleum and natural gas marketers, and financial derivative counterparties.
A substantial portion of Bellatrix’s accounts receivable are with customers and joint interest partners in the petroleum and natural gas industry and are subject to normal industry credit risks. Bellatrix sells substantially all of its production to six primary purchasers under standard industry sale and payment terms. The most significant 60 day exposure to a single counterparty is currently approximately $15.6 million. Purchasers of Bellatrix’s natural gas, crude oil and natural gas liquids are subject to a periodic internal credit review to minimize the risk of non-payment. Bellatrix has continued to closely monitor and reassess the creditworthiness of its counterparties, including financial institutions. This has resulted in Bellatrix reducing or mitigating its exposures to certain counterparties where it is deemed warranted and permitted under contractual terms.
Bellatrix may be exposed to third party credit risk through its contractual arrangements with its current or future joint venture partners, marketers of its petroleum and natural gas production, derivative counterparties and other parties. In the event such entities fail to meet their contractual obligations to Bellatrix, such failures may have a material adverse effect on the Company’s business, financial condition, results of operations and prospects. In addition, poor credit conditions in the industry and of joint venture partners may impact a joint venture partner’s willingness to participate in Bellatrix’s ongoing capital program, potentially delaying the program and the results of such program until Bellatrix finds a suitable alternative partner.
During 2010, Bellatrix concentrated on executing its considerable drilling program and improving its balance sheet. Bellatrix took advantage of several financial opportunities that improved the Company’s financial flexibility. In 2011, Bellatrix continued to focus on its drilling program and maintaining a strong balance sheet. In May 2011, Bellatrix closed an equity issuance of 9.8 million common shares on a bought deal basis at a price of $5.60 per share for gross proceeds of $55.0 million (net proceeds of $51.9 million after transaction costs). The net proceeds from this financing were used to temporarily reduce outstanding indebtedness, thereby freeing up borrowing capacity that may be redrawn to fund Bellatrix’s ongoing capital expenditures program and general corporate purposes.
Total net debt levels of $119.3 million at December 31, 2011 have increased $31.9 million from $87.4 million at December 31, 2010, primarily as a consequence of an increase in a working capital deficiency as the Company executed its 2011 intensive capital program. Total net debt includes the liability component of the 4.75% Debentures and excludes unrealized commodity contract assets and liabilities, deferred taxes, finance lease obligations, deferred liabilities and decommissioning liabilities.
Funds flow from operations represents 52% of the funding requirements for Bellatrix’s capital expenditures for the year ended December 31, 2011. The remainder was financed with proceeds from the May 2011 equity financing and bank debt.
33
Effective November 25, 2011, the Company’s borrowing base was increased from $140 million to $170 million. The Company’s credit facilities consist of a $15 million demand operating facility provided by a Canadian bank and a $155 million extendible revolving term credit facility provided by two Canadian banks and a Canadian financial institution. Amounts borrowed under the credit facility will bear interest at a floating rate based on the applicable Canadian prime rate, U.S. base rate or LIBOR margin rate, plus between 1.00% and 3.50%, depending on the type of borrowing and the Company’s debt to cash flow ratio. The credit facilities are secured by a $400 million debenture containing a first ranking charge and security interest. Bellatrix has provided a negative pledge and undertaking to provide fixed charges over major petroleum and natural gas reserves in certain circumstances. A standby fee is charged of between 0.50% and 0.875% on the undrawn portion of the credit facilities, depending on the Company’s debt to cash flow ratio.
The revolving period for the revolving term credit facility will end on June 26, 2012, unless extended for a further 364 - day period. Should the facility not be extended it will convert to a non-revolving term facility with the full amount outstanding due 366 days after the last day of the revolving period of June 26, 2012. The borrowing base will be subject to re-determination on May 31 and November 31 in each year prior to maturity, with the next semi-annual redetermination occurring on May 31, 2012.
As at December 31, 2011, approximately $113.3 million or 67% was undrawn under the existing credit facilities and is available to fund Bellatrix’s ongoing capital spending and operational requirements.
As an added layer of protection of its cash flows, Bellatrix has fixed contracts that provide for 3,000 bbl/d of crude oil at an average price of CAD$92.30/bbl for the 2012 year, as well as a call option providing for 833 bbl/d of crude oil at a price of US$110.00/bbl for the 2012 year, and a call option providing for 1,000 bbl/d of crude oil at a price of US$110.00/bbl for the 2013 year. In addition, the Company has a fixed price contract for natural gas that provides for 10,000 GJ/d at a price of CAD$4.10/GJ from April 1st to October 31st of 2012.
Subsequent to year end, Bellatrix added two additional fixed price contracts that provide for a total of 20,000 GJ/d of natural gas at an average price of CAD$4.11/GJ spanning from April 1st to October 31st, 2012, as well as two additional call options providing for 2,000 bbl/d of crude oil at a price of US$110.00/bbl in place for the 2013 year.
Bellatrix currently has commitments associated with its credit facilities outlined above and the commitments outlined under the “Commitments” section. Bellatrix continually monitors its capital spending program in light of the recent volatility with respect to commodity prices and Canadian dollar exchange rates with the aim of ensuring the Company will be able to meet future anticipated obligations incurred from normal ongoing operations with funds flow from operations and draws on Bellatrix’s credit facility, as necessary. Bellatrix has the ability to fund its 2012 capital program of $180 million by utilizing cash flow, and to the extent necessary, bank indebtedness.
As at February 29, 2012, Bellatrix had outstanding a total of 7,945,154 options exercisable at an average exercise price of $3.44 per share, $55.0 million principal amount of 4.75% Debentures convertible into common shares (at a conversion price of $5.60 per share) and 107,422,406 common shares.
Related Party Transactions
During 2010 and 2011, the Company entered into agreements to obtain financing in the amount of $1.6 million and $3.7 million, respectively, for the construction of certain facilities.
34
Members of the Company’s management team and entities affiliated with them provided financing of $600,000 in 2011 ($300,000 in 2010). The terms of the transactions with those related parties were the same as those with arms-length participants.
Commitments
As at December 31, 2011, Bellatrix committed to drill 4 gross (3.17 net) wells pursuant to farm-in agreements. Bellatrix expects to satisfy these drilling commitments at an estimated cost of approximately $10.8 million. In addition, on February 1, 2011, Bellatrix entered into a joint venture agreement which includes a minimum commitment for the Company to drill 3 gross (3.0 net) wells per year for 2011 to 2015 for a total estimated cost of approximately $52.5 million. As at December 31, 2011, 12 wells remained to be drilled under this commitment for a total estimated cost of $42.0 million. On August 4, 2011, Bellatrix entered in a joint venture agreement which includes a minimum commitment for the Company to drill between 5 to 10 gross and net wells per year for 2011 to 2016 for a total of 40 gross and net wells at an estimated cost of approximately $140.0 million, with the first five wells requiring completion by November of 2012. In respect of the February 1, 2011 joint venture agreement, the Company also committed to drilling 1 gross (1 net) test well at an estimated cost of $7.8 million.
The following are the contractual maturities of financial liabilities as at December 31, 2011:
Financial liability ($000s) | | < 1 Year | | 1-2 Years | | 2-5 Years | | Thereafter | |
Accounts payable and accrued liabilities (1) | | $ | 62,421 | | $ | — | | $ | — | | $ | — | |
Commodity contract liability | | 10,677 | | 2,944 | | — | | — | |
Bank debt — principal (2) | | — | | 56,701 | | — | | — | |
Convertible debentures — principal | | — | | — | | 55,000 | | — | |
Convertible debentures — interest (3) | | 2,620 | | 2,613 | | 3,471 | | — | |
Finance lease obligation | | 490 | | 513 | | 1,686 | | 2,428 | |
Total | | $ | 76,208 | | $ | 62,771 | | $ | 60,157 | | $ | 2,428 | |
(1) As at December 31, 2011, $0.4 million of accrued coupon interest payable in relation to the 4.75% Debentures and $0.2 million of accrued interest payable in relation to the credit facilities is included in Accounts Payable and Accrued Liabilities.
(2) Bank debt is based on a revolving term which is reviewed annually and converts to a 366 day non-revolving facility if not renewed.
(3) The 4.75% Debentures outstanding at December 31, 2011 bear interest at a coupon rate of 4.75%, which currently requires total annual interest payments of $2.6 million.
The Company estimates the total undiscounted amount of cash flows required to settle its decommissioning liabilities to be approximately $51 million which is estimated to be incurred between 2013 and 2053.
Off-Balance Sheet Arrangements
The Company has certain fixed term lease agreements, including primarily office space leases, which were entered into in the normal course of operations. All leases have been treated as operating leases whereby the lease payments are included in operating expenses or G&A expenses depending on the nature of the lease. The lease agreements do not currently provide for early termination. No asset or liability value has been assigned to these leases in the balance sheet as of December 31, 2011.
The Company is committed to payments under fixed term operating leases which do not currently provide for early termination. The Company’s commitment for office space is as follows:
35
($000s)
Year | | Gross
Amount | | Expected
Recoveries | | Net amount | |
2012 | | $ | 2,219 | | $ | 1,062 | | $ | 1,157 | |
2013 | | 2,218 | | 1,102 | | 1,116 | |
2014 | | 1,469 | | 753 | | 716 | |
| | | | | | | | | | |
Business Prospects and 2012 Year Outlook
Bellatrix continues to develop its core assets and conduct exploration programs utilizing its large inventory of geological prospects. As at December 31, 2011, Bellatrix has approximately 224,559 net undeveloped acres, and including all opportunities has in excess of 900 exploitation drilling opportunities identified, representing over 10 years of drilling inventory based on annual cashflow. The Company continues to focus on adding Cardium prospective lands. Year to date, Bellatrix has added 40 gross and net contiguous sections in the Ferrier area which includes highly prospective Cardium and Duvernay mineral rights.
As an added layer of protection of its cash flows, Bellatrix has fixed contracts that provide for 3,000 bbl/d of crude oil at an average price of CAD$92.30/bbl for the 2012 year, as well as a call option providing for 833 bbl/d of crude oil at a price of US$110.00/bbl for the 2012 year, and a call option providing for 1,000 bbl/d of crude oil at a price of US$110.00/bbl for the 2013 year. In addition, the Company has a fixed price contract for natural gas that provides for 10,000 GJ/d at a price of CAD$4.10/GJ from April 1st to October 31st of 2012.
Subsequent to year end, Bellatrix added two additional fixed price contracts that provide for a total of 20,000 GJ/d of natural gas at an average price of CAD$4.11/GJ spanning from April 1st to October 31st, 2012, as well as two additional call options providing for 2,000 bbl/d of crude oil at a price of US$110.00/bbl in place for the 2013 year.
For 2012, Bellatrix will continue to be active in drilling its two core resource plays, the Cardium oil and Notikewin condensate rich gas, utilizing horizontal drilling multi fracturing technology. In addition, with the spudding of Bellatrix’s first (100% WI) Duvernay well in the first quarter of 2012, the Company is embarking on development of its third resource play in the potentially high impact Duvernay Shale. An initial capital budget of $180 million has been set for fiscal 2012. Based on the timing of proposed expenditures, downtime for anticipated plant turnarounds and normal production declines, execution of the 2012 budget is anticipated to provide 2012 average daily production of approximately 16,500 boe/d to 17,000 boe/d and an exit rate of approximately 18,000 boe/d to 18,500 boe/d.
Financial Reporting Update
Adoption of International Financial Reporting Standards
As of January 1, 2011, Bellatrix prepares its consolidated financial statements and comparative information in accordance with IFRS, “IFRS 1” and International Accounting Standard 34 — Interim Financial Reporting, as issued by the International Accounting Standards Board. Previously, Bellatrix’s financial statements were prepared in accordance with previous GAAP.
The Company’s IFRS accounting policies are provided in Note 3 of the Consolidated Financial Statements. This MD&A for the year ended December 31, 2011 includes detailed information on the Company’s IFRS accounting policies and elections, including the estimated impact of adoption of the accounting policies. In addition, Note 23 in the Consolidated Financial Statements presents reconciliations between the Company’s 2010 previous GAAP results and the 2010 IFRS results. The Company presents reconciliations of equity as at January 1, 2010 and December 31, 2010, as well as reconciliations of Total Comprehensive Income for the year ended December 31, 2010.
36
Accounting Policy Changes
The following discussion explains the significant differences between Bellatrix’s previous GAAP accounting policies and those applied by the Company under IFRS and specifically, IFRS 1. IFRS policies have been retrospectively and consistently applied except where specific IFRS 1 optional and mandatory exemptions permitted an alternative treatment upon transition to IFRS for first-time adopters.
The most significant changes to the Company’s accounting policies relate to the accounting for petroleum and natural gas expenditures. Under previous GAAP, Bellatrix followed the Canadian Institute of Chartered Accountants (“CICA”) guideline on full cost accounting in which all costs directly associated with the acquisition of, the exploration for, and the development of crude oil, natural gas liquids and natural gas reserves were capitalized on a cost centre basis. Under previous GAAP, Bellatrix only had one cost centre. Costs accumulated within the cost centre were depleted using the unit-of-production method based on proved reserves determined using estimated future prices and costs. Upon transition to IFRS, Bellatrix was required to adopt new accounting policies for petroleum and natural gas expenditures, including exploration and evaluation (“E&E”) costs and development costs.
Under IFRS, exploration and evaluation costs are those expenditures for an area where technical feasibility and commercial viability has not yet been determined. Development costs include those expenditures for areas where technical feasibility and commercial viability has been determined. Bellatrix adopted the IFRS 1 exemption whereby the Company deemed its January 1, 2010 property, plant and equipment (“PP&E) costs to be equal to its previous GAAP historical PP&E net book value. Accordingly, exploration and evaluation costs were deemed equal to the unproved properties balance and the development costs were deemed equal to the remaining PP&E balance. Under IFRS, exploration and evaluation costs are presented as exploration and evaluation assets and development costs of reserves are presented within property, plant and equipment on the Consolidated Balance Sheet.
The following discussion highlights significant changes to our critical accounting policies and estimates from those disclosed in our MD&A for the year ended December 31, 2010.
Exploration and Evaluation (“E&E”)
E&E costs are capitalized when the legal right to explore has been obtained but before technical feasibility and commercial viability have been determined. Under previous GAAP, Bellatrix would capitalize all expenditures associated with unproved properties. Once technical feasibility and commercial viability has been determined, the capitalized costs are transferred from E&E assets to PP&E and are subject to an impairment test.
Bellatrix has adopted an accounting policy whereby E&E assets will not be subject to depletion. Costs associated with unproved properties under previous GAAP were not subject to depletion.
Depletion and Depreciation
Previous GAAP provided specific guidelines on the depletion calculation for oil and natural gas properties. Depletion was calculated based on proved reserves. Under IFRS, the Company has a choice in the reserve base to use for its depletion calculations. Bellatrix has adopted a policy of depleting its oil and natural gas properties using its proved plus probable reserve base. In addition, depletion calculations under previous GAAP were done on a cost centre basis, for which under previous GAAP, the Company only had one. Under IFRS, the Company is required to calculate depletion based on individual components for which the company has identified to be at the area level.
Impairments
IFRS requires an asset impairment test to be conducted on transition date and when indicators of impairment are present. Under previous GAAP, impairment of long-lived assets is assessed on the basis of an asset’s estimated
37
undiscounted future cash flows compared with the asset’s carrying amount and if impairment is indicated, discounted cash flows are prepared to quantify the amount of impairment. The impairment test under previous GAAP is done at the cost centre level. Under previous GAAP, Bellatrix had one cost centre for impairment test purposes. Impairments recognized under previous GAAP were not reversed.
IFRS requires the impairment test to occur at the asset level or at the CGU level. The carrying amount of the asset or CGU is compared to its recoverable amount which is the higher of discounted cash flows or fair value less costs to sell. Under IFRS, impairments recognized are reversed when there has been a subsequent increase in the recoverable amount. In the case of an impairment reversal, the carrying amount of the asset or CGU is limited to the original carrying amount less depreciation, depletion and amortization as if no impairment had been recognized for the asset or CGU for prior periods.
Asset Divestitures
Under previous GAAP, proceeds of a divestiture are deducted from the country cost centre pool without recognition of a gain or loss unless such a deduction resulted in a change to the depletion rate of 20% or greater. Under IFRS, proceeds of a divestiture are deducted from the carrying value of the asset and a gain or loss is recognized in earnings.
Decommissioning Liabilities
IAS 37 — “Provisions, Contingent Liabilities and Contingent Assets,” will govern how the Company accounts for its decommissioning liabilities (previously referred to as asset retirement obligations). The discount rate used for the decommissioning liability will be a risk free rate as the estimated provision is adjusted to reflect risks specific to the liability. Under previous GAAP, the Company used a credit-adjusted risk free rate. Therefore, under IFRS, the decommissioning liabilities are higher due to lower discount rates used. Under IFRS, the liability is to be re-measured each reporting period in order to reflect interest rates in effect at that time.
Share Based Payments
Differences in the accounting for the Company’s share option plan under previous GAAP and IFRS exist. IFRS 2 — “Share-based Payments,” requires the Company to estimate the number of options expected to vest when a grant of equity instruments do not vest immediately. IFRS 2 does not allow the recognition of the expense on a straight-line basis and requires each installment to be treated as a separate arrangement. Under previous GAAP, the Company accounted for forfeitures as they occurred and recognized share-based compensation expense using the graded method, which is the method required under IFRS.
Flow-through Shares
Under previous GAAP, the accounting treatment of flow-through shares was addressed by EIC 146 — “Flow-Through Shares”. Under previous GAAP, the proceeds received for the flow-through shares are credited to shareholders’ capital and the deferred tax liability is recognized when the Company files the renouncement documents with the tax authorities to renounce the tax credits associated with the expenditures.
Under IFRS, Bellatrix set up a liability for the difference between the proceeds received and the market price of the shares on the date of the transaction (the “premium”). As the expenditures are made, Bellatrix records the related tax liability associated with the renouncement of the tax benefits and removes the deferred liability originally set up. The difference between the deferred tax liability and the original liability set up goes through profit or loss.
38
Convertible Debentures
Convertible debentures have both a debt and equity component under IFRS and previous GAAP. As a consequence of the Company having status as an income trust in 2009, and no IFRS 1 exemption related to the conversion feature of convertible debentures for trust units, the Company has treated the 7.5% Debentures as a financial derivative instrument (the “instrument”). As a result, the fair value of the instrument was determined to be nil. The offsetting entry was made to share capital as a result of the Company’s deficit elimination effective November 1, 2009. In addition, this IFRS difference has caused a $1.6 million increase to the Company’s deficit as a result of the 7.5% Debenture redemption in the second quarter of 2010, as opposed to the $2.9 million reduction in the deficit under previous GAAP.
Also, the allocation of deferred tax on the convertible debentures differs under previous GAAP and IFRS. Under previous GAAP, the tax basis of the liability is considered to be the same as its carrying amount; therefore, no temporary difference exists. IFRS does not contain this special exemption and requires the temporary difference to be recognized. The deferred tax adjustment is charged directly to the carrying amount of the equity component of the convertible debentures.
Future Accounting Pronouncements
New and Amended Standards
The following pronouncements from the International Accounting Standards Board (“IASB”) are applicable to Bellatrix and will become effective for future reporting periods, but have not yet been adopted:
IFRS 10 — “Consolidated Financial Statements” (“IFRS 10”), which requires an entity to consolidate an investee when it is exposed, or has rights, to variable returns from its involvement with the investee and has the ability to affect those returns through its power over the investee. Under existing IFRS, consolidation is required when an entity has the power to govern the financial and operating policies of an entity so as to obtain benefits from its activities. This standard replaces SIC-12 — “Consolidation—Special Purpose Entities” and parts of IAS 27 — “Consolidated and Separate Financial Statements.”
IFRS 11 — “Joint Arrangements” (“IFRS 11”), requires a venturer to classify its interest in a joint arrangement as a joint venture or joint operation, each having its own accounting model. Joint ventures will be accounted for using the equity method of accounting whereas for a joint operation the venture will recognize its share of the assets, liabilities, revenue and expenses of the joint operation. The standard provides for a more substance based reflection of joint arrangements by focusing on the rights and obligations of the arrangement, rather than its legal form. IFRS 11 replaces IAS 31 — “Interests in Joint Ventures” and SIC-13 — “Jointly Controlled Entities—Non-monetary Contributions by Venturers” and establishes principles for accounting for all joint arrangements.
IFRS 12 — “Disclosure of Interests in Other Entities” (“IFRS 12”), establishes disclosure requirements for interests in other entities, such as joint arrangements, associates, special purpose vehicles and off balance sheet vehicles. The standard carries forward existing disclosures and also introduces significant additional disclosure requirements that address the nature of, and risks associated with, an entity’s interests in other entities.
Amendments have been made to existing standards, including IAS 27 — “Separate Financial Statements” (“IAS 27”) and IAS 28 — “Investments in Associates and Joint Ventures” (“IAS 28”). IAS 27 addresses accounting for subsidiaries, jointly controlled entities and associates in non-consolidated financial statements. IAS 28 has been amended to include joint ventures in its scope and to address the changes in IFRS 10 to 12.
The above standards are effective for annual periods beginning on or after January 1, 2013. Early adoption is permitted, providing the five standards are adopted concurrently. We are currently evaluating the impact of adopting these standards on our Consolidated Financial Statements.
39
IFRS 13 — “Fair Value Measurement” (“IFRS 13”), is a comprehensive standard for fair value measurement and disclosure requirements for use across all IFRSs. The new standard clarifies that fair value is the price that would be received to sell an asset, or paid to transfer a liability in an orderly transaction between market participants, at the measurement date. It also establishes disclosures about fair value measurement. Under existing IFRS, guidance on measuring and disclosing fair value is dispersed among the specific standards requiring fair value measurements and in many cases does not reflect a clear measurement basis or consistent disclosures. IFRS 13 is effective for annual periods beginning on or after January 1, 2013 and applies prospectively from the beginning of the annual period in which the standard is adopted. Early adoption is permitted. We are currently evaluating the impact of adopting IFRS 13 on our Consolidated Financial Statements.
IFRS 9 — “Financial Instruments”, which is the result of the first phase of the IASB’s project to replace IAS 39, “Financial Instruments: Recognition and Measurement”. The new standard replaces the current multiple classification and measurement models for financial assets and liabilities with a single model that has only two classification categories: amortized cost and fair value. This standard is effective for annual periods beginning on or after January 1, 2013 with different transitional arrangements depending on the date of initial application. We are currently evaluating the impact of adopting IFRS 9 on our Consolidated Financial Statements.
In June 2011, the IASB issued an amendment to IAS 1 — “Presentation of Financial Statements” (“IAS 1”) requiring companies to group items presented within Other Comprehensive Income based on whether they may be subsequently reclassified to profit or loss. This amendment to IAS 1 is effective for annual periods beginning on or after July 1, 2012 with full retrospective application. Early adoption is permitted. Bellatrix has yet to assess the full impact of adopting this amendment on its consolidated financial statements.
Business Risks and Uncertainties
General
Bellatrix’s production and exploration activities are concentrated in the Western Canadian Sedimentary Basin, where activity is highly competitive and includes a variety of different sized companies ranging from smaller junior producers to the much larger integrated petroleum companies.
Bellatrix is subject to the various types of business risks and uncertainties including:
· Finding and developing oil and natural gas reserves at economic costs;
· Production of oil and natural gas in commercial quantities; and
· Marketability of oil and natural gas produced.
In order to reduce exploration risk, the Company strives to employ highly qualified and motivated professional employees with a demonstrated ability to generate quality proprietary geological and geophysical prospects. To help maximize drilling success, Bellatrix combines exploration in areas that afford multi-zone prospect potential, targeting a range of low to moderate risk prospects with some exposure to select high-risk with high-reward opportunities. Bellatrix also explores in areas where the Company has significant drilling experience.
The Company mitigates its risk related to producing hydrocarbons through the utilization of the most appropriate technology and information systems managed by qualified personnel. In addition, Bellatrix seeks to maintain operational control of the majority of its prospects.
Oil and gas exploration and production can involve environmental risks such as pollution of the environment and destruction of natural habitat, as well as safety risks such as personal injury. In order to mitigate such risks, Bellatrix conducts its operations at high standards and follows safety procedures intended to reduce the potential for personal injury to employees, contractors and the public at large. The Company maintains current insurance coverage for general
40
and comprehensive liability as well as limited pollution liability. The amount and terms of this insurance are reviewed on an ongoing basis and adjusted as necessary to reflect changing corporate requirements, as well as industry standards and government regulations. Bellatrix may periodically use financial or physical delivery contracts to reduce its exposure against the potential adverse impact of commodity price volatility, as governed by formal policies approved by senior management subject to controls established by the Board.
Royalties and Incentives
General
In addition to federal regulation, each province has legislation and regulations which govern royalties, production rates and other matters. The royalty regime in a given province is a significant factor in the profitability of oil sands projects, crude oil, natural gas liquids, sulphur and natural gas production. Royalties payable on production from lands other than Crown lands are determined by negotiation between the mineral freehold owner and the lessee, although production from such lands is subject to certain provincial taxes and royalties. Royalties from production on Crown lands are determined by governmental regulation and are generally calculated as a percentage of the value of gross production. The rate of royalties payable generally depends in part on prescribed reference prices, well productivity, geographical location, field discovery date, method of recovery and the type or quality of the petroleum product produced. Other royalties and royalty like interests are, from time to time, carved out of the working interest owner’s interest through non public transactions. These are often referred to as overriding royalties, gross overriding royalties, net profits interests, or net carried interests.
Occasionally the governments of the western Canadian provinces create incentive programs for exploration and development. Such programs often provide for royalty rate reductions, royalty holidays or royalty tax credits and are generally introduced when commodity prices are low to encourage exploration and development activity by improving earnings and cash flow within the industry.
Alberta
Producers of oil and natural gas from Crown lands in Alberta are required to pay annual rental payments, currently at a rate of $3.50 per hectare, and make monthly royalty payments in respect of oil and natural gas produced.
Royalties are currently paid pursuant to “The New Royalty Framework” (implemented by the Mines and Minerals (New Royalty Framework) Amendment Act, 2008) and the “Alberta Royalty Framework”, which was implemented in 2010.
Royalty rates for conventional oil are set by a single sliding rate formula which is applied monthly and incorporates separate variables to account for production rates and market prices. Effective January 1, 2011, the maximum royalty payable under the royalty regime was set at 40%. The royalty curve for conventional oil announced on May 27, 2010 amends the price component of the conventional oil royalty formula to moderate the increase in the royalty rate at prices higher than $535/m3 compared to the previous royalty curve.
Royalty rates for natural gas under the royalty regime are similarly determined using a single sliding rate formula incorporating separate variables to account for production rates and market prices. Effective January 1, 2011, the maximum royalty payable under the royalty regime was set at 36%. The royalty curve for natural gas announced on May 27, 2010 amends the price component of the natural gas royalty formula to moderate the increase in the royalty rate at prices higher than $5.25/GJ compared to the previous royalty curve.
Producers of oil and natural gas from freehold lands in Alberta are required to pay annual freehold production taxes. The level of the freehold production tax is based on the volume of monthly production and a specified rate of tax for both oil and gas.
The Innovative Energy Technologies Program (the “IETP”), which is currently in place, has the stated objectives of increasing recovery from oil and gas deposits, finding technical solutions to the gas over bitumen issue, improving the
41
recovery of bitumen by in-situ and mining techniques and improving the recovery of natural gas from coal seams. The IETP provides royalty adjustments to specific pilot and demonstration projects that utilize new or innovative technologies to increase recovery from existing reserves.
The Government of Alberta currently has in place two royalty programs, both of which commenced in 2008 and are intended to encourage the development of deeper, higher cost oil and gas reserves. A five-year program for conventional oil exploration wells over 2,000 metres provides qualifying wells with up to a $1 million or 12 months of royalty relief, whichever comes first, and a five-year program for natural gas wells deeper than 2,500 metres provides a sliding scale royalty credit based on depth of up to $3,750 per metre. On May 27, 2010, the natural gas deep drilling program was amended, retroactive to May 1, 2010, by reducing the minimum qualifying depth to 2,000 metres, removing a supplemental benefit of $875,000 for wells exceeding 4,000 metres that are spudded subsequent to that date, and including wells drilled into pools drilled prior to 1985, among other changes.
On November 19, 2008, the Government of Alberta announced the introduction of a five-year program of transitional royalty rates with the intent of promoting new drilling. The five-year transition option is designed to provide lower royalties at certain price levels in the initial years of a well’s life when production rates are expected to be the highest. Under this program, companies drilling new natural gas or conventional deep oil wells (between 1,000 and 3,500 m) are given a one-time option, on a well-by-well basis, to adopt either the new transitional royalty rates or those outlined in the royalty regime. These options expired on February 15, 2011 and on January 1, 2014, all producers operating under the transitional royalty rates will automatically become subject to the royalty regime. The revised royalty curves for conventional oil and natural gas will not be applied to production from wells operating under the transitional royalty rates.
On March 3, 2009, the Government of Alberta announced a three-point incentive program in order to stimulate new and continued economic activity in Alberta. One aspect of the program was a drilling royalty credit program which provided up to a $200 per metre royalty credit for new wells. The drilling credit program applied to wells that were drilled between April 1, 2009 and March 31, 2010 and has not been extended for wells drilled after March 31, 2010. Another aspect of the program was a new well royalty program which provided for a maximum 5% royalty rate for eligible new wells for the first twelve (12) productive months or until the regulated “volume cap” was reached. The New Well Royalty Regulation, providing for the permanent implementation of this incentive program, was approved by an Order-in-Council on March 17, 2011.
In addition to the foregoing, the Government of Alberta has implemented certain initiatives intended to accelerate technological development and facilitate the development of unconventional resources (the “Emerging Resource and Technologies Initiative”). Specifically:
· Coalbed methane wells will receive a maximum royalty rate of 5% for 36 producing months on up to 750 MMcf of production, retroactive to wells that began producing on or after May 1, 2010;
· Shale gas wells will receive a maximum royalty rate of 5% for 36 producing months with no limitation on production volume, retroactive to wells that began producing on or after May 1, 2010;
· Horizontal gas wells will receive a maximum royalty rate of 5% for 18 producing months on up to 500 MMcf of production, retroactive to wells that commenced drilling on or after May 1, 2010;
· Horizontal oil wells and horizontal non-project oil sands wells will receive a maximum royalty rate of 5% with volume and production month limits set according to the depth of the well, retroactive to wells that commenced drilling on or after May 1, 2010.
The Emerging Resource and Technologies Initiative will be reviewed in 2014, and the Government of Alberta has committed to providing industry with three years notice at that time if it decides to discontinue the program.
42
Land Tenure
Crude oil and natural gas located in the western provinces is owned predominantly by the respective provincial governments. Provincial governments grant rights to explore for and produce oil and natural gas pursuant to leases, licences, and permits for varying terms, and on conditions set forth in provincial legislation including requirements to perform specific work or make payments. Oil and natural gas located in such provinces can also be privately owned and rights to explore for and produce such oil and natural gas are granted by lease on such terms and conditions as may be negotiated.
Each of the provinces of Alberta, British Columbia and Saskatchewan has implemented legislation providing for the reversion to the Crown of mineral rights to deep, non-productive geological formations at the conclusion of the primary term of a lease or license. On March 29, 2007, British Columbia’s policy of deep rights reversion was expanded for new leases to provide for the reversion of both shallow and deep formations that cannot be shown to be capable of production at the end of their primary term.
Alberta also has a policy of “shallow rights reversion” which provides for the reversion to the Crown of mineral rights to shallow, non-productive geological formations for all leases and licenses. For leases and licenses issued subsequent to January 1, 2009, shallow rights reversion will be applied at the conclusion of the primary term of the lease or license. Holders of leases or licences that have been continued indefinitely prior to January 1, 2009 will receive a notice regarding the reversion of the shallow rights, which will be implemented three years from the date of the notice. Leases and licences that were granted prior to January 1, 2009 but continued after that date are not subject to shallow rights reversion until they reach the end of their primary term and are continued (at which time deep rights reversion will be applied); thereafter, the holders of such agreements will be served with shallow rights reversion notices based on vintage and location similar to leases and licences that were already continued as of January 1, 2009. The order in which these agreements will receive reversion notices will depend on their vintage and location, and the Government of Alberta had anticipated that the receipt of reversion notices for older leases and licenses would commence in April 2011. However, on April 14, 2011, the Government of Alberta announced it was deferring serving shallow rights reversion notices and will revisit the decision in spring 2012.
Environmental Regulation
The oil and natural gas industry is currently subject to environmental regulations pursuant to a variety of provincial and federal legislation, all of which is subject to governmental review and revision from time to time. Such legislation provides for restrictions and prohibitions on the release or emission of various substances produced in association with certain oil and gas industry operations, such as sulphur dioxide and nitrous oxide. In addition, such legislation requires that well and facility sites be abandoned and reclaimed to the satisfaction of provincial authorities. Compliance with such legislation can require significant expenditures and a breach of such requirements may result in suspension or revocation of necessary licenses and authorizations, civil liability for pollution damage, and the imposition of material fines and penalties. Implementation of strategies for reducing greenhouse gases could have a material impact on the nature of oil and gas operations, including those of the Company. Given the evolving nature of the debate related to climate change and the control of greenhouse gases and resulting requirements, it is not possible to predict either the nature of those requirements or the impact on the Company and its operations and financial condition.
Global Financial Crisis
Recent market events and conditions, including disruptions in the international credit markets and other financial systems and the American and European sovereign debt levels have caused significant volatility in commodity prices. These conditions have caused a decrease in confidence in the global credit and financial markets and have created a climate of greater volatility, less liquidity, widening of credit spreads, a lack of price transparency, increased credit losses and tighter credit conditions. Notwithstanding various actions by governments, concerns about the general condition of the capital markets, financial instruments, banks, investment banks, insurers and other financial institutions caused the
43
broader credit markets to further deteriorate and stock markets to decline substantially. This volatility may in the future affect the Corporation’s ability to obtain equity or debt financing on acceptable terms.
Substantial Capital Requirements
The Company anticipates making substantial capital expenditures for the acquisition, exploration, development and production of oil and natural gas reserves in the future. As future capital expenditures will be financed out of cash generated from operations, borrowings and possible future equity sales, the Company’s ability to do so is dependent on, among other factors, the overall state of the capital markets, the Company’s credit rating (if applicable), interest rates, tax burden due to new tax laws and investor appetite for investments in the energy industry and the Company’s securities in particular. Further, if the Company’s revenues or reserves decline, it may not have access to the capital necessary to undertake or complete future drilling programs. There can be no assurance that debt or equity financing, or cash generated by operations will be available or sufficient to meet these requirements or for other corporate purposes or, if debt or equity financing is available, that it will be on terms acceptable to the Company. The inability of the Company to access sufficient capital for its operations could have a material adverse effect on the Company’s business financial condition, results of operations and prospects.
Third Party Credit Risk
The Company may be exposed to third party credit risk through its contractual arrangements with its current or future joint venture partners, marketers of its petroleum and natural gas production and other parties. In the event such entities fail to meet their contractual obligations to the Company, such failures may have a material adverse effect on the Company’s business, financial condition, results of operations and prospects. In addition, poor credit conditions in the industry and of joint venture partners may impact a joint venture partner’s willingness to participate in the Company’s ongoing capital program, potentially delaying the program and the results of such program until the Company finds a suitable alternative partner.
Critical Accounting Estimates
The reader is advised that the critical accounting estimates, policies, and practices as described herein continue to be critical in determining Bellatrix’s financial results.
The reader is cautioned that the preparation of financial statements in accordance with GAAP requires management to make certain judgments and estimates that affect the reported amounts of assets, liabilities, revenues and expenses. The following discussion outlines accounting policies and practices that are critical to determining Bellatrix’s financial results.
Derivatives
The fair value of commodity contracts is estimated, whenever possible, based on published market prices, and if not available, on estimates from third party brokers, as at the balance sheet date and may differ from what will eventually be realized.
Oil and gas reserves
Reserves and resources are used in the units of production calculation for depreciation, depletion and amortization and the impairment analysis which affect net profit. There are numerous uncertainties inherent in estimating oil and gas reserves. Estimating reserves is very complex, requiring many judgments based on geological, geophysical, engineering and economic data. Changes in these judgments could have a material impact on the estimated reserves. These estimates may change, having either a negative or positive effect on net profit as further information becomes available and as the economic environment changes.
44
Depreciation and depletion
Depletion of petroleum and natural gas properties is provided using the unit-of-production method based on production volumes before royalties in relation to total estimated proved and probable reserves as determined annually by independent engineers and internal reserve evaluations on a quarterly basis determined in accordance with National Instrument 51-101. Natural gas reserves and production are converted at the energy equivalent of six thousand cubic feet to one barrel of oil.
Calculations for depletion and depreciation of production equipment are based on total capitalized costs plus estimated future development costs of proved and probable undeveloped reserves less the estimated net realizable value of production equipment and facilities after the proved reserves are fully produced. The costs of acquiring and evaluating unproved properties are excluded from depletion calculations.
Recoverability of asset carrying values
The Company assesses its oil and gas properties, including exploration and evaluation assets, for possible impairment if there are events or changes in circumstances that indicate that carrying values of the assets may not be recoverable, or at least at every reporting date.
The assessment of any impairment of property, plant and equipment is dependent upon estimates of recoverable amount that take into account factors such as reserves, economic and market conditions, timing of cash flows, the useful lives of assets and their related salvage values.
Bellatrix’s assets are aggregated into CGUs, for the purpose of calculating impairment, based on their ability to generate largely independent cash flows, geography, geology, production profile and infrastructure of its assets. By their nature, these estimates and assumptions are subject to measurement uncertainty and may impact the carrying value of the Company’s assets in future periods.
Decommissioning obligations
Provisions for decommissioning obligations associated with the Company’s drilling operations are based on current legal and constructive requirements, technology, price levels and expected plans for remediation. Actual costs and cash outflows can differ from estimates because of changes in laws and regulations, public expectations, prices, discovery and analysis of site conditions and changes in clean up technology.
Share-based compensation
The fair value of stock options granted is measured using a Black Scholes model. Measurement inputs include share price on measurement date, exercise price of the option, expected volatility, expected life of the options, expected dividends and the risk-free rate. The Company estimates volatility based on historical share price excluding specific time frames in which volatility was affected by specific transactions that are not considered to be indicative of the Company’s expected share price volatility. The expected life of the options is based on historical experience and general option holder behavior. Dividends were not taken into consideration as the Company does not expect to pay dividends. Management also makes an estimate of the number of options that will be forfeited and the rate is adjusted to reflect the actual number of options that actually vest.
Income taxes
Related assets and liabilities are recognized for the estimated tax consequences between amounts included in the financial statements and their tax base using substantively enacted future income tax rates. Timing of future revenue streams and future capital spending changes can affect the timing of any temporary differences, and accordingly affect the amount of the deferred tax asset or liability calculated at a point in time. These differences could materially impact earnings.
45
Legal, Environmental Remediation and Other Contingent Matters
The Company is involved in various claims and litigation arising in the normal course of business. While the outcome of these matters is uncertain and there can be no assurance that such matters will be resolved in the Company’s favor, the Company does not currently believe that the outcome of adverse decisions in any pending or threatened proceeding related to these and other matters or any amount which it may be required to pay by reason thereof would have a material adverse impact on its financial position or results of operations.
The Company reviews legal, environmental remediation and other contingent matters to both determine whether a loss is probable based on judgment and interpretation of laws and regulations and determine that the loss can reasonably be estimated. When the loss is determined, it is charged to earnings. The Company’s management monitor known and potential contingent matters and make appropriate provisions by charges to earnings when warranted by the circumstances.
With the above risks and uncertainties the reader is cautioned that future events and results may vary substantially from that which Bellatrix currently foresees.
Controls and Procedures
Disclosure Controls and Procedures
The Company’s Chief Executive Officer and Chief Financial Officer have designed, or caused to be designed under their supervision, disclosure controls and procedures to provide reasonable assurance that: (i) material information relating to the Company is made known to the Company’s Chief Executive Officer and Chief Financial Officer by others, particularly during the period in which the annual and interim filings are being prepared; and (ii) information required to be disclosed by the Company in its annual filings, interim filings or other reports filed or submitted by it under securities legislation is recorded, processed, summarized and reported within the time period specified in securities legislation. Such officers have evaluated, or caused to be evaluated under their supervision, the effectiveness of the Company’s disclosure controls and procedures at the financial year end of the Company and have concluded that the Company’s disclosure controls and procedures are effective at the financial year end of the Company for the foregoing purposes.
Internal Control over Financial Reporting
The Company’s Chief Executive Officer and Chief Financial Officer have designed, or caused to be designed under their supervision, internal control over financial reporting to provide reasonable assurance regarding the reliability of the Company’s financial reporting and the preparation of financial statements for external purposes in accordance with GAAP. Such officers have evaluated, or caused to be evaluated under their supervision, the effectiveness of the Company’s internal control over financial reporting at the financial year end of the Company and concluded that the Company’s internal control over financial reporting is effective at the financial year end of the Company for the foregoing purpose.
The Company is required to disclose herein any change in the Company’s internal control over financial reporting that occurred during the period beginning on October 1, 2011 and ended on December 31, 2011 that has materially affected, or is reasonably likely to materially affect, the Company’s internal control over financial reporting. No material changes in the Company’s internal control over financial reporting were identified during such period that has materially affected, or are reasonably likely to materially affect, the Company’s internal control over financial reporting.
In conjunction with its conversion to IFRS, the Company completed an assessment of its information systems and based on this review no significant changes to the information systems were required as part of the IFRS conversion process. In addition, the effects of the adoption of IFRS on the Company’s business activities and internal controls, including
46
disclosure controls and procedures, were reviewed and no significant changes to the Corporation’s business activities and internal control environment were required.
It should be noted that a control system, including the Company’s disclosure and internal controls and procedures, no matter how well conceived, can provide only reasonable, but not absolute, assurance that the objectives of the control system will be met and it should not be expected that the disclosure and internal controls and procedures will prevent all errors or fraud.
Sensitivity Analysis
The table below shows sensitivities to funds flow from operations as a result of product price, exchange rate, and interest rate changes. This is based on actual average prices received for the fourth quarter of 2011 and average production volumes of 14,209 boe/d during that period, as well as the same level of debt outstanding at December 31, 2011. Diluted weighted average shares are based upon the fourth quarter of 2011. These sensitivities are approximations only, and not necessarily valid under other significantly different production levels or product mixes. Commodity price risk management activities can significantly affect these sensitivities. Changes in any of these parameters will affect funds flow as shown in the table below:
| | Funds Flow from Operations (1) | | Funds Flow from Operations (1) | |
| | (annualized) | | Per Diluted Share | |
Sensitivity Analysis | | ($000s) | | ($) | |
Change of US $1/bbl WTI | | 1,700 | | 0.01 | |
Change of $0.10/ mcf | | 1,700 | | 0.01 | |
Change of US $0.01 CDN/ US exchange rate | | 1,400 | | 0.01 | |
Change in prime of 1% | | 600 | | 0.01 | |
(1)The term “funds flow from operations” should not be considered an alternative to, or more meaningful than cash flow from operating activities as determined in accordance with GAAP as an indicator of the Company’s performance. Therefore reference to diluted funds flow from operations or funds flow from operations per share may not be comparable with the calculation of similar measures for other entities. Management uses funds flow from operations to analyze operating performance and leverage and considers funds flow from operations to be a key measure as it demonstrates the Company’s ability to generate the cash necessary to fund future capital investments and to repay debt. The reconciliation between cash flow from operating activities and funds flow from operations can be found elsewhere herein. Funds flow from operations per share is calculated using the weighted average number of common shares for the period.
47
Selected Quarterly Consolidated Information
The following table sets forth selected consolidated financial information of the Company for the most recently completed quarters ending December 31, 2011 and for the quarters in 2011 and 2010. The adoption date of IFRS of January 1, 2011 required restatement for comparative purposes, of the Company’s opening balance sheet as at January 1, 2010, all interim quarterly periods in 2010 and for its year ended December 31, 2010.
2011 — Quarter ended (unaudited)
($000s, except per share amounts) | | March 31 | | June 30 | | Sept. 30 | | Dec. 31 | |
Revenues before royalties and risk management | | 40,535 | | 53,444 | | 49,145 | | 59,194 | |
Cash flow from operating activities | | 15,718 | | 23,825 | | 28,023 | | 30,626 | |
Cash flow from operating activities per share | | | | | | | | | |
Basic | | $ | 0.16 | | $ | 0.23 | | $ | 0.26 | | $ | 0.28 | |
Diluted | | $ | 0.15 | | $ | 0.22 | | $ | 0.24 | | $ | 0.26 | |
Funds flow from operations (1) | | 17,027 | | 23,126 | | 23,964 | | 30,120 | |
Funds flow from operations per share (1) | | | | | | | | | |
Basic | | $ | 0.17 | | $ | 0.22 | | $ | 0.22 | | $ | 0.28 | |
Diluted | | $ | 0.16 | | $ | 0.21 | | $ | 0.21 | | $ | 0.26 | |
Net profit (loss) | | (5,487 | ) | 12,315 | | 820 | | (13,597 | ) |
Net profit (loss) per share | | | | | | | | | |
Basic | | $ | (0.06 | ) | $ | 0.12 | | 0.01 | | $ | (0.13 | ) |
Diluted | | $ | (0.06 | ) | $ | 0.11 | | 0.01 | | $ | (0.13 | ) |
Net capital expenditures (cash) | | 59,247 | | 28,784 | | 40,087 | | 47,240 | |
2010 — Quarter ended (unaudited)
($000s, except per share amounts) | | March 31 | | June 30 | | Sept. 30 | | Dec. 31 | |
Revenues before royalties and risk management | | 26,929 | | 25,574 | | 27,344 | | 37,826 | |
Cash flow from operating activities | | 13,456 | | 6,065 | | 13,466 | | 11,285 | |
Cash flow from operating activities per share | | | | | | | | | |
Basic | | $ | 0.15 | | $ | 0.07 | | $ | 0.14 | | $ | 0.12 | |
Diluted | | $ | 0.15 | | $ | 0.07 | | $ | 0.14 | | $ | 0.11 | |
Funds flow from operations (1) | | 10,198 | | 10,610 | | 16,342 | | 15,892 | |
Funds flow from operations per share (1) | | | | | | | | | |
Basic | | $ | 0.12 | | $ | 0.11 | | $ | 0.17 | | $ | 0.16 | |
Diluted | | $ | 0.11 | | $ | 0.11 | | $ | 0.17 | | $ | 0.15 | |
Net profit (loss) | | 3,969 | | (6,351 | ) | (2,546 | ) | (57 | ) |
Net profit (loss) per share | | | | | | | | | |
Basic | | $ | 0.04 | | $ | (0.07 | ) | $ | (0.03 | ) | $ | (0.00 | ) |
Diluted | | $ | 0.04 | | $ | (0.07 | ) | $ | (0.03 | ) | $ | (0.00 | ) |
Net capital expenditures (cash) | | 18,393 | | 17,656 | | 30,416 | | 25,716 | |
(1) Refer to “Non-GAAP Measures” in respect of the term “funds flow from operations” and “funds flow from operations per share”.
The quarterly results for 2011 compared to 2010 were impacted by Bellatrix’s increased capital program, improved pricing for crude oil, condensate and NGL’s, and increased production efficiencies. Similar to 2010, the Company’s focus in 2011 was the expansion of its capital program in order to increase total production, and to continue to streamline its operations and field optimization projects.
48
In the first quarter of 2011, the Company spent $59.2 million in capital expenditures, compared to only $18.4 million in the comparative period in 2010. The Company drilled or participated in 21 gross (12.07 net) successful wells in the first quarter of 2011, compared to 14 gross (8.06) wells in the comparative 2010 quarter.
During the second quarter of 2011, Bellatrix closed a $55.0 million bought deal equity financing, in order to further accelerate the development of Cardium and Notikewin inventories. In addition, effective June 1, 2011, the Company’s borrowing base from its banking syndicate was increased from $100 million to $140 million through to November 30, 2011. Funded in part by the additional financing from the equity financing, the Company invested $28.8 million in capital expenditures during the second quarter of 2011, compared to $17.7 million for the same period in 2010.
During the third quarter of 2011, the Company sold its Meekwap, Alberta property for net proceeds of $4.2 million, resulting in the recognition of a $1.6 million gain on the disposition, offset slightly by $0.1 million in losses on other minor prior period property dispositions. The Company spent $132.3 million on capital expenditures during the third quarter of 2011, compared to $30.4 in the comparative 2010 quarter.
Overall, the Company’s expanded and successful capital program, increased production, and higher realized prices for crude oil, condensate, and NGL’s, have resulted in the Company having increased cash flows, sales volumes, and reserves for 2011, as compared to 2010.
49
Selected Annual Consolidated Information
The following table sets forth selected consolidated financial information of the Company for the most recently completed year ending December 31, 2011 and for comparative 2010 and 2009 years. The adoption date of IFRS of January 1, 2011 required restatement for comparative purposes, of the Company’s opening balance sheet as at January 1, 2010, all interim quarterly periods in 2010 and for its year ended December 31, 2010. As a result, 2009 comparative information has not been restated and is in accordance with previous GAAP.
Years ended December 31,
($000s, except per share amounts) | | 2011 | | 2010 | | 2009 | |
Revenues (before royalties and risk management) | | 202,318 | | 117,673 | | 109,014 | |
Funds flow from operations (1) | | 94,237 | | 53,042 | | 36,025 | |
Funds flow from operations per share (1) | | | | | | | |
Basic | | $ | 0.91 | | $ | 0.57 | | $ | 0.46 | |
Diluted | | $ | 0.87 | | $ | 0.54 | | $ | 0.46 | |
Cash flow from operating activities | | | | | | | |
Cash flow from operating activities per share | | 98,089 | | 44,272 | | 30,671 | |
Basic | | $ | 0.94 | | $ | 0.47 | | $ | 0.39 | |
Diluted | | $ | 0.87 | | $ | 0.46 | | $ | 0.39 | |
Net profit (loss) | | (5,949 | ) | (4,985 | ) | (126,620 | ) |
Net profit (loss) per share | | | | | | | |
Basic | | $ | (0.06 | ) | $ | (0.05 | ) | $ | (1.61 | ) |
Diluted | | $ | (0.06 | ) | $ | (0.05 | ) | $ | (1.61 | ) |
Net capital expenditures (cash) | | (175,358 | ) | (92,181 | ) | (76,434 | ) |
Total assets | | 580,422 | | 477,054 | | 440,970 | |
Total net debt (1) (2) | | 119,250 | | 87,444 | | 107,269 | |
Non-current financial liabilities | | | | | | | |
Future income taxes | | — | | — | | — | |
Decommissioning liabilities | | 45,091 | | 38,710 | | 25,728 | |
Sales volumes (boe/d) | | 11,954 | | 8,519 | | 8,426 | |
Distributions declared | | — | | — | | 1,570 | |
Distributions per share/unit | | — | | — | | $ | 0.02 | |
(1) Refer to “Non-GAAP Measures” in respect of the terms “funds flow from operations,” “funds flow from operations per share,” “net debt” and “total net debt.”
(2) Net debt includes the net working capital deficiency before short-term commodity contract assets and liabilities, current finance lease obligations and short-term future income tax assets and liabilities. Total net debt also includes the liability component of convertible debentures and excludes finance lease obligations, decommissioning liabilities and future income tax liabilities.
2011 annual results are compared in detail to 2010 annual results throughout this MD&A.
The annual results for 2010 compared to 2009 were impacted by dispositions, increased capital spending, higher overall commodity prices, and lower operating costs.
In 2009, total sales volumes averaged 8,426 boe/d, which was consistent with the 8,519 boe/d average sales volumes realized during 2010. The Company disposed of two minor properties in the second quarter of 2009 and the majority of its Saskatchewan properties during the third quarter of 2009.
The 2009 property dispositions were made in order to reduce the Company’s indebtedness, and led to a reduction in sales volumes by approximately 3,600 boe/d for the third and fourth quarters of 2009. A shift in the Company’s operating focus to Cardium and Notikewin areas in conjunction with increased capital spending of $106.7 million in 2010,
50
compared to $16.5 million in 2009 resulted in additional sales volumes, more than replacing all of the 2009 sold production.
The increase in revenues before royalties and risk management contracts of 8% is primarily attributable to higher overall commodity prices between 2009 and 2010. Bellatrix’s realized average price for total crude and NGLs before risk management increased to $66.59/bbl in 2010, compared to $49.62/bbl in 2010. Bellatrix’s realized natural gas prices before risk management decreased from $4.50/mcf in 2009 to $4.19/mcf in 2010.
51
BELLATRIX EXPLORATION LTD.
CONSOLIDATED BALANCE SHEETS
(expressed in Canadian dollars)
| | As at
December 31, | | As at
December 31, | | As at
January 1, | |
($000s) | | 2011 | | 2010 | | 2010 | |
| | | | (note 23) | | (note 23) | |
ASSETS | | | | | | | |
Current assets | | | | | | | |
Accounts receivable (note 22) | | $ | 45,322 | | $ | 39,500 | | $ | 20,722 | |
Deposits and prepaid expenses | | 3,626 | | 4,619 | | 4,940 | |
Commodity contract asset (note 22) | | 2,979 | | — | | 3,374 | |
| | 51,927 | | 44,119 | | 29,036 | |
Exploration and evaluation assets (note 6) | | 33,089 | | 18,535 | | 20,542 | |
Property, plant and equipment (note 7) | | 484,301 | | 399,580 | | 346,229 | |
Deferred taxes (note 16) | | 11,105 | | 14,820 | | 14,602 | |
Total assets | | $ | 580,422 | | $ | 477,054 | | $ | 410,409 | |
| | | | | | | |
LIABILITIES | | | | | | | |
Current liabilities | | | | | | | |
Accounts payable and accrued liabilities | | $ | 62,421 | | $ | 42,792 | | $ | 23,345 | |
Current portion of finance lease obligation (note 11) | | 490 | | 146 | | — | |
Commodity contract liability (note 22) | | 10,667 | | 3,732 | | — | |
| | 73,578 | | 46,670 | | 23,345 | |
| | | | | | | |
Deferred liability- flow-through shares (note 8) | | — | | 3,768 | | — | |
Commodity contract liability (note 22) | | 2,944 | | — | | — | |
Long-term debt (note 9) | | 56,701 | | 41,172 | | 27,902 | |
Convertible debentures (note 10) | | 49,076 | | 47,599 | | 81,684 | |
Finance lease obligation (note 11) | | 4,627 | | 1,443 | | — | |
Decommissioning Liabilities (note 12) | | 45,091 | | 38,710 | | 39,001 | |
Total liabilities | | 232,017 | | 179,362 | | 171,932 | |
| | | | | | | |
SHAREHOLDERS’ EQUITY | | | | | | | |
Shareholders’ capital (note 13) | | 370,048 | | 316,779 | | 257,629 | |
Equity component of convertible debentures (note 10) | | 4,378 | | 4,378 | | — | |
Contributed surplus | | 33,882 | | 30,489 | | 28,186 | |
Deficit | | (59,903 | ) | (53,954 | ) | (47,338 | ) |
Total shareholders’ equity | | 348,405 | | 297,692 | | 238,477 | |
Total liabilities and shareholders’ equity | | $ | 580,422 | | $ | 477,054 | | $ | 410,409 | |
COMMITMENTS (note 21)
See accompanying notes to the consolidated financial statements.
52
BELLATRIX EXPLORATION LTD.
CONSOLIDATED STATEMENTS OF COMPREHENSIVE INCOME
For the years ended December 31,
(expressed in Canadian dollars)
($000s) | | 2011 | | 2010 | |
| | | | (note 23) | |
REVENUES | | | | | |
Petroleum and natural gas sales | | $ | 200,187 | | $ | 115,676 | |
Other income | | 2,131 | | 1,997 | |
Royalties | | (34,698 | ) | (22,914 | ) |
Total revenues | | 167,620 | | 94,759 | |
| | | | | |
Realized gain on commodity contracts | | 567 | | 15,388 | |
Unrealized loss on commodity contracts | | (6,900 | ) | (7,106 | ) |
| | 161,287 | | 103,041 | |
| | | | | |
EXPENSES | | | | | |
Production | | 50,313 | | 37,964 | |
Transportation | | 5,715 | | 3,723 | |
General and administrative (note 18) | | 12,358 | | 9,414 | |
Provision for uncollectible accounts | | — | | 250 | |
Share-based compensation (notes 14) | | 2,939 | | 1,649 | |
Depletion and depreciation (note 7) | | 63,384 | | 47,901 | |
Gain on property dispositions (note 7) | | (1,730 | ) | (1,425 | ) |
Impairment loss (reversal) on property, plant and equipment (note 7) | | 25,569 | | (3,238 | ) |
Loss on redemption of 7.5% Debentures (note 10) | | — | | 3,514 | |
| | 158,548 | | 99,752 | |
| | | | | |
NET PROFIT (LOSS) BEFORE FINANCE AND TAXES | | 2,739 | | 3,289 | |
| | | | | |
Finance expenses (note 17) | | 7,920 | | 8,465 | |
| | | | | |
NET PROFIT(LOSS) BEFORE TAXES | | (5,181 | ) | (5,176 | ) |
| | | | | |
TAXES | | | | | |
Deferred tax expense (recovery) (note 16) | | 768 | | (191 | ) |
| | | | | |
NET LOSS AND COMPREHENSIVE LOSS | | (5,949 | ) | (4,985 | ) |
| | | | | |
Net loss per share | | | | | |
Basic | | $ | (0.06 | ) | $ | (0.05 | ) |
Diluted | | $ | (0.06 | ) | $ | (0.05 | ) |
See accompanying notes to the consolidated financial statements.
53
BELLATRIX EXPLORATION LTD.
CONSOLIDATED STATEMENTS OF SHAREHOLDERS’ EQUITY
For the years ended December 31,
(expressed in Canadian dollars)
($000s) | | 2011 | | 2010 | |
| | | | (note 23) | |
| | | | | |
SHAREHOLDERS’ CAPITAL (note 13) | | | | | |
Common shares | | | | | |
Balance, beginning of year | | 316,779 | | 257,629 | |
Issued for cash, net of transaction costs | | 52,734 | | 62,358 | |
Premium on flow-through shares classified as a deferred liability | | — | | (3,768 | ) |
Issued on exercise of share options | | 381 | | 434 | |
Contributed surplus transferred on exercised options | | 154 | | 126 | |
Balance, end of year | | 370,048 | | 316,779 | |
| | | | | |
EQUITY COMPONENT OF CONVERTIBLE DEBENTURES (note 10) | | | | | |
Balance, beginning of year | | 4,378 | | — | |
Conversion feature of 4.75% Debentures issued | | — | | 4,378 | |
Balances, end of year | | 4,378 | | 4,378 | |
| | | | | |
CONTRIBUTED SURPLUS (note 14) | | | | | |
Balance, beginning of year | | 30,489 | | 28,186 | |
Share-based compensation expense | | 3,632 | | 2,429 | |
Adjustment of share-based compensation expense for forfeitures of unvested share options | | (85 | ) | — | |
Transfer to share capital for exercised options | | (154 | ) | (126 | ) |
Balance, end of year | | 33,882 | | 30,489 | |
| | | | | |
DEFICIT | | | | | |
Balance, beginning of year | | (53,954 | ) | (47,338 | ) |
Adjustment for redemption of 7.5% Debentures (note 10) | | — | | (1,631 | ) |
Net loss | | (5,949 | ) | (4,985 | ) |
Balance, end of year | | (59,903 | ) | (53,954 | ) |
| | | | | |
TOTAL SHAREHOLDERS’ EQUITY | | $ | 348,405 | | $ | 297,692 | |
| | | | | | | |
See accompanying notes to the consolidated financial statements.
54
BELLATRIX EXPLORATION LTD.
CONSOLIDATED STATEMENTS OF CASH FLOWS
For the years ended December 31,
(expressed in Canadian dollars)
($000s) | | 2011 | | 2010 | |
| | | | (note 23) | |
Cash provided by (used in): | | | | | |
| | | | | |
CASH FLOW FROM OPERATING ACTIVITIES | | | | | |
Net loss | | $ | (5,949 | ) | $ | (4,985 | ) |
Adjustments for: | | | | | |
Depletion and depreciation | | 63,384 | | 47,901 | |
Finance expenses (note 17) | | 2,356 | | 2,711 | |
Share-based compensation (note 14) | | 2,939 | | 1,649 | |
Unrealized loss on commodity contracts | | 6,900 | | 7,106 | |
Gain on property dispositions | | (1,730 | ) | (1,425 | ) |
Impairment loss on property, plant and equipment | | 25,569 | | (3,238 | ) |
Loss on redemption of 7.5% Debentures | | — | | 3,514 | |
Deferred tax expense (recovery) (note 16) | | 768 | | (191 | ) |
Realization of imputed interest costs on 7.5% Debentures | | — | | (5,050 | ) |
Decommissioning costs incurred (note 12) | | (569 | ) | (1,373 | ) |
Change in non-cash working capital (note 15) | | 4,524 | | (2,347 | ) |
| | 98,192 | | 44,272 | |
| | | | | |
CASH FLOW FROM (USED IN) FINANCING ACTIVITIES | | | | | |
Issuance of share capital | | 55,385 | | 65,464 | |
Issue costs on share capital | | (3,088 | ) | (3,712 | ) |
Issuance of 4.75% Debentures | | — | | 55,000 | |
Issue costs on 4.75% Debentures | | — | | (2,480 | ) |
Redemption of 7.5% Debentures | | — | | (88,009 | ) |
Realization of imputed interest costs on 7.5% Debentures allocated to operating activities | | — | | 5,050 | |
Advances from loans and borrowings | | 372,141 | | 271,926 | |
Repayment of loans and borrowings | | (356,612 | ) | (258,656 | ) |
Obligations under finance lease (note 11) | | (172 | ) | (11 | ) |
| | 67,654 | | 44,572 | |
Change in non-cash working capital (note 15) | | 136 | | 493 | |
| | 67,790 | | 45,065 | |
| | | | | |
CASH FLOW FROM (USED IN) INVESTING ACTIVITIES | | | | | |
Expenditure on exploration and evaluation assets | | (16,839 | ) | (480 | ) |
Additions to property, plant and equipment | | (162,722 | ) | (106,268 | ) |
Proceeds on sale of property, plant and equipment | | 4,203 | | 14,567 | |
| | (175,358 | ) | (92,181 | ) |
Change in non-cash working capital (note 15) | | 9,376 | | 2,844 | |
| | (165,982 | ) | (89,337 | ) |
| | | | | |
Change in cash | | — | | — | |
| | | | | |
Cash, beginning of year | | — | | — | |
| | | | | |
Cash, end of year | | $ | — | | $ | — | |
| | | | | |
Cash paid: | | | | | |
Interest | | $ | 4,738 | | $ | 4,675 | |
Taxes | | — | | — | |
See accompanying notes to the consolidated financial statements.
55
NOTES TO THE CONSOLIDATED FINANCIAL STATEMENTS
(expressed in Canadian dollars)
1. CORPORATE INFORMATION
Bellatrix Exploration Ltd. (the “Company” or “Bellatrix”) is a growth oriented, public exploration and production company. The Company resulted from a reorganization (the “Reorganization) effective November 1, 2009 pursuant to a plan of arrangement (the “Arrangement”) involving, among others, True Energy Trust (the “Trust” or “True”), Bellatrix Exploration Ltd. and securityholders of the Trust.
The Arrangement involved the exchange, on a one-for-one basis of trust units and exchangeable shares, after accounting for the conversion factor applicable to the exchangeable shares, for common shares of Bellatrix. All outstanding incentive unit rights to acquire Trust units of True became share options to acquire an equal number of common shares of Bellatrix Exploration Ltd. on the same terms and conditions, including as to exercise price, vesting and expiry dates.
In connection with the Reorganization, the unitholders’ capital was reduced by the deficit of the Trust as of October 31, 2009 and trust units were exchanged for common shares of Bellatrix.
2. BASIS OF PREPARATION
a. Statement of compliance
These consolidated financial statements have been prepared using accounting policies consistent with International Financial Reporting Standards (“IFRS”) and in accordance with IFRS 1 — “First-time Adoption of IFRS”, as they are part of the period covered by the Company’s first IFRS financial statements for the year ended December 31, 2011. The consolidated financial statements of the Company were authorized by the Board of Directors on March 7, 2012.
Previously, the Company prepared its consolidated annual and consolidated interim financial statements in accordance with Canadian Generally Accepted Accounting Principles (“Previous GAAP”). Previous GAAP differs in some areas from IFRS. The comparative figures from 2010 were restated to reflect these adjustments. An explanation along with reconciliations of how the transition from Previous GAAP to IFRS has impacted the Company’s equity, earnings and comprehensive income is provided in note 23.
b. Basis of measurement
The consolidated financial statements are presented in Canadian dollars, the Company’s functional currency, and have been prepared on the historical cost basis except for derivative financial instruments and liabilities for cash-settled share-based payment arrangements measured at fair value. The consolidated financial statements have, in management’s opinion, been properly prepared using careful judgment and reasonable limits of materiality and within the framework of the significant policies summarized in note 3. The areas involving a higher degree of judgment or complexity, or areas where assumptions and estimates are significant to the financial statements are disclosed in note 4.
56
3. SIGNIFICANT ACCOUNTING POLICIES
a. Principles of Consolidation
The consolidated financial statements include the accounts of the Company and its subsidiary. Any reference to the “Company” throughout these consolidated financial statements refers to the Company and its subsidiary. All inter-entity transactions have been eliminated.
b. Revenue Recognition
Revenues from the sale of petroleum and natural gas are recorded when title to the products transfers to the purchasers based on volumes delivered and contracted delivery points and prices. Royalty income is recognized as it accrues in accordance with the terms of the overriding royalty agreements and is included with petroleum and natural gas sales.
Processing charges to other entities for use of facilities owned by the Company are recognized as revenue as they accrue in accordance with the terms of the service agreements and are presented as other income.
c. Joint Interests
A significant portion of the Company’s exploration and development activities are conducted jointly with others as established by contractual agreements and requiring unanimous consent for strategic financial and operating decisions. The financial statements reflect only the Company’s proportionate share of the assets, liabilities, revenues, expenses and cash flows from these activities.
d. Property, Plant and Equipment and Exploration and Evaluation Assets
I. Pre-exploration expenditures
Expenditures made by the Company before acquiring the legal right to explore in a specific area do not meet the definition of an asset and therefore are expensed by the Company as incurred.
II. Exploration and evaluation expenditures
Costs incurred once the legal right to explore has been acquired are capitalized as exploration and evaluation assets. These costs include, but are not limited to, exploration license expenditures, leasehold property acquisition costs, evaluation costs, including drilling costs directly attributable to an identifiable well and directly attributable general and administrative costs. These costs are accumulated in cost centres by property and are not subject to depletion until technical feasibility and commercial viability have been determined.
Exploration and evaluation assets are assessed for impairment if sufficient data exists to determine technical feasibility and commercial viability, or if facts and circumstances suggest that the carrying amount is unlikely to be recovered.
III. Developing and production costs
Items of property, plant and equipment, which include oil and gas development and production assets, are measured at cost less accumulated depletion and depreciation and accumulated impairment losses.
Gains and losses on disposal of an item of property, plant and equipment, including oil and natural gas interests, are determined by comparing the proceeds from disposal with the carrying amount of property, plant and equipment, and are recognized within the Consolidated Statements of Comprehensive Income.
57
IV. Subsequent costs
Costs incurred subsequent to the determination of technical feasibility and commercial viability and the costs of replacing parts of property, plant and equipment are recognized as oil and natural gas interests only when they increase the future economic benefits embodied in the specific asset to which they relate. All other expenditures are recognized in profit or loss as incurred. Such capitalized oil and natural gas interests generally represent costs incurred in developing proved and/or probable reserves and bringing in or enhancing production from such reserves, and are accumulated on a well, field or geotechnical area basis. The carrying amount of any replaced or sold component is derecognized. The costs of the day-to-day servicing of property, plant and equipment are recognized in profit or loss as incurred.
V. Depletion and depreciation
Depletion of petroleum and natural gas properties is provided using the unit-of-production method based on production volumes in relation to total estimated proven and probable reserves as determined annually by independent engineers and determined in accordance with National Instrument 51-101. Natural gas reserves and production are converted at the energy equivalent of six thousand cubic feet to one barrel of oil.
Calculations for depletion and depreciation of production equipment are based on total capitalized costs plus estimated future development costs of proven and probable undeveloped reserves less the estimated net realizable value of production equipment and facilities after the proved and probable reserves are fully produced.
Depreciation of office furniture and equipment is provided for on a 20% declining balance basis. Depreciation methods, useful lives and residual values are reviewed at each reporting date.
e. Impairment
I. Financial assets
A financial asset is assessed at each reporting date to determine whether there is any objective evidence that it is impaired. A financial asset is considered to be impaired if objective evidence indicates that one or more events have had a negative effect on the estimated future cash flows of that asset.
An impairment loss in respect of a financial asset measured at amortized cost is calculated as the difference between its carrying amount and the present value of the estimated future cash flows discounted at the original effective interest rate. All impairment losses are recognized in profit or loss.
II. Non-financial assets
For the purpose of impairment testing, assets are grouped together into the smallest group of assets that generates cash inflows from continuing use that are largely independent of the cash inflows of other assets or groups of assets (the “cash-generating unit” or “CGU”). Developing and producing assets are assessed for impairment if facts and circumstances suggest that the carrying amount exceeds the recoverable amount.
The recoverable amount of an asset or a CGU is the greater of its value in use and its fair value less costs to sell. Fair value less costs to sell is determined to be the amount for which the asset could be sold in an arm’s length transaction. Fair value less costs to sell can be determined by using an observable market metric or by using discounted future net cash flows of proved and probable reserves using forecasted prices and costs. Value in use is determined by estimating the present
58
value of the future net cash flows expected to be derived from the continued use of the asset or cash generating unit.
An impairment loss is recognized if the carrying amount of an asset or its CGU exceeds its estimated recoverable amount. Impairment losses are recognized in profit or loss. Impairment losses recognized in respect of CGU’s are allocated first to reduce the carrying amount of goodwill, if any, allocated to the units and then to reduce the carrying amounts of the other assets in the unit (group of units) on a pro rata basis.
Impairment losses recognized in prior years are assessed at each reporting date for any indications that the loss has decreased or no longer exists. An impairment loss is reversed if there has been a change in the estimates used to determine the recoverable amount. An impairment loss is reversed only to the extent that the asset’s carrying amount does not exceed the carrying amount that would have been determined, net of depletion and depreciation or amortization, if no impairment loss had been recognized.
Exploration and evaluation assets are grouped together with the Company’s CGU’s when they are assessed for impairment, both at the time of any triggering facts and circumstances as well as upon their eventual reclassification to producing assets (oil and natural gas interests in property, plant and equipment).
f. Provisions
Provisions are recognized when the Company has a present legal or constructive obligation as a result of a past event, it is probable that an outflow of economic benefits will be required to settle the obligation and a reliable estimate can be made of the amount of the obligation. Provisions are determined by discounting the expected cash flows at a pre-tax rate that reflects current market assessments of the time value of money and the risks specific to the liability if the risks have not been incorporated into the estimate of cash flows. The increase in the provision due to the passage of time is recognized within finance costs.
I. Decommissioning obligations
The Company’s activities give rise to dismantling, decommissioning and site disturbance re-mediation activities. A provision is made for the estimated cost of site restoration and capitalized in the relevant asset category.
Decommissioning obligations are measured at the present value of management’s best estimate of the expenditure required to settle the present obligation at the balance sheet date. Changes in the present value of the estimated expenditure are reflected as an adjustment to the provision and the relevant asset. The unwinding of the discount on the decommissioning provision is recognized as a finance cost. Actual costs incurred upon settlement of the decommissioning liabilities are charged against the provision to the extent the provision was recognized.
II. Environmental Liabilities
The Company records liabilities on an undiscounted basis for environmental remediation efforts that are likely to occur and where the cost can be reasonably estimated. The estimates, including associated legal costs, are based on available information using existing technology and enacted laws and regulations. The estimates are subject to revision in future periods based on actual costs incurred or new circumstances. Any amounts expected to be recovered from other parties, including insurers, are recorded as an asset separate from the associated liability.
59
g. Share-based Payments
I. Equity-settled transactions
Bellatrix accounts for options issued under the Company’s share option plan to employees, directors, officers, consultants and other service providers by reference to the fair value of the equity instruments granted. The fair value of each share option is estimated on the date of the grant using the Black-Scholes options pricing model and charged to earnings over the vesting period with a corresponding increase to contributed surplus. The Company estimates a forfeiture rate on the grant date and the rate is adjusted to reflect the actual number of options that actually vest. The expected life of the options granted is adjusted, based on the Company’s best estimate, for the effects of non-transferability, exercise restrictions and behavioural considerations.
II. Cash-settled transactions
The Company’s Deferred Share Unit Plan (the “Plan”) is accounted for as a cash settled share based payment plan in accordance with IFRS 2 — “Share-based Payments” in which the fair value of the amount payable under the Plan is recognized as an expense with a corresponding increase in liabilities. The liability is re-measured at each reporting date and at settlement date. Any changes in the fair value of the liability are recognized in profit or loss.
h. Income Taxes
Income tax expense is comprised of current and deferred tax. Income tax expense is recognized in profit or loss except to the extent that it relates to items recognized directly in equity, in which case it is recognized in equity.
I. Current income tax
Current income tax assets and liabilities for the current and prior periods are measured at the amount expected to be recovered from or paid to the taxation authorities. The tax rates and tax laws used to compute the amount are those that are enacted or substantively enacted by the date of the statement of financial position.
II. Deferred income tax
Deferred tax is recognized using the balance sheet method, providing for temporary differences between the carrying amounts of assets and liabilities for financial reporting purposes and the amounts used for taxation purposes. Deferred tax is not recognized on the initial recognition of assets or liabilities in a transaction that is not a business combination. In addition, deferred tax is not recognized for taxable temporary differences arising on the initial recognition of goodwill. Deferred tax is measured at the tax rates that are expected to be applied to temporary differences when they reverse, based on the laws that have been enacted or substantively enacted by the reporting date. Deferred tax assets and liabilities are offset if there is a legally enforceable right to offset, and they relate to income taxes levied by the same tax authority on the same taxable entity, or on different tax entities, but they intend to settle current tax liabilities and assets on a net basis or their tax assets and liabilities will be realized simultaneously.
A deferred tax asset is recognized to the extent that it is probable that future taxable profits will be available against which the temporary difference can be utilized. Deferred tax assets are reviewed at each reporting date and are reduced to the extent that it is no longer probable that the related tax benefit will be realized.
60
i. Financial Instruments
All financial instruments, including all derivatives, are recognized on the balance sheet initially at fair value. Subsequent measurement of all financial assets and liabilities except those held-for-trading and available for sale are measured at amortized cost determined using the effective interest rate method. Held-for-trading financial assets are measured at fair value with changes in fair value recognized in income. Available-for-sale financial assets are measured at fair value with changes in fair value recognized in comprehensive income and reclassified to income when derecognized or impaired. The Company has the following classifications:
Financial Assets and Liabilities | | Category | | Subsequent Measurement |
Cash and cash equivalents | | Held-for-trading | | Fair value through profit or loss |
Accounts receivable | | Loans and receivables | | Amortized cost |
Commodity risk management contracts | | Held-for-trading | | Fair value through profit or loss |
Accounts payable and accrued liabilities | | Other liabilities | | Amortized cost |
Deferred liability | | Other liabilities | | Amortized cost |
Long-term debt | | Other liabilities | | Amortized cost |
Convertible debentures | | Other liabilities | | Amortized cost |
Finance lease obligation | | Other liabilities | | Amortized cost |
Transaction costs attributable to financial instruments classified as other than held-for-trading are included in the recognized amount of the related financial instrument and recognized over the life of the resulting financial instrument using the effective interest rate method.
The Company utilizes financial derivatives and commodity sales contracts requiring physical delivery, to manage the price risk attributable to anticipated sale of petroleum and natural gas production and foreign exchange exposures. The Company does not enter into derivative financial instruments for trading or speculative purposes. The Company has not designated its financial derivative contracts as effective accounting hedges, and thus not applied hedge accounting, even though the Company considers all commodity contracts to be economic hedges. As a result, financial derivatives are classified as fair value through profit or loss and are recorded on the balance sheet at fair value.
The derivative financial instruments are initiated within the guidelines of the Company’s commodity price risk management policy. This includes linking all derivatives to specific assets and liabilities on the balance sheet or to specific firm commitments or forecasted transactions.
The Company accounts for its commodity sales and purchase contracts, which were entered into and continue to be held for the purpose of receipt or delivery of non-financial items in accordance with its expected purchase, sale or usage requirements as executory contracts. As such, physical sales and purchase contracts are not recorded at fair value on the balance sheet. Settlements on these physical sales contracts are recognized in petroleum and natural gas sales.
Financial instruments measured at fair value on the balance sheet require classification into one of the following levels of the fair value hierarchy:
Level 1 — Quoted prices (unadjusted) in active markets for identical assets or liabilities
Level 2 — Inputs other than quoted prices included in level 1 that are observable for the asset or liability, either directly or indirectly.
Level 3 — inputs for the asset or liability that are not based on observable market data.
61
The fair value hierarchy level at which a fair value measurement is categorized is determined on the basis of the lowest level input that is significant to the fair value measurement in its entirety. The Company has categorized its financial instruments that are fair valued on the balance sheet according to the fair value hierarchy (note 22).
j. Compound Financial Instruments
The Company’s compound financial instruments comprise of its convertible debentures that can be converted to common shares at the option of the holder, and the number of shares to be issued does not vary with changes in fair value.
The liability component of the convertible debentures is recognized initially at the fair value of a similar liability that does not have an equity conversion option. The equity component is recognized initially as the difference between the fair value of the convertible debenture and the fair value of the liability component. Any directly attributable transaction costs are allocated to the liability and equity components in proportion to their initial carrying amounts.
Subsequent to initial recognition, the liability component of the convertible debentures is measured at amortized cost using the effective interest method. The equity component of the convertible debentures is not re-measured subsequent to initial recognition.
k. Flow-through Shares
Resource expenditures for income tax purposes related to exploration and development activities funded by flow-through share arrangements are renounced to investors in accordance with income tax legislation. A deferred liability is recognized for the difference between the value ascribed to the flow-through shares issued and the value that would have been received for common shares at the date of issuance of the flow-through shares (the “premium”). The deferred liability is drawn down as the Company incurs qualifying expenditures. Any difference between the deferred liability set up for the premium on the flow-through shares and the tax effect on the renounced expenditures is recognized in profit or loss as a deferred tax expense.
l. Finance Lease Obligation
Leases which effectively transfer substantially all of the risks and rewards of ownership to the Company are classified as finance leases and are accounted for as an acquisition of an asset and an assumption of an obligation at the inception of the lease, measured as the present value of minimum lease payments to a maximum of the asset’s fair value. The asset is amortized in accordance with the Company’s depletion and depreciation policy. The obligations recorded under finance lease payments are reduced by the lease payments made.
m. Basic and Diluted per Share Calculations
Basic per share amounts are calculated using the weighted average number of shares outstanding during the period. The Company uses the treasury share method to determine the dilutive effect of share options. Under the treasury share method, only “in the money” dilutive instruments impact the diluted calculations in computing diluted per share amounts. The Company uses the “if-converted” method to determine the dilutive effect of convertible debentures.
n. Finance Income and Expenses
Finance income is recognized as it accrues in profit or loss, using the effective interest method. Finance expense comprises interest expense on borrowings, amortization of deferred charges, accretion of the discount rate on provisions, accretion of the liability component of the convertible debentures and impairment losses recognized on financial assets.
62
o. Borrowing Costs
Borrowing costs incurred for the construction of qualifying assets are capitalized during the period of time that is required to complete and prepare the assets for their intended use or sale. Qualifying assets are assets that necessarily take a substantial period of time to get ready for their intended use. All other borrowing costs are recognized in profit or loss using the effective interest method. The capitalization rate used to determine the amount of borrowing costs to be capitalized is the weighted average interest rate applicable to the Company’s outstanding borrowings during the period.
p. Cash and Cash Equivalents
Cash and cash equivalents include cash and short-term investments with original maturities of three months or less.
4. CRITICAL JUDGMENTS AND ACCOUNTING ESTIMATES
The consolidated financial statements of the Company have been prepared by management in accordance with IFRS. The preparation of consolidated financial statements in conformity with IFRS requires management to make judgment, estimates and assumptions that affect the reported amounts of assets, liabilities, and contingent liabilities at the date of the consolidated financial statements and reported amounts of revenues and expenses during the reporting period and accompanying notes. By their nature, these estimates are subject to measurement uncertainty and the effect on the financial statements of changes in such estimates in future periods could be material. Revisions to accounting estimates are recognized in the period in which the estimates are revised and in any future periods affected. The consolidated financial statements have, in management’s opinion, been properly prepared using careful judgment and reasonable limits of materiality and within the framework of the significant policies summarized below.
I. Derivatives
The fair value of commodity contracts is estimated, whenever possible, based on published market prices, and if not available, on estimates from third party brokers, as at the balance sheet date and may differ from what will eventually be realized.
II. Oil and gas reserves
Reserves and resources are used in the units of production calculation for depreciation, depletion and amortization and the impairment analysis which affect net profit. There are numerous uncertainties inherent in estimating oil and gas reserves. Estimating reserves is very complex, requiring many judgments based on geological, geophysical, engineering and economic data. Changes in these judgments could have a material impact on the estimated reserves. These estimates may change, having either a negative or positive effect on net profit as further information becomes available and as the economic environment changes.
III. Depreciation and depletion
Depletion of petroleum and natural gas properties is provided using the unit-of-production method based on production volumes before royalties in relation to total estimated proved and probable reserves as determined annually by independent engineers and internal reserve evaluations on a quarterly basis determined in accordance with National Instrument 51-101. Natural gas reserves and production are converted at the energy equivalent of six thousand cubic feet to one barrel of oil.
Calculations for depletion and depreciation of production equipment are based on total capitalized costs plus estimated future development costs of proved and probable undeveloped reserves less the estimated
63
net realizable value of production equipment and facilities after the proved reserves are fully produced. The costs of acquiring and evaluating unproved properties are excluded from depletion calculations.
IV. Recoverability of asset carrying values
The Company assesses its oil and gas properties, including exploration and evaluation assets, for possible impairment if there are events or changes in circumstances that indicate that carrying values of the assets may not be recoverable, or at least at every reporting date.
The assessment of any impairment of property, plant and equipment is dependent upon estimates of recoverable amount that take into account factors such as reserves, economic and market conditions, timing of cash flows, the useful lives of assets and their related salvage values.
Bellatrix’s assets are aggregated into CGUs, for the purpose of calculating impairment, based on their ability to generate largely independent cash flows, geography, geology, production profile and infrastructure of its assets. By their nature, these estimates and assumptions are subject to measurement uncertainty and may impact the carrying value of the Company’s assets in future periods.
V. Decommissioning obligations
Provisions for decommissioning obligations associated with the Company’s drilling operations are based on current legal and constructive requirements, technology, price levels and expected plans for remediation. Actual costs and cash outflows can differ from estimates because of changes in laws and regulations, public expectations, prices, discovery and analysis of site conditions and changes in clean up technology.
VI. Share-based compensation
The fair value of stock options granted is measured using a Black Scholes model. Measurement inputs include share price on measurement date, exercise price of the option, expected volatility, expected life of the options, expected dividends and the risk-free rate. The Company estimates volatility based on historical share price excluding specific time frames in which volatility was affected by specific transactions that are not considered to be indicative of the Company’s expected share price volatility. The expected life of the options is based on historical experience and general option holder behavior. Dividends were not taken into consideration as the Company does not expect to pay dividends. Management also makes an estimate of the number of options that will be forfeited and the rate is adjusted to reflect the actual number of options that actually vest.
VII. Income taxes
Related assets and liabilities are recognized for the estimated tax consequences between amounts included in the financial statements and their tax base using substantively enacted future income tax rates. Timing of future revenue streams and future capital spending changes can affect the timing of any temporary differences, and accordingly affect the amount of the deferred tax asset or liability calculated at a point in time. These differences could materially impact earnings.
5. NEW STANDARDS AND INTERPRETATIONS NOT YET ADOPTED
The following pronouncements from the IASB are applicable to Bellatrix and will become effective for future reporting periods, but have not yet been adopted:
IFRS 10 - “Consolidated Financial Statements” (“IFRS 10”), which requires an entity to consolidate an investee when it is exposed, or has rights, to variable returns from its involvement with the investee and has the ability to affect those returns through its power over the investee. Under existing IFRS, consolidation is required when an
64
entity has the power to govern the financial and operating policies of an entity so as to obtain benefits from its activities. This standard replaces SIC-12 — “Consolidation—Special Purpose Entities” and parts of IAS 27 — “Consolidated and Separate Financial Statements.”
IFRS 11 — “Joint Arrangements” (“IFRS 11”), requires a venturer to classify its interest in a joint arrangement as a joint venture or joint operation, each having its own accounting model. Joint ventures will be accounted for using the equity method of accounting whereas for a joint operation the venture will recognize its share of the assets, liabilities, revenue and expenses of the joint operation. The standard provides for a more substance based reflection of joint arrangements by focusing on the rights and obligations of the arrangement, rather than its legal form. IFRS 11 replaces IAS 31 — “Interests in Joint Ventures” and SIC-13 — “Jointly Controlled Entities—Non-monetary Contributions by Venturers” and establishes principles for accounting for all joint arrangements.
IFRS 12 — “Disclosure of Interests in Other Entities” (“IFRS 12”), establishes disclosure requirements for interests in other entities, such as joint arrangements, associates, special purpose vehicles and off balance sheet vehicles. The standard carries forward existing disclosures and also introduces significant additional disclosure requirements that address the nature of, and risks associated with, an entity’s interests in other entities.
Amendments have been made to existing standards, including IAS 27 — “Separate Financial Statements” (“IAS 27”) and IAS 28 — “Investments in Associates and Joint Ventures” (“IAS 28”). IAS 27 addresses accounting for subsidiaries, jointly controlled entities and associates in non-consolidated financial statements. IAS 28 has been amended to include joint ventures in its scope and to address the changes in IFRS 10 to 12.
The above standards are effective for annual periods beginning on or after January 1, 2013. Early adoption is permitted, providing the five standards are adopted concurrently. We are currently evaluating the impact of adopting these standards on our Consolidated Financial Statements.
IFRS 13 — “Fair Value Measurement” (“IFRS 13”), is a comprehensive standard for fair value measurement and disclosure requirements for use across all IFRSs. The new standard clarifies that fair value is the price that would be received to sell an asset, or paid to transfer a liability in an orderly transaction between market participants, at the measurement date. It also establishes disclosures about fair value measurement. Under existing IFRS, guidance on measuring and disclosing fair value is dispersed among the specific standards requiring fair value measurements and in many cases does not reflect a clear measurement basis or consistent disclosures. IFRS 13 is effective for annual periods beginning on or after January 1, 2013 and applies prospectively from the beginning of the annual period in which the standard is adopted. Early adoption is permitted. We are currently evaluating the impact of adopting IFRS 13 on our Consolidated Financial Statements.
IFRS 9 - “Financial Instruments”, which is the result of the first phase of the IASB’s project to replace IAS 39, “Financial Instruments: Recognition and Measurement”. The new standard replaces the current multiple classification and measurement models for financial assets and liabilities with a single model that has only two classification categories: amortized cost and fair value. This standard is effective for annual periods beginning on or after January 1, 2013 with different transitional arrangements depending on the date of initial application. We are currently evaluating the impact of adopting IFRS 9 on our Consolidated Financial Statements.
In June 2011, the IASB issued an amendment to IAS 1 - “Presentation of Financial Statements” (“IAS 1”) requiring companies to group items presented within Other Comprehensive Income based on whether they may be subsequently reclassified to profit or loss. This amendment to IAS 1 is effective for annual periods beginning on or after July 1, 2012 with full retrospective application. Early adoption is permitted. Bellatrix has yet to assess the full impact of adopting this amendment on its consolidated financial statements.
65
6. EXPLORATION AND EVALUATION ASSETS
($000s) | | | |
Deemed cost (note 23) | | | |
Balance, January 1, 2010 | | $ | 20,542 | |
Additions | | 481 | |
Transfer to oil and natural gas properties | | (1,809 | ) |
Disposals (1) | | (679 | ) |
Balance, December 31, 2010 | | 18,535 | |
Additions | | 16,839 | |
Transfer to oil and natural gas properties | | (1,817 | ) |
Disposals (1) | | (468 | ) |
Balance, December 31, 2011 | | $ | 33,089 | |
(1) Disposals include swaps.
7. PROPERTY, PLANT AND EQUIPMENT
($000s) | | Oil and
natural gas
properties | | Office
furniture and
equipment | | Total | |
Cost (note 23) | | | | | | | |
Balance, January 1, 2010, deemed cost | | $ | 388,276 | | $ | 1,748 | | $ | 390,024 | |
Additions | | 112,145 | | 488 | | 112,633 | |
Transfer from exploration and evaluation assets | | 1,809 | | — | | 1,809 | |
Disposals (1) | | (17,630 | ) | — | | (17,630 | ) |
Balance, December 31, 2010 | | 484,600 | | 2,236 | | 486,836 | |
Additions | | 173,595 | | 267 | | 173,862 | |
Transfer from exploration and evaluation assets | | 1,817 | | — | | 1,817 | |
Disposals (1) | | (2,697 | ) | — | | (2,697 | ) |
Balance, December 31, 2011 | | $ | 657,315 | | $ | 2,503 | | $ | 659,818 | |
| | | | | | | |
Accumulated Depletion, Depreciation and Impairment losses | | | | | | | |
Balance, January 1, 2010 (note 23) (2) | | $ | 43,193 | | $ | 602 | | $ | 43,795 | |
Charge for time period | | 47,650 | | 251 | | 47,901 | |
Impairment loss | | 6,489 | | 121 | | 6,610 | |
Impairment reversal | | (9,648 | ) | (200 | ) | (9,848 | ) |
Disposals (1) | | (1,202 | ) | — | | (1,202 | ) |
Balance, December 31, 2010 | | $ | 86,482 | | $ | 774 | | $ | 87,256 | |
Charge for time period | | 63,085 | | 299 | | 63,384 | |
Impairment loss | | 28,039 | | 194 | | 28,233 | |
Impairment reversal | | (2,664 | ) | — | | (2,664 | ) |
Disposals (1) | | (692 | ) | — | | (692 | ) |
Balance, December 31, 2011 | | $ | 174,250 | | $ | 1,267 | | $ | 175,517 | |
(1) Disposals include swaps. | | | | | | | |
(2) Transitional impairment to property, plant and equipment on January 1 2010. | | | | | |
| | | | | | | |
Carrying amounts | | | | | | | |
At January 1, 2010 | | $ | 345,083 | | $ | 1,146 | | $ | 346,229 | |
At December 31, 2010 | | $ | 398,118 | | $ | 1,462 | | $ | 399,580 | |
December 31, 2011 | | $ | 483,065 | | $ | 1,236 | | $ | 484,301 | |
Bellatrix has included $376.8 million (2010: $288.8 million) for future development costs and excluded $35.1 million (2010: $32.6 million) for estimated salvage from the depletion calculation during the three months ended December 31, 2011.
66
For the year ended December 31, 2011, the Company capitalized $3.6 million (2010: $2.0 million) of general and administrative expenses and $1.4 million (2010: $0.8 million) of share-based compensation expense directly related to exploration and development activities.
Bellatrix’s credit facilities are secured against all of the assets of the Corporation by a $400 million debenture containing a first ranking charge and security interest. The Corporation has provided a negative pledge and undertaking to provide fixed charges over major petroleum and natural gas reserves in certain circumstances.
Impairment
Bellatrix assesses the recoverability of the carrying values of its oil and natural gas properties on a Cash-Generating Unit (“CGU”) basis. The composition of each CGU is determined based on factors such as common processing facilities, sales points, and commonalities in the geological and geophysical structure of individual areas.
In accordance with IFRS, the recoverability of a CGU’s carrying value is determined by calculating and using the greater of its Value in Use (“VIU”) or Fair Value Less Costs to Sell (“FVLCS”). VIU is determined by estimating the present value of the future net cash flows expected to be derived from the continued use of the assets in the CGU. FVLCS is determined to be the amount for which the assets in the CGU could be sold in an arm’s length transaction. FVLCS is calculated for each CGU based on independently available data on recent industry acquisition transactions (“transaction metrics”) applicable to the CGU based on similarities in assets involved in the transactions. These transaction metrics are determined as a dollar-value per boe for proved plus probable reserves. The per-boe value for each CGU is applied to the estimated boe proved plus probable reserves remaining in that CGU as determined at least annually by independent reserve engineers. The recoverable amount is compared to the carrying value of that CGU in order to determine if impairment exists. Impairment is recognized as an expense included in the Company’s consolidated statement of comprehensive income in the period in which it occurs.
A $1.00/boe decrease to transaction metrics used in 2011 year-end impairment calculations would result in a an increase in impairment expense of $3.2 million. Identical decreases would result from a $1.00/boe increase to transaction metrics used.
2011 Impairment
Bellatrix engaged an external reserve evaluator to prepare an updated company reserve report effective December 31, 2011, and previously at June 30, 2011. Overall corporate proved and probable reserve volumes increased significantly at December 31, 2011 and June 30, 2011 compared to the previous reserve evaluation report effective December 31, 2010. However, the fair value of three gas-weighted CGUs declined due to a reduction in prices and volumes.
During the year ended December 31, 2011, Bellatrix performed an impairment test in accordance with IAS 36 resulting in an excess of the carrying value of three CGUs over their recoverable amount, resulting in a non-cash $25.6 million impairment loss.
IAS 36 requires impairment losses to be reversed when there has been a subsequent increase in the recoverable amount. In the case of an impairment loss reversal, the carrying amount of the asset or CGU is limited to the original carrying amount less depreciation, depletion and amortization as if no impairment had been recognized for the asset or CGU for prior periods. In 2011, a partial reversal of impairment was recognized relating to a previous impairment for the Company`s South East Alberta CGU. As a result of the reversal, impairment expense for the 2011 year was reduced by $2.7 million.
67
2010 Impairment
As discussed in note 23, for the year ended December 31, 2010, the Company recognized a net impairment reversal of $3.2 million. The impairment reversal was a result of a higher fair value less costs to sell for the Company’s North East cash generating unit (“CGU”) at the end of the 2010 fiscal period.
8. DEFERRED LIABILITY
On August 12, 2010, Bellatrix issued 4,710,000 common shares on a flow-through basis (“Flow-Through Shares”) at $4.25 each. As a result of the Flow-Through Shares, the Company was committed to incur $20.0 million of Canadian Eligible Expenses (“CEE”) on or before December 31, 2011.
Bellatrix recognized a deferred liability based on the premium received on the Flow-Through Shares compared to the Company’s closing share price on the date of the issuance. For the year ended December 31, 2011, the Company satisfied its $20.0 million commitment, and as a result, the deferred liability has been eliminated.
9. LONG-TERM DEBT
($000s) | | 2011 | | 2010 | |
Operating facility | | $ | 5,701 | | $ | 6,172 | |
Revolving term facility | | 51,000 | | 35,000 | |
Balance, end of year | | $ | 56,701 | | $ | 41,172 | |
The Company’s credit facilities consist of a $15 million demand operating facility provided by a Canadian bank and a $155 million extendible revolving term credit facility provided by two Canadian banks and a Canadian financial institution. Amounts borrowed under the credit facility will bear interest at a floating rate based on the applicable Canadian prime rate, U.S. base rate or LIBOR rate, plus between 1.00% and 3.50%, depending on the type of borrowing and the Company’s debt to cash flow ratio. The credit facilities are secured by a $400 million debenture containing a first ranking charge and security interest. Bellatrix has provided a negative pledge and undertaking to provide fixed charges over major petroleum and natural gas reserves in certain circumstances. A standby fee is charged of between 0.50% and 0.875% on the undrawn portion of the credit facilities, depending on the Company’s debt to cash flow ratio.
The revolving period for the revolving term credit facility will end on June 26, 2012, unless extended for a further 364 - day period. Should the facility not be extended it will convert to a non-revolving term facility with the full amount outstanding due 366 days after the last day of the revolving period of June 26, 2012. The borrowing base will be subject to re-determination on May 31 and November 30 in each year prior to maturity, with the next semi-annual redetermination occurring on May 31, 2012.
Payment will not be required under the revolving term facility for more than 365 days from December 31, 2011 and as there is sufficient availability under the revolving term credit facility to cover the operating facility, the entire amounts owing on the credit facilities have been classified as long-term.
Pursuant to Bellatrix’s credit facilities, the Company is permitted to pay the semi-annual interest payments on the debentures, and payments by the Company to debenture holders in relation to the redemption of debentures and in relation to debenture normal course issuer bids approved by the Toronto Stock Exchange, provided that the aggregate of all such normal course issuer bids and redemptions do not exceed $10.0 million in any fiscal year.
As at December 31, 2011, approximately $113.3 million was not drawn under the existing facilities and Bellatrix was fully compliant with all of its operating debt covenants.
68
10. CONVERTIBLE DEBENTURES
The following table sets forth a reconciliation of the convertible debentures:
Convertible debentures
($000s except number of debentures) | | 7.5% | | 4.75% | | Total | |
Number of Debentures | | | | | | | |
Balance, December 31, 2009 | | 84,884 | | — | | 84,884 | |
Issued | | — | | 55,000 | | 55,000 | |
Redeemed | | (84,884 | ) | — | | (84,884 | ) |
Balance, December 31, 2010 and 2011 | | — | | 55,000 | | 55,000 | |
Debt Component | | | | | | | |
Balance, December 31, 2009 | | $ | 81,684 | | $ | — | | $ | 81,684 | |
Issued | | — | | 48,841 | | 48,841 | |
Issue costs | | — | | (2,202 | ) | (2,202 | ) |
Accretion | | 689 | | 960 | | 1,649 | |
Redeemed | | (82,373 | ) | — | | (82,373 | ) |
Balance, December 31, 2010 | | $ | — | | $ | 47,599 | | $ | 47,599 | |
Issued | | — | | — | | — | |
Accretion | | — | | 1,477 | | 1,477 | |
Redeemed | | — | | — | | — | |
Balance, December 31, 2011 | | $ | — | | $ | 49,076 | | $ | 49,076 | |
Equity Component | | | | | | | |
Balance, December 31, 2009 | | $ | — | | $ | — | | $ | — | |
Issued | | — | | 4,656 | | 4,656 | |
Issue costs | | — | | (278 | ) | (278 | ) |
Redeemed | | — | | — | | — | |
Balance, December 31, 2010 and 2011 | | $ | — | | $ | 4,378 | | $ | 4,378 | |
On April 20, 2010, Bellatrix issued $55 million of 4.75% convertible unsecured subordinated debentures (the “4.75%” Debentures) on a bought deal basis. The 4.75% Debentures have a face value of $1,000 each, bear interest at the rate of 4.75% per annum payable semi-annually in arrears on the last day of April and October of each year commencing on October 31, 2010 and mature on April 30, 2015 (the “Maturity Date”). The 4.75% Debentures are convertible at the holder’s option and at any time prior to the close of business on the earlier of the close of business on the business day immediately preceding the Maturity Date and the date specified by the Corporation for redemption of the 4.75% Debentures into common shares of the Corporation at a conversion price of $5.60 per common share (the “Conversion Price”), subject to adjustment in certain events. The 4.75% Debentures are not redeemable by the Corporation before April 30, 2013. On and after April 13, 2013 and prior to April 30, 2014, the 4.75% Debentures are redeemable at the Corporation’s option, in whole or in part, at par plus accrued and unpaid interest if the weighted average trading price of the common shares for the specified period is not less than 125% of the Conversion Price. On and after April 30, 2014, the 4.75% Debentures are redeemable at the Corporation’s option, in whole or in part, at any time at par plus accrued and unpaid interest. The 4.75% Debentures are listed and posted for trading on the TSX under the symbol “BXE.DB.A”.
As the 4.75% Debentures are convertible into common shares, the liability and equity components are presented separately. The initial carrying amount of the financial liability is determined by discounting the stream of future payments of interest and principal and has been determined to be $48.8 million. A total of $2.2 million of issue costs has been allocated to the liability component of the debentures. Using the residual method, the carrying amount of
69
the conversion feature is the difference between the principal amount and the carrying value of the financial liability. Within the Shareholder’s Equity section of the consolidated financial statements, $4.4 million has been recorded as the carrying amount of the conversion feature of the debentures, net of $0.3 million of issue costs and $1.5 million of deferred taxes. The 4.75% Debentures, net of the equity component and issue costs, of $46.6 million, is accreted using the effective interest rate method over the term of the 4.75% Debentures such that the carrying amount of the financial liability will equal the principal balance at maturity.
On April 20, 2010, Bellatrix deposited with Computershare Trust Company of Canada, the trustee (the “Trustee”) for Bellatrix’s previously outstanding series of debentures, being the 7.5% convertible unsecured subordinated debentures due June 30, 2011 (the “7.5% Debentures”), sufficient funds to satisfy the principal amount and interest owing on the 7.5% Debentures and on May 3, 2010 the trustee provided notice to the registered holders of the 7.5% Debentures of its intention to redeem the 7.5% Debentures on July 2, 2010. The 7.5% Debentures were redeemed for an amount of $1,025 for each $1,000 principal amount of the 7.5% Debentures plus accrued and unpaid interest, or a total of $88.0 million. Proceeds from the issuance of the 4.75% Debentures have been used by Bellatrix to partially fund the redemption of the 7.5% Debentures and the balance of the redemption amount was funded through bank indebtedness. Bellatrix recorded a $3.5 million loss and an increase of the deficit of $1.6 million in connection with the redemption of the 7.5% Debentures.
11. FINANCE LEASE OBLIGATION
The Company entered into an agreement in December 2010 to raise $1.6 million for the construction of certain facilities. A similar agreement was entered into in December 2011, raising $3.7 million for the construction of other facilities.
The agreements resulted in the recognition of finance leases in both 2010 and 2011 for the use of the constructed facilities. The agreements will expire in year 2030 and 2031, respectively, or earlier if certain circumstances are met. At the end of the term of each agreement, the ownership of the facilities is transferred to the Company. Assets under these finance leases at December 31, 2011 totaled $5.3 million with accumulated depreciation of $0.43 million.
Multiple participants of the joint ventures were involved in both the 2010 and 2011 agreements. Although the majority of participants were fully external to the Company, some related parties were involved in each agreement. See note 19.
The following is a schedule of future minimum lease payments under the finance lease obligations:
Year ending December 31, | | ($000s) | |
2012 | | $ | 1,238 | |
2013 | | 1,185 | |
2014 | | 1,133 | |
2015 | | 1,078 | |
2016 | | 992 | |
Thereafter | | 4,756 | |
Total lease payments | | 10,382 | |
Amount representing implicit interest at 15.28% | | (5,265 | ) |
| | 5,117 | |
Current portion of finance lease obligation | | (490 | ) |
Finance lease obligation | | $ | 4,627 | |
70
12. DECOMMISSIONING LIABILITIES
The Company’s decommissioning liabilities result from net ownership interests in petroleum and natural gas assets including well sites, gathering systems and processing facilities. The Company estimates the total undiscounted amount of cash flows required to settle its decommissioning liabilities is approximately $51 million which will be incurred between 2013 and 2053. A risk-free rate between 0.95% - 2.49% (2010: 1.67% - 2.99%) and an inflation rate of 2.4% (2010: 2.4%) were used to calculate the fair value of the decommissioning liabilities as at December 31, 2011.
($000s) | | 2011 | | 2010 | |
Balance, beginning of year (note 23) | | $ | 38,710 | | $ | 39,001 | |
Incurred on development activities | | 1,694 | | 2,140 | |
Revisions on estimates | | 4,703 | | 1,182 | |
Reversed on dispositions | | (326 | ) | (3,302 | ) |
Settled during the year | | (569 | ) | (1,373 | ) |
Accretion expense | | 879 | | 1,062 | |
Balance, end of year | | $ | 45,091 | | $ | 38,710 | |
13. SHAREHOLDERS’ CAPITAL
Bellatrix is authorized to issue an unlimited number of common shares. All shares issued are fully paid and have no par value. The common shareholders are entitled to dividends declared by the Board of Directors; Bellatrix does not anticipate paying dividends.
| | 2011 | | 2010 | |
| | Number | | Amount | | Number | | Amount | |
| | | | ($000s) | | | | ($000s) | |
Common shares, opening balance | | 97,446,026 | | $ | 316,779 | | 78,809,039 | | $ | 257,629 | |
Shares issued for cash, net of transaction costs and tax effect of $0.8 million (2010: $1 million) | | 9,822,000 | | 52,734 | | 18,350,000 | | 62,358 | |
Premium on flow-through shares classified as a deferred liability | | — | | — | | — | | (3,768 | ) |
Shares issued on exercise of options | | 139,215 | | 381 | | 286,987 | | 434 | |
Contributed surplus transferred on exercised options | | — | | 154 | | — | | 126 | |
Balance, end of year | | 107,407,241 | | $ | 370,048 | | 97,446,026 | | $ | 316,779 | |
On May 11, 2011, Bellatrix closed an equity issuance of 9.8 million common shares on a bought deal basis at a price of $5.60 per share for gross proceeds of $55.0 million (net proceeds of $51.9 million after transaction costs and before tax effect).
14. SHARE-BASED COMPENSATION PLANS
a. Share Option Plan
Bellatrix has a share option plan where the Company may grant share options to its directors, officers, employees and service providers. Under this plan, the exercise price of each share option is not less than the volume weighted average trading price of the Company’s share price for the five trading days immediately preceding the date of grant. The maximum term of an option grant is five years. Option grants are non-transferable or assignable except in accordance with the share option plan and the holding of share options
71
shall not entitle a holder to any rights as a shareholder of Bellatrix. Share options, entitling the holder to purchase common shares of the Company, have been granted to directors, officers, employees and service providers of Bellatrix. One third of the initial grant of share options normally vests on each of the first, second, and third anniversary from the date of grant.
During the year ended December 31, 2011, Bellatrix granted 2,554,000 (2010: 2,178,500) share options. During the year ended December 31, 2011, the Company recorded share-based compensation of $3.5 million related to its outstanding share options, of which $1.4 million was capitalized to property, plant and equipment. In addition, $0.8 million (note 14 b.) was expensed in relation to the Director’s Deferred Share Unit Plan introduced during 2011, resulting in total net share-based compensation of $2.9 million recognized as an expense for the 2011 year (2010: $1.6 million).
The fair values of all share options granted are estimated on the date of grant using the Black-Scholes option-pricing model. The weighted average fair market value of share options granted during the years ended December 31, 2011 and 2010, and the weighted average assumptions used in their determination are as noted below:
| | 2011 | | 2010 | |
Inputs: | | | | | |
Share price | | 5.21 | | 3.65 | |
Exercise price | | 5.21 | | 3.65 | |
Risk free interest rate (%) | | 1.83 | | 2.40 | |
Option life (years) | | 3.61 | | 3.65 | |
Option volatility (%) | | 65 | | 75 | |
Results: | | | | | |
Weighted average fair value of each share option granted | | 2.48 | | 2.08 | |
Bellatrix calculates volatility based on historical share price. Bellatrix incorporates an estimated forfeiture rate between 3% to 10% (2010: 3% to 10%) for stock options that will not vest, and adjusts for actual forfeitures as they occur.
The weighted average share trading price for the year ended December 31, 2011 was $5.01 (2010: $3.66).
The following tables summarize information regarding Bellatrix’s Share Option Plan:
Share Options Continuity
| | Weighted Average
Exercise Price | | Number | |
Balance, December 31, 2009 | | $ | 2.01 | | 4,213,733 | |
Granted | | $ | 3.65 | | 2,178,500 | |
Exercised | | $ | 1.51 | | (286,987 | ) |
Forfeited and cancelled | | $ | 2.77 | | (281,869 | ) |
Balance, December 31, 2010 | | $ | 2.69 | | 5,823,377 | |
Granted | | $ | 5.21 | | 2,544,000 | |
Exercised | | $ | 2.74 | | (139,215 | ) |
Forfeited and cancelled | | $ | 4.37 | | (242,842 | ) |
Balance, December 31, 2011 | | $ | 3.44 | | 7,985,320 | |
As of December 31, 2011, a total of 10,739,129 share options were reserved, leaving an additional 2,753,809 available for future grants.
72
Share Options Outstanding, December 31, 2011
| | Outstanding | | Weighted | | Exercisable | |
| | | | Weighted | | Average | | | |
| | At | | Average | | Remaining | | At | | | |
Exercise Price | | December, 2011 | | Exercise Price | | Contractual Life | | December 31, 20111 | | Exercise Price | |
$ 0.65 - $ 0.83 | | 311,740 | | $ | 0.70 | | 2.3 | | 197,205 | | $ | 0.70 | |
$ 0.84 - $ 1.50 | | 866,290 | | $ | 1.36 | | 2.3 | | 566,421 | | $ | 1.37 | |
$ 1.51 - $ 2.00 | | 1,725,622 | | $ | 1.88 | | 2.3 | | 1,233,412 | | $ | 1.86 | |
$ 2.01 - $ 3.94 | | 2,297,168 | | $ | 3.64 | | 3.0 | | 969,813 | | $ | 3.35 | |
$ 3.95 - $ 5.57 | | 2,784,500 | | $ | 5.20 | | 3.9 | | 407,499 | | $ | 4.91 | |
$ 0.65 - $ 5.57 | | 7,985,320 | | $ | 3.44 | | 3.1 | | 3,374,350 | | $ | 2.51 | |
Share Options Outstanding, December 31, 2010
| | Outstanding | | Weighted | | Exercisable | |
| | | | Weighted | | Average | | | |
| | At | | Average | | Remaining | | At | | | |
Exercise Price | | Dec. 31, 2010 | | Exercise Price | | Contractual Life | | Dec. 31, 2010 | | Exercise Price | |
$ 0.65 - $ 0.83 | | 339,575 | | $ | 0.69 | | 3.3 | | 104,856 | | $ | 0.69 | |
$ 1.07 - $ 1.50 | | 886,014 | | $ | 1.36 | | 3.3 | | 280,635 | | $ | 1.37 | |
$ 1.64 - $ 2.00 | | 1,735,120 | | $ | 1.88 | | 3.3 | | 660,074 | | $ | 1.85 | |
$ 2.47 - $ 3.94 | | 2,406,668 | | $ | 3.64 | | 3.9 | | 365,334 | | $ | 2.52 | |
$ 3.98 - $ 5.57 | | 456,000 | | $ | 4.88 | | 1.8 | | 396,500 | | $ | 4.96 | |
$ 0.65 - $ 5.57 | | 5,823,377 | | $ | 2.69 | | 3.5 | | 1,807,399 | | $ | 2.53 | |
b. Deferred Share Unit Plan
On May 11, 2011, the Directors of Bellatrix approved a Directors’ Deferred Share Unit Plan (“the Plan”) where the Company may grant to non-employee directors Deferred Share Units (“DSUs”), each DSU being a right to receive, on a deferred payment basis, a cash payment equivalent to the volume weighted average trading price of the Company’s common shares for the five trading days immediately preceding the redemption date of such DSU. Participants of the Plan may also elect to receive their annual remuneration in the form of DSUs. Subject to Toronto Stock Exchange and shareholder approval, Bellatrix may elect to deliver common shares from treasury in satisfaction in whole or in part of any payment to be made upon the redemption of the DSUs. The DSUs vest immediately and must be redeemed by December 1st of the calendar year immediately following the year in which the participant ceases to hold all positions with Bellatrix or earlier if the participant elects to have the DSUs redeemed at an earlier date (provided that the DSUs may not be redeemed prior to the date that the participant ceases to hold all positions with Bellatrix). On a go forward basis, it is intended that in the event of a share based award, non-employee directors would receive DSU grants instead of share option grants as has been the past practice.
During the year ended December 31, 2011, the Company granted 159,226 DSU’s which remain outstanding. For the year ended December 31, 2011, Bellatrix recorded approximately $0.8 million of share based compensation expense and a corresponding liability related to the Company’s outstanding DSU’s.
73
15. SUPPLEMENTAL CASH FLOW INFORMATION
Change in Non-cash Working Capital
($000s) | | 2011 | | 2010 | |
Changes in non-cash working capital items: | | | | | |
Accounts receivable | | $ | (5,822 | ) | $ | (18,778 | ) |
Deposits and prepaid expenses | | 993 | | 321 | |
Accounts payable and accrued liabilities | | 18,865 | | 19,447 | |
| | $ | 14,036 | | $ | 990 | |
Changes related to: | | | | | |
Operating activities | | $ | 4,524 | | $ | (2,347 | ) |
Financing activities | | 136 | | 493 | |
Investing activities | | 9,376 | | 2,844 | |
| | $ | 14,036 | | $ | 990 | |
16. INCOME TAXES
Bellatrix is a corporation as defined under the Income Tax Act (Canada) and is subject to Canadian federal and provincial taxes. Bellatrix is subject to provincial taxes in Alberta, British Columbia and Saskatchewan as the Company operates in those jurisdictions.
Deferred taxes reflect the tax effects of differences between the carrying amounts of assets and liabilities for financial reporting purposes and the amounts reported for tax purposes. As at December 31, 2011, Bellatrix has approximately $514 million in tax pools available for deduction against future income. Included in this tax basis are estimated non-capital loss carry forwards of approximately $10 million that expire in years through 2027.
The provision for income taxes differs from the expected amount calculated by applying the combined Federal and Provincial corporate income tax rate of 26.5% (2010: 28.05%) to loss before taxes. This difference results from the following items:
($000s) | | 2011 | | 2010 | |
Expected income tax expense (recovery) | | $ | (1,373 | ) | $ | (1,452 | ) |
Share based compensation expense | | 576 | | 463 | |
Change in tax rates | | (6 | ) | 560 | |
Flow through shares | | 1,537 | | — | |
Other | | 34 | | 238 | |
Deferred tax expense (recovery) | | $ | 768 | | $ | (191 | ) |
The statutory tax rate decreased to 26.5% in 2011 from 28.05% in 2010 as a result of tax legislation enacted in 2007.
74
The components of the net deferred tax asset at December 31 are as follows:
($000s) | | 2011 | | 2010 | |
Deferred income tax liabilities: | | | | | |
Equity component of 4.75% Debentures | | $ | (1,078 | ) | $ | (1,354 | ) |
Property, plant and equipment andexploration and evaluation assets | | (8,126 | ) | — | |
Deferred income tax assets: | | | | | |
Finance lease obligation | | 1,279 | | 399 | |
Property, plant and equipment andexploration and evaluation assets | | — | | 2,991 | |
Commodity contract liability | | 2,658 | | 989 | |
Decommissioning liabilities | | 11,273 | | 9,729 | |
Share issue costs | | 1,174 | | 752 | |
Non-capital losses | | 2,500 | | 79 | |
Attributed Canadian Royalty Income | | 1,209 | | 1,209 | |
Other | | 216 | | 26 | |
Deferred income tax asset | | $ | 11,105 | | $ | 14,820 | |
The Company has recognized a net deferred tax asset based on the independently evaluated reserve report as cash flows are expected to be sufficient to realize the deferred tax asset.
$1.5 million of deferred taxes related to the 4.75% Debentures has been netted against the carrying amount of the conversion feature of the 4.75% Debentures included in Shareholder’s Equity in 2010 (note 10).
A continuity of the net deferred income tax asset (liability) for 2010 and 2011 is provided below:
Movement of temporary differences during the year
($000s) | | Balance,
Jan. 1, 2010 | | Recognized in
profit or loss | | Recognized
in equity | | Flow
through
shares | | Balance,
Dec. 31, 2010 | |
Property, plant and equipment and exploration and evaluation assets | | $ | 945 | | $ | 2,046 | | $ | — | | $ | — | | $ | 2,991 | |
Decommissioning liabilities | | 10,084 | | (355 | ) | — | | — | | 9,729 | |
Commodity contract liability | | (958 | ) | 1,947 | | — | | — | | 989 | |
Share issue costs | | 59 | | 693 | | 1,039 | | — | | 752 | |
Non-capital losses | | 3,727 | | (3,648 | ) | — | | — | | 79 | |
Equity component of 4.75% debentures | | (490 | ) | (891 | ) | (1,012 | ) | — | | (1,354 | ) |
Finance lease obligation | | — | | 399 | | — | | — | | 399 | |
Attributed Canadian Royalty Income | | 1,209 | | — | | — | | — | | 1,209 | |
Other | | 26 | | — | | — | | — | | 26 | |
| | $ | 14,602 | | $ | 191 | | $ | 27 | | $ | — | | $ | 14,820 | |
75
Movement of temporary differences during the year
($000s) | | Balance,
Jan. 1, 2011 | | Recognized in
profit or loss | | Recognized
in equity | | Flow
through
shares | | Balance,
Dec. 31, 2011 | |
Property, plant and equipment and exploration and evaluation assets | | $ | 2,991 | | $ | (7,349 | ) | $ | — | | $ | (3,768 | ) | $ | (8,126 | ) |
Decommissioning liabilities | | 9,729 | | 1,544 | | — | | — | | 11,273 | |
Commodity contract liability | | 989 | | 1,669 | | — | | — | | 2,658 | |
Share issue costs | | 752 | | (399 | ) | 821 | | — | | 1,174 | |
Non-capital losses | | 79 | | 2,421 | | — | | — | | 2,500 | |
Equity component of 4.75% debentures | | (1,354 | ) | 276 | | — | | — | | (1,078 | ) |
Finance lease obligation | | 399 | | 880 | | — | | — | | 1,279 | |
Attributed Canadian Royalty Income | | 1,209 | | — | | — | | — | | 1,209 | |
Other | | 26 | | 190 | | — | | — | | 216 | |
| | $ | 14,820 | | $ | (768 | ) | $ | 821 | | $ | (3,768 | ) | $ | 11,105 | |
17. FINANCE INCOME AND EXPENSES
($000s) | | 2011 | | 2010 | |
Finance expense | | | | | |
Interest on long-term debt | | 2,952 | | 2,391 | |
Interest on convertible debentures | | 2,612 | | 3,363 | |
Accretion on convertible debentures | | 1,477 | | 1,649 | |
Accretion on decommissioning liabilities | | 879 | | 1,062 | |
Finance expense | | $ | 7,920 | | $ | 8,465 | |
| | | | | | | |
18. CONSOLIDATED STATEMENT OF COMPREHENSIVE INCOME PRESENTATION
A mixed presentation of nature and function was used for the Company`s presentation of operating expenses in the consolidated statement of comprehensive income for the current and comparative years. General and administrative expenses are presented by their function. Other expenses, including production, transportation, depletion and dispositions are presented by their nature. Such presentation is in accordance with industry practice.
Total employee compensation costs included in total production and general administrative expenses in the consolidated statements of comprehensive income are detailed in the following table:
($000s) | | 2011 | | 2010 | |
Production | | 818 | | 717 | |
General and administrative (1) | | 6,497 | | 5,006 | |
Employee compensation | | $ | 7,315 | | $ | 5,723 | |
| | | | | | | |
(1) Amount shown is net of capitalization
76
19. RELATED PARTY TRANSACTIONS
a. Finance lease agreements
During 2010 and 2011, the Company entered into agreements to obtain financing in the amount of $1.6 million and $3.7 million, respectively, for the construction of certain facilities.
Members of the Company’s management team and entities affiliated with them provided financing of $600,000 in 2011 ($300,000 in 2010). The terms of the transactions with those related parties were the same as those with arms-length participants.
b. Key Management Compensation
Key management includes senior officers and directors (executive and non-executive) of the Company. The compensation paid or payable to key management for employee services is shown below:
($000s) | | 2011 | | 2010 | |
Salaries and other short-term employee benefits | | $ | 3,960 | | $ | 2,220 | |
Long-term incentive compensation | | 59 | | 30 | |
Share-based payments (1) | | 2,506 | | 1,089 | |
| | $ | 6,525 | | $ | 3,339 | |
(1) Share-based payments include share options and deferred share units.
20. PER SHARE AMOUNTS
The calculation of basic earnings per share for the year ended December 31, 2011 was based on a loss of $5.9 million (2010 loss: $5.0 million).
| | 2011 | | 2010 | |
Basic common shares outstanding | | 107,407,241 | | 97,446,026 | |
Dilutive effect of: | | | | | |
Share options outstanding | | 7,985,320 | | 5,823,377 | |
Shares issuable for convertible debentures | | 9,821,429 | | 9,821,429 | |
Diluted common shares outstanding | | 125,213,990 | | 113,090,832 | |
Weighted average shares outstanding | | 103,857,689 | | 93,286,554 | |
Dilutive effect of share options and convertible debentures (1) | | — | | — | |
Diluted weighted average shares outstanding | | 103,857,689 | | 93,286,554 | |
(1) A total of 7,985,320 (2010: 5,823,377) share options, and 9,821,429 (2010: 9,821,429) common shares issuable pursuant to the conversion of the convertible debentures were excluded from the calculation as they were not dilutive
77
21. COMMITMENTS
The Company is committed to payments under fixed term operating leases which do not currently provide for early termination. The Company’s commitment for office space is as follows:
($000s)
Year | | Gross
Amount | | Recoveries | | Net amount | |
2012 | | $ | 2,219 | | $ | 1,062 | | $ | 1,157 | |
2013 | | 2,218 | | 1,102 | | 1,116 | |
2014 | | 1,469 | | 753 | | 716 | |
| | | | | | | | | | |
As at December 31, 2011, Bellatrix committed to drill 4 gross (3.17 net) wells pursuant to farm-in agreements. Bellatrix expects to satisfy these drilling commitments at an estimated cost of approximately $10.8 million. In addition, on February 1, 2011, Bellatrix entered into a joint venture agreement which includes a minimum commitment for the Company to drill 3 gross (3.0 net) wells per year for 2011 to 2015 for a total estimated cost of approximately $52.5 million. As at December 31, 2011, 12 wells remained to be drilled under this commitment for a total estimated cost of $42.0 million. On August 4, 2011, Bellatrix entered in a joint venture agreement which includes a minimum commitment for the Company to drill between 5 to 10 gross and net wells per year for 2011 to 2016 for a total of 40 gross and net wells at an estimated cost of approximately $140.0 million, with the first five wells requiring completion by November of 2012. In respect of the February 1, 2011 joint venture agreement, the Company also committed to drilling 1 gross (1 net) test well at an estimated cost of $7.8 million.
22. FINANCIAL RISK MANAGEMENT
a. Overview
The Company has exposure to the following risks from its use of financial instruments:
· Credit risk
· Liquidity risk
· Market risk
This note presents information about the Company’s exposure to each of the above risks, the Company’s objectives, policies and processes for measuring and managing risk, and the Company’s management of capital. Further quantitative disclosures are included throughout these financial statements.
The Board of Directors has overall responsibility for the establishment and oversight of the Company’s risk management framework. The Board has implemented and monitors compliance with risk management policies.
The Company’s risk management policies are established to identify and analyze the risks faced by the Company, to set appropriate risk limits and controls, and to monitor risks and adherence to market conditions and the Company’s activities.
78
b. Credit risk
As at December 31, 2011, accounts receivable was comprised of the following:
Aging ($000s) | | Not past due
(less than 90
days) | | Past due (90
days or more) | | Total | |
Joint venture and other trade accounts receivable | | 17,043 | | 2,770 | | 19,813 | |
Amounts due from government agencies | | 733 | | 1,106 | | 1,839 | |
Revenue and other accruals | | 21,201 | | 727 | | 21,928 | |
Cash call receivables | | — | | 65 | | 65 | |
Plant revenue allocation receivable | | — | | 2,855 | | 2,855 | |
Less: Allowance for doubtful accounts | | — | | (1,178 | ) | (1,178 | ) |
Total accounts receivable | | 38,977 | | 6,345 | | 45,322 | |
Less: | | | | | | | |
Accounts payable due to same partners | | (8,019 | ) | (7 | ) | (8,026 | ) |
Subsequent receipts to February 24, 2012 | | (26,880 | ) | (236 | ) | (27,116 | ) |
| | 4,078 | | 6,102 | | 10,180 | |
Amounts due from government agencies include GST, royalties and other adjustments. Plant revenue allocation receivable includes amounts under dispute over plant revenue allocations, net of expenses, from an operator. The Company has commenced legal action for collection of these amounts. Accounts payable due to same partners includes amounts which may be available for offset against certain receivables.
Cash calls receivables consist of advances paid to joint interest partners for capital projects.
The carrying amount of accounts receivable and derivative assets represents the maximum credit exposure.
c. Liquidity risk
Liquidity risk is the risk that the Company will not be able to meet its financial obligations as they become due. The Company’s approach to managing liquidity is to make reasonable efforts to sustain sufficient liquidity to meet its liabilities when they become due, under both normal and stressed conditions, without incurring unacceptable losses or risking harm to the Company’s reputation.
The Company prepares annual capital expenditure budgets which are regularly monitored and updated as necessary. Further, the Company utilizes authorizations for expenditures on both operated and non-operated projects to further manage capital expenditures. To facilitate the capital expenditure program, the Company has a revolving reserve-based credit facility, as outlined in note 9, which is reviewed at least annually by the lender. The Company attempts to match its payment cycle with the collection of petroleum and natural gas revenues on the 25th of each month. The Company also mitigates liquidity risk by maintaining an insurance program to minimize exposure to insurable losses.
79
The following are the contractual maturities of financial liabilities as at December 31, 2011:
Financial liability ($000s) | | < 1 Year | | 1-2 Years | | 2-5 Years | | Thereafter | |
Accounts payable and accrued liabilities (1) | | $ | 62,421 | | $ | — | | $ | — | | $ | — | |
Commodity contract liability | | 10,677 | | 2,944 | | — | | — | |
Bank debt — principal (2) | | — | | 56,701 | | — | | — | |
Convertible debentures — principal | | — | | — | | 55,000 | | — | |
Convertible debentures — interest (3) | | 2,620 | | 2,613 | | 3,471 | | — | |
Finance lease obligation | | 490 | | 513 | | 1,686 | | 2,428 | |
Total | | $ | 76,208 | | $ | 62,771 | | $ | 60,157 | | $ | 2,428 | |
(1) As at December 31, 2011, $0.4 million of accrued coupon interest payable in relation to the 4.75% Debentures and $0.2 million of accrued interest payable in relation to the credit facilities is included in Accounts Payable and Accrued Liabilities.
(2) Bank debt is based on a revolving term which is reviewed annually and converts to a 366 day non-revolving facility if not renewed.
(3) The 4.75% Debentures outstanding at December 31, 2011 bear interest at a coupon rate of 4.75%, which currently requires total annual interest payments of $2.6 million.
Interest due on the bank credit facility is calculated based upon floating rates.
d. Market risk
Market risk is the risk that changes in market prices, such as foreign exchange rates, commodity prices, and interest rates will affect the Company’s net profit or the value of financial instruments. The objective of market risk management is to manage and control market risk exposures within acceptable limits, while maximizing returns.
Foreign Currency Exchange Rate Risk
Foreign currency exchange rate risk is the risk that the fair value of future cash flows will fluctuate as a result of changes in foreign exchange rates. Although substantially all of the Company’s petroleum and natural gas sales are denominated in Canadian dollars, the underlying market prices in Canada for petroleum and natural gas are impacted by changes in the exchange rate between the Canadian and United States dollar. As at December 31, 2011, if the Canadian/US dollar exchange rate had decreased by US$0.01 with all other variables held constant, after tax net profit for the year ended December 31, 2011 would have been approximately $1.0 million lower/higher. An equal and opposite impact would have occurred to net profit had the Canadian/US dollar exchange rate increased by US$0.01.
The Company had no forward exchange rate contracts in place as at or during the year ended December 31, 2011.
Commodity Price Risk
Commodity price risk is the risk that the fair value or future cash flows will fluctuate as a result of changes in commodity prices. Commodity prices for petroleum and natural gas are impacted by not only the relationship between the Canadian and United States dollar, as outlined above, but also world economic events that dictate the levels of supply and demand.
The Company utilizes both financial derivatives and physical delivery sales contracts to manage commodity price risks. All such transactions are conducted in accordance with the commodity price risk management policy that has been approved by the Board of Directors.
The Company’s formal commodity price risk management policy permits management to use specified price risk management strategies including fixed price contracts, costless collars and the purchase of floor price options, other
80
derivative financial instruments, and physical delivery sales contracts to reduce the impact of price volatility and ensure minimum prices for a maximum of eighteen months beyond the current date. The program is designed to provide price protection on a portion of the Company’s future production in the event of adverse commodity price movement, while retaining significant exposure to upside price movements. By doing this, the Company seeks to provide a measure of stability to cash flows from operating activities, as well as, to ensure Bellatrix realizes positive economic returns from its capital developments and acquisition activities.
As at December 31, 2011, the Company has entered into commodity price risk management arrangements as follows:
Type | | Period | | Volume | | Price Floor | | Price Ceiling | | Index | |
Crude oil fixed | | January 1, 2012 to Dec. 31, 2012 | | 1,000 bbl/d | | $ | 90.00 CAD | | $ | 90.00 CDN | | WTI | |
Crude oil fixed | | January 1, 2012 to Dec. 31, 2012 | | 1,000 bbl/d | | $ | 90.49 CAD | | $ | 90.49 CDN | | WTI | |
Crude oil fixed | | January 1, 2012 to Dec. 31, 2012 | | 1,000 bbl/d | | $ | 96.40 CAD | | $ | 96.40 CDN | | WTI | |
Crude oil call option | | January 1, 2012 to Dec. 31, 2012 | | 833 bbl/d | | — | | $ | 110.00 US | | WTI | |
Crude oil call option | | January 1, 2013 to Dec. 31, 2013 | | 1,000 bbl/d | | — | | $ | 110.00 US | | WTI | |
Natural gas fixed | | April 1, 2012 to Oct. 31, 2012 | | 10,000 GJ/d | | $ | 4.10 CAD | | $ | 4.10 CDN | | AECO | |
Subsequent to December 31, 2011, the Company has entered into commodity price risk management arrangements as follows:
Type | | Period | | Volume | | Price Floor | | Price Ceiling | | Index | |
Crude oil call option | | January 1, 2013 to Dec. 31, 2013 | | 1,000 bbl/d | | — | | $ | 110.00 US | | WTI | |
Crude oil call option | | January 1, 2013 to Dec. 31, 2013 | | 1,000 bbl/d | | — | | $ | 110.00 US | | WTI | |
Natural gas fixed | | April 1, 2012 to Oct. 31, 2012 | | 10,000 GJ/d | | $ | 4.10 CAD | | $ | 4.10 CDN | | AECO | |
Natural gas fixed | | April 1, 2012 to Oct. 31, 2012 | | 10,000 GJ/d | | $ | 4.11 CAD | | $ | 4.11 CDN | | AECO | |
Interest rate risk
Interest rate risk is the risk that future cash flows will fluctuate as a result of changes in the market interest rates. The Company is exposed to interest rate fluctuations on its bank debt which bears a floating rate of interest. As at December 31, 2011, if interest rates had been 1% lower with all other variables held constant, after tax net profit for the year ended December 31, 2011 would have been approximately $0.4 million higher, due to lower interest expense. An equal and opposite impact would have occurred to net earnings had interest rates been 1% higher.
The Company had no interest rate swap or financial contracts in place as at or during the year ended December 31, 2011.
e. Capital management
The Company’s policy is to maintain a strong capital base so as to maintain investor, creditor and market confidence and to sustain the future development of the business. The Company manages its capital structure and makes adjustments to it in the light of changes in economic conditions and the risk characteristics of the underlying petroleum and natural gas assets. The Company considers its capital structure to include shareholders’ equity, bank debt, convertible debentures and working capital. In order to maintain or adjust the capital structure, the Company may from time to time issue common shares, issue convertible debentures, adjust its capital spending, and/or dispose of certain assets to manage current and projected debt levels.
The Company monitors capital based on the ratio of total net debt to annualized funds flow (the “ratio”). This ratio is calculated as total net debt, defined as outstanding bank debt, plus the liability component of convertible debentures, plus or minus working capital (excluding commodity contract assets and liabilities and deferred tax assets or liabilities), divided by funds flow from operations (cash flow from operating activities before changes in non-cash working capital and deductions for decommissioning costs) for the most recent calendar quarter,
81
annualized (multiplied by four). The total net debt to annualized funds flow ratio may increase at certain times as a result of acquisitions, fluctuations in commodity prices, timing of capital expenditures and other factors. In order to facilitate the management of this ratio, the Company prepares annual capital expenditure budgets which are reviewed and updated as necessary depending on varying factors including current and forecast prices, successful capital deployment and general industry conditions. The annual and updated budgets are approved by the Board of Directors. Bellatrix does not pay dividends.
On May 11, 2011, the Company closed an equity issuance on a bought deal basis to further the Company’s financial flexibility.
The Company’s long-term strategy is to target a total net debt to annualized funds flow ratio of less than 1.5 times. As at December 31, 2011 the Company’s ratio of total net debt to annualized funds flow based on year-end results was 1.0 times. The total net debt to annualized funds flow ratio as at December 31, 2011 decreased from that at December 31, 2010 of 1.4 times due a decrease in total net debt resulting from the timing of the Company’s 2011 capital expenditure program and higher annualized funds flow. The Company continues to take a balanced approach to the priority use of funds flows. The 4.75% Debentures have a maturity date of April 30, 2015. Upon maturity, the Company may settle the principal in cash or issuance of additional common shares.
Excluding the 4.75% Debentures, net debt to annualized funds flow based on year-end results was 0.6 times.
The Company’s capital structure and calculation of total net debt and total net debt to funds flow ratios as defined by the Company is as follows:
| | Year ended December 31, | |
($000s, except where noted) | | 2011 | | 2010 | |
| | | | | |
Shareholders’ equity | | 348,405 | | 297,692 | |
| | | | | |
Long-term debt | | 56,701 | | 41,172 | |
Convertible debentures (liability component) | | 49,076 | | 47,599 | |
Working capital (surplus) deficiency | | 13,473 | | (1,327 | ) |
Total net debt (1) at year end | | 119,250 | | 87,444 | |
| | | | | |
Debt to funds flow from operations (1) ratio annualized (3) | | | | | |
Funds flow from operations (1) (annualized) | | 120,480 | | 63,568 | |
Total net debt to periods funds flow from operations ratio annualized (3) | | 1.0x | | 1.4x | |
| | | | | |
Net debt (2) (excluding convertible debentures) at year end | | 70,174 | | 39,845 | |
Net debt to periods funds flow from operations ratio annualized (3) | | 0.6x | | 0.6x | |
| | | | | |
Debt to funds flow from operations (1) ratio | | | | | |
Funds flow from operations (1) for the year | | 94,237 | | 53,042 | |
Total net debt (2) to funds flow from operations for the year | | 1.3x | | 1.6x | |
| | | | | |
Net debt (2) (excluding convertible debentures) to funds flow from operations for the period | | 0.7x | | 0.8x | |
(1) Funds flow from operations is a term that does not have any standardized meaning under GAAP. Funds flow from operations is calculated as cash flow from operating activities, decommissioning costs incurred and changes in non-cash working capital incurred.
(2) Net debt and total net debt are considered non-GAAP terms. The Company’s calculation of total net debt includes the liability component of convertible debentures and excludes deferred liabilities, long-term commodity contract liabilities, decommissioning liabilities, long-term finance lease obligations and the deferred tax liability. Net debt and total net debt include the net working capital deficiency (excess) before short-term commodity contract assets and liabilities and current finance lease obligations. Net
82
debt also excludes the liability component of convertible debentures. Total net debt and net debt are non-GAAP measures; refer to the following reconciliation of total liabilities to total net debt and net debt.
(3) Total net debt and net debt to periods funds flow from operations ratio (annualized) is calculated based upon fourth quarter funds flow from operations annualized.
The Company’s credit facility is based on petroleum and natural gas reserves (see note 9). The credit facility outlines limitations on percentages of forecasted production, from external reserve engineer data, which may be hedged through financial commodity price risk management contracts.
f. Fair value of financial instruments
The Company’s financial instruments as at December 31, 2011 include accounts receivable, deposits, commodity contract asset, accounts payable and accrued liabilities, long-term debt and convertible debentures. The fair value of accounts receivable, deposits, accounts payable and accrued liabilities approximate their carrying amounts due to their short-terms to maturity.
The fair value of commodity contracts is determined by discounting the difference between the contracted price and published forward price curves as at the balance sheet date, using the remaining contracted petroleum and natural gas volumes. The fair value of commodity contracts as at December 31, 2011 was a net liability of $10.6 million (2010: $3.7 million). The commodity contracts are classified as level 2 within the fair value hierarchy.
Long-term bank debt bears interest at a floating market rate and the credit and market premiums therein are indicative of current rates; accordingly the fair market value approximates the carrying value.
The fair value of the convertible debentures of $59.7 million is based on exchange traded values. The convertible debentures are classified as level 1 within the fair value hierarchy.
23. TRANSITION TO INTERNATIONAL FINANCIAL REPORTING STANDARDS
On February 13, 2008 the CICA Accounting Standards Board announced that Canadian public reporting issuers will be required to report under IFRS, replacing Canadian GAAP for years beginning on or after January 1, 2011.
The adoption date of January 1, 2011 required restatement for comparative purposes, of the Company’s opening balance sheet as at January 1, 2010 and for its year ended December 31, 2010.
The Company has prepared reconciliations of equity as at January 1, 2010 and December 31, 2010 and reconciliations of Total Comprehensive Income for the year ended December 31, 2010, using the accounting policies in note 3 and the following IFRS 1 - “First-time Adoption of International Financial Reporting Standards” (“IFRS 1”) exemptions:
Key First-time Adoption Exemptions Applied and Comparative Period Adjustments
IFRS 1 is the standard that governs mandatory exceptions and optional exemptions that an entity may elect for its transition to IFRS in order to assist the entity with the transition process. This standard is only applicable to the opening balance sheet of the entity on the transition date of January 1, 2010. All adjustments made as a result of adoption of IFRS are offset against Bellatrix’s January 1, 2010 deficit.
a. Business Combinations
An exemption under IFRS 1 provides the entity with relief on the restatement of business combinations prior to the transition date. Under IFRS 3 — “Business Combinations,” the determination of the fair value of share consideration differs from the determination under Canadian accounting standards. Any difference in the fair value calculation would have a resulting impact on the carrying amount of net assets acquired, non-controlling interest and any goodwill. The Company has taken advantage of this election, allowing Bellatrix to be exempt from restating business combinations prior to the transition date to IFRS.
83
b. Property, Plant and Equipment (“PP&E”)
The adopter has the option to elect fair value at the date of transition as the deemed cost for its PP&E or to use a revalued amount according to its Previous GAAP if the revaluation, at the date of revaluation, is comparable to fair value or depreciated cost in accordance with IFRS or to measure oil and gas assets at the date of transition to IFRS at the amount previously determined under Previous GAAP.
Bellatrix has elected to value its PP&E as previously determined by Previous GAAP. The measurement upon transition to IFRS is as follows:
· exploration and evaluation assets were reclassified from the full cost pool to exploration and evaluation (“E&E”) assets at the amount that was recorded under Previous GAAP; and
· the remaining full cost pool was allocated to development and producing assets on a pro rata basis using reserve values for its proved plus probable company interest reserves.
This resulted in $20.5 million in exploration and evaluation assets and $390.1 million in property, plant and equipment as of January 1, 2010, prior to the impairment test (note 23 f).
c. Share Based Payments
Differences in the accounting for the Company’s share option plan under Previous GAAP and IFRS exist. IFRS 2 — “Share-based Payments,” requires the Company to estimate the number of options expected to vest when a grant of equity instruments do not vest immediately. IFRS 2 does not allow the recognition of the expense on a straight-line basis and requires each installment to be treated as a separate arrangement. Under Previous GAAP, the Company accounted for forfeitures as they occurred and recognized share-based compensation expense using the graded method, which is the method required under IFRS. IFRS 1 provides an elective exemption, which the Company has elected, which allows Bellatrix to apply IFRS 2 to the unvested options outstanding on transition date.
An adjustment of $0.05 million has been made on transition date to contributed surplus, with an offsetting entry to the January 1, 2010 deficit, as a result of applying this exemption.
As a result of applying IFRS 2, a reduction of share-based compensation of $0.03 million has been made to the Statement of Comprehensive Income for the year ended December 31, 2010.
Due to differences in the accounting for share-based compensation under Previous GAAP and IFRS, adjustments are required in the amount of capitalized share-based compensation. For the year ended December 31, 2010, Bellatrix capitalized $0.3 million less under IFRS when compared to Previous GAAP.
d. Decommissioning Liabilities
IAS 37 — “Provisions, Contingent Liabilities and Contingent Assets,” will govern how the Company accounts for its decommissioning liabilities (previously referred to as asset retirement obligations). The discount rate used for the decommissioning liability will be a risk free rate as the estimated provision is adjusted to reflect risks specific to the liability. Under Previous GAAP, the Company used a credit-adjusted risk free rate. Therefore, under IFRS, the decommissioning liabilities are higher due to lower discount rates used. Under Previous GAAP, a discount rate of 8% and an inflation rate of 2.4% were used, compared to a risk-free discount rate of 1.45% to 3.35% and an inflation rate of 2.4% used under IFRS to measure decommissioning liabilities as at January 1, 2010.
IFRS 1 provides an exemption that the Company has elected which allows Bellatrix to measure decommissioning liabilities as at the date of transition of January 1, 2010 to IFRS in accordance with IAS 37 and recognize directly in the Company’s deficit any difference between that amount and the carrying amount of those liabilities at the date of transition to IFRS determined under Previous GAAP.
84
As a result of applying this exemption, an increase of $13.3 million has been made to decommissioning liabilities and Bellatrix’s deficit on January 1, 2010.
As a result of re-measuring the decommissioning liabilities each reporting period, on a cumulative basis in 2010, PP&E and decommissioning liabilities decreased $0.2 million for the year ended December 31, 2010. The decrease in discount rates used under IFRS versus Previous GAAP caused a decrease of $1.1 million in accretion expense for the year ended December 31, 2010.
e. Depletion Policy
Previous GAAP provided specific guidelines on the depletion calculation for oil and natural gas properties. Depletion was calculated based on proved reserves. Under IFRS, the Company has a choice as to the reserve base to use for its depletion calculations. Bellatrix has adopted a policy of depleting its oil and natural gas properties using its proved plus probable reserve base. In addition, depletion calculations under Previous GAAP were done on a cost centre basis, for which under Previous GAAP, the Company only had one. Under IFRS, the Company is required to calculate depletion based on individual components for which the company has identified to be at the area level.
The adoption of this policy was effective January 1, 2010.
As a result of using proved plus probable reserves for its depletion calculation, depreciation and depletion expense decreased by $24.8 million the year ended December 31, 2010.
f. Impairment Test
IFRS requires an asset impairment test to be conducted on transition date and when indicators of impairment are present. Under Previous GAAP, impairment of long-lived assets is assessed on the basis of an asset’s estimated undiscounted future cash flows compared with the asset’s carrying amount and if impairment is indicated, discounted cash flows are prepared to quantify the amount of impairment. The impairment test under previous GAAP is done at the cost centre level. Under Previous GAAP, Bellatrix had one cost centre for impairment test purposes.
IFRS requires the impairment test to occur at the asset level or at the cash generating unit (“CGU”) level when long-lived assets exist that do not generate largely independent cash inflows. The carrying amount of the asset or CGU is compared to its recoverable amount which is the higher of value in use or fair value less costs to sell.
Bellatrix performed an impairment test on transition to IFRS on January 1, 2010 based on fair value less costs to sell. Fair value less costs to sell was based on merger and acquisition transactions on oil and gas properties similar to those owned by Bellatrix. The Company experienced transitional write-downs on its non-core and certain heavy oil properties with an offsetting entry to Bellatrix’s January 1, 2010 deficit.
Based on the assessment, the carrying amount of the following CGU’s were impaired, with an offsetting entry to the January 1, 2010 deficit:
($000’s) | | | | | |
Cash Generating Unit | | Product (1) | | Transitional Impairment (2) | |
South East Alberta | | 100% Natural Gas | | $ | 5,366 | |
North East Alberta | | 89% Natural Gas | | 10,895 | |
Meekwap | | 75% Oil and NGL’s | | 4,093 | |
Saskatchewan | | 100% Heavy Oil | | 23,441 | |
Total | | | | $ | 43,795 | |
(1) Based on 2009 year end proved and probable reserves.
(2) Includes impairment related to corporate assets assigned to each CGU on a pro-rata basis.
85
Due to the continued weakening of natural gas prices, Bellatrix performed impairment tests on its oil and gas properties for all of the quarterly reporting periods in 2010. The following impairments and impairment reversals were recorded in 2010:
($000’s) | | | | | |
Cash Generating Unit | | Product (1) | | Impairment (Reversal) (2) | |
Meekwap | | 75% Oil and NGL’s | | $ | 336 | |
Meekwap | | 70% Oil and NGL’s | | 1,286 | |
South East Alberta | | 100% Natural Gas | | 4,988 | |
North East Alberta | | 81% Natural Gas | | (9,848 | ) |
Total reversal | | | | $ | (3,238 | ) |
(1) Based on applicable year end proved and probable reserves.
(2) Includes impairment (reversal) related to corporate assets assigned to each CGU on a pro-rata basis.
Natural gas properties were further impaired in 2010, as well as another non-core oil property. Bellatrix experienced an impairment reversal in 2010 in its North East AB CGU as recent transactions in the CGU have increased the fair value of the properties written down on transition. In the case of an impairment reversal, the carrying amount of the asset or CGU is limited to the original carrying amount less depreciation, depletion and amortization as if no impairment had been recognized for the asset or CGU for prior periods.
g. Asset Divestitures
Under Previous GAAP, proceeds of a divestiture are deducted from the country cost centre pool without recognition of a gain or loss unless such a deduction resulted in a change to the depletion rate of 20% or greater. Under IFRS, proceeds of a divestiture are deducted from the carrying value of the asset and a gain or loss is recognized in earnings.
As a result of divestitures during 2010, including property swaps, the Company recognized a net gain on dispositions of $1.4 million for the year ended December 31, 2010.
h. Flow-through Shares
Under Previous GAAP, the accounting treatment of flow-through shares was addressed by EIC 146 — “Flow-Through Shares”. Under Previous GAAP, the proceeds received for the flow-through shares are credited to shareholders’ capital and the deferred tax liability is recognized when the Company files the renouncement documents with the tax authorities to renounce the tax credits associated with the expenditures.
Under IFRS, Bellatrix set up a liability for the difference between the proceeds received and the market price of the shares on the date of the transaction (the “premium”). As the expenditures are made, Bellatrix will record the related tax liability associated with the renouncement of the tax benefits and remove the deferred liability originally set up. The difference between the deferred tax liability and the original liability set up will go through profit or loss.
As a result of the issuance of Flow-Through Shares in 2010, the Company set up a deferred liability of $3.7 million with an offsetting adjustment to share capital. This qualifying CEE was fully spent in 2011.
i. Convertible Debentures
Convertible debentures have both a debt and equity component under IFRS and Previous GAAP. As a consequence of the Company having status as an income trust in 2009, and no IFRS 1 exemption related to the conversion feature of convertible debentures for trust units, the Company has treated the 7.5% debentures as a financial derivative instrument (the “instrument”). As a result, the fair value of the derivative instrument was determined to be nil. The offsetting entry was made to share capital as a result of the Company’s deficit elimination effective November 1, 2009. In addition, this IFRS difference has caused a $1.6 million increase to the Company’s
86
deficit as a result of the 7.5% Debenture redemption in the second quarter of 2010, as opposed to the $2.9 million reduction in the deficit under Previous GAAP.
Also, the allocation of deferred tax on the convertible debentures differs under Previous GAAP and IFRS. Under Previous GAAP, the tax basis of the liability is considered to be the same as its carrying amount; therefore, no temporary difference exists. IFRS does not contain this special exemption and requires the temporary difference to be recognized. The deferred tax adjustment is charged directly to the carrying amount of the equity component of the convertible debentures.
Bellatrix recorded a deferred tax adjustment of $0.5 million related to its 7.5% Debentures on transition to IFRS with an offsetting entry to the January 1, 2010 deficit.
Upon the issuance of its 4.75% Debentures in the second quarter of 2010, the Company recognized an adjustment of $1.5 million to the equity component of its 4.75% Debentures with an offsetting entry to the deferred tax asset.
j. Income Taxes
IFRS does not use the terminology of future income taxes; IFRS refers to deferred income taxes.
Under IFRS, all tax assets and liabilities must be classified as non-current. All of the recognized IFRS conversion adjustments as discussed in this transition note have related effects on deferred taxes. The tax impact of the above changes increased (decreased) the deferred tax asset as follows:
($000’s) | | January 1, 2010 | | For the year ended
December 31, 2010 | | As at December 31, 2010 | |
Impairment (reversal) of assets | | $ | 11,251 | | $ | (908 | ) | $ | 10,343 | |
Depletion and depreciation | | — | | (7,033 | ) | (7,033 | ) |
Convertible debentures | | (491 | ) | (864 | ) | (1,355 | ) |
Decommissioning liabilities | | 3,434 | | (308 | ) | 3,126 | |
Gain on property dispositions | | — | | 399 | | 399 | |
Increase in deferred tax asset | | $ | 14,194 | | $ | (8,714 | ) | $ | 5,480 | |
k. Presentation
Certain presentation and classification differs under IFRS in comparison with the Company’s Previous GAAP as follows:
· Interest and finance charges - the net finance income or expense is presented separately from operating expenses. These charges also include the unwinding of the discount rate on decommissioning liabilities that were presented as part of depletion, depreciation and accretion under Previous GAAP.
· Deferred income taxes - all tax assets and liabilities are classified as non-current. The amount of income taxes paid during a period must be disclosed on the face of the statements of cash flows instead of within the notes to the financial statements.
· Loans and borrowings - the cash inflow and outflow associated with loans and borrowings have been disclosed separately on the statements of cash flows. Previously, the Company netted these amounts.
· No material changes have occurred in the Consolidated Statements of Cash Flows as a result of the adoption of IFRS.
87
BELLATRIX EXPLORATION LTD.
RECONCILIATION OF EQUITY
As at January 1, 2010 (Date of Transition to IFRS)
($000s) | | Previous
GAAP | | Effect of
transition to
IFRS | | IFRS | |
ASSETS | | | | | | | |
Current assets | | | | | | | |
Accounts receivable | | $ | 20,722 | | $ | — | | $ | 20,722 | |
Deposits and prepaid expenses | | 4,940 | | — | | 4,940 | |
Commodity contract asset | | 3,374 | | — | | 3,374 | |
| | 29,036 | | — | | 29,036 | |
Exploration and evaluation assets | | — | | 20,542 | | 20,542 | |
Property, plant and equipment | | 410,566 | | | | 346,229 | |
Transfer to exploration and evaluation assets (note b) | | | | (20,542 | ) | | |
Transitional impairment to property, plant and equipment (note f) | | | | (43,795 | ) | | |
Deferred taxes | | 1,368 | | | | 14,602 | |
Re-class from current liabilities (note k) | | | | (960 | ) | | |
Due to transitional adjustments (note j) | | | | 14,194 | | | |
Total assets | | $ | 440,970 | | $ | (30,561 | ) | $ | 410,409 | |
| | | | | | | |
LIABILITIES | | | | | | | |
Current liabilities | | | | | | | |
Accounts payable and accrued liabilities | | $ | 23,345 | | $ | — | | $ | 23,345 | |
Deferred taxes (note k) | | 960 | | (960 | ) | — | |
| | 24,305 | | (960 | ) | 23,345 | |
| | | | | | | |
Long-term debt | | 27,902 | | — | | 27,902 | |
Convertible debentures | | 81,684 | | — | | 81,684 | |
Decommissioning liabilities (note d) | | 25,728 | | 13,273 | | 39,001 | |
Total liabilities | | 159,619 | | 12,313 | | 171,932 | |
| | | | | | | |
SHAREHOLDERS’ EQUITY | | | | | | | |
Shareholders’ capital (note i) | | 252,592 | | 5,037 | | 257,629 | |
Equity component of convertible debentures (note i) | | 5,037 | | (5,037 | ) | — | |
Contributed surplus (note c) | | 28,232 | | (46 | ) | 28,186 | |
Deficit | | (4,510 | ) | (42,828 | ) | (47,338 | ) |
Total shareholders’ equity | | 281,351 | | (42,874 | ) | 238,477 | |
Total liabilities and shareholders’ equity | | $ | 440,970 | | $ | (30,561 | ) | $ | 410,409 | |
88
BELLATRIX EXPLORATION LTD.
RECONCILIATION OF EQUITY
As at December 31, 2010
($000s) | | Previous
GAAP | | Effect of
transition to
IFRS | | IFRS | |
ASSETS | | | | | | | |
Current assets | | | | | | | |
Accounts receivable | | $ | 39,500 | | $ | — | | $ | 39,500 | |
Deposits and prepaid expenses | | 4,619 | | — | | 4,619 | |
Deferred taxes (note g) | | 989 | | (989 | ) | — | |
| | 45,108 | | (989 | ) | 44,119 | |
Exploration and evaluation assets | | — | | 18,535 | | 18,535 | |
Property, plant and equipment | | 433,697 | | | | 399,580 | |
Transfer to exploration and evaluation assets (note b) | | | | (18,535 | ) | | |
Transitional impairment to property, plant and equipment (note f) | | | | (43,795 | ) | | |
2010 adjustments (notes c, d, e, g) | | | | 28,213 | | | |
Deferred taxes (note g) | | 8,351 | | | | 14,820 | |
Re-class from current assets (note k) | | | | 989 | | | |
Due to transitional adjustments (note j) | | | | 14,194 | | | |
2010 adjustments | | | | (8,714 | ) | | |
Total assets | | $ | 487,156 | | $ | (10,102 | ) | 477,054 | |
| | | | | | | |
LIABILITIES | | | | | | | |
Current liabilities | | | | | | | |
Accounts payable and accrued liabilities | | $ | 42,792 | | $ | — | | $ | 42,792 | |
Current portion of capital lease obligation | | 146 | | — | | 146 | |
Commodity contract liability | | 3,732 | | — | | 3,732 | |
| | 46,670 | | — | | 46,670 | |
| | | | | | | |
Deferred liability, Flow-through Shares (note h) | | — | | 3,768 | | 3,768 | |
Long-term debt | | 41,172 | | — | | 41,172 | |
Convertible debentures | | 47,599 | | — | | 47,599 | |
Capital lease obligation | | 1,443 | | — | | 1,443 | |
Decommissioning liabilities | | 27,483 | | — | | 38,710 | |
Opening adjustment (note d) | | | | 13,273 | | | |
2010 adjustments (note d) | | | | (2,046 | ) | | |
Total liabilities | | 164,367 | | 14,995 | | 179,362 | |
| | | | | | | |
SHAREHOLDERS’ EQUITY | | | | | | | |
Shareholders’ capital | | 315,510 | | | | 316,779 | |
Opening adjustment (note i) | | | | 5,037 | | | |
Flow-through shares (note h) | | | | (3,768 | ) | | |
Equity component of convertible debentures | | 5,881 | | | | 4,378 | |
Opening adjustment (note i) | | | | (5,037 | ) | | |
2010 adjustments (note i) | | | | 3,534 | | | |
Contributed surplus (note c) | | 30,526 | | | | 30,489 | |
Opening adjustment (note c) | | | | (46 | ) | | |
2010 adjustment (note c) | | | | 9 | | | |
Deficit | | (29,128 | ) | | | (53,954 | ) |
Opening adjustment | | | | (42,828 | ) | | |
Adjustment for repurchase of 7.5% Debentures (note i) | | | | (4,546 | ) | | |
2010 adjustments to profit | | | | 22,548 | | | |
Total shareholders’ equity | | 322,789 | | (25,097 | ) | 297,692 | |
Total liabilities and shareholders’ equity | | $ | 487,156 | | $ | (10,102 | ) | $ | 477,054 | |
89
BELLATRIX EXPLORATION LTD.
RECONCILIATION OF TOTAL COMPREHENSIVE INCOME
For the year ended December 31, 2010
(Expressed in Canadian dollars)
($000s) | | Previous
GAAP | | Effect of
transition
to IFRS | | IFRS | |
| | | | | | | |
REVENUES | | | | | | | |
Petroleum and natural gas sales | | $ | 117,673 | | $ | (1,997 | ) | $ | 115,676 | |
Other income | | | | 1,997 | | 1,997 | |
Royalties | | (22,914 | ) | — | | (22,914 | ) |
Total revenues | | 94,759 | | — | | 94,759 | |
Gain on commodity contracts (note k) | | 8,282 | | — | | 8,282 | |
| | 103,041 | | — | | 103,041 | |
| | | | | | | |
EXPENSES | | | | | | | |
Production | | 37,964 | | — | | 37,964 | |
Transportation | | 3,723 | | — | | 3,723 | |
General and administrative | | 9,414 | | — | | 9,414 | |
Interest and financing charges (note k) | | 7,403 | | (7,403 | ) | — | |
Share-based compensation (note c) | | 1,618 | | 31 | | 1,649 | |
Depletion and depreciation and accretion | | 74,856 | | | | 47,901 | |
2010 depletion and depreciation adjustments (note e) | | | | (24,801 | ) | | |
Re-class of unwinding of decommissioning liabilities (note k) | | | | (2,154 | ) | | |
Provision for uncollectible accounts | | 250 | | — | | 250 | |
Loss on redemption of 7.5% Debentures | | 3,514 | | — | | 3,514 | |
Impairment loss (reversal) on property, plant and equipment (note i) | | — | | (3,238 | ) | (3,238 | ) |
Net gain on dispositions (note g) | | — | | (1,425 | ) | (1,425 | ) |
| | 138,742 | | (38,990 | ) | 99,752 | |
| | | | | | | |
NET INCOME (LOSS) BEFORE FINANCE AND TAXES | | (35,701 | ) | 38,990 | | 3,289 | |
| | | | | | | |
Finance expenses | | — | | | | 8,465 | |
Interest and financing charges (note k) | | | | 7,403 | | | |
Unwinding of decommissioning liabilities (note d,k) | | | | 1,062 | | | |
NET LOSS BEFORE TAXES | | (35,701 | ) | 30,525 | | (5,176 | ) |
| | | | | | | |
TAXES | | | | | | | |
Deferred tax expense (note j) | | (8,168 | ) | 7,977 | | (191 | ) |
NET LOSS AND COMPREHENSIVE LOSS | | (27,533 | ) | 22,548 | | (4,985 | ) |
| | | | | | | | | | |
90
ADDITIONAL INFORMATION
(unaudited)
Oil and Gas Working Interest (1) Gross Reserves
Reconciliation of Proved Reserves (2)
| | Crude oil
& NGL
(mbbl) | | Coal bed
methane
(mmcf) | | Natural
gas
(mmcf) | | Equivalent
units
(mboe) | |
December 31, 2010 | | 9,511 | | 1,632 | | 90,352 | | 24,842 | |
Revision of previous estimates | | 1,176 | | (296 | ) | 22,504 | | 4,877 | |
Discoveries, extensions, infill drilling and improved recovery | | 6,270 | | — | | 60,219 | | 16,307 | |
Acquisitions, net of dispositions | | 99 | | — | | (98 | ) | 83 | |
Production | | (1,652 | ) | (199 | ) | (15,970 | ) | (4,347 | ) |
December 31, 2011 | | 15,405 | | 1,137 | | 157,007 | | 41,761 | |
| | | | | | | | | |
Proved plus probable reserves | | | | | | | | | |
December 31, 2011 | | 25,151 | | 1,509 | | 252,196 | | 67,435 | |
December 31, 2010 | | 17,063 | | 1,991 | | 150,284 | | 42,442 | |
(1) “Working interest” refers to Bellatrix’s working interest (operated or non-operated) share before deduction of royalties and without including any royalty interests of Bellatrix. Also referred to as “gross” under National Instrument 51-101 (“NI 51-101”). May not add due to rounding.
(2) Based on forecast prices.
Finding, Development and Acquisition Costs (“FD&A”)
($/boe) | | 2011 | | 2010 | | 2009-2011
Average | |
Proved (excluding FDC) | | 8.37 | | 8.47 | | 8.23 | |
Proved (including FDC) | | 13.00 | | 15.94 | | 13.69 | |
| | | | | | | |
Proved plus probable (excluding FDC) | | 6.06 | | 4.96 | | 5.65 | |
Proved plus probable (including FDC) | | 9.29 | | 12.89 | | 10.59 | |
NI 51-101 specifies how finding and development costs (“FDC”) should be calculated if they are reported. Essentially NI 51-101 requires that the exploration and development costs incurred in the year along with the change in estimated FDC be aggregated and then divided by the applicable reserve additions. The calculation specifically excludes the effects of acquisitions and dispositions on both reserves and costs. By excluding the effects of acquisitions and dispositions Bellatrix believes that the provisions of the NI 51-101 do not fully reflect Bellatrix’s ongoing reserve replacement costs. Since acquisitions can have a significant impact on Bellatrix’s annual reserve replacement costs, excluding these amounts could result in an inaccurate portrayal of Bellatrix’s cost structure. Accordingly, Bellatrix also provides FD&A costs that incorporate all acquisitions and excludes dispositions during the year. Finding and development costs disclosed herein is based on working interest gross reserves.
The aggregate of the exploration and development costs incurred in the most recent financial year and the change during that year in estimated future development costs generally will not reflect total F&D costs related to reserve additions for that year.
Finding and development costs, excluding FDC, for proved reserves, were $8.37/boe and $8.47/boe in 2011 and 2010, respectively (proved plus probable - $6.06/boe in 2011 and $4.96/boe in 2010) and $8.23/boe on a three year average (proved plus probable $5.65/boe).
The net present value of future net revenue of reserves do not represent fair market value.
91
The Company’s updated corporate presentation is available at www.bellatrixexploration.com.
Bellatrix Exploration Ltd. is a Western Canadian based growth oriented oil and gas company engaged in the exploration for, and the acquisition, development and production of oil and natural gas reserves in the provinces of Alberta, British Columbia and Saskatchewan. Common shares and convertible debentures of Bellatrix trade on the Toronto Stock Exchange (“TSX”) under the symbols BXE and BXE.DB.A, respectively. For further information, please contact:
Raymond G. Smith, P.Eng., President and CEO (403) 750-2420
or
Edward J. Brown, CA, Vice President, Finance and CFO (403) 750-2655
or
Troy Winsor, Investor Relations (800) 663-8072
Bellatrix Exploration Ltd.
2300, 530 — 8th Avenue SW
Calgary, Alberta, Canada T2P 3S8
Phone: (403) 266-8670
Fax: (403) 264-8163
www.bellatrixexploration.com
92