Exhibit 4

MANAGEMENT’S DISCUSSION AND ANALYSIS
For the year ended June 30, 2008
TABLE OF CONTENTS
INTRODUCTION | 4 |
| |
CAUTIONARY STATEMENT REGARDING FORWARD-LOOKING INFORMATION | 4 |
NON-GAAP MEASURES | 4 |
EBITA RECONCILIATION | 5 |
| |
BUSINESS PROFILE AND STRATEGY | 6 |
| |
CONTINUING OPERATIONS | 7 |
DISCONTINUED OPERATIONS | 8 |
CONSUMER PROTECTION REGULATIONS | 8 |
CLASS ACTION LAWSUIT | 8 |
| |
OVERALL FINANCIAL PERFORMANCE | 10 |
| |
2008 HIGHLIGHTS AND OUTLOOK | 10 |
BRANCH COUNT | 11 |
REVENUE AND SAME BRANCH SALES | 12 |
REVENUE | 12 |
SAME BRANCH SALES | 13 |
EXPENSES (EXCLUDING RETENTION PAYMENTS) | 13 |
RETENTION PAYMENTS | 13 |
AMORTIZATION | 14 |
INCOME TAXES | 14 |
INCOME FROM CONTINUING OPERATIONS | 14 |
DISCONTINUED OPERATIONS | 14 |
| |
LIQUIDITY AND CAPITAL RESOURCES | 14 |
| |
NORMAL COURSE ISSUER BID | 15 |
CONTRACTUAL OBLIGATIONS | 15 |
| |
SUMMARY OF QUARTERLY RESULTS | 15 |
| |
RELATED PARTY TRANSACTIONS | 17 |
| |
CONTRACTUAL BUSINESS ARRANGEMENTS | 18 |
| |
LEGAL PROCEEDINGS AND OTHER CONTINGENCIES | 18 |
| |
LEGAL PROCEEDINGS | 18 |
OTHER CONTINGENCIES | 18 |
| |
REGULATORY ENVIRONMENT | 19 |
| |
CRITICAL ACCOUNTING ESTIMATES | 19 |
| |
REVENUE RECOGNITION | 20 |
RETENTION PAYMENTS | 20 |
AMORTIZATION POLICIES AND USEFUL LIVES | 21 |
GOODWILL | 21 |
CONTINGENCIES | 21 |
INCOME TAX ESTIMATES AND FUTURE INCOME TAXES | 21 |
| |
CHANGES IN ACCOUNTING POLICIES AND PRACTICES | 22 |
| |
FINANCIAL INSTRUMENTS | 22 |
COMPREHENSIVE INCOME | 23 |
2
HEDGES | 23 |
EQUITY | 23 |
ACCOUNTING CHANGES | 23 |
| |
RECENT ACCOUNTING PRONOUNCEMENTS NOT YET ADOPTED | 23 |
| |
FINANCIAL INSTRUMENTS | 23 |
FINANCIAL INSTRUMENTS PRESENTATION | 24 |
CAPITAL DISCLOSURES | 24 |
GOING CONCERN | 25 |
GOODWILL AND INTANGIBLE ASSETS | 25 |
| |
CONTROLS AND PROCEDURES | 25 |
| |
DISCLOSURE CONTROLS AND PROCEDURES | 25 |
INTERNAL CONTROLS OVER FINANCIAL REPORTING | 25 |
LIMITATIONS ON THE EFFECTIVENESS OF DISCLOSURE CONTROLS AND THE DESIGN OF ICFR | 26 |
| |
DIVIDENDS | 26 |
| |
OUTSTANDING SHARE DATA | 26 |
3
INTRODUCTION
The following management discussion and analysis (“MD&A”) should be read in conjunction with The Cash Store Financial Services Inc.’s (“Cash Store Financial” or the “Company”) fiscal 2008 audited consolidated financial statements and the Company’s Annual Information Form (“AIF”) for fiscal 2008 which are available on SEDAR (“System for Electronic Document Analysis and Retreival”) at www.sedar.com. Additional information relating to the Company, including the AIF, is available on SEDAR at www.sedar.com.
This management’s discussion and analysis is dated as of August 19, 2008.
Cautionary Statement Regarding Forward-looking Information
This MD&A contains “forward-looking information” within the meaning of applicable Canadian and United States securities legislation. Forward-looking information includes, but is not limited to, information with respect to our objectives, strategies, operations and financial results, competition as well initiatives to grow revenue or reduce retention payments. Generally, forward-looking information can be identified by the use of forward-looking terminology such as “plans”, “expects”, or “does not expect”, “is expected”, “budget”, “scheduled”, “estimates”, “forecasts”, “intends”, “anticipates”, or “does not anticipate”, or “believes” or variations of such words and phrases or state that certain actions, events or results “may”, “could”, “would”, “might”, or “will be taken”, “occur”, or “be achieved”. Forward-looking information are subject to known and unknown risks, uncertainties and other factors that may cause the actual results, level of activity, performance or achievements of the Company, to be materially different from those expressed or implied by such forward-looking information, including, but not limited to, changes in economic and political conditions, legislative or regulatory developments, technological developments, third-party arrangements, competition, litigation, risks associated with but not limited to, market conditions, the availability of alternative transactions, shareholder, legal, regulatory and court approvals, favourable Canada Revenue Agency ruling and third party consents and other factors described in the Company’s latest Annual Information Form filed on SEDAR at www.sedar.com (see above) under the heading “Risk Factors”. Although the Company has attempted to identify important factors that could cause actual results to differ materially from those contained in forward-looking information, there may be other factors that cause results not to be as anticipated, estimated or intended. There can be no assurance that such information will prove to be accurate, as actual results and future events could differ materially from those anticipated in such information. Accordingly, readers should not place undue reliance on forward-looking information. The Company does not undertake to update any forward-looking information, except in accordance with applicable securities laws.
Non-GAAP Measures
This MD&A refers to certain financial measures that are not determined in accordance with generally accepted accounting principles (“GAAP”) in Canada. These measures do not have standardized meanings and may not be comparable to similar measures presented by other companies. Although a measure such as ‘Earnings Before Interest, Income Taxes, Extraordinary Items, Stock-based Compensation, Amortization of Capital and Intangible Assets’ (“EBITA”) do not have standardized meanings prescribed by GAAP, these measures are used herein or can be determined by reference to the Company’s financial statements. “Same branch sales” is a non-
4
GAAP measure tracked and reported by the Company and is generally used to compare the average revenue for a particular group of branches in a current period to that same particular group of branches in a prior period. This non-GAAP measure is a way to gauge the performance of a particular group of branches and is directly related to and helps explain changes in total revenue. Average revenue is defined as revenue for the period divided by the number branches. “Branch operating income” (“BOI”) is a non-GAAP measure tracked and reported by the Company and is generally used to compare the performance at branch level and includes expenses which primarily relate to the operations of the branch network. “Regional expenses” is a non-GAAP measure which is used to gauge expenditures at the regional and divisional level and includes compensation of associates including centralized regional departments, Regional Managers, Divisional Vice Presidents and Divisional President, as well as other expenses related to the functions of these groups. “Corporate expenses” is a non-GAAP measure which is used to gauge expenditures at the corporate level and includes compensation of associates and related expenses at the corporate office level. These measures are discussed because management believes that they facilitate the understanding of the Company’s results of its operational and financial position.
The following table provides a reconciliation of net income in accordance with GAAP to EBITA for the past eight quarters.
EBITA Reconciliation
| | 2008 | | 2007 | |
(thousands of dollars) | | Q4 | | Q3 | | Q2 | | Q1 | | YTD | | Q4 | | Q3 | | Q2 | | Q1 | | YTD | |
| | | | | | | | | | | | | | | | | | | | | |
Consolidated Results | | | | | | | | | | | | | | | | | | | | | |
Total operations | | | | | | | | | | | | | | | | | | | | | |
Income from continuing operations | | 3,190 | | 2,706 | | 3,207 | | 3,418 | | 12,522 | | 2,013 | | 1,374 | | 2,250 | | 3,033 | | 8,670 | |
Interest | | 3 | | 1 | | 3 | | 2 | | 9 | | 4 | | 9 | | 5 | | 8 | | 26 | |
Income tax | | 2,734 | | 1,323 | | 1,958 | | 1,855 | | 7,870 | | 1,007 | | 567 | | 1,323 | | 1,863 | | 4,760 | |
Stock-based compensation | | 331 | | 106 | | 96 | | 92 | | 625 | | 241 | | 282 | | 316 | | 321 | | 1,160 | |
Amortization of capital and intangible assets | | 1,356 | | 1,297 | | 1,375 | | 1,218 | | 5,246 | | 1,164 | | 1,104 | | 1,084 | | 1,052 | | 4,404 | |
EBITA from continuing operations | | 7,614 | | 5,433 | | 6,639 | | 6,585 | | 26,271 | | 4,429 | | 3,336 | | 4,978 | | 6,277 | | 19,020 | |
EBITA from discontinued operations | | — | | (560 | ) | (396 | ) | (402 | ) | (1,358 | ) | (202 | ) | (579 | ) | (1,025 | ) | (731 | ) | (2,537 | ) |
5
BUSINESS PROFILE AND STRATEGY
The Company operates under two branch banners: The Cash Store and Instaloans. The Cash Store and Instaloans act as brokers to facilitate payday advance services to income earning consumers seeking short term advances with third party lenders without having to provide a credit history or security on the loan, as is generally required by commercial lending institutions. At June 30, 2008, the Company owned and operated 384 branches in nine provinces and two territories and employed over 1,500 associates within Canada. Cash Store Financial, formerly Rentcash Inc., is listed on the Toronto Stock Exchange under the symbol “CSF” (formerly “RCS”).
The Company’s business is based on the recognition that the needs of a segment of the population are not being met by traditional financial institutions. The goal is to establish The Cash Store and Instaloans as neighbourhood financial supermarkets providing a wide range of services, a high level of customer service and convenient hours of operation.
Building strong fundamentals to support long-term business growth and generate sustainable returns for our shareholders is a cornerstone of our overall corporate strategy. The Company has no debt financing, strong working capital, and a mostly liquid cash position held in current accounts with major Canadian banks. Management believes that maintaining a strong cash position will enable the Company to respond to growth opportunities as they arise.
To further strengthen the Company’s forward potential, the Company’s shareholders approved a plan on November 28, 2007 to spin-off the Company’s rental operations and certain of its assets and liabilities to Insta-Rent Inc. (“Insta-rent”), whose common shares were, upon the completion of this transaction, owned by the shareholders of the Company. Insta-Rent Inc. is now publicly traded on the TSX Venture stock exchange under the symbol “IRR”.
This spin-off transaction was completed on March 31, 2008 and, accordingly, the Company ceased to consolidate those assets and liabilities of the rental division transferred to Insta-Rent Inc. and have presented the results of its operations and its cash flows for the years ended June 30, 2008 and 2007 as discontinued operations. The spin-off transaction enables the Company to focus on its core competencies, being the brokering of small-sum short term consumer loans and related alternative financial services products. The Company will also be able to utilize approximately $4.7 million of future tax assets against taxes payable over the next year of operations as a result of the spin-off. The future assets are a result of non-capital loss carry-forwards being utilized.
Due to its strong cash position, the Company has, over the past year, repurchased 1,353,110 common shares pursuant to a normal course issuer bid at an average share price of $4.42 and at a total cost of $6.0 million. Further share repurchase initiatives are currently underway. Also, during 2008, the Company paid dividends of $3.6 million.
The Company’s Financial Statements and Management’s Discussion and Analysis for the year ended June 30, 2008 have been presented in a new format. This new format more closely reflects the disclosures of the Company’s North American competitors and the reporting used by management to track the Company’s performance.
6
Continuing Operations
The Company’s strategic approach has been to grow rapidly and secure a dominant market footprint, then build revenues, followed by infrastructure enhancements and product diversification. Since the Company’s inception in April 2001, the branch count has grown to a total of 384 locations as at June 30, 2008. Branch count has been increasing at a measured pace, depending on overall performance and market opportunities. As a result of new provincial regulations in several jurisdictions that are anticipated over the next 24-36 months, positive shifts in the competitive landscape are also expected. Resulting growth opportunities will be embraced. These are expected to be funded through current operations and cash on hand.
As a result of recent management initiatives, the Company has experienced positive trending in several fundamental areas over the past five quarters. Positive trending includes a steady improvement in overall branch operating performance.
Since December 2006, management’s attention has been on driving growth and improving the Company’s overall financial performance. In the first quarter of 2008, the Company rolled out its “Freedom Card”, a pre-paid credit card with monthly maintenance fees which is proving to be a sustainable and growing revenue stream. As well, a customer loyalty program is currently being tested in some markets. Term loan and line of credit products are currently being tested in several markets.
Regularly, the Chief Executive Officer and the Chief Operating Officer go on a country-wide tour, meeting with all branch managers to review strategic priorities of the Company. During these sessions, emphasis was placed on verifying that all associates are committed to the effective pursuit of established goals and objectives.
Over the past year, a strong emphasis has been placed on the reduction of non-profitable branches. The Company continues to work diligently to ensure that all of its branches are adding to the profitability of the Company. Branch operating income, by maturity level, is outlined below:
| | Number of | | BOI (Loss) | | BOI % of Revenues | |
Year Opened | | Branches | | F2008 | | F2007 | | F2008 | | F2007 | |
2001 * | | 98 | | 13,742,974 | | 13,174,263 | | 34.2 | % | 31.3 | % |
2002 | | 15 | | 2,656,495 | | 2,043,838 | | 36.7 | % | 29.0 | % |
2003 | | 36 | | 5,026,843 | | 4,194,833 | | 33.5 | % | 27.8 | % |
2004 | | 52 | | 6,413,855 | | 5,193,139 | | 33.7 | % | 28.6 | % |
2005 | | 69 | | 5,796,168 | | 3,598,803 | | 25.4 | % | 17.0 | % |
2006 | | 55 | | 2,379,599 | | 305,659 | | 15.6 | % | 2.5 | % |
2007 | | 27 | | (28,487 | ) | (574,754 | ) | -0.5 | % | -30.1 | % |
2008 | | 32 | | (559,519 | ) | (105,292 | ) | -20.1 | % | | |
Subtotal | | 384 | | 35,427,928 | | 27,830,489 | | | | | |
Branches not yet open | | | | (6,234 | ) | — | | | | | |
Closed branches | | | | (381,636 | ) | (601,856 | ) | | | | |
Other | | | | 4,795,095 | | 7,731,113 | | | | | |
Continuing Operations | | | | $ | 39,835,153 | | $ | 34,959,746 | | | | | |
| | | | | | | | | | | | | |
* Instaloan branches were acquired by Cash Store Financial on April 22, 2005, they have been operating since 2001
7
Discontinued Operations
On November 28, 2007, the Company’s shareholders approved a plan to spin-off the Company’s rental operations and certain of its assets and liabilities to Insta-Rent Inc., whose common shares were, upon the completion of this transaction, owned by the shareholders of the Company. Insta-Rent Inc. is publicly traded on the TSX Venture stock exchange under the symbol “IRR”.
This spin-off transaction was completed on March 31, 2008 and, accordingly, the Company ceased to consolidate those assets and liabilities of the rental division transferred to Insta-Rent Inc. and have presented the results of its operations and its cash flows for the year ended June 30, 2008 and 2007 as discontinued operations.
The net loss from discontinued operations during the year was $1.7 million, which includes $678,000 of spin-off costs related to the transaction, compared to a net loss of $2.8 million during fiscal 2007. The decrease in the net loss was due to improved branch operating income compared to the prior year.
Consumer Protection Regulations
In May 2007, Bill C-26, An Act to Amend the Criminal Code (criminal interest rate), received Royal Assent. Consistent with the provisions of Bill 26, several provinces are expected to establish limits on the total cost of borrowing. On July 31, 2008 the Nova Scotia Utility and Review Board issued an Order setting the maximum cost of borrowing for a payday loan. The Board adopted a market approach, setting the maximum at $31 per $100 lent, effectively allowing most if not all operators currently in the market to remain in business. This rate cap is expected to be approved and implemented by the Government of Nova Scotia within the second quarter of fiscal 2009. The Public Utility Board in Manitoba recently issued an Order to establish maximum amounts that can be charged in respect of a payday loan. This cap was set at $17 per $100 lent. In its Order, the Manitoba PUB stated its intention through a low cap was to force all but the most efficient operators from the market. Although Cash Store Financial fully intends to maintain its presence in Manitoba and to operate profitably in doing so, the Company has sought a leave to appeal this Order before the Manitoba Court of Appeal on the grounds that the rate cap is unduly punitive to the Company’s operations, and in attempting to “shape” the market in Manitoba the utilities board exceeded its legislated mandate. The Provinces of British Columbia, Saskatchewan, Ontario and New Brunswick have passed legislation that allows for the setting of maximum rates, although these rates have not yet been set. At this stage, other than Nova Scotia, it remains difficult for the Company to specify limits that each province will set, due to incomplete public consultation processes that are either underway or have yet to begin. A ban on rollovers is expected in those jurisdictions that are presently developing rate regimes.
Cash Store Financial has been, and continues to be, a long-standing advocate of improved consumer protection measures for the payday loan industry. The Company’s long-term strategy has been predicated on the belief that regulatory certainty will have a positive impact on operations. The Company has aggressively built its network of retail branches on this basis.
Class Action Lawsuit
On April 21, 2008, the Company reached a conditional settlement in respect of a class action law suit initiated in the province of Ontario. The settlement is conditional upon the lawsuit being certified by the Court as a class proceeding under the Class Proceedings Act and as part of that
8
process, the terms of settlement are being approved by the Court. The settlement does not constitute any admission of liability by the Company. As at June 30, 2008 the settlement had not been approved by the Court. A decision is expected to be received during the first quarter of fiscal 2009.
Under the terms of the conditional settlement in principle, the Company is to pay to the Class an aggregate of $1.5 million in cash and $1.5 million in credit vouchers to those customers of The Cash Store and Instaloans, outside of Alberta and British Columbia, who were advanced funds under a loan agreement and who repaid the payday loan plus the brokerage fees and interest in full (“the Class”). The credit vouchers may be used to pay existing outstanding brokerage fees and interest or to pay brokerage fees and interest which may arise in the future through new loans advanced to the customer. The credit vouchers are fully transferable and have no expiry date. In addition, the Company is to pay the legal fees and costs of the Class, in an amount to be approved by the Court. The Company believes a settlement at this time is prudent and will lead to reduced legal costs and expenditures of management resources.
Due to the uncertainty surrounding the court process, the Company is not able, at this time, to determine the likelihood of the settlement and therefore has not accrued any amounts.
9
OVERALL FINANCIAL PERFORMANCE
| | Three Months Ended June 30 | | Year Ended June 30 | |
Thousands of dollars, except for per share amounts and branch figures | | 2008 | | 2007 | | 2008 | | 2007 | |
Consoldiated results | | | | | | | | | |
No of branches | | 384 | | 358 | | 384 | | 358 | |
Revenue | | | | | | | | | |
Brokerage | | $ | 34,490 | | $ | 31,451 | | $ | 130,567 | | $ | 123,498 | |
Corporate | | 52 | | 15 | | 232 | | 64 | |
| | 34,542 | | 31,467 | | 130,799 | | 123,562 | |
Branch Expenses | | 18,635 | | 16,903 | | 70,853 | | 65,184 | |
Retention payments | | 4,229 | | 5,501 | | 20,111 | | 23,418 | |
Branch operating income | | 11,678 | | 9,063 | | 39,835 | | 34,960 | |
| | | | | | | | | |
Regional expenses | | 1,985 | | 1,819 | | 7,440 | | 5,969 | |
Corporate expenses | | 3,523 | | 4,001 | | 11,181 | | 14,754 | |
Other amortization | | 244 | | 222 | | 821 | | 807 | |
Income from continuing operations before income taxes | | 5,925 | | 3,021 | | 20,392 | | 13,430 | |
Income from continuing operations | | 3,210 | | 2,013 | | 12,522 | | 8,670 | |
Loss from discontinued operations | | — | | (422 | ) | (1,716 | ) | (2,788 | ) |
EBITA* | | 7,613 | | 4,429 | | 26,271 | | 19,020 | |
Net income | | 3,210 | | 1,591 | | 10,806 | | 5,882 | |
Weighted average number of shares outstanding - basic | | 19,652 | | 20,699 | | 20,124 | | 20,596 | |
- diluted | | 19,733 | | 20,805 | | 20,242 | | 20,707 | |
Basic earings per share | | | | | | | | | |
Income from continuing operations | | $ | 0.16 | | $ | 0.09 | | $ | 0.62 | | $ | 0.42 | |
Loss from discontinued operations | | $ | — | | $ | (0.02 | ) | $ | (0.08 | ) | $ | (0.13 | ) |
Net income | | $ | 0.16 | | $ | 0.07 | | $ | 0.54 | | $ | 0.29 | |
Diluted earnings per share | | | | | | | | | |
Income from continuing operations | | $ | 0.16 | | $ | 0.09 | | $ | 0.62 | | $ | 0.42 | |
Loss from discontinued operations | | $ | — | | $ | (0.02 | ) | $ | (0.09 | ) | $ | (0.14 | ) |
Net income | | $ | 0.16 | | $ | 0.07 | | $ | 0.53 | | $ | 0.28 | |
Consolidated Balance Sheet Information | | | | | | | | | |
Working capital | | $ | 16,740 | | $ | 9,408 | | $ | 16,740 | | $ | 9,408 | |
Total assets | | 81,252 | | 91,932 | | 81,252 | | 91,932 | |
Total long-term liabilities | | 1,800 | | 1,857 | | 1,800 | | 1,857 | |
Total liabilities | | 10,049 | | 14,287 | | 10,049 | | 14,287 | |
Shareholders' equity | | $ | 71,202 | | $ | 77,645 | | $ | 71,202 | | $ | 77,645 | |
* EBITA - earnings from continuing operations before interest, income taxes, stock-based compensation, amortization of capital and intangible assets
2008 Highlights and Outlook
Income from continuing operations for the year ended June 30, 2008 was $12.5 million, compared to $8.7 million in the prior year. The higher earnings resulted in diluted earnings per share from continuing operations increasing to $0.62 ($0.62 basic), compared to $0.42 ($0.42 basic), for the year ended June 30, 2007.
The Company’s EBITA (income from continuing operations before interest, income taxes, stock-based compensation, and amortization of capital and intangible assets) for the year ended June 30, 2008 was $26.3 million, compared to $19.0 million for the year ended June 30, 2007. This improvement is due to increased revenues partially offset by higher expenses primarily due to opening 26 new branches, and the Company has, starting January 2007, increased its infrastructure substantially, including the addition of a centralized cheque cashing department and collections department, and increased capacity in both the internal audit and training departments.
The higher fiscal 2008 earnings reflect the following:
10
· Increased branch-level operating results due to improved revenues, growing same branch sales, and decreased retention payments;
· Targeted expenditures on infrastructure enhancements to increase revenue generation, including: a new cheque cashing department, a new centralized collections department, increased capacity in the internal audit and training departments; and, increased capacity for regional and divisional management; and,
· Decreased expenditures on stock-based compensation.
Branch revenues for the year improved by 6%, while same branch sales increased 5% compared to the same period last year.
Product and revenue diversification initiatives continue to generate positive results. Fees from other services (including fees from cheque cashing, money transfer, payment protection, debit cards, pre-paid credit cards, collections and telephone re-connect services) increased to $21.7 million for the year ended June 30, 2008, compared to $19.8 million for the year ended June 30, 2007. A customer loyalty program, term loan, and line of credit products are currently being tested in several markets.
The Company is well-positioned to fund future growth initiatives and working capital requirements with a cash position of $15.6 million and a positive working capital of $16.7 million as at June 30, 2008. For the year ended June 30, 2008, working capital has increased by $7.3 million from $9.4 million at June 30, 2007.
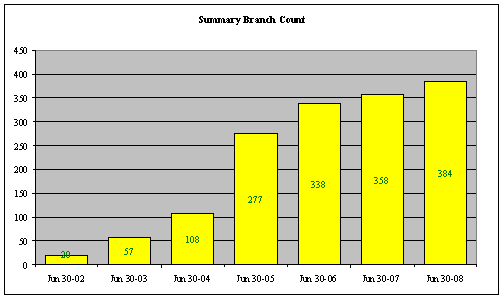
Branch Count
As at June 30, 2008, the Company had a total of 384 branches in operation, compared to 358 a year ago. Thirty seven new branches were opened during the year, while eleven branches were closed and their customer accounts transferred to nearby branches. Branch performance continues to be monitored and consolidations will occur when efficiencies can be achieved.
11
Revenue and Same Branch Sales
Revenues have improved relative to the year ended June 30, 2007. Revenue for the year ended June 30, 2008 totaled $130.8 million, an increase of $7.2 million (6%) compared to $123.6 million in the prior year. Branch operating income improved to $39.8 million from $35.0 million for the same period last year.
Same branch sales improved for the 338 branches open since the beginning of fiscal 2007 averaged $375,700 in fiscal 2008, a 7% increase compared to the $352,300 in the prior year. The increase reflects the impact of several strategic initiatives further executed upon by management. Increased revenues more than offset increased expenses. As revenue rises, expenses are expected to remain relatively constant.
Product and revenue diversification initiatives continue to generate positive results. Fees from other services (including fees from cheque cashing, money transfer, payment protection, debit cards, pre-paid credit cards, collections and telephone re-connect services) increased to $5.9 million for the quarter, compared to $5.1 million in the same period last year and $21.7 million for the year ended June 30, 2008, compared to $19.8 million for fiscal 2007, an increase of 9%. A Customer Loyalty Program, a term loan product, and a line of credit product are being tested in several markets.
Revenue
Brokerage revenues continued to improve relative to the year ended June 30, 2007. Revenue for the year ended June 30, 2008 totaled $130.6 million, an increase of $7.1 million (6%) compared to $123.5 million in the prior year.
| | Number of | | Revenues | | Average Revenue/Branch/Month | |
Year Opened | | Branches | | F2008 | | F2007 | | %Change | | F2008 | | F2007 | |
2001* | | 98 | | 40,197,880 | | 42,145,880 | | -5 | % | 34,182 | | 35,838 | |
2002 | | 15 | | 7,241,908 | | 7,039,407 | | 3 | % | 40,233 | | 39,108 | |
2003 | | 36 | | 15,021,149 | | 15,086,555 | | 0 | % | 34,771 | | 34,923 | |
2004 | | 52 | | 19,026,328 | | 18,158,604 | | 5 | % | 30,491 | | 29,100 | |
2005 | | 69 | | 22,781,632 | | 21,205,190 | | 7 | % | 27,514 | | 25,610 | |
2006 | | 55 | | 15,231,364 | | 11,993,489 | | 27 | % | 23,078 | | 18,172 | |
2007 | | 27 | | 5,496,997 | | 1,909,415 | | 188 | % | 16,966 | | 5,893 | |
2008 | | 32 | | 2,783,877 | | — | | | | 7,250 | | — | |
Subtotal | | 384 | | 127,781,135 | | 117,538,540 | | 9 | % | 110,921 | | 102,030 | |
Closed Branches | | | | 203,475 | | 1,182,562 | | | | | | | |
Other | | | | 2,582,319 | | 4,777,075 | | | | | | | |
Continuing Operations | | | | $ | 130,566,929 | | $ | 123,498,177 | | | | | | | |
| | | | | | | | | | | | | | | |
* Instaloan branches were acquired by Cash Store Financial on April 22, 2005, they have been operating since 2001
Broker fees for the fourth quarter of fiscal 2008 increased 9% to $28.6 million from $26.3 million for fiscal 2007. Broker fees for fiscal 2008 increased 5% to $108.9 million from $103.7 million in the prior year as a result of an increase in loans brokered.
12
| | Three months ended | | Year ended | |
| | Jun 2008 | | Jun 2007 | | Jun 2008 | | Jun 2007 | |
REVENUES | | | | | | | | | |
Brokerage fees | | $ | 28,616,969 | | $ | 26,335,603 | | $ | 108,882,050 | | $ | 103,672,007 | |
Other | | 5,873,072 | | 5,115,806 | | 21,684,879 | | 19,826,170 | |
Total Brokerage | | 34,490,041 | | 31,451,409 | | 130,566,929 | | 123,498,177 | |
Corporate | | 51,768 | | 15,487 | | 232,453 | | 63,828 | |
Total | | $ | 34,541,810 | | $ | 31,466,896 | | $ | 130,799,382 | | $ | 123,562,005 | |
Loans brokered for the year ended June 30, 2008, totalled $522 million with an average loan size of $360 (excluding the Company’s broker fee), compared to $499 million and an average loan size of $345 in the same period last year.
Same Branch Sales
“Same branch sales” is a non-GAAP measure tracked and reported by the Company and is generally used to compare average revenue for a particular group of branches in a current period to that same group of branches in a prior period.
Same branch sales improved for the 338 branches open since the beginning of fiscal 2007, averaging $375,700 in fiscal 2008, a 7% increase when compared to an average $352,300 in the prior year. The increase reflects the impact of several strategic initiatives further executed upon by management. Increased revenues more than offset increased expenses. As revenue rises, expenses are expected to remain relatively constant. Management believes the increase in same branch sales reflects the impact of training and development activities and Management’s continued emphasis on revenue growth.
Improving same branch sales is an important objective as the cost structure for the existing branch base is relatively fixed.
Expenses (excluding retention payments)
Expenses for the year ended June 30, 2008 totalled $85.0 million, compared to $82.3 million for the year ended June 30, 2007. The increase is primarily due to the number of new branches increasing by 26. Starting in January 2007, the Company increased its infrastructure substantially, including the addition of a centralized cheque cashing department and collections department and increased capacity in both the internal audit and training departments. It is anticipated that corporate expenses will increase in the future due to the Company’s participation in regulatory proceedings being held in some of the provinces.
Retention Payments
Third-party lender retention payments for the year ended June 30, 2008 totalled $20.1 million (3.9% of loans brokered), compared to $23.4 million (4.7% of loans brokered) in the same period last year. There were lower payments despite the fact that total loans brokered increased to $522 million this year from $499 million in the same period last year. As a percentage of revenue, retention payments have decreased to 15.4% in the year ended June 30, 2008, compared to 19.0% in the year ended June 30, 2007.
13
Management believes that the focus on improving processes and controls, as well as the establishment of an internal collection department, has resulted in the decrease in retention payments.
Amortization
Amortization of capital and intangible assets for the year ended June 30, 2008 totalled $5.2 million, compared to $4.4 million for the year ended June 30, 2007. The increase reflects the increased number of branches.
Income Taxes
The Company’s effective tax rate was 38.6% for the year ended June 30, 2008, compared to 35.4% in the prior year. The year-over-year increase was due to a reduction of future tax assets as part of the rental division spin-off of approximately $290,000 and a reduction in the overall effective tax rates into the future, thereby reducing the overall future income tax asset when temporary differences will be recognized.
The effective rate was also higher than the calculated consolidated statutory rate of approximately 30.6% (2007 — 34.5%) due to the reduction and the impact of non-deductible stock-based compensation which totalled $625,000 in fiscal 2008 (2007 — $1.2 million).
The future tax asset write-down relates to the reduction of tax rates in future periods and the time frame when the Company will utilize tax assets generated from the spin-out of the rental division into a separate publicly traded company.
Income from Continuing Operations
Income from continuing operations for the year ended June 30, 2008 was $12.5 million, compared to $8.7 million for the period last year. The increase in income from continuing operations was due primarily to increased revenues and lower retention payments offset by increased expenses associated with increases in infrastructure and controls.
Discontinued Operations
The net loss from the rental division during the year ended June 30, 2008 was $1.7 million (which includes $678,000 of spin-off costs related to the transaction) compared to a net loss of $2.8 million in the same period last year.
LIQUIDITY AND CAPITAL RESOURCES
The Company’s cash decreased to $15.6 million as at June 30, 2008, compared to $18.2 million at June 30, 2007. The Company’s cash includes $3.0 million of restricted cash with Direct Cash, which is subject to cancellation without notice. Significant items impacting cash and cash equivalents during fiscal 2008 were:
· payment of dividends to shareholders of $3.6 million;
· repurchase of shares in the amount of $6.0 million;
· cash generated from operating activities, before non-cash operating items, of $18.3 million;
14
· capital asset expenditures of $5.8 million;
· cash used by discontinued operations of $1.3 million.
As at June 30, 2008, the Company’s working capital position totalled a positive $16.7 million, which is a $7.3 million improvement compared to June 30, 2007. This increase is namely as a result of improved operational results and the utilization of approximately $5 million in future income taxes, from the rental division spin-off.
Normal Course Issuer Bid
On June 25, 2007, the Company announced its intention to make a normal course issuer bid to purchase, through the facilities of the Toronto Stock Exchange, certain of its outstanding common shares. The number of common shares to be purchased during the period of the normal course issuer bid (the “Bid”) from June 27, 2007 to June 26, 2008 will not exceed 1,208,739 common shares, or approximately 8.9% of the public float outstanding on June 18, 2008. On May 12, 2008 the Company announced an amended normal course issuer bid to purchase an additional 144,371 common shares, which would not exceed a total of 1,353,110 common shares purchased pursuant to the original Bid. All common shares repurchased by the Company pursuant to the normal course issuer bid have been cancelled. During the year, the Company purchased 1,353,110 Common shares at a cost of $5,975,695.
Contractual Obligations
The Company’s contractual obligations over the next five years and thereafter are summarized in the table below. For additional information, see Notes 10 and 14 (a) of the Company’s audited consolidated financial statements for the year ended June 30, 2008.
| | | | | | | | | | 5 Years and | | | |
(thousands of dollars) | | 1 Year | | 2 Years | | 3 Years | | 4 Years | | > | | Total | |
Obligations under Capital Leases | | $ | 8 | | $ | — | | $ | — | | $ | — | | $ | — | | $ | 8 | |
Operating leases | | 7,717 | | 6,197 | | 4,342 | | 3,011 | | 474 | | 21,741 | |
| | $ | 7,725 | | $ | 6,197 | | $ | 4,342 | | $ | 3,011 | | $ | 474 | | $ | 21,749 | |
SUMMARY OF QUARTERLY RESULTS
The financial results for each of the last eight quarters are summarized in the following table. The results demonstrate a continued emphasis on revenue growth compared to the prior quarters with an equal emphasis on management programs for underperforming branches.
In general, improved results reflect a pattern of maturation in the Company’s branch network. Beginning in the first quarter of fiscal 2008, there was an increase in brokerage revenue over prior periods due to a renewed emphasis on revenue growth by the Company. Expenses have also steadily increased due to an increased number of branches in operation and costs associated with the restructuring of processes and controls and the strengthening of operational and management capacities in key corporate areas including internal audit, risk management, training, and government relations.
15
From a seasonality perspective, the Company believes that its revenues are generally stronger in the first and fourth quarters followed by the second quarter. In addition, quarterly results of operations are impacted by the number and timing of new branch openings.
| | 2008 | | 2007 | |
(thousands of dollars, except for per share | | Q4 | | Q3 | | Q2 | | Q1 | | Q4 | | Q3 | | Q2 | | Q1 | |
Consolidated Results | | | | | | | | | | | | | | | | | |
Total operations No. of branches | | 384 | | 378 | | 367 | | 361 | | 358 | | 355 | | 348 | | 344 | |
| | | | | | | | | | | | | | | | | |
Brokerage | | $ | 34,490 | | $ | 31,305 | | $ | 32,591 | | $ | 32,181 | | $ | 31,451 | | $ | 29,895 | | $ | 30,773 | | $ | 31,378 | |
Corporate | | 52 | | 41 | | 83 | | 57 | | 16 | | 32 | | 6 | | 12 | |
| | 34,542 | | 31,345 | | 32,674 | | 32,238 | | 31,467 | | 29,927 | | 30,779 | | 31,390 | |
Branch expenses | | 18,635 | | 17,724 | | 17,460 | | 17,034 | | 16,903 | | 16,607 | | 16,077 | | 15,598 | |
Retention payments | | 4,229 | | 4,800 | | 5,290 | | 5,792 | | 5,501 | | 5,707 | | 6,000 | | 6,210 | |
Branch operating income | | 11,678 | | 8,821 | | 9,924 | | 9,413 | | 9,063 | | 7,613 | | 8,702 | | 9,582 | |
Regional expenses | | 1,985 | | 1,730 | | 1,991 | | 1,734 | | 1,819 | | 1,470 | | 1,432 | | 1,247 | |
Corporate expenses | | 3,523 | | 2,827 | | 2,589 | | 2,243 | | 4,001 | | 4,010 | | 3,494 | | 3,249 | |
Other amortization | | 244 | | 234 | | 180 | | 163 | | 222 | | 192 | | 203 | | 190 | |
Net income before income taxes | | 5,925 | | 4,030 | | 5,165 | | 5,273 | | 3,021 | | 1,941 | | 3,573 | | 4,896 | |
EBITA from continuing operations** | | 7,614 | | 5,433 | | 6,639 | | 6,585 | | 4,429 | | 3,336 | | 4,921 | | 6,334 | |
Net income from continuing operations | | 3,191 | | 2,706 | | 3,207 | | 3,418 | | 2,013 | | 1,374 | | 2,250 | | 3,033 | |
Loss from discontinued operations | | — | | (650 | ) | (676 | ) | (390 | ) | (422 | ) | (924 | ) | (860 | ) | (583 | ) |
Net income | | $ | 3,191 | | $ | 2,056 | | $ | 2,531 | | $ | 3,028 | | $ | 1,591 | | $ | 450 | | $ | 1,390 | | $ | 2,450 | |
Basic earnings per share | | | | | | | | | | | | | | | | | |
Income from continuing operations | | $ | 0.16 | | $ | 0.14 | | $ | 0.15 | | $ | 0.17 | | $ | 0.09 | | $ | 0.07 | | $ | 0.11 | | $ | 0.15 | |
Loss from discontinued operations | | — | | (0.03 | ) | (0.03 | ) | (0.02 | ) | (0.02 | ) | (0.04 | ) | (0.04 | ) | (0.03 | ) |
Net income | | 0.16 | | 0.11 | | 0.12 | | 0.15 | | 0.07 | | 0.02 | | 0.07 | | 0.12 | |
Diluted earnings per share | | | | | | | | | | | | | | | | | |
Income from continuing operations | | $ | 0.16 | | $ | 0.13 | | $ | 0.16 | | $ | 0.17 | | $ | 0.09 | | $ | 0.07 | | $ | 0.11 | | $ | 0.15 | |
Loss from discontinued operations | | — | | (0.04 | ) | (0.03 | ) | (0.02 | ) | (0.02 | ) | (0.04 | ) | (0.04 | ) | (0.03 | ) |
Net income | | 0.16 | | 0.09 | | 0.13 | | 0.15 | | 0.07 | | 0.02 | | 0.07 | | 0.12 | |
*Certain comparative tax figures have been reclassified to conform to the presentaion adopted for the current period.
**EBITA - earnings from continuing operations before interest, income taxes, stock-based compensation, amortization of capital and intangible assets.
Fourth Quarter
Net income from continuing operations for the fourth quarter of fiscal 2008 increased to $3.2 million, compared to $2.0 million for the same quarter last year due to increased revenue, decreased expenses and lower retention payments. Diluted earnings per share for continuing operations for the fourth quarter were $0.16 ($0.16 basic), compared to $0.09 per share ($0.09 basic) for the same quarter last year.
| | Number of | | BOI (Loss) | | BOI % of Revenues | |
Year Opened | | Branches | | Q4 2008 | | Q4 2007 | | Q4 2008 | | Q4 2007 | |
2001 * | | 98 | | 3,361,395 | | 3,609,577 | | 33.7 | % | 34.7 | % |
2002 | | 15 | | 687,541 | | 517,270 | | 36.7 | % | 30.1 | % |
2003 | | 36 | | 1,287,250 | | 1,236,737 | | 33.8 | % | 32.9 | % |
2004 | | 52 | | 1,870,865 | | 1,377,715 | | 36.9 | % | 30.4 | % |
2005 | | 69 | | 1,573,969 | | 1,316,473 | | 26.6 | % | 23.9 | % |
2006 | | 55 | | 855,164 | | 428,184 | | 20.7 | % | 12.6 | % |
2007 | | 27 | | 103,069 | | (182,481 | ) | 6.6 | % | -20.6 | % |
2008 | | 32 | | (67,515 | ) | (56,762 | ) | -4.7 | % | | |
Subtotal | | 384 | | 9,671,738 | | 8,246,713 | | | | | |
Branches not yet open | | | | (6,234 | ) | — | | | | | |
Closed branches | | | | (133,817 | ) | (101,235 | ) | | | | |
Other | | | | 2,145,843 | | 917,383 | | | | | |
Continuing Operations | | | | $ | 11,677,530 | | $ | 9,062,861 | | | | | |
| | | | | | | | | | | | | |
* Instaloan branches were acquired by Cash Store Financial on April 22, 2005, they have been operating since 2001
Revenue for the fourth quarter of fiscal 2008 increased to $34.5 million, compared to $31.5 million for the same quarter last year due to an additional 26 branches operating during the fourth quarter of fiscal 2008 as well as an increase in average revenue per branch as compared with the same quarter last year.
16
| | Number of | | Revenues | | Average Revenue/Branch/Month | |
Year Opened | | Branches | | Q4 2008 | | Q4 2007 | | %Change | | Q4 2008 | | Q4 2007 | |
2001* | | 98 | | 9,972,352 | | 10,404,828 | | -4 | % | 33,920 | | 35,391 | |
2002 | | 15 | | 1,871,594 | | 1,717,107 | | 9 | % | 41,591 | | 38,158 | |
2003 | | 36 | | 3,807,663 | | 3,764,236 | | 1 | % | 35,256 | | 34,854 | |
2004 | | 52 | | 5,064,876 | | 4,530,464 | | 12 | % | 32,467 | | 29,041 | |
2005 | | 69 | | 5,926,587 | | 5,502,189 | | 8 | % | 28,631 | | 26,581 | |
2006 | | 55 | | 4,141,002 | | 3,401,499 | | 22 | % | 25,097 | | 20,615 | |
2007 | | 27 | | 1,561,483 | | 883,746 | | 77 | % | 19,278 | | 10,910 | |
2008 | | 32 | | 1,438,210 | | — | | | | 14,981 | | — | |
Subtotal | | 384 | | 33,783,767 | | 30,204,069 | | 12 | % | 29,326 | | 26,219 | |
Closed Branches | | | | 6,014 | | 271,624 | | | | | | | |
Other | | | | 700,261 | | 975,718 | | | | | | | |
Continuing Operations | | | | $ | 34,490,042 | | $ | 31,451,411 | | | | | | | |
| | | | | | | | | | | | | | | |
* Instaloan branches were acquired by Cash Store Financial on April 22, 2005, they have been operating since 2001
Same branch sales for the 344 locations open since the beginning of the fourth quarter of fiscal 2007 increased by 5% compared to the same quarter last year, with same branch sales averaging $91,700 in the fourth quarter of fiscal 2008 compared to $87,300 in the fourth quarter of fiscal 2007. The increase reflects the impact of several strategic initiatives further executed upon by management. Management believes the increase reflects the impact of recent training and development activities, and management programs for underperforming stores.
Expenses for the fourth quarter of fiscal 2008 totalled $23.0 million, compared to $21.8 million in the same quarter last year. These increased costs are due to a significant increase in training and development activities, an increase in the number of branches, a restructuring of processes and controls and the strengthening of operational and management capacity in key areas such as internal audit, risk management and government relations. Retention payments totalled $4.2 million in the fourth quarter, compared to $5.5 million in the same quarter last year. The amortization of capital and intangible assets was up $192,000 to $1.4 million due to 26 more branches in operation during the fourth quarter of fiscal 2008 as compared to the same quarter last year.
The Company’s effective tax rate was 46.2% for the quarter ended June 30, 2008 compared to 33.4% for the same quarter in the prior year. The increase was caused by lower effective rates being applied on the valuation of future tax assets during the quarter.
RELATED PARTY TRANSACTIONS
The Company provides administrative functions to Insta-Rent. For this service the Company is charging Insta-Rent $30,000 per month. Included in selling, general and administrative expenses is a recovery of $90,000 (2007 - $0) relating to these services for the period that Insta-Rent was a separate public company. Included in trade accounts payable is $489,704 (2007 -$0) payable to Insta-Rent. The Company also charges Insta-Rent a monthly management fee of $30,000 per month in regards to providing Insta-Rent with administrative functions. These transactions are subject to normal trade terms and are measured at the actual exchange amount.
The Company has a $600,000 interest bearing note receivable due from Insta-Rent within the fiscal year.
The Company owns approximately 19% of the outstanding common shares of The Cash Store Australia Holdings Inc. Included in accounts receivable is $659,830 (2007 - $0) receivable from
17
The Cash Store Australia Holdings Inc., which has been repaid subsequent to year-end. These transactions are subject to normal trade terms and are measured at the actual exchange amount. Certain of the directors and officers have an ownership in TCS Australia Holdings Inc.
CONTRACTUAL BUSINESS ARRANGEMENTS
The Company’s subsidiaries, The Cash Store Inc. and 1152919 Alberta Ltd. (operating as Instaloans), act as brokers on behalf of consumers seeking short term advances. Neither the Company nor any of its subsidiaries fund the short term advances; most funding is provided by independent third party lenders. The advances are repayable by the customer to the third party lenders and represent assets of the lenders; accordingly they are not included on the Company’s balance sheet. To facilitate the short term advance business, written agreements have been entered into with a number of third party lenders that are prepared to consider lending to brokerage customers. The absence of third party lenders willing to lend to brokerage customers could have a material impact on the Company’s business.
LEGAL PROCEEDINGS AND OTHER CONTINGENCIES
Legal Proceedings
The Company has been served in prior fiscal periods with Statements of Claim issued in Alberta, British Columbia and Ontario alleging that the Company is in breach of s. 347 of the Criminal Code (the interest rate provision) and certain provincial consumer protection statutes. The claim in British Columbia was certified as a class proceeding against the Company and its subsidiary, The Cash Store Inc., with respect to British Columbia residents, and the certification decision was affirmed by the British Columbia Court of Appeal in fiscal 2006. In fiscal 2007, the plaintiffs in the British Columbia case brought forward an application to have certain of the Company’s third party lenders added to the claim. No decision has yet been made by the Court in respect of this application.
The claim in Ontario was certified against The Cash Store Inc., but not against the Company, in fiscal 2006 with respect to residents of Canada, other than residents of British Columbia and Alberta. In Alberta, there are two claims. One of the claims is in respect of payday loans and the certification motion has been pending since fiscal 2006. The other Alberta claim is in respect of title loans and the certification application has not yet been heard.
The Company believes that it conducts its business in accordance with applicable laws and is defending each of the actions vigorously. However, the likelihood of loss, if any, is not determinable. Accordingly, no provision has been made for these actions in the accounts. The Company is also involved in other claims related to the normal course of operations. Management believes that it has adequately provided for these claims.
Other Contingencies
As noted previously under the Contractual Business Arrangements section of this MD&A, the Company’s subsidiaries, The Cash Store Inc. and 1152919 Alberta Ltd. (operating as Instaloans), act as brokers on behalf of consumers seeking short term advances. The funding of the advances is provided directly to the customers by independent third party lenders. The Company has entered into written business arrangements with a number of third party lenders that are prepared
18
to consider lending to brokerage customers. Pursuant to these agreements, services related to the collection of documents and information as well as loan collection services are provided to the third party lenders. The agreements also provide that the third party lenders are responsible for losses suffered as a result of uncollectible loans, provided the required duties under the terms of the agreements have been properly performed by the brokerage subsidiaries. In the event the duties are not properly performed and the lenders make a claim as required under the agreement, the brokerage subsidiaries may be liable to the lenders’ for losses they have incurred. The Company’s contingent risk is the balance of the third party lenders loan portfolio which totalled approximately $58 million as at June 30, 2008 (2007 - $53 million). To date, no claims have been made by the third party lenders and no payments have been made or accrued by the brokerage subsidiaries pursuant to this clause in the agreements. Risk is managed through compliance with the loan limits, procedures and selection criteria established by the lenders.
REGULATORY ENVIRONMENT
In May 2007, Bill C-26, An Act to Amend the Criminal Code (criminal interest rate), received Royal Assent. Consistent with the provisions of Bill 26, several provinces are expected to establish limits on the total cost of borrowing. On July 31, the Nova Scotia Utility and Review Board issued an Order setting the maximum cost of borrowing for a payday loan. The Board adopted a market approach, setting the maximum at $31 per $100 lent, effectively allowing most if not all operators currently in the market to remain in business. This rate cap is expected to be approved and implemented by the Government of Nova Scotia within the second quarter of fiscal 2009. The Public Utility Board in Manitoba recently issued an Order to establish maximum amounts that can be charged in respect of a payday loan. This cap was set at $17 per $100 lent. In its Order, the Manitoba PUB stated its intention through a low cap was to force all but the most efficient operators from the market. Although Cash Store Financial fully intends to maintain its presence in Manitoba and to operate profitably in doing so, the Company has sought a leave to appeal this Order before the Manitoba Court of Appeal on the grounds that the rate cap is unduly punitive to the Company’s operations and in attempting to “shape” the market in Manitoba the utilities board exceeded its legislated mandate. The Provinces of British Columbia, Saskatchewan, Ontario and New Brunswick have passed legislation that allows for the setting of maximum rates, although these rates have not yet been set. At this stage, other than Nova Scotia, it remains difficult for the Company to specify limits that each province will set, due to incomplete public consultation processes that are either underway or have yet to begin. A ban on rollovers is expected in those jurisdictions that are presently developing rate regimes.
Cash Store Financial has been, and continues to be, a long-standing advocate of improved consumer protection measures for the payday loan industry. The Company’s long-term strategy has been predicated on the belief that regulatory certainty will have a positive impact on operations. The Company has aggressively built its network of retail branches on this basis.
CRITICAL ACCOUNTING ESTIMATES
The Company’s accounting policies are integral to understanding and interpreting the financial results reported in this MD&A. The significant accounting policies used in preparing the Company’s consolidated financial statements are summarized in Note 1 to those statements which are available on SEDAR at www.sedar.com. Certain policies included in Note 1 are considered to be particularly important to the presentation of the Company’s financial position and results of
19
operations, because they require Management to make difficult, complex or subjective judgments and estimates, often as a result of matters that are inherently uncertain, which may result in materially different results under different assumptions and conditions. The following is a discussion of those critical accounting estimates. These estimates are adjusted in the normal course to reflect changing underlying circumstances. The impact and any associated risks related to these critical accounting estimates on the Company’s business may also be discussed elsewhere in this MD&A.
Revenue Recognition
Revenue arising from brokering short-term advances for customers is recognized once all services have been rendered, all advance amounts have been received by the customer and the brokerage fee has been received by the Company.
Revenue from the Company’s cheque cashing, money order sales, money transfer, bill payment services and other miscellaneous services is recognized when the transactions are completed at the point-of-sale in the store and the related fee charged by the Company has been received.
For consumer loans that the Company makes directly, which have terms ranging from 1 to 365 days, revenues are recognized in accordance with Canadian Institute of Chartered Accountants (“CICA”), AcG-4, fees and costs associated with lending activities. Loan origination fees are recognized over the term of the contract.
Retention Payments
The Company, through The Cash Store and Instaloans banners, acts as a broker on behalf of consumers seeking short term advances. The Company does not fund the short term advances; all funding is provided by independent third party lenders. The advances are repayable by the customer to the third party lenders and represent assets of the lenders; accordingly they are not included on the Company’s balance sheet.
To facilitate the short term advance business, the Company has entered into written agreements with a number of third party lenders that are prepared to consider lending to the Company’s customers. Pursuant to these agreements, the Company provides services to the lenders related to the collection of documents and information as well as loan collection services. The agreements also provide that the third party lenders are responsible for losses suffered on account of uncollectible loans provided the Company has properly performed its duties under the terms of the agreements. In the event the Company does not properly perform its duties and the lenders make a claim as required under the agreement, it may be liable to the lenders for losses they have incurred. A liability is recorded when it is determined that the Company has a liability under the agreement.
The Company’s board of directors approved a resolution which authorizes management to pay a maximum amount of retention payments per quarter to third party lenders as consideration to those lenders that continue to be willing to fund advances to the Company’s customers. While the third party lenders have not been guaranteed a return, the decision has been made to voluntarily make retention payments to the lenders to deflect the impact of the loan losses experienced by the third party lenders. Retention payments are recorded in the period in which a commitment is made to a third party lender pursuant to the resolution approved by the board of directors.
20
Amortization Policies and Useful Lives
The Company depreciates the cost of capital assets and intangible assets over the estimated useful service lives of the items. These estimates of useful lives involve considerable judgment. In determining these estimates, the Company takes into account industry trends and company-specific factors, including changing technologies and expectations for the in-service period of these assets. On an annual basis, the Company reassesses its existing estimates of useful lives to ensure they match the anticipated life of the asset from a revenue-producing perspective. If the in-service period change happens more quickly than the Company has anticipated, the Company might have to shorten the estimated life of certain capital or intangible assets, which could result in higher depreciation expenses in future periods or an impairment charge to write down the value of capital or intangible assets.
Goodwill
With the acquisition of the assets and certain liabilities of Instaloans on April 22, 2005, the Company has a significant amount of goodwill on its balance sheet. The Company has performed a goodwill impairment test as at April 1, 2008 and will continue to do so on an annual basis and more frequently if events or changes in circumstances indicate that an impairment loss may have been incurred. Impairment is tested at the reporting unit level by comparing the reporting unit’s carrying amount to its fair value. The fair values of the reporting units are estimated using a combination of a market approach and discounted cash flows. The process of determining fair values is subjective and requires management to exercise judgment in making assumptions about future results, including revenue and cash flow projections at the reporting unit level, and discount rates. As a result, future goodwill impairment tests could result in significant impairment charges.
Contingencies
The Company is subject to various claims and contingencies related to lawsuits, taxes and commitments under contractual and other commercial obligations. The Company recognizes liabilities for contingencies and commitments when a loss is probable and capable of being reasonably estimated. Significant changes in assumptions as to the likelihood and estimates of the amount of a loss could result in recognition of an additional liability.
Income Tax Estimates and Future Income Taxes
As part of the process of preparing the Company’s consolidated financial statements, Management is required to estimate income taxes in each of the jurisdictions in which it operates. This process involves estimating the Company’s actual current tax exposure together with assessing temporary differences resulting from differing treatment of items. These differences result in future income tax assets and liabilities, which are included within the Company’s balance sheet. The Company must then assess the likelihood that future tax assets will be recovered from future taxable income, and if the Company assesses that recovery is not likely, a valuation allowance must be established. Management judgment is required in determining the Company’s provision for income taxes, future tax assets and liabilities and any valuation allowance that may be deemed necessary.
21
CHANGES IN ACCOUNTING POLICIES AND PRACTICES
Financial Instruments
The financial instruments standard establishes the recognition and measurement criteria for financial assets, financial liabilities and derivatives. All financial instruments are required to be measured at fair value on initial recognition of the instrument, except for certain related party transactions. Measurement in subsequent periods depends on whether the financial instrument has been classified as “held—for-trading”, “available-for-sale financial assets”, “held-to-maturity investments”, “loans and receivables”, or “other financial liabilities” as defined by the standard.
Financial assets and financial liabilities “held-for-trading” are measured at fair value with changes in those fair values recognized in net earnings. “Available-for-sale financial assets” are measured at fair value, with changes in those fair values recognized in Other Comprehensive Income (“OCI”). “Held-to-maturity investments”, “loans and receivables” and “other financial liabilities” are measured at amortized cost using the effective interest method.
Cash has been designated as “held-for-trading”. Accounts receivable are designated as “loans and receivables”. Accounts payable and accrued liabilities and capital lease obligations are designated as “other financial liabilities”.
Section 3855 requires that the Company records non-financial derivatives as assets or liabilities at their fair value unless exempted from derivative treatment as normal purchase or sale. The Section also requires the Company to identify embedded derivatives that need separation from the related host contract and measure those embedded derivatives at fair value. Subsequent change in fair value of embedded derivatives is recognized in the consolidated statement of operations and deficit in the period the change occurs. The Company has elected to apply this accounting treatment for all embedded derivatives in host contracts entered into on or after July 1, 2003 and has determined there are no material embedded derivatives that must be separated from the host contract and accounted for separately and there are no non-financial derivative instruments.
Transactions costs that are directly attributable to the acquisition or issuance or disposal of financial assets or liabilities are expensed at the time of occurrence.
Section 3861 (replaces Handbook Section 3860, Financial Instruments-Disclosure and Presentation) establishes standards for presentation of financial instruments and non-financial derivatives, and identifies information that should be disclosed. There was no material effect on the Company’s financial statements when we adopted the Section 3861 on July 1, 2007.
In March 2007, the CICA issued Handbook Section 3862, “Financial Instruments—Disclosures”, which complements CICA 3861 and provides expanded disclosure requirements that provide additional detail by financial assets and liability categories. This standard harmonizes disclosures with International Financial Reporting Standards, IFRS 7, Financial Instruments: Disclosures, and places an increased emphasis on disclosures about the risks associated with both recognized and unrecognized financial instruments and how these risks are managed. The Company is in the process of assessing the impact of adopting this new standard. This standard applies to the Company’s interim and annual financial statements beginning July 1, 2008.
22
Comprehensive Income
The new standards introduce comprehensive income, which consists of net earnings and other comprehensive income (“OCI”). The Company has no OCI transactions recorded for the period ended June 30, 2008. The adoption of Comprehensive Income has been in accordance with the applicable transitional provisions.
Section 3251 establishes standards for the presentation of equity and for the changes in equity during the reporting period. The cumulative changes in OCI are included in accumulated other comprehensive income (“AOCI”), which is presented as a new category within shareholders’ equity. The Company has no opening or closing balances for accumulated other comprehensive income or loss and accordingly, does not have either a statement of comprehensive income or accumulated other comprehensive income.
Hedges
Section 3865 specifies circumstances under which hedge accounting is permissible and how hedge accounting may be performed. The Company currently does not have any hedges.
Equity
Effective July 1, 2007 the Company adopted CICA Handbook Section 3251, “Equity”. The standard established standards for the presentation of equity and changes in equity during the reporting period and are in addition to those in CICA Handbook Section 1530. Specifically an enterprise should present separately the following components of equity: retained earnings, accumulated other comprehensive income and the total for retained earnings and accumulated other comprehensive income, contributed surplus, share capital and reserves.
Accounting Changes
In July 2006, the Accounting Standards Board (“AcSB”) issued a replacement of The Canadian Institute of Chartered Accountants’ Handbook (“CICA Handbook”) Section 1506, Accounting Changes (“Section 1506”). The new standard allows for voluntary changes in accounting policy only when they result in financial statements providing reliable and more relevant information, requires changes in accounting policy to be applied retrospectively unless doing so is impracticable, requires prior period errors to be corrected retrospectively, and calls for enhanced disclosures about the effects of changes in accounting policies, estimates and errors on the financial statements. The impact that the adoption of Section 1506 will have on the Company’s results of operations and financial condition will depend on the nature of future accounting changes. The adoption of Section 1506 effective July 1, 2007 has had no impact on these audited consolidated financial statements.
RECENT ACCOUNTING PRONOUNCEMENTS NOT YET ADOPTED
Financial Instruments
In July 2006, the Accounting Standards Board (“AcSB”) issued a replacement of The Canadian Institute of Chartered Accountants’ Handbook (“CICA Handbook”) Section 1506, Accounting Changes (“Section 1506”). The new standard allows for voluntary changes in accounting policy only when they result in financial statements providing reliable and more relevant information, requires changes in accounting policy to be applied retrospectively unless doing so is
23
impracticable, requires prior period errors to be corrected retrospectively, and calls for enhanced disclosures about the effects of changes in accounting policies, estimates and errors on the financial statements. The impact that the adoption of Section 1506 will have on the Company’s results of operations and financial condition will depend on the nature of future accounting changes. The adoption of Section 1506 effective July 1, 2007 has had no impact on these audited consolidated financial statements.
Section 3862 requires disclosures, by class of financial instrument that enables users to evaluate the significance of financial instruments for an entity’s financial position and performance, including disclosures about fair value. In addition, disclosure is required of qualitative and quantitative information about exposure to risks arising from financial instruments, including specified minimum disclosures about credit risk, liquidity risk and market risk. The quantitative disclosures must also include a sensitivity analysis of each type of market risk to which an entity is exposed, show how net income and other comprehensive income would have been affected by reasonably possible changes in the relevant risk variable.
This standard is effective for the Company for interim and annual financial statements beginning on July 1, 2008. The Company does not expect the adoption of this standard to have a material impact on its financial position and results of operations.
In March 2007, the CICA also issued Handbook Section 3863, “Financial Instruments—Presentation” to enhance financial statement users’ understanding of the significance of financial instruments to an entity’s financial position, performance and cash flows. This Section establishes standards for presentation of financial instruments and non-financial derivatives. It deals with the classification of financial instruments, from the perspective of the issuer, between liabilities and equity, the classification of related interest, dividends, gains and losses, and the circumstances in which financial assets and financial liabilities are offset. This standard harmonizes disclosures with International Financial Reporting Standards (“IFRS”). The Company is in the process of assessing the impact of adopting this new standard. The standard applies to the Company’s interim and annual financial statements beginning July 1, 2008.
Financial instruments presentation
In October 2006, the AcSB approved Section 3863-Financial Instruments-Presentation, which replaces Section 3861, Financial Instruments-Disclosure and Presentation. The existing requirements on presentation of financial instruments have been carried forward unchanged to Section 3863, Financial Instruments-Presentation.
This standard is effective for the Company for interim and annual financial statements beginning on July 1, 2008. The Company does not expect the adoption of the standard to have a material impact on its financial position and results of operation.
Capital Disclosures
In December 2006, the CICA issued Handbook Section 1535, “Capital Disclosures”. This standard requires that an entity disclose information that enables users of its financial statements to evaluate an entity’s objectives, policies and processes for managing capital, including disclosures of any externally imposed capital requirements and the consequences of non-compliance. The Company is in the process of assessing the impact of adopting this new
24
standard. This standard applies to the Company’s interim and annual financial statements beginning July 1, 2008.
Going Concern
In April 2007, the CICA approved amendments to Handbook Section 1400, “General Standards of Financial Statement Presentation”. These amendments require management to assess an entity’s ability to continue as a going concern. When management is aware of material uncertainties related to events or conditions that may cast doubt on an entity’s ability to continue as a going concern, those uncertainties must be disclosed. In assessing the appropriateness of the going concern assumption, the standard requires management to consider all available information about the future, which is at least, but not limited to, twelve months from the balance sheet date. The Company is in the process of assessing the impact of adopting this new standard. The new requirements of the standard applies to the Company’s interim and annual financial statements beginning July 1, 2008.
Goodwill and Intangible assets
In February 2008, the CICA issued Handbook Section 3064, (“CICA 3064”) Goodwill and Intangible Assets. CICA 3064, which replaces Section 3062, Goodwill and Intangible Assets and Section 3450, Research and Development Costs, establishes standards for the recognition, measurement and disclosure of goodwill and intangible assets. The provisions relating to the definition and initial recognition of intangible assets, including internally generated intangible assets, are equivalent to the corresponding provisions of International Reporting Standard IAS 38, Intangible Assets. This new standard applies to the Company’s interim and annual financial statements beginning July 1, 2009.
CONTROLS AND PROCEDURES
Disclosure Controls and Procedures
Disclosure controls and procedures are designed to provide reasonable assurance that all material information related to the Company, including its consolidated subsidiaries, is made known to senior management, including the Chief Executive Officer (“CEO”) and Chief Financial Officer (“CFO”), on a timely basis so that appropriate decisions can be made regarding public disclosure. As at June 30, 2008, an evaluation was conducted using the standards of the COSO control framework, by and under the supervision of management, including the CEO and CFO, of the effectiveness of the Company’s disclosure controls and procedures as defined under Multilateral Instrument 52-109 (“Certification of Disclosure in Issuers’ Annual and Interim Filings”). Based on this evaluation, the CEO and CFO have concluded that the Company’s disclosure controls and procedures were effective.
Internal Controls over Financial Reporting
Internal controls over financial reporting (“ICFR”) are designed to provide reasonable assurance regarding the reliability of the Company’s financial reporting and its preparation of financial statements for external reporting purposes in accordance with Canadian Generally Accepted Accounting Principles (“GAAP”). As at June 30, 2008, an evaluation was conducted using the standards of the COSO control framework, by and under the supervision of management,
25
including the CEO and CFO, of the Company’s design of ICFR. Based on this evaluation, the CEO and CFO have concluded that the design of the Company’s ICFR provided reasonable assurance regarding the reliability of financial reporting and the preparation of financial statements for external purposes in accordance with GAAP.
Management has evaluated whether there were changes in the Company’s ICFR during the most recent interim period ended June 30, 2008 that have materially affected, or are reasonably likely to materially affect, the Company’s ICFR. No such changes were identified through management’s evaluation.
Limitations on the Effectiveness of Disclosure Controls and the Design of ICFR
The Company’s management, including the CEO and CFO, do not expect that the Company’s disclosure controls and procedures and ICFR will prevent all errors and all fraud. A control system, no matter how well designed and operated, can provide only reasonable assurance that the control system objectives will be met. The likelihood of achievement is affected by limitations inherent in all internal control systems. These inherent limitations include the realties that judgements in decision-making can be faulty, and that breakdowns can occur because of simple errors or mistakes. Controls can also be circumvented in numerous ways including collusion, overrides and deception. Another inherent limitation in any system of ICFR is the increasing complexity of GAAP. With the changing standards, growing rules-based guidance and interpretations, increasing abundance of Canadian, U.S. and International standards and the varying interpretations of GAAP by professional accountants and regulatory authorities it is possible that the judgements and interpretations made by the Company may differ from that of others. In addition to the inherent limitations, the design of a control system must reflect that there are resource constraints, and the expected benefit of controls must be considered relative to the expected costs. Due to inherent limitations in a cost-effective control system, misstatements due to error or fraud may occur and not be detected. Further, no evaluation of controls can provide absolute assurance that all control issues within a company will be detected.
DIVIDENDS
On August 27, 2008, the Company declared two cash dividends. The first dividend is a quarterly cash dividend of $0.025 per common share and the second dividend is a special cash dividend of $0.075 per common shares. Both are payable on October 2, 2008 to shareholders of record on September 18, 2008. Decisions on future dividends will be subject to Board of Directors’ approval on a quarterly basis.
OUTSTANDING SHARE DATA
As at August 19, 2008, the Company had 19,408,160 common shares outstanding. There were also options to purchase 1,079,000 common shares, which if exercised, would provide the Company with proceeds of approximately $4.7 million.
26
