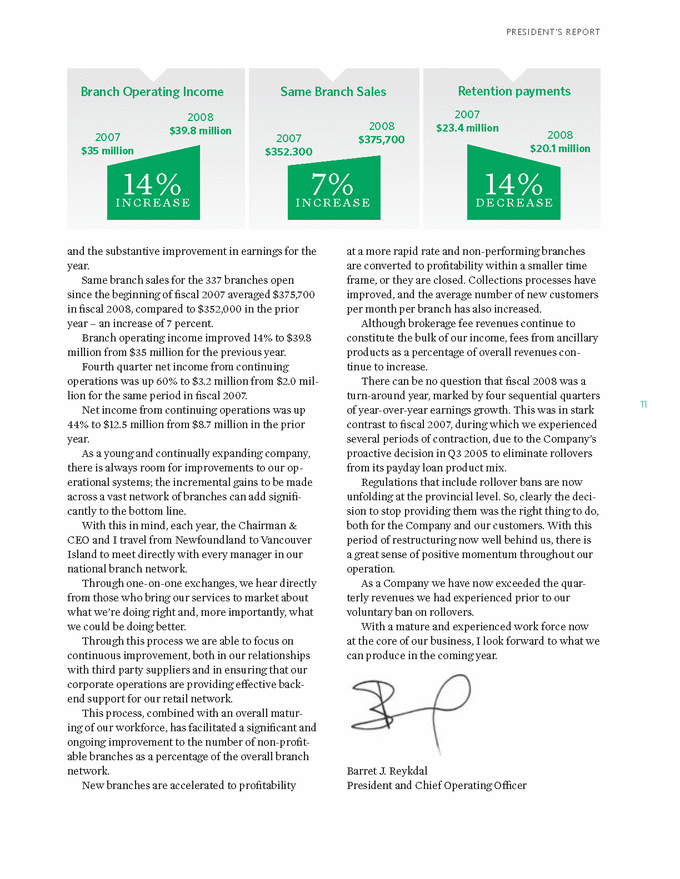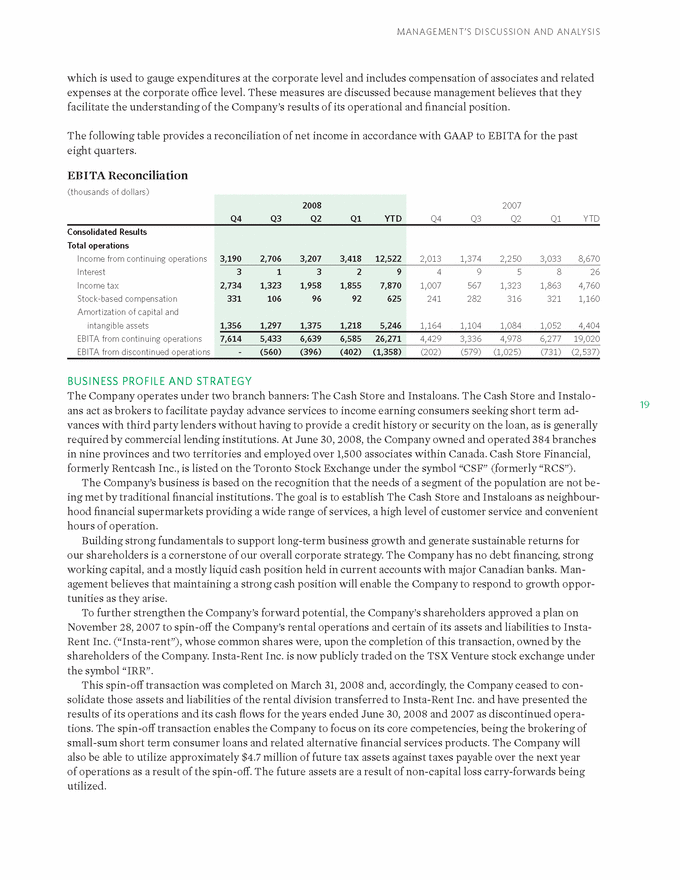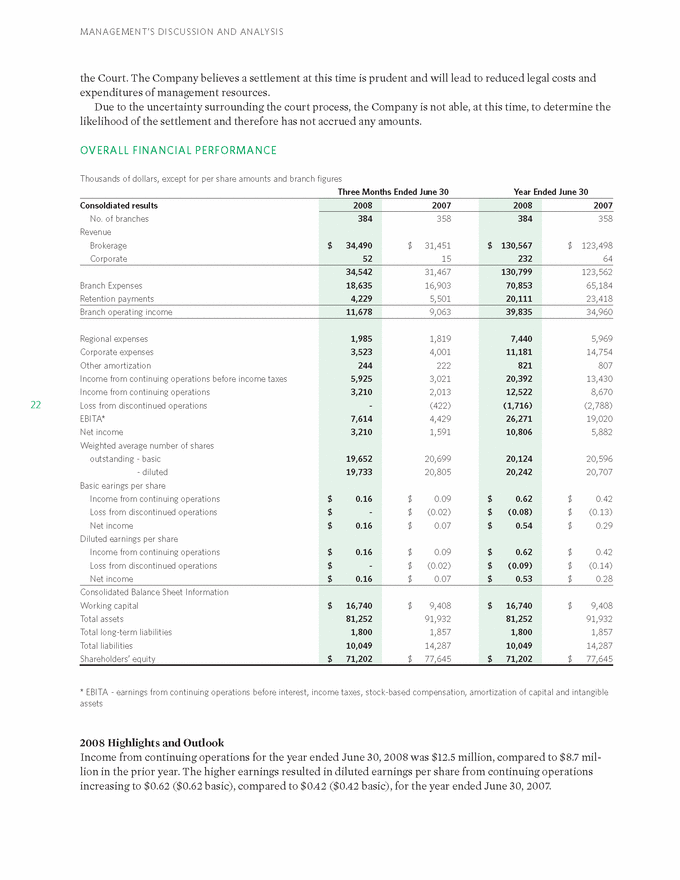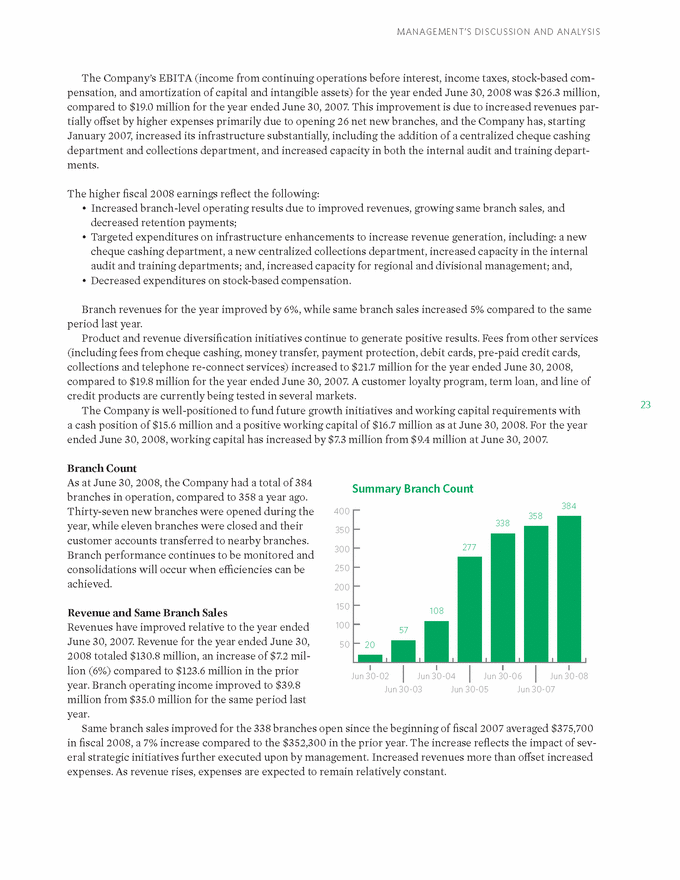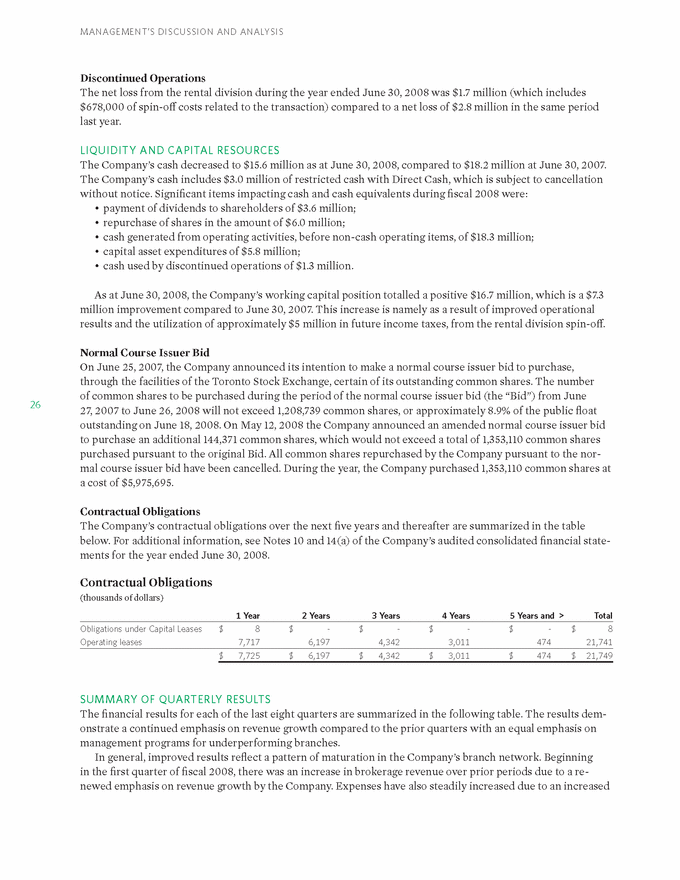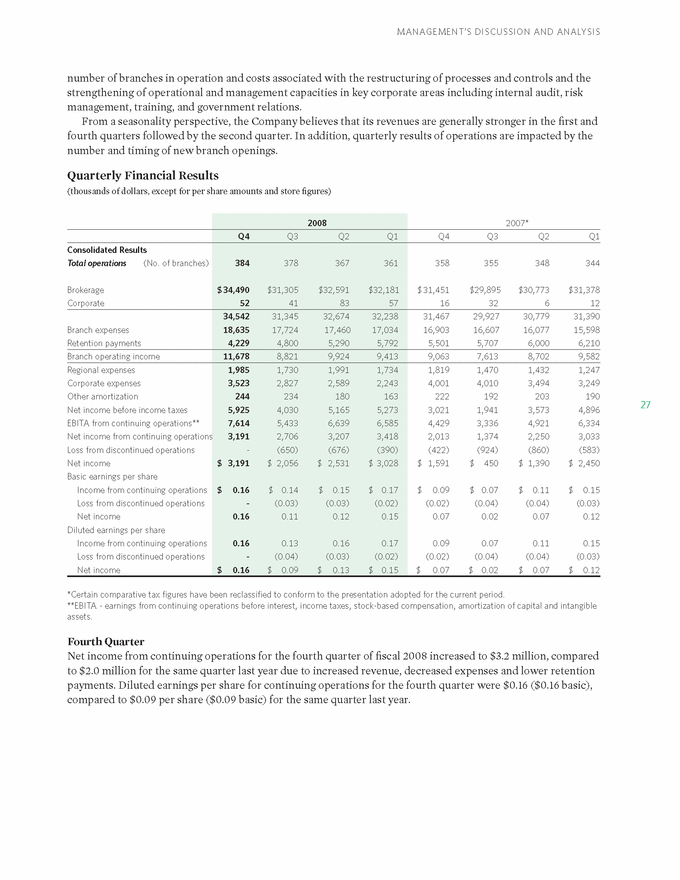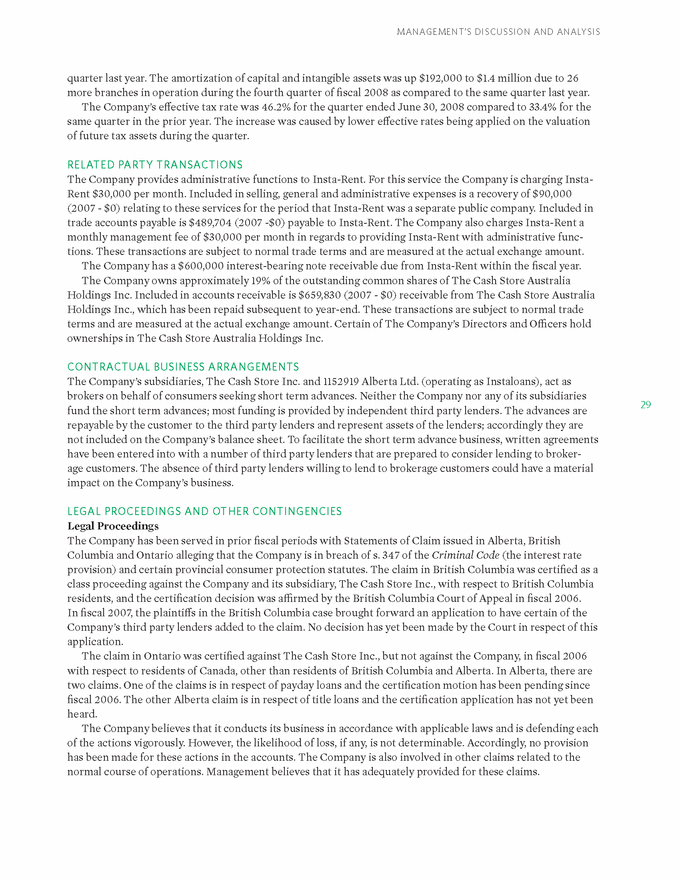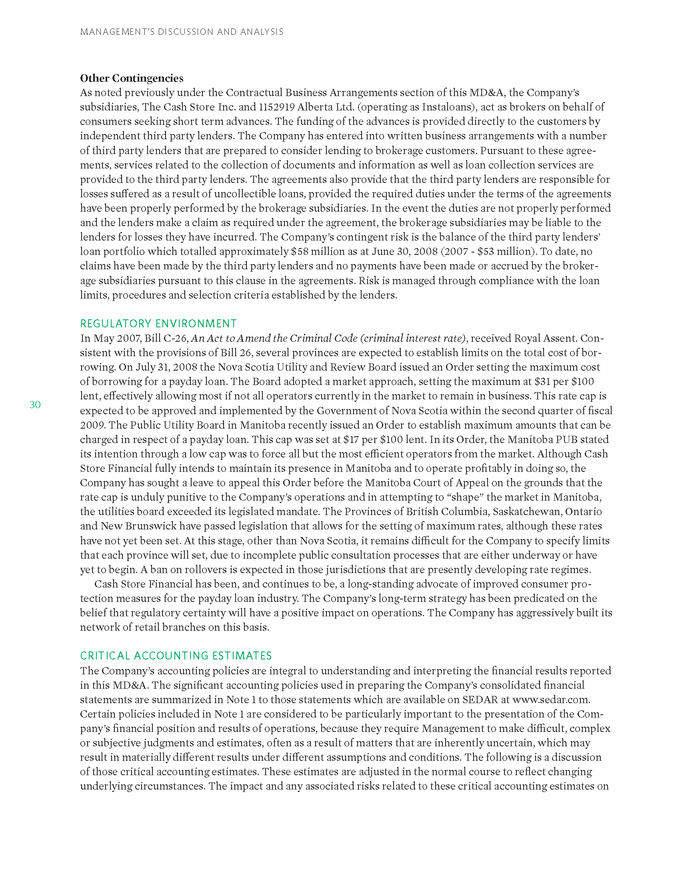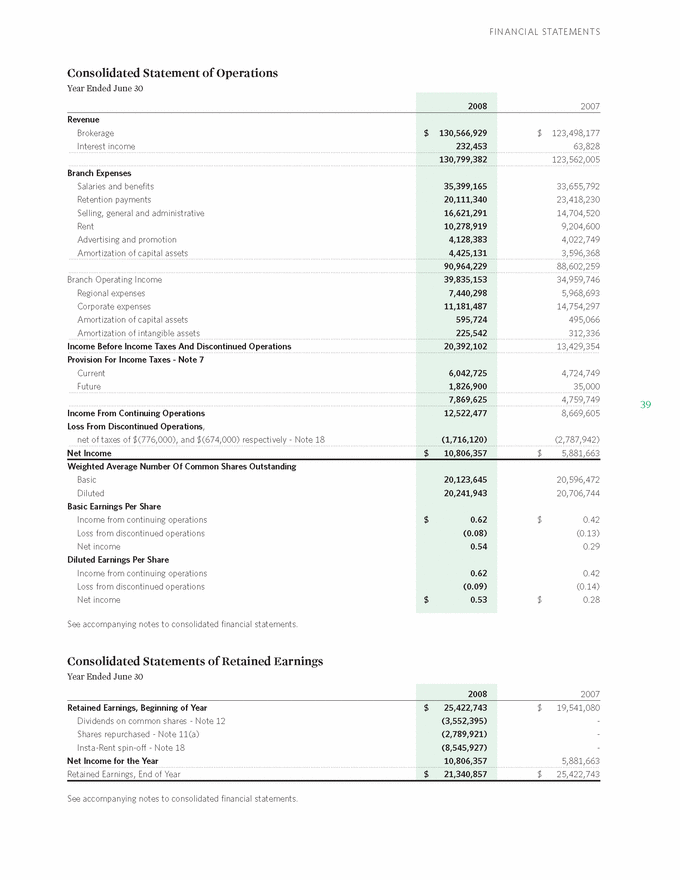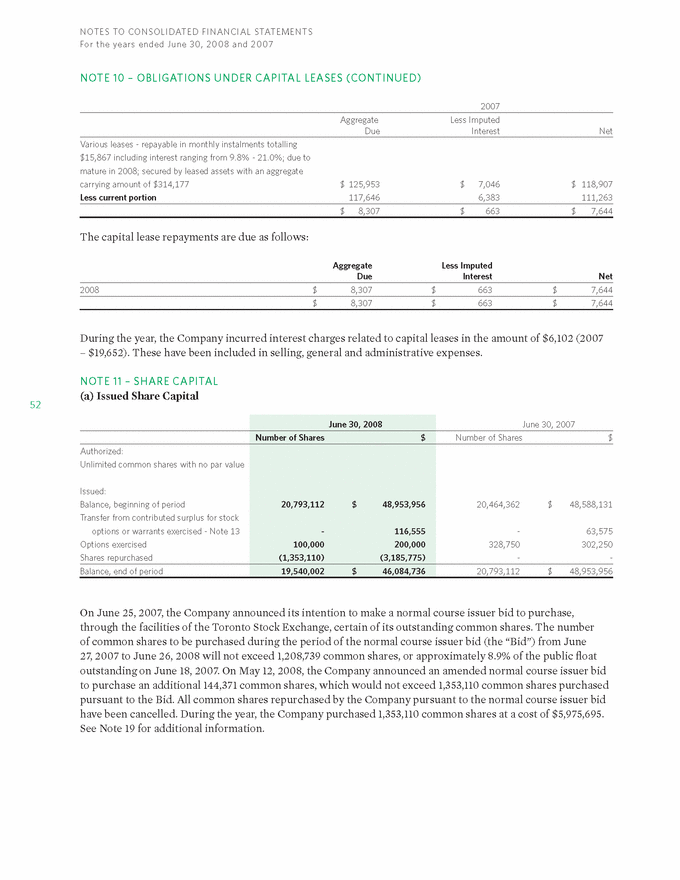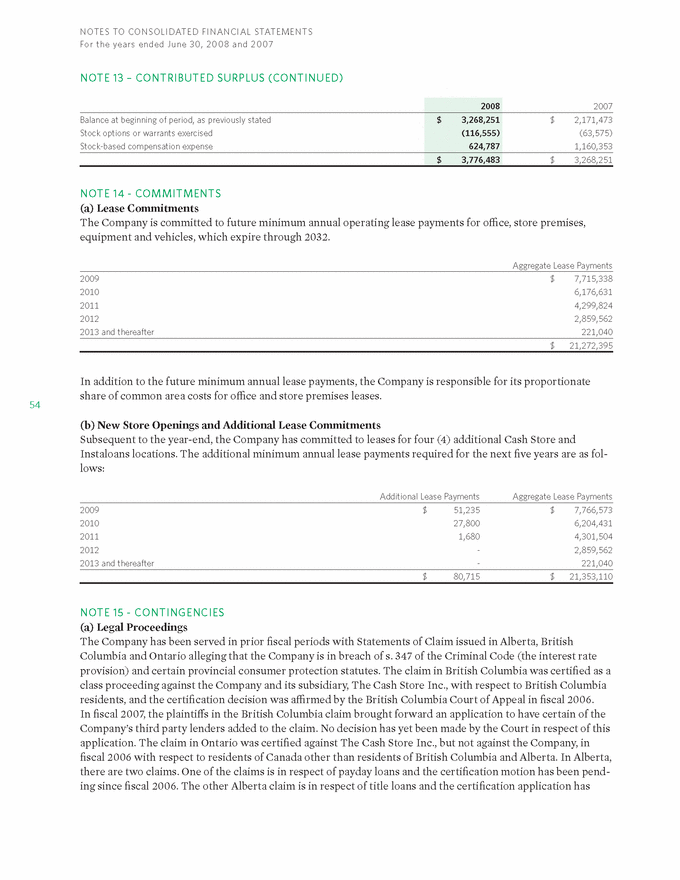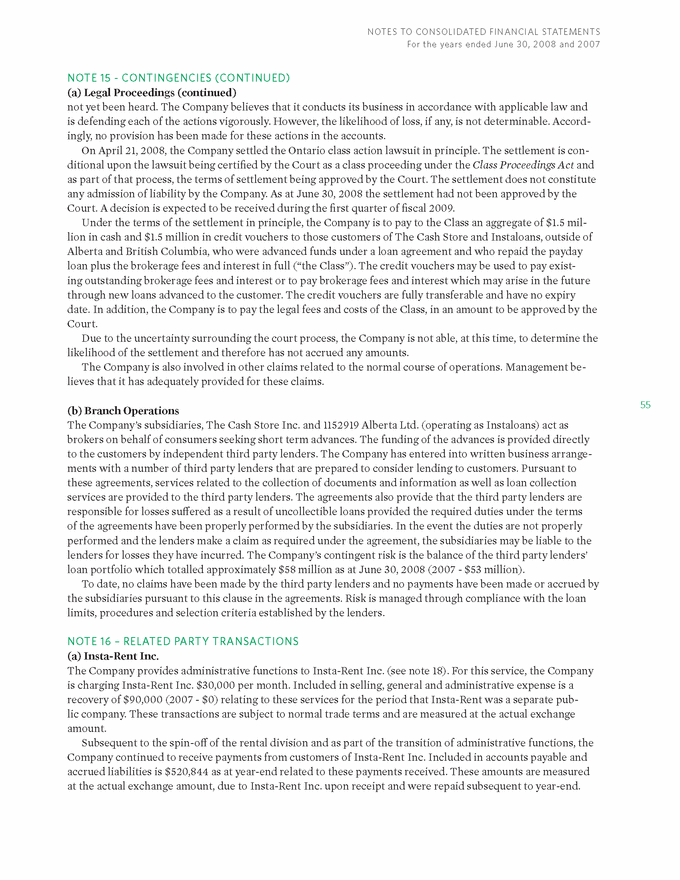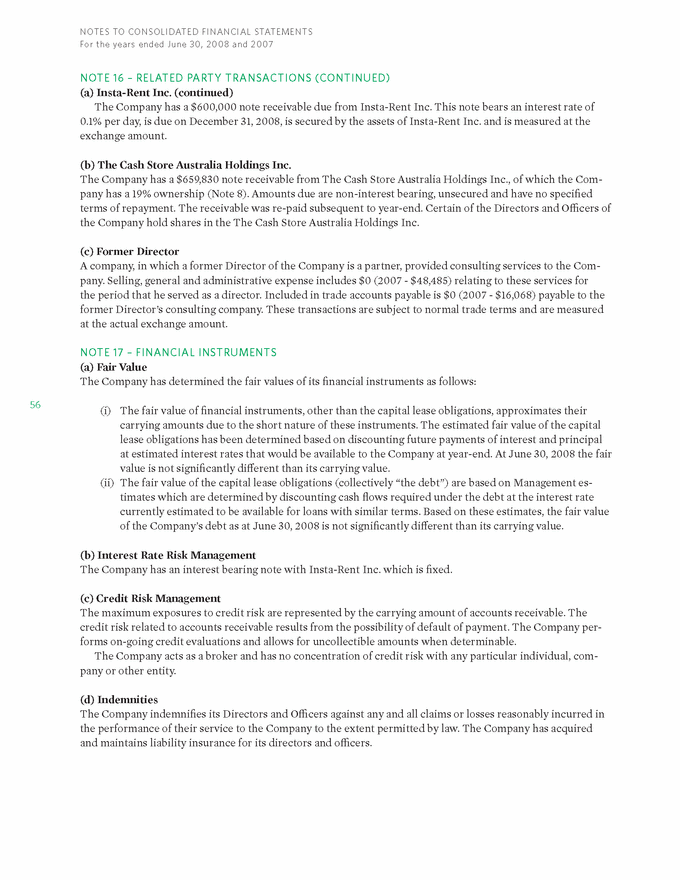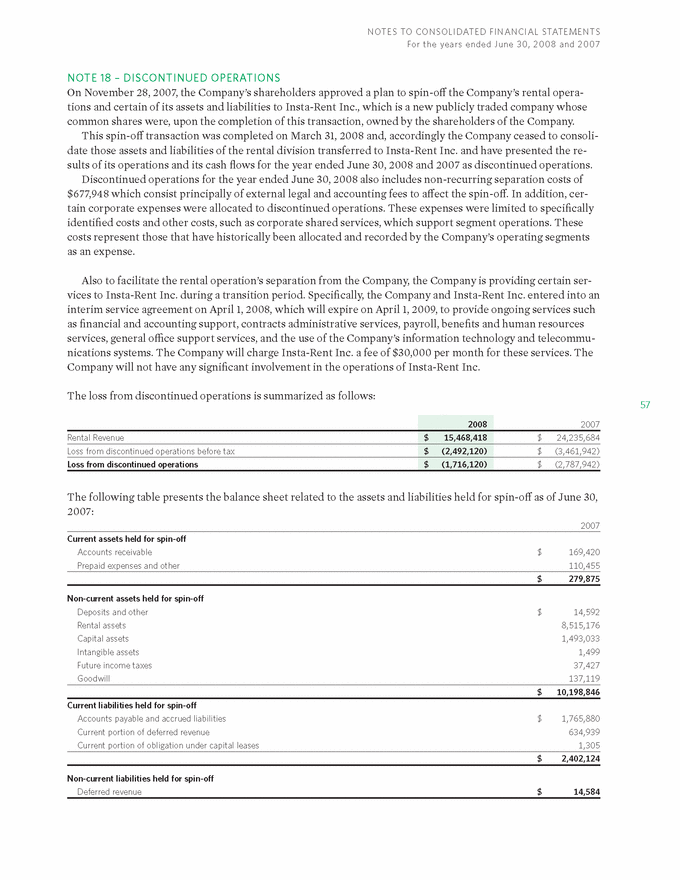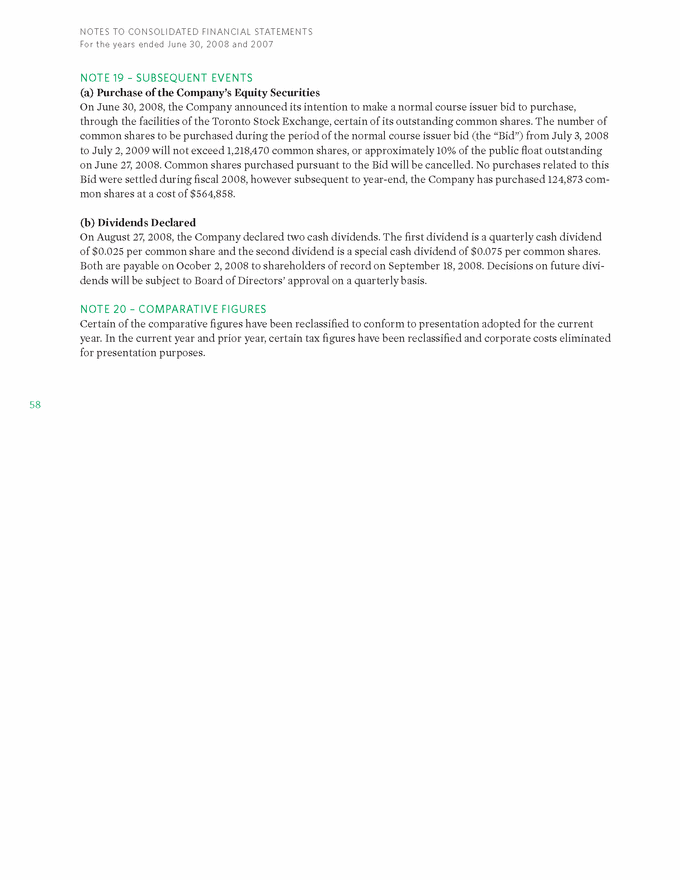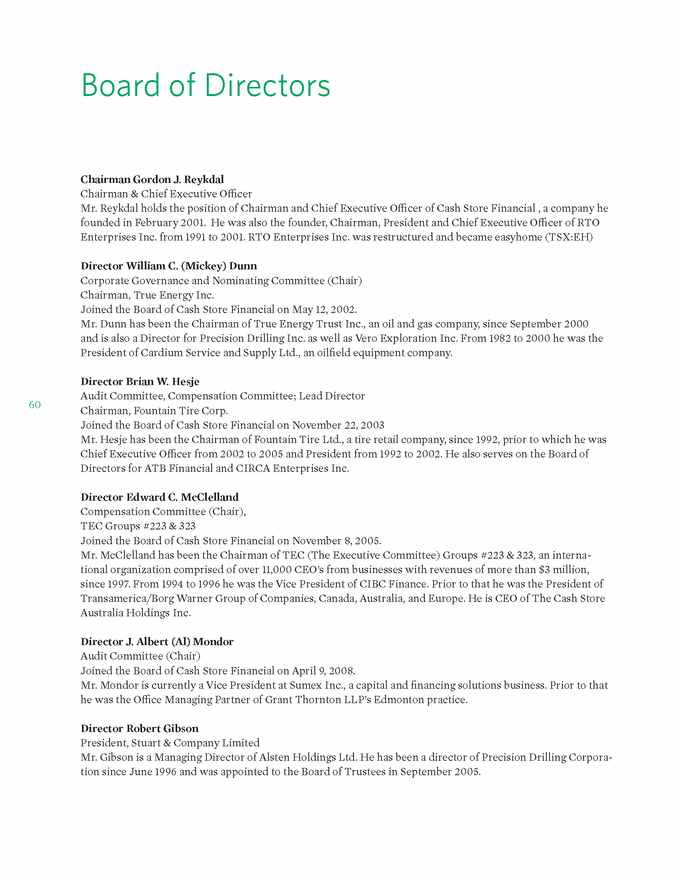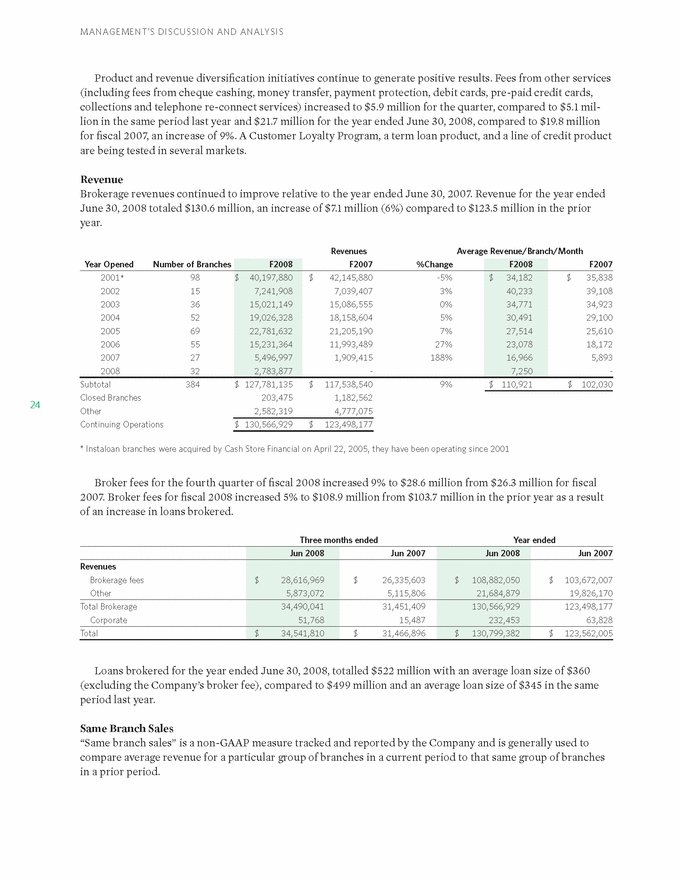
| Product and revenue diversification initiatives continue to generate positive results. Fees from other services (including fees from cheque cashing, money transfer, payment protection, debit cards, pre-paid credit cards, collections and telephone re-connect services) increased to $5.9 million for the quarter, compared to $5.1 million in the same period last year and $21.7 million for the year ended June 30, 2008, compared to $19.8 million for fiscal 2007, an increase of 9%. A Customer Loyalty Program, a term loan product, and a line of credit product are being tested in several markets. Revenue Brokerage revenues continued to improve relative to the year ended June 30, 2007. Revenue for the year ended June 30, 2008 totaled $130.6 million, an increase of $7.1 million (6%) compared to $123.5 million in the prior year. Revenues Average Revenue/Branch/Month Year Opened Number of Branches F2008 F2007 %Change F2008 F2007 2001 98 $ 40,197,880 $ 42,145,880 -5% $ 34,182 $ 35,838 2002 15 7,241,908 7,039,407 3% 40,233 39,108 2003 36 15,021,149 15,086,555 0% 34,771 34,923 2004 52 19,026,328 18,158,604 5% 30,491 29,100 2005 69 22,781,632 21,205,190 7% 27,514 25,610 2006 55 15,231,364 11,993,489 27% 23,078 18,172 2007 27 5,496,997 1,909,415 188% 16,966 5,893 2008 32 2,783,877 - 7,250 - Subtotal 384 $ 127,781,135 $ 117,538,540 9% $ 110,921 $ 102,030 Closed Branches 203,475 1,182,562 Other 2,582,319 4,777,075 Continuing Operations $ 130,566,929 $ 123,498,177 * Instaloan branches were acquired by Cash Store Financial on April 22, 2005, they have been operating since 2001 Broker fees for the fourth quarter of fiscal 2008 increased 9% to $28.6 million from $26.3 million for fiscal 2007. Broker fees for fiscal 2008 increased 5% to $108.9 million from $103.7 million in the prior year as a result of an increase in loans brokered. Three months ended Year ended Jun 2008 Jun 2007 Jun 2008 Jun 2007 Revenues Brokerage fees $ 28,616,969 $ 26,335,603 $ 108,882,050 $ 103,672,007 Other 5,873,072 5,115,806 21,684,879 19,826,170 Total Brokerage 34,490,041 31,451,409 130,566,929 123,498,177 Corporate 51,768 15,487 232,453 63,828 Total $ 34,541,810 $ 31,466,896 $ 130,799,382 $ 123,562,005 Loans brokered for the year ended June 30, 2008, totalled $522 million with an average loan size of $360 (excluding the Company’s broker fee), compared to $499 million and an average loan size of $345 in the same period last year. Same Branch Sales “Same branch sales” is a non-GAAP measure tracked and reported by the Company and is generally used to compare average revenue for a particular group of branches in a current period to that same group of branches in a prior period. * MANAGEMENT’S DISCUSSION AND ANALYSIS 24 |

