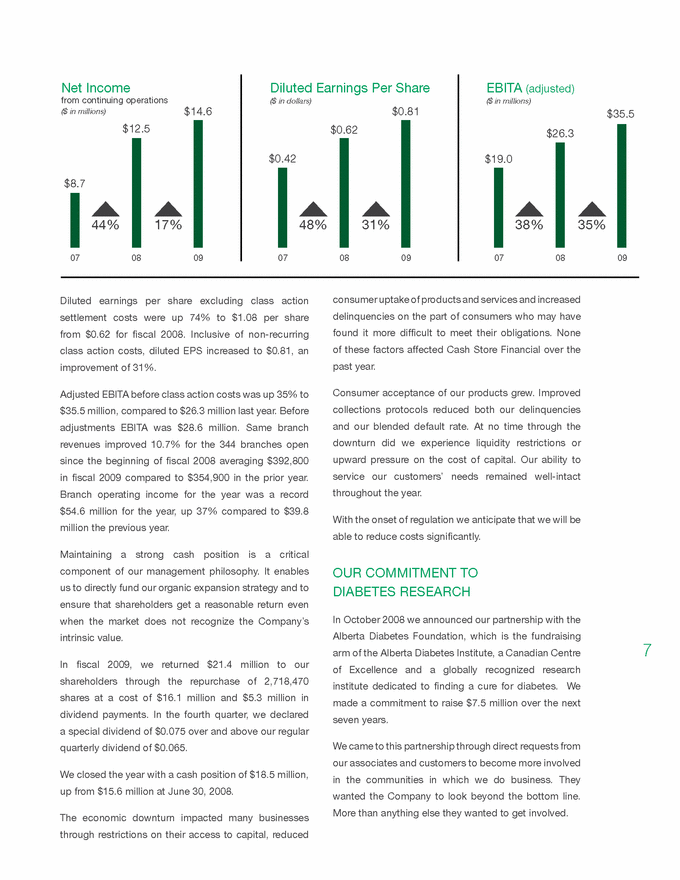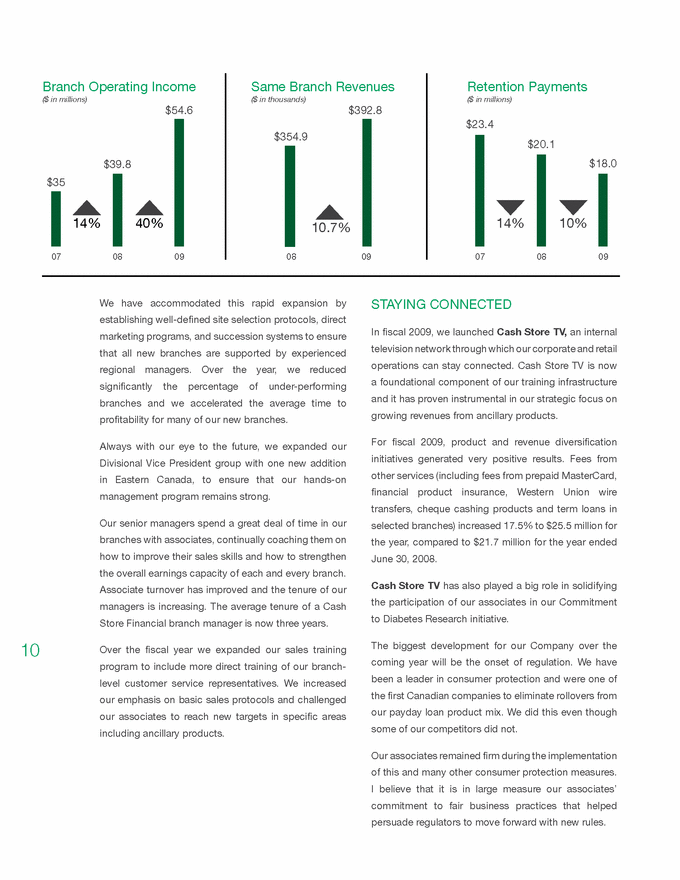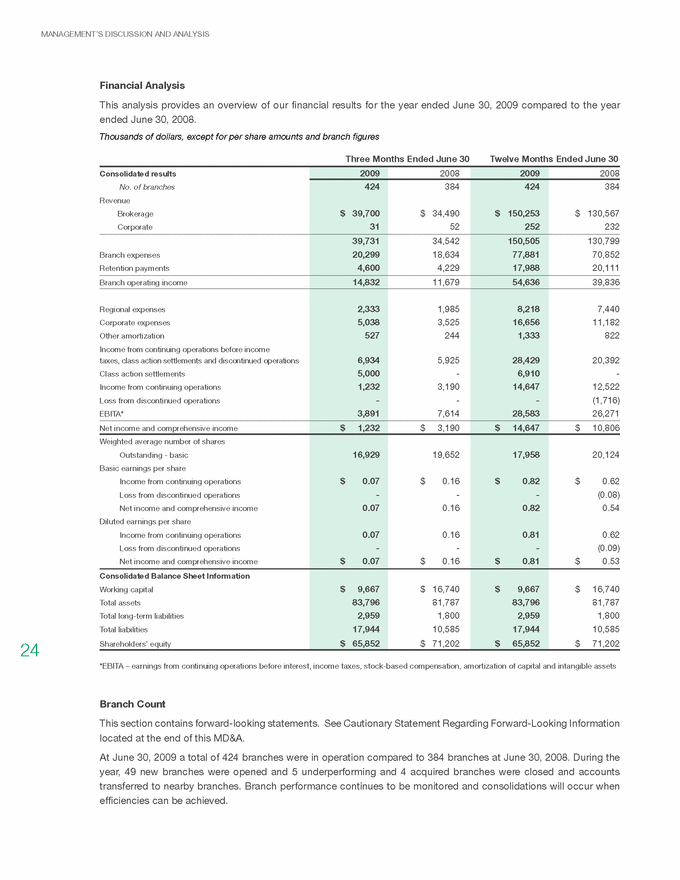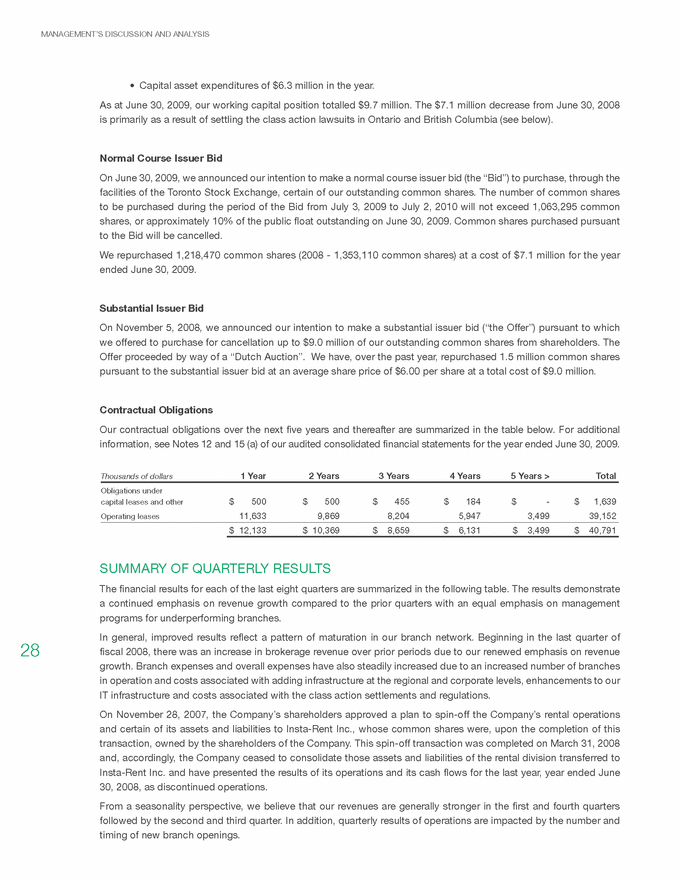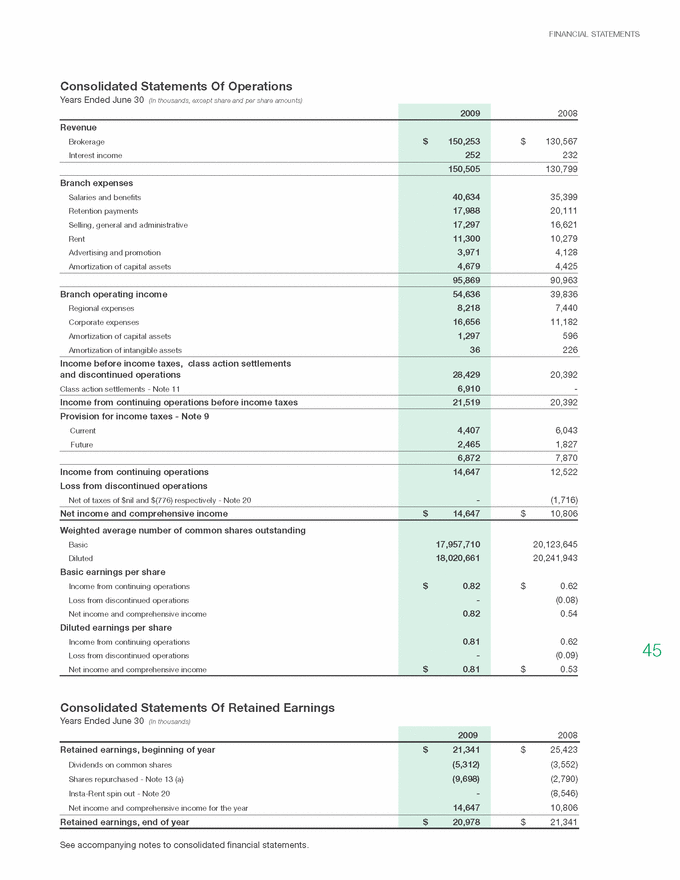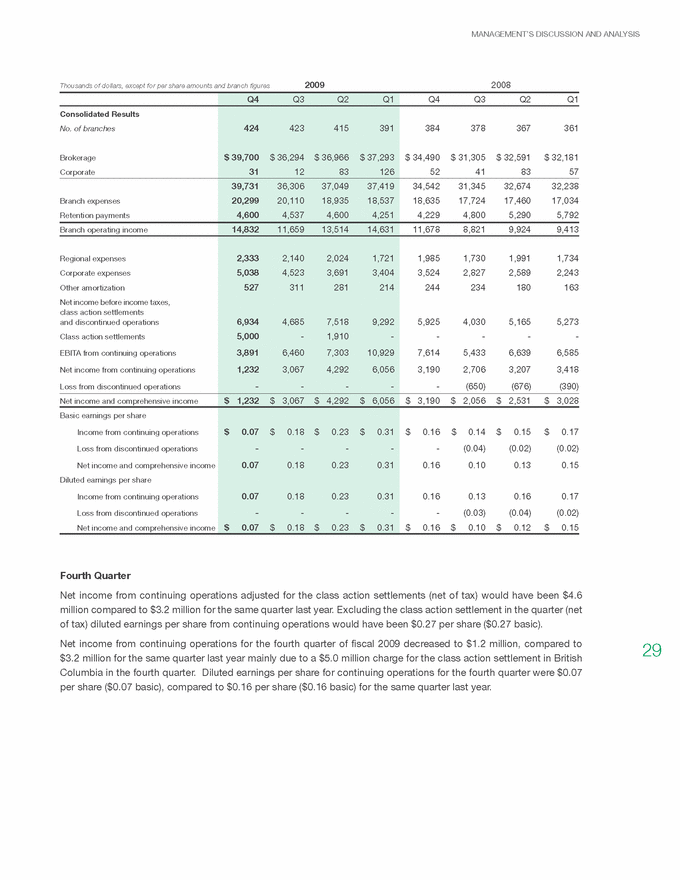
| MANAGEMENT’S DISCUSSION AND ANALYSIS 29 Fourth Quarter Net income from continuing operations adjusted for the class action settlements (net of tax) would have been $4.6 million compared to $3.2 million for the same quarter last year. Excluding the class action settlement in the quarter (net of tax) diluted earnings per share from continuing operations would have been $0.27 per share ($0.27 basic). Net income from continuing operations for the fourth quarter of fiscal 2009 decreased to $1.2 million, compared to $3.2 million for the same quarter last year mainly due to a $5.0 million charge for the class action settlement in British Columbia in the fourth quarter. Diluted earnings per share for continuing operations for the fourth quarter were $0.07 per share ($0.07 basic), compared to $0.16 per share ($0.16 basic) for the same quarter last year. Thousands of dollars, except for per share amounts and branch figures 2009 2008 Q4 Q3 Q2 Q1 Q4 Q3 Q2 Q1 Consolidated Results No. of branches 424 423 415 391 384 378 367 361 Brokerage $ 39,700 $ 36,294 $ 36,966 $ 37,293 $ 34,490 $ 31,305 $ 32,591 $ 32,181 Corporate 31 12 83 126 52 41 83 57 39,731 36,306 37,049 37,419 34,542 31,345 32,674 32,238 Branch expenses 20,299 20,110 18,935 18,537 18,635 17,724 17,460 17,034 Retention payments 4,600 4,537 4,600 4,251 4,229 4,800 5,290 5,792 Branch operating income 14,832 11,659 13,514 14,631 11,678 8,821 9,924 9,413 Regional expenses 2,333 2,140 2,024 1,721 1,985 1,730 1,991 1,734 Corporate expenses 5,038 4,523 3,691 3,404 3,524 2,827 2,589 2,243 Other amortization 527 311 281 214 244 234 180 163 Net income before income taxes, class action settlements and discontinued operations 6,934 4,685 7,518 9,292 5,925 4,030 5,165 5,273 Class action settlements 5,000 - 1,910 - - - - - EBITA from continuing operations 3,891 6,460 7,303 10,929 7,614 5,433 6,639 6,585 Net income from continuing operations 1,232 3,067 4,292 6,056 3,190 2,706 3,207 3,418 Loss from discontinued operations - - - - - (650) (676) (390) Net income and comprehensive income $ 1,232 $ 3,067 $ 4,292 $ 6,056 $ 3,190 $ 2,056 $ 2,531 $ 3,028 Basic earnings per share Income from continuing operations $ 0.07 $ 0.18 $ 0.23 $ 0.31 $ 0.16 $ 0.14 $ 0.15 $ 0.17 Loss from discontinued operations - - - - - (0.04) (0.02) (0.02) Net income and comprehensive income 0.07 0.18 0.23 0.31 0.16 0.10 0.13 0.15 Diluted earnings per share Income from continuing operations 0.07 0.18 0.23 0.31 0.16 0.13 0.16 0.17 Loss from discontinued operations - - - - - (0.03) (0.04) (0.02) Net income and comprehensive income $ 0.07 $ 0.18 $ 0.23 $ 0.31 $ 0.16 $ 0.10 $ 0.12 $ 0.15 |


