UNITED STATES
SECURITIES AND EXCHANGE COMMISSION
Washington, D.C. 20549
FORM N-CSR
CERTIFIED SHAREHOLDER REPORT OF REGISTERED MANAGEMENT
INVESTMENT COMPANIES
Investment Company Act file number 811-22468
Ashmore Funds
(Exact name of registrant as specified in charter)
c/o Ashmore Investment Management Limited
61 Aldwych
London WC2B 4AE
England
(Address of principal executive offices) (Zip code)
Corporation Service Company
84 State Street
Boston, MA 20109
(Name and address of agent for service)
Registrant’s telephone number, including area code: 011-44-20-3077-6000
Date of fiscal year end: October 31
Date of reporting period: October 31, 2012
Item 1. Reports to Stockholders.
ASHMORE FUNDS
ANNUAL FINANCIAL STATEMENTS
October 31, 2012

(THIS PAGE INTENTIONALLY LEFT BLANK)
ASHMORE FUNDS
TABLE OF CONTENTS
This material is authorized for use only when preceded or accompanied by the current Ashmore Funds prospectuses. Investors should consider the investment objectives, risks, charges and expenses of these Funds carefully before investing. This and other information is contained in the Funds’ prospectus. Please read the prospectus carefully before you invest or send money.
A Fund’s past performance is not necessarily an indication of how the Fund will perform in the future.
An investment in a Fund is not a deposit of a bank and is not guaranteed or insured by the Federal Deposit Insurance Corporation or any other government agency. It is possible to lose money on investments in the Funds.
ASHMORE FUNDS
INVESTMENT MANAGERS REPORT
For the period November 1, 2011 to October 31, 2012
Overview
The period since last November has seen an expected degree of volatility across investment markets due to the on-going European sovereign debt crisis and lingering concerns about the speed of the recovery in the United States.
Despite what the price action may otherwise indicate, we still believe that fundamentals across Emerging Markets generally, both at the sovereign and corporate level, are strong. Growth remains robust in both absolute terms (around 5% to 6%) and more certainly in relative terms compared to developed markets, which continue to flirt with dips back into technical recessions.
In late 2011, the market experienced a moderate sell-off that was driven by concerns about U.S. growth and European sovereigns, which materially weighted on global risk sentiment. During this period, concerns about Greece were at the forefront, due to political posturing, including a decision by the German Constitutional Court, which had to rule on Germany’s ability to participate in the Greek bailout after German opposition members questioned the legality of Germany’s contribution to the broader EU bailout scheme. The uncertainty created by the European debate led many investors to de-risk in the event of a tail-risk scenario that could see multiple European countries – in particular the larger ones like Spain or Italy—require a bailout. Market participants eagerly awaited policy intervention and the absence of any decisive action led to increased selling pressure. During this period, the underlying fundamentals across Emerging Markets did not materially deteriorate to a level that justified the drop in most asset prices. In fact, it was during the 4th quarter of 2011 that Ashmore took advantage of mispriced securities to lock-in attractive entry points and position portfolios for the eventual rebound, which came in the 1st quarter of 2012.
During the last week of December, the market began to turn following an announcement by the European Central Bank (“ECB”) to provide nearly €500 billion in Long Term Refinancing Operation (“LTRO”) financing to Eurozone banks. The LTRO programme is meant to provide banks in the Eurozone with cheap financing at 1% and allow these banks to not only shore up their own capital situations, but also pass this liquidity to borrowers across the Eurozone to stimulate economic activity. The ECB action preceded upbeat U.S. economic data, which further brought investors back to the markets. In January alone, all major Emerging Market indices were up strongly, led by local currency debt, which jumped nearly 7.5% (based on JP Morgan GBI EM Global Diversified index). Strong performance continued into February, but ran out of steam in March as investors locked in gains, believing that the market had gotten a bit ahead of itself and re-focusing on problems in Europe, which still included some fairly negative tail risk scenarios.
We arrived at the end of September having had the acute European tail risks (principally Spain and Italy) largely mitigated by the ECB’s announcement to effectively buy sovereign debt to keep borrowing rates below danger levels and positive movement in Greece. In the U.S. QE3 was announced, this time aimed at the beleaguered real estate market with the US Fed looking to buy mortgage backed securities, which seeks to both keep low mortgage rates anchored, but also remove some of the troubled assets off the books of financial institutions. Emerging Market fundamentals continue to look attractive and growth has picked up across some of the larger countries that suffered through the drop in mid to late 2011, such as China and Brazil.
Our outlook for Emerging Markets is constructive, with many assets among the main asset classes priced below our assessment of intrinsic value and, on a risk basis, we believe still offering superior fundamentals with the added benefit of higher yields or in the case of equities, better company profiles given the market consensus view on future growth expectations across the Emerging World.
2
ASHMORE FUNDS
INVESTMENT MANAGERS REPORT (CONTINUED)
Portfolio Overview
Ashmore Emerging Markets Corporate Debt Fund
The Ashmore Emerging Markets Corporate Debt Fund (“the Fund”) seeks to achieve its objective by investing principally in debt instruments of corporate issuers, which may be denominated in any currency, including the local currency of the issuer. Emerging Market Corporates operate in an environment that typically consists of higher growth and maturing capital markets. Increased “south/south” trade (a.k.a. trade among other Emerging Market countries as opposed to trade with Developed Markets) has also been a material structural change for Emerging Market Corporates and has helped them to broaden their customer base. In most cases, Emerging Market Corporates are characterised by new and growing businesses in industries such as mobile communications, technology and food production. These industries are the ones which will reap larger rewards from the developing economies in which they operate. Ashmore continues to focus its efforts on companies that are less followed by the market and thus allow for us to add maximum value based on our views, research and global Emerging Market network capabilities. Over the period, the fund produced attractive returns, which were due to a combination of spread compression resulting from a general willingness of investors to acquire Emerging Market corporate debt as well as attractive coupons, which have had the combined effect of not only boosting total returns, but also cushioning the impact of market sell-offs. We are highly constructive on the outlook for Emerging Market Corporate Debt, which is the largest growing part of the Emerging Market debt universe.
Ashmore Emerging Markets Local Currency Bond Fund
The Ashmore Emerging Markets Local Currency Bond Fund (“the Fund”) seeks to achieve its objective by investing principally in debt instruments of Sovereign and Quasi-Sovereign issuers of Emerging Market Countries that are denominated in the local currency of the issuer. Returns for the Fund are driven by Emerging Market currency appreciation, interest rate positioning and credit worthiness. Our outlook for Emerging Market currencies remains unchanged in that we expect that the medium to long term trend will be a gradual appreciation of Emerging Market currencies relative to developed market currencies – namely the US dollar. Not only are Emerging Market currencies supported by stronger growth, more robust fundaments and higher interest rates compared to developed markets, but it is also likely that a gradual depreciation of developed market currencies will be one mechanism by which developed markets will de-leverage and reduce their enormous debt burdens. In terms of the bonds, we continue to find attractive opportunities across Emerging Market countries. Increasingly, Emerging Market monetary policymakers are acting in idiosyncratic fashion subject to their own domestic needs. This requires local expertise to understand the dynamics that drive local decision-making. Among the Fund’s top contributors in the period, we saw strong gains out of our positions in China, which have generally been linked to the homebuilding sector. The expected recovery in Chinese growth has seen bond prices for these instruments bid higher. Our off-benchmark in the UAE was a strong contributor as well, where a local port operator made a full repayment of their sukuk bonds.
Ashmore Emerging Markets Local Currency Fund
The Ashmore Emerging Markets Local Currency Fund (“the Fund”) seeks to achieve its objective by investing principally in derivatives and other instruments that mature in less than one year (“short-dated instruments”) and provide investment exposure to local currencies of Emerging Market Countries. The Fund also has the flexibility to invest in longer-dated derivative instruments. The Fund may also invest in debt instruments of any maturity issued by Sovereigns and Quasi-Sovereigns and denominated in the local currency of the issuer. Consistent with our outlook for local currency bonds, we are looking for Emerging Market currencies to grind higher relative to the US dollar over the medium term. The current environment continues to reflect the better fiscal and growth picture across Emerging Markets compared to developed markets. Putting aside periods of market dislocations, when positioning tends to be based more on technical and emotional factors, rather than fundamentals, a focus on the real drivers of long-term currency performance, relative interest rates and growth are clearly in favour of Emerging Markets. The deleveraging process is perhaps halfway completed across the developed world. On a sovereign level, the heavy debt burdens of developed market countries are clear – no more so than in the United States, which seems to continually bump up against its multi-trillion dollar debt ceiling. In our view, the safe haven for currency investors is in a basket of Emerging Market currencies, which not only offers superior
3
ASHMORE FUNDS
INVESTMENT MANAGERS REPORT (CONTINUED)
diversification, but also allows the manager to invest in currencies that we believe are best positioned to benefit from positive domestic and regional trends that should push currency prices higher. The best performing currencies have been the rouble and the Mexican peso. The rouble has benefitted from a strong domestic economy and higher oil prices, while the peso gains have been more tactical, given some larger swings in the currency this year on account of risk appetite and U.S.-related events.
Ashmore Emerging Markets Sovereign Debt Fund
The Ashmore Emerging Markets Sovereign Debt Fund (“the Fund”) seeks to achieve its objective by investing principally in debt instruments of Sovereign and Quasi-Sovereign issuers of Emerging Market Countries that are denominated in any Hard Currency. Historically, Emerging Markets Sovereign debt has typically been the most developed, stable, and least risky asset class in Emerging Market fixed income. Given the strong policy responses by the ECB and the US Fed in 2012, hard currency assets have performed particularly well in Emerging Markets over the period. It is clear that international investors are much more comfortable making the jump from domestic bonds to Emerging Market bonds, when they are denominated in hard currency. The relative strength of Emerging Market issuers to developed markets and the attractive pick-up in yield has seen hard currency sovereign debt instruments bid up strongly over the year. Among the Fund’s best performing positions, Russia and Venezuela were standouts. The Russian economy has performed well during the course of the year buoyed by robust consumer spending, a pick-up in industrial production and improved political outlook after some tense months in late 2011. The rise in oil prices has also helped on the fiscal side. The Russian economy held up quite well in the challenging second quarter of the year. The Fund’s gains in Venezuela were driven almost entirely by the prospect of a Chavez loss in the presidential election in October. A change in government would have been welcome by investors as a chance to bring discipline to the government’s finances and potentially generate renewed interest by international investors, who have been chased off by Chavez’s nationalistic rhetoric and seizures. When it became clear that Chavez would win yet again, the bonds sold off. Ashmore had gone into the election with a lighter position than it did earlier on as the potential upside did not outweigh the downside and thus we re-allocated assets among other more attractive securities. Overall, the performance was solidly positive and those investors who held their nerve were rewarded for their patience during the period.
Ashmore Emerging Markets Total Return Fund
The Ashmore Emerging Markets Total Return Fund (“the Fund”) seeks to achieve its objective by investing principally in debt instruments of Sovereign, Quasi-Sovereign, and Corporate issuers, which may be denominated in any currency, including the local currency of the issuer. The Fund tactically allocates assets between external debt, corporate debt and local currency. We have seen over the period sharp swings in investors risk perception due to the European sovereign debt crisis and concerns over U.S. growth. For example, the exuberance of investors early in the 1st quarter of 2012 abruptly gave way to risk aversion in toward the end of March, which pushed us into a market correction that lasted until the ECB announced that it would engage in open-ended purchases of European sovereign debt to keep lending rates manageable. The three main themes in the Total Return Fund have performed differently during the ebbs and flows of risk appetite over the period. Hard currency assets have been the best performers, owning to their hard currency denomination and credit risk profiles. Although during periods of market downturns investors have preferred to seek the safety of assets and currencies they know best (US Treasuries and the US dollar for the most part), the reality is that investors realise that not only does Emerging Market sovereign debt represent a sensible trade from a credit standpoint, but the yield is multiples higher compared to developed market sovereign debt. Thus, Emerging Market sovereign debt not only saw appreciation this year due to favourable demand during periods of market stress, but also saw strong investor participation during bull market periods, where investors were more inclined to look for returns beyond their borders. Local currency has been a more tactical allocation. Given its strong liquidity profile, Emerging Market currencies are a quick way for investors to express a global risk view. We have seen sharp rises followed by sharp declines in EM currencies. The overall effect has been a positive return, but due to the volatility, we have managed our exposures more tactically. Corporate Debt has been the main alpha position in our asset allocation. Looking ahead, we are strategically bullish on the asset class and have taken opportunities to add exposure when prices come off. The Fund’s ability to moderate its allocations among these three themes has been a key way in which we have been able to manage the downside risk and maximise longer-term appreciation potential. The largest contributors to performance in the period were from positions in Brazil and Mexico. In the case of the former, gains were made across asset classes, with local currency contributing the most on our local currency
4
ASHMORE FUNDS
INVESTMENT MANAGERS REPORT (CONTINUED)
bond exposure and active management of the tightly controlled USD/BRL rate. In Mexico, performance was driven by our corporate debt positions and in local currency, where the peso has been volatile over the period with large gains in early and late 2012, with a moderate correction from April to June.
Ashmore Emerging Markets Equity Fund
The Ashmore Emerging Markets Equity Fund, launched on June 22, 2011, seeks to achieve its objective by investing principally in equity securities and equity-related investments of Emerging Market Issuers, which may be denominated in any currency, including the local currency of the issuer. The MSCI Emerging Markets Index (Net) returned 2.6% in USD terms for the year ending October 2012.
Performance was mixed on a country and regional basis. Egypt and Turkey were the top performing markets. The Fund’s overweight positions in China and South Korea, and the underweights in Chile and South Africa added relative value. Brazil and Russia were among the detractors over the period. In terms of regions, Asia, the Philippines, Thailand, India and China outperformed. In Latin America, Colombia and Mexico also delivered strong returns, while Brazil’s returns lagged as the government continued its interventionist policies. Stock selection in Mexico, India and China delivered the best relative performance. Cemex in Mexico outperformed for the period, and in India, Strides Arcolab, and industrial conglomerate Jaiprakash Associates were amongst the top performers.
We believe the recovery, which began this summer, is likely to continue as emerging economies take action to support domestic growth. Emerging markets continue to provide attractive investment opportunities, with the MSCI EM index trading at 10.9x 2013 earnings (as of October 31) according to our estimates. China, South Korea and Russia continue to offer some of the most attractive valuations, at 8.9x, 8.4x, and 5.9x 2013 earnings respectively while offering a Price to Book Value of 1.5x, 1.1x and 0.8x, compared to an index level of 1.8x (according to our estimates, as of October 31).
Ashmore Emerging Markets Small-Cap Equity Fund
The Ashmore Emerging Markets Small-Cap Equity Fund, launched on October 4, 2011, seeks to achieve its objective by investing principally in equity securities and equity-related investments of Small-Capitalization Emerging Market Issuers, which may be denominated in any currency, including the local currency of the issuer. The MSCI Emerging Markets Small Cap Index (Net) returned 3.7% in USD terms for the one year ending October 2012.
Egypt and Turkey were top performing markets. In Asia, Thailand, the Philippines and India delivered the strongest return. In Latin America, Mexico and Peru delivered the strongest returns. Russia and the Czech Republic lagged the rest of the markets.
The Fund outperformed the benchmark during the period. Stock selection added value, particularly in South Korea. South Korean tour operators did well this quarter, including Hana Tour Service and Modetour network, which have seen a significant pickup in Chinese tourism since the geopolitical issues between China and Japan have risen. In addition, stock selection in Thailand added value. On the negative side, stock selection in Mexico and Malaysia detracted from performance. Overall, the portfolio’s underweight in materials and health care added to relative returns.
We believe the recovery, which began this summer, is likely to continue as emerging economies take action to support domestic growth. Emerging markets continue to offer attractive investment opportunities, with the MSCI EM Small Cap Index trading at 10.4x 2013 earnings and a Price/Book Value of 1.2x according to consensus estimates (as of October 31).
5
IMPORTANT INFORMATION ABOUT THE FUNDS
Ashmore Investment Management Limited
This commentary may include statements that constitute “forward-looking statements” under the U.S. securities laws. Forward-looking statements include, among other things, projections, estimates, and information about possible or future results related to the Funds and market or regulatory developments. The views expressed above are not guarantees of future performance or economic results and involve certain risks, uncertainties and assumptions that could cause actual outcomes and results to differ materially from the views expressed herein. The views expressed above are those of Ashmore Investment Management Limited as of the date indicated and are subject to change at any time based upon economic, market, or other conditions and Ashmore Investment Management Limited undertakes no obligation to update the views expressed herein. Any discussions of specific securities or markets should not be considered a recommendation to buy or sell or invest in those securities or markets. The views expressed above may not be relied upon as investment advice or as an indication of the Funds’ trading intent. Information about the Funds’ holdings, asset allocation or country diversification is historical and is not an indication of future portfolio composition, which may vary. Direct investment in any index is not possible. The performance of any index mentioned in this commentary has not been adjusted for ongoing management, distribution and operating expenses applicable to mutual fund investments. In addition, the returns do not reflect certain charges that an investor in the Funds may pay. If these additional fees were reflected, the performance shown would have been lower.
The following disclosure provides important information regarding each Fund’s Average Annual Total Return table and Cumulative Returns chart, which appears on each Fund’s individual page in this report (the “Shareholder Report” or “Report”). Please refer to this information when reviewing the table and chart for a Fund.
On each individual Fund Summary page in this Report, the Average Annual Total Return table and Cumulative Returns chart measure performance assuming that all dividend and capital gain distributions were reinvested. Returns do not reflect the deduction of taxes that a shareholder would pay on (i) Fund distributions or (ii) the redemption of Fund shares. The Cumulative Returns Chart reflects only Institutional Class performance. Performance for Class A and Class C shares is typically lower than Institutional Class performance due to the lower expenses paid by Institutional Class shares. Except for the load-waived performance for the Class A and C shares of each Fund (as applicable), performance shown is net of fees and expenses. The load-waived performance for Class A and Class C shares does not reflect the sales charges shareholders of those classes may pay in connection with a purchase or redemption of Class A and Class C shares. The load-waived performance of those share classes is relevant only to shareholders who purchased Class A or Class C shares on a load-waived basis. The figures in the line graph are calculated at net asset value and assume the investment of $1,000,000 at the beginning of the first full month following the inception of the Institutional Class. Each Fund measures its performance against a broad-based securities market index (“benchmark index”). Each benchmark index does not take into account fees, expenses or taxes.
For periods prior to the inception date of the Class A and Class C shares (if applicable), performance information shown is based on the performance of the Fund’s Institutional Class shares, adjusted to reflect the distribution and/or service fees and other expenses paid by the Class A and Class C shares, respectively.
A Fund’s past performance, before and after taxes, is not necessarily an indication of how the Fund will perform in the future.
An investment in a Fund is not a deposit of a bank and is not guaranteed or insured by the Federal Deposit Insurance Corporation or any other government agency. It is possible to lose money on investments in the Funds.
6
IMPORTANT INFORMATION ABOUT THE FUNDS (CONTINUED)
The following disclosure provides important information regarding each Fund’s Expense Example, which appears on each Fund’s individual page in this Shareholder Report. Please refer to this information when reviewing the Expense Example for a Fund.
EXPENSE EXAMPLE
Fund Expenses
As a shareholder of the Funds, you incur two types of costs: (1) transaction costs, including sales charges (loads) on purchase payments; redemption fees; and exchange fees; and (2) ongoing costs, including management fees; distribution (12b-1) fees; and other Fund expenses. This Example is intended to help you understand your ongoing costs (in dollars) of investing in the Funds and to compare these costs with the ongoing costs of investing in other mutual funds. The Example is based on an investment of $1,000 invested at the beginning of the period and held for the entire period, from May 1, 2012 or the inception date (if later), through to October 31, 2012.
Actual Expenses
The information in the table under the heading “Actual Performance” provides information based on actual performance and actual expenses. You may use the information in these columns, together with the amount you invested, to estimate the expenses that you paid over the period. Simply divide your account value by $1,000 (for example, an $8,600 account value divided by $1,000 = $8.60), then multiply the result by the number in the appropriate column for your share class, in the row titled “Expenses Paid” to estimate the expenses you paid on your account during this period.
Hypothetical Example for Comparison Purposes
The information in the table under the heading “Hypothetical Performance” provides information about hypothetical account values and hypothetical expenses based on the Fund’s actual expense ratio and an assumed rate of return of 5% per year before expenses, which is not the Fund’s actual return. The hypothetical account values and expenses may not be used to estimate the actual ending account balance or expenses you paid for the period. You may use this information to compare the ongoing costs of investing in the Fund and other funds. To do so, compare this 5% hypothetical example with the 5% hypothetical examples that appear in the shareholder reports of the other funds.
Please note that the expenses shown in the table are meant to highlight your ongoing costs only and do not reflect any transactional costs, such as sales charges (loads), redemption fees, or exchange fees. Therefore, the information under the heading “Hypothetical Performance” is useful in comparing ongoing costs only, and will not help you determine the relative total costs of owning different funds. In addition, if these transactional costs were included, your costs would have been higher.
7
Ashmore Emerging Markets Corporate Debt Fund
Ashmore Emerging Markets Corporate Debt Fund is an open-end U.S. mutual fund. The Fund seeks to achieve its objective by investing principally in debt instruments of Corporate issuers, which may be denominated in any currency, including the local currency of the issuer.
Please refer to page 6 herein for an explanation of the information presented below in the Average Annual Total Return Table and Cumulative Return chart.
| | | | | | |
| | | |
Average Annual Total Return For The Period Ended October 31, 2012 | | 6 Months | | 1 Year | | Since Inception¹ |
| | | |
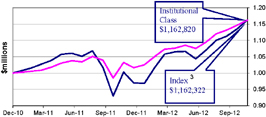
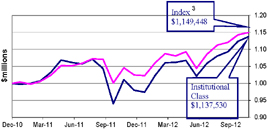
Ashmore Emerging Markets Corporate Debt Fund Institutional Class1 | | 9.05% | | 15.97% | | 8.28% |
| | | |
Ashmore Emerging Markets Corporate Debt Fund Retail Class A (load-waived)1 | | 8.79% | | 15.54% | | 7.99% |
| | | |
Ashmore Emerging Markets Corporate Debt Fund Retail Class A (unadjusted)1,2 | | 4.45% | | 10.94% | | 5.70% |
| | | |
Ashmore Emerging Markets Corporate Debt Fund Retail Class C (load-waived)1 | | 8.46% | | 14.78% | | 7.23% |
| | | |
Ashmore Emerging Markets Corporate Debt Fund Retail Class C (unadjusted)1,2 | | 7.46% | | 13.78% | | 7.23% |
| | | |
JP Morgan CEMBI BD3 | | 7.10% | | 12.60% | | 8.24% |
| | | | | | |
| | |
| Cumulative Returns Through October 31, 2012 (% of NAV) | | | | Top 5 Country Exposures (% of NAV) |
| | | | Russia | | 12.42% |
| | | | Mexico | | 11.37% |
| | | | China | | 10.82% |
| | | | United Arab Emirates | | 8.72% |
| | | | Brazil | | 5.67% |
| | | | Source: Ashmore. Top 5 country exposure based on aggregate allocation to investment instruments related to countries shown above. As of October 31, 2012 |
$1,000,000 invested at the beginning of the first full month following the inception of the Institutional Class. The minimum initial investment amount for Institutional Class Shares is $1,000,000. The minimum initial investment amount for Retail Shares Classes A and C is $1,000.
All Fund returns are net of fees and expenses, except for the load-waived return information for Class A and Class C shares. Performance calculations assume that all dividend, capital gain and other distributions were reinvested.
1 For periods prior to the inception date of the Class A and Class C shares (05/12/2011), performance information shown is based on the performance of the Fund’s Institutional Class shares (12/08/2010), adjusted to reflect the distribution and/or service fees and other expenses paid by the Class A and Class C shares, respectively.
2 Unadjusted Performance accounts for a maximum sales load of 4% for Class A shares and maximum deferred sales charge of 1% for the 6 months and 1 year returns for the Class C shares.
3 The index for the Fund is the JP Morgan Corporate Emerging Markets Bond Index Broad Diversified.
Past performance does not guarantee future results. The performance data quoted represents past performance and current returns may be lower or higher. The investment return and net asset value will fluctuate so that an investor’s shares, when redeemed, may be worth more or less than the original cost. To obtain performance information current to the most recent month-end, please visit www.ashmoregroup.com. Periods greater than one year are annualized. Changes in rates of exchange between currencies may cause the value of investments to decrease or increase. The Fund’s performance will fluctuate over long and short term periods.
Please refer to page 7 herein for an explanation of the Expense Example information presented below.
| | | | | | | | | | | | |
| |
| | | Expense Example |
| | | Actual Performance | | Hypothetical Performance |
| | | Institutional
Class | | Class A | | Class C | | Institutional
Class | | Class A | | Class C |
Beginning Account Value
(05/01/2012) | | $1,000.00 | | $1,000.00 | | $1,000.00 | | $1,000.00 | | $1,000.00 | | $1,000.00 |
Ending Account Value
(10/31/2012) | | $1,090.50 | | $1,087.90 | | $1,084.60 | | $1,019.25 | | $1,017.85 | | $1,014.08 |
Expense Ratio | | 1.17% | | 1.45% | | 2.20% | | 1.17% | | 1.45% | | 2.20% |
Expenses Paid† | | $6.15 | | $7.61 | | $11.53 | | $5.94 | | $7.35 | | $11.14 |
† Expenses are equal to the Fund’s annualized expense ratio multiplied by the average account value over the period, multiplied by 184/366 (to reflect the one-half year period). Hypothetical expenses are based on the Fund’s actual annualized expense ratios and assumed rate of 5 percent per year before expenses.
Unaudited
|
Share Class |
| Information |
|
Institutional Class |
|
Launch Date: |
December 8, 2010 |
|
Minimum Initial Investment: |
$1,000,000 |
|
ISIN: |
US044825049 |
|
CUSIP: |
044820504 |
|
BLOOMBERG: |
EMCIX US |
|
TICKER: |
EMCIX |
|
Retail Class A |
|
Launch Date: |
May 12, 2011 |
|
Minimum Initial Investment: |
$1,000 |
|
ISIN: |
US0448206039 |
|
CUSIP: |
044820603 |
|
BLOOMBERG: |
ECDAX US |
|
TICKER: |
ECDAX |
|
Retail Class C |
|
Launch Date: |
May 12, 2011 |
|
Minimum Initial Investment: |
$1,000 |
|
ISIN: |
US0448207029 |
|
CUSIP: |
044820702 |
|
BLOOMBERG: |
ECDCX US |
|
TICKER: |
ECDCX |
|
All sources are Ashmore unless otherwise indicated |
8
Ashmore Emerging Markets Local Currency Bond Fund
Ashmore Emerging Markets Local Currency Bond Fund is an open-end U.S. mutual fund. The Fund seeks to achieve its objective by investing principally in debt instruments of Sovereign and Quasi-Sovereign issuers of Emerging Market Countries that are denominated in the local currency of the issuer.
Please refer to page 6 herein for an explanation of the information presented below in the Average Annual Total Return Table and Cumulative Return chart.
| | | | | | |
| | | |
Average Annual Total Return For The Period Ended October 31, 2012 | | 6 Months | | 1 Year | | Since Inception¹ |
| | | |
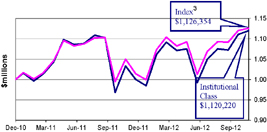
Ashmore Emerging Markets Local Currency Bond Fund Institutional Class1 | | 4.16% | | 8.39% | | 6.17% |
| | | |
Ashmore Emerging Markets Local Currency Bond Fund Retail Class A (load-waived)1 | | 3.88% | | 8.02% | | 5.88% |
| | | |
Ashmore Emerging Markets Local Currency Bond Fund Retail Class A (unadjusted)1,2 | | -0.27% | | 3.70% | | 3.63% |
| | | |
Ashmore Emerging Markets Local Currency Bond Fund Retail Class C (load-waived)1 | | 3.60% | | 7.33% | | 5.11% |
| | | |
Ashmore Emerging Markets Local Currency Bond Fund Retail Class C (unadjusted)1,2 | | 2.60% | | 6.33% | | 5.11% |
| | | |
JP Morgan GBI-EM GD3 | | 3.08% | | 7.25% | | 6.47% |
| | | | | | |
| | |
| Cumulative Returns Through October 31, 2012 (% of net assets) | | | | Top 5 Country Exposures (% of NAV) |
| | | | Poland | | 16.99% |
| | | | Mexico | | 14.82% |
| | | | Russia | | 14.70% |
| | | | Brazil | | 10.36% |
| | | | Turkey | | 10.16% |
| | | | Source: Ashmore. Top 5 country exposure based on aggregate allocation to investment instruments related to countries shown above. As of October 31, 2012 |
$1,000,000 invested at the beginning of the first full month following the inception of the Institutional Class. The minimum initial investment amount for Institutional Class Shares is $1,000,000. The minimum initial investment amount for Retail Shares Classes A and C is $1,000.
All Fund returns are net of fees and expenses, except for the load-waived return information for Class A and Class C shares. Performance calculations assume that all dividend, capital gain and other distributions were reinvested.
1 For periods prior to the inception date of the Class A and Class C shares (05/12/2011), performance information shown is based on the performance of the Fund’s Institutional Class shares (12/08/2010), adjusted to reflect the distribution and/or service fees and other expenses paid by the Class A and Class C shares, respectively.
2 Unadjusted Performance accounts for a maximum sales load of 4% for Class A shares and maximum deferred sales charge of 1% for the 6 months and 1 year returns for the Class C shares.
3 The index for the Fund is the JP Morgan Global Bond Index — Emerging Markets Global Diversified.
Past performance does not guarantee future results. The performance data quoted represents past performance and current returns may be lower or higher. The investment return and net asset value will fluctuate so that an investor’s shares, when redeemed, may be worth more or less than the original cost. To obtain performance information current to the most recent month-end, please visit www.ashmoregroup.com. Periods greater than one year are annualized. Changes in rates of exchange between currencies may cause the value of investments to decrease or increase. The Fund’s performance will fluctuate over long and short term periods.
Please refer to page 7 herein for an explanation of the Expense Example information presented below.
| | | | | | | | | | | | |
| |
| | | Expense Example |
| | | Actual Performance | | Hypothetical Performance |
| | | Institutional
Class | | Class A | | Class C | | Institutional
Class | | Class A | | Class C |
Beginning Account Value
(05/01/2012) | | $1,000.00 | | $1,000.00 | | $1,000.00 | | $1,000.00 | | $1,000.00 | | $1,000.00 |
Ending Account Value
(10/31/2012) | | $1,041.60 | | $1,038.80 | | $1,036.00 | | $1,020.26 | | $1,018.85 | | $1,015.08 |
Expense Ratio | | 0.97% | | 1.25% | | 2.00% | | 0.97% | | 1.25% | | 2.00% |
Expenses Paid† | | $4.98 | | $6.41 | | $10.24 | | $4.93 | | $6.34 | | $10.13 |
† Expenses are equal to the Fund’s annualized expense ratio multiplied by the average account value over the period, multiplied by 184/366 (to reflect the one-half year period). Hypothetical expenses are based on the Fund’s actual annualized expense ratios and assumed rate of 5 percent per year before expenses.
Unaudited
|
Share Class |
| Information |
|
Institutional Class |
|
Launch Date: |
December 8, 2010 |
|
Minimum Initial Investment: |
$1,000,000 |
|
ISIN: |
US0448202079 |
|
CUSIP: |
044820207 |
|
BLOOMBERG: |
ELBIX US |
|
TICKER: |
ELBIX |
|
Retail Class A |
|
Launch Date: |
May 12, 2011 |
|
Minimum Initial Investment: |
$1,000 |
|
ISIN: |
US0448208761 |
|
CUSIP: |
044820876 |
|
BLOOMBERG: |
ELBAX US |
|
TICKER: |
ELBAX |
|
Retail Class C |
|
Launch Date: |
May 12, 2011 |
|
Minimum Initial Investment: |
$1,000 |
|
ISIN: |
US0448208688 |
|
CUSIP: |
044820868 |
|
BLOOMBERG: |
ELBCX US |
|
TICKER: |
ELBCX |
|
All sources are Ashmore unless otherwise indicated |
9
Ashmore Emerging Markets Local Currency Fund
Ashmore Emerging Markets Local Currency Fund is an open-end U.S. mutual fund. The Fund seeks to achieve its objective by investing principally in derivatives and other instruments that mature in less than one year (“short-dated instruments”) and provide investment exposure to local currencies of Emerging Market Countries. The Fund also has the flexibility to invest in longer-dated derivative instruments. The Fund may also invest in debt instruments of any maturity issued by Sovereigns and Quasi-Sovereigns and denominated in the local currency of the issuer.
Please refer to page 6 herein for an explanation of the information presented below in the Average Annual Total Return Table and Cumulative Return chart.
| | | | | | |
| | | |
Average Annual Total Return For The Period Ended October 31, 2012 | | 6 Months | | 1 Year | | Since Inception¹ |
| | | |
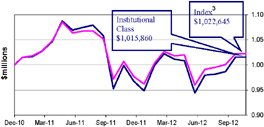
Ashmore Emerging Markets Local Currency Fund Institutional Class1 | | 0.74% | | 1.71% | | 0.83% |
| | | |
Ashmore Emerging Markets Local Currency Fund Retail Class A (load-waived)1 | | 0.74% | | 1.50% | | 0.49% |
| | | |
Ashmore Emerging Markets Local Currency Fund Retail Class A (unadjusted)1,2 | | -3.29% | | -2.56% | | -1.65% |
| | | |
Ashmore Emerging Markets Local Currency Fund Retail Class C (load-waived)1 | | 0.32% | | 0.77% | | -0.21% |
| | | |
Ashmore Emerging Markets Local Currency Fund Retail Class C (unadjusted)1,2 | | -0.68% | | -0.23% | | -0.21% |
| | | |
JP Morgan ELMI+3 | | 0.26% | | 1.55% | | 1.19% |
| | | | | | |
| | |
| Cumulative Returns Through October 31, 2012 (% of net asset) | | | | Top 5 Country Exposures (% of NAV) |
| | | | Russia | | 14.00% |
| | | | Mexico | | 12.62% |
| | | | Poland | | 11.73% |
| | | | China | | 10.32% |
| | | | India | | 10.27% |
| | | | Source: Ashmore. Top 5 country exposure based on aggregate allocation to investment instruments related to countries shown above. As of October 31, 2012 |
$1,000,000 invested at the beginning of the first full month following the inception of the Institutional Class. The minimum initial investment amount for Institutional Class Shares is $1,000,000. The minimum initial investment amount for Retail Shares Classes A and C is $1,000.
All Fund returns are net of fees and expenses, except for the load-waived return information for Class A and Class C shares. Performance calculations assume that all dividend, capital gain and other distributions were reinvested.
1 For periods prior to the inception date of the Class A and Class C shares (05/12/2011), performance information shown is based on the performance of the Fund’s Institutional Class shares (12/08/2010), adjusted to reflect the distribution and/or service fees and other expenses paid by the Class A and Class C shares, respectively.
2 Unadjusted Performance accounts for a maximum sales load of 4% for Class A shares and maximum deferred sales charge of 1% for the 6 months and 1 year returns for the Class C shares.
3 The index for the Fund is the JP Morgan Emerging Local Markets Index Plus.
Past performance does not guarantee future results. The performance data quoted represents past performance and current returns may be lower or higher. The investment return and net asset value will fluctuate so that an investor’s shares, when redeemed, may be worth more or less than the original cost. To obtain performance information current to the most recent month-end, please visit www.ashmoregroup.com. Periods greater than one year are annualized. Changes in rates of exchange between currencies may cause the value of investments to decrease or increase. The Fund’s performance will fluctuate over long and short term periods.
Please refer to page 7 herein for an explanation of the Expense Example information presented below.
| | | | | | | | | | | | |
| |
| | | Expense Example |
| | | Actual Performance | | Hypothetical Performance |
| | | Institutional
Class | | Class A | | Class C | | Institutional
Class | | Class A | | Class C |
Beginning Account Value
(05/01/2012) | | $1,000.00 | | $1,000.00 | | $1,000.00 | | $1,000.00 | | $1,000.00 | | $1,000.00 |
Ending Account Value
(10/31/2012) | | $1,007.40 | | $1,007.40 | | $1,003.20 | | $1,020.76 | | $1,019.41 | | $1,015.58 |
Expense Ratio | | 0.87% | | 1.15% | | 1.90% | | 0.87% | | 1.15% | | 1.90% |
Expenses Paid† | | $4.39 | | $5.80 | | $9.57 | | $4.42 | | $5.85 | | $9.63 |
† Expenses are equal to the Fund’s annualized expense ratio multiplied by the average account value over the period, multiplied by 184/366 (to reflect the one-half year period). Hypothetical expenses are based on the Fund’s actual annualized expense ratios and assumed rate of 5 percent per year before expenses.
Unaudited
|
Share Class |
| Information |
|
Institutional Class |
|
Launch Date: |
December 8, 2010 |
|
Minimum Initial Investment: |
$1,000,000 |
|
ISIN: |
US0448201089 |
|
CUSIP: |
044820108 |
|
BLOOMBERG: |
ECYIX US |
|
TICKER: |
ECYIX |
|
Retail Class A |
|
Launch Date: |
May 12, 2011 |
|
Minimum Initial Investment: |
$1,000 |
|
ISIN: |
US0448208019 |
|
CUSIP: |
044820801 |
|
BLOOMBERG: |
ECYAX US |
|
TICKER: |
ECYAX |
|
Retail Class C |
|
Launch Date: |
May 12, 2011 |
|
Minimum Initial Investment: |
$1,000 |
|
ISIN: |
US0448208845 |
|
CUSIP: |
044820884 |
|
BLOOMBERG: |
ECYCX US |
|
TICKER: |
ECYCX |
|
All sources are Ashmore unless otherwise indicated |
10
Ashmore Emerging Markets Sovereign Debt Fund
The Ashmore Emerging Markets Sovereign Debt Fund is an open-end U.S. mutual fund. The Fund seeks to achieve its objective by investing principally in debt instruments of Sovereign and Quasi-Sovereign issuers of Emerging Market Countries that are denominated in any Hard Currency.
Please refer to page 6 herein for an explanation of the information presented below in the Average Annual Total Return Table and Cumulative Return chart.
| | | | | | |
| | | |
Average Annual Total Return For The Period Ended October 31, 2012 | | 6 Months | | 1 Year | | Since Inception¹ |
| | | |
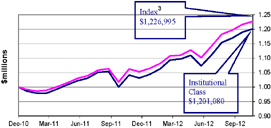
Ashmore Emerging Markets Sovereign Debt Fund Institutional Class1 | | 8.26% | | 15.32% | | 10.15% |
| | | |
Ashmore Emerging Markets Sovereign Debt Fund Retail Class A (load-waived)1 | | 8.38% | | 15.24% | | 9.88% |
| | | |
Ashmore Emerging Markets Sovereign Debt Fund Retail Class A (unadjusted)1,2 | | 4.05% | | 10.63% | | 7.55% |
| | | |
Ashmore Emerging Markets Sovereign Debt Fund Retail Class C (load-waived)1 | | 7.81% | | 14.28% | | 9.01% |
| | | |
Ashmore Emerging Markets Sovereign Debt Fund Retail Class C (unadjusted)1,2 | | 6.81% | | 13.28% | | 9.01% |
| | | |
JP Morgan EMBI GD3 | | 8.78% | | 15.53% | | 11.38% |
| | | | | | |
| | |
| Cumulative Returns Through October 31, 2012 (% of net assets) | | | | Top 5 Country Exposures (% of NAV) |
| | | | Brazil | | 7.36% |
| | | | Russia | | 6.68% |
| | | | Mexico | | 6.25% |
| | | | Turkey | | 6.23% |
| | | | Philippines | | 5.86% |
| | | | Source: Ashmore. Top 5 country exposure based on aggregate allocation to investment instruments related to countries shown above. As of October 31, 2012 |
$1,000,000 invested at the beginning of the first full month following the inception of the Institutional Class. The minimum initial investment amount for Institutional Class Shares is $1,000,000. The minimum initial investment amount for Retail Shares Classes A and C is $1,000.
All Fund returns are net of fees and expenses, except for the load-waived return information for Class A and Class C shares. Performance calculations assume that all dividend, capital gain and other distributions were reinvested.
1 For periods prior to the inception date of the Class A and Class C shares (05/12/2011), performance information shown is based on the performance of the Fund’s Institutional Class shares (12/08/2010), adjusted to reflect the distribution and/or service fees and other expenses paid by the Class A and Class C shares, respectively.
2 Unadjusted Performance accounts for a maximum sales load of 4% for Class A shares and maximum deferred sales charge of 1% for the 6 months and 1 year returns for the Class C shares.
3 The index for the Fund is the JP Morgan Emerging Markets Bond Index Global Diversified.
Past performance does not guarantee future results. The performance data quoted represents past performance and current returns may be lower or higher. The investment return and net asset value will fluctuate so that an investor’s shares, when redeemed, may be worth more or less than the original cost. To obtain performance information current to the most recent month-end, please visit www.ashmoregroup.com. Periods greater than one year are annualized. Changes in rates of exchange between currencies may cause the value of investments to decrease or increase. The Fund’s performance will fluctuate over long and short term periods.
Please refer to page 7 herein for an explanation of the Expense Example information presented below.
| | | | | | | | | | | | |
| |
| | | Expense Example |
| | | Actual Performance | | Hypothetical Performance |
| | | Institutional
Class | | Class A | | Class C | | Institutional
Class | | Class A | | Class C |
Beginning Account Value
(05/01/2012) | | $1,000.00 | | $1,000.00 | | $1,000.00 | | $1,000.00 | | $1,000.00 | | $1,000.00 |
Ending Account Value
(10/31/2012) | | $1,082.60 | | $1,083.80 | | $1,078.10 | | $1,020.51 | | $1,019.10 | | $1,015.33 |
Expense Ratio | | 0.92% | | 1.20% | | 1.95% | | 0.92% | | 1.20% | | 1.95% |
Expenses Paid† | | $4.82 | | $6.29 | | $10.19 | | $4.67 | | $6.09 | | $9.88 |
† Expenses are equal to the Fund’s annualized expense ratio multiplied by the average account value over the period, multiplied by 184/366 (to reflect the one-half year period). Hypothetical expenses are based on the Fund’s actual annualized expense ratios and assumed rate of 5 percent per year before expenses.
Unaudited
|
Share Class |
| Information |
|
Institutional Class |
|
Launch Date: |
December 8, 2010 |
|
Minimum Initial Investment: |
$1,000,000 |
|
ISIN: |
US0448203069 |
|
CUSIP: |
044820306 |
|
BLOOMBERG: |
ESDIX US |
|
TICKER: |
ESDIX |
|
Retail Class A |
|
Launch Date: |
May 12, 2011 |
|
Minimum Initial Investment: |
$1,000 |
|
ISIN: |
US0448208506 |
|
CUSIP: |
044820850 |
|
BLOOMBERG: |
ESDAX US |
|
TICKER: |
ESDAX |
|
Retail Class C |
|
Launch Date: |
May 12, 2011 |
|
Minimum Initial Investment: |
$1,000 |
|
ISIN: |
US0448208431 |
|
CUSIP: |
044820843 |
|
BLOOMBERG: |
ESDCX US |
|
TICKER: |
ESDCX |
|
All sources are Ashmore unless otherwise indicated |
11
Ashmore Emerging Markets Total Return Fund
The Ashmore Emerging Markets Total Return Fund is a daily dealing U.S. mutual fund. The Fund seeks to achieve its objective by investing principally in debt instruments of Sovereign, Quasi-Sovereign, and Corporate issuers, which may be denominated in any currency, including the local currency of the issuer.
Please refer to page 6 herein for an explanation of the information presented below in the Average Annual Total Return Table and Cumulative Return chart.
| | | | | | |
| | | |
Average Annual Total Return For The Period Ended October 31, 2012 | | 6 Months | | 1 Year | | Since Inception¹ |
| | | |
Ashmore Emerging Markets Total Return Fund Institutional Class1 | | 6.58% | | 12.50% | | 7.03% |
| | | |
Ashmore Emerging Markets Total Return Fund Retail Class A (load-waived)1 | | 6.51% | | 12.20% | | 6.79% |
| | | |
Ashmore Emerging Markets Total Return Fund Retail Class A (unadjusted)1,2 | | 2.26% | | 7.72% | | 4.52% |
| | | |
Ashmore Emerging Markets Total Return Fund Retail Class C (load-waived)1 | | 6.12% | | 11.42% | | 5.99% |
| | | |
Ashmore Emerging Markets Total Return Fund Retail Class C (unadjusted)1,2 | | 5.12% | | 10.42% | | 5.99% |
| | | |
50/25/25 Composite Benchmark3 | | 5.21% | | 9.90% | | 7.61% |
| | | | | | |
| | |
| Cumulative Returns Through October 31, 2012 (% of net assets) | | | | Top 5 Country Exposures (% of NAV) |
| | | | Russia | | 14.37% |
| | | | Mexico | | 10.93% |
| | | | Poland | | 9.99% |
| | | | Brazil | | 8.67% |
| | | | China | | 7.31% |
| | | | Source: Ashmore. Top 5 country exposure based on aggregate allocation to investment instruments related to countries shown above. As of October 31, 2012 |
$1,000,000 invested at the beginning of the first full month following the inception of the Institutional Class. The minimum initial investment amount for Institutional Class Shares is $1,000,000. The minimum initial investment amount for Retail Shares Classes A and C is $1,000.
All Fund returns are net of fees and expenses, except for the load-waived return information for Class A and Class C shares. Performance calculations assume that all dividend, capital gain and other distributions were reinvested.
1 For periods prior to the inception date of the Class A and Class C shares (05/12/2011), performance information shown is based on the performance of the Fund’s Institutional Class shares (12/08/2010), adjusted to reflect the distribution and/or service fees and other expenses paid by the Class A and Class C shares, respectively.
2 Unadjusted Performance accounts for a maximum sales load of 4% for Class A shares and maximum deferred sales charge of 1% for the 6 months and 1 year returns for the Class C shares.
3 The index for the Fund is 50% JP Morgan Emerging Markets Bond Index Global Diversified, 25% JP Morgan Emerging Local Markets Index Plus, 25% JPMorgan Global Bond Index-Emerging Markets Global Diversified.
Past performance does not guarantee future results. The performance data quoted represents past performance and current returns may be lower or higher. The investment return and net asset value will fluctuate so that an investor’s shares, when redeemed, may be worth more or less than the original cost. To obtain performance information current to the most recent month-end, please visit www.ashmoregroup.com. Periods greater than one year are annualized. Changes in rates of exchange between currencies may cause the value of investments to decrease or increase. The Fund’s performance will fluctuate over long and short term periods.
Please refer to page 7 herein for an explanation of the Expense Example information presented below.
| | | | | | | | | | | | |
| |
| | | Expense Example |
| | | Actual Performance | | Hypothetical Performance |
| | | Institutional
Class | | Class A | | Class C | | Institutional
Class | | Class A | | Class C |
Beginning Account Value
(05/01/2012) | | $1,000.00 | | $1,000.00 | | $1,000.00 | | $1,000.00 | | $1,000.00 | | $1,000.00 |
Ending Account Value
(10/31/2012) | | $1,065.80 | | $1,065.10 | | $1,061.20 | | $1,020.01 | | $1,018.60 | | $1,014.83 |
Expense Ratio | | 1.02% | | 1.30% | | 2.05% | | 1.02% | | 1.30% | | 2.05% |
Expenses Paid† | | $5.30 | | $6.75 | | $10.62 | | $5.18 | | $6.60 | | $10.38 |
† Expenses are equal to the Fund’s annualized expense ratio multiplied by the average account value over the period, multiplied by 184/366 (to reflect the one-half year period). Hypothetical expenses are based on the Fund’s actual annualized expense ratios and assumed rate of 5 percent per year before expenses.
Unaudited
|
Share Class |
| Information |
|
Institutional Class |
|
Launch Date: |
December 8, 2010 |
|
Minimum Initial Investment: |
$1,000,000 |
|
ISIN: |
US0448204059 |
|
CUSIP: |
044820405 |
|
BLOOMBERG: |
EMKIX US |
|
TICKER: |
EMKIX US |
|
Retail Class A |
|
Launch Date: |
May 12, 2011 |
|
Minimum Initial Investment: |
$1,000 |
|
ISIN: |
US0448208357 |
|
CUSIP: |
044820835 |
|
BLOOMBERG: |
EMKAX US |
|
TICKER: |
EMKAX |
|
Retail Class C |
|
Launch Date: |
May 12, 2011 |
|
Minimum Initial Investment: |
$1,000 |
|
ISIN: |
US0448208274 |
|
CUSIP: |
044820827 |
|
BLOOMBERG: |
EMKCX US |
|
TICKER: |
EMKCX |
|
All sources are Ashmore unless otherwise indicated |
12
Ashmore Emerging Markets Equity Fund
Ashmore Emerging Markets Equity Fund is an open-end U.S. mutual fund. The Fund seeks to achieve its objective by investing principally in equity securities and equity-related investments of Emerging Market issuers which may be denominated in any currency, including the local currency of the issuer .
Please refer to page 6 herein for an explanation of the information presented below in the Average Annual Total Return Table and Cumulative Return chart.
| | | | | | |
| | | |
Average Annual Total Return For The Period Ended October 31, 2012 | | 6 Months | | 1 Year | | Since Inception¹ |
| | | |
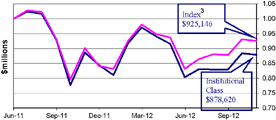
Ashmore Emerging Markets Equity Fund Institutional Class1 | | -4.02% | | -0.87% | | -9.07% |
| | | |
Ashmore Emerging Markets Equity Fund Retail Class A (load-
waived)1 | | -4.06% | | -1.11% | | -9.36% |
| | | |
Ashmore Emerging Markets Equity Fund Retail Class A
(unadjusted)1,2 | | -9.10% | | -6.30% | | -12.88% |
| | | |
Ashmore Emerging Markets Equity Fund Retail Class C (load-
waived)1 | | -4.66% | | -2.03% | | -10.19% |
| | | |
Ashmore Emerging Markets Equity Fund Retail Class C
(unadjusted)1,2 | | -5.66% | | -3.01% | | -10.19% |
| | | |
MSCI EM NET3 | | -1.25% | | 2.64% | | -5.55% |
| | | | | | |
| | |
| Cumulative Returns Through October 31, 2012 (% of net assets) | | | | Top 5 Country Exposures (% of NAV) |
| | | | China | | 22.01% |
| | | | Brazil | | 15.99% |
| | | | South Korea | | 15.61% |
| | | | Taiwan | | 10.92% |
| | | | India | | 8.35% |
| | | | Source: Ashmore. Top 5 country exposure based on aggregate allocation to investment instruments related to countries shown above. As of October 31, 2012 |
$1,000,000 invested at the beginning of the first full month following the inception of the Institutional Class. The minimum initial investment amount for Institutional Class Shares is $1,000,000. The minimum initial investment amount for Retail Shares Class A is $1,000.
All Fund returns are net of fees and expenses, except for the load-waived return information for Class A and Class C shares. Performance calculations assume that all dividend, capital gain and other distributions were reinvested.
1 For periods prior to the inception date of the Class A (02/27/2012) and Class C (08/24/2012) shares, performance information shown is based on the performance of the Fund’s Institutional Class (06/22/2011) shares, adjusted to reflect the distribution and/or service fees and other expenses paid by the Class A and Class C shares
2 Unadjusted Performance accounts for a maximum sales load of 5.25% for Class A shares and maximum deferred sales charge of 1% for the 6 months and 1 year returns for the Class C shares.
3 The index for the Fund is the Morgan Stanley Capital Index Emerging Markets Net.
Past performance does not guarantee future results. The performance data quoted represents past performance and current returns may be lower or higher. The investment return and net asset value will fluctuate so that an investor’s shares, when redeemed, may be worth more or less than the original cost. To obtain performance information current to the most recent month-end, please visit www.ashmoregroup.com. Periods greater than one year are annualized. Changes in rates of exchange between currencies may cause the value of investments to decrease or increase. The Fund has been in existence for less than one year; cumulative performance may not be indicative of the Fund’s long-term potential. The Fund’s performance will fluctuate over long and short term periods.
| | | | | | | | | | | | |
| |
| | | Expense Example |
| | | Actual Performance | | Hypothetical Performance |
| | | Institutional
Class | | Class A | | Class C* | | Institutional
Class | | Class A | | Class C* |
Beginning Account Value
(05/01/2012) | | $1,000.00 | | $1,000.00 | | $1,000.00 | | $1,000.00 | | $1,000.00 | | $1,000.00 |
Ending Account Value
(10/31/2012) | | $959.80 | | $959.40 | | $1,032.60 | | $1,019.25 | | $1,017.85 | | $1,005.28 |
Expense Ratio | | 1.17% | | 1.45% | | 2.20% | | 1.17% | | 1.45% | | 2.20% |
Expenses Paid† | | $5.76 | | $7.14 | | $4.22 | | $5.94 | | $7.35 | | $4.16 |
* Beginning account value for Class C dated 08/24/2012.
† Expenses are equal to the Fund’s annualized expense ratio multiplied by the average account value over the period, multiplied by 184/366 for Institutional Class and Class A (to reflect the one-half year period) and 69/366 for Class C (to reflect the period since inception date of 8/24/2012 for Class C shares). The Fund’s Class C hypothetical expenses reflect an amount as if the class has been in operation for the entire fiscal half year. Hypothetical expenses are based on the Fund’s actual annualized expense ratios and assumed rate of 5 percent per year before expenses.
Unaudited
|
Share Class |
| Information |
|
Institutional Class |
|
Launch Date: |
June 22, 2011 |
|
Minimum Initial Investment: |
$1,000,000 |
|
ISIN: |
US0448208191 |
|
CUSIP: |
044820819 |
|
BLOOMBERG: |
EMFIX US |
|
TICKER: |
EMFIX |
|
Retail Class A |
|
Launch Date: |
February 27, 2012 |
|
Minimum Initial Investment: |
$1,000 |
|
ISIN: |
US0448207771 |
|
CUSIP: |
044820777 |
|
BLOOMBERG: |
EMEAX US |
|
TICKER: |
EMEAX |
|
Retail Class C |
|
Launch Date: |
August 24, 2012 |
|
Minimum Initial Investment: |
$1,000 |
|
ISIN: |
US0448207698 |
|
CUSIP: |
044820769 |
|
BLOOMBERG: |
EMECX US |
|
TICKER: |
EMECX |
|
All sources are Ashmore unless otherwise indicated |
13
Ashmore Emerging Markets Small-Cap Equity Fund
Ashmore Emerging Markets Small-Cap Equity Fund is an open-end U.S. mutual fund. The Fund seeks to achieve its objective by investing principally in equity securities and equity-related investments of Small-Capitalization Emerging Market Issuers, which may be denominated in any currency, including the local currency of the issuer. The Fund currently defines a Small-Capitalization issuer as an issuer with a market capitalization of $2 billion or less at the time of investment.
Please refer to page 6 herein for an explanation of the information presented below in the Average Annual Total Return Table and Cumulative Return chart.
| | | | | | |
| | | |
Average Annual Total Return For The Period Ended October 31, 2012 | | 6 Months | | 1 Year | | Since Inception¹ |
| | | |
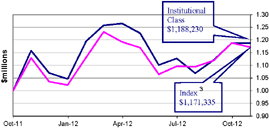
Ashmore Emerging Markets Small-Cap Equity Fund Institutional Class1 | | -3.13% | | 2.61% | | 17.42% |
| | | |
Ashmore Emerging Markets Small-Cap Equity Fund Retail Class A (load-waived)1 | | -3.28% | | 2.30% | | 16.96% |
| | | |
Ashmore Emerging Markets Small-Cap Equity Fund Retail Class A (unadjusted)1,2 | | -8.36% | | -3.07% | | 11.26% |
| | | |
Ashmore Emerging Markets Small-Cap Equity Fund Retail Class C (load-waived)1 | | -3.65% | | 1.57% | | 16.10% |
| | | |
Ashmore Emerging Markets Small-Cap Equity Fund Retail Class C (unadjusted)1,2 | | -4.65% | | 0.57% | | 16.10% |
| | | |
MSCI EM Small Cap NET3 | | 0.15% | | 3.74% | | 15.78% |
| | | | | | |
| | |
| Cumulative Returns Through October 31, 2012 (% of net assets) | | | | Top 5 Country Exposures (% of NAV) |
| | | | China | | 21.99% |
| | | | Brazil | | 18.34% |
| | | | South Korea | | 14.05% |
| | | | Taiwan | | 13.22% |
| | | | India | | 8.41% |
| | | | Source: Ashmore. Top 5 country exposure based on aggregate allocation to investment instruments related to countries shown above. As of October 31, 2012 |
$1,000,000 invested at the beginning of the first full month following the inception of the Institutional Class. The minimum initial investment amount for Institutional Class Shares is $1,000,000. The minimum initial investment amount for Retail Class A and Class C shares is $1,000.
All Fund returns are net of fees and expenses, except for the load-waived return information for Class A and Class C shares. Performance calculations assume that all dividend, capital gain and other distributions were reinvested.
1 For periods prior to the inception date of the Class A shares (02/01/2012) and Class C shares (08/24/2012), performance information shown is based on the performance of the Fund’s Institutional Class shares (10/04/2011), adjusted to reflect the distribution and/or service fees and other expenses paid by the Class A and Class C shares, respectively.
2 Unadjusted Performance accounts for a maximum sales load of 5.25% for Class A shares and maximum deferred sales charge of 1% for the 6 months and 1 year returns for the Class C shares.
3 The index for the Fund is the Morgan Stanley Capital Index Emerging Markets Small-Cap Net
Past performance does not guarantee future results. The performance data quoted represents past performance and current returns may be lower or higher. The investment return and net asset value will fluctuate so that an investor’s shares, when redeemed, may be worth more or less than the original cost. To obtain performance information current to the most recent month-end, please visit www.ashmoregroup.com. Periods greater than one year are annualized. Changes in rates of exchange between currencies may cause the value of investments to decrease or increase. The Fund has been in existence for less than one year; cumulative performance may not be indicative of the Fund’s long-term potential. The Fund’s performance will fluctuate over long and short term periods.
Please refer to page 7 herein for an explanation of the Expense Example information presented below.
| | | | | | | | | | | | |
| |
| | | Expense Example |
| | | Actual Performance | | Hypothetical Performance |
| | | Institutional
Class | | Class A | | Class C* | | Institutional
Class | | Class A | | Class C* |
Beginning Account Value
(05/01/2012) | | $1,000.00 | | $1,000.00 | | $1,000.00 | | $1,000.00 | | $1,000.00 | | $1,000.00 |
Ending Account Value
(10/31/2012) | | $968.70 | | $967.20 | | $1,051.70 | | $1,017.50 | | $1,016.09 | | $1,004.62 |
Expense Ratio | | 1.52% | | 1.80% | | 2.55% | | 1.52% | | 1.80% | | 2.55% |
Expenses Paid† | | $7.52 | | $8.90 | | $4.93 | | $7.71 | | $9.12 | | $4.82 |
* Beginning account value for Class C dated 08/24/2012
† Expenses are equal to the Fund’s annualized expense ratio multiplied by the average account value over the period, multiplied by 184/366 for Institutional Class and Class A (to reflect the one-half year period) and 69/366 for Class C (to reflect the period since inception date of 8/24/2012 for Class C shares). The Fund’s Class C hypothetical expenses reflect an amount as if the class has been in operation for the entire fiscal half year. Hypothetical expenses are based on the Fund’s actual annualized expense ratios and assumed rate of 5 percent per year before expenses.
Unaudited
|
Share Class |
| Information |
|
Institutional Class |
|
Launch Date: |
October 4, 2011 |
|
Minimum Initial Investment: |
$1,000,000 |
|
ISIN: |
US0448201162 |
|
CUSIP: |
044820116 |
|
BLOOMBERG: |
ESCIX US |
|
TICKER: |
ESCIX |
|
Retail Class A |
|
Launch Date: |
February 1, 2012 |
|
Minimum Initial Investment: |
$1,000 |
|
ISIN: |
US0448207938 |
|
CUSIP: |
044820793 |
|
BLOOMBERG: |
ESSAX US |
|
TICKER: |
ESSAX |
|
Retail Class C |
|
Launch Date: |
August 24, 2012 |
|
Minimum Initial Investment: |
$1,000 |
|
ISIN: |
US0448207854 |
|
CUSIP: |
044820785 |
|
BLOOMBERG: |
ESSCX US |
|
TICKER: |
ESSCX |
|
All sources are Ashmore unless otherwise indicated |
14
(THIS PAGE INTENTIONALLY LEFT BLANK)
15
ASHMORE FUNDS
STATEMENTS OF ASSETS AND LIABILITIES
As of October 31, 2012
| | | | | | | | | | | | |
| | | | | Ashmore
Emerging Markets
Corporate Debt
Fund | | | | | Ashmore
Emerging Markets
Local Currency
Bond Fund | |
ASSETS: | | | | | | | | | | | | |
Investments in securities, at value | | | | | $17,982,618 | | | | | | $68,040,605 | |
Investments in fully funded total return swaps, at value | | | | | — | | | | | | 6,705,718 | |
Cash | | | | | 319,110 | | | | | | 5,033,019 | |
Foreign currency, at value | | | | | 2,623 | | | | | | 207,661 | |
Unrealized appreciation on interest rate swap contracts | | | | | — | | | | | | 324,725 | |
Unrealized appreciation on forward foreign currency exchange contracts | | | | | — | | | | | | 620,425 | |
Receivable for securities and currencies sold | | | | | 428,681 | | | | | | 813,105 | |
Receivable for fund shares sold | | | | | 10,000 | | | | | | 110,027 | |
Receivable from Investment Manager | | | | | 25,686 | | | | | | 36,297 | |
Interest and dividends receivable | | | | | 314,813 | | | | | | 964,785 | |
Tax reclaims receivable | | | | | — | | | | | | 8,048 | |
Other assets | | | | | 1,530 | | | | | | 2,410 | |
Total Assets | | | | | 19,085,061 | | | | | | 82,866,825 | |
LIABILITIES: | | | | | | | | | | | | |
Unrealized depreciation on interest rate swap contracts | | | | | — | | | | | | 9,830 | |
Unrealized depreciation on forward foreign currency exchange contracts | | | | | 6,075 | | | | | | 410,330 | |
Payable for securities and currencies purchased | | | | | 797,584 | | | | | | 9,113,273 | |
Payable for fund units redeemed | | | | | — | | | | | | — | |
Due to broker from reverse repurchase agreement | | | | | — | | | | | | — | |
Distributions payable | | | | | 20,606 | | | | | | 60,992 | |
Investment Manager fee payable | | | | | 18,239 | | | | | | 60,041 | |
Trustees’ fees payable | | | | | 5,387 | | | | | | 5,388 | |
Other liabilities | | | | | 73,845 | | | | | | 102,319 | |
Total Liabilities | | | | | 921,736 | | | | | | 9,762,173 | |
Net Assets | | | | | $18,163,325 | | | | | | $73,104,652 | |
NET ASSETS: | | | | | | | | | | | | |
Paid in capital | | | | | $17,814,314 | | | | | | $70,992,187 | |
Undistributed (distributions in excess of) net investment income (loss) | | | | | 57,372 | | | | | | (252,856 | ) |
Accumulated net realized gain (loss) | | | | | 159,169 | | | | | | 22,246 | |
Net unrealized appreciation | | | | | 132,470 | | | | | | 2,343,075 | |
Net Assets | | | | | $18,163,325 | | | | | | $73,104,652 | |
| | | | | | | | | | | | |
Net Assets: | | | | | | | | | | | | |
Class A | | | | | $ 485,326 | | | | | | $ 412,965 | |
Class C | | | | | 27,324 | | | | | | 18,592 | |
Institutional Class | | | | | 17,650,675 | | | | | | 72,673,095 | |
| | | | | | | | | | | | |
Shares Issued and Outstanding (no par value, unlimited shares authorized): | | | | | | | | | | | | |
Class A | | | | | 50,067 | | | | | | 42,001 | |
Class C | | | | | 2,818 | | | | | | 1,892 | |
Institutional Class | | | | | 1,753,505 | | | | | | 7,141,941 | |
| | | | | | | | | | | | |
Net Asset Value and Redemption Price Per Share (Net Asset Per Share Outstanding): | | | | | | | | | | | | |
Class A | | | | | $ 9.69 | | | | | | $ 9.83 | |
Class C | | | | | 9.70 | | | | | | 9.83 | |
Institutional Class | | | | | 10.07 | | | | | | 10.18 | |
| | | | | | | | | | | | |
Cost of Investments in securities | | | | | $17,845,215 | | | | | | $66,439,982 | |
Cost of Investments in fully funded total return swaps | | | | | $ — | | | | | | $ 6,485,326 | |
Cost of Foreign currency held | | | | | $ 2,620 | | | | | | $ 207,661 | |
See accompanying notes to the financial statements.
16
| | | | | | | | | | | | | | | | | | | | | | | | | | | | | | |
| | | Ashmore Emerging Markets Local Currency Fund | | | | | Ashmore Emerging Markets Sovereign Debt Fund | | | | | Ashmore Emerging Markets Total Return Fund | | | | | Ashmore Emerging Markets Equity Fund | | | | | Ashmore Emerging Markets Small-Cap Equity Fund | | | |
| | | | | | | | | | | | | | | | | | | | | | | | | | | | | | |
| | | $ 99,133,775 | | | | | | $34,183,963 | | | | | | $641,445,840 | | | | | | $ 8,690,666 | | | | | | $13,568,105 | | | |
| | | — | | | | | | — | | | | | | 13,612,382 | | | | | | — | | | | | | — | | | |
| | | 1,960,277 | | | | | | 486,781 | | | | | | 16,642,898 | | | | | | 69,138 | | | | | | 216,215 | | | |
| | | 6,244 | | | | | | 154 | | | | | | 735,767 | | | | | | 21,494 | | | | | | 18,708 | | | |
| | | — | | | | | | — | | | | | | 844,032 | | | | | | — | | | | | | — | | | |
| | | 871,636 | | | | | | — | | | | | | 3,187,910 | | | | | | — | | | | | | — | | | |
| | | — | | | | | | — | | | | | | 23,123,525 | | | | | | 1,422 | | | | | | 108,573 | | | |
| | | — | | | | | | — | | | | | | 19,609 | | | | | | — | | | | | | — | | | |
| | | 34,187 | | | | | | 29,265 | | | | | | 80,583 | | | | | | 30,817 | | | | | | 5 | | | |
| | | 5,469 | | | | | | 476,592 | | | | | | 8,346,349 | | | | | | 12,477 | | | | | | 4,703 | | | |
| | | — | | | | | | — | | | | | | — | | | | | | 176 | | | | | | — | | | |
| | | | 2,260 | | | | | | 1,893 | | | | | | 6,261 | | | | | | 7,384 | | | | | | 5,735 | | | |
| | | | 102,013,848 | | | | | | 35,178,648 | | | | | | 708,045,156 | | | | | | 8,833,574 | | | | | | 13,922,044 | | | |
| | | | | | | | | | | | | | | | | | | | | | | | | | | | | | |
| | | — | | | | | | — | | | | | | 28,025 | | | | | | — | | | | | | — | | | |
| | | 508,357 | | | | | | — | | | | | | 2,204,911 | | | | | | — | | | | | | — | | | |
| | | 33,000,000 | | | | | | — | | | | | | 186,821,293 | | | | | | — | | | | | | 216,900 | | | |
| | | — | | | | | | — | | | | | | 22,654 | | | | | | — | | | | | | 1,475 | | | |
| | | — | | | | | | — | | | | | | 221,550 | | | | | | — | | | | | | — | | | |
| | | — | | | | | | 28,983 | | | | | | 362,599 | | | | | | — | | | | | | — | | | |
| | | 50,189 | | | | | | 27,101 | | | | | | 411,570 | | | | | | 8,545 | | | | | | 17,179 | | | |
| | | 5,388 | | | | | | 5,388 | | | | | | 5,388 | | | | | | 5,388 | | | | | | 5,388 | | | |
| | | | 89,769 | | | | | | 77,027 | | | | | | 206,797 | | | | | | 75,824 | | | | | | 83,303 | | | |
| | | | 33,653,703 | | | | | | 138,499 | | | | | | 190,284,787 | | | | | | 89,757 | | | | | | 324,245 | | | |
| | | | $ 68,360,145 | | | | | | $35,040,149 | | | | | | $517,760,369 | | | | | | $ 8,743,817 | | | | | | $13,597,799 | | | |
| | | | | | | | | | | | | | | | | | | | | | | | | | | | | | |
| | | $ 66,405,763 | | | | | | $31,703,281 | | | | | | $495,427,360 | | | | | | $10,113,641 | | | | | | $11,730,632 | | | |
| | | 1,567,268 | | | | | | (15,244 | ) | | | | | 5,252,821 | | | | | | (431 | ) | | | | | — | | | |
| | | (7,284 | ) | | | | | 124,604 | | | | | | 2,129,089 | | | | | | (1,407,867 | ) | | | | | 1,114,020 | | | |
| | | | 394,398 | | | | | | 3,227,508 | | | | | | 14,951,099 | | | | | | 38,474 | | | | | | 753,147 | | | |
| | | | $ 68,360,145 | | | | | | $35,040,149 | | | | | | $517,760,369 | | | | | | $ 8,743,817 | | | | | | $13,597,799 | | | |
| | | | | | | | | | |
| | | | | | | | | | | | | | | | | | | | | | | | | | | | | | |
| | | $ 953 | | | | | | $ 14,258 | | | | | | $ 3,262,865 | | | | | | $ 908 | | | | | | $ 237,941 | | | |
| | | 942 | | | | | | 1,164 | | | | | | 541,214 | | | | | | 1,035 | | | | | | 1,053 | | | |
| | | 68,358,250 | | | | | | 35,024,727 | | | | | | 513,956,290 | | | | | | 8,741,874 | | | | | | 13,358,805 | | | |
| | | | | | | | | | |
| | | | | | | | | | | | | | | | | | | | | | | | | | | | | | |
| | | 100 | | | | | | 1,289 | | | | | | 324,546 | | | | | | 101 | | | | | | 24,352 | | | |
| | | 100 | | | | | | 105 | | | | | | 53,879 | | | | | | 100 | | | | | | 100 | | | |
| | | 7,188,247 | | | | | | 3,186,199 | | | | | | 50,406,605 | | | | | | 1,014,567 | | | | | | 1,132,660 | | | |
| | | | | | | | | | |
| | | | | | | | | | | | | | | | | | | | | | | | | | | | | | |
| | | $ 9.51 | | | | | | $ 11.06 | | | | | | $ 10.05 | | | | | | $ 9.01 | | | | | | $ 9.77 | | | |
| | | 9.41 | | | | | | 11.04 | | | | | | 10.05 | | | | | | 10.32 | | | | | | 10.48 | | | |
| | | | 9.51 | | | | | | 10.99 | | | | | | 10.20 | | | | | | 8.62 | | | | | | 11.79 | | | |
| | | | | | | | | | |
| | | $ 99,102,802 | | | | | | $30,956,455 | | | | | | $628,314,996 | | | | | | $ 8,652,233 | | | | | | $12,815,178 | | | |
| | | $ — | | | | | | $ — | | | | | | $ 13,716,485 | | | | | | $ — | | | | | | $ — | | | |
| | | | $ 6,097 | | | | | | $ 150 | | | | | | $ 415,763 | | | | | | $ 21,350 | | | | | | $ 18,692 | | | |
See accompanying notes to the financial statements.
17
ASHMORE FUNDS
STATEMENTS OF OPERATIONS
For the Year Ended October 31, 2012
| | | | | | | | | | | | |
| | | | | Ashmore
Emerging Markets
Corporate Debt
Fund | | | | | Ashmore
Emerging Markets
Local Currency
Bond Fund | |
INVESTMENT INCOME: | | | | | | | | | | | | |
Interest, net of foreign tax withholdings* | | | | | $1,235,960 | | | | | | $3,079,031 | |
Dividends, net of foreign tax withholdings* | | | | | — | | | | | | — | |
Total Income | | | | | 1,235,960 | | | | | | 3,079,031 | |
EXPENSES: | | | | | | | | | | | | |
Investment Manager fees | | | | | 161,278 | | | | | | 622,489 | |
Administration fees | | | | | 4,297 | | | | | | 25,640 | |
Custody fees | | | | | 4,169 | | | | | | 36,021 | |
Professional fees | | | | | 99,177 | | | | | | 99,177 | |
Trustees’ fees | | | | | 29,989 | | | | | | 29,989 | |
Offering expenses and registration fees | | | | | 37,620 | | | | | | 44,441 | |
Insurance fees | | | | | 7,796 | | | | | | 8,245 | |
Printing fees | | | | | 19,515 | | | | | | 19,515 | |
Transfer agent fees - Institutional Class | | | | | 359 | | | | | | 359 | |
Distribution fees - Class A | | | | | 133 | | | | | | 754 | |
Distribution fees - Class C | | | | | 67 | | | | | | 43 | |
Other | | | | | 9,178 | | | | | | 23,065 | |
Total Expenses | | | | | 373,578 | | | | | | 909,738 | |
Less expenses reimbursed by the Investment Manager | | | | | (209,250 | ) | | | | | (274,477 | ) |
Net Expenses | | | | | 164,328 | | | | | | 635,261 | |
Net Investment Income (Loss) | | | | | 1,071,632 | | | | | | 2,443,770 | |
NET REALIZED AND UNREALIZED GAINS (LOSSES): | | | | | | | | | | | | |
NET REALIZED GAIN (LOSS) ON: | | | | | | | | | | | | |
Investments in securities | | | | | 117,450 | | | | | | (878,414 | ) |
Forward foreign currency exchange contracts | | | | | 72,859 | | | | | | 626,093 | |
Futures contracts | | | | | — | | | | | | (88,997 | ) |
Interest rate swap contracts | | | | | — | | | | | | 460,465 | |
Written options | | | | | — | | | | | | 1,600 | |
Foreign exchange transactions | | | | | (4,834 | ) | | | | | 71,249 | |
NET CHANGE IN UNREALIZED APPRECIATION (DEPRECIATION) ON: | | | | | | | | | | | | |
Investments in securities | | | | | 906,459 | | | | | | 2,570,960 | |
Forward foreign currency exchange contracts | | | | | 40,947 | | | | | | 87,799 | |
Investments in fully funded total return swaps | | | | | — | | | | | | (158,838 | ) |
Interest rate swap contracts | | | | | — | | | | | | (49,057 | ) |
Foreign exchange translations | | | | | 1,978 | | | | | | 24,398 | |
Net Realized and Unrealized Gains (Losses) | | | | | 1,134,859 | | | | | | 2,667,258 | |
Net Increase (Decrease) in Net Assets Resulting from Operations | | | | | $2,206,491 | | | | | | $5,111,028 | |
* Foreign tax withholdings | | | | | $ 1,114 | | | | | | $ 23,366 | |
See accompanying notes to the financial statements.
18
| | | | | | | | | | | | | | | | | | | | | | | | | | |
Ashmore Emerging Markets Local Currency Fund | | | | | Ashmore Emerging Markets Sovereign Debt Fund | | | | | Ashmore Emerging Markets Total Return Fund | | | | | Ashmore Emerging Markets Equity Fund | | | | | Ashmore Emerging Markets Small-Cap Equity Fund | |
| | | | | | | | | | | | | | | | | | | | | | | | | | |
| | $ 152,974 | | | | | | $1,804,659 | | | | | | $12,244,330 | | | | | | $ 95 | | | | | | $ — | |
| | — | | | | | | — | | | | | | — | | | | | | 194,919 | | | | | | 232,868 | |
| | 152,974 | | | | | | 1,804,659 | | | | | | 12,244,330 | | | | | | 195,014 | | | | | | 232,868 | |
| | | | | | | | | | | | | | | | | | | | | | | | | | |
| | 486,207 | | | | | | 291,254 | | | | | | 2,299,682 | | | | | | 99,844 | | | | | | 177,525 | |
| | 22,351 | | | | | | 12,674 | | | | | | 88,529 | | | | | | 3,406 | | | | | | 4,687 | |
| | 20,014 | | | | | | 11,322 | | | | | | 91,976 | | | | | | 3,908 | | | | | | 5,361 | |
| | 99,177 | | | | | | 99,177 | | | | | | 99,177 | | | | | | 95,949 | | | | | | 103,952 | |
| | 29,989 | | | | | | 29,989 | | | | | | 29,989 | | | | | | 29,989 | | | | | | 29,810 | |
| | 49,122 | | | | | | 39,008 | | | | | | 102,850 | | | | | | 80,895 | | | | | | 47,332 | |
| | 8,169 | | | | | | 7,981 | | | | | | 10,182 | | | | | | 11,538 | | | | | | 10,574 | |
| | 19,515 | | | | | | 19,515 | | | | | | 17,516 | | | | | | 18,029 | | | | | | 16,855 | |
| | 359 | | | | | | 359 | | | | | | 359 | | | | | | 359 | | | | | | 359 | |
| | 2 | | | | | | 15 | | | | | | 2,068 | | | | | | 2 | | | | | | 253 | |
| | 9 | | | | | | 11 | | | | | | 1,501 | | | | | | 2 | | | | | | 3 | |
| | 20,975 | | | | | | 16,388 | | | | | | 56,379 | | | | | | 10,852 | | | | | | 9,334 | |
| | 755,889 | | | | | | 527,693 | | | | | | 2,800,208 | | | | | | 354,773 | | | | | | 406,045 | |
| | (258,326 | ) | | | | | (230,499 | ) | | | | | (452,094 | ) | | | | | (253,176 | ) | | | | | (225,857 | ) |
| | 497,563 | | | | | | 297,194 | | | | | | 2,348,114 | | | | | | 101,597 | | | | | | 180,188 | |
| | (344,589 | ) | | | | | 1,507,465 | | | | | | 9,896,216 | | | | | | 93,417 | | | | | | 52,680 | |
| | | | | | | | | | | | | | | | | | | | | | | | | | |
| | | | | | | | | | | | | | | | | | | | | | | | | | |
| | (279,686 | ) | | | | | 507,160 | | | | | | 2,264,912 | | | | | | (547,069 | ) | | | | | 1,134,579 | |
| | 2,095,185 | | | | | | 14,115 | | | | | | 5,457,532 | | | | | | (2,455 | ) | | | | | 646 | |
| | — | | | | | | (374,422 | ) | | | | | (806,114 | ) | | | | | — | | | | | | — | |
| | — | | | | | | — | | | | | | 702,021 | | | | | | — | | | | | | — | |
| | 1,455 | | | | | | — | | | | | | 1,892 | | | | | | — | | | | | | — | |
| | (89,468 | ) | | | | | 470 | | | | | | 3,996 | | | | | | (6,083 | ) | | | | | (14,261 | ) |
| | | | | | | | | | | | | | | | | | | | | | | | | | |
| | 285,179 | | | | | | 3,028,274 | | | | | | 17,134,420 | | | | | | 380,238 | | | | | | (790,123 | ) |
| | 717,768 | | | | | | 500 | | | | | | 1,208,109 | | | | | | — | | | | | | — | |
| | — | | | | | | — | | | | | | (45,725 | ) | | | | | — | | | | | | — | |
| | — | | | | | | — | | | | | | 695,451 | | | | | | — | | | | | | — | |
| | 146 | | | | | | (20 | ) | | | | | 139,521 | | | | | | (548 | ) | | | | | 233 | |
| | 2,730,579 | | | | | | 3,176,077 | | | | | | 26,756,015 | | | | | | (175,917 | ) | | | | | 331,074 | |
| | $2,385,990 | | | | | | $4,683,542 | | | | | | $36,652,231 | | | | | | $ (82,500 | ) | | | | | $ 383,754 | |
| | $ — | | | | | | $ — | | | | | | $ 58,668 | | | | | | $ 20,793 | | | | | | $ 17,594 | |
See accompanying notes to the financial statements.
19
ASHMORE FUNDS
STATEMENTS OF CHANGES IN NET ASSETS
For the Year Ended October 31, 2012 and the Period Ended October 31, 2011
| | | | | | | | | | | | | | | | | | | | |
| | | | | Ashmore Emerging Markets Corporate Debt Fund | | Ashmore Emerging Markets Local Currency Bond Fund | |
| | | | | 2012 | | | 20111 | | | | | 2012 | | | 20111 | |
INCREASE (DECREASE) IN NET ASSETS FROM: | | | | | | | | | | | | | | | | | | | | |
OPERATIONS: | | | | | | | | | | | | | | | | | | | | |
Net investment income (loss) | | | | | $ 1,071,632 | | | | $ 710,945 | | | | | | $ 2,443,770 | | | | $ 1,282,157 | |
Net realized gain (loss) | | | | | 185,475 | | | | 64,793 | | | | | | 191,996 | | | | (121,063 | ) |
Net change in unrealized appreciation (depreciation) | | | | | 949,384 | | | | (816,914 | ) | | | | | 2,475,262 | | | | (132,187 | ) |
Net Increase (Decrease) in Net Assets Resulting from Operations | | | | | 2,206,491 | | | | (41,176 | ) | | | | | 5,111,028 | | | | 1,028,907 | |
| | | | | | |
DISTRIBUTIONS TO CLASS A SHAREHOLDERS: | | | | | | | | | | | | | | | | | | | | |
From net investment income | | | | | (3,531 | ) | | | (37 | ) | | | | | (10,601 | ) | | | (416 | ) |
From net realized gain | | | | | (6 | ) | | | — | | | | | | — | | | | — | |
Tax return of capital | | | | | — | | | | — | | | | | | (128 | ) | | | (272 | ) |
| | | | | | | | | | | | | | | | | | | | |
Total distributions to Class A shareholders | | | | | (3,537 | ) | | | (37 | ) | | | | | (10,729 | ) | | | (688 | ) |
| | | | | | |
DISTRIBUTIONS TO CLASS C SHAREHOLDERS: | | | | | | | | | | | | | | | | | | | | |
From net investment income | | | | | (413 | ) | | | (34 | ) | | | | | (119 | ) | | | (11 | ) |
From net realized gain | | | | | (5 | ) | | | — | | | | | | — | | | | — | |
Tax return of capital | | | | | — | | | | — | | | | | | (1 | ) | | | (8 | ) |
| | | | | | | | | | | | | | | | | | | | |
Total distributions to Class C shareholders | | | | | (418 | ) | | | (34 | ) | | | | | (120 | ) | | | (19 | ) |
| | | | | | |
DISTRIBUTIONS TO INSTITUTIONAL CLASS SHAREHOLDERS: | | | | | | | | | | | | | | | | | | | | |
From net investment income | | | | | (1,067,910 | ) | | | (678,055 | ) | | | | | (2,484,804 | ) | | | (1,531,519 | ) |
From net realized gain | | | | | (66,313 | ) | | | — | | | | | | — | | | | — | |
Tax return of capital | | | | | — | | | | — | | | | | | (20,104 | ) | | | (1,033,846 | ) |
| | | | | | | | | | | | | | | | | | | | |
Total distributions to Institutional Class shareholders | | | | | (1,134,223 | ) | | | (678,055 | ) | | | | | (2,504,908 | ) | | | (2,565,365 | ) |
| | | | | | |
FUND SHARE TRANSACTIONS: | | | | | | | | | | | | | | | | | | | | |
Net increase in net assets resulting from Class A share transactions | | | | | 475,184 | | | | 1,025 | | | | | | 114,504 | | | | 301,326 | |
Net increase in net assets resulting from Class C share transactions | | | | | 25,392 | | | | 1,023 | | | | | | 17,125 | | | | 1,014 | |
Net increase in net assets resulting from Institutional Class share transactions | | | | | 4,768,171 | | | | 12,543,519 | | | | | | 7,561,234 | | | | 64,051,343 | |
| | | | | | | | | | | | | | | | | | | | |
Net increase in net assets resulting from Fund share transactions | | | | | 5,268,747 | | | | 12,545,567 | | | | | | 7,692,863 | | | | 64,353,683 | |
Total Increase (Decrease) in Net Assets | | | | | 6,337,060 | | | | 11,826,265 | | | | | | 10,288,134 | | | | 62,816,518 | |
NET ASSETS: | | | | | | | | | | | | | | | | | | | | |
Net assets at the beginning of the period | | | | | 11,826,265 | | | | — | | | | | | 62,816,518 | | | | — | |
Net assets at the end of the period | | | | | $18,163,325 | | | | $11,826,265 | | | | | | $73,104,652 | | | | $62,816,518 | |
Undistributed (Distributions in excess of) Net Investment Income (Loss) | | | | | $ 57,372 | | | | $ 31,289 | | | | | | $ (252,856 | ) | | | $ (344,026 | ) |
| 1 | The Fund was initially capitalized on November 19, 2010 and it commenced investment operations on December 8, 2010. |
| 2 | The Fund commenced investment operations on June 22, 2011. |
| 3 | The Fund commenced investment operations on October 4, 2011. |
See accompanying notes to the financial statements.
20
| | | | | | | | | | | | | | | | | | | | | | | | | | | | | | | | | | | | | | |
Ashmore Emerging Markets Local Currency Fund | | | Ashmore Emerging Markets Sovereign Debt Fund | | | Ashmore Emerging Markets Total Return Fund | | | Ashmore Emerging Markets Equity Fund | | | Ashmore Emerging Markets Small-Cap Equity Fund | |
2012 | | | 20111 | | | 2012 | | | 20111 | | | 2012 | | | 20111 | | | 2012 | | | 20112 | | | 2012 | | | 20113 | |
| | | | | | | | | | | | | | | | | | | | | | | | | | | | | | | | | | | | | | | |
| | | | | | | | | | | | | | | | | | | | | | | | | | | | | | | | | | | | | | | |
| | $ (344,589 | ) | | | $ (97,551 | ) | | | $ 1,507,465 | | | | $ 416,196 | | | | $ 9,896,216 | | | | $ 2,451,239 | | | | $ 93,417 | | | | $ 53,026 | | | | $ 52,680 | | | | $ (6,872 | ) |
| | 1,727,486 | | | | (2,408,355 | ) | | | 147,323 | | | | (5,401 | ) | | | 7,624,239 | | | | (1,490,657 | ) | | | (555,607 | ) | | | (851,017 | ) | | | 1,120,964 | | | | 40,246 | |
| | 1,003,093 | | | | (608,695 | ) | | | 3,028,754 | | | | 198,754 | | | | 19,131,776 | | | | (4,180,677 | ) | | | 379,690 | | | | (341,216 | ) | | | (789,890 | ) | | | 1,543,037 | |
| | 2,385,990 | | | | (3,114,601 | ) | | | 4,683,542 | | | | 609,549 | | | | 36,652,231 | | | | (3,220,095 | ) | | | (82,500 | ) | | | (1,139,207 | ) | | | 383,754 | | | | 1,576,411 | |
| | | | | | | | | | |
| | | | | | | | | | | | | | | | | | | | | | | | | | | | | | | | | | | | | | | |
| | — | | | | — | | | | (263 | ) | | | (19 | ) | | | (34,655 | ) | | | (3,827 | ) | | | (9 | ) | | | — | | | | (1,149 | ) | | | — | |
| | — | | | | — | | | | — | | | | — | | | | — | | | | — | | | | — | | | | — | | | | — | | | | — | |
| | — | | | | (2 | ) | | | — | | | | — | | | | — | | | | (3,858 | ) | | | — | | | | — | | | | — | | | | — | |
| | | | | | | | | | | | | | | | | | | | | | | | | | | | | | | | | | | | | | |
| | — | | | | (2 | ) | | | (263 | ) | | | (19 | ) | | | (34,655 | ) | | | (7,685 | ) | | | (9 | ) | | | — | | | | (1,149 | ) | | | — | |
| | | | | | | | | | |
| | | | | | | | | | | | | | | | | | | | | | | | | | | | | | | | | | | | | | | |
| | — | | | | — | | | | (40 | ) | | | (16 | ) | | | (4,414 | ) | | | (8 | ) | | | (3 | ) | | | — | | | | (5 | ) | | | — | |
| | — | | | | — | | | | — | | | | — | | | | — | | | | — | | | | — | | | | — | | | | — | | | | — | |
| | — | | | | (1 | ) | | | — | | | | — | | | | — | | | | (8 | ) | | | — | | | | — | | | | — | | | | — | |
| | | | | | | | | | | | | | | | | | | | | | | | | | | | | | | | | | | | | | |
| | — | | | | (1 | ) | | | (40 | ) | | | (16 | ) | | | (4,414 | ) | | | (16 | ) | | | (3 | ) | | | — | | | | (5 | ) | | | — | |
| | | | | | | | | | |
| | | | | | | | | | | | | | | | | | | | | | | | | | | | | | | | | | | | | | | |
| | — | | | | — | | | | (1,527,944 | ) | | | (427,941 | ) | | | (9,890,635 | ) | | | (1,165,588 | ) | | | (101,630 | ) | | | (46,475 | ) | | | (53,188 | ) | | | — | |
| | — | | | | — | | | | — | | | | — | | | | — | | | | — | | | | — | | | | — | | | | (38,656 | ) | | | — | |
| | — | | | | (948,700 | ) | | | — | | | | — | | | | — | | | | (1,259,791 | ) | | | (4,929 | ) | | | — | | | | — | | | | — | |
| | | | | | | | | | | | | | | | | | | | | | | | | | | | | | | | | | | | | | |
| | — | | | | (948,700 | ) | | | (1,527,944 | ) | | | (427,941 | ) | | | (9,890,635 | ) | | | (2,425,379 | ) | | | (106,559 | ) | | | (46,475 | ) | | | (91,844 | ) | | | — | |
| | | | | | | | | | |
| | | | | | | | | | | | | | | | | | | | | | | | | | | | | | | | | | | | | | | |
| | 2 | | | | 1,001 | | | | 11,932 | | | | 1,013 | | | | 2,690,701 | | | | 544,481 | | | | 1,007 | | | | — | | | | 233,034 | | | | — | |
| | 2 | | | | 1,001 | | | | 46 | | | | 1,011 | | | | 518,650 | | | | 1,011 | | | | 1,005 | | | | — | | | | 1,032 | | | | — | |
| | 42,329,736 | | | | 27,705,717 | | | | 1,338,057 | | | | 30,351,222 | | | | 385,372,014 | | | | 107,564,160 | | | | 82,731 | | | | 10,033,827 | | | | 1,496,566 | | | | 10,000,000 | |
| | | | | | | | | | | | | | | | | | | | | | | | | | | | | | | | | | | | | | |
| | 42,329,740 | | | | 27,707,719 | | | | 1,350,035 | | | | 30,353,246 | | | | 388,581,365 | | | | 108,109,652 | | | | 84,743 | | | | 10,033,827 | | | | 1,730,632 | | | | 10,000,000 | |
| | 44,715,730 | | | | 23,644,415 | | | | 4,505,330 | | | | 30,534,819 | | | | 415,303,892 | | | | 102,456,477 | | | | (104,328 | ) | | | 8,848,145 | | | | 2,021,388 | | | | 11,576,411 | |
| | | | | | | | | | | | | | | | | | | | | | | | | | | | | | | | | | | | | | | |
| | 23,644,415 | | | | — | | | | 30,534,819 | | | | — | | | | 102,456,477 | | | | — | | | | 8,848,145 | | | | — | | | | 11,576,411 | | | | — | |
| | $68,360,145 | | | | $23,644,415 | | | | $35,040,149 | | | | $30,534,819 | | | | $517,760,369 | | | | $102,456,477 | | | | $8,743,817 | | | | $8,848,145 | | | | $13,597,799 | | | | $11,576,411 | |
| | $ 1,567,268 | | | | $ 181,501 | | | | $ (15,244 | ) | | | $ (6,153 | ) | | | $ 5,252,821 | | | | $ 155,823 | | | | $ (431 | ) | | | $ 16,332 | | | | $ — | | | | $ — | |
See accompanying notes to the financial statements.
21
ASHMORE FUNDS
FINANCIAL HIGHLIGHTS
For the Year Ended October 31, 2012 and the Period Ended October 31, 2011
Ashmore Emerging Markets Corporate Debt Fund
| | | | | | | | | | | | | | | | | | | | | | | | |
| | | Class A | | | Class C | | | Institutional Class | |
| | | 2012 | | | 20111 | | | 2012 | | | 20111 | | | 2012 | | | 20112 | |
Net asset value at beginning of period | | | $ 9.09 | | | | $ 10.00 | | | | $ 9.09 | | | | $ 10.00 | | | | $ 9.43 | | | | $ 10.00 | |
| | | | | | |
Income/(loss) from investment operations: | | | | | | | | | | | | | | | | | | | | | | | | |
Net investment income3 | | | 0.67 | | | | 0.32 | | | | 0.60 | | | | 0.28 | | | | 0.73 | | | | 0.63 | |
Net realized and unrealized gain (loss) | | | 0.67 | | | | (0.86) | | | | 0.68 | | | | (0.86) | | | | 0.70 | | | | (0.60) | |
| | | | | | | | | | | | | | | | | | | | | | | | |
Total from investment operations | | | 1.34 | | | | (0.54) | | | | 1.28 | | | | (0.58) | | | | 1.43 | | | | 0.03 | |
| | | | | | |
Less distributions: | | | | | | | | | | | | | | | | | | | | | | | | |
| | | | | | |
From net investment income | | | (0.69) | | | | (0.37) | | | | (0.62) | | | | (0.33) | | | | (0.74) | | | | (0.60) | |
From net realized gain | | | (0.05) | | | | — | | | | (0.05) | | | | — | | | | (0.05) | | | | — | |
| | | | | | | | | | | | | | | | | | | | | | | | |
| | | | | | |
Total distributions | | | (0.74) | | | | (0.37) | | | | (0.67) | | | | (0.33) | | | | (0.79) | | | | (0.60) | |
| | | | | | | | | | | | | | | | | | | | | | | | |
Net asset value at end of period | | | $ 9.69 | | | | $ 9.09 | | | | $ 9.70 | | | | $ 9.09 | | | | $ 10.07 | | | | $ 9.43 | |
| | | | | | | | | | | | | | | | | | | | | | | | |
| | | | | | |
Total return4 | | | 15.54% | | | | (5.44%) | | | | 14.78% | | | | (5.78%) | | | | 15.97% | | | | 0.27% | |
| | | | | | |
Portfolio turnover rate5 | | | 50% | | | | 22% | | | | 50% | | | | 22% | | | | 50% | | | | 22% | |
| | | | | | |
Net assets, end of period (in thousands) | | | $485 | | | | $1 | | | | $27 | | | | $1 | | | | $17,651 | | | | $11,824 | |
| | | | | | |
Ratios to average net assets:6 | | | | | | | | | | | | | | | | | | | | | | | | |
Total expenses to average net assets: | | | | | | | | | | | | | | | | | | | | | | | | |
Total expenses before reimbursements | | | 2.89% | | | | 4.36% | | | | 3.60% | | | | 5.12% | | | | 2.66% | | | | 3.78% | |
Total expenses after reimbursements | | | 1.45% | | | | 1.45% | | | | 2.20% | | | | 2.20% | | | | 1.17% | | | | 1.17% | |
| | | | | | |
Net investment income to average net assets: | | | | | | | | | | | | | | | | | | | | | | | | |
Net investment income before reimbursements | | | 5.19% | | | | 4.35% | | | | 4.73% | | | | 3.59% | | | | 6.16% | | | | 4.60% | |
Net investment income after reimbursements | | | 6.63% | | | | 7.26% | | | | 6.13% | | | | 6.51% | | | | 7.65% | | | | 7.21% | |
| 1 | Class A and Class C commenced investment operations on May 12, 2011. |
| 2 | The Institutional Class commenced investment operations on December 8, 2010. |
| 3 | Per share amounts are based on average number of shares outstanding during the period. |
| 4 | Assumes investment at net asset value at the beginning of the period, reinvestment of all distributions at net asset value on distribution date, and a complete redemption of the investment at net asset value at the end of the period excluding the impact of sales charges. Total return is not annualized for periods less than one year. |
| 5 | The portfolio turnover rate is calculated by dividing the lesser of cost of purchases or proceeds from sales of long term portfolio securities by the monthly average of the value of the long term portfolio securities. Portfolio turnover is not annualized for periods less than one year. |
| 6 | Annualized for periods less than one year. |
See accompanying notes to the financial statements.
22
ASHMORE FUNDS
FINANCIAL HIGHLIGHTS
For the Year Ended October 31, 2012 and the Period Ended October 31, 2011
Ashmore Emerging Markets Local Currency Bond Fund
| | | | | | | | | | | | | | | | | | | | | | | | |
| | | Class A | | | Class C | | | Institutional Class | |
| | | 2012 | | | 20111 | | | 2012 | | | 20111 | | | 2012 | | | 20112 | |
Net asset value at beginning of period | | | $ 9.43 | | | | $ 10.00 | | | | $ 9.43 | | | | $ 10.00 | | | | $ 9.76 | | | | $ 10.00 | |
| | | | | | |
Income/(loss) from investment operations: | | | | | | | | | | | | | | | | | | | | | | | | |
Net investment income3 | | | 0.43 | | | | 0.13 | | | | 0.22 | | | | 0.13 | | | | 0.37 | | | | 0.29 | |
Net realized and unrealized gain (loss) | | | 0.31 | | | | (0.48) | | | | 0.45 | | | | (0.51) | | | | 0.42 | | | | 0.06 | |
| | | | | | | | | | | | | | | | | | | | | | | | |
Total from investment operations | | | 0.74 | | | | (0.35) | | | | 0.67 | | | | (0.38) | | | | 0.79 | | | | 0.35 | |
| | | | | | |
Less distributions: | | | | | | | | | | | | | | | | | | | | | | | | |
| | | | | | |
From net investment income | | | (0.34) | | | | (0.13) | | | | (0.27) | | | | (0.11) | | | | (0.37) | | | | (0.35) | |
Tax return of capital | | | —4 | | | | (0.09) | | | | —4 | | | | (0.08) | | | | —4 | | | | (0.24) | |
| | | | | | | | | | | | | | | | | | | | | | | | |
| | | | | | |
Total distributions | | | (0.34) | | | | (0.22) | | | | (0.27) | | | | (0.19) | | | | (0.37) | | | | (0.59) | |
| | | | | | | | | | | | | | | | | | | | | | | | |
Net asset value at end of period | | | $ 9.83 | | | | $ 9.43 | | | | $ 9.83 | | | | $ 9.43 | | | | $ 10.18 | | | | $ 9.76 | |
| | | | | | | | | | | | | | | | | | | | | | | | |
| | | | | | |
Total return5 | | | 8.02% | | | | (3.60%) | | | | 7.33% | | | | (4.01%) | | | | 8.39% | | | | 3.35% | |
| | | | | | |
Portfolio turnover rate6 | | | 101% | | | | 31% | | | | 101% | | | | 31% | | | | 101% | | | | 31% | |
| | | | | | |
Net assets, end of period (in thousands) | | | $413 | | | | $286 | | | | $19 | | | | $1 | | | | $72,673 | | | | $62,530 | |
| | | | | | |
Ratios to average net assets:7 | | | | | | | | | | | | | | | | | | | | | | | | |
Total expenses to average net assets: | | | | | | | | | | | | | | | | | | | | | | | | |
Total expenses before reimbursements | | | 1.64% | | | | 1.99% | | | | 2.47% | | | | 2.87% | | | | 1.39% | | | | 1.70% | |
Total expenses after reimbursements | | | 1.25% | | | | 1.25% | | | | 2.00% | | | | 2.00% | | | | 0.97% | | | | 0.97% | |
| | | | | | |
Net investment income to average net assets: | | | | | | | | | | | | | | | | | | | | | | | | |
Net investment income before reimbursements | | | 3.03% | | | | 2.34% | | | | 1.87% | | | | 1.87% | | | | 3.31% | | | | 2.55% | |
Net investment income after reimbursements | | | 3.42% | | | | 3.08% | | | | 2.34% | | | | 2.74% | | | | 3.73% | | | | 3.28 % | |
| 1 | Class A and Class C commenced investment operations on May 12, 2011. |
| 2 | The Institutional Class commenced investment operations on December 8, 2010. |
| 3 | Per share amounts are based on average number of shares outstanding during the period. |
| 4 | Amount is less than $0.005 per share. |
| 5 | Assumes investment at net asset value at the beginning of the period, reinvestment of all distributions at net asset value on distribution date, and a complete redemption of the investment at net asset value at the end of the period excluding the impact of sales charges. Total return is not annualized for periods less than one year. |
| 6 | The portfolio turnover rate is calculated by dividing the lesser of cost of purchases or proceeds from sales of long term portfolio securities, including fully funded total return swaps, by the monthly average of the value of the long term portfolio securities. Portfolio turnover is not annualized for periods less than one year. |
| 7 | Annualized for periods less than one year. |
See accompanying notes to the financial statements.
23
ASHMORE FUNDS
FINANCIAL HIGHLIGHTS
For the Year Ended October 31, 2012 and the Period Ended October 31, 2011
Ashmore Emerging Markets Local Currency Fund
| | | | | | | | | | | | | | | | | | | | | | | | |
| | | Class A | | | Class C | | | Institutional Class | |
| | | 2012 | | | 20111 | | | 2012 | | | 20111 | | | 2012 | | | 20112 | |
Net asset value at beginning of period | | | $ 9.38 | | | | $ 10.00 | | | | $ 9.35 | | | | $ 10.00 | | | | $ 9.35 | | | | $ 10.00 | |
| | | | | | |
Income/(loss) from investment operations: | | | | | | | | | | | | | | | | | | | | | | | | |
Net investment loss3 | | | (0.09) | | | | (0.03) | | | | (0.17) | | | | (0.06) | | | | (0.10) | | | | (0.04) | |
Net realized and unrealized gain (loss) | | | 0.22 | | | | (0.57) | | | | 0.23 | | | | (0.58) | | | | 0.26 | | | | 0.06 | |
| | | | | | | | | | | | | | | | | | | | | | | | |
Total from investment operations | | | 0.13 | | | | (0.60) | | | | 0.06 | | | | (0.64) | | | | 0.16 | | | | 0.02 | |
| | | | | | |
Less distributions: | | | | | | | | | | | | | | | | | | | | | | | | |
| | | | | | |
Tax return of capital | | | — | | | | (0.02) | | | | — | | | | (0.01) | | | | — | | | | (0.67) | |
| | | | | | | | | | | | | | | | | | | | | | | | |
| | | | | | |
Total distributions | | | — | | | | (0.02) | | | | — | | | | (0.01) | | | | — | | | | (0.67) | |
| | | | | | | | | | | | | | | | | | | | | | | | |
Net asset value at end of period | | | $ 9.51 | | | | $ 9.38 | | | | $ 9.41 | | | | $ 9.35 | | | | $ 9.51 | | | | $ 9.35 | |
| | | | | | | | | | | | | | | | | | | | | | | | |
| | | | | | |
Total return4 | | | 1.50% | | | | (6.12%) | | | | 0.77% | | | | (6.46%) | | | | 1.71% | | | | (0.12%) | |
| | | | | | |
Portfolio turnover rate5 | | | 157% | | | | 37% | | | | 157% | | | | 37% | | | | 157% | | | | 37% | |
| | | | | | |
Net assets, end of period (in thousands) | | | $1 | | | | $1 | | | | $1 | | | | $1 | | | | $68,358 | | | | $23,643 | |
| | | | | | |
Ratios to average net assets:6 | | | | | | | | | | | | | | | | | | | | | | | | |
Total expenses to average net assets: | | | | | | | | | | | | | | | | | | | | | | | | |
Total expenses before reimbursements | | | 1.46% | | | | 2.17% | | | | 2.22% | | | | 2.90% | | | | 1.32% | | | | 2.03% | |
Total expenses after reimbursements | | | 1.15% | | | | 1.15% | | | | 1.90% | | | | 1.90% | | | | 0.87% | | | | 0.87% | |
| | | | | | |
Net investment loss to average net assets: | | | | | | | | | | | | | | | | | | | | | | | | |
Net investment loss before reimbursements | | | (1.31%) | | | | (1.60%) | | | | (2.07%) | | | | (2.33%) | | | | (1.05%) | | | | (1.58%) | |
Net investment loss after reimbursements | | | (1.00%) | | | | (0.58%) | | | | (1.75%) | | | | (1.33%) | | | | (0.60%) | | | | (0.42%) | |
| 1 | Class A and Class C commenced investment operations on May 12, 2011. |
| 2 | The Institutional Class commenced investment operations on December 8, 2010. |
| 3 | Per share amounts are based on average number of shares outstanding during the period. |
| 4 | Assumes investment at net asset value at the beginning of the period, reinvestment of all distributions at net asset value on distribution date, and a complete redemption of the investment at net asset value at the end of the period excluding the impact of sales charges. Total return is not annualized for periods less than one year. |
| 5 | The portfolio turnover rate is calculated by dividing the lesser of cost of purchases or proceeds from sales of long term portfolio securities by the monthly average of the value of the long term portfolio securities. Portfolio turnover is not annualized for periods less than one year. |
| 6 | Annualized for periods less than one year. |
See accompanying notes to the financial statements.
24
ASHMORE FUNDS
FINANCIAL HIGHLIGHTS
For the Year Ended October 31, 2012 and the Period Ended October 31, 2011
Ashmore Emerging Markets Sovereign Debt Fund
| | | | | | | | | | | | | | | | | | | | | | | | |
| | | Class A | | | Class C | | | Institutional Class | |
| | | 2012 | | | 20111 | | | 2012 | | | 20111 | | | 2012 | | | 20112 | |
Net asset value at beginning of period | | | $ 10.04 | | | | $ 10.00 | | | | $ 10.04 | | | | $ 10.00 | | | | $ 9.99 | | | | $ 10.00 | |
| | | | | | |
Income from investment operations: | | | | | | | | | | | | | | | | | | | | | | | | |
Net investment income3 | | | 0.44 | | | | 0.19 | | | | 0.37 | | | | 0.15 | | | | 0.48 | | | | 0.40 | |
Net realized and unrealized gain | | | 1.03 | | | | 0.04 | | | | 1.01 | | | | 0.05 | | | | 1.01 | | | | — | |
| | | | | | | | | | | | | | | | | | | | | | | | |
Total from investment operations | | | 1.47 | | | | 0.23 | | | | 1.38 | | | | 0.20 | | | | 1.49 | | | | 0.40 | |
| | | | | | |
Less distributions: | | | | | | | | | | | | | | | | | | | | | | | | |
| | | | | | |
From net investment income | | | (0.45) | | | | (0.19) | | | | (0.38) | | | | (0.16) | | | | (0.49) | | | | (0.41) | |
| | | | | | | | | | | | | | | | | | | | | | | | |
| | | | | | |
Total distributions | | | (0.45) | | | | (0.19) | | | | (0.38) | | | | (0.16) | | | | (0.49) | | | | (0.41) | |
| | | | | | | | | | | | | | | | | | | | | | | | |
Net asset value at end of period | | | $ 11.06 | | | | $ 10.04 | | | | $ 11.04 | | | | $ 10.04 | | | | $ 10.99 | | | | $ 9.99 | |
| | | | | | | | | | | | | | | | | | | | | | | | |
| | | | | | |
Total return4 | | | 15.24% | | | | 2.26% | | | | 14.28% | | | | 1.90% | | | | 15.32% | | | | 4.15% | |
| | | | | | |
Portfolio turnover rate5 | | | 30% | | | | 9% | | | | 30% | | | | 9% | | | | 30% | | | | 9% | |
| | | | | | |
Net assets, end of period (in thousands) | | | $14 | | | | $1 | | | | $1 | | | | $1 | | | | $35,025 | | | | $30,533 | |
| | | | | | |
Ratios to average net assets:6 | | | | | | | | | | | | | | | | | | | | | | | | |
Total expenses to average net assets: | | | | | | | | | | | | | | | | | | | | | | | | |
Total expenses before reimbursements | | | 1.93% | | | | 4.61% | | | | 2.73% | | | | 5.35% | | | | 1.63% | | | | 3.63% | |
Total expenses after reimbursements | | | 1.20% | | | | 1.20% | | | | 1.95% | | | | 1.95% | | | | 0.92% | | | | 0.92% | |
| | | | | | |
Net investment income/(loss) to average net assets: | | | | | | | | | | | | | | | | | | | | | | | | |
Net investment income (loss) before reimbursements | | | 3.62% | | | | 0.57% | | | | 2.86% | | | | (0.18%) | | | | 3.95% | | | | 1.74% | |
Net investment income after reimbursements | | | 4.35% | | | | 3.98% | | | | 3.64% | | | | 3.22% | | | | 4.66% | | | | 4.45% | |
| 1 | Class A and Class C commenced investment operations on May 12, 2011. |
| 2 | The Institutional Class commenced investment operations on December 8, 2010. |
| 3 | Per share amounts are based on average number of shares outstanding during the period. |
| 4 | Assumes investment at net asset value at the beginning of the period, reinvestment of all distributions at net asset value on distribution date, and a complete redemption of the investment at net asset value at the end of the period excluding the impact of sales charges. Total return is not annualized for periods less than one year. |
| 5 | The portfolio turnover rate is calculated by dividing the lesser of cost of purchases or proceeds from sales of long term portfolio securities by the monthly average of the value of the long term portfolio securities. Portfolio turnover is not annualized for periods less than one year. |
| 6 | Annualized for periods less than one year. |
See accompanying notes to the financial statements.
25
ASHMORE FUNDS
FINANCIAL HIGHLIGHTS
For the Year Ended October 31, 2012 and the Period Ended October 31, 2011
Ashmore Emerging Markets Total Return Fund
| | | | | | | | | | | | | | | | | | | | | | | | |
| | | Class A | | | Class C | | | Institutional Class | |
| | | 2012 | | | 20111 | | | 2012 | | | 20111 | | | 2012 | | | 20112 | |
Net asset value at beginning of period | | | $ 9.37 | | | | $ 10.00 | | | | $ 9.36 | | | | $ 10.00 | | | | $ 9.50 | | | | $ 10.00 | |
| | | | | | |
Income/(loss) from investment operations: | | | | | | | | | | | | | | | | | | | | | | | | |
Net investment income3 | | | 0.43 | | | | 0.22 | | | | 0.39 | | | | 0.19 | | | | 0.44 | | | | 0.46 | |
Net realized and unrealized gain (loss) | | | 0.68 | | | | (0.66) | | | | 0.66 | | | | (0.66) | | | | 0.72 | | | | (0.34) | |
| | | | | | | | | | | | | | | | | | | | | | | | |
Total from investment operations | | | 1.11 | | | | (0.44) | | | | 1.05 | | | | (0.47) | | | | 1.16 | | | | 0.12 | |
| | | | | | |
Less distributions: | | | | | | | | | | | | | | | | | | | | | | | | |
| | | | | | |
From net investment income | | | (0.43) | | | | (0.09) | | | | (0.36) | | | | (0.08) | | | | (0.46) | | | | (0.29) | |
Tax return of capital | | | — | | | | (0.10) | | | | — | | | | (0.09) | | | | — | | | | (0.33) | |
| | | | | | | | | | | | | | | | | | | | | | | | |
| | | | | | |
Total distributions | | | (0.43) | | | | (0.19) | | | | (0.36) | | | | (0.17) | | | | (0.46) | | | | (0.62) | |
| | | | | | | | | | | | | | | | | | | | | | | | |
Net asset value at end of period | | | $ 10.05 | | | | $ 9.37 | | | | $ 10.05 | | | | $ 9.36 | | | | $ 10.20 | | | | $ 9.50 | |
| | | | | | | | | | | | | | | | | | | | | | | | |
| | | | | | |
Total return4 | | | 12.20% | | | | (4.40%) | | | | 11.42% | | | | (4.79%) | | | | 12.50% | | | | 1.11% | |
| | | | | | |
Portfolio turnover rate5 | | | 83% | | | | 39% | | | | 83% | | | | 39% | | | | 83% | | | | 39% | |
| | | | | | |
Net assets, end of period (in thousands) | | | $3,263 | | | | $509 | | | | $541 | | | | $1 | | | | $513,956 | | | | $101,947 | |
| | | | | | |
Ratios to average net assets:6 | | | | | | | | | | | | | | | | | | | | | | | | |
Total expenses to average net assets: | | | | | | | | | | | | | | | | | | | | | | | | |
Total expenses before reimbursements | | | 1.48% | | | | 1.75% | | | | 2.21% | | | | 2.82% | | | | 1.22% | | | | 1.63% | |
Total expenses after reimbursements | | | 1.30% | | | | 1.30% | | | | 2.05% | | | | 2.05% | | | | 1.02% | | | | 1.02% | |
| | | | | | |
Net investment income to average net assets: | | | | | | | | | | | | | | | | | | | | | | | | |
Net investment income before reimbursements | | | 3.99% | | | | 4.21% | | | | 2.62% | | | | 3.32% | | | | 4.11% | | | | 4.63% | |
Net investment income after reimbursements | | | 4.17% | | | | 4.66% | | | | 2.78% | | | | 4.09% | | | | 4.31% | | | | 5.24% | |
| 1 | Class A and Class C commenced investment operations on May 12, 2011. |
| 2 | The Institutional Class commenced investment operations on December 8, 2010. |
| 3 | Per share amounts are based on average number of shares outstanding during the period. |
| 4 | Assumes investment at net asset value at the beginning of the period, reinvestment of all distributions at net asset value on distribution date, and a complete redemption of the investment at net asset value at the end of the period excluding the impact of sales charges. Total return is not annualized for periods less than one year. |
| 5 | The portfolio turnover rate is calculated by dividing the lesser of cost of purchases or proceeds from sales of long term portfolio securities, including fully funded total return swaps, by the monthly average of the value of the long term portfolio securities. Portfolio turnover is not annualized for periods less than one year. |
| 6 | Annualized for periods less than one year. |
See accompanying notes to the financial statements.
26
ASHMORE FUNDS
FINANCIAL HIGHLIGHTS
For the Year Ended October 31, 2012 and the Period Ended October 31, 2011
Ashmore Emerging Markets Equity Fund
| | | | | | | | | | | | | | | | |
| | | Class A | | | Class C | | | Institutional Class | |
| | | 20121 | | | 20122 | | | 2012 | | | 20113 | |
Net asset value at beginning of period | | | $ 10.00 | | | | $ 10.00 | | | | $ 8.81 | | | | $ 10.00 | |
| | | | |
Income/(loss) from investment operations: | | | | | | | | | | | | | | | | |
Net investment income (loss)4 | | | 0.08 | | | | (0.01) | | | | 0.09 | | | | 0.05 | |
Net realized and unrealized gain (loss) | | | (0.98) | | | | 0.36 | | | | (0.17) | | | | (1.19) | |
| | | | | | | | | | | | | | | | |
Total from investment operations | | | (0.90) | | | | 0.35 | | | | (0.08) | | | | (1.14) | |
| | | | |
Less distributions: | | | | | | | | | | | | | | | | |
| | | | |
From net investment income | | | (0.09) | | | | (0.03) | | | | (0.10) | | | | (0.05) | |
Tax return of capital | | | — | | | | — | | | | (0.01) | | | | — | |
| | | | | | | | | | | | | | | | |
| | | | |
Total distributions | | | (0.09) | | | | (0.03) | | | | (0.11) | | | | (0.05) | |
| | | | | | | | | | | | | | | | |
Net asset value at end of period | | | $ 9.01 | | | | $ 10.32 | | | | $ 8.62 | | | | $ 8.81 | |
| | | | | | | | | | | | | | | | |
| | | | |
Total return5 | | | (8.94%) | | | | 3.26% | | | | (0.87%) | | | | (11.37)% | |
| | | | |
Portfolio turnover rate6 | | | 95% | | | | 95% | | | | 95% | | | | 75% | |
| | | | |
Net assets, end of period (in thousands) | | | $1 | | | | $1 | | | | $8,742 | | | | $8,848 | |
| | | | |
Ratios to average net assets:7 | | | | | | | | | | | | | | | | |
Total expenses to average net assets: | | | | | | | | | | | | | | | | |
Total expenses before reimbursements | | | 4.40% | | | | 5.40% | | | | 4.09% | | | | 5.34% | |
Total expenses after reimbursements | | | 1.45% | | | | 2.20% | | | | 1.17% | | | | 1.17% | |
| | | | |
Net investment income/(loss) to average net assets: | | | | | | | | | | | | | | | | |
Net investment loss before reimbursements | | | (1.60%) | | | | (3.82%) | | | | (1.84%) | | | | (2.55%) | |
Net investment income after reimbursements | | | 1.35% | | | | (0.62%) | | | | 1.08% | | | | 1.62% | |
| 1 | Class A commenced investment operations on February 27, 2012. |
| 2 | Class C commenced investment operations on August 24, 2012. |
| 3 | The Institutional Class commenced investment operations on June 22, 2011. |
| 4 | Per share amounts are based on average number of shares outstanding during the period. |
| 5 | Assumes investment at net asset value at the beginning of the period, reinvestment of all distributions at net asset value on distribution date, and a complete redemption of the investment at net asset value at the end of the period excluding the impact of sales charges. Total return is not annualized for periods less than one year. |
| 6 | The portfolio turnover rate is calculated by dividing the lesser of cost of purchases or proceeds from sales of long term portfolio securities by the monthly average of the value of the long term portfolio securities. Portfolio turnover is not annualized for periods less than one year. |
| 7 | Annualized for periods less than one year. |
See accompanying notes to the financial statements.
27
ASHMORE FUNDS
FINANCIAL HIGHLIGHTS
For the Year Ended October 31, 2012 and the Period Ended October 31, 2011
Ashmore Emerging Markets Small-Cap Equity Fund
| | | | | | | | | | | | | | | | |
| | | Class A | | | Class C | | | Institutional Class | |
| | | 20121 | | | 20122 | | | 2012 | | | 20113 | |
Net asset value at beginning of period | | | $ 10.00 | | | | $ 10.00 | | | | $ 11.58 | | | | $ 10.00 | |
| | | | |
Income/(loss) from investment operations: | | | | | | | | | | | | | | | | |
Net investment income (loss)4 | | | 0.02 | | | | (0.01) | | | | 0.05 | | | | (0.01) | |
Net realized and unrealized gain (loss) | | | (0.20) | | | | 0.54 | | | | 0.25 | | | | 1.59 | |
| | | | | | | | | | | | | | | | |
Total from investment operations | | | (0.18) | | | | 0.53 | | | | 0.30 | | | | 1.58 | |
| | | | |
Less distributions: | | | | | | | | | | | | | | | | |
| | | | |
From net investment income | | | (0.05) | | | | (0.05) | | | | (0.05) | | | | — | |
From net realized gain | | | — | | | | — | | | | (0.04) | | | | — | |
| | | | | | | | | �� | | | | | | | |
| | | | |
Total distributions | | | (0.05) | | | | (0.05) | | | | (0.09) | | | | — | |
| | | | | | | | | | | | | | | | |
Net asset value at end of period | | | $ 9.77 | | | | $ 10.48 | | | | $ 11.79 | | | | $ 11.58 | |
| | | | | | | | | | | | | | | | |
| | | | |
Total return5 | | | (1.73)% | | | | 5.17% | | | | 2.61% | | | | 15.80% | |
| | | | |
Portfolio turnover rate6 | | | 94% | | | | 94% | | | | 94% | | | | 20% | |
| | | | |
Net assets, end of period (in thousands) | | | $238 | | | | $1 | | | | $13,359 | | | | $11,576 | |
| | | | |
Ratios to average net assets:7 | | | | | | | | | | | | | | | | |
Total expenses to average net assets: | | | | | | | | | | | | | | | | |
Total expenses before reimbursements | | | 3.43% | | | | 5.12% | | | | 3.43% | | | | 15.42% | |
Total expenses after reimbursements | | | 1.80% | | | | 2.55% | | | | 1.52% | | | | 1.52% | |
| | | | |
Net investment loss to average net assets: | | | | | | | | | | | | | | | | |
Net investment loss before reimbursements | | | (1.15%) | | | | (3.35%) | | | | (1.46%) | | | | (14.76%) | |
Net investment gain (loss) after reimbursements | | | 0.48% | | | | (0.78%) | | | | 0.45% | | | | (0.86%) | |
| 1 | Class A commenced investment operations on February 1, 2012. |
| 2 | Class C commenced investment operations on August 24, 2012. |
| 3 | The Institutional Class commenced investment operations on October 4, 2011. |
| 4 | Per share amounts are based on average number of shares outstanding during the period. |
| 5 | Assumes investment at net asset value at the beginning of the period, reinvestment of all distributions at net asset value on distribution date, and a complete redemption of the investment at net asset value at the end of the period excluding the impact of sales charges. Total return is not annualized for periods less than one year. |
| 6 | The portfolio turnover rate is calculated by dividing the lesser of cost of purchases or proceeds from sales of long term portfolio securities by the monthly average of the value of the long term portfolio securities. Portfolio turnover is not annualized for periods less than one year. |
| 7 | Annualized for periods less than one year. |
See accompanying notes to the financial statements.
28
ASHMORE EMERGING MARKETS CORPORATE DEBT FUND
SCHEDULE OF INVESTMENTS
As of October 31, 2012
| | | | | | | | | | | | | | |
| | | Currency(1) | | Par | | | Value | | | % of Net Assets | |
Debt Securities | | | | | | | | | | | | | | |
| | | | |
Argentina (Cost $195,612) | | | | | | | | | | | | | | |
WPE International Cooperatief UA 10.375%, 09/30/2020 | | | | | 200,000 | | | $ | 172,000 | | | | 0.95 | |
| | | | | | | | | 172,000 | | | | 0.95 | |
Barbados (Cost $212,777) | | | | | | | | | | | | | | |
Columbus International, Inc. 11.500%, 11/20/2014 | | | | | 200,000 | | | | 224,000 | | | | 1.23 | |
| | | | | | | | | 224,000 | | | | 1.23 | |
Brazil (Cost $1,119,464) | | | | | | | | | | | | | | |
Arcos Dorados Holdings, Inc. 10.250%, 07/13/2016 | | BRL | | | 250,000 | | | | 131,705 | | | | 0.73 | |
Banco do Brasil S.A. Cayman 8.500%, 10/29/2049 | | | | | 100,000 | | | | 121,750 | | | | 0.67 | |
Cia Energetica de Sao Paulo 9.750%, 01/15/2015 | | BRL | | | 250,000 | | | | 176,437 | | | | 0.97 | |
JBS Finance II Ltd. 8.250%, 01/29/2018 | | | | | 100,000 | | | | 104,250 | | | | 0.57 | |
Marfrig Holding Europe B.V. 8.375%, 05/09/2018 | | | | | 200,000 | | | | 173,000 | | | | 0.95 | |
Marfrig Overseas Ltd. 9.500%, 05/04/2020 | | | | | 100,000 | | | | 88,500 | | | | 0.49 | |
Minerva Luxembourg S.A. 12.250%, 02/10/2022 | | | | | 200,000 | | | | 238,000 | | | | 1.31 | |
OSX 3 Leasing B.V. 9.250%, 03/20/2015(2) | | | | | 100,000 | | | | 104,000 | | | | 0.57 | |
| | | | | | | | | 1,137,642 | | | | 6.26 | |
Chile (Cost $542,710) | | | | | | | | | | | | | | |
Automotores Gildemeister S.A. 8.250%, 05/24/2021 | | | | | 100,000 | | | | 108,000 | | | | 0.60 | |
Banco Santander Chile 6.500%, 09/22/2020 | | CLP | | | 50,000,000 | | | | 102,099 | | | | 0.56 | |
Inversiones Alsacia S.A. 8.000%, 08/18/2018 | | | | | 140,334 | | | | 147,853 | | | | 0.81 | |
Telefonica Chile S.A. 3.875%, 10/12/2022(2)(3) | | | | | 200,000 | | | | 198,189 | | | | 1.09 | |
| | | | | | | | | 556,141 | | | | 3.06 | |
China (Cost $2,353,982) | | | | | | | | | | | | | | |
Agile Property Holdings Ltd. 9.875%, 03/20/2017 | | | | | 200,000 | | | | 217,500 | | | | 1.20 | |
Agile Property Holdings Ltd. 8.875%, 04/28/2017 | | | | | 100,000 | | | | 104,380 | | | | 0.57 | |
Central China Real Estate Ltd. 12.250%, 10/20/2015 | | | | | 100,000 | | | | 109,750 | | | | 0.60 | |
CFG Investment SAC 9.750%, 07/30/2019 | | | | | 200,000 | | | | 173,000 | | | | 0.95 | |
China Automation Group Ltd. 7.750%, 04/20/2016 | | | | | 200,000 | | | | 170,292 | | | | 0.94 | |
China Forestry Holdings Co. Ltd. 10.250%, 11/17/2015 | | | | | 60,000 | | | | 32,700 | | | | 0.18 | |
China Liansu Group Holdings Ltd. 7.875%, 05/13/2016 | | | | | 200,000 | | | | 202,750 | | | | 1.12 | |
China Oriental Group Co. Ltd. 8.000%, 08/18/2015 | | | | | 100,000 | | | | 95,750 | | | | 0.53 | |
China Oriental Group Co. Ltd. 7.000%, 11/17/2017 | | | | | 100,000 | | | | 87,500 | | | | 0.48 | |
China Shanshui Cement Group Ltd. 10.500%, 04/27/2017 | | | | | 200,000 | | | | 217,500 | | | | 1.20 | |
Country Garden Holdings Co. Ltd. 11.250%, 04/22/2017 | | | | | 100,000 | | | | 111,250 | | | | 0.61 | |
Country Garden Holdings Co. Ltd. 11.125%, 02/23/2018 | | | | | 200,000 | | | | 224,500 | | | | 1.24 | |
Evergrande Real Estate Group Ltd. 7.500%, 01/19/2014 | | CNY | | | 1,000,000 | | | | 153,752 | | | | 0.85 | |
Evergrande Real Estate Group Ltd. 13.000%, 01/27/2015 | | | | | 100,000 | | | | 103,250 | | | | 0.57 | |
Hidili Industry International Development Ltd. 8.625%, 11/04/2015 | | | | | 100,000 | | | | 75,000 | | | | 0.41 | |
Shimao Property Holdings Ltd. 9.650%, 08/03/2017 | | | | | 100,000 | | | | 106,034 | | | | 0.58 | |
Sino-Forest Corp. 5.000%, 08/01/2013(2)(4) | | | | | 14,000 | | | | 2,100 | | | | 0.01 | |
Sino-Forest Corp. 5.000%, 08/01/2013(4) | | | | | 7,000 | | | | 1,050 | | | | 0.01 | |
Sino-Forest Corp. 10.250%, 07/28/2014(4) | | | | | 62,000 | | | | 9,300 | | | | 0.05 | |
Sino-Forest Corp. 10.250%, 07/28/2014(2)(4) | | | | | 20,000 | | | | 3,000 | | | | 0.02 | |
Sino-Forest Corp. 4.250%, 12/15/2016(2)(4) | | | | | 113,000 | | | | 16,950 | | | | 0.09 | |
Sino-Forest Corp. 6.250%, 10/21/2017(2)(4) | | | | | 132,000 | | | | 19,800 | | | | 0.11 | |
Sino-Forest Corp. 6.250%, 10/21/2017(4) | | | | | 120,000 | | | | 18,000 | | | | 0.10 | |
| | | | | | | | | 2,255,108 | | | | 12.42 | |
Colombia (Cost $149,141) | | | | | | | | | | | | | | |
Bancolombia S.A. 5.125%, 09/11/2022 | | | | | 150,000 | | | | 156,750 | | | | 0.86 | |
| | | | | | | | | 156,750 | | | | 0.86 | |
See accompanying notes to the financial statements.
29
ASHMORE EMERGING MARKETS CORPORATE DEBT FUND
SCHEDULE OF INVESTMENTS (CONTINUED)
As of October 31, 2012
| | | | | | | | | | | | | | |
| | | Currency(1) | | Par | | | Value | | | % of Net
Assets | |
Croatia (Cost $115,480) | | | | | | | | | | | | | | |
Zagrebacki Holding D.O.O. 5.500%, 07/10/2017 | | EUR | | | 100,000 | | | $ | 112,766 | | | | 0.62 | |
| | | | | | | | | 112,766 | | | | 0.62 | |
Czech Republic (Cost $135,551) | | | | | | | | | | | | | | |
Central European Media Enterprises Ltd. 11.625%, 09/15/2016 | | EUR | | | 100,000 | | | | 133,505 | | | | 0.73 | |
| | | | | | | | | 133,505 | | | | 0.73 | |
India (Cost $640,751) | | | | | | | | | | | | | | |
Reliance Holdings USA, Inc. 6.250%, 10/19/2040 | | | | | 250,000 | | | | 291,162 | | | | 1.61 | |
Vedanta Resources Jersey Ltd. 5.500%, 07/13/2016 | | | | | 200,000 | | | | 198,500 | | | | 1.09 | |
Vedanta Resources PLC 8.250%, 06/07/2021 | | | | | 200,000 | | | | 205,500 | | | | 1.13 | |
| | | | | | | | | 695,162 | | | | 3.83 | |
Indonesia (Cost $193,514) | | | | | | | | | | | | | | |
Bumi Investment Pte Ltd. 10.750%, 10/06/2017 | | | | | 100,000 | | | | 78,000 | | | | 0.43 | |
GT 2005 Bonds B.V. 8.000%, 07/21/2014 | | | | | 100,000 | | | | 99,750 | | | | 0.55 | |
| | | | | | | | | 177,750 | | | | 0.98 | |
Israel (Cost $412,812) | | | | | | | | | | | | | | |
Israel Electric Corp. Ltd. 6.700%, 02/10/2017 | | | | | 200,000 | | | | 219,000 | | | | 1.21 | |
Israel Electric Corp. Ltd. 7.250%, 01/15/2019 | | | | | 200,000 | | | | 221,611 | | | | 1.22 | |
| | | | | | | | | 440,611 | | | | 2.43 | |
Jamaica (Cost $621,839) | | | | | | | | | | | | | | |
Digicel Group Ltd. 10.500%, 04/15/2018 | | | | | 200,000 | | | | 221,000 | | | | 1.22 | |
Digicel Group Ltd. 8.250%, 09/30/2020(2) | | | | | 400,000 | | | | 431,000 | | | | 2.37 | |
| | | | | | | | | 652,000 | | | | 3.59 | |
Kazakhstan (Cost $1,083,278) | | | | | | | | | | | | | | |
ATF Bank JSC 9.000%, 05/11/2016 | | | | | 100,000 | | | | 99,970 | | | | 0.55 | |
BTA Bank JSC 10.750%, 07/01/2018(4) | | | | | 200,000 | | | | 79,000 | | | | 0.43 | |
BTA Bank JSC 0.000%, 06/30/2020(4)(5) | | | | | 200,000 | | | | 23,200 | | | | 0.13 | |
BTA Bank JSC 7.200%, 07/01/2025(4) | | | | | 300,000 | | | | 18,000 | | | | 0.10 | |
Kazkommertsbank JSC 8.500%, 04/16/2013 | | | | | 200,000 | | | | 198,900 | | | | 1.10 | |
Kazkommertsbank JSC 8.500%, 05/11/2018 | | | | | 200,000 | | | | 173,220 | | | | 0.95 | |
Zhaikmunai LLP 10.500%, 10/19/2015 | | | | | 150,000 | | | | 164,445 | | | | 0.91 | |
| | | | | | | | | 756,735 | | | | 4.17 | |
Kuwait (Cost $105,377) | | | | | | | | | | | | | | |
Kuwait Projects Co. 9.375%, 07/15/2020 | | | | | 100,000 | | | | 121,350 | | | | 0.67 | |
| | | | | | | | | 121,350 | | | | 0.67 | |
Mexico (Cost $1,954,360) | | | | | | | | | | | | | | |
BBVA Bancomer S.A. Texas 6.750%, 09/30/2022 | | | | | 150,000 | | | | 169,875 | | | | 0.93 | |
Cemex Espana Luxembourg 9.250%, 05/12/2020 | | | | | 100,000 | | | | 104,000 | | | | 0.57 | |
Cemex Finance LLC 9.375%, 10/12/2022(2)(3) | | | | | 200,000 | | | | 209,000 | | | | 1.15 | |
Cemex S.A.B. de C.V., FRN 5.362%, 09/30/2015 | | | | | 300,000 | | | | 291,750 | | | | 1.61 | |
Cemex S.A.B. de C.V. 9.000%, 01/11/2018 | | | | | 100,000 | | | | 103,750 | | | | 0.57 | |
Corp. GEO S.A.B. de C.V. 8.875%, 03/27/2022 | | | | | 200,000 | | | | 211,500 | | | | 1.16 | |
Desarrolladora Homex S.A.B. de CV 9.750%, 03/25/2020 | | | | | 100,000 | | | | 101,000 | | | | 0.56 | |
Empresas ICA S.A.B. de C.V. 8.375%, 07/24/2017 | | | | | 150,000 | | | | 160,125 | | | | 0.88 | |
Grupo Papelero Scribe S.A. de C.V. 8.875%, 04/07/2020 | | | | | 100,000 | | | | 87,400 | | | | 0.48 | |
Grupo Televisa S.A.B. 8.500%, 03/11/2032 | | | | | 100,000 | | | | 144,923 | | | | 0.80 | |
Petroleos Mexicanos 7.650%, 11/24/2021 | | MXN | | | 1,300,000 | | | | 108,279 | | | | 0.60 | |
RDS Ultra-Deepwater Ltd. 11.875%, 03/15/2017 | | | | | 100,000 | | | | 112,750 | | | | 0.62 | |
Urbi Desarrollos Urbanos S.A.B. de C.V. 9.750%, 02/03/2022 | | | | | 250,000 | | | | 232,500 | | | | 1.28 | |
| | | | | | | | | 2,036,852 | | | | 11.21 | |
See accompanying notes to the financial statements.
30
ASHMORE EMERGING MARKETS CORPORATE DEBT FUND
SCHEDULE OF INVESTMENTS (CONTINUED)
As of October 31, 2012
| | | | | | | | | | | | | | |
| | | Currency(1) | | Par | | | Value | | | % of Net
Assets | |
Mongolia (Cost $200,000) | | | | | | | | | | | | | | |
Mongolian Mining Corp. 8.875%, 03/29/2017 | | | | | 200,000 | | | $ | 204,000 | | | | 1.12 | |
| | | | | | | | | 204,000 | | | | 1.12 | |
Nigeria (Cost $199,955) | | | | | | | | | | | | | | |
Afren PLC 10.250%, 04/08/2019 | | | | | 200,000 | | | | 229,000 | | | | 1.26 | |
| | | | | | | | | 229,000 | | | | 1.26 | |
Panama (Cost $200,000) | | | | | | | | | | | | | | |
Sable International Finance Ltd. 8.750%, 02/01/2020 | | | | | 200,000 | | | | 228,000 | | | | 1.26 | |
| | | | | | | | | 228,000 | | | | 1.26 | |
Paraguay (Cost $150,000) | | | | | | | | | | | | | | |
Banco Bilbao Vizcaya Argentaria Paraguay S.A. 9.750%, 02/11/2016 | | | | | 150,000 | | | | 159,750 | | | | 0.88 | |
| | | | | | | | | 159,750 | | | | 0.88 | |
Peru (Cost $353,396) | | | | | | | | | | | | | | |
BBVA Banco Continental S.A. 5.000%, 08/26/2022(2) | | | | | 150,000 | | | | 159,750 | | | | 0.88 | |
Corp. Azucarera del Peru S.A. 6.375%, 08/02/2022 | | | | | 100,000 | | | | 108,500 | | | | 0.60 | |
Southern Copper Corp. 6.750%, 04/16/2040 | | | | | 100,000 | | | | 118,654 | | | | 0.65 | |
| | | | | | | | | 386,904 | | | | 2.13 | |
Philippines (Cost $239,630) | | | | | | | | | | | | | | |
Petron Corp. 7.000%, 11/10/2017 | | PHP | | | 10,000,000 | | | | 252,625 | | | | 1.39 | |
| | | | | | | | | 252,625 | | | | 1.39 | |
Poland (Cost $625,563) | | | | | | | | | | | | | | |
Eileme 2 AB 11.625%, 01/31/2020 | | | | | 200,000 | | | | 224,750 | | | | 1.24 | |
Eileme 2 AB 11.750%, 01/31/2020 | | EUR | | | 100,000 | | | | 145,300 | | | | 0.80 | |
TVN Finance Corp. II AB 10.750%, 11/15/2017 | | EUR | | | 200,000 | | | | 281,591 | | | | 1.55 | |
| | | | | | | | | 651,641 | | | | 3.59 | |
Russian Federation (Cost $2,183,813) | | | | | | | | | | | | | | |
Alfa Bank OJSC Via Alfa Bond Issuance PLC 7.500%, 09/26/2019(2) | | | | | 200,000 | | | | 205,782 | | | | 1.13 | |
Brunswick Rail Finance Ltd. 6.500%, 11/01/2017(2) | | | | | 200,000 | | | | 202,594 | | | | 1.12 | |
CEDC Finance Corp. International, Inc. 8.875%, 12/01/2016 | | EUR | | | 200,000 | | | | 165,909 | | | | 0.91 | |
Evraz Group S.A. 9.500%, 04/24/2018 | | | | | 100,000 | | | | 112,809 | | | | 0.62 | |
Promsvyazbank OJSC Via PSB Finance S.A. 10.200%, 11/06/2019(2) | | | | | 200,000 | | | | 199,750 | | | | 1.10 | |
Russian Standard Bank Via Russian Standard Finance S.A. 10.750%, 04/10/2018(2)(3) | | | | | 200,000 | | | | 204,986 | | | | 1.13 | |
Sberbank of Russia Via SB Capital S.A. 5.125%, 10/29/2022(2) | | | | | 200,000 | | | | 199,478 | | | | 1.10 | |
Severstal OAO Via Steel Capital S.A. 5.900%, 10/17/2022(2)(3) | | | | | 200,000 | | | | 198,690 | | | | 1.09 | |
Vimpel Communications Via VIP Finance Ireland Ltd. OJSC 7.748%, 02/02/2021 | | | | | 200,000 | | | | 220,000 | | | | 1.21 | |
VimpelCom Holdings B.V. 7.504%, 03/01/2022 | | | | | 200,000 | | | | 216,000 | | | | 1.19 | |
VTB Bank OJSC Via VTB Capital S.A. 6.551%, 10/13/2020 | | | | | 100,000 | | | | 105,300 | | | | 0.58 | |
VTB Bank OJSC Via VTB Capital S.A. 6.950%, 10/17/2022(2)(3) | | | | | 200,000 | | | | 206,590 | | | | 1.14 | |
| | | | | | | | | 2,237,888 | | | | 12.32 | |
Singapore (Cost $306,858) | | | | | | | | | | | | | | |
MMI International Ltd. 8.000%, 03/01/2017 | | | | | 200,000 | | | | 209,000 | | | | 1.15 | |
Noble Group Ltd. 6.750%, 01/29/2020 | | | | | 100,000 | | | | 108,000 | | | | 0.60 | |
| | | | | | | | | 317,000 | | | | 1.75 | |
See accompanying notes to the financial statements.
31
ASHMORE EMERGING MARKETS CORPORATE DEBT FUND
SCHEDULE OF INVESTMENTS (CONTINUED)
As of October 31, 2012
| | | | | | | | | | | | | | |
| | | Currency(1) | | Par | | | Value | | | % of Net
Assets | |
South Africa (Cost $670,448) | | | | | | | | | | | | | | |
Edcon Pty Ltd., FRN 3.502%, 06/15/2014 | | EUR | | | 60,000 | | | $ | 72,326 | | | | 0.40 | |
Edcon Pty Ltd. 9.500%, 03/01/2018 | | | | | 150,000 | | | | 141,000 | | | | 0.78 | |
Foodcorp Pty Ltd. 8.750%, 03/01/2018 | | EUR | | | 100,000 | | | | 134,801 | | | | 0.74 | |
Sappi Papier Holding GmbH 8.375%, 06/15/2019 | | | | | 200,000 | | | | 211,000 | | | | 1.16 | |
Standard Bank PLC 8.125%, 12/02/2019 | | | | | 100,000 | | | | 113,000 | | | | 0.62 | |
| | | | | | | | | 672,127 | | | | 3.70 | |
South Korea (Cost $299,555) | | | | | | | | | | | | | | |
Korea Gas Corp. 6.250%, 01/20/2042 | | | | | 200,000 | | | | 273,491 | | | | 1.50 | |
Shinhan Bank 6.819%, 09/20/2036 | | | | | 100,000 | | | | 106,436 | | | | 0.59 | |
| | | | | | | | | 379,927 | | | | 2.09 | |
Turkey (Cost $397,587) | | | | | | | | | | | | | | |
Akbank TAS 5.000%, 10/24/2022(2) | | | | | 200,000 | | | | 202,146 | | | | 1.11 | |
Tupras Turkiye Petrol Rafinerileri AS 4.125%, 05/02/2018(2) | | | | | 200,000 | | | | 196,390 | | | | 1.08 | |
| | | | | | | | | 398,536 | | | | 2.19 | |
Ukraine (Cost $701,259) | | | | | | | | | | | | | | |
DTEK Finance B.V. 9.500%, 04/28/2015 | | | | | 100,000 | | | | 101,060 | | | | 0.56 | |
Metinvest B.V. 10.250%, 05/20/2015 | | | | | 200,000 | | | | 204,180 | | | | 1.12 | |
MHP S.A. 10.250%, 04/29/2015 | | | | | 200,000 | | | | 205,500 | | | | 1.13 | |
Privatbank CJSC Via UK SPV Credit Finance PLC 9.375%, 09/23/2015 | | | | | 200,000 | | | | 186,590 | | | | 1.03 | |
| | | | | | | | | 697,330 | | | | 3.84 | |
United Arab Emirates (Cost $1,480,503) | | | | | | | | | | | | | | |
Anka a Sukuk Ltd. 10.000%, 08/25/2016 | | AED | | | 520,000 | | | | 141,574 | | | | 0.78 | |
Atlantic Finance Ltd. 10.750%, 05/27/2014 | | | | | 100,000 | | | | 110,500 | | | | 0.61 | |
Dana Gas Sukuk Ltd. 7.500%, 10/31/2049 | | | | | 200,000 | | | | 156,000 | | | | 0.86 | |
DP World Ltd. 6.850%, 07/02/2037 | | | | | 200,000 | | | | 219,250 | | | | 1.21 | |
Dubai Holding Commercial Operations MTN Ltd. 4.750%, 01/30/2014 | | EUR | | | 300,000 | | | | 381,071 | | | | 2.10 | |
Dubai Holding Commercial Operations MTN Ltd. 6.000%, 02/01/2017 | | GBP | | | 200,000 | | | | 310,323 | | | | 1.71 | |
Jafz Sukuk Ltd. 7.000%, 06/19/2019 | | | | | 200,000 | | | | 220,800 | | | | 1.21 | |
| | | | | | | | | 1,539,518 | | | | 8.48 | |
Total Debt Securities (Cost $17,845,215) | | | | | | | | | 17,982,618 | | | | 99.01 | |
| | | | |
Total Investments (Total Cost $17,845,215) | | | | | | | | | 17,982,618 | | | | 99.01 | |
| | | | |
Other Assets Less Liabilities (See Statements of Assets and Liabilities for further detail) | | | | | | | | | 180,707 | | | | 0.99 | |
| | | | |
Net Assets | | | | | | | | $ | 18,163,325 | | | | 100.00 | |
| (1) | Par values are stated in United States Dollars unless otherwise noted below. |
| (2) | Securities exempt from registration under Rule 144A of the Securities Act of 1933. These securities may not be publicly traded without registration under the Securities Act of 1933. |
| (3) | Restricted security that has been deemed illiquid. At October 31, 2012, the value of these restricted illiquid securities amounted to $1,017,455 or 5.6% of net assets. Additional information on each restricted illiquid security is as follows: |
| | | | | | | | | | |
| SECURITY | | ACQUISITION DATE | | ACQUISITION COST |
| Cemex Finance LLC 9.375%, 10/12/2022 | | | | 10/04/2012 | | | | | $200,000 | |
| Russian Standard Bank Via Russian Standard Finance S.A. 10.750%, 04/10/2018 | | | | 10/03/2012 | | | | | 200,000 | |
| Severstal OAO Via Steel Capital S.A. 5.900%, 10/17/2022 | | | | 10/04/2012 | | | | | 200,000 | |
See accompanying notes to the financial statements.
32
ASHMORE EMERGING MARKETS CORPORATE DEBT FUND
SCHEDULE OF INVESTMENTS (CONTINUED)
As of October 31, 2012
| | | | | | | | | | |
| SECURITY | | ACQUISITION DATE | | ACQUISITION COST |
| Telefonica Chile S.A. 3.875%, 10/12/2022 | | | | 10/04/2012 | | | | | 199,802 | |
VTB Bank OJSC Via VTB Capital S.A.6.950%, 10/17/2022 | | | | 10/04/2012 | | | | | 200,000 | |
| (4) | Issuer has defaulted on terms of debt obligation. |
Percentages shown are based on net assets.
At October 31, 2012, the Ashmore Emerging Markets Corporate Debt Fund had outstanding forward foreign currency exchange contracts as follows:
| | | | | | | | | | | | | | | | | | |
Settlement Date | | Counterparty | | Currency Buy | | Currency Buy
Amount
(Local
Currency) | | | Currency Sell | | Currency Sell
Amount
(Local Currency) | | | Unrealized Gain/(Loss) | |
| 11/13/2012 | | HSBC Bank PLC | | United States Dollar | | | 150,000 | | | Chinese Yuan Renminbi | | | 951,150 | | | | $(2,496) | |
| 11/19/2012 | | Union Bank of Switzerland - London | | United States Dollar | | | 59,679 | | | British Pound | | | 37,000 | | | | (26) | |
| 11/19/2012 | | Union Bank of Switzerland - London | | United States Dollar | | | 265,190 | | | British Pound | | | 165,377 | | | | (1,670) | |
| 11/19/2012 | | Deutsche Bank London | | United States Dollar | | | 1,478,940 | | | Euro | | | 1,142,206 | | | | (1,790) | |
| 12/21/2012 | | Union Bank of Switzerland - London | | Colombian Peso | | | 10,113,000 | | | United States Dollar | | | 5,581 | | | | (93) | |
| | | | | | | | | | | | | | | | | | |
| Total | | | | | | | | | | | | | | | | | $(6,075) | |
| | | | | | | | | | | | | | | | | | |
At October 31, 2012, for U.S. federal income tax purposes, gross unrealized appreciation, gross unrealized depreciation, net unrealized appreciation/(depreciation) on investments in securities (including the effects of foreign currency translation) and the cost basis of investments were as follows:
| | | | |
Federal tax cost of investments | | | $17,845,215 | |
Gross tax appreciation of investments | | | $919,272 | |
Gross tax depreciation of investments | | | (781,869) | |
Net tax appreciation of investments | | | $137,403 | |
The difference between book basis and tax basis net unrealized appreciation or depreciation is attributable primarily to the tax deferral of losses on wash sales.
The inputs or methodologies used for valuing securities are not necessarily an indication of the risks associated with investing in those securities and other financial instruments, if any. See note 4 in the Notes to the Financial Statements for more information regarding pricing inputs and valuation techniques. The following is a summary of the inputs used in valuing the Ashmore Emerging Markets Corporate Debt Fund’s investments and other financial instruments, which are carried at fair value, as of October 31, 2012:
| | | | | | | | | | | | | | | | |
| | | Level 1 | | | Level 2 | | | Level 3 | | | Total | |
Investments | | | | | | | | | | | | | | | | |
Assets: | | | | | | | | | | | | | | | | |
Corporate Bonds | | | $— | | | | $16,947,458 | | | | $— | | | | $16,947,458 | |
Corporate Convertible Bonds | | | — | | | | 218,600 | | | | — | | | | 218,600 | |
Government Bonds | | | — | | | | 121,750 | | | | — | | | | 121,750 | |
Financial Certificates | | | | | | | 518,374 | | | | | | | | 518,374 | |
Index Linked Corporate Bonds | | | — | | | | 176,436 | | | | — | | | | 176,436 | |
Total Investments | | | $— | | | | $17,982,618 | | | | $— | | | | $17,9.82,618 | |
See accompanying notes to the financial statements.
33
ASHMORE EMERGING MARKETS CORPORATE DEBT FUND
SCHEDULE OF INVESTMENTS (CONTINUED)
As of October 31, 2012
| | | | | | | | | | | | | | | | |
| | | Level 1 | | | Level 2 | | | Level 3 | | | Total | |
Other Financial Instruments | | | | | | | | | | | | | | | | |
Liabilities: | | | | | | | | | | | | | | | | |
Forward Foreign Currency Exchange Contracts | | | $— | | | | $(6,075 | ) | | | $— | | | | $(6,075) | |
| |
| |
The Fund discloses all transfers between levels based on valuations at the end of each reporting period. At October 31, 2012 there were no transfers between Level 1, Level 2 and Level 3 based on levels assigned to the securities on October 31, 2011. U.S. GAAP provides additional guidance for estimating fair value when the volume and level of activity for the asset or liability have significantly decreased as well as guidance on identifying circumstances that indicate when a transaction is not orderly.
The following is a summary of the fair values of the Fund’s derivative instruments*:
Fair Values of Financial Derivative Instruments on the Statements of Assets and Liabilities as of October 31, 2012:
| | | | | |
| | | Derivatives Not Accounted
for as Hedging Instruments |
| |
Liabilities: | | | | | |
Unrealized Depreciation on Forward Foreign Currency Exchange Contracts | | | $ | (6,075 | ) |
| | | | | |
The Effect of Financial Derivative Instruments on the Statements of Operations for the Year Ended October 31, 2012:
| | | | | |
| | | Derivatives Not Accounted
for as Hedging Instruments
Foreign Exchange |
Realized Gain on Derivatives Recognized resulting from Operations: | | | | | |
Net Realized Gain on Forward Foreign Currency Exchange Contracts | | | $ | 72,859 | |
| | | | | |
| |
Net Change in Unrealized Appreciation on Derivatives Recognized resulting from Operations: | | | | | |
Net Change in Unrealized Appreciation on Forward Foreign Currency Exchange Contracts | | | $ | 40,947 | |
| | | | | |
* See note 9 in the Notes to the Financial Statements for additional information.
See accompanying notes to the financial statements.
34
ASHMORE EMERGING MARKETS LOCAL CURRENCY BOND FUND
SCHEDULE OF INVESTMENTS
As of October 31, 2012
| | | | | | | | | | | | | | |
| | | Currency(1) | | Par | | | Value | | | % of Net
Assets | |
Debt Securities | | | | | | | | | | | | | | |
| | | | |
Brazil (Cost $5,068,583) | | | | | | | | | | | | | | |
Brazil (Fed Rep of) 8.500%, 01/05/2024 | | BRL | | | 2,160,000 | | | $ | 1,244,283 | | | | 1.70 | |
Brazil Letras do Tesouro Nacional 8.989%, 01/01/2015(2) | | BRL | | | 2,500,000 | | | | 1,044,039 | | | | 1.43 | |
Brazil Notas do Tesouro Nacional Serie B 6.000%, 08/15/2016 | | BRL | | | 410,000 | | | | 496,701 | | | | 0.68 | |
Brazil Notas do Tesouro Nacional Serie B 6.000%, 08/15/2020 | | BRL | | | 1,320,000 | | | | 1,694,887 | | | | 2.32 | |
Brazil Notas do Tesouro Nacional Serie B 6.000%, 08/15/2050 | | BRL | | | 480,000 | | | | 720,839 | | | | 0.98 | |
| | | | | | | | | 5,200,749 | | | | 7.11 | |
Chile (Cost $290,135) | | | | | | | | | | | | | | |
Chile (Rep of) 5.500%, 08/05/2020 | | CLP | | | 131,000,000 | | | | 295,271 | | | | 0.40 | |
| | | | | | | | | 295,271 | | | | 0.40 | |
Colombia (Cost $2,786,404) | | | | | | | | | | | | | | |
Colombia (Rep of) 12.000%, 10/22/2015 | | COP | | | 1,406,000,000 | | | | 948,711 | | | | 1.30 | |
Colombia (Rep of) 7.750%, 04/14/2021 | | COP | | | 1,941,000,000 | | | | 1,335,139 | | | | 1.83 | |
Colombia (Rep of) 4.375%, 03/21/2023 | | COP | | | 632,000,000 | | | | 343,297 | | | | 0.47 | |
Colombia (Rep of) 9.850%, 06/28/2027 | | COP | | | 586,000,000 | | | | 498,260 | | | | 0.68 | |
| | | | | | | | | 3,125,407 | | | | 4.28 | |
Ghana (Cost $106,692) | | | | | | | | | | | | | | |
Ghana (Rep of) 21.000%, 10/26/2015 | | GHS | | | 200,000 | | | | 106,015 | | | | 0.15 | |
| | | | | | | | | 106,015 | | | | 0.15 | |
Hungary (Cost $3,160,682) | | | | | | | | | | | | | | |
Hungary (Rep of) 7.750%, 08/24/2015 | | HUF | | | 450,000,000 | | | | 2,129,238 | | | | 2.91 | |
Hungary (Rep of) 6.750%, 11/24/2017 | | HUF | | | 109,660,000 | | | | 506,819 | | | | 0.69 | |
Hungary (Rep of) 7.000%, 06/24/2022 | | HUF | | | 148,000,000 | | | | 678,334 | | | | 0.93 | |
| | | | | | | | | 3,314,391 | | | | 4.53 | |
Malaysia (Cost $2,471,385) | | | | | | | | | | | | | | |
Malaysia (Rep of) 4.262%, 09/15/2016 | | MYR | | | 1,800,000 | | | | 614,956 | | | | 0.84 | |
Malaysia (Rep of) 4.378%, 11/29/2019 | | MYR | | | 2,039,000 | | | | 710,834 | | | | 0.97 | |
Malaysia (Rep of) 4.160%, 07/15/2021 | | MYR | | | 2,630,000 | | | | 904,379 | | | | 1.24 | |
Malaysia (Rep of) 4.392%, 04/15/2026 | | MYR | | | 400,000 | | | | 141,912 | | | | 0.20 | |
Malaysia (Rep of) 4.498%, 04/15/2030 | | MYR | | | 535,000 | | | | 191,099 | | | | 0.26 | |
| | | | | | | | | 2,563,180 | | | | 3.51 | |
Mexico (Cost $3,088,415) | | | | | | | | | | | | | | |
Mexican Bonos 7.500%, 06/03/2027 | | MXN | | | 6,100,000 | | | | 533,051 | | | | 0.73 | |
Mexican Bonos 8.500%, 05/31/2029 | | MXN | | | 4,800,000 | | | | 454,804 | | | | 0.62 | |
Mexican Bonos 7.750%, 05/29/2031 | | MXN | | | 4,300,000 | | | | 378,449 | | | | 0.52 | |
Mexican Bonos 10.000%, 11/20/2036 | | MXN | | | 8,850,000 | | | | 956,146 | | | | 1.31 | |
Mexican Bonos 8.500%, 11/18/2038 | | MXN | | | 10,700,000 | | | | 1,011,295 | | | | 1.38 | |
| | | | | | | | | 3,333,745 | | | | 4.56 | |
Nigeria (Cost $1,074,745) | | | | | | | | | | | | | | |
Nigeria (Rep of) 16.000%, 06/29/2019 | | NGN | | | 48,000,000 | | | | 340,762 | | | | 0.47 | |
Nigeria Treasury Bill 16.085%, 03/28/2013(2) | | NGN | | | 40,000,000 | | | | 241,673 | | | | 0.33 | |
Nigeria Treasury Bill 17.034%, 04/04/2013(2) | | NGN | | | 3,000,000 | | | | 18,095 | | | | 0.03 | |
Nigeria Treasury Bill 16.487%, 04/11/2013(2) | | NGN | | | 27,800,000 | | | | 166,835 | | | | 0.23 | |
Nigeria Treasury Bill 15.775%, 04/25/2013(2) | | NGN | | | 23,800,000 | | | | 142,153 | | | | 0.19 | |
Nigeria Treasury Bill 16.966%, 08/08/2013(2) | | NGN | | | 34,500,000 | | | | 199,925 | | | | 0.27 | |
| | | | | | | | | 1,109,443 | | | | 1.52 | |
See accompanying notes to the financial statements.
35
ASHMORE EMERGING MARKETS LOCAL CURRENCY BOND FUND
SCHEDULE OF INVESTMENTS (CONTINUED)
As of October 31, 2012
| | | | | | | | | | | | | | |
| | | Currency(1) | | Par | | | Value | | | % of Net
Assets | |
Peru (Cost $904,422) | | | | | | | | | | | | | | |
Peru (Rep of) 8.600%, 08/12/2017 | | PEN | | | 710,000 | | | $ | 338,356 | | | | 0.46 | |
Peru (Rep of) 7.840%, 08/12/2020 | | PEN | | | 779,000 | | | | 371,990 | | | | 0.51 | |
Peru (Rep of) 8.200%, 08/12/2026 | | PEN | | | 387,000 | | | | 204,080 | | | | 0.28 | |
Peru (Rep of) 6.950%, 08/12/2031 | | PEN | | | 410,000 | | | | 192,747 | | | | 0.26 | |
| | | | | | | | | 1,107,173 | | | | 1.51 | |
Philippines (Cost $205,478) | | | | | | | | | | | | | | |
Philippines (Rep of) 6.250%, 01/14/2036 | | PHP | | | 10,000,000 | | | | 283,787 | | | | 0.39 | |
| | | | | | | | | 283,787 | | | | 0.39 | |
Poland (Cost $6,312,445) | | | | | | | | | | | | | | |
Poland (Rep of) 4.202%, 07/25/2014(2) | | PLN | | | 1,090,000 | | | | 319,866 | | | | 0.44 | |
Poland (Rep of) 6.250%, 10/24/2015 | | PLN | | | 190,000 | | | | 63,321 | | | | 0.09 | |
Poland (Rep of) 5.000%, 04/25/2016 | | PLN | | | 3,600,000 | | | | 1,163,673 | | | | 1.59 | |
Poland (Rep of) 3.000%, 08/24/2016 | | PLN | | | 1,970,000 | | | | 823,443 | | | | 1.13 | |
Poland (Rep of) 4.750%, 10/25/2016 | | PLN | | | 1,200,000 | | | | 385,335 | | | | 0.53 | |
Poland (Rep of) 4.750%, 04/25/2017 | | PLN | | | 5,625,000 | | | | 1,807,844 | | | | 2.47 | |
Poland (Rep of) 5.750%, 10/25/2021 | | PLN | | | 1,670,000 | | | | 570,153 | | | | 0.78 | |
Poland (Rep of) 5.750%, 09/23/2022 | | PLN | | | 3,340,000 | | | | 1,145,851 | | | | 1.57 | |
Poland (Rep of) 2.750%, 08/25/2023 | | PLN | | | 800,000 | | | | 266,863 | | | | 0.36 | |
| | | | | | | | | 6,546,349 | | | | 8.96 | |
Russian Federation (Cost $11,334,348) | | | | | | | | | | | | | | |
Russian Federal Bond - OFZ 7.100%, 03/13/2014 | | RUB | | | 31,970,000 | | | | 1,026,306 | | | | 1.40 | |
Russian Federal Bond - OFZ 7.350%, 01/20/2016 | | RUB | | | 12,590,000 | | | | 406,735 | | | | 0.56 | |
Russian Federal Bond - OFZ 6.900%, 08/03/2016 | | RUB | | | 20,590,000 | | | | 656,126 | | | | 0.90 | |
Russian Federal Bond - OFZ 7.400%, 04/19/2017 | | RUB | | | 25,690,000 | | | | 832,977 | | | | 1.14 | |
Russian Federal Bond - OFZ 7.400%, 06/14/2017 | | RUB | | | 89,180,000 | | | | 2,891,021 | | | | 3.95 | |
Russian Federal Bond - OFZ 7.500%, 03/15/2018 | | RUB | | | 49,950,000 | | | | 1,624,364 | | | | 2.22 | |
Russian Federal Bond - OFZ 7.500%, 02/27/2019 | | RUB | | | 45,230,000 | | | | 1,470,871 | | | | 2.01 | |
Russian Federal Bond - OFZ 7.600%, 04/14/2021 | | RUB | | | 19,700,000 | | | | 640,930 | | | | 0.88 | |
Russian Federal Bond - OFZ 7.600%, 07/20/2022 | | RUB | | | 16,380,000 | | | | 532,674 | | | | 0.73 | |
Russian Federal Bond - OFZ 8.150%, 02/03/2027 | | RUB | | | 35,541,000 | | | | 1,180,828 | | | | 1.62 | |
| | | | | | | | | 11,262,832 | | | | 15.41 | |
South Africa (Cost $7,389,448) | | | | | | | | | | | | | | |
South Africa (Rep of) 13.500%, 09/15/2015 | | ZAR | | | 5,330,000 | | | | 743,978 | | | | 1.02 | |
South Africa (Rep of) 8.250%, 09/15/2017 | | ZAR | | | 9,050,000 | | | | 1,148,346 | | | | 1.57 | |
South Africa (Rep of) 8.000%, 12/21/2018 | | ZAR | | | 11,510,000 | | | | 1,451,126 | | | | 1.98 | |
South Africa (Rep of) 7.250%, 01/15/2020 | | ZAR | | | 10,526,200 | | | | 1,266,805 | | | | 1.73 | |
South Africa (Rep of) 6.750%, 03/31/2021 | | ZAR | | | 1,860,000 | | | | 215,610 | | | | 0.29 | |
South Africa (Rep of) 7.750%, 02/28/2023 | | ZAR | | | 2,970,000 | | | | 357,306 | | | | 0.49 | |
South Africa (Rep of) 10.500%, 12/21/2026 | | ZAR | | | 6,800,000 | | | | 969,082 | | | | 1.33 | |
South Africa (Rep of) 7.000%, 02/28/2031 | | ZAR | | | 5,400,000 | | | | 546,493 | | | | 0.75 | |
South Africa (Rep of) 6.500%, 02/28/2041 | | ZAR | | | 3,320,000 | | | | 299,882 | | | | 0.41 | |
| | | | | | | | | 6,998,628 | | | | 9.57 | |
Thailand (Cost $2,635,145) | | | | | | | | | | | | | | |
Thailand (Rep of) 3.625%, 05/22/2015 | | THB | | | 2,500,000 | | | | 82,872 | | | | 0.11 | |
Thailand (Rep of) 3.250%, 06/16/2017 | | THB | | | 11,000,000 | | | | 360,945 | | | | 0.49 | |
Thailand (Rep of) 5.125%, 03/13/2018 | | THB | | | 13,100,000 | | | | 468,365 | | | | 0.64 | |
Thailand (Rep of) 3.450%, 03/08/2019 | | THB | | | 2,500,000 | | | | 82,638 | | | | 0.11 | |
Thailand (Rep of) 3.875%, 06/13/2019 | | THB | | | 7,000,000 | | | | 238,070 | | | | 0.33 | |
Thailand (Rep of) 1.200%, 07/14/2021 | | THB | | | 15,000,000 | | | | 518,233 | | | | 0.71 | |
Thailand (Rep of) 3.650%, 12/17/2021 | | THB | | | 6,000,000 | | | | 200,976 | | | | 0.28 | |
Thailand (Rep of) 5.500%, 03/13/2023 | | THB | | | 1,700,000 | | | | 65,241 | | | | 0.09 | |
Thailand (Rep of) 3.625%, 06/16/2023 | | THB | | | 5,785,000 | | | | 191,284 | | | | 0.26 | |
Thailand (Rep of) 4.750%, 12/20/2024 | | THB | | | 5,280,000 | | | | 192,708 | | | | 0.26 | |
Thailand (Rep of) 5.670%, 03/13/2028 | | THB | | | 1,000,000 | | | | 40,470 | | | | 0.06 | |
See accompanying notes to the financial statements.
36
ASHMORE EMERGING MARKETS LOCAL CURRENCY BOND FUND
SCHEDULE OF INVESTMENTS (CONTINUED)
As of October 31, 2012
| | | | | | | | | | | | | | |
| | | Currency(1) | | Par | | | Value | | | % of Net
Assets | |
Thailand - (continued) | | | | | | | | | | | | | | |
Thailand (Rep of) 3.775%, 06/25/2032 | | THB | | | 8,000,000 | | | $ | 258,678 | | | | 0.35 | |
| | | | | | | | | 2,700,480 | | | | 3.69 | |
Turkey (Cost $3,328,879) | | | | | | | | | | | | | | |
Turkey (Rep of) 9.000%, 05/21/2014 | | TRY | | | 1,267,000 | | | | 1,030,822 | | | | 1.41 | |
Turkey (Rep of) 4.000%, 04/01/2020 | | TRY | | | 741,000 | | | | 558,456 | | | | 0.76 | |
Turkey (Rep of) 3.000%, 02/23/2022 | | TRY | | | 3,170,000 | | | | 1,955,730 | | | | 2.68 | |
| | | | | | | | | 3,545,008 | | | | 4.85 | |
Uruguay (Cost $1,282,776) | | | | | | | | | | | | | | |
Uruguay (Rep of) 5.000%, 09/14/2018 | | UYU | | | 6,200,000 | | | | 565,250 | | | | 0.77 | |
Uruguay (Rep of) 4.250%, 04/05/2027 | | UYU | | | 2,699,000 | | | | 240,936 | | | | 0.33 | |
Uruguay (Rep of) 4.375%, 12/15/2028 | | UYU | | | 6,150,000 | | | | 396,146 | | | | 0.54 | |
Uruguay (Rep of) 3.700%, 06/26/2037 | | UYU | | | 1,970,000 | | | | 162,808 | | | | 0.22 | |
Uruguay Notas del Tesoro 9.000%, 01/27/2014 | | UYU | | | 1,800,000 | | | | 90,501 | | | | 0.13 | |
Uruguay Notas del Tesoro 3.250%, 01/27/2019 | | UYU | | | 700,000 | | | | 92,506 | | | | 0.13 | |
| | | | | | | | | 1,548,147 | | | | 2.12 | |
Total Debt Securities (Cost $51,439,982) | | | | | | | | | 53,040,605 | | | | 72.56 | |
| | | | |
Short-Term Investments | | | | | | | | | | | | | | |
| | | | |
Landesbank Hessen-Thuerin, Time Deposit 0.160%, 11/01/2012 | | | | | 7,500,000 | | | | 7,500,000 | | | | 10.26 | |
Landesbank Hessen-Thuerin, Time Deposit 0.160%, 11/02/2012 | | | | | 7,500,000 | | | | 7,500,000 | | | | 10.26 | |
| | | | |
Total Short-Term Investments (Cost $15,000,000) | | | | | | | | | 15,000,000 | | | | 20.52 | |
| | | | |
Total Investments in Securities (Cost $66,439,982) | | | | | | | | | 68,040,605 | | | | 93.08 | |
| | | | |
Fully Funded Total Return Swaps | | | | | | | | | | | | | | |
| | | | |
India (Cost $658,989) | | | | | | | | | | | | | | |
India (Rep of), Issued by Credit Suisse Europe 8.790%, 11/08/2021 | | INR | | | 11,000,000 | | | | 210,957 | | | | 0.29 | |
India (Rep of), Issued by HSBC 7.490%, 04/16/2017 | | INR | | | 4,960,000 | | | | 89,850 | | | | 0.12 | |
India (Rep of), Issued by HSBC 7.830%, 04/11/2018 | | INR | | | 15,440,000 | | | | 282,936 | | | | 0.39 | |
| | | | |
| | | | | | | | | 583,743 | | | | 0.80 | |
Indonesia (Cost $5,826,337) | | | | | | | | | | | | | | |
Indonesia (Rep of), Issued by Barclays, 9.500%, 07/15/2031 | | IDR | | | 2,932,000,000 | | | | 404,064 | | | | 0.55 | |
Indonesia (Rep of), Issued by Credit Suisse, 9.500%, 06/15/2015 | | IDR | | | 1,500,000,000 | | | | 171,902 | | | | 0.24 | |
Indonesia (Rep of), Issued by Credit Suisse, 8.375%, 09/15/2026 | | IDR | | | 2,100,000,000 | | | | 262,341 | | | | 0.36 | |
Indonesia (Rep of), Issued by Deutsche Bank, 12.800%, 06/15/2021 | | IDR | | | 6,452,000,000 | | | | 993,583 | | | | 1.36 | |
Indonesia (Rep of), Issued by Deutsche Bank, 9.500%, 07/15/2031 | | IDR | | | 1,500,000,000 | | | | 206,718 | | | | 0.28 | |
Indonesia (Rep of), Issued by HSBC, 11.000%, 11/15/2020 | | IDR | | | 3,100,000,000 | | | | 432,095 | | | | 0.59 | |
Indonesia (Rep of), Issued by HSBC, 10.500%, 08/15/2030 | | IDR | | | 2,180,000,000 | | | | 323,062 | | | | 0.44 | |
Indonesia (Rep of), Issued by HSBC, 9.500%, 07/15/2031 | | IDR | | | 2,350,000,000 | | | | 323,858 | | | | 0.44 | |
See accompanying notes to the financial statements.
37
ASHMORE EMERGING MARKETS LOCAL CURRENCY BOND FUND
SCHEDULE OF INVESTMENTS (CONTINUED)
As of October 31, 2012
| | | | | | | | | | | | | | |
| | | Currency(1) | | Par | | | Value | | | % of Net
Assets | |
Indonesia - (continued) | | | | | | | | | | | | | | |
Indonesia (Rep of), Issued by HSBC 8.250%, 06/15/2032 | | IDR | | | 5,200,000,000 | | | $ | 645,256 | | | | 0.88 | |
Indonesia (Rep of), Issued by Standard Chartered, 11.500%, 09/15/2019 | | IDR | | | 7,936,000,000 | | | | 1,102,499 | | | | 1.51 | |
Indonesia (Rep of), Issued by Standard Chartered, 8.375%, 09/15/2026 | | IDR | | | 2,100,000,000 | | | | 262,341 | | | | 0.36 | |
Indonesia (Rep of), Issued by Standard Chartered, 10.500%, 08/15/2030 | | IDR | | | 2,700,000,000 | | | | 400,122 | | | | 0.55 | |
Indonesia (Rep of), Issued by Standard Chartered, 8.250%, 07/15/2031 | | IDR | | | 1,700,000,000 | | | | 234,280 | | | | 0.32 | |
Indonesia (Rep of), Issued by Standard Chartered, 8.250%, 06/15/2032 | | IDR | | | 2,900,000,000 | | | | 359,854 | | | | 0.49 | |
| | | | |
| | | | | | | | | 6,121,975 | | | | 8.37 | |
Total Fully Funded Total Return Swaps (Cost $6,485,326) | | | | | | | | | 6,705,718 | | | | 9.17 | |
| | | | |
Total Investments (Total Cost $72,925,308) | | | | | | | | | 74,746,323 | | | | 102.25 | |
| | | | |
Liabilities Less Other Assets (See Statements of Assets and Liabilities for further detail) | | | | | | | | | (1,641,671 | ) | | | (2.25 | ) |
| | | | |
Net Assets | | | | | | | | $ | 73,104,652 | | | | 100.00 | |
| (1) | Par values are stated in United States Dollars unless otherwise noted below. |
| (2) | Zero coupon bond reflects effective yield on the date of purchase. |
Percentages shown are based on net assets.
At October 31, 2012, the Ashmore Emerging Markets Local Currency Bond Fund had outstanding forward foreign currency exchange contracts as follows:
| | | | | | | | | | | | | | | | | | |
Settlement Date | | Counterparty | | Currency Buy | | Currency Buy Amount (Local Currency) | | | Currency Sell | | Currency Sell Amount (Local Currency) | | | Unrealized
Gain/(Loss) | |
| 11/05/2012 | | Bank of America Los Angeles | | Brazilian Real | | | 738,116 | | | United States Dollar | | | 364,052 | | | | $ (887) | |
| 11/05/2012 | | HSBC | | Brazilian Real | | | 738,116 | | | United States Dollar | | | 364,052 | | | | (887) | |
| 11/05/2012 | | Deutsche Bank London | | Brazilian Real | | | 408,600 | | | United States Dollar | | | 200,000 | | | | 1,038 | |
| 11/05/2012 | | Barclays Wholesale GTS | | United States Dollar | | | 460,085 | | | Brazilian Real | | | 944,831 | | | | (4,787) | |
| 11/05/2012 | | HSBC | | United States Dollar | | | 457,644 | | | Brazilian Real | | | 940,000 | | | | (4,852) | |
| 11/13/2012 | | Barclays Wholesale GTS | | Chinese Yuan Renminbi | | | 8,801,480 | | | United States Dollar | | | 1,390,000 | | | | 21,127 | |
| 11/13/2012 | | Barclays Wholesale GTS | | United States Dollar | | | 1,383,228 | | | Chinese Yuan Renminbi | | | 8,801,480 | | | | (27,899) | |
| 11/14/2012 | | Union Bank of Switzerland | | Philippine Peso | | | 27,188,250 | | | United States Dollar | | | 642,202 | | | | 17,543 | |
| 11/14/2012 | | Union Bank of Switzerland | | Philippine Peso | | | 4,780,397 | | | United States Dollar | | | 114,583 | | | | 1,417 | |
| 11/15/2012 | | Bank of America Los Angeles | | Russian Rouble | | | 24,888,880 | | | United States Dollar | | | 800,000 | | | | (8,565) | |
| 11/16/2012 | | Morgan Stanley & Co. International | | Colombian Peso | | | 302,775,600 | | | United States Dollar | | | 167,049 | | | | (2,104) | |
| 11/16/2012 | | Barclays Wholesale GTS | | Korean Won | | | 1,546,571,501 | | | United States Dollar | | | 1,383,028 | | | | 34,932 | |
| 11/16/2012 | | Barclays Wholesale GTS | | Mexican Peso | | | 16,808,493 | | | United States Dollar | | | 1,304,045 | | | | (22,435) | |
| 11/16/2012 | | HSBC | | Mexican Peso | | | 6,945,628 | | | United States Dollar | | | 540,444 | | | | (10,855) | |
| 11/16/2012 | | Deutsche Bank London | | Peruvian Neuevo Sol | | | 720,477 | | | United States Dollar | | | 276,151 | | | | 1,585 | |
| 11/16/2012 | | Bank of America Los Angeles | | United States Dollar | | | 159,669 | | | Chilean Peso | | | 76,564,255 | | | | 382 | |
| 11/16/2012 | | Deutsche Bank London | | United States Dollar | | | 44,000 | | | Peruvian Neuevo Sol | | | 114,796 | | | | (253) | |
See accompanying notes to the financial statements.
38
ASHMORE EMERGING MARKETS LOCAL CURRENCY BOND FUND
SCHEDULE OF INVESTMENTS (CONTINUED)
As of October 31, 2012
| | | | | | | | | | | | | | | | | | |
Settlement Date | | Counterparty | | Currency Buy | | Currency Buy Amount (Local Currency) | | | Currency Sell | | Currency Sell Amount (Local Currency) | | | Unrealized Gain/(Loss) | |
| 11/19/2012 | | Citibank London | | Chilean Peso | | | 519,306,720 | | | United States Dollar | | | 1,096,000 | | | | $(15,416) | |
| 11/19/2012 | | Barclays Wholesale GTS | | Malaysian Ringgit | | | 2,654,100 | | | United States Dollar | | | 860,268 | | | | 9,745 | |
| 11/19/2012 | | Barclays Wholesale GTS | | Malaysian Ringgit | | | 640,687 | | | United States Dollar | | | 207,644 | | | | 2,373 | |
| 11/21/2012 | | Chase Manhattan Bank London | | Indian Rupee | | | 11,036,859 | | | United States Dollar | | | 207,304 | | | | (3,027) | |
| 11/21/2012 | | Union Bank of Switzerland | | Indian Rupee | | | 20,451,750 | | | United States Dollar | | | 391,234 | | | | (12,701) | |
| 11/21/2012 | | Barclays Wholesale GTS | | Malaysian Ringgit | | | 2,040,000 | | | United States Dollar | | | 664,387 | | | | 4,223 | |
| 11/21/2012 | | Standard Chartered London | | Malaysian Ringgit | | | 2,279,425 | | | United States Dollar | | | 730,000 | | | | 17,081 | |
| 11/21/2012 | | Union Bank of Switzerland | | Malaysian Ringgit | | | 889,575 | | | United States Dollar | | | 290,000 | | | | 1,558 | |
| 11/21/2012 | | Barclays Wholesale GTS | | Thai Baht | | | 80,266,313 | | | United States Dollar | | | 2,596,439 | | | | 18,955 | |
| 11/21/2012 | | HSBC | | Thai Baht | | | 1,220,000 | | | United States Dollar | | | 39,613 | | | | 139 | |
| 11/21/2012 | | Bank of America Los Angeles | | United States Dollar | | | 1,450,000 | | | Indian Rupee | | | 77,963,600 | | | | 7,004 | |
| 11/21/2012 | | Barclays Wholesale GTS | | United States Dollar | | | 525,000 | | | Malaysian Ringgit | | | 1,599,780 | | | | 672 | |
| 11/21/2012 | | Citibank London | | United States Dollar | | | 940,157 | | | Thai Baht | | | 29,182,487 | | | | (10,723) | |
| 11/21/2012 | | Deutsche Bank London | | United States Dollar | | | 604,871 | | | Thai Baht | | | 18,576,500 | | | | (425) | |
| 11/21/2012 | | HSBC | | United States Dollar | | | 80,129 | | | Thai Baht | | | 2,490,818 | | | | (1,031) | |
| 11/27/2012 | | HSBC | | Polish Zloty | | | 4,196,336 | | | United States Dollar | | | 1,300,121 | | | | 9,971 | |
| 11/28/2012 | | Barclays Wholesale GTS | | Korean Won | | | 1,216,115,180 | | | United States Dollar | | | 1,087,283 | | | | 27,625 | |
| 11/28/2012 | | Union Bank of Switzerland | | Malaysian Ringgit | | | 699,776 | | | United States Dollar | | | 222,618 | | | | 6,612 | |
| 11/28/2012 | | Deutsche Bank London | | United States Dollar | | | 1,755,802 | | | Taiwan Dollar | | | 51,216,750 | | | | 2,694 | |
| 11/29/2012 | | Chase Manhattan Bank London | | Indian Rupee | | | 11,036,860 | | | United States Dollar | | | 207,401 | | | | (3,447) | |
| 11/29/2012 | | Barclays Wholesale GTS | | Indonesian Rupiah | | | 10,795,899,618 | | | United States Dollar | | | 1,114,128 | | | | 5,688 | |
| 11/29/2012 | | Standard Chartered London | | United States Dollar | | | 777,096 | | | Indonesian Rupiah | | | 7,518,400,500 | | | | (2,758) | |
| 11/30/2012 | | Citibank London | | Hungarian Forint | | | 157,670,480 | | | United States Dollar | | | 715,270 | | | | 2,806 | |
| 11/30/2012 | | Deutsche Bank London | | Hungarian Forint | | | 294,254,400 | | | United States Dollar | | | 1,320,000 | | | | 20,117 | |
| 11/30/2012 | | HSBC | | Hungarian Forint | | | 80,930,909 | | | United States Dollar | | | 365,748 | | | | 2,834 | |
| 11/30/2012 | | Deutsche Bank London | | Polish Zloty | | | 3,449,485 | | | United States Dollar | | | 1,100,000 | | | | (23,466) | |
| 11/30/2012 | | Northern Trust Securities | | Polish Zloty | | | 2,348,500 | | | United States Dollar | | | 700,000 | | | | 32,933 | |
| 11/30/2012 | | Bank of America Los Angeles | | South African Rand | | | 4,959,741 | | | United States Dollar | | | 570,000 | | | | (523) | |
| 11/30/2012 | | Deutsche Bank London | | Turkish Lira | | | 2,290,101 | | | United States Dollar | | | 1,264,173 | | | | 8,133 | |
| 11/30/2012 | | Deutsche Bank London | | Turkish Lira | | | 1,470,337 | | | United States Dollar | | | 812,900 | | | | 3,971 | |
| 11/30/2012 | | HSBC | | Turkish Lira | | | 3,100,000 | | | United States Dollar | | | 1,697,421 | | | | 24,839 | |
| 11/30/2012 | | Barclays Wholesale GTS | | United States Dollar | | | 586,617 | | | Czech Koruna | | | 11,330,016 | | | | 1,262 | |
| 11/30/2012 | | Deutsche Bank London | | United States Dollar | | | 1,836,606 | | | Hungarian Forint | | | 414,200,551 | | | | (49,779) | |
| 11/30/2012 | | Standard Chartered London | | United States Dollar | | | 389,154 | | | South African Rand | | | 3,416,652 | | | | (3,146) | |
| 12/04/2012 | | HSBC | | Brazilian Real | | | 2,391,361 | | | United States Dollar | | | 1,149,637 | | | | 22,210 | |
| 12/04/2012 | | Morgan Stanley & Co. International | | Brazilian Real | | | 2,380,000 | | | United States Dollar | | | 1,151,316 | | | | 14,965 | |
| 12/04/2012 | | Barclays Wholesale GTS | | United States Dollar | | | 70,000 | | | Brazilian Real | | | 142,576 | | | | 133 | |
| 12/07/2012 | | Barclays Wholesale GTS | | Mexican Peso | | | 16,808,491 | | | United States Dollar | | | 1,298,204 | | | �� | (19,296) | |
| 12/07/2012 | | Chase Manhattan Bank London | | Mexican Peso | | | 4,195,744 | | | United States Dollar | | | 320,000 | | | | (758) | |
| 12/07/2012 | | Goldman Sachs Intl Ltd. London | | Mexican Peso | | | 16,220,000 | | | United States Dollar | | | 1,257,023 | | | | (22,893) | |
| 12/07/2012 | | Union Bank of Switzerland | | Mexican Peso | | | 20,200,000 | | | United States Dollar | | | 1,546,116 | | | | (9,159) | |
| 12/07/2012 | | Chase Manhattan Bank London | | Peruvian Neuevo Sol | | | 720,476 | | | United States Dollar | | | 277,533 | | | | (150) | |
| 12/10/2012 | | Bank of America Los Angeles | | Polish Zloty | | | 3,330,750 | | | United States Dollar | | | 1,000,000 | | | | 38,272 | |
| 12/17/2012 | | Union Bank of Switzerland | | Russian Rouble | | | 13,125,000 | | | United States Dollar | | | 420,000 | | | | (5,147) | |
| 12/18/2012 | | Deutsche Bank London | | Indian Rupee | | | 38,941,000 | | | United States Dollar | | | 700,000 | | | | 17,104 | |
| 12/18/2012 | | Citibank London | | Korean Won | | | 864,601,140 | | | United States Dollar | | | 780,000 | | | | 12,566 | |
| 12/18/2012 | | Deutsche Bank London | | Malaysian Ringgit | | | 6,773,505 | | | United States Dollar | | | 2,171,761 | | | | 43,970 | |
| 12/20/2012 | | Barclays Wholesale GTS | | Russian Rouble | | | 45,028,800 | | | United States Dollar | | | 1,440,000 | | | | (17,591) | |
| 12/20/2012 | | HSBC | | Russian Rouble | | | 8,299,158 | | | United States Dollar | | | 264,321 | | | | (2,160) | |
| 12/20/2012 | | HSBC | | Russian Rouble | | | 12,621,644 | | | United States Dollar | | | 406,004 | | | | (7,300) | |
| 12/20/2012 | | Bank of America Los Angeles | | United States Dollar | | | 87,539 | | | Russian Rouble | | | 2,766,881 | | | | 136 | |
| 12/20/2012 | | Barclays Wholesale GTS | | United States Dollar | | | 1,420,000 | | | Russian Rouble | | | 44,584,038 | | | | 11,640 | |
| 12/20/2012 | | CSBF Global Foreign Exchange London | | United States Dollar | | | 379,286 | | | Russian Rouble | | | 11,780,608 | | | | 7,149 | |
| 12/20/2012 | | CSBF Global Foreign Exchange London | | United States Dollar | | | 100,239 | | | Russian Rouble | | | 3,109,405 | | | | 2,016 | |
| 12/21/2012 | | Citibank London | | United States Dollar | | | 1,636,295 | | | Colombian Peso | | | 2,967,829,500 | | | | 25,844 | |
| 01/03/2013 | | Banco Santander New York | | Brazilian Real | | | 480,000 | | | United States Dollar | | | 234,078 | | | | 131 | |
| 01/03/2013 | | Chase Manhattan Bank London | | Brazilian Real | | | 485,161 | | | United States Dollar | | | 235,401 | | | | 1,326 | |
| 01/15/2013 | | Union Bank of Switzerland | | Indian Rupee | | | 22,073,719 | | | United States Dollar | | | 396,154 | | | | 8,288 | |
See accompanying notes to the financial statements.
39
ASHMORE EMERGING MARKETS LOCAL CURRENCY BOND FUND
SCHEDULE OF INVESTMENTS (CONTINUED)
As of October 31, 2012
| | | | | | | | | | | | | | | | | | |
Settlement
Date | | Counterparty | | Currency Buy | | Currency
Buy
Amount
(Local
Currency) | | | Currency Sell | | Currency
Sell
Amount
(Local
Currency) | | | Unrealized Gain/(Loss) | |
| 01/18/2013 | | Morgan Stanley & Co. International | | Mexican Peso | | | 14,040,000 | | | United States Dollar | | | 1,078,764 | | | | $(15,258) | |
| 01/30/2013 | | Deutsche Bank London | | Polish Zloty | | | 1,560,635 | | | United States Dollar | | | 480,388 | | | | 3,411 | |
| 01/31/2013 | | Barclays Wholesale GTS | | Czech Koruna | | | 11,760,000 | | | United States Dollar | | | 610,344 | | | | (2,590) | |
| 01/31/2013 | | Union Bank of Switzerland | | Hungarian Forint | | | 82,352,150 | | | United States Dollar | | | 377,779 | | | | (5,378) | |
| 01/31/2013 | | Bank of America Los Angeles | | Polish Zloty | | | 3,641,482 | | | United States Dollar | | | 1,130,175 | | | | (1,422) | |
| 01/31/2013 | | Union Bank of Switzerland | | United States Dollar | | �� | 1,998,544 | | | Russian Rouble | | | 63,424,782 | | | | 6,964 | |
| 02/04/2013 | | Bank of America Los Angeles | | United States Dollar | | | 359,443 | | | Brazilian Real | | | 738,116 | | | | 806 | |
| 02/04/2013 | | HSBC | | United States Dollar | | | 359,390 | | | Brazilian Real | | | 738,116 | | | | 754 | |
| 02/11/2013 | | Deutsche Bank London | | Indian Rupee | | | 56,581,600 | | | United States Dollar | | | 1,070,000 | | | | (37,931) | |
| 04/15/2013 | | HSBC | | Chinese Offshore Yuan | | | 7,273,810 | | | United States Dollar | | | 1,130,000 | | | | 19,307 | |
| 04/15/2013 | | HSBC | | Chinese Offshore Yuan | | | 4,280,295 | | | United States Dollar | | | 670,000 | | | | 6,313 | |
| 04/15/2013 | | HSBC | | Chinese Offshore Yuan | | | 4,273,930 | | | United States Dollar | | | 670,000 | | | | 5,307 | |
| 04/15/2013 | | HSBC | | United States Dollar | | | 1,390,915 | | | Chinese Offshore Yuan | | | 8,846,915 | | | | (6,952) | |
| 04/15/2013 | | HSBC | | United States Dollar | | | 1,080,000 | | | Chinese Offshore Yuan | | | 6,981,120 | | | | (23,060) | |
| 05/02/2013 | | Standard Chartered London | | Chinese Offshore Yuan | | | 8,562,600 | | | United States Dollar | | | 1,340,000 | | | | 11,226 | |
| 05/02/2013 | | Standard Chartered London | | Chinese Offshore Yuan | | | 158,120 | | | United States Dollar | | | 24,864 | | | | 89 | |
| 05/02/2013 | | Standard Chartered London | | United States Dollar | | | 220,423 | | | Chinese Offshore Yuan | | | 1,413,570 | | | | (2,647) | |
| 05/02/2013 | | Standard Chartered London | | United States Dollar | | | 1,149,375 | | | Chinese Offshore Yuan | | | 7,307,150 | | | | (3,734) | |
| 06/17/2013 | | Standard Chartered London | | United States Dollar | | | 742,587 | | | Chinese Offshore Yuan | | | 4,780,030 | | | | (9,701) | |
| 07/17/2013 | | Standard Chartered London | | Chinese Offshore Yuan | | | 4,780,030 | | | United States Dollar | | | 740,000 | | | | 10,965 | |
| 07/17/2013 | | Standard Chartered London | | Chinese Offshore Yuan | | | 125,800 | | | United States Dollar | | | 19,705 | | | | 59 | |
| 07/17/2013 | | Standard Chartered London | | United States Dollar | | | 19,710 | | | Chinese Offshore Yuan | | | 125,800 | | | | (54) | |
| 04/13/2015 | | HSBC | | Chinese Offshore Yuan | | | 7,218,720 | | | United States Dollar | | | 1,080,000 | | | | 19,627 | |
| 04/13/2015 | | HSBC | | Chinese Offshore Yuan | | | 22,111 | | | United States Dollar | | | 3,374 | | | | (5) | |
| 04/13/2015 | | HSBC | | Chinese Offshore Yuan | | | 8,846,915 | | | United States Dollar | | | 1,349,129 | | | | (1,479) | |
| 04/13/2015 | | HSBC | | United States Dollar | | | 670,000 | | | Chinese Offshore Yuan | | | 4,330,210 | | | | 10,379 | |
| 04/13/2015 | | HSBC | | United States Dollar | | | 670,000 | | | Chinese Offshore Yuan | | | 4,343,945 | | | | 8,287 | |
| 04/13/2015 | | HSBC | | United States Dollar | | | 1,130,000 | | | Chinese Offshore Yuan | | | 7,413,591 | | | | 688 | |
| 05/04/2015 | | Standard Chartered London | | Chinese Offshore Yuan | | | 1,413,570 | | | United States Dollar | | | 213,337 | | | | 1,758 | |
| 05/04/2015 | | Standard Chartered London | | Chinese Offshore Yuan | | | 7,307,150 | | | United States Dollar | | | 1,113,895 | | | | (2,005) | |
| 05/04/2015 | | Standard Chartered London | | United States Dollar | | | 1,340,000 | | | Chinese Offshore Yuan | | | 8,720,720 | | | | 13,015 | |
| 06/17/2015 | | Standard Chartered London | | Chinese Offshore Yuan | | | 4,780,030 | | | United States Dollar | | | 719,234 | | | | 6,461 | |
| 07/17/2015 | | Standard Chartered London | | Chinese Offshore Yuan | | | 125,800 | | | United States Dollar | | | 19,129 | | | | (60) | |
| 07/17/2015 | | Standard Chartered London | | United States Dollar | | | 740,000 | | | Chinese Offshore Yuan | | | 4,905,830 | | | | (3,634) | |
| | | | | | | | | | | | | | | | | | |
Total | | | | | | | | | | | | | | | | | $210,095 | |
| | | | | | | | | | | | | | | | | | |
At October 31, 2012, the Ashmore Emerging Markets Local Currency Bond Fund had the following interest rate swap contracts outstanding:
| | | | | | | | | | | | | | |
Pay Rate Index/ Pay Rate | | Receive Rate/
Receive Rate Index | | Notional Amount | | Expiration
Date | | Unrealized
Gain/(Loss) | | | Counterparty |
Brazil CETIP Interbank
Deposit Rate | | 9.644% | | BRL | | 4,688,715 | | 01/02/2017 | | | $148,674 | | | HSBC |
| Singapore Offer Rate Fixing 6 Month | | 2.760% | | SGD | | 660,000 | | 06/14/2032 | | | 20,421 | | | Barclays Capital |
| 1.820% | | Singapore Offer Rate Fixing 6 Month | | SGD | | 1,140,000 | | 06/14/2022 | | | (9,830) | | | Barclays Capital |
Mexico Interbank
TIIE 28 Day Rate | | 6.515% | | MXN | | 48,000,000 | | 07/01/2016 | | | 155,630 | | | Barclays Capital |
| | | | | | | | | | | | | | |
| | | | | | | | | | | $314,895 | | | |
| | | | | | | | | | | | | | |
See accompanying notes to the financial statements.
40
ASHMORE EMERGING MARKETS LOCAL CURRENCY BOND FUND
SCHEDULE OF INVESTMENTS (CONTINUED)
As of October 31, 2012
At October 31, 2012, for U.S. federal income tax purposes, gross unrealized appreciation, gross unrealized depreciation, net unrealized appreciation/(depreciation) on investments in securities (including the effects of foreign currency translation) and the cost basis of investments were as follows:
| | | | |
Federal tax cost of investments | | | $72,988,318 | |
Gross tax appreciation of investments | | | $2,525,706 | |
Gross tax depreciation of investments | | | (767,701) | |
Net tax appreciation of investments | | | $1,758,005 | |
The difference between book basis and tax basis net unrealized appreciation or depreciation is attributable primarily to the tax deferral of losses on wash sales.
The inputs or methodologies used for valuing securities are not necessarily an indication of the risks associated with investing in those securities and other financial instruments, if any. See note 4 in the Notes to the Financial Statements for more information regarding pricing inputs and valuation techniques. The following is a summary of the inputs used in valuing the Ashmore Emerging Markets Local Currency Bond Fund’s investments and other financial instruments, which are carried at fair value, as of October 31, 2012:
| | | | | | | | | | | | | | | | |
| | | Level 1 | | | Level 2 | | | Level 3 | | | Total | |
Investments | | | | | | | | | | | | | | | | |
Assets: | | | | | | | | | | | | | | | | |
Government Bonds | | | $— | | | | $43,609,490 | | | | $— | | | | $43,609,490 | |
Index Linked Government Bonds | | | — | | | | 9,431,115 | | | | — | | | | 9,431,115 | |
Fully Funded Total Return Swaps | | | — | | | | 6,705,718 | | | | — | | | | 6,705,718 | |
Short-Term Investments | | | — | | | | 15,000,000 | | | | — | | | | 15,000,000 | |
| |
Total Investments | | | $— | | | | $74,746,323 | | | | $— | | | | $74,746,323 | |
| |
| | | | |
Other Financial Instruments | | | | | | | | | | | | | | | | |
Assets: | | | | | | | | | | | | | | | | |
Forward Foreign Currency Exchange Contracts | | | $— | | | | $620,425 | | | | $— | | | | $ 620,425 | |
Interest Rate Swap Contracts | | | — | | | | 324,725 | | | | — | | | | 324,725 | |
Liabilities: | | | | | | | | | | | | | | | | |
Forward Foreign Currency Exchange Contracts | | | — | | | | (410,330 | ) | | | — | | | | (410,330 | ) |
Interest Rate Swap Contracts | | | — | | | | (9,830 | ) | | | — | | | | (9,830 | ) |
| |
Total Other Financial Instruments | | | $— | | | | $524,990 | | | | $— | | | | $ 524,990 | |
| |
The Fund discloses all transfers between levels based on valuations at the end of each reporting period. At October 31, 2012, there were no transfers between Level 1, Level 2 and Level 3 based on levels assigned to the securities on October 31, 2011. U.S. GAAP provides additional guidance for estimating fair value when the volume and level of activity for the asset or liability have significantly decreased as well as guidance on identifying circumstances that indicate when a transaction is not orderly.
See accompanying notes to the financial statements.
41
ASHMORE EMERGING MARKETS LOCAL CURRENCY BOND FUND
SCHEDULE OF INVESTMENTS (CONTINUED)
As of October 31, 2012
The following is a summary of the fair values of the Fund’s derivative instruments*:
Fair Values of Financial Derivative Instruments on the Statements of Assets and Liabilities as of October 31, 2012:
| | | | | | | | |
| | | Derivatives Not Accounted for as
Hedging Instruments | |
| | | Foreign Exchange | | | Fixed Income/
Interest Rate | |
Assets: | | | | | | | | |
Unrealized Appreciation on Interest Rate Swap Contracts | | $ | — | | | $ | 324,725 | |
Unrealized Appreciation on Forward Foreign Currency Exchange Contracts | | | 620,425 | | | | — | |
| | | | |
| | $ | 620,425 | | | $ | 324,725 | |
| | | | |
| | |
Liabilities: | | | | | | | | |
Unrealized Depreciation on Interest Rate Swap Contracts | | $ | — | | | $ | (9,830 | ) |
Unrealized Depreciation on Forward Foreign Currency Exchange Contracts | | | (410,330 | ) | | | — | |
| | | | |
| | $ | (410,330 | ) | | $ | (9,830 | ) |
| | | | |
The Effect of Financial Derivative Instruments on the Statements of Operations for the Period Ended October 31, 2012:
| | | | | | | | |
| | | Derivatives Not Accounted for as
Hedging Instruments | |
| | | Foreign Exchange | | | Fixed Income/ Interest Rate | |
Realized Gain (Loss) on Derivatives Recognized resulting from Operations: | | | | | | | | |
Net Realized Gain on Forward Foreign Currency Exchange Contracts | | $ | 626,093 | | | $ | — | |
Net Realized Gain on Options Contracts | | | — | | | | 1,600 | |
Net Realized Gain on Interest Rate Swap Contracts | | | — | | | | 460,465 | |
Net Realized Loss on Futures Contracts | | | — | | | | (88,997) | |
| | | | |
| | $ | 626,093 | | | $ | 373,068 | |
| | | | |
| | |
Net Change in Unrealized Appreciation (Depreciation) on Derivatives Recognized resulting from Operations: | | | | | | | | |
Net Change in Unrealized Appreciation on Forward Foreign Currency Exchange Contracts | | $ | 87,799 | | | $ | — | |
Net Change in Unrealized Depreciation on Interest Rate Swap Contracts | | | — | | | | (49,057) | |
| | | | |
| | $ | 87,799 | | | $ | (49,057) | |
| | | | |
* See note 9 in the Notes to the Financial Statements for additional information.
See accompanying notes to the financial statements.
42
ASHMORE EMERGING MARKETS LOCAL CURRENCY FUND
SCHEDULE OF INVESTMENTS
As of October 31, 2012
| | | | | | | | | | | | | | |
| | | Currency(1) | | Par | | | Value | | | % of Net
Assets | |
Debt Securities | | | | | | | | | | | | | | |
| | | | |
Nigeria (Cost $788,483) | | | | | | | | | | | | | | |
Nigeria Treasury Bill 16.080%, 03/28/2013(2) | | NGN | | | 50,000,000 | | | $ | 302,091 | | | | 0.44 | |
Nigeria Treasury Bill 15.760%, 04/11/2013(2) | | NGN | | | 15,200,000 | | | | 91,219 | | | | 0.14 | |
Nigeria Treasury Bill 15.770%, 04/25/2013(2) | | NGN | | | 30,800,000 | | | | 183,963 | | | | 0.27 | |
Nigeria Treasury Bill 16.960%, 08/08/2013(2) | | NGN | | | 40,200,000 | | | | 232,956 | | | | 0.34 | |
| | | | | | | | | 810,229 | | | | 1.19 | |
Turkey (Cost $2,314,319) | | | | | | | | | | | | | | |
Turkey (Rep of) 6.750%, 09/11/2013(2) | | TRY | | | 4,400,000 | | | | 2,319,688 | | | | 3.39 | |
| | | | | | | | | 2,319,688 | | | | 3.39 | |
Total Debt Securities (Cost $3,102,802) | | | | | | | | | 3,129,917 | | | | 4.58 | |
| | | | |
Short-Term Investments | | | | | | | | | | | | | | |
| | | | |
ABN Amro Bank Jersey, Time Deposit 0.180%, 11/06/2012 | | | | | 10,000,000 | | | | 10,000,000 | | | | 14.63 | |
BNP Paribas, Certificate of Deposit 0.380%, 12/18/2012 | | | | | 10,000,000 | | | | 10,003,692 | | | | 14.63 | |
Landesbank-Hessen Thueringen, Time Deposit 0.160%, 11/01/2012 | | | | | 13,000,000 | | | | 13,000,000 | | | | 19.02 | |
Landesbank-Hessen Thueringen, Time Deposit 0.160%, 11/02/2012 | | | | | 13,000,000 | | | | 13,000,000 | | | | 19.01 | |
National Bank of Abu Dhabi, Time Deposit 0.120%, 11/02/2012 | | | | | 10,000,000 | | | | 10,000,000 | | | | 14.63 | |
National Bank of Abu Dhabi, Time Deposit 0.120%, 11/09/2012 | | | | | 10,000,000 | | | | 10,000,000 | | | | 14.63 | |
Riyad Bank London, Time Deposit 0.150%, 11/01/2012 | | | | | 10,000,000 | | | | 10,000,000 | | | | 14.63 | |
Riyad Bank London, Time Deposit 0.150%, 11/08/2012 | | | | | 10,000,000 | | | | 10,000,000 | | | | 14.63 | |
UBS A.G. - London, Certificate of Deposit 0.210%, 02/28/2013 | | | | | 10,000,000 | | | | 10,000,166 | | | | 14.63 | |
| | | | |
Total Short-Term Investments (Cost $96,000,000) | | | | | | | | | 96,003,858 | | | | 140.44 | |
| | | | |
Total Investments (Total Cost $99,102,802) | | | | | | | | | 99,133,775 | | | | 145.02 | |
| | | |
Liabilities Less Other Assets (See Statements of Assets and Liabilities for further detail) | | | | | | | (30,773,630 | ) | | | (45.02 | ) |
| | | | |
Net Assets | | | | | | | | $ | 68,360,145 | | | | 100.00 | |
| (1) | Par values are stated in United States Dollars unless otherwise noted below. |
| (2) | Zero coupon bond reflects effective yield on the date of purchase. |
Percentages shown are based on net assets.
See accompanying notes to the financial statements.
43
ASHMORE EMERGING MARKETS LOCAL CURRENCY FUND
SCHEDULE OF INVESTMENTS (CONTINUED)
As of October 31, 2012
At October 31, 2012, the Ashmore Emerging Markets Local Currency Fund had outstanding forward foreign currency exchange contracts as follows:
| | | | | | | | | | | | | | | | | | | | | | | | | | | |
Settlement Date | | Counterparty | | Currency Buy | | Currency Buy
Amount
(Local
Currency) | | Currency Sell | | Currency Sell
Amount
(Local
Currency) | | Unrealized
Gain/(Loss) |
| 11/05/2012 | | Bank of America Los Angeles | | Brazilian Real | | | | 1,025,886 | | | United States Dollar | | | | 505,986 | | | | | $ (1,233) | |
| 11/05/2012 | | HSBC Bank PLC | | Brazilian Real | | | | 1,025,886 | | | United States Dollar | | | | 505,986 | | | | | (1,233) | |
| 11/05/2012 | | Barclays Wholesale GTS | | Brazilian Real | | | | 279,686 | | | United States Dollar | | | | 137,000 | | | | | 610 | |
| 11/05/2012 | | Barclays Wholesale GTS | | Brazilian Real | | | | 447,700 | | | United States Dollar | | | | 220,000 | | | | | 277 | |
| 11/05/2012 | | Deutsche Bank London | | Brazilian Real | | | | 387,030 | | | United States Dollar | | | | 190,000 | | | | | 426 | |
| 11/05/2012 | | Barclays Wholesale GTS | | United States Dollar | | | | 772,393 | | | Brazilian Real | | | | 1,586,187 | | | | | (8,037) | |
| 11/05/2012 | | HSBC Bank PLC | | United States Dollar | | | | 769,231 | | | Brazilian Real | | | | 1,580,000 | | | | | (8,155) | |
| 11/13/2012 | | Bank of America Los Angeles | | Chinese Yuan Renminbi | | | | 10,955,885 | | | United States Dollar | | | | 1,728,467 | | | | | 28,072 | |
| 11/13/2012 | | Bank of America Los Angeles | | Chinese Yuan Renminbi | | | | 6,422,590 | | | United States Dollar | | | | 1,010,000 | | | | | 19,723 | |
| 11/13/2012 | | Bank of America Los Angeles | | Chinese Yuan Renminbi | | | | 4,028,535 | | | United States Dollar | | | | 630,000 | | | | | 15,888 | |
| 11/13/2012 | | Barclays Wholesale GTS | | Chinese Yuan Renminbi | | | | 7,978,320 | | | United States Dollar | | | | 1,260,000 | | | | | 19,151 | |
| 11/13/2012 | | Barclays Wholesale GTS | | Chinese Yuan Renminbi | | | | 6,212,710 | | | United States Dollar | | | | 980,000 | | | | | 16,074 | |
| 11/13/2012 | | Citibank London | | Chinese Yuan Renminbi | | | | 3,694,890 | | | United States Dollar | | | | 580,000 | | | | | 12,396 | |
| 11/13/2012 | | Standard Chartered London | | Chinese Yuan Renminbi | | | | 6,688,518 | | | United States Dollar | | | | 1,050,415 | | | | | 21,944 | |
| 11/13/2012 | | Bank of America Los Angeles | | United States Dollar | | | | 105,000 | | | Chinese Yuan Renminbi | | | | 660,975 | | | | | (973) | |
| 11/13/2012 | | Morgan Stanley & Co. International | | United States Dollar | | | | 120,000 | | | Chinese Yuan Renminbi | | | | 762,360 | | | | | (2,228) | |
| 11/14/2012 | | Union Bank of Switzerland - London | | Philippine Peso | | | | 52,488,723 | | | United States Dollar | | | | 1,258,119 | | | | | 15,562 | |
| 11/14/2012 | | Union Bank of Switzerland - London | | Philippine Peso | | | | 16,211,750 | | | United States Dollar | | | | 382,931 | | | | | 10,460 | |
| 11/15/2012 | | Bank of America Los Angeles | | Russian Rouble | | | | 23,333,325 | | | United States Dollar | | | | 750,000 | | | | | (8,030) | |
| 11/16/2012 | | Bank of America Los Angeles | | Chilean Peso | | | | 553,200,417 | | | United States Dollar | | | | 1,153,655 | | | | | (2,759) | |
| 11/16/2012 | | Morgan Stanley & Co. International | | Colombian Peso | | | | 2,080,398,100 | | | United States Dollar | | | | 1,147,806 | | | | | (14,455) | |
| 11/16/2012 | | Barclays Wholesale GTS | | Korean Won | | | | 1,653,065,015 | | | United States Dollar | | | | 1,478,261 | | | | | 37,337 | |
| 11/16/2012 | | Barclays Wholesale GTS | | Mexican Peso | | | | 57,026,779 | | | United States Dollar | | | | 4,424,282 | | | | | (76,115) | |
| 11/16/2012 | | HSBC Bank PLC | | Mexican Peso | | | | 134,202 | | | United States Dollar | | | | 10,442 | | | | | (210) | |
| 11/16/2012 | | Deutsche Bank London | | Peruvian Neuevo Sol | | | | 862,122 | | | United States Dollar | | | | 330,442 | | | | | 1,897 | |
| 11/16/2012 | | Morgan Stanley & Co. International | | United States Dollar | | | | 85,000 | | | Colombian Peso | | | | 155,082,500 | | | | | 515 | |
| 11/16/2012 | | Standard Chartered London | | United States Dollar | | | | 69,000 | | | Korean Won | | | | 75,762,000 | | | | | (462) | |
| 11/16/2012 | | Deutsche Bank London | | United States Dollar | | | | 102,000 | | | Peruvian Neuevo Sol | | | | 266,118 | | | | | (585) | |
| 11/19/2012 | | Citibank London | | Chilean Peso | | | | 505,565,940 | | | United States Dollar | | | | 1,067,000 | | | | | (15,008) | |
| 11/19/2012 | | Barclays Wholesale GTS | | Malaysian Ringgit | | | | 2,251,190 | | | United States Dollar | | | | 729,674 | | | | | 8,266 | |
| 11/21/2012 | | Chase Manhattan Bank London | | Indian Rupee | | | | 82,325,479 | | | United States Dollar | | | | 1,546,309 | | | | | (22,581) | |
| 11/21/2012 | | Union Bank of Switzerland - London | | Indian Rupee | | | | 18,240,750 | | | United States Dollar | | | | 348,938 | | | | | (11,328) | |
| 11/21/2012 | | Barclays Wholesale GTS | | Malaysian Ringgit | | | | 1,170,000 | | | United States Dollar | | | | 381,045 | | | | | 2,422 | |
| 11/21/2012 | | Standard Chartered London | | Malaysian Ringgit | | | | 2,185,750 | | | United States Dollar | | | | 700,000 | | | | | 16,379 | |
| 11/21/2012 | | Union Bank of Switzerland - London | | Malaysian Ringgit | | | | 1,472,400 | | | United States Dollar | | | | 480,000 | | | | | 2,579 | |
| 11/21/2012 | | Barclays Wholesale GTS | | Thai Baht | | | | 41,515,397 | | | United States Dollar | | | | 1,342,932 | | | | | 9,804 | |
| 11/21/2012 | | Barclays Wholesale GTS | | Thai Baht | | | | 10,811,500 | | | United States Dollar | | | | 350,000 | | | | | 2,281 | |
| 11/21/2012 | | Deutsche Bank London | | Thai Baht | | | | 6,216,172 | | | United States Dollar | | | | 202,405 | | | | | 142 | |
| 11/21/2012 | | Bank of America Los Angeles | | United States Dollar | | | | 1,550,000 | | | Indian Rupee | | | | 83,340,400 | | | | | 7,487 | |
| 11/21/2012 | | Barclays Wholesale GTS | | United States Dollar | | | | 545,000 | | | Malaysian Ringgit | | | | 1,660,724 | | | | | 698 | |
| 11/27/2012 | | HSBC Bank PLC | | Polish Zloty | | | | 26,413,163 | | | United States Dollar | | | | 8,183,404 | | | | | 62,759 | |
| 11/28/2012 | | Barclays Wholesale GTS | | Korean Won | | | | 1,138,016,040 | | | United States Dollar | | | | 1,017,457 | | | | | 25,851 | |
| 11/28/2012 | | Union Bank of Switzerland - London | | Malaysian Ringgit | | | | 2,784,495 | | | United States Dollar | | | | 885,823 | | | | | 26,309 | |
| 11/28/2012 | | Deutsche Bank London | | Taiwan Dollar | | | | 77,240,893 | | | United States Dollar | | | | 2,647,957 | | | | | (4,064) | |
| 11/29/2012 | | Chase Manhattan Bank London | | Indian Rupee | | | | 82,325,479 | | | United States Dollar | | | | 1,547,035 | | | | | (25,710) | |
| 11/29/2012 | | Barclays Wholesale GTS | | Indonesian Rupiah | | | | 18,164,327,500 | | | United States Dollar | | | | 1,874,544 | | | | | 9,569 | |
| 11/29/2012 | | HSBC Bank PLC | | Romanian Leu | | | | 4,244,503 | | | United States Dollar | | | | 1,204,764 | | | | | 535 | |
| 11/29/2012 | | Citibank London | | United States Dollar | | | | 167,000 | | | Indian Rupee | | | | 9,039,710 | | | | | (48) | |
| 11/29/2012 | | Deutsche Bank London | | United States Dollar | | | | 180,000 | | | Romanian Leu | | | | 636,466 | | | | | (735) | |
| 11/30/2012 | | Barclays Wholesale GTS | | Czech Koruna | | | | 44,227,901 | | | United States Dollar | | | | 2,289,922 | | | | | (4,927) | |
| 11/30/2012 | | Deutsche Bank London | | Hungarian Forint | | | | 245,212,000 | | | United States Dollar | | | | 1,100,000 | | | | | 16,764 | |
| 11/30/2012 | | HSBC Bank PLC | | Hungarian Forint | | | | 117,093,615 | | | United States Dollar | | | | 529,177 | | | | | 4,100 | |
| 11/30/2012 | | Goldman Sachs International Ltd. - London | | Israeli Shekel | | | | 4,151,352 | | | United States Dollar | | | | 1,072,071 | | | | | (4,570) | |
| 11/30/2012 | | Deutsche Bank London | | Polish Zloty | | | | 2,348,500 | | | United States Dollar | | | | 700,000 | | | | | 32,933 | |
| 11/30/2012 | | Deutsche Bank London | | Polish Zloty | | | | 2,759,588 | | | United States Dollar | | | | 880,000 | | | | | (18,772) | |
| 11/30/2012 | | Barclays Wholesale GTS | | Singapore Dollar | | | | 4,845,090 | | | United States Dollar | | | | 3,957,437 | | | | | 14,469 | |
See accompanying notes to the financial statements.
44
ASHMORE EMERGING MARKETS LOCAL CURRENCY FUND
SCHEDULE OF INVESTMENTS (CONTINUED)
As of October 31, 2012
| | | | | | | | | | | | | | | | | | | | | | | | | | | |
Settlement
Date | | Counterparty | | Currency Buy | | Currency Buy
Amount
(Local
Currency) | | Currency Sell | | Currency Sell
Amount
(Local
Currency) | | Unrealized Gain/(Loss) |
| 11/30/2012 | | Standard Chartered London | | South African Rand | | | | 12,961,411 | | | United States Dollar | | | | 1,476,293 | | | | | $ 11,933 | |
| 11/30/2012 | | HSBC Bank PLC | | Turkish Lira | | | | 2,900,000 | | | United States Dollar | | | | 1,587,910 | | | | | 23,236 | |
| 11/30/2012 | | Union Bank of Switzerland - London | | United States Dollar | | | | 530,000 | | | Czech Koruna | | | | 10,320,690 | | | | | (3,209) | |
| 11/30/2012 | | Deutsche Bank London | | United States Dollar | | | | 286,218 | | | Hungarian Forint | | | | 64,549,383 | | | | | (7,758) | |
| 11/30/2012 | | Union Bank of Switzerland - London | | United States Dollar | | | | 135,000 | | | Polish Zloty | | | | 434,571 | | | | | (623) | |
| 11/30/2012 | | Bank of America Los Angeles | | United States Dollar | | | | 152,424 | | | Russian Rouble | | | | 4,782,000 | | | | | 761 | |
| 11/30/2012 | | Bank of America Los Angeles | | United States Dollar | | | | 166,000 | | | Singapore Dollar | | | | 202,520 | | | | | (22) | |
| 11/30/2012 | | Deutsche Bank London | | United States Dollar | | | | 1,168,642 | | | Turkish Lira | | | | 2,117,042 | | | | | (7,518) | |
| 12/04/2012 | | HSBC Bank PLC | | Brazilian Real | | | | 2,317,487 | | | United States Dollar | | | | 1,114,123 | | | | | 21,524 | |
| 12/04/2012 | | Morgan Stanley & Co. International | | Brazilian Real | | | | 2,307,000 | | | United States Dollar | | | | 1,116,002 | | | | | 14,506 | |
| 12/04/2012 | | Barclays Wholesale GTS | | United States Dollar | | | | 240,000 | | | Brazilian Real | | | | 488,832 | | | | | 456 | |
| 12/07/2012 | | Barclays Wholesale GTS | | Mexican Peso | | | | 57,026,779 | | | United States Dollar | | | | 4,404,463 | | | | | (65,468) | |
| 12/07/2012 | | Goldman Sachs International Ltd. - London | | Mexican Peso | | | | 300,000 | | | United States Dollar | | | | 23,250 | | | | | (423) | |
| 12/07/2012 | | Chase Manhattan Bank London | | Peruvian Neuevo Sol | | | | 928,019 | | | United States Dollar | | | | 357,480 | | | | | (193) | |
| 12/07/2012 | | Deutsche Bank London | | United States Dollar | | | | 65,817 | | | Chilean Peso | | | | 31,410,000 | | | | | 380 | |
| 12/07/2012 | | Deutsche Bank London | | United States Dollar | | | | 140,000 | | | Mexican Peso | | | | 1,827,480 | | | | | 953 | |
| 12/10/2012 | | Bank of America Los Angeles | | Polish Zloty | | | | 3,697,133 | | | United States Dollar | | | | 1,110,000 | | | | | 42,482 | |
| 12/17/2012 | | Union Bank of Switzerland - London | | Russian Rouble | | | | 9,375,000 | | | United States Dollar | | | | 300,000 | | | | | (3,676) | |
| 12/18/2012 | | Deutsche Bank London | | Indian Rupee | | | | 36,715,800 | | | United States Dollar | | | | 660,000 | | | | | 16,127 | |
| 12/18/2012 | | Standard Chartered London | | Indian Rupee | | | | 28,222,500 | | | United States Dollar | | | | 530,000 | | | | | (10,278) | |
| 12/18/2012 | | Citibank London | | Korean Won | | | | 787,008,730 | | | United States Dollar | | | | 710,000 | | | | | 11,438 | |
| 12/18/2012 | | Deutsche Bank London | | Malaysian Ringgit | | | | 1,469,000 | | | United States Dollar | | | | 470,999 | | | | | 9,536 | |
| 12/18/2012 | | Citibank London | | Singapore Dollar | | | | 2,245,408 | | | United States Dollar | | | | 1,840,634 | | | | | 106 | |
| 12/20/2012 | | Bank of America Los Angeles | | Russian Rouble | | | | 38,966,700 | | | United States Dollar | | | | 1,232,831 | | | | | (1,917) | |
| 12/20/2012 | | Barclays Wholesale GTS | | Russian Rouble | | | | 46,279,600 | | | United States Dollar | | | | 1,480,000 | | | | | (18,079) | |
| 12/20/2012 | | Barclays Wholesale GTS | | United States Dollar | | | | 1,410,000 | | | Russian Rouble | | | | 44,270,066 | | | | | 11,558 | |
| 12/20/2012 | | Deutsche Bank London | | United States Dollar | | | | 70,000 | | | Russian Rouble | | | | 2,215,815 | | | | | 5 | |
| 12/21/2012 | | Citibank London | | United States Dollar | | | | 1,136,788 | | | Colombian Peso | | | | 2,061,850,000 | | | | | 17,954 | |
| 01/03/2013 | | Banco Santander New York | | Brazilian Real | | | | 2,410,000 | | | United States Dollar | | | | 1,175,266 | | | | | 658 | |
| 01/03/2013 | | Chase Manhattan Bank London | | Brazilian Real | | | | 2,404,128 | | | United States Dollar | | | | 1,166,486 | | | | | 6,572 | |
| 01/15/2013 | | Union Bank of Switzerland - London | | Indian Rupee | | | | 164,650,958 | | | United States Dollar | | | | 2,954,971 | | | | | 61,824 | |
| 01/18/2013 | | Morgan Stanley & Co. International | | Mexican Peso | | | | 260,000 | | | United States Dollar | | | | 19,977 | | | | | (283) | |
| 01/30/2013 | | Deutsche Bank London | | United States Dollar | | | | 849,260 | | | Polish Zloty | | | | 2,758,991 | | | | | (6,029) | |
| 01/31/2013 | | Barclays Wholesale GTS | | Czech Koruna | | | | 11,760,000 | | | United States Dollar | | | | 610,344 | | | | | (2,590) | |
| 01/31/2013 | | Union Bank of Switzerland - London | | Hungarian Forint | | | | 66,726,000 | | | United States Dollar | | | | 306,097 | | | | | (4,358) | |
| 01/31/2013 | | Union Bank of Switzerland - London | | Russian Rouble | | | | 236,882,196 | | | United States Dollar | | | | 7,464,265 | | | | | (26,011) | |
| 01/31/2013 | | Bank of America Los Angeles | | United States Dollar | | | | 1,997,997 | | | Polish Zloty | | | | 6,437,647 | | | | | 2,514 | |
| 02/04/2013 | | Bank of America Los Angeles | | United States Dollar | | | | 499,579 | | | Brazilian Real | | | | 1,025,886 | | | | | 1,120 | |
| 02/04/2013 | | HSBC Bank PLC | | United States Dollar | | | | 499,506 | | | Brazilian Real | | | | 1,025,886 | | | | | 1,047 | |
| 02/11/2013 | | Deutsche Bank London | | Indian Rupee | | | | 61,340,800 | | | United States Dollar | | | | 1,160,000 | | | | | (41,122) | |
| 04/15/2013 | | HSBC Bank PLC | | Chinese Offshore Yuan | | | | 6,758,850 | | | United States Dollar | | | | 1,050,000 | | | | | 17,940 | |
| 04/15/2013 | | HSBC Bank PLC | | Chinese Offshore Yuan | | | | 3,769,215 | | | United States Dollar | | | | 590,000 | | | | | 5,559 | |
| 04/15/2013 | | HSBC Bank PLC | | Chinese Offshore Yuan | | | | 3,763,610 | | | United States Dollar | | | | 590,000 | | | | | 4,673 | |
| 04/15/2013 | | HSBC Bank PLC | | United States Dollar | | | | 1,118,880 | | | Chinese Offshore Yuan | | | | 7,116,635 | | | | | (5,592) | |
| 04/15/2013 | | HSBC Bank PLC | | United States Dollar | | | | 1,110,000 | | | Chinese Offshore Yuan | | | | 7,175,040 | | | | | (23,700) | |
| 05/02/2013 | | Standard Chartered London | | Chinese Offshore Yuan | | | | 7,476,300 | | | United States Dollar | | | | 1,170,000 | | | | | 9,802 | |
| 05/02/2013 | | Standard Chartered London | | Chinese Offshore Yuan | | | | 138,060 | | | United States Dollar | | | | 21,709 | | | | | 77 | |
| 05/02/2013 | | Standard Chartered London | | United States Dollar | | | | 1,197,697 | | | Chinese Yuan Renminbi | | | | 7,614,360 | | | | | (23,101) | |
| 07/17/2013 | | Standard Chartered London | | United States Dollar | | | | 1,109,461 | | | Chinese Offshore Yuan | | | | 7,141,600 | | | | | (14,493) | |
| 07/17/2013 | | Standard Chartered London | | Chinese Offshore Yuan | | | | 8,332,755 | | | United States Dollar | | | | 1,290,000 | | | | | 19,114 | |
| 07/17/2013 | | Standard Chartered London | | Chinese Offshore Yuan | | | | 219,300 | | | United States Dollar | | | | 34,350 | | | | | 103 | |
| 07/17/2013 | | Standard Chartered London | | United States Dollar | | | | 220,988 | | | Chinese Offshore Yuan | | | | 1,410,455 | | | | | (601) | |
| 04/13/2015 | | HSBC Bank PLC | | Chinese Offshore Yuan | | | | 7,419,240 | | | United States Dollar | | | | 1,110,000 | | | | | 20,173 | |
| 04/13/2015 | | HSBC Bank PLC | | Chinese Yuan Renminbi | | | | 7,116,635 | | | United States Dollar | | | | 1,085,266 | | | | | 55,732 | |
| 04/13/2015 | | HSBC Bank PLC | | United States Dollar | | | | 590,000 | | | Chinese Offshore Yuan | | | | 3,813,170 | | | | | 9,140 | |
| 04/13/2015 | | HSBC Bank PLC | | United States Dollar | | | | 590,000 | | | Chinese Offshore Yuan | | | | 3,825,265 | | | | | 7,297 | |
| 04/13/2015 | | HSBC Bank PLC | | United States Dollar | | | | 1,050,000 | | | Chinese Offshore Yuan | | | | 6,888,735 | | | | | 639 | |
| 04/13/2015 | | HSBC Bank PLC | | United States Dollar | | | | 1,328 | | | Chinese Offshore Yuan | | | | 8,705 | | | | | 2 | |
| 05/04/2015 | | Standard Chartered London | | Chinese Offshore Yuan | | | | 7,614,360 | | | United States Dollar | | | | 1,160,726 | | | | | (2,090) | |
See accompanying notes to the financial statements.
45
ASHMORE EMERGING MARKETS LOCAL CURRENCY FUND
SCHEDULE OF INVESTMENTS (CONTINUED)
As of October 31, 2012
| | | | | | | | | | | | | | | | | | |
Settlement
Date | | Counterparty | | Currency Buy | | Currency Buy
Amount
(Local
Currency) | | | Currency Sell | | Currency Sell
Amount
(Local
Currency) | | | Unrealized
Gain/(Loss) | |
| 05/04/2015 | | Standard Chartered London | | United States Dollar | | | 1,170,000 | | | Chinese Offshore Yuan | | | 7,614,360 | | | | $ 11,364 | |
| 07/17/2015 | | Standard Chartered London | | Chinese Offshore Yuan | | | 7,141,600 | | | United States Dollar | | | 1,074,571 | | | | 9,652 | |
| 07/17/2015 | | Standard Chartered London | | Chinese Offshore Yuan | | | 1,410,455 | | | United States Dollar | | | 214,469 | | | | (670) | |
| 07/17/2015 | | Standard Chartered London | | United States Dollar | | | 1,290,000 | | | Chinese Offshore Yuan | | | 8,552,055 | | | | (6,335) | |
| | | | | | | | | | | | | | | | | | |
Total | | | | | | | | | | | | | | | | | $ 363,279 | |
| | | | | | | | | | | | | | | | | | |
At October 31, 2012, for U.S. federal income tax purposes, gross unrealized appreciation, gross unrealized depreciation, net unrealized appreciation/(depreciation) on investments in securities (including the effects of foreign currency translation) and the cost basis of investments were as follows:
| | | | |
Federal tax cost of investments | | | $99,102,802 | |
Gross tax appreciation of investments | | | $30,973 | |
Gross tax depreciation of investments | | | — | |
Net tax appreciation of investments | | | $30,973 | |
The difference between book basis and tax basis net unrealized appreciation or depreciation is attributable primarily to the tax deferral of losses on wash sales.
The inputs or methodologies used for valuing securities are not necessarily an indication of the risks associated with investing in those securities and other financial instruments, if any. See note 4 in the Notes to the Financial Statements for more information regarding pricing inputs and valuation techniques. The following is a summary of the inputs used in valuing the Ashmore Emerging Markets Local Currency Fund’s investments and other financial instruments, which are carried at fair value, as of October 31, 2012:
| | | | | | | | | | | | | | | | |
| | | Level 1 | | | Level 2 | | | Level 3 | | | Total | |
Investments | | | | | | | | | | | | | | | | |
Assets: | | | | | | | | | | | | | | | | |
Government Bonds | | | $— | | | | $ 3,129,917 | | | | $— | | | | $ 3,129,917 | |
Short-Term Investments | | | — | | | | 96,003,858 | | | | — | | | | 96,003,858 | |
Total Investments | | | $— | | | | $99,133,775 | | | | $— | | | | $99,133,775 | |
Other Financial Instruments | | | | | | | | | | | | | | | | |
Assets: | | | | | | | | | | | | | | | | |
Forward Foreign Currency Exchange Contracts | | | $— | | | | $ 871,636 | | | | $— | | | | $ 871,636 | |
Liabilities: | | | | | | | | | | | | | | | | |
Forward Foreign Currency Exchange Contracts | | | — | | | | (508,357 | ) | | | — | | | | (508,357 | ) |
Total Other Financial Instruments | | | $— | | | | $ 363,279 | | | | $— | | | | $ 363,279 | |
The Fund discloses all transfers between levels based on valuations at the end of each reporting period. At October 31, 2012 there were no transfers between Level 1, Level 2 and Level 3 based on levels assigned to the securities on October 31, 2011. U.S. GAAP provides additional guidance for estimating fair value when the volume and level of activity for the asset or liability have significantly decreased as well as guidance on identifying circumstances that indicate when a transaction is not orderly.
See accompanying notes to the financial statements.
46
ASHMORE EMERGING MARKETS LOCAL CURRENCY FUND
SCHEDULE OF INVESTMENTS (CONTINUED)
As of October 31, 2012
The following is a summary of the fair values of the Fund’s derivative instruments*:
Fair Values of Financial Derivative Instruments on the Statements of Assets and Liabilities as of October 31, 2012:
| | |
| | | Derivatives Not Accounted
for as Hedging Instruments |
| | | Foreign Exchange |
Assets: | | |
Unrealized Appreciation on Forward Foreign Currency Exchange Contracts | | $ 871,636 |
| | |
Liabilities: | | |
Unrealized Depreciation on Forward Foreign Currency Exchange Contracts | | $(508,357) |
| | |
The Effect of Financial Derivative Instruments on the Statements of Operations for the Period Ended October 31, 2012:
| | |
| | | Derivatives Not Accounted
for as Hedging Instruments |
| | | Foreign Exchange |
| Realized Gain on Derivatives Recognized resulting from Operations: | | |
Net Realized Gain on Forward Foreign Currency Exchange Contracts | | $2,095,185 |
Net Realized Gain on Written Options | | 1,455 |
| | |
| | $2,096,640 |
| | |
| |
Net Change in Unrealized Appreciation on Derivatives Recognized resulting from Operations: | | |
Net Change in Unrealized Appreciation on Forward Foreign Currency Exchange Contracts | | $ 717,768 |
| | |
| * | See note 9 in the Notes to the Financial Statements for additional information. |
See accompanying notes to the financial statements.
47
ASHMORE EMERGING MARKETS SOVEREIGN DEBT FUND
SCHEDULE OF INVESTMENTS
As of October 31, 2012
| | | | | | | | | | | | | | |
| | | Currency(1) | | Par | | | Value | | | % of Net Assets | |
Debt Securities | | | | | | | | | | | | | | |
| | | | |
Argentina (Cost $717,783) | | | | | | | | | | | | | | |
Argentina (Rep of) 8.750%, 06/02/2017 | | | | | 95,000 | | | $ | 80,750 | | | | 0.23 | |
Argentina (Rep of) 8.280%, 12/31/2033 | | | | | 507,131 | | | | 342,729 | | | | 0.98 | |
Argentina Boden Bonds 7.000%, 10/03/2015 | | | | | 263,000 | | | | 213,290 | | | | 0.61 | |
| | | | | | | | | 636,769 | | | | 1.82 | |
Azerbaijan (Cost $106,166) | | | | | | | | | | | | | | |
State Oil Co. of the Azerbaijan Republic 5.450%, 02/09/2017 | | | | | 100,000 | | | | 107,769 | | | | 0.31 | |
| | | | | | | | | 107,769 | | | | 0.31 | |
Belarus (Cost $452,109) | | | | | | | | | | | | | | |
Belarus (Rep of) 8.750%, 08/03/2015 | | | | | 200,000 | | | | 200,000 | | | | 0.57 | |
Belarus (Rep of) 8.950%, 01/26/2018 | | | | | 300,000 | | | | 299,250 | | | | 0.85 | |
| | | | | | | | | 499,250 | | | | 1.42 | |
Bolivia (Cost $60,000) | | | | | | | | | | | | | | |
Bolivian (Rep of) 4.875%, 10/29/2022(2)(3) | | | | | 60,000 | | | | 60,037 | | | | 0.17 | |
| | | | | | | | | 60,037 | | | | 0.17 | |
Brazil (Cost $2,285,985) | | | | | | | | | | | | | | |
Banco Nacional de Desenvolvimento Economico e Social 6.500%, 06/10/2019 | | | | | 240,000 | | | | 299,400 | | | | 0.86 | |
Banco Nacional de Desenvolvimento Economico e Social 5.500%, 07/12/2020 | | | | | 100,000 | | | | 119,750 | | | | 0.34 | |
Brazil (Fed Rep of) 5.875%, 01/15/2019 | | | | | 100,000 | | | | 123,500 | | | | 0.35 | |
Brazil (Fed Rep of) 4.875%, 01/22/2021 | | | | | 290,000 | | | | 347,275 | | | | 0.99 | |
Brazil (Fed Rep of) 2.625%, 01/05/2023 | | | | | 200,000 | | | | 199,500 | | | | 0.57 | |
Brazil (Fed Rep of) 8.875%, 04/15/2024 | | | | | 70,000 | | | | 112,700 | | | | 0.32 | |
Brazil (Fed Rep of) 10.125%, 05/15/2027 | | | | | 140,000 | | | | 252,700 | | | | 0.72 | |
Brazil (Fed Rep of) 8.250%, 01/20/2034 | | | | | 200,000 | | | | 328,000 | | | | 0.94 | |
Brazil (Fed Rep of) 7.125%, 01/20/2037 | | | | | 235,000 | | | | 353,675 | | | | 1.01 | |
Brazil (Fed Rep of) 5.625%, 01/07/2041 | | | | | 320,000 | | | | 409,600 | | | | 1.17 | |
| | | | | | | | | 2,546,100 | | | | 7.27 | |
Chile (Cost $545,273) | | | | | | | | | | | | | | |
Banco del Estado de Chile 4.125%, 10/07/2020 | | | | | 110,000 | | | | 121,226 | | | | 0.35 | |
Chile (Rep of) 3.250%, 09/14/2021 | | | | | 100,000 | | | | 108,500 | | | | 0.31 | |
Corp. Nacional del Cobre de Chile 7.500%, 01/15/2019 | | | | | 100,000 | | | | 129,951 | | | | 0.37 | |
Empresa Nacional del Petroleo 5.250%, 08/10/2020 | | | | | 200,000 | | | | 223,806 | | | | 0.64 | |
| | | | | | | | | 583,483 | | | | 1.67 | |
China (Cost $619,215) | | | | | | | | | | | | | | |
Sinochem Overseas Capital Co. Ltd. 4.500%, 11/12/2020 | | | | | 490,000 | | | | 528,052 | | | | 1.51 | |
Sinochem Overseas Capital Co. Ltd. 6.300%, 11/12/2040 | | | | | 100,000 | | | | 121,490 | | | | 0.34 | |
| | | | | | | | | 649,542 | | | | 1.85 | |
Colombia (Cost $1,243,197) | | | | | | | | | | | | | | |
Colombia (Rep of) 7.375%, 03/18/2019 | | | | | 260,000 | | | | 343,200 | | | | 0.98 | |
Colombia (Rep of) 11.750%, 02/25/2020 | | | | | 130,000 | | | | 210,275 | | | | 0.60 | |
Colombia (Rep of) 4.375%, 07/12/2021 | | | | | 200,000 | | | | 229,700 | | | | 0.66 | |
Colombia (Rep of) 8.125%, 05/21/2024 | | | | | 120,000 | | | | 179,700 | | | | 0.51 | |
Colombia (Rep of) 7.375%, 09/18/2037 | | | | | 100,000 | | | | 154,250 | | | | 0.44 | |
Colombia (Rep of) 6.125%, 01/18/2041 | | | | | 200,000 | | | | 273,000 | | | | 0.78 | |
| | | | | | | | | 1,390,125 | | | | 3.97 | |
Croatia (Cost $688,585) | | | | | | | | | | | | | | |
Croatia (Rep of) 6.250%, 04/27/2017 | | | | | 200,000 | | | | 219,800 | | | | 0.62 | |
Croatia (Rep of) 6.750%, 11/05/2019 | | | | | 100,000 | | | | 114,750 | | | | 0.33 | |
See accompanying notes to the financial statements.
48
ASHMORE EMERGING MARKETS SOVEREIGN DEBT FUND
SCHEDULE OF INVESTMENTS (CONTINUED)
As of October 31, 2012
| | | | | | | | | | | | | | |
| | | Currency(1) | | Par | | | Value | | | % of Net
Assets | |
Croatia - (continued) | | | | | | | | | | | | | | |
Croatia (Rep of) 6.625%, 07/14/2020 | | | | | 380,000 | | | $ | 434,595 | | | | 1.24 | |
| | | | | | | | | 769,145 | | | | 2.19 | |
Dominican Republic (Cost $210,839) | | | | | | | | | | | | | | |
Dominican (Rep of) 7.500%, 05/06/2021 | | | | | 200,000 | | | | 235,000 | | | | 0.67 | |
| | | | | | | | | 235,000 | | | | 0.67 | |
Ecuador (Cost $100,000) | | | | | | | | | | | | | | |
Ecuador (Rep of) 9.375%, 12/15/2015 | | | | | 100,000 | | | | 102,250 | | | | 0.29 | |
| | | | | | | | | 102,250 | | | | 0.29 | |
Egypt (Cost $197,814) | | | | | | | | | | | | | | |
Egypt (Rep of) 6.875%, 04/30/2040 | | | | | 100,000 | | | | 99,750 | | | | 0.28 | |
Nile Finance Ltd. 5.250%, 08/05/2015 | | | | | 100,000 | | | | 100,500 | | | | 0.29 | |
| | | | | | | | | 200,250 | | | | 0.57 | |
El Salvador (Cost $372,486) | | | | | | | | | | | | | | |
El Salvador (Rep of) 7.375%, 12/01/2019 | | | | | 100,000 | | | | 117,500 | | | | 0.33 | |
El Salvador (Rep of) 8.250%, 04/10/2032 | | | | | 100,000 | | | | 122,500 | | | | 0.35 | |
El Salvador (Rep of) 7.650%, 06/15/2035 | | | | | 150,000 | | | | 174,375 | | | | 0.50 | |
| | | | | | | | | 414,375 | | | | 1.18 | |
Georgia (Cost $219,274) | | | | | | | | | | | | | | |
JSC Georgian Railway 7.750%, 07/11/2022 | | | | | 200,000 | | | | 223,840 | | | | 0.64 | |
| | | | | | | | | 223,840 | | | | 0.64 | |
Ghana (Cost $108,974) | | | | | | | | | | | | | | |
Ghana (Rep of) 8.500%, 10/04/2017 | | | | | 100,000 | | | | 116,000 | | | | 0.33 | |
| | | | | | | | | 116,000 | | | | 0.33 | |
Hungary (Cost $570,472) | | | | | | | | | | | | | | |
Hungary (Rep of) 6.250%, 01/29/2020 | | | | | 140,000 | | | | 155,092 | | | | 0.44 | |
Hungary (Rep of) 6.375%, 03/29/2021 | | | | | 208,000 | | | | 231,670 | | | | 0.66 | |
Hungary (Rep of) 7.625%, 03/29/2041 | | | | | 224,000 | | | | 266,112 | | | | 0.76 | |
| | | | | | | | | 652,874 | | | | 1.86 | |
Indonesia (Cost $1,809,723) | | | | | | | | | | | | | | |
Indonesia (Rep of) 10.375%, 05/04/2014 | | | | | 90,000 | | | | 101,700 | | | | 0.29 | |
Indonesia (Rep of) 7.500%, 01/15/2016 | | | | | 150,000 | | | | 175,500 | | | | 0.50 | |
Indonesia (Rep of) 6.875%, 01/17/2018 | | | | | 130,000 | | | | 158,275 | | | | 0.45 | |
Indonesia (Rep of) 11.625%, 03/04/2019 | | | | | 100,000 | | | | 152,000 | | | | 0.44 | |
Indonesia (Rep of) 5.875%, 03/13/2020 | | | | | 150,000 | | | | 180,188 | | | | 0.52 | |
Indonesia (Rep of) 4.875%, 05/05/2021 | | | | | 200,000 | | | | 228,000 | | | | 0.65 | |
Indonesia (Rep of) 8.500%, 10/12/2035 | | | | | 250,000 | | | | 400,625 | | | | 1.14 | |
Indonesia (Rep of) 7.750%, 01/17/2038 | | | | | 100,000 | | | | 151,375 | | | | 0.43 | |
Majapahit Holding B.V. 7.750%, 10/17/2016 | | | | | 100,000 | | | | 119,000 | | | | 0.34 | |
Majapahit Holding B.V. 8.000%, 08/07/2019 | | | | | 110,000 | | | | 139,700 | | | | 0.40 | |
Majapahit Holding B.V. 7.750%, 01/20/2020 | | | | | 100,000 | | | | 125,750 | | | | 0.36 | |
Perusahaan Listrik Negara PT 5.250%, 10/24/2042(3) | | | | | 35,000 | | | | 35,742 | | | | 0.10 | |
| | | | | | | | | 1,967,855 | | | | 5.62 | |
Iraq (Cost $329,692) | | | | | | | | | | | | | | |
Iraq (Rep of) 5.800%, 01/15/2028 | | | | | 390,000 | | | | 362,700 | | | | 1.04 | |
| | | | | | | | | 362,700 | | | | 1.04 | |
Ivory Coast (Cost $328,341) | | | | | | | | | | | | | | |
Ivory Coast (Rep of) 3.750%, 12/31/2032 | | | | | 570,000 | | | | 513,000 | | | | 1.46 | |
| | | | | | | | | 513,000 | | | | 1.46 | |
Jordan (Cost $203,710) | | | | | | | | | | | | | | |
Jordan (Rep of) 3.875%, 11/12/2015 | | | | | 210,000 | | | | 204,540 | | | | 0.58 | |
| | | | | | | | | 204,540 | | | | 0.58 | |
Kazakhstan (Cost $1,131,782) | | | | | | | | | | | | | | |
Development Bank of Kazakhstan JSC 5.500%, 12/20/2015 | | | | | 200,000 | | | | 218,240 | | | | 0.62 | |
Kazakhstan Temir Zholy Finance B.V. 6.375%, 10/06/2020 | | | | | 200,000 | | | | 239,802 | | | | 0.69 | |
See accompanying notes to the financial statements.
49
ASHMORE EMERGING MARKETS SOVEREIGN DEBT FUND
SCHEDULE OF INVESTMENTS (CONTINUED)
As of October 31, 2012
| | | | | | | | | | | | | | |
| | | Currency(1) | | Par | | | Value | | | % of Net
Assets | |
Kazakhstan - (continued) | | | | | | | | | | | | | | |
Kazatomprom Natsionalnaya Atomnaya Kompaniya A.O. 6.250%, 05/20/2015 | | | | | 100,000 | | | $ | 109,625 | | | | 0.31 | |
KazMunayGas National Co. 11.750%, 01/23/2015 | | | | | 150,000 | | | | 179,877 | | | | 0.51 | |
KazMunayGas National Co. 9.125%, 07/02/2018 | | | | | 130,000 | | | | 169,491 | | | | 0.48 | |
KazMunayGas National Co. 7.000%, 05/05/2020 | | | | | 70,000 | | | | 86,014 | | | | 0.25 | |
KazMunayGas National Co. 6.375%, 04/09/2021 | | | | | 210,000 | | | | 247,538 | | | | 0.71 | |
| | | | | | | | | 1,250,587 | | | | 3.57 | |
Lebanon (Cost $726,772) | | | | | | | | | | | | | | |
Lebanon (Rep of) 6.375%, 03/09/2020 | | | | | 310,000 | | | | 322,400 | | | | 0.92 | |
Lebanon (Rep of) 6.100%, 10/04/2022 | | | | | 295,000 | | | | 297,213 | | | | 0.85 | |
Lebanon (Rep of) 6.600%, 11/27/2026 | | | | | 100,000 | | | | 100,750 | | | | 0.29 | |
| | | | | | | | | 720,363 | | | | 2.06 | |
Lithuania (Cost $943,131) | | | | | | | | | | | | | | |
Lithuania (Rep of) 5.125%, 09/14/2017 | | | | | 100,000 | | | | 112,000 | | | | 0.32 | |
Lithuania (Rep of) 7.375%, 02/11/2020 | | | | | 190,000 | | | | 241,300 | | | | 0.69 | |
Lithuania (Rep of) 6.125%, 03/09/2021 | | | | | 200,000 | | | | 240,500 | | | | 0.69 | |
Lithuania (Rep of) 6.625%, 02/01/2022 | | | | | 400,000 | | | | 495,000 | | | | 1.41 | |
| | | | | | | | | 1,088,800 | | | | 3.11 | |
Malaysia (Cost $268,136) | | | | | | | | | | | | | | |
Wakala Global Sukuk Bhd. 4.646%, 07/06/2021 | | | | | 250,000 | | | | 286,739 | | | | 0.82 | |
| | | | | | | | | 286,739 | | | | 0.82 | |
Mexico (Cost $1,938,368) | | | | | | | | | | | | | | |
Comision Federal de Electricidad 5.750%, 02/14/2042 | | | | | 200,000 | | | | 227,000 | | | | 0.65 | |
Mexico (Rep of) 5.625%, 01/15/2017 | | | | | 64,000 | | | | 74,816 | | | | 0.21 | |
Mexico (Rep of) 5.950%, 03/19/2019 | | | | | 60,000 | | | | 74,100 | | | | 0.21 | |
Mexico (Rep of) 5.125%, 01/15/2020 | | | | | 230,000 | | | | 274,850 | | | | 0.78 | |
Mexico (Rep of) 3.625%, 03/15/2022 | | | | | 70,000 | | | | 76,475 | | | | 0.22 | |
Mexico (Rep of) 6.750%, 09/27/2034 | | | | | 195,000 | | | | 275,925 | | | | 0.79 | |
Mexico (Rep of) 6.050%, 01/11/2040 | | | | | 274,000 | | | | 363,735 | | | | 1.04 | |
Mexico (Rep of) 4.750%, 03/08/2044 | | | | | 120,000 | | | | 133,200 | | | | 0.38 | |
Mexico (Rep of) 5.750%, 10/12/2110 | | | | | 196,000 | | | | 230,300 | | | | 0.66 | |
Pemex Project Funding Master Trust 5.750%, 03/01/2018 | | | | | 60,000 | | | | 69,900 | | | | 0.20 | |
Petroleos Mexicanos 8.000%, 05/03/2019 | | | | | 100,000 | | | | 131,000 | | | | 0.37 | |
Petroleos Mexicanos 6.000%, 03/05/2020 | | | | | 40,000 | | | | 47,800 | | | | 0.14 | |
Petroleos Mexicanos 6.500%, 06/02/2041 | | | | | 116,000 | | | | 143,985 | | | | 0.41 | |
Petroleos Mexicanos 5.500%, 06/27/2044 | | | | | 40,000 | | | | 43,600 | | | | 0.12 | |
| | | | | | | | | 2,166,686 | | | | 6.18 | |
Mongolia (Cost $100,988) | | | | | | | | | | | | | | |
Development Bank of Mongolia LLC 5.750%, 03/21/2017 | | | | | 100,000 | | | | 106,730 | | | | 0.30 | |
| | | | | | | | | 106,730 | | | | 0.30 | |
Morocco (Cost $75,325) | | | | | | | | | | | | | | |
Morocco (Rep of) 4.500%, 10/05/2020 | | EUR | | | 60,000 | | | | 77,264 | | | | 0.22 | |
| | | | | | | | | 77,264 | | | | 0.22 | |
Nigeria (Cost $113,047) | | | | | | | | | | | | | | |
Nigeria (Rep of) 6.750%, 01/28/2021 | | | | | 100,000 | | | | 115,250 | | | | 0.33 | |
| | | | | | | | | 115,250 | | | | 0.33 | |
Pakistan (Cost $125,755) | | | | | | | | | | | | | | |
Pakistan (Rep of) 7.125%, 03/31/2016 | | | | | 150,000 | | | | 139,500 | | | | 0.40 | |
| | | | | | | | | 139,500 | | | | 0.40 | |
Panama (Cost $492,212) | | | | | | | | | | | | | | |
Panama (Rep of) 7.250%, 03/15/2015 | | | | | 90,000 | | | | 102,600 | | | | 0.29 | |
Panama (Rep of) 8.875%, 09/30/2027 | | | | | 90,000 | | | | 146,025 | | | | 0.42 | |
Panama (Rep of) 9.375%, 04/01/2029 | | | | | 90,000 | | | | 154,350 | | | | 0.44 | |
See accompanying notes to the financial statements.
50
ASHMORE EMERGING MARKETS SOVEREIGN DEBT FUND
SCHEDULE OF INVESTMENTS (CONTINUED)
As of October 31, 2012
| | | | | | | | | | | | | | |
| | | Currency(1) | | Par | | | Value | | | % of Net
Assets | |
Panama - (continued) | | | | | | | | | | | | | | |
Panama (Rep of) 6.700%, 01/26/2036 | | | | | 105,000 | | | $ | 149,468 | | | | 0.43 | |
| | | | | | | | | 552,443 | | | | 1.58 | |
Peru (Cost $564,619) | | | | | | | | | | | | | | |
Peru (Rep of) 8.375%, 05/03/2016 | | | | | 50,000 | | | | 62,000 | | | | 0.18 | |
Peru (Rep of) 7.125%, 03/30/2019 | | | | | 100,000 | | | | 131,500 | | | | 0.37 | |
Peru (Rep of) 7.350%, 07/21/2025 | | | | | 150,000 | | | | 218,250 | | | | 0.62 | |
Peru (Rep of) 8.750%, 11/21/2033 | | | | | 134,000 | | | | 234,500 | | | | 0.67 | |
| | | | | | | | | 646,250 | | | | 1.84 | |
Philippines (Cost $1,752,064) | | | | | | | | | | | | | | |
Philippine (Rep of) 8.375%, 06/17/2019 | | | | | 250,000 | | | | 345,000 | | | | 0.99 | |
Philippine (Rep of) 4.000%, 01/15/2021 | | | | | 150,000 | | | | 168,188 | | | | 0.48 | |
Philippine (Rep of) 10.625%, 03/16/2025 | | | | | 140,000 | | | | 246,050 | | | | 0.70 | |
Philippine (Rep of) 5.500%, 03/30/2026 | | | | | 200,000 | | | | 253,000 | | | | 0.72 | |
Philippine (Rep of) 9.500%, 02/02/2030 | | | | | 220,000 | | | | 384,450 | | | | 1.10 | |
Philippine (Rep of) 7.750%, 01/14/2031 | | | | | 230,000 | | | | 355,350 | | | | 1.01 | |
Philippine (Rep of) 6.375%, 10/23/2034 | | | | | 100,000 | | | | 139,000 | | | | 0.40 | |
Power Sector Assets & Liabilities Management Corp. 7.390%, 12/02/2024 | | | | | 100,000 | | | | 140,250 | | | | 0.40 | |
| | | | | | | | | 2,031,288 | | | | 5.80 | |
Poland (Cost $839,770) | | | | | | | | | | | | | | |
Poland (Rep of) 6.375%, 07/15/2019 | | | | | 210,000 | | | | 261,450 | | | | 0.74 | |
Poland (Rep of) 5.000%, 03/23/2022 | | | | | 400,000 | | | | 466,076 | | | | 1.33 | |
Poland (Rep of) 3.000%, 03/17/2023 | | | | | 180,000 | | | | 177,404 | | | | 0.51 | |
| | | | | | | | | 904,930 | | | | 2.58 | |
Qatar (Cost $399,422) | | | | | | | | | | | | | | |
Qatar (Rep of) 6.400%, 01/20/2040 | | | | | 100,000 | | | | 139,350 | | | | 0.40 | |
Qatar (Rep of) 5.750%, 01/20/2042 | | | | | 220,000 | | | | 283,800 | | | | 0.81 | |
| | | | | | | | | 423,150 | | | | 1.21 | |
Romania (Cost $259,475) | | | | | | | | | | | | | | |
Romanian (Rep of) 6.750%, 02/07/2022 | | | | | 250,000 | | | | 288,750 | | | | 0.82 | |
| | | | | | | | | 288,750 | | | | 0.82 | |
Russian Federation (Cost $2,052,000) | | | | | | | | | | | | | | |
Russian Agricultural Bank OJSC Via RSHB Capital S.A. 7.750%, 05/29/2018 | | | | | 100,000 | | | | 119,230 | | | | 0.34 | |
Russian Foreign Bond - Eurobond 5.000%, 04/29/2020 | | | | | 100,000 | | | | 115,750 | | | | 0.33 | |
Russian Foreign Bond - Eurobond 12.750%, 06/24/2028 | | | | | 120,000 | | | | 237,060 | | | | 0.68 | |
Russian Foreign Bond - Eurobond 7.500%, 03/31/2030 | | | | | 577,375 | | | | 731,130 | | | | 2.09 | |
Russian Foreign Bond - Eurobond 5.625%, 04/04/2042 | | | | | 200,000 | | | | 240,260 | | | | 0.68 | |
Vnesheconombank Via VEB Finance PLC 5.450%, 11/22/2017 | | | | | 100,000 | | | | 109,367 | | | | 0.31 | |
Vnesheconombank Via VEB Finance PLC 6.902%, 07/09/2020 | | | | | 590,000 | | | | 700,023 | | | | 2.00 | |
Vnesheconombank Via VEB Finance PLC 6.800%, 11/22/2025 | | | | | 50,000 | | | | 59,188 | | | | 0.17 | |
| | | | | | | | | 2,312,008 | | | | 6.60 | |
Senegal (Cost $230,329) | | | | | | | | | | | | | | |
Senegal (Rep of) 8.750%, 05/13/2021 | | | | | 200,000 | | | | 242,000 | | | | 0.69 | |
| | | | | | | | | 242,000 | | | | 0.69 | |
Serbia (Cost $260,381) | | | | | | | | | | | | | | |
Serbia (Rep of) 7.250%, 09/28/2021 | | | | | 250,000 | | | | 266,250 | | | | 0.76 | |
| | | | | | | | | 266,250 | | | | 0.76 | |
See accompanying notes to the financial statements.
51
ASHMORE EMERGING MARKETS SOVEREIGN DEBT FUND
SCHEDULE OF INVESTMENTS (CONTINUED)
As of October 31, 2012
| | | | | | | | | | | | | | |
| | | Currency(1) | | Par | | | Value | | | % of Net
Assets | |
Slovenia (Cost $72,012) | | | | | | | | | | | | | | |
Slovenia (Rep of) 5.500%, 10/26/2022(2)(3) | | | | | 70,000 | | | $ | 70,770 | | | | 0.20 | |
| | | | | | | | | 70,770 | | | | 0.20 | |
South Africa (Cost $583,809) | | | | | | | | | | | | | | |
South Africa (Rep of) 6.875%, 05/27/2019 | | | | | 120,000 | | | | 149,448 | | | | 0.43 | |
South Africa (Rep of) 5.500%, 03/09/2020 | | | | | 150,000 | | | | 175,245 | | | | 0.50 | |
South Africa (Rep of) 5.875%, 05/30/2022 | | | | | 130,000 | | | | 157,348 | | | | 0.45 | |
South Africa (Rep of) 6.250%, 03/08/2041 | | | | | 100,000 | | | | 128,250 | | | | 0.36 | |
| | | | | | | | | 610,291 | | | | 1.74 | |
Sri Lanka (Cost $309,372) | | | | | | | | | | | | | | |
Sri Lanka (Rep of) 7.400%, 01/22/2015 | | | | | 100,000 | | | | 109,750 | | | | 0.31 | |
Sri Lanka (Rep of) 6.250%, 07/27/2021 | | | | | 200,000 | | | | 223,640 | | | | 0.64 | |
| | | | | | | | | 333,390 | | | | 0.95 | |
Turkey (Cost $1,955,457) | | | | | | | | | | | | | | |
Turkey (Rep of) 7.250%, 03/15/2015 | | | | | 80,000 | | | | 89,320 | | | | 0.26 | |
Turkey (Rep of) 7.000%, 09/26/2016 | | | | | 130,000 | | | | 151,125 | | | | 0.43 | |
Turkey (Rep of) 7.500%, 07/14/2017 | | | | | 100,000 | | | | 120,680 | | | | 0.35 | |
Turkey (Rep of) 6.750%, 04/03/2018 | | | | | 260,000 | | | | 309,530 | | | | 0.88 | |
Turkey (Rep of) 7.000%, 03/11/2019 | | | | | 100,000 | | | | 122,650 | | | | 0.35 | |
Turkey (Rep of) 7.500%, 11/07/2019 | | | | | 100,000 | | | | 126,950 | | | | 0.36 | |
Turkey (Rep of) 5.625%, 03/30/2021 | | | | | 100,000 | | | | 116,250 | | | | 0.33 | |
Turkey (Rep of) 7.375%, 02/05/2025 | | | | | 250,000 | | | | 326,875 | | | | 0.93 | |
Turkey (Rep of) 11.875%, 01/15/2030 | | | | | 40,000 | | | | 75,900 | | | | 0.22 | |
Turkey (Rep of) 8.000%, 02/14/2034 | | | | | 110,000 | | | | 157,300 | | | | 0.45 | |
Turkey (Rep of) 6.875%, 03/17/2036 | | | | | 114,000 | | | | 146,695 | | | | 0.42 | |
Turkey (Rep of) 7.250%, 03/05/2038 | | | | | 40,000 | | | | 54,000 | | | | 0.15 | |
Turkey (Rep of) 6.750%, 05/30/2040 | | | | | 100,000 | | | | 128,350 | | | | 0.37 | |
Turkey (Rep of) 6.000%, 01/14/2041 | | | | | 200,000 | | | | 235,000 | | | | 0.67 | |
| | | | | | | | | 2,160,625 | | | | 6.17 | |
Ukraine (Cost $1,375,371) | | | | | | | | | | | | | | |
Financing of Infrastrucural Projects State Enterprise 8.375%, 11/03/2017 | | | | | 150,000 | | | | 142,500 | | | | 0.41 | |
National JSC Naftogaz of Ukraine 9.500%, 09/30/2014 | | | | | 110,000 | | | | 112,068 | | | | 0.32 | |
Ukraine (Rep of) 6.875%, 09/23/2015 | | | | | 320,000 | | | | 319,584 | | | | 0.91 | |
Ukraine (Rep of) 6.580%, 11/21/2016 | | | | | 100,000 | | | | 98,956 | | | | 0.28 | |
Ukraine (Rep of) 9.250%, 07/24/2017 | | | | | 350,000 | | | | 381,700 | | | | 1.09 | |
Ukraine (Rep of) 7.750%, 09/23/2020 | | | | | 100,000 | | | | 104,362 | | | | 0.30 | |
Ukreximbank Via Biz Finance PLC 8.375%, 04/27/2015 | | | | | 260,000 | | | | 255,125 | | | | 0.73 | |
| | | | | | | | | 1,414,295 | | | | 4.04 | |
United Arab Emirates (Cost $613,076) | | | | | | | | | | | | | | |
Dubai DOF Sukuk Ltd. 6.396%, 11/03/2014 | | | | | 250,000 | | | | 268,375 | | | | 0.76 | |
Emirate of Dubai (Rep of) 7.750%, 10/05/2020 | | | | | 350,000 | | | | 422,625 | | | | 1.21 | |
| | | | | | | | | 691,000 | | | | 1.97 | |
Uruguay (Cost $931,817) | | | | | | | | | | | | | | |
Uruguay (Rep of) 8.000%, 11/18/2022 | | | | | 333,000 | | | | 481,185 | | | | 1.37 | |
Uruguay (Rep of) 6.875%, 09/28/2025 | | | | | 91,000 | | | | 125,580 | | | | 0.36 | |
Uruguay (Rep of) 7.875%, 01/15/2033 | | | | | 232,000 | | | | 359,600 | | | | 1.03 | |
Uruguay (Rep of) 7.625%, 03/21/2036 | | | | | 56,000 | | | | 86,940 | | | | 0.25 | |
| | | | | | | | | 1,053,305 | | | | 3.01 | |
Venezuela (Cost $1,428,109) | | | | | | | | | | | | | | |
Petroleos de Venezuela S.A. 5.250%, 04/12/2017 | | | | | 90,000 | | | | 71,100 | | | | 0.20 | |
Petroleos de Venezuela S.A. 12.750%, 02/17/2022 | | | | | 65,000 | | | | 66,788 | | | | 0.19 | |
Petroleos de Venezuela S.A. 5.375%, 04/12/2027 | | | | | 280,000 | | | | 175,000 | | | | 0.50 | |
Petroleos de Venezuela S.A. 5.500%, 04/12/2037 | | | | | 20,000 | | | | 12,250 | | | | 0.03 | |
See accompanying notes to the financial statements.
52
ASHMORE EMERGING MARKETS SOVEREIGN DEBT FUND
SCHEDULE OF INVESTMENTS (CONTINUED)
As of October 31, 2012
| | | | | | | | | | | | | | |
| | | Currency(1) | | Par | | | Value | | | % of Net Assets | |
Venezuela - (continued) | | | | | | | | | | | | | | |
Venezuela (Rep of) 8.500%, 10/08/2014 | | | | | 40,000 | | | $ | 40,600 | | | | 0.12 | |
Venezuela (Rep of) 5.750%, 02/26/2016 | | | | | 60,000 | | | | 55,350 | | | | 0.16 | |
Venezuela (Rep of) 7.750%, 10/13/2019 | | | | | 130,000 | | | | 113,100 | | | | 0.32 | |
Venezuela (Rep of) 6.000%, 12/09/2020 | | | | | 60,000 | | | | 45,750 | | | | 0.13 | |
Venezuela (Rep of) 12.750%, 08/23/2022 | | | | | 242,000 | | | | 259,545 | | | | 0.74 | |
Venezuela (Rep of) 9.000%, 05/07/2023 | | | | | 121,000 | | | | 106,178 | | | | 0.30 | |
Venezuela (Rep of) 8.250%, 10/13/2024 | | | | | 105,000 | | | | 86,625 | | | | 0.25 | |
Venezuela (Rep of) 7.650%, 04/21/2025 | | | | | 65,000 | | | | 51,188 | | | | 0.15 | |
Venezuela (Rep of) 11.750%, 10/21/2026 | | | | | 85,000 | | | | 86,062 | | | | 0.25 | |
Venezuela (Rep of) 9.250%, 09/15/2027 | | | | | 140,000 | | | | 126,350 | | | | 0.36 | |
Venezuela (Rep of) 9.250%, 05/07/2028 | | | | | 165,000 | | | | 145,612 | | | | 0.41 | |
Venezuela (Rep of) 11.950%, 08/05/2031 | | | | | 201,000 | | | | 205,522 | | | | 0.59 | |
Venezuela (Rep of) 9.375%, 01/13/2034 | | | | | 94,000 | | | | 83,425 | | | | 0.24 | |
| | | | | | | | | 1,730,445 | | | | 4.94 | |
Vietnam (Cost $195,156) | | | | | | | | | | | | | | |
Vietnam (Rep of) 6.875%, 01/15/2016 | | | | | 100,000 | | | | 110,500 | | | | 0.32 | |
Vietnam (Rep of) 6.750%, 01/29/2020 | | | | | 90,000 | | | | 105,075 | | | | 0.30 | |
| | | | | | | | | 215,575 | | | | 0.62 | |
Zambia (Cost $49,062) | | | | | | | | | | | | | | |
Zambia (Rep of) 5.375%, 09/20/2022(3) | | | | | 50,000 | | | | 50,375 | | | | 0.14 | |
| | | | | | | | | 50,375 | | | | 0.14 | |
Total Debt Securities (Cost $30,956,455) | | | | | | | | | 34,183,963 | | | | 97.56 | |
| | | | |
Total Investments (Total Cost $30,956,455) | | | | | | | | | 34,183,963 | | | | 97.56 | |
| | | | |
Other Assets Less Liabilities (See Statements of Assets and Liabilities for further detail) | | | | | | | | | 856,186 | | | | 2.44 | |
| | | | |
Net Assets | | | | | | | | $ | 35,040,149 | | | | 100.00 | |
| (1) | Par values are stated in United States Dollars unless otherwise noted below. |
| (2) | Restricted security that has been deemed illiquid. At October 31, 2012, the value of these restricted illiquid securities amounted to $130,807 or 0.4% of net assets. Additional information on each restricted illiquid security is as follows: |
| | | | |
| SECURITY | | ACQUISITION DATE | | ACQUISITION COST |
Bolivian (Rep of) 4.875%, 10/29/2022 | | 10/22/2012 | | $60,000 |
Slovenia (Rep of) 5.500%, 10/26/2022 | | 10/26/2012 | | 72,013 |
| (3) | Securities exempt from registration under Rule 144A of the Securities Act of 1933. These securities may not be publicly traded without registration under the Securities Act of 1933. |
Percentages shown are based on net assets.
See accompanying notes to the financial statements.
53
ASHMORE EMERGING MARKETS SOVEREIGN DEBT FUND
SCHEDULE OF INVESTMENTS (CONTINUED)
As of October 31, 2012
At October 31, 2012, for U.S. federal income tax purposes, gross unrealized appreciation, gross unrealized depreciation, net unrealized appreciation/(depreciation) on investments in securities (including the effects of foreign currency translation) and the cost basis of investments were as follows:
| | | | |
Federal tax cost of investments | | | $30,958,566 | |
Gross tax appreciation of investments | | | $3,329,481 | |
Gross tax depreciation of investments | | | (104,084 | ) |
Net tax appreciation of investments | | | $3,225,397 | |
The difference between book basis and tax basis net unrealized appreciation or depreciation is attributable primarily to the tax deferral of losses on wash sales.
The inputs or methodologies used for valuing securities are not necessarily an indication of the risks associated with investing in those securities and other financial instruments, if any. See note 4 in the Notes to the Financial Statements for more information regarding pricing inputs and valuation techniques. The following is a summary of the inputs used in valuing the Ashmore Emerging Markets Sovereign Debt Fund’s investments and other financial instruments, which are carried at fair value, as of October 31, 2012:
| | | | | | | | | | | | | | | | |
| | | Level 1 | | | Level 2 | | | Level 3 | | | Total | |
Investments | | | | | | | | | | | | | | | | |
Assets: | | | | | | | | | | | | | | | | |
Corporate Bonds | | | $— | | | | $ 5,500,937 | | | | $— | | | | $ 5,500,937 | |
Government Agencies | | | — | | | | 1,083,070 | | | | — | | | | 1,083,070 | |
Government Bonds | | | — | | | | 27,044,842 | | | | — | | | | 27,044,842 | |
Financial Certificates | | | — | | | | 555,114 | | | | — | | | | 555,114 | |
Total Investments | | | $— | | | | $34,183,963 | | | | $— | | | | $34,183,963 | |
The Fund discloses all transfers between levels based on valuations at the end of each reporting period. At October 31, 2012, there were no transfers between Level 1, Level 2 and Level 3 based on levels assigned to the securities on October 31, 2011. U.S. GAAP provides additional guidance for estimating fair value when the volume and level of activity for the asset or liability have significantly decreased as well as guidance on identifying circumstances that indicate when a transaction is not orderly.
The following is a summary of the fair values of the Fund’s derivative instruments*:
The Effect of Financial Derivative Instruments on the Statements of Operations for the Period Ended October 31, 2012:
| | | | | | | | |
| | | Derivatives Not Accounted for as
Hedging Instruments | |
| | | Foreign Exchange | | | Fixed Income/
Interest Rate | |
Realized Gain (Loss) on Derivatives Recognized resulting from Operations: | | | | | | | | |
Net Realized Gain on Forward Foreign Currency Exchange Contracts | | | $ 14,115 | | | | $ — | |
Net Realized Loss on Futures Contracts | | | — | | | | (374,422) | |
| | | | |
| | | $ 14,115 | | | | $ (374,422) | |
| | | | |
Net Change in Unrealized Appreciation on Derivatives Recognized resulting from Operations: | | | | | | | | |
Net Change in Unrealized Appreciation on Forward Foreign Currency Exchange Contracts | | | $ 500 | | | | $ — | |
| | | | |
| * | See note 9 in the Notes to the Financial Statements for additional information. |
See accompanying notes to the financial statements.
54
ASHMORE EMERGING MARKETS TOTAL RETURN FUND
SCHEDULE OF INVESTMENTS
As of October 31, 2012
| | | | | | | | | | | | | | |
| | | Currency(1) | | Par | | | Value | | | % of Net
Assets | |
Debt Securities | | | | | | | | | | | | | | |
| | | | |
Argentina (Cost $9,214,176) | | | | | | | | | | | | | | |
Argentina Boden Bonos 7.000%, 10/03/2015 | | | | | 1,499,000 | | | $ | 1,225,308 | | | | 0.23 | |
Argentine (Rep of) 8.750%, 06/02/2017 | | | | | 478,000 | | | | 406,300 | | | | 0.08 | |
Argentine (Rep of) 8.280%, 12/31/2033 | | | | | 2,579,548 | | | | 1,746,665 | | | | 0.34 | |
WPE International Cooperatief UA 10.375%, 09/30/2020 | | | | | 6,200,000 | | | | 5,332,000 | | | | 1.03 | |
| | | | | | | | | 8,710,273 | | | | 1.68 | |
Azerbaijan (Cost $651,102) | | | | | | | | | | | | | | |
State Oil Co. of the Azerbaijan Republic 5.450%, 02/09/2017 | | | | | 630,000 | | | | 678,945 | | | | 0.13 | |
| | | | | | | | | 678,945 | | | | 0.13 | |
Barbados (Cost $2,366,972) | | | | | | | | | | | | | | |
Columbus International, Inc. 11.500%, 11/20/2014 | | | | | 2,200,000 | | | | 2,464,000 | | | | 0.48 | |
| | | | | | | | | 2,464,000 | | | | 0.48 | |
Belarus (Cost $2,804,266) | | | | | | | | | | | | | | |
Belarus (Rep of) 8.750%, 08/03/2015 | | | | | 1,150,000 | | | | 1,150,000 | | | | 0.22 | |
Belarus (Rep of) 8.950%, 01/26/2018 | | | | | 1,760,000 | | | | 1,755,600 | | | | 0.34 | |
| | | | | | | | | 2,905,600 | | | | 0.56 | |
Bolivia (Cost $300,000) | | | | | | | | | | | | | | |
Bolivian (Rep of) 4.875%, 10/29/2022(2)(3) | | | | | 300,000 | | | | 300,186 | | | | 0.06 | |
| | | | | | | | | 300,186 | | | | 0.06 | |
Brazil (Cost $35,065,619) | | | | | | | | | | | | | | |
Arcos Dorados Holdings, Inc. 10.250%, 07/13/2016 | | BRL | | | 3,800,000 | | | | 2,001,920 | | | | 0.39 | |
Banco Nacional de Desenvolvimento Economico e Social 6.500%, 06/10/2019 | | | | | 1,100,000 | | | | 1,372,250 | | | | 0.26 | |
Banco Nacional de Desenvolvimento Economico e Social 5.500%, 07/12/2020 | | | | | 640,000 | | | | 766,400 | | | | 0.15 | |
Banco Votorantim S.A. 6.250%, 05/16/2016 | | BRL | | | 8,200,000 | | | | 4,555,245 | | | | 0.88 | |
Brazil (Fed Rep of) 6.000%, 01/17/2017 | | | | | 300,000 | | | | 355,500 | | | | 0.07 | |
Brazil (Fed Rep of) 5.875%, 01/15/2019 | | | | | 500,000 | | | | 617,500 | | | | 0.12 | |
Brazil (Fed Rep of) 4.875%, 01/22/2021 | | | | | 1,920,000 | | | | 2,299,200 | | | | 0.44 | |
Brazil (Fed Rep of) 2.625%, 01/05/2023 | | | | | 500,000 | | | | 498,750 | | | | 0.10 | |
Brazil (Fed Rep of) 8.875%, 04/15/2024 | | | | | 320,000 | | | | 515,200 | | | | 0.10 | |
Brazil (Fed Rep of) 10.125%, 05/15/2027 | | | | | 620,000 | | | | 1,119,100 | | | | 0.22 | |
Brazil (Fed Rep of) 8.250%, 01/20/2034 | | | | | 990,000 | | | | 1,623,600 | | | | 0.31 | |
Brazil (Fed Rep of) 7.125%, 01/20/2037 | | | | | 1,220,000 | | | | 1,836,100 | | | | 0.35 | |
Brazil (Fed Rep of) 5.625%, 01/07/2041 | | | | | 1,850,000 | | | | 2,368,000 | | | | 0.46 | |
Brazil Letras do Tesouro Nacional 0.000%, 01/01/2015(4) | | BRL | | | 200,000 | | | | 83,523 | | | | 0.02 | |
Brazil Notas do Tesouro Nacional, Serie B 6.000%, 08/15/2016 | | BRL | | | 430,000 | | | | 519,011 | | | | 0.10 | |
Brazil Notas do Tesouro Nacional, Serie B 6.000%, 08/15/2020 | | BRL | | | 1,570,000 | | | | 2,011,068 | | | | 0.39 | |
Brazil Notas do Tesouro Nacional, Serie B 6.000%, 08/15/2050 | | BRL | | | 1,030,000 | | | | 1,546,801 | | | | 0.30 | |
Fibria Overseas Finance Ltd. 6.750%, 03/03/2021 | | | | | 1,450,000 | | | | 1,602,250 | | | | 0.31 | |
JBS Finance II Ltd. 8.250%, 01/29/2018 | | | | | 3,050,000 | | | | 3,179,625 | | | | 0.61 | |
Marfrig Holding Europe B.V. 8.375%, 05/09/2018 | | | | | 4,500,000 | | | | 3,892,500 | | | | 0.75 | |
Marfrig Overseas Ltd. 9.500%, 05/04/2020 | | | | | 300,000 | | | | 265,500 | | | | 0.05 | |
Minerva Luxembourg S.A. 12.250%, 02/10/2022 | | | | | 1,200,000 | | | | 1,428,000 | | | | 0.28 | |
Minerva Overseas II Ltd. 10.875%, 11/15/2019 | | | | | 1,000,000 | | | | 1,155,000 | | | | 0.22 | |
See accompanying notes to the financial statements.
55
ASHMORE EMERGING MARKETS TOTAL RETURN FUND
SCHEDULE OF INVESTMENTS (CONTINUED)
As of October 31, 2012
| | | | | | | | | | | | | | |
| | | Currency(1) | | Par | | | Value | | | % of Net
Assets | |
Brazil - (continued) | | | | | | | | | | | | | | |
OSX 3 Leasing B.V. 9.250%, 03/20/2015(2) | | | | | 300,000 | | | $ | 312,000 | | | | 0.06 | |
| | | | | | | | | 35,924,043 | | | | 6.94 | |
Chile (Cost $6,566,169) | | | | | | | | | | | | | | |
Banco del Estado de Chile 4.125%, 10/07/2020 | | | | | 650,000 | | | | 716,337 | | | | 0.14 | |
Banco Santander Chile 6.500%, 09/22/2020 | | CLP | | | 1,348,000,000 | | | | 2,752,593 | | | | 0.53 | |
Chile (Rep of) 5.500%, 08/05/2020 | | CLP | | | 330,000,000 | | | | 741,521 | | | | 0.14 | |
Corp. Nacional del Cobre de Chile 7.500%, 01/15/2019 | | | | | 200,000 | | | | 259,902 | | | | 0.05 | |
Corp. Nacional del Cobre de Chile 3.750%, 11/04/2020 | | | | | 200,000 | | | | 216,721 | | | | 0.04 | |
Corp. Nacional del Cobre de Chile 3.875%, 11/03/2021 | | | | | 600,000 | | | | 653,662 | | | | 0.13 | |
Empresa Nacional del Petroleo 6.250%, 07/08/2019 | | | | | 270,000 | | | | 314,086 | | | | 0.06 | |
Empresa Nacional del Petroleo 5.250%, 08/10/2020 | | | | | 360,000 | | | | 402,851 | | | | 0.08 | |
Inversiones Alsacia S.A. 8.000%, 08/18/2018 | | | | | 654,892 | | | | 689,981 | | | | 0.13 | |
| | | | | | | | | 6,747,654 | | | | 1.30 | |
China (Cost $24,819,918) | | | | | | | | | | | | | | |
Agile Property Holdings Ltd. 9.875%, 03/20/2017 | | | | | 1,500,000 | | | | 1,631,250 | | | | 0.32 | |
Central China Real Estate Ltd. 12.250%, 10/20/2015 | | | | | 2,200,000 | | | | 2,414,500 | | | | 0.47 | |
CFG Investment SAC 9.750%, 07/30/2019 | | | | | 1,650,000 | | | | 1,427,250 | | | | 0.28 | |
China Oriental Group Co. Ltd. 8.000%, 08/18/2015 | | | | | 900,000 | | | | 861,750 | | | | 0.17 | |
China Oriental Group Co. Ltd. 7.000%, 11/17/2017 | | | | | 1,800,000 | | | | 1,575,000 | | | | 0.30 | |
China Shanshui Cement Group Ltd. 10.500%, 04/27/2017 | | | | | 1,500,000 | | | | 1,631,250 | | | | 0.32 | |
Country Garden Holdings Co. Ltd. 11.125%, 02/23/2018 | | | | | 3,000,000 | | | | 3,367,500 | | | | 0.65 | |
Evergrande Real Estate Group Ltd. 13.000%, 01/27/2015 | | | | | 3,500,000 | | | | 3,613,750 | | | | 0.70 | |
Fosun International Ltd. 7.500%, 05/12/2016 | | | | | 900,000 | | | | 900,000 | | | | 0.17 | |
Hidili Industry International Development Ltd. 8.625%, 11/04/2015 | | | | | 2,000,000 | | | | 1,500,000 | | | | 0.29 | |
Shimao Property Holdings Ltd. 9.650%, 08/03/2017 | | | | | 1,000,000 | | | | 1,060,342 | | | | 0.20 | |
Sinochem Overseas Capital Co. Ltd. 4.500%, 11/12/2020 | | | | | 2,170,000 | | | | 2,338,513 | | | | 0.45 | |
Sinochem Overseas Capital Co. Ltd. 6.300%, 11/12/2040 | | | | | 900,000 | | | | 1,093,414 | | | | 0.21 | |
Sino-Forest Corp. 5.000%, 08/01/2013(2)(5) | | | | | 176,000 | | | | 26,400 | | | | 0.01 | |
Sino-Forest Corp. 5.000%, 08/01/2013(5) | | | | | 100,000 | | | | 15,000 | | | | — | |
Sino-Forest Corp. 10.250%, 07/28/2014(5) | | | | | 226,000 | | | | 33,900 | | | | 0.01 | |
Sino-Forest Corp. 10.250%, 07/28/2014(2)(5) | | | | | 30,000 | | | | 4,500 | | | | — | |
Sino-Forest Corp. 4.250%, 12/15/2016(2)(5) | | | | | 694,000 | | | | 104,100 | | | | 0.02 | |
Sino-Forest Corp. 4.250%, 12/15/2016(5) | | | | | 10,000 | | | | 1,500 | | | | — | |
Sino-Forest Corp. 6.250%, 10/21/2017(5) | | | | | 500,000 | | | | 75,000 | | | | 0.01 | |
Sino-Forest Corp. 6.250%, 10/21/2017(2)(5) | | | | | 128,000 | | | | 19,200 | | | | — | |
Yanlord Land Group Ltd. 9.500%, 05/04/2017 | | | | | 1,600,000 | | | | 1,656,000 | | | | 0.32 | |
| | | | | | | | | 25,350,119 | | | | 4.90 | |
Colombia (Cost $14,511,334) | | | | | | | | | | | | | | |
Colombia (Rep of) 12.000%, 10/22/2015 | | COP | | | 4,581,000,000 | | | | 3,091,071 | | | | 0.60 | |
Colombia (Rep of) 7.375%, 01/27/2017 | | | | | 120,000 | | | | 149,100 | | | | 0.03 | |
Colombia (Rep of) 7.375%, 03/18/2019 | | | | | 930,000 | | | | 1,227,600 | | | | 0.24 | |
Colombia (Rep of) 11.750%, 02/25/2020 | | | | | 500,000 | | | | 808,750 | | | | 0.16 | |
Colombia (Rep of) 7.750%, 04/14/2021 | | COP | | | 1,235,000,000 | | | | 849,509 | | | | 0.16 | |
Colombia (Rep of) 4.375%, 07/12/2021 | | | | | 1,000,000 | | | | 1,148,500 | | | | 0.22 | |
Colombia (Rep of) 4.375%, 03/21/2023 | | COP | | | 1,090,000,000 | | | | 592,079 | | | | 0.11 | |
Colombia (Rep of) 8.125%, 05/21/2024 | | | | | 500,000 | | | | 748,750 | | | | 0.15 | |
Colombia (Rep of) 9.850%, 06/28/2027 | | COP | | | 1,480,000,000 | | | | 1,258,404 | | | | 0.24 | |
Colombia (Rep of) 7.375%, 09/18/2037 | | | | | 750,000 | | | | 1,156,875 | | | | 0.22 | |
Colombia (Rep of) 6.125%, 01/18/2041 | | | | | 1,620,000 | | | | 2,211,300 | | | | 0.43 | |
Emgesa S.A. ESP 8.750%, 01/25/2021 | | COP | | | 2,415,000,000 | | | | 1,493,220 | | | | 0.29 | |
| | | | | | | | | 14,735,158 | | | | 2.85 | |
See accompanying notes to the financial statements.
56
ASHMORE EMERGING MARKETS TOTAL RETURN FUND
SCHEDULE OF INVESTMENTS (CONTINUED)
As of October 31, 2012
| | | | | | | | | | | | | | |
| | | Currency(1) | | Par | | | Value | | | % of Net
Assets | |
Croatia (Cost $4,347,834) | | | | | | | | | | | | | | |
Croatia (Rep of) 6.250%, 04/27/2017 | | | | | 450,000 | | | $ | 494,550 | | | | 0.09 | |
Croatia (Rep of) 6.750%, 11/05/2019 | | | | | 810,000 | | | | 929,475 | | | | 0.18 | |
Croatia (Rep of) 6.625%, 07/14/2020 | | | | | 1,080,000 | | | | 1,235,164 | | | | 0.24 | |
Croatia (Rep of) 6.375%, 03/24/2021 | | | | | 1,810,000 | | | | 2,051,490 | | | | 0.40 | |
| | | | | | | | | 4,710,679 | | | | 0.91 | |
Czech Republic (Cost $1,526,301) | | | | | | | | | | | | | | |
Central European Media Enterprises Ltd. 11.625%, 09/15/2016 | | EUR | | | 1,150,000 | | | | 1,535,303 | | | | 0.30 | |
| | | | | | | | | 1,535,303 | | | | 0.30 | |
Dominican Republic (Cost $1,211,862) | | | | | | | | | | | | | | |
Dominican (Rep of) 7.500%, 05/06/2021 | | | | | 1,110,000 | | | | 1,304,250 | | | | 0.25 | |
| | | | | | | | | 1,304,250 | | | | 0.25 | |
Ecuador (Cost $315,373) | | | | | | | | | | | | | | |
Ecuador (Rep of) 9.375%, 12/15/2015 | | | | | 310,000 | | | | 316,975 | | | | 0.06 | |
| | | | | | | | | 316,975 | | | | 0.06 | |
Egypt (Cost $931,193) | | | | | | | | | | | | | | |
Egypt (Rep of) 5.750%, 04/29/2020 | | | | | 200,000 | | | | 205,500 | | | | 0.04 | |
Egypt (Rep of) 6.875%, 04/30/2040 | | | | | 480,000 | | | | 478,800 | | | | 0.09 | |
Nile Finance Ltd. 5.250%, 08/05/2015 | | | | | 300,000 | | | | 301,500 | | | | 0.06 | |
| | | | | | | | | 985,800 | | | | 0.19 | |
El Salvador (Cost $2,288,586) | | | | | | | | | | | | | | |
El Salvador (Rep of) 7.375%, 12/01/2019 | | | | | 430,000 | | | | 505,250 | | | | 0.10 | |
El Salvador (Rep of) 8.250%, 04/10/2032 | | | | | 160,000 | | | | 196,000 | | | | 0.04 | |
El Salvador (Rep of) 7.650%, 06/15/2035 | | | | | 555,000 | | | | 645,188 | | | | 0.12 | |
El Salvador (Rep of) 7.625%, 02/01/2041 | | | | | 450,000 | | | | 523,125 | | | | 0.10 | |
Telemovil Finance Co. Ltd. 8.000%, 10/01/2017 | | | | | 550,000 | | | | 580,250 | | | | 0.11 | |
| | | | | | | | | 2,449,813 | | | | 0.47 | |
Georgia (Cost $1,042,606) | | | | | | | | | | | | | | |
Georgia (Rep of) 6.875%, 04/12/2021 | | | | | 600,000 | | | | 688,500 | | | | 0.13 | |
Georgian Railway JSC 7.750%, 07/11/2022 | | | | | 370,000 | | | | 414,104 | | | | 0.08 | |
| | | | | | | | | 1,102,604 | | | | 0.21 | |
Ghana (Cost $984,290) | | | | | | | | | | | | | | |
Ghana (Rep of) 21.000%, 10/26/2015 | | GHS | | | 500,000 | | | | 265,037 | | | | 0.05 | |
Ghana (Rep of) 8.500%, 10/04/2017 | | | | | 640,000 | | | | 742,400 | | | | 0.14 | |
| | | | | | | | | 1,007,437 | | | | 0.19 | |
Hungary (Cost $11,158,538) | | | | | | | | | | | | | | |
Hungary (Rep of) 5.500%, 02/12/2016 | | HUF | | | 850,000,000 | | | | 3,790,956 | | | | 0.73 | |
Hungary (Rep of) 6.750%, 11/24/2017 | | HUF | | | 565,000,000 | | | | 2,611,277 | | | | 0.51 | |
Hungary (Rep of) 6.250%, 01/29/2020 | | | | | 810,000 | | | | 897,318 | | | | 0.17 | |
Hungary (Rep of) 6.375%, 03/29/2021 | | | | | 1,036,000 | | | | 1,153,897 | | | | 0.22 | |
Hungary (Rep of) 7.000%, 06/24/2022 | | HUF | | | 330,000,000 | | | | 1,512,502 | | | | 0.29 | |
Hungary (Rep of) 7.625%, 03/29/2041 | | | | | 1,280,000 | | | | 1,520,640 | | | | 0.30 | |
| | | | | | | | | 11,486,590 | | | | 2.22 | |
India (Cost $2,668,234) | | | | | | | | | | | | | | |
Reliance Holdings USA, Inc. 6.250%, 10/19/2040 | | | | | 1,000,000 | | | | 1,164,649 | | | | 0.22 | |
Vedanta Resources PLC 8.250%, 06/07/2021 | | | | | 1,600,000 | | | | 1,644,000 | | | | 0.32 | |
| | | | | | | | | 2,808,649 | | | | 0.54 | |
Indonesia (Cost $9,801,063) | | | | | | | | | | | | | | |
Indonesia (Rep of) 6.750%, 03/10/2014 | | | | | 105,000 | | | | 112,088 | | | | 0.02 | |
Indonesia (Rep of) 7.500%, 01/15/2016 | | | | | 740,000 | | | | 865,800 | | | | 0.17 | |
Indonesia (Rep of) 6.875%, 01/17/2018 | | | | | 850,000 | | | | 1,034,875 | | | | 0.20 | |
Indonesia (Rep of) 11.625%, 03/04/2019 | | | | | 480,000 | | | | 729,600 | | | | 0.14 | |
Indonesia (Rep of) 5.875%, 03/13/2020 | | | | | 670,000 | | | | 804,838 | | | | 0.16 | |
See accompanying notes to the financial statements.
57
ASHMORE EMERGING MARKETS TOTAL RETURN FUND
SCHEDULE OF INVESTMENTS (CONTINUED)
As of October 31, 2012
| | | | | | | | | | | | | | |
| | | Currency(1) | | Par | | | Value | | | % of Net
Assets | |
Indonesia - (continued) | | | | | | | | | | | | | | |
Indonesia (Rep of) 4.875%, 05/05/2021 | | | | | 600,000 | | | $ | 684,000 | | | | 0.13 | |
Indonesia (Rep of) 8.500%, 10/12/2035 | | | | | 500,000 | | | | 801,250 | | | | 0.15 | |
Indonesia (Rep of) 6.625%, 02/17/2037 | | | | | 550,000 | | | | 737,000 | | | | 0.14 | |
Indonesia (Rep of) 7.750%, 01/17/2038 | | | | | 650,000 | | | | 983,938 | | | | 0.19 | |
Majapahit Holding B.V. 7.750%, 10/17/2016 | | | | | 740,000 | | | | 880,600 | | | | 0.17 | |
Majapahit Holding B.V. 8.000%, 08/07/2019 | | | | | 530,000 | | | | 673,100 | | | | 0.13 | |
Majapahit Holding B.V. 7.750%, 01/20/2020 | | | | | 310,000 | | | | 389,825 | | | | 0.08 | |
Pertamina Persero PT 6.000%, 05/03/2042 | | | | | 600,000 | | | | 678,000 | | | | 0.13 | |
Perusahaan Listrik Negara PT 5.500%, 11/22/2021 | | | | | 660,000 | | | | 744,150 | | | | 0.14 | |
Perusahaan Listrik Negara PT 5.250%, 10/24/2042(2) | | | | | 200,000 | | | | 204,240 | | | | 0.04 | |
| | | | | | | | | 10,323,304 | | | | 1.99 | |
Iraq (Cost $2,005,598) | | | | | | | | | | | | | | |
Iraq (Rep of) 5.800%, 01/15/2028 | | | | | 2,330,000 | | | | 2,166,900 | | | | 0.42 | |
| | | | | | | | | 2,166,900 | | | | 0.42 | |
Ivory Coast (Cost $2,473,994) | | | | | | | | | | | | | | |
Ivory Coast (Rep of) 3.750%, 12/31/2032 | | | | | 3,340,000 | | | | 3,006,000 | | | | 0.58 | |
| | | | | | | | | 3,006,000 | | | | 0.58 | |
Jamaica (Cost $3,000,000) | | | | | | | | | | | | | | |
Digicel Group Ltd. 8.250%, 09/30/2020(2) | | | | | 3,000,000 | | | | 3,232,500 | | | | 0.62 | |
| | | | | | | | | 3,232,500 | | | | 0.62 | |
Jordan (Cost $1,066,446) | | | | | | | | | | | | | | |
Jordan (Rep of) 3.875%, 11/12/2015 | | | | | 1,090,000 | | | | 1,061,660 | | | | 0.21 | |
| | | | | | | | | 1,061,660 | | | | 0.21 | |
Kazakhstan (Cost $14,571,309) | | | | | | | | | | | | | | |
BTA Bank JSC 10.750%, 07/01/2018(5) | | | | | 2,050,000 | | | | 809,750 | | | | 0.16 | |
BTA Bank JSC 0.000%, 06/30/2020(4)(5) | | | | | 900,000 | | | | 104,400 | | | | 0.02 | |
BTA Bank JSC 7.200%, 07/01/2025(5) | | | | | 1,400,000 | | | | 84,000 | | | | 0.02 | |
Development Bank of Kazakhstan JSC 5.500%, 12/20/2015 | | | | | 600,000 | | | | 654,720 | | | | 0.13 | |
Halyk Savings Bank of Kazakhstan JSC 7.250%, 01/28/2021 | | | | | 1,500,000 | | | | 1,563,300 | | | | 0.30 | |
Kazakhstan Temir Zholy Finance B.V. 6.375%, 10/06/2020 | | | | | 860,000 | | | | 1,031,149 | | | | 0.20 | |
Kazakhstan Temir Zholy Finance B.V. 6.950%, 07/10/2042 | | | | | 600,000 | | | | 732,324 | | | | 0.14 | |
Kazatomprom Natsionalnaya Atomnaya Kompaniya AO 6.250%, 05/20/2015 | | | | | 690,000 | | | | 756,412 | | | | 0.14 | |
Kazkommertsbank JSC 8.500%, 05/11/2018 | | | | | 2,850,000 | | | | 2,468,385 | | | | 0.48 | |
KazMunayGas National Co. 8.375%, 07/02/2013 | | | | | 430,000 | | | | 447,768 | | | | 0.09 | |
KazMunayGas National Co. 11.750%, 01/23/2015 | | | | | 500,000 | | | | 599,590 | | | | 0.11 | |
KazMunayGas National Co. 9.125%, 07/02/2018 | | | | | 670,000 | | | | 873,533 | | | | 0.17 | |
KazMunayGas National Co. 7.000%, 05/05/2020 | | | | | 390,000 | | | | 479,224 | | | | 0.09 | |
KazMunayGas National Co. 6.375%, 04/09/2021 | | | | | 450,000 | | | | 530,437 | | | | 0.10 | |
Zhaikmunai LLP 10.500%, 10/19/2015 | | | | | 2,450,000 | | | | 2,685,935 | | | | 0.52 | |
| | | | | | | | | 13,820,927 | | | | 2.67 | |
Kuwait (Cost $787,153) | | | | | | | | | | | | | | |
Kuwait Projects Co. 9.375%, 07/15/2020 | | | | | 700,000 | | | | 849,450 | | | | 0.16 | |
| | | | | | | | | 849,450 | | | | 0.16 | |
Lebanon (Cost $3,808,170) | | | | | | | | | | | | | | |
Lebanon (Rep of) 5.150%, 11/12/2018 | | | | | 456,000 | | | | 451,440 | | | | 0.09 | |
Lebanon (Rep of) 6.375%, 03/09/2020 | | | | | 953,000 | | | | 991,120 | | | | 0.19 | |
Lebanon (Rep of) 8.250%, 04/12/2021 | | | | | 310,000 | | | | 357,585 | | | | 0.07 | |
Lebanon (Rep of) 6.100%, 10/04/2022 | | | | | 1,425,000 | | | | 1,435,688 | | | | 0.28 | |
Lebanon (Rep of) 6.600%, 11/27/2026 | | | | | 540,000 | | | | 544,050 | | | | 0.10 | |
| | | | | | | | | 3,779,883 | | | | 0.73 | |
See accompanying notes to the financial statements.
58
ASHMORE EMERGING MARKETS TOTAL RETURN FUND
SCHEDULE OF INVESTMENTS (CONTINUED)
As of October 31, 2012
| | | | | | | | | | | | | | |
| | | Currency(1) | | Par | | | Value | | | % of Net
Assets | |
Lithuania (Cost $5,088,743) | | | | | | | | | | | | | | |
Lithuania (Rep of) 5.125%, 09/14/2017 | | | | | 510,000 | | | $ | 571,200 | | | | 0.11 | |
Lithuania (Rep of) 7.375%, 02/11/2020 | | | | | 1,400,000 | | | | 1,778,000 | | | | 0.34 | |
Lithuania (Rep of) 6.125%, 03/09/2021 | | | | | 720,000 | | | | 865,800 | | | | 0.17 | |
Lithuania (Rep of) 6.625%, 02/01/2022 | | | | | 1,820,000 | | | | 2,252,250 | | | | 0.44 | |
| | | | | | | | | 5,467,250 | | | | 1.06 | |
Malaysia (Cost $7,121,154) | | | | | | | | | | | | | | |
Malaysia (Rep of) 4.262%, 09/15/2016 | | MYR | | | 2,700,000 | | | | 922,433 | | | | 0.18 | |
Malaysia (Rep of) 4.160%, 07/15/2021 | | MYR | | | 10,400,000 | | | | 3,576,252 | | | | 0.69 | |
Malaysia (Rep of) 3.502%, 05/31/2027 | | MYR | | | 2,100,000 | | | | 675,842 | | | | 0.13 | |
Petronas Capital Ltd. 5.250%, 08/12/2019 | | | | | 450,000 | | | | 538,811 | | | | 0.10 | |
Petronas Capital Ltd. 7.875%, 05/22/2022 | | | | | 440,000 | | | | 634,365 | | | | 0.12 | |
Wakala Global Sukuk Bhd. 4.646%, 07/06/2021 | | | | | 750,000 | | | | 860,216 | | | | 0.17 | |
| | | | | | | | | 7,207,919 | | | | 1.39 | |
Mexico (Cost $33,238,863) | | | | | | | | | | | | | | |
Cemex Espana Luxembourg 9.250%, 05/12/2020 | | | | | 3,820,000 | | | | 3,972,800 | | | | 0.77 | |
Comision Federal de Electricidad 4.875%, 05/26/2021 | | | | | 870,000 | | | | 976,575 | | | | 0.19 | |
Comision Federal de Electricidad 5.750%, 02/14/2042 | | | | | 600,000 | | | | 681,000 | | | | 0.13 | |
Corp. GEO S.A.B. de C.V. 8.875%, 03/27/2022 | | | | | 600,000 | | | | 634,500 | | | | 0.12 | |
Desarrolladora Homex S.A.B. de C.V. 9.750%, 03/25/2020 | | | | | 1,200,000 | | | | 1,212,000 | | | | 0.23 | |
Grupo Papelero Scribe S.A. de C.V. 8.875%, 04/07/2020 | | | | | 400,000 | | | | 349,600 | | | | 0.07 | |
Mexican Bonos 6.500%, 06/10/2021 | | MXN | | | 44,600,000 | | | | 3,631,636 | | | | 0.70 | |
Mexican Bonos 7.500%, 06/03/2027 | | MXN | | | 38,600,000 | | | | 3,373,077 | | | | 0.65 | |
Mexican Bonos 8.500%, 05/31/2029 | | MXN | | | 16,560,000 | | | | 1,569,072 | | | | 0.30 | |
Mexican Bonos 7.750%, 05/29/2031 | | MXN | | | 24,950,000 | | | | 2,195,886 | | | | 0.42 | |
Mexican Bonos 10.000%, 11/20/2036 | | MXN | | | 19,500,000 | | | | 2,106,762 | | | | 0.41 | |
Mexican Bonos 8.500%, 11/18/2038 | | MXN | | | 24,200,000 | | | | 2,287,228 | | | | 0.44 | |
Mexico (Rep of) 5.625%, 01/15/2017 | | | | | 298,000 | | | | 348,362 | | | | 0.07 | |
Mexico (Rep of) 5.950%, 03/19/2019 | | | | | 406,000 | | | | 501,410 | | | | 0.10 | |
Mexico (Rep of) 5.125%, 01/15/2020 | | | | | 1,000,000 | | | | 1,195,000 | | | | 0.23 | |
Mexico (Rep of) 3.625%, 03/15/2022 | | | | | 416,000 | | | | 454,480 | | | | 0.09 | |
Mexico (Rep of) 6.750%, 09/27/2034 | | | | | 980,000 | | | | 1,386,700 | | | | 0.27 | |
Mexico (Rep of) 6.050%, 01/11/2040 | | | | | 1,502,000 | | | | 1,993,905 | | | | 0.39 | |
Mexico (Rep of) 4.750%, 03/08/2044 | | | | | 430,000 | | | | 477,300 | | | | 0.09 | |
Mexico (Rep of) 5.750%, 10/12/2110 | | | | | 804,000 | | | | 944,700 | | | | 0.18 | |
Pemex Project Funding Master Trust 5.750%, 03/01/2018 | | | | | 392,000 | | | | 456,680 | | | | 0.09 | |
Petroleos Mexicanos 8.000%, 05/03/2019 | | | | | 490,000 | | | | 641,900 | | | | 0.12 | |
Petroleos Mexicanos 6.000%, 03/05/2020 | | | | | 317,000 | | | | 378,815 | | | | 0.07 | |
Petroleos Mexicanos 6.500%, 06/02/2041 | | | | | 708,000 | | | | 878,805 | | | | 0.17 | |
Petroleos Mexicanos 5.500%, 06/27/2044 | | | | | 194,000 | | | | 211,460 | | | | 0.04 | |
Urbi Desarrollos Urbanos S.A.B. de C.V. 9.750%, 02/03/2022 | | | | | 1,150,000 | | | | 1,069,500 | | | | 0.21 | |
| | | | | | | | | 33,929,153 | | | | 6.55 | |
Mongolia (Cost $1,068,867) | | | | | | | | | | | | | | |
Mongolian Mining Corp. 8.875%, 03/29/2017 | | | | | 1,050,000 | | | | 1,071,000 | | | | 0.21 | |
| | | | | | | | | 1,071,000 | | | | 0.21 | |
Morocco (Cost $182,493) | | | | | | | | | | | | | | |
Morocco (Kingdom of) 4.500%, 10/05/2020 | | EUR | | | 150,000 | | | | 193,160 | | | | 0.04 | |
| | | | | | | | | 193,160 | | | | 0.04 | |
Nigeria (Cost $8,732,256) | | | | | | | | | | | | | | |
Afren PLC 11.500%, 02/01/2016 | | | | | 3,100,000 | | | | 3,534,000 | | | | 0.68 | |
Afren PLC 10.250%, 04/08/2019 | | | | | 1,000,000 | | | | 1,145,000 | | | | 0.22 | |
Nigeria (Fed Rep of) 6.750%, 01/28/2021 | | | | | 600,000 | | | | 691,500 | | | | 0.13 | |
Nigeria (Fed Rep of) 16.390%, 01/27/2022 | | NGN | | | 110,000,000 | | | | 821,323 | | | | 0.16 | |
See accompanying notes to the financial statements.
59
ASHMORE EMERGING MARKETS TOTAL RETURN FUND
SCHEDULE OF INVESTMENTS (CONTINUED)
As of October 31, 2012
| | | | | | | | | | | | | | |
| | | Currency(1) | | Par | | | Value | | | % of Net
Assets | |
Nigeria - (continued) | | | | | | | | | | | | | | |
Nigeria Treasury Bill 16.085%, 03/28/2013(6) | | NGN | | | 30,000,000 | | | $ | 181,255 | | | | 0.04 | |
Nigeria Treasury Bill 17.034%, 04/04/2013(6) | | NGN | | | 2,000,000 | | | | 12,063 | | | | — | |
Nigeria Treasury Bill 16.256%, 04/11/2013(6) | | NGN | | | 91,000,000 | | | | 546,116 | | | | 0.11 | |
Nigeria Treasury Bill 15.775%, 04/25/2013(6) | | NGN | | | 97,500,000 | | | | 582,349 | | | | 0.11 | |
Nigeria Treasury Bill 16.965%, 08/08/2013(6) | | NGN | | | 146,900,000 | | | | 851,274 | | | | 0.16 | |
Nigeria Treasury Bill 15.072%, 10/10/2013(6) | | NGN | | | 143,100,000 | | | | 806,247 | | | | 0.16 | |
| | | | | | | | | 9,171,127 | | | | 1.77 | |
Pakistan (Cost $575,100) | | | | | | | | | | | | | | |
Pakistan (Rep of) 7.125%, 03/31/2016 | | | | | 650,000 | | | | 604,500 | | | | 0.12 | |
| | | | | | | | | 604,500 | | | | 0.12 | |
Panama (Cost $2,815,834) | | | | | | | | | | | | | | |
Panama (Rep of) 7.250%, 03/15/2015 | | | | | 270,000 | | | | 307,800 | | | | 0.06 | |
Panama (Rep of) 7.125%, 01/29/2026 | | | | | 520,000 | | | | 746,200 | | | | 0.14 | |
Panama (Rep of) 8.875%, 09/30/2027 | | | | | 270,000 | | | | 438,075 | | | | 0.08 | |
Panama (Rep of) 9.375%, 04/01/2029 | | | | | 390,000 | | | | 668,850 | | | | 0.13 | |
Panama (Rep of) 6.700%, 01/26/2036 | | | | | 564,000 | | | | 802,854 | | | | 0.16 | |
| | | | | | | | | 2,963,779 | | | | 0.57 | |
Peru (Cost $5,878,955) | | | | | | | | | | | | | | |
Peru (Rep of) 8.375%, 05/03/2016 | | | | | 440,000 | | | | 545,600 | | | | 0.11 | |
Peru (Rep of) 8.600%, 08/12/2017 | | PEN | | | 1,400,000 | | | | 667,181 | | | | 0.13 | |
Peru (Rep of) 7.125%, 03/30/2019 | | | | | 260,000 | | | | 341,900 | | | | 0.07 | |
Peru (Rep of) 7.840%, 08/12/2020 | | PEN | | | 1,800,000 | | | | 859,541 | | | | 0.17 | |
Peru (Rep of) 7.350%, 07/21/2025 | | | | | 1,050,000 | | | | 1,527,750 | | | | 0.29 | |
Peru (Rep of) 8.200%, 08/12/2026 | | PEN | | | 900,000 | | | | 474,605 | | | | 0.09 | |
Peru (Rep of) 6.950%, 08/12/2031 | | PEN | | | 900,000 | | | | 423,103 | | | | 0.08 | |
Peru (Rep of) 8.750%, 11/21/2033 | | | | | 718,000 | | | | 1,256,500 | | | | 0.24 | |
| | | | | | | | | 6,096,180 | | | | 1.18 | |
Philippines (Cost $10,977,202) | | | | | | | | | | | | | | |
Philippines (Rep of) 8.375%, 06/17/2019 | | | | | 370,000 | | | | 510,600 | | | | 0.10 | |
Philippines (Rep of) 4.000%, 01/15/2021 | | | | | 820,000 | | | | 919,425 | | | | 0.18 | |
Philippines (Rep of) 7.500%, 09/25/2024 | | | | | 400,000 | | | | 574,000 | | | | 0.11 | |
Philippines (Rep of) 10.625%, 03/16/2025 | | | | | 598,000 | | | | 1,050,985 | | | | 0.20 | |
Philippines (Rep of) 5.500%, 03/30/2026 | | | | | 1,480,000 | | | | 1,872,200 | | | | 0.36 | |
Philippines (Rep of) 9.500%, 02/02/2030 | | | | | 700,000 | | | | 1,223,250 | | | | 0.24 | |
Philippines (Rep of) 7.750%, 01/14/2031 | | | | | 980,000 | | | | 1,514,100 | | | | 0.29 | |
Philippines (Rep of) 6.375%, 10/23/2034 | | | | | 860,000 | | | | 1,195,400 | | | | 0.23 | |
Philippines (Rep of) 6.250%, 01/14/2036 | | PHP | | | 32,000,000 | | | | 908,118 | | | | 0.18 | |
Power Sector Assets & Liabilities Management Corp. 7.250%, 05/27/2019 | | | | | 420,000 | | | | 544,950 | | | | 0.11 | |
Power Sector Assets & Liabilities Management Corp. 7.390%, 12/02/2024 | | | | | 1,010,000 | | | | 1,416,525 | | | | 0.27 | |
| | | | | | | | | 11,729,553 | | | | 2.27 | |
Poland (Cost $26,440,044) | | | | | | | | | | | | | | |
CEDC Finance Corp. International, Inc. 8.875%, 12/01/2016 | | EUR | | | 1,480,000 | | | | 1,227,724 | | | | 0.24 | |
Eileme 2 AB 11.625%, 01/31/2020 | | | | | 1,900,000 | | | | 2,135,125 | | | | 0.41 | |
Eileme 2 AB 11.750%, 01/31/2020 | | EUR | | | 900,000 | | | | 1,307,697 | | | | 0.25 | |
Poland (Rep of) 5.000%, 04/25/2016 | | PLN | | | 6,800,000 | | | | 2,198,049 | | | | 0.42 | |
Poland (Rep of) 3.000%, 08/24/2016 | | PLN | | | 5,580,000 | | | | 2,332,392 | | | | 0.45 | |
Poland (Rep of) 4.750%, 10/25/2016 | | PLN | | | 3,350,000 | | | | 1,075,727 | | | | 0.21 | |
Poland (Rep of) 4.750%, 04/25/2017 | | PLN | | | 12,080,000 | | | | 3,882,445 | | | | 0.75 | |
Poland (Rep of) 6.375%, 07/15/2019 | | | | | 1,180,000 | | | | 1,469,100 | | | | 0.28 | |
Poland (Rep of) 5.750%, 10/25/2021 | | PLN | | | 10,200,000 | | | | 3,482,374 | | | | 0.67 | |
See accompanying notes to the financial statements.
60
ASHMORE EMERGING MARKETS TOTAL RETURN FUND
SCHEDULE OF INVESTMENTS (CONTINUED)
As of October 31, 2012
| | | | | | | | | | | | | | |
| | | Currency(1) | | Par | | | Value | | | % of Net
Assets | |
Poland - (continued) | | | | | | | | | | | | | | |
Poland (Rep of) 5.000%, 03/23/2022 | | | | | 1,860,000 | | | $ | 2,167,253 | | | | 0.42 | |
Poland (Rep of) 5.750%, 09/23/2022 | | PLN | | | 1,150,000 | | | | 394,530 | | | | 0.08 | |
Poland (Rep of) 3.000%, 03/17/2023 | | | | | 990,000 | | | | 975,724 | | | | 0.19 | |
Poland (Rep of) 2.750%, 08/25/2023 | | PLN | | | 1,760,000 | | | | 672,720 | | | | 0.13 | |
TVN Finance Corp. II AB 10.750%, 11/15/2017 | | EUR | | | 2,600,000 | | | | 3,660,684 | | | | 0.71 | |
| | | | | | | | | 26,981,544 | | | | 5.21 | |
Qatar (Cost $2,348,303) | | | | | | | | | | | | | | |
Qatar (Rep of) 6.400%, 01/20/2040 | | | | | 840,000 | | | | 1,170,540 | | | | 0.23 | |
Qatar (Rep of) 5.750%, 01/20/2042 | | | | | 1,050,000 | | | | 1,354,500 | | | | 0.26 | |
| | | | | | | | | 2,525,040 | | | | 0.49 | |
Romania (Cost $1,400,554) | | | | | | | | | | | | | | |
Romania (Rep of) 6.750%, 02/07/2022 | | | | | 1,320,000 | | | | 1,524,600 | | | | 0.29 | |
| | | | | | | | | 1,524,600 | | | | 0.29 | |
Russian Federation (Cost $55,451,626) | | | | | | | | | | | | | | |
Alfa Bank OJSC Via Alfa Bond Issuance PLC 7.500%, 09/26/2019(2) | | | | | 650,000 | | | | 668,792 | | | | 0.13 | |
Brunswick Rail Finance Ltd. 6.500%, 11/01/2017(2) | | | | | 750,000 | | | | 759,728 | | | | 0.15 | |
Evraz Group S.A. 6.750%, 04/27/2018 | | | | | 3,200,000 | | | | 3,224,000 | | | | 0.62 | |
Lukoil International Finance B.V. 6.656%, 06/07/2022 | | | | | 700,000 | | | | 845,530 | | | | 0.16 | |
Metalloinvest Finance Ltd. 6.500%, 07/21/2016 | | | | | 800,000 | | | | 824,000 | | | | 0.16 | |
Promsvyazbank OJSC Via PSB Finance S.A. 10.200%, 11/06/2019(2) | | | | | 750,000 | | | | 749,063 | | | | 0.14 | |
Russian Agricultural Bank OJSC Via RSHB Capital S.A. 9.000%, 06/11/2014 | | | | | 300,000 | | | | 331,596 | | | | 0.06 | |
Russian Agricultural Bank OJSC Via RSHB Capital S.A. 7.750%, 05/29/2018 | | | | | 430,000 | | | | 512,687 | | | | 0.10 | |
Russian Federal Bond - OFZ 7.100%, 03/13/2014 | | RUB | | | 28,300,000 | | | | 908,491 | | | | 0.18 | |
Russian Federal Bond - OFZ 7.350%, 01/20/2016 | | RUB | | | 185,000,000 | | | | 5,976,646 | | | | 1.15 | |
Russian Federal Bond - OFZ 6.900%, 08/03/2016 | | RUB | | | 14,700,000 | | | | 468,433 | | | | 0.09 | |
Russian Federal Bond - OFZ 7.400%, 04/19/2017 | | RUB | | | 91,130,000 | | | | 2,954,814 | | | | 0.57 | |
Russian Federal Bond - OFZ 7.400%, 06/14/2017 | | RUB | | | 91,000,000 | | | | 2,950,021 | | | | 0.57 | |
Russian Federal Bond - OFZ 7.500%, 03/15/2018 | | RUB | | | 117,340,000 | | | | 3,815,874 | | | | 0.74 | |
Russian Federal Bond - OFZ 7.500%, 02/27/2019 | | RUB | | | 75,580,000 | | | | 2,457,847 | | | | 0.47 | |
Russian Federal Bond - OFZ 7.600%, 04/14/2021 | | RUB | | | 53,700,000 | | | | 1,747,103 | | | | 0.34 | |
Russian Federal Bond - OFZ 7.600%, 07/20/2022 | | RUB | | | 32,180,000 | | | | 1,046,487 | | | | 0.20 | |
Russian Federal Bond - OFZ 8.150%, 02/03/2027 | | RUB | | | 76,625,000 | | | | 2,545,820 | | | | 0.49 | |
Russian Foreign Bond - Eurobond 5.000%, 04/29/2020 | | | | | 500,000 | | | | 578,750 | | | | 0.11 | |
Russian Foreign Bond - Eurobond 12.750%, 06/24/2028 | | | | | 554,000 | | | | 1,094,427 | | | | 0.21 | |
Russian Foreign Bond - Eurobond 7.500%, 03/31/2030 | | | | | 3,284,450 | | | | 4,159,099 | | | | 0.80 | |
Russian Foreign Bond - Eurobond 5.625%, 04/04/2042 | | | | | 1,400,000 | | | | 1,681,820 | | | | 0.33 | |
Russian Standard Bank Via Russian Standard Finance S.A. 9.250%, 07/11/2017 | | | | | 900,000 | | | | 929,250 | | | | 0.18 | |
Severstal OAO Via Steel Capital S.A. 6.250%, 07/26/2016 | | | | | 1,700,000 | | | | 1,791,800 | | | | 0.35 | |
Severstal OAO Via Steel Capital S.A. 5.900%, 10/17/2022(2)(3) | | | | | 700,000 | | | | 695,415 | | | | 0.13 | |
TMK OAO Via TMK Capital S.A. 7.750%, 01/27/2018 | | | | | 2,000,000 | | | | 2,060,000 | | | | 0.40 | |
Vimpel Communications Via VIP Finance Ireland Ltd. OJSC 7.748%, 02/02/2021 | | | | | 7,650,000 | | | | 8,415,000 | | | | 1.63 | |
Vnesheconombank Via VEB Finance PLC 5.450%, 11/22/2017 | | | | | 500,000 | | | | 546,835 | | | | 0.11 | |
Vnesheconombank Via VEB Finance PLC 6.902%, 07/09/2020 | | | | | 2,400,000 | | | | 2,847,552 | | | | 0.55 | |
See accompanying notes to the financial statements.
61
ASHMORE EMERGING MARKETS TOTAL RETURN FUND
SCHEDULE OF INVESTMENTS (CONTINUED)
As of October 31, 2012
| | | | | | | | | | | | | | |
| | | Currency(1) | | Par | | | Value | | | % of Net
Assets | |
Russian Federation - (continued) | | | | | | | | | | | | | | |
Vnesheconombank Via VEB Finance PLC 6.800%, 11/22/2025 | | | | | 240,000 | | | $ | 284,102 | | | | 0.06 | |
| | | | | | | | | 57,870,982 | | | | 11.18 | |
Saudi Arabia (Cost $1,603,834) | | | | | | | | | | | | | | |
Dar Al-Arkan International Sukuk Co. II 10.750%, 02/18/2015 | | | | | 1,500,000 | | | | 1,629,000 | | | | 0.31 | |
| | | | | | | | | 1,629,000 | | | | 0.31 | |
Senegal (Cost $911,765) | | | | | | | | | | | | | | |
Senegal (Rep of) 8.750%, 05/13/2021 | | | | | 800,000 | | | | 968,000 | | | | 0.19 | |
| | | | | | | | | 968,000 | | | | 0.19 | |
Serbia (Cost $838,077) | | | | | | | | | | | | | | |
Serbia (Rep of) 7.250%, 09/28/2021 | | | | | 810,000 | | | | 862,650 | | | | 0.17 | |
| | | | | | | | | 862,650 | | | | 0.17 | |
Singapore (Cost $947,450) | | | | | | | | | | | | | | |
MMI International Ltd. 8.000%, 03/01/2017 | | | | | 900,000 | | | | 940,500 | | | | 0.18 | |
| | | | | | | | | 940,500 | | | | 0.18 | |
Slovenia (Cost $393,971) | | | | | | | | | | | | | | |
Slovenia (Rep of) 5.500%, 10/26/2022(2)(3) | | | | | 400,000 | | | | 404,400 | | | | 0.08 | |
| | | | | | | | | 404,400 | | | | 0.08 | |
South Africa (Cost $22,884,656) | | | | | | | | | | | | | | |
African Bank Ltd. 8.125%, 02/24/2017 | | | | | 700,000 | | | | 753,375 | | | | 0.15 | |
Edcon Pty Ltd., FRN 3.502%, 06/15/2014 | | EUR | | | 700,000 | | | | 843,801 | | | | 0.16 | |
Edcon Pty Ltd. 9.500%, 03/01/2018 | | EUR | | | 1,200,000 | | | | 1,434,851 | | | | 0.28 | |
Edcon Pty Ltd. 9.500%, 03/01/2018 | | | | | 550,000 | | | | 517,000 | | | | 0.10 | |
Edcon Pty Ltd. 9.500%, 03/01/2018(2)(3)(7) | | | | | 300,000 | | | | 282,000 | | | | 0.05 | |
Sappi Papier Holding GmbH 8.375%, 06/15/2019 | | | | | 900,000 | | | | 949,500 | | | | 0.18 | |
South Africa (Rep of) 13.500%, 09/15/2015 | | ZAR | | | 10,800,000 | | | | 1,507,497 | | | | 0.29 | |
South Africa (Rep of) 8.250%, 09/15/2017 | | ZAR | | | 19,200,000 | | | | 2,436,271 | | | | 0.47 | |
South Africa (Rep of) 8.000%, 12/21/2018 | | ZAR | | | 23,200,000 | | | | 2,924,945 | | | | 0.57 | |
South Africa (Rep of) 6.875%, 05/27/2019 | | | | | 670,000 | | | | 834,418 | | | | 0.16 | |
South Africa (Rep of) 7.250%, 01/15/2020 | | ZAR | | | 22,100,000 | | | | 2,659,687 | | | | 0.51 | |
South Africa (Rep of) 5.500%, 03/09/2020 | | | | | 1,180,000 | | | | 1,378,594 | | | | 0.27 | |
South Africa (Rep of) 6.750%, 03/31/2021 | | ZAR | | | 7,300,000 | | | | 846,211 | | | | 0.16 | |
South Africa (Rep of) 5.875%, 05/30/2022 | | | | | 540,000 | | | | 653,601 | | | | 0.13 | |
South Africa (Rep of) 7.750%, 02/28/2023 | | ZAR | | | 4,700,000 | | | | 565,434 | | | | 0.11 | |
South Africa (Rep of) 10.500%, 12/21/2026 | | ZAR | | | 14,800,000 | | | | 2,109,179 | | | | 0.41 | |
South Africa (Rep of) 7.000%, 02/28/2031 | | ZAR | | | 11,400,000 | | | | 1,153,707 | | | | 0.22 | |
South Africa (Rep of) 6.500%, 02/28/2041 | | ZAR | | | 5,700,000 | | | | 514,857 | | | | 0.10 | |
South Africa (Rep of) 6.250%, 03/08/2041 | | | | | 490,000 | | | | 628,425 | | | | 0.12 | |
| | | | | | | | | 22,993,353 | | | | 4.44 | |
South Korea (Cost $388,225) | | | | | | | | | | | | | | |
Korea (Rep of) 7.125%, 04/16/2019 | | | | | 310,000 | | | | 404,207 | | | | 0.08 | |
| | | | | | | | | 404,207 | | | | 0.08 | |
Sri Lanka (Cost $1,920,156) | | | | | | | | | | | | | | |
Sri Lanka (Rep of) 7.400%, 01/22/2015 | | | | | 100,000 | | | | 109,750 | | | | 0.02 | |
Sri Lanka (Rep of) 6.250%, 10/04/2020 | | | | | 730,000 | | | | 817,600 | | | | 0.16 | |
Sri Lanka (Rep of) 6.250%, 07/27/2021 | | | | | 800,000 | | | | 894,560 | | | | 0.17 | |
Sri Lanka (Rep of) 5.875%, 07/25/2022 | | | | | 200,000 | | | | 219,000 | | | | 0.04 | |
| | | | | | | | | 2,040,910 | | | | 0.39 | |
Thailand (Cost $5,399,762) | | | | | | | | | | | | | | |
Thailand Government Bond 3.250%, 06/16/2017 | | THB | | | 67,000,000 | | | | 2,198,486 | | | | 0.43 | |
Thailand Government Bond 1.200%, 07/14/2021 | | THB | | | 23,900,000 | | | | 825,717 | | | | 0.16 | |
Thailand Government Bond 3.650%, 12/17/2021 | | THB | | | 39,000,000 | | | | 1,306,344 | | | | 0.25 | |
See accompanying notes to the financial statements.
62
ASHMORE EMERGING MARKETS TOTAL RETURN FUND
SCHEDULE OF INVESTMENTS (CONTINUED)
As of October 31, 2012
| | | | | | | | | | | | | | |
| | | Currency(1) | | Par | | | Value | | | % of Net
Assets | |
Thailand - (continued) | | | | | | | | | | | | | | |
Thailand Government Bond 3.580%, 12/17/2027 | | THB | | | 35,000,000 | | | $ | 1,142,460 | | | | 0.22 | |
| | | | | | | | | 5,473,007 | | | | 1.06 | |
Turkey (Cost $20,415,645) | | | | | | | | | | | | | | |
Turkey (Rep of) 9.000%, 05/21/2014 | | TRY | | | 2,700,000 | | | | 2,196,701 | | | | 0.42 | |
Turkey (Rep of) 7.250%, 03/15/2015 | | | | | 440,000 | | | | 491,260 | | | | 0.09 | |
Turkey (Rep of) 7.000%, 09/26/2016 | | | | | 890,000 | | | | 1,034,625 | | | | 0.20 | |
Turkey (Rep of) 7.500%, 07/14/2017 | | | | | 350,000 | | | | 422,380 | | | | 0.08 | |
Turkey (Rep of) 6.750%, 04/03/2018 | | | | | 1,720,000 | | | | 2,047,660 | | | | 0.39 | |
Turkey (Rep of) 7.000%, 03/11/2019 | | | | | 670,000 | | | | 821,755 | | | | 0.16 | |
Turkey (Rep of) 7.500%, 11/07/2019 | | | | | 300,000 | | | | 380,850 | | | | 0.07 | |
Turkey (Rep of) 10.500%, 01/15/2020 | | TRY | | | 2,800,000 | | | | 1,794,620 | | | | 0.35 | |
Turkey (Rep of) 4.000%, 04/01/2020 | | TRY | | | 1,700,000 | | | | 1,281,209 | | | | 0.25 | |
Turkey (Rep of) 5.625%, 03/30/2021 | | | | | 530,000 | | | | 616,125 | | | | 0.12 | |
Turkey (Rep of) 3.000%, 02/23/2022 | | TRY | | | 6,700,000 | | | | 4,133,561 | | | | 0.80 | |
Turkey (Rep of) 7.375%, 02/05/2025 | | | | | 994,000 | | | | 1,299,655 | | | | 0.25 | |
Turkey (Rep of) 11.875%, 01/15/2030 | | | | | 370,000 | | | | 702,075 | | | | 0.14 | |
Turkey (Rep of) 8.000%, 02/14/2034 | | | | | 540,000 | | | | 772,200 | | | | 0.15 | |
Turkey (Rep of) 6.875%, 03/17/2036 | | | | | 680,000 | | | | 875,024 | | | | 0.17 | |
Turkey (Rep of) 7.250%, 03/05/2038 | | | | | 380,000 | | | | 513,000 | | | | 0.10 | |
Turkey (Rep of) 6.750%, 05/30/2040 | | | | | 650,000 | | | | 834,275 | | | | 0.16 | |
Turkey (Rep of) 6.000%, 01/14/2041 | | | | | 600,000 | | | | 705,000 | | | | 0.14 | |
| | | | | | | | | 20,921,975 | | | | 4.04 | |
Ukraine (Cost $17,295,235) | | | | | | | | | | | | | | |
DTEK Finance B.V. 9.500%, 04/28/2015 | | | | | 1,500,000 | | | | 1,515,900 | | | | 0.29 | |
Ferrexpo Finance PLC 7.875%, 04/07/2016 | | | | | 2,500,000 | | | | 2,400,000 | | | | 0.46 | |
Financing of Infrastrucural Projects State Enterprise 8.375%, 11/03/2017 | | | | | 370,000 | | | | 351,500 | | | | 0.07 | |
Metinvest B.V. 10.250%, 05/20/2015 | | | | | 2,900,000 | | | | 2,960,610 | | | | 0.57 | |
MHP S.A. 10.250%, 04/29/2015 | | | | | 2,700,000 | | | | 2,774,250 | | | | 0.54 | |
National JSC Naftogaz of Ukraine 9.500%, 09/30/2014 | | | | | 490,000 | | | | 499,212 | | | | 0.10 | |
Oschadbank Via SSB #1 PLC 8.250%, 03/10/2016 | | | | | 600,000 | | | | 570,750 | | | | 0.11 | |
Privatbank CJSC Via UK SPV Credit Finance PLC 9.375%, 09/23/2015 | | | | | 600,000 | | | | 559,770 | | | | 0.11 | |
Ukraine (Rep of) 7.650%, 06/11/2013 | | | | | 560,000 | | | | 563,640 | | | | 0.11 | |
Ukraine (Rep of) 6.875%, 09/23/2015 | | | | | 720,000 | | | | 719,064 | | | | 0.14 | |
Ukraine (Rep of) 6.250%, 06/17/2016 | | | | | 600,000 | | | | 592,092 | | | | 0.12 | |
Ukraine (Rep of) 6.580%, 11/21/2016 | | | | | 370,000 | | | | 366,137 | | | | 0.07 | |
Ukraine (Rep of) 9.250%, 07/24/2017 | | | | | 2,250,000 | | | | 2,453,782 | | | | 0.47 | |
Ukraine (Rep of) 7.750%, 09/23/2020 | | | | | 490,000 | | | | 511,374 | | | | 0.10 | |
Ukreximbank Via Biz Finance PLC 8.375%, 04/27/2015 | | | | | 970,000 | | | | 951,813 | | | | 0.18 | |
| | | | | | | | | 17,789,894 | | | | 3.44 | |
United Arab Emirates (Cost $16,434,712) | | | | | | | | | | | | | | |
Atlantic Finance Ltd. 10.750%, 05/27/2014 | | | | | 2,150,000 | | | | 2,375,750 | | | | 0.46 | |
DP World Ltd. 6.850%, 07/02/2037 | | | | | 2,700,000 | | | | 2,959,875 | | | | 0.57 | |
Dubai DOF Sukuk Ltd. 6.396%, 11/03/2014 | | | | | 980,000 | | | | 1,052,030 | | | | 0.20 | |
Dubai Holding Commercial Operations MTN Ltd. 4.750%, 01/30/2014 | | EUR | | | 3,200,000 | | | | 4,064,762 | | | | 0.79 | |
Dubai Holding Commercial Operations MTN Ltd. 6.000%, 02/01/2017 | | GBP | | | 1,300,000 | | | | 2,017,101 | | | | 0.39 | |
Emaar Sukuk Ltd. 6.400%, 07/18/2019 | | | | | 1,500,000 | | | | 1,623,750 | | | | 0.31 | |
Emirate of Dubai (Rep of) 6.700%, 10/05/2015 | | | | | 510,000 | | | | 563,550 | | | | 0.11 | |
Emirate of Dubai (Rep of) 7.750%, 10/05/2020 | | | | | 2,150,000 | | | | 2,596,125 | | | | 0.50 | |
| | | | | | | | | 17,252,943 | | | | 3.33 | |
See accompanying notes to the financial statements.
63
ASHMORE EMERGING MARKETS TOTAL RETURN FUND
SCHEDULE OF INVESTMENTS (CONTINUED)
As of October 31, 2012
| | | | | | | | | | | | | | |
| | | Currency(1) | | Par | | | Value | | | % of Net
Assets | |
Uruguay (Cost $7,958,362) | | | | | | | | | | | | | | |
Uruguay (Rep of) 5.000%, 09/14/2018 | | UYU | | | 12,120,000 | | | $ | 1,104,973 | | | | 0.21 | |
Uruguay (Rep of) 8.000%, 11/18/2022 | | | | | 1,436,000 | | | | 2,075,020 | | | | 0.40 | |
Uruguay (Rep of) 6.875%, 09/28/2025 | | | | | 214,000 | | | | 295,320 | | | | 0.06 | |
Uruguay (Rep of) 6.875%, 09/28/2025 | | | | | 210,000 | | | | 289,800 | | | | 0.06 | |
Uruguay (Rep of) 4.250%, 04/05/2027 | | UYU | | | 8,950,000 | | | | 798,954 | | | | 0.15 | |
Uruguay (Rep of) 4.375%, 12/15/2028 | | UYU | | | 15,090,000 | | | | 972,007 | | | | 0.19 | |
Uruguay (Rep of) 7.875%, 01/15/2033 | | | | | 1,111,000 | | | | 1,722,050 | | | | 0.33 | |
Uruguay (Rep of) 7.625%, 03/21/2036 | | | | | 545,000 | | | | 846,112 | | | | 0.16 | |
Uruguay (Rep of) 3.700%, 06/26/2037 | | UYU | | | 5,940,000 | | | | 490,903 | | | | 0.10 | |
Uruguay Notas del Tesoro 9.000%, 01/27/2014 | | UYU | | | 100,000 | | | | 5,028 | | | | — | |
Uruguay Notas del Tesoro 3.250%, 01/27/2019 | | UYU | | | 100,000 | | | | 13,215 | | | | — | |
| | | | | | | | | 8,613,382 | | | | 1.66 | |
Venezuela (Cost $7,958,593) | | | | | | | | | | | | | | |
Petroleos de Venezuela S.A. 5.250%, 04/12/2017 | | | | | 520,000 | | | | 410,800 | | | | 0.08 | |
Petroleos de Venezuela S.A. 12.750%, 02/17/2022 | | | | | 320,000 | | | | 328,800 | | | | 0.06 | |
Petroleos de Venezuela S.A. 5.375%, 04/12/2027 | | | | | 1,460,000 | | | | 912,500 | | | | 0.18 | |
Petroleos de Venezuela S.A. 5.500%, 04/12/2037 | | | | | 70,000 | | | | 42,875 | | | | 0.01 | |
Venezuela (Rep of) 8.500%, 10/08/2014 | | | | | 280,000 | | | | 284,200 | | | | 0.05 | |
Venezuela (Rep of) 7.750%, 10/13/2019 | | | | | 590,000 | | | | 513,300 | | | | 0.10 | |
Venezuela (Rep of) 6.000%, 12/09/2020 | | | | | 390,000 | | | | 297,375 | | | | 0.06 | |
Venezuela (Rep of) 12.750%, 08/23/2022 | | | | | 902,000 | | | | 967,395 | | | | 0.19 | |
Venezuela (Rep of) 9.000%, 05/07/2023 | | | | | 600,000 | | | | 526,500 | | | | 0.10 | |
Venezuela (Rep of) 8.250%, 10/13/2024 | | | | | 460,000 | | | | 379,500 | | | | 0.07 | |
Venezuela (Rep of) 7.650%, 04/21/2025 | | | | | 775,000 | | | | 610,312 | | | | 0.12 | |
Venezuela (Rep of) 11.750%, 10/21/2026 | | | | | 867,000 | | | | 877,838 | | | | 0.17 | |
Venezuela (Rep of) 9.250%, 09/15/2027 | | | | | 680,000 | | | | 613,700 | | | | 0.12 | |
Venezuela (Rep of) 9.250%, 05/07/2028 | | | | | 791,000 | | | | 698,058 | | | | 0.13 | |
Venezuela (Rep of) 11.950%, 08/05/2031 | | | | | 854,000 | | | | 873,215 | | | | 0.17 | |
Venezuela (Rep of) 9.375%, 01/13/2034 | | | | | 339,000 | | | | 300,862 | | | | 0.06 | |
| | | | | | | | | 8,637,230 | | | | 1.67 | |
Vietnam (Cost $1,062,080) | | | | | | | | | | | | | | |
Vietnam (Rep of) 6.875%, 01/15/2016 | | | | | 520,000 | | | | 574,600 | | | | 0.11 | |
Vietnam (Rep of) 6.750%, 01/29/2020 | | | | | 460,000 | | | | 537,050 | | | | 0.10 | |
| | | | | | | | | 1,111,650 | | | | 0.21 | |
Zambia (Cost $294,373) | | | | | | | | | | | | | | |
Zambia (Rep of) 5.375%, 09/20/2022(2) | | | | | 300,000 | | | | 302,250 | | | | 0.06 | |
| | | | | | | | | 302,250 | | | | 0.06 | |
Total Debt Securities (Cost $428,314,996) | | | | | | | | | 441,445,840 | | | | 85.26 | |
See accompanying notes to the financial statements.
64
ASHMORE EMERGING MARKETS TOTAL RETURN FUND
SCHEDULE OF INVESTMENTS (CONTINUED)
As of October 31, 2012
| | | | | | | | | | | | | | |
| | | Currency(1) | | Par | | | Value | | | % of Net
Assets | |
Short-Term Investments | | | | | | | | | | | | | | |
Riyad Bank London, Time Deposit 0.150%, 11/01/2012 | | | | | 50,000,000 | | | $ | 50,000,000 | | | | 9.66 | |
Riyad Bank London, Time Deposit 0.150%, 11/08/2012 | | | | | 50,000,000 | | | | 50,000,000 | | | | 9.66 | |
Landesbank Hessen-Thuerin, Time Deposit 0.160%, 11/01/2012 | | | | | 40,000,000 | | | | 40,000,000 | | | | 7.73 | |
Landesbank Hessen-Thuerin, Time Deposit 0.160%, 11/02/2012 | | | | | 40,000,000 | | | | 40,000,000 | | | | 7.72 | |
National Bank Abu Dhabi, Time Deposit 0.120%, 11/02/2012 | | | | | 20,000,000 | | | | 20,000,000 | | | | 3.86 | |
Total Short-Term Investments (Cost $200,000,000) | | | | | | | | | 200,000,000 | | | | 38.63 | |
| | | | |
Total Investments in Securities (Cost $628,314,996) | | | | | | | | | 641,445,840 | | | | 123.89 | |
| | | | |
Fully Funded Total Return Swaps | | | | | | | | | | | | | | |
| | | | |
India (Cost $909,526) | | | | | | | | | | | | | | |
India Government Bond, Issued by Credit Suisse Europe 8.790% 11/08/2021 | | INR | | | 14,000,000 | | | | 268,491 | | | | 0.05 | |
India Government Bond, Issued by HSBC 7.490% 04/16/2017 | | INR | | | 1,130,000 | | | | 20,470 | | | | — | |
India Government Bond, Issued by HSBC 7.830% 04/11/2018 | | INR | | | 11,700,000 | | | | 214,400 | | | | 0.04 | |
Rural Electrification Corp. Ltd., Issued by HSBC 9.350% 10/19/2016 | | INR | | | 18,000,000 | | | | 335,027 | | | | 0.07 | |
| | | | | | | | | 838,388 | | | | 0.16 | |
Indonesia (Cost $12,806,959) | | | | | | | | | | | | | | |
Indonesia (Rep of) 12.800% 06/15/2021 | | IDR | | | 35,000,000,000 | | | | 5,389,862 | | | | 1.04 | |
Indonesia (Rep of) 8.375% 09/15/2026 | | IDR | | | 9,100,000,000 | | | | 1,136,812 | | | | 0.22 | |
Indonesia (Rep of) 10.500% 08/15/2030 | | IDR | | | 32,000,000,000 | | | | 4,742,186 | | | | 0.92 | |
Indonesia (Rep of) 10.500% 08/15/2030 | | IDR | | | 5,300,000,000 | | | | 785,425 | | | | 0.15 | |
Indonesia (Rep of) 8.250% 06/15/2032 | | IDR | | | 5,800,000,000 | | | | 719,709 | | | | 0.14 | |
| | | | | | | | | 12,773,994 | | | | 2.47 | |
Total Fully Funded Total Return Swaps (Cost $13,716,485) | | | | | | | | | 13,612,382 | | | | 2.63 | |
| | | | |
Total Investments (Total Cost $642,031,481) | | | | | | | | | 655,058,222 | | | | 126.52 | |
| | | | |
Liabilities Less Other Assets (See Statements of Assets and Liabilities for further detail) | | | | | | | | | (137,297,853 | ) | | | (26.52 | ) |
Net Assets | | | | | | | | $ | 517,760,369 | | | | 100.00 | |
See accompanying notes to the financial statements.
65
ASHMORE EMERGING MARKETS TOTAL RETURN FUND
SCHEDULE OF INVESTMENTS (CONTINUED)
As of October 31, 2012
| (1) | Par values are stated in United States Dollars unless otherwise noted below. |
| (2) | Securities exempt from registration under Rule 144A of the Securities Act of 1933. These securities may not be publicly traded without registration under the Securities Act of 1933. |
| (3) | Restricted security that has been deemed illiquid. At October 31, 2012, the value of these restricted illiquid securities amounted to $1,682,001 or 0.3% of net assets. Additional information on each restricted illiquid security is as follows: |
| | | | | | |
| SECURITY | | ACQUISITION DATE | | ACQUISITION COST | |
Bolivian (Rep of) 4.875%, 10/29/2022 | | 10/22/2012 | | | $300,000 | |
Edcon Pty Ltd. 9.500%, 03/01/2018 | | 07/06/11-07/10/12 | | | 288,250 | |
Severstal OAO Via Steel Capital S.A. 5.900%, 10/17/2022 | | 10/04/2012 | | | 700,000 | |
Slovenia (Rep of) 5.500%, 10/26/2022 | | 10/19/2012 | | | 393,964 | |
| (5) | Issuer has defaulted on terms of debt obligation. |
| (6) | Zero coupon bond reflects effective yield on the date of purchase. |
| (7) | The average amount of borrowings outstanding during the year ended October 31, 2012 was $221,550. On October 31, 2012 securities valued at $282,000 were pledged as collateral for reverse repurchase agreements with JP Morgan, 0.0%, due 11/15/2012. |
Percentages shown are based on net assets.
At October 31, 2012, the Ashmore Emerging Markets Total Return Fund had outstanding forward foreign currency exchange contracts as follows:
| | | | | | | | | | | | | | | | | | |
Settlement Date | | Counterparty | | Currency Buy | | Currency Buy Amount (Local Currency) | | | Currency Sell | | Currency Sell Amount (Local Currency) | | | Unrealized Gain/(Loss) | |
| |
11/05/2012 | | Bank of America Los Angeles | | Brazilian Real | | | 1,080,245 | | | United States Dollar | | | 532,796 | | | | $(1,298) | |
11/05/2012 | | Barclays Wholesale GTS | | Brazilian Real | | | 2,161,949 | | | United States Dollar | | | 1,059,000 | | | | 4,714 | |
11/05/2012 | | Deutsche Bank London | | Brazilian Real | | | 1,838,700 | | | United States Dollar | | | 900,000 | | | | 4,670 | |
11/05/2012 | | Deutsche Bank London | | Brazilian Real | | | 2,564,583 | | | United States Dollar | | | 1,259,000 | | | | 2,816 | |
11/05/2012 | | HSBC Bank PLC | | Brazilian Real | | | 1,080,245 | | | United States Dollar | | | 532,796 | | | | (1,298) | |
11/05/2012 | | Barclays Wholesale GTS | | United States Dollar | | | 2,125,887 | | | Brazilian Real | | | 4,365,721 | | | | (22,119) | |
11/05/2012 | | HSBC Bank PLC | | United States Dollar | | | 2,122,687 | | | Brazilian Real | | | 4,360,000 | | | | (22,503) | |
11/13/2012 | | Bank of America Los Angeles | | Chinese Yuan Renminbi | | | 28,926,845 | | | United States Dollar | | | 4,563,674 | | | | 74,120 | |
11/13/2012 | | Bank of America Los Angeles | | Chinese Yuan Renminbi | | | 18,059,560 | | | United States Dollar | | | 2,840,000 | | | | 55,459 | |
11/13/2012 | | Bank of America Los Angeles | | Chinese Yuan Renminbi | | | 4,655,940 | | | United States Dollar | | | 730,000 | | | | 16,479 | |
11/13/2012 | | Bank of America Los Angeles | | Chinese Yuan Renminbi | | | 2,493,855 | | | United States Dollar | | | 390,000 | | | | 9,836 | |
11/13/2012 | | Bank of America Los Angeles | | Chinese Yuan Renminbi | | | 2,291,760 | | | United States Dollar | | | 360,000 | | | | 7,434 | |
11/13/2012 | | Barclays Wholesale GTS | | Chinese Yuan Renminbi | | | 21,617,695 | | | United States Dollar | | | 3,410,000 | | | | 55,929 | |
11/13/2012 | | Barclays Wholesale GTS | | Chinese Yuan Renminbi | | | 5,088,800 | | | United States Dollar | | | 800,000 | | | | 15,879 | |
11/13/2012 | | Barclays Wholesale GTS | | Chinese Yuan Renminbi | | | 3,292,640 | | | United States Dollar | | | 520,000 | | | | 7,904 | |
11/13/2012 | | Chase Manhattan Bank London | | Chinese Yuan Renminbi | | | 29,362,410 | | | United States Dollar | | | 4,620,000 | | | | 87,627 | |
11/13/2012 | | Citibank London | | Chinese Yuan Renminbi | | | 4,459,350 | | | United States Dollar | | | 700,000 | | | | 14,960 | |
11/13/2012 | | Deutsche Bank London | | Chinese Yuan Renminbi | | | 22,236,440 | | | United States Dollar | | | 3,524,000 | | | | 41,132 | |
11/13/2012 | | Morgan Stanley & Co. International | | Chinese Yuan Renminbi | | | 10,609,510 | | | United States Dollar | | | 1,670,000 | | | | 31,005 | |
11/13/2012 | | Standard Chartered London | | Chinese Yuan Renminbi | | | 16,502,490 | | | United States Dollar | | | 2,591,675 | | | | 54,142 | |
11/13/2012 | | Union Bank of Switzerland - London | | Chinese Yuan Renminbi | | | 7,853,402 | | | United States Dollar | | | 1,239,000 | | | | 20,123 | |
11/13/2012 | | Standard Chartered London | | United States Dollar | | | 13,800,000 | | | Chinese Yuan Renminbi | | | 86,995,200 | | | | (147,797) | |
11/14/2012 | | Bank of America Los Angeles | | Philippine Peso | | | 33,520,000 | | | United States Dollar | | | 800,000 | | | | 13,390 | |
11/14/2012 | | Deutsche Bank London | | Philippine Peso | | | 26,611,200 | | | United States Dollar | | | 640,000 | | | | 5,742 | |
11/14/2012 | | Union Bank of Switzerland - London | | Philippine Peso | | | 156,043,699 | | | United States Dollar | | | 3,740,261 | | | | 46,264 | |
11/14/2012 | | Union Bank of Switzerland - London | | Philippine Peso | | | 37,960,150 | | | United States Dollar | | | 896,640 | | | | 24,493 | |
11/14/2012 | | Union Bank of Switzerland - London | | Philippine Peso | | | 15,230,500 | | | United States Dollar | | | 367,000 | | | | 2,580 | |
11/14/2012 | | HSBC Bank PLC | | United States Dollar | | | 922,173 | | | Philippine Peso | | | 38,000,000 | | | | 73 | |
11/14/2012 | | Morgan Stanley & Co. International | | United States Dollar | | | 1,200,000 | | | Philippine Peso | | | 49,524,000 | | | | (1,739) | |
11/15/2012 | | Bank of America Los Angeles | | Russian Ruble | | | 81,199,971 | | | United States Dollar | | | 2,610,000 | | | | (27,943) | |
11/16/2012 | | Bank of America Los Angeles | | Chilean Peso | | | 406,524,808 | | | United States Dollar | | | 847,774 | | | | (2,027) | |
See accompanying notes to the financial statements.
66
ASHMORE EMERGING MARKETS TOTAL RETURN FUND
SCHEDULE OF INVESTMENTS (CONTINUED)
As of October 31, 2012
| | | | | | | | | | | | | | | | | | |
Settlement
Date | | Counterparty | | Currency Buy | | Currency
Buy Amount
(Local Currency) | | | Currency Sell | | Currency Sell Amount (Local Currency) | | | Unrealized Gain/(Loss) | |
| |
11/16/2012 | | Bank of America Los Angeles | | Colombian Peso | | | 5,327,300,000 | | | United States Dollar | | | 2,900,000 | | | | $2,185 | |
11/16/2012 | | Bank of America Los Angeles | | Korean Won | | | 1,446,900,000 | | | United States Dollar | | | 1,300,000 | | | | 26,577 | |
11/16/2012 | | Barclays Wholesale GTS | | Korean Won | | | 5,214,855,789 | | | United States Dollar | | | 4,663,408 | | | | 117,786 | |
11/16/2012 | | Standard Chartered London | | Korean Won | | | 555,561,650 | | | United States Dollar | | | 499,000 | | | | 10,362 | |
11/16/2012 | | Bank of America Los Angeles | | Mexican Peso | | | 16,068,538 | | | United States Dollar | | | 1,250,000 | | | | (24,809) | |
11/16/2012 | | Barclays Wholesale GTS | | Mexican Peso | | | 29,689,859 | | | United States Dollar | | | 2,303,414 | | | | (39,628) | |
11/16/2012 | | HSBC Bank PLC | | Mexican Peso | | | 44,075,982 | | | United States Dollar | | | 3,429,584 | | | | (68,887) | |
11/16/2012 | | Deutsche Bank London | | Peruvian Neuevo Sol | | | 5,726,820 | | | United States Dollar | | | 2,200,000 | | | | 7,623 | |
11/16/2012 | | Deutsche Bank London | | Peruvian Neuevo Sol | | | 2,808,263 | | | United States Dollar | | | 1,076,375 | | | | 6,178 | |
11/16/2012 | | Bank of America Los Angeles | | United States Dollar | | | 1,900,000 | | | Chilean Peso | | | 917,510,000 | | | | (8,816) | |
11/16/2012 | | Morgan Stanley & Co. International | | United States Dollar | | | 2,261,008 | | | Colombian Peso | | | 4,098,077,068 | | | | 28,474 | |
11/16/2012 | | Deutsche Bank London | | United States Dollar | | | 274,000 | | | Peruvian Neuevo Sol | | | 714,866 | | | | (1,573) | |
11/16/2012 | | Deutsche Bank London | | United States Dollar | | | 2,451,240 | | | Peruvian Neuevo Sol | | | 6,372,243 | | | | (5,187) | |
11/19/2012 | | Citibank London | | Chilean Peso | | | 2,220,794,340 | | | United States Dollar | | | 4,687,000 | | | | (65,925) | |
11/19/2012 | | Barclays Wholesale GTS | | Malaysian Ringgit | | | 7,203,960 | | | United States Dollar | | | 2,335,006 | | | | 26,451 | |
11/19/2012 | | Barclays Wholesale GTS | | Malaysian Ringgit | | | 1,264,248 | | | United States Dollar | | | 409,738 | | | | 4,682 | |
11/19/2012 | | Citibank London | | Malaysian Ringgit | | | 23,592,800 | | | United States Dollar | | | 7,700,000 | | | | 33,715 | |
11/19/2012 | | CSFB Global Foreign Exchange London | | United States Dollar | | | 159,622 | | | British Pound | | | 99,262 | | | | (552) | |
11/19/2012 | | Union Bank of Switzerland - London | | United States Dollar | | | 1,696,935 | | | British Pound | | | 1,058,239 | | | | (10,686) | |
11/19/2012 | | Bank of America Los Angeles | | United States Dollar | | | 182,852 | | | Euro | | | 140,704 | | | | 446 | |
11/19/2012 | | CSFB Global Foreign Exchange London | | United States Dollar | | | 590,249 | | | Euro | | | 454,195 | | | | 1,441 | |
11/19/2012 | | CSFB Global Foreign Exchange London | | United States Dollar | | | 396,526 | | | Euro | | | 305,173 | | | | 907 | |
11/19/2012 | | Deutsche Bank London | | United States Dollar | | | 261,922 | | | Euro | | | 201,923 | | | | 154 | |
11/19/2012 | | Deutsche Bank London | | United States Dollar | | | 12,914,659 | | | Euro | | | 9,974,173 | | | | (15,628) | |
11/21/2012 | | Chase Manhattan Bank London | | Indian Rupee | | | 253,272,676 | | | United States Dollar | | | 4,757,188 | | | | (69,469) | |
11/21/2012 | | Deutsche Bank London | | Indian Rupee | | | 224,024,440 | | | United States Dollar | | | 4,196,000 | | | | (49,624) | |
11/21/2012 | | Union Bank of Switzerland - London | | Indian Rupee | | | 66,330,000 | | | United States Dollar | | | 1,268,867 | | | | (41,192) | |
11/21/2012 | | Barclays Wholesale GTS | | Malaysian Ringgit | | | 5,580,000 | | | United States Dollar | | | 1,817,294 | | | | 11,551 | |
11/21/2012 | | Standard Chartered London | | Malaysian Ringgit | | | 6,369,900 | | | United States Dollar | | | 2,040,000 | | | | 47,734 | |
11/21/2012 | | Union Bank of Switzerland - London | | Malaysian Ringgit | | | 4,698,792 | | | United States Dollar | | | 1,531,000 | | | | 9,028 | |
11/21/2012 | | Union Bank of Switzerland - London | | Malaysian Ringgit | | | 5,030,700 | | | United States Dollar | | | 1,640,000 | | | | 8,811 | |
11/21/2012 | | Bank of America Los Angeles | | Thai Baht | | | 27,810,000 | | | United States Dollar | | | 900,000 | | | | 6,160 | |
11/21/2012 | | Barclays Wholesale GTS | | Thai Baht | | | 35,523,500 | | | United States Dollar | | | 1,150,000 | | | | 7,496 | |
11/21/2012 | | Barclays Wholesale GTS | | Thai Baht | | | 20,835,717 | | | United States Dollar | | | 673,990 | | | | 4,920 | |
11/21/2012 | | Barclays Wholesale GTS | | Thai Baht | | | 12,474,350 | | | United States Dollar | | | 406,000 | | | | 463 | |
11/21/2012 | | Deutsche Bank London | | Thai Baht | | | 109,173,945 | | | United States Dollar | | | 3,554,823 | | | | 2,496 | |
11/21/2012 | | Morgan Stanley & Co. International | | Thai Baht | | | 101,557,500 | | | United States Dollar | | | 3,300,000 | | | | 9,145 | |
11/21/2012 | | Bank of America Los Angeles | | United States Dollar | | | 5,470,000 | | | Indian Rupee | | | 294,110,960 | | | | 26,422 | |
11/21/2012 | | Barclays Wholesale GTS | | United States Dollar | | | 1,710,000 | | | Malaysian Ringgit | | | 5,210,712 | | | | 2,190 | |
11/21/2012 | | Deutsche Bank London | | United States Dollar | | | 685,714 | | | Malaysian Ringgit | | | 2,100,000 | | | | (2,560) | |
11/21/2012 | | HSBC Bank PLC | | United States Dollar | | | 4,538,035 | | | Malaysian Ringgit | | | 13,900,000 | | | | (17,689) | |
11/21/2012 | | Deutsche Bank London | | United States Dollar | | | 1,136,733 | | | Thai Baht | | | 35,000,000 | | | | (3,706) | |
11/21/2012 | | Deutsche Bank London | | United States Dollar | | | 2,176,031 | | | Thai Baht | | | 67,000,000 | | | | (7,094) | |
11/21/2012 | | HSBC Bank PLC | | United States Dollar | | | 1,299,419 | | | Thai Baht | | | 40,000,000 | | | | (3,940) | |
11/27/2012 | | HSBC Bank PLC | | Polish Zloty | | | 27,614,742 | | | United States Dollar | | | 8,555,680 | | | | 65,614 | |
11/28/2012 | | Citibank London | | Indonesian Rupiah | | | 85,008,000,000 | | | United States Dollar | | | 8,800,000 | | | | 18,645 | |
11/28/2012 | | Barclays Wholesale GTS | | Korean Won | | | 3,826,857,860 | | | United States Dollar | | | 3,421,450 | | | | 86,929 | |
11/28/2012 | | Union Bank of Switzerland - London | | Malaysian Ringgit | | | 5,728,622 | | | United States Dollar | | | 1,822,429 | | | | 54,125 | |
11/28/2012 | | Deutsche Bank London | | Taiwan Dollar | | | 306,532,524 | | | United States Dollar | | | 10,508,486 | | | | (16,126) | |
11/28/2012 | | Standard Chartered London | | United States Dollar | | | 11,498,575 | | | Indonesian Rupiah | | | 111,133,731,000 | | | | (30,327) | |
11/28/2012 | | Standard Chartered London | | United States Dollar | | | 8,600,000 | | | Taiwan Dollar | | | 251,464,000 | | | | (7,408) | |
11/29/2012 | | Chase Manhattan Bank London | | Indian Rupee | | | 253,272,676 | | | United States Dollar | | | 4,759,423 | | | | (79,096) | |
11/29/2012 | | Barclays Wholesale GTS | | Indonesian Rupiah | | | 71,901,458,200 | | | United States Dollar | | | 7,420,171 | | | | 37,880 | |
11/29/2012 | | HSBC Bank PLC | | Romanian Leu | | | 13,354,596 | | | United States Dollar | | | 3,790,581 | | | | 1,682 | |
11/29/2012 | | Union Bank of Switzerland - London | | Romanian Leu | | | 2,546,976 | | | United States Dollar | | | 721,016 | | | | 2,240 | |
11/29/2012 | | Citibank London | | United States Dollar | | | 10,400,000 | | | Indian Rupee | | | 565,864,000 | | | | (56,827) | |
11/29/2012 | | Standard Chartered London | | United States Dollar | | | 1,539,117 | | | Indonesian Rupiah | | | 14,890,961,300 | | | | (5,462) | |
11/29/2012 | | Deutsche Bank London | | United States Dollar | | | 450,000 | | | Romanian Leu | | | 1,591,164 | | | | (1,838) | |
11/29/2012 | | Union Bank of Switzerland - London | | United States Dollar | | | 2,000,000 | | | Romanian Leu | | | 7,079,538 | | | | (10,354) | |
See accompanying notes to the financial statements.
67
ASHMORE EMERGING MARKETS TOTAL RETURN FUND
SCHEDULE OF INVESTMENTS (CONTINUED)
As of October 31, 2012
| | | | | | | | | | | | | | | | | | |
Settlement Date | | Counterparty | | Currency Buy | | Currency Buy Amount (Local Currency) | | | Currency Sell | | Currency Sell Amount (Local Currency) | | | Unrealized Gain/(Loss) | |
| |
11/30/2012 | | Barclays Wholesale GTS | | Czech Koruna | | | 140,560,068 | | | United States Dollar | | | 7,277,569 | | | | $(15,660) | |
11/30/2012 | | Deutsche Bank London | | Hungarian Forint | | | 688,822,800 | | | United States Dollar | | | 3,090,000 | | | | 47,092 | |
11/30/2012 | | Deutsche Bank London | | Hungarian Forint | | | 141,006,012 | | | United States Dollar | | | 625,235 | | | | 16,946 | |
11/30/2012 | | HSBC Bank PLC | | Hungarian Forint | | | 173,692,484 | | | United States Dollar | | | 784,962 | | | | 6,082 | |
11/30/2012 | | Union Bank of Switzerland - London | | Hungarian Forint | | | 1,108,375,000 | | | United States Dollar | | | 5,000,000 | | | | 47,850 | |
11/30/2012 | | Union Bank of Switzerland - London | | Hungarian Forint | | | 66,039,750 | | | United States Dollar | | | 300,000 | | | | 763 | |
11/30/2012 | | Goldman Sachs Intl Ltd. London | | Israeli Shekel | | | 16,540,012 | | | United States Dollar | | | 4,271,395 | | | | (18,207) | |
11/30/2012 | | Deutsche Bank London | | Polish Zloty | | | 7,112,600 | | | United States Dollar | | | 2,120,000 | | | | 99,740 | |
11/30/2012 | | Deutsche Bank London | | Polish Zloty | | | 25,794,216 | | | United States Dollar | | | 8,000,000 | | | | 50,004 | |
11/30/2012 | | Deutsche Bank London | | Polish Zloty | | | 4,328,789 | | | United States Dollar | | | 1,370,000 | | | | (19,047) | |
11/30/2012 | | Deutsche Bank London | | Polish Zloty | | | 10,975,633 | | | United States Dollar | | | 3,500,000 | | | | (74,663) | |
11/30/2012 | | Bank of America Los Angeles | | Russian Ruble | | | 73,324,000 | | | United States Dollar | | | 2,337,169 | | | | (11,675) | |
11/30/2012 | | Citibank London | | Russian Ruble | | | 48,034,350 | | | United States Dollar | | | 1,530,000 | | | | (6,575) | |
11/30/2012 | | Barclays Wholesale GTS | | Singapore Dollar | | | 14,861,180 | | | United States Dollar | | | 12,138,512 | | | | 44,381 | |
11/30/2012 | | Barclays Wholesale GTS | | Singapore Dollar | | | 3,423,218 | | | United States Dollar | | | 2,800,000 | | | | 6,285 | |
11/30/2012 | | Bank of America Los Angeles | | South African Rand | | | 6,874,027 | | | United States Dollar | | | 790,000 | | | | (726) | |
11/30/2012 | | Deutsche Bank London | | South African Rand | | | 85,556,352 | | | United States Dollar | | | 9,800,000 | | | | 23,562 | |
11/30/2012 | | Standard Chartered London | | South African Rand | | | 45,653,274 | | | United States Dollar | | | 5,199,867 | | | | 42,032 | |
11/30/2012 | | Deutsche Bank London | | Turkish Lira | | | 11,064,335 | | | United States Dollar | | | 6,107,696 | | | | 39,292 | |
11/30/2012 | | HSBC Bank PLC | | Turkish Lira | | | 8,500,000 | | | United States Dollar | | | 4,654,219 | | | | 68,107 | |
11/30/2012 | | Morgan Stanley & Co. International | | Turkish Lira | | | 15,555,680 | | | United States Dollar | | | 8,600,000 | | | | 42,234 | |
11/30/2012 | | Union Bank of Switzerland - London | | United States Dollar | | | 1,410,000 | | | Czech Koruna | | | 27,456,930 | | | | (8,538) | |
11/30/2012 | | Union Bank of Switzerland - London | | United States Dollar | | | 4,700,000 | | | Czech Koruna | | | 91,163,550 | | | | (9,883) | |
11/30/2012 | | HSBC Bank PLC | | United States Dollar | | | 8,256,981 | | | Hungarian Forint | | | 1,821,985,445 | | | | (40,850) | |
11/30/2012 | | Union Bank of Switzerland - London | | United States Dollar | | | 2,100,000 | | | Israeli Shekel | | | 8,165,787 | | | | 205 | |
11/30/2012 | | Barclays Wholesale GTS | | United States Dollar | | | 11,782,289 | | | Polish Zloty | | | 37,829,008 | | | | (23,600) | |
11/30/2012 | | Standard Chartered London | | United States Dollar | | | 11,100,000 | | | Singapore Dollar | | | 13,561,203 | | | | (17,198) | |
11/30/2012 | | Barclays Wholesale GTS | | United States Dollar | | | 8,964,602 | | | South African Rand | | | 78,317,002 | | | | (27,740) | |
11/30/2012 | | CSFB Global Foreign Exchange London | | United States Dollar | | | 4,236,004 | | | South African Rand | | | 37,006,150 | | | | (13,035) | |
11/30/2012 | | HSBC Bank PLC | | United States Dollar | | | 940,683 | | | South African Rand | | | 8,213,341 | | | | (2,371) | |
11/30/2012 | | Union Bank of Switzerland - London | | United States Dollar | | | 9,571,599 | | | Turkish Lira | | | 17,273,358 | | | | (24,921) | |
12/04/2012 | | Barclays Wholesale GTS | | Brazilian Real | | | 12,240,000 | | | United States Dollar | | | 6,000,000 | | | | (1,986) | |
12/04/2012 | | HSBC Bank PLC | | Brazilian Real | | | 7,774,152 | | | United States Dollar | | | 3,737,393 | | | | 72,204 | |
12/04/2012 | | Morgan Stanley & Co. International | | Brazilian Real | | | 7,739,000 | | | United States Dollar | | | 3,743,711 | | | | 48,660 | |
12/07/2012 | | Deutsche Bank London | | Chilean Peso | | | 148,180,000 | | | United States Dollar | | | 310,496 | | | | (1,791) | |
12/07/2012 | | Barclays Wholesale GTS | | Mexican Peso | | | 29,689,858 | | | United States Dollar | | | 2,293,096 | | | | (34,084) | |
12/07/2012 | | Goldman Sachs Intl Ltd. London | | Mexican Peso | | | 102,850,000 | | | United States Dollar | | | 7,970,706 | | | | (145,161) | |
12/07/2012 | | HSBC Bank PLC | | Mexican Peso | | | 51,094,444 | | | United States Dollar | | | 3,889,058 | | | | (1,437) | |
12/07/2012 | | Morgan Stanley & Co. International | | Mexican Peso | | | 42,040,320 | | �� | United States Dollar | | | 3,200,000 | | | | (1,279) | |
12/07/2012 | | Morgan Stanley & Co. International | | Mexican Peso | | | 40,549,948 | | | United States Dollar | | | 3,091,993 | | | | (6,671) | |
12/07/2012 | | Chase Manhattan Bank London | | Peruvian Neuevo Sol | | | 3,203,209 | | | United States Dollar | | | 1,233,902 | | | | (666) | |
12/07/2012 | | HSBC Bank PLC | | United States Dollar | | | 756,242 | | | Chilean Peso | | | 365,000,000 | | | | (4,168) | |
12/07/2012 | | Barclays Wholesale GTS | | United States Dollar | | | 9,987,497 | | | Mexican Peso | | | 131,000,000 | | | | 20,103 | |
12/07/2012 | | Union Bank of Switzerland - London | | United States Dollar | | | 1,952,546 | | | Mexican Peso | | | 25,658,408 | | | | 276 | |
12/10/2012 | | Bank of America Los Angeles | | Polish Zloty | | | 10,491,863 | | | United States Dollar | | | 3,150,000 | | | | 120,557 | |
12/17/2012 | | Union Bank of Switzerland - London | | Russian Ruble | | | 37,812,500 | | | United States Dollar | | | 1,210,000 | | | | (14,828) | |
12/18/2012 | | Deutsche Bank London | | Indian Rupee | | | 119,048,200 | | | United States Dollar | | | 2,140,000 | | | | 52,291 | |
12/18/2012 | | Standard Chartered London | | Indian Rupee | | | 97,447,500 | | | United States Dollar | | | 1,830,000 | | | | (35,489) | |
12/18/2012 | | Citibank London | | Korean Won | | | 3,103,696,400 | | | United States Dollar | | | 2,800,000 | | | | 45,109 | |
12/18/2012 | | Deutsche Bank London | | Malaysian Ringgit | | | 7,582,138 | | | United States Dollar | | | 2,431,030 | | | | 49,219 | |
12/18/2012 | | Citibank London | | Singapore Dollar | | | 9,354,819 | | | United States Dollar | | | 7,668,450 | | | | 440 | |
12/20/2012 | | Bank of America Los Angeles | | Russian Ruble | | | 85,003,081 | | | United States Dollar | | | 2,689,333 | | | | (4,181) | |
12/20/2012 | | Barclays Wholesale GTS | | Russian Ruble | | | 156,350,000 | | | United States Dollar | | | 5,000,000 | | | | (61,079) | |
12/20/2012 | | Deutsche Bank London | | Russian Ruble | | | 41,278,640 | | | United States Dollar | | | 1,300,000 | | | | 3,946 | |
12/20/2012 | | Barclays Wholesale GTS | | United States Dollar | | | 4,390,000 | | | Russian Ruble | | | 137,833,752 | | | | 35,987 | |
12/20/2012 | | CSFB Global Foreign Exchange London | | United States Dollar | | | 2,699,361 | | | Russian Ruble | | | 83,842,166 | | | | 50,882 | |
12/20/2012 | | CSFB Global Foreign Exchange London | | United States Dollar | | | 713,113 | | | Russian Ruble | | | 22,120,778 | | | | 14,343 | |
12/20/2012 | | Goldman Sachs Intl Ltd. London | | United States Dollar | | | 3,510,116 | | | Russian Ruble | | | 111,367,199 | | | | (7,849) | |
12/21/2012 | | Citibank London | | United States Dollar | | | 2,869,318 | | | Colombian Peso | | | 5,204,226,000 | | | | 45,318 | |
See accompanying notes to the financial statements.
68
ASHMORE EMERGING MARKETS TOTAL RETURN FUND
SCHEDULE OF INVESTMENTS (CONTINUED)
As of October 31, 2012
| | | | | | | | | | | | | | | | | | |
Settlement Date | | Counterparty | | Currency Buy | | Currency Buy Amount (Local Currency) | | | Currency Sell | | Currency Sell Amount (Local Currency) | | | Unrealized Gain/(Loss) | |
| |
12/21/2012 | | Morgan Stanley & Co. International | | United States Dollar | | | 1,860,000 | | | Colombian Peso | | | 3,427,980,000 | | | | $(145) | |
01/03/2013 | | Banco Santander New York | | United States Dollar | | | 1,643,421 | | | Brazilian Real | | | 3,370,000 | | | | (920) | |
01/03/2013 | | Chase Manhattan Bank London | | United States Dollar | | | 1,638,810 | | | Brazilian Real | | | 3,377,587 | | | | (9,234) | |
01/15/2013 | | Union Bank of Switzerland - London | | Indian Rupee | | | 506,545,352 | | | United States Dollar | | | 9,090,907 | | | | 190,201 | |
01/18/2013 | | Morgan Stanley & Co. International | | Mexican Peso | | | 89,050,000 | | | United States Dollar | | | 6,842,158 | | | | (96,774) | |
01/30/2013 | | Deutsche Bank London | | Polish Zloty | | | 10,069,089 | | | United States Dollar | | | 3,099,421 | | | | 22,005 | |
01/31/2013 | | Barclays Wholesale GTS | | Czech Koruna | | | 67,988,683 | | | United States Dollar | | | 3,528,613 | | | | (14,974) | |
01/31/2013 | | Union Bank of Switzerland - London | | Hungarian Forint | | | 367,503,800 | | | United States Dollar | | | 1,685,875 | | | | (24,002) | |
01/31/2013 | | Bank of America Los Angeles | | Polish Zloty | | | 23,494,540 | | | United States Dollar | | | 7,291,799 | | | | (9,173) | |
01/31/2013 | | Union Bank of Switzerland - London | | Russian Ruble | | | 290,384,377 | | | United States Dollar | | | 9,150,143 | | | | (31,886) | |
02/04/2013 | | Bank of America Los Angeles | | United States Dollar | | | 526,050 | | | Brazilian Real | | | 1,080,245 | | | | 1,180 | |
02/04/2013 | | HSBC Bank PLC | | United States Dollar | | | 525,974 | | | Brazilian Real | | | 1,080,245 | | | | 1,103 | |
02/11/2013 | | Deutsche Bank London | | Indian Rupee | | | 219,980,800 | | | United States Dollar | | | 4,160,000 | | | | (147,472) | |
02/11/2013 | | Standard Chartered London | | Indian Rupee | | | 72,530,780 | | | United States Dollar | | | 1,358,000 | | | | (35,014) | |
04/15/2013 | | HSBC Bank PLC | | Chinese Offshore Yuan | | | 13,195,850 | | | United States Dollar | | | 2,050,000 | | | | 35,025 | |
04/15/2013 | | HSBC Bank PLC | | Chinese Offshore Yuan | | | 17,289,800 | | | United States Dollar | | | 2,710,000 | | | | 21,895 | |
04/15/2013 | | HSBC Bank PLC | | Chinese Offshore Yuan | | | 3,513,675 | | | United States Dollar | | | 550,000 | | | | 5,182 | |
04/15/2013 | | HSBC Bank PLC | | Chinese Offshore Yuan | | | 3,508,450 | | | United States Dollar | | | 550,000 | | | | 4,357 | |
04/15/2013 | | HSBC Bank PLC | | United States Dollar | | | 27,396 | | | Chinese Offshore Yuan | | | 174,251 | | | | (137) | |
04/15/2013 | | HSBC Bank PLC | | United States Dollar | | | 5,775,607 | | | Chinese Offshore Yuan | | | 37,333,524 | | | | (123,319) | |
05/02/2013 | | Standard Chartered London | | Chinese Offshore Yuan | | | 80,500,000 | | | United States Dollar | | | 12,500,000 | | | | 203,350 | |
05/02/2013 | | Standard Chartered London | | Chinese Offshore Yuan | | | 21,906,200 | | | United States Dollar | | | 3,400,000 | | | | 56,921 | |
05/02/2013 | | Standard Chartered London | | Chinese Offshore Yuan | | | 7,029,000 | | | United States Dollar | | | 1,100,000 | | | | 9,216 | |
05/02/2013 | | Standard Chartered London | | Chinese Offshore Yuan | | | 2,404,200 | | | United States Dollar | | | 378,049 | | | | 1,348 | |
05/02/2013 | | Standard Chartered London | | United States Dollar | | | 970,300 | | | Chinese Offshore Yuan | | | 6,222,535 | | | | (11,650) | |
05/02/2013 | | Standard Chartered London | | United States Dollar | | | 16,612,956 | | | Chinese Offshore Yuan | | | 105,616,865 | | | | (53,976) | |
06/17/2013 | | Standard Chartered London | | United States Dollar | | | 3,883,527 | | | Chinese Offshore Yuan | | | 24,998,265 | | | | (50,732) | |
07/17/2013 | | HSBC Bank PLC | | Chinese Offshore Yuan | | | 3,666,015 | | | United States Dollar | | | 573,577 | | | | 2,371 | |
07/17/2013 | | Standard Chartered London | | Chinese Offshore Yuan | | | 24,998,265 | | | United States Dollar | | | 3,870,000 | | | | 57,342 | |
07/17/2013 | | Standard Chartered London | | Chinese Offshore Yuan | | | 657,900 | | | United States Dollar | | | 103,051 | | | | 308 | |
07/17/2013 | | HSBC Bank PLC | | United States Dollar | | | 564,393 | | | Chinese Offshore Yuan | | | 3,666,015 | | | | (11,555) | |
07/17/2013 | | Standard Chartered London | | United States Dollar | | | 103,079 | | | Chinese Offshore Yuan | | | 657,900 | | | | (280) | |
04/13/2015 | | HSBC Bank PLC | | Chinese Offshore Yuan | | | 38,604,157 | | | United States Dollar | | | 5,775,607 | | | | 104,963 | |
04/13/2015 | | HSBC Bank PLC | | Chinese Offshore Yuan | | | 174,251 | | | United States Dollar | | | 26,573 | | | | (29) | |
04/13/2015 | | HSBC Bank PLC | | United States Dollar | | | 2,710,000 | | | Chinese Offshore Yuan | | | 17,596,030 | | | | 29,597 | |
04/13/2015 | | HSBC Bank PLC | | United States Dollar | | | 550,000 | | | Chinese Offshore Yuan | | | 3,554,650 | | | | 8,520 | |
04/13/2015 | | HSBC Bank PLC | | United States Dollar | | | 550,000 | | | Chinese Offshore Yuan | | | 3,565,925 | | | | 6,803 | |
04/13/2015 | | HSBC Bank PLC | | United States Dollar | | | 2,050,000 | | | Chinese Offshore Yuan | | | 13,449,435 | | | | 1,248 | |
04/13/2015 | | HSBC Bank PLC | | United States Dollar | | | 93,434 | | | Chinese Offshore Yuan | | | 612,369 | | | | 152 | |
05/04/2015 | | Standard Chartered London | | Chinese Offshore Yuan | | | 6,222,535 | | | United States Dollar | | | 939,109 | | | | 7,740 | |
05/04/2015 | | Standard Chartered London | | Chinese Offshore Yuan | | | 105,616,865 | | | United States Dollar | | | 16,100,132 | | | | (28,987) | |
05/04/2015 | | Standard Chartered London | | United States Dollar | | | 1,100,000 | | | Chinese Offshore Yuan | | | 7,158,800 | | | | 10,684 | |
05/04/2015 | | Standard Chartered London | | United States Dollar | | | 3,400,000 | | | Chinese Offshore Yuan | | | 22,343,100 | | | | 172 | |
05/04/2015 | | Standard Chartered London | | United States Dollar | | | 12,500,000 | | | Chinese Offshore Yuan | | | 82,337,500 | | | | (28,850) | |
06/17/2015 | | Standard Chartered London | | Chinese Offshore Yuan | | | 24,998,265 | | | United States Dollar | | | 3,761,400 | | | | 33,787 | |
07/17/2015 | | HSBC Bank PLC | | Chinese Offshore Yuan | | | 3,785,666 | | | United States Dollar | | | 564,393 | | | | 9,445 | |
07/17/2015 | | Standard Chartered London | | Chinese Offshore Yuan | | | 657,900 | | | United States Dollar | | | 100,038 | | | | (312) | |
07/17/2015 | | HSBC Bank PLC | | United States Dollar | | | 557,442 | | | Chinese Offshore Yuan | | | 3,666,015 | | | | 1,741 | |
07/17/2015 | | HSBC Bank PLC | | United States Dollar | | | 18,198 | | | Chinese Offshore Yuan | | | 119,651 | | | | 61 | |
07/17/2015 | | Standard Chartered London | | United States Dollar | | | 3,870,000 | | | Chinese Offshore Yuan | | | 25,656,165 | | | | (19,005) | |
| | | | | | | | | | | | | | | | | | |
Total | | | | | | | | | | | | | | | | | $982,999 | |
| | | | | | | | | | | | | | | | | | |
See accompanying notes to the financial statements.
69
ASHMORE EMERGING MARKETS TOTAL RETURN FUND
SCHEDULE OF INVESTMENTS (CONTINUED)
As of October 31, 2012
At October 31, 2012, the Ashmore Emerging Markets Total Return Fund had the following interest rate swap contracts outstanding:
| | | | | | | | | | | | | | | | | | |
Pay Rate Index/ Pay Rate | | Receive Rate/ Receive Rate Index | | | | | Notional Amount | | | Expiration Date | | | Unrealized Gains/ (Losses) | | Counterparty |
Brazil CETIP Interbank | | | | | | | | | | | | | | | | | | |
Deposit Rate | | 9.644% | | | BRL | | | | 1,453,739 | | | | 01/02/2017 | | | $46,097 | | HSBC |
| | | | | | |
Brazil CETIP Interbank | | | | | | | | | | | | | | | | | | |
Deposit Rate | | 9.048% | | | BRL | | | | 35,232,343 | | | | 01/02/2017 | | | 617,370 | | HSBC |
| | | | | | |
Brazil CETIP Interbank | | | | | | | | | | | | | | | | | | |
Deposit Rate | | 9.050% | | | BRL | | | | 10,164,227 | | | | 01/02/2017 | | | 179,397 | | HSBC |
| | | | | | |
Brazil CETIP Interbank | | | | | | | | | | | | | | | | | | |
Deposit Rate | | 8.310% | | | BRL | | | | 27,399,877 | | | | 01/02/2017 | | | (27,651) | | HSBC |
| | | | | | |
Singapore Offer Rate | | | | | | | | | | | | | | | | | | |
Fixing 6 Month | | 1.800% | | | SGD | | | | 2,780,000 | | | | 10/25/2022 | | | 1,168 | | Barclays Capital |
| | | | | | |
| | Singapore Offer Rate | | | | | | | | | | | | | | | | |
2.600% | | Fixing 6 Month | | | SGD | | | | 1,560,000 | | | | 10/25/2032 | | | (374) | | Barclays Capital |
| | | | | | | | | | | | | | | | | | |
| | | | | | | | | | | | | | | | $816,007 | | |
| | | | | | | | | | | | | | | | | | |
At October 31, 2012, for U.S. federal income tax purposes, gross unrealized appreciation, gross unrealized depreciation, net unrealized appreciation/(depreciation) on investments in securities (including the effects of foreign currency translation) and the cost basis of investments were as follows:
| | | | |
Federal tax cost of investments | | | $642,565,757 | |
Gross tax appreciation of investments | | | $16,085,090 | |
Gross tax depreciation of investments | | | (3,592,625) | |
Net tax appreciation of investments | | | $12,492,465 | |
The difference between book basis and tax basis net unrealized appreciation or depreciation is attributable primarily to the tax deferral of losses on wash sales.
See accompanying notes to the financial statements.
70
ASHMORE EMERGING MARKETS TOTAL RETURN FUND
SCHEDULE OF INVESTMENTS (CONTINUED)
As of October 31, 2012
The inputs or methodologies used for valuing securities are not necessarily an indication of the risks associated with investing in those securities and other financial instruments, if any. See note 4 in the Notes to the Financial Statements for more information regarding pricing inputs and valuation techniques. The following is a summary of the inputs used in valuing the Ashmore Emerging Markets Total Return Fund’s investments and other financial instruments, which are carried at fair value, as of October 31, 2012:
| | | | | | | | | | | | | | | | |
| | | Level 1 | | | Level 2 | | | Level 3 | | | Total | |
Investments | | | | | | | | | | | | | | | | |
Assets: | | | | | | | | | | | | | | | | |
Corporate Bonds | | | $— | | | | $166,568,316 | | | | $— | | | | $166,568,316 | |
Corporate Convertible Bonds | | | — | | | | 147,000 | | | | — | | | | 147,000 | |
Government Agencies | | | — | | | | 5,969,965 | | | | — | | | | 5,969,965 | |
Government Bonds | | | — | | | | 242,456,022 | | | | — | | | | 242,456,022 | |
Financial Certificates | | | — | | | | 3,535,996 | | | | — | | | | 3,535,996 | |
Index Linked Corporate Bonds | | | — | | | | 4,555,244 | | | | — | | | | 4,555,244 | |
Index Linked Government Bonds | | | — | | | | 18,213,297 | | | | — | | | | 18,213,297 | |
Fully Funded Total Return Swaps | | | — | | | | 13,612,382 | | | | — | | | | 13,612,382 | |
Short-Term Investments | | | — | | | | 200,000,000 | | | | — | | | | 200,000,000 | |
| |
Total Investments | | | $— | | | | $655,058,222 | | | | $— | | | | $655,058,222 | |
| |
| | | | |
Other Financial Instruments | | | | | | | | | | | | | | | | |
Assets: | | | | | | | | | | | | | | | | |
Forward Foreign Currency Exchange Contracts | | | $— | | | | $ 3,187,910 | | | | $— | | | | $ 3,187,910 | |
Interest Rate Swap Contracts | | | — | | | | 844,032 | | | | — | | | | 844,032 | |
Liabilities: | | | | | | | | | | | | | | | | |
Forward Foreign Currency Exchange Contracts | | | — | | | | (2,204,911 | ) | | | — | | | | (2,204,911 | ) |
Interest Rate Swap Contracts | | | — | | | | (28,025 | ) | | | — | | | | (28,025 | ) |
| |
Total Other Financial Instruments | | | $— | | | | $ 1,799,006 | | | | $— | | | | $ 1,799,006 | |
| |
The Fund discloses all transfers between levels based on valuations at the end of each reporting period. At October 31, 2012, there were no transfers between Level 1, Level 2 and Level 3 based on levels assigned to the securities on October 31, 2011. U.S. GAAP provides additional guidance for estimating fair value when the volume and level of activity for the asset or liability have significantly decreased as well as guidance on identifying circumstances that indicate when a transaction is not orderly.
See accompanying notes to the financial statements.
71
ASHMORE EMERGING MARKETS TOTAL RETURN FUND
SCHEDULE OF INVESTMENTS (CONTINUED)
As of October 31, 2012
The following is a summary of the fair values of the Fund’s derivative instruments*:
Fair Values of Financial Derivative Instruments on the Statements of Assets and Liabilities as of October 31, 2012:
| | | | | | | | |
| | | Derivatives Not Accounted for as Hedging Instruments | |
| | | Foreign Exchange | | | Fixed Income/ Interest Rate | |
Assets: | | | | | | | | |
Unrealized Appreciation on Interest Rate Swap Contracts | | $ | — | | | $ | 844,032 | |
Unrealized Appreciation on Forward Foreign Currency Exchange Contracts | | | 3,187,910 | | | | — | |
| | $ | 3,187,910 | | | $ | 844,032 | |
Liabilities: | | | | | | | | |
Unrealized Depreciation on Interest Rate Swap Contracts | | $ | — | | | $ | (28,025 | ) |
Unrealized Depreciation on Forward Foreign Currency Exchange Contracts | | | (2,204,911 | ) | | | — | |
| | $ | (2,204,911 | ) | | $ | (28,025 | ) |
|
| The Effect of Financial Derivative Instruments on the Statements of Operations for the Year Ended October 31, 2012: | |
| |
| | | Derivatives Not Accounted for as Hedging Instruments | |
| | | Foreign Exchange | | | Fixed Income/ Interest Rate | |
Realized Gain/(Loss) on Derivatives Recognized resulting from Operations: | | | | | | | | |
Net Realized Gain on Forward Foreign Currency Exchange Contracts | | $ | 5,457,532 | | | $ | — | |
Net Realized Gain on Options | | | | | | | 1,892 | |
Net Realized Loss on Futures Contracts | | | | | | | (806,114 | ) |
Net Realized Gain on Interest Rate Swap Contracts | | | — | | | | 702,021 | |
| | $ | 5,457,532 | | | $ | (102,201 | ) |
| | |
Net Change in Unrealized Appreciation on Derivatives Recognized resulting from Operations: | | | | | | | | |
Net Change in Unrealized Appreciation on Forward Foreign Currency Exchange Contracts | | $ | 1,208,109 | | | $ | — | |
Net Change in Unrealized Appreciation on Interest Rate Swap Contracts | | | — | | | | 695,451 | |
| | $ | 1,208,109 | | | $ | 695,451 | |
* See note 9 in the Notes to the Financial Statements for additional information.
See accompanying notes to the financial statements.
72
ASHMORE EMERGING MARKETS EQUITY FUND
SCHEDULE OF INVESTMENTS
As of October 31, 2012
| | | | | | | | | | | | | | |
| | | Currency(1) | | Shares | | | Value | | | % of Net
Assets | |
Common Stock | | | | | | | | | | | | | | |
| | | | |
Brazil (Cost $1,332,564) | | | | | | | | | | | | | | |
Banco do Brasil S.A. | | BRL | | | 13,300 | | | $ | 141,902 | | | | 1.62 | |
BM&FBovespa S.A. | | BRL | | | 7,200 | | | | 46,085 | | | | 0.53 | |
Braskem S.A. ADR | | | | | 4,543 | | | | 59,422 | | | | 0.68 | |
BRF - Brasil Foods S.A. | | BRL | | | 1,000 | | | | 18,193 | | | | 0.21 | |
Cosan Ltd., Class A | | | | | 5,300 | | | | 86,973 | | | | 0.99 | |
Duratex S.A. | | BRL | | | 5,800 | | | | 40,351 | | | | 0.46 | |
EcoRodovias Infraestrutura e Logistica S.A. | | BRL | | | 3,600 | | | | 31,444 | | | | 0.36 | |
Embraer S.A. ADR | | | | | 3,595 | | | | 100,336 | | | | 1.15 | |
Estacio Participacoes S.A. | | BRL | | | 2,900 | | | | 55,257 | | | | 0.63 | |
Even Construtora e Incorporadora S.A. | | BRL | | | 9,100 | | | | 36,292 | | | | 0.42 | |
Iochpe-Maxion S.A. | | BRL | | | 2,000 | | | | 24,519 | | | | 0.28 | |
Lojas Renner S.A. | | BRL | | | 1,700 | | | | 62,943 | | | | 0.72 | |
MRV Engenharia e Participacoes S.A. | | BRL | | | 9,000 | | | | 45,641 | | | | 0.52 | |
Petroleo Brasileiro S.A. ADR | | | | | 8,644 | | | | 183,339 | | | | 2.10 | |
Usinas Siderurgicas de Minas Gerais S.A. | | BRL | | | 200 | | | | 1,046 | | | | 0.01 | |
Vale S.A. | | BRL | | | 4,600 | | | | 84,818 | | | | 0.97 | |
Vale S.A. ADR | | | | | 9,900 | | | | 181,368 | | | | 2.07 | |
| | | | | | | | | 1,199,929 | | | | 13.72 | |
Chile (Cost $33,265) | | | | | | | | | | | | | | |
Cia Cervecerias Unidas S.A. ADR | | | | | 144 | | | | 10,214 | | | | 0.12 | |
Cia Sud Americana de Vapores S.A. | | CLP | | | 95,000 | | | | 9,082 | | | | 0.10 | |
Forus S.A. | | CLP | | | 3,085 | | | | 16,799 | | | | 0.19 | |
| | | | | | | | | 36,095 | | | | 0.41 | |
China (Cost $1,915,303) | | | | | | | | | | | | | | |
AAC Technologies Holdings, Inc. | | HKD | | | 24,000 | | | | 85,780 | | | | 0.98 | |
Anhui Conch Cement Co. Ltd., Class H | | HKD | | | 31,500 | | | | 108,928 | | | | 1.25 | |
Baidu, Inc. ADR | | | | | 800 | | | | 85,296 | | | | 0.98 | |
Belle International Holdings Ltd. | | HKD | | | 29,000 | | | | 54,033 | | | | 0.62 | |
Brilliance China Automotive Holdings Ltd. | | HKD | | | 64,000 | | | | 79,937 | | | | 0.91 | |
China Merchants Bank Co. Ltd., Class H | | HKD | | | 117,000 | | | | 218,600 | | | | 2.50 | |
China Modern Dairy Holdings Ltd. | | HKD | | | 195,000 | | | | 50,574 | | | | 0.58 | |
China Pacific Insurance Group Co. Ltd., Class H | | HKD | | | 18,800 | | | | 58,947 | | | | 0.67 | |
China Shenhua Energy Co. Ltd., Class H | | HKD | | | 27,500 | | | | 117,096 | | | | 1.34 | |
Chow Tai Fook Jewellery Group Ltd. | | HKD | | | 68,600 | | | | 84,621 | | | | 0.97 | |
CNOOC Ltd. | | HKD | | | 120,000 | | | | 249,289 | | | | 2.85 | |
Ctrip.com International Ltd. ADR | | | | | 4,000 | | | | 80,040 | | | | 0.91 | |
Dongfeng Motor Group Co. Ltd., Class H | | HKD | | | 52,000 | | | | 64,412 | | | | 0.74 | |
Industrial & Commercial Bank of China, Class H | | HKD | | | 354,000 | | | | 234,324 | | | | 2.68 | |
Intime Department Store Group Co. Ltd. | | HKD | | | 57,000 | | | | 67,517 | | | | 0.77 | |
New Oriental Education & Technology Group ADR | | | | | 2,900 | | | | 48,894 | | | | 0.56 | |
Ping An Insurance Group Co., Class H | | HKD | | | 14,000 | | | | 110,915 | | | | 1.27 | |
Shimao Property Holdings Ltd. | | HKD | | | 45,500 | | | | 86,890 | | | | 0.99 | |
SINA Corp. | | | | | 180 | | | | 9,833 | | | | 0.11 | |
Weichai Power Co. Ltd., Class H | | HKD | | | 9,600 | | | | 34,002 | | | | 0.39 | |
| | | | | | | | | 1,929,928 | | | | 22.07 | |
Colombia (Cost $29,127) | | | | | | | | | | | | | | |
Pacific Rubiales Energy Corp. | | CAD | | | 971 | | | | 22,837 | | | | 0.26 | |
| | | | | | | | | 22,837 | | | | 0.26 | |
Hungary (Cost $34,902) | | | | | | | | | | | | | | |
OTP Bank PLC | | HUF | | | 1,897 | | | | 35,978 | | | | 0.41 | |
| | | | | | | | | 35,978 | | | | 0.41 | |
See accompanying notes to the financial statements.
73
ASHMORE EMERGING MARKETS EQUITY FUND
SCHEDULE OF INVESTMENTS (CONTINUED)
As of October 31, 2012
| | | | | | | | | | | | | | |
| | | Currency(1) | | Shares | | | Value | | | % of Net
Assets | |
India (Cost $352,662) | | | | | | | | | | | | | | |
HDFC Bank Ltd. ADR | | | | | 1,500 | | | $ | 56,085 | | | | 0.64 | |
ICICI Bank Ltd. ADR | | | | | 2,300 | | | | 90,275 | | | | 1.03 | |
Infosys Ltd. ADR | | | | | 1,700 | | | | 73,814 | | | | 0.85 | |
Larsen & Toubro Ltd. GDR (Registered) | | | | | 2,669 | | | | 81,645 | | | | 0.93 | |
Sterlite Industries India Ltd. ADR | | | | | 6,000 | | | | 44,940 | | | | 0.52 | |
| | | | | | | | | 346,759 | | | | 3.97 | |
Indonesia (Cost $272,661) | | | | | | | | | | | | | | |
Bank Mandiri Persero Tbk PT | | IDR | | | 44,500 | | | | 38,218 | | | | 0.44 | |
Indofood Sukses Makmur Tbk PT | | IDR | | | 51,500 | | | | 30,558 | | | | 0.35 | |
Indomobil Sukses Internasional Tbk PT | | IDR | | | 134,000 | | | | 71,142 | | | | 0.81 | |
Perusahaan Gas Negara Persero Tbk PT | | IDR | | | 128,000 | | | | 61,960 | | | | 0.71 | |
Tambang Batubara Bukit Asam Persero Tbk PT | | IDR | | | 10,000 | | | | 16,656 | | | | 0.19 | |
United Tractors Tbk PT | | IDR | | | 18,500 | | | | 40,635 | | | | 0.46 | |
| | | | | | | | | 259,169 | | | | 2.96 | |
Malaysia (Cost $212,772) | | | | | | | | | | | | | | |
DRB-Hicom Bhd | | MYR | | | 105,100 | | | | 85,564 | | | | 0.98 | |
Parkson Retail Group Ltd. | | HKD | | | 90,000 | | | | 76,180 | | | | 0.87 | |
Sime Darby Bhd | | MYR | | | 10,900 | | | | 34,995 | | | | 0.40 | |
| | | | | | | | | 196,739 | | | | 2.25 | |
Mexico (Cost $378,050) | | | | | | | | | | | | | | |
Alfa S.A.B. de C.V., Class A | | MXN | | | 23,770 | | | | 43,837 | | | | 0.50 | |
Alpek S.A. de C.V. | | MXN | | | 17,626 | | | | 46,007 | | | | 0.53 | |
Cemex S.A.B. de C.V. ADR | | | | | 9,300 | | | | 84,072 | | | | 0.96 | |
Desarrolladora Homex S.A.B. de C.V. ADR | | | | | 3,940 | | | | 52,205 | | | | 0.60 | |
Fomento Economico Mexicano S.A.B. de C.V. ADR | | | | | 250 | | | | 22,652 | | | | 0.26 | |
Grupo Financiero Banorte S.A.B. de C.V., Class O | | MXN | | | 8,900 | | | | 49,444 | | | | 0.57 | |
Mexichem S.A.B. de C.V. | | MXN | | | 8,871 | | | | 43,959 | | | | 0.50 | |
Promotora y Operadora de Infraestructura S.A.B. de C.V. | | MXN | | | 1,740 | | | | 9,033 | | | | 0.10 | |
Ternium S.A. ADR | | | | | 3,547 | | | | 72,820 | | | | 0.83 | |
| | | | | | | | | 424,029 | | | | 4.85 | |
Peru (Cost $11,334) | | | | | | | | | | | | | | |
Cia de Minas Buenaventura S.A. ADR | | | | | 268 | | | | 9,584 | | | | 0.11 | |
| | | | | | | | | 9,584 | | | | 0.11 | |
Philippines (Cost $25,899) | | | | | | | | | | | | | | |
Petron Corp. | | PHP | | | 101,100 | | | | 26,642 | | | | 0.31 | |
| | | | | | | | | 26,642 | | | | 0.31 | |
Russian Federation (Cost $733,229) | | | | | | | | | | | | | | |
Gazprom OAO ADR | | | | | 8,757 | | | | 79,995 | | | | 0.91 | |
Lukoil OAO ADR | | | | | 2,504 | | | | 151,367 | | | | 1.73 | |
NovaTek OAO GDR (Registered) | | | | | 275 | | | | 31,350 | | | | 0.36 | |
Sberbank of Russia ADR | | | | | 14,850 | | | | 174,636 | | | | 2.00 | |
Sistema JSFC GDR | | | | | 3,365 | | | | 61,748 | | | | 0.71 | |
Uralkali OJSC GDR (Registered) | | | | | 3,300 | | | | 129,294 | | | | 1.48 | |
VimpelCom Ltd. ADR | | | | | 3,002 | | | | 33,082 | | | | 0.38 | |
X5 Retail Group N.V. GDR (Registered) | | | | | 2,902 | | | | 55,045 | | | | 0.63 | |
| | | | | | | | | 716,517 | | | | 8.20 | |
South Africa (Cost $221,619) | | | | | | | | | | | | | | |
Exxaro Resources Ltd. | | ZAR | | | 1,943 | | | | 38,874 | | | | 0.44 | |
Imperial Holdings Ltd. | | ZAR | | | 2,136 | | | | 48,519 | | | | 0.55 | |
Investec Ltd. | | ZAR | | | 6,235 | | | | 36,668 | | | | 0.42 | |
Sasol Ltd. | | ZAR | | | 1,527 | | | | 65,152 | | | | 0.75 | |
Steinhoff International Holdings Ltd. | | ZAR | | | 12,116 | | | | 40,713 | | | | 0.47 | |
Telkom S.A. Ltd. | | ZAR | | | 2,592 | | | | 5,455 | | | | 0.06 | |
| | | | | | | | | 235,381 | | | | 2.69 | |
See accompanying notes to the financial statements.
74
ASHMORE EMERGING MARKETS EQUITY FUND
SCHEDULE OF INVESTMENTS (CONTINUED)
As of October 31, 2012
| | | | | | | | | | | | | | |
| | | Currency(1) | | Shares | | | Value | | | % of Net
Assets | |
South Korea (Cost $1,052,545) | | | | | | | | | | | | | | |
Doosan Infracore Co. Ltd. | | KRW | | | 2,720 | | | $ | 40,154 | | | | 0.46 | |
E-Mart Co. Ltd. | | KRW | | | 307 | | | | 66,574 | | | | 0.76 | |
Hana Financial Group, Inc. | | KRW | | | 2,780 | | | | 80,932 | | | | 0.93 | |
Hyundai Heavy Industries Co. Ltd. | | KRW | | | 230 | | | | 48,294 | | | | 0.55 | |
Hyundai Mobis | | KRW | | | 333 | | | | 84,884 | | | | 0.97 | |
Hyundai Motor Co. | | KRW | | | 1,196 | | | | 246,197 | | | | 2.82 | |
Kia Motors Corp. | | KRW | | | 1,165 | | | | 64,734 | | | | 0.74 | |
LG Chem Ltd. | | KRW | | | 284 | | | | 79,685 | | | | 0.91 | |
NHN Corp. | | KRW | | | 341 | | | | 78,950 | | | | 0.90 | |
Samsung Engineering Co. Ltd. | | KRW | | | 396 | | | | 51,742 | | | | 0.59 | |
Samsung Heavy Industries Co. Ltd. | | KRW | | | 2,940 | | | | 89,904 | | | | 1.03 | |
SK Hynix, Inc. | | KRW | | | 2,420 | | | | 55,141 | | | | 0.63 | |
| | | | | | | | | 987,191 | | | | 11.29 | |
Taiwan (Cost $892,933) | | | | | | | | | | | | | | |
Catcher Technology Co. Ltd. | | TWD | | | 29,000 | | | | 126,076 | | | | 1.44 | |
Chinatrust Financial Holding Co. Ltd. | | TWD | | | 117,827 | | | | 64,938 | | | | 0.74 | |
Delta Electronics, Inc. | | TWD | | | 20,616 | | | | 70,431 | | | | 0.81 | |
FLEXium Interconnect, Inc. | | TWD | | | 6,284 | | | | 25,599 | | | | 0.29 | |
Formosa Plastics Corp. | | TWD | | | 17,000 | | | | 46,323 | | | | 0.53 | |
Hon Hai Precision Industry Co. Ltd. | | TWD | | | 53,327 | | | | 161,921 | | | | 1.85 | |
Kinsus Interconnect Technology Corp. | | TWD | | | 9,000 | | | | 24,739 | | | | 0.28 | |
MediaTek, Inc. | | TWD | | | 13,000 | | | | 144,407 | | | | 1.65 | |
Simplo Technology Co. Ltd. | | TWD | | | 2,000 | | | | 9,859 | | | | 0.11 | |
Taiwan Fertilizer Co. Ltd. | | TWD | | | 12,000 | | | | 28,590 | | | | 0.33 | |
Taiwan Semiconductors Manufacturing Co. Ltd. | | TWD | | | 67,251 | | | | 204,199 | | | | 2.34 | |
TPK Holding Co. Ltd. | | TWD | | | 2,363 | | | | 29,687 | | | | 0.34 | |
Wan Hai Lines Ltd. | | TWD | | | 34,000 | | | | 16,644 | | | | 0.19 | |
| | | | | | | | | 953,413 | | | | 10.90 | |
Thailand (Cost $148,253) | | | | | | | | | | | | | | |
Banpu PCL (Registered) | | THB | | | 3,900 | | | | 50,894 | | | | 0.58 | |
PTT Exploration & Production PCL (Registered) | | THB | | | 8,100 | | | | 43,867 | | | | 0.50 | |
Siam Cement PCL (Registered) | | THB | | | 3,200 | | | | 43,429 | | | | 0.50 | |
| | | | | | | | | 138,190 | | | | 1.58 | |
Turkey (Cost $176,942) | | | | | | | | | | | | | | |
Koza Anadolu Metal Madencilik Isletmeleri A/S | | TRY | | | 11,095 | | | | 28,160 | | | | 0.32 | |
Turk Hava Yollari | | TRY | | | 24,269 | | | | 56,182 | | | | 0.64 | |
Turkiye Halk Bankasi A/S | | TRY | | | 9,284 | | | | 81,825 | | | | 0.94 | |
Yapi ve Kredi Bankasi A/S | | TRY | | | 20,711 | | | | 53,144 | | | | 0.61 | |
| | | | | | | | | 219,311 | | | | 2.51 | |
Total Common Stock (Cost $7,824,060) | | | | | | | | | 7,737,692 | | | | 88.49 | |
| | | | |
Preferred Stock | | | | | | | | | | | | | | |
| | | | |
Brazil (Cost $232,074) | | | | | | | | | | | | | | |
Itau Unibanco Holding S.A. ADR | | | | | 7,342 | | | | 107,047 | | | | 1.23 | |
Usinas Siderurgicas de Minas Gerais S.A., Class A | | BRL | | | 18,100 | | | | 87,423 | | | | 1.00 | |
| | | | | | | | | 194,470 | | | | 2.23 | |
South Korea (Cost $273,244) | | | | | | | | | | | | | | |
Samsung Electronics Co. Ltd. GDR | | | | | 1,025 | | | | 376,072 | | | | 4.30 | |
| | | | | | | | | 376,072 | | | | 4.30 | |
Total Preferred Stock (Cost $505,318) | | | | | | | | | 570,542 | | | | 6.53 | |
See accompanying notes to the financial statements.
75
ASHMORE EMERGING MARKETS EQUITY FUND
SCHEDULE OF INVESTMENTS (CONTINUED)
As of October 31, 2012
| | | | | | | | | | | | | | |
| | | Currency(1) | | Shares | | | Value | | | % of Net
Assets | |
Equity-Linked Securities | | | | | | | | | | | | | | |
| | | | |
India (Cost $322,855) | | | | | | | | | | | | | | |
Axis Bank Ltd., Issued by Merrill Lynch International | | | | | 3,928 | | | $ | 86,333 | | | | 0.99 | |
Bajaj Auto Ltd., Issued by JP Morgan Structured Pro | | | | | 2,080 | | | | 70,219 | | | | 0.80 | |
Jaiprakash Associates Ltd., Issued by Merrill Lynch International | | | | | 47,546 | | | | 77,187 | | | | 0.88 | |
Maruti Suzuki India Ltd., Issued by Merrill Lynch International | | | | | 2,624 | | | | 70,123 | | | | 0.80 | |
Strides Arcolab Ltd., Issued by CLSA Financial Products | | | | | 4,728 | | | | 78,570 | | | | 0.90 | |
| | | | | | | | | 382,432 | | | | 4.37 | |
Total Equity-Linked Securities (Cost $322,855) | | | | | | | | | 382,432 | | | | 4.37 | |
| | | | |
Total Investments (Total Cost $8,652,233) | | | | | | | | | 8,690,666 | | | | 99.39 | |
| | | |
Other Assets Less Liabilities (See Statements of Assets and Liabilities for
further detail) | | | | | | | 53,151 | | | | 0.61 | |
| | | | |
Net Assets | | | | | | | | $ | 8,743,817 | | | | 100.00 | |
| (1) | Par values are stated in United States Dollars unless otherwise noted below. |
Percentages shown are based on net assets.
At October 31, 2012, the industry sectors for the Ashmore Emerging Markets Equity Fund were:
| | | | |
| Industry | | Percentage of Net Assets | |
| |
Consumer Discretionary | | | 18.4% | |
Consumer Staples | | | 2.9 | |
Energy | | | 13.3 | |
Financials | | | 21.2 | |
Health Care | | | 0.9 | |
Industrials | | | 9.0 | |
Information Technology | | | 17.9 | |
Materials | | | 14.0 | |
Telecommunication Services | | | 1.1 | |
Utilities | | | 0.7 | |
| |
Total Investments | | | 99.4 | |
Other Assets Less Liabilities | | | 0.6 | |
Net Assets | | | 100.0% | |
| |
| |
See accompanying notes to the financial statements.
76
ASHMORE EMERGING MARKETS EQUITY FUND
SCHEDULE OF INVESTMENTS (CONTINUED)
As of October 31, 2012
At October 31, 2012, for U.S. federal income tax purposes, gross unrealized appreciation, gross unrealized depreciation, net unrealized appreciation/(depreciation) on investments in securities (including the effects of foreign currency translation) and the cost basis of investments were as follows:
| | | | |
Federal tax cost of investments | | | $8,762,196 | |
Gross tax appreciation of investments | | | $703,006 | |
Gross tax depreciation of investments | | | (774,536) | |
Net tax depreciation of investments | | | $(71,530) | |
The difference between book basis and tax basis net unrealized appreciation or depreciation is attributable primarily to the tax deferral of losses on wash sales.
The inputs or methodologies used for valuing securities are not necessarily an indication of the risks associated with investing in those securities and other financial instruments, if any. See note 4 in the Notes to the Financial Statements for more information regarding pricing inputs and valuation techniques. The following is a summary of the inputs used in valuing the Ashmore Emerging Markets Equity Fund’s investments and other financial instruments, as of October 31, 2012.
| | | | | | | | | | | | | | | | |
| | | Level 1 | | | Level 2 | | | Level 3 | | | Total | |
Investments | | | | | | | | | | | | | | | | |
Assets: | | | | | | | | | | | | | | | | |
Common Stocks | | | | | | | | | | | | | | | | |
Brazil | | $ | 1,199,929 | | | $ | — | | | | $— | | | $ | 1,199,929 | |
Chile | | | 36,095 | | | | — | | | | — | | | | 36,095 | |
China | | | 1,929,928 | | | | — | | | | — | | | | 1,929,928 | |
Colombia | | | 22,837 | | | | — | | | | — | | | | 22,837 | |
Hungary | | | 35,978 | | | | — | | | | — | | | | 35,978 | |
India | | | 346,759 | | | | — | | | | — | | | | 346,759 | |
Indonesia | | | 259,169 | | | | — | | | | — | | | | 259,169 | |
Malaysia | | | 196,739 | | | | — | | | | — | | | | 196,739 | |
Mexico | | | 424,029 | | | | — | | | | — | | | | 424,029 | |
Peru | | | 9,584 | | | | — | | | | — | | | | 9,584 | |
Philippines | | | 26,642 | | | | — | | | | — | | | | 26,642 | |
Russian Federation | | | 716,517 | | | | — | | | | — | | | | 716,517 | |
South Africa | | | 235,381 | | | | — | | | | — | | | | 235,381 | |
South Korea | | | 987,191 | | | | — | | | | — | | | | 987,191 | |
Taiwan | | | 953,413 | | | | — | | | | — | | | | 953,413 | |
Thailand | | | 138,190 | | | | — | | | | — | | | | 138,190 | |
Turkey | | | 219,311 | | | | — | | | | — | | | | 219,311 | |
Preferred Stocks | | | | | | | | | | | | | | | | |
Brazil | | | 194,470 | | | | — | | | | — | | | | 194,470 | |
South Korea | | | 376,072 | | | | — | | | | — | | | | 376,072 | |
Equity - Linked Securities | | | | | | | | | | | | | | | | |
India | | | — | | | | 382,432 | | | | — | | | | 382,432 | |
| |
Total Investments | | $ | 8,308,234 | | | $ | 382,432 | | | | $— | | | $ | 8,690,666 | |
| |
The Fund discloses all transfers between levels based on valuations at the end of each reporting period. At October 31, 2011, for certain foreign equity securities, the Ashmore Emerging Markets Equity Fund’s fair value trigger was met as a result of the monitoring of events impacting the value of securities after the closing of the exchange on which the securities principally trade, but before the calculation of the daily net asset value, resulting in certain securities being classified as Level 2. Since the fair value trigger was not met at October 31, 2012, these securities were transferred to Level 1. The fair value of the securities transferred from Level 2 to Level 1, using the October 31, 2012 fair value, was $3,356,069 for common stocks. In addition, there were transfers from Level 2 to Level 1 of $376,073 for common stocks due to valuations at a readily available market closing price.
See accompanying notes to the financial statements.
77
ASHMORE EMERGING MARKETS EQUITY FUND
SCHEDULE OF INVESTMENTS (CONTINUED)
As of October 31, 2012
U.S. GAAP provides additional guidance for estimating fair value when the volume and level of activity for the asset or liability have significantly decreased as well as guidance on identifying circumstances that indicate when a transaction is not orderly.
The following is a summary of the fair values of the Fund’s derivative instruments*:
The Effect of Financial Derivative Instruments on the Statements of Operations for the Year Ended October 31, 2012:
| | |
| | | Derivatives Not Accounted for as |
| | | Hedging Instruments |
| | | Foreign Exchange |
Realized Loss on Derivatives Recognized resulting from Operations: | | |
Net Realized Loss on Forward Foreign Currency Exchange Contracts | | $ (2,455) |
* See note 9 in the Notes to the Financial Statements for additional information.
See accompanying notes to the financial statements.
78
ASHMORE EMERGING MARKETS SMALL-CAP EQUITY FUND
SCHEDULE OF INVESTMENTS
As of October 31, 2012
| | | | | | | | | | | | | | |
| | | Currency(1) | | Shares | | | Value | | | % of Net
Assets | |
Common Stock | | | | | | | | | | | | | | |
| | | | |
Brazil (Cost $1,672,081) | | | | | | | | | | | | | | |
Brazil Pharma S.A. | | BRL | | | 20,000 | | | $ | 121,612 | | | | 0.89 | |
Cia de Locacao das Americas | | BRL | | | 34,491 | | | | 183,404 | | | | 1.35 | |
Estacio Participacoes S.A. | | BRL | | | 11,400 | | | | 217,218 | | | | 1.60 | |
Even Construtora e Incorporadora S.A. | | BRL | | | 82,800 | | | | 330,213 | | | | 2.43 | |
Iochpe-Maxion S.A. | | BRL | | | 23,400 | | | | 286,876 | | | | 2.11 | |
Magazine Luiza S.A. | | BRL | | | 16,800 | | | | 93,552 | | | | 0.69 | |
Mahle-Metal Leve S.A. Industria e Comercio | | BRL | | | 13,800 | | | | 173,872 | | | | 1.28 | |
Marisa Lojas S.A. | | BRL | | | 15,000 | | | | 220,157 | | | | 1.62 | |
Sao Martinho S.A. | | BRL | | | 3,200 | | | | 39,987 | | | | 0.29 | |
Sonae Sierra Brasil S.A. | | BRL | | | 3,900 | | | | 65,286 | | | | 0.48 | |
Tegma Gestao Logistica | | BRL | | | 15,600 | | | | 268,827 | | | | 1.98 | |
| | | | | | | | | 2,001,004 | | | | 14.72 | |
China (Cost $2,683,955) | | | | | | | | | | | | | | |
3SBio, Inc. ADR | | | | | 17,800 | | | | 238,698 | | | | 1.75 | |
China Automation Group Ltd. | | HKD | | | 866,000 | | | | 205,604 | | | | 1.51 | |
Chinasoft International Ltd. | | HKD | | | 770,000 | | | | 188,773 | | | | 1.39 | |
Focus Media Holding Ltd. ADR | | | | | 6,141 | | | | 144,805 | | | | 1.06 | |
Greatview Aseptic Packaging Co. Ltd. | | HKD | | | 669,000 | | | | 350,467 | | | | 2.58 | |
Hengdeli Holdings Ltd. | | HKD | | | 724,000 | | | | 227,942 | | | | 1.68 | |
Hollysys Automation Technologies Ltd. | | | | | 28,647 | | | | 297,356 | | | | 2.19 | |
Intime Department Store Group Co. Ltd. | | HKD | | | 199,500 | | | | 236,309 | | | | 1.74 | |
Ju Teng International Holdings Ltd. | | HKD | | | 284,000 | | | | 113,599 | | | | 0.83 | |
MIE Holdings Corp. | | HKD | | | 500,000 | | | | 137,418 | | | | 1.01 | |
REXLot Holdings Ltd. | | HKD | | | 825,000 | | | | 59,612 | | | | 0.44 | |
SouFun Holdings Ltd. ADR | | | | | 15,300 | | | | 276,471 | | | | 2.03 | |
Spreadtrum Communications, Inc. ADR | | | | | 6,600 | | | | 152,130 | | | | 1.12 | |
Trinity Ltd. | | HKD | | | 312,000 | | | | 218,600 | | | | 1.61 | |
Yingde Gases | | HKD | | | 150,000 | | | | 142,257 | | | | 1.05 | |
| | | | | | | | | 2,990,041 | | | | 21.99 | |
Colombia (Cost $38,606) | | | | | | | | | | | | | | |
Pacific Rubiales Energy Corp. | | CAD | | | 1,287 | | | | 30,269 | | | | 0.22 | |
| | | | | | | | | 30,269 | | | | 0.22 | |
Indonesia (Cost $744,726) | | | | | | | | | | | | | | |
Berlian Laju Tanker Tbk PT(2) | | IDR | | | 4,428,000 | | | | 67,760 | | | | 0.50 | |
Bumi Serpong Damai PT | | IDR | | | 1,742,930 | | | | 224,984 | | | | 1.66 | |
Ciputra Surya Tbk PT | | IDR | | | 292,000 | | | | 53,195 | | | | 0.39 | |
Gajah Tunggal Tbk PT | | IDR | | | 492,500 | | | | 111,510 | | | | 0.82 | |
Perusahaan Perkebunan London Sumatra Indonesia Tbk PT | | IDR | | | 532,500 | | | | 128,882 | | | | 0.95 | |
Timah Persero Tbk PT | | IDR | | | 605,000 | | | | 90,062 | | | | 0.66 | |
| | | | | | | | | 676,393 | | | | 4.98 | |
Malaysia (Cost $433,976) | | | | | | | | | | | | | | |
DRB-Hicom Bhd. | | MYR | | | 272,200 | | | | 221,603 | | | | 1.63 | |
Wah Seong Corp. Bhd. | | MYR | | | 298,800 | | | | 171,655 | | | | 1.26 | |
| | | | | | | | | 393,258 | | | | 2.89 | |
Mexico (Cost $751,030) | | | | | | | | | | | | | | |
Corp. GEO S.A.B. de C.V., Series B | | MXN | | | 81,100 | | | | 97,481 | | | | 0.72 | |
Desarrolladora Homex S.A.B. de C.V. ADR | | | | | 9,993 | | | | 132,407 | | | | 0.97 | |
Grupo Aeromexico S.A.B. de C.V. | | MXN | | | 76,400 | | | | 122,112 | | | | 0.90 | |
Grupo KUO S.A.B. de C.V., Series B | | MXN | | | 125,194 | | | | 264,059 | | | | 1.94 | |
Industrias CH S.A.B. de C.V., Series B | | MXN | | | 34,300 | | | | 198,152 | | | | 1.46 | |
See accompanying notes to the financial statements.
79
ASHMORE EMERGING MARKETS SMALL-CAP EQUITY FUND
SCHEDULE OF INVESTMENTS (CONTINUED)
As of October 31, 2012
| | | | | | | | | | | | | | |
| | | Currency(1) | | Shares | | | Value | | | % of Net
Assets | |
Mexico - (continued) | | | | | | | | | | | | | | |
TV Azteca S.A.B. de C.V., Series CPO | | MXN | | | 164,000 | | | $ | 103,071 | | | | 0.76 | |
| | | | | | | | | 917,282 | | | | 6.75 | |
Nigeria (Cost $64,384) | | | | | | | | | | | | | | |
Zenith Bank PLC | | NGN | | | 643,652 | | | | 73,848 | | | | 0.54 | |
| | | | | | | | | 73,848 | | | | 0.54 | |
Philippines (Cost $208,804) | | | | | | | | | | | | | | |
Megaworld Corp. | | PHP | | | 1,620,000 | | | | 96,310 | | | | 0.71 | |
Oriental Peninsula Resources Group, Inc. | | PHP | | | 2,065,000 | | | | 201,938 | | | | 1.48 | |
| | | | | | | | | 298,248 | | | | 2.19 | |
South Africa (Cost $193,847) | | | | | | | | | | | | | | |
JD Group Ltd. | | ZAR | | | 20,753 | | | | 110,802 | | | | 0.81 | |
Wilson Bayly Holmes-Ovcon Ltd. | | ZAR | | | 7,700 | | | | 126,175 | | | | 0.93 | |
| | | | | | | | | 236,977 | | | | 1.74 | |
South Korea (Cost $1,536,278) | | | | | | | | | | | | | | |
Basic House (The) Co. Ltd. | | KRW | | | 10,150 | | | | 109,355 | | | | 0.80 | |
Hana Tour Service, Inc. | | KRW | | | 5,680 | | | | 319,780 | | | | 2.35 | |
Hyundai Department Store Co. Ltd. | | KRW | | | 1,511 | | | | 187,732 | | | | 1.38 | |
Hyundai Home Shopping Network Corp. | | KRW | | | 1,189 | | | | 141,184 | | | | 1.04 | |
Korean Reinsurance Co. | | KRW | | | 17,040 | | | | 167,182 | | | | 1.23 | |
LG Fashion Corp. | | KRW | | | 9,950 | | | | 277,351 | | | | 2.04 | |
Modetour Network, Inc. | | KRW | | | 10,058 | | | | 283,591 | | | | 2.09 | |
Nexen Tire Corp. | | KRW | | | 8,900 | | | | 139,139 | | | | 1.02 | |
| | | | | | | | | 1,625,314 | | | | 11.95 | |
Taiwan (Cost $2,011,092) | | | | | | | | | | | | | | |
Catcher Technology Co. Ltd. | | TWD | | | 64,000 | | | | 278,237 | | | | 2.05 | |
China Life Insurance Co. Ltd. | | TWD | | | 239,088 | | | | 186,605 | | | | 1.37 | |
FLEXium Interconnect, Inc. | | TWD | | | 61,743 | | | | 251,516 | | | | 1.85 | |
Hung Poo Real Estate Development Corp. | | TWD | | | 138,000 | | | | 127,076 | | | | 0.93 | |
Kinsus Interconnect Technology Corp. | | TWD | | | 31,000 | | | | 85,214 | | | | 0.63 | |
Novatek Microelectronics Corp. | | TWD | | | 8,000 | | | | 30,124 | | | | 0.22 | |
Shin Zu Shing Co. Ltd. | | TWD | | | 53,000 | | | | 183,244 | | | | 1.35 | |
Simplo Technology Co. Ltd. | | TWD | | | 58,000 | | | | 285,905 | | | | 2.10 | |
Tainan Spinning Co. Ltd. | | TWD | | | 455,000 | | | | 200,924 | | | | 1.48 | |
TXC Corp. | | TWD | | | 97,000 | | | | 168,681 | | | | 1.24 | |
| | | | | | | | | 1,797,526 | | | | 13.22 | |
Thailand (Cost $144,937) | | | | | | | | | | | | | | |
Jasmine International PCL (Registered) | | THB | | | 534,800 | | | | 84,446 | | | | 0.62 | |
Supalai PCL (Registered) | | THB | | | 192,000 | | | | 115,881 | | | | 0.85 | |
| | | | | | | | | 200,327 | | | | 1.47 | |
Turkey (Cost $219,578) | | | | | | | | | | | | | | |
Turkiye Sinai Kalkinma Bankasi AS | | TRY | | | 189,076 | | | | 217,269 | | | | 1.60 | |
| | | | | | | | | 217,269 | | | | 1.60 | |
Total Common Stock (Cost $10,703,294) | | | | | | | | | 11,457,756 | | | | 84.26 | |
| | | | |
Preferred Stock | | | | | | | | | | | | | | |
| | | | |
Brazil (Cost $519,760) | | | | | | | | | | | | | | |
Banco ABC Brasil S.A. | | BRL | | | 63,693 | | | | 361,890 | | | | 2.66 | |
Randon Participacoes S.A. | | BRL | | | 13,700 | | | | 72,444 | | | | 0.53 | |
Saraiva S.A. Livreiros Editores | | BRL | | | 4,200 | | | | 52,173 | | | | 0.39 | |
| | | | | | | | | 486,507 | | | | 3.58 | |
Total Preferred Stock (Cost $519,760) | | | | | | | | | 486,507 | | | | 3.58 | |
See accompanying notes to the financial statements.
80
ASHMORE EMERGING MARKETS SMALL-CAP EQUITY FUND
SCHEDULE OF INVESTMENTS (CONTINUED)
As of October 31, 2012
| | | | | | | | | | | | | | |
| | | Currency(1) | | Shares | | | Value | | | % of Net
Assets | |
Equity-Linked Securities | | | | | | | | | | | | | | |
| | | | |
India (Cost $1,193,312) | | | | | | | | | | | | | | |
Dewan Housing Finance Corp. Ltd., Issued by Citigroup Global Markets | | | | | 36,497 | | | $ | 129,861 | | | | 0.95 | |
Hexaware Technologies Ltd., Issued by Merrill Lynch International & Co. | | | | | 96,093 | | | | 200,022 | | | | 1.47 | |
HT Media Ltd., Issued by Citigroup Global Markets | | | | | 64,750 | | | | 123,167 | | | | 0.91 | |
India Cements Ltd., Issued by Merrill Lynch International & Co. | | | | | 140,538 | | | | 249,700 | | | | 1.84 | |
Indian Bank, Issued by Merrill Lynch International & Co. | | | | | 57,925 | | | | 180,860 | | | | 1.33 | |
Strides Arcolab Ltd., Issued by Merrill Lynch International & Co. | | | | | 15,620 | | | | 259,573 | | | | 1.91 | |
| | | | | | | | | 1,143,183 | | | | 8.41 | |
Saudi Arabia (Cost $130,829) | | | | | | | | | | | | | | |
Fawaz Abdulaziz Alhokair & Co., Issued by Royal Bank of Scotland PLC | | | | | 5,000 | | | | 130,660 | | | | 0.96 | |
| | | | | | | | | 130,660 | | | | 0.96 | |
South Korea (Cost $206,729) | | | | | | | | | | | | | | |
Gamevil, Inc., Issued by HSBC Bank PLC | | | | | 2,256 | | | | 235,405 | | | | 1.73 | |
MegaStudy Co. Ltd., Issued by HSBC Bank PLC | | | | | 800 | | | | 49,661 | | | | 0.36 | |
| | | | | | | | | 285,066 | | | | 2.09 | |
United Arab Emirates (Cost $61,254) | | | | | | | | | | | | | | |
Sorouh Real Estate Co., Issued by Merrill Lynch International & Co. | | | | | 180,000 | | | | 64,933 | | | | 0.48 | |
| | | | | | | | | 64,933 | | | | 0.48 | |
Total Equity-Linked Securities (Cost $1,592,124) | | | | | | | | | 1,623,842 | | | | 11.94 | |
| | | | |
Total Investments (Total Cost $12,815,178) | | | | | | | | | 13,568,105 | | | | 99.78 | |
| | | | |
Other Assets Less Liabilities (See Statements of Assets and Liabilities for further detail) | | | | | | | | | 29,694 | | | | 0.22 | |
| | | | |
Net Assets | | | | | | | | $ | 13,597,799 | | | | 100.00 | |
| (1) | Par values are stated in United States Dollars unless otherwise noted below. |
| (2) | Security that has been deemed illiquid. At October 31, 2012, the value of this illiquid security amounted to $67,760 or 0.5% of net assets. Additional information on this illiquid security is as follows: |
| | | | |
| SECURITY | | ACQUISITION DATE | | ACQUISITION COST |
Berlian Laju Tanker Tbk PT | | 10/18/2011 | | $92,441 |
Percentages shown are based on net assets.
See accompanying notes to the financial statements.
81
ASHMORE EMERGING MARKETS SMALL-CAP EQUITY FUND
SCHEDULE OF INVESTMENTS (CONTINUED)
As of October 31, 2012
At October 31, 2012, the industry sectors for the Ashmore Emerging Markets Small-Cap Equity Fund were:
| | | | |
| Industry | | Percentage of Net Assets | |
| |
Consumer Discretionary | | | 34.7% | |
Consumer Staples | | | 2.1 | |
Energy | | | 2.5 | |
Financials | | | 15.2 | |
Health Care | | | 3.7 | |
Industrials | | | 13.1 | |
Information Technology | | | 18.8 | |
Materials | | | 9.1 | |
Telecommunication Services | | | 0.6 | |
| |
Total Investments | | | 99.8 | |
Other Assets Less Liabilities | | | 0.2 | |
Net Assets | | | 100.0% | |
| |
| |
At October 31, 2012, for U.S. federal income tax purposes, gross unrealized appreciation, gross unrealized depreciation, net unrealized appreciation/(depreciation) on investments in securities (including the effects of foreign currency translation) and the cost basis of investments were as follows:
| | | | |
Federal tax cost of investments | | | $12,831,393 | |
Gross tax appreciation of investments | | | $1,667,113 | |
Gross tax depreciation of investments | | | (930,401) | |
Net tax appreciation of investments | | | $736,712 | |
The difference between book basis and tax basis net unrealized appreciation or depreciation is attributable primarily to the tax deferral of losses on wash sales.
See accompanying notes to the financial statements.
82
ASHMORE EMERGING MARKETS SMALL-CAP EQUITY FUND
SCHEDULE OF INVESTMENTS (CONTINUED)
As of October 31, 2012
The inputs or methodologies used for valuing securities are not necessarily an indication of the risks associated with investing in those securities and other financial instruments, if any. See note 4 in the Notes to the Financial Statements for more information regarding pricing inputs and valuation techniques. The following is a summary of the inputs used in valuing the Ashmore Emerging Markets Small-Cap Equity Fund’s investments, which are carried at fair value, as of October 31, 2012:
| | | | | | | | | | | | | | | | |
| | | Level 1 | | | Level 2 | | | Level 3 | | | Total | |
Investments | | | | | | | | | | | | | | | | |
Assets: | | | | | | | | | | | | | | | | |
Common Stocks | | | | | | | | | | | | | | | | |
Brazil | | $ | 2,001,004 | | | $ | — | | | $ | — | | | $ | 2,001,004 | |
China | | | 2,990,041 | | | | — | | | | — | | | | 2,990,041 | |
Colombia | | | 30,269 | | | | — | | | | — | | | | 30,269 | |
Indonesia | | | 608,633 | | | | — | | | | 67,760 | | | | 676,393 | |
Malaysia | | | 393,258 | | | | — | | | | — | | | | 393,258 | |
Mexico | | | 917,282 | | | | — | | | | — | | | | 917,282 | |
Nigeria | | | 73,848 | | | | — | | | | — | | | | 73,848 | |
Philippines | | | 298,248 | | | | — | | | | — | | | | 298,248 | |
South Africa | | | 236,977 | | | | — | | | | — | | | | 236,977 | |
South Korea | | | 1,625,314 | | | | — | | | | — | | | | 1,625,314 | |
Taiwan | | | 1,797,526 | | | | — | | | | — | | | | 1,797,526 | |
Thailand | | | 200,327 | | | | — | | | | — | | | | 200,327 | |
Turkey | | | 217,269 | | | | — | | | | — | | | | 217,269 | |
Preferred Stocks | | | | | | | | | | | | | | | | |
Brazil | | | 486,507 | | | | — | | | | — | | | | 486,507 | |
Equity - Linked Securities | | | | | | | | | | | | | | | | |
India | | | — | | | | 1,143,183 | | | | — | | | | 1,143,183 | |
Saudi Arabia | | | — | | | | 130,660 | | | | — | | | | 130,660 | |
South Korea | | | — | | | | 285,066 | | | | — | | | | 285,066 | |
United Arab Emirates | | | — | | | | 64,933 | | | | — | | | | 64,933 | |
| |
Total Investments | | $ | 11,876,503 | | | $ | 1,623,842 | | | $ | 67,760 | | | $ | 13,568,105 | |
| |
The Fund discloses all transfers between levels based on valuations at the end of each reporting period. At October 31, 2011, for certain foreign equity securities, the Ashmore Emerging Markets Small-Cap Equity Fund’s fair value trigger was met as a result of the monitoring of events impacting the value of securities after the closing of the exchange on which the securities principally trade, but before the calculation of the daily net asset value, resulting in certain securities being classified as Level 2. Since the fair value trigger was not met for these securities at October 31, 2012, these securities were transferred to Level 1. The fair value of the securities transferred from Level 2 to Level 1, using the October 31, 2012 fair value, was $2,274,908.
See accompanying notes to the financial statements.
83
ASHMORE EMERGING MARKETS SMALL-CAP EQUITY FUND
SCHEDULE OF INVESTMENTS (CONTINUED)
As of October 31, 2012
The following is a reconcilation of investments in which significant unobservable inputs (Level 3) were used for the Fund during the period ending October 31, 2012:
| | | | | | | | | | | | | | | | | | | | |
Category and Subcategory | | Beginning Balance at 10/31/2011 | | | Purchases | | Sales | | Realized Gains | | Realized Losses | | Change in Unrealized Appreciation/ (Depreciation) | | Transfer into Level 3 | | Transfer out of Level 3 | | Ending Balance at 10/31/2012 |
Investments, at value | | | | | | | | | | | | | | | | | | | | |
Common Stock | | | $— | | | $— | | $— | | $— | | $— | | $— | | $67,760 | | $— | | $67,760 |
Total | | | $— | | | $— | | $— | | $— | | $— | | $— | | $67,760 | | $— | | $67,760 |
See the table on “Quantitative information about Fair Value measurements” for information on the valuation techniques and inputs used to value Level 3 securities at October 31, 2012.
| | | | | | | | |
Quantitative Information about Level 3 Fair Value Measurements Ashmore Emerging Markets Small-Cap Equity Fund |
| | | Fair Value at 10/31/2012 | | Valuation Techniques | | Unobservable Input | | Range (Actual) |
Common Stocks | | $67,760 | | Discount from last
traded price | | Discount
Percentage(a) | | 0% - 100% (25%) |
| (a) | Represents discount to last publicly reported closing price on applicable market. |
The significant unobservable inputs used in the fair value measurement of the Fund’s investments are listed above. Generally, a change in the assumptions used in any input in isolation may be accompanied by a change in another input. Significant changes in any of the unobservable inputs may significantly impact the fair value measurement. The impact is based on the relationship between each unobservable input and the fair value measurement. The increase in discount percentage reduced the value of the security.
The following is a summary of the fair values of the Fund’s derivative instruments*:
The Effect of Financial Derivative Instruments on the Statements of Operations for the Year Ended October 31, 2012:
| | |
| | | Derivatives Not Accounted |
| | | for as Hedging Instruments |
| | | Foreign Exchange |
Realized Gain on Derivatives Recognized resulting from Operations: | | |
Net Realized Gain on Forward Foreign Currency Exchange Contracts | | $646 |
* See note 9 in the Notes to the Financial Statements for additional information.
See accompanying notes to the financial statements.
84
ASHMORE FUNDS
NOTES TO FINANCIAL STATEMENTS
October 31, 2012
1. Organization
Ashmore Funds (the “Trust”) is a Massachusetts business trust organized under the laws of The Commonwealth of Massachusetts on August 6, 2010 (inception date) and is registered under the Investment Company Act of 1940, as amended (the “Investment Company Act” or “1940 Act”), as an open-end investment management company. The Trust includes seven funds as of October 31, 2012, each with its own investment objective. The Ashmore Emerging Markets Corporate Debt, Ashmore Emerging Markets Local Currency Bond Fund, Ashmore Emerging Markets Local Currency Fund, Ashmore Emerging Markets Sovereign Debt Fund, Ashmore Emerging Markets Total Return Fund, Ashmore Emerging Markets Equity Fund and Ashmore Emerging Markets Small-Cap Equity Fund (each a “Fund” and collectively, the “Funds”) are separate investment funds of the Trust. Each of the Funds, except Ashmore Emerging Markets Equity Fund and Ashmore Emerging Markets Small-Cap Equity Fund, are non-diversified. Non-diversified funds may invest a relatively large portion of their net assets in a single issuer or a small number of issuers in comparison to a fund that is “diversified.” Each of the Funds is presented herein.
On December 8, 2010, the Ashmore Emerging Markets Corporate Debt Fund, Ashmore Emerging Markets Local Currency Bond Fund, Ashmore Emerging Markets Local Currency Fund, Ashmore Emerging Markets Sovereign Debt Fund and Ashmore Emerging Markets Total Return Fund commenced investment operations. From August 6, 2010 through December 7, 2010, these five Funds did not have any operations other than those actions relating to organizational matters, including the sale of 2,000 shares of each of these five Funds for cash in the amount of $10.00 per share, or $20,000 for each of these five Funds. Effective May 12, 2011, Ashmore Emerging Markets Corporate Debt Fund, Ashmore Emerging Markets Local Currency Bond Fund, Ashmore Emerging Markets Local Currency Fund, Ashmore Emerging Markets Sovereign Debt Fund and Ashmore Emerging Markets Total Return Fund began to offer Class A and C shares (“Retail Shares”). On June 22, 2011, the Ashmore Emerging Markets Equity Fund – Institutional Class commenced investment operations. On October 4, 2011, the Ashmore Emerging Markets Small-Cap Equity Fund – Institutional Class commenced investment operations. On September 30, 2011, the Ashmore Emerging Markets Equity Fund and Ashmore Emerging Markets Small-Cap Equity Fund launched Class A and C shares. Class A shares for the Ashmore Emerging Markets Equity Fund and Ashmore Emerging Markets Small-Cap Equity Fund were initially offered on February 27, 2012 and February 1, 2012, respectively. Class C shares for the Ashmore Emerging Markets Equity Fund and Ashmore Emerging Markets Small-Cap Equity Fund were initially offered on August 24, 2012.
Ashmore Investment Management Limited (“Ashmore” or the “Investment Manager” or “AIML”) serves as investment manager to the Funds. The Investment Manager has retained Ashmore EMM, L.L.C. (the “Subadviser”) to manage the investment portfolios of Ashmore Emerging Markets Equity Fund and Ashmore Emerging Markets Small-Cap Equity Fund. The Subadviser is responsible for managing the investment of the Funds’ assets, subject to the general oversight and supervision of the Investment Manager and the Board. Ashmore Investment Management (US) Corporation (“AIMUS”) is the principal underwriter of shares of the Funds. AIMUS is an affiliate of the Investment Manager. The Northern Trust Company (“Northern Trust”) serves as the administrator, custodian and transfer agent of the Funds.
2. Significant accounting policies
The significant accounting policies adopted and consistently followed in the preparation of the Funds’ financial statements are set out below:
(a) Basis of preparation
The financial statements have been prepared in accordance with accounting principles generally accepted in the United States of America (“U.S. GAAP”).
85
ASHMORE FUNDS
NOTES TO FINANCIAL STATEMENTS (CONTINUED)
October 31, 2012
(b) Use of estimates
The preparation of financial statements in accordance with U.S. GAAP requires management to make estimates and assumptions that affect the reported amounts of assets and liabilities and the disclosure of contingent assets and liabilities at the date of the financial statements and the reported amounts of revenues and expenses during the reporting period. Actual results could differ from these estimates. These financial statements contain all adjustments which are, in the opinion of management of the Trust, necessary to portray a fair statement of the period presented. Such adjustments are normal and recurring in nature. Valuation models used to determine the fair value of unlisted derivative instruments require the use of a number of market based assumptions.
(c) Determination of Net Asset Value
The net asset value (“NAV”) of a Fund’s shares is calculated at the close of regular trading (normally 4:00 p.m. Eastern time) (the “NYSE Close”) on each day that the New York Stock Exchange (“NYSE”) is open for regular trading.
(d) Investment valuation
For the purposes of calculating NAV, portfolio securities and other assets for which market quotations are readily available are valued at market value. Market values for various types of securities and other instruments are generally determined on the basis of closing prices or the last reported sales prices on an exchange or other market, or if no sales are reported, based on quotes or other market information obtained from a quotation reporting system, established market makers, or pricing services. Domestic and foreign debt securities where the close of trading does not coincide with the NYSE close and non-exchange traded derivatives are normally valued on the basis of quotes obtained from brokers and dealers or pricing services using data reflecting the earlier closing of the principal markets for those securities. Prices obtained from independent pricing services are based on information provided by market makers or estimates of market values obtained from yield data relating to investments or securities with similar characteristics. Certain debt securities purchased on a delayed delivery basis are marked-to-market daily until settlement at the forward settlement date. Short-term investments having a maturity of 60 days or less and sufficient credit quality are generally valued at amortized cost. Exchange traded options, futures and options on futures are valued at the settlement price determined by the relevant exchange. With respect to any portion of a Fund’s assets that are invested in one or more open-ended investment management companies, a Fund’s NAV will be calculated based upon the NAVs of such investments. The prospectuses for these open-end investment management companies explain the circumstances under which those companies will use fair value pricing and the effects of using fair value pricing.
If the Investment Manager believes a non-U.S. (foreign) security’s value has materially changed after the close of the security’s primary exchange or principal market but before the NYSE Close, the security will be valued at fair value based on procedures approved by the Board of Trustees of the Trust, (the “Board”). A Fund may determine the fair value of investments based on information provided by pricing services and other third-party vendors, which may recommend fair value prices or adjustments with reference to other securities, indices or assets. The Funds may use fair value pricing more frequently for foreign securities or assets because, amongst other things, many foreign markets close well before the NAV of the Funds’ shares is next calculated. In considering whether fair value pricing is required and in determining fair values, the Investment Manager may, amongst other things, consider significant events (which may be considered to include changes in the value of U.S. securities or securities indices) that occur after the close of the relevant market and before the NYSE Close. A Fund may utilize modeling tools provided by third-party vendors to determine the fair values of non-U.S. securities. Foreign exchanges may permit trading in foreign securities on days when the Trust is not open for business, which may result in the values of a Fund’s portfolio investments being affected when you are unable to buy, sell or exchange shares of the Fund.
86
ASHMORE FUNDS
NOTES TO FINANCIAL STATEMENTS (CONTINUED)
October 31, 2012
Domestic fixed income and non-U.S. securities are normally priced using data reflecting the earlier closing of the principal markets for those securities, subject to possible fair value adjustments. Information that becomes known to a Fund or its agents after NAV has been calculated on a particular day will not generally be used to retroactively adjust the price of a security or NAV determined earlier that day.
Investments initially valued in currencies other than the U.S. dollar are converted to the U.S. dollar using exchange rates obtained from pricing services. Foreign exchange rates are calculated as of 4:00 p.m. Eastern time on each day that the NYSE is open for regular trading. As a result, the NAV of a Fund’s shares may be affected by changes in the value of currencies in relation to the U.S. dollar. The value of securities traded in markets outside the United States or denominated in currencies other than the U.S. dollar may be affected significantly on a day that the NYSE is closed and an investor is not able to purchase, redeem or exchange shares of the Funds. Securities and other assets for which market quotations are not readily available are valued at fair value as determined in good faith by the Board or persons acting at their direction. The Board has adopted methods for valuing securities and other assets in circumstances where market quotes are not readily available, and has delegated to the Investment Manager and the Subadviser, as applicable, the responsibility for applying the valuation methods. For instance, certain securities or investments for which market quotes are not readily available may be valued, pursuant to guidelines approved by the Board.
In the event that market quotes are not readily available, and the security or asset cannot be valued pursuant to one of the Board’s approved valuation methods, the fair value of the security or asset will be determined in good faith by the Board, generally based upon recommendations provided by the Investment Manager and the Subadviser, as applicable. Market quotes are considered not readily available in circumstances where there is an absence of current or reliable market-based data (e.g., trade information, bid/asked information, broker quotes), including where events occur after the close of the relevant market, but prior to a Fund’s NAV calculation time, that materially affect the values of a Fund’s securities or assets. In addition, market quotes are considered not readily available when, due to extraordinary circumstances, the exchanges or markets on which the securities trade do not open for trading for the entire day and no other market prices are available. A Fund may also determine that market quotations are not readily available due to events relating to a single issuer (e.g., corporate actions or announcements) or events relating to multiple issuers (e.g., governmental actions or natural disasters). The Board has delegated to the Investment Manager and the Subadviser, as applicable, the responsibility for monitoring significant events that may materially affect the values of a Fund’s securities or assets and for determining whether the value of the applicable securities or assets should be re-evaluated in light of such significant events.
The Investment Manager, as applicable, primarily employs a market-based approach which may use related or comparable assets or liabilities, recent transactions, market multiples, book values, and other relevant information for the investment to determine the fair value of the investment. The Investment Manager may also apply a discount to the last traded price in situations where the last traded price may not represent the fair value of the security, such as if a security’s trading has been suspended on its primary trading market, a security has been de-listed from its primary trading market, a security has not traded for an extended period of time, or a security’s primary trading market is temporarily closed at a time when under normal conditions it would be open. Any such discount would be based on a number of factors including but not limited to the circumstances surrounding any potential suspension or de-listing, market and industry conditions, competitor information, and period of time since last trading took place.
When a Fund uses fair value pricing to determine the NAV of its shares, securities will not be priced on the basis of quotes from the primary market in which they are traded, but rather may be priced by another method that the Board or persons acting at its direction believe accurately reflects fair value. Fair value pricing may require subjective determinations about the value of a security or asset. While the Funds’ policies are intended to result in the calculation of a Fund’s NAV that fairly reflects security and asset values as of the time of pricing, the Funds cannot ensure that fair values determined by the Board or persons acting at their direction would accurately reflect the price that a Fund could obtain for a security or asset if it were to dispose of that security as of the time of pricing (for instance, in a forced or distressed sale). The prices used by a Fund may differ from the value that would be realized if the securities were sold. Also, the use of fair value pricing may
87
ASHMORE FUNDS
NOTES TO FINANCIAL STATEMENTS (CONTINUED)
October 31, 2012
not always result in adjustments to the prices of securities or other assets held by the Fund for purposes of calculating the NAV of the Fund’s shares.
(e) Investment transactions, income and expenses
Investment transactions are recorded at the trade date. The Funds determine the gain or loss realized from investment transactions using an identified cost basis method. Interest income is recognized on an accrual basis and includes the amortization of premiums and the accretion of discounts using the effective yield method. Dividend income is recognized on the ex-dividend date. Dividends from foreign securities are recorded on the ex-dividend date, or as soon as such information is available.
Expenses are recorded on an accruals basis. Each Fund is charged for those expenses that are directly attributable to that Fund. Certain expenses arising in connection with a class of shares are charged to that class of shares. Expenses incurred which do not specifically relate to an individual Fund are allocated amongst all the Funds in the Trust in proportion to each Fund’s relative net assets.
(f) Fully funded total return swaps
Each Fund is subject to market risk in the normal course of pursuing its investment objectives. Certain Funds enter into fully funded total return swaps (“TRS”) to manage their exposure to the market, certain sectors of the market or a particular security or reference asset, or to create exposure to certain investments to which they would otherwise not be exposed. TRS contracts involve the exchange by a Fund and a counterparty of their respective commitments to pay or receive a net amount based on the change in the fair value of a particular security or index and a specified notional amount.
Where a Fund enters into a TRS transaction with a swap counterparty, pursuant to which the Fund makes an initial payment equal to the estimated value of an emerging market debt security, loan or other financial instrument, the TRS are considered investments for financial statement purposes and are accounted for using the same policies as would apply to the underlying assets they represent. Aside from the market risk of the underlying securities, there is a risk of default by the counterparty to the transaction.
(g) Equity-Linked Securities
Certain Funds may purchase equity-linked securities, also known as participation notes. Equity-linked securities are primarily used by the Funds as an alternate means to efficiently and effectively access what is generally an emerging securities market. A Fund deposits cash with its custodian (or broker) in an amount near or equal to the selling price of the underlying security, in exchange for an equity linked security. Upon sale, the Fund receives cash from the broker or custodian, equal to the value of the underlying security. Aside from the market risk and credit risk of the underlying securities, there is a risk of default by the counterparty to the transaction. In the event of insolvency of the counterparty, a Fund might be unable to obtain its expected benefit. In addition, while the Funds will seek to enter into such transactions only with parties that are capable of entering into closing transactions with a Fund, there can be no assurance that a Fund will be able to close out such a transaction with the counterparty or obtain an offsetting position with any counterparty, at a time prior to the end of the term of the underlying agreement.
(h) Reverse Repurchase Agreements
Certain Funds may enter into reverse repurchase agreements. In a reverse repurchase agreement, a Fund sells a security that it holds to a financial institution with a simultaneous agreement to repurchase the same security at an agreed-upon price and date. Securities sold under reverse repurchase agreements are reflected as a liability on the Statements of Assets and Liabilities. Interest payments made are recorded as a component of interest expense on the Statements of Operations. In periods of increased demand for the security, a Fund may receive a fee for use of the security by the counterparty, which may result in interest income to the Fund. A reverse repurchase agreement involves the risk that the market value of the security sold by a Fund may decline below
88
ASHMORE FUNDS
NOTES TO FINANCIAL STATEMENTS (CONTINUED)
October 31, 2012
the repurchase price of the security. A Fund will segregate assets determined to be liquid by the investment adviser or otherwise cover its obligations under reverse repurchase agreements.
(i) Organizational and Offering Costs
Organization costs were recognized as expenses as incurred and consisted of costs incurred to establish the Trust and enable it legally to do business. These expenses were paid by the Funds, and the Investment Manager has agreed to reimburse the Funds for these expenses, subject to potential recovery (see Note 10).
Offering costs include legal fees relating to the preparation of the initial registration statement. Offering costs are amortized over twelve months from the commencement of operations on a straight-line basis.
3. Principal risks
In the normal course of business the Funds trade financial instruments and enter into financial transactions where a risk of potential loss exists due to, amongst other things, changes in the market (market risk), or the failure or inability of the other party to a transaction to perform (credit and counterparty risk). See below for a summary description of select principal risks, some of which may not apply to a particular Fund. For more information, please see the Funds’ prospectuses.
Convertible Securities Risk
Securities that are convertible into preferred or common stocks are subject to the risks of both debt and equity securities and the risk of changes in value at a different rate than the underlying stocks. Convertible securities, particularly high-yield or junk bonds, are subject to greater levels of credit and liquidity risk, may be speculative and may decline in value due to changes in interest rates or an issuer’s or counterparty’s deterioration or default.
Counterparty and Third Party Risk
Transactions involving a counterparty to a derivative or other instrument, or a third party responsible for servicing the instrument, are subject to the credit risk of the counterparty or third party, and to the counterparty’s or third party’s ability to perform in accordance with the terms of the transaction.
Credit Risk
The Funds could lose money if the issuer or guarantor of a debt security or other instrument is unable or unwilling to meet its financial obligations, and the lack of ability, or perceived lack of ability, of the issuer to make timely payments of interest and/or principal will negatively affect the value of the security or instrument.
Currency Management Strategies Risk
Currency management strategies, including the use of forward currency contracts and other derivatives, may substantially change the Funds’ exposure to currencies and currency exchange rates and could result in losses to the Funds if currencies do not perform as the Investment Manager anticipates.
Currency Risk
Foreign (non-U.S.) currencies may decline in value relative to the U.S. dollar and adversely affect the value of the Funds’ investments in foreign currencies, securities denominated in foreign currencies or derivatives that provide exposure to foreign currencies.
Derivatives Risk
Investing in derivative instruments may be considered risky and involves correlation, documentation, interest rate, leverage, liquidity, market, management repetition and valuation risks and the risk of losing more than the principal amount invested.
89
ASHMORE FUNDS
NOTES TO FINANCIAL STATEMENTS (CONTINUED)
October 31, 2012
Emerging Markets Risk
Compared to foreign developed markets, investing in emerging markets may involve heightened volatility, greater political, regulatory, legal and economic uncertainties, less liquidity, dependence on particular commodities or international aid, high levels of inflation, greater custody risk, and certain special risks associated with smaller companies.
Equity Securities Risk
Equity securities may react more strongly to changes in an issuer’s financial condition or prospects than other securities of the same issuer.
Focused Investment Risk
Focusing a fund’s investments in a limited number of issuers, sectors or industries increases risk and the volatility of the value of a fund’s shares. The Funds may be particularly susceptible to economic, political, regulatory or other events affecting the issuers, sectors or industries due to the extent that it focuses its investments.
Foreign Investment Risk
Investments in foreign (non-U.S.) issuers, directly or through the use of depositary receipts, may be negatively affected by adverse political, regulatory, economic, market or other developments affecting issuers located in foreign countries, currency exchange rates or regulations, or foreign withholding taxes. Investing in foreign securities may result in the Funds experiencing more rapid and extreme changes in value than a fund that invests exclusively in the securities of U.S. issuers.
Geographic Focus Risk
The Funds may be particularly susceptible to economic, political or regulatory events affecting those countries or regions in which the Funds focus their investments.
High Yield Risk
Below investment grade securities and unrated securities of similar credit quality (commonly known as “high yield” securities or “junk bonds”) are subject to greater levels of credit and liquidity risks than higher quality securities, and are considered predominantly speculative with respect to the issuer’s continuing ability to make principal and interest payments.
Inflation/Deflation Risk
The value of the Funds’ investments may decline as inflation reduces the value of money; conversely, if deflation reduces prices throughout the economy, there may be an adverse effect on the creditworthiness of issuers in whose securities the Funds invest and an increase in the likelihood of issuer defaults.
Interest Rate Risk
Debt and other securities and instruments may decline in value due to changes in interest rates, the extended duration of principal payments at below-market interest rates, and/or prepayment.
Investments in Pooled Vehicles Risk
Investing in another investment company or pooled vehicle subjects the Funds to that company’s risks, and, in general, to a pro rata portion of that company’s fees and expenses in addition to fees and expenses charged by the Funds.
IPO Risk
Securities offered in initial public offerings (IPOs) are subject to many of the same risks of investing in small companies and often to a heightened degree, their values may be highly volatile, they may have no trading history and information about the issuer may have been available for only limited periods.
90
ASHMORE FUNDS
NOTES TO FINANCIAL STATEMENTS (CONTINUED)
October 31, 2012
Issuer Non-Diversification Risk
The Ashmore Emerging Markets Corporate Debt Fund, Ashmore Emerging Markets Local Currency Bond Fund, Ashmore Emerging Markets Local Currency Fund, Ashmore Emerging Markets Sovereign Debt Fund and the Ashmore Emerging Markets Total Return Fund are “non-diversified” and are therefore more susceptible to the risks of focusing investments in a small number of issuers, industries or foreign currencies, as well as the risks of a single economic, political or regulatory occurrence, than funds that are “diversified”.
Issuer Risk
The value of a security or instrument may decline for reasons directly related to the issuer, such as management performance, financial leverage and reduced demand for the issuer’s goods or services.
Large Shareholder Risk
Shareholders of the Funds, such as institutional investors, may disrupt the efficient management of the Funds’ operations by purchasing or redeeming Fund shares in large amounts.
Leverage Risk
The use of leverage, including through borrowings, derivatives and reverse repurchase agreements, will increase the volatility of the Funds’ investment portfolio and magnify the Funds’ investment losses or gains.
Limited Operating History Risk
The Funds have a limited operating history for investors to evaluate and may not achieve the desired asset levels to maximize investment and operational efficiencies.
Liquidity Risk
Illiquid securities and other instruments may be highly volatile, difficult to value, and difficult to sell or close out at favorable prices or times.
Management Risk
The Funds’ investment returns depend on the ability of the Investment Manager to manage the Funds’ portfolio successfully; there is a risk that the Investment Manager may be incorrect in its analysis of economic trends, currencies, countries, industries, companies, and the relative attractiveness of asset classes or other matters.
Market Risk
The value of securities and instruments owned by the Funds may rise and fall, sometimes rapidly or unpredictably, due to factors affecting securities markets generally or particular industries or geographic areas.
Mortgage-Backed and Asset-Backed Risk
Payments on underlying assets, including mortgages or other obligations, may be delayed, prepaid, subordinated or defaulted on. Rising interest rates tend to extend the duration of these securities, making them more sensitive to changes in interest rates.
Over-the-Counter Risk
Securities and derivatives traded in over-the-counter markets may trade less frequently and in limited volumes and thus exhibit more volatility and liquidity risk. The prices paid by the Funds in over-the-counter transactions may include an undisclosed dealer markup.
Portfolio Turnover Risk
If the Funds frequently trade their securities, this will increase transaction costs, may result in taxable capital gains, and may reduce the Funds’ investment performance.
Small and Mid-Sized Companies Risk
Investments in securities issued by small and mid-sized companies tend to be more vulnerable to adverse developments than larger companies, and may present increased volatility and liquidity risk.
91
ASHMORE FUNDS
NOTES TO FINANCIAL STATEMENTS (CONTINUED)
October 31, 2012
Valuation Risk
Certain securities and instruments may be difficult to value, and to the extent the Funds sell a security or instrument at a price lower than that used to value the security, their net asset value will be adversely affected.
4. Fair value measurements
U.S. GAAP includes a topic which defines fair value as the price that the Fund would receive upon selling an investment in a timely transaction to a market participant in the principal or most advantageous market of the investment in an orderly transaction. This topic establishes a three-tier hierarchy to maximize the use of observable market data and minimize the use of unobservable inputs and to establish classification of fair value measurements for disclosure purposes. Inputs may be observable or unobservable and refer broadly to the assumptions that market participants would use in pricing the asset or liability including assumptions about risk. Such risks include the inherent risk in a particular valuation technique which is used to measure fair value. This may include the pricing model and/or the inputs to the pricing model used in the valuation technique. Observable inputs are inputs that reflect the assumptions market participants would use in pricing the asset or liability developed based on market data obtained from sources independent of the reporting entity. Unobservable inputs are inputs that reflect the reporting entity’s own assumptions about the assumptions market participants would use in pricing the asset or liability, developed based on the best information available in the circumstances. The three-tier hierarchy of inputs is summarized in the three broad levels listed below.
| | • | | Level 1 – Inputs using unadjusted quoted prices in active markets or exchanges for identical assets and liabilities. |
| | • | | Level 2 – Significant observable inputs other than those used in Level 1, which may include, but are not limited to, quoted prices for similar assets or liabilities in markets that are active, quoted prices for identical or similar assets or liabilities in markets that are not active, inputs other than quoted prices that are observable for the assets or liabilities (such as interest rates, yield curves, volatilities, prepayment rates, loss severities, credit risks and default rates) or other market corroborated inputs. |
| | • | | Level 3 – Significant unobservable inputs based on the best information available in the circumstances, to the extent observable inputs are not available, which may include assumptions made by the Board or persons acting at their discretion that are used in determining the fair market value of investments. |
Fixed income securities including corporate, convertible and municipal bonds and notes, U.S. government agency securities, U.S. treasury obligations, sovereign issues, bank loans, convertible preferred securities and non-U.S. bonds are normally valued based on evaluations provided by pricing service providers that use broker dealer quotations, reported trades or valuation estimates from their internal pricing models. The service providers’ internal models use inputs that are observable such as issuer details, interest rates, yield curves, prepayment rates, credit risks/spreads, default rates and quoted prices for similar assets. Securities that use similar valuation techniques and inputs to those described above are typically categorized as Level 2 of the fair value hierarchy.
Fixed income securities purchased on a delayed-delivery basis are marked to market daily until their settlement at the forward settlement date and are typically categorized as Level 2 of the fair value hierarchy.
Common stocks, exchange-traded funds and financial derivative instruments, such as futures contracts or options contracts that are traded on a national securities exchange, are stated at the last reported sale or settlement price on the day of valuation. To the extent these securities are actively traded and valuation adjustments are not applied, they are typically categorized as Level 1 of the fair value hierarchy. Valuation adjustments may be applied to certain securities that are solely traded on a foreign exchange to account for the market movement between the close of the foreign market and the close of the NYSE. These securities are valued using pricing service providers that consider the correlation of the trading patterns of the foreign
92
ASHMORE FUNDS
NOTES TO FINANCIAL STATEMENTS (CONTINUED)
October 31, 2012
security to the intraday trading in the U.S. markets for investments. Securities using these valuation adjustments are typically categorized as Level 2 of the fair value hierarchy. Preferred securities, equity linked notes and other equities traded on inactive markets or valued by reference to similar instruments are also typically categorized as Level 2 of the fair value hierarchy.
Investments in registered open-end investment management companies will be valued based upon the NAVs of such investments and are categorized as Level 1 of the fair value hierarchy. Investments in privately held investment funds will be valued based upon the NAVs of such investments and are categorized as Level 2 of the fair value hierarchy.
Short-term investments having a maturity of 60 days or less are generally valued at amortized cost which approximates fair market value. These investments are categorized as Level 2 of the fair value hierarchy.
Over-the-counter derivative financial instruments, such as foreign currency contracts, options contracts, or swaps agreements, derive their value from underlying asset prices, indices, reference rates, and other inputs or a combination of these factors. These contracts are normally valued on the basis of broker dealer quotations or pricing service providers. Depending on the product and the terms of the transaction, the value of the financial derivative contracts can be estimated by a pricing service provider using a series of techniques, including simulation pricing models. The pricing models use inputs that are observed from actively quoted markets such as issuer details, indices, spreads, interest rates, curves, dividends and exchange rates. Financial derivatives that use similar valuation techniques and inputs as described above are categorized as Level 2 of the fair value hierarchy.
Investments and derivatives classified within Level 3 have significant unobservable inputs, as they trade infrequently or not at all. Level 3 instruments may include private equity and real estate investments, certain loan agreements, less-liquid corporate debt securities (including distressed debt instruments) and certain collateralized debt obligations. Also included in this category are options, government and sovereign obligations, government agency securities and corporate bonds for which independent broker prices are used and information relating to the inputs of the price models is currently unavailable.
5. Capital share transactions
Transactions in Class A shares for the year ended October 31, 2012, were as follows:
| | | | | | | | | | | | | | | | | | | | | | | | | | | | | | | | |
| Fund | | Shares Sold | | | Proceeds from Shares Sold | | | Shares from Reinvested Distributions | | | Proceeds from Reinvestment of Distributions | | | Shares Redeemed | | | Payments for Shares Redeemed | | | Net Increase in Shares | | | Net Increase in Net Assets | |
Ashmore Emerging Markets Corporate Debt Fund | | | 49,653 | | | $ | 472,200 | | | | 311 | | | $ | 2,984 | | | | - | | | $ | - | | | | 49,964 | | | $ | 475,184 | |
Ashmore Emerging Markets Local Currency Bond Fund | | | 11,668 | | | | 114,014 | | | | 50 | | | | 490 | | | | - | | | | - | | | | 11,718 | | | | 114,504 | |
Ashmore Emerging Markets Local Currency Fund | | | - | | | | 1 | | | | - | | | | 1 | | | | - | | | | - | | | | - | | | | 2 | |
Ashmore Emerging Markets Sovereign Debt Fund | | | 4,143 | | | | 42,088 | | | | 24 | | | | 258 | | | | (2,979 | ) | | | (30,414 | ) | | | 1,188 | | | | 11,932 | |
Ashmore Emerging Markets Total Return Fund | | | 267,010 | | | | 2,659,890 | | | | 3,342 | | | | 31,787 | | | | (98 | ) | | | (976 | ) | | | 270,254 | | | | 2,690,701 | |
93
ASHMORE FUNDS
NOTES TO FINANCIAL STATEMENTS (CONTINUED)
October 31, 2012
| | | | | | | | | | | | | | | | | | | | | | | | | | | | | | | | |
| Fund | | Shares Sold | | | Proceeds from Shares Sold | | | Shares from Reinvested Distributions | | | Proceeds from Reinvestment of Distributions | | | Shares
Redeemed | | | Payments
for Shares
Redeemed | | | Net
Increase
in Shares | | | Net
Increase in
Net Assets | |
Ashmore Emerging Markets Equity Fund | | | 100 | | | | 1,000 | | | | 1 | | | | 7 | | | | - | | | | - | | | | 101 | | | | 1,007 | |
Ashmore Emerging Markets Small-Cap Equity Fund | | | 24,294 | | | | 232,698 | | | | 71 | | | | 693 | | | | (13) | | | | (357) | | | | 24,352 | | | | 233,034 | |
Transactions in Class C shares for the year ended October 31, 2012, were as follows:
| | | | | | | | | | | | | | | | | | | | | | | | | | | | | | | | |
| Fund | | Shares Sold | | | Proceeds from Shares
Sold | | | Shares from Reinvested Distributions | | | Proceeds from Reinvestment of Distributions | | | Shares Redeemed | | | Payments for Shares Redeemed | | | Net Increase in Shares | | | Net
Increase in
Net Assets | |
Ashmore Emerging Markets Corporate Debt Fund | | | 2,674 | | | $ | 25,000 | | | | 42 | | | $ | 392 | | | | - | | | $ | - | | | | 2,716 | | | $ | 25,392 | |
Ashmore Emerging Markets Local Currency Bond Fund | | | 1,780 | | | | 17,016 | | | | 11 | | | | 109 | | | | - | | | | - | | | | 1,791 | | | | 17,125 | |
Ashmore Emerging Markets Local Currency Fund | | | - | | | | 1 | | | | - | | | | 1 | | | | - | | | | - | | | | - | | | | 2 | |
Ashmore Emerging Markets Sovereign Debt Fund | | | - | | | | 1 | | | | 4 | | | | 45 | | | | - | | | | - | | | | 4 | | | | 46 | |
Ashmore Emerging Markets Total Return Fund | | | 53,408 | | | | 515,050 | | | | 375 | | | | 3,649 | | | | (5 | ) | | | (49 | ) | | | 53,778 | | | | 518,650 | |
Ashmore Emerging Markets Equity Fund | | | 100 | | | | 1,002 | | | | - | | | | 3 | | | | - | | | | - | | | | 100 | | | | 1,005 | |
Ashmore Emerging Markets Small-Cap Equity Fund | | | 240 | | | | 2,502 | | | | 1 | | | | 5 | | | | (141 | ) | | | (1,475 | ) | | | 100 | | | | 1,032 | |
Transactions in Institutional Class shares for the year ended October 31, 2012, were as follows:
| | | | | | | | | | | | | | | | | | | | | | | | | | | | | | | | |
| Fund | | Shares Sold | | | Proceeds from Shares Sold | | | Shares from Reinvested Distributions | | | Proceeds from Reinvestment of Distributions | | | Shares Redeemed | | | Payments for Shares
Redeemed | | | Net Increase in Shares | | | Net Increase in Net Assets | |
Ashmore Emerging Markets Corporate Debt Fund | | | 1,044,877 | | | $ | 10,239,560 | | | | 95,986 | | | $ | 908,806 | | | | (641,267) | | | $ | (6,380,195) | | | | 499,596 | | | $ | 4,768,171 | |
Ashmore Emerging Markets Local Currency Bond Fund | | | 1,926,912 | | | | 18,958,172 | | | | 156,284 | | | | 1,521,349 | | | | (1,346,183) | | | | (12,918,287) | | | | 737,013 | | | | 7,561,234 | |
94
ASHMORE FUNDS
NOTES TO FINANCIAL STATEMENTS (CONTINUED)
October 31, 2012
| | | | | | | | | | | | | | | | | | | | | | | | | | | | | | | | |
| Fund | | Shares Sold | | | Proceeds from Shares Sold | | | Shares from Reinvested Distributions | | | Proceeds from Reinvestment of Distributions | | | Shares Redeemed | | | Payments for Shares Redeemed | | | Net Increase in Shares | | | Net Increase in Net Assets | |
Ashmore Emerging Markets Local Currency Fund | | | 5,016,267 | | | | 45,668,320 | | | | - | | | | 2 | | | | (355,306) | | | | (3,338,586) | | | | 4,660,961 | | | | 42,329,736 | |
Ashmore Emerging Markets Sovereign Debt Fund | | | 1,054,650 | | | | 11,000,000 | | | | 139,559 | | | | 1,444,696 | | | | (1,063,839) | | | | (11,106,639) | | | | 130,370 | | | | 1,338,057 | |
Ashmore Emerging Markets Total Return Fund | | | 41,003,044 | | | | 397,771,511 | | | | 916,115 | | | | 8,898,160 | | | | (2,240,094) | | | | (21,297,657) | | | | 39,679,065 | | | | 385,372,014 | |
Ashmore Emerging Markets Equity Fund | | | 524 | | | | 5,044 | | | | 9,661 | | | | 77,689 | | | | - | | | | (2) | | | | 10,185 | | | | 82,731 | |
Ashmore Emerging Markets Small- Cap Equity Fund | | | 125,602 | | | | 1,417,778 | | | | 7,058 | | | | 78,789 | | | | - | | | | (1) | | | | 132,660 | | | | 1,496,566 | |
Capital shares
Class A or Class C shares are issued at the Fund’s relevant NAV per share plus any applicable sales charge for Class A shares. Institutional Class shares are issued at the Fund’s relevant NAV per share without a sales charge. Shares confer upon the holders the right to receive notice of and attend, speak and vote at general meetings of the Funds. The shares confer upon the holders the right to any or all dividends or distributions which the Trustees in their sole discretion may from time to time resolve to make or declare.
6. Investment transactions
For the year ended October 31, 2012, the aggregate costs of purchases and proceeds from sales of investments (including fully funded TRS and excluding short-term investments) for the Funds were as follows:
| | | | | | | | |
| | | |
| Fund | | Purchases | | | Sales | |
Ashmore Emerging Markets Corporate Debt Fund | | $ | 12,576,153 | | | $ | 6,762,254 | |
Ashmore Emerging Markets Local Currency Bond Fund | | | 66,249,866 | | | | 50,021,599 | |
Ashmore Emerging Markets Local Currency Fund | | | 2,310,954 | | | | 986,604 | |
Ashmore Emerging Markets Sovereign Debt Fund | | | 10,983,626 | | | | 9,610,140 | |
Ashmore Emerging Markets Total Return Fund | | | 499,011,126 | | | | 157,824,832 | |
Ashmore Emerging Markets Equity Fund | | | 8,352,024 | | | | 8,220,218 | |
Ashmore Emerging Markets Small-Cap Equity Fund | | | 12,779,730 | | | | 11,083,443 | |
95
ASHMORE FUNDS
NOTES TO FINANCIAL STATEMENTS (CONTINUED)
October 31, 2012
7. Federal income taxes
No provision for U.S. federal income taxes has been made since each Fund’s policy is to comply with the requirements of Subchapter M of the Internal Revenue Code of 1986, as amended, applicable to regulated investment companies, and to distribute, each year, substantially all of its taxable income and capital gains to its shareholders.
For financial reporting purposes the Funds may periodically make reclassifications among components of capital accounts to reflect permanent differences between U.S. GAAP and taxable income. The reclassifications have no impact on the net assets of the Funds. As of October 31, 2012, the following reclassifications were made to the Statement of Net Assets:
| | | | | | | | |
| Fund | | Accumulated Undistributed Net Realized Gain/
Loss | | | Undistributed Net Investment
Income | |
| Ashmore Emerging Markets Corporate Debt Fund | | | $ (26,305) | | | | $ 26,305 | |
| Ashmore Emerging Markets Local Currency Bond Fund | | | (142,924) | | | | 142,924 | |
| Ashmore Emerging Markets Local Currency Fund | | | (1,730,356) | | | | 1,730,356 | |
| Ashmore Emerging Markets Sovereign Debt Fund | | | (11,691) | | | | 11,691 | |
| Ashmore Emerging Markets Total Return Fund | | | (5,130,486) | | | | 5,130,486 | |
| Ashmore Emerging Markets Equity Fund | | | 8,538 | | | | (8,538) | |
| Ashmore Emerging Markets Small-Cap Equity Fund | | | (1,662) | | | | 1,662 | |
At October 31, 2012, the capital loss carryforwards for U.S. federal income tax purposes and their respective years of expiration were as follows:
| | | | |
| Fund | | October 31, 2019 | |
Ashmore Emerging Markets Local Currency Fund | | | $ (4,413) | |
The Regulated Investment Company Modernization Act of 2010 (the “Act”) was enacted on December 22, 2010. The Act makes changes to several tax rules affecting the Funds. In general, the provisions of the Act are effective for the Funds’ fiscal year ending October 31, 2012. Although the Act provides several benefits, including the unlimited carryover of future capital losses, there may be a greater likelihood that all, or a portion of a Fund’s pre-enactment capital loss carryovers may expire without being utilized, due to the fact that post-enactment capital losses are utilized before pre-enactment capital loss carryovers.
The following Funds have available capital loss carryforwards for which there is no expiration date:
| | | | |
| Fund | | Short-Term Capital Loss
Carryforward at October 31, 2012 | | Long-Term Capital Loss
Carryforward at October 31, 2012 |
Ashmore Emerging Markets Equity Fund | | $ (1,297,904) | | |
Ashmore Emerging Markets Local Currency Fund | | | | $ (2,870) |
The Funds in the above two tables may offset future capital gains with these capital loss carryforwards.
The Funds are subject to the provisions of the Financial Accounting Standards Board (“FASB”) Accounting Standards Codification (“ASC”) Topic 740-10, Income Taxes. This standard provides guidance as to how uncertain tax positions should be recognized, measured, presented and disclosed in the Funds’ financial statements. The Funds recognize the tax benefits of uncertain tax positions only where the position is more-likely-than-not (i.e. greater than 50-percent) to be sustained assuming examination by a tax authority based on the technical merits of the position. In evaluating whether a tax position has met the recognition threshold, the
96
ASHMORE FUNDS
NOTES TO FINANCIAL STATEMENTS (CONTINUED)
October 31, 2012
Funds must presume that the position will be examined by the appropriate taxing authority that has full knowledge of all relevant information. A tax position that meets the more-likely-than-not recognition threshold is measured to determine the amount of benefit to recognize in the Funds’ financial statements. Income tax and related interest and penalties would be recognized by the Funds as tax expense in the statement of operations if the tax positions were deemed not to meet the more-likely-than-not threshold. The Funds analyze all open tax years for all major taxing jurisdictions. Open tax years are those that are open to examination by taxing authorities, as defined by the Statute of Limitations in each jurisdiction. The Funds have no examinations by tax authorities in progress. Management has analyzed the Funds’ tax positions, and has concluded that no liability for unrecognized tax benefits should be recorded related to uncertain tax positions. Further, Management is not aware of any tax positions for which it is reasonably possible that the total amounts of unrecognized tax benefits will significantly change in the next twelve months.
As of October 31, 2012, the components of distributable taxable earnings, including temporary differences, are as follows:
| | | | | | | | | | | | | | | | | | | | |
| Fund | | Undistributed Ordinary Income | | | Undistributed Long Term Capital Gain | | | Accumulated Capital Losses and Other | | | Unrealized Appreciation (Depreciation) on Investments and Foreign Currencies | | | Total Accumulated Earning (Deficit) | |
Ashmore Emerging Markets Corporate Debt Fund | | | $ 151,435 | | | | $ 94,032 | | | | $ (35,001) | | | | $ 138,545 | | | | $349,011 | |
Ashmore Emerging Markets Local Currency Bond Fund | | | - | | | | - | | | | (96,283) | | | | 2,208,747 | | | | 2,112,464 | |
Ashmore Emerging Markets Local Currency Fund | | | 1,809,816 | | | | - | | | | (31,004) | | | | 175,570 | | | | 1,954,382 | |
Ashmore Emerging Markets Sovereign Debt Fund | | | 88,704 | | | | 61,828 | | | | (39,062) | | | | 3,225,398 | | | | 3,336,868 | |
Ashmore Emerging Markets Total Return Fund | | | 8,933,641 | | | | - | | | | (402,679) | | | | 13,802,047 | | | | 22,333,009 | |
Ashmore Emerging Markets Equity Fund | | | - | | | | - | | | | (1,298,335) | | | | (71,489) | | | | (1,369,824) | |
Ashmore Emerging Markets Small-Cap Equity Fund | | | 1,099,388 | | | | 30,847 | | | | - | | | | 736,932 | | | | 1,867,167 | |
The taxable character of distributions paid during the fiscal year ended October 31, 2012, were as follows:
| | | | | | | | | | | | | | | | | | | | |
| | | Distributions From | | | | | | | |
| Fund | | Ordinary Income | | | Short-Term Capital Gains | | | Long-Term Capital Gains | | | Return
of
Capital | | | Total
Distributions
Paid | |
Ashmore Emerging Markets Corporate Debt Fund | | | $1,068,991 | | | | $ 66,324 | | | | $ - | | | | $ - | | | | $1,135,315 | |
Ashmore Emerging Markets Local Currency Bond Fund | | | 1,649,340 | | | | 758,249 | | | | 77,545 | | | | 20,233 | | | | 2,505,367 | |
Ashmore Emerging Markets Local Currency Fund | | | - | | | | - | | | | - | | | | - | | | | - | |
Ashmore Emerging Markets Sovereign Debt Fund | | | 1,514,004 | | | | - | | | | - | | | | - | | | | 1,514,004 | |
Ashmore Emerging Markets Total Return Fund | | | 9,666,192 | | | | - | | | | - | | | | - | | | | 9,666,192 | |
Ashmore Emerging Markets Equity Fund | | | 101,642 | | | | - | | | | - | | | | 4,929 | | | | 106,571 | |
Ashmore Emerging Markets Small-Cap Equity Fund | | | 39,065 | | | | 53,933 | | | | - | | | | - | | | | 92,998 | |
97
ASHMORE FUNDS
NOTES TO FINANCIAL STATEMENTS (CONTINUED)
October 31, 2012
The taxable character of distributions paid during the fiscal period ended October 31, 2011, were as follows:
| | | | | | | | | | | | | | | | |
| | | Distributions From | | | | | | | |
| Fund | | Ordinary Income | | | Long-Term Capital Gains | | | Return of Capital | | | Total
Distributions Paid | |
Ashmore Emerging Markets Corporate Debt Fund | | $ | 660,384 | | | $ | - | | | $ | - | | | $ | 660,384 | |
Ashmore Emerging Markets Local Currency Bond Fund | | | 1,481,344 | | | | - | | | | 1,034,126 | | | | 2,515,470 | |
Ashmore Emerging Markets Local Currency Fund | | | - | | | | - | | | | 948,703 | | | | 948,703 | |
Ashmore Emerging Markets Sovereign Debt Fund | | | 413,236 | | | | - | | | | - | | | | 413,236 | |
Ashmore Emerging Markets Total Return Fund | | | 1,070,336 | | | | - | | | | 1,263,657 | | | | 2,333,993 | |
Ashmore Emerging Markets Equity Fund | | | 46,475 | | | | - | | | | - | | | | 46,475 | |
Ashmore Emerging Markets Small-Cap Equity Fund | | | - | | | | - | | | | - | | | | - | |
8. Distributions to shareholders
The Ashmore Emerging Markets Corporate Debt Fund, Ashmore Emerging Markets Local Currency Bond Fund, Ashmore Emerging Markets Local Currency Fund, Ashmore Emerging Markets Sovereign Debt Fund and Ashmore Emerging Markets Total Return Fund declare distributions of their net investment income daily and pay such distributions monthly. The Ashmore Emerging Markets Equity Fund and Ashmore Emerging Markets Small-Cap Equity Fund declare and pay distributions of their net investment income at least quarterly.
Distributions of net realized capital gains, if any, are declared and paid at least annually. The Funds may also make a special distribution to comply with federal tax requirements. Income dividends and capital gains distributions determined in accordance with federal income tax regulations may differ from U.S. GAAP. Differences between tax regulations and U.S. GAAP may change the fiscal period in which income and capital items are recognized for tax and U.S. GAAP purposes. Examples of events that give rise to timing differences include wash sales, straddles and capital loss carryforwards. Further, the character of investment income and capital gains may be different for certain transactions under the two methods of accounting. Examples of characterization differences include the treatment of foreign currency transactions and swap transactions. As a result, income dividends and capital gain distributions declared during a fiscal period for federal tax purposes may differ significantly from the net investment income and realized capital gain reported on each Fund’s financial statements presented under U.S. GAAP. In general, to the extent that any differences which are permanent in nature result in over distributions to shareholders, the amount of the over distribution may be reported as return of capital. Temporary differences do not require reclassification. See Note 7 for further details.
9. Derivative instruments and hedging activities
FASB ASC Topic 815-10 (“Topic 815-10”), Disclosures about Derivative Instruments and Hedging Activities, improves financial reporting about derivative instruments by requiring enhanced disclosures to enable investors to better understand how and why the Funds use derivative instruments, how these derivative instruments are accounted for and their effects on the Funds’ financial position and results of operations.
None of the derivatives held in the Funds have been designated as hedging instruments under Topic 815-10. A discussion of the strategies for these derivatives and their counterparty credit risk can be found below.
In accordance with Topic 815-10, the Funds record their trading-related derivative activities on a fair value basis (as described in Note 4). Fair values represent the amount at which the instrument could be exchanged in a current transaction between willing parties, other than in a forced or liquidation sale.
98
ASHMORE FUNDS
NOTES TO FINANCIAL STATEMENTS (CONTINUED)
October 31, 2012
The following disclosures contain information on how and why the Funds use derivative financial instruments; the credit-risk-related contingent features in certain derivative financial instruments; and how derivative financial instruments affect the Funds’ financial position, results of operations and cash flows. The location and fair value of these instruments on the Statements of Assets and Liabilities and the realized, and changes in unrealized, gains and losses on the Statements of Operations, are included in tables following each of the Fund’s Schedule of Investments and categorized by type of financial derivative contract.
(a) Options
Each Fund is subject to market risk in the normal course of pursuing its investment objectives. The Funds have entered into options to speculate on the price movements of the financial instrument underlying the option, for use as an economic hedge against certain equity positions held in a Fund’s portfolio holdings or for other investment purposes. Option contracts give a Fund the right, but not the obligation, to buy or sell within a limited time, a financial instrument, commodity or currency at a contracted price that may also be settled in cash, based on differentials between specified indices or prices.
Options written obligate a Fund to buy or sell within a limited time, a financial instrument, commodity or currency at a contracted price that may also be settled in cash, based on differentials between specified indices or prices. Options written by a Fund may expose a Fund to the market risk of an unfavorable change in the financial instrument underlying the written option.
A Fund is exposed to counterparty risk from the potential that a seller of an option contract does not sell or purchase the underlying asset as agreed under the terms of the option contract. The maximum risk of loss from counterparty risk to a Fund holding a put or call option is generally the fair value of the contracts and the premiums paid to purchase its open option contracts. The risk of loss on call options sold by the Funds is potentially unlimited. A Fund considers the credit risk of the intermediary counterparties to its option transactions in evaluating potential credit risk.
Gains and losses associated with the valuation of options are recognized at fair value as the net change in unrealized appreciation/(depreciation) on investments in securities in the Statements of Operations. The premium on purchased put options exercised is subtracted from the proceeds of the sale of the underlying security or foreign currency in determining the realized gain or loss. The premium on purchased call options exercised is added to the cost of the securities or foreign currency purchased. Premiums paid on the purchase of options that expire unexercised are recorded as realized losses and are reflected in net realized gain/(loss) on investments in securities in the Statements of Operations.
For the year ended October 31, 2012, the Ashmore Emerging Markets Local Currency Bond Fund, Ashmore Emerging Markets Local Currency Fund and Ashmore Emerging Markets Total Return Fund had an average contract notional exposure of $20,213, $18,375, and $23,888, respectively, related to options contracts.
(b) Forward foreign currency exchange contracts
A forward foreign exchange contract involves an obligation to purchase or sell a specific currency at a future date at a price set at the time the contract is made. The Funds have entered into forward foreign currency exchange contracts in connection with settling planned purchases or sales of securities, as part of an investment strategy to protect against uncertainty in the level of future foreign exchange rates in the purchase and sale of securities, or to gain exposure to foreign currencies. All forward foreign currency exchange contracts are valued daily at the applicable exchange rates. Any resulting unrealized gains or losses are recorded in net change in unrealized appreciation/(depreciation) on forward foreign currency exchange contracts in the Statements of Operations. A Fund records realized gains or losses at the time the forward foreign exchange contract is offset by entering into a closing transaction with the same counterparty or is extinguished by delivery of the currency. Realized gains or losses, if any, are included in net realized gain/(loss) on forward foreign exchange contracts in the Statements of Operations.
99
ASHMORE FUNDS
NOTES TO FINANCIAL STATEMENTS (CONTINUED)
October 31, 2012
Risks arise upon entering into these contracts from the potential inability of counterparties to meet the terms of their contracts and from unanticipated movements in the value of a foreign currency relative to the U.S. dollar. The contractual amounts of forward foreign currency exchange contracts do not necessarily represent the amounts potentially subject to risk. The measurement of the risks associated with these instruments should be considered in light of all related and offsetting transactions. The Funds bear market risk from changes in foreign currency exchange rates and credit risk if the counterparty fails to perform. Further information on the impact of these positions on the Funds’ financial statements can be found in Note 11.
For the year ended October 31, 2012, the Ashmore Emerging Markets Corporate Debt Fund, Ashmore Emerging Markets Local Currency Bond Fund, Ashmore Emerging Markets Local Currency Fund, Ashmore Emerging Markets Sovereign Debt Fund, Ashmore Emerging Markets Total Return Fund and Ashmore Emerging Markets Equity Fund had an average contract notional exposure of $6,852,998, $169,906,568, $144,676,139, $71,911, $365,436,934, and $17,519, respectively, related to forward foreign currency exchange contracts.
(c) Futures contracts
During the reporting period, certain Funds entered into long (short) futures contracts for hedging purposes. Futures contracts obligate the buyer to take and the seller to make delivery at a future date of a specified quantity of a financial instrument or an amount of cash based on the value of securities indices, commodities or the fair value in U.S. dollars of a foreign currency.
The Funds’ participation in the futures markets involves certain risks, including the imperfect correlation between movements in the price of the futures contracts and movements in the price of the underlying securities. Risks may arise from the potential inability of a counterparty to meet the terms of the contract. Credit risk is mitigated to the extent that the exchange on which a particular futures contract is traded assumes the risk of a counterparty defaulting on its obligations under the contract.
At the time the Funds enter into a futures contract, the Funds deposit and maintain as collateral initial margin with the broker, as required by the exchange on which the transaction is effected. Pursuant to the contract, the Funds agree to receive from or pay to the broker an amount of cash equal to the fluctuation in the value of the contract. Such receipts or payments are determined by the rules of the futures exchange and are known as variation margin. When the contract is closed, the Funds record a realized gain or loss equal to the difference between the value of the contract at the time it was opened and the time it was closed. This amount is included in net realized gain or loss on futures contracts in the Statement of Operations. Any unrealized gains or losses on open futures contracts are included in net change in unrealized appreciation (depreciation) on futures contracts in the Statement of Operations.
For the year ended October 31, 2012, the Ashmore Emerging Markets Local Currency Bond, Ashmore Emerging Markets Sovereign Debt and Ashmore Emerging Markets Total Return Funds had an average notional long (short) exposure of $(784,199), $(831,399), and $(1,778,825), respectively, related to futures contracts.
(d) Interest rate swaps
During the reporting period, certain Funds entered into interest rate swaps, which are arrangements between two parties to exchange cash flows based on a notional principal amount, to manage the Funds’ exposure to interest rates. Interest rate swaps are marked to market daily and the change in fair value, if any, is recorded as unrealized gain or loss. Payments made or received are recorded as part of realized gains and losses. Certain Funds could be exposed to credit or market risk due to unfavorable changes in the fluctuation of interest rates or if the counterparty defaults on its obligations to perform.
Interest rate swaps are recorded at their fair value. The fair value is based on quoted market prices or prices obtained from a third party provider at the date of the Statements of Assets and Liabilities, without any
100
ASHMORE FUNDS
NOTES TO FINANCIAL STATEMENTS (CONTINUED)
October 31, 2012
deduction for estimated future selling costs. The periodic payments on the swap agreements entered into by the Funds are reflected in the Statement of Operations within net realized gain/(loss) on interest rate swap contracts. Unrealized gains are reported as an asset and unrealized losses are reported as a liability in the Statements of Assets and Liabilities. Changes in the fair value are reflected in the Statements of Operations within net change in unrealized appreciation/(depreciation) on interest rate swap contracts in the period in which they occur.
For the year ended October 31, 2012, the Ashmore Emerging Markets Local Currency Bond and Ashmore Emerging Markets Total Return Funds had an average notional exposure of $10,429,653 and $36,021,752, respectively, related to interest rate swap contracts.
10. Related parties
Investment management fees
The Trust has an Investment Management Agreement (the “Agreement”) with the Investment Manager, with whom certain officers and directors of the Trust are affiliated, to furnish investment management services to the Funds. Under the terms of the Agreement, the Trust, on behalf of the Funds, compensates the Investment Manager for its investment management services at the following rates, based on each Fund’s average daily net assets:
| | |
| Fund | | Rate |
Ashmore Emerging Markets Corporate Debt Fund | | 1.15% |
Ashmore Emerging Markets Local Currency Bond Fund | | 0.95% |
Ashmore Emerging Markets Local Currency Fund | | 0.85% |
Ashmore Emerging Markets Sovereign Debt Fund | | 0.90% |
Ashmore Emerging Markets Total Return Fund | | 1.00% |
Ashmore Emerging Markets Equity Fund | | 1.15% |
Ashmore Emerging Markets Small-Cap Equity Fund | | 1.50% |
The Investment Manager has contractually agreed to waive its fees or reimburse each Fund for other expenses until February 28, 2013, to the extent that total operating expenses (other than acquired fund fees and expenses, interest expenses, taxes, extraordinary expenses and certain credits and offset arrangements) for each class of shares of each Fund exceed the rates in the table below, based on each Fund’s average daily net assets. The expense limitation arrangement may be terminated by the Board at any time.
| | | | | | |
| Fund | | Class A | | Class C | | Institutional Class |
Ashmore Emerging Markets Corporate Debt Fund | | 1.45% | | 2.20% | | 1.17% |
Ashmore Emerging Markets Local Currency Bond Fund | | 1.25% | | 2.00% | | 0.97% |
Ashmore Emerging Markets Local Currency Fund | | 1.15% | | 1.90% | | 0.87% |
Ashmore Emerging Markets Sovereign Debt Fund | | 1.20% | | 1.95% | | 0.92% |
Ashmore Emerging Markets Total Return Fund | | 1.30% | | 2.05% | | 1.02% |
Ashmore Emerging Markets Equity Fund | | 1.45% | | 2.20% | | 1.17% |
Ashmore Emerging Markets Small-Cap Equity Fund | | 1.80% | | 2.55% | | 1.52% |
101
ASHMORE FUNDS
NOTES TO FINANCIAL STATEMENTS (CONTINUED)
October 31, 2012
Any such waiver or reimbursement is subject to the Investment Manager’s right to recover amounts waived or reimbursed to the extent actual fees and expenses for a future fiscal period are less than each Fund’s expense limitation cap, provided, however, that the Investment Manager shall only be entitled to recover such amounts waived or reimbursed during the previous three fiscal years. The total accumulated amount subject to recovery in future years is $497,476 for Ashmore Emerging Markets Corporate Debt Fund, $592,273 for Ashmore Emerging Markets Local Currency Bond Fund, $559,549 for Ashmore Emerging Markets Local Currency Fund, $514,697 for Ashmore Emerging Markets Sovereign Debt Fund, $766,510 for Ashmore Emerging Markets Total Return Fund, $389,297 for Ashmore Emerging Markets Equity Fund and $337,321 for Ashmore Emerging Markets Small-Cap Equity Fund.
Subadviser fees
For the services provided, the Investment Manager pays the Subadviser at the following rates, based on each Fund’s average daily net assets:
| | |
| Fund | | Institutional Class |
Ashmore Emerging Markets Equity Fund | | 0.92% |
Ashmore Emerging Markets Small-Cap Equity Fund | | 1.20% |
Distribution fees
The Funds have adopted Amended Plans of Distribution and Servicing Fees pursuant to Rule 12b-1 under the 1940 Act (“Distribution and Servicing Fee Plans”). Under the Distribution and Servicing Fee Plans, each of the Funds may pay fees to the distributor on an ongoing basis as compensation for the services the distributor renders and the expenses it bears in connection with the sale and distribution of Fund shares (“distribution fees”) and/or in connection with personal services rendered to Fund shareholders and the maintenance of shareholder accounts (“servicing fees”). Class A and C shares each have a separate 12b-1 Plan. Class A shares pay only servicing fees. Class C shares pay both distribution and servicing fees. The following table lists the maximum annual rates at which the distribution and/or servicing fees may be paid under each 12b-1 Plan (calculated as a percentage of a Fund’s average daily net assets attributable to the particular class of shares):
| | | | |
| | | Servicing Fee | | Distribution Fee |
Class A shares | | 0.25% | | None |
Class C shares | | 0.25% | | 0.75% |
Investor Ownership
On November 19, 2010, Ashmore Emerging Markets Corporate Debt Fund, Ashmore Emerging Markets Local Currency Bond Fund, Ashmore Emerging Markets Local Currency Fund, Ashmore Emerging Markets Sovereign Debt Fund and Ashmore Emerging Markets Total Return Fund were seeded. On June 22, 2011, Ashmore Emerging Markets Equity Fund was seeded. On October 4, 2011, Ashmore Emerging Markets Small-Cap Equity Fund was seeded. Each of the Funds was seeded by Ashmore Investments UK Limited, the parent of the Investment Manager. Ashmore Investments UK Limited seeded each Fund with $10 million, except the Ashmore Emerging Markets Total Return Fund, which was seeded with $20 million.
102
ASHMORE FUNDS
NOTES TO FINANCIAL STATEMENTS (CONTINUED)
October 31, 2012
As of October 31, 2012, Ashmore Investments UK Limited owned the following percentages of outstanding shares of each Fund:
| | |
| Fund | | Institutional Class |
Ashmore Emerging Markets Corporate Debt Fund | | 38.44% |
Ashmore Emerging Markets Local Currency Fund | | 14.72% |
Ashmore Emerging Markets Equity Fund | | 68.11% |
Ashmore Emerging Markets Small-Cap Equity Fund | | 88.88% |
In addition to the Ashmore Investments UK Limited ownership, shown in the table above, the following Funds had other investors owning greater than 5% of the outstanding shares of such Funds: four investors each owned 65.47%, 6.19%, 6.19% and 6.19%, respectively, of the outstanding shares of the Ashmore Emerging Markets Corporate Debt Fund - Class A, one investor owned 96.05% of the outstanding shares of the Ashmore Emerging Markets Corporate Debt Fund - Class C, two investors each owned 23.12% and 5.79%, respectively, of the outstanding shares of the Ashmore Emerging Markets Corporate Debt Fund - Institutional Class, four investors each owned 71.86%, 13.65%, 7.21% and 7.03%, respectively, of the outstanding shares of the Ashmore Emerging Markets Local Currency Bond Fund - Class A, three investors each owned 83.67%, 10.79% and 5.54%, respectively, of the outstanding shares of the Ashmore Emerging Markets Local Currency Bond Fund - Class C, four investors each owned 35.20%, 34.78%, 12.11% and 10.28%, respectively, of the outstanding shares of the Ashmore Emerging Markets Local Currency Bond Fund - Institutional Class, one investor owned 100.00% of the outstanding shares of the Ashmore Emerging Markets Local Currency Fund - Class A and Class C, three investors each owned 54.97%, 8.52% and 7.52%, respectively, of the outstanding shares of the Ashmore Emerging Markets Local Currency Fund - Institutional Class, two investors each owned 91.74% and 8.26%, respectively, of the outstanding shares of the Ashmore Emerging Markets Sovereign Debt Fund - Class A, one investor owned 100.00% of the outstanding shares of the Ashmore Emerging Markets Sovereign Debt Fund - Class C, one investor owned 100.00% of the outstanding shares of the Ashmore Emerging Markets Sovereign Debt Fund - Institutional Class, six investors each owned 17.98%, 14.70%, 9.00%, 7.71%, 6.25% and 6.16%, respectively, of the outstanding shares of the Ashmore Emerging Markets Total Return Fund - Class A, five investors each owned 40.01%, 18.68%, 9.82%, 9.58% and 9.34%, respectively, of the outstanding shares of the Ashmore Emerging Markets Total Return Fund - Class C, four investors each owned 48.19%, 15.72%, 11.99% and 7.45%, respectively, of the outstanding shares of the Ashmore Emerging Markets Total Return Fund – Institutional Class, one investor owned 100.00% of the outstanding shares of the Ashmore Emerging Markets Equity Fund - Class A and Class C, three investors owned 16.77%, 10.05% and 5.02%, respectively, of the outstanding shares of the Ashmore Emerging Markets Equity Fund – Institutional Class, four investors each owned 39.64%, 29.55%, 20.06% and 10.75%, respectively, of the outstanding shares of the Ashmore Emerging Markets Small-Cap Equity Fund - Class A, two investors each owned 58.37% and 41.63% of the outstanding shares of the Ashmore Emerging Markets Small-Cap Equity Fund - Class C and one investor owned 7.98% of the outstanding shares of the Ashmore Emerging Markets Small-Cap Equity Fund - Institutional Class.
11. Financial instruments with off-balance sheet risk and concentration of credit risk
Derivative financial instruments may result in off-balance sheet market and credit risk. Market risk is the possibility that future changes in market price may make a financial instrument less valuable. If the markets should move against one or more positions that the Funds hold, the Funds could incur losses greater than the unrealized amounts recorded in the Statements of Assets and Liabilities.
Credit risk is the risk that the counterparty will default and fail to fulfill the terms of the agreement.
Derivative risk exposures are discussed in Note 9.
103
ASHMORE FUNDS
NOTES TO FINANCIAL STATEMENTS (CONTINUED)
October 31, 2012
| 12. | Recent accounting pronouncements |
In December 2011, the FASB issued Accounting Standards Update (“ASU”) No. 2011-11, Disclosures about Offsetting Assets and Liabilities (“ASU 2011-11”). These disclosure requirements are intended to help investors and other financial statement users to better assess the effect or potential effect of offsetting arrangements on a company’s financial position. They also improve transparency in the reporting of how companies mitigate credit risk, including the disclosure of related collateral pledged or received. In addition, ASU 2011-11 facilitates comparison between those reporting entities that prepare their financial statements on the basis of U.S. GAAP and those reporting entities that prepare their financial statements on the basis of IFRS. Specifically, ASU 2011-11 requires reporting entities to disclose 1) both gross and net information about both instruments and transactions eligible for offset in the financial statements and 2) to disclose instruments and transactions subject to an agreement similar to a master netting agreement. The effective date of ASU 2011-11 is for interim and annual periods beginning on or after January 1, 2013. At this time, the Funds’ management is evaluating the implications of this requirement and the impact it will have on the Funds’ financial statement disclosures.
Management has evaluated subsequent events for the Funds through the date the financial statements were issued, and has concluded that there are no identified subsequent events relevant for financial statement adjustment or disclosure.
104
| | |

| | |
| | KPMG LLP Aon Center |
| | Suite 5500 |
| | 200 East Randolph Drive |
| | Chicago, IL 60601-6436 |
Report of Independent Registered Public Accounting Firm
The Board of Trustees and Shareholders
Ashmore Funds:
We have audited the accompanying statements of assets and liabilities of Ashmore Emerging Markets Corporate Debt Fund, Ashmore Emerging Markets Local Currency Bond Fund, Ashmore Emerging Markets Local Currency Fund, Ashmore Emerging Markets Sovereign Debt Fund, Ashmore Emerging Markets Total Return Fund, Ashmore Emerging Markets Equity Fund, and Ashmore Emerging Markets Small-Cap Equity Fund (Funds within Ashmore Funds), including the schedules of investments as of October 31, 2012, and the related statements of operations for the year-ended December 31, 2012, the statements of changes in net assets and the financial highlights for the each of the years or periods in the two-year period ended October 31, 2012. These financial statements and financial highlights are the responsibility of the Funds’ management. Our responsibility is to express an opinion on these financial statements and financial highlights based on our audits.
We conducted our audits in accordance with the standards of the Public Company Accounting Oversight Board (United States). Those standards require that we plan and perform the audit to obtain reasonable assurance about whether the financial statements and financial highlights are free of material misstatement. An audit includes examining, on a test basis, evidence supporting the amounts and disclosures in the financial statements and financial highlights. Our procedures included confirmation of securities owned as of October 31, 2012 by correspondence with the custodian and brokers. An audit also includes assessing the accounting principles used and significant estimates made by management, as well as evaluating the overall financial statement presentation. We believe that our audits provide a reasonable basis for our opinion.
In our opinion, the financial statements and financial highlights referred to above present fairly, in all material respects, the financial position of the Funds as of October 31, 2012, the results of their operations for the year then ended, and the changes in their net assets and the financial highlights for each of the years or periods in the two-year period ended October 31, 2012, in conformity with U.S. generally accepted accounting principles.

December 24, 2012
| | | | |
| | KPMG LLP is a Delaware limited liability partnership, the U.S. member firm of KPMG International Cooperative (“KPMG International”), a Swiss entity. | | |
ASHMORE FUNDS
ADVISORY AGREEMENT APPROVAL
As of October 31, 2012
ADVISORY AGREEMENT APPROVAL
At an in-person meeting of the Board of Trustees of Ashmore Funds (the “Trust”) held on September 13, 2012, the Board, including a majority of the Trustees who are not “interested persons” of the Trust within the meaning of the Investment Company Act of 1940, as amended (the “1940 Act”) (the “Independent Trustees”), voting separately, considered and unanimously approved the continuation, on an interim basis until March 31, 2013, of the Investment Management Agreements (each, an “Agreement,” and collectively, the “Agreements”) between Ashmore Investment Management Limited (“AIML”) and the Trust, on behalf of each of Ashmore Emerging Markets Corporate Debt Fund, Ashmore Emerging Markets Local Currency Fund, Ashmore Emerging Markets Local Currency Bond Fund, Ashmore Emerging Markets Sovereign Debt Fund and Ashmore Emerging Markets Total Return Fund (the “Funds”). These Agreements were proposed to be continued for an interim five-month period through March 31, 2013 rather than a one-year term in order to align their annual continuance cycle with that of the other Ashmore Funds. In determining to approve the continuation of the Agreements on an interim basis, the Board considered all factors that it believed, in light of the legal advice furnished to them and their own business judgment, to be relevant to the interests of shareholders, including those listed below.
In evaluating the terms of the Agreements, the Board did not identify any single factor as controlling, and individual members of the Board did not necessarily attribute the same weight or importance to each factor, nor are the items described herein all encompassing of the matters considered by the Board. Throughout their review of the Agreements, the Independent Trustees were assisted by Independent Trustee legal counsel. The Independent Trustees had formally requested through their legal counsel, and AIML had provided, certain information the Independent Trustees considered relevant to their evaluation.
Among the information and factors considered by the Board in evaluating the Agreements were the following:
NATURE, QUALITY AND EXTENT OF INVESTMENT MANAGEMENT SERVICES
The Board examined the nature, quality and extent of the services provided by AIML to the Funds. The Board considered information regarding the overall organization and resources of AIML, including information regarding senior management, portfolio managers and other personnel providing investment management, administrative and other services to the Funds. The Board reviewed AIML’s key personnel who provide investment management services to the Funds, as well as the fact that, under the Agreements, AIML has the authority and responsibility, subject to the Board’s oversight, to make and execute investment decisions for the Funds within the framework of the Funds’ investment policies and restrictions. The Board considered that AIML’s duties include: (i) investment research and selection, and (ii) adherence to (and monitoring compliance with) the Funds’ investment policies and restrictions, the 1940 Act and other relevant laws. The Board also evaluated the significant compliance resources available to and utilized by AIML. The Board concluded that it was satisfied with the nature, extent and quality of services provided to the Funds and that there was a reasonable basis on which to conclude that the Funds benefit from the services provided by AIML under the Agreements.
INVESTMENT PERFORMANCE
The Board considered the investment performance of the Funds and AIML. The Board compared the investment performance of each Fund to its peers using rankings compiled by AIML as of June 30, 2012. The information on each Fund’s investment performance was provided for the one-year and since-inception (December 8, 2010) periods ended June 30, 2012. The Board also received information comparing the Funds’ performance to that of each Fund’s benchmark index and comparable institutional composite managed by the Investment Adviser. The Board noted the favorable long-term track record of AIML in managing accounts having similar strategies.
106
ASHMORE FUNDS
ADVISORY AGREEMENT APPROVAL (CONTINUED)
As of October 31, 2012
The Board considered the performance of the Funds in light of their respective investment objectives on both an absolute and comparable basis, and relative to their peers and to other AIML client accounts. They noted that the Funds were relatively new and had correspondingly short track records.
INVESTMENT MANAGEMENT FEES AND COST OF SERVICES
The Board considered the contractual and actual investment management fees paid by each Fund to AIML. In doing so, the Board compared the contractual investment management fees and overall net and gross expense ratios to those of the Funds’ peers and noted that, with respect to certain of the Funds, there were only a limited number of peer funds with similar investment strategies. In light of the information provided, the Board concluded that the investment management fees were generally within the range of fees paid by other similar investment companies. The Board also considered AIML’s commitment to limit certain of the Funds’ ordinary operating expenses for a period of time.
The Board reviewed AIML’s costs and profitability as presented by AIML in serving as each Fund’s investment adviser. The Board noted that AIML was operating at a loss with respect to each Fund except the Ashmore Emerging Markets Total Return Fund, and in that case, AIML’s profitability was not excessive.
In evaluating the terms of the Agreements, the Board also considered the other benefits that may inure to AIML as a result of its relationship with the Funds, such as the reputational benefit derived from serving as investment adviser to the Funds.
ECONOMIES OF SCALE
The Board noted that the contractual investment management fees for the Funds do not contain breakpoints that would reduce the fee rate on assets above specified levels. In evaluating the Funds’ contractual investment management fees, the Board considered AIML’s representation that the contractual investment management fees were intended to reflect achievable economies of scale and also AIML’s continuing agreement to limit certain expenses of each Fund. The Board received and evaluated information concerning whether AIML would realize economies of scale as the Trust’s assets grow beyond current levels. The Board noted they intend to monitor each Fund’s asset growth in connection with future reviews of the Funds’ Agreements to determine whether breakpoints may be appropriate at such time. In light of the Trust’s current size and expense structure, the Board concluded that breakpoints in the Funds’ contractual investment management fees were not warranted at this time.
The Board concluded that the fees to be paid by each Fund were reasonable in light of the services to be provided by AIML, its projected costs and the Funds’ current and reasonably foreseeable asset levels, and that the Agreements should be approved.
107
ASHMORE FUNDS
FOR MORE INFORMATION
As of October 31, 2012
PORTFOLIO HOLDINGS
The Ashmore Funds file their complete schedule of portfolio holdings with the Securities and Exchange Commission (“SEC”) for the first and third quarters of each fiscal year on Form N-Q. The Funds’ Forms N-Q are available on the SEC’s Web site at www.sec.gov. You may also review and obtain copies at the SEC’s Public Reference Room in Washington D.C. Information about the Public Reference Room may be obtained by calling 800-SEC-0330.
PROXY VOTING
Ashmore Funds’ Proxy Voting Policies and Procedures and each Fund’s portfolio securities voting record for the most recent 12-month period ended June 30 are available upon request and without charge by visiting the Ashmore Funds’ Web site at www.ashmoregroup.com or the SEC’s Web site at www.sec.gov or by calling 866-876-8294.
108
ASHMORE FUNDS
PRIVACY POLICY
We consider customer privacy to be a fundamental aspect of our relationships with shareholders and are committed to maintaining the confidentiality, integrity and security of our current, prospective and former shareholders’ personal information. To ensure our shareholders’ privacy, we have developed policies that are designed to protect this confidentiality, while allowing shareholders’ needs to be served.
Obtaining Personal Information In the course of providing shareholders with products and services, we may obtain non-public personal information about shareholders, which may come from sources such as account applications and other forms, from other written, electronic or verbal correspondence, from shareholder transactions, from a shareholder’s brokerage or financial advisory firm, financial adviser or consultant, and/or from information captured on our internet web sites.
Respecting Your Privacy As a matter of policy, we do not disclose any personal or account information provided by shareholders or gathered by us to non-affiliated third parties, except as required for our everyday business purposes, such as to process transactions or service a shareholder’s account, or as otherwise permitted by law. As is common in the industry, non-affiliated companies may from time to time be used to provide certain services, such as preparing and mailing prospectuses, reports, account statements and other information, and gathering shareholder proxies. We may also retain non-affiliated financial services providers to market our shares or products and we may enter into joint-marketing arrangements with them and other financial companies. We may also retain marketing and research service firms to conduct research on shareholder satisfaction. These companies may have access to a shareholder’s personal and account information, but are permitted to use this information solely to provide the specific service or as otherwise permitted by law. We may also provide a shareholder’s personal and account information to their respective brokerage or financial advisory firm, Custodian, and/or to their financial advisor or consultant.
Sharing Information with Third Parties We reserve the right to disclose or report personal information to non-affiliated third parties where we believe in good faith that disclosure is required under law to cooperate with regulators or law enforcement authorities, to protect our rights or property or upon reasonable request by any investee entity in which a shareholder has chosen to invest. Of course, we may also share your information with your consent.
Sharing Information with Affiliates We may share shareholder information with our affiliates in connection with our affiliates’ everyday business purposes, such as servicing a shareholder’s account, but our affiliates may not use this information to market products and services to you except in conformance with applicable laws or regulations. The information we share includes information about our experiences and transactions with a shareholder and may include, for example, a shareholder’s participation in one of the Funds or in other investment programs, a shareholder’s ownership of certain types of accounts, or other data about a shareholder’s transactions or accounts. Our affiliates, in turn, are not permitted to share shareholder information with non-affiliated entities, except as required or permitted by law.
Procedures to Safeguard Private Information We take seriously the obligation to safeguard shareholder non-public personal information. In addition to this policy, we have also implemented procedures that are designed to restrict access to a shareholder’s non-public personal information only to internal personnel who need to know that information in order to provide products or services to such shareholders. In addition, we have physical, electronic, and procedural safeguards in place to guard a shareholder’s non-public personal information.
Disposal of Confidential Records We will dispose of records, if any, that are knowingly derived from data received from a consumer reporting agency regarding a shareholder that is an individual in a manner that ensures the confidentiality of the data is maintained. Such records include, among other things, copies of consumer reports and notes of conversations with individuals at consumer reporting agencies.
109
ASHMORE FUNDS
OTHER INFORMATION
Administrator, Custodian and Transfer Agent
The Northern Trust Company
50 South LaSalle Street
Chicago, Illinois 60603
312-630-6000
Investment Manager
Ashmore Investment Management Limited
61 Aldwych
London WC2B 4AE
United Kingdom
44-20-3077-6000
Subadviser for Ashmore Emerging Markets Equity Fund
and Ashmore Emerging Markets Small-Cap Equity Fund
Ashmore EMM, LLC
1001 19th Street North, 17th Floor
Arlington, Virginia 22209-1722
Distributor
Ashmore Investment Management (US) Corporation
122 East 42nd Street
New York, New York 10168
212-661-0061
Legal Counsel
Ropes & Gray LLP
Prudential Tower
800 Boylston Street
Boston, Massachusetts 02199
617-951-7000
Independent Trustees’ Counsel
Dechert LLP
200 Clarendon Street
27th Floor
Boston, Massachusetts 02116
617-728-7100
110
ASHMORE FUNDS
TRUSTEES AND OFFICERS
Set forth below is information about the Trustees and Officers of the Ashmore Funds. Each Trustee has served in that capacity since he or she was originally elected or appointed to the Board of Trustees. Each Trustee oversees a total of 7 portfolios in the Ashmore Funds. The Ashmore Funds’ Statement of Additional Information contains additional information about the Trustees and is available upon request and without charge by calling 866-876-8294.
INDEPENDENT TRUSTEES
| | | | | | | | | | |
Name, Address* and Age of Independent Trustee | | Positions(s) Held with Trust | | Term of Office and Length of Time Served | | Principal Occupation(s)
During Past 5 Years | | Number of
Portfolios in Fund Complex Overseen By
Trustee | | Other Directorships Held by Trustee During the Past 5 Years |
Yeelong Balladon (Age 53) | | Trustee | | Indefinite term; Trustee since inception | | Freshfields Bruckhaus Deringer (a law firm) from 1982 to 2009 (Partner from 1999). | | 7 | | Non-executive director since August 2010, Jasper Investments Limited; Non- executive director May 2010 – March 2012, Pacnet Limited. |
George J. Gorman (Age 60) | | Trustee | | Indefinite term; Trustee since inception | | George J. Gorman LLC (consulting firm) since December 2010; Ernst & Young LLP (an accounting firm) from July 1974 to July 2009 (Senior Partner from October 1988). | | 7 | | Trustee, Bank of America Money Market Funds Series Trust since June 2011. |
Oliver T. Kane (Age 62) | | Trustee, Chairman of the Trustees | | Indefinite term; Trustee since inception | | Investment Consultant since June 2005. | | 7 | | Trustee, United Church of Christ Pension Board, since June 2010; Director, Ashmore Global Opportunities Limited since August 2010 to October 2010. |
111
ASHMORE FUNDS
TRUSTEES AND OFFICERS
INTERESTED TRUSTEES
| | | | | | | | | | |
Name, Address* and Age of Interested Trustee | | Positions(s) Held with Trust | | Term of Office and Length of Time Served | | Principal Occupation(s)
During Past 5 Years | | Number of
Portfolios in Fund Complex Overseen By
Trustee | | Other Directorships Held by Trustee During the Past 5 Years |
George Grunebaum(1) (Age: 49) | | Trustee; President and Chief Executive Officer | | Indefinite term; Trustee since inception | | Chief Executive Officer since November 2008, Ashmore Investment Management (US) Corporation; Portfolio Manager since November 2008, Ashmore Investment Management Limited; Principal from September 2005 to October 2008, Dolomite Capital Management(3); Managing Director from September 1986 to June 2005, J.P. Morgan Chase. | | 7 | | Trustee, Ashmore EMM, L.L.C. since May 2011; Director, Ashmore Global Emerging Markets Fund, LTD since July 2006; Director, Ashmore Global Opportunities, Limited from October 2007 to August 2010. |
Martin Tully(2) (Age: 49) | | Trustee | | Indefinite term; Trustee since inception | | A number of senior operational roles with the Ashmore Group plc since 2006, most recently focussing on the development of Ashmore’s overseas subsidiaries. Prior to Ashmore, various senior roles with Rothschild, Citigroup and HSBC. | | 7 | | Trustee of The Ashmore Foundation, the charitable arm of the Ashmore Group plc. |
| | * | Each Trustee may be contacted at 61 Aldwych, London WC2B 4AE, United Kingdom. |
| | (1) | Mr. Grunebaum is an “interested person” of the Trust, as defined in Section 2(a)(19) of the 1940 Act, due to, among other things, his positions with the Distributor and its affiliates. |
| | (2) | Mr. Tully is an “interested person” of the Trust, as defined in Section 2(a)(19) of the 1940 Act, due to his position with Ashmore Group plc, the parent company of Ashmore Investment Management Limited, and his interests in Ashmore Group plc. |
| | (3) | Dolomite Capital Management was sold to an affiliate of the Investment Manager on November 3, 2008. |
112
ASHMORE FUNDS
TRUSTEES AND OFFICERS
OFFICERS
| | | | | | |
Name, Address** and Age of Officer | | Positions(s) Held with Trust | | Term of Office and Length of Time Served | | Principal Occupation(s) During Past 5 Years |
George Grunebaum (Age: 49) | | Trustee, President and Chief Executive Officer | | Indefinite term; since inception | | Chief Executive Officer since November 2008, Ashmore Investment Management (US) Corporation; Portfolio Manager since November 2008, Ashmore Investment Management Limited; Principal from September 2005 to October 2008, Dolomite Capital Management; Managing Director from September 1986 to June 2005, J.P. Morgan Chase. |
Michael Perman (Age: 55) | | Secretary | | Indefinite term; since inception | | Company Secretary since March 2008, Ashmore Group plc; Company Secretary from April 1996 to February 2008, INVESCO plc. |
Alexandra Autrey (Age: 36) | | Chief Legal Officer | | Indefinite term; since inception | | Head of Legal and Transaction Management, Ashmore Group plc, since January 2012; Deputy Head of Legal and Transaction Management, Ashmore Group plc, May 2008 - January 2012; Legal Counsel, Ashmore Group plc, May 2005 – May 2008. |
Christopher Tsutsui (Age: 48) | | Treasurer and Principal Financial and Accounting Officer | | Indefinite term; since inception | | Head of Finance, Ashmore Group plc, since July 2012; Board Member, Ashmore Management Company Colombia S.A.S., since September 2011; Chief Financial Officer, Ashmore Investment Management (U.S.) Corporation, since November 2008; Chief Financial Officer, Dolomite Capital Management(1), from April 2006 to November 2008; Vice President, Morgan Stanley, from April 2004 to April 2006. |
Stephen Hicks (Age: 52) | | Chief Compliance Officer | | Indefinite term; since inception | | Group Head of Compliance since June 2010, Ashmore Group plc; Director of Group Compliance from February 2001 to October 2005 and Chief Compliance Officer from October 2005 to May 2010, 3iGroup plc (a private equity firm). |
Owen Meacham (Age: 41) | | Assistant Secretary | | Indefinite term; since inception | | Senior Corporate Attorney since October 2007, The Northern Trust Company; Vice President - Product Development Manager from April 2005 to October 2007, ABN AMRO Asset Management. |
Paul Robinson (Age: 39) | | Assistant Chief Legal Officer | | Indefinite term; since June 2011 | | Lawyer since September 2007 and Deputy Head of Legal and Transaction Management since September 2012, Ashmore Group plc; Head of Investment and Merchant Banking Transaction |
113
ASHMORE FUNDS
TRUSTEES AND OFFICERS
| | | | | | |
Name, Address** and Age of Officer | | Positions(s)
Held with Trust | | Term of Office and Length of Time Served | | Principal Occupation(s) During Past 5 Years |
| | | | | | | Legal from 2005 to September 2007, Nomura International plc. |
| | ** | Each Officer may be contacted at 61 Aldwych, London WC2B 4AE, United Kingdom. |
| | (1) | Dolomite Capital Management was sold to an affiliate of the Investment Manager on November 3, 2008. |
114
Item 2. Code of Ethics.
| (a) | The registrant has adopted a code of ethics that applies to its principal executive officer, principal financial officer, principal accounting officer or controller, or persons performing similar functions, regardless of whether these individuals are employed by the registrant or a third party (the “Code of Ethics”). |
| (c) | The registrant has not amended its Code of Ethics during the period covered by this report. However, Appendix A to the registrant’s Code of Ethics, which is Code of Ethics of Ashmore Investment Management Limited, was amended during the period covered by this report. |
| (d) | The registrant has not granted any waivers, including an implicit waiver, from any provisions of its Code of Ethics during the period covered by this report. |
Item 3. Audit Committee Financial Expert.
The registrant’s Board of Trustees has determined that the registrant has at least one “audit committee financial expert” (as defined in Item 3 of Form N-CSR), serving on its audit committee. George J. Gorman is the “audit committee financial expert” and is “independent” (as each term is defined in Item 3 of Form N-CSR).
Under applicable securities laws and regulations, a person who is determined to be an audit committee financial expert will not be deemed an “expert” for any purpose, including without limitation for purposes of Section 11 of the Securities Act of 1933, as amended, as a result of being designated or identified as an audit committee financial expert. The designation or identification of a person as an audit committee financial expert does not impose on such person any duties, obligations, or liability that are greater than the duties, obligations, and liability imposed on such person as a member of the registrant’s Audit Committee and Board of Trustees in the absence of such designation or identification. The designation or identification of a person as an audit committee financial expert does not affect the duties, obligations or liability of any other member of the registrant’s Audit Committee or Board of Trustees.
Item 4. Principal Accountant Fees and Services.
Item 4(a): Audit Fees
The aggregate fees billed for each of the last two fiscal years for professional services rendered by KPMG LLP (“KPMG”), independent registered public accounting firm, for the audit of the registrant’s annual financial statements or services that are normally provided by the accountant in connection with statutory and regulatory filings or engagements for those fiscal years are $188,300 in 2012 and $165,000 in 2011.
Item 4(b): Audit-Related Fees
The aggregate fees billed in each of the last two fiscal years for assurance and related services by KPMG that are reasonably related to the performance of the audit of the registrant’s financial statements and are not reported under paragraph (a) of this Item are NONE.
Item 4(c): Tax Fees
The aggregate fees billed in each of the last two fiscal years for professional services rendered by KPMG for RIC tax compliance and diversification review and tax return review are $26,500 in 2012 and $7,500 in 2011.
Item 4(d): All Other Fees
The aggregate fees billed in each of the last two fiscal years for products and services provided by KPMG, other than the services reported in paragraphs (a) through (c) of this Item are NONE.
Item 4(e)(1): Pre-Approval Policies and Procedures
Pursuant to the registrant’s Audit Committee Charter adopted on November 17, 2010, the Audit Committee shall, to the extent required by applicable regulations, pre-approve (i) all audit and permitted non-audit services rendered by the independent auditors to a Fund and (ii) all non-audit services rendered by the independent auditors to a Fund’s investment adviser(s) (including any sub-advisers) and to certain of the investment adviser’s affiliates, as applicable. The Audit Committee may implement policies and procedures by which such services are pre-approved other than by the full Committee (for example, by the Committee chair).
Item 4(e)(2): Percentage of Fees Pre-Approved Pursuant to Waiver Provision of Paragraph (c)(7)(i)(C) of Rule 2-01 of Regulation S-X
No percentage of the principal accountant’s fees or services were approved pursuant to the waiver provision of paragraph (c)(7)(i)(C) of Rule 2-01 of Regulation S-X.
Item 4(f): Work Performed by Persons Other than the Principal Accountant
Not applicable.
Item 4(g): Aggregate Non-Audit Fees Disclosure
The aggregate non-audit fees and services billed by KPMG for services rendered to the registrant and service affiliates for the last two fiscal years were $26,500 for 2012 and $7,500 for 2011.
Item 4(h): Non-Audit Services and Independent Accountant’s Independence
The registrant’s Audit Committee has considered whether the provision of non-audit services to service affiliates, not pre-approved pursuant to paragraph (c)(7)(ii) of Rule 2-01 of Regulation S-X, is compatible with maintaining the registered public accountant’s independence in performing audit services.
Item 5. Audit Committee of Listed Registrants.
Not applicable.
Item 6. Investments.
| (a) | The registrant has elected to include the schedule of investments in securities of unaffiliated issuers as part of the report to shareholders filed under Item 1 of this report on Form N-CSR. |
Item 7. Disclosure of Proxy Voting Policies and Procedures for Closed-End Management Investment Companies.
Not applicable.
Item 8. Portfolio Managers of Closed-End Management Investment Companies.
Not applicable.
Item 9. Purchases of Equity Securities by Closed-End Management Investment Company and Affiliated Purchasers.
Not applicable.
Item 10. Submission of Matters to a Vote of Security Holders.
There have been no material changes to the procedures by which shareholders may recommend nominees to the registrant’s Board of Trustees.
Item 11. Controls and Procedures.
| (a) | The registrant’s principal executive and principal financial officers, or persons performing similar functions, have concluded that the registrant’s disclosure controls and procedures (as defined in Rule 30a-3(c) under the Investment Company Act of 1940 (the “1940 Act”)) are effective, based on the evaluation of these controls and procedures required by Rule 30a-3(b) under the 1940 Act and Rules 13a-15(b) or 15d-15(b) under the Securities Exchange Act of 1934 as of a date within 90 days of the filing date of this report. |
| (b) | There were no changes in the registrant’s internal control over financial reporting (as defined in Rule 30a-3(d) under the 1940 Act) that occurred during the second fiscal quarter of the period covered by this report that have materially affected, or are reasonably likely to materially affect, the registrant’s internal control over financial reporting. |
Item 12. Exhibits.
| (a)(1) | Exhibit 99.CODE: Code of Ethics pursuant to Item 2 of Form N-CSR. |
| (a)(2) | Exhibit 99.CERT: Certifications pursuant to Section 302 of the Sarbanes-Oxley Act of 2002. |
| (b) | Exhibit 99.906 CERT: Certifications pursuant to Section 906 of the Sarbanes-Oxley Act of 2002. |
SIGNATURES
Pursuant to the requirements of the Securities Exchange Act of 1934 and the Investment Company Act of 1940, the registrant has duly caused this report to be signed on its behalf by the undersigned, thereunto duly authorized.
Ashmore Funds
| | |
| By | | /s/ George Grunebaum |
| | George Grunebaum, President and Chief Executive Officer |
| | (Principal Executive Officer) |
Date: January 4, 2013
Pursuant to the requirements of the Securities Exchange Act of 1934 and the Investment Company Act of 1940, this report has been signed below by the following persons on behalf of the registrant and in the capacities and on the dates indicated.
| | |
| By | | /s/ George Grunebaum |
| | George Grunebaum, President and Chief Executive Officer |
| | (Principal Executive Officer) |
Date: January 4, 2013 |
| |
By | | /s/ Chris Tsutsui |
| | Chris Tsutsui, Treasurer |
| | (Principal Financial and Accounting Officer) |
Date: January 4, 2013 |