UNITED STATES
SECURITIES AND EXCHANGE COMMISSION
Washington, D.C. 20549
FORM N-CSR
CERTIFIED SHAREHOLDER REPORT OF REGISTERED MANAGEMENT
INVESTMENT COMPANIES
Investment Company Act file number 811-22468
Ashmore Funds
(Exact name of registrant as specified in charter)
c/o Ashmore Investment Management Limited
61 Aldwych
London WC2B 4AE
England
(Address of principal executive offices) (Zip code)
Corporation Service Company
84 State Street
Boston, MA 20109
(Name and address of agent for service)
Registrant’s telephone number, including area code: 011-44-20-3077-6000
Date of fiscal year end: October 31
Date of reporting period: October 31, 2013
Item 1. Reports to Stockholders.
2
ASHMORE FUNDS
ANNUAL FINANCIAL STATEMENTS
October 31, 2013

ASHMORE FUNDS
TABLE OF CONTENTS
This material is authorized for use only when preceded or accompanied by the current Ashmore Funds prospectuses. Investors should consider the investment objectives, risks, charges and expenses of these Funds carefully before investing. This and other information is contained in the Funds’ prospectus. Please read the prospectus carefully before you invest or send money.
A Fund’s past performance is not necessarily an indication of how the Fund will perform in the future.
An investment in a Fund is not a deposit of a bank and is not guaranteed or insured by the Federal Deposit Insurance Corporation or any other government agency. It is possible to lose money on investments in the Funds.
ASHMORE FUNDS
INVESTMENT MANAGERS REPORT
For the period November 1, 2012 to October 31, 2013
Overview
The year to October 31, 2013 saw a number of periods of increased volatility across the different investment themes. Despite this volatility, we believe that fundamentals across Emerging Markets (“EM”) remain strong.
In the third quarter of 2012, Global Purchasing Managers Indices (“PMIs”) and high frequency data indicated a continued recovery in the global economic cycle, especially in Asia Ex-Japan and the US. In Europe, the European Central Bank (ECB) and the Bundesbank revised their respective forecasts for EU and German growth to -0.3% and +0.4% respectively (from +0.5% and +1.6%). Progress was made on the regulatory side as European leaders agreed legislation establishing a Single Supervisory Mechanism. The new Japanese government put pressure on the Bank of Japan to do more in order to stimulate the economy, resulting in a fall in the Japanese Yen (“JPY”). In the US, the Federal Reserve replaced Operation Twist with outright purchases of US Treasuries and mortgage backed securities. It also pledged to keep interest rates exceptionally low until unemployment falls below 6.5% and estimated inflation for 1-2 years remains below 2.5%. The Federal Reserve Chairman, Ben Bernanke, also mentioned that the Federal Open Market Committee did not expect this unemployment threshold to be reached before mid-2015. All eyes then moved to the fiscal cliff negotiations in US Congress. The last minute agreement reached on 31 December merely moved the trigger date for the “sequester” (automatic spending cuts) from 1 January to 1 March. The only effective measures taken were raising income tax for wealthy families and reversing payroll tax cuts. In practice this amounted to a tax increase of roughly 1.5% of GDP.
During the first quarter of 2013, financial markets moved beyond risk-on/risk-off trading, with a huge dispersion in returns between countries in both equity and fixed income markets. There were some clear signs of risk appetite in the S&P 500 for instance, which grew 10% and printed all-time highs. The Nikkei225 also rose nearly 20% on the back of further JPY weakness as the newly appointed Bank of Japan governor Kuroda gave the measure of his determination to end a decade of deflation via aggressive monetary expansion. Most of the optimism however, was centred on the US with both European and Emerging Markets lagging over the quarter.
Market volatility increased considerably during the second quarter of 2013 as the two most successful trades of April, long USDJPY and long EM bonds, reversed sharply in May and June and took most financial asset prices with them. The origin of this sell-off can be traced back to the strong US non-farm payroll numbers for April, which came in at 165,000 jobs, triggering an increase in US treasury yields in early May. EM bonds, particularly local currency bonds, started selling off a few days later, and market weakness broadened and accelerated on May 22nd after Ben Bernanke gave a relatively short timeframe for the Federal Reserve to start ‘tapering’ its asset purchase programme. This carried broad implications for financial assets held on leverage, and the fact that the Nikkei fell 7% on that day illustrates the technical nature of the sell-off, in which the most crowded trades moved the fastest. The USD was initially weakened as long USDJPY positions were unwound; however, the market correction soon resumed a more ‘traditional’ pattern of market liquidation and the USD moved higher, consistent with rising treasury yields and weaker equity markets.
In Q3 2013, the global macro environment improved, although it was still not entirely free of uncertainty. The decision to delay tapering meant expectations of a US economic rebound lost traction and there was a reduction in mortgage applications as a result of financial tightening. Nevertheless, employment numbers remained relatively steady. European and UK economic data surprised on the upside, adding pressure to the US dollar, which lost 3.5% versus its major peers during the quarter. Chinese economic data also surprised on the upside, frustrating bearish expectations and lifting industrial metal commodity prices. Geopolitical risk increased, lifting oil and energy prices as the situation in Egypt and Syria remained volatile but both areas stabilised during September.
2
ASHMORE FUNDS
INVESTMENT MANAGERS REPORT (CONTINUED)
Portfolio Overview
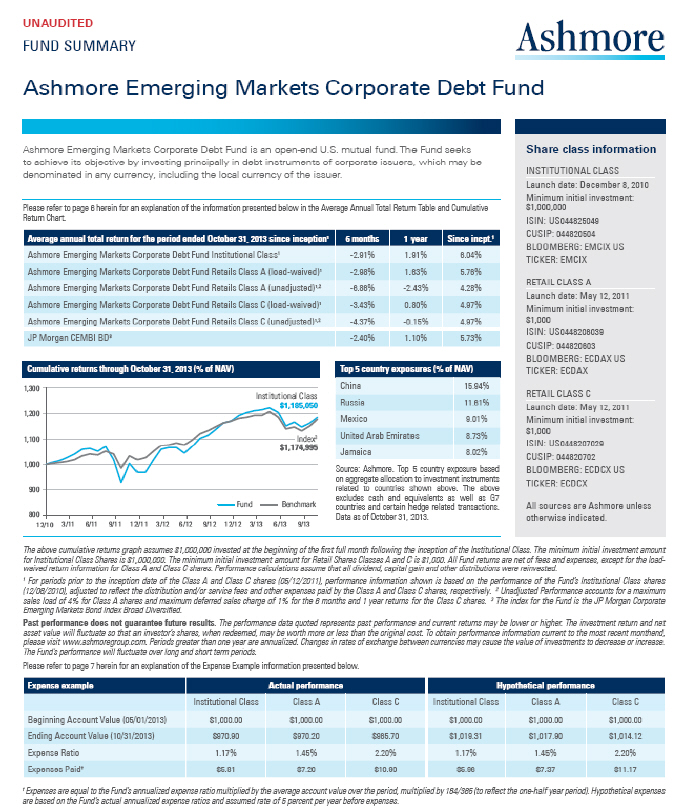
Ashmore Emerging Markets Corporate Debt Fund
The Ashmore Emerging Markets Corporate Debt Fund (“the Fund”) seeks to achieve its objective by investing principally in the debt instruments of EM corporate issuers, which may be denominated in any currency, including the local currency of the issuer. EM corporates operate in an environment that typically consists of higher growth and maturing capital markets. In many cases, EM corporates are characterised by new and growing businesses in industries such as mobile communications, technology and food production. We expect these industries to benefit from the developing economies in which they operate. Increased “south/south” trade (a.k.a. trade between EM countries as opposed to trade with developed markets) has resulted in a material structural change for EM corporates and has helped them to broaden their customer bases. We continue to focus efforts on companies that are less followed by the market and which thus allow us to add maximum value based on our views, research and global EM network capabilities.
Over the period, the fund’s institutional class outperformed its benchmark. Among the Fund’s top contributors in the period, we saw strong gains from overweight positions in China and the United Arab Emirates, where security selection was the primary driver of relative outperformance. Other positive contributors included Singapore, Israel and South Africa. The main detractors from performance included overweight positions in Brazil and Mexico and an underweight position in Hong Kong. Corporate debt remains the best performing asset class year to date despite underperforming external debt during the third quarter.
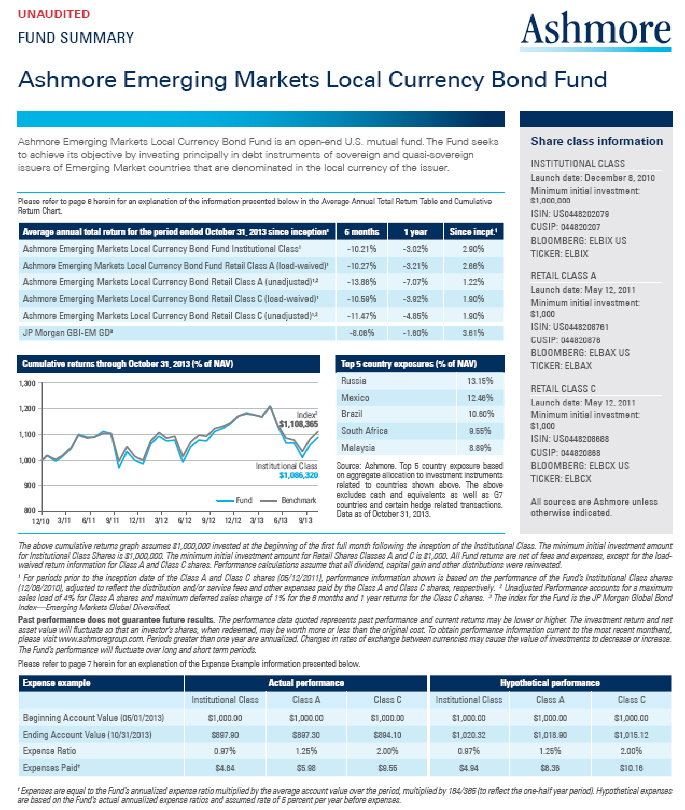
Ashmore Emerging Markets Local Currency Bond Fund
The Ashmore Emerging Markets Local Currency Bond Fund (“the Fund”) seeks to achieve its objective by investing principally in the debt instruments of sovereign and quasi-sovereign EM issuers, denominated in the local currency of the issuer. The Fund’s returns are driven by EM currency appreciation, interest rate positioning and credit worthiness.
EM currencies are not only supported by stronger growth, more robust fundamentals and higher interest rates than developed markets, but it is also likely that a gradual depreciation of developed market currencies will be one mechanism by which developed markets will de-leverage and reduce their enormous debt burdens. In terms of bonds, we continue to find attractive opportunities across EM countries. EM monetary policymakers are acting in an idiosyncratic fashion to meet their particular domestic needs and local expertise is increasingly necessary to help understand the dynamics that drive local decision-making.
Among the Fund’s top contributors for the period were strong gains from underweight positions in Indonesia and Turkey and overweight positions in Russia and Romania. In Indonesia, positive news and flows contributed to performance: the September CPI surprised on the downside at 8.4% (vs. 9.0% expected and 8.8% prior), which we believe was still contaminated by the hike in fuel prices as core inflation rose from 4.5% to 4.7% (0.1% above expected levels). The August trade balance was positive with a US$ 132m surplus vs. the US$ 811m deficit expected, while headline foreign reserves rose from US$ 93bn to US$ 96bn.
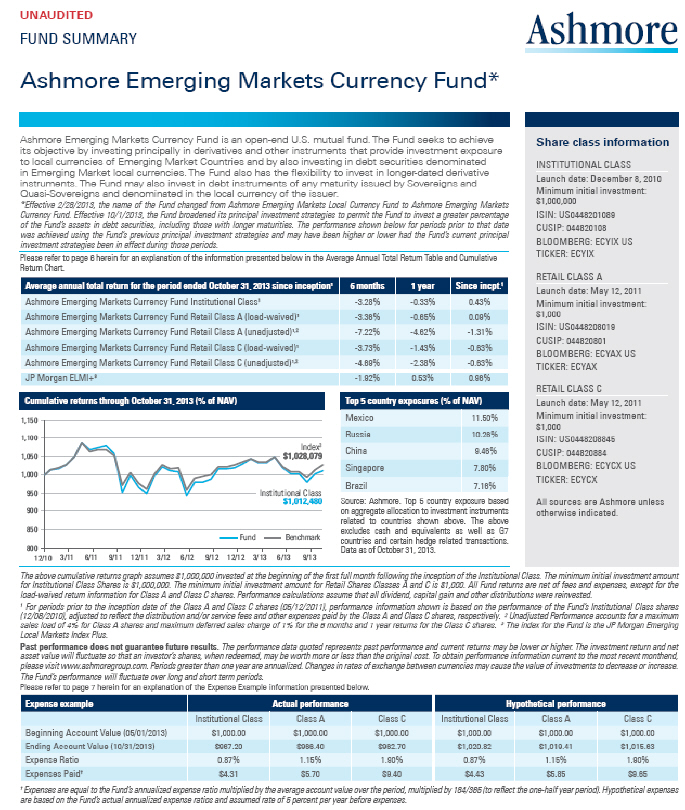
Ashmore Emerging Markets Currency Fund
The Ashmore Emerging Markets Currency Fund (“the Fund”) (formerly known as the Ashmore Emerging Markets Local Currency Fund) seeks to achieve its objective by investing principally in derivatives and other instruments that provide investment exposure to the local currencies of EM countries. The Fund also has the flexibility to invest in debt securities issued by Sovereigns and Quasi-Sovereigns and denominated in the local currency of the issuer.
The current environment continues to reflect the better fiscal and growth picture in the Emerging Markets compared to the developed markets. Putting aside periods of market dislocation when positioning tends to be based to a greater extent on technical and emotional factors rather than fundamentals, the real drivers of long-term currency performance, including relative interest rates and growth, clearly favour Emerging Markets. We believe that the deleveraging process across the developed world is perhaps half complete. At a sovereign level, the heavy debt burdens of developed market countries are clear – no more so than in the United States, which
3
ASHMORE FUNDS
INVESTMENT MANAGERS REPORT (CONTINUED)
continually bumps up against its multi-trillion dollar debt ceiling. In our view, a basket of EM currencies not only provides superior diversification, but also allows us to invest in currencies that we consider to be best positioned to benefit from positive domestic and regional trends.
The best performing currencies over the period were the Russian rouble, Mexican peso and Polish zloty. More recently, stronger than expected economic activity in Europe contributed to positive momentum in the Euro, benefitting European EM countries.
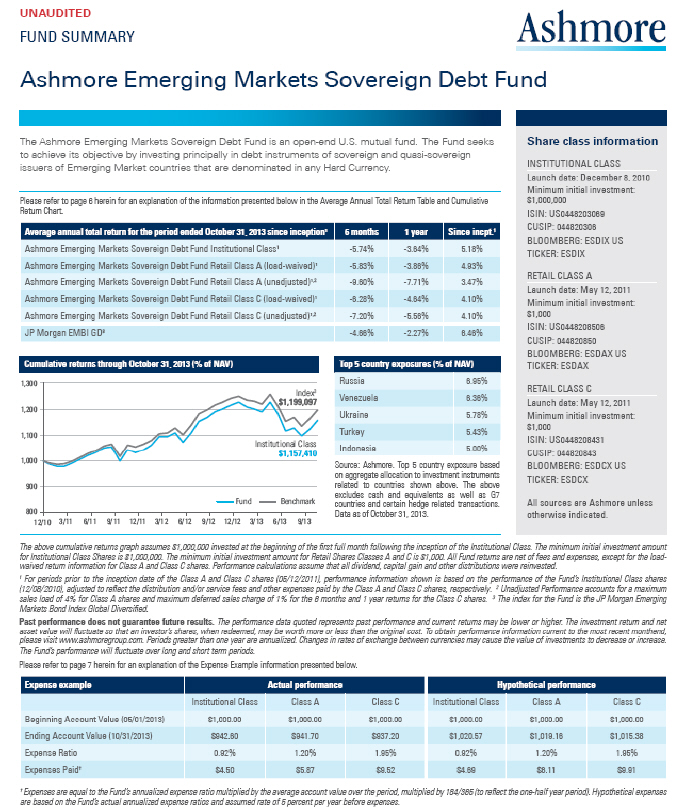
Ashmore Emerging Markets Sovereign Debt Fund
The Ashmore Emerging Markets Sovereign Debt Fund (“the Fund”) seeks to achieve its objective by investing principally in the debt instruments of sovereign and quasi-sovereign EM issuers denominated in any hard currency. Historically, we believe that EM sovereign debt has typically been the most developed, stable, and least risky asset class in EM fixed income.
Due to robust balance sheet positions (68% of the countries in the JP Morgan EMBI Global Diversified Index (“EMBI-GD index”) are investment grade), sovereign external debt has the lowest exposure to credit spreads, combined with the highest exposure to US$ duration in the asset class. Nevertheless, high yield (“HY”) sold off by 190 basis points (bps) following Bernanke’s tapering announcement on 22 May, while investment grade (“IG”) sold off by 51 bps. This was partly due to the new supply of issuance just prior to the sell-off in May, and partly due to country specific factors including those in, for example; Ukraine, Venezuela and Mongolia.
Volatile market prices provide opportunities, to the extent that prices diverge from fundamentals. Despite having only 32% of the market capitalisation in the main index, HY is currently a universe of 34 countries. The bulk of asset price growth in these countries takes place as they access capital markets for the first time in the pursuit of long-term funding sources for economic adjustment and development, as well as investment. Pricing appropriately for the potential risks and returns from each of these economies is crucial for managers in this asset class. In Q3, the EMBI-GD index was up 1.2% with HY again outperforming IG (1.9% vs. 0.9%). Spreads on IG declined 5 bps from 222 to 217 bps over Treasury whilst HY was almost flat, moving only from 591 to 590 bps. The outperformance of HY can be explained by exposure to duration and credit spreads: the 5 year US Treasury yield declined 1 bps, and the 10 year rose 11bps, benefiting HY, which has a 5.8 year duration vs. IG with 7.3 years.
Among the Fund’s best performing positions, Argentina, Peru and the United Arab Emirates were the strongest relative outperformers. In Argentina, on the political side, Cristina Kirchner narrowly maintained her majority in the lower house with 33% of the total votes (down from 54% in 2011), but lost in the province of Buenos Aires by a margin of over 10% to her previous cabinet chief, Sergio Massa (the current mayor of Tigre and now a rival within the Peronist party). This election result opens the way for political transition in Argentina following the next election in 2015. The process may be tortuous as Cristina Kirchner may lose her majority in the Argentinian Congress if her allies change sides before the elections. On the economic side, there is an expectation that the government will take measures to attenuate the loss of reserves, such as increasing the pace of ARS devaluation. Meanwhile, the trade surplus surprised on the upside at US $ 850m (versus US$ 675m expected and US$ 568m previously) and concerns about a technically driven default on the back of the holdout case against the republic subsided in October.
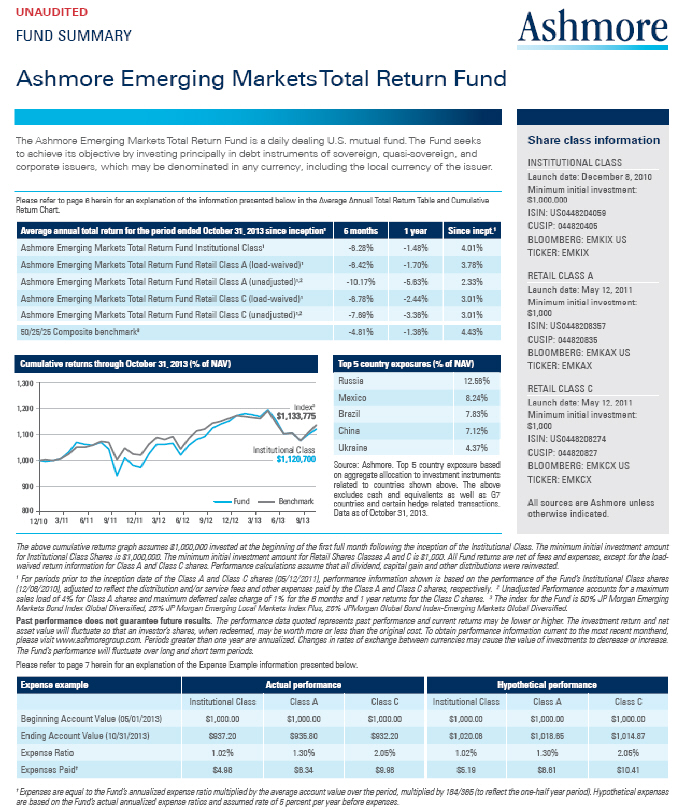
Ashmore Emerging Markets Total Return Fund
The Ashmore Emerging Markets Total Return Fund (“the Fund”) seeks to achieve its objective by investing principally in the debt instruments of sovereign, quasi-sovereign, and corporate issuers, which may be denominated in any currency, including the local currency of the issuer. The Fund tactically allocates assets between external debt, corporate debt and local currency.
Over the period, the fund outperformed its benchmark with external debt contributing the most to relative performance. In October sovereign debt had a strong run, rising 2.8% with IG up 2.3% and HY up 3.7%. The main reason for the outperformance of HY was spread tightening. The EMBI-GD index moved from 322 bps over US treasuries to 298 bps, as IG declined 13 bps to 201, and HY declined by 38 bps to 548. No single country had an absolute negative performance during October. We expect the correlation between EM debt and US
4
ASHMORE FUNDS
INVESTMENT MANAGERS REPORT (CONTINUED)
Treasuries to decline as investors select the best assets to buy, suggesting that the return deviation between good and bad assets should increase. Valuations in EM fixed income are compelling after the recent sell-off, while the fundamental picture has remained broadly stable, with the usual idiosyncratic country stories.
The largest contributors to absolute performance in the period were positions in China, Russia and Poland. Oil prices remained elevated, in part due to the on-going conflict in the Middle East. This helped Russia to avoid the issues seen in other commodity exporting countries such as Peru. During Q4, the market received fairly positive numbers from Russia, including rises in real disposable income, wages, retail sales and investment. In Poland, the credit profile remained positive.
Ashmore Emerging Markets Equity Fund
The Ashmore Emerging Markets Equity Fund (“the Fund”), launched on June 22, 2011, seeks to achieve its objective by investing principally in equity securities and equity-related investments of Emerging Market issuers, which may be denominated in any currency, including the local currency of the issuer. The MSCI Emerging Markets Index (Net) (“MSCI EM Index”) returned 6.5% in USD terms for the year ending October 2013.
Emerging Market (EM) equity returns have been volatile this reporting year, although they ended the period on a positive note, up 6.5%. On a regional basis, EM Eastern Europe led market performance, followed by EM Asia. EM Latin America lagged. Country allocation added the most value to the Fund’s performance, which strongly outperformed its benchmark. The Fund’s exposure to the UAE (which will enter the MSCI EM Index effective May 2014) and Saudi Arabia, as well as the underweights in Chile and Indonesia, added the most value on a country basis. Our underweight in Brazil detracted. However, our stock decisions in that country added significant value, led by our exposure to Braskem SA, a petrochemicals company, and Banco do Brasil. Holdings in Taiwan suffered during the period with Parkson Retail Group detracting the most. We have reduced our exposure to technology stocks overall in Taiwan during the period and have added to our exposure in industrial companies, all driven by relative valuation.
Our investment process continues to seek companies trading at a discount to their long-term fundamental value with a focus on quality and growth. This has resulted in a cyclical bias in the portfolio, notably with an overweight position in Consumer Discretionary and Industrials, and an underweight exposure to the more expensive Consumer Staples stocks.
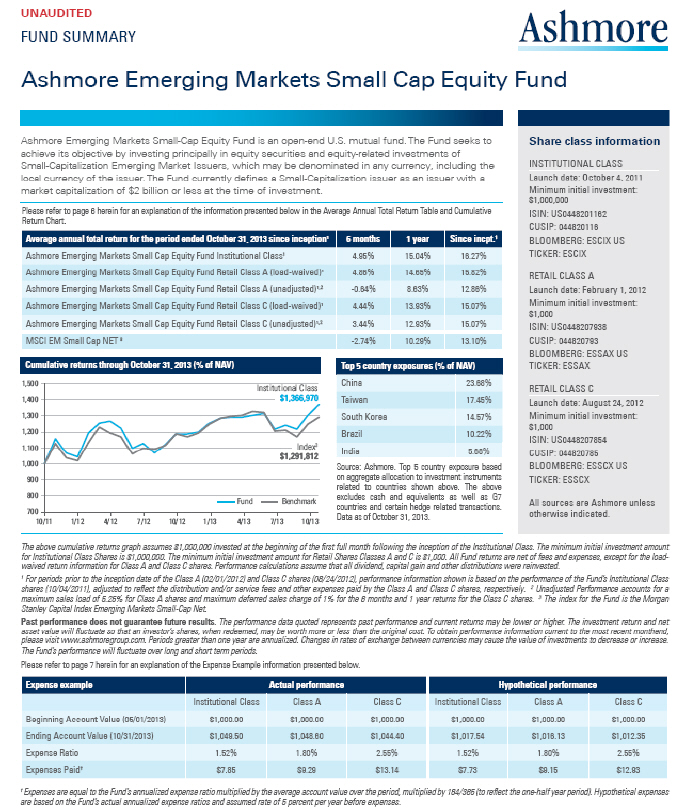
Ashmore Emerging Markets Small-Cap Equity Fund
The Ashmore Emerging Markets Small-Cap Equity Fund (“the Fund”), launched on October 4, 2011, seeks to achieve its objective by investing principally in equity securities and equity-related investments of Small-Capitalization Emerging Market Issuers, which may be denominated in any currency, including the local currency of the issuer. The MSCI Emerging Markets Small Cap Index (Net) returned 10.3% in USD terms for the one year ending October 2013.
Small cap returns were markedly divergent among countries: outperforming countries included Hungary, Taiwan, Poland and China, while Colombia, Peru, Chile and India were significant underperformers. Small caps outperformed EM equities overall by over 400bps.
The Fund outperformed the benchmark during the period. Stock selection was the primary source of added value, particularly in China and also in Brazil. In China, our holding in SouFun, a real-estate search provider, led gains, up largely on the back of an expected moderation in Chinese real estate regulations as well as attractive reported corporate earnings for 2Q13. Our allocations in China are dominated by Information Technology and Consumer Discretionary stocks, which we believe have attractive valuations relative to their quality and growth prospects. Stock selection in Taiwan and Indonesia, however, suffered. On a sector basis, the Fund’s overweight in Consumer Discretionary and underweight in Financials and Materials added to relative returns, while the overweight in Industrials detracted.
We continue to find growth and value opportunities in Emerging Markets and monitor the portfolio’s positions to take advantage of these opportunities as they arise.
5
IMPORTANT INFORMATION ABOUT THE FUNDS
Ashmore Investment Management Limited
This commentary may include statements that constitute “forward-looking statements” under the U.S. securities laws. Forward-looking statements include, among other things, projections, estimates, and information about possible or future results related to the Funds and market or regulatory developments. The views expressed above are not guarantees of future performance or economic results and involve certain risks, uncertainties and assumptions that could cause actual outcomes and results to differ materially from the views expressed herein. The views expressed above are those of Ashmore Investment Management Limited as of the date indicated and are subject to change at any time based upon economic, market, or other conditions and Ashmore Investment Management Limited undertakes no obligation to update the views expressed herein. Any discussions of specific securities or markets should not be considered a recommendation to buy or sell or invest in those securities or markets. The views expressed above may not be relied upon as investment advice or as an indication of the Funds’ trading intent. Information about the Funds’ holdings, asset allocation or country diversification is historical and is not an indication of future portfolio composition, which may vary. Direct investment in any index is not possible. The performance of any index mentioned in this commentary has not been adjusted for ongoing management, distribution and operating expenses applicable to mutual fund investments. In addition, the returns do not reflect certain charges that an investor in the Funds may pay. If these additional fees were reflected, the performance shown would have been lower.
The following disclosure provides important information regarding each Fund’s Average Annual Total Return table and Cumulative Returns chart, which appear on each Fund’s individual page in this report (the “Shareholder Report” or “Report”). Please refer to this information when reviewing the table and chart for a Fund.
On each individual Fund Summary page in this Report, the Average Annual Total Return table and Cumulative Returns chart measure performance assuming that all dividend and capital gain distributions were reinvested. Returns do not reflect the deduction of taxes that a shareholder would pay on (i) Fund distributions or (ii) the redemption of Fund shares. The Cumulative Returns Chart reflects only Institutional Class performance. Performance for Class A and Class C shares is typically lower than Institutional Class performance due to the lower expenses paid by Institutional Class shares. Except for the load-waived performance for the Class A and C shares of each Fund (as applicable), performance shown is net of fees and expenses. The load-waived performance for Class A and Class C shares does not reflect the sales charges shareholders of those classes may pay in connection with a purchase or redemption of Class A and Class C shares. The load-waived performance of those share classes is relevant only to shareholders who purchased Class A or Class C shares on a load-waived basis. The figures in the line graph are calculated at net asset value and assume the investment of $1,000,000 at the beginning of the first full month following the inception of the Institutional Class. Each Fund measures its performance against a broad-based securities market index (“benchmark index”). Each benchmark index does not take into account fees, expenses or taxes.
For periods prior to the inception date of the Class A and Class C shares (if applicable), performance information shown is based on the performance of the Fund’s Institutional Class shares, adjusted to reflect the distribution and/or service fees and other expenses paid by the Class A and Class C shares, respectively.
A Fund’s past performance, before and after taxes, is not necessarily an indication of how the Fund will perform in the future.
An investment in a Fund is not a deposit of a bank and is not guaranteed or insured by the Federal Deposit Insurance Corporation or any other government agency. It is possible to lose money on investments in the Funds.
6
IMPORTANT INFORMATION ABOUT THE FUNDS (CONTINUED)
The following disclosure provides important information regarding each Fund’s Expense Example, which appears on each Fund’s individual page in this Shareholder Report. Please refer to this information when reviewing the Expense Example for a Fund.
EXPENSE EXAMPLE
Fund Expenses
As a shareholder of the Funds, you incur two types of costs: (1) transaction costs, including sales charges (loads) on purchase payments; redemption fees; and exchange fees; and (2) ongoing costs, including management fees; distribution (12b-1) fees; and other Fund expenses. This Example is intended to help you understand your ongoing costs (in dollars) of investing in the Funds and to compare these costs with the ongoing costs of investing in other mutual funds. The Example is based on an investment of $1,000 invested at the beginning of the period and held for the entire period, from May 1, 2013 or the inception date (if later), through October 31, 2013.
Actual Expenses
The information in the table under the heading “Actual Performance” provides information based on actual performance and actual expenses. You may use the information in these columns, together with the amount you invested, to estimate the expenses that you paid over the period. Simply divide your account value by $1,000 (for example, an $8,600 account value divided by $ 1,000 = $8.60), then multiply the result by the number in the appropriate column for your share class, in the row titled “Expenses Paid” to estimate the expenses you paid on your account during this period.
Hypothetical Example for Comparison Purposes
The information in the table under the heading “Hypothetical Performance” provides information about hypothetical account values and hypothetical expenses based on the Fund’s actual expense ratio and an assumed rate of return of 5% per year before expenses, which is not the Fund’s actual return. The hypothetical account values and expenses may not be used to estimate the actual ending account balance or expenses you paid for the period. You may use this information to compare the ongoing costs of investing in the Fund and other funds. To do so, compare this 5% hypothetical example with the 5% hypothetical examples that appear in the shareholder reports of the other funds.
Please note that the expenses shown in the table are meant to highlight your ongoing costs only and do not reflect any transactional costs, such as sales charges (loads), redemption fees, or exchange fees. Therefore, the information under the heading “Hypothetical Performance” is useful in comparing ongoing costs only, and will not help you determine the relative total costs of owning different funds. In addition, if these transactional costs were included, your costs would have been higher.
7
8
9
10
11
12

13
14
(THIS PAGE INTENTIONALLY LEFT BLANK)
15
ASHMORE FUNDS
STATEMENTS OF ASSETS AND LIABILITIES
As of October 31, 2013
| | | | | | | | | | |
| | | Ashmore
Emerging Markets
Corporate Debt
Fund | | | | | Ashmore
Emerging Markets
Local Currency
Bond Fund | |
ASSETS: | | | | | | | | | | |
Investments in securities, at value | | $ | 177,961,300 | | | | | $ | 65,231,795 | |
Investments in fully funded total return swaps, at value | | | — | | | | | | 3,460,671 | |
Deposit held at broker | | | — | | | | | | 109,046 | |
Cash | | | 5,279,487 | | | | | | 13,979,267 | |
Cash held at broker (restricted $1,270,000, $300,000, and $4,080,000, respectively) | | | — | | | | | | 1,270,000 | |
Foreign currency, at value | | | 1,306,227 | | | | | | 183,398 | |
Purchased Options | | | — | | | | | | 41 | |
Unrealized appreciation on interest rate swap contracts | | | — | | | | | | 119,701 | |
Unrealized appreciation on forward foreign currency exchange contracts | | | 13,313 | | | | | | 681,850 | |
Receivable for securities and currencies sold | | | 315,135 | | | | | | 5,847 | |
Receivable for fund shares sold | | | 2,603,417 | | | | | | 94,235 | |
Receivable from Investment Manager | | | 46,802 | | | | | | 28,297 | |
Interest and dividends receivable | | | 3,180,829 | | | | | | 1,079,924 | |
Other assets | | | 4,052 | | | | | | 3,633 | |
Total Assets | | | 190,710,562 | | | | | | 86,247,705 | |
LIABILITIES: | | | | | | | | | | |
Unrealized depreciation on interest rate swap contracts | | | — | | | | | | 235,599 | |
Unrealized depreciation on forward foreign currency exchange contracts | | | 39,080 | | | | | | 645,457 | |
Payable for securities and currencies purchased | | | 2,581,136 | | | | | | 392,056 | |
Payable for when-issued securities | | | — | | | | | | — | |
Payable for fund units redeemed | | | 1,055,309 | | | | | | 428 | |
Distributions payable | | | 205,184 | | | | | | 71,676 | |
Investment Manager fee payable | | | 167,200 | | | | | | 68,183 | |
Trustees’ fees payable | | | 3,480 | | | | | | 5,423 | |
Other liabilities | | | 90,796 | | | | | | 64,952 | |
Total Liabilities | | | 4,142,185 | | | | | | 1,483,774 | |
Net Assets | | $ | 186,568,377 | | | | | $ | 84,763,931 | |
NET ASSETS: | | | | | | | | | | |
Paid in capital | | $ | 189,475,645 | | | | | $ | 88,792,484 | |
Undistributed (distributions in excess of) net investment income (loss) | | | (191,916 | ) | | | | | (29,724 | ) |
Accumulated net realized gain (loss) | | | (17,905 | ) | | | | | (155,842 | ) |
Net unrealized appreciation (depreciation) | | | (2,697,447 | ) | | | | | (3,842,987 | ) |
Net Assets | | $ | 186,568,377 | | | | | $ | 84,763,931 | |
| | | |
Net Assets: | | | | | | | | | | |
Class A | | $ | 2,851,543 | | | | | $ | 2,096,392 | |
Class C | | | 149,538 | | | | | | 124,284 | |
Institutional Class | | | 183,567,296 | | | | | | 82,543,255 | |
| | | |
Shares Issued and Outstanding (no par value, unlimited shares authorized): | | | | | | | | | | |
Class A | | | 308,330 | | | | | | 229,591 | |
Class C | | | 16,166 | | | | | | 13,621 | |
Institutional Class | | | 19,104,996 | | | | | | 8,734,320 | |
| | | |
Net Asset Value and Redemption Price Per Share (Net Asset Per Share Outstanding): | | | | | | | | | | |
Class A | | $ | 9.25 | | | | | $ | 9.13 | |
Class C | | | 9.25 | | | | | | 9.13 | |
Institutional Class | | | 9.61 | | | | | | 9.45 | |
| | | |
Cost of Investments in securities | | $ | 180,626,683 | | | | | $ | 68,134,474 | |
Cost of Investments in fully funded total return swaps | | $ | — | | | | | $ | 4,265,881 | |
Cost of Foreign currency held | | $ | 1,323,540 | | | | | $ | 184,578 | |
Premiums paid for Purchased Options | | $ | — | | | | | $ | 60,630 | |
| 1 | Formerly the Ashmore Emerging Markets Local Currency Fund. |
See accompanying notes to the financial statements.
16
| | | | | | | | | | | | | | | | | | | | | | | | | | | | |
| | | Ashmore
Emerging Markets
Currency Fund1 | | | | | Ashmore
Emerging Markets
Sovereign Debt
Fund | | | | | Ashmore
Emerging Markets
Total Return Fund | | | | | Ashmore
Emerging Markets
Equity Fund | | | | | Ashmore
Emerging Markets
Small-Cap Equity Fund | |
| | | | | | | | | | | | | | | | | | | | | | | | | | | | |
| | $ | 20,996,252 | | | | | $ | 28,209,322 | | | | | $ | 640,202,469 | | | | | $ | 9,786,908 | | | | | $ | 30,552,350 | |
| | | — | | | | | | — | | | | | | 6,780,454 | | | | | | — | | | | | | — | |
| | | — | | | | | | — | | | | | | — | | | | | | — | | | | | | — | |
| | | 14,861,395 | | | | | | 880,747 | | | | | | 16,449,680 | | | | | | 73,422 | | | | | | 110,301 | |
| | | 300,000 | | | | | | — | | | | | | 4,080,000 | | | | | | — | | | | | | — | |
| | | 73,671 | | | | | | 153 | | | | | | 1,470,831 | | | | | | 461 | | | | | | 59 | |
| | | 25 | | | | | | — | | | | | | 128 | | | | | | — | | | | | | — | |
| | | — | | | | | | — | | | | | | 1,652 | | | | | | — | | | | | | — | |
| | | 464,581 | | | | | | — | | | | | | 3,377,188 | | | | | | — | | | | | | — | |
| | | 52,711 | | | | | | 168 | | | | | | 1,195,922 | | | | | | — | | | | | | 451,729 | |
| | | 16 | | | | | | 16 | | | | | | 445,695 | | | | | | 5,036 | | | | | | 12,353 | |
| | | 20,516 | | | | | | 19,060 | | | | | | 50,722 | | | | | | 23,745 | | | | | | 29,538 | |
| | | 149,211 | | | | | | 429,326 | | | | | | 10,409,986 | | | | | | 15,821 | | | | | | 12,558 | |
| | | | 1,342 | | | | | | 2,913 | | | | | | 21,255 | | | | | | 911 | | | | | | 3,023 | |
| | | | 36,919,720 | | | | | | 29,541,705 | | | | | | 684,485,982 | | | | | | 9,906,304 | | | | | | 31,171,911 | |
| | | | | | | | | | | | | | | | | | | | | | | | | | | | |
| | | — | | | | | | — | | | | | | 43,910 | | | | | | — | | | | | | — | |
| | | 655,182 | | | | | | — | | | | | | 3,679,147 | | | | | | — | | | | | | — | |
| | | 534,835 | | | | | | 142,706 | | | | | | 5,458,498 | | | | | | — | | | | | | 434,542 | |
| | | — | | | | | | 294,582 | | | | | | — | | | | | | — | | | | | | — | |
| | | — | | | | | | — | | | | | | 179,292 | | | | | | — | | | | | | — | |
| | | 3,334 | | | | | | 26,422 | | | | | | 616,546 | | | | | | — | | | | | | — | |
| | | 25,860 | | | | | | 21,916 | | | | | | 563,576 | | | | | | 9,512 | | | | | | 38,758 | |
| | | 3,072 | | | | | | 2,358 | | | | | | 30,833 | | | | | | 560 | | | | | | 1,616 | |
| | | | 49,613 | | | | | | 47,461 | | | | | | 188,725 | | | | | | 41,517 | | | | | | 50,173 | |
| | | | 1,271,896 | | | | | | 535,445 | | | | | | 10,760,527 | | | | | | 51,589 | | | | | | 525,089 | |
| | | $ | 35,647,824 | | | | | $ | 29,006,260 | | | | | $ | 673,725,455 | | | | | $ | 9,854,715 | | | | | $ | 30,646,822 | |
| | | | | | | | | | | | | | | | | | | | | | | | | | | | |
| | $ | 35,636,551 | | | | | $ | 28,741,688 | | | | | $ | 693,771,431 | | | | | $ | 10,536,953 | | | | | $ | 26,089,675 | |
| | | 454,881 | | | | | | (22,533 | ) | | | | | 2,693,049 | | | | | | (507 | ) | | | | | (2,074 | ) |
| | | (81,531 | ) | | | | | 777,271 | | | | | | 5,918,046 | | | | | | (1,028,808 | ) | | | | | 1,891,748 | |
| | | | (362,077 | ) | | | | | (490,166 | ) | | | | | (28,657,071 | ) | | | | | 347,077 | | | | | | 2,667,473 | |
| | | $ | 35,647,824 | | | | | $ | 29,006,260 | | | | | $ | 673,725,455 | | | | | $ | 9,854,715 | | | | | $ | 30,646,822 | |
| | | | | | | | | |
| | | | | | | | | | | | | | | | | | | | | | | | | | | | |
| | $ | 947 | | | | | $ | 1,507 | | | | | $ | 10,344,404 | | | | | $ | 28,485 | | | | | $ | 265,099 | |
| | | 929 | | | | | | 1,110 | | | | | | 968,867 | | | | | | 1,112 | | | | | | 11,712 | |
| | | 35,645,948 | | | | | | 29,003,643 | | | | | | 662,412,184 | | | | | | 9,825,118 | | | | | | 30,370,011 | |
| | | | | | | | | |
| | | | | | | | | | | | | | | | | | | | | | | | | | | | |
| | | 103 | | | | | | 148 | | | | | | 1,112,387 | | | | | | 2,947 | | | | | | 24,970 | |
| | | 103 | | | | | | 110 | | | | | | 104,294 | | | | | | 101 | | | | | | 1,033 | |
| | | 3,892,083 | | | | | | 2,876,486 | | | | | | 70,221,939 | | | | | | 1,060,084 | | | | | | 2,343,470 | |
| | | | | | | | | |
| | | | | | | | | | | | | | | | | | | | | | | | | | | | |
| | $ | 9.15 | | | | | $ | 10.15 | | | | | $ | 9.30 | | | | | $ | 9.66 | | | | | $ | 10.61 | |
| | | 8.98 | | | | | | 10.12 | | | | | | 9.29 | | | | | | 11.00 | | | | | | 11.33 | |
| | | | 9.16 | | | | | | 10.08 | | | | | | 9.43 | | | | | | 9.27 | | | | | | 12.96 | |
| | | | | | | | | |
| | $ | 21,129,995 | | | | | $ | 28,699,491 | | | | | $ | 666,039,210 | | | | | $ | 9,439,825 | | | | | $ | 27,886,112 | |
| | $ | — | | | | | $ | — | | | | | $ | 9,079,300 | | | | | $ | — | | | | | $ | — | |
| | $ | 73,410 | | | | | $ | 150 | | | | | $ | 1,480,749 | | | | | $ | 467 | | | | | $ | 59 | |
| | | $ | 36,378 | | | | | $ | — | | | | | $ | 189,973 | | | | | $ | — | | | | | $ | — | |
See accompanying notes to the financial statements.
17
ASHMORE FUNDS
STATEMENTS OF OPERATIONS
For the Year Ended October 31, 2013
| | | | | | | | | | |
| | | Ashmore
Emerging Markets
Corporate Debt
Fund | | | | | Ashmore
Emerging Markets
Local Currency
Bond Fund | |
INVESTMENT INCOME: | | | | | | | | | | |
Interest, net of foreign tax withholdings* | | $ | 5,354,195 | | | | | $ | 5,014,138 | |
Dividends, net of foreign tax withholdings* | | | — | | | | | | — | |
Total Income | | | 5,354,195 | | | | | | 5,014,138 | |
EXPENSES: | | | | | | | | | | |
Investment Manager fees | | | 901,481 | | | | | | 811,977 | |
Administration fees | | | 27,225 | | | | | | 29,738 | |
Custody fees | | | 19,597 | | | | | | 21,367 | |
Professional fees | | | 72,191 | | | | | | 76,878 | |
Trustees’ fees | | | 15,600 | | | | | | 21,466 | |
Offering expenses and registration fees | | | 75,906 | | | | | | 56,240 | |
Insurance fees | | | 3,873 | | | | | | 6,243 | |
Printing fees | | | 15,304 | | | | | | 15,304 | |
Distribution fees - Class A | | | 5,992 | | | | | | 3,736 | |
Distribution fees - Class C | | | 837 | | | | | | 952 | |
Other | | | 9,943 | | | | | | 2,685 | |
Total Expenses | | | 1,147,949 | | | | | | 1,046,586 | |
Less expenses reimbursed by the Investment Manager | | | (223,515 | ) | | | | | (212,015 | ) |
Net Expenses | | | 924,434 | | | | | | 834,571 | |
Net Investment income | | | 4,429,761 | | | | | | 4,179,567 | |
NET REALIZED AND UNREALIZED GAINS (LOSSES): | | | | | | | | | | |
NET REALIZED GAIN (LOSS) ON: | | | | | | | | | | |
Investments in securities | | | 131,582 | | | | | | (2,519,649 | ) |
Forward foreign currency exchange contracts | | | (368,873 | ) | | | | | 383,592 | |
Futures contracts | | | — | | | | | | (43,862 | ) |
Interest rate swap contracts | | | — | | | | | | 147,348 | |
Purchased options | | | — | | | | | | (127,684 | ) |
Foreign exchange transactions | | | (41,376 | ) | | | | | (100,405 | ) |
Net realized gain (loss) | | | (278,667 | ) | | | | | (2,260,660 | ) |
NET CHANGE IN UNREALIZED APPRECIATION (DEPRECIATION) ON: | | | | | | | | | | |
Investments in securities | | | (2,762,266 | ) | | | | | (4,091,779 | ) |
Forward foreign currency exchange contracts | | | (19,692 | ) | | | | | (173,702 | ) |
Investments in fully funded total return swaps | | | — | | | | | | (1,025,602 | ) |
Interest rate swap contracts | | | — | | | | | | (430,246 | ) |
Purchased option contracts | | | — | | | | | | (60,589 | ) |
Foreign exchange translations | | | (7,439 | ) | | | | | 7,379 | |
Change in net unrealized appreciation (depreciation) | | | (2,789,397 | ) | | | | | (5,774,539 | ) |
Net Realized and Unrealized Gains (Losses) | | | (3,068,064 | ) | | | | | (8,035,199 | ) |
Net Increase (Decrease) in Net Assets Resulting from Operations | | $ | 1,361,697 | | | | | $ | (3,855,632 | ) |
* Foreign tax withholdings | | $ | 120 | | | | | $ | 24,603 | |
| 1 | Formerly the Ashmore Emerging Markets Local Currency Fund. |
See accompanying notes to the financial statements.
18
| | | | | | | | | | | | | | | | | | | | | | | | | | | | |
| | | Ashmore
Emerging Markets
Currency Fund1 | | | | | Ashmore
Emerging Markets
Sovereign Debt
Fund | | | | | Ashmore
Emerging Markets
Total Return Fund | | | | | Ashmore
Emerging Markets
Equity Fund | | | | | Ashmore
Emerging Markets
Small-Cap Equity Fund | |
| | | | | | | | | | | | | | | | | | | | | | | | | | | | |
| | $ | 518,821 | | | | | $ | 1,930,852 | | | | | $ | 33,964,531 | | | | | $ | — | | | | | $ | — | |
| | | | — | | | | | | — | | | | | | — | | | | | | 182,504 | | | | | | 464,195 | |
| | | | 518,821 | | | | | | 1,930,852 | | | | | | 33,964,531 | | | | | | 182,504 | | | | | | 464,195 | |
| | | | | | | | | | | | | | | | | | | | | | | | | | | | |
| | | 425,513 | | | | | | 316,464 | | | | | | 5,714,293 | | | | | | 106,734 | | | | | | 407,313 | |
| | | 17,445 | | | | | | 12,238 | | | | | | 198,843 | | | | | | 3,222 | | | | | | 9,517 | |
| | | 12,515 | | | | | | 8,790 | | | | | | 142,853 | | | | | | 2,320 | | | | | | 6,788 | |
| | | 74,851 | | | | | | 73,538 | | | | | | 105,994 | | | | | | 67,670 | | | | | | 68,317 | |
| | | 12,715 | | | | | | 9,547 | | | | | | 124,714 | | | | | | 3,187 | | | | | | 7,341 | |
| | | 51,442 | | | | | | 50,718 | | | | | | 87,610 | | | | | | 46,791 | | | | | | 45,655 | |
| | | 4,900 | | | | | | 3,545 | | | | | | 31,046 | | | | | | 7,682 | | | | | | 6,738 | |
| | | 15,304 | | | | | | 15,304 | | | | | | 15,304 | | | | | | 13,185 | | | | | | 13,219 | |
| | | 2 | | | | | | 24 | | | | | | 20,978 | | | | | | 32 | | | | | | 1,777 | |
| | | 9 | | | | | | 11 | | | | | | 8,642 | | | | | | 11 | | | | | | 134 | |
| | | | 15,125 | | | | | | 6,710 | | | | | | 31,218 | | | | | | 5,169 | | | | | | 6,423 | |
| | | | 629,821 | | | | | | 496,889 | | | | | | 6,481,495 | | | | | | 256,003 | | | | | | 573,222 | |
| | | | (194,284 | ) | | | | | (173,356 | ) | | | | | (619,476 | ) | | | | | (147,340 | ) | | | | | (158,906 | ) |
| | | | 435,537 | | | | | | 323,533 | | | | | | 5,862,019 | | | | | | 108,663 | | | | | | 414,316 | |
| | | | 83,284 | | | | | | 1,607,319 | | | | | | 28,102,512 | | | | | | 73,841 | | | | | | 49,879 | |
| | | | | | | | | | | | | | | | | | | | | | | | | | | | |
| | | | | | | | | | | | | | | | | | | | | | | | | | | | |
| | | (220,920 | ) | | | | | 779,381 | | | | | | 5,395,626 | | | | | | 379,059 | | | | | | 1,962,853 | |
| | | 972,420 | | | | | | 861 | | | | | | 2,841,808 | | | | | | (6,511 | ) | | | | | (1,320 | ) |
| | | — | | | | | | — | | | | | | (75,762 | ) | | | | | — | | | | | | — | |
| | | — | | | | | | — | | | | | | 783,419 | | | | | | — | | | | | | — | |
| | | (73,606 | ) | | | | | — | | | | | | (344,510 | ) | | | | | — | | | | | | — | |
| | | | (19,918 | ) | | | | | (785 | ) | | | | | (282,431 | ) | | | | | 462 | | | | | | (32,135 | ) |
| | | | 657,976 | | | | | | 779,457 | | | | | | 8,318,150 | | | | | | 373,010 | | | | | | 1,929,398 | |
| | | | | | | | | | | | | | | | | | | | | | | | | | | | |
| | | (164,716 | ) | | | | | (3,717,677 | ) | | | | | (38,599,290 | ) | | | | | 308,650 | | | | | | 1,913,311 | |
| | | (553,880 | ) | | | | | — | | | | | | (1,284,956 | ) | | | | | — | | | | | | — | |
| | | — | | | | | | — | | | | | | (2,194,743 | ) | | | | | — | | | | | | — | |
| | | — | | | | | | — | | | | | | (858,265 | ) | | | | | — | | | | | | — | |
| | | (36,353 | ) | | | | | — | | | | | | (189,845 | ) | | | | | — | | | | | | — | |
| | | | (1,526 | ) | | | | | 3 | | | | | | (112,776 | ) | | | | | (47 | ) | | | | | 1,015 | |
| | | | (756,475 | ) | | | | | (3,717,674 | ) | | | | | (43,239,875 | ) | | | | | 308,603 | | | | | | 1,914,326 | |
| | | | (98,499 | ) | | | | | (2,938,217 | ) | | | | | (34,921,725 | ) | | | | | 681,613 | | | | | | 3,843,724 | |
| | | $ | (15,215 | ) | | | | $ | (1,330,898 | ) | | | | $ | (6,819,213 | ) | | | | $ | 755,454 | | | | | $ | 3,893,603 | |
| | | $ | 19 | | | | | $ | — | | | | | $ | 101,568 | | | | | $ | 21,222 | | | | | $ | 47,429 | |
See accompanying notes to the financial statements.
19
ASHMORE FUNDS
STATEMENTS OF CHANGES IN NET ASSETS
For the Years Ended October 31, 2013 and October 31, 2012
| | | | | | | | | | | | | | | | | | | | | | |
| | | Ashmore Emerging Markets Corporate Debt Fund | | Ashmore Emerging Markets Local Currency Bond Fund | |
| | | 2013 | | | | | 2012 | | | | | 2013 | | | | | 2012 | |
OPERATIONS: | | | | | | | | | | | | | | | | | | | | | | |
Net investment income (loss) | | $ | 4,429,761 | | | | | $ | 1,071,632 | | | | | $ | 4,179,567 | | | | | $ | 2,443,770 | |
Net realized gain (loss) | | | (278,667 | ) | | | | | 185,475 | | | | | | (2,260,660 | ) | | | | | 191,996 | |
Net change in unrealized appreciation (depreciation) | | | (2,789,397 | ) | | | | | 949,384 | | | | | | (5,774,539 | ) | | | | | 2,475,262 | |
Net Increase (Decrease) in Net Assets Resulting from Operations | | | 1,361,697 | | | | | | 2,206,491 | | | | | | (3,855,632 | ) | | | | | 5,111,028 | |
| | | | | | | |
DISTRIBUTIONS TO CLASS A SHAREHOLDERS: | | | | | | | | | | | | | | | | | | | | | | |
From net investment income | | | (129,218 | ) | | | | | (3,531 | ) | | | | | (34,973 | ) | | | | | (10,601 | ) |
From net realized gain | | | (8,260 | ) | | | | | (6 | ) | | | | | — | | | | | | — | |
Tax return of capital | | | (926 | ) | | | | | — | | | | | | (27,984 | ) | | | | | (128 | ) |
| | | | | | | | | | | | | | | | | | | | | | |
Total distributions to Class A shareholders | | | (138,404 | ) | | | | | (3,537 | ) | | | | | (62,957 | ) | | | | | (10,729 | ) |
| | | | | | | |
DISTRIBUTIONS TO CLASS C SHAREHOLDERS: | | | | | | | | | | | | | | | | | | | | | | |
From net investment income | | | (3,894 | ) | | | | | (413 | ) | | | | | (1,828 | ) | | | | | (119 | ) |
From net realized gain | | | (203 | ) | | | | | (5 | ) | | | | | — | | | | | | — | |
Tax return of capital | | | (48 | ) | | | | | — | | | | | | (1,463 | ) | | | | | (1 | ) |
| | | | | | | | | | | | | | | | | | | | | | |
Total distributions to Class C shareholders | | | (4,145 | ) | | | | | (418 | ) | | | | | (3,291 | ) | | | | | (120 | ) |
| | | | | | | |
DISTRIBUTIONS TO INSTITUTIONAL CLASS SHAREHOLDERS: | | | | | | | | | | | | | | | | | | | | | | |
From net investment income | | | (4,260,824 | ) | | | | | (1,067,910 | ) | | | | | (2,046,475 | ) | | | | | (2,484,804 | ) |
From net realized gain | | | (216,214 | ) | | | | | (66,313 | ) | | | | | — | | | | | | — | |
Tax return of capital | | | (59,552 | ) | | | | | — | | | | | | (1,618,141 | ) | | | | | (20,104 | ) |
| | | | | | | | | | | | | | | | | | | | | | |
Total distributions to Institutional Class shareholders | | | (4,536,590 | ) | | | | | (1,134,223 | ) | | | | | (3,664,616 | ) | | | | | (2,504,908 | ) |
FUND SHARE TRANSACTIONS: | | | | | | | | | | | | | | | | | | | | | | |
Net increase (decrease) in net assets resulting from Class A share transactions | | | 2,556,553 | | | | | | 475,184 | | | | | | 1,842,673 | | | | | | 114,504 | |
Net increase (decrease) in net assets resulting from Class C share transactions | | | 128,015 | | | | | | 25,392 | | | | | | 116,253 | | | | | | 17,125 | |
Net increase (decrease) in net assets resulting from Institutional Class share transactions | | | 169,037,926 | | | | | | 4,768,171 | | | | | | 17,286,849 | | | | | | 7,561,234 | |
| | | | | | | | | | | | | | | | | | | | | | |
| | | | | | | |
Net increase (decrease) in net assets resulting from Fund share transactions | | | 171,722,494 | | | | | | 5,268,747 | | | | | | 19,245,775 | | | | | | 7,692,863 | |
Total Increase (Decrease) in Net Assets | | | 168,405,052 | | | | | | 6,337,060 | | | | | | 11,659,279 | | | | | | 10,288,134 | |
NET ASSETS: | | | | | | | | | | | | | | | | | | | | | | |
Net assets at the beginning of the year | | | 18,163,325 | | | | | | 11,826,265 | | | | | | 73,104,652 | | | | | | 62,816,518 | |
Net assets at the end of the year | | $ | 186,568,377 | | | | | $ | 18,163,325 | | | | | $ | 84,763,931 | | | | | $ | 73,104,652 | |
Undistributed (Distributions in excess of) Net Investment Income (Loss) | | $ | (191,916 | ) | | | | $ | 57,372 | | | | | $ | (29,724 | ) | | | | $ | (252,856 | ) |
| 1 | Formerly the Ashmore Emerging Markets Local Currency Fund. |
See accompanying notes to the financial statements.
20
| | | | | | | | | | | | | | | | | | | | | | | | | | | | | | | | | | | | | | |
Ashmore Emerging Markets Currency Fund1 | | | Ashmore Emerging Markets
Sovereign Debt Fund | | | Ashmore Emerging Markets Total Return Fund | | | Ashmore Emerging Markets
Equity Fund | | | Ashmore Emerging Markets Small-Cap Equity Fund | |
2013 | | | 2012 | | | 2013 | | | 2012 | | | 2013 | | | 2012 | | | 2013 | | | 2012 | | | 2013 | | | 2012 | |
| | | | | | | | | | | | | | | | | | | | | | | | | | | | | | | | | | | | | | | |
| | $ 83,284 | | | $ | (344,589 | ) | | $ | 1,607,319 | | | $ | 1,507,465 | | | $ | 28,102,512 | | | $ | 9,896,216 | | | $ | 73,841 | | | $ | 93,417 | | | $ | 49,879 | | | $ | 52,680 | |
| | 657,976 | | | | 1,727,486 | | | | 779,457 | | | | 147,323 | | | | 8,318,150 | | | | 7,624,239 | | | | 373,010 | | | | (555,607 | ) | | | 1,929,398 | | | | 1,120,964 | |
| | (756,475 | ) | | | 1,003,093 | | | | (3,717,674 | ) | | | 3,028,754 | | | | (43,239,875 | ) | | | 19,131,776 | | | | 308,603 | | | | 379,690 | | | | 1,914,326 | | | | (789,890 | ) |
| (15,215 | ) | | | 2,385,990 | | | | (1,330,898 | ) | | | 4,683,542 | | | | (6,819,213 | ) | | | 36,652,231 | | | | 755,454 | | | | (82,500 | ) | | | 3,893,603 | | | | 383,754 | |
| | | | | | | | | | |
| | | | | | | | | | | | | | | | | | | | | | | | | | | | | | | | | | | | | | | |
| | — | | | | — | | | | (413 | ) | | | (263 | ) | | | (377,693 | ) | | | (34,655 | ) | | | (100 | ) | | | (9 | ) | | | (844 | ) | | | (1,149 | ) |
| | (30 | ) | | | — | | | | (43 | ) | | | — | | | | (64,653 | ) | | | — | | | | — | | | | — | | | | (13,704 | ) | | | — | |
| | — | | | | — | | | | — | | | | — | | | | — | | | | — | | | | (20 | ) | | | — | | | | — | | | | — | |
| | | | | | | | | | | | | | | | | | | | | | | | | | | | | | | | | | | | | | |
| | (30 | ) | | | — | | | | (456 | ) | | | (263 | ) | | | (442,346 | ) | | | (34,655 | ) | | | (120 | ) | | | (9 | ) | | | (14,548 | ) | | | (1,149 | ) |
| | | | | | | | | | |
| | | | | | | | | | | | | | | | | | | | | | | | | | | | | | | | | | | | | | | |
| | — | | | | — | | | | (40 | ) | | | (40 | ) | | | (32,382 | ) | | | (4,414 | ) | | | (6 | ) | | | (3 | ) | | | (40 | ) | | | (5 | ) |
| | (30 | ) | | | — | | | | (3 | ) | | | — | | | | (9,191 | ) | | | — | | | | — | | | | — | | | | (52 | ) | | | — | |
| | — | | | | — | | | | — | | | | — | | | | — | | | | — | | | | (1 | ) | | | — | | | | — | | | | — | |
| | | | | | | | | | | | | | | | | | | | | | | | | | | | | | | | | | | | | | |
| | (30 | ) | | | — | | | | (43 | ) | | | (40 | ) | | | (41,573 | ) | | | (4,414 | ) | | | (7 | ) | | | (3 | ) | | | (92 | ) | | | (5 | ) |
| | | | | | | | | | |
| | | | | | | | | | | | | | | | | | | | | | | | | | | | | | | | | | | | | | | |
| | (118,078 | ) | | | — | | | | (1,614,231 | ) | | | (1,527,944 | ) | | | (26,448,591 | ) | | | (9,890,635 | ) | | | (67,762 | ) | | | (101,630 | ) | | | (72,503 | ) | | | (53,188 | ) |
| | (1,809,756 | ) | | | — | | | | (126,668 | ) | | | — | | | | (8,496,687 | ) | | | — | | | | — | | | | — | | | | (1,116,480 | ) | | | — | |
| | — | | | | — | | | | — | | | | — | | | | — | | | | — | | | | (6,759 | ) | | | (4,929 | ) | | | — | | | | (38,656 | ) |
| | | | | | | | | | | | | | | | | | | | | | | | | | | | | | | | | | | | | | |
| | (1,927,834 | ) | | | — | | | | (1,740,899 | ) | | | (1,527,944 | ) | | | (34,945,278 | ) | | | (9,890,635 | ) | | | (74,521 | ) | | | (106,559 | ) | | | (1,188,983 | ) | | | (91,844 | ) |
| | | | | | | | | | | | | | | | | | | | | | | | | | | | | | | | | | | | | | | |
| | 32 | | | | 2 | | | | (11,850 | ) | | | 11,932 | | | | 7,948,290 | | | | 2,690,701 | | | | 25,333 | | | | 1,007 | | | | (106,768 | ) | | | 233,034 | |
| | 30 | | | | 2 | | | | 44 | | | | 46 | | | | 510,771 | | | | 518,650 | | | | 8 | | | | 1,005 | | | | 10,478 | | | | 1,032 | |
| (30,769,274 | ) | | | 42,329,736 | | | | (2,949,787 | ) | | | 1,338,057 | | | | 189,754,435 | | | | 385,372,014 | | | | 404,751 | | | | 82,731 | | | | 14,455,333 | | | | 1,496,566 | |
| | | | | | | | | | | | | | | | | | | | | | | | | | | | | | | | | | | | | | |
| | | | | | | | | | |
| | (30,769,212 | ) | | | 42,329,740 | | | | (2,961,593 | ) | | | 1,350,035 | | | | 198,213,496 | | | | 388,581,365 | | | | 430,092 | | | | 84,743 | | | | 14,359,043 | | | | 1,730,632 | |
| | (32,712,321 | ) | | | 44,715,730 | | | | (6,033,889 | ) | | | 4,505,330 | | | | 155,965,086 | | | | 415,303,892 | | | | 1,110,898 | | | | (104,328 | ) | | | 17,049,023 | | | | 2,021,388 | |
| | | | | | | | | | | | | | | | | | | | | | | | | | | | | | | | | | | | | | | |
| | 68,360,145 | | | | 23,644,415 | | | | 35,040,149 | | | | 30,534,819 | | | | 517,760,369 | | | | 102,456,477 | | | | 8,743,817 | | | | 8,848,145 | | | | 13,597,799 | | | | 11,576,411 | |
| | $ 35,647,824 | | | $ | 68,360,145 | | | $ | 29,006,260 | | | $ | 35,040,149 | | | $ | 673,725,455 | | | $ | 517,760,369 | | | $ | 9,854,715 | | | $ | 8,743,817 | | | $ | 30,646,822 | | | $ | 13,597,799 | |
| | $ 454,881 | | | $ | 1,567,268 | | | $ | (22,533 | ) | | $ | (15,244 | ) | | $ | 2,693,049 | | | $ | 5,252,821 | | | $ | (507 | ) | | $ | (431 | ) | | $ | (2,074 | ) | | $ | — | |
See accompanying notes to the financial statements.
21
ASHMORE FUNDS
FINANCIAL HIGHLIGHTS
For the Periods Ended October 31,
| | | | | | | | | | | | | | | | | | | | | | | | |
Ashmore Emerging Markets Corporate Debt Fund | | | | | | | | | | | | | | | | | | | | | | | | |
| | | | | | |
| | | 2013 | | | Class A
2012 | | | 20111 | | | 2013 | | | Class C
2012 | | | 20111 | |
Net asset value at beginning of period | | | $9.69 | | | | $9.09 | | | | $10.00 | | | | $9.70 | | | | $9.09 | | | | $10.00 | |
| | | | | | |
Income (loss) from investment operations: | | | | | | | | | | | | | | | | | | | | | | | | |
Net investment income (loss)2 | | | 0.51 | | | | 0.67 | | | | 0.32 | | | | 0.44 | | | | 0.60 | | | | 0.28 | |
Net realized and unrealized gain (loss) | | | (0.35) | | | | 0.67 | | | | (0.86) | | | | (0.36) | | | | 0.68 | | | | (0.86) | |
| | | | | | | | | | | | | | | | | | | | | | | | |
Total from investment operations | | | 0.16 | | | | 1.34 | | | | (0.54) | | | | 0.08 | | | | 1.28 | | | | (0.58) | |
| | | | | | |
Less distributions: | | | | | | | | | | | | | | | | | | | | | | | | |
| | | | | | |
From net investment income | | | (0.52) | | | | (0.69) | | | | (0.37) | | | | (0.45) | | | | (0.62) | | | | (0.33) | |
From net realized gain | | | (0.07) | | | | (0.05) | | | | — | | | | (0.07) | | | | (0.05) | | | | — | |
Tax return of capital | | | (0.01) | | | | — | | | | — | | | | (0.01) | | | | — | | | | — | |
| | | | | | | | | | | | | | | | | | | | | | | | |
| | | | | | |
Total distributions | | | (0.60) | | | | (0.74) | | | | (0.37) | | | | (0.53) | | | | (0.67) | | | | (0.33) | |
| | | | | | | | | | | | | | | | | | | | | | | | |
Net asset value at end of period | | | $9.25 | | | | $9.69 | | | | $9.09 | | | | $9.25 | | | | $9.70 | | | | $9.09 | |
| | | | | | | | | | | | | | | | | | | | | | | | |
| | | | | | |
Total return3 | | | 1.63% | | | | 15.54% | | | | (5.44%) | | | | 0.80% | | | | 14.78% | | | | (5.78%) | |
| | | | | | |
Portfolio turnover rate4 | | | 49% | | | | 50% | | | | 22% | | | | 49% | | | | 50% | | | | 22% | |
| | | | | | |
Net assets, end of period (in thousands) | | | $2,852 | | | | $485 | | | | $1 | | | | $150 | | | | $27 | | | | $1 | |
| | | | | | |
Ratios to average net assets:5 | | | | | | | | | | | | | | | | | | | | | | | | |
Total expenses to average net assets: | | | | | | | | | | | | | | | | | | | | | | | | |
Total expenses before reimbursements | | | 1.71% | | | | 2.89% | | | | 4.36% | | | | 2.46% | | | | 3.60% | | | | 5.12% | |
Total expenses after reimbursements | | | 1.45% | | | | 1.45% | | | | 1.45% | | | | 2.20% | | | | 2.20% | | | | 2.20% | |
| | | | | | |
Net investment income to average net assets: | | | | | | | | | | | | | | | | | | | | | | | | |
Net investment income before reimbursements | | | 5.15% | | | | 5.19% | | | | 4.35% | | | | 4.42% | | | | 4.73% | | | | 3.59% | |
Net investment income after reimbursements | | | 5.41% | | | | 6.63% | | | | 7.26% | | | | 4.68% | | | | 6.13% | | | | 6.51% | |
See accompanying notes to the financial statements.
22
ASHMORE FUNDS
FINANCIAL HIGHLIGHTS
For the Periods Ended October 31,
| | | | | | | | | | | | |
Ashmore Emerging Markets Corporate Debt Fund | | | | | | | | | | | | |
| |
| | | Institutional Class | |
| | | 2013 | | | 2012 | | | 20116 | |
| | | |
Net asset value at beginning of period | | | $10.07 | | | | $9.43 | | | | $10.00 | |
| | | |
Income (loss) from investment operations: | | | | | | | | | | | | |
Net investment income (loss)2 | | | 0.55 | | | | 0.73 | | | | 0.63 | |
Net realized and unrealized gain (loss) | | | (0.36) | | | | 0.70 | | | | (0.60) | |
| | | | | | | | | | | | |
Total from investment operations | | | 0.19 | | | | 1.43 | | | | 0.03 | |
| | | |
Less distributions: | | | | | | | | | | | | |
| | | |
From net investment income | | | (0.57) | | | | (0.74) | | | | (0.60) | |
From net realized gain | | | (0.07) | | | | (0.05) | | | | — | |
Tax return of capital | | | (0.01) | | | | — | | | | — | |
| | | | | | | | | | | | |
| | | |
Total distributions | | | (0.65) | | | | (0.79) | | | | (0.60) | |
| | | | | | | | | | | | |
Net asset value at end of period | | | $9.61 | | | | $10.07 | | | | $9.43 | |
| | | | | | | | | | | | |
| | | |
Total return3 | | | 1.91% | | | | 15.97% | | | | 0.27% | |
| | | |
Portfolio turnover rate4 | | | 49% | | | | 50% | | | | 22% | |
| | | |
Net assets, end of period (in thousands) | | | $183,567 | | | | $17,651 | | | | $11,824 | |
| | | |
Ratios to average net assets:5 | | | | | | | | | | | | |
Total expenses to average net assets: | | | | | | | | | | | | |
Total expenses before reimbursements | | | 1.46% | | | | 2.66% | | | | 3.78% | |
Total expenses after reimbursements | | | 1.17% | | | | 1.17% | | | | 1.17% | |
| | | |
Net investment income to average net assets: | | | | | | | | | | | | |
Net investment income before reimbursements | | | 5.37% | | | | 6.16% | | | | 4.60% | |
Net investment income after reimbursements | | | 5.66% | | | | 7.65% | | | | 7.21% | |
| 1 | Class A and Class C commenced investment operations on May 12, 2011. |
| 2 | Per share amounts are based on average number of shares outstanding during the period. |
| 3 | Assumes investment at net asset value at the beginning of the period, reinvestment of all distributions at net asset value on distribution date, and a complete redemption of the investment at net asset value at the end of the period excluding the impact of sales charges. Total return is not annualized for periods less than one year. |
| 4 | The portfolio turnover rate is calculated by dividing the lesser of cost of purchases or proceeds from sales of long term portfolio securities by the monthly average of the value of the long term portfolio securities. Portfolio turnover is not annualized for periods less than one year. |
| 5 | Annualized for periods less than one year. |
| 6 | The Institutional Class commenced investment operations on December 8, 2010. |
See accompanying notes to the financial statements.
23
ASHMORE FUNDS
FINANCIAL HIGHLIGHTS
For the Periods Ended October 31,
| | | | | | | | | | | | | | | | | | | | | | | | |
Ashmore Emerging Markets Local Currency Bond Fund | | | | | | | | | | | | | | | | | | | | | | | | |
| | |
| | | Class A | | | Class C | |
| | | 2013 | | | 2012 | | | 20111 | | | 2013 | | | 2012 | | | 20111 | |
Net asset value at beginning of period | | | $9.83 | | | | $9.43 | | | | $10.00 | | | | $9.83 | | | | $9.43 | | | | $10.00 | |
| | | | | | |
Income (loss) from investment operations: | | | | | | | | | | | | | | | | | | | | | | | | |
Net investment income (loss)2 | | | 0.44 | | | | 0.43 | | | | 0.13 | | | | 0.38 | | | | 0.22 | | | | 0.13 | |
Net realized and unrealized gain (loss) | | | (0.74) | | | | 0.31 | | | | (0.48) | | | | (0.75) | | | | 0.45 | | | | (0.51) | |
| | | | | | | | | | | | | | | | | | | | | | | | |
Total from investment operations | | | (0.30) | | | | 0.74 | | | | (0.35) | | | | (0.37) | | | | 0.67 | | | | (0.38) | |
| | | | | | |
Less distributions: | | | | | | | | | | | | | | | | | | | | | | | | |
| | | | | | |
From net investment income | | | (0.22) | | | | (0.34) | | | | (0.13) | | | | (0.18) | | | | (0.27) | | | | (0.11) | |
From net realized gain | | | (0.01) | | | | — | | | | — | | | | (0.01) | | | | — | | | | — | |
Tax return of capital | | | (0.17) | | | | —3 | | | | (0.09) | | | | (0.14) | | | | —3 | | | | (0.08) | |
| | | | | | | | | | | | | | | | | | | | | | | | |
| | | | | | |
Total distributions | | | (0.40) | | | | (0.34) | | | | (0.22) | | | | (0.33) | | | | (0.27) | | | | (0.19) | |
| | | | | | | | | | | | | | | | | | | | | | | | |
Net asset value at end of period | | | $9.13 | | | | $9.83 | | | | $9.43 | | | | $9.13 | | | | $9.83 | | | | $9.43 | |
| | | | | | | | | | | | | | | | | | | | | | | | |
| | | | | | |
Total return4 | | | (3.21%) | | | | 8.02% | | | | (3.60%) | | | | (3.92%) | | | | 7.33% | | | | (4.01%) | |
| | | | | | |
Portfolio turnover rate5 | | | 112% | | | | 101% | | | | 31% | | | | 112% | | | | 101% | | | | 31% | |
| | | | | | |
Net assets, end of period (in thousands) | | | $2,096 | | | | $413 | | | | $286 | | | | $124 | | | | $19 | | | | $1 | |
| | | | | | |
Ratios to average net assets:6 | | | | | | | | | | | | | | | | | | | | | | | | |
Total expenses to average net assets: | | | | | | | | | | | | | | | | | | | | | | | | |
Total expenses before reimbursements | | | 1.47% | | | | 1.64% | | | | 1.99% | | | | 2.22% | | | | 2.47% | | | | 2.87% | |
Total expenses after reimbursements | | | 1.25% | | | | 1.25% | | | | 1.25% | | | | 2.00% | | | | 2.00% | | | | 2.00% | |
| | | | | | |
Net investment income to average net assets: | | | | | | | | | | | | | | | | | | | | | | | | |
Net investment income before reimbursements | | | 4.38% | | | | 3.03% | | | | 2.34% | | | | 3.77% | | | | 1.87% | | | | 1.87% | |
Net investment income after reimbursements | | | 4.60% | | | | 3.42% | | | | 3.08% | | | | 3.99% | | | | 2.34% | | | | 2.74% | |
See accompanying notes to the financial statements.
24
ASHMORE FUNDS
FINANCIAL HIGHLIGHTS
For the Periods Ended October 31,
| | | | | | | | | | | | |
Ashmore Emerging Markets Local Currency Bond Fund | | | | | | | | | | | | |
| |
| | | Institutional Class | |
| | | 2013 | | | 2012 | | | 20117 | |
Net asset value at beginning of period | | | $10.18 | | | | $9.76 | | | | $10.00 | |
| | | |
Income (loss) from investment operations: | | | | | | | | | | | | |
Net investment income (loss)2 | | | 0.49 | | | | 0.37 | | | | 0.29 | |
Net realized and unrealized gain (loss) | | | (0.78) | | | | 0.42 | | | | 0.06 | |
| | | | | | | | | | | | |
Total from investment operations | | | (0.29) | | | | 0.79 | | | | 0.35 | |
| | | |
Less distributions: | | | | | | | | | | | | |
| | | |
From net investment income | | | (0.24) | | | | (0.37) | | | | (0.35) | |
From net realized gain | | | (0.01) | | | | — | | | | — | |
Tax return of capital | | | (0.19) | | | | —3 | | | | (0.24) | |
| | | | | | | | | | | | |
| | | |
Total distributions | | | (0.44) | | | | (0.37) | | | | (0.59) | |
| | | | | | | | | | | | |
Net asset value at end of period | | | $9.45 | | | | $10.18 | | | | $9.76 | |
| | | | | | | | | | | | |
| | | |
Total return4 | | | (3.02%) | | | | 8.39% | | | | 3.35% | |
| | | |
Portfolio turnover rate5 | | | 112% | | | | 101% | | | | 31% | |
| | | |
Net assets, end of period (in thousands) | | | $82,543 | | | | $72,673 | | | | $62,530 | |
| | | |
Ratios to average net assets:6 | | | | | | | | | | | | |
Total expenses to average net assets: | | | | | | | | | | | | |
Total expenses before reimbursements | | | 1.22% | | | | 1.39% | | | | 1.70% | |
Total expenses after reimbursements | | | 0.97% | | | | 0.97% | | | | 0.97% | |
| | | |
Net investment income to average net assets: | | | | | | | | | | | | |
Net investment income before reimbursements | | | 4.64% | | | | 3.31% | | | | 2.55% | |
Net investment income after reimbursements | | | 4.89% | | | | 3.73% | | | | 3.28% | |
| 1 | Class A and Class C commenced investment operations on May 12, 2011. |
| 2 | Per share amounts are based on average number of shares outstanding during the period. |
| 3 | Amount is less than $0.005 per share. |
| 4 | Assumes investment at net asset value at the beginning of the period, reinvestment of all distributions at net asset value on distribution date, and a complete redemption of the investment at net asset value at the end of the period excluding the impact of sales charges. Total return is not annualized for periods less than one year. |
| 5 | The portfolio turnover rate is calculated by dividing the lesser of cost of purchases or proceeds from sales of long term portfolio securities, including fully funded total return swaps, by the monthly average of the value of the long term portfolio securities. Portfolio turnover is not annualized for periods less than one year. |
| 6 | Annualized for periods less than one year. |
| 7 | The Institutional Class commenced investment operations on December 8, 2010. |
See accompanying notes to the financial statements.
25
ASHMORE FUNDS
FINANCIAL HIGHLIGHTS
For the Periods Ended October 31,
| | | | | | | | | | | | | | | | | | | | | | | | |
Ashmore Emerging Markets Currency Fund1 | | | | | | | | | | | | | | | | | | | | | | | | |
| | |
| | | Class A | | | Class C | |
| | | 2013 | | | 2012 | | | 20112 | | | 2013 | | | 2012 | | | 20112 | |
Net asset value at beginning of period | | | $9.51 | | | | $9.38 | | | | $10.00 | | | | $9.41 | | | | $9.35 | | | | $10.00 | |
| | | | | | |
Income (loss) from investment operations: | | | | | | | | | | | | | | | | | | | | | | | | |
Net investment gain (loss)3 | | | (0.01) | | | | (0.09) | | | | (0.03) | | | | (0.08) | | | | (0.17) | | | | (0.06) | |
Net realized and unrealized gain (loss) | | | (0.05) | | | | 0.22 | | | | (0.57) | | | | (0.05) | | | | 0.23 | | | | (0.58) | |
| | | | | | | | | | | | | | | | | | | | | | | | |
Total from investment operations | | | (0.06) | | | | 0.13 | | | | (0.60) | | | | (0.13) | | | | 0.06 | | | | (0.64) | |
| | | | | | |
Less distributions: | | | | | | | | | | | | | | | | | | | | | | | | |
| | | | | | |
From net investment income | | | — | | | | — | | | | — | | | | — | | | | — | | | | — | |
From net realized gain | | | (0.30) | | | | — | | | | (0.02) | | | | (0.30) | | | | — | | | | (0.01) | |
| | | | | | | | | | | | | | | | | | | | | | | | |
| | | | | | |
Total distributions | | | (0.30) | | | | — | | | | (0.02) | | | | (0.30) | | | | — | | | | (0.01) | |
| | | | | | | | | | | | | | | | | | | | | | | | |
Net asset value at end of period | | | $9.15 | | | | $9.51 | | | | $9.38 | | | | $8.98 | | | | $9.41 | | | | $9.35 | |
| | | | | | | | | | | | | | | | | | | | | | | | |
| | | | | | |
Total return4 | | | (0.65%) | | | | 1.50% | | | | (6.12%) | | | | (1.43%) | | | | 0.77% | | | | (6.46%) | |
| | | | | | |
Portfolio turnover rate5 | | | 198% | | | | 157% | | | | 37% | | | | 198% | | | | 157% | | | | 37% | |
| | | | | | |
Net assets, end of period (in thousands) | | | $1 | | | | $1 | | | | $1 | | | | $1 | | | | $1 | | | | $1 | |
| | | | | | |
Ratios to average net assets:6 | | | | | | | | | | | | | | | | | | | | | | | | |
Total expenses to average net assets: | | | | | | | | | | | | | | | | | | | | | | | | |
Total expenses before reimbursements | | | 1.51% | | | | 1.46% | | | | 2.17% | | | | 2.26% | | | | 2.22% | | | | 2.90% | |
Total expenses after reimbursements | | | 1.15% | | | | 1.15% | | | | 1.15% | | | | 1.90% | | | | 1.90% | | | | 1.90% | |
| | | | | | |
Net investment loss to average net assets: | | | | | | | | | | | | | | | | | | | | | | | | |
Net investment loss before reimbursements | | | (0.56%) | | | | (1.31%) | | | | (1.60%) | | | | (1.30%) | | | | (2.07%) | | | | (2.33%) | |
Net investment loss after reimbursements | | | (0.20%) | | | | (1.00%) | | | | (0.58%) | | | | (0.94%) | | | | (1.75%) | | | | (1.33%) | |
See accompanying notes to the financial statements.
26
ASHMORE FUNDS
FINANCIAL HIGHLIGHTS
For the Periods Ended October 31,
| | | | | | | | | | | | |
Ashmore Emerging Markets Currency Fund1 | | | | | | | | | | | | |
| |
| | | Institutional Class | |
| | | 2013 | | | 2012 | | | 20117 | |
Net asset value at beginning of period | | | $9.51 | | | | $9.35 | | | | $10.00 | |
| | | |
Income (loss) from investment operations: | | | | | | | | | | | | |
Net investment income (loss)3 | | | 0.02 | | | | (0.10) | | | | (0.04) | |
Net realized and unrealized gain (loss) | | | (0.05) | | | | 0.26 | | | | 0.06 | |
| | | | | | | | | | | | |
Total from investment operations | | | (0.03) | | | | 0.16 | | | | 0.02 | |
| | | |
Less distributions: | | | | | | | | | | | | |
| | | |
From net investment income | | | (0.02) | | | | — | | | | — | |
From net realized gain | | | (0.30) | | | | — | | | | (0.67) | |
| | | | | | | | | | | | |
| | | |
Total distributions | | | (0.32) | | | | — | | | | (0.67) | |
| | | | | | | | | | | | |
Net asset value at end of period | | | $9.16 | | | | $9.51 | | | | $9.35 | |
| | | | | | | | | | | | |
| | | |
Total return4 | | | (0.33%) | | | | 1.71% | | | | (0.12%) | |
| | | |
Portfolio turnover rate5 | | | 198% | | | | 157% | | | | 37% | |
| | | |
Net assets, end of period (in thousands) | | | $35,646 | | | | $68,358 | | | | $23,643 | |
| | | |
Ratios to average net assets:6 | | | | | | | | | | | | |
Total expenses to average net assets: | | | | | | | | | | | | |
Total expenses before reimbursements | | | 1.26% | | | | 1.32% | | | | 2.03% | |
Total expenses after reimbursements | | | 0.87% | | | | 0.87% | | | | 0.87% | |
| | | |
Net investment income (loss) to average net assets: | | | | | | | | | | | | |
Net investment loss before reimbursements | | | (0.22%) | | | | (1.05%) | | | | (1.58%) | |
Net investment income (loss) after reimbursements | | | 0.17% | | | | (0.60%) | | | | (0.42%) | |
| 1 | Formerly the Ashmore Emerging Markets Local Currency Fund. |
| 2 | Class A and Class C commenced investment operations on May 12, 2011. |
| 3 | Per share amounts are based on average number of shares outstanding during the period. |
| 4 | Assumes investment at net asset value at the beginning of the period, reinvestment of all distributions at net asset value on distribution date, and a complete redemption of the investment at net asset value at the end of the period excluding the impact of sales charges. Total return is not annualized for periods less than one year. |
| 5 | The portfolio turnover rate is calculated by dividing the lesser of cost of purchases or proceeds from sales of long term portfolio securities by the monthly average of the value of the long term portfolio securities. Portfolio turnover is not annualized for periods less than one year. |
| 6 | Annualized for periods less than one year. |
| 7 | The Institutional Class commenced investment operations on December 8, 2010. |
See accompanying notes to the financial statements.
27
ASHMORE FUNDS
FINANCIAL HIGHLIGHTS
For the Periods Ended October 31,
| | | | | | | | | | | | | | | | | | | | | | | | |
Ashmore Emerging Markets Sovereign Debt Fund | | | | | | | | | | | | | | | | | | | | | | | | |
| | | | | | |
| | | | | | Class A | | | | | | | | | Class C | | | | |
| | | 2013 | | | 2012 | | | 20111 | | | 2013 | | | 2012 | | | 20111 | |
Net asset value at beginning of period | | | $11.06 | | | | $10.04 | | | | $10.00 | | | | $11.04 | | | | $10.04 | | | | $10.00 | |
| | | | | | |
Income (loss) from investment operations: | | | | | | | | | | | | | | | | | | | | | | | | |
Net investment income (loss)2 | | | 0.46 | | | | 0.44 | | | | 0.19 | | | | 0.38 | | | | 0.37 | | | | 0.15 | |
Net realized and unrealized gain (loss) | | | (0.88) | | | | 1.03 | | | | 0.04 | | | | (0.89) | | | | 1.01 | | | | 0.05 | |
| | | | | | | | | | | | | | | | | | | | | | | | |
Total from investment operations | | | (0.42) | | | | 1.47 | | | | 0.23 | | | | (0.51) | | | | 1.38 | | | | 0.20 | |
| | | | | | |
Less distributions: | | | | | | | | | | | | | | | | | | | | | | | | |
| | | | | | |
From net investment income | | | (0.46) | | | | (0.45) | | | | (0.19) | | | | (0.38) | | | | (0.38) | | | | (0.16) | |
From net realized gain | | | (0.03) | | | | — | | | | — | | | | (0.03) | | | | — | | | | — | |
| | | | | | | | | | | | | | | | | | | | | | | | |
| | | | | | |
Total distributions | | | (0.49) | | | | (0.45) | | | | (0.19) | | | | (0.41) | | | | (0.38) | | | | (0.16) | |
| | | | | | | | | | | | | | | | | | | | | | | | |
Net asset value at end of period | | | $10.15 | | | | $11.06 | | | | $10.04 | | | | $10.12 | | | | $11.04 | | | | $10.04 | |
| | | | | | | | | | | | | | | | | | | | | | | | |
| | | | | | |
Total return3 | | | (3.86%) | | | | 15.24% | | | | 2.26% | | | | (4.64%) | | | | 14.28% | | | | 1.90% | |
| | | | | | |
Portfolio turnover rate4 | | | 81% | | | | 30% | | | | 9% | | | | 81% | | | | 30% | | | | 9% | |
| | | | | | |
Net assets, end of period (in thousands) | | | $2 | | | | $14 | | | | $1 | | | | $1 | | | | $1 | | | | $1 | |
| | | | | | |
Ratios to average net assets:5 | | | | | | | | | | | | | | | | | | | | | | | | |
Total expenses to average net assets: | | | | | | | | | | | | | | | | | | | | | | | | |
Total expenses before reimbursements | | | 1.66% | | | | 1.93% | | | | 4.61% | | | | 2.41% | | | | 2.73% | | | | 5.35% | |
Total expenses after reimbursements | | | 1.20% | | | | 1.20% | | | | 1.20% | | | | 1.95% | | | | 1.95% | | | | 1.95% | |
| | | | | | |
Net investment income (loss) to average net assets: | | | | | | | | | | | | | | | | | | | | | | | | |
Net investment income (loss) before reimbursements | | | 3.75% | | | | 3.62% | | | | 0.57% | | | | 3.16% | | | | 2.86% | | | | (0.18%) | |
Net investment income after reimbursements | | | 4.21% | | | | 4.35% | | | | 3.98% | | | | 3.62% | | | | 3.64% | | | | 3.22% | |
See accompanying notes to the financial statements.
28
ASHMORE FUNDS
FINANCIAL HIGHLIGHTS
For the Periods Ended October 31,
| | | | | | | | | | | | |
Ashmore Emerging Markets Sovereign Debt Fund | | | | | | | | | | | | |
| |
| | | Institutional Class | |
| | | 2013 | | | 2012 | | | 20116 | |
Net asset value at beginning of period | | | $10.99 | | | | $9.99 | | | | $10.00 | |
| | | |
Income (loss) from investment operations: | | | | | | | | | | | | |
Net investment income (loss)2 | | | 0.48 | | | | 0.48 | | | | 0.40 | |
Net realized and unrealized gain (loss) | | | (0.87) | | | | 1.01 | | | | — | |
| | | | | | | | | | | | |
Total from investment operations | | | (0.39) | | | | 1.49 | | | | 0.40 | |
| | | |
Less distributions | | | | | | | | | | | | |
| | | |
From net investment income | | | (0.49) | | | | (0.49) | | | | (0.41) | |
From net realized gain | | | (0.03) | | | | — | | | | — | |
| | | | | | | | | | | | |
| | | |
Total distributions | | | (0.52) | | | | (0.49) | | | | (0.41) | |
| | | | | | | | | | | | |
Net asset value at end of period | | | $10.08 | | | | $10.99 | | | | $9.99 | |
| | | | | | | | | | | | |
| | | |
Total return3 | | | (3.64%) | | | | 15.32% | | | | 4.15% | |
| | | |
Portfolio turnover rate4 | | | 81% | | | | 30% | | | | 9% | |
| | | |
Net assets, end of period (in thousands) | | | $29,004 | | | | $35,025 | | | | $30,533 | |
| | | |
Ratios to average net assets:5 | | | | | | | | | | | | |
Total expenses to average net assets: | | | | | | | | | | | | |
Total expenses before reimbursements | | | 1.41% | | | | 1.63% | | | | 3.63% | |
Total expenses after reimbursements | | | 0.92% | | | | 0.92% | | | | 0.92% | |
| | | |
Net investment income to average net assets: | | | | | | | | | | | | |
Net investment income before reimbursements | | | 4.08% | | | | 3.95% | | | | 1.74% | |
Net investment income after reimbursements | | | 4.57% | | | | 4.66% | | | | 4.45% | |
| 1 | Class A and Class C commenced investment operations on May 12, 2011. |
| 2 | Per share amounts are based on average number of shares outstanding during the period. |
| 3 | Assumes investment at net asset value at the beginning of the period, reinvestment of all distributions at net asset value on distribution date, and a complete redemption of the investment at net asset value at the end of the period excluding the impact of sales charges. Total return is not annualized for periods less than one year. |
| 4 | The portfolio turnover rate is calculated by dividing the lesser of cost of purchases or proceeds from sales of long term portfolio securities by the monthly average of the value of the long term portfolio securities. Portfolio turnover is not annualized for periods less than one year. |
| 5 | Annualized for periods less than one year. |
| 6 | The Institutional Class commenced investment operations on December 8, 2010. |
See accompanying notes to the financial statements.
29
ASHMORE FUNDS
FINANCIAL HIGHLIGHTS
For the Periods Ended October 31,
| | | | | | | | | | | | | | | | | | | | | | | | |
Ashmore Emerging Markets Total Return Fund | | | | | | | | | | | | | | | | | | | | | | | | |
| | | | | | |
| | | | | | Class A | | | | | | | | | Class C | | | | |
| | | 2013 | | | 2012 | | | 20111 | | | 2013 | | | 2012 | | | 20111 | |
Net asset value at beginning of period | | | $10.05 | | | | $9.37 | | | | $10.00 | | | | $10.05 | | | | $9.36 | | | | $10.00 | |
| | | | | | |
Income (loss) from investment operations: | | | | | | | | | | | | | | | | | | | | | | | | |
Net investment income (loss) | | | 0.41 | | | | 0.432 | | | | 0.222 | | | | 0.33 | | | | 0.392 | | | | 0.192 | |
Net realized and unrealized gain (loss) | | | (0.57) | | | | 0.68 | | | | (0.66) | | | | (0.57) | | | | 0.66 | | | | (0.66) | |
| | | | | | | | | | | | | | | | | | | | | | | | |
Total from investment operations | | | (0.16) | | | | 1.11 | | | | (0.44) | | | | (0.24) | | | | 1.05 | | | | (0.47) | |
| | | | | | |
Less distributions: | | | | | | | | | | | | | | | | | | | | | | | | |
| | | | | | |
From net investment income | | | (0.43) | | | | (0.43) | | | | (0.09) | | | | (0.36) | | | | (0.36) | | | | (0.08) | |
From net realized gain | | | (0.16) | | | | — | | | | — | | | | (0.16) | | | | — | | | | — | |
Tax return of capital | | | — | | | | — | | | | (0.10) | | | | — | | | | — | | | | (0.09) | |
| | | | | | | | | | | | | | | | | | | | | | | | |
| | | | | | |
Total distributions | | | (0.59) | | | | (0.43) | | | | (0.19) | | | | (0.52) | | | | (0.36) | | | | (0.17) | |
| | | | | | | | | | | | | | | | | | | | | | | | |
Net asset value at end of period | | | $9.30 | | | | $10.05 | | | | $9.37 | | | | $9.29 | | | | $10.05 | | | | $9.36 | |
| | | | | | | | | | | | | | | | | | | | | | | | |
| | | | | | |
Total return3 | | | (1.70%) | | | | 12.20% | | | | (4.40%) | | | | (2.44%) | | | | 11.42% | | | | (4.79%) | |
| | | | | | |
Portfolio turnover rate4 | | | 85% | | | | 83% | | | | 39% | | | | 85% | | | | 83% | | | | 39% | |
| | | | | | |
Net assets, end of period (in thousands) | | | $10,344 | | | | $3,263 | | | | $509 | | | | $969 | | | | $541 | | | | $1 | |
| | | | | | |
Ratios to average net assets:5 | | | | | | | | | | | | | | | | | | | | | | | | |
Total expenses to average net assets: | | | | | | | | | | | | | | | | | | | | | | | | |
Total expenses before reimbursements | | | 1.38% | | | | 1.48% | | | | 1.75% | | | | 2.13% | | | | 2.21% | | | | 2.82% | |
Total expenses after reimbursements | | | 1.30% | | | | 1.30% | | | | 1.30% | | | | 2.05% | | | | 2.05% | | | | 2.05% | |
| | | | | | |
Net investment income to average net assets: | | | | | | | | | | | | | | | | | | | | | | | | |
Net investment income before reimbursements | | | 4.55% | | | | 3.99% | | | | 4.21% | | | | 3.83% | | | | 2.62% | | | | 3.32% | |
Net investment income after reimbursements | | | 4.63% | | | | 4.17% | | | | 4.66% | | | | 3.91% | | | | 2.78% | | | | 4.09% | |
See accompanying notes to the financial statements.
30
ASHMORE FUNDS
FINANCIAL HIGHLIGHTS
For the Periods Ended October 31,
| | | | | | | | | | | | |
Ashmore Emerging Markets Total Return Fund | | | | | | | | | | | | |
| |
| | | Institutional Class | |
| | | 2013 | | | 2012 | | | 20116 | |
Net asset value at beginning of period | | | $ 10.20 | | | | $ 9.50 | | | | $ 10.00 | |
| | | |
Income (loss) from investment operations: | | | | | | | | | | | | |
Net investment income (loss) | | | 0.45 | | | | 0.44 | 2 | | | 0.46 | 2 |
Net realized and unrealized gain (loss) | | | (0.60) | | | | 0.72 | | | | (0.34) | |
| | | | | | | | | | | | |
Total from investment operations | | | (0.15) | | | | 1.16 | | | | 0.12 | |
| | | |
Less distributions: | | | | | | | | | | | | |
| | | |
From net investment income | | | (0.46) | | | | (0.46) | | | | (0.29) | |
From net realized gain | | | (0.16) | | | | — | | | | — | |
Tax return of capital | | | — | | | | — | | | | (0.33) | |
| | | | | | | | | | | | |
| | | |
Total distributions | | | (0.62) | | | | (0.46) | | | | (0.62) | |
| | | | | | | | | | | | |
Net asset value at end of period | | | $ 9.43 | | | | $ 10.20 | | | | $ 9.50 | |
| | | | | | | | | | | | |
| | | | | | | | | | | | |
| | | |
Total return3 | | | (1.48%) | | | | 12.50% | | | | 1.11% | |
| | | |
Portfolio turnover rate4 | | | 85% | | | | 83% | | | | 39% | |
| | | |
Net assets, end of period (in thousands) | | | $662,412 | | | | $513,956 | | | | $101,947 | |
| | | |
Ratios to average net assets:5 | | | | | | | | | | | | |
Total expenses to average net assets: | | | | | | | | | | | | |
Total expenses before reimbursements | | | 1.13% | | | | 1.22% | | | | 1.63% | |
Total expenses after reimbursements | | | 1.02% | | | | 1.02% | | | | 1.02% | |
| | | |
Net investment income to average net assets: | | | | | | | | | | | | |
Net investment income before reimbursements | | | 4.81% | | | | 4.11% | | | | 4.63% | |
Net investment income after reimbursements | | | 4.92% | | | | 4.31% | | | | 5.24% | |
| 1 | Class A and Class C commenced investment operations on May 12, 2011. |
| 2 | Per share amounts are based on average number of shares outstanding during the period. |
| 3 | Assumes investment at net asset value at the beginning of the period, reinvestment of all distributions at net asset value on distribution date, and a complete redemption of the investment at net asset value at the end of the period excluding the impact of sales charges. Total return is not annualized for periods less than one year. |
| 4 | The portfolio turnover rate is calculated by dividing the lesser of cost of purchases or proceeds from sales of long term portfolio securities, including fully funded total return swaps, by the monthly average of the value of the long term portfolio securities. Portfolio turnover is not annualized for periods less than one year. |
| 5 | Annualized for periods less than one year. |
| 6 | The Institutional Class commenced investment operations on December 8, 2010. |
See accompanying notes to the financial statements.
31
ASHMORE FUNDS
FINANCIAL HIGHLIGHTS
For the Periods Ended October 31,
| | | | | | | | | | | | | | | | |
Ashmore Emerging Markets Equity Fund | | | | | | | | | | | | | | | | |
| | |
| | | Class A | | | Class C | |
| | | 2013 | | | 20121 | | | 2013 | | | 20122 | |
Net asset value at beginning of period | | | $ 9.01 | | | | $ 10.00 | | | | $ 10.32 | | | | $ 10.00 | |
| | | | |
Income (loss) from investment operations: | | | | | | | | | | | | | | | | |
Net investment income (loss)3 | | | 0.08 | | | | 0.08 | | | | (0.03) | | | | (0.01) | |
Net realized and unrealized gain (loss) | | | 0.64 | | | | (0.98) | | | | 0.78 | | | | 0.36 | |
| | | | | | | | | | | | | | | | |
Total from investment operations | | | 0.72 | | | | (0.90) | | | | 0.75 | | | | 0.35 | |
| | | | |
Less distributions: | | | | | | | | | | | | | | | | |
| | | | |
From net investment income | | | (0.06) | | | | (0.09) | | | | (0.06) | | | | (0.03) | |
Tax return of capital | | | (0.01) | | | | — | | | | (0.01) | | | | — | |
| | | | | | | | | | | | | | | | |
| | | | |
Total distributions | | | (0.07) | | | | (0.09) | | | | (0.07) | | | | (0.03) | |
| | | | | | | | | | | | | | | | |
Net asset value at end of period | | | $ 9.66 | | | | $ 9.01 | | | | $ 11.00 | | | | $ 10.32 | |
| | | | | | | | | | | | | | | | |
| | | | | | | | | | | | | | | | |
| | | | |
Total return4 | | | 8.11% | | | | (8.94%) | | | | 7.58% | | | | 3.26% | |
| | | | |
Portfolio turnover rate5 | | | 92% | | | | 95% | | | | 92% | | | | 95% | |
| | | | |
Net assets, end of period (in thousands) | | | $28 | | | | $1 | | | | $1 | | | | $1 | |
| | | | |
Ratios to average net assets: | | | | | | | | | | | | | | | | |
Total expenses to average net assets: | | | | | | | | | | | | | | | | |
Total expenses before reimbursements | | | 3.01% | | | | 4.40% | | | | 3.77% | | | | 5.40% | |
Total expenses after reimbursements | | | 1.45% | | | | 1.45% | | | | 2.20% | | | | 2.20% | |
| | | | |
Net investment income (loss) to average net assets: | | | | | | | | | | | | | | | | |
Net investment loss before reimbursements | | | (0.70%) | | | | (1.60%) | | | | (1.81%) | | | | (3.82%) | |
Net investment income (loss) after reimbursements | | | 0.86% | | | | 1.35% | | | | (0.24%) | | | | (0.62%) | |
See accompanying notes to the financial statements.
32
ASHMORE FUNDS
FINANCIAL HIGHLIGHTS
For the Periods Ended October 31,
| | | | | | | | | | | | |
Ashmore Emerging Markets Equity Fund | | | | | | | | | | | | |
| |
| | | Institutional Class | |
| | | 2013 | | | 2012 | | | 20116 | |
Net asset value at beginning of period | | | $ 8.62 | | | | $ 8.81 | | | | $ 10.00 | |
| | | |
Income (loss) from investment operations: | | | | | | | | | | | | |
Net investment income (loss)3 | | | 0.07 | | | | 0.09 | | | | 0.05 | |
Net realized and unrealized gain (loss) | | | 0.65 | | | | (0.17) | | | | (1.19) | |
| | | | | | | | | | | | |
Total from investment operations | | | 0.72 | | | | (0.08) | | | | (1.14) | |
| | | |
Less distributions: | | | | | | | | | | | | |
| | | |
From net investment income | | | (0.06) | | | | (0.10) | | | | (0.05) | |
Tax return of capital | | | (0.01) | | | | (0.01) | | | | — | |
| | | | | | | | | | | | |
| | | |
Total distributions | | | (0.07) | | | | (0.11) | | | | (0.05) | |
| | | | | | | | | | | | |
Net asset value at end of period | | | $ 9.27 | | | | $ 8.62 | | | | $ 8.81 | |
| | | | | | | | | | | | |
| | | | | | | | | | | | |
| | | |
Total return4 | | | 8.48% | | | | (0.87%) | | | | (11.37%) | |
| | | |
Portfolio turnover rate5 | | | 92% | | | | 95% | | | | 75% | |
| | | |
Net assets, end of period (in thousands) | | | $9,825 | | | | $8,742 | | | | $8,848 | |
| | | |
Ratios to average net assets: | | | | | | | | | | | | |
Total expenses to average net assets: | | | | | | | | | | | | |
Total expenses before reimbursements | | | 2.76% | | | | 4.09% | | | | 5.34% | |
Total expenses after reimbursements | | | 1.17% | | | | 1.17% | | | | 1.17% | |
| | | |
Net investment income/(loss) to average net assets: | | | | | | | | | | | | |
Net investment loss before reimbursements | | | (0.79%) | | | | (1.84%) | | | | (2.55%) | |
Net investment income after reimbursements | | | 0.80% | | | | 1.08% | | | | 1.62% | |
| 1 | Class A commenced investment operations on February 27, 2012. |
| 2 | Class C commenced investment operations on August 24, 2012. |
| 3 | Per share amounts are based on average number of shares outstanding during the period. |
| 4 | Assumes investment at net asset value at the beginning of the period, reinvestment of all distributions at net asset value on distribution date, and a complete redemption of the investment at net asset value at the end of the period excluding the impact of sales charges. Total return is not annualized for periods less than one year. |
| 5 | The portfolio turnover rate is calculated by dividing the lesser of cost of purchases or proceeds from sales of long term portfolio securities by the monthly average of the value of the long term portfolio securities. Portfolio turnover is not annualized for periods less than one year. |
| 6 | The Institutional Class commenced investment operations on June 22, 2011. |
See accompanying notes to the financial statements.
33
ASHMORE FUNDS
FINANCIAL HIGHLIGHTS
For the Periods Ended October 31,
| | | | | | | | | | | | | | | | |
Ashmore Emerging Markets Small-Cap Equity Fund | | | | | | | | | | | | | | | | |
| | |
| | | Class A | | | Class C | |
| | | 2013 | | | 20121 | | | 2013 | | | 20122 | |
Net asset value at beginning of period | | | $ 9.77 | | | | $ 10.00 | | | | $ 10.48 | | | | $ 10.00 | |
| | | | |
Income (loss) from investment operations: | | | | | | | | | | | | | | | | |
Net investment income (loss)3 | | | 0.08 | | | | 0.02 | | | | (0.06) | | | | (0.01) | |
Net realized and unrealized gain (loss) | | | 1.31 | | | | (0.20) | | | | 1.46 | | | | 0.54 | |
| | | | | | | | | | | | | | | | |
Total from investment operations | | | 1.39 | | | | (0.18) | | | | 1.40 | | | | 0.53 | |
| | | | |
Less distributions: | | | | | | | | | | | | | | | | |
| | | | |
From net investment income | | | (0.03) | | | | (0.05) | | | | (0.03) | | | | (0.05) | |
From net realized gain | | | (0.52) | | | | — | | | | (0.52) | | | | — | |
| | | | | | | | | | | | | | | | |
| | | | |
Total distributions | | | (0.55) | | | | (0.05) | | | | (0.55) | | | | (0.05) | |
| | | | | | | | | | | | | | | | |
Net asset value at end of period | | | $ 10.61 | | | | $ 9.77 | | | | $ 11.33 | | | | $ 10.48 | |
| | | | | | | | | | | | | | | | |
| | | | | | | | | | | | | | | | |
| | | | |
Total return4 | | | 14.65% | | | | (1.73)% | | | | 13.93% | | | | 5.17% | |
| | | | |
Portfolio turnover rate5 | | | 113% | | | | 94% | | | | 113% | | | | 94% | |
| | | | |
Net assets, end of period (in thousands) | | | $265 | | | | $238 | | | | $12 | | | | $1 | |
| | | | |
Ratios to average net assets:6 | | | | | | | | | | | | | | | | |
Total expenses to average net assets: | | | | | | | | | | | | | | | | |
Total expenses before reimbursements | | | 2.35% | | | | 3.43% | | | | 3.10% | | | | 5.12% | |
Total expenses after reimbursements | | | 1.80% | | | | 1.80% | | | | 2.55% | | | | 2.55% | |
| | | | |
Net investment income (loss) to average net assets: | | | | | | | | | | | | | | | | |
Net investment loss before reimbursements | | | 0.25% | | | | (1.15%) | | | | (1.13%) | | | | (3.35%) | |
Net investment income (loss) after reimbursements | | | 0.80% | | | | 0.48% | | | | (0.58%) | | | | (0.78%) | |
See accompanying notes to the financial statements.
34
ASHMORE FUNDS
FINANCIAL HIGHLIGHTS
For the Periods Ended October 31,
| | | | | | | | | | | | |
Ashmore Emerging Markets Small-Cap Equity Fund | | | | | | | | | | | | |
| |
| | | Institutional Class | |
| | | 2013 | | | 2012 | | | 20117 | |
Net asset value at beginning of period | | | $ 11.79 | | | | $ 11.58 | | | | $ 10.00 | |
| | | |
Income (loss) from investment operations: | | | | | | | | | | | | |
Net investment income (loss)3 | | | 0.02 | | | | 0.05 | | | | (0.01) | |
Net realized and unrealized gain (loss) | | | 1.70 | | | | 0.25 | | | | 1.59 | |
| | | | | | | | | | | | |
Total from investment operations | | | 1.72 | | | | 0.30 | | | | 1.58 | |
| | | |
Less distributions: | | | | | | | | | | | | |
| | | |
From net investment income | | | (0.03) | | | | (0.05) | | | | — | |
From net realized gain | | | (0.52) | | | | (0.04) | | | | — | |
| | | | | | | | | | | | |
| | | |
Total distributions | | | (0.55) | | | | (0.09) | | | | — | |
| | | | | | | | | | | | |
Net asset value at end of period | | | $ 12.96 | | | | $ 11.79 | | | | $ 11.58 | |
| | | | | | | | | | | | |
| | | | | | | | | | | | |
| | | |
Total return4 | | | 15.04% | | | | 2.61% | | | | 15.80% | |
| | | |
Portfolio turnover rate5 | | | 113% | | | | 94% | | | | 20% | |
| | | |
Net assets, end of period (in thousands) | | | $30,370 | | | | $13,359 | | | | $11,576 | |
| | | |
Ratios to average net assets:6 | | | | | | | | | | | | |
Total expenses to average net assets: | | | | | | | | | | | | |
Total expenses before reimbursements | | | 2.11% | | | | 3.43% | | | | 15.42% | |
Total expenses after reimbursements | | | 1.52% | | | | 1.52% | | | | 1.52% | |
| | | |
Net investment income (loss) to average net assets: | | | | | | | | | | | | |
Net investment loss before reimbursements | | | (0.42%) | | | | (1.46%) | | | | (14.76%) | |
Net investment income (loss) after reimbursements | | | 0.17% | | | | 0.45% | | | | (0.86%) | |
| 1 | Class A commenced investment operations on February 1, 2012. |
| 2 | Class C commenced investment operations on August 24, 2012. |
| 3 | Per share amounts are based on average number of shares outstanding during the period. |
| 4 | Assumes investment at net asset value at the beginning of the period, reinvestment of all distributions at net asset value on distribution date, and a complete redemption of the investment at net asset value at the end of the period excluding the impact of sales charges. Total return is not annualized for periods less than one year. |
| 5 | The portfolio turnover rate is calculated by dividing the lesser of cost of purchases or proceeds from sales of long term portfolio securities by the monthly average of the value of the long term portfolio securities. Portfolio turnover is not annualized for periods less than one year. |
| 6 | Annualized for periods less than one year. |
| 7 | The Institutional Class commenced investment operations on October 4, 2011. |
See accompanying notes to the financial statements.
35
ASHMORE EMERGING MARKETS CORPORATE DEBT FUND
SCHEDULE OF INVESTMENTS
As of October 31, 2013
| | | | | | | | | | | | | | |
| | | Currency(1) | | Par | | | Value | | | % of Net Assets | |
Debt Securities | | | | | | | | | | | | | | |
| | | | |
Argentina (Cost $195,987) | | | | | | | | | | | | | | |
WPE International Cooperatief UA 10.375%, 09/30/2020 | | | | | 200,000 | | | $ | 140,000 | | | | 0.08 | |
| | | | |
| | | | | | | | | 140,000 | | | | 0.08 | |
Barbados (Cost $961,232) | | | | | | | | | | | | | | |
Columbus International, Inc. 11.500%, 11/20/2014 | | | | | 900,000 | | | | 969,750 | | | | 0.52 | |
| | | | |
| | | | | | | | | 969,750 | | | | 0.52 | |
Brazil (Cost $10,268,310) | | | | | | | | | | | | | | |
Banco do Brasil S.A. 3.875%, 10/10/2022 | | | | | 200,000 | | | | 182,000 | | | | 0.10 | |
Banco do Brasil S.A. 8.500%, 10/29/2049 | | | | | 100,000 | | | | 112,750 | | | | 0.06 | |
Banco Santander Brasil S.A. 8.000%, 03/18/2016 | | BRL | | | 600,000 | | | | 250,424 | | | | 0.13 | |
Banco Santander Brasil S.A. 4.625%, 02/13/2017 | | | | | 200,000 | | | | 210,000 | | | | 0.11 | |
Banco Votorantim S.A. 6.250%, 05/16/2016 | | BRL | | | 1,380,264 | | | | 588,583 | | | | 0.32 | |
Braskem Finance Ltd. 5.750%, 04/15/2021 | | | | | 200,000 | | | | 204,700 | | | | 0.11 | |
BRF S.A. 5.875%, 06/06/2022 | | | | | 200,000 | | | | 208,000 | | | | 0.11 | |
Cia Energetica de Sao Paulo 9.750%, 01/15/2015 | | BRL | | | 358,543 | | | | 161,865 | | | | 0.09 | |
Cosan Luxembourg S.A. 9.500%, 03/14/2018 | | BRL | | | 1,400,000 | | | | 556,200 | | | | 0.30 | |
Gerdau Holdings, Inc. 7.000%, 01/20/2020 | | | | | 100,000 | | | | 109,600 | | | | 0.06 | |
Globo Comunicacao e Participacoes S.A. 4.875%, 04/11/2022 | | | | | 200,000 | | | | 202,000 | | | | 0.11 | |
Itau Unibanco Holding S.A. 5.650%, 03/19/2022 | | | | | 200,000 | | | | 198,500 | | | | 0.11 | |
JBS Finance II Ltd. 8.250%, 01/29/2018 | | | | | 200,000 | | | | 209,500 | | | | 0.11 | |
Marfrig Holding Europe B.V. 9.875%, 07/24/2017 | | | | | 1,400,000 | | | | 1,398,250 | | | | 0.75 | |
Marfrig Holding Europe B.V. 8.375%, 05/09/2018 | | | | | 900,000 | | | | 848,250 | | | | 0.45 | |
Marfrig Overseas Ltd. 9.500%, 05/04/2020 | | | | | 1,050,000 | | | | 1,013,250 | | | | 0.54 | |
Minerva Luxembourg S.A. 12.250%, 02/10/2022(2) | | | | | 200,000 | | | | 224,000 | | | | 0.12 | |
Minerva Luxembourg S.A. 7.750%, 01/31/2023(2) | | | | | 700,000 | | | | 679,000 | | | | 0.36 | |
Mirabela Nickel Ltd. 8.750%, 04/15/2018 | | | | | 195,000 | | | | 68,250 | | | | 0.04 | |
Odebrecht Finance Ltd. 4.375%, 04/25/2025 | | | | | 230,000 | | | | 206,425 | | | | 0.11 | |
OGX Austria GmbH 8.500%, 06/01/2018(3) | | | | | 700,000 | | | | 66,500 | | | | 0.04 | |
Oi S.A. 5.750%, 02/10/2022 | | | | | 200,000 | | | | 187,500 | | | | 0.10 | |
OSX 3 Leasing B.V. 9.250%, 03/20/2015(4) | | | | | 910,000 | | | | 731,412 | | | | 0.39 | |
Petrobras Global Finance B.V., FRN 2.384%, 01/15/2019 | | | | | 230,000 | | | | 223,560 | | | | 0.12 | |
Petrobras Global Finance B.V. 4.375%, 05/20/2023 | | | | | 50,000 | | | | 46,205 | | | | 0.02 | |
Samarco Mineracao S.A. 4.125%, 11/01/2022 | | | | | 200,000 | | | | 182,800 | | | | 0.10 | |
Schahin II Finance Co. SPV Ltd. 5.875%, 09/25/2022 | | | | | 191,600 | | | | 186,810 | | | | 0.10 | |
Telemar Norte Leste S.A. 5.500%, 10/23/2020 | | | | | 100,000 | | | | 96,000 | | | | 0.05 | |
| | | | | | | | | 9,352,334 | | | | 5.01 | |
Chile (Cost $2,608,768) | | | | | | | | | | | | | | |
Automotores Gildemeister S.A. 8.250%, 05/24/2021 | | | | | 300,000 | | | | 274,500 | | | | 0.15 | |
Automotores Gildemeister S.A. 6.750%, 01/15/2023 | | | | | 150,000 | | | | 126,750 | | | | 0.07 | |
Banco de Credito e Inversiones 4.000%, 02/11/2023 | | | | | 200,000 | | | | 186,804 | | | | 0.10 | |
Banco Santander Chile 6.500%, 09/22/2020 | | CLP | | | 100,000,000 | | | | 194,046 | | | | 0.10 | |
Cencosud S.A. 5.500%, 01/20/2021 | | | | | 150,000 | | | | 155,552 | | | | 0.08 | |
Cencosud S.A. 4.875%, 01/20/2023 | | | | | 200,000 | | | | 192,118 | | | | 0.10 | |
E.CL S.A. 5.625%, 01/15/2021 | | | | | 100,000 | | | | 104,817 | | | | 0.06 | |
Inversiones Alsacia S.A. 8.000%, 08/18/2018 | | | | | 123,782 | | | | 90,361 | | | | 0.05 | |
Inversiones CMPC S.A. 4.375%, 05/15/2023 | | | | | 200,000 | | | | 189,403 | | | | 0.10 | |
SACI Falabella 3.750%, 04/30/2023 | | | | | 200,000 | | | | 184,000 | | | | 0.10 | |
SMU S.A. 7.750%, 02/08/2020 | | | | | 400,000 | | | | 222,000 | | | | 0.12 | |
See accompanying notes to the financial statements.
36
ASHMORE EMERGING MARKETS CORPORATE DEBT FUND
SCHEDULE OF INVESTMENTS (CONTINUED)
As of October 31, 2013
| | | | | | | | | | | | | | |
| | | Currency(1) | | Par | | | Value | | | % of Net Assets | |
Chile - (continued) | | | | | | | | | | | | | | |
Sociedad Quimica y Minera de Chile S.A. 3.625%, 04/03/2023 | | | | | 200,000 | | | $ | 172,951 | | | | 0.09 | |
Telefonica Chile S.A. 3.875%, 10/12/2022 | | | | | 200,000 | | | | 184,711 | | | | 0.10 | |
| | | | | | | | | 2,278,013 | | | | 1.22 | |
China (Cost $24,561,086) | | | | | | | | | | | | | | |
21Vianet Group, Inc. 7.875%, 03/22/2016 | | CNY | | | 2,000,000 | | | | 336,966 | | | | 0.18 | |
Agile Property Holdings Ltd. 10.000%, 11/14/2016 | | | | | 200,000 | | | | 210,260 | | | | 0.11 | |
Agile Property Holdings Ltd. 9.875%, 03/20/2017 | | | | | 400,000 | | | | 438,000 | | | | 0.23 | |
Baidu, Inc. 3.500%, 11/28/2022 | | | | | 200,000 | | | | 187,326 | | | | 0.10 | |
Bestgain Real Estate Ltd. 2.625%, 03/13/2018 | | | | | 600,000 | | | | 566,076 | | | | 0.30 | |
Chaowei Power Holdings Ltd. 7.250%, 09/24/2017 | | CNY | | | 1,000,000 | | | | 157,027 | | | | 0.08 | |
China Automation Group Ltd. 7.750%, 04/20/2016 | | | | | 400,000 | | | | 404,000 | | | | 0.22 | |
China CITIC Bank International Ltd. 6.875%, 06/24/2020 | | | | | 100,000 | | | | 111,646 | | | | 0.06 | |
China Forestry Holdings Co. Ltd. 10.250%, 11/17/2015 | | | | | 60,000 | | | | 22,200 | | | | 0.01 | |
China Lesso Group Holdings Ltd. 7.875%, 05/13/2016 | | | | | 700,000 | | | | 738,500 | | | | 0.40 | |
China Oriental Group Co. Ltd. 8.000%, 08/18/2015 | | | | | 650,000 | | | | 664,625 | | | | 0.36 | |
China Overseas Finance Cayman II Ltd. 5.500%, 11/10/2020 | | | | | 100,000 | | | | 105,691 | | | | 0.06 | |
China Railway Resources Huitung Ltd. 3.850%, 02/05/2023 | | | | | 200,000 | | | | 187,164 | | | | 0.10 | |
China SCE Property Holdings Ltd. 11.500%, 11/14/2017 | | | | | 600,000 | | | | 655,500 | | | | 0.35 | |
COSL Finance BVI Ltd. 3.250%, 09/06/2022 | | | | | 200,000 | | | | 183,671 | | | | 0.10 | |
Country Garden Holdings Co. Ltd. 11.125%, 02/23/2018 | | | | | 800,000 | | | | 892,960 | | | | 0.48 | |
Country Garden Holdings Co. Ltd. 7.250%, 04/04/2021(4) | | | | | 300,000 | | | | 299,640 | | | | 0.16 | |
Country Garden Holdings Co. Ltd. 7.500%, 01/10/2023 | | | | | 1,300,000 | | | | 1,295,125 | | | | 0.69 | |
Emerald Plantation Holdings Ltd. 6.000%, 01/30/2020(2)(5) | | | | | 80,635 | | | | 49,591 | | | | 0.03 | |
ENN Energy Holdings Ltd. 6.000%, 05/13/2021 | | | | | 200,000 | | | | 214,567 | | | | 0.12 | |
Evergrande Real Estate Group Ltd. 13.000%, 01/27/2015(2) | | | | | 350,000 | | | | 375,375 | | | | 0.20 | |
Evergrande Real Estate Group Ltd. 8.750%, 10/30/2018(2) | | | | | 1,000,000 | | | | 1,011,200 | | | | 0.54 | |
Far East Energy Bermuda Ltd. 13.000%, 01/15/2016(2)(5) | | | | | 213,291 | | | | 213,291 | | | | 0.11 | |
Fosun International Ltd. 7.500%, 05/12/2016 | | | | | 200,000 | | | | 207,500 | | | | 0.11 | |
Franshion Development Ltd. 6.750%, 04/15/2021 | | | | | 400,000 | | | | 405,000 | | | | 0.22 | |
Fufeng Group Ltd. 7.625%, 04/13/2016 | | | | | 800,000 | | | | 816,000 | | | | 0.44 | |
Gemdale International Investment Ltd. 7.125%, 11/16/2017 | | | | | 1,500,000 | | | | 1,560,000 | | | | 0.84 | |
Hengdeli Holdings Ltd. 6.250%, 01/29/2018 | | | | | 700,000 | | | | 715,750 | | | | 0.38 | |
Hidili Industry International Development Ltd. 8.625%, 11/04/2015 | | | | | 100,000 | | | | 72,000 | | | | 0.04 | |
Hyva Global B.V. 8.625%, 03/24/2016 | | | | | 400,000 | | | | 398,000 | | | | 0.21 | |
KWG Property Holding Ltd. 13.250%, 03/22/2017 | | | | | 600,000 | | | | 696,000 | | | | 0.37 | |
KWG Property Holding Ltd. 12.500%, 08/18/2017 | | | | | 500,000 | | | | 553,750 | | | | 0.30 | |
Lonking Holdings Ltd. 8.500%, 06/03/2016 | | | | | 800,000 | | | | 830,000 | | | | 0.45 | |
MIE Holdings Corp. 6.875%, 02/06/2018 | | | | | 200,000 | | | | 191,000 | | | | 0.10 | |
Nord Anglia Education, Inc. 8.500%, 02/15/2018(5) | | | | | 200,000 | | | | 202,000 | | | | 0.11 | |
Powerlong Real Estate Holdings Ltd. 13.750%, 09/16/2015 | | | | | 100,000 | | | | 106,500 | | | | 0.06 | |
Powerlong Real Estate Holdings Ltd. 11.250%, 01/25/2018 | | | | | 900,000 | | | | 895,500 | | | | 0.48 | |
Shimao Property Holdings Ltd. 11.000%, 03/08/2018 | | | | | 200,000 | | | | 224,500 | | | | 0.12 | |
Shimao Property Holdings Ltd. 6.625%, 01/14/2020 | | | | | 1,100,000 | | | | 1,061,500 | | | | 0.57 | |
Sino-Forest Corp. 5.000%, 08/01/2013(6) | | | | | 21,000 | | | | — | | | | — | |
Sino-Forest Corp. 10.250%, 07/28/2014(6) | | | | | 82,000 | | | | — | | | | — | |
Sino-Forest Corp. 4.250%, 12/15/2016(6) | | | | | 113,000 | | | | — | | | | — | |
Sino-Forest Corp. 6.250%, 10/21/2017(6) | | | | | 252,000 | | | | — | | | | — | |
Sunac China Holdings Ltd. 12.500%, 10/16/2017 | | | | | 1,100,000 | | | | 1,240,250 | | | | 0.66 | |
Sunac China Holdings Ltd. 9.375%, 04/05/2018 | | | | | 400,000 | | | | 411,000 | | | | 0.22 | |
Tencent Holdings Ltd. 4.625%, 12/12/2016 | | | | | 200,000 | | | | 215,169 | | | | 0.12 | |
See accompanying notes to the financial statements.
37
ASHMORE EMERGING MARKETS CORPORATE DEBT FUND
SCHEDULE OF INVESTMENTS (CONTINUED)
As of October 31, 2013
| | | | | | | | | | | | | | |
| | | Currency(1) | | Par | | | Value | | | % of Net Assets | |
China - (continued) | | | | | | | | | | | | | | |
Texhong Textile Group Ltd. 6.500%, 01/18/2019 | | | | | 400,000 | | | $ | 398,000 | | | | 0.21 | |
West China Cement Ltd. 7.500%, 01/25/2016 | | | | | 1,100,000 | | | | 1,108,250 | | | | 0.59 | |
Yanlord Land Group Ltd. 9.500%, 05/04/2017 | | | | | 500,000 | | | | 532,500 | | | | 0.29 | |
Yanlord Land Group Ltd. 10.625%, 03/29/2018 | | | | | 600,000 | | | | 657,000 | | | | 0.35 | |
Yingde Gases Investment Ltd. 8.125%, 04/22/2018 | | | | | 1,000,000 | | | | 1,022,500 | | | | 0.55 | |
Yuzhou Properties Co. Ltd. 11.750%, 10/25/2017 | | | | | 800,000 | | | | 900,000 | | | | 0.48 | |
| | | | | | | | | 24,740,070 | | | | 13.26 | |
Colombia (Cost $2,856,428) | | | | | | | | | | | | | | |
Banco Davivienda S.A. 2.950%, 01/29/2018 | | | | | 400,000 | | | | 390,000 | | | | 0.21 | |
Banco de Bogota S.A. 5.375%, 02/19/2023 | | | | | 200,000 | | | | 198,000 | | | | 0.11 | |
Bancolombia S.A. 4.250%, 01/12/2016 | | | | | 100,000 | | | | 104,000 | | | | 0.06 | |
Bancolombia S.A. 5.125%, 09/11/2022 | | | | | 400,000 | | | | 382,000 | | | | 0.20 | |
Ecopetrol S.A. 4.250%, 09/18/2018 | | | | | 200,000 | | | | 210,000 | | | | 0.11 | |
Empresa de Energia de Bogota S.A. 6.125%, 11/10/2021 | | | | | 200,000 | | | | 210,000 | | | | 0.11 | |
Empresa de Telecomunicaciones de Bogota 7.000%, 01/17/2023 | | COP | | | 600,000,000 | | | | 273,470 | | | | 0.15 | |
Grupo Aval Ltd. 4.750%, 09/26/2022 | | | | | 200,000 | | | | 187,750 | | | | 0.10 | |
Gruposura Finance 5.700%, 05/18/2021 | | | | | 200,000 | | | | 207,000 | | | | 0.11 | |
Millicom International Cellular S.A. 6.625%, 10/15/2021(2) | | | | | 600,000 | | | | 616,500 | | | | 0.33 | |
| | | | | | | | | 2,778,720 | | | | 1.49 | |
Czech Republic (Cost $1,435,249) | | | | | | | | | | | | | | |
EP Energy A.S. 5.875%, 11/01/2019 | | EUR | | | 200,000 | | | | 294,971 | | | | 0.16 | |
New World Resources N.V. 7.875%, 05/01/2018 | | EUR | | | 790,000 | | | | 756,737 | | | | 0.40 | |
New World Resources N.V. 7.875%, 01/15/2021 | | EUR | | | 350,000 | | | | 184,623 | | | | 0.10 | |
| | | | | | | | | 1,236,331 | | | | 0.66 | |
Hong Kong (Cost $5,687,531) | | | | | | | | | | | | | | |
CFG Investment S.A.C. 9.750%, 07/30/2019(2) | | | | | 200,000 | | | | 191,000 | | | | 0.10 | |
CIFI Holdings Group Co. Ltd. 12.250%, 04/15/2018 | | | | | 1,900,000 | | | | 2,118,500 | | | | 1.14 | |
Fosun International Ltd. 7.500%, 05/12/2016 | | | | | 600,000 | | | | 622,500 | | | | 0.33 | |
HKCG Finance Ltd. 6.250%, 08/07/2018 | | | | | 100,000 | | | | 116,122 | | | | 0.06 | |
Hutchison Whampoa International 11 Ltd. 4.625%, 01/13/2022 | | | | | 400,000 | | | | 412,682 | | | | 0.22 | |
Noble Group Ltd. 4.875%, 08/05/2015 | | | | | 100,000 | | | | 104,150 | | | | 0.06 | |
Nord Anglia Education UK Holdings PLC 10.250%, 04/01/2017 | | | | | 800,000 | | | | 888,000 | | | | 0.48 | |
Pacnet Ltd. 9.250%, 11/09/2015 | | | | | 400,000 | | | | 404,000 | | | | 0.22 | |
PCCW-HKT Capital No 3 Ltd. 5.250%, 07/20/2015 | | | | | 200,000 | | | | 212,643 | | | | 0.11 | |
PCCW-HKT Capital No 4 Ltd. 4.250%, 02/24/2016 | | | | | 175,000 | | | | 184,191 | | | | 0.10 | |
PCCW-HKT Capital No 5 Ltd. 3.750%, 03/08/2023 | | | | | 200,000 | | | | 184,788 | | | | 0.10 | |
Wharf Finance Ltd. 6.125%, 11/06/2017 | | | | | 300,000 | | | | 336,495 | | | | 0.18 | |
| | | | | | | | | 5,775,071 | | | | 3.10 | |
India (Cost $5,512,106) | | | | | | | | | | | | | | |
Bank of Baroda 6.625%, 05/25/2022 | | | | | 220,000 | | | | 213,806 | | | | 0.12 | |
Bharti Airtel International Netherlands B.V. 5.125%, 03/11/2023 | | | | | 400,000 | | | | 375,000 | | | | 0.20 | |
ICICI Bank Ltd. 5.750%, 11/16/2020 | | | | | 200,000 | | | | 207,198 | | | | 0.11 | |
Reliance Holdings USA, Inc. 5.400%, 02/14/2022 | | | | | 500,000 | | | | 511,225 | | | | 0.27 | |
Vedanta Resources PLC 6.000%, 01/31/2019 | | | | | 800,000 | | | | 772,000 | | | | 0.41 | |
Vedanta Resources PLC 8.250%, 06/07/2021 | | | | | 1,400,000 | | | | 1,442,000 | | | | 0.77 | |
Vedanta Resources PLC 7.125%, 05/31/2023 | | | | | 2,100,000 | | | | 2,005,500 | | | | 1.08 | |
| | | | | | | | | 5,526,729 | | | | 2.96 | |
Indonesia (Cost $1,251,887) | | | | | | | | | | | | | | |
Bumi Investment Pte Ltd. 10.750%, 10/06/2017 | | | | | 200,000 | | | | 122,000 | | | | 0.07 | |
See accompanying notes to the financial statements.
38
ASHMORE EMERGING MARKETS CORPORATE DEBT FUND
SCHEDULE OF INVESTMENTS (CONTINUED)
As of October 31, 2013
| | | | | | | | | | | | | | |
| | | Currency(1) | | Par | | | Value | | | % of Net Assets | |
Indonesia - (continued) | | | | | | | | | | | | | | |
Enercoal Resources Pte Ltd. 9.250%, 08/05/2014 | | | | | 200,000 | | | $ | 104,000 | | | | 0.06 | |
Indo Energy Finance B.V. 7.000%, 05/07/2018 | | | | | 200,000 | | | | 209,750 | | | | 0.11 | |
Indo Energy Finance II B.V. 6.375%, 01/24/2023 | | | | | 600,000 | | | | 526,500 | | | | 0.28 | |
Indosat Palapa Co. B.V. 7.375%, 07/29/2020 | | | | | 200,000 | | | | 215,250 | | | | 0.11 | |
| | | | | | | | | 1,177,500 | | | | 0.63 | |
Israel (Cost $4,982,286) | | | | | | | | | | | | | | |
Altice Financing S.A. 7.875%, 12/15/2019 | | | | | 800,000 | | | | 866,400 | | | | 0.46 | |
Altice Financing S.A. 8.000%, 12/15/2019 | | EUR | | | 1,400,000 | | | | 2,063,373 | | | | 1.11 | |
Altice Finco S.A. 9.875%, 12/15/2020 | | | | | 600,000 | | | | 670,500 | | | | 0.36 | |
Altice Finco S.A. 9.000%, 06/15/2023 | | EUR | | | 200,000 | | | | 294,632 | | | | 0.16 | |
Israel Electric Corp. Ltd. 5.625%, 06/21/2018 | | | | | 200,000 | | | | 210,500 | | | | 0.11 | |
Israel Electric Corp. Ltd. 7.250%, 01/15/2019 | | | | | 700,000 | | | | 780,500 | | | | 0.42 | |
Israel Electric Corp. Ltd. 6.875%, 06/21/2023 | | | | | 200,000 | | | | 214,300 | | | | 0.11 | |
| | | | | | | | | 5,100,205 | | | | 2.73 | |
Jamaica (Cost $14,498,267) | | | | | | | | | | | | | | |
Digicel Group Ltd. 10.500%, 04/15/2018 | | | | | 3,350,000 | | | | 3,618,000 | | | | 1.94 | |
Digicel Group Ltd. 8.250%, 09/30/2020 | | | | | 3,800,000 | | | | 4,009,000 | | | | 2.15 | |
Digicel Ltd. 7.000%, 02/15/2020 | | | | | 1,500,000 | | | | 1,522,500 | | | | 0.81 | |
Digicel Ltd. 6.000%, 04/15/2021 | | | | | 5,460,000 | | | | 5,296,200 | | | | 2.84 | |
| | | | | | | | | 14,445,700 | | | | 7.74 | |
Kazakhstan (Cost $8,134,515) | | | | | | | | | | | | | | |
ATF Bank JSC 9.000%, 05/11/2016 | | | | | 200,000 | | | | 199,250 | | | | 0.11 | |
Development Bank of Kazakhstan JSC 4.125%, 12/10/2022 | | | | | 600,000 | | | | 553,500 | | | | 0.30 | |
Kaspi Bank JSC 9.875%, 10/28/2016(4) | | | | | 700,000 | | | | 698,250 | | | | 0.37 | |
KazAgro National Management Holding JSC 4.625%, 05/24/2023 | | | | | 200,000 | | | | 189,050 | | | | 0.10 | |
Kazkommertsbank JSC 7.875%, 04/07/2014 | | | | | 1,100,000 | | | | 1,105,500 | | | | 0.59 | |
Kazkommertsbank JSC 8.000%, 11/03/2015 | | | | | 600,000 | | | | 606,000 | | | | 0.32 | |
Kazkommertsbank JSC 7.500%, 11/29/2016 | | | | | 700,000 | | | | 684,250 | | | | 0.37 | |
Kazkommertsbank JSC 6.875%, 02/13/2017 | | EUR | | | 1,550,000 | | | | 2,046,638 | | | | 1.10 | |
Kazkommertsbank JSC 8.500%, 05/11/2018 | | | | | 1,000,000 | | | | 957,500 | | | | 0.51 | |
KazMunayGas National Co. JSC 5.750%, 04/30/2043 | | | | | 200,000 | | | | 181,480 | | | | 0.10 | |
Zhaikmunai LLP 7.125%, 11/13/2019 | | | | | 900,000 | | | | 958,500 | | | | 0.51 | |
| | | | | | | | | 8,179,918 | | | | 4.38 | |
Kuwait (Cost $349,970) | | | | | | | | | | | | | | |
Kuwait Projects Co. 9.375%, 07/15/2020 | | | | | 300,000 | | | | 360,000 | | | | 0.19 | |
| | | | | | | | | 360,000 | | | | 0.19 | |
Lithuania (Cost $937,105) | | | | | | | | | | | | | | |
Bite Finance International B.V., FRN 7.725%, 02/15/2018 | | EUR | | | 700,000 | | | | 967,057 | | | | 0.52 | |
| | | | | | | | | 967,057 | | | | 0.52 | |
Malaysia (Cost $404,062) | | | | | | | | | | | | | | |
IOI Investment L Bhd. 4.375%, 06/27/2022 | | | | | 200,000 | | | | 191,800 | | | | 0.10 | |
Malayan Banking Bhd., FRN 3.250%, 09/20/2022 | | | | | 200,000 | | | | 198,780 | | | | 0.11 | |
| | | | | | | | | 390,580 | | | | 0.21 | |
Mexico (Cost $18,771,142) | | | | | | | | | | | | | | |
Alpek S.A. de C.V. 4.500%, 11/20/2022 | | | | | 400,000 | | | | 386,500 | | | | 0.21 | |
America Movil S.A.B. de C.V., FRN 1.256%, 09/12/2016 | | | | | 300,000 | | | | 302,618 | | | | 0.16 | |
America Movil S.A.B. de C.V. 3.125%, 07/16/2022 | | | | | 200,000 | | | | 188,324 | | | | 0.10 | |
America Movil S.A.B. de C.V. 6.450%, 12/05/2022 | | MXN | | | 6,000,000 | | | | 434,202 | | | | 0.23 | |
BBVA Bancomer S.A. 6.500%, 03/10/2021 | | | | | 300,000 | | | | 324,750 | | | | 0.17 | |
BBVA Bancomer S.A. 6.750%, 09/30/2022 | | | | | 350,000 | | | | 379,750 | | | | 0.20 | |
Cemex Espana Luxembourg 9.875%, 04/30/2019 | | | | | 1,150,000 | | | | 1,299,500 | | | | 0.70 | |
Cemex Espana Luxembourg 9.250%, 05/12/2020 | | | | | 1,879,000 | | | | 2,048,110 | | | | 1.10 | |
See accompanying notes to the financial statements.
39
ASHMORE EMERGING MARKETS CORPORATE DEBT FUND
SCHEDULE OF INVESTMENTS (CONTINUED)
As of October 31, 2013
| | | | | | | | | | | | | | |
| | | Currency(1) | | Par | | | Value | | | % of Net Assets | |
Mexico - (continued) | | | | | | | | | | | | | | |
Cemex Finance LLC 9.375%, 10/12/2022 | | | | | 3,300,000 | | | $ | 3,704,250 | | | | 1.99 | |
Cemex S.A.B. de C.V. 9.000%, 01/11/2018 | | | | | 1,350,000 | | | | 1,468,125 | | | | 0.79 | |
Cemex S.A.B. de C.V. 9.500%, 06/15/2018 | | | | | 200,000 | | | | 227,500 | | | | 0.12 | |
Cemex S.A.B. de C.V. 5.875%, 03/25/2019 | | | | | 900,000 | | | | 880,875 | | | | 0.47 | |
Cemex S.A.B. de C.V. 6.500%, 12/10/2019 | | | | | 300,000 | | | | 304,500 | | | | 0.16 | |
Cemex S.A.B. de C.V. 7.250%, 01/15/2021(4) | | | | | 1,000,000 | | | | 1,018,750 | | | | 0.55 | |
Comision Federal de Electricidad 4.875%, 05/26/2021 | | | | | 200,000 | | | | 208,500 | | | | 0.11 | |
Corp. GEO S.A.B. de C.V. 9.250%, 06/30/2020(3) | | | | | 100,000 | | | | 15,000 | | | | 0.01 | |
Corp. GEO S.A.B. de C.V. 8.875%, 03/27/2022(3) | | | | | 200,000 | | | | 30,000 | | | | 0.02 | |
Desarrolladora Homex S.A.B. de C.V. 9.500%, 12/11/2019(3) | | | | | 100,000 | | | | 16,500 | | | | 0.01 | |
Desarrolladora Homex S.A.B. de C.V. 9.750%, 03/25/2020(3) | | | | | 100,000 | | | | 16,500 | | | | 0.01 | |
Empresas ICA S.A.B. de C.V. 8.375%, 07/24/2017 | | | | | 760,000 | | | | 758,100 | | | | 0.41 | |
Fomento Economico Mexicano S.A.B. de C.V. 2.875%, 05/10/2023 | | | | | 500,000 | | | | 453,131 | | | | 0.24 | |
Grupo Televisa S.A.B. 6.625%, 03/18/2025 | | | | | 370,000 | | | | 432,393 | | | | 0.23 | |
Mexichem S.A.B. de C.V. 4.875%, 09/19/2022 | | | | | 275,000 | | | | 272,250 | | | | 0.15 | |
Mexichem S.A.B. de C.V. 6.750%, 09/19/2042 | | | | | 200,000 | | | | 196,500 | | | | 0.10 | |
NII Capital Corp. 10.000%, 08/15/2016 | | | | | 100,000 | | | | 78,000 | | | | 0.04 | |
NII Capital Corp. 8.875%, 12/15/2019 | | | | | 150,000 | | | | 93,750 | | | | 0.05 | |
NII Capital Corp. 7.625%, 04/01/2021 | | | | | 1,980,000 | | | | 1,148,400 | | | | 0.62 | |
Petroleos Mexicanos 7.650%, 11/24/2021 | | MXN | | | 5,800,000 | | | | 469,902 | | | | 0.25 | |
Urbi Desarrollos Urbanos S.A.B. de C.V. 8.500%, 04/19/2016(2)(3) | | | | | 100,000 | | | | 16,000 | | | | 0.01 | |
Urbi Desarrollos Urbanos S.A.B. de C.V. 9.500%, 01/21/2020(2)(3) | | | | | 500,000 | | | | 80,000 | | | | 0.04 | |
Urbi Desarrollos Urbanos S.A.B. de C.V. 9.750%, 02/03/2022(2)(3) | | | | | 850,000 | | | | 136,000 | | | | 0.07 | |
| | | | | | | | | 17,388,680 | | | | 9.32 | |
Mongolia (Cost $1,301,075) | | | | | | | | | | | | | | |
Mongolian Mining Corp. 8.875%, 03/29/2017 | | | | | 950,000 | | | | 776,625 | | | | 0.42 | |
Trade & Development Bank of Mongolia LLC 8.500%, 09/20/2015 | | | | | 400,000 | | | | 392,103 | | | | 0.21 | |
| | | | | | | | | 1,168,728 | | | | 0.63 | |
Nigeria (Cost $4,496,747) | | | | | | | | | | | | | | |
Afren PLC 11.500%, 02/01/2016 | | | | | 400,000 | | | | 456,500 | | | | 0.24 | |
Afren PLC 10.250%, 04/08/2019 | | | | | 200,000 | | | | 229,000 | | | | 0.12 | |
FBN Finance Co. B.V., FRN 8.250%, 08/07/2020 | | | | | 1,600,000 | | | | 1,635,200 | | | | 0.88 | |
Frigoglass Finance B.V. 8.250%, 05/15/2018 | | EUR | | | 200,000 | | | | 292,391 | | | | 0.16 | |
Sea Trucks Group 9.000%, 03/26/2018(4) | | | | | 2,000,000 | | | | 1,890,000 | | | | 1.01 | |
| | | | | | | | | 4,503,091 | | | | 2.41 | |
Panama (Cost $423,778) | | | | | | | | | | | | | | |
Sable International Finance Ltd. 8.750%, 02/01/2020 | | | | | 400,000 | | | | 452,000 | | | | 0.24 | |
| | | | | | | | | 452,000 | | | | 0.24 | |
Paraguay (Cost $872,810) | | | | | | | | | | | | | | |
Banco Bilbao Vizcaya Argentaria Paraguay S.A. 9.750%, 02/11/2016 | | | | | 150,000 | | | | 159,938 | | | | 0.09 | |
Telefonica Celular del Paraguay S.A. 6.750%, 12/13/2022 | | | | | 700,000 | | | | 707,000 | | | | 0.38 | |
| | | | | | | | | 866,938 | | | | 0.47 | |
Peru (Cost $3,479,311) | | | | | | | | | | | | | | |
Ajecorp B.V. 6.500%, 05/14/2022 | | | | | 1,150,000 | | | | 1,161,500 | | | | 0.62 | |
See accompanying notes to the financial statements.
40
ASHMORE EMERGING MARKETS CORPORATE DEBT FUND
SCHEDULE OF INVESTMENTS (CONTINUED)
As of October 31, 2013
| | | | | | | | | | | | | | |
| | | Currency(1) | | Par | | | Value | | | % of Net
Assets | |
Peru - (continued) | | | | | | | | | | | | | | |
Alicorp S.A.A. 3.875%, 03/20/2023 | | | | | 150,000 | | | $ | 141,000 | | | | 0.08 | |
Banco de Credito del Peru 4.250%, 04/01/2023 | | | | | 200,000 | | | | 190,500 | | | | 0.10 | |
Banco Internacional del Peru S.A.A. 5.750%, 10/07/2020 | | | | | 200,000 | | | | 208,000 | | | | 0.11 | |
BBVA Banco Continental S.A. 5.000%, 08/26/2022 | | | | | 200,000 | | | | 204,500 | | | | 0.11 | |
Corp. Azucarera del Peru S.A. 6.375%, 08/02/2022 | | | | | 1,000,000 | | | | 975,000 | | | | 0.52 | |
Southern Copper Corp. 3.500%, 11/08/2022 | | | | | 300,000 | | | | 279,814 | | | | 0.15 | |
Southern Copper Corp. 6.750%, 04/16/2040 | | | | | 100,000 | | | | 98,586 | | | | 0.05 | |
Transportadora de Gas del Peru S.A. 4.250%, 04/30/2028 | | | | | 200,000 | | | | 180,956 | | | | 0.10 | |
| | | | | | | | | 3,439,856 | | | | 1.84 | |
Philippines (Cost $1,187,874) | | | | | | | | | | | | | | |
JGSH Philippines Ltd. 4.375%, 01/23/2023 | | | | | 600,000 | | | | 561,000 | | | | 0.30 | |
Petron Corp. 7.000%, 11/10/2017 | | PHP | | | 25,000,000 | | | | 571,986 | | | | 0.31 | |
| | | | | | | | | 1,132,986 | | | | 0.61 | |
Poland (Cost $3,562,328) | | | | | | | | | | | | | | |
Eileme 1 AB 14.250%, 08/15/2020(5) | | | | | 428,500 | | | | 460,638 | | | | 0.25 | |
Eileme 2 AB 11.750%, 01/31/2020 | | EUR | | | 1,050,000 | | | | 1,684,391 | | | | 0.90 | |
Koleje Mazowieckie Finance AB 6.750%, 03/09/2016 | | EUR | | | 125,000 | | | | 177,780 | | | | 0.10 | |
PKO Finance AB 4.630%, 09/26/2022 | | | | | 600,000 | | | | 606,000 | | | | 0.32 | |
Polish Television Holding B.V. 11.000%, 01/15/2021(2)(5) | | EUR | | | 500,000 | | | | 717,978 | | | | 0.39 | |
| | | | | | | | | 3,646,787 | | | | 1.96 | |
Qatar (Cost $1,535,540) | | | | | | | | | | | | | | |
CBQ Finance Ltd. 7.500%, 11/18/2019 | | | | | 200,000 | | | | 235,000 | | | | 0.13 | |
Nakilat, Inc. 6.267%, 12/31/2033 | | | | | 93,759 | | | | 99,384 | | | | 0.05 | |
Qtel International Finance Ltd. 6.500%, 06/10/2014 | | | | | 400,000 | | | | 412,520 | | | | 0.22 | |
Qtel International Finance Ltd. 5.000%, 10/19/2025 | | | | | 200,000 | | | | 205,500 | | | | 0.11 | |
Qtel International Finance Ltd. 4.500%, 01/31/2043 | | | | | 300,000 | | | | 269,310 | | | | 0.15 | |
Ras Laffan Liquefied Natural Gas Co. Ltd. III 5.838%, 09/30/2027 | | | | | 250,000 | | | | 268,750 | | | | 0.14 | |
| | | | | | | | | 1,490,464 | | | | 0.80 | |
Russian Federation (Cost $20,597,082) | | | | | | | | | | | | | | |
Alfa Bank OJSC Via Alfa Bond Issuance PLC 7.500%, 09/26/2019 | | | | | 1,900,000 | | | | 2,023,500 | | | | 1.09 | |
Alfa Bank OJSC Via Alfa Bond Issuance PLC 7.750%, 04/28/2021 | | | | | 600,000 | | | | 652,500 | | | | 0.35 | |
Brunswick Rail Finance Ltd. 6.500%, 11/01/2017 | | | | | 1,200,000 | | | | 1,230,000 | | | | 0.66 | |
CEDC Finance Corp. International, Inc., FRN 8.000%, 04/30/2018 | | | | | 815,127 | | | | 761,967 | | | | 0.41 | |
CEDC Finance Corp. International, Inc. 10.000%, 04/30/2018(5) | | | | | 341,085 | | | | 300,088 | | | | 0.16 | |
Credit Bank of Moscow Via CBOM Finance PLC 7.700%, 02/01/2018 | | | | | 400,000 | | | | 416,000 | | | | 0.22 | |
Far East Capital Ltd. S.A. 8.000%, 05/02/2018(2) | | | | | 200,000 | | | | 181,000 | | | | 0.10 | |
Far East Capital Ltd. S.A. 8.750%, 05/02/2020(2) | | | | | 500,000 | | | | 451,250 | | | | 0.24 | |
Gazprom Neft OAO Via GPN Capital S.A. 4.375%, 09/19/2022 | | | | | 400,000 | | | | 376,500 | | | | 0.20 | |
Gazprom OAO Via Gaz Capital S.A. 6.212%, 11/22/2016 | | | | | 200,000 | | | | 220,140 | | | | 0.12 | |
Gazprom OAO Via Gaz Capital S.A. 5.136%, 03/22/2017 | | EUR | | | 100,000 | | | | 147,777 | | | | 0.08 | |
Lukoil International Finance B.V. 6.356%, 06/07/2017 | | | | | 100,000 | | | | 111,930 | | | | 0.06 | |
Lukoil International Finance B.V. 4.563%, 04/24/2023 | | | | | 200,000 | | | | 191,250 | | | | 0.10 | |
Metalloinvest Finance Ltd. 5.625%, 04/17/2020 | | | | | 900,000 | | | | 895,500 | | | | 0.48 | |
MMC Finance Ltd. 5.550%, 10/28/2020(4) | | | | | 200,000 | | | | 202,016 | | | | 0.11 | |
Novatek OAO via Novatek Finance Ltd. 4.422%, 12/13/2022 | | | | | 200,000 | | | | 190,250 | | | | 0.10 | |
See accompanying notes to the financial statements.
41
ASHMORE EMERGING MARKETS CORPORATE DEBT FUND
SCHEDULE OF INVESTMENTS (CONTINUED)
As of October 31, 2013
| | | | | | | | | | | | | | |
| | | Currency(1) | | Par | | | Value | | | % of Net
Assets | |
Russian Federation - (continued) | | | | | | | | | | | | | | |
Petropavlovsk 2010 Ltd. 4.000%, 02/18/2015 | | | | | 400,000 | | | $ | 262,000 | | | | 0.14 | |
Phosagro OAO via Phosagro Bond Funding Ltd. 4.204%, 02/13/2018 | | | | | 400,000 | | | | 401,000 | | | | 0.22 | |
Promsvyazbank OJSC Via PSB Finance S.A. 11.250%, 07/08/2016 | | | | | 100,000 | | | | 112,250 | | | | 0.06 | |
Promsvyazbank OJSC Via PSB Finance S.A. 8.500%, 04/25/2017 | | | | | 900,000 | | | | 972,000 | | | | 0.52 | |
Promsvyazbank OJSC Via PSB Finance S.A. 10.200%, 11/06/2019 | | | | | 1,400,000 | | | | 1,505,000 | | | | 0.81 | |
Rosneft Finance S.A. 7.875%, 03/13/2018 | | | | | 100,000 | | | | 116,125 | | | | 0.06 | |
Rosneft Finance S.A. 7.250%, 02/02/2020 | | | | | 200,000 | | | | 228,500 | | | | 0.12 | |
Rosneft Oil Co. via Rosneft International Finance Ltd. 3.149%, 03/06/2017 | | | | | 200,000 | | | | 201,500 | | | | 0.11 | |
Rosneft Oil Co. via Rosneft International Finance Ltd. 4.199%, 03/06/2022 | | | | | 200,000 | | | | 187,500 | | | | 0.10 | |
Russian Standard Bank Via Russian Standard Finance S.A.
9.250%, 07/11/2017 | | | | | 400,000 | | | | 420,000 | | | | 0.23 | |
Russian Standard Bank Via Russian Standard Finance S.A.
10.750%, 04/10/2018 | | | | | 1,200,000 | | | | 1,231,500 | | | | 0.66 | |
Sberbank of Russia Via SB Capital S.A. 5.499%, 07/07/2015 | | | | | 300,000 | | | | 317,625 | | | | 0.17 | |
Sberbank of Russia Via SB Capital S.A. 4.950%, 02/07/2017 | | | | | 200,000 | | | | 212,500 | | | | 0.11 | |
Tinkoff Credit Systems Via TCS Finance Ltd. 11.500%, 04/21/2014 | | | | | 200,000 | | | | 206,750 | | | | 0.11 | |
Tinkoff Credit Systems Via TCS Finance Ltd. 10.750%, 09/18/2015 | | | | | 800,000 | | | | 858,640 | | | | 0.46 | |
Tinkoff Credit Systems Via TCS Finance Ltd. 14.000%, 06/06/2018 | | | | | 700,000 | | | | 791,000 | | | | 0.42 | |
TMK OAO Via TMK Capital S.A. 7.750%, 01/27/2018 | | | | | 200,000 | | | | 209,500 | | | | 0.11 | |
TMK OAO Via TMK Capital S.A. 6.750%, 04/03/2020 | | | | | 200,000 | | | | 195,500 | | | | 0.11 | |
VEB-Leasing Via VEB Leasing Investment Ltd. 5.125%, 05/27/2016 | | | | | 200,000 | | | | 211,000 | | | | 0.11 | |
Vimpel Communications Via VIP Finance Ireland Ltd. OJSC
7.748%, 02/02/2021 | | | | | 1,300,000 | | | | 1,423,500 | | | | 0.76 | |
VimpelCom Holdings B.V. 9.000%, 02/13/2018 | | RUB | | | 16,000,000 | | | | 503,886 | | | | 0.27 | |
VimpelCom Holdings B.V. 7.504%, 03/01/2022 | | | | | 800,000 | | | | 858,000 | | | | 0.46 | |
VimpelCom Holdings B.V. 5.950%, 02/13/2023 | | | | | 200,000 | | | | 192,500 | | | | 0.10 | |
Vnesheconombank Via VEB Finance PLC 5.450%, 11/22/2017 | | | | | 100,000 | | | | 107,850 | | | | 0.06 | |
VTB Bank OJSC Via VTB Capital S.A. 6.465%, 03/04/2015 | | | | | 200,000 | | | | 211,240 | | | | 0.11 | |
VTB Bank OJSC Via VTB Capital S.A. 6.950%, 10/17/2022 | | | | | 400,000 | | | | 410,000 | | | | 0.22 | |
| | | | | | | | | 20,698,534 | | | | 11.09 | |
Saudi Arabia (Cost $602,707) | | | | | | | | | | | | | | |
Saudi Electricity Global Sukuk Co. 2.665%, 04/03/2017 | | | | | 200,000 | | | | 204,250 | | | | 0.11 | |
Saudi Electricity Global Sukuk Co. 4.211%, 04/03/2022 | | | | | 200,000 | | | | 202,750 | | | | 0.11 | |
Saudi Electricity Global Sukuk Co. 2 5.060%, 04/08/2043 | | | | | 200,000 | | | | 186,000 | | | | 0.10 | |
| | | | | | | | | 593,000 | | | | 0.32 | |
Singapore (Cost $816,382) | | | | | | | | | | | | | | |
MMI International Ltd. 8.000%, 03/01/2017 | | | | | 400,000 | | | | 402,000 | | | | 0.22 | |
See accompanying notes to the financial statements.
42
ASHMORE EMERGING MARKETS CORPORATE DEBT FUND
SCHEDULE OF INVESTMENTS (CONTINUED)
As of October 31, 2013
| | | | | | | | | | | | | | |
| | | Currency(1) | | Par | | | Value | | | % of Net
Assets | |
Singapore - (continued) | | | | | | | | | | | | | | |
SingTel Group Treasury Pte Ltd. 4.500%, 09/08/2021 | | | | | 200,000 | | | $ | 212,288 | | | | 0.11 | |
United Overseas Bank Ltd., FRN 2.875%, 10/17/2022 | | | | | 200,000 | | | | 200,640 | | | | 0.11 | |
| | | | | | | | | 814,928 | | | | 0.44 | |
South Africa (Cost $6,414,442) | | | | | | | | | | | | | | |
AngloGold Ashanti Holdings PLC 6.500%, 04/15/2040 | | | | | 190,000 | | | | 156,591 | | | | 0.08 | |
Edcon Holdings Pty Ltd., FRN 5.724%, 06/15/2015 | | EUR | | | 1,500,000 | | | | 2,016,259 | | | | 1.08 | |
Edcon Pty Ltd. 9.500%, 03/01/2018 | | | | | 1,560,000 | | | | 2,006,607 | | | | 1.08 | |
Foodcorp Pty Ltd. 8.750%, 03/01/2018 | | EUR | | | 720,000 | | | | 1,075,338 | | | | 0.58 | |
Myriad International Holdings B.V. 6.000%, 07/18/2020 | | | | | 200,000 | | | | 213,000 | | | | 0.12 | |
Sappi Papier Holding GmbH 8.375%, 06/15/2019 | | | | | 200,000 | | | | 211,500 | | | | 0.11 | |
Sappi Papier Holding GmbH 6.625%, 04/15/2021 | | | | | 700,000 | | | | 658,000 | | | | 0.35 | |
Standard Bank PLC 8.125%, 12/02/2019 | | | | | 400,000 | | | | 448,500 | | | | 0.24 | |
| | | | | | | | | 6,785,795 | | | | 3.64 | |
South Korea (Cost $2,325,401) | | | | | | | | | | | | | | |
Hana Bank 3.500%, 10/25/2017 | | | | | 200,000 | | | | 208,898 | | | | 0.11 | |
Korea Gas Corp. 2.875%, 07/29/2018 | | | | | 750,000 | | | | 758,412 | | | | 0.41 | |
Korea Hydro & Nuclear Power Co. Ltd. 6.250%, 06/17/2014 | | | | | 300,000 | | | | 309,375 | | | | 0.17 | |
Korea Hydro & Nuclear Power Co. Ltd. 4.750%, 07/13/2021 | | | | | 200,000 | | | | 214,024 | | | | 0.12 | |
Lotte Shopping Co. Ltd. 3.875%, 04/07/2016 | | | | | 200,000 | | | | 208,449 | | | | 0.11 | |
Shinhan Bank 1.875%, 07/30/2018 | | | | | 200,000 | | | | 193,393 | | | | 0.10 | |
SK Innovation Co. Ltd. 3.625%, 08/14/2018 | | | | | 200,000 | | | | 205,934 | | | | 0.11 | |
Woori Bank Co. Ltd. 5.875%, 04/13/2021 | | | | | 200,000 | | | | 224,282 | | | | 0.12 | |
| | | | | | | | | 2,322,767 | | | | 1.25 | |
Taiwan (Cost $102,163) | | | | | | | | | | | | | | |
Cathay United Bank Co. Ltd., FRN 5.500%, 10/05/2020 | | | | | 100,000 | | | | 101,500 | | | | 0.05 | |
| | | | | | | | | 101,500 | | | | 0.05 | |
Thailand (Cost $633,250) | | | | | | | | | | | | | | |
PTT Global Chemical PCL 4.250%, 09/19/2022 | | | | | 200,000 | | | | 195,034 | | | | 0.10 | |
Siam Commercial Bank Ltd. 3.900%, 11/14/2016 | | | | | 400,000 | | | | 421,149 | | | | 0.23 | |
| | | | | | | | | 616,183 | | | | 0.33 | |
Turkey (Cost $2,514,284) | | | | | | | | | | | | | | |
Akbank T.A.S. 5.000%, 10/24/2022 | | | | | 200,000 | | | | 189,100 | | | | 0.10 | |
Anadolu Efes Biracilik Ve Malt Sanayii A.S. 3.375%, 11/01/2022 | | | | | 200,000 | | | | 170,000 | | | | 0.09 | |
KOC Holding A.S. 3.500%, 04/24/2020 | | | | | 200,000 | | | | 179,000 | | | | 0.10 | |
Tupras Turkiye Petrol Rafinerileri A.S. 4.125%, 05/02/2018 | | | | | 200,000 | | | | 191,500 | | | | 0.10 | |
Turkiye Garanti Bankasi A.S. 5.250%, 09/13/2022 | | | | | 200,000 | | | | 189,800 | | | | 0.10 | |
Turkiye Halk Bankasi A.S. 3.875%, 02/05/2020 | | | | | 200,000 | | | | 181,626 | | | | 0.10 | |
Turkiye Is Bankasi 3.750%, 10/10/2018 | | | | | 200,000 | | | | 190,000 | | | | 0.10 | |
Turkiye Sise ve Cam Fabrikalari A.S. 4.250%, 05/09/2020 | | | | | 1,000,000 | | | | 897,500 | | | | 0.48 | |
Yapi ve Kredi Bankasi A.S. 4.000%, 01/22/2020 | | | | | 200,000 | | | | 184,000 | | | | 0.10 | |
Yuksel Insaat A.S. 9.500%, 11/10/2015 | | | | | 100,000 | | | | 72,500 | | | | 0.04 | |
| | | | | | | | | 2,445,026 | | | | 1.31 | |
Ukraine (Cost $10,161,255) | | | | | | | | | | | | | | |
Avangardco Investments Public Ltd. 10.000%, 10/29/2015 | | | | | 200,000 | | | | 198,500 | | | | 0.11 | |
DTEK Finance B.V. 9.500%, 04/28/2015 | | | | | 100,000 | | | | 100,150 | | | | 0.05 | |
DTEK Finance PLC 7.875%, 04/04/2018 | | | | | 1,500,000 | | | | 1,350,000 | | | | 0.72 | |
Ferrexpo Finance PLC 7.875%, 04/07/2016 | | | | | 2,100,000 | | | | 2,023,875 | | | | 1.09 | |
Metinvest B.V. 10.250%, 05/20/2015 | | | | | 900,000 | | | | 900,000 | | | | 0.48 | |
Metinvest B.V. 8.750%, 02/14/2018 | | | | | 850,000 | | | | 767,125 | | | | 0.41 | |
MHP S.A. 10.250%, 04/29/2015 | | | | | 1,600,000 | | | | 1,608,000 | | | | 0.86 | |
MHP S.A. 8.250%, 04/02/2020 | | | | | 800,000 | | | | 686,000 | | | | 0.37 | |
See accompanying notes to the financial statements.
43
ASHMORE EMERGING MARKETS CORPORATE DEBT FUND
SCHEDULE OF INVESTMENTS (CONTINUED)
As of October 31, 2013
| | | | | | | | | | | | | | |
| | | Currency(1) | | Par | | | Value | | | % of Net
Assets | |
Ukraine - (continued) | | | | | | | | | | | | | | |
Mriya Agro Holding PLC 9.450%, 04/19/2018 | | | | | 300,000 | | | $ | 258,000 | | | | 0.14 | |
NTRP Via Interpipe Ltd. 10.250%, 08/02/2017 | | | | | 200,000 | | | | 157,000 | | | | 0.08 | |
Privatbank CJSC Via UK SPV Credit Finance PLC 9.375%, 09/23/2015 | | | | | 300,000 | | | | 264,750 | | | | 0.14 | |
UKRLANDFARMING PLC 10.875%, 03/26/2018 | | | | | 1,600,000 | | | | 1,448,000 | | | | 0.78 | |
| | | | | | | | | 9,761,400 | | | | 5.23 | |
United Arab Emirates (Cost $15,073,574) | | | | | | | | | | | | | | |
Abu Dhabi National Energy Co. 3.625%, 01/12/2023 | | | | | 200,000 | | | | 188,000 | | | | 0.10 | |
Abu Dhabi National Energy Co. 6.500%, 10/27/2036 | | | | | 350,000 | | | | 411,250 | | | | 0.22 | |
ADCB Finance Cayman Ltd., FRN 3.125%, 05/28/2023 | | | | | 200,000 | | | | 185,148 | | | | 0.10 | |
Anka a Sukuk Ltd. 10.000%, 08/25/2016 | | AED | | | 7,900,000 | | | | 2,306,766 | | | | 1.24 | |
Dana Gas Sukuk Ltd. 7.000%, 10/31/2017 | | | | | 777,200 | | | | 741,456 | | | | 0.40 | |
Dana Gas Sukuk Ltd. 9.000%, 10/31/2017 | | | | | 877,200 | | | | 837,726 | | | | 0.45 | |
DP World Ltd. 6.850%, 07/02/2037 | | | | | 700,000 | | | | 731,500 | | | | 0.39 | |
DP World Sukuk Ltd. 6.250%, 07/02/2017 | | | | | 400,000 | | | | 439,000 | | | | 0.23 | |
Dubai Electricity & Water Authority 6.375%, 10/21/2016 | | | | | 200,000 | | | | 223,250 | | | | 0.12 | |
Dubai Holding Commercial Operations MTN Ltd. 4.750%, 01/30/2014 | | EUR | | | 3,850,000 | | | | 5,227,337 | | | | 2.80 | |
Dubai Holding Commercial Operations MTN Ltd. 6.000%, 02/01/2017 | | GBP | | | 1,300,000 | | | | 2,146,953 | | | | 1.15 | |
Emirates NBD PJSC 4.625%, 03/28/2017 | | | | | 200,000 | | | | 208,520 | | | | 0.11 | |
Jafz Sukuk Ltd. 7.000%, 06/19/2019 | | | | | 800,000 | | | | 891,000 | | | | 0.48 | |
MAF Global Securities Ltd. 5.250%, 07/05/2019 | | | | | 600,000 | | | | 631,500 | | | | 0.34 | |
MAF Sukuk Ltd. 5.850%, 02/07/2017 | | | | | 200,000 | | | | 216,500 | | | | 0.12 | |
| | | | | | | | | 15,385,906 | | | | 8.25 | |
Vietnam (Cost $892,323) | | | | | | | | | | | | | | |
Vingroup JSC 11.625%, 05/07/2018(4) | | | | | 900,000 | | | | 892,323 | | | | 0.48 | |
| | | | | | | | | 892,323 | | | | 0.48 | |
Total Debt Securities (Cost $180,408,257) | | | | | | | | �� | 177,924,870 | | | | 95.37 | |
| | | | |
| | | | | Shares | | | Value | | | % of Net
Assets | |
Equity Securities | | | | | | | | | | | | | | |
| | | | |
China (Cost $ — ) | | | | | | | | | | | | | | |
Emerald Plantation Holdings Ltd.(2) | | | | | 78,275 | | | $ | 11,741 | | | | 0.01 | |
| | | | | | | | | 11,741 | | | | 0.01 | |
Kazakhstan (Cost $214,500) | | | | | | | | | | | | | | |
BTA Bank JSC GDR (Registered) | | | | | 7,399 | | | | 5,993 | | | | — | |
| | | | | | | | | 5,993 | | | | — | |
Total Equity Securities (Cost $214,500) | | | | | | | | | 17,734 | | | | 0.01 | |
See accompanying notes to the financial statements.
44
ASHMORE EMERGING MARKETS CORPORATE DEBT FUND
SCHEDULE OF INVESTMENTS (CONTINUED)
As of October 31, 2013
| | | | | | | | | | | | | | |
| | | | | Number
of
Warrants | | | Value | | | % of Net
Assets | |
Warrants | | | | | | | | | | | | | | |
| | | | |
China (Cost $3,926) | | | | | | | | | | | | | | |
Far East Energy Bermuda Ltd., Exp. 08/23/2014, Strike Price $11.92(2) | | | | | 186,955 | | | $ | 18,696 | | | | 0.01 | |
| | | | |
Total Warrants (Cost $3,926) | | | | | | | | | 18,696 | | | | 0.01 | |
| | | | |
Total Investments (Total Cost $180,626,683) | | | | | | | | | 177,961,300 | | | | 95.39 | |
| | | | |
Other Assets Less Liabilities (See Statements of Assets and Liabilities for further detail) | | | | | | | | | 8,607,077 | | | | 4.61 | |
| | | | |
Net Assets | | | | | | | | $ | 186,568,377 | | | | 100.00 | |
| (1) | Par values are stated in United States Dollars unless otherwise noted below. |
| (2) | Security determined to be illiquid by the Investment Manager. |
| (3) | Issuer has defaulted on terms of debt obligation. |
| (4) | Securities exempt from registration under Rule 144A of the Securities Act of 1933. These securities may not be publicly traded without registration under the Securities Act of 1933. |
| (5) | Security is payment in-kind bond. |
| (6) | Security has been deemed worthless and is a Level 3 investment. |
Percentages shown are based on net assets.
At October 31, 2013, the Ashmore Emerging Markets Corporate Debt Fund had outstanding forward foreign currency exchange contracts as follows:
| | | | | | | | | | | | | | | | | | |
Settlement
Date | | Counterparty | | Currency Buy | | Currency Buy
Amount
(Local
Currency) | | | Currency Sell | | Currency Sell
Amount
(Local
Currency) | | | Unrealized
Gain/(Loss) | |
11/04/2013 | | Barclays Wholesale GTS | | Brazilian Real | | | 8,375 | | | United States Dollar | | | 3,822 | | | | $ (88) | |
11/04/2013 | | Standard Chartered London | | United States Dollar | | | 3,762 | | | Brazilian Real | | | 8,375 | | | | 27 | |
11/29/2013 | | Standard Chartered London | | Chilean Peso | | | 52,815,000 | | | United States Dollar | | | 105,136 | | | | (2,497) | |
11/29/2013 | | Barclays Wholesale GTS | | Mexican Peso | | | 875,000 | | | United States Dollar | | | 68,125 | | | | (1,215) | |
11/29/2013 | | Deutsche Bank London | | Mexican Peso | | | 875,000 | | | United States Dollar | | | 67,607 | | | | (697) | |
11/29/2013 | | Barclays Wholesale GTS | | United States Dollar | | | 104,847 | | | Chilean Peso | | | 52,255,500 | | | | 3,295 | |
01/21/2014 | | Chase Manhattan Bank London | | Euro | | | 483,183 | | | United States Dollar | | | 654,333 | | | | 1,792 | |
01/21/2014 | | Deutsche Bank London | | United States Dollar | | | 2,128,784 | | | British Pound | | | 1,332,963 | | | | (7,115) | |
01/21/2014 | | Deutsche Bank London | | United States Dollar | | | 306,561 | | | Euro | | | 224,200 | | | | 2,115 | |
01/21/2014 | | Deutsche Bank London | | United States Dollar | | | 20,665,619 | | | Euro | | | 15,235,548 | | | | (23,056) | |
01/21/2014 | | HSBC Bank PLC | | United States Dollar | | | 335,154 | | | Euro | | | 243,009 | | | | 5,168 | |
01/21/2014 | | HSBC Bank PLC | | United States Dollar | | | 747,705 | | | Euro | | | 553,874 | | | | (4,412) | |
01/31/2014 | | Standard Chartered London | | United States Dollar | | | 67,531 | | | Mexican Peso | | | 877,901 | | | | 734 | |
02/04/2014 | | Barclays Wholesale GTS | | United States Dollar | | | 3,743 | | | Brazilian Real | | | 8,375 | | | | 88 | |
02/28/2014 | | Chase Manhattan Bank London | | United States Dollar | | | 57,764 | | | Mexican Peso | | | 759,598 | | | | 94 | |
| | | | | | | | | | | | | | | | | | |
Total | | | | | | | | | | | | | | | | | $(25,767 | ) |
| | | | | | | | | | | | | | | | | | |
See accompanying notes to the financial statements.
45
ASHMORE EMERGING MARKETS CORPORATE DEBT FUND
SCHEDULE OF INVESTMENTS (CONTINUED)
As of October 31, 2013
The inputs or methodologies used for valuing securities are not necessarily an indication of the risks associated with investing in those securities and other financial instruments, if any. See note 4 in the Notes to the Financial Statements for more information regarding pricing inputs and valuation techniques. The following is a summary of the inputs used in valuing the Ashmore Emerging Markets Corporate Debt Fund’s investments and other financial instruments, which are carried at fair value, as of October 31, 2013:
| | | | | | | | | | | | |
| | | Level 1 | | Level 2 | | | Level 3 | | Total | |
Investments | | | | | | | | | | | | |
Assets: | | | | | | | | | | | | |
Common Stock | | $— | | $ | 17,734 | | | $— | | $ | 17,734 | |
Corporate Bonds | | — | | | 170,699,198 | | | — | | | 170,699,198 | |
Corporate Convertible Bonds | | — | | | 523,027 | | | — | | | 523,027 | |
Government Bonds | | — | | | 112,750 | | | — | | | 112,750 | |
Index Linked Corporate Bonds | | — | | | 750,447 | | | — | | | 750,447 | |
Financial Certificates | | — | | | 5,839,448 | | | — | | | 5,839,448 | |
Warrants | | — | | | 18,696 | | | — | | | 18,696 | |
| |
Total Investments | | $— | | $ | 177,961,300 | | | $— | | $ | 177,961,300 | |
| |
| | | | |
Other Financial Instruments | | | | | | | | | | | | |
Assets: | | | | | | | | | | | | |
Forward Foreign Currency Exchange Contracts | | $— | | $ | 13,313 | | | $— | | $ | 13,313 | |
Liabilities: | | | | | | | | | | | | |
Forward Foreign Currency Exchange Contracts | | — | | | (39,080 | ) | | — | | | (39,080 | ) |
| |
Total Other Financial Instruments | | $— | | $ | (25,767 | ) | | $— | | $ | (25,767 | ) |
| |
The Fund discloses all transfers between levels based on valuations at the end of each reporting period. At October 31, 2013 there were no transfers between Level 1, Level 2 and Level 3 based on levels assigned to the securities on October 31, 2012. U.S. GAAP provides additional guidance for estimating fair value when the volume and level of activity for the asset or liability have significantly decreased as well as guidance on identifying circumstances that indicate when a transaction is not orderly.
The following is a summary of the fair values of the Fund’s derivative instruments*:
Fair Values of Financial Derivative Instruments on the Statements of Assets and Liabilities as of October 31, 2013:
| | | | |
| | | Derivatives Not Accounted | |
| | | for as Hedging Instruments | |
| | | Foreign Exchange | |
| |
Assets: | | | | |
Unrealized Appreciation on Forward Foreign Currency Exchange Contracts | | $ | 13,313 | |
| | | | |
| |
Liabilities: | | | | |
Unrealized Depreciation on Forward Foreign Currency Exchange Contracts | | $ | (39,080 | ) |
| | | | |
See accompanying notes to the financial statements.
46
ASHMORE EMERGING MARKETS CORPORATE DEBT FUND
SCHEDULE OF INVESTMENTS (CONTINUED)
As of October 31, 2013
The Effect of Financial Derivative Instruments on the Statements of Operations for the Year Ended October 31, 2013:
| | | | |
| | | Derivatives Not Accounted | |
| | | for as Hedging Instruments | |
| | | Foreign Exchange | |
| |
Realized Gain on Derivatives Recognized resulting from Operations: | |
Net Realized Gain (Loss) on Forward Foreign Currency Exchange Contracts | | $ | (368,873) | |
| | | | |
|
Net Change in Unrealized Appreciation on Derivatives Recognized resulting from Operations: | |
Net Change in Unrealized Depreciation on Forward Foreign Currency Exchange Contracts | | $ | (19,692) | |
| | | | |
* See note 9 in the Notes to the Financial Statements for additional information.
At October 31, 2013, for U.S. federal income tax purposes, gross unrealized appreciation, gross unrealized depreciation, net unrealized appreciation/(depreciation) on investments in securities (including the effects of foreign currency translation) and the cost basis of investments were as follows:
| | | | |
Federal tax cost of investments | | | $180,644,589 | |
| |
Gross tax appreciation of investments | | | $2,437,707 | |
Gross tax depreciation of investments | | | (5,120,996 | ) |
| |
Net tax depreciation of investments | | | $(2,683,289 | ) |
| |
The difference between book basis and tax basis net unrealized appreciation or depreciation is attributable primarily to the tax deferral of losses on wash sales.
See accompanying notes to the financial statements.
47
ASHMORE EMERGING MARKETS LOCAL CURRENCY BOND FUND
SCHEDULE OF INVESTMENTS
As of October 31, 2013
| | | | | | | | | | | | | | |
| | | Currency(1) | | Par | | | Value | | | % of Net
Assets | |
Debt Securities | | | | | | | | | | | | | | |
| | | | |
Brazil (Cost $9,305,733) | | | | | | | | | | | | | | |
Brazil (Fed Rep of) 8.500%, 01/05/2024 | | BRL | | | 1,560,000 | | | $ | 635,434 | | | | 0.75 | |
Brazil Letras do Tesouro Nacional 8.931%, 01/01/2017(2) | | BRL | | | 12,690,000 | | | | 4,007,722 | | | | 4.73 | |
Brazil Notas do Tesouro Nacional Serie B 6.000%, 08/15/2020 | | BRL | | | 4,558,178 | | | | 2,097,473 | | | | 2.47 | |
Brazil Notas do Tesouro Nacional Serie F 10.000%, 01/01/2021 | | BRL | | | 4,020,000 | | | | 1,666,792 | | | | 1.97 | |
Brazil Notas do Tesouro Nacional Serie F 10.000%, 01/01/2023 | | BRL | | | 440,000 | | | | 179,078 | | | | 0.21 | |
| | | | | | | | | 8,586,499 | | | | 10.13 | |
Chile (Cost $231,426) | | | | | | | | | | | | | | |
Bonos de la Tesoreria de la Republica en pesos 6.000%, 01/01/2020 | | CLP | | | 20,000,000 | | | | 41,513 | | | | 0.05 | |
Chile (Rep of) 5.500%, 08/05/2020 | | CLP | | | 81,000,000 | | | | 161,288 | | | | 0.19 | |
| | | | | | | | | 202,801 | | | | 0.24 | |
Colombia (Cost $3,082,556) | | | | | | | | | | | | | | |
Colombia (Rep of) 12.000%, 10/22/2015 | | COP | | | 1,036,000,000 | | | | 622,361 | | | | 0.73 | |
Colombia (Rep of) 7.750%, 04/14/2021 | | COP | | | 1,450,000,000 | | | | 876,352 | | | | 1.03 | |
Colombia (Rep of) 4.375%, 03/21/2023 | | COP | | | 369,000,000 | | | | 177,232 | | | | 0.21 | |
Colombian TES 8.000%, 10/28/2015 | | COP | | | 403,500,000 | | | | 226,379 | | | | 0.27 | |
Colombian TES 7.000%, 05/04/2022 | | COP | | | 891,000,000 | | | | 478,800 | | | | 0.57 | |
Colombian TES 7.500%, 08/26/2026 | | COP | | | 1,095,000,000 | | | | 602,544 | | | | 0.71 | |
| | | | | | | | | 2,983,668 | | | | 3.52 | |
Ghana (Cost $171,387) | | | | | | | | | | | | | | |
Ghana (Rep of) 21.000%, 10/26/2015(3) | | GHS | | | 320,000 | | | | 148,383 | | | | 0.18 | |
| | | | | | | | | 148,383 | | | | 0.18 | |
Hungary (Cost $3,616,369) | | | | | | | | | | | | | | |
Hungary (Rep of) 7.750%, 08/24/2015 | | HUF | | | 52,230,000 | | | | 255,901 | | | | 0.30 | |
Hungary (Rep of) 5.500%, 12/22/2016 | | HUF | | | 133,700,000 | | | | 637,002 | | | | 0.75 | |
Hungary (Rep of) 6.750%, 11/24/2017 | | HUF | | | 331,490,000 | | | | 1,650,884 | | | | 1.95 | |
Hungary (Rep of) 7.000%, 06/24/2022 | | HUF | | | 235,000,000 | | | | 1,191,727 | | | | 1.40 | |
Hungary (Rep of) 6.000%, 11/24/2023 | | HUF | | | 40,300,000 | | | | 192,663 | | | | 0.23 | |
| | | | | | | | | 3,928,177 | | | | 4.63 | |
Indonesia (Cost $896,636) | | | | | | | | | | | | | | |
Indonesia (Rep of) 8.375%, 03/15/2024 | | IDR | | | 100,000,000 | | | | 9,400 | | | | 0.01 | |
Indonesia (Rep of) 6.125%, 05/15/2028 | | IDR | | | 5,100,000,000 | | | | 383,315 | | | | 0.45 | |
Indonesia (Rep of) 8.375%, 03/15/2034 | | IDR | | | 3,800,000,000 | | | | 345,609 | | | | 0.41 | |
| | | | | | | | | 738,324 | | | | 0.87 | |
Malaysia (Cost $4,013,075) | | | | | | | | | | | | | | |
Malaysia (Rep of) 4.012%, 09/15/2017 | | MYR | | | 1,160,000 | | | | 376,745 | | | | 0.45 | |
Malaysia (Rep of) 3.314%, 10/31/2017 | | MYR | | | 1,350,000 | | | | 427,198 | | | | 0.50 | |
Malaysia (Rep of) 3.580%, 09/28/2018 | | MYR | | | 1,600,000 | | | | 511,013 | | | | 0.60 | |
Malaysia (Rep of) 4.378%, 11/29/2019 | | MYR | | | 2,359,000 | | | | 781,346 | | | | 0.92 | |
Malaysia (Rep of) 3.492%, 03/31/2020 | | MYR | | | 2,400,000 | | | | 757,016 | | | | 0.89 | |
Malaysia (Rep of) 3.889%, 07/31/2020 | | MYR | | | 200,000 | | | | 64,723 | | | | 0.08 | |
Malaysia (Rep of) 4.160%, 07/15/2021 | | MYR | | | 1,250,000 | | | | 409,427 | | | | 0.48 | |
Malaysia (Rep of) 3.480%, 03/15/2023 | | MYR | | | 1,050,000 | | | | 329,131 | | | | 0.39 | |
Malaysia (Rep of) 4.392%, 04/15/2026 | | MYR | | | 400,000 | | | | 131,951 | | | | 0.16 | |
Malaysia (Rep of) 4.498%, 04/15/2030 | | MYR | | | 535,000 | | | | 178,740 | | | | 0.21 | |
| | | | | | | | | 3,967,290 | | | | 4.68 | |
See accompanying notes to the financial statements.
48
ASHMORE EMERGING MARKETS LOCAL CURRENCY BOND FUND
SCHEDULE OF INVESTMENTS (CONTINUED)
As of October 31, 2013
| | | | | | | | | | | | | | |
| | | Currency(1) | | Par | | | Value | | | % of Net
Assets | |
Mexico (Cost $3,779,013) | | | | | | | | | | | | | | |
Mexican Bonos 10.000%, 11/20/2036 | | MXN | | | 8,550,000 | | | $ | 848,498 | | | | 1.00 | |
Mexican Bonos 8.500%, 11/18/2038 | | MXN | | | 9,700,000 | | | | 840,640 | | | | 0.99 | |
Mexican Bonos 7.750%, 11/13/2042 | | MXN | | | 14,300,000 | | | | 1,148,300 | | | | 1.36 | |
Mexican Udibonos 4.000%, 11/15/2040 | | MXN | | | 4,605,128 | | | | 374,593 | | | | 0.44 | |
Petroleos Mexicanos 7.190%, 09/12/2024(3) | | MXN | | | 2,540,000 | | | | 188,767 | | | | 0.22 | |
| | | | | | | | | 3,400,798 | | | | 4.01 | |
Nigeria (Cost $1,726,623) | | | | | | | | | | | | | | |
Nigeria (Rep of) 16.000%, 06/29/2019 | | NGN | | | 78,000,000 | | | | 562,602 | | | | 0.67 | |
Nigeria (Rep of) 16.390%, 01/27/2022 | | NGN | | | 79,500,000 | | | | 602,908 | | | | 0.71 | |
Nigeria Treasury Bill 10.425%, 04/10/2014(2) | | NGN | | | 30,000,000 | | | | 179,239 | | | | 0.21 | |
Nigeria Treasury Bill 10.906%, 04/24/2014(2) | | NGN | | | 60,000,000 | | | | 356,335 | | | | 0.42 | |
| | | | | | | | | 1,701,084 | | | | 2.01 | |
Peru (Cost $1,374,394) | | | | | | | | | | | | | | |
Peru (Rep of) 8.600%, 08/12/2017 | | PEN | | | 710,000 | | | | 293,379 | | | | 0.35 | |
Peru (Rep of) 7.840%, 08/12/2020 | | PEN | | | 999,000 | | | | 419,119 | | | | 0.49 | |
Peru (Rep of) 8.200%, 08/12/2026 | | PEN | | | 438,000 | | | | 195,553 | | | | 0.23 | |
Peru (Rep of) 6.950%, 08/12/2031 | | PEN | | | 590,000 | | | | 229,298 | | | | 0.27 | |
Peru (Rep of) 6.900%, 08/12/2037 | | PEN | | | 577,000 | | | | 222,789 | | | | 0.26 | |
Peru (Rep of) 6.850%, 02/12/2042 | | PEN | | | 174,000 | | | | 66,155 | | | | 0.08 | |
| | | | | | | | | 1,426,293 | | | | 1.68 | |
Philippines (Cost $520,049) | | | | | | | | | | | | | | |
Philippines (Rep of) 6.250%, 01/14/2036 | | PHP | | | 20,000,000 | | | | 529,970 | | | | 0.63 | |
| | | | | | | | | 529,970 | | | | 0.63 | |
Poland (Cost $3,230,280) | | | | | | | | | | | | | | |
Poland (Rep of) 3.000%, 08/24/2016 | | PLN | | | 4,405,470 | | | | 1,503,753 | | | | 1.77 | |
Poland (Rep of) 5.750%, 10/25/2021 | | PLN | | | 1,230,000 | | | | 444,227 | | | | 0.53 | |
Poland (Rep of) 5.750%, 09/23/2022 | | PLN | | | 1,805,000 | | | | 655,533 | | | | 0.77 | |
Poland (Rep of) 2.750%, 08/25/2023 | | PLN | | | 926,576 | | | | 317,721 | | | | 0.38 | |
Poland (Rep of) 4.000%, 10/25/2023 | | PLN | | | 1,100,000 | | | | 351,871 | | | | 0.42 | |
Poland (Rep of) 5.750%, 04/25/2029 | | PLN | | | 400,000 | | | | 146,921 | | | | 0.17 | |
| | | | | | | | | 3,420,026 | | | | 4.04 | |
Romania (Cost $1,362,725) | | | | | | | | | | | | | | |
Romania (Rep of) 5.850%, 07/28/2014 | | RON | | | 1,520,000 | | | | 474,255 | | | | 0.56 | |
Romania (Rep of) 5.800%, 10/26/2015 | | RON | | | 1,460,000 | | | | 464,888 | | | | 0.55 | |
Romania (Rep of) 5.900%, 07/26/2017 | | RON | | | 760,000 | | | | 246,307 | | | | 0.29 | |
Romania (Rep of) 5.600%, 11/28/2018 | | RON | | | 170,000 | | | | 54,622 | | | | 0.07 | |
Romania (Rep of) 5.750%, 04/29/2020 | | RON | | | 400,000 | | | | 128,683 | | | | 0.15 | |
Romania (Rep of) 5.850%, 04/26/2023 | | RON | | | 270,000 | | | | 88,076 | | | | 0.10 | |
| | | | | | | | | 1,456,831 | | | | 1.72 | |
Russian Federation (Cost $12,918,497) | | | | | | | | | | | | | | |
Russian Federal Bond - OFZ 7.400%, 04/19/2017 | | RUB | | | 84,513,000 | | | | 2,708,991 | | | | 3.20 | |
Russian Federal Bond - OFZ 7.400%, 06/14/2017 | | RUB | | | 45,572,000 | | | | 1,461,481 | | | | 1.72 | |
Russian Federal Bond - OFZ 6.200%, 01/31/2018 | | RUB | | | 35,470,000 | | | | 1,089,402 | | | | 1.28 | |
Russian Federal Bond - OFZ 7.500%, 03/15/2018 | | RUB | | | 18,634,000 | | | | 601,364 | | | | 0.71 | |
Russian Federal Bond - OFZ 7.500%, 02/27/2019 | | RUB | | | 52,807,000 | | | | 1,705,855 | | | | 2.01 | |
Russian Federal Bond - OFZ 6.800%, 12/11/2019 | | RUB | | | 49,655,000 | | | | 1,546,747 | | | | 1.82 | |
Russian Federal Bond - OFZ 6.400%, 05/27/2020 | | RUB | | | 7,680,000 | | | | 233,570 | | | | 0.28 | |
Russian Federal Bond - OFZ 7.600%, 04/14/2021 | | RUB | | | 43,200,000 | | | | 1,397,535 | | | | 1.65 | |
Russian Federal Bond - OFZ 7.600%, 07/20/2022 | | RUB | | | 5,507,000 | | | | 177,896 | | | | 0.21 | |
Russian Federal Bond - OFZ 7.000%, 01/25/2023 | | RUB | | | 23,884,000 | | | | 741,005 | | | | 0.87 | |
Russian Federal Bond - OFZ 7.000%, 08/16/2023 | | RUB | | | 5,106,000 | | | | 157,380 | | | | 0.19 | |
Russian Federal Bond - OFZ 8.150%, 02/03/2027 | | RUB | | | 20,899,000 | | | | 691,078 | | | | 0.82 | |
Russian Federal Bond - OFZ 7.050%, 01/19/2028 | | RUB | | | 11,958,000 | | | | 357,762 | | | | 0.42 | |
| | | | | | | | | 12,870,066 | | | | 15.18 | |
See accompanying notes to the financial statements.
49
ASHMORE EMERGING MARKETS LOCAL CURRENCY BOND FUND
SCHEDULE OF INVESTMENTS (CONTINUED)
As of October 31, 2013
| | | | | | | | | | | | | | |
| | | Currency(1) | | Par | | | Value | | | % of Net
Assets | |
South Africa (Cost $10,534,055) | | | | | | | | | | | | | | |
South Africa (Rep of) 8.250%, 09/15/2017 | | ZAR | | | 20,850,000 | | | $ | 2,195,213 | | | | 2.59 | |
South Africa (Rep of) 8.000%, 12/21/2018 | | ZAR | | | 17,300,000 | | | | 1,811,211 | | | | 2.14 | |
South Africa (Rep of) 7.750%, 02/28/2023 | | ZAR | | | 20,100,000 | | | | 2,021,263 | | | | 2.38 | |
South Africa (Rep of) 10.500%, 12/21/2026 | | ZAR | | | 6,500,000 | | | | 777,073 | | | | 0.92 | |
South Africa (Rep of) 7.000%, 02/28/2031 | | ZAR | | | 16,150,000 | | | | 1,371,956 | | | | 1.62 | |
South Africa (Rep of) 6.250%, 03/31/2036 | | ZAR | | | 6,600,000 | | | | 492,767 | | | | 0.58 | |
South Africa (Rep of) 6.500%, 02/28/2041 | | ZAR | | | 4,600,000 | | | | 342,766 | | | | 0.40 | |
South Africa (Rep of) 8.750%, 02/28/2048 | | ZAR | | | 2,700,000 | | | | 259,897 | | | | 0.31 | |
| | | | | | | | | 9,272,146 | | | | 10.94 | |
Thailand (Cost $3,415,390) | | | | | | | | | | | | | | |
Thailand (Rep of) 3.625%, 05/22/2015 | | THB | | | 2,500,000 | | | | 81,399 | | | | 0.10 | |
Thailand (Rep of) 3.250%, 06/16/2017 | | THB | | | 8,000,000 | | | | 257,840 | | | | 0.30 | |
Thailand (Rep of) 3.450%, 03/08/2019 | | THB | | | 2,500,000 | | | | 80,142 | | | | 0.10 | |
Thailand (Rep of) 3.875%, 06/13/2019 | | THB | | | 24,000,000 | | | | 786,838 | | | | 0.93 | |
Thailand (Rep of) 1.200%, 07/14/2021 | | THB | | | 15,786,000 | | | | 473,980 | | | | 0.56 | |
Thailand (Rep of) 3.650%, 12/17/2021 | | THB | | | 9,500,000 | | | | 302,876 | | | | 0.36 | |
Thailand (Rep of) 5.500%, 03/13/2023 | | THB | | | 1,700,000 | | | | 61,578 | | | | 0.07 | |
Thailand (Rep of) 3.625%, 06/16/2023 | | THB | | | 17,985,000 | | | | 565,803 | | | | 0.67 | |
Thailand (Rep of) 4.750%, 12/20/2024 | | THB | | | 5,280,000 | | | | 181,150 | | | | 0.21 | |
Thailand (Rep of) 3.580%, 12/17/2027 | | THB | | | 5,300,000 | | | | 160,199 | | | | 0.19 | |
Thailand (Rep of) 1.250%, 03/12/2028 | | THB | | | 9,086,130 | | | | 248,419 | | | | 0.29 | |
Thailand (Rep of) 5.670%, 03/13/2028 | | THB | | | 1,000,000 | | | | 36,908 | | | | 0.04 | |
| | | | | | | | | 3,237,132 | | | | 3.82 | |
Turkey (Cost $6,481,183) | | | | | | | | | | | | | | |
Turkey (Rep of) 9.000%, 05/21/2014 | | TRY | | | 1,162,990 | | | | 614,047 | | | | 0.72 | |
Turkey (Rep of) 8.300%, 06/20/2018(2) | | TRY | | | 1,480,000 | | | | 743,614 | | | | 0.88 | |
Turkey (Rep of) 4.000%, 04/01/2020 | | TRY | | | 1,066,893 | | | | 595,374 | | | | 0.70 | |
Turkey (Rep of) 9.500%, 01/12/2022 | | TRY | | | 960,000 | | | | 506,149 | | | | 0.60 | |
Turkey (Rep of) 3.000%, 02/23/2022 | | TRY | | | 4,055,864 | | | | 2,128,258 | | | | 2.51 | |
Turkey (Rep of) 8.500%, 09/14/2022 | | TRY | | | 1,510,000 | | | | 750,367 | | | | 0.89 | |
Turkey (Rep of) 7.100%, 03/08/2023 | | TRY | | | 1,430,000 | | | | 648,112 | | | | 0.76 | |
| | | | | | | | | 5,985,921 | | | | 7.06 | |
Uruguay (Cost $1,475,083) | | | | | | | | | | | | | | |
Uruguay (Rep of) 5.000%, 09/14/2018 | | UYU | | | 10,446,442 | | | | 544,819 | | | | 0.64 | |
Uruguay (Rep of) 4.250%, 04/05/2027 | | UYU | | | 3,163,927 | | | | 158,432 | | | | 0.19 | |
Uruguay (Rep of) 4.375%, 12/15/2028 | | UYU | | | 5,985,408 | | | | 307,818 | | | | 0.36 | |
Uruguay (Rep of) 3.700%, 06/26/2037 | | UYU | | | 4,093,804 | | | | 193,100 | | | | 0.23 | |
Uruguay Notas del Tesoro 9.000%, 01/27/2014 | | UYU | | | 1,800,000 | | | | 82,590 | | | | 0.10 | |
Uruguay Notas del Tesoro 3.250%, 01/27/2019 | | UYU | | | 1,840,580 | | | | 89,627 | | | | 0.10 | |
| | | | | | | | | 1,376,386 | | | | 1.62 | |
Total Debt Securities (Cost $68,134,474) | | | | | | | | | 65,231,795 | | | | 76.96 | |
See accompanying notes to the financial statements.
50
ASHMORE EMERGING MARKETS LOCAL CURRENCY BOND FUND
SCHEDULE OF INVESTMENTS (CONTINUED)
As of October 31, 2013
| | | | | | | | | | | | | | |
| | | Currency(1) | | Number of Contracts | | | Value | | | % of Net
Assets | |
Purchased Options | | | | | | | | | | | | | | |
| | | | |
United States (Premiums Paid $60,630) | | | | | | | | | | | | | | |
Euro Volatility Quoted American Style Options, Exp. 11/08/2013,
Strike Price $1.26 | | EUR | | | 3,000,000 | | | $ | 41 | | | | — | |
Total Purchased Options (Premiums Paid $60,630) | | | | | | | | | 41 | | | | — | |
Total Investments in Securities (Cost $68,195,104) | | | | | | | | | 65,231,836 | | | | 76.96 | |
| | | | |
| | | Currency(1) | | Par | | | Value | | | % of Net
Assets | |
Fully Funded Total Return Swaps | | | | | | | | | | | | | | |
| | | | |
Indonesia (Cost $4,265,881) | | | | | | | | | | | | | | |
Indonesia (Rep of), Issued by Barclays, 9.500%, 07/15/2031 | | IDR | | | 2,932,000,000 | | | $ | 293,593 | | | | 0.34 | |
Indonesia (Rep of), Issued by Credit Suisse, 8.375%, 09/15/2026 | | IDR | | | 2,100,000,000 | | | | 194,562 | | | | 0.23 | |
Indonesia (Rep of), Issued by Deutsche Bank, 11.500%, 09/15/2019 | | IDR | | | 9,536,000,000 | | | | 1,015,143 | | | | 1.20 | |
Indonesia (Rep of), Issued by Deutsche Bank, 7.000%, 05/15/2027 | | IDR | | | 2,700,000,000 | | | | 222,716 | | | | 0.26 | |
Indonesia (Rep of), Issued by Deutsche Bank, 9.500%, 07/15/2031 | | IDR | | | 3,200,000,000 | | | | 320,429 | | | | 0.38 | |
Indonesia (Rep of), Issued by Deutsche Bank, 6.625%, 05/15/2033 | | IDR | | | 1,350,000,000 | | | | 102,096 | | | | 0.12 | |
Indonesia (Rep of), Issued by HSBC, 10.500%, 08/15/2030 | | IDR | | | 2,180,000,000 | | | | 235,987 | | | | 0.28 | |
Indonesia (Rep of), Issued by HSBC, 8.250%, 06/15/2032 | | IDR | | | 30,000,000 | | | | 2,688 | | | | — | |
Indonesia (Rep of), Issued by Standard Chartered, 8.375%, 09/15/2026 | | IDR | | | 6,200,000,000 | | | | 574,420 | | | | 0.68 | |
Indonesia (Rep of), Issued by Standard Chartered, 10.500%, 08/15/2030 | | IDR | | | 4,610,000,000 | | | | 499,037 | | | | 0.59 | |
| | | | | | | | | 3,460,671 | | | | 4.08 | |
Total Fully Funded Total Return Swaps (Cost $4,265,881) | | | | | | | | | 3,460,671 | | | | 4.08 | |
| | | | |
Total Investments (Total Cost $72,460,985) | | | | | | | | | 68,692,507 | | | | 81.04 | |
| | |
Other Assets Less Liabilities (See Statements of Assets and Liabilities for further detail) | | | | 16,071,424 | | | | 18.96 | |
| | | | |
Net Assets | | | | | | | | $ | 84,763,931 | | | | 100.00 | |
| (1) | Par values are stated in United States Dollars unless otherwise noted below. |
| (2) | Zero coupon bond reflects effective yield on the date of purchase. |
| (3) | Security determined to be illiquid by the Investment Manager. |
Percentages shown are based on net assets.
See accompanying notes to the financial statements.
51
ASHMORE EMERGING MARKETS LOCAL CURRENCY BOND FUND
SCHEDULE OF INVESTMENTS (CONTINUED)
As of October 31, 2013
At October 31, 2013, the Ashmore Emerging Markets Local Currency Bond Fund had outstanding forward foreign currency exchange contracts as follows:
| | | | | | | | | | | | | | | | | | |
Settlement Date | | Counterparty | | Currency Buy | | Currency Buy Amount (Local Currency) | | | Currency Sell | | Currency Sell Amount (Local
Currency) | | | Unrealized Gain/(Loss) | |
11/04/2013 | | Goldman Sachs Intl Ltd. London | | Brazilian Real | | | 875,392 | | | United States Dollar | | | 400,000 | | | $ | (9,611 | ) |
11/04/2013 | | HSBC Bank PLC | | Brazilian Real | | | 329,851 | | | United States Dollar | | | 148,850 | | | | (1,750 | ) |
11/04/2013 | | HSBC Bank PLC | | Brazilian Real | | | 2,744,849 | | | United States Dollar | | | 1,249,914 | | | | (25,825 | ) |
11/04/2013 | | Barclays Wholesale GTS | | United States Dollar | | | 138,699 | | | Brazilian Real | | | 307,163 | | | | 1,717 | |
11/04/2013 | | Barclays Wholesale GTS | | United States Dollar | | | 180,900 | | | Brazilian Real | | | 402,376 | | | | 1,457 | |
11/04/2013 | | Deutsche Bank London | | United States Dollar | | | 211,280 | | | Brazilian Real | | | 475,486 | | | | (767 | ) |
11/04/2013 | | Goldman Sachs Intl Ltd. London | | United States Dollar | | | 1,167,562 | | | Brazilian Real | | | 2,555,794 | | | | 27,784 | |
11/04/2013 | | Standard Chartered London | | United States Dollar | | | 94,008 | | | Brazilian Real | | | 209,272 | | | | 682 | |
11/15/2013 | | Deutsche Bank London | | Malaysian Ringgit | | | 732,261 | | | United States Dollar | | | 226,111 | | | | 4,745 | |
11/15/2013 | | ANZ Banking Corp. Melbourne | | Malaysian Ringgit | | | 793,125 | | | United States Dollar | | | 251,387 | | | | (1,343 | ) |
11/15/2013 | | Goldman Sachs Intl Ltd. London | | Malaysian Ringgit | | | 5,200,000 | | | United States Dollar | | | 1,601,774 | | | | 37,601 | |
11/29/2013 | | Citibank London | | Chilean Peso | | | 254,288,680 | | | United States Dollar | | | 504,141 | | | | (9,964 | ) |
11/29/2013 | | Goldman Sachs Intl Ltd. London | | Chilean Peso | | | 148,507,461 | | | United States Dollar | | | 295,449 | | | | (6,844 | ) |
11/29/2013 | | Barclays Wholesale GTS | | Hungarian Forint | | | 11,625,836 | | | United States Dollar | | | 52,137 | | | | 1,158 | |
11/29/2013 | | HSBC Bank PLC | | Hungarian Forint | | | 263,071,850 | | | United States Dollar | | | 1,159,264 | | | | 46,707 | |
11/29/2013 | | ING Bank | | Hungarian Forint | | | 35,969,806 | | | United States Dollar | | | 164,227 | | | | 665 | |
11/29/2013 | | Deutsche Bank London | | Indonesian Rupiah | | | 1,180,000,000 | | | United States Dollar | | | 103,873 | | | | 2,193 | |
11/29/2013 | | Standard Chartered London | | Indonesian Rupiah | | | 1,000,000,000 | | | United States Dollar | | | 87,184 | | | | 2,703 | |
11/29/2013 | | Union Bank of Switzerland - London | | Indonesian Rupiah | | | 10,405,705,457 | | | United States Dollar | | | 912,381 | | | | 22,957 | |
11/29/2013 | | BNP Paribas | | Malaysian Ringgit | | | 2,001,268 | | | United States Dollar | | | 622,111 | | | | 5,760 | |
11/29/2013 | | BNP Paribas | | Malaysian Ringgit | | | 1,490,861 | | | United States Dollar | | | 467,882 | | | | (145 | ) |
11/29/2013 | | Barclays Wholesale GTS | | Malaysian Ringgit | | | 2,000,000 | | | United States Dollar | | | 621,562 | | | | 5,910 | |
11/29/2013 | | Chase Manhattan Bank London | | Malaysian Ringgit | | | 3,000,000 | | | United States Dollar | | | 932,314 | | | | 8,895 | |
11/29/2013 | | Barclays Wholesale GTS | | Mexican Peso | | | 1,769,964 | | | United States Dollar | | | 135,907 | | | | (560 | ) |
11/29/2013 | | Barclays Wholesale GTS | | Mexican Peso | | | 21,437,000 | | | United States Dollar | | | 1,669,028 | | | | (29,771 | ) |
11/29/2013 | | Chase Manhattan Bank London | | Mexican Peso | | | 15,909,685 | | | United States Dollar | | | 1,193,916 | | | | 22,675 | |
11/29/2013 | | Deutsche Bank London | | Mexican Peso | | | 21,436,485 | | | United States Dollar | | | 1,656,286 | | | | (17,068 | ) |
11/29/2013 | | CSFB Global Foreign Exchange London | | Peruvian Neuevo Sol | | | 1,542,110 | | | United States Dollar | | | 551,147 | | | | 2,845 | |
11/29/2013 | | CSFB Global Foreign Exchange London | | Peruvian Neuevo Sol | | | 1,216,600 | | | United States Dollar | | | 440,000 | | | | (2,945 | ) |
11/29/2013 | | Bank of America | | Polish Zloty | | | 2,735,230 | | | United States Dollar | | | 860,000 | | | | 26,336 | |
11/29/2013 | | Barclays Wholesale GTS | | Polish Zloty | | | 892,548 | | | United States Dollar | | | 273,667 | | | | 15,559 | |
11/29/2013 | | Barclays Wholesale GTS | | Polish Zloty | | | 1,489,935 | | | United States Dollar | | | 474,205 | | | | 8,600 | |
11/29/2013 | | Bank of America | | Russian Ruble | | | 3,627,496 | | | United States Dollar | | | 113,904 | | | | (1,468 | ) |
11/29/2013 | | Barclays Wholesale GTS | | Thai Baht | | | 8,000,000 | | | United States Dollar | | | 254,647 | | | | 1,913 | |
11/29/2013 | | Citibank London | | Thai Baht | | | 10,000,000 | | | United States Dollar | | | 317,339 | | | | 3,361 | |
11/29/2013 | | HSBC Bank PLC | | Thai Baht | | | 5,000,000 | | | United States Dollar | | | 159,312 | | | | 1,038 | |
11/29/2013 | | Citibank London | | Turkish Lira | | | 3,305,780 | | | United States Dollar | | | 1,630,471 | | | | 16,989 | |
11/29/2013 | | Morgan Stanley & Co. International | | Turkish Lira | | | 2,131,280 | | | United States Dollar | | | 1,070,000 | | | | (7,861 | ) |
11/29/2013 | | Standard Chartered London | | United States Dollar | | | 98,101 | | | Chilean Peso | | | 49,281,134 | | | | 2,330 | |
11/29/2013 | | HSBC Bank PLC | | United States Dollar | | | 202,946 | | | Colombian Peso | | | 382,939,012 | | | | 1,126 | |
11/29/2013 | | Barclays Wholesale GTS | | United States Dollar | | | 40,340 | | | Czech Koruna | | | 772,738 | | | | (329 | ) |
11/29/2013 | | ANZ Banking Corp. Melbourne | | United States Dollar | | | 164,812 | | | Indonesian Rupiah | | | 1,784,250,000 | | | | 4,431 | |
11/29/2013 | | HSBC Bank PLC | | United States Dollar | | | 164,309 | | | Indonesian Rupiah | | | 1,800,000,000 | | | | 2,512 | |
11/29/2013 | | Deutsche Bank London | | United States Dollar | | | 133,589 | | | Peruvian Neuevo Sol | | | 371,817 | | | | 16 | |
11/29/2013 | | Barclays Wholesale GTS | | United States Dollar | | | 131,984 | | | Philippine Peso | | | 5,679,269 | | | | 770 | |
11/29/2013 | | Barclays Wholesale GTS | | United States Dollar | | | 580,000 | | | Polish Zloty | | | 1,821,084 | | | | (10,112 | ) |
11/29/2013 | | Deutsche Bank London | | United States Dollar | | | 1,070,000 | | | Polish Zloty | | | 3,362,609 | | | | (19,635 | ) |
11/29/2013 | | Barclays Wholesale GTS | | United States Dollar | | | 169,875 | | | Romanian Leu | | | 563,866 | | | | (2,484 | ) |
11/29/2013 | | Barclays Wholesale GTS | | United States Dollar | | | 318,698 | | | Russian Ruble | | | 10,360,542 | | | | (2,432 | ) |
11/29/2013 | | Deutsche Bank London | | United States Dollar | | | 241,103 | | | Russian Ruble | | | 7,688,778 | | | | 2,786 | |
11/29/2013 | | Barclays Wholesale GTS | | United States Dollar | | | 39,287 | | | South African Rand | | | 388,476 | | | | 748 | |
11/29/2013 | | Goldman Sachs Intl Ltd. London | | United States Dollar | | | 635,571 | | | South African Rand | | | 6,308,363 | | | | 9,749 | |
11/29/2013 | | HSBC Bank PLC | | United States Dollar | | | 219,221 | | | South African Rand | | | 2,172,038 | | | | 3,743 | |
11/29/2013 | | Union Bank of Switzerland - London | | United States Dollar | | | 160,551 | | | South African Rand | | | 1,596,303 | | | | 2,190 | |
See accompanying notes to the financial statements.
52
ASHMORE EMERGING MARKETS LOCAL CURRENCY BOND FUND
SCHEDULE OF INVESTMENTS (CONTINUED)
As of October 31, 2013
| | | | | | | | | | | | | | | | | | |
Settlement Date | | Counterparty | | Currency Buy | | Currency Buy Amount (Local Currency) | | | Currency Sell | | Currency Sell Amount (Local
Currency) | | | Unrealized Gain/(Loss) | |
11/29/2013 | | Citibank London | | United States Dollar | | | 757,411 | | | Turkish Lira | | | 1,535,652 | | | | $(7,892 | ) |
11/29/2013 | | Deutsche Bank London | | United States Dollar | | | 54,457 | | | Turkish Lira | | | 108,621 | | | | 325 | |
11/29/2013 | | Deutsche Bank London | | United States Dollar | | | 143,769 | | | Turkish Lira | | | 292,754 | | | | (2,128 | ) |
11/29/2013 | | HSBC Bank PLC | | United States Dollar | | | 591,962 | | | Turkish Lira | | | 1,199,842 | | | | (5,988 | ) |
12/02/2013 | | Deutsche Bank London | | Czech Koruna | | | 8,047,095 | | | United States Dollar | | | 431,558 | | | | (8,030 | ) |
12/02/2013 | | Barclays Wholesale GTS | | United States Dollar | | | 1,271,125 | | | Russian Ruble | | | 40,528,540 | | | | 15,715 | |
12/02/2013 | | Barclays Wholesale GTS | | United States Dollar | | | 1,150,000 | | | Russian Ruble | | | 36,742,500 | | | | 11,866 | |
12/02/2013 | | Barclays Wholesale GTS | | United States Dollar | | | 33,409 | | | Russian Ruble | | | 1,064,885 | | | | 423 | |
12/03/2013 | | Goldman Sachs Intl Ltd. London | | Brazilian Real | | | 2,555,794 | | | United States Dollar | | | 1,159,800 | | | | (27,927 | ) |
12/13/2013 | | ANZ Banking Corp. Melbourne | | Indonesian Rupiah | | | 2,000,000,000 | | | United States Dollar | | | 180,424 | | | | (1,194 | ) |
12/13/2013 | | Union Bank of Switzerland - London | | Indonesian Rupiah | | | 797,024,284 | | | United States Dollar | | | 71,836 | | | | (411 | ) |
12/13/2013 | | BNP Paribas | | Thai Baht | | | 8,000,000 | | | United States Dollar | | | 255,143 | | | | 1,176 | |
12/13/2013 | | Chase Manhattan Bank London | | Thai Baht | | | 4,944,285 | | | United States Dollar | | | 157,712 | | | | 702 | |
12/13/2013 | | Citibank London | | Thai Baht | | | 10,000,000 | | | United States Dollar | | | 318,796 | | | | 1,602 | |
12/13/2013 | | Standard Chartered London | | Thai Baht | | | 16,509,809 | | | United States Dollar | | | 524,204 | | | | 4,768 | |
12/13/2013 | | Union Bank of Switzerland - London | | Thai Baht | | | 8,000,000 | | | United States Dollar | | | 254,915 | | | | 1,404 | |
12/13/2013 | | HSBC Bank PLC | | United States Dollar | | | 242,519 | | | Indonesian Rupiah | | | 2,650,000,000 | | | | 5,039 | |
12/16/2013 | | HSBC Bank PLC | | Chinese Offshore Yuan | | | 1,429,680 | | | United States Dollar | | | 230,000 | | | | 4,302 | |
12/16/2013 | | HSBC Bank PLC | | Chinese Offshore Yuan | | | 1,242,600 | | | United States Dollar | | | 200,000 | | | | 3,642 | |
12/16/2013 | | HSBC Bank PLC | | Chinese Offshore Yuan | | | 1,117,440 | | | United States Dollar | | | 180,000 | | | | 3,130 | |
12/16/2013 | | HSBC Bank PLC | | Chinese Offshore Yuan | | | 13,481,257 | | | United States Dollar | | | 2,208,892 | | | | 470 | |
12/16/2013 | | HSBC Bank PLC | | Chinese Offshore Yuan | | | 318,704 | | | United States Dollar | | | 51,822 | | | | 409 | |
12/16/2013 | | Deutsche Bank London | | Thai Baht | | | 6,000,000 | | | United States Dollar | | | 190,325 | | | | 1,875 | |
12/16/2013 | | HSBC Bank PLC | | Thai Baht | | | 18,643,847 | | | United States Dollar | | | 591,680 | | | | 5,545 | |
12/16/2013 | | HSBC Bank PLC | | United States Dollar | | | 125,464 | | | Chinese Offshore Yuan | | | 776,374 | | | | (1,771 | ) |
12/16/2013 | | HSBC Bank PLC | | United States Dollar | | | 430,000 | | | Chinese Offshore Yuan | | | 2,678,040 | | | | (8,888 | ) |
12/16/2013 | | HSBC Bank PLC | | United States Dollar | | | 2,270,000 | | | Chinese Offshore Yuan | | | 14,135,267 | | | | (46,544 | ) |
01/03/2014 | | Morgan Stanley & Co. International | | Brazilian Real | | | 1,265,582 | | | United States Dollar | | | 570,000 | | | | (13,465 | ) |
01/31/2014 | | Barclays Wholesale GTS | | Czech Koruna | | | 775,852 | | | United States Dollar | | | 41,481 | | | | (629 | ) |
01/31/2014 | | Union Bank of Switzerland - London | | Czech Koruna | | | 7,824,075 | | | United States Dollar | | | 420,000 | | | | (8,028 | ) |
01/31/2014 | | Bank of America | | Mexican Peso | | | 5,277,840 | | | United States Dollar | | | 400,000 | | | | 1,577 | |
01/31/2014 | | Standard Chartered London | | Mexican Peso | | | 27,270,052 | | | United States Dollar | | | 2,097,712 | | | | (22,806 | ) |
01/31/2014 | | Morgan Stanley & Co. International | | Peruvian Neuevo Sol | | | 1,290,876 | | | United States Dollar | | | 462,265 | | | | (1,493 | ) |
01/31/2014 | | Barclays Wholesale GTS | | Polish Zloty | | | 15,638,002 | | | United States Dollar | | | 5,134,908 | | | | (86,997 | ) |
01/31/2014 | | Barclays Wholesale GTS | | Romanian Leu | | | 1,358,277 | | | United States Dollar | | | 419,053 | | | | (5,275 | ) |
01/31/2014 | | Deutsche Bank London | | United States Dollar | | | 634,927 | | | Hungarian Forint | | | 135,429,894 | | | | 16,554 | |
01/31/2014 | | Deutsche Bank London | | United States Dollar | | | 155,599 | | | Polish Zloty | | | 476,175 | | | | 1,890 | |
01/31/2014 | | Barclays Wholesale GTS | | United States Dollar | | | 223,509 | | | Romanian Leu | | | 723,275 | | | | 3,174 | |
01/31/2014 | | CSFB Global Foreign Exchange London | | United States Dollar | | | 39,830 | | | Russian Ruble | | | 1,293,129 | | | | 182 | |
01/31/2014 | | Deutsche Bank London | | United States Dollar | | | 232,327 | | | Russian Ruble | | | 7,539,007 | | | | 1,174 | |
01/31/2014 | | HSBC Bank PLC | | United States Dollar | | | 114,081 | | | Russian Ruble | | | 3,714,657 | | | | 187 | |
02/28/2014 | | Chase Manhattan Bank London | | Mexican Peso | | | 23,595,222 | | | United States Dollar | | | 1,794,313 | | | | (2,912 | ) |
04/13/2015 | | HSBC Bank PLC | | Chinese Offshore Yuan | | | 7,218,720 | | | United States Dollar | | | 1,080,000 | | | | 84,924 | |
04/13/2015 | | HSBC Bank PLC | | Chinese Offshore Yuan | | | 8,846,915 | | | United States Dollar | | | 1,349,129 | | | | 78,545 | |
04/13/2015 | | HSBC Bank PLC | | Chinese Offshore Yuan | | | 22,111 | | | United States Dollar | | | 3,374 | | | | 195 | |
04/13/2015 | | HSBC Bank PLC | | United States Dollar | | | 670,000 | | | Chinese Offshore Yuan | | | 4,330,210 | | | | (28,789 | ) |
04/13/2015 | | HSBC Bank PLC | | United States Dollar | | | 670,000 | | | Chinese Offshore Yuan | �� | | 4,343,945 | | | | (31,006 | ) |
04/13/2015 | | HSBC Bank PLC | | United States Dollar | | | 1,130,000 | | | Chinese Offshore Yuan | | | 7,413,591 | | | | (66,371 | ) |
05/04/2015 | | Standard Chartered London | | Chinese Offshore Yuan | | | 7,307,150 | | | United States Dollar | | | 1,113,895 | | | | 64,592 | |
05/04/2015 | | Standard Chartered London | | Chinese Offshore Yuan | | | 1,413,570 | | | United States Dollar | | | 213,337 | | | | 14,642 | |
05/04/2015 | | Standard Chartered London | | United States Dollar | | | 1,340,000 | | | Chinese Offshore Yuan | | | 8,720,720 | | | | (66,466 | ) |
07/17/2015 | | Standard Chartered London | | Chinese Offshore Yuan | | | 4,780,030 | | | United States Dollar | | | 719,234 | | | | 50,053 | |
07/17/2015 | | Standard Chartered London | | Chinese Offshore Yuan | | | 125,800 | | | United States Dollar | | | 19,129 | | | | 1,117 | |
07/17/2015 | | Standard Chartered London | | United States Dollar | | | 740,000 | | | Chinese Offshore Yuan | | | 4,905,830 | | | | (49,533 | ) |
| | | | | | | | | | | | | | | | | | |
Total | | | | | | | | | | | | | | | | | $36,393 | |
| | | | | | | | | | | | | | | | | | |
See accompanying notes to the financial statements.
53
ASHMORE EMERGING MARKETS LOCAL CURRENCY BOND FUND
SCHEDULE OF INVESTMENTS (CONTINUED)
As of October 31, 2013
At October 31, 2013, the Ashmore Emerging Markets Local Currency Bond Fund had the following interest rate swap contracts outstanding:
| | | | | | | | | | | | | | | | | | | | |
Pay Rate Index/ Pay Rate | | Receive Rate/
Receive Rate Index | | Notional Amount | | | Expiration
Date | | | Unrealized Gain/(Loss) | | | Counterparty |
Brazil CETIP Interbank Deposit Rate | | 10.955% | | | BRL | | | | 3,356,753 | | | | 07/01/2015 | | | $ | 398 | | | HSBC |
Brazil CETIP Interbank Deposit Rate | | 11.170% | | | BRL | | | | 2,377,957 | | | | 01/04/2016 | | | | 324 | | | HSBC |
Brazil CETIP Interbank Deposit Rate | | 11.032% | | | BRL | | | | 1,659,129 | | | | 01/02/2017 | | | | (1,271 | ) | | HSBC |
Brazil CETIP Interbank Deposit Rate | | 10.380% | | | BRL | | | | 2,060,553 | | | | 01/02/2017 | | | | (22,270 | ) | | HSBC |
Mexico Interbank TIIE 28 Day Rate | | 6.760% | | | MXN | | | | 13,000,000 | | | | 09/01/2023 | | | | 17,650 | | | HSBC |
Mexico Interbank TIIE 28 Day Rate | | 6.320% | | | MXN | | | | 23,000,000 | | | | 11/15/2027 | | | | (148,311 | ) | | Barclays
Capital |
Mexico Interbank TIIE 28 Day Rate | | 7.130% | | | MXN | | | | 5,000,000 | | | | 07/10/2028 | | | | (14,440 | ) | | Barclays
Capital |
Mexico Interbank TIIE 28 Day Rate | | 7.000% | | | MXN | | | | 6,500,000 | | | | 06/29/2028 | | | | (15,257 | ) | | Barclays
Capital |
MYR-KLIBOR-BNM 3 Month | | 3.725% | | | MYR | | | | 1,300,000 | | | | 04/09/2023 | | | | (13,141 | ) | | Barclays
Capital |
3.250% | | WIBOR Poland 6 Month | | | PLN | | | | 250,000 | | | | 12/07/2017 | | | | 373 | | | HSBC |
WIBOR Poland 6 Month | | 3.600% | | | PLN | | | | 9,150,000 | | | | 12/07/2017 | | | | 85,137 | | | HSBC |
WIBOR Poland 6 Month | | 3.865% | | | PLN | | | | 3,450,000 | | | | 02/22/2023 | | | | 15,819 | | | HSBC |
WIBOR Poland 6 Month | | 3.355% | | | PLN | | | | 2,000,000 | | | | 04/11/2023 | | | | (20,909 | ) | | HSBC |
| | | | | | | | | | | | | | | | | | | | |
| | | | | | | | | | | | | | | | $ | (115,898 | ) | | |
| | | | | | | | | | | | | | | | | | | | |
The inputs or methodologies used for valuing securities are not necessarily an indication of the risks associated with investing in those securities and other financial instruments, if any. See note 4 in the Notes to the Financial Statements for more information regarding pricing inputs and valuation techniques. The following is a summary of the inputs used in valuing the Ashmore Emerging Markets Local Currency Bond Fund’s investments and other financial instruments, which are carried at fair value, as of October 31, 2013:
| | | | | | | | | | | | |
| | | Level 1 | | Level 2 | | | Level 3 | | Total | |
Investments | | | | | | | | | | | | |
Assets: | | | | | | | | | | | | |
Government Bonds | | $— | | $ | 55,485,240 | | | $— | | $ | 55,485,240 | |
Index Linked Government Bonds | | — | | | 9,557,788 | | | — | | | 9,557,788 | |
Corporate Bonds | | — | | | 188,767 | | | — | | | 188,767 | |
Purchased Options | | — | | | 41 | | | — | | | 41 | |
Fully Funded Total Return Swaps | | — | | | 3,460,671 | | | — | | | 3,460,671 | |
Total Investments | | $— | | $ | 68,692,507 | | | $— | | $ | 68,692,507 | |
| | | | |
Other Financial Instruments | | | | | | | | | | | | |
Assets: | | | | | | | | | | | | |
Forward Foreign Currency Exchange Contracts | | $— | | $ | 681,850 | | | $— | | $ | 681,850 | |
Interest Rate Swap Contracts | | — | | | 119,701 | | | — | | | 119,701 | |
Liabilities: | | | | | | | | | | | | |
Forward Foreign Currency Exchange Contracts | | — | | | (645,457 | ) | | — | | | (645,457 | ) |
Interest Rate Swap Contracts | | — | | | (235,599 | ) | | — | | | (235,599 | ) |
Total Other Financial Instruments | | $— | | $ | (79,505 | ) | | $— | | $ | (79,505 | ) |
See accompanying notes to the financial statements.
54
ASHMORE EMERGING MARKETS LOCAL CURRENCY BOND FUND
SCHEDULE OF INVESTMENTS (CONTINUED)
As of October 31, 2013
The Fund discloses all transfers between levels based on valuations at the end of each reporting period. At October 31, 2013, there were no transfers between Level 1, Level 2 and Level 3 based on levels assigned to the securities on October 31, 2012. U.S. GAAP provides additional guidance for estimating fair value when the volume and level of activity for the asset or liability have significantly decreased as well as guidance on identifying circumstances that indicate when a transaction is not orderly.
The following is a summary of the fair values of the Fund’s derivative instruments*:
Fair Values of Financial Derivative Instruments on the Statements of Assets and Liabilities as of October 31, 2013:
| | | | | | | | |
| | | Derivatives Not Accounted for as
Hedging Instruments | |
| | | Foreign Exchange | | | Fixed Income/ Interest Rate | |
| |
Assets: | | | | | | | | |
Unrealized Appreciation on Interest Rate Swap Contracts | | $ | — | | | $ | 119,701 | |
Unrealized Appreciation on Forward Foreign Currency Exchange Contracts | | | 681,850 | | | | — | |
| | | | |
| | $ | 681,850 | | | $ | 119,701 | |
| | | | |
| | |
Liabilities: | | | | | | | | |
Unrealized Depreciation on Interest Rate Swap Contracts | | $ | — | | | $ | (235,599 | ) |
Unrealized Depreciation on Forward Foreign Currency Exchange Contracts | | | (645,457 | ) | | | — | |
| | | | |
| | $ | (645,457 | ) | | $ | (235,599 | ) |
| | | | |
|
The Effect of Financial Derivative Instruments on the Statements of Operations for the Period Ended October 31, 2013: | |
| | | | | | | | |
| | | Derivatives Not Accounted for as
Hedging Instruments | |
| | | Foreign Exchange | | | Fixed Income/
Interest Rate | |
| |
Realized Gain (Loss) on Derivatives Recognized resulting from Operations: | | | | | | | | |
Net Realized Gain on Forward Foreign Currency Exchange Contracts | | $ | 383,592 | | | $ | — | |
Net Realized Loss on Options Contracts | | | — | | | | (127,684 | ) |
Net Realized Gain on Interest Rate Swap Contracts | | | — | | | | 147,348 | |
Net Realized Loss on Futures Contracts | | | — | | | | (43,862 | ) |
| | | | |
| | $ | 383,592 | | | $ | (24,198 | ) |
| | | | |
| | |
Net Change in Unrealized Appreciation (Depreciation) on Derivatives Recognized resulting from Operations: | | | | | | | | |
Net Change in Unrealized Depreciation on Forward Foreign Currency Exchange Contracts | | $ | (173,702 | ) | | $ | — | |
Net Change in Unrealized Depreciation on Options Contracts | | | — | | | | (60,589 | ) |
Net Change in Unrealized Depreciation on Interest Rate Swap Contracts | | | — | | | | (430,246 | ) |
| | | | |
| | $ | (173,702 | ) | | $ | (490,835 | ) |
| | | | |
* See note 9 in the Notes to the Financial Statements for additional information.
See accompanying notes to the financial statements.
55
ASHMORE EMERGING MARKETS LOCAL CURRENCY BOND FUND
SCHEDULE OF INVESTMENTS (CONTINUED)
As of October 31, 2013
At October 31, 2013, for U.S. federal income tax purposes, gross unrealized appreciation, gross unrealized depreciation, net unrealized appreciation/(depreciation) on investments in securities (including the effects of foreign currency translation) and the cost basis of investments were as follows:
| | | | |
Federal tax cost of investments | | | $72,667,418 | |
Gross tax appreciation of investments | | | $915,561 | |
Gross tax depreciation of investments | | | (4,900,472) | |
Net tax depreciation of investments | | | $(3,984,911) | |
The difference between book basis and tax basis net unrealized appreciation or depreciation is attributable primarily to the tax deferral of losses on wash sales.
See accompanying notes to the financial statements.
56
ASHMORE EMERGING MARKETS CURRENCY FUND(A)
SCHEDULE OF INVESTMENTS
As of October 31, 2013
| | | | | | | | | | | | | | | | |
| | | Currency(1) | | | Par | | | Value | | | % of Net
Assets | |
Debt Securities | | | | | | | | | | | | | | | | |
| | | | |
Brazil (Cost $1,441,552) | | | | | | | | | | | | | | | | |
Brazil Notas do Tesouro Nacional Serie F
10.000%, 01/01/2021 | | | BRL | | | | 3,340,000 | | | $ | 1,384,970 | | | | 3.88 | |
| | | | | | | | | | | 1,384,970 | | | | 3.88 | |
Colombia (Cost $310,321) | | | | | | | | | | | | | | | | |
Colombian TES 7.000%, 05/04/2022 | | | COP | | | | 290,000,000 | | | | 155,838 | | | | 0.44 | |
Emgesa S.A. ESP 8.750%, 01/25/2021 | | | COP | | | | 280,000,000 | | | | 156,265 | | | | 0.44 | |
| | | | | | | | | | | 312,103 | | | | 0.88 | |
Mexico (Cost $1,889,657) | | | | | | | | | | | | | | | | |
Mexican Bonos 8.000%, 12/19/2013 | | | MXN | | | | 17,800,000 | | | | 1,371,278 | | | | 3.85 | |
Mexican Bonos 6.500%, 06/09/2022 | | | MXN | | | | 2,200,000 | | | | 175,001 | | | | 0.49 | |
Mexican Bonos 10.000%, 12/05/2024 | | | MXN | | | | 800,000 | | | | 80,771 | | | | 0.22 | |
Mexican Bonos 8.500%, 11/18/2038 | | | MXN | | | | 2,500,000 | | | | 216,660 | | | | 0.61 | |
| | | | | | | | | | | 1,843,710 | | | | 5.17 | |
Romania (Cost $909,589) | | | | | | | | | | | | | | | | |
Romania Government Bond 5.850%, 07/28/2014 | | | RON | | | | 1,140,000 | | | | 355,691 | | | | 1.00 | |
Romania Government Bond 5.800%, 10/26/2015 | | | RON | | | | 350,000 | | | | 111,446 | | | | 0.31 | |
Romania Government Bond 5.900%, 07/26/2017 | | | RON | | | | 200,000 | | | | 64,817 | | | | 0.18 | |
Romania Treasury Bills 3.700%, 01/08/2014(2) | | | RON | | | | 1,290,000 | | | | 392,788 | | | | 1.10 | |
| | | | | | | | | | | 924,742 | | | | 2.59 | |
Russian Federation (Cost $1,673,428) | | | | | | | | | | | | | | | | |
Russian Federal Bond - OFZ 7.400%, 04/19/2017 | | | RUB | | | | 15,140,000 | | | | 485,300 | | | | 1.36 | |
Russian Federal Bond - OFZ 7.400%, 06/14/2017 | | | RUB | | | | 9,320,000 | | | | 298,890 | | | | 0.84 | |
Russian Federal Bond - OFZ 7.600%, 04/14/2021 | | | RUB | | | | 12,800,000 | | | | 414,084 | | | | 1.16 | |
Russian Federal Bond - OFZ 7.600%, 07/20/2022 | | | RUB | | | | 3,709,000 | | | | 119,814 | | | | 0.34 | |
Russian Federal Bond - OFZ 7.000%, 01/25/2023 | | | RUB | | | | 2,649,000 | | | | 82,186 | | | | 0.23 | |
Russian Federal Bond - OFZ 7.000%, 08/16/2023 | | | RUB | | | | 2,653,000 | | | | 81,772 | | | | 0.23 | |
Russian Federal Bond - OFZ 7.050%, 01/19/2028 | | | RUB | | | | 6,553,000 | | | | 196,054 | | | | 0.55 | |
| | | | | | | | | | | 1,678,100 | | | | 4.71 | |
Turkey (Cost $1,399,793) | | | | | | | | | | | | | | | | |
Turkey (Rep of) 9.000%, 03/05/2014 | | | TRY | | | | 1,700,000 | | | | 857,831 | | | | 2.41 | |
Turkiye Garanti Bankasi A.S. 6.790%, 11/15/2013(2) | | | TRY | | | | 931,107 | | | | 464,786 | | | | 1.30 | |
| | | | | | | | | | | 1,322,617 | | | | 3.71 | |
Uruguay (Cost $505,655) | | | | | | | | | | | | | | | | |
Uruguay (Rep of) 5.000%, 09/14/2018 | | | UYU | | | | 2,864,347 | | | | 149,386 | | | | 0.42 | |
Uruguay (Rep of) 4.250%, 04/05/2027 | | | UYU | | | | 3,017,950 | | | | 151,122 | | | | 0.42 | |
Uruguay (Rep of) 4.375%, 12/15/2028 | | | UYU | | | | 2,417,184 | | | | 124,311 | | | | 0.35 | |
Uruguay (Rep of) 3.700%, 06/26/2037 | | | UYU | | | | 2,230,088 | | | | 105,191 | | | | 0.30 | |
| | | | | | | | | | | 530,010 | | | | 1.49 | |
Total Debt Securities (Cost $8,129,995) | | | | | | | | | | | 7,996,252 | | | | 22.43 | |
See accompanying notes to the financial statements.
57
ASHMORE EMERGING MARKETS CURRENCY FUND(A)
SCHEDULE OF INVESTMENTS (CONTINUED)
As of October 31, 2013
| | | | | | | | | | | | | | | | |
| | | Currency | | | Par | | | Value | | | % of Net
Assets | |
Short-Term Investments | | | | | | | | | | | | | | | | |
| | | | |
ABN Amro Bank Jersey, Time Deposit
0.160%, 11/29/2013 | | | | | | | 3,400,000 | | | $ | 3,400,000 | | | | 9.54 | |
Landesbank-Hessen Thueringen, Time Deposit
0.100%, 11/01/2013 | | | | | | | 3,200,000 | | | | 3,200,000 | | | | 8.98 | |
National Bank Abu Dhabi, Time Deposit
0.120%, 11/07/2013 | | | | | | | 3,200,000 | | | | 3,200,000 | | | | 8.97 | |
Riyad Bank London, Time Deposit
0.120%, 11/06/2013 | | | | | | | 3,200,000 | | | | 3,200,000 | | | | 8.98 | |
| | | | |
Total Short-Term Investments (Cost $13,000,000) | | | | | | | | | | | 13,000,000 | | | | 36.47 | |
| | | | |
| | | Currency(1) | | | Number
of
Contracts | | | Value | | | % of Net
Assets | |
Purchased Options | | | | | | | | | | | | | | | | |
| | | | |
United States (Premiums Paid $36,378) | | | | | | | | | | | | | | | | |
Euro Volatility Quoted American Style Options,
Exp. 11/08/2013, Strike Price $1.26 | | | EUR | | | | 1,800,000 | | | $ | 25 | | | | — | |
Total Purchased Options (Premiums Paid $36,378) | | | | | | | | | | | 25 | | | | — | |
| | | | |
Total Investments (Total Cost $21,166,373) | | | | | | | | | | | 20,996,277 | | | | 58.90 | |
| | |
Other Assets Less Liabilities (See statements of Assets and Liabilities for further detail) | | | | 14,651,547 | | | | 41.10 | |
| | | | |
Net Assets | | | | | | | | | | $ | 35,647,824 | | | | 100.00 | |
| (1) | Par values are stated in United States Dollars unless otherwise noted below. |
| (2) | Zero coupon bond reflects effective yield on the date of purchase. |
Percentages shown are based on net assets.
See accompanying notes to the financial statements.
58
ASHMORE EMERGING MARKETS CURRENCY FUND(A)
SCHEDULE OF INVESTMENTS (CONTINUED)
As of October 31, 2013
At October 31, 2013, the Ashmore Emerging Markets Currency Fund had outstanding forward foreign currency exchange contracts as follows:
| | | | | | | | | | | | | | | | | | |
Settlement
Date | | Counterparty | | Currency Buy | | Currency Buy
Amount (Local Currency) | | | Currency Sell | | Currency Sell
Amount
(Local
Currency) | | | Unrealized Gain/(Loss) | |
11/04/2013 | | Goldman Sachs Intl Ltd. London | | Brazilian Real | | | 382,984 | | | United States Dollar | | | 175,000 | | | $ | (4,205) | |
11/04/2013 | | HSBC Bank PLC | | Brazilian Real | | | 1,183,627 | | | United States Dollar | | | 538,985 | | | | (11,136) | |
11/04/2013 | | Standard Chartered London | | Brazilian Real | | | 3,952,481 | | | United States Dollar | | | 1,775,518 | | | | (12,875) | |
11/04/2013 | | Barclays Wholesale GTS | | United States Dollar | | | 22,462 | | | Brazilian Real | | | 50,193 | | | | 79 | |
11/04/2013 | | Goldman Sachs Intl Ltd. London | | United States Dollar | | | 969,159 | | | Brazilian Real | | | 2,121,490 | | | | 23,062 | |
11/04/2013 | | Morgan Stanley & Co. International | | United States Dollar | | | 1,490,122 | | | Brazilian Real | | | 3,347,409 | | | | (2,686) | |
11/12/2013 | | Chase Manhattan Bank London | | Argentine Peso | | | 2,515,800 | | | United States Dollar | | | 410,341 | | | | 7,545 | |
11/15/2013 | | Goldman Sachs Intl Ltd. London | | Malaysian Ringgit | | | 1,100,000 | | | United States Dollar | | | 338,837 | | | | 7,955 | |
11/29/2013 | | Barclays Wholesale GTS | | Chilean Peso | | | 65,560,000 | | | United States Dollar | | | 131,541 | | | | (4,134) | |
11/29/2013 | | Citibank London | | Chilean Peso | | | 115,281,993 | | | United States Dollar | | | 228,553 | | | | (4,518) | |
11/29/2013 | | Goldman Sachs Intl Ltd. London | | Chilean Peso | | | 67,325,985 | | | United States Dollar | | | 133,942 | | | | (3,105) | |
11/29/2013 | | Standard Chartered London | | Chilean Peso | | | 226,636,025 | | | United States Dollar | | | 451,152 | | | | (10,714) | |
11/29/2013 | | Standard Chartered London | | Chinese Yuan Renminbi | | | 21,716,010 | | | United States Dollar | | | 3,538,654 | | | | (2,912) | |
11/29/2013 | | Citibank London | | Colombian Peso | | | 760,192,090 | | | United States Dollar | | | 402,644 | | | | (2,000) | |
11/29/2013 | | Citibank London | | Indian Rupee | | | 80,093,028 | | | United States Dollar | | | 1,292,866 | | | | (15,586) | |
11/29/2013 | | Union Bank of Switzerland - London | | Indian Rupee | | | 83,000,000 | | | United States Dollar | | | 1,337,847 | | | | (14,208) | |
11/29/2013 | | Union Bank of Switzerland - London | | Indonesian Rupiah | | | 7,831,410,638 | | | United States Dollar | | | 686,665 | | | | 17,278 | |
11/29/2013 | | Bank of America | | Israeli Shekel | | | 2,161,935 | | | United States Dollar | | | 589,730 | | | | 23,049 | |
11/29/2013 | | Barclays Wholesale GTS | | Malaysian Ringgit | | | 2,000,000 | | | United States Dollar | | | 621,562 | | | | 5,910 | |
11/29/2013 | | BNP Paribas | | Malaysian Ringgit | | | 318,080 | | | United States Dollar | | | 99,824 | | | | (31) | |
11/29/2013 | | BNP Paribas | | Malaysian Ringgit | | | 547,205 | | | United States Dollar | | | 170,103 | | | | 1,575 | |
11/29/2013 | | Chase Manhattan Bank London | | Malaysian Ringgit | | | 1,000,000 | | | United States Dollar | | | 310,771 | | | | 2,965 | |
11/29/2013 | | Barclays Wholesale GTS | | Mexican Peso | | | 4,287,000 | | | United States Dollar | | | 333,775 | | | | (5,954) | |
11/29/2013 | | Chase Manhattan Bank London | | Mexican Peso | | | 7,243,434 | | | United States Dollar | | | 543,572 | | | | 10,324 | |
11/29/2013 | | Deutsche Bank London | | Mexican Peso | | | 4,287,000 | | | United States Dollar | | | 331,234 | | | | (3,413) | |
11/29/2013 | | CSFB Global Foreign Exchange London | | Peruvian Neuevo Sol | | | 1,049,065 | | | United States Dollar | | | 374,934 | | | | 1,935 | |
11/29/2013 | | CSFB Global Foreign Exchange London | | Peruvian Neuevo Sol | | | 553,000 | | | United States Dollar | | | 200,000 | | | | (1,339) | |
11/29/2013 | | Barclays Wholesale GTS | | Philippine Peso | | | 19,299,056 | | | United States Dollar | | | 448,502 | | | | (2,616) | |
11/29/2013 | | Bank of America | | Polish Zloty | | | 1,017,760 | | | United States Dollar | | | 320,000 | | | | 9,800 | |
11/29/2013 | | Barclays Wholesale GTS | | Romanian Leu | | | 1,889,060 | | | United States Dollar | | | 569,114 | | | | 8,323 | |
11/29/2013 | | Bank of America | | Russian Ruble | | | 100,962,113 | | | United States Dollar | | | 3,170,224 | | | | (40,861) | |
11/29/2013 | | Morgan Stanley & Co. International | | Singapore Dollar | | | 3,602,483 | | | United States Dollar | | | 2,901,111 | | | | (982) | |
11/29/2013 | | Barclays Wholesale GTS | | South African Rand | | | 3,896 | | | United States Dollar | | | 394 | | | | (7) | |
11/29/2013 | | Goldman Sachs Intl Ltd. London | | South African Rand | | | 7,879,461 | | | United States Dollar | | | 793,860 | | | | (12,177) | |
11/29/2013 | | Barclays Wholesale GTS | | Thai Baht | | | 8,000,000 | | | United States Dollar | | | 254,647 | | | | 1,913 | |
11/29/2013 | | Citibank London | | Thai Baht | | | 10,000,000 | | | United States Dollar | | | 317,339 | | | | 3,360 | |
11/29/2013 | | HSBC Bank PLC | | Thai Baht | | | 5,000,000 | | | United States Dollar | | | 159,312 | | | | 1,038 | |
11/29/2013 | | Morgan Stanley & Co. International | | Turkish Lira | | | 1,035,762 | | | United States Dollar | | | 520,000 | | | | (3,820) | |
11/29/2013 | | Union Bank of Switzerland - London | | United States Dollar | | | 20,106 | | | Chilean Peso | | | 10,204,731 | | | | 274 | |
11/29/2013 | | Citibank London | | United States Dollar | | | 165,000 | | | Colombian Peso | | | 314,004,900 | | | | (490) | |
11/29/2013 | | Deutsche Bank London | | United States Dollar | | | 158,042 | | | Colombian Peso | | | 299,805,480 | | | | 35 | |
11/29/2013 | | HSBC Bank PLC | | United States Dollar | | | 18,410 | | | Czech Koruna | | | 348,292 | | | | 79 | |
11/29/2013 | | HSBC Bank PLC | | United States Dollar | | | 67,945 | | | Hungarian Forint | | | 15,418,780 | | | | (2,737) | |
11/29/2013 | | Standard Chartered London | | United States Dollar | | | 15,336 | | | Hungarian Forint | | | 3,365,641 | | | | (92) | |
11/29/2013 | | Barclays Wholesale GTS | | United States Dollar | | | 71,519 | | | Israeli Shekel | | | 251,814 | | | | 145 | |
11/29/2013 | | Bank of America | | United States Dollar | | | 235,726 | | | Mexican Peso | | | 3,042,517 | | | | 3,069 | |
11/29/2013 | | Deutsche Bank London | | United States Dollar | | | 17,981 | | | Peruvian Neuevo Sol | | | 50,329 | | | | (99) | |
11/29/2013 | | Barclays Wholesale GTS | | United States Dollar | | | 250,000 | | | Polish Zloty | | | 784,950 | | | | (4,359) | |
11/29/2013 | | Barclays Wholesale GTS | | United States Dollar | | | 525,229 | | | Polish Zloty | | | 1,650,251 | | | | (9,526) | |
11/29/2013 | | Deutsche Bank London | | United States Dollar | | | 470,000 | | | Polish Zloty | | | 1,477,034 | | | | (8,625) | |
11/29/2013 | | Goldman Sachs Intl Ltd. London | | United States Dollar | | | 577,357 | | | Romanian Leu | | | 1,904,411 | | | | (4,773) | |
11/29/2013 | | ING | | United States Dollar | | | 64,438 | | | Romanian Leu | | | 212,535 | | | | (529) | |
11/29/2013 | | Barclays Wholesale GTS | | United States Dollar | | | 91,390 | | | Russian Ruble | | | 2,972,977 | | | | (758) | |
11/29/2013 | | Barclays Wholesale GTS | | United States Dollar | | | 210,309 | | | Russian Ruble | | | 6,836,926 | | | | (1,605) | |
11/29/2013 | | Goldman Sachs Intl Ltd. London | | United States Dollar | | | 1,012,182 | | | Russian Ruble | | | 32,933,886 | | | | (8,617) | |
11/29/2013 | | Goldman Sachs Intl Ltd. London | | United States Dollar | | | 35,181 | | | Thai Baht | | | 1,103,870 | | | | (220) | |
See accompanying notes to the financial statements.
59
ASHMORE EMERGING MARKETS CURRENCY FUND(A)
SCHEDULE OF INVESTMENTS (CONTINUED)
As of October 31, 2013
| | | | | | | | | | | | | | | | | | |
Settlement
Date | | Counterparty | | Currency Buy | | Currency Buy
Amount (Local Currency) | | | Currency Sell | | Currency Sell
Amount
(Local
Currency) | | | Unrealized Gain/(Loss) | |
11/29/2013 | | Citibank London | | United States Dollar | | | 39,618 | | | Turkish Lira | | | 80,326 | | | $ | (413) | |
11/29/2013 | | Citibank London | | United States Dollar | | | 653,707 | | | Turkish Lira | | | 1,325,391 | | | | (6,811) | |
11/29/2013 | | Deutsche Bank London | | United States Dollar | | | 360,244 | | | Turkish Lira | | | 718,542 | | | | 2,153 | |
12/02/2013 | | Deutsche Bank London | | Czech Koruna | | | 3,257,158 | | | United States Dollar | | | 174,678 | | | | (3,250) | |
12/02/2013 | | Barclays Wholesale GTS | | Russian Ruble | | | 6,951,298 | | | United States Dollar | | | 218,085 | | | | (2,762) | |
12/02/2013 | | Barclays Wholesale GTS | | Russian Ruble | | | 41,431,825 | | | United States Dollar | | | 1,299,455 | | | | (16,065) | |
12/02/2013 | | Barclays Wholesale GTS | | United States Dollar | | | 510,000 | | | Russian Ruble | | | 16,294,500 | | | | 5,262 | |
12/03/2013 | | Union Bank of Switzerland - London | | Argentine Peso | | | 574,000 | | | United States Dollar | | | 89,457 | | | | 2,718 | |
12/03/2013 | | Goldman Sachs Intl Ltd. London | | Brazilian Real | | | 2,121,490 | | | United States Dollar | | | 962,716 | | | | (23,181) | |
12/13/2013 | | ANZ Banking Corp. Melbourne | | Indonesian Rupiah | | | 1,000,000,000 | | | United States Dollar | | | 90,212 | | | | (597) | |
12/13/2013 | | Union Bank of Switzerland - London | | Indonesian Rupiah | | | 810,000,000 | | | United States Dollar | | | 73,006 | | | | (418) | |
12/13/2013 | | BNP Paribas | | Thai Baht | | | 4,000,000 | | | United States Dollar | | | 127,571 | | | | 588 | |
12/13/2013 | | Chase Manhattan Bank London | | Thai Baht | | | 1,257,546 | | | United States Dollar | | | 40,113 | | | | 178 | |
12/13/2013 | | Citibank London | | Thai Baht | | | 4,000,000 | | | United States Dollar | | | 127,518 | | | | 641 | |
12/13/2013 | | Union Bank of Switzerland - London | | Thai Baht | | | 4,000,000 | | | United States Dollar | | | 127,458 | | | | 702 | |
12/16/2013 | | HSBC Bank PLC | | Chinese Offshore Yuan | | | 1,932,012 | | | United States Dollar | | | 313,130 | | | | 3,496 | |
12/16/2013 | | HSBC Bank PLC | | Chinese Offshore Yuan | | | 5,710,712 | | | United States Dollar | | | 935,695 | | | | 199 | |
12/16/2013 | | HSBC Bank PLC | | Chinese Offshore Yuan | | | 141,013 | | | United States Dollar | | | 23,000 | | | | 110 | |
12/16/2013 | | HSBC Bank PLC | | Thai Baht | | | 17,093,551 | | | United States Dollar | | | 542,480 | | | | 5,084 | |
12/16/2013 | | HSBC Bank PLC | | United States Dollar | | | 1,250,000 | | | Chinese Offshore Yuan | | | 7,783,738 | | | | (25,630) | |
12/17/2013 | | Goldman Sachs Intl Ltd. London | | Taiwan Dollar | | | 64,124,974 | | | United States Dollar | | | 2,190,435 | | | | (10,863) | |
01/03/2014 | | Morgan Stanley & Co. International | | Brazilian Real | | | 510,674 | | | United States Dollar | | | 230,000 | | | | (5,433) | |
01/31/2014 | | Barclays Wholesale GTS | | Czech Koruna | | | 23,292,735 | | | United States Dollar | | | 1,245,354 | | | | (18,889) | |
01/31/2014 | | Union Bank of Switzerland - London | | Czech Koruna | | | 2,980,600 | | | United States Dollar | | | 160,000 | | | | (3,058) | |
01/31/2014 | | Deutsche Bank London | | Hungarian Forint | | | 193,659,202 | | | United States Dollar | | | 907,919 | | | | (23,672) | |
01/31/2014 | | Bank of America | | Mexican Peso | | | 2,366,483 | | | United States Dollar | | | 179,352 | | | | 707 | |
01/31/2014 | | Standard Chartered London | | Mexican Peso | | | 8,550,184 | | | United States Dollar | | | 657,712 | | | | (7,150) | |
01/31/2014 | | Morgan Stanley & Co. International | | Peruvian Neuevo Sol | | | 798,546 | | | United States Dollar | | | 285,961 | | | | (924) | |
01/31/2014 | | Barclays Wholesale GTS | | Polish Zloty | | | 7,602,422 | | | United States Dollar | | | 2,496,338 | | | | (42,293) | |
01/31/2014 | | Barclays Wholesale GTS | | Romanian Leu | | | 609,227 | | | United States Dollar | | | 187,958 | | | | (2,366) | |
01/31/2014 | | Barclays Wholesale GTS | | United States Dollar | | | 347,136 | | | Romanian Leu | | | 1,123,332 | | | | 4,930 | |
01/31/2014 | | CSFB Global Foreign Exchange London | | United States Dollar | | | 99,576 | | | Russian Ruble | | | 3,232,823 | | | | 454 | |
01/31/2014 | | Deutsche Bank London | | United States Dollar | | | 196,052 | | | Russian Ruble | | | 6,341,987 | | | | 1,601 | |
01/31/2014 | | Deutsche Bank London | | United States Dollar | | | 98,404 | | | Russian Ruble | | | 3,193,198 | | | | 497 | |
01/31/2014 | | HSBC Bank PLC | | United States Dollar | | | 285,233 | | | Russian Ruble | | | 9,287,608 | | | | 467 | |
02/28/2014 | | Chase Manhattan Bank London | | Mexican Peso | | | 7,397,987 | | | United States Dollar | | | 562,585 | | | | (913) | |
04/13/2015 | | HSBC Bank PLC | | Chinese Offshore Yuan | | | 7,419,240 | | | United States Dollar | | | 1,110,000 | | | | 87,283 | |
04/13/2015 | | HSBC Bank PLC | | Chinese Offshore Yuan | | | 7,116,635 | | | United States Dollar | | | 1,085,266 | | | | 63,183 | |
04/13/2015 | | HSBC Bank PLC | | United States Dollar | | | 1,328 | | | Chinese Offshore Yuan | | | 8,705 | | | | (76) | |
04/13/2015 | | HSBC Bank PLC | | United States Dollar | | | 590,000 | | | Chinese Offshore Yuan | | | 3,813,170 | | | | (25,352) | |
04/13/2015 | | HSBC Bank PLC | | United States Dollar | | | 590,000 | | | Chinese Offshore Yuan | | | 3,825,265 | | | | (27,304) | |
04/13/2015 | | HSBC Bank PLC | | United States Dollar | | | 1,050,000 | | | Chinese Offshore Yuan | | | 6,888,735 | | | | (61,672) | |
05/04/2015 | | Standard Chartered London | | Chinese Offshore Yuan | | | 7,614,360 | | | United States Dollar | | | 1,160,726 | | | | 67,308 | |
05/04/2015 | | Standard Chartered London | | United States Dollar | | | 1,170,000 | | | Chinese Offshore Yuan | | | 7,614,360 | | | | (58,033) | |
07/17/2015 | | Standard Chartered London | | Chinese Offshore Yuan | | | 7,141,600 | | | United States Dollar | | | 1,074,571 | | | | 74,781 | |
07/17/2015 | | Standard Chartered London | | Chinese Offshore Yuan | | | 1,410,455 | | | United States Dollar | | | 214,469 | | | | 12,526 | |
07/17/2015 | | Standard Chartered London | | United States Dollar | | | 1,290,000 | | | Chinese Offshore Yuan | | | 8,552,055 | | | | (86,348) | |
| | | | | | | | | | | | | | | | | | |
Total | | | | | | | | | | | | | | $ | (190,601) | |
| | | | | | | | | | | | | | | | | | |
See accompanying notes to the financial statements.
60
ASHMORE EMERGING MARKETS CURRENCY FUND(A)
SCHEDULE OF INVESTMENTS (CONTINUED)
As of October 31, 2013
The inputs or methodologies used for valuing securities are not necessarily an indication of the risks associated with investing in those securities and other financial instruments, if any. See note 4 in the Notes to the Financial Statements for more information regarding pricing inputs and valuation techniques. The following is a summary of the inputs used in valuing the Ashmore Emerging Markets Local Currency Fund’s investments and other financial instruments, which are carried at fair value, as of October 31, 2013:
| | | | | | | | | | | | |
| | | Level 1 | | Level 2 | | | Level 3 | | Total | |
Investments | | | | | | | | | | | | |
Assets: | | | | | | | | | | | | |
Government Bonds | | $— | | $ | 6,845,191 | | | $— | | $ | 6,845,191 | |
Index Linked Government Bonds | | — | | | 530,010 | | | — | | | 530,010 | |
Corporate Bonds | | — | | | 621,051 | | | — | | | 621,051 | |
Short-Term Investments | | — | | | 13,000,000 | | | — | | | 13,000,000 | |
Purchased Options | | — | | | 25 | | | — | | | 25 | |
Total Investments | | $— | | $ | 20,996,277 | | | $— | | $ | 20,996,277 | |
Other Financial Instruments | | | | | | | | | | | | |
Assets: | | | | | | | | | | | | |
Forward Foreign Currency Exchange Contracts | | $— | | $ | 464,581 | | | $— | | $ | 464,581 | |
Liabilities: | | | | | | | | | | | | |
Forward Foreign Currency Exchange Contracts | | — | | | (655,182 | ) | | — | | | (655,182 | ) |
Total Other Financial Instruments | | $— | | $ | (190,601 | ) | | $— | | $ | (190,601 | ) |
The Fund discloses all transfers between levels based on valuations at the end of each reporting period. At October 31, 2013 there were no transfers between Level 1, Level 2 and Level 3 based on levels assigned to the securities on October 31, 2012. U.S. GAAP provides additional guidance for estimating fair value when the volume and level of activity for the asset or liability have significantly decreased as well as guidance on identifying circumstances that indicate when a transaction is not orderly.
See accompanying notes to the financial statements.
61
ASHMORE EMERGING MARKETS CURRENCY FUND(A)
SCHEDULE OF INVESTMENTS (CONTINUED)
As of October 31, 2013
The following is a summary of the fair values of the Fund’s derivative instruments*:
Fair Values of Financial Derivative Instruments on the Statements of Assets and Liabilities as of October 31, 2013:
| | |
| | | Derivatives Not Accounted
for as Hedging Instruments |
| | | Foreign Exchange |
Assets: | | |
Unrealized Appreciation on Forward Foreign Currency Exchange Contracts | | $ 464,581 |
| | |
Liabilities: | | |
Unrealized Depreciation on Forward Foreign Currency Exchange Contracts | | $(655,182) |
| | |
The Effect of Financial Derivative Instruments on the Statements of Operations for the Period Ended October 31, 2013:
| | | | | | | | |
| | | Derivatives Not Accounted
for as Hedging Instruments | |
| | | Foreign
Exchange | | | Fixed Income/ Interest Rate | |
Realized Gain (Loss) on Derivatives Recognized resulting from Operations: | | | | | | | | |
Net Realized Gain on Forward Foreign Currency Exchange Contracts | | $ | 972,420 | | | $ | — | |
Net Realized Loss on Options Contracts | | | — | | | | (73,606 | ) |
| | | | |
| | $ | 972,420 | | | $ | (73,606 | ) |
| | | | |
Net Change in Unrealized Appreciation (Depreciation) on Derivatives Recognized resulting from Operations: | | | | | | | | |
Net Change in Unrealized Depreciation on Forward Foreign Currency Exchange Contracts | | $ | (553,880 | ) | | $ | — | |
Net Change in Unrealized Depreciation on Options Contracts | | | — | | | | (36,353 | ) |
| | | | |
| | $ | (553,879 | ) | | $ | (36,353 | ) |
| | | | |
* See note 9 in the Notes to the Financial Statements for additional information.
At October 31, 2013, for U.S. federal income tax purposes, gross unrealized appreciation, gross unrealized depreciation, net unrealized appreciation/(depreciation) on investments in securities (including the effects of foreign currency translation) and the cost basis of investments were as follows:
| | | | |
Federal tax cost of investments | | | $21,166,373 | |
Gross tax appreciation of investments | | | $50,238 | |
Gross tax depreciation of investments | | | (220,334) | |
Net tax depreciation of investments | | | $(170,096) | |
The difference between book basis and tax basis net unrealized appreciation or depreciation is attributable primarily to the tax deferral of losses on wash sales.
(A)Formerly the Ashmore Emerging Markets Local Currency Fund. See note 1 to the Financial Statements.
See accompanying notes to the financial statements.
62
ASHMORE EMERGING MARKETS SOVEREIGN DEBT FUND
SCHEDULE OF INVESTMENTS
As of October 31, 2013
| | | | | | | | | | | | | | |
| | | Currency(1) | | Par | | | Value | | | % of Net
Assets | |
Debt Securities | | | | | | | | | | | | | | |
| | | | |
Argentina (Cost $1,093,500) | | | | | | | | | | | | | | |
Argentina (Rep of) 8.750%, 06/02/2017 | | | | | 84,000 | | | $ | 73,080 | | | | 0.25 | |
Argentina (Rep of) 8.280%, 12/31/2033 | | | | | 128,081 | | | | 89,657 | | | | 0.31 | |
Argentina Boden Bonds 7.000%, 10/03/2015 | | | | | 769,000 | | | | 723,569 | | | | 2.50 | |
Argentine (Rep of) 8.280%, 12/31/2033 | | | | | 352,485 | | | | 252,907 | | | | 0.87 | |
| | | | | | | | | 1,139,213 | | | | 3.93 | |
Azerbaijan (Cost $317,311) | | | | | | | | | | | | | | |
State Oil Co. of the Azerbaijan Republic
5.450%, 02/09/2017 | | | | | 300,000 | | | | 320,550 | | | | 1.11 | |
| | | | | | | | | 320,550 | | | | 1.11 | |
Belarus (Cost $545,649) | | | | | | | | | | | | | | |
Belarus (Rep of) 8.750%, 08/03/2015 | | | | | 170,000 | | | | 170,213 | | | | 0.59 | |
Belarus (Rep of) 8.950%, 01/26/2018 | | | | | 380,000 | | | | 378,100 | | | | 1.30 | |
| | | | | | | | | 548,313 | | | | 1.89 | |
Bolivia (Cost $59,470) | | | | | | | | | | | | | | |
Bolivian (Rep of) 4.875%, 10/29/2022 | | | | | 60,000 | | | | 58,500 | | | | 0.20 | |
| | | | | | | | | 58,500 | | | | 0.20 | |
Brazil (Cost $1,161,337) | | | | | | | | | | | | | | |
Banco Nacional de Desenvolvimento Economico e Social
6.500%, 06/10/2019 | | | | | 120,000 | | | | 132,450 | | | | 0.46 | |
Banco Nacional de Desenvolvimento Economico e Social
5.500%, 07/12/2020 | | | | | 100,000 | | | | 105,000 | | | | 0.36 | |
Brazil (Fed Rep of) 5.875%, 01/15/2019 | | | | | 100,000 | | | | 115,350 | | | | 0.40 | |
Brazil (Fed Rep of) 4.875%, 01/22/2021 | | | | | 150,000 | | | | 162,750 | | | | 0.56 | |
Brazil (Fed Rep of) 2.625%, 01/05/2023 | | | | | 200,000 | | | | 178,500 | | | | 0.61 | |
Brazil (Fed Rep of) 8.875%, 04/15/2024 | | | | | 100,000 | | | | 140,000 | | | | 0.48 | |
Brazil (Fed Rep of) 4.250%, 01/07/2025(2) | | | | | 296,000 | | | | 289,192 | | | | 1.00 | |
| | | | | | | | | 1,123,242 | | | | 3.87 | |
Chile (Cost $386,074) | | | | | | | | | | | | | | |
Banco del Estado de Chile 3.875%, 02/08/2022 | | | | | 150,000 | | | | 146,689 | | | | 0.50 | |
Corp. Nacional del Cobre de Chile 7.500%, 01/15/2019 | | | | | 100,000 | | | | 121,216 | | | | 0.42 | |
Empresa Nacional del Petroleo 5.250%, 08/10/2020 | | | | | 100,000 | | | | 104,069 | | | | 0.36 | |
| | | | | | | | | 371,974 | | | | 1.28 | |
China (Cost $521,558) | | | | | | | | | | | | | | |
Sinochem Overseas Capital Co. Ltd. 4.500%, 11/12/2020 | | | | | 390,000 | | | | 398,872 | | | | 1.37 | |
Sinochem Overseas Capital Co. Ltd. 6.300%, 11/12/2040 | | | | | 100,000 | | | | 107,263 | | | | 0.37 | |
| | | | | | | | | 506,135 | | | | 1.74 | |
Colombia (Cost $1,149,886) | | | | | | | | | | | | | | |
Colombia (Rep of) 7.375%, 03/18/2019 | | | | | 260,000 | | | | 317,850 | | | | 1.09 | |
Colombia (Rep of) 11.750%, 02/25/2020 | | | | | 40,000 | | | | 58,600 | | | | 0.20 | |
Colombia (Rep of) 4.375%, 07/12/2021 | | | | | 200,000 | | | | 211,800 | | | | 0.73 | |
Colombia (Rep of) 8.125%, 05/21/2024 | | | | | 100,000 | | | | 132,500 | | | | 0.46 | |
Colombia (Rep of) 7.375%, 09/18/2037 | | | | | 200,000 | | | | 258,000 | | | | 0.89 | |
Colombia (Rep of) 6.125%, 01/18/2041 | | | | | 110,000 | | | | 124,575 | | | | 0.43 | |
| | | | | | | | | 1,103,325 | | | | 3.80 | |
Costa Rica (Cost $471,225) | | | | | | | | | | | | | | |
Costa Rica (Rep of) 4.250%, 01/26/2023 | | | | | 140,000 | | | | 133,000 | | | | 0.46 | |
Costa Rica (Rep of) 4.375%, 04/30/2025 | | | | | 60,000 | | | | 55,200 | | | | 0.19 | |
Costa Rica (Rep of) 5.625%, 04/30/2043 | | | | | 60,000 | | | | 53,250 | | | | 0.18 | |
Instituto Costarricense de Electricidad 6.950%, 11/10/2021 | | | | | 200,000 | | | | 211,200 | | | | 0.73 | |
| | | | | | | | | 452,650 | | | | 1.56 | |
See accompanying notes to the financial statements.
63
ASHMORE EMERGING MARKETS SOVEREIGN DEBT FUND
SCHEDULE OF INVESTMENTS (CONTINUED)
As of October 31, 2013
| | | | | | | | | | | | | | |
| | | Currency(1) | | Par | | | Value | | | % of Net
Assets | |
Croatia (Cost $712,791) | | | | | | | | | | | | | | |
Croatia (Rep of) 6.250%, 04/27/2017 | | | | | 200,000 | | | $ | 213,384 | | | | 0.74 | |
Croatia (Rep of) 6.750%, 11/05/2019 | | | | | 200,000 | | | | 218,000 | | | | 0.75 | |
Croatia (Rep of) 6.625%, 07/14/2020 | | | | | 270,000 | | | | 291,600 | | | | 1.00 | |
| | | | | | | | | 722,984 | | | | 2.49 | |
Dominican Republic (Cost $266,767) | | | | | | | | | | | | | | |
Dominican (Rep of) 7.500%, 05/06/2021 | | | | | 100,000 | | | | 110,650 | | | | 0.38 | |
Dominican (Rep of) 5.875%, 04/18/2024 | | | | | 160,000 | | | | 157,360 | | | | 0.54 | |
| | | | | | | | | 268,010 | | | | 0.92 | |
Ecuador (Cost $100,000) | | | | | | | | | | | | | | |
Ecuador (Rep of) 9.375%, 12/15/2015 | | | | | 100,000 | | | | 106,500 | | | | 0.37 | |
| | | | | | | | | 106,500 | | | | 0.37 | |
Egypt (Cost $194,823) | | | | | | | | | | | | | | |
Egypt Government International Bond 5.750%, 04/29/2020 | | | | | 110,000 | | | | 101,200 | | | | 0.35 | |
Nile Finance Ltd. 5.250%, 08/05/2015 | | | | | 100,000 | | | | 98,000 | | | | 0.34 | |
| | | | | | | | | 199,200 | | | | 0.69 | |
El Salvador (Cost $333,611) | | | | | | | | | | | | | | |
El Salvador (Rep of) 7.375%, 12/01/2019 | | | | | 100,000 | | | | 112,500 | | | | 0.39 | |
El Salvador (Rep of) 5.875%, 01/30/2025 | | | | | 80,000 | | | | 79,400 | | | | 0.27 | |
El Salvador (Rep of) 8.250%, 04/10/2032 | | | | | 70,000 | | | | 79,800 | | | | 0.28 | |
El Salvador (Rep of) 7.650%, 06/15/2035 | | | | | 60,000 | | | | 63,450 | | | | 0.22 | |
| | | | | | | | | 335,150 | | | | 1.16 | |
Georgia (Cost $217,785) | | | | | | | | | | | | | | |
Georgian Railway JSC 7.750%, 07/11/2022 | | | | | 200,000 | | | | 216,500 | | | | 0.75 | |
| | | | | | | | | 216,500 | | | | 0.75 | |
Ghana (Cost $107,368) | | | | | | | | | | | | | | |
Ghana (Rep of) 8.500%, 10/04/2017 | | | | | 100,000 | | | | 109,250 | | | | 0.38 | |
| | | | | | | | | 109,250 | | | | 0.38 | |
Guatemala (Cost $150,073) | | | | | | | | | | | | | | |
Guatemala (Rep of) 4.875%, 02/13/2028 | | | | | 150,000 | | | | 141,300 | | | | 0.49 | |
| | | | | | | | | 141,300 | | | | 0.49 | |
Hungary (Cost $931,804) | | | | | | | | | | | | | | |
Hungary (Rep of) 4.125%, 02/19/2018 | | | | | 130,000 | | | | 131,300 | | | | 0.45 | |
Hungary (Rep of) 6.250%, 01/29/2020 | | | | | 140,000 | | | | 152,180 | | | | 0.52 | |
Hungary (Rep of) 6.375%, 03/29/2021 | | | | | 178,000 | | | | 193,352 | | | | 0.67 | |
Hungary (Rep of) 5.375%, 02/21/2023 | | | | | 270,000 | | | | 268,934 | | | | 0.93 | |
Hungary (Rep of) 7.625%, 03/29/2041 | | | | | 204,000 | | | | 229,755 | | | | 0.79 | |
| | | | | | | | | 975,521 | | | | 3.36 | |
Indonesia (Cost $1,489,101) | | | | | | | | | | | | | | |
Indonesia (Rep of) 10.375%, 05/04/2014 | | | | | 90,000 | | | | 93,825 | | | | 0.32 | |
Indonesia (Rep of) 6.875%, 01/17/2018 | | | | | 30,000 | | | | 34,050 | | | | 0.12 | |
Indonesia (Rep of) 5.875%, 03/13/2020 | | | | | 120,000 | | | | 131,400 | | | | 0.45 | |
Indonesia (Rep of) 4.875%, 05/05/2021 | | | | | 200,000 | | | | 207,500 | | | | 0.71 | |
Indonesia (Rep of) 7.750%, 01/17/2038 | | | | | 100,000 | | | | 121,875 | | | | 0.42 | |
Majapahit Holding B.V. 7.750%, 10/17/2016 | | | | | 100,000 | | | | 112,000 | | | | 0.39 | |
Majapahit Holding B.V. 8.000%, 08/07/2019 | | | | | 110,000 | | | | 127,463 | | | | 0.44 | |
Pertamina Persero PT 6.000%, 05/03/2042 | | | | | 200,000 | | | | 177,000 | | | | 0.61 | |
Pertamina Persero PT 5.625%, 05/20/2043 | | | | | 200,000 | | | | 168,000 | | | | 0.58 | |
Perusahaan Listrik Negara PT 5.500%, 11/22/2021 | | | | | 200,000 | | | | 201,000 | | | | 0.69 | |
Perusahaan Listrik Negara PT 5.250%, 10/24/2042 | | | | | 35,000 | | | | 28,175 | | | | 0.10 | |
| | | | | | | | | 1,402,288 | | | | 4.83 | |
Iraq (Cost $457,502) | | | | | | | | | | | | | | |
Iraq (Rep of) 5.800%, 01/15/2028 | | | | | 540,000 | | | | 469,800 | | | | 1.62 | |
| | | | | | | | | 469,800 | | | | 1.62 | |
See accompanying notes to the financial statements.
64
ASHMORE EMERGING MARKETS SOVEREIGN DEBT FUND
SCHEDULE OF INVESTMENTS (CONTINUED)
As of October 31, 2013
| | | | | | | | | | | | | | |
| | | Currency(1) | | Par | | | Value | | | % of Net
Assets | |
Ivory Coast (Cost $605,186) | | | | | | | | | | | | | | |
Ivory Coast (Rep of) 5.750%, 12/31/2032 | | | | | 780,000 | | | $ | 702,156 | | | | 2.42 | |
| | | | | | | | | 702,156 | | | | 2.42 | |
Kazakhstan (Cost $1,049,218) | | | | | | | | | | | | | | |
Development Bank of Kazakhstan JSC 4.125%, 12/10/2022 | | | | | 200,000 | | | | 184,500 | | | | 0.64 | |
Kazakhstan Temir Zholy Finance B.V. 6.950%, 07/10/2042 | | | | | 57,000 | | | | 59,636 | | | | 0.20 | |
KazMunaiGaz Finance Sub B.V. 11.750%, 01/23/2015 | | | | | 50,000 | | | | 55,875 | | | | 0.19 | |
KazMunaiGaz Finance Sub B.V. 9.125%, 07/02/2018 | | | | | 130,000 | | | | 159,088 | | | | 0.55 | |
KazMunaiGaz Finance Sub B.V. 7.000%, 05/05/2020 | | | | | 70,000 | | | | 80,062 | | | | 0.28 | |
KazMunaiGaz Finance Sub B.V. 6.375%, 04/09/2021 | | | | | 210,000 | | | | 232,838 | | | | 0.80 | |
KazMunayGas National Co. JSC 4.400%, 04/30/2023 | | | | | 70,000 | | | | 66,409 | | | | 0.23 | |
KazMunayGas National Co. JSC 5.750%, 04/30/2043 | | | | | 225,000 | | | | 204,165 | | | | 0.70 | |
| | | | | | | | | 1,042,573 | | | | 3.59 | |
Latvia (Cost $196,478) | | | | | | | | | | | | | | |
Latvia (Rep of) 2.750%, 01/12/2020 | | | | | 200,000 | | | | 191,250 | | | | 0.66 | |
| | | | | | | | | 191,250 | | | | 0.66 | |
Lebanon (Cost $713,401) | | | | | | | | | | | | | | |
Lebanon (Rep of) 5.150%, 11/12/2018 | | | | | 50,000 | | | | 48,750 | | | | 0.17 | |
Lebanon (Rep of) 6.375%, 03/09/2020 | | | | | 190,000 | | | | 191,900 | | | | 0.66 | |
Lebanon (Rep of) 8.250%, 04/12/2021 | | | | | 94,000 | | | | 104,340 | | | | 0.36 | |
Lebanon (Rep of) 6.100%, 10/04/2022 | | | | | 225,000 | | | | 219,375 | | | | 0.76 | |
Lebanon (Rep of) 6.600%, 11/27/2026 | | | | | 130,000 | | | | 128,050 | | | | 0.44 | |
| | | | | | | | | 692,415 | | | | 2.39 | |
Lithuania (Cost $664,766) | | | | | | | | | | | | | | |
Lithuania (Rep of) 5.125%, 09/14/2017 | | | | | 200,000 | | | | 219,400 | | | | 0.76 | |
Lithuania (Rep of) 7.375%, 02/11/2020 | | | | | 100,000 | | | | 121,500 | | | | 0.42 | |
Lithuania (Rep of) 6.125%, 03/09/2021 | | | | | 100,000 | | | | 114,625 | | | | 0.39 | |
Lithuania (Rep of) 6.625%, 02/01/2022 | | | | | 200,000 | | | | 237,500 | | | | 0.82 | |
| | | | | | | | | 693,025 | | | | 2.39 | |
Malaysia (Cost $336,771) | | | | | | | | | | | | | | |
Petronas Capital Ltd. 7.875%, 05/22/2022 | | | | | 50,000 | | | | 64,694 | | | | 0.22 | |
Wakala Global Sukuk Bhd. 4.646%, 07/06/2021 | | | | | 250,000 | | | | 264,400 | | | | 0.91 | |
| | | | | | | | | 329,094 | | | | 1.13 | |
Mexico (Cost $1,068,002) | | | | | | | | | | | | | | |
Comision Federal de Electricidad 5.750%, 02/14/2042 | | | | | 200,000 | | | | 190,250 | | | | 0.65 | |
Mexico (Rep of) 5.950%, 03/19/2019 | | | | | 60,000 | | | | 69,840 | | | | 0.24 | |
Mexico (Rep of) 6.750%, 09/27/2034 | | | | | 179,000 | | | | 219,275 | | | | 0.76 | |
Mexico (Rep of) 6.050%, 01/11/2040 | | | | | 12,000 | | | | 13,590 | | | | 0.05 | |
Mexico (Rep of) 4.750%, 03/08/2044 | | | | | 94,000 | | | | 88,125 | | | | 0.30 | |
Mexico (Rep of) 5.750%, 10/12/2110 | | | | | 66,000 | | | | 63,855 | | | | 0.22 | |
Pemex Project Funding Master Trust 5.750%, 03/01/2018 | | | | | 60,000 | | | | 66,900 | | | | 0.23 | |
Petroleos Mexicanos 8.000%, 05/03/2019 | | | | | 80,000 | | | | 97,760 | | | | 0.34 | |
Petroleos Mexicanos 6.000%, 03/05/2020 | | | | | 30,000 | | | | 33,675 | | | | 0.12 | |
Petroleos Mexicanos 6.500%, 06/02/2041 | | | | | 136,000 | | | | 144,840 | | | | 0.50 | |
Petroleos Mexicanos 5.500%, 06/27/2044 | | | | | 20,000 | | | | 18,700 | | | | 0.06 | |
| | | | | | | | | 1,006,810 | | | | 3.47 | |
Morocco (Cost $257,019) | | | | | | | | | | | | | | |
Morocco (Rep of) 4.250%, 12/11/2022 | | | | | 150,000 | | | | 141,000 | | | | 0.49 | |
Morocco (Rep of) 5.500%, 12/11/2042 | | | | | 100,000 | | | | 87,500 | | | | 0.30 | |
| | | | | | | | | 228,500 | | | | 0.79 | |
Nigeria (Cost $111,722) | | | | | | | | | | | | | | |
Nigeria (Rep of) 6.750%, 01/28/2021 | | | | | 100,000 | | | | 110,250 | | | | 0.38 | |
| | | | | | | | | 110,250 | | | | 0.38 | |
See accompanying notes to the financial statements.
65
ASHMORE EMERGING MARKETS SOVEREIGN DEBT FUND
SCHEDULE OF INVESTMENTS (CONTINUED)
As of October 31, 2013
| | | | | | | | | | | | | | |
| | | Currency(1) | | Par | | | Value | | | % of Net
Assets | |
Pakistan (Cost $97,161) | | | | | | | | | | | | | | |
Pakistan (Rep of) 7.125%, 03/31/2016 | | | | | 100,000 | | | $ | 99,500 | | | | 0.34 | |
| | | | | | | | | 99,500 | | | | 0.34 | |
Panama (Cost $424,261) | | | | | | | | | | | | | | |
Panama (Rep of) 7.125%, 01/29/2026 | | | | | 100,000 | | | | 124,250 | | | | 0.43 | |
Panama (Rep of) 8.875%, 09/30/2027 | | | | | 40,000 | | | | 55,450 | | | | 0.19 | |
Panama (Rep of) 9.375%, 04/01/2029 | | | | | 80,000 | | | | 115,600 | | | | 0.40 | |
Panama (Rep of) 6.700%, 01/26/2036 | | | | | 65,000 | | | | 76,862 | | | | 0.27 | |
Panama (Rep of) 4.300%, 04/29/2053 | | | | | 30,000 | | | | 24,480 | | | | 0.08 | |
| | | | | | | | | 396,642 | | | | 1.37 | |
Paraguay (Cost $150,890) | | | | | | | | | | | | | | |
Paraguay (Rep of) 4.625%, 01/25/2023 | | | | | 150,000 | | | | 141,750 | | | | 0.49 | |
| | | | | | | | | 141,750 | | | | 0.49 | |
Peru (Cost $498,642) | | | | | | | | | | | | | | |
Peru (Rep of) 7.125%, 03/30/2019 | | | | | 70,000 | | | | 85,260 | | | | 0.29 | |
Peru (Rep of) 7.350%, 07/21/2025 | | | | | 115,000 | | | | 148,235 | | | | 0.51 | |
Peru (Rep of) 8.750%, 11/21/2033 | | | | | 164,000 | | | | 239,112 | | | | 0.83 | |
| | | | | | | | | 472,607 | | | | 1.63 | |
Philippines (Cost $986,060) | | | | | | | | | | | | | | |
Philippine (Rep of) 8.375%, 06/17/2019 | | | | | 50,000 | | | | 64,500 | | | | 0.22 | |
Philippine (Rep of) 4.000%, 01/15/2021 | | | | | 50,000 | | | | 53,313 | | | | 0.18 | |
Philippine (Rep of) 10.625%, 03/16/2025 | | | | | 45,000 | | | | 71,100 | | | | 0.25 | |
Philippine (Rep of) 5.500%, 03/30/2026 | | | | | 200,000 | | | | 229,000 | | | | 0.79 | |
Philippine (Rep of) 9.500%, 02/02/2030 | | | | | 104,000 | | | | 159,380 | | | | 0.55 | |
Philippine (Rep of) 7.750%, 01/14/2031 | | | | | 217,000 | | | | 291,865 | | | | 1.01 | |
Power Sector Assets & Liabilities Management Corp.
7.390%, 12/02/2024 | | | | | 100,000 | | | | 125,750 | | | | 0.43 | |
| | | | | | | | | 994,908 | | | | 3.43 | |
Poland (Cost $301,940) | | | | | | | | | | | | | | |
Poland (Rep of) 6.375%, 07/15/2019 | | | | | 120,000 | | | | 141,480 | | | | 0.49 | |
Poland (Rep of) 5.000%, 03/23/2022 | | | | | 110,000 | | | | 120,312 | | | | 0.41 | |
Poland (Rep of) 3.000%, 03/17/2023 | | | | | 40,000 | | | | 37,320 | | | | 0.13 | |
| | | | | | | | | 299,112 | | | | 1.03 | |
Romania (Cost $702,524) | | | | | | | | | | | | | | |
Romania (Rep of) 6.750%, 02/07/2022 | | | | | 322,000 | | | | 371,910 | | | | 1.28 | |
Romania (Rep of) 4.375%, 08/22/2023 | | | | | 320,000 | | | | 313,200 | | | | 1.08 | |
| | | | | | | | | 685,110 | | | | 2.36 | |
Russian Federation (Cost $1,888,353) | | | | | | | | | | | | | | |
Russian Agricultural Bank OJSC Via RSHB Capital S.A.
7.750%, 05/29/2018 | | | | | 100,000 | | | | 113,010 | | | | 0.39 | |
Russian Foreign Bond - Eurobond 5.000%, 04/29/2020 | | | | | 100,000 | | | | 109,000 | | | | 0.37 | |
Russian Foreign Bond - Eurobond 12.750%, 06/24/2028 | | | | | 60,000 | | | | 104,550 | | | | 0.36 | |
Russian Foreign Bond - Eurobond 7.500%, 03/31/2030 | | | | | 518,375 | | | | 616,892 | | | | 2.13 | |
Russian Foreign Bond - Eurobond 5.875%, 09/16/2043(3) | | | | | 200,000 | | | | 212,500 | | | | 0.73 | |
Vnesheconombank Via VEB Finance PLC
5.450%, 11/22/2017 | | | | | 200,000 | | | | 215,700 | | | | 0.74 | |
Vnesheconombank Via VEB Finance PLC
6.902%, 07/09/2020 | | | | | 370,000 | | | | 416,546 | | | | 1.44 | |
Vnesheconombank Via VEB Finance PLC
6.800%, 11/22/2025 | | | | | 160,000 | | | | 174,000 | | | | 0.60 | |
| | | | | | | | | 1,962,198 | | | | 6.76 | |
Senegal (Cost $227,560) | | | | | | | | | | | | | | |
Senegal (Rep of) 8.750%, 05/13/2021 | | | | | 200,000 | | | | 219,500 | | | | 0.76 | |
| | | | | | | | | 219,500 | | | | 0.76 | |
See accompanying notes to the financial statements.
66
ASHMORE EMERGING MARKETS SOVEREIGN DEBT FUND
SCHEDULE OF INVESTMENTS (CONTINUED)
As of October 31, 2013
| | | | | | | | | | | | | | |
| | | Currency(1) | | Par | | | Value | | | % of Net Assets | |
Serbia (Cost $165,517) | | | | | | | | | | | | | | |
Serbia (Rep of) 7.250%, 09/28/2021 | | | | | 150,000 | | | $ | 156,000 | | | | 0.54 | |
| | | | | | | | | 156,000 | | | | 0.54 | |
South Africa (Cost $445,980) | | | | | | | | | | | | | | |
South Africa (Rep of) 6.875%, 05/27/2019 | | | | | 120,000 | | | | 138,600 | | | | 0.48 | |
South Africa (Rep of) 5.500%, 03/09/2020 | | | | | 250,000 | | | | 271,250 | | | | 0.94 | |
South Africa (Rep of) 5.875%, 05/30/2022 | | | | | 30,000 | | | | 32,850 | | | | 0.11 | |
| | | | | | | | | 442,700 | | | | 1.53 | |
Sri Lanka (Cost $213,312) | | | | | | | | | | | | | | |
Bank of Ceylon 6.875%, 05/03/2017 | | | | | 200,000 | | | | 205,000 | | | | 0.71 | |
| | | | | | | | | 205,000 | | | | 0.71 | |
Turkey (Cost $1,586,521) | | | | | | | | | | | | | | |
Turkey (Rep of) 7.000%, 09/26/2016 | | | | | 130,000 | | | | 144,846 | | | | 0.50 | |
Turkey (Rep of) 7.500%, 07/14/2017 | | | | | 100,000 | | | | 114,500 | | | | 0.40 | |
Turkey (Rep of) 6.750%, 04/03/2018 | | | | | 50,000 | | | | 56,250 | | | | 0.19 | |
Turkey (Rep of) 7.000%, 03/11/2019 | | | | | 100,000 | | | | 114,125 | | | | 0.39 | |
Turkey (Rep of) 7.500%, 11/07/2019 | | | | | 100,000 | | | | 117,750 | | | | 0.41 | |
Turkey (Rep of) 5.625%, 03/30/2021 | | | | | 100,000 | | | | 106,750 | | | | 0.37 | |
Turkey (Rep of) 3.250%, 03/23/2023 | | | | | 150,000 | | | | 131,812 | | | | 0.45 | |
Turkey (Rep of) 7.375%, 02/05/2025 | | | | | 195,000 | | | | 228,150 | | | | 0.79 | |
Turkey (Rep of) 8.000%, 02/14/2034 | | | | | 50,000 | | | | 61,830 | | | | 0.21 | |
Turkey (Rep of) 6.875%, 03/17/2036 | | | | | 194,000 | | | | 214,370 | | | | 0.74 | |
Turkey (Rep of) 7.250%, 03/05/2038 | | | | | 10,000 | | | | 11,500 | | | | 0.04 | |
Turkey (Rep of) 6.750%, 05/30/2040 | | | | | 30,000 | | | | 32,700 | | | | 0.11 | |
Turkey (Rep of) 6.000%, 01/14/2041 | | | | | 200,000 | | | | 201,000 | | | | 0.69 | |
| | | | | | | | | 1,535,583 | | | | 5.29 | |
Ukraine (Cost $1,836,933) | | | | | | | | | | | | | | |
National JSC Naftogaz of Ukraine 9.500%, 09/30/2014 | | | | | 360,000 | | | | 339,300 | | | | 1.17 | |
Ukraine (Rep of) 9.250%, 07/24/2017 | | | | | 350,000 | | | | 334,688 | | | | 1.16 | |
Ukraine (Rep of) 7.750%, 09/23/2020 | | | | | 100,000 | | | | 90,500 | | | | 0.31 | |
Ukraine (Rep of) 7.950%, 02/23/2021 | | | | | 350,000 | | | | 317,187 | | | | 1.09 | |
Ukraine (Rep of) 7.800%, 11/28/2022 | | | | | 370,000 | | | | 321,900 | | | | 1.11 | |
Ukreximbank Via Biz Finance PLC 8.750%, 01/22/2018 | | | | | 260,000 | | | | 217,750 | | | | 0.75 | |
| | | | | | | | | 1,621,325 | | | | 5.59 | |
United Arab Emirates (Cost $792,482) | | | | | | | | | | | | | | |
Emirate of Dubai (Rep of) 7.750%, 10/05/2020 | | | | | 670,000 | | | | 798,975 | | | | 2.75 | |
| | | | | | | | | 798,975 | | | | 2.75 | |
Uruguay (Cost $596,419) | | | | | | | | | | | | | | |
Uruguay (Rep of) 4.500%, 08/14/2024 | | | | | 162,503 | | | | 167,784 | | | | 0.58 | |
Uruguay (Rep of) 7.875%, 01/15/2033(4) | | | | | 142,000 | | | | 185,807 | | | | 0.64 | |
Uruguay (Rep of) 7.625%, 03/21/2036 | | | | | 96,000 | | | | 123,120 | | | | 0.43 | |
Uruguay (Rep of) 4.125%, 11/20/2045 | | | | | 99,920 | | | | 82,434 | | | | 0.28 | |
| | | | | | | | | 559,145 | | | | 1.93 | |
Venezuela (Cost $1,847,576) | | | | | | | | | | | | | | |
Petroleos de Venezuela S.A. 5.250%, 04/12/2017 | | | | | 60,000 | | | | 48,150 | | | | 0.17 | |
Petroleos de Venezuela S.A. 12.750%, 02/17/2022 | | | | | 55,000 | | | | 54,450 | | | | 0.19 | |
Petroleos de Venezuela S.A. 5.375%, 04/12/2027 | | | | | 230,000 | | | | 141,450 | | | | 0.49 | |
Petroleos de Venezuela S.A. 5.500%, 04/12/2037 | | | | | 23,000 | | | | 13,512 | | | | 0.05 | |
Venezuela (Rep of) 8.500%, 10/08/2014 | | | | | 80,000 | | | | 79,120 | | | | 0.27 | |
Venezuela (Rep of) 5.750%, 02/26/2016 | | | | | 50,000 | | | | 44,500 | | | | 0.15 | |
Venezuela (Rep of) 7.750%, 10/13/2019 | | | | | 150,000 | | | | 123,000 | | | | 0.42 | |
Venezuela (Rep of) 6.000%, 12/09/2020 | | | | | 60,000 | | | | 43,800 | | | | 0.15 | |
Venezuela (Rep of) 12.750%, 08/23/2022 | | | | | 152,000 | | | | 153,140 | | | | 0.53 | |
Venezuela (Rep of) 9.000%, 05/07/2023 | | | | | 101,000 | | | | 82,062 | | | | 0.28 | |
Venezuela (Rep of) 8.250%, 10/13/2024 | | | | | 85,000 | | | | 64,812 | | | | 0.22 | |
See accompanying notes to the financial statements.
67
ASHMORE EMERGING MARKETS SOVEREIGN DEBT FUND
SCHEDULE OF INVESTMENTS (CONTINUED)
As of October 31, 2013
| | | | | | | | | | | | | | |
| | | Currency(1) | | Par | | | Value | | | % of Net Assets | |
Venezuela - (continued) | | | | | | | | | | | | | | |
Venezuela (Rep of) 7.650%, 04/21/2025 | | | | | 46,000 | | | $ | 33,650 | | | | 0.12 | |
Venezuela (Rep of) 11.750%, 10/21/2026 | | | | | 431,000 | | | | 398,675 | | | | 1.37 | |
Venezuela (Rep of) 9.250%, 09/15/2027 | | | | | 89,000 | | | | 73,425 | | | | 0.25 | |
Venezuela (Rep of) 9.250%, 05/07/2028 | | | | | 115,000 | | | | 91,425 | | | | 0.32 | |
Venezuela (Rep of) 11.950%, 08/05/2031 | | | | | 373,100 | | | | 345,118 | | | | 1.19 | |
| | | | | | | | | 1,790,289 | | | | 6.17 | |
Vietnam (Cost $216,966) | | | | | | | | | | | | | | |
Vietnam (Rep of) 6.875%, 01/15/2016 | | | | | 100,000 | | | | 108,000 | | | | 0.37 | |
Vietnam (Rep of) 6.750%, 01/29/2020 | | | | | 100,000 | | | | 109,375 | | | | 0.38 | |
| | | | | | | | | 217,375 | | | | 0.75 | |
Zambia (Cost $50,196) | | | | | | | | | | | | | | |
Zambia (Rep of) 5.375%, 09/20/2022 | | | | | 50,000 | | | | 45,125 | | | | 0.16 | |
| | | | | | | | | 45,125 | | | | 0.16 | |
Total Debt Securities (Cost $28,699,491) | | | | | | | | | 28,209,322 | | | | 97.25 | |
| | | | |
Total Investments (Total Cost $28,699,491) | | | | | | | | | 28,209,322 | | | | 97.25 | |
| | | | |
Other Assets Less Liabilities (See Statements of Assets and Liabilities for further detail) | | | | | | | | | 796,938 | | | | 2.75 | |
| | | | |
Net Assets | | | | | | | | $ | 29,006,260 | | | | 100.00 | |
| (1) | Par values are stated in United States Dollars unless otherwise noted below. |
| (2) | When Issued Security. |
| (3) | Securities exempt from registration under Rule 144A of the Securities Act of 1933. These securities may not be publicly traded without registration under the Securities Act of 1933. |
| (4) | Security is payment in-kind bond. |
Percentages shown are based on net assets.
See accompanying notes to the financial statements.
68
ASHMORE EMERGING MARKETS SOVEREIGN DEBT FUND
SCHEDULE OF INVESTMENTS (CONTINUED)
As of October 31, 2013
The inputs or methodologies used for valuing securities are not necessarily an indication of the risks associated with investing in those securities and other financial instruments, if any. See note 4 in the Notes to the Financial Statements for more information regarding pricing inputs and valuation techniques. The following is a summary of the inputs used in valuing the Ashmore Emerging Markets Sovereign Debt Fund’s investments, which are carried at fair value, as of October 31, 2013:
| | | | | | | | | | | | | | | | |
| | | Level 1 | | | Level 2 | | | Level 3 | | | Total | |
Investments | | | | | | | | | | | | | | | | |
Assets: | | | | | | | | | | | | | | | | |
Corporate Bonds | | | $— | | | | $ 6,237,140 | | | | $— | | | | $ 6,237,140 | |
Government Agencies | | | — | | | | 430,100 | | | | — | | | | 430,100 | |
Government Bonds | | | — | | | | 20,478,707 | | | | — | | | | 20,478,707 | |
Municipal Bonds | | | — | | | | 798,975 | | | | — | | | | 798,975 | |
Financial Certificates | | | — | | | | 264,400 | | | | — | | | | 264,400 | |
Total Investments | | | $— | | | | $28,209,322 | | | | $— | | | | $28,209,322 | |
The Fund discloses all transfers between levels based on valuations at the end of each reporting period. At Octo-ber 31, 2013, there were no transfers between Level 1, Level 2 and Level 3 based on levels assigned to the securities on October 31, 2012. U.S. GAAP provides additional guidance for estimating fair value when the volume and level of activity for the asset or liability have significantly decreased as well as guidance on identifying cir-cumstances that indicate when a transaction is not orderly.
The following is a summary of the fair values of the Fund’s derivative instruments*:
The Effect of Financial Derivative Instruments on the Statements of Operations for the Period Ended October 31, 2013:
| | | | |
| | | Derivatives Not Accounted for as | |
| | | Hedging Instruments | |
| | | Foreign Exchange | |
Realized Gain (Loss) on Derivatives Recognized resulting from Operations: | | | | |
Net Realized Gain on Forward Foreign Currency Exchange Contracts | | | $ 861 | |
| |
* See note 9 in the Notes to the Financial Statements for additional information. | | | | |
At October 31, 2013, for U.S. federal income tax purposes, gross unrealized appreciation, gross unrealized depreciation, net unrealized appreciation/(depreciation) on investments in securities (including the effects of foreign currency translation) and the cost basis of investments were as follows:
| | | | |
Federal tax cost of investments | | | $28,743,772 | |
Gross tax appreciation of investments | | | $576,963 | |
Gross tax depreciation of investments | | | (1,111,413) | |
Net tax depreciation of investments | | | $(534,450) | |
The difference between book basis and tax basis net unrealized appreciation or depreciation is attributable primarily to the tax deferral of losses on wash sales.
See accompanying notes to the financial statements.
69
ASHMORE EMERGING MARKETS TOTAL RETURN FUND
SCHEDULE OF INVESTMENTS
As of October 31, 2013
| | | | | | | | | | | | | | |
| | | Currency(1) | | Par | | | Value | | | % of Net Assets | |
Debt Securities | | | | | | | | | | | | | | |
| | | | |
Argentina (Cost $11,480,860) | | | | | | | | | | | | | | |
Argentina Boden Bonds 7.000%, 10/03/2015 | | | | | 4,224,000 | | | $ | 3,974,455 | | | | 0.59 | |
Argentine (Rep of) 8.750%, 06/02/2017 | | | | | 496,000 | | | | 431,520 | | | | 0.06 | |
Argentine (Rep of) 8.280%, 12/31/2033 | | | | | 2,525,879 | | | | 1,803,643 | | | | 0.27 | |
WPE International Cooperatief UA 10.375%, 09/30/2020 | | | | | 6,100,000 | | | | 4,270,000 | | | | 0.63 | |
| | | | | | | | | 10,479,618 | | | | 1.55 | |
Azerbaijan (Cost $1,877,848) | | | | | | | | | | | | | | |
State Oil Co. of the Azerbaijan Republic 5.450%, 02/09/2017 | | | | | 1,030,000 | | | | 1,100,555 | | | | 0.16 | |
State Oil Co. of the Azerbaijan Republic 4.750%, 03/13/2023 | | | | | 850,000 | | | | 818,125 | | | | 0.12 | |
| | | | | | | | | 1,918,680 | | | | 0.28 | |
Belarus (Cost $2,988,614) | | | | | | | | | | | | | | |
Belarus (Rep of) 8.750%, 08/03/2015 | | | | | 1,050,000 | | | | 1,051,313 | | | | 0.16 | |
Belarus (Rep of) 8.950%, 01/26/2018 | | | | | 1,984,000 | | | | 1,974,080 | | | | 0.29 | |
| | | | | | | | | 3,025,393 | | | | 0.45 | |
Bolivia (Cost $1,081,795) | | | | | | | | | | | | | | |
Bolivian (Rep of) 4.875%, 10/29/2022 | | | | | 730,000 | | | | 711,750 | | | | 0.11 | |
Bolivian (Rep of) 5.950%, 08/22/2023 | | | | | 370,000 | | | | 372,775 | | | | 0.05 | |
| | | | | | | | | 1,084,525 | | | | 0.16 | |
Brazil (Cost $55,853,906) | | | | | | | | | | | | | | |
Banco Nacional de Desenvolvimento Economico e Social 6.500%, 06/10/2019 | | | | | 730,000 | | | | 805,738 | | | | 0.12 | |
Banco Nacional de Desenvolvimento Economico e Social 5.500%, 07/12/2020 | | | | | 440,000 | | | | 462,000 | | | | 0.07 | |
Banco Nacional de Desenvolvimento Economico e Social 5.750%, 09/26/2023(2) | | | | | 270,000 | | | | 280,125 | | | | 0.04 | |
Banco Santander Brasil S.A. 8.000%, 03/18/2016 | | BRL | | | 300,000 | | | | 125,212 | | | | 0.02 | |
Banco Votorantim S.A. 6.250%, 05/16/2016 | | BRL | | | 10,006,914 | | | | 4,267,225 | | | | 0.63 | |
Brazil (Fed Rep of) 5.875%, 01/15/2019 | | | | | 365,000 | | | | 421,028 | | | | 0.06 | |
Brazil (Fed Rep of) 4.875%, 01/22/2021 | | | | | 917,000 | | | | 994,945 | | | | 0.15 | |
Brazil (Fed Rep of) 2.625%, 01/05/2023 | | | | | 500,000 | | | | 446,250 | | | | 0.07 | |
Brazil (Fed Rep of) 8.500%, 01/05/2024 | | BRL | | | 3,369,000 | | | | 1,372,294 | | | | 0.20 | |
Brazil (Fed Rep of) 8.875%, 04/15/2024 | | | | | 750,000 | | | | 1,050,000 | | | | 0.16 | |
Brazil (Fed Rep of) 4.250%, 01/07/2025 | | | | | 1,671,000 | | | | 1,632,567 | | | | 0.24 | |
Brazil Letras do Tesouro Nacional 8.940%, 01/01/2017(3) | | BRL | | | 31,020,000 | | | | 9,796,654 | | | | 1.45 | |
Brazil Notas do Tesouro Nacional, Serie B 6.000%, 08/15/2020 | | BRL | | | 11,556,592 | | | | 5,317,835 | | | | 0.79 | |
Brazil Notas do Tesouro Nacional, Serie F 10.000%, 01/01/2021 | | BRL | | | 11,630,000 | | | | 4,821,784 | | | | 0.72 | |
Brazil Notas do Tesouro Nacional, Serie F 10.000%, 01/01/2023 | | BRL | | | 920,000 | | | | 374,419 | | | | 0.06 | |
Cosan Luxembourg S.A. 9.500%, 03/14/2018 | | BRL | | | 1,900,000 | | | | 754,843 | | | | 0.11 | |
JBS Finance II Ltd. 8.250%, 01/29/2018 | | | | | 1,683,000 | | | | 1,762,942 | | | | 0.26 | |
Marfrig Holding Europe B.V. 9.875%, 07/24/2017 | | | | | 1,200,000 | | | | 1,198,500 | | | | 0.18 | |
Marfrig Holding Europe B.V. 8.375%, 05/09/2018 | | | | | 2,250,000 | | | | 2,120,625 | | | | 0.31 | |
Marfrig Overseas Ltd. 9.500%, 05/04/2020 | | | | | 1,500,000 | | | | 1,447,500 | | | | 0.22 | |
Minerva Luxembourg S.A. 12.250%, 02/10/2022(4) | | | | | 1,400,000 | | | | 1,568,000 | | | | 0.23 | |
Minerva Luxembourg S.A. 7.750%, 01/31/2023(4) | | | | | 1,968,000 | | | | 1,908,960 | | | | 0.28 | |
NII Capital Corp. 7.625%, 04/01/2021 | | | | | 6,740,000 | | | | 3,909,200 | | | | 0.58 | |
See accompanying notes to the financial statements.
70
ASHMORE EMERGING MARKETS TOTAL RETURN FUND
SCHEDULE OF INVESTMENTS (CONTINUED)
As of October 31, 2013
| | | | | | | | | | | | | | |
| | | Currency(1) | | Par | | | Value | | | % of Net Assets | |
Brazil - (continued) | | | | | | | | | | | | | | |
OGX Austria GmbH 8.500%, 06/01/2018(5) | | | | | 2,900,000 | | | $ | 275,500 | | | | 0.04 | |
Oi S.A. 9.750%, 09/15/2016 | | BRL | | | 1,000,000 | | | | 402,107 | | | | 0.06 | |
OSX 3 Leasing B.V. 9.250%, 03/20/2015(2) | | | | | 1,100,000 | | | | 884,125 | | | | 0.13 | |
| | | | | | | | | 48,400,378 | | | | 7.18 | |
Chile (Cost $6,974,745) | | | | | | | | | | | | | | |
Automotores Gildemeister S.A. 6.750%, 01/15/2023 | | | | | 1,300,000 | | | | 1,098,500 | | | | 0.16 | |
Banco del Estado de Chile 4.125%, 10/07/2020 | | | | | 610,000 | | | | 626,316 | | | | 0.09 | |
Banco del Estado de Chile 3.875%, 02/08/2022 | | | | | 150,000 | | | | 146,689 | | | | 0.02 | |
Banco Santander Chile 6.500%, 09/22/2020 | | CLP | | | 186,500,000 | | | | 361,896 | | | | 0.05 | |
Bonos de la Tesoreria de la Republica en pesos 6.000%, 01/01/2020 | | CLP | | | 50,000,000 | | | | 103,782 | | | | 0.02 | |
Chile (Rep of) 5.500%, 08/05/2020 | | CLP | | | 280,000,000 | | | | 557,540 | | | | 0.08 | |
Corp. Nacional del Cobre de Chile 7.500%, 01/15/2019 | | | | | 300,000 | | | | 363,649 | | | | 0.05 | |
Corp. Nacional del Cobre de Chile 3.750%, 11/04/2020 | | | | | 300,000 | | | | 301,777 | | | | 0.05 | |
Corp. Nacional del Cobre de Chile 3.875%, 11/03/2021 | | | | | 485,000 | | | | 482,746 | | | | 0.07 | |
Empresa Nacional del Petroleo 6.250%, 07/08/2019 | | | | | 270,000 | | | | 296,372 | | | | 0.05 | |
Empresa Nacional del Petroleo 5.250%, 08/10/2020 | | | | | 60,000 | | | | 62,441 | | | | 0.01 | |
Inversiones Alsacia S.A. 8.000%, 08/18/2018 | | | | | 907,737 | | | | 662,648 | | | | 0.10 | |
SMU S.A. 7.750%, 02/08/2020 | | | | | 1,200,000 | | | | 666,000 | | | | 0.10 | |
| | | | | | | | | 5,730,356 | | | | 0.85 | |
China (Cost $36,674,197) | | | | | | | | | | | | | | |
Central China Real Estate Ltd. 6.500%, 06/04/2018 | | | | | 1,900,000 | | | | 1,840,264 | | | | 0.27 | |
Central China Real Estate Ltd. 8.000%, 01/28/2020 | | | | | 1,627,000 | | | | 1,605,215 | | | | 0.24 | |
China Oriental Group Co. Ltd. 7.000%, 11/17/2017 | | | | | 794,000 | | | | 787,013 | | | | 0.12 | |
China SCE Property Holdings Ltd. 10.500%, 01/14/2016 | | CNY | | | 5,000,000 | | | | 853,445 | | | | 0.13 | |
China SCE Property Holdings Ltd. 11.500%, 11/14/2017 | | | | | 2,350,000 | | | | 2,567,375 | | | | 0.38 | |
China Shanshui Cement Group Ltd. 6.500%, 07/22/2014 | | CNY | | | 3,000,000 | | | | 497,467 | | | | 0.07 | |
China Shanshui Cement Group Ltd. 10.500%, 04/27/2017 | | | | | 3,000,000 | | | | 3,255,000 | | | | 0.48 | |
Country Garden Holdings Co. Ltd. 11.125%, 02/23/2018 | | | | | 1,848,000 | | | | 2,062,738 | | | | 0.31 | |
Country Garden Holdings Co. Ltd. 7.250%, 04/04/2021(2) | | | | | 1,250,000 | | | | 1,248,500 | | | | 0.19 | |
Country Garden Holdings Co. Ltd. 7.500%, 01/10/2023 | | | | | 2,826,000 | | | | 2,815,402 | | | | 0.42 | |
Emerald Plantation Holdings Ltd. 6.000%, 01/30/2020(4)(6) | | | | | 320,009 | | | | 196,806 | | | | 0.03 | |
Evergrande Real Estate Group Ltd. 13.000%, 01/27/2015(4) | | | | | 1,604,000 | | | | 1,720,290 | | | | 0.26 | |
Evergrande Real Estate Group Ltd. 8.750%, 10/30/2018(4) | | | | | 1,400,000 | | | | 1,415,680 | | | | 0.21 | |
Far East Energy Bermuda Ltd. 13.000%, 01/15/2016(4)(6) | | | | | 1,493,041 | | | | 1,493,041 | | | | 0.22 | |
Gemdale International Holding Ltd. 9.150%, 07/26/2015 | | CNY | | | 4,750,000 | | | | 826,091 | | | | 0.12 | |
Hengdeli Holdings Ltd. 6.250%, 01/29/2018 | | | | | 792,000 | | | | 809,820 | | | | 0.12 | |
Hidili Industry International Development Ltd. 8.625%, 11/04/2015 | | | | | 1,489,000 | | | | 1,072,080 | | | | 0.16 | |
Lafarge Shui on Cement Ltd. 9.000%, 11/14/2014 | | CNY | | | 2,750,000 | | | | 472,692 | | | | 0.07 | |
Powerlong Real Estate Holdings Ltd. 11.500%, 03/17/2014 | | CNY | | | 1,000,000 | | | | 166,261 | | | | 0.02 | |
RKI Finance 2011 Ltd. 6.000%, 02/25/2014 | | CNY | | | 1,750,000 | | | | 288,302 | | | | 0.04 | |
Sinochem Overseas Capital Co. Ltd. 4.500%, 11/12/2020 | | | | | 2,052,000 | | | | 2,098,681 | | | | 0.31 | |
Sinochem Overseas Capital Co. Ltd. 6.300%, 11/12/2040 | | | | | 660,000 | | | | 707,932 | | | | 0.11 | |
Sino-Forest Corp. 5.000%, 08/01/2013(7) | | | | | 276,000 | | | | — | | | | — | |
Sino-Forest Corp. 10.250%, 07/28/2014(7) | | | | | 256,000 | | | | — | | | | — | |
Sino-Forest Corp. 4.250%, 12/15/2016(7) | | | | | 704,000 | | | | — | | | | — | |
Sino-Forest Corp. 6.250%, 10/21/2017(7) | | | | | 628,000 | | | | — | | | | — | |
Sunac China Holdings Ltd. 12.500%, 10/16/2017 | | | | | 800,000 | | | | 902,000 | | | | 0.13 | |
Sunac China Holdings Ltd. 9.375%, 04/05/2018 | | | | | 3,150,000 | | | | 3,236,625 | | | | 0.48 | |
Yanlord Land Group Ltd. 9.500%, 05/04/2017 | | | | | 1,325,000 | | | | 1,411,125 | | | | 0.21 | |
Yanlord Land Group Ltd. 10.625%, 03/29/2018 | | | | | 775,000 | | | | 848,625 | | | | 0.13 | |
See accompanying notes to the financial statements.
71
ASHMORE EMERGING MARKETS TOTAL RETURN FUND
SCHEDULE OF INVESTMENTS (CONTINUED)
As of October 31, 2013
| | | | | | | | | | | | | | |
| | | Currency(1) | | Par | | | Value | | | % of Net Assets | |
China - (continued) | | | | | | | | | | | | | | |
Yingde Gases Investment Ltd. 8.125%, 04/22/2018 | | | | | 1,600,000 | | | $ | 1,636,000 | | | | 0.24 | |
| | | | | | | | | 36,834,470 | | | | 5.47 | |
Colombia (Cost $15,382,751) | | | | | | | | | | | | | | |
Colombia (Rep of) 12.000%, 10/22/2015 | | COP | | | 4,581,000,000 | | | | 2,751,965 | | | | 0.41 | |
Colombia (Rep of) 7.375%, 03/18/2019 | | | | | 1,850,000 | | | | 2,261,625 | | | | 0.34 | |
Colombia (Rep of) 11.750%, 02/25/2020 | | | | | 498,000 | | | | 729,570 | | | | 0.11 | |
Colombia (Rep of) 7.750%, 04/14/2021 | | COP | | | 263,000,000 | | | | 158,952 | | | | 0.02 | |
Colombia (Rep of) 4.375%, 07/12/2021 | | | | | 800,000 | | | | 847,200 | | | | 0.13 | |
Colombia (Rep of) 4.000%, 02/26/2024 | | | | | 330,000 | | | | 329,175 | | | | 0.05 | |
Colombia (Rep of) 8.125%, 05/21/2024 | | | | | 58,000 | | | | 76,850 | | | | 0.01 | |
Colombia (Rep of) 9.850%, 06/28/2027 | | COP | | | 2,296,000,000 | | | | 1,619,157 | | | | 0.24 | |
Colombia (Rep of) 7.375%, 09/18/2037 | | | | | 650,000 | | | | 838,500 | | | | 0.12 | |
Colombia (Rep of) 6.125%, 01/18/2041 | | | | | 1,032,000 | | | | 1,168,740 | | | | 0.17 | |
Colombian TES 7.000%, 05/04/2022 | | COP | | | 1,793,000,000 | | | | 963,512 | | | | 0.14 | |
Colombian TES 7.500%, 08/26/2026 | | COP | | | 1,294,000,000 | | | | 712,047 | | | | 0.10 | |
Emgesa S.A. ESP 8.750%, 01/25/2021 | | COP | | | 818,000,000 | | | | 456,517 | | | | 0.07 | |
Empresa de Telecomunicaciones de Bogota 7.000%, 01/17/2023 | | COP | | | 1,416,000,000 | | | | 645,388 | | | | 0.10 | |
Empresas Publicas de Medellin ESP 8.375%, 02/01/2021 | | COP | | | 1,306,000,000 | | | | 718,788 | | | | 0.11 | |
| | | | | | | | | 14,277,986 | | | | 2.12 | |
Costa Rica (Cost $2,534,301) | | | | | | | | | | | | | | |
Banco de Costa Rica 5.250%, 08/12/2018(4) | | | | | 300,000 | | | | 303,000 | | | | 0.04 | |
Banco Nacional de Costa Rica 6.250%, 11/01/2023 | | | | | 250,000 | | | | 249,198 | | | | 0.04 | |
Costa Rica (Rep of) 4.250%, 01/26/2023 | | | | | 1,375,000 | | | | 1,306,250 | | | | 0.19 | |
Costa Rica (Rep of) 4.375%, 04/30/2025 | | | | | 220,000 | | | | 202,400 | | | | 0.03 | |
Costa Rica (Rep of) 5.625%, 04/30/2043 | | | | | 220,000 | | | | 195,250 | | | | 0.03 | |
Instituto Costarricense de Electricidad 6.375%, 05/15/2043 | | | | | 220,000 | | | | 195,800 | | | | 0.03 | |
| | | | | | | | | 2,451,898 | | | | 0.36 | |
Croatia (Cost $4,128,457) | | | | | | | | | | | | | | |
Croatia (Rep of) 6.250%, 04/27/2017 | | | | | 450,000 | | | | 480,114 | | | | 0.07 | |
Croatia (Rep of) 6.750%, 11/05/2019 | | | | | 470,000 | | | | 512,300 | | | | 0.08 | |
Croatia (Rep of) 6.625%, 07/14/2020 | | | | | 1,535,000 | | | | 1,657,800 | | | | 0.25 | |
Croatia (Rep of) 6.375%, 03/24/2021 | | | | | 1,421,000 | | | | 1,508,036 | | | | 0.22 | |
| | | | | | | | | 4,158,250 | | | | 0.62 | |
Czech Republic (Cost $246,473) | | | | | | | | | | | | | | |
New World Resources N.V. 7.875%, 05/01/2018 | | EUR | | | 250,000 | | | | 239,474 | | | | 0.03 | |
| | | | | | | | | 239,474 | | | | 0.03 | |
Dominican Republic (Cost $1,939,074) | | | | | | | | | | | | | | |
Dominican (Rep of) 7.500%, 05/06/2021(4) | | | | | 993,000 | | | | 1,098,755 | | | | 0.16 | |
Dominican (Rep of) 6.600%, 01/28/2024(4) | | | | | 240,000 | | | | 248,160 | | | | 0.04 | |
Dominican (Rep of) 5.875%, 04/18/2024(4) | | | | | 600,000 | | | | 590,100 | | | | 0.09 | |
| | | | | | | | | 1,937,015 | | | | 0.29 | |
Ecuador (Cost $317,072) | | | | | | | | | | | | | | |
Ecuador (Rep of) 9.375%, 12/15/2015 | | | | | 310,000 | | | | 330,150 | | | | 0.05 | |
| | | | | | | | | 330,150 | | | | 0.05 | |
Egypt (Cost $1,098,359) | | | | | | | | | | | | | | |
Egypt (Rep of) 5.750%, 04/29/2020 | | | | | 600,000 | | | | 552,000 | | | | 0.08 | |
Egypt (Rep of) 6.875%, 04/30/2040 | | | | | 285,000 | | | | 236,550 | | | | 0.04 | |
Nile Finance Ltd. 5.250%, 08/05/2015 | | | | | 300,000 | | | | 294,000 | | | | 0.04 | |
| | | | | | | | | 1,082,550 | | | | 0.16 | |
El Salvador (Cost $3,988,484) | | | | | | | | | | | | | | |
El Salvador (Rep of) 7.375%, 12/01/2019 | | | | | 330,000 | | | | 371,250 | | | | 0.06 | |
See accompanying notes to the financial statements.
72
ASHMORE EMERGING MARKETS TOTAL RETURN FUND
SCHEDULE OF INVESTMENTS (CONTINUED)
As of October 31, 2013
| | | | | | | | | | | | | | |
| | | Currency(1) | | Par | | | Value | | | % of Net Assets | |
El Salvador - (continued) | | | | | | | | | | | | | | |
El Salvador (Rep of) 5.875%, 01/30/2025 | | | | | 885,000 | | | $ | 878,362 | | | | 0.13 | |
El Salvador (Rep of) 8.250%, 04/10/2032 | | | | | 75,000 | | | | 85,500 | | | | 0.01 | |
El Salvador (Rep of) 7.650%, 06/15/2035 | | | | | 120,000 | | | | 126,900 | | | | 0.02 | |
El Salvador (Rep of) 7.625%, 02/01/2041 | | | | | 400,000 | | | | 417,000 | | | | 0.06 | |
Telemovil Finance Co. Ltd. 8.000%, 10/01/2017 | | | | | 1,950,000 | | | | 2,076,750 | | | | 0.31 | |
| | | | | | | | | 3,955,762 | | | | 0.59 | |
Gabon (Cost $316,790) | | | | | | | | | | | | | | |
Gabonese (Rep of) 8.200%, 12/12/2017 | | | | | 265,000 | | | | 308,063 | | | | 0.05 | |
| | | | | | | | | 308,063 | | | | 0.05 | |
Georgia (Cost $861,287) | | | | | | | | | | | | | | |
Georgia (Rep of) 6.875%, 04/12/2021 | | | | | 415,000 | | | | 451,831 | | | | 0.07 | |
Georgian Railway JSC 7.750%, 07/11/2022 | | | | | 370,000 | | | | 400,525 | | | | 0.06 | |
| | | | | | | | | 852,356 | | | | 0.13 | |
Ghana (Cost $1,190,608) | | | | | | | | | | | | | | |
Ghana (Rep of) 21.000%, 10/26/2015(4) | | GHS | | | 1,110,000 | | | | 514,705 | | | | 0.08 | |
Ghana (Rep of) 8.500%, 10/04/2017(4) | | | | | 158,000 | | | | 172,615 | | | | 0.02 | |
Ghana (Rep of) 7.875%, 08/07/2023(4) | | | | | 429,411 | | | | 426,190 | | | | 0.06 | |
| | | | | | | | | 1,113,510 | | | | 0.16 | |
Guatemala (Cost $650,317) | | | | | | | | | | | | | | |
Guatemala (Rep of) 4.875%, 02/13/2028 | | | | | 650,000 | | | | 612,300 | | | | 0.09 | |
| | | | | | | | | 612,300 | | | | 0.09 | |
Hong Kong (Cost $2,316,708) | | | | | | | | | | | | | | |
CFG Investment SAC 9.750%, 07/30/2019(4) | | | | | 2,496,000 | | | | 2,383,680 | | | | 0.35 | |
| | | | | | | | | 2,383,680 | | | | 0.35 | |
Hungary (Cost $16,235,526) | | | | | | | | | | | | | | |
Hungary (Rep of) 7.750%, 08/24/2015 | | HUF | | | 481,360,000 | | | | 2,358,420 | | | | 0.35 | |
Hungary (Rep of) 5.500%, 12/22/2016 | | HUF | | | 376,290,000 | | | | 1,792,800 | | | | 0.27 | |
Hungary (Rep of) 6.750%, 11/24/2017 | | HUF | | | 794,670,000 | | | | 3,957,610 | | | | 0.59 | |
Hungary (Rep of) 4.125%, 02/19/2018 | | | | | 810,000 | | | | 818,100 | | | | 0.12 | |
Hungary (Rep of) 6.250%, 01/29/2020 | | | | | 694,000 | | | | 754,378 | | | | 0.11 | |
Hungary (Rep of) 6.375%, 03/29/2021 | | | | | 898,000 | | | | 975,452 | | | | 0.15 | |
Hungary (Rep of) 7.000%, 06/24/2022 | | HUF | | | 451,640,000 | | | | 2,290,348 | | | | 0.34 | |
Hungary (Rep of) 5.375%, 02/21/2023 | | | | | 1,576,000 | | | | 1,569,775 | | | | 0.23 | |
Hungary (Rep of) 6.000%, 11/24/2023 | | HUF | | | 158,660,000 | | | | 758,509 | | | | 0.11 | |
Hungary (Rep of) 7.625%, 03/29/2041 | | | | | 1,188,000 | | | | 1,337,985 | | | | 0.20 | |
| | | | | | | | | 16,613,377 | | | | 2.47 | |
India (Cost $4,005,331) | | | | | | | | | | | | | | |
Export-Import Bank of India 4.000%, 08/07/2017 | | | | | 200,000 | | | | 203,530 | | | | 0.03 | |
Export-Import Bank of India 4.000%, 01/14/2023 | | | | | 468,000 | | | | 418,392 | | | | 0.06 | |
Vedanta Resources PLC 8.250%, 06/07/2021 | | | | | 2,780,000 | | | | 2,863,400 | | | | 0.43 | |
Vedanta Resources PLC 7.125%, 05/31/2023 | | | | | 500,000 | | | | 477,500 | | | | 0.07 | |
| | | | | | | | | 3,962,822 | | | | 0.59 | |
Indonesia (Cost $16,599,882) | | | | | | | | | | | | | | |
Indo Energy Finance II B.V. 6.375%, 01/24/2023 | | | | | 3,112,000 | | | | 2,730,780 | | | | 0.40 | |
Indonesia (Rep of) 6.875%, 01/17/2018 | | | | | 575,000 | | | | 652,625 | | | | 0.10 | |
Indonesia (Rep of) 11.625%, 03/04/2019 | | | | | 680,000 | | | | 929,900 | | | | 0.14 | |
Indonesia (Rep of) 7.875%, 04/15/2019 | | IDR | | | 13,600,000,000 | | | | 1,248,703 | | | | 0.19 | |
Indonesia (Rep of) 5.875%, 03/13/2020 | | | | | 1,496,000 | | | | 1,638,120 | | | | 0.24 | |
Indonesia (Rep of) 4.875%, 05/05/2021 | | | | | 400,000 | | | | 415,000 | | | | 0.06 | |
Indonesia (Rep of) 5.375%, 10/17/2023 | | | | | 310,000 | | | | 326,275 | | | | 0.05 | |
Indonesia (Rep of) 8.375%, 03/15/2024 | | IDR | | | 22,000,000,000 | | | | 2,067,990 | | | | 0.31 | |
Indonesia (Rep of) 6.125%, 05/15/2028 | | IDR | | | 3,600,000,000 | | | | 270,576 | | | | 0.04 | |
Indonesia (Rep of) 8.375%, 03/15/2034 | | IDR | | | 9,600,000,000 | | | | 873,117 | | | | 0.13 | |
Indonesia (Rep of) 6.625%, 02/17/2037 | | | | | 185,000 | | | | 201,650 | | | | 0.03 | |
See accompanying notes to the financial statements.
73
ASHMORE EMERGING MARKETS TOTAL RETURN FUND
SCHEDULE OF INVESTMENTS (CONTINUED)
As of October 31, 2013
| | | | | | | | | | | | | | |
| | | Currency(1) | | Par | | | Value | | | % of Net Assets | |
Indonesia - (continued) | | | | | | | | | | | | | | |
Indonesia (Rep of) 7.750%, 01/17/2038 | | | | | 190,000 | | | $ | 231,562 | | | | 0.03 | |
Indonesia Treasury Bill 5.600%, 10/09/2014(3) | | IDR | | | 5,371,000,000 | | | | 450,521 | | | | 0.07 | |
Majapahit Holding B.V. 7.750%, 10/17/2016 | | | | | 355,000 | | | | 397,600 | | | | 0.06 | |
Majapahit Holding B.V. 8.000%, 08/07/2019 | | | | | 670,000 | | | | 776,362 | | | | 0.11 | |
Majapahit Holding B.V. 7.750%, 01/20/2020 | | | | | 300,000 | | | | 344,250 | | | | 0.05 | |
Pertamina Persero PT 6.000%, 05/03/2042 | | | | | 735,000 | | | | 650,475 | | | | 0.10 | |
Pertamina Persero PT 5.625%, 05/20/2043 | | | | | 710,000 | | | | 596,400 | | | | 0.09 | |
Perusahaan Listrik Negara PT 5.500%, 11/22/2021 | | | | | 660,000 | | | | 663,300 | | | | 0.10 | |
Perusahaan Listrik Negara PT 5.250%, 10/24/2042 | | | | | 200,000 | | | | 161,000 | | | | 0.02 | |
Perusahaan Penerbit SBSN Indonesia 6.125%, 03/15/2019(2) | | | | | 450,000 | | | | 486,000 | | | | 0.07 | |
| | | | | | | | | 16,112,206 | | | | 2.39 | |
Iraq (Cost $2,274,809) | | | | | | | | | | | | | | |
Iraq (Rep of) 5.800%, 01/15/2028 | | | | | 2,630,000 | | | | 2,288,100 | | | | 0.34 | |
| | | | | | | | | 2,288,100 | | | | 0.34 | |
Israel (Cost $3,963,703) | | | | | | | | | | | | | | |
Altice Financing S.A. 8.000%, 12/15/2019 | | EUR | | | 750,000 | | | | 1,105,378 | | | | 0.17 | |
Altice Finco S.A. 9.875%, 12/15/2020 | | | | | 2,300,000 | | | | 2,570,250 | | | | 0.38 | |
Plaza Centers N.V. 5.400%, 07/01/2015 | | ILS | | | 1,566,133 | | | | 296,141 | | | | 0.04 | |
| | | | | | | | | 3,971,769 | | | | 0.59 | |
Ivory Coast (Cost $3,685,947) | | | | | | | | | | | | | | |
Ivory Coast (Rep of) 5.750%, 12/31/2032 | | | | | 4,290,000 | | | | 3,861,858 | | | | 0.57 | |
| | | | | | | | | 3,861,858 | | | | 0.57 | |
Jamaica (Cost $7,094,862) | | | | | | | | | | | | | | |
Digicel Group Ltd. 10.500%, 04/15/2018 | | | | | 500,000 | | | | 540,000 | | | | 0.08 | |
Digicel Group Ltd. 8.250%, 09/30/2020 | | | | | 5,300,000 | | | | 5,591,500 | | | | 0.83 | |
Digicel Ltd. 6.000%, 04/15/2021 | | | | | 900,000 | | | | 873,000 | | | | 0.13 | |
| | | | | | | | | 7,004,500 | | | | 1.04 | |
Kazakhstan (Cost $17,451,344) | | | | | | | | | | | | | | |
ATF Bank JSC 9.250%, 02/21/2014 | | | | | 2,600,000 | | | | 2,603,120 | | | | 0.39 | |
ATF Bank JSC 9.000%, 05/11/2016 | | | | | 800,000 | | | | 797,000 | | | | 0.12 | |
Development Bank of Kazakhstan JSC 4.125%, 12/10/2022 | | | | | 1,000,000 | | | | 922,500 | | | | 0.14 | |
Halyk Savings Bank of Kazakhstan JSC 7.250%, 01/28/2021 | | | | | 1,600,000 | | | | 1,684,000 | | | | 0.25 | |
KazAgro National Management Holding JSC 4.625%, 05/24/2023 | | | | | 310,000 | | | | 293,027 | | | | 0.04 | |
Kazakhstan Temir Zholy Finance B.V. 6.375%, 10/06/2020 | | | | | 795,000 | | | | 882,450 | | | | 0.13 | |
Kazakhstan Temir Zholy Finance B.V. 6.950%, 07/10/2042 | | | | | 700,000 | | | | 732,375 | | | | 0.11 | |
Kazatomprom Natsionalnaya Atomnaya Kompaniya A.O. 6.250%, 05/20/2015 | | | | | 455,000 | | | | 480,025 | | | | 0.07 | |
Kazkommertsbank JSC 7.875%, 04/07/2014 | | | | | 800,000 | | | | 804,000 | | | | 0.12 | |
Kazkommertsbank JSC 8.500%, 05/11/2018 | | | | | 3,950,000 | | | | 3,782,125 | | | | 0.56 | |
KazMunayGas National Co. JSC 9.125%, 07/02/2018 | | | | | 501,000 | | | | 613,099 | | | | 0.09 | |
KazMunayGas National Co. JSC 7.000%, 05/05/2020 | | | | | 400,000 | | | | 457,500 | | | | 0.07 | |
KazMunayGas National Co. JSC 6.375%, 04/09/2021 | | | | | 450,000 | | | | 498,938 | | | | 0.07 | |
KazMunayGas National Co. JSC 4.400%, 04/30/2023 | | | | | 570,000 | | | | 540,759 | | | | 0.08 | |
KazMunayGas National Co. JSC 5.750%, 04/30/2043 | | | | | 850,000 | | | | 771,290 | | | | 0.12 | |
Zhaikmunai LLP 7.125%, 11/13/2019 | | | | | 1,400,000 | | | | 1,491,000 | | | | 0.22 | |
| | | | | | | | | 17,353,208 | | | | 2.58 | |
Latvia (Cost $835,033) | | | | | | | | | | | | | | |
Latvia (Rep of) 2.750%, 01/12/2020 | | | | | 850,000 | | | | 812,813 | | | | 0.12 | |
| | | | | | | | | 812,813 | | | | 0.12 | |
Lebanon (Cost $3,580,511) | | | | | | | | | | | | | | |
Lebanon (Rep of) 5.150%, 11/12/2018 | | | | | 400,000 | | | | 390,000 | | | | 0.06 | |
See accompanying notes to the financial statements.
74
ASHMORE EMERGING MARKETS TOTAL RETURN FUND
SCHEDULE OF INVESTMENTS (CONTINUED)
As of October 31, 2013
| | | | | | | | | | | | | | |
| | | Currency(1) | | Par | | | Value | | | % of Net Assets | |
Lebanon - (continued) | | | | | | | | | | | | | | |
Lebanon (Rep of) 6.375%, 03/09/2020 | | | | | 1,086,000 | | | $ | 1,096,860 | | | | 0.16 | |
Lebanon (Rep of) 8.250%, 04/12/2021 | | | | | 342,000 | | | | 379,620 | | | | 0.06 | |
Lebanon (Rep of) 6.100%, 10/04/2022 | | | | | 1,240,000 | | | | 1,209,000 | | | | 0.18 | |
Lebanon (Rep of) 6.600%, 11/27/2026 | | | | | 426,000 | | | | 419,610 | | | | 0.06 | |
| | | | | | | | | 3,495,090 | | | | 0.52 | |
Lithuania (Cost $4,301,890) | | | | | | | | | | | | | | |
Lithuania (Rep of) 5.125%, 09/14/2017 | | | | | 710,000 | | | | 778,870 | | | | 0.12 | |
Lithuania (Rep of) 7.375%, 02/11/2020 | | | | | 1,100,000 | | | | 1,336,500 | | | | 0.20 | |
Lithuania (Rep of) 6.125%, 03/09/2021 | | | | | 620,000 | | | | 710,675 | | | | 0.10 | |
Lithuania (Rep of) 6.625%, 02/01/2022 | | | | | 1,291,000 | | | | 1,533,063 | | | | 0.23 | |
| | | | | | | | | 4,359,108 | | | | 0.65 | |
Malaysia (Cost $14,750,200) | | | | | | | | | | | | | | |
Malaysia (Govt of) 4.262%, 09/15/2016 | | MYR | | | 2,700,000 | | | | 881,938 | | | | 0.13 | |
Malaysia (Govt of) 4.012%, 09/15/2017 | | MYR | | | 3,700,000 | | | | 1,201,685 | | | | 0.18 | |
Malaysia (Govt of) 3.314%, 10/31/2017 | | MYR | | | 2,900,000 | | | | 917,685 | | | | 0.14 | |
Malaysia (Govt of) 3.580%, 09/28/2018 | | MYR | | | 6,300,000 | | | | 2,012,113 | | | | 0.30 | |
Malaysia (Govt of) 4.378%, 11/29/2019 | | MYR | | | 3,800,000 | | | | 1,258,632 | | | | 0.19 | |
Malaysia (Govt of) 3.492%, 03/31/2020 | | MYR | | | 5,200,000 | | | | 1,640,201 | | | | 0.24 | |
Malaysia (Govt of) 3.889%, 07/31/2020 | | MYR | | | 960,000 | | | | 310,671 | | | | 0.05 | |
Malaysia (Govt of) 4.160%, 07/15/2021 | | MYR | | | 4,610,000 | | | | 1,509,968 | | | | 0.22 | |
Malaysia (Govt of) 3.418%, 08/15/2022 | | MYR | | | 2,570,000 | | | | 800,052 | | | | 0.12 | |
Malaysia (Govt of) 3.480%, 03/15/2023 | | MYR | | | 5,220,000 | | | | 1,636,254 | | | | 0.24 | |
Malaysia (Govt of) 3.502%, 05/31/2027 | | MYR | | | 2,200,000 | | | | 668,253 | | | | 0.10 | |
Malaysia (Govt of) 5.248%, 09/15/2028 | | MYR | | | 100,000 | | | | 36,185 | | | | 0.01 | |
Petronas Capital Ltd. 5.250%, 08/12/2019 | | | | | 450,000 | | | | 506,273 | | | | 0.07 | |
Petronas Capital Ltd. 7.875%, 05/22/2022 | | | | | 440,000 | | | | 569,302 | | | | 0.08 | |
Wakala Global Sukuk Bhd. 4.646%, 07/06/2021 | | | | | 500,000 | | | | 528,800 | | | | 0.08 | |
| | | | | | | | | 14,478,012 | | | | 2.15 | |
Mexico (Cost $39,544,537) | | | | | | | | | | | | | | |
America Movil S.A.B. de C.V. 6.450%, 12/05/2022 | | MXN | | | 9,860,000 | | | | 713,538 | | | | 0.11 | |
Cemex Espana Luxembourg 9.250%, 05/12/2020 | | | | | 4,012,000 | | | | 4,373,080 | | | | 0.65 | |
Cemex S.A.B. de C.V. 9.000%, 01/11/2018 | | | | | 800,000 | | | | 870,000 | | | | 0.13 | |
Cemex S.A.B. de C.V. 6.500%, 12/10/2019 | | | | | 1,300,000 | | | | 1,319,500 | | | | 0.20 | |
Comision Federal de Electricidad 4.875%, 05/26/2021 | | | | | 495,000 | | | | 516,038 | | | | 0.08 | |
Comision Federal de Electricidad 4.875%, 01/15/2024(2) | | | | | 400,000 | | | | 405,500 | | | | 0.06 | |
Comision Federal de Electricidad 5.750%, 02/14/2042 | | | | | 370,000 | | | | 351,962 | | | | 0.05 | |
Corp. GEO S.A.B. de C.V. 8.875%, 03/27/2022 | | | | | 1,400,000 | | | | 210,000 | | | | 0.03 | |
Desarrolladora Homex S.A.B. de C.V. 9.750%, 03/25/2020(5) | | | | | 1,250,000 | | | | 206,250 | | | | 0.03 | |
Grupo Papelero Scribe S.A. de C.V. 8.875%, 04/07/2020 | | | | | 190,000 | | | | 185,725 | | | | 0.03 | |
Grupo Televisa S.A.B. 7.250%, 05/14/2043 | | MXN | | | 5,000,000 | | | | 318,614 | | | | 0.05 | |
Mexican Bonos 6.500%, 06/09/2022 | | MXN | | | 19,000,000 | | | | 1,511,372 | | | | 0.22 | |
Mexican Bonos 10.000%, 12/05/2024 | | MXN | | | 8,000,000 | | | | 807,711 | | | | 0.12 | |
Mexican Bonos 7.500%, 06/03/2027 | | MXN | | | 38,540,000 | | | | 3,225,725 | | | | 0.48 | |
Mexican Bonos 8.500%, 05/31/2029 | | MXN | | | 42,060,000 | | | | 3,737,843 | | | | 0.55 | |
Mexican Bonos 7.750%, 05/29/2031 | | MXN | | | 16,850,000 | | | | 1,381,608 | | | | 0.20 | |
Mexican Bonos 10.000%, 11/20/2036 | | MXN | | | 17,800,000 | | | | 1,766,462 | | | | 0.26 | |
Mexican Bonos 8.500%, 11/18/2038 | | MXN | | | 17,300,000 | | | | 1,499,286 | | | | 0.22 | |
Mexican Bonos 7.750%, 11/13/2042 | | MXN | | | 28,500,000 | | | | 2,288,569 | | | | 0.34 | |
Mexican Udibonos 4.000%, 11/15/2040 | | MXN | | | 9,556,878 | | | | 777,382 | | | | 0.11 | |
Mexico (Rep of) 5.950%, 03/19/2019 | | | | | 386,000 | | | | 449,304 | | | | 0.07 | |
Mexico (Rep of) 6.750%, 09/27/2034 | | | | | 984,000 | | | | 1,205,400 | | | | 0.18 | |
Mexico (Rep of) 6.050%, 01/11/2040 | | | | | 82,000 | | | | 92,865 | | | | 0.01 | |
See accompanying notes to the financial statements.
75
ASHMORE EMERGING MARKETS TOTAL RETURN FUND
SCHEDULE OF INVESTMENTS (CONTINUED)
As of October 31, 2013
| | | | | | | | | | | | | | |
| | | Currency(1) | | Par | | | Value | | | % of Net Assets | |
Mexico - (continued) | | | | | | | | | | | | | | |
Mexico (Rep of) 4.750%, 03/08/2044 | | | | | 466,000 | | | $ | 436,875 | | | | 0.06 | |
Mexico (Rep of) 5.750%, 10/12/2110 | | | | | 268,000 | | | | 259,290 | | | | 0.04 | |
NII Capital Corp. 10.000%, 08/15/2016 | | | | | 1,000,000 | | | | 780,000 | | | | 0.12 | |
NII Capital Corp. 8.875%, 12/15/2019 | | | | | 500,000 | | | | 312,500 | | | | 0.05 | |
Pemex Project Funding Master Trust 5.750%, 03/01/2018 | | | | | 402,000 | | | | 448,230 | | | | 0.07 | |
Petroleos Mexicanos 8.000%, 05/03/2019 | | | | | 560,000 | | | | 684,320 | | | | 0.10 | |
Petroleos Mexicanos 6.000%, 03/05/2020 | | | | | 322,000 | | | | 361,445 | | | | 0.05 | |
Petroleos Mexicanos 7.650%, 11/24/2021 | | MXN | | | 5,500,000 | | | | 445,597 | | | | 0.07 | |
Petroleos Mexicanos 6.500%, 06/02/2041 | | | | | 583,000 | | | | 620,895 | | | | 0.09 | |
Petroleos Mexicanos 5.500%, 06/27/2044 | | | | | 115,000 | | | | 107,525 | | | | 0.02 | |
Urbi Desarrollos Urbanos S.A.B. de C.V. 8.500%, 04/19/2016(4)(5) | | | | | 129,000 | | | | 20,640 | | | | — | |
Urbi Desarrollos Urbanos S.A.B. de C.V. 9.500%, 01/21/2020(4)(5) | | | | | 1,227,000 | | | | 196,320 | | | | 0.03 | |
Urbi Desarrollos Urbanos S.A.B. de C.V. 9.750%, 02/03/2022(4)(5) | | | | | 3,952,000 | | | | 632,320 | | | | 0.09 | |
| | | | | | | | | 33,519,691 | | | | 4.97 | |
Mongolia (Cost $2,132,673) | | | | | | | | | | | | | | |
Mongolian Mining Corp. 8.875%, 03/29/2017 | | | | | 2,075,000 | | | | 1,696,313 | | | | 0.25 | |
| | | | | | | | | 1,696,313 | | | | 0.25 | |
Morocco (Cost $1,509,610) | | | | | | | | | | | | | | |
Morocco (Rep of) 4.250%, 12/11/2022 | | | | | 1,135,000 | | | | 1,066,900 | | | | 0.16 | |
Morocco (Rep of) 5.500%, 12/11/2042 | | | | | 400,000 | | | | 350,000 | | | | 0.05 | |
| | | | | | | | | 1,416,900 | | | | 0.21 | |
Nigeria (Cost $11,680,583) | | | | | | | | | | | | | | |
Afren PLC 11.500%, 02/01/2016 | | | | | 1,225,000 | | | | 1,398,031 | | | | 0.21 | |
Afren PLC 10.250%, 04/08/2019 | | | | | 2,600,000 | | | | 2,977,000 | | | | 0.44 | |
Nigeria (Rep of) 16.000%, 06/29/2019 | | NGN | | | 50,000,000 | | | | 360,642 | | | | 0.05 | |
Nigeria (Rep of) 6.750%, 01/28/2021 | | | | | 400,000 | | | | 441,000 | | | | 0.07 | |
Nigeria (Rep of) 16.390%, 01/27/2022 | | NGN | | | 261,500,000 | | | | 1,983,152 | | | | 0.30 | |
Nigeria Treasury Bill 11.270%, 04/10/2014(3) | | NGN | | | 170,000,000 | | | | 1,015,686 | | | | 0.15 | |
Sea Trucks Group 9.000%, 03/26/2018(2) | | | | | 3,510,000 | | | | 3,316,950 | | | | 0.49 | |
| | | | | | | | | 11,492,461 | | | | 1.71 | |
Pakistan (Cost $682,797) | | | | | | | | | | | | | | |
Pakistan (Rep of) 7.125%, 03/31/2016 | | | | | 305,000 | | | | 303,475 | | | | 0.05 | |
Pakistan (Rep of) 6.875%, 06/01/2017 | | | | | 420,000 | | | | 412,650 | | | | 0.06 | |
| | | | | | | | | 716,125 | | | | 0.11 | |
Panama (Cost $2,424,993) | | | | | | | | | | | | | | |
Panama (Rep of) 7.125%, 01/29/2026 | | | | | 356,000 | | | | 442,330 | | | | 0.07 | |
Panama (Rep of) 8.875%, 09/30/2027 | | | | | 130,000 | | | | 180,212 | | | | 0.03 | |
Panama (Rep of) 9.375%, 04/01/2029 | | | | | 535,000 | | | | 773,075 | | | | 0.11 | |
Panama (Rep of) 6.700%, 01/26/2036 | | | | | 609,000 | | | | 720,142 | | | | 0.11 | |
Panama (Rep of) 4.300%, 04/29/2053 | | | | | 110,000 | | | | 89,760 | | | | 0.01 | |
| | | | | | | | | 2,205,519 | | | | 0.33 | |
Paraguay (Cost $1,885,442) | | | | | | | | | | | | | | |
Paraguay (Rep of) 4.625%, 01/25/2023 | | | | | 480,000 | | | | 453,600 | | | | 0.07 | |
Telefonica Celular del Paraguay S.A. 6.750%, 12/13/2022 | | | | | 1,350,000 | | | | 1,363,500 | | | | 0.20 | |
| | | | | | | | | 1,817,100 | | | | 0.27 | |
Peru (Cost $6,657,456) | | | | | | | | | | | | | | |
Peru (Rep of) 8.600%, 08/12/2017 | | PEN | | | 1,400,000 | | | | 578,493 | | | | 0.09 | |
Peru (Rep of) 7.125%, 03/30/2019 | | | | | 225,000 | | | | 274,050 | | | | 0.04 | |
Peru (Rep of) 7.840%, 08/12/2020 | | PEN | | | 1,800,000 | | | | 755,169 | | | | 0.11 | |
Peru (Rep of) 7.350%, 07/21/2025 | | | | | 721,000 | | | | 929,369 | | | | 0.14 | |
See accompanying notes to the financial statements.
76
ASHMORE EMERGING MARKETS TOTAL RETURN FUND
SCHEDULE OF INVESTMENTS (CONTINUED)
As of October 31, 2013
| | | | | | | | | | | | | | |
| | | Currency(1) | | Par | | | Value | | | % of Net Assets | |
Peru - (continued) | | | | | | | | | | | | | | |
Peru (Rep of) 8.200%, 08/12/2026 | | PEN | | | 2,129,000 | | | $ | 950,534 | | | | 0.14 | |
Peru (Rep of) 6.950%, 08/12/2031 | | PEN | | | 1,030,000 | | | | 400,300 | | | | 0.06 | |
Peru (Rep of) 8.750%, 11/21/2033 | | | | | 1,072,000 | | | | 1,562,976 | | | | 0.23 | |
Peru (Rep of) 6.900%, 08/12/2037 | | PEN | | | 1,472,000 | | | | 568,363 | | | | 0.08 | |
Peru (Rep of) 6.850%, 02/12/2042 | | PEN | | | 466,000 | | | | 177,174 | | | | 0.03 | |
| | | | | | | | | 6,196,428 | | | | 0.92 | |
Philippines (Cost $7,744,541) | | | | | | | | | | | | | | |
Petron Corp. 7.000%, 11/10/2017 | | PHP | | | 19,000,000 | | | | 434,709 | | | | 0.07 | |
Philippines (Rep of) 8.375%, 06/17/2019 | | | | | 180,000 | | | | 232,200 | | | | 0.03 | |
Philippines (Rep of) 4.000%, 01/15/2021 | | | | | 708,000 | | | | 754,905 | | | | 0.11 | |
Philippines (Rep of) 3.900%, 11/26/2022 | | PHP | | | 17,000,000 | | | | 413,099 | | | | 0.06 | |
Philippines (Rep of) 10.625%, 03/16/2025 | | | | | 334,000 | | | | 527,720 | | | | 0.08 | |
Philippines (Rep of) 5.500%, 03/30/2026 | | | | | 620,000 | | | | 709,900 | | | | 0.11 | |
Philippines (Rep of) 9.500%, 02/02/2030 | | | | | 1,010,000 | | | | 1,547,825 | | | | 0.23 | |
Philippines (Rep of) 7.750%, 01/14/2031 | | | | | 620,000 | | | | 833,900 | | | | 0.12 | |
Philippines (Rep of) 6.250%, 01/14/2036 | | PHP | | | 22,000,000 | | | | 582,967 | | | | 0.09 | |
Power Sector Assets & Liabilities Management Corp. 7.250%, 05/27/2019 | | | | | 520,000 | | | | 629,200 | | | | 0.09 | |
Power Sector Assets & Liabilities Management Corp. 7.390%, 12/02/2024 | | | | | 622,000 | | | | 782,165 | | | | 0.12 | |
| | | | | | | | | 7,448,590 | | | | 1.11 | |
Poland (Cost $30,227,666) | | | | | | | | | | | | | | |
Eileme 2 AB 11.625%, 01/31/2020 | | | | | 2,400,000 | | | | 2,802,000 | | | | 0.42 | |
Eileme 2 AB 11.750%, 01/31/2020 | | EUR | | | 475,000 | | | | 761,986 | | | | 0.11 | |
Poland (Rep of) 5.000%, 04/25/2016 | | PLN | | | 16,014,000 | | | | 5,440,502 | | | | 0.81 | |
Poland (Rep of) 3.000%, 08/24/2016 | | PLN | | | 10,246,561 | | | | 3,497,537 | | | | 0.52 | |
Poland (Rep of) 4.750%, 04/25/2017 | | PLN | | | 13,805,000 | | | | 4,701,323 | | | | 0.70 | |
Poland (Rep of) 6.375%, 07/15/2019 | | | | | 858,000 | | | | 1,011,582 | | | | 0.15 | |
Poland (Rep of) 5.000%, 03/23/2022 | | | | | 313,000 | | | | 342,344 | | | | 0.05 | |
Poland (Rep of) 5.750%, 09/23/2022 | | PLN | | | 25,890,000 | | | | 9,402,634 | | | | 1.40 | |
Poland (Rep of) 3.000%, 03/17/2023 | | | | | 399,000 | | | | 372,267 | | | | 0.06 | |
Poland (Rep of) 2.750%, 08/25/2023 | | PLN | | | 2,038,467 | | | | 698,986 | | | | 0.10 | |
Poland (Rep of) 5.750%, 04/25/2029 | | PLN | | | 980,000 | | | | 359,956 | | | | 0.05 | |
Polish Television Holding B.V. 11.000%, 01/15/2021(6) | | EUR | | | 1,100,000 | | | | 1,579,552 | | | | 0.23 | |
| | | | | | | | | 30,970,669 | | | | 4.60 | |
Qatar (Cost $1,333,773) | | | | | | | | | | | | | | |
Qatar (Rep of) 6.400%, 01/20/2040 | | | | | 590,000 | | | | 691,775 | | | | 0.10 | |
Qatar (Rep of) 5.750%, 01/20/2042 | | | | | 488,000 | | | | 531,920 | | | | 0.08 | |
| | | | | | | | | 1,223,695 | | | | 0.18 | |
Romania (Cost $6,351,499) | | | | | | | | | | | | | | |
Romania (Rep of) 5.850%, 07/28/2014 | | RON | | | 5,290,000 | | | | 1,650,531 | | | | 0.24 | |
Romania (Rep of) 5.900%, 07/26/2017 | | RON | | | 1,460,000 | | | | 473,169 | | | | 0.07 | |
Romania (Rep of) 5.600%, 11/28/2018 | | RON | | | 200,000 | | | | 64,262 | | | | 0.01 | |
Romania (Rep of) 5.750%, 04/29/2020 | | RON | | | 800,000 | | | | 257,365 | | | | 0.04 | |
Romania (Rep of) 6.750%, 02/07/2022 | | | | | 1,998,000 | | | | 2,307,690 | | | | 0.34 | |
Romania (Rep of) 5.850%, 04/26/2023 | | RON | | | 520,000 | | | | 169,629 | | | | 0.03 | |
Romania (Rep of) 4.375%, 08/22/2023 | | | | | 1,604,000 | | | | 1,569,915 | | | | 0.23 | |
| | | | | | | | | 6,492,561 | | | | 0.96 | |
Russian Federation (Cost $88,490,434) | | | | | | | | | | | | | | |
Alfa Bank OJSC Via Alfa Bond Issuance PLC 7.500%, 09/26/2019 | | | | | 1,600,000 | | | | 1,704,000 | | | | 0.25 | |
Alfa Bank OJSC Via Alfa Bond Issuance PLC 7.750%, 04/28/2021 | | | | | 1,700,000 | | | | 1,848,750 | | | | 0.27 | |
See accompanying notes to the financial statements.
77
ASHMORE EMERGING MARKETS TOTAL RETURN FUND
SCHEDULE OF INVESTMENTS (CONTINUED)
As of October 31, 2013
| | | | | | | | | | | | | | |
| | | Currency(1) | | Par | | | Value | | | % of Net Assets | |
Russian Federation - (continued) | | | | | | | | | | | | | | |
Brunswick Rail Finance Ltd. 6.500%, 11/01/2017 | | | | | 1,650,000 | | | $ | 1,691,250 | | | | 0.25 | |
CEDC Finance Corp. International, Inc. , FRN 8.000%, 04/30/2018 | | | | | 3,223,103 | | | | 3,012,902 | | | | 0.45 | |
CEDC Finance Corp. International, Inc. 10.000%, 04/30/2018(6) | | | | | 774,617 | | | | 681,510 | | | | 0.10 | |
Credit Bank of Moscow Via CBOM Finance PLC 7.700%, 02/01/2018 | | | | | 2,600,000 | | | | 2,704,000 | | | | 0.40 | |
Far East Capital Ltd. S.A. 8.000%, 05/02/2018 | | | | | 3,650,000 | | | | 3,303,250 | | | | 0.49 | |
Far East Capital Ltd. S.A. 8.750%, 05/02/2020 | | | | | 1,350,000 | | | | 1,218,375 | | | | 0.18 | |
Mobile Telesystems OJSC 8.150%, 11/03/2020 | | RUB | | | 15,250,000 | | | | 480,742 | | | | 0.07 | |
MTS International Funding Ltd. 8.625%, 06/22/2020 | | | | | 4,400,000 | | | | 5,302,000 | | | | 0.79 | |
Promsvyazbank OJSC Via PSB Finance S.A. 8.500%, 04/25/2017 | | | | | 1,200,000 | | | | 1,296,000 | | | | 0.19 | |
Promsvyazbank OJSC Via PSB Finance S.A. 10.200%, 11/06/2019 | | | | | 2,050,000 | | | | 2,203,750 | | | | 0.33 | |
Russian Agricultural Bank OJSC Via RSHB Capital S.A. 7.750%, 05/29/2018 | | | | | 510,000 | | | | 576,351 | | | | 0.09 | |
Russian Federal Bond - OFZ 6.900%, 08/03/2016 | | RUB | | | 96,715,000 | | | | 3,061,816 | | | | 0.45 | |
Russian Federal Bond - OFZ 7.400%, 04/19/2017 | | RUB | | | 149,305,000 | | | | 4,785,842 | | | | 0.71 | |
Russian Federal Bond - OFZ 7.400%, 06/14/2017 | | RUB | | | 155,079,000 | | | | 4,973,340 | | | | 0.74 | |
Russian Federal Bond - OFZ 6.200%, 01/31/2018 | | RUB | | | 95,512,000 | | | | 2,933,493 | | | | 0.44 | |
Russian Federal Bond - OFZ 7.500%, 03/15/2018 | | RUB | | | 30,136,000 | | | | 972,561 | | | | 0.14 | |
Russian Federal Bond - OFZ 7.500%, 02/27/2019 | | RUB | | | 158,616,000 | | | | 5,123,864 | | | | 0.76 | |
Russian Federal Bond - OFZ 6.800%, 12/11/2019 | | RUB | | | 106,229,000 | | | | 3,309,021 | | | | 0.49 | |
Russian Federal Bond - OFZ 6.400%, 05/27/2020 | | RUB | | | 19,260,000 | | | | 585,750 | | | | 0.09 | |
Russian Federal Bond - OFZ 7.600%, 04/14/2021 | | RUB | | | 113,664,000 | | | | 3,677,070 | | | | 0.55 | |
Russian Federal Bond - OFZ 7.600%, 07/20/2022 | | RUB | | | 24,587,000 | | | | 794,248 | | | | 0.12 | |
Russian Federal Bond - OFZ 7.000%, 01/25/2023 | | RUB | | | 24,021,000 | | | | 745,255 | | | | 0.11 | |
Russian Federal Bond - OFZ 7.000%, 08/16/2023 | | RUB | | | 10,072,000 | | | | 310,444 | | | | 0.05 | |
Russian Federal Bond - OFZ 8.150%, 02/03/2027 | | RUB | | | 38,219,000 | | | | 1,263,807 | | | | 0.19 | |
Russian Federal Bond - OFZ 7.050%, 01/19/2028 | | RUB | | | 24,684,000 | | | | 738,502 | | | | 0.11 | |
Russian Foreign Bond - Eurobond 5.000%, 04/29/2020 | | | | | 400,000 | | | | 436,000 | | | | 0.06 | |
Russian Foreign Bond - Eurobond 4.875%, 09/16/2023(2) | | | | | 400,000 | | | | 419,600 | | | | 0.06 | |
Russian Foreign Bond - Eurobond 12.750%, 06/24/2028 | | | | | 147,000 | | | | 256,148 | | | | 0.04 | |
Russian Foreign Bond - Eurobond 7.500%, 03/31/2030 | | | | | 3,939,650 | | | | 4,688,380 | | | | 0.70 | |
Russian Foreign Bond - Eurobond 5.625%, 04/04/2042 | | | | | 1,200,000 | | | | 1,248,000 | | | | 0.19 | |
Russian Foreign Bond - Eurobond 5.875%, 09/16/2043(2) | | | | | 600,000 | | | | 637,500 | | | | 0.09 | |
Russian Standard Bank Via Russian Standard Finance S.A. 9.250%, 07/11/2017 | | | | | 2,000,000 | | | | 2,100,000 | | | | 0.31 | |
Sibmetinvest OOO 13.500%, 10/10/2019 | | RUB | | | 23,250,000 | | | | 753,958 | | | | 0.11 | |
SUEK Finance 8.250%, 06/26/2020 | | RUB | | | 25,500,000 | | | | 787,166 | | | | 0.12 | |
TMK OAO Via TMK Capital S.A. 7.750%, 01/27/2018 | | | | | 3,400,000 | | | | 3,561,500 | | | | 0.53 | |
TMK OAO Via TMK Capital S.A. 6.750%, 04/03/2020 | | | | | 3,720,000 | | | | 3,636,300 | | | | 0.54 | |
Vimpel Communications Via VIP Finance Ireland Ltd. OJSC 7.748%, 02/02/2021 | | | | | 6,400,000 | | | | 7,008,000 | | | | 1.04 | |
VimpelCom Holdings B.V. 9.000%, 02/13/2018 | | RUB | | | 35,000,000 | | | | 1,102,251 | | | | 0.16 | |
Vnesheconombank Via VEB Finance PLC 5.450%, 11/22/2017 | | | | | 317,000 | | | | 341,884 | | | | 0.05 | |
Vnesheconombank Via VEB Finance PLC 6.902%, 07/09/2020 | | | | | 1,882,000 | | | | 2,118,756 | | | | 0.31 | |
See accompanying notes to the financial statements.
78
ASHMORE EMERGING MARKETS TOTAL RETURN FUND
SCHEDULE OF INVESTMENTS (CONTINUED)
As of October 31, 2013
| | | | | | | | | | | | | | |
| | | Currency(1) | | Par | | | Value | | | % of Net
Assets | |
Russian Federation - (continued) | | | | | | | | | | | | | | |
Vnesheconombank Via VEB Finance PLC 6.800%, 11/22/2025 | | | | | 355,000 | | | $ | 386,062 | | | | 0.06 | |
| | | | | | | | | 88,779,398 | | | | 13.18 | |
Senegal (Cost $680,738) | | | | | | | | | | | | | | |
Senegal (Rep of) 8.750%, 05/13/2021 | | | | | 600,000 | | | | 658,500 | | | | 0.10 | |
| | | | | | | | | 658,500 | | | | 0.10 | |
Serbia (Cost $335,753) | | | | | | | | | | | | | | |
Serbia (Rep of) 7.250%, 09/28/2021 | | | | | 300,000 | | | | 312,000 | | | | 0.05 | |
| | | | | | | | | 312,000 | | | | 0.05 | |
Singapore (Cost $2,429,727) | | | | | | | | | | | | | | |
MMI International Ltd. 8.000%, 03/01/2017 | | | | | 1,300,000 | | | | 1,306,500 | | | | 0.19 | |
Olam International Ltd. 6.000%, 10/25/2022 | | SGD | | | 1,500,000 | | | | 1,057,723 | | | | 0.16 | |
| | | | | | | | | 2,364,223 | | | | 0.35 | |
South Africa (Cost $32,138,093) | | | | | | | | | | | | | | |
Edcon Ltd. 9.500%, 03/01/2018 | | EUR | | | 1,400,000 | | | | 1,919,859 | | | | 0.28 | |
Edcon Pty Ltd. 9.500%, 03/01/2018 | | | | | 2,250,000 | | | | 2,550,418 | | | | 0.38 | |
South Africa (Rep of) 8.250%, 09/15/2017 | | ZAR | | | 50,000,000 | | | | 5,264,301 | | | | 0.78 | |
South Africa (Rep of) 8.000%, 12/21/2018 | | ZAR | | | 39,800,000 | | | | 4,166,834 | | | | 0.62 | |
South Africa (Rep of) 6.875%, 05/27/2019 | | | | | 490,000 | | | | 565,950 | | | | 0.08 | |
South Africa (Rep of) 5.500%, 03/09/2020 | | | | | 1,529,000 | | | | 1,658,965 | | | | 0.25 | |
South Africa (Rep of) 5.875%, 05/30/2022 | | | | | 420,000 | | | | 459,900 | | | | 0.07 | |
South Africa (Rep of) 7.750%, 02/28/2023 | | ZAR | | | 45,500,000 | | | | 4,575,495 | | | | 0.68 | |
South Africa (Rep of) 10.500%, 12/21/2026 | | ZAR | | | 19,800,000 | | | | 2,367,085 | | | | 0.35 | |
South Africa (Rep of) 7.000%, 02/28/2031 | | ZAR | | | 42,100,000 | | | | 3,576,429 | | | | 0.53 | |
South Africa (Rep of) 6.250%, 03/31/2036 | | ZAR | | | 13,540,000 | | | | 1,010,919 | | | | 0.15 | |
South Africa (Rep of) 6.500%, 02/28/2041 | | ZAR | | | 12,500,000 | | | | 931,428 | | | | 0.14 | |
South Africa (Rep of) 8.750%, 02/28/2048 | | ZAR | | | 6,500,000 | | | | 625,677 | | | | 0.09 | |
| | | | | | | | | 29,673,260 | | | | 4.40 | |
Sri Lanka (Cost $1,034,884) | | | | | | | | | | | | | | |
Bank of Ceylon 6.875%, 05/03/2017 | | | | | 200,000 | | | | 205,000 | | | | 0.03 | |
Sri Lanka (Rep of) 6.250%, 10/04/2020 | | | | | 560,000 | | | | 567,700 | | | | 0.09 | |
Sri Lanka (Rep of) 6.250%, 07/27/2021 | | | | | 220,000 | | | | 221,100 | | | | 0.03 | |
| | | | | | | | | 993,800 | | | | 0.15 | |
Thailand (Cost $8,178,328) | | | | | | | | | | | | | | |
Thailand (Govt of) 3.250%, 06/16/2017 | | THB | | | 48,300,000 | | | | 1,556,706 | | | | 0.23 | |
Thailand (Govt of) 3.875%, 06/13/2019 | | THB | | | 29,700,000 | | | | 973,713 | | | | 0.14 | |
Thailand (Govt of) 1.200%, 07/14/2021 | | THB | | | 25,152,360 | | | | 755,209 | | | | 0.11 | |
Thailand (Govt of) 3.650%, 12/17/2021 | | THB | | | 42,100,000 | | | | 1,342,218 | | | | 0.20 | |
Thailand (Govt of) 3.625%, 06/16/2023 | | THB | | | 71,900,000 | | | | 2,261,952 | | | | 0.34 | |
Thailand (Govt of) 3.580%, 12/17/2027 | | THB | | | 14,900,000 | | | | 450,371 | | | | 0.07 | |
Thailand (Govt of) 1.250%, 03/12/2028 | | THB | | | 17,970,346 | | | | 491,317 | | | | 0.07 | |
| | | | | | | | | 7,831,486 | | | | 1.16 | |
Turkey (Cost $24,800,879) | | | | | | | | | | | | | | |
Roenesans Holding, FRN 11.650%, 12/18/2015 | | TRY | | | 610,000 | | | | 305,879 | | | | 0.05 | |
Turkey (Rep of) 9.000%, 05/21/2014 | | TRY | | | 4,119,210 | | | | 2,174,900 | | | | 0.32 | |
Turkey (Rep of) 7.000%, 09/26/2016 | | | | | 321,000 | | | | 357,658 | | | | 0.05 | |
Turkey (Rep of) 7.500%, 07/14/2017 | | | | | 350,000 | | | | 400,750 | | | | 0.06 | |
Turkey (Rep of) 6.750%, 04/03/2018 | | | | | 1,308,000 | | | | 1,471,500 | | | | 0.22 | |
Turkey (Rep of) 8.300%, 06/20/2018 | | TRY | | | 3,000,000 | | | | 1,507,326 | | | | 0.22 | |
Turkey (Rep of) 7.000%, 03/11/2019 | | | | | 610,000 | | | | 696,162 | | | | 0.10 | |
Turkey (Rep of) 7.500%, 11/07/2019 | | | | | 390,000 | | | | 459,225 | | | | 0.07 | |
Turkey (Rep of) 4.000%, 04/01/2020 | | TRY | | | 2,029,760 | | | | 1,132,698 | | | | 0.17 | |
Turkey (Rep of) 5.625%, 03/30/2021 | | | | | 630,000 | | | | 672,525 | | | | 0.10 | |
See accompanying notes to the financial statements.
79
ASHMORE EMERGING MARKETS TOTAL RETURN FUND
SCHEDULE OF INVESTMENTS (CONTINUED)
As of October 31, 2013
| | | | | | | | | | | | | | |
| | | Currency(1) | | Par | | | Value | | | % of Net
Assets | |
Turkey - (continued) | | | | | | | | | | | | | | |
Turkey (Rep of) 9.500%, 01/12/2022 | | TRY | | | 1,750,000 | | | $ | 922,668 | | | | 0.14 | |
Turkey (Rep of) 3.000%, 02/23/2022 | | TRY | | | 9,614,718 | | | | 5,045,189 | | | | 0.75 | |
Turkey (Rep of) 8.500%, 09/14/2022 | | TRY | | | 2,660,000 | | | | 1,321,838 | | | | 0.20 | |
Turkey (Rep of) 6.250%, 09/26/2022 | | | | | 290,000 | | | | 319,725 | | | | 0.05 | |
Turkey (Rep of) 7.100%, 03/08/2023 | | TRY | | | 4,100,000 | | | | 1,858,222 | | | | 0.28 | |
Turkey (Rep of) 3.250%, 03/23/2023 | | | | | 250,000 | | | | 219,688 | | | | 0.03 | |
Turkey (Rep of) 7.375%, 02/05/2025 | | | | | 812,000 | | | | 950,040 | | | | 0.14 | |
Turkey (Rep of) 8.000%, 02/14/2034 | | | | | 619,000 | | | | 765,455 | | | | 0.11 | |
Turkey (Rep of) 6.875%, 03/17/2036 | | | | | 1,350,000 | | | | 1,491,750 | | | | 0.22 | |
Turkey (Rep of) 7.250%, 03/05/2038 | | | | | 305,000 | | | | 350,750 | | | | 0.05 | |
Turkey (Rep of) 6.750%, 05/30/2040 | | | | | 487,000 | | | | 530,830 | | | | 0.08 | |
Turkey (Rep of) 4.875%, 04/16/2043 | | | | | 250,000 | | | | 215,938 | | | | 0.03 | |
| | | | | | | | | 23,170,716 | | | | 3.44 | |
Ukraine (Cost $34,059,411) | | | | | | | | | | | | | | |
DTEK Finance PLC 7.875%, 04/04/2018 | | | | | 4,293,000 | | | | 3,863,700 | | | | 0.57 | |
Ferrexpo Finance PLC 7.875%, 04/07/2016 | | | | | 3,400,000 | | | | 3,276,750 | | | | 0.49 | |
Metinvest B.V. 10.250%, 05/20/2015 | | | | | 6,500,000 | | | | 6,500,000 | | | | 0.96 | |
MHP S.A. 10.250%, 04/29/2015 | | | | | 2,868,000 | | | | 2,882,340 | | | | 0.43 | |
MHP S.A. 8.250%, 04/02/2020 | | | | | 3,550,000 | | | | 3,044,125 | | | | 0.45 | |
Mriya Agro Holding PLC 9.450%, 04/19/2018 | | | | | 2,100,000 | | | | 1,806,000 | | | | 0.27 | |
National JSC Naftogaz of Ukraine 9.500%, 09/30/2014 | | | | | 1,805,000 | | | | 1,701,213 | | | | 0.25 | |
Oschadbank Via SSB #1 PLC 8.250%, 03/10/2016 | | | | | 600,000 | | | | 516,000 | | | | 0.08 | |
Oschadbank Via SSB #1 PLC 8.875%, 03/20/2018 | | | | | 400,000 | | | | 332,000 | | | | 0.05 | |
Privatbank CJSC Via UK SPV Credit Finance PLC 9.375%, 09/23/2015 | | | | | 600,000 | | | | 529,500 | | | | 0.08 | |
Ukraine (Govt of) 6.250%, 06/17/2016 | | | | | 200,000 | | | | 179,000 | | | | 0.03 | |
Ukraine (Govt of) 9.250%, 07/24/2017 | | | | | 1,875,000 | | | | 1,792,969 | | | | 0.27 | |
Ukraine (Govt of) 7.750%, 09/23/2020 | | | | | 990,000 | | | | 895,950 | | | | 0.13 | |
Ukraine (Govt of) 7.950%, 02/23/2021 | | | | | 330,000 | | | | 299,062 | | | | 0.04 | |
Ukraine (Govt of) 7.800%, 11/28/2022 | | | | | 1,770,000 | | | | 1,539,900 | | | | 0.23 | |
Ukraine Railways via Shortline PLC 9.500%, 05/21/2018 | | | | | 200,000 | | | | 170,000 | | | | 0.02 | |
Ukreximbank Via Biz Finance PLC 8.750%, 01/22/2018 | | | | | 1,170,000 | | | | 979,875 | | | | 0.14 | |
UKRLANDFARMING PLC 10.875%, 03/26/2018 | | | | | 1,610,000 | | | | 1,457,050 | | | | 0.22 | |
| | | | | | | | | 31,765,434 | | | | 4.71 | |
United Arab Emirates (Cost $21,675,602) | | | | | | | | | | | | | | |
Anka a Sukuk Ltd. 10.000%, 08/25/2016 | | AED | | | 4,000,000 | | | | 1,167,983 | | | | 0.17 | |
Dana Gas Sukuk Ltd. 7.000%, 10/31/2017 | | | | | 1,100,000 | | | | 1,049,411 | | | | 0.16 | |
Dana Gas Sukuk Ltd. 9.000%, 10/31/2017 | | | | | 2,000,000 | | | | 1,910,000 | | | | 0.28 | |
DP World Ltd. 6.850%, 07/02/2037 | | | | | 3,700,000 | | | | 3,866,500 | | | | 0.57 | |
DP World Sukuk Ltd. 6.250%, 07/02/2017 | | | | | 1,550,000 | | | | 1,701,125 | | | | 0.25 | |
Dubai DOF Sukuk Ltd. 6.450%, 05/02/2022 | | | | | 200,000 | | | | 222,500 | | | | 0.03 | |
Dubai DOF Sukuk Ltd. 3.875%, 01/30/2023 | | | | | 330,000 | | | | 309,375 | | | | 0.05 | |
Dubai Holding Commercial Operations MTN Ltd. 4.750%, 01/30/2014 | | EUR | | | 3,650,000 | | | | 4,955,788 | | | | 0.74 | |
Dubai Holding Commercial Operations MTN Ltd. 6.000%, 02/01/2017 | | GBP | | | 1,650,000 | | | | 2,724,978 | | | | 0.41 | |
Emirate of Dubai Government International Bonds 7.750%, 10/05/2020 | | | | | 3,320,000 | | | | 3,959,100 | | | | 0.59 | |
Emirate of Dubai Government International Bonds 5.250%, 01/30/2043 | | | | | 250,000 | | | | 216,562 | | | | 0.03 | |
| | | | | | | | | 22,083,322 | | | | 3.28 | |
Uruguay (Cost $5,695,496) | | | | | | | | | | | | | | |
Uruguay (Rep of) 5.000%, 09/14/2018 | | UYU | | | 20,421,109 | | | | 1,065,034 | | | | 0.16 | |
See accompanying notes to the financial statements.
80
ASHMORE EMERGING MARKETS TOTAL RETURN FUND
SCHEDULE OF INVESTMENTS (CONTINUED)
As of October 31, 2013
| | | | | | | | | | | | | | |
| | | Currency(1) | | Par | | | Value | | | % of Net
Assets | |
Uruguay - (continued) | | | | | | | | | | | | | | |
Uruguay (Rep of) 4.500%, 08/14/2024 | | | | | 539,374 | | | $ | 556,904 | | | | 0.08 | |
Uruguay (Rep of) 4.250%, 04/05/2027 | | UYU | | | 7,462,865 | | | | 373,699 | | | | 0.06 | |
Uruguay (Rep of) 4.375%, 12/15/2028 | | UYU | | | 17,933,203 | | | | 922,269 | | | | 0.14 | |
Uruguay (Rep of) 7.875%, 01/15/2033(6) | | | | | 751,000 | | | | 982,683 | | | | 0.15 | |
Uruguay (Rep of) 7.625%, 03/21/2036 | | | | | 595,000 | | | | 763,087 | | | | 0.11 | |
Uruguay (Rep of) 3.700%, 06/26/2037 | | UYU | | | 7,869,025 | | | | 371,173 | | | | 0.05 | |
Uruguay (Rep of) 4.125%, 11/20/2045 | | | | | 446,300 | | | | 368,198 | | | | 0.05 | |
Uruguay Notas del Tesoro 9.000%, 01/27/2014 | | UYU | | | 100,000 | | | | 4,588 | | | | — | |
Uruguay Notas del Tesoro 3.250%, 01/27/2019 | | UYU | | | 262,940 | | | | 12,804 | | | | — | |
| | | | | | | | | 5,420,439 | | | | 0.80 | |
Venezuela (Cost $10,428,927) | | | | | | | | | | | | | | |
Petroleos de Venezuela S.A. 5.250%, 04/12/2017 | | | | | 435,000 | | | | 349,088 | | | | 0.05 | |
Petroleos de Venezuela S.A. 12.750%, 02/17/2022 | | | | | 230,000 | | | | 227,700 | | | | 0.03 | |
Petroleos de Venezuela S.A. 5.375%, 04/12/2027 | | | | | 1,215,000 | | | | 747,225 | | | | 0.11 | |
Petroleos de Venezuela S.A. 5.500%, 04/12/2037 | | | | | 264,000 | | | | 155,100 | | | | 0.02 | |
Venezuela (Rep of) 8.500%, 10/08/2014 | | | | | 484,000 | | | | 478,676 | | | | 0.07 | |
Venezuela (Rep of) 5.750%, 02/26/2016 | | | | | 280,000 | | | | 249,200 | | | | 0.04 | |
Venezuela (Rep of) 7.750%, 10/13/2019 | | | | | 470,000 | | | | 385,400 | | | | 0.06 | |
Venezuela (Rep of) 6.000%, 12/09/2020 | | | | | 385,000 | | | | 281,050 | | | | 0.04 | |
Venezuela (Rep of) 12.750%, 08/23/2022 | | | | | 956,000 | | | | 963,170 | | | | 0.14 | |
Venezuela (Rep of) 9.000%, 05/07/2023 | | | | | 520,000 | | | | 422,500 | | | | 0.06 | |
Venezuela (Rep of) 8.250%, 10/13/2024 | | | | | 423,000 | | | | 322,538 | | | | 0.05 | |
Venezuela (Rep of) 7.650%, 04/21/2025 | | | | | 315,000 | | | | 230,422 | | | | 0.04 | |
Venezuela (Rep of) 11.750%, 10/21/2026 | | | | | 2,337,000 | | | | 2,161,725 | | | | 0.32 | |
Venezuela (Rep of) 9.250%, 09/15/2027 | | | | | 409,000 | | | | 337,425 | | | | 0.05 | |
Venezuela (Rep of) 9.250%, 05/07/2028 | | | | | 720,000 | | | | 572,400 | | | | 0.09 | |
Venezuela (Rep of) 11.950%, 08/05/2031 | | | | | 1,985,200 | | | | 1,836,310 | | | | 0.27 | |
| | | | | | | | | 9,719,929 | | | | 1.44 | |
Vietnam (Cost $1,280,324) | | | | | | | | | | | | | | |
Vietnam (Rep of) 6.875%, 01/15/2016 | | | | | 520,000 | | | | 561,600 | | | | 0.08 | |
Vietnam (Rep of) 6.750%, 01/29/2020 | | | | | 643,000 | | | | 703,281 | | | | 0.11 | |
| | | | | | | | | 1,264,881 | | | | 0.19 | |
Zambia (Cost $301,178) | | | | | | | | | | | | | | |
Zambia (Rep of) 5.375%, 09/20/2022 | | | | | 300,000 | | | | 270,750 | | | | 0.04 | |
| | | | | | | | | 270,750 | | | | 0.04 | |
Total Debt Securities (Cost $590,387,028) | | | | | | | | | 564,993,467 | | | | 83.86 | |
| | | | |
| | | Currency(1) | | Shares | | | Value | | | % of Net
Assets | |
Equity Securities | | | | | | | | | | | | | | |
| | | | |
China (Cost $ — ) | | | | | | | | | | | | | | |
Emerald Plantation Holdings Ltd. | | | | | 308,246 | | | $ | 46,237 | | | | 0.01 | |
| | | | | | | | | 46,237 | | | | 0.01 | |
Kazakhstan (Cost $624,700) | | | | | | | | | | | | | | |
BTA Bank JSC GDR (Registered) | | | | | 34,532 | | | | 27,971 | | | | — | |
| | | | | | | | | 27,971 | | | | — | |
Total Equity Securities (Cost $624,700) | | | | | | | | | 74,208 | | | | 0.01 | |
See accompanying notes to the financial statements.
81
ASHMORE EMERGING MARKETS TOTAL RETURN FUND
SCHEDULE OF INVESTMENTS (CONTINUED)
As of October 31, 2013
| | | | | | | | | | | | | | |
| | | Currency(1) | | Number of Contracts | | | Value | | | % of Net
Assets | |
Purchased Options | | | | | | | | | | | | | | |
| | | | |
United States (Premiums Paid $189,973) | | | | | | | | | | | | | | |
Euro Volatility Quoted American Style Options, Exp. 11/08/2013,
Strike Price $1.26 | | EUR | | | 9,400,000 | | | $ | 128 | | | | — | |
| | | | |
Total Purchased Options (Premiums Paid $189,973) | | | | | | | | | 128 | | | | — | |
| | | | |
| | | Currency(1) | | Par | | | Value | | | % of Net
Assets | |
Warrants | | | | | | | | | | | | | | |
| | | | |
(Cost $27,482) | | | | | | | | | | | | | | |
Far East Energy Bermuda Ltd., Exp. 08/23/2014,
Strike Price $11.92 | | | | | 1,308,684 | | | $ | 134,794 | | | | 0.02 | |
| | | | |
Total Warrants (Cost $27,482) | | | | | | | | | 134,794 | | | | 0.02 | |
| | | | |
| | | Currency(1) | | Par | | | Value | | | % of Net
Assets | |
Short-Term Investments | | | | | | | | | | | | | | |
| | | | |
Abnajesh, Time Deposit 0.110%, 11/01/2013 | | | | | 25,000,000 | | | $ | 25,000,000 | | | | 3.71 | |
Riyad Bank London, Time Deposit 0.120%, 11/06/2013 | | | | | 25,000,000 | | | | 25,000,000 | | | | 3.71 | |
United Kingdom, Time Deposit 0.120%, 11/07/2013 | | | | | 25,000,000 | | | | 25,000,000 | | | | 3.71 | |
Total Short-Term Investments (Cost $75,000,000) | | | | | | | | | 75,000,000 | | | | 11.13 | |
| | | | |
Total Investments in Securities (Cost $666,229,183) | | | | | | | | | 640,202,597 | | | | 95.02 | |
| | | | |
Fully Funded Total Return Swaps | | | | | | | | | | | | | | |
| | | | |
Indonesia (Cost $9,079,300) | | | | | | | | | | | | | | |
Indonesia (Rep of) 12.800% 06/15/2021 | | IDR | | | 15,700,000,000 | | | | 1,817,565 | | | | 0.27 | |
Indonesia (Rep of) 11.000% 09/15/2025 | | IDR | | | 1,200,000,000 | | | | 132,269 | | | | 0.02 | |
Indonesia (Rep of) 8.375% 09/15/2026 | | IDR | | | 9,100,000,000 | | | | 843,100 | | | | 0.13 | |
Indonesia (Rep of) 7.000% 05/15/2027 | | IDR | | | 10,400,000,000 | | | | 857,870 | | | | 0.13 | |
Indonesia (Rep of) 10.500% 08/15/2030 | | IDR | | | 26,950,000,000 | | | | 2,917,366 | | | | 0.43 | |
Indonesia (Rep of) 9.500% 07/15/2031 | | IDR | | | 2,120,000,000 | | | | 212,284 | | | | 0.03 | |
| | | | | | | | | 6,780,454 | | | | 1.01 | |
Total Fully Funded Total Return Swaps (Cost $9,079,300) | | | | | | | | | 6,780,454 | | | | 1.01 | |
| | | | |
Total Investments (Total Cost $675,308,483) | | | | | | | | | 646,983,051 | | | | 96.03 | |
| | |
Other Assets Less Liabilities (See Statements of Assets and Liabilities for further detail) | | | | 26,742,404 | | | | 3.97 | |
Net Assets | | | | | | | | $ | 673,725,455 | | | | 100.00 | |
| (1) | Par values are stated in United States Dollars unless otherwise noted below. |
| (2) | Securities exempt from registration under Rule 144A of the Securities Act of 1933. These securities may not be publicly traded without registration under the Securities Act of 1933. |
See accompanying notes to the financial statements.
82
ASHMORE EMERGING MARKETS TOTAL RETURN FUND
SCHEDULE OF INVESTMENTS (CONTINUED)
As of October 31, 2013
| (3) | Zero coupon bond reflects effective yield on the date of purchase. |
| (4) | Security determined to be illiquid by the Investment Manager. |
| (5) | Issuer has defaulted on terms of debt obligation. |
| (6) | Security is payment in-kind bond. |
| (7) | Security has been deemed worthless and is a Level 3 investment. |
Percentages shown are based on net assets.
At October 31, 2013, the Ashmore Emerging Markets Total Return Fund had outstanding forward foreign currency exchange contracts as follows:
| | | | | | | | | | | | | | | | | | |
Settlement Date | | Counterparty | | Currency Buy | | Currency Buy Amount
(Local Currency) | | | Currency Sell | | Currency Sell Amount (Local
Currency) | | | Unrealized
Gain/(Loss) | |
11/04/2013 | | Barclays Wholesale GTS | | Brazilian Real | | | 1,270,965 | | | United States Dollar | | | 571,400 | | | | $(4,602) | |
11/04/2013 | | Barclays Wholesale GTS | | Brazilian Real | | | 592,731 | | | United States Dollar | | | 270,000 | | | | (5,666) | |
11/04/2013 | | Barclays Wholesale GTS | | Brazilian Real | | | 7,417,310 | | | United States Dollar | | | 3,420,000 | | | | (112,186) | |
11/04/2013 | | Citibank London | | Brazilian Real | | | 366,537 | | | United States Dollar | | | 163,414 | | | | 47 | |
11/04/2013 | | Goldman Sachs International Ltd. London | | Brazilian Real | | | 1,322,096 | | | United States Dollar | | | 582,307 | | | | 7,294 | |
11/04/2013 | | Goldman Sachs International Ltd. London | | Brazilian Real | | | 806,607 | | | United States Dollar | | | 358,568 | | | | 1,146 | |
11/04/2013 | | Goldman Sachs International Ltd. London | | Brazilian Real | | | 5,188,072 | | | United States Dollar | | | 2,339,604 | | | | (25,938) | |
11/04/2013 | | Goldman Sachs International Ltd. London | | Brazilian Real | | | 7,637,795 | | | United States Dollar | | | 3,490,000 | | | | (83,858) | |
11/04/2013 | | HSBC Bank PLC | | Brazilian Real | | | 456,136 | | | United States Dollar | | | 205,838 | | | | (2,420) | |
11/04/2013 | | HSBC Bank PLC | | Brazilian Real | | | 9,508,155 | | | United States Dollar | | | 4,329,702 | | | | (89,457) | |
11/04/2013 | | Barclays Wholesale GTS | | United States Dollar | | | 2,894,112 | | | Brazilian Real | | | 6,346,788 | | | | 63,706 | |
11/04/2013 | | Barclays Wholesale GTS | | United States Dollar | | | 2,451,717 | | | Brazilian Real | | | 5,380,293 | | | | 52,328 | |
11/04/2013 | | Barclays Wholesale GTS | | United States Dollar | | | 286,067 | | | Brazilian Real | | | 633,525 | | | | 3,541 | |
11/04/2013 | | Chase Manhattan Bank London | | United States Dollar | | | 217,128 | | | Brazilian Real | | | 481,763 | | | | 2,281 | |
11/04/2013 | | Deutsche Bank London | | United States Dollar | | | 932,457 | | | Brazilian Real | | | 2,098,494 | | | | (3,385) | |
11/04/2013 | | Goldman Sachs International Ltd. London | | United States Dollar | | | 4,765,708 | | | Brazilian Real | | | 10,432,134 | | | | 113,406 | |
11/04/2013 | | Standard Chartered London | | United States Dollar | | | 4,129,828 | | | Brazilian Real | | | 9,193,409 | | | | 29,946 | |
11/12/2013 | | Chase Manhattan Bank London | | Argentine Peso | | | 6,289,500 | | | United States Dollar | | | 1,025,852 | | | | 18,861 | |
11/15/2013 | | Goldman Sachs International Ltd. London | | Malaysian Ringgit | | | 8,500,000 | | | United States Dollar | | | 2,618,285 | | | | 61,464 | |
11/15/2013 | | Chase Manhattan Bank London | | Malaysian Ringgit | | | 1,200,000 | | | United States Dollar | | | 378,728 | | | | (411) | |
11/15/2013 | | Deutsche Bank London | | United States Dollar | | | 643,754 | | | Malaysian Ringgit | | | 2,030,400 | | | | 3,641 | |
11/29/2013 | | Barclays Wholesale GTS | | Chilean Peso | | | 192,171,696 | | | United States Dollar | | | 383,576 | | | | (10,115) | |
11/29/2013 | | Chase Manhattan Bank London | | Chilean Peso | | | 232,405,906 | | | United States Dollar | | | 462,730 | | | | (11,079) | |
11/29/2013 | | Citibank London | | Chilean Peso | | | 678,798,774 | | | United States Dollar | | | 1,345,755 | | | | (26,597) | |
11/29/2013 | | Deutsche Bank London | | Chilean Peso | | | 345,531,469 | | | United States Dollar | | | 687,488 | | | | (15,992) | |
11/29/2013 | | Deutsche Bank London | | Chilean Peso | | | 404,392,500 | | | United States Dollar | | | 810,000 | | | | (24,115) | |
11/29/2013 | | Goldman Sachs International Ltd. London | | Chilean Peso | | | 396,426,150 | | | United States Dollar | | | 788,672 | | | | (18,269) | |
11/29/2013 | | Standard Chartered London | | Chilean Peso | | | 544,233,025 | | | United States Dollar | | | 1,083,374 | | | | (25,727) | |
11/29/2013 | | Union Bank of Switzerland - London | | Chilean Peso | | | 129,476,551 | | | United States Dollar | | | 255,862 | | | | (4,241) | |
11/29/2013 | | Chase Manhattan Bank London | | Chinese Yuan Renminbi | | | 6,620,000 | | | United States Dollar | | | 1,079,406 | | | | (1,556) | |
11/29/2013 | | Goldman Sachs International Ltd. London | | Chinese Yuan Renminbi | | | 10,976,760 | | | United States Dollar | | | 1,789,495 | | | | (2,288) | |
11/29/2013 | | Standard Chartered London | | Chinese Yuan Renminbi | | | 70,508,079 | | | United States Dollar | | | 11,489,389 | | | | (9,454) | |
11/29/2013 | | Citibank London | | Colombian Peso | | | 1,020,033,765 | | | United States Dollar | | | 539,415 | | | | (1,827) | |
11/29/2013 | | Deutsche Bank London | | Colombian Peso | | | 902,211,152 | | | United States Dollar | | | 477,108 | | | | (1,616) | |
11/29/2013 | | Deutsche Bank London | | Colombian Peso | | | 1,431,080,000 | | | United States Dollar | | | 760,000 | | | | (5,778) | |
11/29/2013 | | Bank of America | | Czech Koruna | | | 1,888,842 | | | United States Dollar | | | 99,243 | | | | 166 | |
11/29/2013 | | Barclays Wholesale GTS | | Czech Koruna | | | 20,050,202 | | | United States Dollar | | | 1,046,707 | | | | 8,533 | |
11/29/2013 | | Barclays Wholesale GTS | | Czech Koruna | | | 9,796,579 | | | United States Dollar | | | 520,226 | | | | (4,633) | |
11/29/2013 | | Deutsche Bank London | | Czech Koruna | | | 19,014,280 | | | United States Dollar | | | 1,010,000 | | | | (9,280) | |
11/29/2013 | | Deutsche Bank London | | Czech Koruna | | | 18,887,357 | | | United States Dollar | | | 1,004,966 | | | | (10,926) | |
11/29/2013 | | Standard Chartered London | | Czech Koruna | | | 1,991,261 | | | United States Dollar | | | 105,094 | | | | (295) | |
11/29/2013 | | Barclays Wholesale GTS | | Hungarian Forint | | | 23,518,444 | | | United States Dollar | | | 105,470 | | | | 2,343 | |
11/29/2013 | | Barclays Wholesale GTS | | Hungarian Forint | | | 161,572,355 | | | United States Dollar | | | 741,402 | | | | (724) | |
11/29/2013 | | Barclays Wholesale GTS | | Hungarian Forint | | | 86,931,410 | | | United States Dollar | | | 403,001 | | | | (4,491) | |
11/29/2013 | | Deutsche Bank London | | Hungarian Forint | | | 61,204,780 | | | United States Dollar | | | 280,000 | | | | 574 | |
See accompanying notes to the financial statements.
83
ASHMORE EMERGING MARKETS TOTAL RETURN FUND
SCHEDULE OF INVESTMENTS (CONTINUED)
As of October 31, 2013
| | | | | | | | | | | | | | | | | | |
Settlement Date | | Counterparty | | Currency Buy | | Currency Buy Amount
(Local Currency) | | | Currency Sell | | Currency Sell Amount (Local
Currency) | | | Unrealized
Gain/(Loss) | |
11/29/2013 | | Deutsche Bank London | | Hungarian Forint | | | 161,761,781 | | | United States Dollar | | | 741,402 | | | | $145 | |
11/29/2013 | | Deutsche Bank London | | Hungarian Forint | | | 178,008,127 | | | United States Dollar | | | 817,074 | | | | (1,051) | |
11/29/2013 | | HSBC Bank PLC | | Hungarian Forint | | | 51,958,373 | | | United States Dollar | | | 232,892 | | | | 5,295 | |
11/29/2013 | | HSBC Bank PLC | | Hungarian Forint | | | 68,399,262 | | | United States Dollar | | | 308,589 | | | | 4,966 | |
11/29/2013 | | HSBC Bank PLC | | Hungarian Forint | | | 280,046,000 | | | United States Dollar | | | 1,300,000 | | | | (16,216) | |
11/29/2013 | | HSBC Bank PLC | | Hungarian Forint | | | 910,831,950 | | | United States Dollar | | | 4,221,505 | | | | (46,077) | |
11/29/2013 | | Citibank London | | Indian Rupee | | | 288,771,050 | | | United States Dollar | | | 4,661,357 | | | | (56,195) | |
11/29/2013 | | Deutsche Bank London | | Indian Rupee | | | 43,594,773 | | | United States Dollar | | | 706,446 | | | | (11,220) | |
11/29/2013 | | Deutsche Bank London | | Indian Rupee | | | 80,896,200 | | | United States Dollar | | | 1,304,567 | | | | (14,479) | |
11/29/2013 | | Goldman Sachs International Ltd. London | | Indian Rupee | | | 69,675,800 | | | United States Dollar | | | 1,123,622 | | | | (12,471) | |
11/29/2013 | | HSBC Bank PLC | | Indian Rupee | | | 19,683,000 | | | United States Dollar | | | 316,091 | | | | (2,198) | |
11/29/2013 | | Union Bank of Switzerland - London | | Indian Rupee | | | 295,000,000 | | | United States Dollar | | | 4,754,997 | | | | (50,499) | |
11/29/2013 | | Deutsche Bank London | | Indonesian Rupiah | | | 18,100,020,019 | | | United States Dollar | | | 1,585,635 | | | | 41,322 | |
11/29/2013 | | Standard Chartered London | | Indonesian Rupiah | | | 3,853,500,000 | | | United States Dollar | | | 350,000 | | | | (3,620) | |
11/29/2013 | | Union Bank of Switzerland - London | | Indonesian Rupiah | | | 25,490,915,103 | | | United States Dollar | | | 2,235,065 | | | | 56,237 | |
11/29/2013 | | Bank of America | | Israeli Shekel | | | 399,838 | | | United States Dollar | | | 112,366 | | | | 964 | |
11/29/2013 | | Bank of America | | Israeli Shekel | | | 3,569,481 | | | United States Dollar | | | 973,679 | | | | 38,054 | |
11/29/2013 | | Barclays Wholesale GTS | | Israeli Shekel | | | 788,677 | | | United States Dollar | | | 223,998 | | | | (455) | |
11/29/2013 | | Union Bank of Switzerland - London | | Israeli Shekel | | | 768,456 | | | United States Dollar | | | 216,572 | | | | 1,239 | |
11/29/2013 | | Barclays Wholesale GTS | | Malaysian Ringgit | | | 4,000,000 | | | United States Dollar | | | 1,243,124 | | | | 11,821 | |
11/29/2013 | | Barclays Wholesale GTS | | Malaysian Ringgit | | | 5,375,890 | | | United States Dollar | | | 1,690,000 | | | | (3,388) | |
11/29/2013 | | BNP Paribas | | Malaysian Ringgit | | | 4,624,461 | | | United States Dollar | | | 1,437,552 | | | | 13,309 | |
11/29/2013 | | BNP Paribas | | Malaysian Ringgit | | | 2,586,801 | | | United States Dollar | | | 811,826 | | | | (252) | |
11/29/2013 | | Chase Manhattan Bank London | | Malaysian Ringgit | | | 9,370,000 | | | United States Dollar | | | 2,926,753 | | | | 12,956 | |
11/29/2013 | | Chase Manhattan Bank London | | Malaysian Ringgit | | | 4,000,000 | | | United States Dollar | | | 1,243,085 | | | | 11,860 | |
11/29/2013 | | Deutsche Bank London | | Malaysian Ringgit | | | 1,771,280 | | | United States Dollar | | | 560,000 | | | | (4,285) | |
11/29/2013 | | Barclays Wholesale GTS | | Mexican Peso | | | 12,705,586 | | | United States Dollar | | | 971,533 | | | | 46 | |
11/29/2013 | | Barclays Wholesale GTS | | Mexican Peso | | | 2,281,429 | | | United States Dollar | | | 175,180 | | | | (722) | |
11/29/2013 | | Barclays Wholesale GTS | | Mexican Peso | | | 8,257,000 | | | United States Dollar | | | 642,868 | | | | (11,467) | |
11/29/2013 | | Chase Manhattan Bank London | | Mexican Peso | | | 42,336,279 | | | United States Dollar | | | 3,177,057 | | | | 60,340 | |
11/29/2013 | | Chase Manhattan Bank London | | Mexican Peso | | | 33,020,582 | | | United States Dollar | | | 2,553,618 | | | | (28,580) | |
11/29/2013 | | Citibank London | | Mexican Peso | | | 11,356,371 | | | United States Dollar | | | 870,000 | | | | (1,594) | |
11/29/2013 | | Citibank London | | Mexican Peso | | | 16,619,747 | | | United States Dollar | | | 1,280,000 | | | | (9,111) | |
11/29/2013 | | Deutsche Bank London | | Mexican Peso | | | 53,403,160 | | | United States Dollar | | | 4,064,353 | | | | 19,312 | |
11/29/2013 | | Deutsche Bank London | | Mexican Peso | | | 8,255,808 | | | United States Dollar | | | 637,884 | | | | (6,573) | |
11/29/2013 | | Citibank London | | Peruvian Neuevo Sol | | | 1,571,973 | | | United States Dollar | | | 563,633 | | | | 1,087 | |
11/29/2013 | | CSFB Global Foreign Exchange London | | Peruvian Neuevo Sol | | | 5,237,655 | | | United States Dollar | | | 1,871,928 | | | | 9,662 | |
11/29/2013 | | CSFB Global Foreign Exchange London | | Peruvian Neuevo Sol | | | 4,285,750 | | | United States Dollar | | | 1,550,000 | | | | (10,375) | |
11/29/2013 | | Deutsche Bank London | | Peruvian Neuevo Sol | | | 2,633,039 | | | United States Dollar | | | 940,371 | | | | 5,529 | |
11/29/2013 | | HSBC Bank PLC | | Peruvian Neuevo Sol | | | 2,692,720 | | | United States Dollar | | | 970,000 | | | | (2,659) | |
11/29/2013 | | Barclays Wholesale GTS | | Philippine Peso | | | 38,441,776 | | | United States Dollar | | | 893,372 | | | | (5,212) | |
11/29/2013 | | Goldman Sachs International Ltd. London | | Philippine Peso | | | 9,908,400 | | | United States Dollar | | | 230,632 | | | | (1,708) | |
11/29/2013 | | Bank of America | | Polish Zloty | | | 3,562,160 | | | United States Dollar | | | 1,120,000 | | | | 34,299 | |
11/29/2013 | | Barclays Wholesale GTS | | Polish Zloty | | | 3,074,332 | | | United States Dollar | | | 942,629 | | | | 53,591 | |
11/29/2013 | | Barclays Wholesale GTS | | Polish Zloty | | | 1,707,211 | | | United States Dollar | | | 543,358 | | | | 9,854 | |
11/29/2013 | | Barclays Wholesale GTS | | Polish Zloty | | | 1,695,373 | | | United States Dollar | | | 541,505 | | | | 7,872 | |
11/29/2013 | | Barclays Wholesale GTS | | Polish Zloty | | | 3,812,354 | | | United States Dollar | | | 1,230,000 | | | | 5,373 | |
11/29/2013 | | Barclays Wholesale GTS | | Polish Zloty | | | 743,994 | | | United States Dollar | | | 240,000 | | | | 1,087 | |
11/29/2013 | | Barclays Wholesale GTS | | Polish Zloty | | | 1,295,611 | | | United States Dollar | | | 420,000 | | | | (164) | |
11/29/2013 | | HSBC Bank PLC | | Polish Zloty | | | 5,165,589 | | | United States Dollar | | | 1,668,499 | | | | 5,382 | |
11/29/2013 | | HSBC Bank PLC | | Polish Zloty | | | 6,194,027 | | | United States Dollar | | | 2,020,000 | | | | (12,859) | |
11/29/2013 | | Morgan Stanley & Co. International | | Polish Zloty | | | 5,045,331 | | | United States Dollar | | | 1,660,000 | | | | (25,088) | |
11/29/2013 | | Barclays Wholesale GTS | | Romanian Leu | | | 1,557,018 | | | United States Dollar | | | 473,747 | | | | 2,194 | |
11/29/2013 | | Deutsche Bank London | | Romanian Leu | | | 2,572,514 | | | United States Dollar | | | 790,000 | | | | (3,648) | |
11/29/2013 | | Goldman Sachs International Ltd. London | | Romanian Leu | | | 2,547,118 | | | United States Dollar | | | 780,050 | | | | (1,462) | |
11/29/2013 | | HSBC Bank PLC | | Romanian Leu | | | 6,811,900 | | | United States Dollar | | | 2,095,776 | | | | (13,552) | |
11/29/2013 | | Union Bank of Switzerland - London | | Romanian Leu | | | 699,979 | | | United States Dollar | | | 211,544 | | | | 2,422 | |
11/29/2013 | | Bank of America | | Russian Ruble | | | 39,464,243 | | | United States Dollar | | | 1,239,182 | | | | (15,972) | |
11/29/2013 | | Deutsche Bank London | | Russian Ruble | | | 31,850,222 | | | United States Dollar | | | 975,006 | | | | $12,205 | |
See accompanying notes to the financial statements.
84
ASHMORE EMERGING MARKETS TOTAL RETURN FUND
SCHEDULE OF INVESTMENTS (CONTINUED)
As of October 31, 2013
| | | | | | | | | | | | | | | | | | |
Settlement Date | | Counterparty | | Currency Buy | | Currency Buy Amount (Local
Currency) | | | Currency Sell | | Currency Sell Amount (Local
Currency) | | | Unrealized
Gain/(Loss) | |
11/29/2013 | | Deutsche Bank London | | Russian Ruble | | | 37,392,919 | | | United States Dollar | | | 1,146,846 | | | | 12,163 | |
11/29/2013 | | Goldman Sachs International Ltd. London | | Russian Ruble | | | 151,695,391 | | | United States Dollar | | | 4,663,963 | | | | 37,899 | |
11/29/2013 | | Goldman Sachs International Ltd. London | | Russian Ruble | | | 91,056,000 | | | United States Dollar | | | 2,800,000 | | | | 22,319 | |
11/29/2013 | | Deutsche Bank London | | Singapore Dollar | | | 1,187,117 | | | United States Dollar | | | 952,457 | | | | 3,215 | |
11/29/2013 | | Deutsche Bank London | | Singapore Dollar | | | 422,750 | | | United States Dollar | | | 340,000 | | | | 329 | |
11/29/2013 | | Deutsche Bank London | | Singapore Dollar | | | 1,823,535 | | | United States Dollar | | | 1,469,739 | | | | (1,728) | |
11/29/2013 | | HSBC Bank PLC | | Singapore Dollar | | | 399,723 | | | United States Dollar | | | 318,573 | | | | 3,218 | |
11/29/2013 | | Morgan Stanley & Co. International | | Singapore Dollar | | | 13,263,348 | | | United States Dollar | | | 10,681,088 | | | | (3,617) | |
11/29/2013 | | Barclays Wholesale GTS | | South African Rand | | | 3,743,472 | | | United States Dollar | | | 378,580 | | | | (7,208) | |
11/29/2013 | | Barclays Wholesale GTS | | South African Rand | | | 20,139,492 | | | United States Dollar | | | 2,040,000 | | | | (42,058) | |
11/29/2013 | | Deutsche Bank London | | South African Rand | | | 3,352,945 | | | United States Dollar | | | 331,972 | | | | 658 | |
11/29/2013 | | Deutsche Bank London | | South African Rand | | | 4,701,549 | | | United States Dollar | | | 470,000 | | | | (3,582) | |
11/29/2013 | | HSBC Bank PLC | | South African Rand | | | 4,884,319 | | | United States Dollar | | | 479,185 | | | | 5,364 | |
11/29/2013 | | Union Bank of Switzerland - London | | South African Rand | | | 8,590,079 | | | United States Dollar | | | 854,991 | | | | (2,811) | |
11/29/2013 | | Union Bank of Switzerland - London | | South African Rand | | | 8,589,997 | | | United States Dollar | | | 854,991 | | | | (2,819) | |
11/29/2013 | | Barclays Wholesale GTS | | Thai Baht | | | 78,170,000 | | | United States Dollar | | | 2,485,533 | | | | 21,379 | |
11/29/2013 | | Barclays Wholesale GTS | | Thai Baht | | | 23,000,000 | | | United States Dollar | | | 732,111 | | | | 5,499 | |
11/29/2013 | | Citibank London | | Thai Baht | | | 32,000,000 | | | United States Dollar | | | 1,015,486 | | | | 10,754 | |
11/29/2013 | | Deutsche Bank London | | Thai Baht | | | 14,414,100 | | | United States Dollar | | | 460,000 | | | | 2,260 | |
11/29/2013 | | Deutsche Bank London | | Thai Baht | | | 14,748,698 | | | United States Dollar | | | 470,973 | | | | 2,018 | |
11/29/2013 | | HSBC Bank PLC | | Thai Baht | | | 44,559,600 | | | United States Dollar | | | 1,420,000 | | | | 9,026 | |
11/29/2013 | | HSBC Bank PLC | | Thai Baht | | | 15,000,000 | | | United States Dollar | | | 477,935 | | | | 3,115 | |
11/29/2013 | | Bank of America | | Turkish Lira | | | 609,366 | | | United States Dollar | | | 299,028 | | | | 4,654 | |
11/29/2013 | | Bank of America | | Turkish Lira | | | 610,184 | | | United States Dollar | | | 297,221 | | | | 6,869 | |
11/29/2013 | | Citibank London | | Turkish Lira | | | 1,133,583 | | | United States Dollar | | | 559,104 | | | | 5,826 | |
11/29/2013 | | Citibank London | | Turkish Lira | | | 2,376,549 | | | United States Dollar | | | 1,190,000 | | | | (5,629) | |
11/29/2013 | | Goldman Sachs International Ltd. London | | Turkish Lira | | | 2,328,619 | | | United States Dollar | | | 1,160,000 | | | | 485 | |
11/29/2013 | | HSBC Bank PLC | | Turkish Lira | | | 3,746,464 | | | United States Dollar | | | 1,880,000 | | | | (12,921) | |
11/29/2013 | | Morgan Stanley & Co. International | | Turkish Lira | | | 10,098,680 | | | United States Dollar | | | 5,070,000 | | | | (37,247) | |
11/29/2013 | | Barclays Wholesale GTS | | United States Dollar | | | 238,689 | | | Chilean Peso | | | 118,962,500 | | | | 7,501 | |
11/29/2013 | | Citibank London | | United States Dollar | | | 1,451,852 | | | Colombian Peso | | | 2,744,871,291 | | | | 5,222 | |
11/29/2013 | | HSBC Bank PLC | | United States Dollar | | | 1,332,161 | | | Colombian Peso | | | 2,513,653,778 | | | | 7,390 | |
11/29/2013 | | HSBC Bank PLC | | United States Dollar | | | 1,415,012 | | | Hungarian Forint | | | 321,108,644 | | | | (57,011) | |
11/29/2013 | | Morgan Stanley & Co. International | | United States Dollar | | | 6,525,612 | | | Hungarian Forint | | | 1,398,340,839 | | | | 115,351 | |
11/29/2013 | | ANZ Banking Corp. Melbourne | | United States Dollar | | | 287,105 | | | Indonesian Rupiah | | | 3,108,200,000 | | | | 7,718 | |
11/29/2013 | | Deutsche Bank London | | United States Dollar | | | 2,655,678 | | | Indonesian Rupiah | | | 29,000,000,000 | | | | 48,955 | |
11/29/2013 | | HSBC Bank PLC | | United States Dollar | | | 264,719 | | | Indonesian Rupiah | | | 2,900,000,000 | | | | 4,047 | |
11/29/2013 | | Bank of America | | United States Dollar | | | 320,000 | | | Israeli Shekel | | | 1,132,002 | | | | (854) | |
11/29/2013 | | HSBC Bank PLC | | United States Dollar | | | 3,325,231 | | | Mexican Peso | | | 43,081,693 | | | | 30,834 | |
11/29/2013 | | Deutsche Bank London | | United States Dollar | | | 375,478 | | | Peruvian Neuevo Sol | | | 1,045,068 | | | | 45 | |
11/29/2013 | | Deutsche Bank London | | United States Dollar | | | 493,657 | | | Peruvian Neuevo Sol | | | 1,376,070 | | | | (686) | |
11/29/2013 | | Barclays Wholesale GTS | | United States Dollar | | | 1,770,000 | | | Polish Zloty | | | 5,557,446 | | | | (30,860) | |
11/29/2013 | | Deutsche Bank London | | United States Dollar | | | 3,824,089 | | | Polish Zloty | | | 11,707,242 | | | | 30,420 | |
11/29/2013 | | Deutsche Bank London | | United States Dollar | | | 3,230,000 | | | Polish Zloty | | | 10,150,679 | | | | (59,273) | |
11/29/2013 | | Barclays Wholesale GTS | | United States Dollar | | | 1,423,950 | | | Romanian Leu | | | 4,726,516 | | | | (20,825) | |
11/29/2013 | | Barclays Wholesale GTS | | United States Dollar | | | 1,002,476 | | | Russian Ruble | | | 32,180,984 | | | | 5,013 | |
11/29/2013 | | Barclays Wholesale GTS | | United States Dollar | | | 4,965,386 | | | Russian Ruble | | | 161,419,746 | | | | (37,886) | |
11/29/2013 | | Deutsche Bank London | | United States Dollar | | | 604,641 | | | Russian Ruble | | | 19,282,014 | | | | 6,987 | |
11/29/2013 | | Goldman Sachs International Ltd. London | | United States Dollar | | | 935,316 | | | Russian Ruble | | | 30,021,765 | | | | 4,779 | |
11/29/2013 | | Morgan Stanley & Co. International | | United States Dollar | | | 4,624,101 | | | Russian Ruble | | | 148,468,310 | | | | 22,264 | |
11/29/2013 | | Barclays Wholesale GTS | | United States Dollar | | | 1,634,389 | | | South African Rand | | | 16,177,185 | | | | 29,528 | |
11/29/2013 | | Goldman Sachs International Ltd. London | | United States Dollar | | | 3,652,740 | | | South African Rand | | | 36,255,276 | | | | 56,029 | |
11/29/2013 | | HSBC Bank PLC | | United States Dollar | | | 501,668 | | | South African Rand | | | 4,966,411 | | | | 8,974 | |
11/29/2013 | | HSBC Bank PLC | | United States Dollar | | | 540,506 | | | South African Rand | | | 5,342,256 | | | | 10,527 | |
11/29/2013 | | HSBC Bank PLC | | United States Dollar | | | 539,258 | | | South African Rand | | | 5,331,540 | | | | 10,342 | |
11/29/2013 | | Goldman Sachs International Ltd. London | | United States Dollar | | | 1,089,096 | | | Thai Baht | | | 34,012,469 | | | | (1,684) | |
11/29/2013 | | Deutsche Bank London | | United States Dollar | | | 758,242 | | | Turkish Lira | | | 1,512,389 | | | | 4,531 | |
11/29/2013 | | Deutsche Bank London | | United States Dollar | | | 297,452 | | | Turkish Lira | | | 605,698 | | | | (4,402) | |
11/29/2013 | | Deutsche Bank London | | United States Dollar | | | 1,582,014 | | | Turkish Lira | | | 3,204,580 | | | | $(15,012) | |
See accompanying notes to the financial statements.
85
ASHMORE EMERGING MARKETS TOTAL RETURN FUND
SCHEDULE OF INVESTMENTS (CONTINUED)
As of October 31, 2013
| | | | | | | | | | | | | | | | | | |
Settlement Date | | Counterparty | | Currency Buy | | Currency Buy Amount (Local
Currency) | | | Currency Sell | | Currency Sell Amount (Local
Currency) | | | Unrealized
Gain/(Loss) | |
11/29/2013 | | HSBC Bank PLC | | United States Dollar | | | 1,193,873 | | | Turkish Lira | | | 2,419,849 | | | | (12,077) | |
11/29/2013 | | Citibank London | | United States Dollar | | | 1,328,661 | | | Turkish Lira | | | 2,693,860 | | | | (13,845) | |
12/02/2013 | | Deutsche Bank London | | Czech Koruna | | | 21,842,115 | | | United States Dollar | | | 1,171,373 | | | | (21,796) | |
12/02/2013 | | Barclays Wholesale GTS | | Russian Ruble | | | 135,015,121 | | | United States Dollar | | | 4,210,000 | | | | (27,780) | |
12/02/2013 | | Barclays Wholesale GTS | | Russian Ruble | | | 193,924,480 | | | United States Dollar | | | 6,084,039 | | | | (77,046) | |
12/02/2013 | | Barclays Wholesale GTS | | United States Dollar | | | 5,070,000 | | | Russian Ruble | | | 161,986,500 | | | | 52,316 | |
12/02/2013 | | Barclays Wholesale GTS | | United States Dollar | | | 799,158 | | | Russian Ruble | | | 25,480,344 | | | | 9,880 | |
12/03/2013 | | Chase Manhattan Bank London | | Argentine Peso | | | 3,299,400 | | | United States Dollar | | | 520,000 | | | | 9,830 | |
12/03/2013 | | Union Bank of Switzerland - London | | Argentine Peso | | | 3,268,000 | | | United States Dollar | | | 509,312 | | | | 15,476 | |
12/03/2013 | | Goldman Sachs International Ltd. London | | Brazilian Real | | | 10,432,134 | | | United States Dollar | | | 4,734,025 | | | | (113,990) | |
12/13/2013 | | ANZ Banking Corp. Melbourne | | Indonesian Rupiah | | | 14,000,000,000 | | | United States Dollar | | | 1,262,968 | | | | (8,358) | |
12/13/2013 | | Union Bank of Switzerland - London | | Indonesian Rupiah | | | 14,161,928,443 | | | United States Dollar | | | 1,276,424 | | | | (7,303) | |
12/13/2013 | | BNP Paribas | | Thai Baht | | | 30,000,000 | | | United States Dollar | | | 956,785 | | | | 4,410 | |
12/13/2013 | | Chase Manhattan Bank London | | Thai Baht | | | 22,838,082 | | | United States Dollar | | | 728,487 | | | | 3,241 | |
12/13/2013 | | Citibank London | | Thai Baht | | | 36,000,000 | | | United States Dollar | | | 1,147,666 | | | | 5,768 | |
12/13/2013 | | Standard Chartered London | | Thai Baht | | | 23,313,851 | | | United States Dollar | | | 740,240 | | | | 6,733 | |
12/13/2013 | | Union Bank of Switzerland - London | | Thai Baht | | | 30,000,000 | | | United States Dollar | | | 955,932 | | | | 5,264 | |
12/13/2013 | | Barclays Wholesale GTS | | United States Dollar | | | 966,272 | | | Indonesian Rupiah | | | 10,600,000,000 | | | | 16,353 | |
12/13/2013 | | HSBC Bank PLC | | United States Dollar | | | 404,503 | | | Indonesian Rupiah | | | 4,420,000,000 | | | | 8,404 | |
12/16/2013 | | HSBC Bank PLC | | Chinese Offshore Yuan | | | 51,923,633 | | | United States Dollar | | | 8,507,643 | | | | 1,809 | |
12/16/2013 | | Deutsche Bank London | | Thai Baht | | | 7,000,000 | | | United States Dollar | | | 224,719 | | | | (486) | |
12/16/2013 | | HSBC Bank PLC | | Thai Baht | | | 57,572,370 | | | United States Dollar | | | 1,827,114 | | | | 17,122 | |
12/16/2013 | | HSBC Bank PLC | | United States Dollar | | | 594,059 | | | Chinese Offshore Yuan | | | 3,630,000 | | | | (839) | |
12/16/2013 | | HSBC Bank PLC | | United States Dollar | | | 310,000 | | | Chinese Offshore Yuan | | | 1,900,300 | | | | (1,429) | |
12/16/2013 | | HSBC Bank PLC | | United States Dollar | | | 850,884 | | | Chinese Offshore Yuan | | | 5,213,792 | | | | (3,573) | |
12/16/2013 | | HSBC Bank PLC | | United States Dollar | | | 1,154,286 | | | Chinese Offshore Yuan | | | 7,070,000 | | | | (4,374) | |
12/16/2013 | | HSBC Bank PLC | | United States Dollar | | | 452,305 | | | Chinese Offshore Yuan | | | 2,787,782 | | | | (4,568) | |
12/16/2013 | | HSBC Bank PLC | | United States Dollar | | | 5,030,000 | | | Chinese Offshore Yuan | | | 31,321,760 | | | | (103,135) | |
12/17/2013 | | Deutsche Bank London | | Taiwan Dollar | | | 20,630,000 | | | United States Dollar | | | 705,420 | | | | (4,218) | |
12/17/2013 | | Goldman Sachs International Ltd. London | | Taiwan Dollar | | | 32,922,400 | | | United States Dollar | | | 1,124,783 | | | | (5,769) | |
12/17/2013 | | Goldman Sachs International Ltd. London | | Taiwan Dollar | | | 264,371,732 | | | United States Dollar | | | 9,030,631 | | | | (44,784) | |
12/17/2013 | | Union Bank of Switzerland - London | | Taiwan Dollar | | | 7,302,500 | | | United States Dollar | | | 250,000 | | | | (1,792) | |
01/03/2014 | | Morgan Stanley & Co. International | | Brazilian Real | | | 6,039,270 | | | United States Dollar | | | 2,720,000 | | | | (64,254) | |
01/21/2014 | | Deutsche Bank London | | United States Dollar | | | 2,337,890 | | | British Pound | | | 1,463,898 | | | | (7,814) | |
01/21/2014 | | Deutsche Bank London | | United States Dollar | | | 12,517,416 | | | Euro | | | 9,228,356 | | | | (13,966) | |
01/21/2014 | | Union Bank of Switzerland - London | | United States Dollar | | | 259,322 | | | Euro | | | 188,539 | | | | 3,301 | |
01/31/2014 | | Barclays Wholesale GTS | | Czech Koruna | | | 58,529,947 | | | United States Dollar | | | 3,129,325 | | | | (47,465) | |
01/31/2014 | | Union Bank of Switzerland - London | | Czech Koruna | | | 32,786,600 | | | United States Dollar | | | 1,760,000 | | | | (33,641) | |
01/31/2014 | | Deutsche Bank London | | Hungarian Forint | | | 283,105,493 | | | United States Dollar | | | 1,327,264 | | | | (34,606) | |
01/31/2014 | | Bank of America | | Mexican Peso | | | 53,833,968 | | | United States Dollar | | | 4,080,000 | | | | 16,085 | |
01/31/2014 | | Deutsche Bank London | | Mexican Peso | | | 45,890,180 | | | United States Dollar | | | 3,560,000 | | | | (68,337) | |
01/31/2014 | | Standard Chartered London | | Mexican Peso | | | 62,772,968 | | | United States Dollar | | | 4,828,727 | | | | (52,497) | |
01/31/2014 | | Morgan Stanley & Co. International | | Peruvian Neuevo Sol | | | 3,896,901 | | | United States Dollar | | | 1,395,488 | | | | (4,508) | |
01/31/2014 | | Barclays Wholesale GTS | | Romanian Leu | | | 4,014,907 | | | United States Dollar | | | 1,238,672 | | | | (15,592) | |
01/31/2014 | | Barclays Wholesale GTS | | United States Dollar | | | 3,620,050 | | | Polish Zloty | | | 11,024,609 | | | | 61,332 | |
01/31/2014 | | Deutsche Bank London | | United States Dollar | | | 479,320 | | | Russian Ruble | | | 15,553,935 | | | | 2,423 | |
02/28/2014 | | Chase Manhattan Bank London | | Mexican Peso | | | 54,313,872 | | | United States Dollar | | | 4,130,332 | | | | (6,702) | |
04/13/2015 | | HSBC Bank PLC | | Chinese Offshore Yuan | | | 38,604,157 | | | United States Dollar | | | 5,775,607 | | | | 454,154 | |
04/13/2015 | | HSBC Bank PLC | | Chinese Offshore Yuan | | | 174,251 | | | United States Dollar | | | 26,573 | | | | 1,547 | |
04/13/2015 | | HSBC Bank PLC | | United States Dollar | | | 93,434 | | | Chinese Offshore Yuan | | | 612,369 | | | | (5,387) | |
04/13/2015 | | HSBC Bank PLC | | United States Dollar | | | 550,000 | | | Chinese Offshore Yuan | | | 3,554,650 | | | | (23,633) | |
04/13/2015 | | HSBC Bank PLC | | United States Dollar | | | 550,000 | | | Chinese Offshore Yuan | | | 3,565,925 | | | | (25,453) | |
04/13/2015 | | HSBC Bank PLC | | United States Dollar | | | 2,050,000 | | | Chinese Offshore Yuan | | | 13,449,435 | | | | (120,408) | |
04/13/2015 | | HSBC Bank PLC | | United States Dollar | | | 2,710,000 | | | Chinese Offshore Yuan | | | 17,596,030 | | | | (129,566) | |
05/04/2015 | | Standard Chartered London | | Chinese Offshore Yuan | | | 105,616,865 | | | United States Dollar | | | 16,100,132 | | | | 933,612 | |
05/04/2015 | | Standard Chartered London | | Chinese Offshore Yuan | | | 6,222,535 | | | United States Dollar | | | 939,109 | | | | 64,453 | |
05/04/2015 | | Standard Chartered London | | United States Dollar | | | 1,100,000 | | | Chinese Offshore Yuan | | | 7,158,800 | | | | (54,561) | |
05/04/2015 | | Standard Chartered London | | United States Dollar | | | 3,400,000 | | | Chinese Offshore Yuan | | | 22,343,100 | | | | (203,465) | |
05/04/2015 | | Standard Chartered London | | United States Dollar | | | 12,500,000 | | | Chinese Offshore Yuan | | | 82,337,500 | | | | $(779,280) | |
See accompanying notes to the financial statements.
86
ASHMORE EMERGING MARKETS TOTAL RETURN FUND
SCHEDULE OF INVESTMENTS (CONTINUED)
As of October 31, 2013
| | | | | | | | | | | | | | | | | | |
Settlement Date | | Counterparty | | Currency Buy | | Currency Buy Amount (Local
Currency) | | | Currency Sell | | Currency Sell Amount (Local
Currency) | | | Unrealized
Gain/(Loss) | |
07/17/2015 | | HSBC Bank PLC | | Chinese Offshore Yuan | | | 3,785,666 | | | United States Dollar | | | 564,393 | | | | 44,863 | |
07/17/2015 | | Standard Chartered London | | Chinese Offshore Yuan | | | 24,998,265 | | | United States Dollar | | | 3,761,400 | | | | 261,762 | |
07/17/2015 | | Standard Chartered London | | Chinese Offshore Yuan | | | 657,900 | | | United States Dollar | | | 100,038 | | | | 5,843 | |
07/17/2015 | | HSBC Bank PLC | | United States Dollar | | | 18,198 | | | Chinese Offshore Yuan | | | 119,651 | | | | (1,058) | |
07/17/2015 | | HSBC Bank PLC | | United States Dollar | | | 557,442 | | | Chinese Offshore Yuan | | | 3,666,015 | | | | (32,558) | |
07/17/2015 | | Standard Chartered London | | United States Dollar | | | 3,870,000 | | | Chinese Offshore Yuan | | | 25,656,165 | | | | (259,043) | |
| | | | | | | | | | | | | | | | | | |
Total | | | | | | | | | | | | | | | | | $(301,959) | |
| | | | | | | | | | | | | | | | | | |
At October 31, 2013, the Ashmore Emerging Markets Total Return Fund had the following interest rate swap contracts outstanding:
| | | | | | | | | | | | | | | | |
Pay Rate Index/ Pay Rate | | Receive Rate/
Receive Rate Index | | Notional Amount | | | Expiration
Date | | Unrealized
Gains/
(Losses) | | Counterparty |
| | | | | | |
Brazil CETIP Interbank Deposit Rate | | 11.032% | | | BRL | | | | 2,184,520 | | | 01/02/2017 | | $(1,674) | | HSBC |
| | | | | | |
Brazil CETIP Interbank Deposit Rate | | 10.380% | | | BRL | | | | 3,907,944 | | | 01/02/2017 | | (42,236) | | HSBC |
| | | | | | |
Brazil CETIP Interbank Deposit Rate | | 10.955% | | | BRL | | | | 7,552,695 | | | 07/01/2015 | | 897 | | HSBC |
| | | | | | |
Brazil CETIP Interbank Deposit Rate | | 11.170% | | | BRL | | | | 5,548,566 | | | 01/04/2016 | | 755 | | HSBC |
| | | | | | | | | | | | | | | | |
| | | | | | | | | | | | | | $(42,258) | | |
| | | | | | | | | | | | | | | | |
See accompanying notes to the financial statements.
87
ASHMORE EMERGING MARKETS TOTAL RETURN FUND
SCHEDULE OF INVESTMENTS (CONTINUED)
As of October 31, 2013
The inputs or methodologies used for valuing securities are not necessarily an indication of the risks associated with investing in those securities and other financial instruments, if any. See note 4 in the Notes to the Financial Statements for more information regarding pricing inputs and valuation techniques. The following is a summary of the inputs used in valuing the Ashmore Emerging Markets Total Return Fund’s investments and other financial instruments, which are carried at fair value, as of October 31, 2013:
| | | | | | | | | | | | |
| | | Level 1 | | Level 2 | | | Level 3 | | Total | |
Investments | | | | | | | | | | | | |
Assets: | | | | | | | | | | | | |
Corporate Bonds | | $— | | $ | 237,852,626 | | | $— | | $ | 237,852,626 | |
Government Agencies | | — | | | 3,127,333 | | | — | | | 3,127,333 | |
Government Bonds | | — | | | 285,492,620 | | | — | | | 285,492,620 | |
Municipal Bonds | | — | | | 3,959,100 | | | — | | | 3,959,100 | |
Index Linked Corporate Bonds | | — | | | 4,563,366 | | | — | | | 4,563,366 | |
Index Linked Government Bonds | | — | | | 22,623,228 | | | — | | | 22,623,228 | |
Common Stock | | — | | | 74,208 | | | — | | | 74,208 | |
Purchased Options | | — | | | 128 | | | — | | | 128 | |
Warrants | | — | | | 134,794 | | | — | | | 134,794 | |
Financial Certificate | | — | | | 7,375,194 | | | — | | | 7,375,194 | |
Fully Funded Total Return Swaps | | — | | | 6,780,454 | | | — | | | 6,780,454 | |
Short-Term Investments | | — | | | 75,000,000 | | | — | | | 75,000,000 | |
| |
Total Investments | | $— | | $ | 646,983,051 | | | $— | | $ | 646,983,051 | |
| |
| | | | |
Other Financial Instruments | | | | | | | | | | | | |
Assets: | | | | | | | | | | | | |
Forward Foreign Currency Exchange Contracts | | $— | | $ | 3,377,188 | | | $— | | $ | 3,377,188 | |
Interest Rate Swap Contracts | | — | | | 1,652 | | | — | | | 1,652 | |
Liabilities: | | | | | | | | | | | | |
Forward Foreign Currency Exchange Contracts | | — | | | (3,679,147 | ) | | — | | | (3,679,147 | ) |
Interest Rate Swap Contracts | | — | | | (43,910 | ) | | — | | | (43,910 | ) |
| |
Total Other Financial Instruments | | $— | | $ | (344,217 | ) | | $— | | $ | (344,217 | ) |
| |
The Fund discloses all transfers between levels based on valuations at the end of each reporting period. At October 31, 2013, there were no transfers between Level 1, Level 2 and Level 3 based on levels assigned to the securities on October 31, 2012. U.S. GAAP provides additional guidance for estimating fair value when the volume and level of activity for the asset or liability have significantly decreased as well as guidance on identifying circumstances that indicate when a transaction is not orderly.
See accompanying notes to the financial statements.
88
ASHMORE EMERGING MARKETS TOTAL RETURN FUND
SCHEDULE OF INVESTMENTS (CONTINUED)
As of October 31, 2013
The following is a summary of the fair values of the Fund’s derivative instruments*:
Fair Values of Financial Derivative Instruments on the Statements of Assets and Liabilities as of October 31, 2013:
| | | | | | | | | | |
| | | Derivatives Not Accounted for as
Hedging Instruments | |
| | | Foreign
Exchange | | | | | Fixed Income/
Interest Rate | |
Assets: | | | | | | | | | | |
Unrealized Appreciation on Interest Rate Swap Contracts | | $ | — | | | | | $ | 1,652 | |
Unrealized Appreciation on Forward Foreign Currency Exchange Contracts | | | 3,377,188 | | | | | | — | |
| | $ | 3,377,188 | | | | | $ | 1,652 | |
| | | |
Liabilities: | | | | | | | | | | |
Unrealized Depreciation on Interest Rate Swap Contracts | | $ | — | | | | | $ | (43,910 | ) |
Unrealized Depreciation on Forward Foreign Currency Exchange Contracts | | | (3,679,147 | ) | | | | | — | |
| | $ | (3,679,147 | ) | | | | $ | (43,910 | ) |
|
| The Effect of Financial Derivative Instruments on the Statements of Operations for the Year Ended October 31, 2013: | |
| |
| | | Derivatives Not Accounted for as
Hedging Instruments | |
| | | Foreign
Exchange | | | | | Fixed Income/
Interest Rate | |
Realized Gain/(Loss) on Derivatives Recognized resulting from Operations: | | | | | | | | | | |
Net Realized Gain on Forward Foreign Currency Exchange Contracts | | $ | 2,841,808 | | | | | $ | — | |
Net Realized Loss on Options | | | — | | | | | | (344,510 | ) |
Net Realized Loss on Futures Contracts | | | — | | | | | | (75,762 | ) |
Net Realized Gain on Interest Rate Swap Contracts | | | — | | | | | | 783,419 | |
| | $ | 2,841,808 | | | | | $ | 363,147 | |
| | | |
Net Change in Unrealized Appreciation on Derivatives Recognized resulting from Operations: | | | | | | | | | | |
Net Change in Unrealized Depreciation on Forward Foreign Currency Exchange Contracts | | $ | (1,284,956 | ) | | | | $ | — | |
Net Change in Unrealized Depreciation on Interest Rate Swap Contracts | | | — | | | | | | (858,265 | ) |
Net Change in Unrealized Depreciation on Options | | | — | | | | | | (189,845 | ) |
| | $ | (1,284,956 | ) | | | | $ | (1,048,110 | ) |
At October 31, 2013, for U.S. federal income tax purposes, gross unrealized appreciation, gross unrealized depreciation, net unrealized appreciation/(depreciation) on investments in securities (including the effects of foreign currency translation) and the cost basis of investments were as follows:
| | | | |
Federal tax cost of investments | | | $676,189,894 | |
Gross tax appreciation of investments | | | $6,705,279 | |
Gross tax depreciation of investments | | | (35,912,122) | |
Net tax depreciation of investments | | | $(29,206,843) | |
The difference between book basis and tax basis net unrealized appreciation or depreciation is attributable primarily to the tax deferral of losses on wash sales.
See accompanying notes to the financial statements.
89
ASHMORE EMERGING MARKETS EQUITY FUND
SCHEDULE OF INVESTMENTS
As of October 31, 2013
| | | | | | | | | | | | | | |
| | | Currency(1) | | Shares | | | Value | | | % of Net
Assets | |
Common Stock | | | | | | | | | | | | | | |
| | | | |
Brazil (Cost $1,209,329) | | | | | | | | | | | | | | |
ALL - America Latina Logistica S.A. | | BRL | | | 9,600 | | | $ | 34,368 | | | | 0.35 | |
Braskem S.A. ADR | | | | | 5,703 | | | | 100,544 | | | | 1.02 | |
Estacio Participacoes S.A. | | BRL | | | 5,400 | | | | 41,702 | | | | 0.42 | |
Gol Linhas Aereas Inteligentes S.A. ADR | | | | | 9,972 | | | | 51,555 | | | | 0.52 | |
Petroleo Brasileiro S.A. | | BRL | | | 16,400 | | | | 143,048 | | | | 1.45 | |
Petroleo Brasileiro S.A. ADR | | | | | 20,177 | | | | 351,685 | | | | 3.57 | |
Vale S.A. | | BRL | | | 5,600 | | | | 89,367 | | | | 0.91 | |
Vale S.A. ADR | | | | | 17,417 | | | | 278,846 | | | | 2.83 | |
| | | | | | | | | 1,091,115 | | | | 11.07 | |
China (Cost $2,033,755) | | | | | | | | | | | | | | |
Anhui Conch Cement Co. Ltd., Class H | | HKD | | | 54,000 | | | | 188,405 | | | | 1.91 | |
Anton Oilfield Services Group | | HKD | | | 82,000 | | | | 51,825 | | | | 0.53 | |
Baidu, Inc. ADR | | | | | 1,164 | | | | 187,288 | | | | 1.90 | |
Beijing Enterprises Water Group Ltd. | | | | | 122,000 | | | | 54,288 | | | | 0.55 | |
China Dongxiang Group Co. | | HKD | | | 292,000 | | | | 45,572 | | | | 0.46 | |
China Merchants Bank Co. Ltd., Class H | | HKD | | | 113,508 | | | | 225,464 | | | | 2.29 | |
China Minsheng Banking Corp. Ltd., Class H | | HKD | | | 145,500 | | | | 166,838 | | | | 1.69 | |
China National Building Material Co. Ltd., Class H | | HKD | | | 82,000 | | | | 80,170 | | | | 0.81 | |
Chow Tai Fook Jewellery Group Ltd. | | | | | 70,200 | | | | 116,442 | | | | 1.18 | |
CITIC Securities Co. Ltd., Class H | | HKD | | | 75,000 | | | | 157,100 | | | | 1.59 | |
Hollysys Automation Technologies Ltd. | | | | | 5,011 | | | | 84,035 | | | | 0.85 | |
Honghua Group Ltd. | | HKD | | | 115,000 | | | | 35,006 | | | | 0.36 | |
Industrial & Commercial Bank of China Ltd., Class H | | HKD | | | 231,000 | | | | 161,786 | | | | 1.64 | |
Intime Retail Group Co. Ltd. | | | | | 57,000 | | | | 67,859 | | | | 0.69 | |
Nine Dragons Paper Holdings Ltd. | | HKD | | | 81,000 | | | | 66,865 | | | | 0.68 | |
Ping An Insurance Group Co. of China Ltd., Class H | | HKD | | | 27,500 | | | | 216,545 | | | | 2.20 | |
Shanghai Pharmaceuticals Holding Co. Ltd., Class H | | HKD | | | 44,700 | | | | 92,133 | | | | 0.94 | |
Shimao Property Holdings Ltd. | | HKD | | | 22,000 | | | | 55,390 | | | | 0.56 | |
Sohu.com, Inc. | | | | | 1,200 | | | | 80,352 | | | | 0.82 | |
ZTE Corp., Class H | | HKD | | | 36,200 | | | | 78,909 | | | | 0.80 | |
| | | | | | | | | 2,212,272 | | | | 22.45 | |
Colombia (Cost $29,435) | | | | | | | | | | | | | | |
Cemex Latam Holdings S.A.(2) | | COP | | | 3,781 | | | | 28,932 | | | | 0.29 | |
| | | | | | | | | 28,932 | | | | 0.29 | |
Czech Republic (Cost $122,302) | | | | | | | | | | | | | | |
Erste Group Bank A.G. | | EUR | | | 3,776 | | | | 133,170 | | | | 1.35 | |
| | | | | | | | | 133,170 | | | | 1.35 | |
India (Cost $243,006) | | | | | | | | | | | | | | |
ICICI Bank Ltd. ADR | | | | | 1,227 | | | | 45,792 | | | | 0.46 | |
Infosys Ltd. | | | | | 2,426 | | | | 128,723 | | | | 1.31 | |
Reliance Industries Ltd. GDR(2) | | | | | 2,514 | | | | 75,093 | | | | 0.76 | |
| | | | | | | | | 249,608 | | | | 2.53 | |
Indonesia (Cost $70,911) | | | | | | | | | | | | | | |
Indomobil Sukses Internasional Tbk PT | | IDR | | | 72,000 | | | | 32,575 | | | | 0.33 | |
Timah Persero Tbk PT | | | | | 170,500 | | | | 24,503 | | | | 0.25 | |
| | | | | | | | | 57,078 | | | | 0.58 | |
Malaysia (Cost $339,228) | | | | | | | | | | | | | | |
DRB-Hicom Bhd. | | MYR | | | 84,700 | | | | 68,178 | | | | 0.69 | |
Gamuda Bhd. | | MYR | | | 38,800 | | | | 59,880 | | | | 0.61 | |
Parkson Retail Group Ltd. | | HKD | | | 117,000 | | | | 40,142 | | | | 0.41 | |
SP Setia Bhd. | | MYR | | | 19,800 | | | | 19,263 | | | | 0.19 | |
See accompanying notes to the financial statements.
90
ASHMORE EMERGING MARKETS EQUITY FUND
SCHEDULE OF INVESTMENTS (CONTINUED)
As of October 31, 2013
| | | | | | | | | | | | | | |
| | | Currency(1) | | Shares | | | Value | | | % of Net
Assets | |
Malaysia - (continued) | | | | | | | | | | | | | | |
Tenaga Nasional Bhd. | | MYR | | | 32,200 | | | $ | 96,226 | | | | 0.98 | |
| | | | | | | | | 283,689 | | | | 2.88 | |
Mexico (Cost $395,750) | | | | | | | | | | | | | | |
Alfa S.A.B. de C.V., Class A | | MXN | | | 15,500 | | | | 42,506 | | | | 0.43 | |
Cemex S.A.B. de C.V. ADR (Participation Certificate)(2) | | | | | 14,689 | | | | 155,410 | | | | 1.57 | |
Empresas ICA S.A.B. de C.V. ADR | | | | | 2,700 | | | | 20,547 | | | | 0.21 | |
Grupo Aeroportuario del Centro Norte S.A.B. de C.V. | | MXN | | | 11,600 | | | | 39,537 | | | | 0.40 | |
Grupo Lala S.A.B. de C.V. | | MXN | | | 15,000 | | | | 33,317 | | | | 0.34 | |
Ternium S.A. ADR | | | | | 4,715 | | | | 122,967 | | | | 1.25 | |
| | | | | | | | | 414,284 | | | | 4.20 | |
Peru (Cost $177,148) | | | | | | | | | | | | | | |
Credicorp Ltd. | | | | | 1,470 | | | | 200,802 | | | | 2.04 | |
| | | | | | | | | 200,802 | | | | 2.04 | |
Philippines (Cost $41,147) | | | | | | | | | | | | | | |
Bloomberry Resorts Corp. | | | | | 163,100 | | | | 38,576 | | | | 0.39 | |
| | | | | | | | | 38,576 | | | | 0.39 | |
Qatar (Cost $66,164) | | | | | | | | | | | | | | |
Doha Bank QSC | | | | | 4,300 | | | | 64,973 | | | | 0.66 | |
| | | | | | | | | 64,973 | | | | 0.66 | |
Russian Federation (Cost $906,717) | | | | | | | | | | | | | | |
Aeroflot - Russian Airlines OJSC | | | | | 88,800 | | | | 158,934 | | | | 1.61 | |
Lukoil OAO ADR | | | | | 3,626 | | | | 237,866 | | | | 2.41 | |
NovaTek OAO GDR (Registered) | | | | | 220 | | | | 30,910 | | | | 0.31 | |
Sberbank of Russia ADR | | | | | 38,237 | | | | 488,286 | | | | 4.96 | |
Sistema JSFC GDR (Registered) | | | | | 3,365 | | | | 90,182 | | | | 0.92 | |
| | | | | | | | | 1,006,178 | | | | 10.21 | |
South Africa (Cost $163,662) | | | | | | | | | | | | | | |
Exxaro Resources Ltd. | | ZAR | | | 3,005 | | | | 46,098 | | | | 0.47 | |
Imperial Holdings Ltd. | | ZAR | | | 2,493 | | | | 52,971 | | | | 0.54 | |
Steinhoff International Holdings Ltd. | | ZAR | | | 23,815 | | | | 92,069 | | | | 0.93 | |
| | | | | | | | | 191,138 | | | | 1.94 | |
South Korea (Cost $1,916,304) | | | | | | | | | | | | | | |
BS Financial Group, Inc. | | KRW | | | 6,140 | | | | 98,692 | | | | 1.00 | |
Grand Korea Leisure Co. Ltd. | | KRW | | | 2,050 | | | | 74,791 | | | | 0.76 | |
Hana Financial Group, Inc. | | KRW | | | 3,970 | | | | 153,074 | | | | 1.55 | |
Hyundai Development Co.-Engineering & Construction | | KRW | | | 3,820 | | | | 84,989 | | | | 0.86 | |
Hyundai Mobis Co. Ltd. | | KRW | | | 420 | | | | 118,586 | | | | 1.21 | |
Hyundai Motor Co. | | KRW | | | 2,134 | | | | 508,981 | | | | 5.17 | |
Kia Motors Corp. | | KRW | | | 2,357 | | | | 137,098 | | | | 1.39 | |
Korean Reinsurance Co. | | KRW | | | 7,480 | | | | 83,914 | | | | 0.85 | |
LG Chem Ltd. | | KRW | | | 388 | | | | 109,551 | | | | 1.11 | |
LG Display Co. Ltd. | | KRW | | | 2,150 | | | | 50,570 | | | | 0.51 | |
Lotte Chemical Corp. | | KRW | | | 210 | | | | 43,059 | | | | 0.44 | |
Samsung Electronics Co. Ltd. | | KRW | | | 294 | | | | 406,043 | | | | 4.12 | |
Samsung Engineering Co. Ltd. | | KRW | | | 836 | | | | 58,873 | | | | 0.60 | |
Samsung Heavy Industries Co. Ltd. | | KRW | | | 3,270 | | | | 120,072 | | | | 1.22 | |
| | | | | | | | | 2,048,293 | | | | 20.79 | |
Taiwan (Cost $360,474) | | | | | | | | | | | | | | |
China Life Insurance Co. Ltd. | | TWD | | | 63,840 | | | | 62,581 | | | | 0.64 | |
Evergreen Marine Corp. Taiwan Ltd. | | TWD | | | 75,000 | | | | 44,163 | | | | 0.45 | |
Formosa Plastics Corp. | | TWD | | | 8,320 | | | | 22,599 | | | | 0.23 | |
Innolux Corp. | | TWD | | | 28,000 | | | | 11,103 | | | | 0.11 | |
MediaTek, Inc. | | TWD | | | 3,000 | | | | 41,049 | | | | 0.42 | |
Shin Kong Financial Holding Co. Ltd. | | TWD | | | 269,901 | | | | 93,704 | | | | 0.95 | |
See accompanying notes to the financial statements.
91
ASHMORE EMERGING MARKETS EQUITY FUND
SCHEDULE OF INVESTMENTS (CONTINUED)
As of October 31, 2013
| | | | | | | | | | | | | | |
| | | Currency(1) | | Shares | | | Value | | | % of Net
Assets | |
Taiwan - (continued) | | | | | | | | | | | | | | |
Taiwan Semiconductor Manufacturing Co. Ltd. | | TWD | | | 21,251 | | | $ | 79,204 | | | | 0.80 | |
United Microelectronics Corp. | | TWD | | | 36,000 | | | | 15,256 | | | | 0.15 | |
Wan Hai Lines Ltd. | | TWD | | | 34,000 | | | | 18,343 | | | | 0.19 | |
| | | | | | | | | 388,002 | | | | 3.94 | |
Thailand (Cost $199,270) | | | | | | | | | | | | | | |
Charoen Pokphand Foods PCL (Registered) | | THB | | | 37,800 | | | | 29,511 | | | | 0.30 | |
Kasikornbank PCL (Registered) | | THB | | | 2,200 | | | | 13,713 | | | | 0.14 | |
Kasikornbank PCL, NVDR | | THB | | | 16,100 | | | | 98,281 | | | | 1.00 | |
Thai Beverage PCL | | SGD | | | 102,000 | | | | 44,751 | | | | 0.45 | |
| | | | | | | | | 186,256 | | | | 1.89 | |
Turkey (Cost $285,832) | | | | | | | | | | | | | | |
Turk Hava Yollari | | TRY | | | 26,654 | | | | 104,413 | | | | 1.06 | |
Turkiye Halk Bankasi A/S | | TRY | | | 24,017 | | | | 194,302 | | | | 1.97 | |
| | | | | | | | | 298,715 | | | | 3.03 | |
Total Common Stock (Cost $8,560,434) | | | | | | | | | 8,893,081 | | | | 90.24 | |
| | | | |
Preferred Stock | | | | | | | | | | | | | | |
| | | | |
Brazil (Cost $324,963) | | | | | | | | | | | | | | |
Banco ABC Brasil S.A. | | BRL | | | 7,167 | | | | 44,118 | | | | 0.44 | |
Cia Energetica de Minas Gerais ADR | | | | | 5,142 | | | | 46,124 | | | | 0.47 | |
Itau Unibanco Holding S.A. ADR | | | | | 7,931 | | | | 122,216 | | | | 1.24 | |
Usinas Siderurgicas de Minas Gerais S.A., Class A | | BRL | | | 16,700 | | | | 88,562 | | | | 0.90 | |
| | | | | | | | | 301,020 | | | | 3.05 | |
Total Preferred Stock (Cost $324,963) | | | | | | | | | 301,020 | | | | 3.05 | |
See accompanying notes to the financial statements.
92
ASHMORE EMERGING MARKETS EQUITY FUND
SCHEDULE OF INVESTMENTS (CONTINUED)
As of October 31, 2013
| | | | | | | | | | | | | | |
| | | Currency(1) | | Shares | | | Value | | | % of Net
Assets | |
Equity-Linked Securities | | | | | | | | | | | | | | |
| | | | |
India (Cost $398,551) | | | | | | | | | | | | | | |
Axis Bank Ltd., Issued by Merrill Lynch International | | | | | 3,219 | | | $ | 64,044 | | | | 0.65 | |
Axis Bank Ltd., Issued by Merrill Lynch International | | | | | 481 | | | | 9,570 | | | | 0.10 | |
Hero Motocorp Ltd., Issued by JP Morgan Structured Products B.V. | | | | | 1,994 | | | | 67,437 | | | | 0.68 | |
Idea Cellular Ltd., Issued by JP Morgan Structured Products B.V. | | | | | 22,996 | | | | 64,642 | | | | 0.66 | |
Jaiprakash Associates Ltd., Issued by Merrill Lynch International | | | | | 53,701 | | | | 41,638 | | | | 0.42 | |
Maruti Suzuki India Ltd., Issued by Merrill Lynch International | | | | | 2,998 | | | | 79,820 | | | | 0.81 | |
Tech Mahindra Ltd., Issued by Citigroup Global Markets | | | | | 2,554 | | | | 64,460 | | | | 0.65 | |
| | | | | | | | | 391,611 | | | | 3.97 | |
Saudi Arabia (Cost $90,068) | | | | | | | | | | | | | | |
Abdullah Al Othaim Markets, Issued by Credit Suisse | | | | | 3,844 | | | | 136,576 | | | | 1.39 | |
| | | | | | | | | 136,576 | | | | 1.39 | |
United Arab Emirates (Cost $65,809) | | | | | | | | | | | | | | |
Union National Bank PJSC, Issued by JP Morgan Structured Products B.V. | | | | | 47,000 | | | | 64,620 | | | | 0.66 | |
| | | | | | | | | 64,620 | | | | 0.66 | |
Total Equity-Linked Securities (Cost $554,428) | | | | | | | | | 592,807 | | | | 6.02 | |
Total Investments (Total Cost $9,439,825) | | | | | | | | | 9,786,908 | | | | 99.31 | |
Other Assets Less Liabilities (See Statements of Assets and Liabilities for further detail) | | | | | | | | | 67,807 | | | | 0.69 | |
Net Assets | | | | | | | | $ | 9,854,715 | | | | 100.00 | |
| (1) | Par values are stated in United States Dollars unless otherwise noted below. |
| (2) | Security determined to be illiquid by the Investment Manager. |
Percentages shown are based on net assets.
At October 31, 2013, the industry sectors for the Ashmore Emerging Markets Equity Fund were:
| | | | |
| Sector | | Percentage of
Net Assets | |
Consumer Discretionary | | | 15.4% | |
Consumer Staples | | | 1.1 | |
Financials | | | 33.5 | |
Energy | | | 9.9 | |
Health Care | | | 0.9 | |
Industrials | | | 8.9 | |
Information Technology | | | 12.5 | |
Materials | | | 14.2 | |
See accompanying notes to the financial statements.
93
ASHMORE EMERGING MARKETS EQUITY FUND
SCHEDULE OF INVESTMENTS (CONTINUED)
As of October 31, 2013
| | | | |
| Sector | | Percentage of
Net Assets | |
| |
Telecommunication Services | | | 0.9% | |
Utilities | | | 2.0 | |
| |
Total Investments | | | 99.3 | |
Other Assets Less Liabilities | | | 0.7 | |
Net Assets | | | 100.0% | |
| |
The inputs or methodologies used for valuing securities are not necessarily an indication of the risks associated with investing in those securities and other financial instruments, if any. See note 4 in the Notes to the Financial Statements for more information regarding pricing inputs and valuation techniques. The following is a summary of the inputs used in valuing the Ashmore Emerging Markets Equity Fund’s investments, as of October 31, 2013.
| | | | | | | | | | | | | | | | |
| | | Level 1 | | | Level 2 | | | Level 3 | | | Total | |
Investments | | | | | | | | | | | | | | | | |
Assets: | | | | | | | | | | | | | | | | |
Common Stocks | | | | | | | | | | | | | | | | |
Brazil | | $ | 1,091,115 | | | $ | — | | | $ | — | | | $ | 1,091,115 | |
China | | | 2,212,272 | | | | — | | | | — | | | | 2,212,272 | |
Colombia | | | 28,932 | | | | — | | | | — | | | | 28,932 | |
Czech Republic | | | 133,170 | | | | — | | | | — | | | | 133,170 | |
India | | | 249,608 | | | | — | | | | — | | | | 249,608 | |
Indonesia | | | 57,078 | | | | — | | | | — | | | | 57,078 | |
Malaysia | | | 283,689 | | | | — | | | | — | | | | 283,689 | |
Mexico | | | 414,284 | | | | — | | | | — | | | | 414,284 | |
Peru | | | 200,802 | | | | — | | | | — | | | | 200,802 | |
Philippines | | | 38,576 | | | | — | | | | — | | | | 38,576 | |
Qatar | | | 64,973 | | | | — | | | | — | | | | 64,973 | |
Russian Federation | | | 1,006,178 | | | | — | | | | — | | | | 1,006,178 | |
South Africa | | | 191,138 | | | | — | | | | — | | | | 191,138 | |
South Korea | | | 2,048,293 | | | | — | | | | — | | | | 2,048,293 | |
Taiwan | | | 388,002 | | | | — | | | | — | | | | 388,002 | |
Thailand | | | 186,256 | | | | — | | | | — | | | | 186,256 | |
Turkey | | | 298,715 | | | | — | | | | — | | | | 298,715 | |
Preferred Stock | | | | | | | | | | | | | | | | |
Brazil | | | 301,020 | | | | — | | | | — | | | | 301,020 | |
Equity - Linked Securities | | | | | | | | | | | | | | | | |
India | | | — | | | | 391,611 | | | | — | | | | 391,611 | |
Saudi Arabia | | | — | | | | 136,576 | | | | — | | | | 136,576 | |
United Arab Emirates | | | — | | | | 64,620 | | | | — | | | | 64,620 | |
Total Investments | | $ | 9,194,101 | | | $ | 592,807 | | | $ | — | | | $ | 9,786,908 | |
The Fund discloses all transfers between levels based on valuations at the end of each reporting period. At October 31, 2013 there were no transfers between Level 1, Level 2 and Level 3 based on levels assigned to the securities on October 31, 2012. U.S. GAAP provides additional guidance for estimating fair value when the volume and level of activity for the asset or liability have significantly decreased as well as guidance on identifying circumstances that indicate when a transaction is not orderly.
See accompanying notes to the financial statements.
94
ASHMORE EMERGING MARKETS EQUITY FUND
SCHEDULE OF INVESTMENTS (CONTINUED)
As of October 31, 2013
The following is a summary of the fair values of the Fund’s derivative instruments*:
The Effect of Financial Derivative Instruments on the Statements of Operations for the Year Ended October 31, 2013:
| | |
| | | Derivatives Not Accounted for as
Hedging Instruments |
| | | Foreign Exchange |
Realized Loss on Derivatives Recognized resulting from Operations: | | |
Net Realized Loss on Forward Foreign Currency Exchange Contracts | | $ (6,511) |
| | |
| * | See note 9 in the Notes to the Financial Statements for additional information. |
At October 31, 2013, for U.S. federal income tax purposes, gross unrealized appreciation, gross unrealized depreciation, net unrealized appreciation/(depreciation) on investments in securities (including the effects of foreign currency translation) and the cost basis of investments were as follows:
| | | | |
Federal tax cost of investments | | | $9,525,812 | |
Gross tax appreciation of investments | | | $767,873 | |
Gross tax depreciation of investments | | | (506,777) | |
Net tax appreciation of investments | | | $261,096 | |
The difference between book basis and tax basis net unrealized appreciation or depreciation is attributable primarily to the tax deferral of losses on wash sales.
See accompanying notes to the financial statements.
95
ASHMORE EMERGING MARKETS SMALL-CAP EQUITY FUND
SCHEDULE OF INVESTMENTS
As of October 31, 2013
| | | | | | | | | | | | | | |
| | | Currency(1) | | Shares | | | Value | | | % of Net
Assets | |
Common Stock | | | | | | | | | | | | | | |
| | | | |
Brazil (Cost $2,549,410) | | | | | | | | | | | | | | |
Cia de Locacao das Americas | | BRL | | | 34,491 | | | $ | 130,869 | | | | 0.43 | |
Even Construtora e Incorporadora S.A. | | BRL | | | 30,300 | | | | 112,939 | | | | 0.37 | |
GAEC Educacao S.A. | | BRL | | | 12,000 | | | | 102,741 | | | | 0.33 | |
Gol Linhas Aereas Inteligentes S.A. ADR | | | | | 61,500 | | | | 317,955 | | | | 1.04 | |
Iochpe-Maxion S.A. | | BRL | | | 56,100 | | | | 685,912 | | | | 2.24 | |
Magazine Luiza S.A. | | BRL | | | 73,000 | | | | 309,571 | | | | 1.01 | |
Mahle-Metal Leve S.A. Industria e Comercio | | BRL | | | 24,300 | | | | 303,614 | | | | 0.99 | |
Sonae Sierra Brasil S.A. | | BRL | | | 26,300 | | | | 264,150 | | | | 0.86 | |
Valid Solucoes e Servicos de Seguranca em Meios de
Pagamento e Identificacao S.A. | | BRL | | | 16,400 | | | | 253,006 | | | | 0.83 | |
| | | | | | | | | 2,480,757 | | | | 8.10 | |
Cambodia (Cost $145,924) | | | | | | | | | | | | | | |
NagaCorp Ltd. | | HKD | | | 186,000 | | | | 171,773 | | | | 0.56 | |
| | | | | | | | | 171,773 | | | | 0.56 | |
Chile (Cost $345,545) | | | | | | | | | | | | | | |
Cia Sud Americana de Vapores S.A. | | CLP | | | 3,564,829 | | | | 165,628 | | | | 0.54 | |
| | | | | | | | | 165,628 | | | | 0.54 | |
China (Cost $5,425,423) | | | | | | | | | | | | | | |
Anton Oilfield Services Group | | HKD | | | 100,000 | | | | 63,201 | | | | 0.21 | |
AutoNavi Holdings Ltd. ADR | | | | | 15,745 | | | | 243,418 | | | | 0.79 | |
China Dongxiang Group Co. | | HKD | | | 1,651,000 | | | | 257,669 | | | | 0.84 | |
China Lodging Group Ltd. ADR | | | | | 17,198 | | | | 378,012 | | | | 1.23 | |
Chinasoft International Ltd. | | | | | 1,140,000 | | | | 333,780 | | | | 1.09 | |
Forgame Holdings Ltd. | | HKD | | | 11,100 | | | | 91,629 | | | | 0.30 | |
GOME Electrical Appliances Holding Ltd. | | HKD | | | 1,146,000 | | | | 177,377 | | | | 0.58 | |
Goodbaby International Holdings Ltd. | | | | | 302,000 | | | | 149,189 | | | | 0.49 | |
Hollysys Automation Technologies Ltd. | | | | | 62,120 | | | | 1,041,752 | | | | 3.40 | |
Honghua Group Ltd. | | HKD | | | 284,000 | | | | 86,449 | | | | 0.28 | |
Intime Retail Group Co. Ltd. | | | | | 458,500 | | | | 545,848 | | | | 1.78 | |
Ju Teng International Holdings Ltd. | | HKD | | | 794,000 | | | | 577,604 | | | | 1.88 | |
Kingsoft Corp. Ltd. | | HKD | | | 112,000 | | | | 278,230 | | | | 0.91 | |
Minth Group Ltd. | | HKD | | | 118,000 | | | | 247,172 | | | | 0.81 | |
Noah Holdings Ltd. ADR | | | | | 15,800 | | | | 304,782 | | | | 0.99 | |
Shanghai Fudan-Zhangjiang Bio-Pharmaceutical Co. Ltd., Class H | | | | | 220,000 | | | | 191,539 | | | | 0.62 | |
Shenzhou International Group Holdings Ltd. | | HKD | | | 106,000 | | | | 365,046 | | | | 1.19 | |
SouFun Holdings Ltd. ADR | | | | | 15,419 | | | | 820,753 | | | | 2.68 | |
SPT Energy Group, Inc. | | HKD | | | 304,000 | | | | 167,429 | | | | 0.55 | |
Xiao Nan Guo Restaurants Holdings Ltd. | | HKD | | | 520,000 | | | | 107,313 | | | | 0.35 | |
Zhongsheng Group Holdings Ltd. | | HKD | | | 151,000 | | | | 241,896 | | | | 0.79 | |
ZTE Corp., Class H | | HKD | | | 233,000 | | | | 507,894 | | | | 1.66 | |
| | | | | | | | | 7,177,982 | | | | 23.42 | |
Colombia (Cost $278,762) | | | | | | | | | | | | | | |
Gran Tierra Energy, Inc. | | | | | 45,600 | | | | 346,104 | | | | 1.13 | |
| | | | | | | | | 346,104 | | | | 1.13 | |
Hong Kong (Cost $640,823) | | | | | | | | | | | | | | |
Comba Telecom Systems Holdings Ltd. | | HKD | | | 365,000 | | | | 120,521 | | | | 0.39 | |
Pacific Basin Shipping Ltd. | | HKD | | | 908,000 | | | | 649,994 | | | | 2.12 | |
| | | | | | | | | 770,515 | | | | 2.51 | |
Indonesia (Cost $662,162) | | | | | | | | | | | | | | |
Adi Sarana Armada Tbk PT | | IDR | | | 3,211,500 | | | | 86,893 | | | | 0.28 | |
See accompanying notes to the financial statements.
96
ASHMORE EMERGING MARKETS SMALL-CAP EQUITY FUND
SCHEDULE OF INVESTMENTS (CONTINUED)
As of October 31, 2013
| | | | | | | | | | | | | | |
| | | Currency(1) | | Shares | | | Value | | | % of Net
Assets | |
Indonesia - (continued) | | | | | | | | | | | | | | |
Berlian Laju Tanker Tbk PT(2) | | IDR | | | 4,428,000 | | | $ | 57,744 | | | | 0.19 | |
Timah Persero Tbk PT | | | | | 1,812,000 | | | | 260,407 | | | | 0.85 | |
Wismilak Inti Makmur Tbk PT | | IDR | | | 1,536,000 | | | | 107,646 | | | | 0.35 | |
| | | | | | | | | 512,690 | | | | 1.67 | |
Malaysia (Cost $1,450,257) | | | | | | | | | | | | | | |
Gamuda Bhd. | | MYR | | | 203,000 | | | | 313,292 | | | | 1.02 | |
Landmarks Bhd. | | MYR | | | 224,500 | | | | 83,951 | | | | 0.27 | |
My EG Services Bhd. | | MYR | | | 236,100 | | | | 173,584 | | | | 0.57 | |
Padini Holdings Bhd. | | MYR | | | 226,300 | | | | 126,935 | | | | 0.42 | |
Tune Ins Holdings Bhd. | | MYR | | | 220,700 | | | | 128,690 | | | | 0.42 | |
Wah Seong Corp. Bhd. | | MYR | | | 555,201 | | | | 299,105 | | | | 0.98 | |
WCT Holdings Bhd. | | | | | 380,000 | | | | 295,036 | | | | 0.96 | |
| | | | | | | | | 1,420,593 | | | | 4.64 | |
Mexico (Cost $1,341,322) | | | | | | | | | | | | | | |
Cydsa S.A.B. de C.V. | | MXN | | | 143,175 | | | | 192,367 | | | | 0.63 | |
Empresas ICA S.A.B. de C.V. ADR | | | | | 66,281 | | | | 504,398 | | | | 1.65 | |
Grupo Famsa S.A.B. de C.V., Series A | | MXN | | | 135,800 | | | | 255,212 | | | | 0.83 | |
Grupo KUO S.A.B. de C.V., Series B | | | | | 57,313 | | | | 111,356 | | | | 0.36 | |
Qualitas Controladora S.A.B. de C.V. | | MXN | | | 100,300 | | | | 236,696 | | | | 0.77 | |
| | | | | | | | | 1,300,029 | | | | 4.24 | |
Nigeria (Cost $242,002) | | | | | | | | | | | | | | |
Zenith Bank PLC | | NGN | | | 2,035,614 | | | | 276,115 | | | | 0.90 | |
| | | | | | | | | 276,115 | | | | 0.90 | |
Peru (Cost $317,061) | | | | | | | | | | | | | | |
Ferreycorp S.A.A. | | PEN | | | 482,885 | | | | 315,190 | | | | 1.03 | |
| | | | | | | | | 315,190 | | | | 1.03 | |
Philippines (Cost $536,182) | | | | | | | | | | | | | | |
Atlas Consolidated Mining & Development | | | | | 413,100 | | | | 118,356 | | | | 0.39 | |
Century Properties Group, Inc. | | PHP | | | 2,605,000 | | | | 109,722 | | | | 0.36 | |
Filinvest Land, Inc. | | PHP | | | 5,802,000 | | | | 216,182 | | | | 0.70 | |
| | | | | | | | | 444,260 | | | | 1.45 | |
Russian Federation (Cost $825,752) | | | | | | | | | | | | | | |
Aeroflot - Russian Airlines OJSC | | | | | 318,600 | | | | 570,228 | | | | 1.86 | |
Luxoft Holding, Inc. | | | | | 1,100 | | | | 32,142 | | | | 0.11 | |
TMK OAO GDR (Registered) | | | | | 20,916 | | | | 270,235 | | | | 0.88 | |
| | | | | | | | | 872,605 | | | | 2.85 | |
South Korea (Cost $3,982,321) | | | | | | | | | | | | | | |
Basic House (The) Co. Ltd. | | KRW | | | 13,380 | | | | 229,570 | | | | 0.75 | |
BS Financial Group, Inc. | | KRW | | | 21,160 | | | | 340,116 | | | | 1.11 | |
Grand Korea Leisure Co. Ltd. | | KRW | | | 9,020 | | | | 329,082 | | | | 1.07 | |
Hyundai Department Store Co. Ltd. | | KRW | | | 4,127 | | | | 657,519 | | | | 2.15 | |
Hyundai Development Co.-Engineering & Construction | | KRW | | | 12,200 | | | | 271,431 | | | | 0.89 | |
Korean Reinsurance Co. | | KRW | | | 72,600 | | | | 814,461 | | | | 2.66 | |
LG Fashion Corp. | | KRW | | | 24,650 | | | | 755,244 | | | | 2.46 | |
Modetour Network, Inc. | | KRW | | | 10,058 | | | | 212,396 | | | | 0.69 | |
Nexen Tire Corp. | | KRW | | | 41,171 | | | | 617,128 | | | | 2.01 | |
Osstem Implant Co. Ltd. | | KRW | | | 5,502 | | | | 140,565 | | | | 0.46 | |
| | | | | | | | | 4,367,512 | | | | 14.25 | |
Taiwan (Cost $4,875,815) | | | | | | | | | | | | | | |
Chicony Electronics Co. Ltd. | | TWD | | | 310 | | | | 771 | | | | — | |
China Life Insurance Co. Ltd. | | TWD | | | 674,980 | | | | 661,666 | | | | 2.16 | |
Chipbond Technology Corp. | | TWD | | | 293,000 | | | | 592,393 | | | | 1.93 | |
Chroma ATE, Inc. | | TWD | | | 235,000 | | | | 500,723 | | | | 1.63 | |
Evergreen Marine Corp. Taiwan Ltd. | | TWD | | | 490,000 | | | | 288,535 | | | | 0.94 | |
See accompanying notes to the financial statements.
97
ASHMORE EMERGING MARKETS SMALL-CAP EQUITY FUND
SCHEDULE OF INVESTMENTS (CONTINUED)
As of October 31, 2013
| | | | | | | | | | | | | | |
| | | Currency(1) | | Shares | | | Value | | | % of Net
Assets | |
Taiwan - (continued) | | | | | | | | | | | | | | |
Globe Union Industrial Corp. | | TWD | | | 357,000 | | | $ | 270,975 | | | | 0.89 | |
Hung Poo Real Estate Development Corp. | | TWD | | | 268,000 | | | | 279,590 | | | | 0.91 | |
Johnson Health Tech Co. Ltd. | | TWD | | | 101,505 | | | | 289,871 | | | | 0.95 | |
Kinsus Interconnect Technology Corp. | | TWD | | | 161,000 | | | | 575,401 | | | | 1.88 | |
Parade Technologies Ltd. | | TWD | | | 79,802 | | | | 597,574 | | | | 1.95 | |
Tainan Spinning Co. Ltd. | | TWD | | | 1,015,465 | | | | 765,587 | | | | 2.50 | |
Taiwan Sanyo Electric Co. Ltd. | | TWD | | | 101,150 | | | | 132,895 | | | | 0.43 | |
TTFB Co. Ltd. | | TWD | | | 19,000 | | | | 186,252 | | | | 0.61 | |
TXC Corp. | | TWD | | | 183,000 | | | | 226,107 | | | | 0.74 | |
| | | | | | | | | 5,368,340 | | | | 17.52 | |
Thailand (Cost $920,211) | | | | | | | | | | | | | | |
Amata Corp. PCL (Registered) | | THB | | | 540,800 | | | | 297,114 | | | | 0.97 | |
Jasmine International PCL (Registered) | | THB | | | 639,300 | | | | 173,561 | | | | 0.57 | |
STP & I PCL (Registered) | | THB | | | 221,200 | | | | 144,269 | | | | 0.47 | |
Supalai PCL (Registered) | | THB | | | 412,700 | | | | 234,692 | | | | 0.76 | |
| | | | | | | | | 849,636 | | | | 2.77 | |
Turkey (Cost $575,630) | | | | | | | | | | | | | | |
Turkiye Sinai Kalkinma Bankasi A.S. | | TRY | | | 554,653 | | | | 541,803 | | | | 1.77 | |
| | | | | | | | | 541,803 | | | | 1.77 | |
Total Common Stock (Cost $25,114,602) | | | | | | | | | 27,381,532 | | | | 89.35 | |
| | | | |
Preferred Stock | | | | | | | | | | | | | | |
| | | | |
Brazil (Cost $535,721) | | | | | | | | | | | | | | |
Banco ABC Brasil S.A. | | BRL | | | 50,908 | | | | 313,375 | | | | 1.02 | |
Randon Participacoes S.A. | | BRL | | | 43,700 | | | | 247,741 | | | | 0.81 | |
| | | | | | | | | 561,116 | | | | 1.83 | |
Total Preferred Stock (Cost $535,721) | | | | | | | | | 561,116 | | | | 1.83 | |
| | | | |
Equity-Linked Securities | | | | | | | | | | | | | | |
| | | | |
India (Cost $1,652,162) | | | | | | | | | | | | | | |
Dewan Housing Finance Corp. Ltd., Issued by Citigroup Global Markets | | | | | 101,006 | | | | 250,645 | | | | 0.82 | |
Dewan Housing Finance Corp. Ltd., Issued by Merrill Lynch International
& Co. | | | | | 22,842 | | | | 56,682 | | | | 0.18 | |
HT Media Ltd., Issued by Citigroup Global Markets | | | | | 127,750 | | | | 172,433 | | | | 0.56 | |
KPIT Technologies Ltd., Issued by Merrill Lynch International & Co. | | | | | 128,316 | | | | 306,722 | | | | 1.00 | |
MT Educare Ltd., Issued by Merrill Lynch International & Co. | | | | | 209,722 | | | | 343,821 | | | | 1.12 | |
PI Industries Ltd., Issued by Citigroup Global Markets(2) | | | | | 183,760 | | | | 621,653 | | | | 2.03 | |
| | | | | | | | | 1,751,956 | | | | 5.71 | |
Saudi Arabia (Cost $583,627) | | | | | | | | | | | | | | |
Credit Suisse | | | | | 11,852 | | | | 421,096 | | | | 1.37 | |
Fawaz Abdulaziz Alhokair & Co., Issued by Deutsche Bank A.G. London | | | | | 9,660 | | | | 318,102 | | | | 1.04 | |
See accompanying notes to the financial statements.
98
ASHMORE EMERGING MARKETS SMALL-CAP EQUITY FUND
SCHEDULE OF INVESTMENTS (CONTINUED)
As of October 31, 2013
| | | | | | | | | | | | | | |
| | | Currency(1) | | Shares | | | Value | | | % of Net
Assets | |
Saudi Arabia - (continued) | | | | | | | | | | | | | | |
Fawaz Abdulaziz Alhokair & Co., Issued by Merrill Lynch International & Co. | | | | | 3,600 | | | $ | 118,548 | | | | 0.39 | |
| | | | | | | | | 857,746 | | | | 2.80 | |
Total Equity-Linked Securities (Cost $2,235,789) | | | | | | | | | 2,609,702 | | | | 8.51 | |
| | | | |
Total Investments (Total Cost $27,886,112) | | | | | | | | | 30,552,350 | | | | 99.69 | |
| | | | |
Other Assets Less Liabilities (See Statements of Assets and Liabilities for further detail) | | | | | | | | | 94,472 | | | | 0.31 | |
| | | | |
Net Assets | | | | | | | | $ | 30,646,822 | | | | 100.00 | |
| (1) | Par values are stated in United States Dollars unless otherwise noted below. |
| (2) | Security determined to be illiquid by the Investment Manager. |
Percentages shown are based on net assets.
At October 31, 2013, the industry sectors for the Ashmore Emerging Markets Small-Cap Equity Fund were:
| | | | |
| Sector | | Percentage of
Net Assets | |
| |
Consumer Discretionary | | | 29.2% | |
Consumer Staples | | | 0.3 | |
Energy | | | 4.0 | |
Financials | | | 18.8 | |
Health Care | | | 1.1 | |
Industrials | | | 18.4 | |
Information Technology | | | 22.9 | |
Materials | | | 4.4 | |
Telecommunication Services | | | 0.6 | |
| |
Total Investments | | | 99.7 | |
Other Assets Less Liabilities | | | 0.3 | |
Net Assets | | | 100.0% | |
| |
See accompanying notes to the financial statements.
99
ASHMORE EMERGING MARKETS SMALL-CAP EQUITY FUND
SCHEDULE OF INVESTMENTS (CONTINUED)
As of October 31, 2013
The inputs or methodologies used for valuing securities are not necessarily an indication of the risks associated with investing in those securities and other financial instruments, if any. See note 4 in the Notes to the Financial Statements for more information regarding pricing inputs and valuation techniques. The following is a summary of the inputs used in valuing the Ashmore Emerging Markets Small-Cap Equity Fund’s investments, which are carried at fair value, as of October 31, 2013:
| | | | | | | | | | | | | | | | |
| | | Level 1 | | | Level 2 | | | Level 3 | | | Total | |
Investments | | | | | | | | | | | | | | | | |
Assets: | | | | | | | | | | | | | | | | |
Common Stocks | | | | | | | | | | | | | | | | |
Brazil | | $ | 2,480,757 | | | $ | — | | | $ | — | | | $ | 2,480,757 | |
Cambodia | | | 171,773 | | | | — | | | | — | | | | 171,773 | |
Chile | | | 165,628 | | | | — | | | | — | | | | 165,628 | |
China | | | 7,177,982 | | | | — | | | | — | | | | 7,177,982 | |
Colombia | | | 346,104 | | | | — | | | | — | | | | 346,104 | |
Hong Kong | | | 770,515 | | | | — | | | | — | | | | 770,515 | |
Indonesia | | | 454,946 | | | | — | | | | 57,744 | | | | 512,690 | |
Malaysia | | | 1,420,593 | | | | — | | | | — | | | | 1,420,593 | |
Mexico | | | 1,300,029 | | | | — | | | | — | | | | 1,300,029 | |
Nigeria | | | 276,115 | | | | — | | | | — | | | | 276,115 | |
Peru | | | 315,190 | | | | — | | | | — | | | | 315,190 | |
Philippines | | | 444,260 | | | | — | | | | — | | | | 444,260 | |
Russian Federation | | | 872,605 | | | | — | | | | — | | | | 872,605 | |
South Korea | | | 4,367,512 | | | | — | | | | — | | | | 4,367,512 | |
Taiwan | | | 5,368,340 | | | | — | | | | — | | | | 5,368,340 | |
Thailand | | | 849,636 | | | | — | | | | — | | | | 849,636 | |
Turkey | | | 541,803 | | | | — | | | | — | | | | 541,803 | |
Preferred Stock | | | | | | | | | | | | | | | | |
Brazil | | | 561,116 | | | | — | | | | — | | | | 561,116 | |
Equity Linked Securities | | | | | | | | | | | | | | | | |
India | | | — | | | | 1,751,956 | | | | — | | | | 1,751,956 | |
Saudi Arabia | | | — | | | | 857,746 | | | | — | | | | 857,746 | |
| |
Total Investments | | $ | 27,884,904 | | | $ | 2,609,702 | | | $ | 57,744 | | | $ | 30,552,350 | |
| |
The Fund discloses all transfers between levels based on valuations at the end of each reporting period. At October 31, 2013 there were no transfers between Level 1, Level 2 and Level 3 based on levels assigned to the securities on October 31, 2012. U.S. GAAP provides additional guidance for estimating fair value when the volume and level of activity for the asset or liability have significantly decreased as well as guidance on identifying circumstances that indicate when a transaction is not orderly.
The following is a reconcilation of investments in which significant unobservable inputs (Level 3) were used for the Fund during the period ending October 31, 2013:
| | | | | | | | | | | | | | | | | | |
Category and Subcategory | | Beginning
Balance at 10/31/2012 | | Purchases | | Sales | | Realized
Gains | | Realized
Losses | | Change in
Unrealized
Appreciation/
(Depreciation) | | Transfer
into
Level 3 | | Transfer
out of
Level 3 | | Ending
Balance at 10/31/2013 |
|
Investments, at value | | | | | | | | | | | | | | | | | | |
Common Stock | | $67,760 | | $— | | $— | | $— | | $— | | $(10,016) | | $— | | $— | | $57,744 |
|
Total | | $67,760 | | $— | | $— | | $— | | $— | | $(10,016) | | $— | | $— | | $57,744 |
|
See accompanying notes to the financial statements.
100
ASHMORE EMERGING MARKETS SMALL-CAP EQUITY FUND
SCHEDULE OF INVESTMENTS (CONTINUED)
As of October 31, 2013
See the table on “Quantitative information about Fair Value measurements” for information on the valuation techniques and inputs used to value Level 3 securities at October 31, 2013.
| | | | | | | | |
Quantitative Information about Level 3 Fair Value Measurements Ashmore Emerging Markets Small-Cap Equity Fund |
|
| | | Fair Value at
10/31/2013 | | Valuation Techniques | | Unobservable Input | | Actual |
|
Common Stocks | | $57,744 | | Discount from last traded price | | Discount Percentage(a) | | 25% |
|
| (a) | Represents discount to last publicly traded price reported on applicable market. |
The significant unobservable inputs used in the fair value measurement of the Fund’s investments are listed above. Generally, a change in the assumptions used in any input in isolation may be accompanied by a change in another input. Significant changes in any of the unobservable inputs may significantly impact the fair value measurement. The impact is based on the relationship between each unobservable input and the fair value measurement. The increase in discount percentage reduced the value of the security.
The following is a summary of the fair values of the Fund’s derivative instruments*:
The Effect of Financial Derivative Instruments on the Statements of Operations for the Year Ended October 31, 2013:
| | |
| | | Derivatives Not Accounted
for as Hedging Instruments |
| | |
| | | Foreign Exchange |
|
Realized Gain (Loss) on Derivatives Recognized resulting from Operations: | | |
Net Realized Loss on Forward Foreign Currency Exchange Contracts | | $(1,320) |
| | |
* See note 9 in the Notes to the Financial Statements for additional information.
At October 31, 2013, for U.S. federal income tax purposes, gross unrealized appreciation, gross unrealized depreciation, net unrealized appreciation/(depreciation) on investments in securities (including the effects of foreign currency translation) and the cost basis of investments were as follows:
| | | | |
Federal tax cost of investments | | | $28,005,575 | |
Gross tax appreciation of investments | | | $4,044,455 | |
Gross tax depreciation of investments | | | (1,497,680) | |
Net tax appreciation of investments | | | $2,546,775 | |
The difference between book basis and tax basis net unrealized appreciation or depreciation is attributable primarily to the tax deferral of losses on wash sales.
See accompanying notes to the financial statements.
101
ASHMORE FUNDS
NOTES TO FINANCIAL STATEMENTS
October 31, 2013
1. Organization
Ashmore Funds (the “Trust”) is a Massachusetts business trust organized under the laws of The Commonwealth of Massachusetts on August 6, 2010 (inception date) and is registered under the Investment Company Act of 1940, as amended (the “Investment Company Act” or “1940 Act”), as an open-end investment management company. The Trust includes seven funds as of October 31, 2013, each with its own investment objective. The Ashmore Emerging Markets Corporate Debt Fund, Ashmore Emerging Markets Local Currency Bond Fund, Ashmore Emerging Markets Currency Fund, Ashmore Emerging Markets Sovereign Debt Fund, Ashmore Emerging Markets Total Return Fund, Ashmore Emerging Markets Equity Fund and Ashmore Emerging Markets Small-Cap Equity Fund (each a “Fund” and collectively, the “Funds”) are separate investment funds of the Trust. Effective February 28, 2013, the Ashmore Emerging Markets Local Currency Fund changed its name to Ashmore Emerging Markets Currency Fund. Each of the Funds, except Ashmore Emerging Markets Equity Fund and Ashmore Emerging Markets Small-Cap Equity Fund, are non-diversified. Non-diversified funds may invest a relatively large portion of their net assets in a single issuer or a small number of issuers in comparison to a fund that is “diversified.” Each of the Funds is presented herein.
On December 8, 2010, the Ashmore Emerging Markets Corporate Debt Fund, Ashmore Emerging Markets Local Currency Bond Fund, Ashmore Emerging Markets Currency Fund, Ashmore Emerging Markets Sovereign Debt Fund and Ashmore Emerging Markets Total Return Fund commenced investment operations. Effective May 12, 2011, Ashmore Emerging Markets Corporate Debt Fund, Ashmore Emerging Markets Local Currency Bond Fund, Ashmore Emerging Markets Currency Fund, Ashmore Emerging Markets Sovereign Debt Fund and Ashmore Emerging Markets Total Return Fund began to offer Class A and C shares (“Retail Shares”). On June 22, 2011, the Ashmore Emerging Markets Equity Fund – Institutional Class commenced investment operations. On October 4, 2011, the Ashmore Emerging Markets Small-Cap Equity Fund – Institutional Class commenced investment operations. On September 30, 2011, the Ashmore Emerging Markets Equity Fund and Ashmore Emerging Markets Small-Cap Equity Fund launched Class A and C shares. Class A shares for the Ashmore Emerging Markets Equity Fund and Ashmore Emerging Markets Small-Cap Equity Fund were initially offered on February 27, 2012 and February 1, 2012, respectively. Class C shares for the Ashmore Emerging Markets Equity Fund and Ashmore Emerging Markets Small-Cap Equity Fund were initially offered on August 24, 2012.
Ashmore Investment Management Limited (“Ashmore” or the “Investment Manager” or “AIML”) serves as investment manager to the Funds. The Investment Manager has retained Ashmore Equities Investment Management (U.S.) LLC (the “Subadviser”) to manage the investment portfolios of Ashmore Emerging Markets Equity Fund and Ashmore Emerging Markets Small-Cap Equity Fund. Effective July 1, 2013 the Subadviser changed its name from Ashmore EMM, L.L.C. The Subadviser is responsible for managing the investment of the assets of Ashmore Emerging Markets Equity Fund and Ashmore Emerging Markets Small-Cap Equity Fund, subject to the general oversight and supervision of the Investment Manager and the Board of Trustees of the Trust (the “Board”). Ashmore Investment Management (US) Corporation (“AIMUS”) is the principal underwriter of shares of the Funds. AIMUS is an affiliate of the Investment Manager. The Northern Trust Company (“Northern Trust”) serves as the administrator, custodian and transfer agent of the Funds.
2. Significant accounting policies
The significant accounting policies adopted and consistently followed in the preparation of the Funds’ financial statements are set out below:
(a) Basis of preparation
The financial statements have been prepared in accordance with accounting principles generally accepted in the United States of America (“U.S. GAAP”).
102
ASHMORE FUNDS
NOTES TO FINANCIAL STATEMENTS (CONTINUED)
October 31, 2013
(b) Use of estimates
The preparation of financial statements in accordance with U.S. GAAP requires management to make estimates and assumptions that affect the reported amounts of assets and liabilities and the disclosure of contingent assets and liabilities at the date of the financial statements and the reported amounts of revenues and expenses during the reporting period. Actual results could differ from these estimates. These financial statements contain all adjustments which are, in the opinion of management of the Trust, necessary to portray a fair statement of the period presented. Such adjustments are normal and recurring in nature. Valuation models used to determine the fair value of unlisted derivative instruments require the use of a number of market based assumptions.
(c) Determination of Net Asset Value
The net asset value (“NAV”) of a Fund’s shares is calculated at the close of regular trading (normally 4:00 p.m. Eastern time) (the “NYSE Close”) on each day that the New York Stock Exchange (“NYSE”) is open for regular trading.
(d) Investment valuation
For the purposes of calculating NAV, portfolio securities and other assets for which market quotations are readily available are valued at market value. Market values for securities and other instruments are generally determined on the basis of closing prices or the last reported sales prices on an exchange or other market, or if no sales are reported, based on quotes or other market information obtained from a quotation reporting system, established market makers, or pricing services. Domestic and foreign debt securities where the close of trading does not coincide with the NYSE close and non-exchange traded derivatives are normally valued on the basis of quotes obtained from brokers and dealers or pricing services using data reflecting the earlier closing of the principal markets for those securities. Prices obtained from independent pricing services are based on information provided by market makers or estimates of market values obtained from yield data relating to investments or securities with similar characteristics. Certain debt securities purchased on a delayed delivery basis are marked-to-market daily until settlement. Short-term investments having a maturity of 60 days or less and sufficient credit quality are generally valued at amortized cost. Exchange traded options, futures and options on futures are valued at the settlement price determined by the relevant exchange. With respect to any portion of a Fund’s assets that are invested in one or more open-ended investment management companies, a Fund’s NAV will be calculated based upon the NAVs of such investments. The prospectuses for these open-end investment management companies explain the circumstances under which those companies will use fair value pricing and the effects of using fair value pricing.
If the Investment Manager believes a non-U.S. (foreign) security’s value has materially changed after the close of the security’s primary exchange or principal market but before the NYSE Close, the security will be valued at fair value based on procedures approved by the Board. A Fund may determine the fair value of investments based on information provided by pricing services and other third-party vendors, which may recommend fair value prices or adjustments with reference to other securities, indices or assets. The Funds may use fair value pricing more frequently for foreign securities or assets because, amongst other things, many foreign markets close well before the NAV of the Funds’ shares is next calculated. In considering whether fair value pricing is required and in determining fair values, the Investment Manager may, amongst other things, consider significant events (which may be considered to include changes in the value of U.S. securities or securities indices) that occur after the close of the relevant market and before the NYSE Close. A Fund may utilize modeling tools provided by third-party vendors to determine the fair values of non-U.S. securities. Foreign exchanges may permit trading in foreign securities on days when the Trust is not open for business, which may result in the values of a Fund’s portfolio investments being affected when investors are unable to buy, sell or exchange shares of the Fund.
Domestic fixed income and non-U.S. securities are normally priced using data reflecting the earlier closing of the principal markets for those securities, subject to possible fair value adjustments. Information that becomes known to a Fund or its agents after NAV has been calculated on a particular day will not generally be used to retroactively adjust the price of a security or NAV determined earlier that day.
103
ASHMORE FUNDS
NOTES TO FINANCIAL STATEMENTS (CONTINUED)
October 31, 2013
Investments initially valued in currencies other than the U.S. dollar are converted to the U.S. dollar using exchange rates obtained from pricing services. Foreign exchange rates are calculated as of 4:00 p.m. Eastern time on each day that the NYSE is open for regular trading. As a result, the NAV of a Fund’s shares may be affected by changes in the value of currencies in relation to the U.S. dollar. The value of securities traded in markets outside the United States or denominated in currencies other than the U.S. dollar may be affected significantly on a day that the NYSE is closed and an investor is not able to purchase, redeem or exchange shares of the Funds. Securities and other assets for which market quotations are not readily available are valued at fair value as determined in good faith by the Board or persons acting at their direction. The Board has adopted methods and guidelines for valuing securities and other assets in circumstances where market quotes are not readily available, and has delegated to the Investment Manager and the Subadviser, as applicable, the responsibility for applying the valuation methods.
In the event that market quotes are not readily available, and the security or asset cannot be valued pursuant to one of the Board’s approved valuation methods, the fair value of the security or asset will be determined in good faith by the Board, generally based upon recommendations provided by the Investment Manager and the Subadviser, as applicable. Market quotes are considered not readily available in circumstances where there is an absence of current or reliable market-based data (e.g., trade information, bid/asked information, broker quotes), including where events occur after the close of the relevant market, but prior to a Fund’s NAV calculation time, that materially affect the values of a Fund’s securities or assets. In addition, market quotes are considered not readily available when, due to extraordinary circumstances, the exchanges or markets on which the securities trade do not open for trading for the entire day and no other market prices are available. A Fund may also determine that market quotations are not readily available due to events relating to a single issuer (e.g., corporate actions or announcements) or events relating to multiple issuers (e.g., governmental actions or natural disasters). The Board has delegated to the Investment Manager and the Subadviser, as applicable, the responsibility for monitoring significant events that may materially affect the values of a Fund’s securities or assets and for determining whether the value of the applicable securities or assets should be re-evaluated in light of such significant events.
The Investment Manager, as applicable, primarily employs a market-based approach which may use related or comparable assets or liabilities, recent transactions, market multiples, book values, and other relevant information to determine the fair value of the investment. The Investment Manager may also apply a discount to the last traded price in situations where the last traded price may not represent the fair value of the security, such as if a security’s trading has been suspended on its primary trading market, a security has been de-listed from its primary trading market, a security has not traded for an extended period of time, or a security’s primary trading market is temporarily closed at a time when under normal conditions it would be open. Any such discount is based on a number of factors including but not limited to the circumstances surrounding any potential suspension or de-listing, market and industry conditions, competitor information, and the period of time since the last trading took place.
When a Fund uses fair value pricing to determine the NAV of its shares, securities will not be priced on the basis of quotes from the primary market in which they are traded, but rather may be priced by another method that the Board or persons acting at its direction believe accurately reflects fair value. Fair value pricing may require subjective determinations about the value of a security or asset. While the Funds’ policies are intended to result in a calculation of a Fund’s NAV that fairly reflects security and asset values as of the time of pricing, the Funds cannot ensure that fair values determined by the Board or persons acting at their direction accurately reflects the price that a Fund could obtain for a security or asset if it were to dispose of that security or asset at the time of pricing (for instance, in a forced or distressed sale). The prices used by a Fund may differ from the value that would be realized if the securities were sold. Also, the use of fair value pricing may not always result in adjustments to the prices of securities or other assets held by the Fund for the purpose of calculating the NAV of the Fund’s shares.
104
ASHMORE FUNDS
NOTES TO FINANCIAL STATEMENTS (CONTINUED)
October 31, 2013
(e) Investment transactions, income and expenses
Investment transactions are recorded at the trade date. The Funds determine the gain or loss realized from investment transactions using an identified cost basis method. Interest income is recognized on an accrual basis and includes the amortization of premiums and the accretion of discounts using the effective yield method. Dividend income is recognized on the ex-dividend date. Dividends from foreign securities are recorded on the ex-dividend date, or as soon as such information is available and known to Funds’ management.
Expenses are recorded on an accrual basis. Each Fund is charged for those expenses that are directly attributable to that Fund. Certain expenses arising in connection with a class of shares are charged to that class of shares. Expenses incurred which do not specifically relate to an individual Fund are allocated amongst all the Funds in the Trust in proportion to each Fund’s relative net assets.
(f) Fully funded total return swaps
Each Fund is subject to market risk in the normal course of pursuing its investment objectives. Certain Funds enter into fully funded total return swaps (“TRS”) to manage their exposure to the market, certain sectors of the market or a particular security or reference asset, or to create exposure to certain investments to which they would otherwise not be exposed. TRS contracts involve the exchange by a Fund and a counterparty of their respective commitments to pay or receive a net amount based, in part, on the change in the value of a notional amount of a particular security, index or reference asset.
Where a Fund enters into a TRS transaction with a swap counterparty, pursuant to which the Fund makes an initial payment equal to the estimated value of an emerging market debt or equity security, loan or other financial instrument, the TRS is considered an investment for financial statement purposes and is accounted for using the same policies as would apply to the underlying assets it represents. Aside from the market risk of the underlying security, index or reference asset, there is a risk of default by the counterparty to the transaction.
(g) Equity-Linked Securities
Certain Funds may purchase equity-linked securities, also known as participation notes. Equity-linked securities are primarily used by the Funds as an alternate means to efficiently and effectively access what is generally an emerging securities market. A Fund deposits cash with its custodian (or broker) in an amount near or equal to the selling price of the underlying security in exchange for an equity linked security. Upon sale, the Fund receives cash from the broker or custodian, equal to the value of the underlying security. Aside from the market risk and credit risk of the underlying securities, there is a risk of default by the counterparty to the transaction. In the event of insolvency of the counterparty, a Fund might be unable to obtain its expected benefit. In addition, while the Funds will seek to enter into such transactions only with parties that are capable of entering into closing transactions with a Fund, there can be no assurance that a Fund will be able to close out such a transaction with the counterparty or obtain an offsetting position with any counterparty at a time prior to the end of the term of the underlying agreement.
(h) Reverse Repurchase Agreements
Certain Funds may enter into reverse repurchase agreements. In a reverse repurchase agreement, a Fund sells a security that it holds to a financial institution with a simultaneous agreement to repurchase the same security at an agreed-upon price and date. Securities sold under reverse repurchase agreements are reflected as a liability on the Statements of Assets and Liabilities. Interest payments made are recorded as a component of interest expense on the Statements of Operations. In periods of increased demand for the security, a Fund may receive a fee for use of the security by the counterparty, which may result in interest income to the Fund. A reverse repurchase agreement involves the risk that the market value of the security sold by a Fund may decline below the repurchase price of the security. A Fund will segregate assets determined to be liquid by the investment adviser or otherwise cover its obligations under reverse repurchase agreements.
105
ASHMORE FUNDS
NOTES TO FINANCIAL STATEMENTS (CONTINUED)
October 31, 2013
3. Principal risks
In the normal course of business, the Funds trade financial instruments and enter into financial transactions where a risk of potential loss exists due to, amongst other things, changes in the market (market risk), or the failure or inability of the other party to a transaction to perform (credit and counterparty risk). See below for a summary description of select principal risks, some of which may not apply to a particular Fund. For more information, please see the Funds’ prospectuses.
Counterparty and Third Party Risk
Transactions involving a counterparty to a derivative or other instrument, or a third party responsible for servicing the instrument, are subject to the credit risk of the counterparty or third party, and to the counterparty’s or third party’s ability to perform in accordance with the terms of the transaction.
Credit Risk
The Funds could lose money if the issuer or guarantor of a debt security or other instrument is unable or unwilling to meet its financial obligations, and the lack of ability, or perceived lack of ability, of the issuer to make timely payments of interest and/or principal will negatively affect the value of the security or instrument.
Currency Management Strategies Risk
Currency management strategies, including the use of forward currency contracts and other derivatives, may substantially change the Funds’ exposure to currencies and currency exchange rates and could result in losses to the Funds if currencies do not perform as the Investment Manager or the Subadviser, as applicable, anticipate.
Currency Risk
Foreign (non-U.S.) currencies may decline in value relative to the U.S. dollar and adversely affect the value of the Funds’ investments in foreign currencies, securities denominated in foreign currencies or derivatives that provide exposure to foreign currencies.
Derivatives Risk
Investing in derivative instruments may be considered risky and involves correlation, documentation, interest rate, leverage, liquidity, market, management, and valuation risks, as well as the risk of losing more than the principal amount invested.
Emerging Markets Risk
Compared to foreign developed markets, investing in emerging markets may involve heightened volatility, greater political, regulatory, legal and economic uncertainties, less liquidity, dependence on particular commodities or international aid, high levels of inflation, greater custody risk, and certain special risks associated with smaller companies.
Equity Securities Risk
Equity securities may react more strongly to changes in an issuer’s financial condition or prospects than other securities of the same issuer.
Focused Investment Risk
Focusing a fund’s investments in a limited number of issuers, sectors or industries increases risk and the volatility of the value of a fund’s shares. A Fund may be particularly susceptible to economic, political, regulatory or other events affecting the issuers, sectors or industries due to the extent that it focuses its investments.
Foreign Investment Risk
Investments in foreign (non-U.S.) issuers, directly or through the use of depositary receipts, may be negatively affected by adverse political, regulatory, economic, market or other developments affecting issuers located in foreign countries, currency exchange rates or regulations, or foreign withholding taxes. Investing in foreign securities may result in the Funds experiencing more rapid and extreme changes in value than a fund that invests exclusively in the securities of U.S. issuers.
106
ASHMORE FUNDS
NOTES TO FINANCIAL STATEMENTS (CONTINUED)
October 31, 2013
Geographic Focus Risk
The Funds may be particularly susceptible to economic, political or regulatory events affecting those countries or regions in which the Funds focus their investments.
High Yield Risk
Below investment grade securities and unrated securities of similar credit quality (commonly known as “high yield” securities or “junk bonds”) are subject to greater levels of credit and liquidity risks than higher quality securities, and are considered predominantly speculative with respect to the issuer’s continuing ability to make principal and interest payments.
Inflation/Deflation Risk
The value of the Funds’ investments may decline as inflation reduces the value of money; conversely, if deflation reduces prices throughout the economy, there may be an adverse effect on the creditworthiness of issuers in whose securities the Funds invest and an increase in the likelihood of issuer defaults.
Interest Rate Risk
Debt and other securities and instruments may decline in value due to changes in interest rates, the extended duration of principal payments at below-market interest rates, and/or prepayment.
Issuer Non-Diversification Risk
The Ashmore Emerging Markets Corporate Debt Fund, Ashmore Emerging Markets Local Currency Bond Fund, Ashmore Emerging Markets Currency Fund, Ashmore Emerging Markets Sovereign Debt Fund and the Ashmore Emerging Markets Total Return Fund are “non-diversified” and are therefore more susceptible to the risks of focusing investments in a small number of issuers, industries or foreign currencies, as well as the risks of a single economic, political or regulatory occurrence, than funds that are “diversified”.
Issuer Risk
The value of a security or instrument may decline for reasons directly related to the issuer, such as management performance, financial leverage and reduced demand for the issuer’s goods or services.
Leverage Risk
The use of leverage, including through borrowings, derivatives and reverse repurchase agreements, will increase the volatility of the Funds’ investment portfolio and magnify the Funds’ investment losses or gains.
Liquidity Risk
Illiquid securities and other instruments may be highly volatile, difficult to value, and difficult to sell or close out at favorable prices or times.
Market Risk
The value of securities and instruments owned by the Funds may rise and fall, sometimes rapidly or unpredictably, due to factors affecting securities markets generally or particular industries or geographic areas.
Over-the-Counter Risk
Securities and derivatives traded in over-the-counter markets may trade less frequently and in limited volumes and thus exhibit more volatility and liquidity risk. The prices paid by the Funds in over-the-counter transactions may include an undisclosed dealer markup.
Small and Mid-Sized Companies Risk
Investments in securities issued by small and mid-sized companies tend to be more vulnerable to adverse developments than larger companies, and may present increased volatility and liquidity risk.
107
ASHMORE FUNDS
NOTES TO FINANCIAL STATEMENTS (CONTINUED)
October 31, 2013
4. Fair value measurements
U.S. GAAP includes a topic which defines fair value as the price that the Fund would receive upon selling an investment in an orderly and timely transaction to a market participant in the principal or most advantageous market of the investment. This topic establishes a three-tier hierarchy to maximize the use of observable market data, minimize the use of unobservable inputs and establish classification of fair value measurements for disclosure purposes. Inputs may be observable or unobservable and refer broadly to the assumptions that market participants would use in pricing the asset or liability including assumptions about risk. Such risks include the inherent risk in a particular valuation technique which is used to measure fair value. Observable inputs are inputs that reflect the assumptions market participants would use in pricing the asset or liability developed based on market data obtained from sources independent of the reporting entity. Unobservable inputs are inputs that reflect the reporting entity’s own assumptions about the assumptions market participants would use in pricing the asset or liability, developed based on the best information available in the circumstances. The three-tier hierarchy of inputs is summarized in the three broad levels listed below.
| | • | | Level 1 – Inputs using unadjusted quoted prices in active markets or exchanges for identical assets and liabilities. |
| | • | | Level 2 – Significant observable inputs other than those used in Level 1, which may include, but are not limited to, quoted prices for similar assets or liabilities in markets that are active, quoted prices for identical or similar assets or liabilities in markets that are not active, inputs other than quoted prices that are observable for the assets or liabilities (such as interest rates, yield curves, volatilities, prepayment rates, loss severities, credit risks and default rates) or other market corroborated inputs. |
| | • | | Level 3 – Significant unobservable inputs based on the best information available in the circumstances, to the extent observable inputs are not available, which may include assumptions made by the Board or persons acting at their discretion that are used in determining the fair market value of investments. |
Fixed income securities including corporate, convertible and municipal bonds and notes, U.S. government agency securities, U.S. treasury obligations, sovereign issues, bank loans, convertible preferred securities and non-U.S. bonds are normally valued based on evaluations provided by pricing service providers that use broker dealer quotations, reported trades or valuation estimates from their internal pricing models. The service providers’ internal models use inputs that are observable such as issuer details, interest rates, yield curves, prepayment rates, credit risks/spreads, default rates and quoted prices for similar assets. Securities that use similar valuation techniques and inputs to those described above are typically categorized as Level 2 of the fair value hierarchy.
Fixed income securities purchased on a delayed-delivery basis are marked to market daily until their settlement at the forward settlement date and are typically categorized as Level 2 of the fair value hierarchy.
Common stocks, exchange-traded funds and financial derivative instruments, such as futures contracts or options contracts that are traded on a national securities exchange, are stated at the last reported sale or settlement price on the day of valuation. To the extent these securities are actively traded and valuation adjustments are not applied, they are typically categorized as Level 1 of the fair value hierarchy. Valuation adjustments may be applied to certain securities that are solely traded on a foreign exchange to account for the market movement between the close of the foreign market and the close of the NYSE. These securities are valued using pricing service providers that consider the correlation of the trading patterns of the foreign security to the intraday trading in the U.S. markets for investments. Securities using these valuation adjustments are typically categorized as Level 2 of the fair value hierarchy. Preferred securities, equity linked notes and other equities traded on inactive markets or valued by reference to similar instruments are also typically categorized as Level 2 of the fair value hierarchy.
108
ASHMORE FUNDS
NOTES TO FINANCIAL STATEMENTS (CONTINUED)
October 31, 2013
Investments in registered open-end investment management companies will be valued based upon the NAVs of such investments and are categorized as Level 1 of the fair value hierarchy. Investments in privately held investment funds will be valued based upon the NAVs of such investments and are categorized as Level 2 of the fair value hierarchy.
Short-term investments having a maturity of 60 days or less are generally valued at amortized cost which approximates fair market value. These investments are categorized as Level 2 of the fair value hierarchy.
Over-the-counter derivative financial instruments, such as foreign currency contracts, options contracts, or swaps agreements, derive their value from underlying asset prices, indices, reference rates, and other inputs or a combination of these factors. These contracts are normally valued on the basis of broker dealer quotations or pricing service providers. Depending on the product and the terms of the transaction, the value of the financial derivative contracts can be estimated by a pricing service provider using a series of techniques, including simulation pricing models. The pricing models use inputs that are observed from actively quoted markets such as issuer details, indices, spreads, interest rates, curves, dividends and exchange rates. Financial derivatives that use similar valuation techniques and inputs as described above are categorized as Level 2 of the fair value hierarchy.
Investments and derivatives classified within Level 3 have significant unobservable inputs, as they trade infrequently or not at all. Level 3 instruments may include private equity and real estate investments, certain loan agreements, less-liquid corporate debt securities (including distressed debt instruments) and certain collateralized debt obligations. Also included in this category are options, government and sovereign obligations, government agency securities and corporate bonds for which independent broker prices are used and information relating to the inputs of the price models is currently unavailable.
5. Capital share transactions
Transactions in Class A shares for the year ended October 31, 2013, were as follows:
| | | | | | | | | | | | | | | | | | | | | | | | | | | | | | | | |
| Fund | | Shares
Sold | | | Proceeds from
Shares Sold | | | Shares from
Reinvested
Distributions | | | Proceeds from
Reinvestment
of
Distributions | | | Shares
Redeemed | | | Payments for
Shares
Redeemed | | | Net
Increase in
Shares | | | Net Increase
in Net Assets | |
| Ashmore Emerging Markets Corporate Debt Fund | | | 710,363 | | | $ | 6,846,098 | | | | 13,039 | | | $ | 123,616 | | | | (465,139 | ) | | $ | (4,413,161 | ) | | | 258,263 | | | $ | 2,556,553 | |
| | | | | | | | | |
| Ashmore Emerging Markets Local Currency Bond Fund | | | 282,350 | | | | 2,770,330 | | | | 3,689 | | | | 35,144 | | | | (98,449 | ) | | | (962,801 | ) | | | 187,590 | | | | 1,842,673 | |
| Ashmore Emerging Markets Currency Fund | | | - | | | | - | | | | 3 | | | | 32 | | | | - | | | | - | | | | 3 | | | | 32 | |
| Ashmore Emerging Markets Sovereign Debt Fund | | | 2,259 | | | | 24,335 | | | | 41 | | | | 454 | | | | (3,441 | ) | | | (36,639 | ) | | | (1,141 | ) | | | (11,850 | ) |
| Ashmore Emerging Markets Total Return Fund | | | 1,242,751 | | | | 12,347,740 | | | | 39,507 | | | | 382,927 | | | | (494,417 | ) | | | (4,782,377 | ) | | | 787,841 | | | | 7,948,290 | |
| | | | | | | | | |
| Ashmore Emerging Markets Equity Fund | | | 5,425 | | | | 50,890 | | | | 12 | | | | 109 | | | | (2,591 | ) | | | (25,666 | ) | | | 2,846 | | | | 25,333 | |
| Ashmore Emerging Markets Small-Cap Equity Fund | | | 301,343 | | | | 2,975,565 | | | | 983 | | | | 9,486 | | | | (301,708 | ) | | | (3,091,819 | ) | | | 618 | | | | (106,768 | ) |
109
ASHMORE FUNDS
NOTES TO FINANCIAL STATEMENTS (CONTINUED)
October 31, 2013
Transactions in Class C shares for the year ended October 31, 2013, were as follows:
| | | | | | | | | | | | | | | | | | | | | | | | | | | | | | | | |
| Fund | | Shares Sold | | | Proceeds
from Shares Sold | | | Shares from
Reinvested Distributions | | | Proceeds from
Reinvestment
of Distributions | | | Shares Redeemed | | | Payments for
Shares Redeemed | | | Net
Increase in Shares | | | Net Increase in Net Assets | |
| Ashmore Emerging Markets Corporate Debt Fund | | | 13,429 | | | $ | 128,953 | | | | 428 | | | $ | 4,030 | | | | (509 | ) | | $ | (4,968 | ) | | | 13,348 | | | $ | 128,015 | |
| | | | | | | | | |
| Ashmore Emerging Markets Local Currency Bond Fund | | | 37,354 | | | | 374,200 | | | | 217 | | | | 2,102 | | | | (25,842 | ) | | | (260,049 | ) | | | 11,729 | | | | 116,253 | |
| Ashmore Emerging Markets Currency Fund | | | - | | | | - | | | | 3 | | | | 30 | | | | - | | | | - | | | | 3 | | | | 30 | |
| Ashmore Emerging Markets Sovereign Debt Fund | | | - | | | | - | | | | 5 | | | | 44 | | | | - | | | | - | | | | 5 | | | | 44 | |
| Ashmore Emerging Markets Total Return Fund | | | 52,365 | | | | 527,664 | | | | 3,504 | | | | 34,185 | | | | (5,454 | ) | | | (51,078 | ) | | | 50,415 | | | | 510,771 | |
| | | | | | | | | |
| Ashmore Emerging Markets Equity Fund | | | - | | | | - | | | | 1 | | | | 8 | | | | - | | | | - | | | | 1 | | | | 8 | |
| Ashmore Emerging Markets Small-Cap Equity Fund | | | 1,845 | | | | 20,033 | | | | 9 | | | | 92 | | | | (921 | ) | | | (9,647 | ) | | | 933 | | | | 10,478 | |
Transactions in Institutional Class shares for the year ended October 31, 2013, were as follows: | |
| Fund | | Shares
Sold | | | Proceeds
from Shares
Sold | | | Shares from
Reinvested
Distributions | | | Proceeds from
Reinvestment
of
Distributions | | | Shares
Redeemed | | | Payments for
Shares
Redeemed | | | Net
Increase in
Shares | | | Net Increase
in Net Assets | |
| Ashmore Emerging Markets Corporate Debt Fund | | | 19,928,045 | | | $ | 194,087,256 | | | | 94,799 | | | $ | 939,546 | | | | (2,671,353 | ) | | $ | (25,988,876 | ) | | | 17,351,491 | | | $ | 169,037,926 | |
| | | | | | | | | |
| Ashmore Emerging Markets Local Currency Bond Fund | | | 5,455,443 | | | | 54,666,867 | | | | 257,352 | | | | 2,557,655 | | | | (4,120,416 | ) | | | (39,937,673 | ) | | | 1,592,379 | | | | 17,286,849 | |
| Ashmore Emerging Markets Currency Fund | | | 12 | | | | 107 | | | | 200,640 | | | | 1,871,728 | | | | (3,496,816 | ) | | | (32,641,109 | ) | | | (3,296,164 | ) | | | (30,769,274 | ) |
| Ashmore Emerging Markets Sovereign Debt Fund | | | 686,047 | | | | 7,600,107 | | | | 148,479 | | | | 1,562,404 | | | | (1,144,239 | ) | | | (12,112,298 | ) | | | (309,713 | ) | | | (2,949,787 | ) |
| Ashmore Emerging Markets Total Return Fund | | | 21,450,753 | | | | 207,158,741 | | | | 3,546,577 | | | | 33,967,541 | | | | (5,181,996 | ) | | | (51,371,847 | ) | | | 19,815,334 | | | | 189,754,435 | |
| | | | | | | | | |
| Ashmore Emerging Markets Equity Fund | | | 38,798 | | | | 349,904 | | | | 6,748 | | | | 55,109 | | | | (29 | ) | | | (262 | ) | | | 45,517 | | | | 404,751 | |
| Ashmore Emerging Markets Small-Cap Equity Fund | | | 1,755,330 | | | | 21,073,021 | | | | 88,117 | | | | 1,036,344 | | | | (632,637 | ) | | | (7,654,032 | ) | | | 1,210,810 | | | | 14,455,333 | |
110
ASHMORE FUNDS
NOTES TO FINANCIAL STATEMENTS (CONTINUED)
October 31, 2013
Capital shares
Class A or Class C shares are issued at the Fund’s relevant NAV per share plus any applicable sales charge for Class A shares. Institutional Class shares are issued at the Fund’s relevant NAV per share without a sales charge. Shares confer upon the holders the right to receive notice of and attend, speak and vote at general meetings of the Funds. The shares confer upon the holders the right to any or all dividends or distributions which the Trustees in their sole discretion may from time to time resolve to make or declare.
6. Investment transactions
For the year ended October 31, 2013, the aggregate costs of purchases and proceeds from sales of investments (including fully funded TRS and excluding short-term investments) for the Funds were as follows:
| | | | | | | | |
Fund | | Purchases | | | Sales | |
Ashmore Emerging Markets Corporate Debt Fund | | | $202,228,364 | | | | $36,463,089 | |
Ashmore Emerging Markets Local Currency Bond Fund | | | 98,473,989 | | | | 78,162,189 | |
Ashmore Emerging Markets Currency Fund | | | 7,240,707 | | | | 1,922,993 | |
Ashmore Emerging Markets Sovereign Debt Fund | | | 35,514,176 | | | | 31,485,166 | |
Ashmore Emerging Markets Total Return Fund | | | 578,925,013 | | | | 414,858,613 | |
Ashmore Emerging Markets Equity Fund | | | 8,880,026 | | | | 8,471,583 | |
Ashmore Emerging Markets Small-Cap Equity Fund | | | 43,344,416 | | | | 30,268,787 | |
7. Federal income taxes
No provision for U.S. federal income taxes has been made since each Fund’s policy is to comply with the requirements of Subchapter M of the Internal Revenue Code of 1986, as amended, applicable to regulated investment companies, and to distribute, each year, substantially all of its taxable income and capital gains to its shareholders.
For financial reporting purposes the Funds may periodically make reclassifications among components of capital accounts to reflect permanent differences between U.S. GAAP and taxable income. The reclassifications have no impact on the net assets of the Funds. During the year, revisions were also made to previously determined taxable income amounts. As a result, the following reclassifications were made to the Statements of Assets and Liabilities:
| | | | | | | | | | | | | | | | |
| Fund | | Paid in
Capital | | | Undistributed
Net
Investment
Income | | | Accumulated
Net Realized
Gain/Loss | | | Net
Unrealized
Appreciation/
Depreciation | |
| Ashmore Emerging Markets Corporate Debt Fund | | $ | (637) | | | $ | (285,113 | ) | | $ | 326,270 | | | $ | (40,520 | ) |
| Ashmore Emerging Markets Local Currency Bond Fund | | | 202,110 | | | | (1,873,159 | ) | | | 2,082,572 | | | | (411,523 | ) |
| Ashmore Emerging Markets Currency Fund | | | - | | | | (1,077,593 | ) | | | 1,077,593 | | | | - | |
| Ashmore Emerging Markets Sovereign Debt Fund | | | - | | | | 76 | | | | (76 | ) | | | - | |
| Ashmore Emerging Markets Total Return Fund | | | 130,575 | | | | (3,803,618 | ) | | | 4,041,338 | | | | (368,295 | ) |
111
ASHMORE FUNDS
NOTES TO FINANCIAL STATEMENTS (CONTINUED)
October 31, 2013
| | | | | | | | | | | | | | |
| Fund | | Paid in
Capital | | Undistributed
Net
Investment
Income | | | Accumulated
Net Realized
Gain/Loss | | | Net
Unrealized
Appreciation/
Depreciation | |
| Ashmore Emerging Markets Equity Fund | | - | | | (6,049) | | | | 6,049 | | | | - | |
| Ashmore Emerging Markets Small-Cap Equity Fund | | - | | | 21,434 | | | | (21,434) | | | | - | |
At October 31, 2013, the capital loss carryforwards for U.S. federal income tax purposes and their respective years of expiration were as follows:
| | | | |
| Fund | | October 31, 2019 | |
Ashmore Emerging Markets Currency Fund | | | $ (4,413 | ) |
The Regulated Investment Company Modernization Act of 2010 (the “Act”) was enacted on December 22, 2010. The Act makes changes to several tax rules affecting the Funds. In general, the provisions of the Act are effective for the Funds’ fiscal year ending October 31, 2013. Although the Act provides several benefits, including the unlimited carryover of future capital losses, there may be a greater likelihood that all, or a portion of a Fund’s pre-enactment capital loss carryovers may expire without being utilized, due to the fact that post-enactment capital losses are utilized before pre-enactment capital loss carryovers.
The following Funds have available capital loss carryforwards for which there is no expiration date:
| | | | |
| Fund | | Short-Term Capital Loss
Carryforward at October 31, 2013 | | Long-Term Capital Loss
Carryforward at October 31, 2013 |
Ashmore Emerging Markets Equity Fund | | $(942,923) | | $ - |
Ashmore Emerging Markets Currency Fund | | (44,625) | | (68,845) |
The Funds in the above two tables may offset future capital gains with these capital loss carryforwards.
The Funds are subject to the provisions of the Financial Accounting Standards Board (“FASB”) Accounting Standards Codification (“ASC”) Topic 740-10, Income Taxes. This standard provides guidance as to how uncertain tax positions should be recognized, measured, presented and disclosed in the Funds’ financial statements. The Funds recognize the tax benefits of uncertain tax positions only where the position is more-likely-than-not (i.e. greater than 50-percent) to be sustained assuming examination by a tax authority based on the technical merits of the position. In evaluating whether a tax position has met the recognition threshold, the Funds must presume that the position will be examined by the appropriate taxing authority that has full knowledge of all relevant information. A tax position that meets the more-likely-than-not recognition threshold is measured to determine the amount of benefit to recognize in the Funds’ financial statements. Income tax and related interest and penalties would be recognized by the Funds as tax expense in the statement of operations if the tax positions were deemed not to meet the more-likely-than-not threshold. The Funds analyze all open tax years for all major taxing jurisdictions. Open tax years are those that are open to examination by taxing authorities, as defined by the Statute of Limitations in each jurisdiction. The Funds have no examinations by tax authorities in progress. Management has analyzed the Funds’ tax positions, and has concluded that no liability for unrecognized tax benefits should be recorded related to uncertain tax positions. Further, Management is not aware of any tax positions for which it is reasonably possible that the total amounts of unrecognized tax benefits will significantly change in the next twelve months.
112
ASHMORE FUNDS
NOTES TO FINANCIAL STATEMENTS (CONTINUED)
October 31, 2013
As of October 31, 2013, the components of distributable taxable earnings, including temporary differences, were as follows:
| | | | | | | | | | | | | | | | | | | | |
| Fund | | Undistributed
Ordinary
Income | | | Undistributed
Long Term
Capital Gain | | | Accumulated
Capital
Losses and
Other | | | Unrealized
Appreciation
(Depreciation)
on Investments
and Foreign
Currencies | | | Total
Accumulated
Earning
(Deficit) | |
| Ashmore Emerging Markets Corporate Debt Fund | | | $ - | | | | $ - | | | | $(218,480) | | | | $(2,688,788) | | | | $(2,907,268) | |
| Ashmore Emerging Markets Local Currency Bond Fund | | | - | | | | - | | | | (104,274) | | | | (3,924,279) | | | | (4,028,553) | |
| Ashmore Emerging Markets Currency Fund | | | 622,022 | | | | - | | | | (143,128) | | | | (467,621) | | | | 11,273 | |
| Ashmore Emerging Markets Sovereign Debt Fund | | | 13,326 | | | | 821,553 | | | | (35,860) | | | | (534,447) | | | | 264,572 | |
| Ashmore Emerging Markets Total Return Fund | | | 7,790,206 | | | | 1,676,596 | | | | (653,567) | | | | (28,859,211) | | | | (20,045,976) | |
| Ashmore Emerging Markets Equity Fund | | | - | | | | - | | | | (943,327) | | | | 261,089 | | | | (682,238) | |
| Ashmore Emerging Markets Small-Cap Equity Fund | | | 1,549,360 | | | | 459,778 | | | | - | | | | 2,548,009 | | | | 4,557,147 | |
The taxable character of distributions paid during the fiscal year ended October 31, 2013, were as follows:
| | | | | | | | | | | | | | | | | | | | |
| | | Distributions From | | | | |
| Fund | | Ordinary
Income | | | Short-
Term
Capital
Gains | | | Long-Term
Capital
Gains | | | Return of
Capital | | | Total
Distributions
Paid | |
| Ashmore Emerging Markets Corporate Debt Fund | | | $4,151,090 | | | | $ 188,914 | | | | $ 94,032 | | | | $ 60,526 | | | | $4,494,562 | |
| Ashmore Emerging Markets Local Currency Bond Fund | | | 1,840,202 | | | | 170,289 | | | | 62,101 | | | | 1,647,588 | | | | 3,720,180 | |
| Ashmore Emerging Markets Currency Fund | | | 1,924,560 | | | | - | | | | - | | | | - | | | | 1,924,560 | |
| Ashmore Emerging Markets Sovereign Debt Fund | | | 1,617,246 | | | | 64,886 | | | | 61,828 | | | | - | | | | 1,743,960 | |
| Ashmore Emerging Markets Total Return Fund | | | 32,834,581 | | | | 2,162,733 | | | | 177,936 | | | | - | | | | 35,175,250 | |
| Ashmore Emerging Markets Equity Fund | | | 67,868 | | | | - | | | | - | | | | 6,780 | | | | 74,648 | |
| Ashmore Emerging Markets Small-Cap Equity Fund | | | 18,498 | | | | 1,154,277 | | | | 30,847 | | | | - | | | | 1,203,622 | |
The taxable character of distributions paid during the fiscal year ended October 31, 2012, were as follows:
| | | | | | | | | | | | | | | | | | | | |
| | | Distributions From | | | | |
| Fund | | Ordinary
Income | | | Short-Term
Capital
Gains | | | Long-Term
Capital
Gains | | | Return
of
Capital | | | Total
Distributions
Paid | |
| Ashmore Emerging Markets Corporate Debt Fund | | | $1,068,991 | | | | $ 66,324 | | | | $ - | | | | $ - | | | | $1,135,315 | |
| Ashmore Emerging Markets Local Currency Bond Fund | | | 1,649,340 | | | | 758,249 | | | | 77,545 | | | | 20,233 | | | | 2,505,367 | |
| Ashmore Emerging Markets Currency Fund | | | - | | | | - | | | | - | | | | - | | | | - | |
| Ashmore Emerging Markets Sovereign Debt Fund | | | 1,514,004 | | | | - | | | | - | | | | - | | | | 1,514,004 | |
| Ashmore Emerging Markets Total Return Fund | | | 9,666,192 | | | | - | | | | - | | | | - | | | | 9,666,192 | |
| Ashmore Emerging Markets Equity Fund | | | 101,642 | | | | - | | | | - | | | | 4,929 | | | | 106,571 | |
| Ashmore Emerging Markets Small-Cap Equity Fund | | | 39,065 | | | | 53,933 | | | | - | | | | - | | | | 92,998 | |
113
ASHMORE FUNDS
NOTES TO FINANCIAL STATEMENTS (CONTINUED)
October 31, 2013
8. Distributions to shareholders
The Ashmore Emerging Markets Corporate Debt Fund, Ashmore Emerging Markets Local Currency Bond Fund, Ashmore Emerging Markets Currency Fund, Ashmore Emerging Markets Sovereign Debt Fund and Ashmore Emerging Markets Total Return Fund declare distributions of their net investment income daily and pay such distributions monthly. The Ashmore Emerging Markets Equity Fund and Ashmore Emerging Markets Small-Cap Equity Fund declare and pay distributions of their net investment income at least quarterly.
Distributions of net realized capital gains, if any, are declared and paid at least annually. The Funds may also make a special distribution to comply with federal tax requirements. Income dividends and capital gains distributions determined in accordance with federal income tax regulations may differ from U.S. GAAP. Differences between tax regulations and U.S. GAAP may change the fiscal period in which income and capital items are recognized for tax and U.S. GAAP purposes. Examples of events that give rise to timing differences include wash sales, straddles and capital loss carryforwards. Further, the character of investment income and capital gains may be different for certain transactions under the two methods of accounting. Examples of characterization differences include the treatment of foreign currency transactions and swap transactions. As a result, income dividends and capital gain distributions declared during a fiscal period for federal tax purposes may differ significantly from the net investment income and realized capital gain reported on each Fund’s financial statements presented under U.S. GAAP. In general, to the extent that any differences which are permanent in nature result in over distributions to shareholders, the amount of the over distribution may be reported as return of capital. Temporary differences do not require reclassification. See note 7 for further details.
9. Derivative instruments and hedging activities
FASB ASC Topic 815-10 (“Topic 815-10”), Disclosures about Derivative Instruments and Hedging Activities, improves financial reporting about derivative instruments by requiring enhanced disclosures to enable investors to better understand how and why the Funds use derivative instruments, how these derivative instruments are accounted for and their effects on the Funds’ financial position and results of operations.
None of the derivatives held in the Funds have been designated as hedging instruments under Topic 815-10. A discussion of the strategies for these derivatives and their counterparty credit risk can be found below.
In accordance with Topic 815-10, the Funds record their trading-related derivative activities on a fair value basis (as described in Note 4) . Fair values represent the amount at which the instrument could be exchanged in a current transaction between willing parties, other than in a forced or liquidation sale.
The following disclosures contain information on how and why the Funds use derivative financial instruments; the credit-risk-related contingent features in certain derivative financial instruments; and how derivative financial instruments affect the Funds’ financial position, results of operations and cash flows. The location and fair value of these instruments on the Statements of Assets and Liabilities and the realized, and changes in unrealized, gains and losses on the Statements of Operations, are included in tables following each of the Fund’s Schedule of Investments and categorized by type of financial derivative contract.
(a) Options
Each Fund is subject to market risk in the normal course of pursuing its investment objectives. The Funds have entered into options to speculate on the price movements of the financial instrument underlying the option, for use as an economic hedge against certain equity positions held in a Fund’s portfolio holdings or for other investment purposes. Option contracts give a Fund the right, but not the obligation, to buy or sell within a limited time, a financial instrument, commodity or currency at a contracted price that may also be settled in cash, based on differentials between specified indices or prices.
114
ASHMORE FUNDS
NOTES TO FINANCIAL STATEMENTS (CONTINUED)
October 31, 2013
Options written obligate a Fund to buy or sell within a limited time, a financial instrument, commodity or currency at a contracted price that may also be settled in cash, based on differentials between specified indices or prices. Options written by a Fund may expose a Fund to the market risk of an unfavorable change in the financial instrument underlying the written option.
A Fund is exposed to counterparty risk from the potential that a seller or buyer of an option contract does not sell or purchase the underlying asset as agreed under the terms of the option contract. The maximum risk of loss from counterparty risk to a Fund holding a put or call option is generally the fair value of the contracts and the premiums paid to purchase its open option contracts. The risk of loss on call options sold by the Funds is potentially unlimited. A Fund considers the credit risk of the intermediary counterparties to its option transactions in evaluating potential credit risk.
Gains and losses associated with the valuation of options are recognized at fair value as the net change in unrealized appreciation/(depreciation) on investments in securities in the Statements of Operations. The premium on purchased put options exercised is subtracted from the proceeds of the sale of the underlying security or foreign currency in determining the realized gain or loss. The premium on purchased call options exercised is added to the cost of the securities or foreign currency purchased. Premiums paid on the purchase of options that expire unexercised are recorded as realized losses and are reflected in net realized gain/(loss) on investments in securities in the Statements of Operations.
For the year ended October 31, 2013, the Ashmore Emerging Markets Local Currency Bond Fund, Ashmore Emerging Markets Currency Fund and Ashmore Emerging Markets Total Return Fund had average contract notional exposures of $46,468, $27,916, and $158,958, respectively, related to options contracts.
(b) Forward foreign currency exchange contracts
A forward foreign exchange contract involves an obligation to purchase or sell a specific currency at a future date at a price set at the time the contract is made. The Funds have entered into forward foreign currency exchange contracts in connection with settling planned purchases or sales of securities, as part of an investment strategy to protect against uncertainty in the level of future foreign exchange rates in the purchase and sale of securities, or to gain exposure to foreign currencies. All forward foreign currency exchange contracts are valued daily at the applicable exchange rates. Any resulting unrealized gains or losses are recorded in net change in unrealized appreciation/(depreciation) on forward foreign currency exchange contracts in the Statements of Operations. A Fund records realized gains or losses at the time the forward foreign exchange contract is offset by entering into a closing transaction with the same counterparty or is extinguished by delivery of the currency. Realized gains or losses, if any, are included in net realized gain/(loss) on forward foreign exchange contracts in the Statements of Operations.
Risks arise upon entering into these contracts from the potential inability of counterparties to meet the terms of their contracts and from unanticipated movements in the value of a foreign currency relative to the U.S. dollar. The contractual amounts of forward foreign currency exchange contracts do not necessarily represent the amounts potentially subject to risk. The measurement of the risks associated with these instruments should be considered in light of all related and offsetting transactions. The Funds bear market risk from changes in foreign currency exchange rates and credit risk if the counterparty fails to perform. Further information on the impact of these positions on the Funds’ financial statements can be found in the notes to the schedules of investments.
For the year ended October 31, 2013, the Ashmore Emerging Markets Corporate Debt Fund, Ashmore Emerging Markets Local Currency Bond Fund, Ashmore Emerging Markets Currency Fund, Ashmore Emerging Markets Total Return Fund, Ashmore Emerging Markets Small-Cap Equity Fund and Ashmore Emerging Markets Equity Fund had average contract notional exposures of $2,781,468, $162,978,022, $155,780,676, $420,404,358, $203,166 and $75,844, respectively, related to forward foreign currency exchange contracts.
115
ASHMORE FUNDS
NOTES TO FINANCIAL STATEMENTS (CONTINUED)
October 31, 2013
(c) Futures contracts
Futures contracts obligate the buyer to take and the seller to make delivery at a future date of a specified quantity of a financial instrument or an amount of cash based on the value of securities indices, commodities or the fair value in U.S. dollars of a foreign currency.
The Funds’ participation in the futures markets involves certain risks, including the imperfect correlation between movements in the price of the futures contracts and movements in the price of the underlying securities. Risks may arise from the potential inability of a counterparty to meet the terms of the contract. Credit risk is mitigated to the extent that the exchange on which a particular futures contract is traded assumes the risk of a counterparty defaulting on its obligations under the contract.
At the time the Funds enter into a futures contract, the Funds deposit and maintain as collateral initial margin with the broker, as required by the exchange on which the transaction is effected. Pursuant to the contract, the Funds agree to receive from or pay to the broker an amount of cash equal to the fluctuation in the value of the contract. Such receipts or payments are determined by the rules of the futures exchange and are known as variation margin. When the contract is closed, the Funds record a realized gain or loss equal to the difference between the value of the contract at the time it was opened and the time it was closed. This amount is included in net realized gain or loss on futures contracts in the Statement of Operations. Any unrealized gains or losses on open futures contracts are included in net change in unrealized appreciation/(depreciation) on futures contracts in the Statement of Operations.
For the year ended October 31, 2013, the Ashmore Emerging Markets Local Currency Bond and Ashmore Emerging Markets Total Return Funds had an average notional long/(short) exposure of $1,120,546 and $1,935,488, respectively, related to futures contracts.
(d) Interest rate swaps
During the reporting period, certain Funds entered into interest rate swaps, which are arrangements between two parties to exchange cash flows based on a notional principal amount, to manage the Funds’ exposure to interest rates. Interest rate swaps are marked to market daily and the change in fair value, if any, is recorded as unrealized gain or loss. Payments made or received are recorded as part of realized gains and losses. Certain Funds could be exposed to credit or market risk due to unfavorable changes in the fluctuation of interest rates or if the counterparty defaults on its obligations to perform.
Interest rate swaps are recorded at their fair value. The fair value is based on quoted market prices or prices obtained from a third party provider at the date of the Statements of Assets and Liabilities without any deduction for estimated future selling costs. The periodic payments on the swap agreements entered into by the Funds are reflected in the Statement of Operations within net realized gain/(loss) on interest rate swap contracts. Unrealized gains are reported as an asset and unrealized losses are reported as a liability in the Statements of Assets and Liabilities. Changes in the fair value are reflected in the Statements of Operations within net change in unrealized appreciation/(depreciation) on interest rate swap contracts in the period in which they occur.
For the year ended October 31, 2013, the Ashmore Emerging Markets Local Currency Bond and Ashmore Emerging Markets Total Return Funds had average notional exposures of $6,866,090 and $11,039,567, respectively, related to interest rate swap contracts.
10. Related parties
Investment management fees
The Trust has an Investment Management Agreement (the “Agreement”) with the Investment Manager, with whom certain officers and directors of the Trust are affiliated, to furnish investment management services to the
116
ASHMORE FUNDS
NOTES TO FINANCIAL STATEMENTS (CONTINUED)
October 31, 2013
Funds. Under the terms of the Agreement, the Trust, on behalf of the Funds, compensates the Investment Manager for its investment management services at the following rates, based on each Fund’s average daily net assets:
| | |
Fund | | Rate |
Ashmore Emerging Markets Corporate Debt Fund | | 1.15% |
Ashmore Emerging Markets Local Currency Bond Fund | | 0.95% |
Ashmore Emerging Markets Currency Fund | | 0.85% |
Ashmore Emerging Markets Sovereign Debt Fund | | 0.90% |
Ashmore Emerging Markets Total Return Fund | | 1.00% |
Ashmore Emerging Markets Equity Fund | | 1.15% |
Ashmore Emerging Markets Small-Cap Equity Fund | | 1.50% |
The Investment Manager has contractually agreed to waive its fees or reimburse each Fund for other expenses until February 28, 2014, to the extent that total operating expenses (other than acquired fund fees and expenses, interest expenses, taxes, extraordinary expenses and certain credits and offset arrangements) for each class of shares of each Fund exceed the rates in the table below, based on each Fund’s average daily net assets. The expense limitation arrangement may be terminated by the Board at any time.
| | | | | | |
| Fund | | Class A | | Class C | | Institutional
Class |
Ashmore Emerging Markets Corporate Debt Fund | | 1.45% | | 2.20% | | 1.17% |
Ashmore Emerging Markets Local Currency Bond Fund | | 1.25% | | 2.00% | | 0.97% |
Ashmore Emerging Markets Currency Fund | | 1.15% | | 1.90% | | 0.87% |
Ashmore Emerging Markets Sovereign Debt Fund | | 1.20% | | 1.95% | | 0.92% |
Ashmore Emerging Markets Total Return Fund | | 1.30% | | 2.05% | | 1.02% |
Ashmore Emerging Markets Equity Fund | | 1.45% | | 2.20% | | 1.17% |
Ashmore Emerging Markets Small-Cap Equity Fund | | 1.80% | | 2.55% | | 1.52% |
117
ASHMORE FUNDS
NOTES TO FINANCIAL STATEMENTS (CONTINUED)
October 31, 2013
Any such waiver or reimbursement is subject to the Investment Manager’s right to recover amounts waived or reimbursed to the extent actual fees and expenses for a future fiscal period are less than each Fund’s expense limitation cap, provided, however, that the Investment Manager shall only be entitled to recover such amounts waived or reimbursed during the previous three fiscal years. The total amounts subject to recovery in future years are shown below:
| | | | | | | | | | | | | | | | |
| | | Expiration Date October 31, | | | | |
Fund | | 2014 | | | 2015 | | | 2016 | | | Total | |
Ashmore Emerging Markets Corporate Debt Fund | | $ | 288,226 | | | $ | 209,250 | | | $ | 223,515 | | | $ | 720,991 | |
Asmore Emerging Markets Local Currency Bond Fund | | | 317,796 | | | | 274,477 | | | | 212,015 | | | | 804,288 | |
Ashmore Emerging Markets Currency Fund | | | 301,223 | | | | 258,326 | | | | 194,284 | | | | 753,833 | |
Ashmore Emerging Markets Sovereign Debt Fund | | | 284,198 | | | | 230,499 | | | | 173,356 | | | | 688,053 | |
Ashmore Emerging Total Return Fund | | | 314,416 | | | | 452,094 | | | | 619,476 | | | | 1,385,986 | |
Ashmore Emerging Markets Equity Fund | | | 136,121 | | | | 253,176 | | | | 147,340 | | | | 536,637 | |
Ashmore Emerging Markets Small-Cap Equity Fund | | | 111,464 | | | | 225,857 | | | | 158,906 | | | | 496,227 | |
Subadviser fees
For the services provided, the Investment Manager pays the Subadviser at the following rates, based on each Fund’s average daily net assets:
| | |
Fund | | Institutional Class |
Ashmore Emerging Markets Equity Fund | | 0.92% |
Ashmore Emerging Markets Small-Cap Equity Fund | | 1.20% |
Distribution fees
The Funds have adopted Amended Plans of Distribution and Servicing Fees pursuant to Rule 12b- 1 under the 1940 Act (“Distribution and Servicing Fee Plans”). Under the Distribution and Servicing Fee Plans, each of the Funds may pay fees to the distributor on an ongoing basis as compensation for the services the distributor renders and the expenses it bears in connection with the sale and distribution of Fund shares (“distribution fees”) and/or in connection with personal services rendered to Fund shareholders and the maintenance of shareholder accounts (“servicing fees”). Class A and C shares each have a separate 12b-1 Plan. Class A shares pay only servicing fees. Class C shares pay both distribution and servicing fees. The following table lists the maximum annual rates at which the distribution and/or servicing fees may be paid under each 12b-1 Plan (calculated as a percentage of a Fund’s average daily net assets attributable to the particular class of shares):
| | | | |
| | | Servicing Fee | | Distribution Fee |
Class A shares | | 0.25% | | None |
Class C shares | | 0.25% | | 0.75% |
Investor Ownership
On November 19, 2010, Ashmore Emerging Markets Corporate Debt Fund, Ashmore Emerging Markets Local Currency Bond Fund, Ashmore Emerging Markets Currency Fund, Ashmore Emerging Markets Sovereign Debt Fund and Ashmore Emerging Markets Total Return Fund were seeded. On June 22, 2011, Ashmore Emerging Markets Equity Fund was seeded. On October 4, 2011, Ashmore Emerging Markets Small-Cap Equity Fund was seeded. Each of the Funds was seeded by Ashmore Investments UK Limited, the parent of the Investment Manager. Ashmore Investments UK Limited seeded each Fund with $10 million, except the Ashmore Emerging Markets Total Return Fund, which was seeded with $20 million.
118
ASHMORE FUNDS
NOTES TO FINANCIAL STATEMENTS (CONTINUED)
October 31, 2013
As of October 31, 2013, Ashmore Investments UK Limited owned the following percentages of outstanding shares of each Fund:
| | |
| Fund | | Institutional Class |
Ashmore Emerging Markets Equity Fund | | 65.70% |
Ashmore Emerging Markets Small-Cap Equity Fund | | 61.77% |
In addition to the Ashmore Investments UK Limited ownership, shown in the table above, the following Funds had other investors owning greater than 5% of the outstanding shares of such Funds:
| | | | | | |
| Fund | | Class | | # of Investors
Owning > 5%
of outstanding
Shares | | % of Ownership by Investor |
| | | | | | | 26.78%, 25.53%, |
Ashmore Emerging Markets Corporate Debt Fund | | Class A | | 4 | | 5.97%, 5.23% |
| | | | | | | 20.56%, 17.70%, |
| | | | | | | 16.16%, 16.03%, |
| | | Class C | | 7 | | 10.44%, 6.80%, 6.69% |
| Ashmore Emerging Markets Local Currency Bond Fund | | Class A | | 4 | | 24.11%, 13.14%, 10.41%, 6.75% |
| | | | | | | 18.75%, 18.23%, |
| | | | | | | 15.61%, 12.02%, |
| | | Class C | | 7 | | 9.80%, 7.71%, 5.28% |
| | | | | | | 35.59%, 28.43%, |
| | | Class I | | 4 | | 8.12%, 6.15% |
Ashmore Emerging Markets Currency Fund | | Class A | | 1 | | 100.00% |
| | | Class C | | 1 | | 100.00% |
| | | Class I | | 2 | | 80.14%, 16.28% |
Ashmore Emerging Markets Sovereign Debt Fund | | Class A | | 2 | | 75.09%, 24.91% |
| | | Class C | | 1 | | 100.00% |
| | | Class I | | 1 | | 99.63% |
Ashmore Emerging Markets Total Return Fund | | Class A | | 2 | | 10.34%, 5.56% |
| | | | | 5 | | 21.79%, 10.17%, |
| | | Class C | | | | 6.88%, 5.09% 5.04% |
| | | | | | | 30.40%, 12.02%, |
| | | | | | | 9.26%, 5.99%, 5.69%, |
| | | Class I | | 6 | | 5.40% |
Ashmore Emerging Markets Equity Fund | | Class A | | 2 | | 49.87%, 39.85% |
| | | Class C | | 1 | | 100.00% |
| | | Class I | | 3 | | 65.70%, 16.06%, 9.70% |
| | | | | | | 41.82%, 20.68%, |
Ashmore Emerging Markets Small-Cap Equity Fund | | Class A | | 4 | | 17.00%, 16.52% |
| | | Class C | | 2 | | 89.76%, 10.24% |
| | | | | | | 61.77%, 21.42%, |
| | | Class I | | 3 | | 11.90% |
119
ASHMORE FUNDS
NOTES TO FINANCIAL STATEMENTS (CONTINUED)
October 31, 2013
11. Financial instruments with off-balance sheet risk and concentration of credit risk
Derivative financial instruments may result in off-balance sheet market and credit risk. Market risk is the possibility that future changes in market price may make a financial instrument less valuable. If the markets should move against one or more positions that the Funds hold, the Funds could incur losses greater than the unrealized amounts recorded in the Statements of Assets and Liabilities.
Credit risk is the risk that the counterparty will default and fail to fulfill the terms of the agreement.
Derivative risk exposures are discussed in note 9.
12. Recent accounting pronouncements
In June 2013, the Financial Accounting Standard Board (“FASB”) issued Accounting Standards Update (“ASU”) 2013-08, Amendments to the Scope, Measurement and Disclosure Requirements (“ASU 2013-08”), modifying Accounting Standards Codification (“ASC”) 946. The modifications were a result of a joint effort by the FASB and the International Accounting Standards Board to develop a consistent approach for determining whether an entity is an investment company for which fair value of investments is the most relevant measurement. ASU 2013-08 requires reporting entities to disclose that it is an investment company and is applying the guidance as set forth in ASC 946, to disclose any changes in, and the reasons for, its status as an investment company and to disclose information related to whether it has provided or is contractually required to provide financial support to any of its investees. The effective date of ASU 2013-08 is for interim and annual periods beginning after December 15, 2013. At this time, the Fund’s management is evaluating the implications of this requirement and the impact it will have on the Fund’s financial statement footnote disclosures, if any.
13. Subsequent events
On November 5, 2013, the Trust launched the Emerging Markets Frontier Equity Fund Institutional Share Class.
Management has evaluated subsequent events for the Funds through the date the financial statements were issued, and has concluded that there are no identified subsequent events relevant for financial statement adjustment or disclosure, other than the items mentioned above.
120

KPMG LLP
Aon Center
Suite 5500
200 E. Randolph Drive
Chicago, IL 60601-6436
Report of Independent Registered Public Accounting Firm
The Board of Trustees and Shareholders
Ashmore Funds:
We have audited the accompanying statements of assets and liabilities of Ashmore Emerging Markets Corporate Debt Fund, Ashmore Emerging Markets Local Currency Bond Fund, Ashmore Emerging Markets Currency Fund, Ashmore Emerging Markets Sovereign Debt Fund, Ashmore Emerging Markets Total Return Fund, Ashmore Emerging Markets Equity Fund, and Ashmore Emerging Markets Small-Cap Equity Fund (Funds within Ashmore Funds), including the schedules of investments, as of October 31, 2013, and the related statements of operations for the year then ended, the statements of changes in net assets for each of the years in the two-year period ended October 31, 2013, and the financial highlights for each of the years or periods in the three-year period ended October 31, 2013. These financial statements and financial highlights are the responsibility of the Funds’ management. Our responsibility is to express an opinion on these financial statements and financial highlights based on our audits.
We conducted our audits in accordance with the standards of the Public Company Accounting Oversight Board (United States). Those standards require that we plan and perform the audit to obtain reasonable assurance about whether the financial statements and financial highlights are free of material misstatement. An audit includes examining, on a test basis, evidence supporting the amounts and disclosures in the financial statements. Our procedures included confirmation of securities owned as of October 31, 2013, by correspondence with custodian and brokers or other appropriate auditing procedures. An audit also includes assessing the accounting principles used and significant estimates made by management, as well as evaluating the overall financial statement presentation. We believe that our audits provide a reasonable basis for our opinion.
In our opinion, the financial statements and financial highlights referred to above present fairly, in all material respects, the financial position of the Funds as of October 31, 2013, the results of their operations for the year then ended, the changes in their net assets for each of the years in the two-year period then ended, and the financial highlights for each of the years or periods in the three-year period ended October 31, 2013, in conformity with U.S. generally accepted accounting principles.

Chicago, Illinois
December 23, 2013
KPMG LLP is a Delaware limited liability partnership,
the U.S. member firm of KPMG International Cooperative
(“KPMG International”), a Swiss entity.
ASHMORE FUNDS
SUPPLEMENTAL TAX INFORMATION
October 31, 2013
Capital Gain Distribution (Unaudited)
Pursuant to Section 852 of the Internal Revenue Code, the funds listed below designated the following as long term capital gain dividends for the year ended October 31, 2013:
| | | | |
Fund | |
| Long-Term Capital
Gain 15% |
|
Ashmore Emerging Markets Corporate Debt Fund | | | - | |
Ashmore Emerging Markets Local Currency Fund | | | - | |
Ashmore Emerging Markets Local Currency Bond Fund | | | 22,976 | |
Ashmore Emerging Markets Sovereign Debt Fund | | | 821,553 | |
Ashmore Emerging Markets Total Return Fund | | | 1,676,596 | |
Ashmore Emerging Markets Equity Fund | | | - | |
Ashmore Emerging Markets Small Cap Equity Fund | | | 459,778 | |
122
ASHMORE FUNDS
FOR MORE INFORMATION
As of October 31, 2013
PORTFOLIO HOLDINGS
The Ashmore Funds file their complete schedule of portfolio holdings with the Securities and Exchange Commission (“SEC”) for the first and third quarters of each fiscal year on Form N-Q. The Funds’ Forms N-Q are available on the SEC’s Web site at www.sec.gov. You may also review and obtain copies at the SEC’s Public Reference Room in Washington D.C. Information about the Public Reference Room may be obtained by calling 800-SEC-0330.
PROXY VOTING
Ashmore Funds’ Proxy Voting Policies and Procedures and each Fund’s portfolio securities voting record for the most recent 12-month period ended June 30 are available upon request and without charge by visiting the Ashmore Funds’ Web site at www.ashmoregroup.com or the SEC’s Web site at www.sec.gov or by calling 866-876-8294.
123
ASHMORE FUNDS
PRIVACY POLICY
We consider customer privacy to be a fundamental aspect of our relationships with shareholders and are committed to maintaining the confidentiality, integrity and security of our current, prospective and former shareholders’ personal information. To ensure our shareholders’ privacy, we have developed policies that are designed to protect this confidentiality, while allowing shareholders’ needs to be served.
Obtaining Personal Information In the course of providing shareholders with products and services, we may obtain non-public personal information about shareholders, which may come from sources such as account applications and other forms, from other written, electronic or verbal correspondence, from shareholder transactions, from a shareholder’s brokerage or financial advisory firm, financial adviser or consultant, and/or from information captured on our internet web sites.
Respecting Your Privacy As a matter of policy, we do not disclose any personal or account information provided by shareholders or gathered by us to non -affiliated third parties, except as required for our everyday business purposes, such as to process transactions or service a shareholder’s account, or as otherwise permitted by law. As is common in the industry, non-affiliated companies may from time to time be used to provide certain services, such as preparing and mailing prospectuses, reports, account statements and other information, and gathering shareholder proxies. We may also retain non-affiliated financial services providers to market our shares or products and we may enter into joint-marketing arrangements with them and other financial companies. We may also retain marketing and research service firms to conduct research on shareholder satisfaction. These companies may have access to a shareholder’s personal and account information, but are permitted to use this information solely to provide the specific service or as otherwise permitted by law. We may also provide a shareholder’s personal and account information to their respective brokerage or financial advisory firm, Custodian, and/or to their financial advisor or consultant.
Sharing Information with Third Parties We reserve the right to disclose or report personal information to non-affiliated third parties where we believe in good faith that disclosure is required under law to cooperate with regulators or law enforcement authorities, to protect our rights or property or upon reasonable request by any investee entity in which a shareholder has chosen to invest. Of course, we may also share your information with your consent.
Sharing Information with Affiliates We may share shareholder information with our affiliates in connection with our affiliates’ everyday business purposes, such as servicing a shareholder’s account, but our affiliates may not use this information to market products and services to you except in conformance with applicable laws or regulations. The information we share includes information about our experiences and transactions with a shareholder and may include, for example, a shareholder’s participation in one of the Funds or in other investment programs, a shareholder’s ownership of certain types of accounts, or other data about a shareholder’s transactions or accounts. Our affiliates, in turn, are not permitted to share shareholder information with non-affiliated entities, except as required or permitted by law.
Procedures to Safeguard Private Information We take seriously the obligation to safeguard shareholder non-public personal information. In addition to this policy, we have also implemented procedures that are designed to restrict access to a shareholder’s non-public personal information only to internal personnel who need to know that information in order to provide products or services to such shareholders. In addition, we have physical, electronic, and procedural safeguards in place to guard a shareholder’s non-public personal information.
Disposal of Confidential Records We will dispose of records, if any, that are knowingly derived from data received from a consumer reporting agency regarding a shareholder that is an individual in a manner that ensures the confidentiality of the data is maintained. Such records include, among other things, copies of consumer reports and notes of conversations with individuals at consumer reporting agencies.
124
ASHMORE FUNDS
OTHER INFORMATION
Administrator, Custodian and Transfer Agent
The Northern Trust Company
50 South LaSalle Street
Chicago, Illinois 60603
312-630-6000
Investment Manager
Ashmore Investment Management Limited
61 Aldwych
London WC2B 4AE
United Kingdom
44-20-3077-6000
Subadviser for Ashmore Emerging Markets Equity Fund
and Ashmore Emerging Markets Small-Cap Equity Fund
Ashmore Equities Investment Management (U.S.) L.L.C.
1001 19th Street North, 15th Floor
Arlington, Virginia 22209
703-243-8800
Distributor
Ashmore Investment Management (US) Corporation
122 East 42nd Street
New York, New York 10168
212-661-0061
Legal Counsel
Ropes & Gray LLP
Prudential Tower
800 Boylston Street
Boston, Massachusetts 02199
617-951-7000
Independent Trustees’ Counsel
Dechert LLP
One International Place
40th Floor
100 Oliver Street
Boston, Massachusetts 02110
617-728-7100
125
ASHMORE FUNDS
TRUSTEES AND OFFICERS
Set forth below is information about the Trustees and Officers of the Ashmore Funds. Each Trustee has served in that capacity since he or she was originally elected or appointed to the Board of Trustees. Each Trustee oversees a total of 7 portfolios in the Ashmore Funds. The Ashmore Funds’ Statement of Additional Information contains additional information about the Trustees and is available upon request and without charge by calling 866-876-8294.
INDEPENDENT TRUSTEES
| | | | | | | | | | |
Name, Address* and Age of Independent Trustee | | Positions(s)
Held with
Trust | | Term of Office
and Length of
Time Served | | Principal Occupation(s) During Past 5 Years | | Number of
Portfolios in
Fund Complex
Overseen by
Trustee | | Other Directorships Held by Trustee
During the Past 5 Years |
Yeelong Balladon (Age 55) | | Trustee | | Indefinite term; Trustee since inception | | Freshfields Bruckhaus Deringer (a law firm) from 1982 to 2009 (Partner from 1999). | | 7 | | Non-executive director since August 2010, Jasper Investments Limited; Non-executive director from May 2010 - February 2012, Pacnet Limited. |
Michael Chamberlin (Age 64) | | Trustee | | Indefinite term; Trustee since 2012 | | Executive Director, Emerging Markets Traders Association. | | 7 | | None |
George J. Gorman (Age 61) | | Trustee; Lead Independent Trustee | | Indefinite term; Trustee since inception | | George J. Gorman LLC (consulting firm) since December 2010; Ernst & Young LLP (an accounting firm) from July 1974 to July 2009 (Senior Partner from October 1988). | | 7 | | Trustee, Bank of America Money Market Funds Series Trust since June 2011. |
Affiliates of the Investment Manager may be deemed to control Jasper Investments Limited and Pacnet Limited. Employees and officers of affiliates of the Investment Manager may serve on the Boards of Jasper Investments Limited and Pacnet Limited.
Mr. Chamberlin serves as the Executive Director of the Emerging Markets Traders Association (“EMTA”). Mark Coombs is
Co-Chair of EMTA’s Board of Directors and the Investment Manager is a member of the EMTA. Mr. Coombs is the Investment Manager’s Chief Executive Officer.
126
ASHMORE FUNDS
TRUSTEES AND OFFICERS
INTERESTED TRUSTEES
| | | | | | | | | | |
Name, Address* and Age of Independent Trustee | | Positions(s)
Held with
Trust | | Term of Office
and Length of
Time Served | | Principal Occupation(s) During Past 5 Years | | Number of
Portfolios in
Fund Complex
Overseen by
Trustee | | Other Directorships Held by Trustee
During the Past 5 Years |
George Grunebaum(1) (Age 50) | | Trustee; Chairman of the Trustees; President and Chief Executive Officer | | Indefinite term; Trustee since inception | | Chief Executive Officer since November 2008, Ashmore Investment Management (US) Corporation; Portfolio Manager since November 2008, Ashmore Investment Manageme nt (US) Corporation. | | 7 | | Trustee, AEIM, since May 2011, Director, Ashmore Global Emerging Markets Fund, LTD from July 2006 to December 2012; Director, Ashmore Global Opportunities, Limited from October 2007 to August 2010. |
Martin Tully(2) (Age 51) | | Trustee | | Indefinite term; Trustee since inception | | A number of senior operational roles with the Ashmore Group plc since 2006, most recently focusing on the development of Ashmore’s overseas subsidiaries. Prior to Ashmore, various senior roles with Rothschild, Citigroup and HSBC. | | 7 | | Trustee of The Ashmore Foundation, the charitable arm of the Ashmore Group plc. |
| * | Each trustee may be contacted at 61 Aldwych, London WC2B 4AE, United Kingdom. |
| (1) | Mr. Grunebaum is an “interested person” of the Trust, as defined in Section 2(a)(19) of the 1940 Act, due to, among other things, his positions with the Distributor and its affiliates. |
| (2) | Mr. Tully is an “interested person” of the Trust, as defined in Section 2(a)(19) of the 1940 Act, due to his position with Ashmore Group plc, the parent company of Ashmore Investment Management Limited, and his interests in Ashmore Group plc. |
127
ASHMORE FUNDS
TRUSTEES AND OFFICERS
OFFICERS
| | | | | | |
Name, Address** and Age of Officer | | Positions(s) Held
with Trust | | Term of Office and
Length of Time
Served | | Principal Occupation(s) During Past 5 Years |
George Grunebaum (Age 50) | | Trustee, President and Chief Executive Officer | | Indefinite term; since inception | | Chief Executive Officer since November 2008, Ashmore Investment Management (US) Corporation; Portfolio Manager since November 2008, Ashmore Investment Management Limited. |
Michael Perman (Age 56) | | Secretary | | Indefinite term; since inception | | Company Secretary since March 2008, Ashmore Group plc. |
Alexandra Autrey (Age 37) | | Chief Legal Officer | | Indefinite term; since inception | | Global Head of Legal and Transaction Management, Ashmore Group plc, since January 2012; Deputy Head of Legal and Transaction Management, Ashmore Group plc, May 2008 - January 2012; Legal Counsel, Ashmore Group plc, May 2005 - May 2008. |
Christopher Tsutsui (Age 49) | | Treasurer and Principal Financial and Accounting Officer | | Indefinite term; since inception | | Head of Finance, Ashmore Group plc, since July 2012; Board Member, Ashmore Management Company Colombia S.A.S., since September 2011; Chief Financial Officer, Ashmore Investment Management (U.S.) Corporation, from November 2008 to June 2012. |
Stephen Hicks (Age 53) | | Chief Compliance Officer | | Indefinite term; since inception | | Group Head of Compliance since June 2010, Ashmore Group plc; Director of Group Compliance from February 2001 to October 2005 and Chief Compliance Officer from October 2005 to May 2010, 3i Group plc (a private equity firm). |
Owen Meacham (Age 42) | | Assistant Secretary | | Indefinite term; since inception | | Managing Attorney since May 2012, Senior Corporate Attorney from October 2007 to May 2012, The Northern Trust Company. |
Paul Robinson (Age 40) | | Assistant Chief Legal Officer | | Indefinite term; since June, 2011 | | Group Deputy Head of Legal and Transaction Management since August 2012, and Lawyer since September 2007, Ashmore Group plc. |
| * | Each Officer may be contacted at 61 Aldwych, London WC2B 4AE, United Kingdom. |
128
Item 2. Code of Ethics.
| (a) | The registrant has adopted a code of ethics that applies to its principal executive officer, principal financial officer, principal accounting officer or controller, or persons performing similar functions, regardless of whether these individuals are employed by the registrant or a third party (the “Code of Ethics”). |
| (c) | The registrant has not amended its Code of Ethics during the period covered by this report. However, Appendix A to the registrant’s Code of Ethics, which is Code of Ethics of Ashmore Investment Management Limited, was amended during the period covered by this report. |
| (d) | The registrant has not granted any waivers, including an implicit waiver, from any provisions of its Code of Ethics during the period covered by this report. |
Item 3. Audit Committee Financial Expert.
The registrant’s Board of Trustees has determined that the registrant has at least one “audit committee financial expert” (as defined in Item 3 of Form N-CSR), serving on its audit committee. George J. Gorman is the “audit committee financial expert” and is “independent” (as each term is defined in Item 3 of Form N-CSR).
Under applicable securities laws and regulations, a person who is determined to be an audit committee financial expert will not be deemed an “expert” for any purpose, including without limitation for purposes of Section 11 of the Securities Act of 1933, as amended, as a result of being designated or identified as an audit committee financial expert. The designation or identification of a person as an audit committee financial expert does not impose on such person any duties, obligations, or liability that are greater than the duties, obligations, and liability imposed on such person as a member of the registrant’s Audit Committee and Board of Trustees in the absence of such designation or identification. The designation or identification of a person as an audit committee financial expert does not affect the duties, obligations or liability of any other member of the registrant’s Audit Committee or Board of Trustees.
3
Item 4. Principal Accountant Fees and Services.
Item 4(a): Audit Fees
The aggregate fees billed for each of the last two fiscal years for professional services rendered by KPMG LLP (“KPMG”), independent registered public accounting firm, for the audit of the registrant’s annual financial statements or services that are normally provided by the accountant in connection with statutory and regulatory filings or engagements for those fiscal years are $189,000 in 2013 and $188,300 in 2012.
Item 4(b): Audit-Related Fees
The aggregate fees billed in each of the last two fiscal years for assurance and related services by KPMG that are reasonably related to the performance of the audit of the registrant’s financial statements and are not reported under paragraph (a) of this Item are NONE.
Item 4(c): Tax Fees
The aggregate fees billed in each of the last two fiscal years for professional services rendered by KPMG for RIC tax compliance and diversification review and tax return review are $41,500 in 2013 and $26,500 in 2012.
Item 4(d): All Other Fees
The aggregate fees billed in each of the last two fiscal years for products and services provided by KPMG, other than the services reported in paragraphs (a) through (c) of this Item are NONE.
Item 4(e)(1): Pre-Approval Policies and Procedures
Pursuant to the registrant’s Audit Committee Charter adopted on November 17, 2010, the Audit Committee shall, to the extent required by applicable regulations, pre-approve (i) all audit and permitted non-audit services rendered by the independent auditors to a Fund and (ii) all non-audit services rendered by the independent auditors to a Fund’s investment adviser(s) (including any sub-advisers) and to certain of the investment adviser’s affiliates, as applicable. The Audit Committee may implement policies and procedures by which such services are pre-approved other than by the full Committee (for example, by the Committee chair).
Item 4(e)(2): Percentage of Fees Pre-Approved Pursuant to Waiver Provision of Paragraph (c)(7)(i)(C) of
Rule 2-01 of Regulation S-X
No percentage of the principal accountant’s fees or services were approved pursuant to the waiver provision of paragraph (c)(7)(i)(C) of Rule 2-01 of Regulation S-X.
Item 4(f): Work Performed by Persons Other than the Principal Accountant
Not applicable.
Item 4(g): Aggregate Non-Audit Fees Disclosure
The aggregate non-audit fees and services billed by KPMG for services rendered to the registrant and service affiliates for the last two fiscal years were $41,500 for 2013 and $26,500 for 2012.
Item 4(h): Non-Audit Services and Independent Accountant’s Independence
The registrant’s Audit Committee has considered whether the provision of non-audit services to service affiliates, not pre-approved pursuant to paragraph (c)(7)(ii) of Rule 2-01 of Regulation S-X, is compatible with maintaining the registered public accountant’s independence in performing audit services.
4
Item 5. Audit Committee of Listed Registrants.
Not applicable.
Item 6. Investments.
| (a) | The registrant has elected to include the schedule of investments in securities of unaffiliated issuers as part of the report to shareholders filed under Item 1 of this report on Form N-CSR. |
Item 7. Disclosure of Proxy Voting Policies and Procedures for Closed-End Management Investment Companies.
Not applicable.
Item 8. Portfolio Managers of Closed-End Management Investment Companies.
Not applicable.
Item 9. Purchases of Equity Securities by Closed-End Management Investment Company and Affiliated Purchasers.
Not applicable.
Item 10. Submission of Matters to a Vote of Security Holders.
There have been no material changes to the procedures by which shareholders may recommend nominees to the registrant’s Board of Trustees.
Item 11. Controls and Procedures.
| (a) | The registrant’s principal executive and principal financial officers, or persons performing similar functions, have concluded that the registrant’s disclosure controls and procedures (as defined in Rule 30a-3(c) under the Investment Company Act of 1940 (the “1940 Act”)) are effective, based on the evaluation of these controls and procedures required by Rule 30a-3(b) under the 1940 Act and Rules 13a-15(b) or 15d-15(b) under the Securities Exchange Act of 1934 as of a date within 90 days of the filing date of this report. |
| (b) | There were no changes in the registrant’s internal control over financial reporting (as defined in Rule 30a-3(d) under the 1940 Act) that occurred during the second fiscal quarter of the period covered by this report that have materially affected, or are reasonably likely to materially affect, the registrant’s internal control over financial reporting. |
5
Item 12. Exhibits.
| | |
| (a)(1) | | Exhibit 99.CODE: Code of Ethics pursuant to Item 2 of Form N-CSR. |
| |
| (a)(2) | | Exhibit 99.CERT: Certifications pursuant to Section 302 of the Sarbanes-Oxley Act of 2002. |
| |
| (a)(3) | | Not applicable. |
| |
| (b) | | Exhibit 99.906 CERT: Certifications pursuant to Section 906 of the Sarbanes-Oxley Act of 2002. |
6
SIGNATURES
Pursuant to the requirements of the Securities Exchange Act of 1934 and the Investment Company Act of 1940, the registrant has duly caused this report to be signed on its behalf by the undersigned, thereunto duly authorized.
Ashmore Funds
| | |
| By | | /s/ George Grunebaum |
| | George Grunebaum, President and
Chief Executive Officer |
| | (Principal Executive Officer) |
Date: January 3, 2014
Pursuant to the requirements of the Securities Exchange Act of 1934 and the Investment Company Act of 1940, this report has been signed below by the following persons on behalf of the registrant and in the capacities and on the dates indicated.
| | |
| By | | /s/ George Grunebaum |
| | George Grunebaum, President and
Chief Executive Officer |
| | (Principal Executive Officer) |
Date: January 3, 2014
| | |
| By | | /s/ Chris Tsutsui |
| | Chris Tsutsui, Treasurer |
| | (Principal Financial and Accounting Officer) |
Date: January 3, 2014
7