MainGate MLP Fund
Class A (AMLPX)
Class I (IMLPX)
6075 Poplar Avenue, Suite 720 | Memphis, TN 38119 | 855.MLP.FUND (855.657.3863) | w w w.maingatefunds.com
Semi-Annual Report
May 31, 2013
MainGate mlp fund
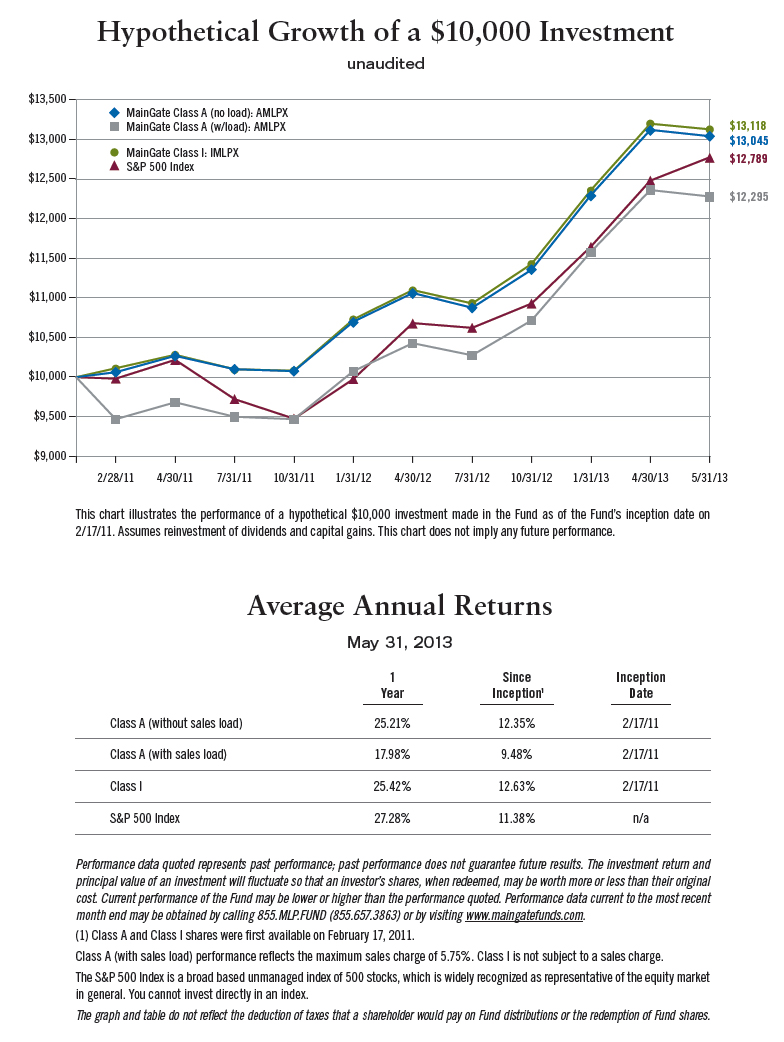
The MainGate MLP Fund had the following performance as of May 31, 2013.
| | CUMULATIVE RETURNS | | AVERAGE ANNUAL RETURNS |
| | 6 Months | Since Inception 2/17/11 | | 1 Year | Since Inception 2/17/11 |
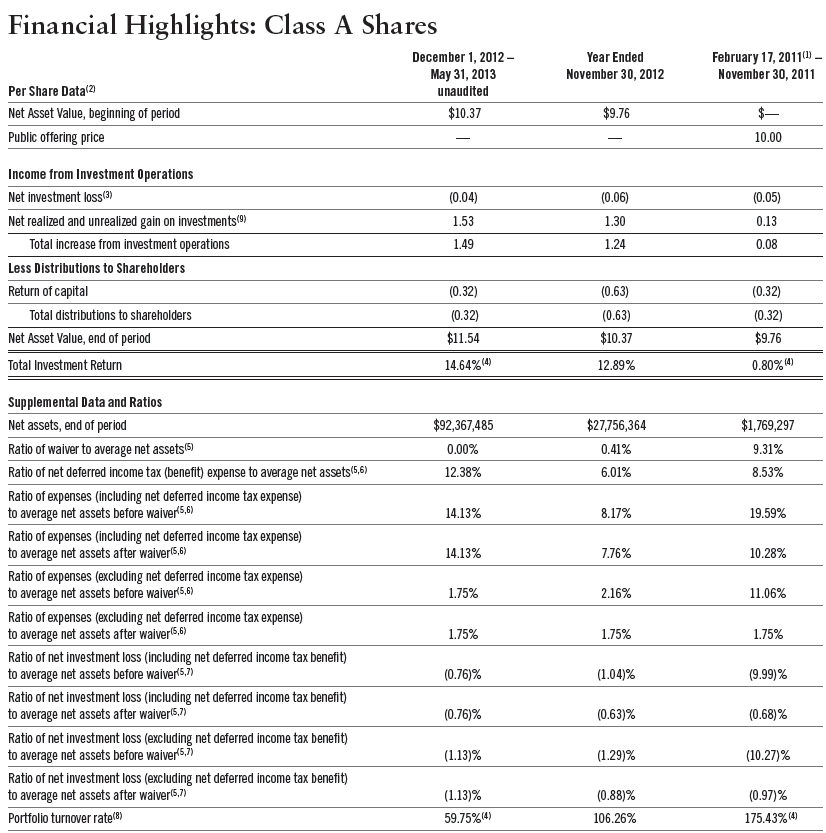
MainGate MLP Fund – Class A without load | 14.64% | 30.45% | | 25.21% | 12.35% |
MainGate MLP Fund – Class A with 5.75% load | 8.08% | 22.95% | | 17.98% | 9.48% |
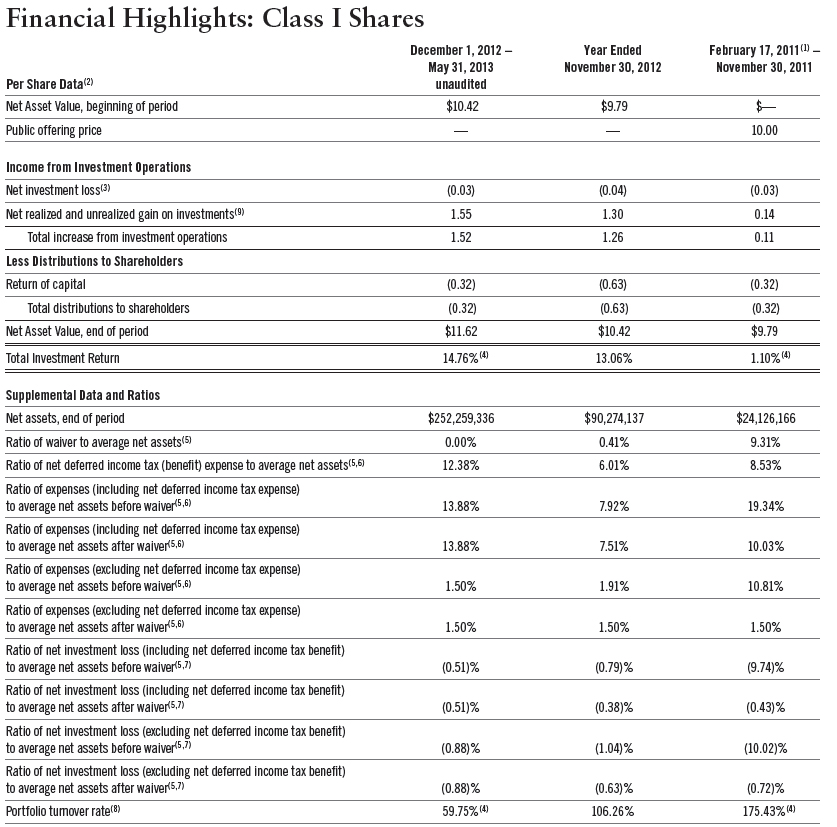
MainGate MLP Fund – Class I | 14.76% | 31.38% | | 25.42% | 12.63% |
S&P 500 Index | 16.43% | 27.89% | | 27.28% | 11.38% |
Gross Expense Ratio A Shares = 8.17% | Net Expense Ratio A Shares = 1.75% (excluding 6.01% Deferred Income Tax Expense) | Gross Expense Ratio I Shares = 7.92% | Net Expense Ratio I Shares = 1.50% (excluding 6.01% Deferred Income Tax Expense): The Fund’s adviser has contractually agreed to cap the Fund’s total annual operating expenses (excluding brokerage fees and commissions; Class A 12b-1 fees; borrowing costs; taxes, such as Deferred Income Tax Expense; and extraordinary expenses) at 1.50% through March 31, 2014. Deferred income tax expense/(benefit) represents an estimate of the Fund’s potential tax expense/(benefit) if it were to recognize the unrealized gains/(losses) in the portfolio. An estimate of deferred income tax expense/(benefit) depends upon the Fund’s net investment income/(loss) and realized and unrealized gains/(losses) on its portfolio, which may vary greatly on a daily, monthly and annual basis depending on the nature of the Fund’s investments and their performance. An estimate of deferred income tax expenses/(benefit) cannot be reliably predicted from year to year. The 6.01% deferred tax expense represents the performance impact of accrued deferred tax liabilities for the fiscal year ended November 30, 2012.
The performance data quoted represents past performance. Past performance is no guarantee of future results. The investment return and the principal value of an investment will fluctuate and shares, when redeemed, may be worth more or less than their original cost. Current performance may be lower or higher than the information quoted. To obtain performance information current to the most recent month- end please call 855.MLP.FUND (855.657.3863). Performance data shown with load reflects the Class A maximum sales charge of 5.75%. Performance data shown without load does not reflect the deduction of the sales load or fees. When reflected, the load or fee reduces the performance quoted.
The following discussion is based on our opinions and beliefs.
The Fund has benefitted from a positive market for midstream energy MLPs and from the current yield environment. The Federal Reserve continues to execute its program of Quantitative Easing which is designed to manage toward a lower overall yield environment. Yield investors are left with anemic choices from a variety of income alternatives as a result of the Fed’s policy.
We manage the Fund with a total return objective and believe that MLPs may provide total returns from yield, growth, and changes in valuation. As of 6/30/13, MLPs, as represented by the Alerian MLP Index, currently have an approximate 5.73% annual yield and a consensus estimated annual distribution growth of approximately 7%. MLPs typically grow distributable cash flow from three primary sources: (1) structural growth factors, (2) accretive acquisitions, and (3) organic growth projects.
Structural growth factors may include higher potential volumes of energy products through pipelines and storage facilities due to macroeconomic growth, plus possible rate increases from contractual or regulatory formulas. For example, interstate crude and refined product pipelines receive an annual rate increase (decrease) of Producer Price Index (“PPI”) + 2.65%. This would mean that in world of 2% PPI inflation, those pipelines would have a 4.65% rate increase.
SEMI-ANNUAL REPORT 2013 • 5
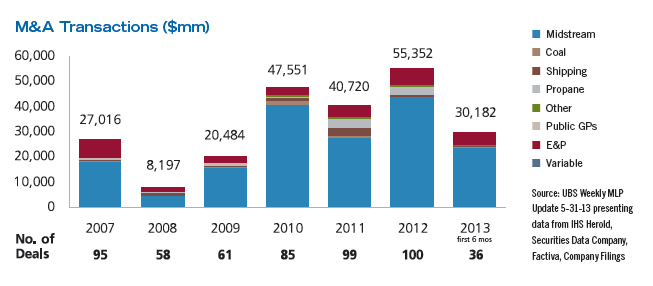
Accretive acquisitions have been a part of the MLP growth story for several years. Merger and Acquisition (“M&A”) activity has been robust in recent times, with MLPs engaged in more than $40 billion of M&A activity each of the previous three years. This year is off to another strong start with more than $30 billion announced as of May 31, 2013.
U.S. Shale Revolution
The most exciting part of the MLP story continues to be the long-term potential from organic growth projects tied to the ongoing U.S. shale revolution. While midstream MLPs serve the crude oil, natural gas and the natural gas liquids (“NGL”) markets, a discussion about the U.S. crude oil market may give investors a better understanding of the factors that influence our view relating to MLP organic growth projects tied to the crude oil market.
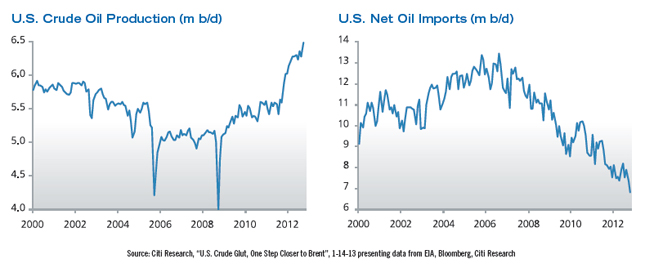
The U.S. is experiencing a shale production boom that began in earnest over five years ago. Since 2008, U.S. oil production is up 50%, and oil imports have dropped decisively. After years of U.S. oil production decline, the U.S. oil industry is growing production again — a lot.
6 | MainGate mlp fund
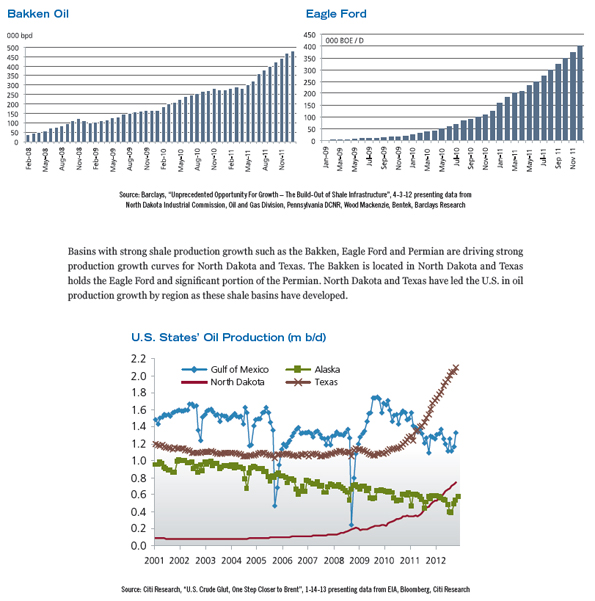
Production growth is being led by the Bakken Oil and Eagle Ford Shale basins. These basins have gone from little to no production to approximately 1 million barrels per day of oil production, and remain on an impressive growth trajectory.
SEMI-ANNUAL REPORT 2013 • 7
The shale production revolution has been so strong that the U.S. now leads the world in crude oil production growth, as shown below.
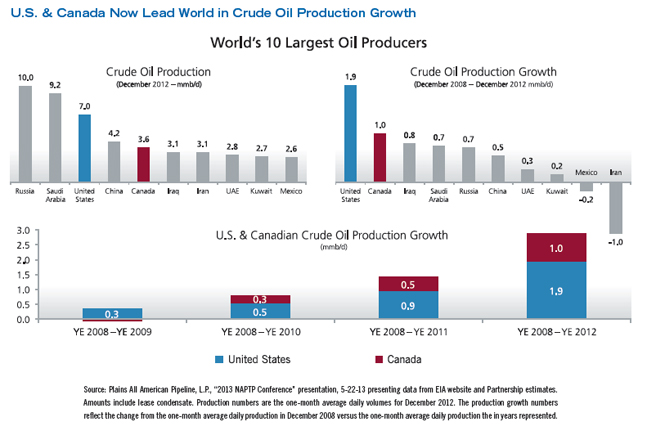
While U.S. crude oil production growth over the past five years has been impressive, a recent study estimates that by 2017, U.S. shale oil production could reach 5 million barrels per day compared to approximately 1.5 million barrels per day at the end of 2012, and that the U.S. may be on course to become the world’s largest oil producing country(1).
A commentator has suggested that mainstream growth forecasts from the U.S. Energy Information Administration’s (“EIA”) Short Term Energy Outlook, OPEC, and the International Energy Agency (“IEA”) have consistently been too conservative as actual U.S. production growth has significantly outperformed recent forecasts(2). U.S. production is up 1.2 million barrels per day over year ago levels, which exceeds the EIA and IEA forecasts by approximately 50% and OPEC’s by almost 100%(2).
This path is being influenced by many factors such as the improvement in various shale production techniques including the use of seismic technology, horizontal drilling, and hydraulic fracturing (“fracking”). The industry continues to evolve with better information on optimal well spacing and improved drilling, completion, and production techniques. These improvements are leading to changes in the level of drilling intensity.
| Leonardo Maugeri. “The Shale Oil Boom: A U.S. Phenomenon” Discussion Paper 2013-05, Belfer Center for Science and International Affairs, Harvard Kennedy School, June 2013. |
| Barclays Commodity Weekly, June 28, 2013. |
The level of drilling intensity is influenced by the overall size of the basin and the ultimate well spacing. It is estimated that the most productive oil areas of the Eagle Ford, Bakken, and Permian cover approximately 6,000, 9,000, and 12,000 square miles, respectively. Large operators in the Bakken and Eagle Ford have steadily tightened well spacing, and should this trend continue, there is the potential for over 100,000 producing wells across the Bakken, Eagle Ford and Permian basins(3). This is about ten times the number of wells already online(4).
In addition, there are other shale oil basins under development including the DJ Niobrara, Woodford, Utica, and the Tuscaloosa Marine. Time will tell how oil production in these other basins will progress.
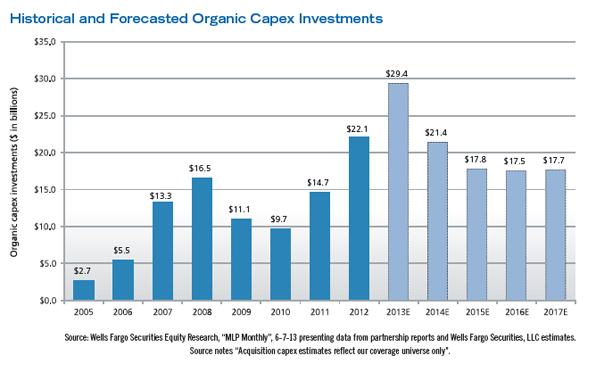
It is clear that the development of U.S. shale oil basins is off to a great start and MLPs are providing critical infrastructure to bring this production to market. MLPs were involved with over $20 billion of organic growth projects last year and are forecast to be involved with approximately $29 billion during 2013(5). Many projects are designed to provide needed infrastructure to support the development of shale energy basins.
The Fund’s portfolio has significant exposure to MLPs that we believe are leading the build-out of infrastructure needed to support the U.S. Shale Revolution. We look forward to the opportunities that lie ahead, and we thank you for your support.
Sincerely,
 |  |
Geoffrey P. Mavar, Chairman | Matthew G. Mead, CEO |
| Leonardo Maugeri, “The Shale Oil Boom: A U.S. Phenomenon” Discussion Paper 2013-05, Belfer Center for Science and International Affairs, Harvard Kennedy School, June 2013. |
| Leonardo Maugeri, “The Shale Oil Boom: A U.S. Phenomenon” Discussion Paper 2013-05, Belfer Center for Science and International Affairs, Harvard Kennedy School, June 2013. |
| Source: Wells Fargo Securities Equity Research, “MLP Monthly”, 6-7-13 presenting data from partnership reports and Wells Fargo Securities, LLC estimates. Source notes “Acquisition capex estimates reflect our coverage universe only”. |
SEMI-ANNUAL REPORT 2013 • 9
........................................................................................................................................................................
Past performance is not a guarantee of future results.
Opinions expressed are those of MainGate and are subject to change, are not guaranteed, and should not be considered investment advice.
The information contained in this report is authorized for use when preceded or accompanied by a prospectus.
Mutual fund investing involves risk. Principal loss is possible. The Fund is nondiversified, meaning it may concentrate its assets in fewer individual holdings than a diversified fund. Therefore, the Fund is more exposed to individual security price volatility than a diversified fund. The Fund will invest in Master Limited Partnerships (MLPs) which concentrate investments in the natural resource sector and are subject to the risks of energy prices and demand and the volatility of commodity investments. Damage to facilities and infrastructure of MLPs may significantly affect the value of an investment and may incur environmental costs and liabilities due to the nature of their business. MLPs are subject to significant regulation and may be adversely affected by changes in the regulatory environment. Investments in smaller companies involve additional risks, such as limited liquidity and greater volatility. Investments in foreign securities involve greater volatility and political, economic and currency risks and differences in accounting methods. MLPs are subject to certain risks inherent in the structure of MLPs, including complex tax structure risks, limited ability for election or removal of management, limited voting rights, potential dependence on parent companies or sponsors for revenues to satisfy obligations, and potential conflicts of interest between partners, members and affiliates.
Producer Price Index (PPI): Measures the average change over time in the selling prices received by domestic producers for their output.
Public GP: Refers to publicly traded shares of entities that own and control the general partner interest of an MLP.
E&P: Refers to Exploration and Production energy MLPs which are engaged in the exploration and production of oil and gas properties.
Distributable Cash Flow: Calculated as net income plus depreciation and other non-cash items, less maintenance capital expenditure requirements.
S&P 500 Index: A broad based unmanaged index of 500 stocks, which is widely recognized as representative of the equity market in general.
The Alerian MLP Index: A capitalization-weighted index of the 50 most prominent energy Master Limited Partnerships.
You cannot invest directly in an index.
Fund holdings and sector allocations are subject to change at any time and should not be considered a recommendation to buy or sell any security. Please refer to the schedule of investments for a complete listing of Fund holdings.
The Fund does not receive the same tax benefits of a direct investment in an MLP.
The Fund is subject to U.S. federal income tax on its taxable income at rates applicable to corporations (currently at a maximum rate of 35%) as well as state and local income taxes.
The Fund accrues deferred income taxes for future tax liabilities associated with the portion of MLP distributions considered to be a tax-deferred return of capital and for any net operating gains as well as capital appreciation of its investments. This deferred tax liability is reflected in the daily NAV and as a result the Fund’s after-tax performance could differ significantly from the underlying assets even if the pre-tax performance is closely tracked.
The potential tax benefits from investing in MLPs depend on MLPs being treated as partnerships for federal income tax purposes. If the MLP is deemed to be a corporation then its income would be subject to federal taxation, reducing the amount of cash available for distributions to the Fund which could result in a reduction of the Fund's value.
The MainGate MLP Fund is distributed by Quasar Distributors, LLC.