(Ticker Symbol: MUHLX)
ANNUAL REPORT
December 31, 2019
Phone: 1-800-860-3863
E-mail: fund@muhlenkamp.com
Website: http://muhlx.muhlenkamp.com/
Beginning on January 1, 2021, as permitted by regulations adopted by the SEC, paper copies of the Fund’s shareholder reports will no longer be sent by mail, unless you specifically request paper copies of the reports from the Fund (defined herein) or from your financial intermediary, such as a broker-dealer or bank. Instead, the reports will be made available on the Fund’s website (www.muhlx.muhlenkamp.com), and you will be notified by mail each time a report is posted and provided with a website link to access the report.
If you already elected to receive shareholder reports electronically, you will not be affected by this change and you need not take any action. You may elect to receive shareholder reports and other communications from the Fund by contacting your financial intermediary (such as a broker-dealer or bank) or, if you are a direct investor, by calling 1-800-860-3863 or by sending an e-mail request to fund@muhlenkamp.com.
You may elect to receive all future reports in paper free of charge. If you invest through a financial intermediary, you can contact your financial intermediary to request that you continue to receive paper copies of your shareholder reports. If you invest directly with the Fund, you can call 1-800-860-3863 or send an e-mail request to fund@muhlenkamp.com to let the Fund know you wish to continue receiving paper copies of your shareholder reports.Your election to receive reports in paper will apply to all funds held in your account if you invest through your financial intermediary.
This report is not authorized for distribution to prospective investors unless preceded or accompanied by a prospectus of the Muhlenkamp Fund. Please call 1-800-860-3863 for a current copy of the prospectus. Read it carefully before you invest.
January 2020
Fellow Investors,
The S&P 500® Index had a total return of 31.49% in 2019, the Russell 3000® Index rose 31.02%, the Dow Jones Industrial Average rose 25.30%, and the Muhlenkamp Fund increased by 14.39%. Why the difference? While recognizing the limitations of all generalizations, we would argue that there are two categories of companies that the market continues to award a premium to: very safe, defensive companies (think utilities and Real Estate Investment Trusts) and disruptive or high-growth companies (examples include Amazon, Tesla, and Mastercard). We own little of either category, so the market is bidding up stocks we mostly don’t own. We remain interested primarily in profitability over the longer term and the price at which we can buy it while the market appears to be less concerned than we are about profitability and pretty price insensitive for popular companies. We expect eventually the market will come back to our way of thinking, but it sure didn’t in 2019. On an absolute basis we had a good year, on a relative basis we did not.
Looking back over 2019 only two things really mattered much to the economy of all the things that hit the headlines: tariffs and the Federal Reserve. The imposition of tariffs on imported goods forced a re-evaluation of a lot of supply chains and was a headwind for businesses. The Fed reversed the direction of policy in January: shifting from raising rates and reducing their balance sheet to lowering rates and expanding their balance sheet. This avoided a problem: when the Fed is raising rates and pulling money out of the economy by shrinking the balance sheet, sooner or later highly indebted companies have a problem rolling over their debt. This is the concern we voiced over two years ago when they began this “tightening.” Now that they’ve reversed themselves our longstanding concern is deferred to a later date to be replaced by worries that higher inflation is now more likely. There is no free lunch. On average, the economy continued to grow at a modest pace, but if you look at it by sector the results were mixed. Housing improved, but industrial production declined. Energy was weak due to low oil prices, retail was a mixed bag, etc. Inflation remained low. Unemployment continued its downtrend and median wages picked up. We spoke on a number of occasions during the year about the areas where we see warning signs and areas that look pretty good. It’s been a mixed bag all year and remains so at year end.
Looking forward, what do we expect? We think the point of maximum uncertainty in trade rules is behind us and businesses will stop postponing strategic decisions. If inflation remains low, the Fed will keep short-term interest rates low and market-based long-term interest would also stay low. Rising inflation would be a problem for stock and bond markets and force some hard decisions on the Fed—we have no strong opinion on the direction of inflation in 2020. We’ll be watching measures of industrial activity closely, a further or extended decline would be worrisome. We will
also watch credit metrics closely—they look pretty good right now. Our baseline is for continued moderate economic growth in the U.S. and we’ll let you know if we are seeing signs of a further slowdown or acceleration.
The bull market in stocks has run for a decade now and there are portions of the market that look expensive to us. Safety, disruption, and high growth are all attributes of companies that have been bid up. Momentum seems to have legs in this market as well, perhaps because of the increased use of market-cap-weighted Exchange Traded Funds. As our holdings become fairly valued, we’ll pay more attention to the price trend, selling when it appears to be rolling over. We continue to hunt for the underappreciated and thus cheap stocks and will buy them when we find them.
Sincerely,
 |  |
| Ron Muhlenkamp, Founder | Jeff Muhlenkamp, Co-Manager |
| Muhlenkamp & Company, Inc. | Muhlenkamp & Company, Inc. |
The comments made in this letter are opinions and are not intended to be investment advice or a forecast of future events.
Dow Jones Industrial Average (DJIA) is one of several stock market indices, created by 19th century Wall Street Journal editor Charles Dow to gauge the performance of the industrial sector of the American stock market. The DJIA consists of 30 of the largest and most widely held public companies in the United States. Note the “industrial” portion of the name is largely historical; many of the 30 modern companies have little to do with traditional heavy industry. You cannot invest directly in an index.
Russell 3000® Index acts as a benchmark of the performance of stock prices for 3,000 of the largest publicly traded companies in the U.S. stock market, as measured by market capitalization. The stocks represented in the index are only updated every June to take a snapshot of the current stock market, therefore the index is passively managed except for its annual reconstitution. You cannot invest directly in an index.
S&P 500® Index is a widely recognized, unmanaged index of common stock prices. The S&P 500® Index is weighted by market value and its performance is thought to be representative of the stock market as a whole. You cannot invest directly in an index.
Mutual fund investing involves risk. Principal loss is possible. The Fund may invest in small- and mid-cap companies which involve additional risks such as limited liquidity and greater volatility. The Fund may also invest in foreign securities which involve political, economic, and currency risks, greater volatility and differences in accounting methods. Investments in debt securities typically decrease in value when interest rates rise. This risk is usually greater for longer-term debt securities.
Past performance is no guarantee of future results. Diversification does not assure a profit or protect against a loss in a declining market.
Fund holdings are subject to change and are not recommendations to buy or sell any security. Please see page 16 for a complete list of Fund holdings.
References to other mutual funds should not be considered an offer of those securities.
Management Discussion of Fund Performance for 2019
| (Unaudited) | January 17, 2020 |
For the year ending December 31, 2019 the Muhlenkamp Fund returned 14.39% before taxes, underperforming the S&P 500® Index which had a total return of 31.49% over the same period.
On average during the year, the Fund was overweight Information Technology, Healthcare, Industrials, and Materials and underweight Consumer Discretionary, Energy, Financials, Communication Services, Consumer Staples, Utilities, and Real Estate relative to the sector weighting of our benchmark the S&P 500® Index.
Of the total underperformance of 17.1%, 8.89% can be attributed to sector allocation and 6.54% can be attributed to stock selection. Most significantly, although the Fund was mildly overweight the Information Technology sector, the 31.23% return we achieved with our technology holdings was significantly less than the 50% return the S&P 500® Index achieved in that sector. Our significant underweight in Financials also prevented us from beating the benchmark despite our financial holdings outperforming the sector by 5%. Our underweight in Communication Services and the poor return of our single holding, Tencent Holdings (TCEHY) in that sector also contributed meaningfully to our underperformance relative to our benchmark.
The top three contributors to the Fund’s performance this year were Apple, Inc. (AAPL), which added 3.76% to performance, Microsoft Corporation (MSFT), which added 3.04%, and Rush Enterprises, Inc. – Class A (RUSHA) which added 1.80%. The three positions which detracted the most from Fund performance were Alliance Data Systems Corporation (ADS) which reduced the Fund’s return by 1.15%, GameStop Corporation (GME) which reduced the Fund’s return by .8%, and Tencent Holdings Limited (TCEHY) which reduced the Fund’s returns by .55%. The use of options by the Fund this year reduced returns by .91%. The Fund’s investment in the SPDR Gold Shares Exchange-Traded Fund (GLD) returned 17.86% for the year which increased the Fund’s total return by .85%.
Economically, 2019 saw slowing manufacturing activity across the globe although all the major economies continued to expand. The U.S.–China trade dispute certainly contributed to this as businesses put capital spending on hold as they waited to see what the new rules would be. The U.S. Federal Reserve, which had been raising rates and shrinking its balance sheet in late 2018, reversed itself early in 2019 with three rate cuts and began expanding its balance sheet again late in the year. The European Central Bank also restarted its balance sheet expansion program in the middle of the year. Thus, two of the four major central banks increased the liquidity they were providing during the year.
While we’ve discussed our sector weightings relative to the S&P 500® Index, we’ll remind you that we do not make buy and sell decisions that way. We buy companies when we think we are getting good value for the price and sell them when we believe that’s no longer true—either because the price appreciated to reflect the value we saw or because our expectations of the business are not being met and the value isn’t there. We are certainly aware of our sector weightings, but don’t manage to them. What we do is pay attention to our exposure to underlying risks and we carefully manage our exposure to those. We find that sector diversification is not a good proxy for risk diversification, and we are far more interested in the latter than the former.
S&P 500® Index is a widely recognized, unmanaged index of common stock prices. The S&P 500® Index is weighted by market value and its performance is thought to be representative of the stock market as a whole. You cannot invest directly in an index.
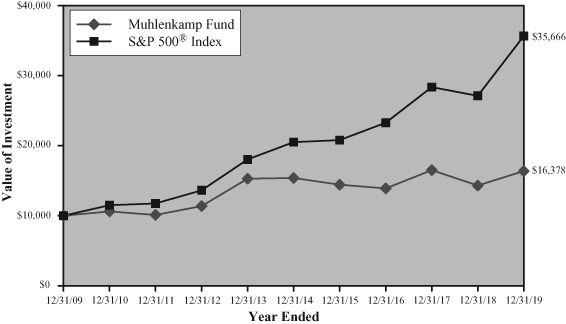
A Hypothetical $10,000 Investment in the Muhlenkamp Fund for the Past 10 Years*
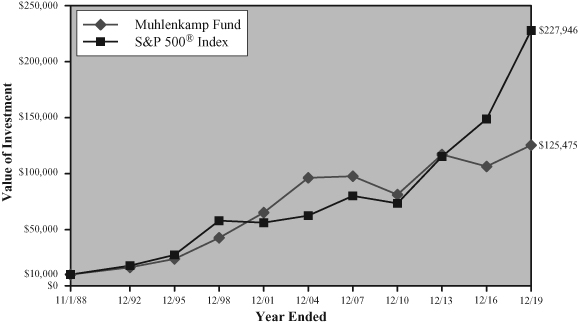
A Hypothetical $10,000 Investment in the Muhlenkamp Fund Since Inception*
The S&P 500® Index is a widely recognized index of common stock prices. The S&P 500® Index is weighted by market value and its performance is thought to be representative of the stock market as a whole. One cannot invest directly in an index. These charts assume an initial gross investment of $10,000 made on 12/31/09 or 11/1/88, respectively. The line graphs do not reflect the deduction of taxes that a shareholder would pay on Fund distributions or redemption of Fund shares. Returns shown include the reinvestment of all dividends. Past performance does not guarantee future results.
____________
Average Annual Total Returns (Unaudited)
as of December 31, 2019
| | One | Three | Five | Ten | Since |
Muhlenkamp Fund | Year | Year | Year | Year | Inception* |
| Return Before Taxes | 14.39% | 5.62% | 1.25% | 5.06% | 8.46% |
S&P 500® Index** | 31.49% | 15.27% | 11.70% | 13.56% | 10.55% |
| Consumer Price Index*** | 2.29% | 2.10% | 1.82% | 1.75% | 2.47% |
Performance data quoted represents past performance and does not guarantee future results. The investment return and principal value of an investment will fluctuate so that an investor’s shares, when redeemed, may be worth more or less than their original cost. Current performance of the Fund may be lower or higher than the performance quoted.
| * | Operations commenced on November 1, 1988. |
| ** | The S&P 500® Index is a widely recognized, unmanaged index of common stock prices. The figures for the S&P 500® Index reflect all dividends reinvested but do not reflect any deductions for fees, expenses, or taxes. One cannot invest directly in an index. |
| *** | Consumer Price Index — U.S. CPI Consumer USA (Non-Seasonally Adjusted) Index. One cannot invest directly in an index. |
Annual Returns Since Inception(1)
(Unaudited)
| One-Year Period | | | | | | | | | |
Ended 12/31 | | Muhlenkamp Fund | | S&P 500® Index | | Consumer Price Index |
| 1989 | | | 12.45 | % | | | 31.69 | % | | | 4.65 | % |
| 1990 | | | -14.90 | % | | | -3.10 | % | | | 6.11 | % |
| 1991 | | | 45.39 | % | | | 30.47 | % | | | 3.06 | % |
| 1992 | | | 15.80 | % | | | 7.62 | % | | | 2.90 | % |
| 1993 | | | 18.12 | % | | | 10.08 | % | | | 2.75 | % |
| 1994 | | | -7.19 | % | | | 1.32 | % | | | 2.67 | % |
| 1995 | | | 32.96 | % | | | 37.58 | % | | | 2.54 | % |
| 1996 | | | 29.98 | % | | | 22.96 | % | | | 3.32 | % |
| 1997 | | | 33.30 | % | | | 33.36 | % | | | 1.70 | % |
| 1998 | | | 3.22 | % | | | 28.58 | % | | | 1.61 | % |
| 1999 | | | 11.40 | % | | | 21.04 | % | | | 2.68 | % |
| 2000 | | | 25.30 | % | | | -9.10 | % | | | 3.39 | % |
| 2001 | | | 9.35 | % | | | -11.89 | % | | | 1.55 | % |
| 2002 | | | -19.92 | % | | | -22.10 | % | | | 2.38 | % |
| 2003 | | | 48.08 | % | | | 28.68 | % | | | 1.88 | % |
| 2004 | | | 24.51 | % | | | 10.88 | % | | | 3.26 | % |
| 2005 | | | 7.88 | % | | | 4.91 | % | | | 3.42 | % |
| 2006 | | | 4.08 | % | | | 15.79 | % | | | 2.54 | % |
| 2007 | | | -9.66 | % | | | 5.49 | % | | | 4.08 | % |
| 2008 | | | -40.39 | % | | | -37.00 | % | | | 0.09 | % |
| 2009 | | | 31.49 | % | | | 26.46 | % | | | 2.72 | % |
| 2010 | | | 6.14 | % | | | 15.06 | % | | | 1.50 | % |
| 2011 | | | -4.74 | % | | | 2.11 | % | | | 2.96 | % |
| 2012 | | | 12.52 | % | | | 16.00 | % | | | 1.74 | % |
| 2013 | | | 34.43 | % | | | 32.39 | % | | | 1.50 | % |
| 2014 | | | 0.64 | % | | | 13.69 | % | | | 0.76 | % |
| 2015 | | | -6.21 | % | | | 1.38 | % | | | 0.73 | % |
| 2016 | | | -3.70 | % | | | 11.96 | % | | | 2.07 | % |
| 2017 | | | 18.77 | % | | | 21.83 | % | | | 2.11 | % |
| 2018 | | | -13.29 | % | | | -4.38 | % | | | 1.91 | % |
| 2019 | | | 14.39 | % | | | 31.49 | % | | | 2.29 | % |
(1) | Operations commenced on November 1, 1988. |
EXPENSE EXAMPLE
December 31, 2019 (Unaudited)
As a shareholder of the Fund, you incur two types of costs: (1) transaction costs, including brokerage commission on purchases and sales of Fund shares, and (2) ongoing costs, including management fees and other Fund expenses. This Example is intended to help you understand your ongoing costs (in dollars) of investing in the Fund and to compare these costs with the ongoing costs of investing in other mutual funds. The Example is based on an investment of $1,000 invested at the beginning of the period and held for the entire period (July 1, 2019 – December 31, 2019).
Actual Expenses
The first line of the table provides information about actual account values and actual expenses. You may use the information in this line, together with the amount you invested, to estimate the expenses that you paid over the period. Simply divide your account value by $1,000 (for example, an $8,600 account value divided by $1,000 = 8.6), then multiply the result by the number in the first line under the heading titled “Expenses Paid During Period” to estimate the expenses you paid on your account during this period.
Hypothetical Example for Comparison Purposes
The second line of the table provides information about hypothetical account values and hypothetical expenses based on the Fund’s actual expense ratio and an assumed rate of return of 5% per year before expenses, which is not the Fund’s actual return. The hypothetical account values and expenses may not be used to estimate the actual ending account balance or expenses you paid for the period. You may use this information to compare the ongoing costs of investing in the Fund and other funds. To do so, compare this 5% hypothetical example with the 5% hypothetical examples that appear in the shareholder reports of the other funds.
Please note that the expenses shown in the table are meant to highlight your ongoing costs only and do not reflect any transactional costs. Therefore, the second line of the table is useful in comparing ongoing costs only, and will not help you determine the relative total costs of owning different funds. In addition, if these transactional costs were included, your costs may have been higher.
EXPENSE EXAMPLE (Continued)
December 31, 2019 (Unaudited)
| | Beginning | Ending | Expenses Paid |
| | Account Value | Account Value | During Period |
| | 7/1/2019 | 12/31/2019 | 7/1/2019 – 12/31/2019(1) |
Actual(2) | $1,000.00 | $1,072.40 | $5.75 |
| Hypothetical (5% return | | | |
| before expenses) | $1,000.00 | $1,019.66 | $5.60 |
(1) | Expenses are equal to the Fund’s annualized expense ratio for the most recent six month period of 1.10% multiplied by the average account value over the period multiplied by 184/365 to reflect the one-half year period. |
(2) | Based on the actual return for the six month period ended December 31, 2019 of 7.24%. |
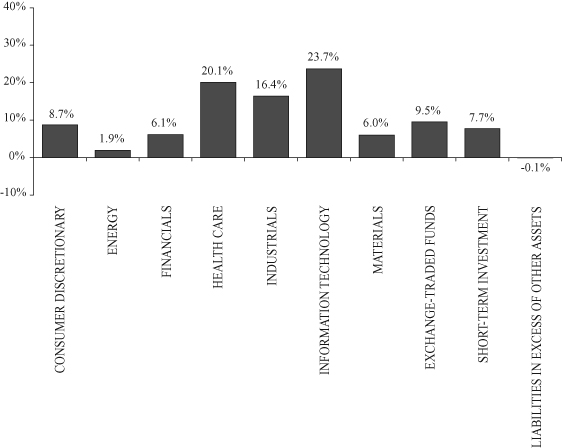
ALLOCATION OF PORTFOLIO ASSETS
(Calculated as a percentage of net assets)
December 31, 2019 (Unaudited)
The Global Industry Classification Standard (GICS®) was developed by and/or is the exclusive property of MSCI, Inc. (“MSCI”) and Standard & Poor’s Financial Services LLC (“S&P”). GICS® is a service mark of MSCI and S&P and has been licensed for use.
STATEMENT OF ASSETS & LIABILITIES
December 31, 2019
| ASSETS | |
| Investments, at value (Cost: $134,393,000) | | $ | 185,570,646 | |
| Dividends and interest receivable | | | 192,986 | |
| Receivable for capital shares sold | | | 2,080 | |
| Prepaid expenses | | | 9,267 | |
| Total assets | | | 185,774,979 | |
| | | | | |
| LIABILITIES | |
| Payable to investment adviser | | | 130,055 | |
| Payable for capital shares redeemed | | | 92,986 | |
| Payable for fund administration & accounting fees | | | 26,955 | |
| Payable for transfer agent fees & expenses | | | 23,963 | |
| Payable for trustee fees | | | 3,353 | |
| Payable for compliance fees | | | 2,249 | |
| Payable for custody fees | | | 2,132 | |
| Accrued expenses | | | 45,265 | |
| Total liabilities | | | 326,958 | |
| Net assets | | $ | 185,448,021 | |
| | | | | |
| NET ASSETS | |
| Paid-in capital | | $ | 134,728,335 | |
| Total distributable earnings | | | 50,719,686 | |
| Net assets | | $ | 185,448,021 | |
Shares issued and outstanding(1) | | | 3,935,386 | |
| Net asset value, redemption price and offering price per share | | $ | 47.12 | |
(1) | Unlimited shares authorized without par value. |
The accompanying notes are an integral part of these financial statements.
STATEMENT OF OPERATIONS
For the Year Ended December 31, 2019
| INVESTMENT INCOME: | | | | | | |
| Dividend income | | | | | $ | 2,168,028 | |
| Less: Foreign taxes withheld | | | | | | (1,876 | ) |
| Interest income | | | | | | 648,387 | |
| Total investment income | | | | | | 2,814,539 | |
| EXPENSES: | | | | | | | |
| Investment advisory fees (See Note 3) | | $ | 1,886,276 | | | | | |
| Transfer agent fees & expenses (See Note 3) | | | 212,677 | | | | | |
| Fund administration & accounting fees (See Note 3) | | | 166,174 | | | | | |
| Postage & printing fees | | | 50,710 | | | | | |
| Federal & state registration fees | | | 25,348 | | | | | |
| Audit fees | | | 20,990 | | | | | |
| Trustee fees | | | 14,241 | | | | | |
| Compliance fees (See Note 3) | | | 13,505 | | | | | |
| Custody fees (See Note 3) | | | 12,606 | | | | | |
| Other expenses | | | 9,878 | | | | | |
| Legal fees | | | 8,459 | | | | | |
| Total expenses before waiver/reductions | | | 2,420,864 | | | | | |
| Less: Net waiver from | | | | | | | | |
| investment adviser (See Note 3) | | | (306,599 | ) | | | | |
| Less: Expense reductions (See Note 8) | | | (8,299 | ) | | | | |
| Net expenses | | | | | | | 2,105,966 | |
| NET INVESTMENT INCOME | | | | | | | 708,573 | |
| REALIZED AND UNREALIZED | | | | | | | | |
| GAIN (LOSS) ON INVESTMENTS | | | | | | | | |
| Net realized gain (loss) on: | | | | | | | | |
| Investments sold | | | 1,561,679 | | | | | |
| Written option contracts expired or closed | | | (311,129 | ) | | | | |
| Total net realized gain | | | | | | | 1,250,550 | |
| Net change in unrealized | | | | | | | | |
| appreciation/depreciation on: | | | | | | | | |
| Investments | | | 23,768,615 | | | | | |
| Written options | | | (312,162 | ) | | | | |
| Total net change in unrealized | | | | | | | | |
| appreciation/depreciation | | | | | | | 23,456,453 | |
| Net realized and unrealized gain on investments | | | | | | | 24,707,003 | |
| NET INCREASE IN NET ASSETS | | | | | | | | |
| RESULTING FROM OPERATIONS | | | | | | $ | 25,415,576 | |
The accompanying notes are an integral part of these financial statements.
STATEMENTS OF CHANGES IN NET ASSETS
| | | Year Ended | | | Year Ended | |
| | | December 31, 2019 | | | December 31, 2018 | |
| OPERATIONS: | | | | | | |
| Net investment income | | $ | 708,573 | | | $ | 450,750 | |
| Net realized gains on investments | | | | | | | | |
| sold and written option contracts | | | | | | | | |
| expired or closed | | | 1,250,550 | | | | 25,819,710 | |
| Net change in unrealized | | | | | | | | |
| appreciation/depreciation on | | | | | | | | |
| investments and written options | | | 23,456,453 | | | | (56,552,875 | ) |
| Net increase (decrease) in net | | | | | | | | |
| assets resulting from operations | | | 25,415,576 | | | | (30,282,415 | ) |
| CAPITAL SHARE TRANSACTIONS: | | | | | | | | |
| Proceeds from shares sold | | | 4,434,238 | | | | 2,516,208 | |
| Proceeds from reinvestments of distributions | | | 2,152,911 | | | | 22,457,482 | |
| Payment for shares redeemed | | | (31,836,877 | ) | | | (42,107,130 | ) |
| Net decrease in net assets resulting | | | | | | | | |
| from capital share transactions | | | (25,249,728 | ) | | | (17,133,440 | ) |
| DISTRIBUTIONS TO SHAREHOLDERS | | | (2,317,279 | ) | | | (24,385,852 | ) |
| TOTAL DECREASE IN NET ASSETS | | | (2,151,431 | ) | | | (71,801,707 | ) |
| NET ASSETS: | | | | | | | | |
| Beginning of year | | | 187,599,452 | | | | 259,401,159 | |
| End of year | | $ | 185,448,021 | | | $ | 187,599,452 | |
The accompanying notes are an integral part of these financial statements.
FINANCIAL HIGHLIGHTS
For a Fund share outstanding throughout the years
| | | Year Ended December 31, | |
| | | 2019 | | | 2018 | | | 2017 | | | 2016 | | | 2015 | |
| PER SHARE DATA: | | | | | | | | | | | | | | | |
| NET ASSET VALUE, | | | | | | | | | | | | | | | |
| BEGINNING OF YEAR | | $ | 41.71 | | | $ | 55.21 | | | $ | 48.47 | | | $ | 50.33 | | | $ | 59.50 | |
| INVESTMENT OPERATIONS: | | | | | | | | | | | | | | | | | | | | |
| Net investment income (loss) | | | 0.18 | | | | 0.12 | | | | 0.20 | | | | (0.08 | ) | | | (0.17 | ) |
| Net realized and unrealized | | | | | | | | | | | | | | | | | | | | |
| gains (losses) on investments | | | 5.82 | | | | (7.49 | ) | | | 8.92 | | | | (1.78 | ) | | | (3.45 | ) |
| Total from investment operations | | | 6.00 | | | | (7.37 | ) | | | 9.12 | | | | (1.86 | ) | | | (3.62 | ) |
| LESS DISTRIBUTIONS FROM: | | | | | | | | | | | | | | | | | | | | |
| Net investment income | | | (0.19 | ) | | | (0.16 | ) | | | (0.19 | ) | | | — | | | | — | |
| Realized gains | | | (0.40 | ) | | | (5.97 | ) | | | (2.19 | ) | | | — | | | | (5.55 | ) |
| Total distributions | | | (0.59 | ) | | | (6.13 | ) | | | (2.38 | ) | | | — | | | | (5.55 | ) |
| NET ASSET VALUE, END OF YEAR | | $ | 47.12 | | | $ | 41.71 | | | $ | 55.21 | | | $ | 48.47 | | | $ | 50.33 | |
| TOTAL RETURN | | | 14.39 | % | | | -13.29 | % | | | 18.77 | % | | | -3.70 | % | | | -6.21 | % |
| SUPPLEMENTAL DATA AND RATIOS: | | | | | | | | | | | | | | | | | | | | |
| NET ASSETS, END OF YEAR | | | | | | | | | | | | | | | | | | | | |
| (in millions) | | $ | 185 | | | $ | 188 | | | $ | 259 | | | $ | 254 | | | $ | 325 | |
| RATIO OF EXPENSES TO | | | | | | | | | | | | | | | | | | | | |
| AVERAGE NET ASSETS: | | | | | | | | | | | | | | | | | | | | |
| Excluding expense waiver/reductions | | | 1.28 | % | | | 1.25 | % | | | 1.25 | % | | | 1.25 | % | | | 1.22 | % |
Including expense waiver/reductions(1) | | | 1.12 | %(2) | | | 1.20 | % | | | 1.21 | % | | | 1.25 | % | | | 1.21 | % |
| RATIO OF NET INVESTMENT | | | | | | | | | | | | | | | | | | | | |
| INCOME (LOSS) TO | | | | | | | | | | | | | | | | | | | | |
| AVERAGE NET ASSETS: | | | | | | | | | | | | | | | | | | | | |
| Including expense waiver/reductions | | | 0.38 | % | | | 0.20 | % | | | 0.37 | % | | | (0.15 | )% | | | (0.28 | )% |
| PORTFOLIO TURNOVER RATE | | | 40.19 | % | | | 9.55 | % | | | 19.32 | % | | | 39.75 | % | | | 19.46 | % |
(1) | The ratio includes expense reductions for minimum account maintenance fees deposited into the Fund. (See Note 8). |
(2) | Prior to February 28, 2019, the annual expense limitation was 1.20% of the average daily net assets. Thereafter it was 1.10%. |
The accompanying notes are an integral part of these financial statements.
SCHEDULE OF INVESTMENTS
December 31, 2019
| Name of Issuer or Title of Issue | | Shares | | | Value | |
| COMMON STOCKS — 82.8% | | | | | | |
| | | | | | | |
| Aerospace & Defense — 2.9% | | | | | | |
| Lockheed Martin Corporation | | | 14,000 | | | $ | 5,451,320 | |
| | | | | | | | | |
| Airlines — 3.2% | | | | | | | | |
| Delta Air Lines, Inc. | | | 100,000 | | | | 5,848,000 | |
| | | | | | | | | |
| Auto Components — 1.9% | | | | | | | | |
| Tenneco, Inc. — Class A | | | 275,400 | | | | 3,607,740 | |
| | | | | | | | | |
| Biotechnology — 2.4% | | | | | | | | |
| Biogen, Inc. (a) | | | 12,500 | | | | 3,709,125 | |
| Gilead Sciences, Inc. | | | 11,000 | | | | 714,780 | |
| | | | | | | | 4,423,905 | |
| Chemicals — 6.0% | | | | | | | | |
| Celanese Corporation — Series A | | | 41,000 | | | | 5,047,920 | |
| Dow, Inc. | | | 110,133 | | | | 6,027,579 | |
| | | | | | | | 11,075,499 | |
| Diversified Financial Services — 3.3% | | | | | | | | |
| Berkshire Hathaway, Inc. — Class B (a) | | | 26,795 | | | | 6,069,067 | |
| | | | | | | | | |
| Electrical Equipment — 2.5% | | | | | | | | |
| Acuity Brands, Inc. | | | 33,200 | | | | 4,581,600 | |
| | | | | | | | | |
| Health Care Providers & Services — 11.5% | | | | | | | | |
| Cigna Corporation | | | 24,001 | | | | 4,907,964 | |
| CVS Health Corporation | | | 76,500 | | | | 5,683,185 | |
| McKesson Corporation | | | 56,500 | | | | 7,815,080 | |
| UnitedHealth Group, Inc. | | | 10,270 | | | | 3,019,175 | |
| | | | | | | | 21,425,404 | |
| Household Durables — 4.7% | | | | | | | | |
| Lennar Corporation — Class A | | | 60,100 | | | | 3,352,979 | |
| Meritage Homes Corporation (a) | | | 89,000 | | | | 5,438,790 | |
| | | | | | | | 8,791,769 | |
| IT Services — 3.3% | | | | | | | | |
| Alliance Data Systems Corporation | | | 55,225 | | | | 6,196,245 | |
| | | | | | | | | |
| Machinery — 1.7% | | | | | | | | |
| Wabtec Corporation | | | 39,799 | | | | 3,096,362 | |
The accompanying notes are an integral part of these financial statements.
SCHEDULE OF INVESTMENTS (Continued)
December 31, 2019
| Name of Issuer or Title of Issue | | Shares | | | Value | |
| COMMON STOCKS — 82.8% (Continued) | | | | | | |
| | | | | | | |
| Mortgage Real Estate Investment Trusts — 2.8% | | | | | | |
| Annaly Capital Management, Inc. — REIT | | | 550,000 | | | $ | 5,181,000 | |
| | | | | | | | | |
| Oil, Gas & Consumable Fuels — 1.9% | | | | | | | | |
| Cameco Corporation (b) | | | 208,000 | | | | 1,851,200 | |
| Golar LNG Partners LP (b) | | | 192,200 | | | | 1,699,048 | |
| | | | | | | | 3,550,248 | |
| Pharmaceuticals — 6.1% | | | | | | | | |
| Bristol-Myers Squibb Co. | | | 90,700 | | | | 5,822,033 | |
| Jazz Pharmaceuticals PLC (a) (b) | | | 36,542 | | | | 5,454,990 | |
| | | | | | | | 11,277,023 | |
| Semiconductors & | | | | | | | | |
| Semiconductor Equipment — 6.9% | | | | | | | | |
| Broadcom, Inc. | | | 17,500 | | | | 5,530,350 | |
| Microchip Technology, Inc. | | | 69,800 | | | | 7,309,456 | |
| | | | | | | | 12,839,806 | |
| Software — 6.4% | | | | | | | | |
| Microsoft Corporation | | | 74,927 | | | | 11,815,988 | |
| | | | | | | | | |
| Specialty Retail — 2.0% | | | | | | | | |
| AutoZone, Inc. (a) | | | 3,168 | | | | 3,774,070 | |
| | | | | | | | | |
| Technology Hardware, | | | | | | | | |
| Storage & Peripherals — 7.1% | | | | | | | | |
| Apple, Inc. | | | 44,647 | | | | 13,110,592 | |
| | | | | | | | | |
| Trading Companies & Distributors — 6.2% | | | | | | | | |
| Rush Enterprises, Inc. — Class A | | | 247,688 | | | | 11,517,492 | |
| Total Common Stocks | | | | | | | | |
| (Cost $104,212,912) | | | | | | | 153,633,130 | |
| | | | | | | | | |
| EXCHANGE-TRADED FUNDS — 9.5% | | | | | | | | |
| Alerian MLP | | | 694,000 | | | | 5,899,000 | |
| Invesco BuyBack Achievers | | | 27,700 | | | | 1,910,746 | |
| SPDR Gold Shares (a) | | | 68,075 | | | | 9,727,917 | |
| Total Exchange Traded Funds | | | | | | | | |
| (Cost $15,827,755) | | | | | | | 17,537,663 | |
The accompanying notes are an integral part of these financial statements.
SCHEDULE OF INVESTMENTS (Continued)
December 31, 2019
| Name of Issuer or Title of Issue | | Shares | | | Value | |
| RIGHTS — 0.1% | | | | | | |
| | | | | | | |
| Pharmaceuticals — 0.1% | | | | | | |
| Bristol-Myers Squibb Co. (a) | | | | | | |
| Total Rights | | | | | | |
| (Cost $115,020) | | | 54,000 | | | $ | 162,540 | |
| | | | | | | | | |
| SHORT-TERM INVESTMENT — 7.7% | | | | | | | | |
| First American Government Obligations Fund — | | | | | | | | |
| Class X, 1.51% (c) | | | | | | | | |
| Total Short-Term Investment | | | | | | | | |
| (Cost $14,237,313) | | | 14,237,313 | | | | 14,237,313 | |
| TOTAL INVESTMENTS | | | | | | | | |
| (Cost $134,393,000) — 100.1% | | | | | | | 185,570,646 | |
| LIABILITIES IN EXCESS | | | | | | | | |
| OF OTHER ASSETS — (0.1)% | | | | | | | (122,625 | ) |
| TOTAL NET ASSETS — 100.0% | | | | | | $ | 185,448,021 | |
REIT — Real Estate Investment Trust
PLC — Public Limited Company
| (a) | Non-income producing security. |
| (b) | Foreign company. |
| (c) | The rate shown is the annualized seven day effective yield as of December 31, 2019. |
The Global Industry Classification Standard (GICS®) was developed by and/or is the exclusive property of MSCI, Inc. (“MSCI”) and Standard & Poor’s Financial Services LLC (“S&P”). GICS® is a service mark of MSCI and S&P and has been licensed for use.
The accompanying notes are an integral part of these financial statements.
NOTES TO FINANCIAL STATEMENTS
Year Ended December 31, 2019
Managed Portfolio Series (the “Trust”) was organized as a Delaware statutory trust on January 27, 2011. The Trust is registered under the Investment Company Act of 1940 (the “1940 Act”), as amended, as an open-end management investment company. The Muhlenkamp Fund (the “Fund”) is a diversified series with its own investment objectives and policies within the Trust. The Fund commenced operations on November 1, 1988.
The Fund operates as a diversified open-end mutual fund that continuously offers its shares for sale to the public. The Fund manages its assets to seek a maximum total after-tax return to its shareholders through capital appreciation, and income from dividends and interest, consistent with reasonable risk. The Fund is an investment company and accordingly follows the investment company accounting and reporting guidance of the Financial Accounting Standards Board (“FASB”) Accounting Standards Codification Topic 946 Financial Services — Investment Companies. The Fund principally invests in a diversified list of common stocks of any capitalization, determined by Muhlenkamp & Company, Inc. (the “Adviser”) to be highly profitable, yet undervalued. The Fund may acquire and hold fixed-income or debt investments as market conditions warrant and when, in the opinion of the Adviser, it is deemed desirable or necessary in order to attempt to achieve its investment objective.
The primary focus of the Fund is long-term and the investment options are diverse. This allows for greater flexibility in the daily management of Fund assets. However, with flexibility also comes the risk that assets will be invested in various classes of securities at the wrong time and price.
| 2. | SUMMARY OF SIGNIFICANT ACCOUNTING POLICIES |
The following is a summary of significant accounting policies consistently followed by the Fund in preparation of the accompanying financial statements. These policies are in conformity with generally accepted accounting principles in the United States of America (“GAAP”).
| a. | Investment Valuations — Following is a description of the valuation techniques applied to the Fund’s major categories of assets and liabilities measured at fair value on a recurring basis. The Fund’s investments are carried at fair value. |
| | |
| | Equity Securities — Equity securities, including common stocks, preferred stocks, exchange-traded funds (“ETFs”) and real estate investment trusts (“REITs”), that are primarily traded on a national securities exchange are valued at the last sale price on the exchange on which they are primarily traded on the day of valuation or, if there has been no sale on such day, at the mean between the bid and ask prices. Securities traded primarily in the Nasdaq Global Market |
NOTES TO FINANCIAL STATEMENTS (Continued)
Year Ended December 31, 2019
| | System for which market quotations are readily available are valued using the Nasdaq Official Closing Price (“NOCP”). If the NOCP is not available, such securities are valued at the last sale price on the day of valuation, or if there has been no sale on such day, at the mean between the bid and ask prices. To the extent these securities are actively traded and valuation adjustments are not applied, they are categorized in Level 1 of the fair value hierarchy. If the market for a particular security is not active, and the mean between bid and ask prices is used, these securities are categorized in Level 2 of the fair value hierarchy. |
| | |
| | Corporate Bonds — Corporate bonds, including listed issues, are valued at fair value on the basis of valuations furnished by an independent pricing service which utilizes both dealer-supplied valuations and formula-based techniques. The pricing service may consider recently executed transactions in securities of the issuer or comparable issuers, market price quotations (where observable), bond spreads, and fundamental data relating to the issuer. Most corporate and municipal bonds are categorized in Level 2 of the fair value hierarchy. |
| | |
| | U.S. Government & Agency Securities — U.S. government & agency securities are normally valued using a model that incorporates market observable data such as reported sales of similar securities, broker quotes, yields, bids, offers, and reference data. Certain securities are valued principally using dealer quotations. U.S. government and agency securities are categorized in Level 2 of the fair value hierarchy depending on the inputs used and market activity levels for specific securities. |
| | |
| | Short-Term Investments — Short-term investments in other mutual funds, including money market funds, are valued at their net asset value per share. To the extent these securities are actively traded and valuation adjustments are not applied, they are categorized in Level 1 of the fair value hierarchy. |
| | |
| | Derivative Instruments — Listed derivatives, including rights and warrants that are actively traded are valued based on quoted prices from the exchange and categorized in Level 1 of the fair value hierarchy. Exchange traded options that are valued at the mean of the highest bid price and lowest ask price across the exchanges where the option is traded are categorized in Level 2 of the fair value hierarchy. |
| | |
| | Securities for which market quotations are not readily available, or if the closing price does not represent fair value, are valued following procedures approved by the Board of Trustees (the “Board”). These procedures consider many factors, including the type of security, size of holding, trading volume and news events. There can be no assurance that the Fund could obtain the fair value assigned to a security if they were to sell the security at approximately the time at which the |
NOTES TO FINANCIAL STATEMENTS (Continued)
Year Ended December 31, 2019
| | Fund determines their net asset values per share. The Board has established a Valuation Committee to administer, implement, and oversee the fair valuation process, and to make fair value decisions when necessary. The Board regularly reviews reports that describe any fair value determinations and methods. |
| | |
| | The Fund has adopted authoritative fair value accounting standards which establish an authoritative definition of fair value and set out a hierarchy for measuring fair value. These standards require additional disclosures about the various inputs and valuation techniques used to develop the measurements of fair value, a discussion of changes in valuation techniques and related inputs during the period and expanded disclosure of valuation Levels for major security types. These inputs are summarized in the three broad Levels listed below: |
| | |
| | Level 1 — Unadjusted quoted prices in active markets for identical assets or liabilities that the Fund has the ability to access. |
| | |
| | Level 2 — Observable inputs other than quoted prices included in Level 1 that are observable for the asset or liability, either directly or indirectly. These inputs may include quoted prices for the identical instrument on an inactive market, prices for similar instruments, interest rates, prepayment speeds, credit risk, yield curves, default rates and similar data. |
| | |
| | Level 3 — Unobservable inputs for the asset or liability, to the extent relevant observable inputs are not available, representing the Fund’s own assumptions about the assumptions a market participant would use in valuing the asset or liability, and would be based on the best information available. |
| | |
| | The inputs or methodology used for valuing securities are not an indication of the risk associated with investing in those securities. The following is a summary of the inputs used to value the Fund’s assets and liabilities as of December 31, 2019: |
| | | | Level 1 | | | Level 2 | | | Level 3 | | | Total | |
| | Assets: | | | | | | | | | | | | |
| | Common Stocks | | $ | 153,633,130 | | | $ | — | | | $ | — | | | $ | 153,633,130 | |
| | Exchange-Traded Funds | | | 17,537,663 | | | | — | | | | — | | | | 17,537,663 | |
| | Rights | | | 162,540 | | | | — | | | | — | | | | 162,540 | |
| | Short-Term Investment | | | 14,237,313 | | | | — | | | | — | | | | 14,237,313 | |
| | Total Investments | | | | | | | | | | | | | | | | |
| | in Securities | | $ | 185,570,646 | | | $ | — | | | $ | — | | | $ | 185,570,646 | |
| | Refer to the Schedule of Investments for further information on the classification of investments. |
NOTES TO FINANCIAL STATEMENTS (Continued)
Year Ended December 31, 2019
| b. | Foreign Securities — Investing in securities of foreign companies and foreign governments involves special risks and considerations not typically associated with investing in U.S. companies and the U.S. government. These risks may include revaluation of currencies and future adverse political and economic developments. Moreover, securities of many foreign companies and foreign governments and their markets may be less liquid and their prices more volatile than those of securities of comparable U.S. companies and the U.S. government. |
| | |
| c. | Foreign Currency Translations — The books and records of the Fund are maintained in U.S. dollars. Foreign currency transactions are translated into U.S. dollars on the following basis: (i) fair value of investment securities, assets and liabilities at the daily rates of exchange, and (ii) purchases and sales of investment securities, dividend and interest income and certain expenses at the rates of exchange prevailing on the respective dates of such transactions. For financial reporting purposes, the Fund does not isolate changes in the exchange rate of investment securities from the fluctuations arising from changes in the market price of such securities. Such fluctuations are included with the net realized and unrealized gain or loss from investments and translations of foreign currency. However, for federal income tax purposes the Fund does isolate and treat the effect of changes in foreign exchange rates on realized gain or loss from the sale of equity securities and payables/receivables arising from trade date and settlement date differences as ordinary income. For the year ended December 31, 2019, the Fund did not have any gain or loss related to foreign currency translations. |
| | |
| d. | Investment Transactions and Related Investment Income — Investment transactions are recorded on the trade date. Dividend income is recorded on the ex-dividend date. Interest income is recorded daily on the yield to maturity basis. The Fund uses the specific identification method in computing gain or loss on the sale of investment securities. Withholding taxes on foreign dividends have been provided for in accordance with the Fund’s understanding of the applicable country’s tax rules and regulations. Distributions received from the Fund’s investments in Master Limited Partnerships (“MLP”s) may be categorized as ordinary income, net capital gain, or a return of capital. The proper classification of MLP distributions is generally not known until after the end of each calendar year. The Fund must use estimates in reporting the character of their income and distributions for financial statement purposes. Due to the nature of the MLP investments, a portion of the distributions received by the Fund’s shareholders may represent a return of capital. |
| | |
| e. | Federal Taxes — The Fund complies with the requirements of subchapter M of the Internal Revenue Code of 1986, as amended, necessary to qualify as a regulated investment company and distribute substantially all net taxable investment income and net realized gains to shareholders in a manner which |
NOTES TO FINANCIAL STATEMENTS (Continued)
Year Ended December 31, 2019
| | results in no tax cost to the Fund. Therefore, no federal income or excise tax provision is required. As of and during the year ended December 31, 2019, the Fund did not have any tax positions that did not meet the “more-likely-than-not” threshold of being sustained by the applicable tax authority. As of and during the year ended December 31, 2019, the Fund did not have any liabilities for any unrecognized tax benefits. The Fund recognize interest and penalties, if any, related to unrecognized tax benefits on uncertain tax positions as income tax expense in the Statement of Operations. As of and during the year ended December 31, 2019, the Fund did not incur any interest and penalties. The Fund is not subject to examination by U.S. tax authorities for tax years prior to the fiscal year ended December 31, 2016. |
| | |
| f. | Dividends and Distributions to Shareholders — Dividends from net investment income, if any, are declared and paid at least annually. Distributions of net realized capital gains, if any, will be declared and paid at least annually. Income dividends and capital gain distributions, if any, are recorded on the ex-dividend date. The Fund may utilize earnings and profits distributed to shareholders on redemption of shares as part of the dividends paid deduction. Accordingly, reclassifications are made within the net asset accounts for such amounts, as well as amounts related to permanent differences in the character of certain income and expense items for income tax and financial reporting purposes. See Note 7 for additional disclosures. |
| | |
| g. | Use of Estimates — The preparation of financial statements in conformity with GAAP requires management to make estimates and assumptions that affect the reported amounts of assets and liabilities and disclosure of contingent assets and liabilities at the date of the financial statements and the reported amounts of revenues and expenses during the reported period. Actual results could differ from those estimates. |
| | |
| h. | Allocation of Expenses — Expenses associated with a specific fund in the Trust are charged to that Fund. Common Trust expenses are typically allocated evenly between the funds of the Trust or by other equitable means. |
| | |
| i. | Options Transactions — The Fund is subject to equity price risk in the normal course of pursuing its investment objectives. The Fund may use purchased option contracts and written option contracts to hedge against the changes in the value of equities or to meet its investment objectives. The Fund may write put and call options only if it (i) owns an offsetting position in the underlying security or (ii) maintains cash or other liquid assets in an amount equal to or greater than its obligation under the option. |
NOTES TO FINANCIAL STATEMENTS (Continued)
Year Ended December 31, 2019
| | When the Fund writes a call or put option, an amount equal to the premium received is included in the Statement of Assets & Liabilities as a liability. The amount of the liability is subsequently adjusted to reflect the current fair value of the option. If an option expires on its stipulated expiration date or if the Fund enters into a closing purchase transaction, a gain or loss is realized. If a written call option is exercised, a gain or loss is realized for the sale of the underlying security and the proceeds from the sale are increased by the premium originally received. If a written put option is exercised, the cost of the security acquired is decreased by the premium originally received. As the writer of an option, the Fund has no control over whether the underlying securities are subsequently sold (call) or purchased (put) and, as a result, bears the market risk of an unfavorable change in the price of the security underlying the written option. |
| | |
| | The Fund may purchase call and put options. When the Fund purchases a call or put option, an amount equal to the premium paid is included in the Statement of Assets & Liabilities as an investment, and is subsequently adjusted to reflect the fair value of the option. If an option expires on the stipulated expiration date or if the Fund enters into a closing sale transaction, a gain or loss is realized. If the Fund exercises a call option, the cost of the security acquired is increased by the premium paid for the call. If the Fund exercises a put option, a gain or loss is realized from the sale of the underlying security, and the proceeds from such a sale are decreased by the premium originally paid. Written and purchased options are non-income producing securities. Written and purchased options expose the Fund to minimal counterparty risk since they are exchange traded and the exchange’s clearinghouse guarantees the options against default. |
| | |
| | The Fund follows authoritative standards regarding disclosure about derivatives and hedging activities and how they affect the Fund’s Statement of Assets and Liabilities and Statement of Operations. For the year ended December 31, 2019, no long options contracts were purchased and 145 written option contracts were opened and $337,413 in premiums were received. The Fund’s average monthly notional value of written option contracts for the year ended December 31, 2019, was $6,669,072. The Fund holds no purchased or written option contracts as of December 31, 2019. |
NOTES TO FINANCIAL STATEMENTS (Continued)
Year Ended December 31, 2019
| | Statement of Operations |
| | |
| | The effect of derivative instruments on the Statement of Operations for the year ended December 31, 2019: |
| | | | Amount of Net | |
| | | | Realized Loss on: | |
| | | | Written Option | |
| | Derivatives | | Contracts | |
| | Equity contracts | | $ | (311,129 | ) |
| | Total | | $ | (311,129 | ) |
| | | | | | |
| | | | Change in Unrealized | |
| | | Appreciation/ Depreciation on: |
| | | | Written Option | |
| | Derivatives | | Contracts | |
| | Equity contracts | | $ | (312,162 | ) |
| | Total | | $ | (312,162 | ) |
| 3. | INVESTMENT ADVISORY FEE AND OTHER TRANSACTIONS WITH AFFILIATES |
The Trust has an agreement with the Adviser to furnish investment advisory services to the Fund. Pursuant to an Investment Advisory Agreement between the Trust and the Adviser, the Adviser charges a management fee at a 1.00% annual rate of the Fund’s average daily net assets up to $300 million, 0.95% of the Fund’s average daily net assets on the next $200 million, and 0.90% on the balance of the Fund’s average daily net assets.
The Fund’s Adviser has contractually agreed to continue waiving a portion or all of its management fees and/or reimburse the Fund for its expenses to ensure that total annual operating expenses (excluding acquired fund fees and expenses, leverage/borrowing interest, interest expense, taxes, brokerage commissions, and extraordinary expenses) do not exceed 1.10% of the average daily net assets (the “Expense Cap”) of the Fund through at least February 28, 2021. Prior to February 28, 2019, the annual expense limitation was 1.20% of the average daily net assets. After February 28, 2021, the Expense Cap is scheduled to return to 1.20%, unless the Adviser voluntarily elects to extend the Expense Cap for another year.
Fees waived and expenses reimbursed by the Adviser may be recouped by the Adviser for a period of thirty-six months following the month during which such waiver or reimbursement was made, if such recoupment can be achieved without exceeding the expense limit in effect at the time the waiver and reimbursement occurred. The Operating Expense Limitation Agreement is indefinite, but cannot be terminated
NOTES TO FINANCIAL STATEMENTS (Continued)
Year Ended December 31, 2019
within one year after the effective date of the Fund’s prospectus. After that date, the agreement may be terminated at any time upon sixty days’ written notice by the Board or the Adviser. Waived fees and reimbursed expenses subject to potential recovery by month of expiration are as follows:
| | Expiration | Amount | |
| | March-November 2020 | $ 83,564 | |
| | January-November 2021 | $ 94,728 | |
| | January-December 2022 | $306,599 | |
U.S. Bancorp Fund Services, LLC (the “Administrator”), doing business as U.S. Bank Global Fund Services, acts as the Fund’s Administrator, Transfer Agent, and Fund Accountant. U.S. Bank N.A. (the “Custodian”) serves as the Custodian to the Fund. The Custodian is an affiliate of the Administrator. The Administrator performs various administrative and accounting services for the Fund. The Administrator prepares various federal and state regulatory filings, reports and returns for the Fund; prepares reports and materials to be supplied to the Trustees; monitors the activities of the Custodian; coordinates the payment of the Fund’s expenses and reviews the Fund’s expense accruals. The officers of the Trust, including the Chief Compliance Officer, are employees of the Administrator. As compensation for its services, the Administrator is entitled to a monthly fee at an annual rate based upon the average daily net assets of the Fund, subject to annual minimums. Fees paid by the Fund for administration, transfer agency and accounting costs, custody and chief compliance officer services for the year ended December 31, 2019, are disclosed in the Statement of Operations.
Quasar Distributors, LLC (“Quasar”) acts as the Fund’s distributor and principal underwriter in a continuous public offering of the Fund’s shares. Quasar is an affiliate of the Administrator.
On November 25, 2019, U.S. Bancorp, the parent company of Quasar, announced that it had signed a purchase agreement to sell Quasar to Foreside Financial Group, LLC such that Quasar will become a wholly-owned broker-dealer subsidiary of Foreside. The transaction is expected to close by the end of March 2020. Quasar will remain the Fund’s distributor at the close of the transaction, subject to Board approval.
The Fund has established an unsecured Line of Credit (“LOC”) in the amount of $10,000,000, 5% of the Fund’s gross market value or 33.33% of the unencumbered assets of the Fund, whichever is less. The LOC matures unless renewed on July 24, 2020. This LOC is intended to provide short-term financing, if necessary, subject to certain restrictions and covenants in connection with shareholder redemptions and other short-term liquidity needs of the Fund. The LOC is with the Custodian. Interest
NOTES TO FINANCIAL STATEMENTS (Continued)
Year Ended December 31, 2019
is charged at the prime rate which was 4.75% as of December 31, 2019. The interest rate during the year was between 4.75-5.50%. The Fund has authorized the Custodian to charge any of the Fund’s accounts for any missed payments. During the year ended December 31, 2019, the Fund did not have any borrowings under the LOC.
5. CAPITAL SHARE TRANSACTIONS
Transactions in capital shares of the Fund were as follows:
| | | | Year Ended | | | Year Ended | |
| | | | December 31, 2019 | | | December 31, 2018 | |
| | Shares outstanding, beginning of year | | | 4,497,263 | | | | 4,698,748 | |
| | Shares sold | | | 99,903 | | | | 47,684 | |
| | Dividends reinvested | | | 45,613 | | | | 541,278 | |
| | Shares redeemed | | | (707,393 | ) | | | (790,447 | ) |
| | Shares outstanding, end of year | | | 3,935,386 | | | | 4,497,263 | |
6. INVESTMENT TRANSACTIONS
Purchases and sales of investment securities, excluding short-term securities and short-term options, for the year ended December 31, 2019, were as follows:
Purchases | Sales |
U.S. Government | Other | U.S. Government | Other |
| $— | $73,816,451 | $— | $63,426,892 |
| 7. | FEDERAL TAX INFORMATION |
The Fund intends to utilize provisions of the federal income tax laws which allow it to carry a realized capital loss forward for an unlimited period. As of December 31, 2019, the Fund did not have a capital loss carryover.
As of December 31, 2019, the Fund’s most recently completed fiscal year end, the components of distributable earnings on a tax basis were as follows:
| | Tax cost of investments | | $ | 134,273,111 | |
| | Gross tax unrealized appreciation | | $ | 52,844,616 | |
| | Gross tax unrealized depreciation | | | (1,547,081 | ) |
| | Net tax unrealized appreciation on | | | | |
| | investments and derivatives | | | 51,297,535 | |
| | Undistributed ordinary income | | | — | |
| | Undistributed long term capital gains | | | — | |
| | Distributable earnings | | | — | |
| | Other accumulated loss | | | (577,849 | ) |
| | Total distributable earnings | | $ | 50,719,686 | |
NOTES TO FINANCIAL STATEMENTS (Continued)
Year Ended December 31, 2019
The temporary book basis and tax-basis differences are attributable primarily to grantor trust income and straddle loss deferrals.
The Fund plans to distribute substantially all of the net investment income and net realized gains that it has realized on the sale of securities. These income and gains distributions will generally be paid once each year, on or before December 31. The character of distributions made during the year from net investment income or net realized gains may differ from the characterization for federal income tax purposes due to differences in the recognition of income, expense or gain items for financial reporting and tax reporting purposes.
The tax character of distributions paid were as follows:
| | | | Year Ended | | | Year Ended | |
| | | | December 31, 2019 | | | December 31, 2018 | |
| | Ordinary Income* | | $ | 673,644 | | | $ | 509,281 | |
| | Long-term capital gain | | $ | 1,643,635 | | | $ | 23,876,571 | |
| | * | For federal income tax purposes, distributions of short-term capital gains are treated as ordinary income distributions. |
On the Statement of Assets and Liabilities, the following adjustments were made for permanent tax adjustments:
| Total | Paid-In |
Distributable Earnings | Capital |
| $(184,679) | $184,679 |
These adjustments result primarily from the utilization of earnings and profits on shareholder redemptions.
Expenses are reduced through the deposit of minimum account maintenance fees into the Fund. By November 30th of each year, all accounts must meet one of three criteria: 1) have net investments (purchases less redemptions) totaling $1,500 or more, 2) have an account value greater than $1,500, or 3) be enrolled in the Fund’s Automatic Investment Plan. Accounts that do not meet one of these three criteria will be charged a $15 minimum account maintenance fee. This fee is used to lower the Fund’s expense ratio. For the fiscal year ended December 31, 2019, the Fund’s expenses were reduced $8,299 by utilizing minimum account maintenance fees pertaining to account balances as of November 30, 2019, resulting in a decrease in the expenses being charged to shareholders.
NOTES TO FINANCIAL STATEMENTS (Continued)
Year Ended December 31, 2019
| 9. | GUARANTEES AND INDEMNIFICATIONS |
In the normal course of business, the Fund enters into contracts with service providers that contain general indemnification clauses. The Fund’s maximum exposure under these arrangements is unknown as this would involve future claims against the Fund that have not yet occurred. Based on experience, the Fund expects the risk of loss to be remote.
REPORT OF INDEPENDENT REGISTERED PUBLIC ACCOUNTING FIRM
To the Shareholders of Muhlenkamp Fund and
Board of Trustees of Managed Portfolio Series
Opinion on the Financial Statements
We have audited the accompanying statement of assets and liabilities, including the schedule of investments, of Muhlenkamp Fund (the “Fund”), a series of Managed Portfolio Series, as of December 31, 2019, the related statement of operations for the year then ended, the statements of changes in net assets for each of the two years in the period then ended, including the related notes, and the financial highlights for each of the five years in the period then ended (collectively referred to as the “financial statements”). In our opinion, the financial statements present fairly, in all material respects, the financial position of the Fund as of December 31, 2019, the results of its operations for the year then ended, the changes in its net assets for each of the two years in the period then ended, and the financial highlights for each of the five years in the period then ended, in conformity with accounting principles generally accepted in the United States of America.
Basis for Opinion
These financial statements are the responsibility of the Fund’s management. Our responsibility is to express an opinion on the Fund’s financial statements based on our audits. We are a public accounting firm registered with the Public Company Accounting Oversight Board (United States) (“PCAOB”) and are required to be independent with respect to the Fund in accordance with the U.S. federal securities laws and the applicable rules and regulations of the Securities and Exchange Commission and the PCAOB.
We conducted our audits in accordance with the standards of the PCAOB. Those standards require that we plan and perform the audit to obtain reasonable assurance about whether the financial statements are free of material misstatement whether due to error or fraud.
Our audits included performing procedures to assess the risks of material misstatement of the financial statements, whether due to error or fraud, and performing procedures that respond to those risks. Such procedures included examining, on a test basis, evidence regarding the amounts and disclosures in the financial statements. Our procedures included confirmation of securities owned as of December 31, 2019, by correspondence with the custodian and brokers. Our audits also included evaluating the accounting principles used and significant estimates made by management, as well as evaluating the overall presentation of the financial statements. We believe that our audits provide a reasonable basis for our opinion.
We have served as the Fund’s auditor since 2008.
COHEN & COMPANY, LTD.
Cleveland, Ohio
February 21, 2020
TRUSTEES AND OFFICERS (Unaudited)
| | | Term of | Number | | Other |
| | | Office | of | | Directorships |
| | | and | Portfolios | Principal | Held |
| | Position(s) | Length of | in Trust | Occupation(s) | by Trustee |
| Name, Address | Held with | Time | Overseen | During the | During the |
and Year of Birth | the Trust | Served | by Trustee | Past Five Years | Past Five Years |
Independent Trustees | | | | | |
| Leonard M. Rush, CPA | Lead | Indefinite | 39 | Retired, Chief | Independent |
| 615 E. Michigan St. | Independent | Term; | | Financial Officer, | Trustee, |
| Milwaukee, WI 53202 | Trustee and | Since | | Robert W. | ETF Series |
| Year of Birth: 1946 | Audit | April | | Baird & Co. | Solutions |
| | Committee | 2011 | | Incorporated | (50 Portfolios) |
| | Chairman | | | (2000-2011). | (2012-Present); |
| | | | | | Director, |
| | | | | | Anchor |
| | | | | | Bancorp |
| | | | | | Wisconsin, Inc. |
| | | | | | (2011-2013) |
| | | | | | |
| David A. Massart | Trustee | Indefinite | 39 | Co-Founder | Independent |
| 615 E. Michigan St. | and | Term; | | and Chief | Trustee, |
| Milwaukee, WI 53202 | Valuation | Since | | Investment | ETF Series |
| Year of Birth: 1967 | Committee | April | | Strategist, | Solutions |
| | Chairman | 2011 | | Next | (50 Portfolios) |
| | | | | Generation | (2012-Present) |
| | | | | Wealth | |
| | | | | Management, | |
| | | | | Inc. (2005- | |
| | | | | Present). | |
| | | | | | |
| David M. Swanson | Trustee | Indefinite | 39 | Founder and | Independent |
| 615 E. Michigan St. | | Term; | | Managing | Trustee, ALPS |
| Milwaukee, WI 53202 | | Since | | Principal, | Variable |
| Year of Birth: 1957 | | April | | SwanDog | Investment |
| | | 2011 | | Strategic | Trust |
| | | | | Marketing, LLC | (10 Portfolios) |
| | | | | (2006-Present). | (2006-Present); |
| | | | | | Independent |
| | | | | | Trustee, |
| | | | | | RiverNorth |
| | | | | | Opportunities |
| | | | | | Closed-End |
| | | | | | Fund (2015- |
| | | | | | Present) |
TRUSTEES AND OFFICERS (Unaudited) (Continued)
| | | Term of | Number | | Other |
| | | Office | of | | Directorships |
| | | and | Portfolios | Principal | Held |
| | Position(s) | Length of | in Trust | Occupation(s) | by Trustee |
| Name, Address | Held with | Time | Overseen | During the | During the |
and Year of Birth | the Trust | Served | by Trustee | Past Five Years | Past Five Years |
Interested Trustee | | | | | |
| Robert J. Kern* | Chairman, | Indefinite | 39 | Retired, Executive | None |
| 615 E. Michigan St. | and | Term; | | Vice President, | |
| Milwaukee, WI 53202 | Trustee | Since | | U.S. Bancorp | |
| Year of Birth: 1958 | | January | | Fund Services, | |
| | | 2011 | | LLC (1994-2018). | |
| | | | | | |
Officers | | | | | |
| Brian R. Wiedmeyer | President | Indefinite | N/A | Vice President, | N/A |
| 615 E. Michigan St. | and | Term; | | U.S. Bancorp | |
| Milwaukee, WI 53202 | Principal | Since | | Fund Services, | |
| Year of Birth: 1973 | Executive | November | | LLC (2005- | |
| | Officer | 2018 | | Present). | |
| | | | | | |
| Deborah Ward | Vice | Indefinite | N/A | Senior Vice | N/A |
| 615 E. Michigan St. | President, | Term; | | President, U.S. | |
| Milwaukee, WI 53202 | Chief | Since | | Bancorp Fund | |
| Year of Birth: 1966 | Compliance | April | | Services, LLC | |
| | Officer and | 2013 | | (2004-Present). | |
| | Anti-Money | | | | |
| | Laundering | | | | |
| | Officer | | | | |
| | | | | | |
| Benjamin Eirich | Vice | Indefinite | N/A | Assistant Vice | N/A |
| 615 E. Michigan St. | President, | Term; | | President, U.S. | |
| Milwaukee, WI 53202 | Treasurer | Since | | Bancorp Fund | |
| Year of Birth: 1981 | and | August | | Services, LLC | |
| | Principal | 2019 | | (2008-Present). | |
| | Financial | (Treasurer); | | | |
| | Officer | Since | | | |
| | | November | | | |
| | | 2018 (Vice | | | |
| | | President) | | | |
| * | Mr. Kern is an “interested person” of the Trust as defined by the 1940 Act by virtue of the fact that he was a board member of the Fund’s principal underwriter, Quasar Distributors, LLC. |
TRUSTEES AND OFFICERS (Unaudited) (Continued)
| | | Term of | Number | | Other |
| | | Office | of | | Directorships |
| | | and | Portfolios | Principal | Held |
| | Position(s) | Length of | in Trust | Occupation(s) | by Trustee |
| Name, Address | Held with | Time | Overseen | During the | During the |
and Year of Birth | the Trust | Served | by Trustee | Past Five Years | Past Five Years |
| Thomas A. Bausch, Esq. | Secretary | Indefinite | N/A | Vice President, | N/A |
| 615 E. Michigan St. | | Term; | | U.S. Bancorp | |
| Milwaukee, WI 53202 | | Since | | Fund Services, | |
| Year of Birth: 1979 | | November | | LLC (2016- | |
| | | 2017 | | Present); | |
| | | | | Associate, | |
| | | | | Godfrey & | |
| | | | | Kahn S.C. | |
| | | | | (2012-2016). | |
| | | | | | |
| Douglas Schafer | Vice | Indefinite | N/A | Assistant Vice | N/A |
| 615 E. Michigan St. | President | Term; | | President, U.S. | |
| Milwaukee, WI 53202 | and | Since | | Bancorp Fund | |
| Year of Birth: 1970 | Assistant | May | | Services, LLC | |
| | Treasurer | 2016 | | (2002-Present). | |
| | | (Assistant | | | |
| | | Treasurer); | | | |
| | | Since | | | |
| | | November | | | |
| | | 2018 (Vice | | | |
| | | President) | | | |
| | | | | | |
| Michael Cyr II | Vice | Indefinite | N/A | Officer, U.S. | N/A |
| 615 E. Michigan St. | President | Term; | | Bancorp Fund | |
| Milwaukee, WI 53202 | and | Since | | Services, LLC | |
| Year of Birth: 1992 | Assistant | August | | (2013-Present). | |
| | Treasurer | 2019 | | | |
ADDITIONAL INFORMATION (Unaudited)
Year Ended December 31, 2019
1. BROKER COMMISSIONS
For the year ended December 31, 2019, the Fund paid $43,111 in broker commissions. These commissions are included in the cost basis of investments purchased, and deducted from the proceeds of securities sold. This accounting method is the industry standard for mutual funds. Were these commissions itemized as expenses, they would equal approximately 1.1 cents per invested Fund share and would have increased the expense ratio from 1.12% to 1.14%.
2. QUALIFIED DIVIDEND INCOME PERCENTAGE
For the fiscal year ended December 31, 2019, certain dividends paid by the Fund may be reported as qualified dividend income and may be eligible for taxation at capital gain rates. The percentage of dividends declared from ordinary income designated as qualified dividend income was 100.00% for the Fund.
For corporate shareholders, the percentage of ordinary income distributions qualifying for the corporate dividends received deduction for the fiscal year ended December 31, 2019 was 100.00% for the Fund.
The percentage of taxable ordinary income distributions that are designated as short-term capital gain distribution under Internal Revenue Section 871(k)(2)(C) for the Fund was 0.00%.
3. INFORMATION ABOUT PROXY VOTING
Information regarding how the Fund votes proxies relating to portfolio securities is available without charge upon request by calling toll-free at 1-800-860-3863 or by accessing the SEC’s website at www.sec.gov. Information regarding how the Fund voted proxies relating to portfolio securities during the most recent twelve month period ending June 30 is available on the SEC’s website at www.sec.gov or by calling the toll-free number listed above.
4. AVAILABILITY OF QUARTERLY PORTFOLIO SCHEDULE
The Fund files its complete schedule of portfolio holdings with the SEC for the first and third quarters of each fiscal year on Form N-Q. The filing will be available, upon request, by calling 1-800-860-3863. Furthermore, you will be able to obtain a copy of the filing on the SEC’s website at www.sec.gov. The Fund’s Forms N-Q may also be reviewed and copied at the SEC’s Public Reference Room in Washington, DC, and information on the operation of the Public Reference Room may be obtained by calling 1-202-551-8090.
PRIVACY NOTICE (UNAUDITED)
The Fund collects only relevant information about you that the law allows or requires it to have in order to conduct its business and properly service you. The Fund collects financial and personal information about you (“Personal Information”) directly (e.g., information on account applications and other forms, such as your name, address, and social security number, and information provided to access account information or conduct account transactions online, such as password, account number, e-mail address, and alternate telephone number), and indirectly (e.g., information about your transactions with us, such as transaction amounts, account balance and account holdings).
The Fund does not disclose any non-public personal information about its shareholders or former shareholders other than for everyday business purposes such as to process a transaction, service an account, respond to court orders and legal investigations or as otherwise permitted by law. Third parties that may receive this information include companies that provide transfer agency, technology and administrative services to the Fund, as well as the Fund’s investment adviser who is an affiliate of the Fund. If you maintain a retirement/educational custodial account directly with the Fund, we may also disclose your Personal Information to the custodian for that account for shareholder servicing purposes. The Fund limits access to your Personal Information provided to unaffiliated third parties to information necessary to carry out their assigned responsibilities to the Fund. All shareholder records will be disposed of in accordance with applicable law. The Fund maintains physical, electronic and procedural safeguards to protect your Personal Information and requires its third party service providers with access to such information to treat your Personal Information with the same high degree of confidentiality.
In the event that you hold shares of the Fund through a financial intermediary, including, but not limited to, a broker-dealer, credit union, bank or trust company, the privacy policy of your financial intermediary governs how your non-public personal information is shared with unaffiliated third parties.
This page was intentionally left blank.
INVESTMENT ADVISER
Muhlenkamp & Company, Inc.
5000 Stonewood Drive, Suite 300
Wexford, PA 15090
ADMINISTRATOR, FUND ACCOUNTANT AND TRANSFER AGENT
U.S. Bancorp Fund Services, LLC
615 East Michigan Street
Milwaukee, WI 53202
CUSTODIAN
U.S. Bank N.A.
1555 North Rivercenter Drive, Suite 302
Milwaukee, WI 53212
DISTRIBUTOR
Quasar Distributors, LLC
777 East Wisconsin Avenue
Milwaukee, WI 53202
INDEPENDENT REGISTERED PUBLIC ACCOUNTING FIRM
Cohen & Company, Ltd.
1350 Euclid Avenue, Suite 800
Cleveland, OH 44115
LEGAL COUNSEL
Stradley Ronon Stevens & Young, LLP
2005 Market Street, Suite 2600
Philadelphia, PA 19103
Item 2. Code of Ethics.
The Registrant has adopted a code of ethics that applies to the Registrant’s principal executive officer and principal financial officer. The Registrant has not made any substantive amendments to its code of ethics during the period covered by this report.
The Registrant has not granted any waivers from any provisions of the code of ethics during the period covered by this report.
A copy of the Registrant’s code of ethics that applies to the Registrant’s principal executive officer and principal financial officer is filed herewith.
Item 3. Audit Committee Financial Expert.
The Registrant’s Board of Trustees has determined that there is at least one audit committee financial expert serving on its audit committee. Leonard M. Rush is the “audit committee financial expert” and is considered to be “independent” as each term is defined in Item 3 of Form N-CSR.
Item 4. Principal Accountant Fees and Services.
The Registrant has engaged its principal accountant to perform audit services, audit-related services, tax services and other services during the past two fiscal years. “Audit services” refer to performing an audit of the Registrant's annual financial statements or services that are normally provided by the accountant in connection with statutory and regulatory filings or engagements for those fiscal years. “Audit-related services” refer to the assurance and related services by the principal accountant that are reasonably related to the performance of the audit. “Tax services” refer to professional services rendered by the principal accountant for tax compliance, tax advice, and tax planning, including reviewing the Fund’s tax returns and distributions. There were no “other services” provided by the principal accountant. For the fiscal years ended December 31, 2019 and December 31, 2018, the Fund’s principal accountant was Cohen & Company, Ltd. The following table details the aggregate fees billed or expected to be billed for each of the past two fiscal years for audit fees, audit-related fees, tax fees and other fees by the principal accountant.
| | FYE 12/31/2019 | FYE 12/31/2018 |
Audit Fees | $16,500 | $16,000 |
Audit-Related Fees | $ - | $ - |
Tax Fees | $ 4,500 | $ 3,000 |
All Other Fees | $ - | $ - |
The audit committee has adopted pre-approval policies and procedures that require the audit committee to pre‑approve all audit and non‑audit services of the Registrant, including services provided to any entity affiliated with the Registrant.
The percentage of fees billed by Cohen & Company, Ltd. applicable to non-audit services pursuant to waiver of pre-approval requirement was as follows:
| | FYE 12/31/2019 | FYE 12/31/2018 |
Audit-Related Fees | 0% | 0% |
Tax Fees | 0% | 0% |
All Other Fees | 0% | 0% |
All of the principal accountant’s hours spent on auditing the Registrant’s financial statements were attributed to work performed by full-time permanent employees of the principal accountant.
The following table indicates the non-audit fees billed or expected to be billed by the Registrant’s accountant for services to the Registrant and to the Registrant’s investment adviser (and any other controlling entity, etc.-not sub-adviser) for the last two years. The audit committee of the board of trustees/directors has considered whether the provision of non-audit services that were rendered to the Registrant’s investment adviser is compatible with maintaining the principal accountant’s independence and has concluded that the provision of such non-audit services by the accountant has not compromised the accountant’s independence.
Non-Audit Related Fees | FYE 12/31/2019 | FYE 12/31/2018 |
Registrant | $0 | $0 |
Registrant’s Investment Adviser | $0 | $0 |
Item 5. Audit Committee of Listed Registrants.
Not applicable to Registrants who are not listed issuers (as defined in Rule 10A-3 under the Securities Exchange Act of 1934).
Item 6. Schedule of Investments.
(a) Schedule of Investments is included as part of the report to shareholders filed under Item 1 of this Form.
(b) Not applicable.
Item 7. Disclosure of Proxy Voting Policies and Procedures for Closed-End Management Investment Companies.
Not applicable to open-end investment companies.
Item 8. Portfolio Managers of Closed-End Management Investment Companies.
Not applicable to open-end investment companies.
Item 9. Purchases of Equity Securities by Closed‑End Management Investment Company and Affiliated Purchasers.
Not applicable to open-end investment companies.
Item 10. Submission of Matters to a Vote of Security Holders.
There have been no material changes to the procedures by which shareholders may recommend nominees to the Registrant’s Board of Trustees.
Item 11. Controls and Procedures.
(a) | The Registrant’s President and Treasurer have reviewed the Registrant's disclosure controls and procedures (as defined in Rule 30a-3(c) under the Investment Company Act of 1940 (the “Act”)) as of a date within 90 days of the filing of this report, as required by Rule 30a-3(b) under the Act and Rules 13a-15(b) or 15d‑15(b) under the Securities Exchange Act of 1934. Based on their review, such officers have concluded that the disclosure controls and procedures are effective in ensuring that information required to be disclosed in this report is appropriately recorded, processed, summarized and reported and made known to them by others within the Registrant and by the Registrant’s service provider. |
(b) | There were no significant changes in the Registrant's internal control over financial reporting (as defined in Rule 30a-3(d) under the Act) that occurred during the period covered by this report that has materially affected, or is reasonably likely to materially affect, the Registrant's internal control over financial reporting. |
Item 12. Disclosure of Securities Lending Activities for Closed-End Management Investment Companies
Not applicable to open-end investment companies.
Item 13. Exhibits.
| (a) | (1) Any code of ethics or amendment thereto, that is the subject of the disclosure required by Item 2, to the extent that the Registrant intends to satisfy Item 2 requirements through filing an exhibit. 1) Filed herewith. |
(2) Certifications pursuant to Section 302 of the Sarbanes-Oxley Act of 2002. Filed herewith.
(3) Any written solicitation to purchase securities under Rule 23c‑1 under the Act sent or given during the period covered by the report by or on behalf of the Registrant to 10 or more persons. Not applicable to open-end investment companies.
(4) Change in the Registrant’s independent public accountant. There was no change in the Registrant’s independent public accountant for the period covered by this report.
| (b) | Certifications pursuant to Section 906 of the Sarbanes‑Oxley Act of 2002. Furnished herewith. |
SIGNATURES
Pursuant to the requirements of the Securities Exchange Act of 1934 and the Investment Company Act of 1940, the Registrant has duly caused this report to be signed on its behalf by the undersigned, thereunto duly authorized.
(Registrant) Managed Portfolio Series
By (Signature and Title) /s/Brian R. Wiedmeyer
Brian R. Wiedmeyer, President
Date March 5, 2020
Pursuant to the requirements of the Securities Exchange Act of 1934 and the Investment Company Act of 1940, this report has been signed below by the following persons on behalf of the Registrant and in the capacities and on the dates indicated.
By (Signature and Title) /s/Brian R. Wiedmeyer
Brian R. Wiedmeyer, President
Date March 5, 2020
By (Signature and Title) /s/Benjamin J. Eirich
Benjamin J. Eirich, Treasurer
Date March 5, 2020