UNITED STATES
SECURITIES AND EXCHANGE COMMISSION
Washington, D.C. 20549
FORM N-CSR
CERTIFIED SHAREHOLDER REPORT OF REGISTERED
MANAGEMENT INVESTMENT COMPANIES
Investment Company Act file number811-22525
Managed Portfolio Series
(Exact name of registrant as specified in charter)
615 East Michigan Street
Milwaukee, WI 53202
(Address of principal executive offices) (Zip code)
Brian R. Wiedmeyer, President
Managed Portfolio Series
c/o U.S. Bancorp Fund Services, LLC
777 East Wisconsin Ave, 5thFl
Milwaukee, WI 53202
(Name and address of agent for service)
(414) 765-6844
Registrant's telephone number, including area code
Date of fiscal year end:November 30, 2019
Date of reporting period:November 30, 2019
Item 1. Reports to Stockholders.
|  | |
| | |
| Beginning on January 1, 2021, as permitted by regulations adopted by the Securities and Exchange Commission, paper copies of the Fund’s annual and semi-annual shareholder reports will no longer be sent by mail, unless you specifically request paper copies of the reports. Instead, the reports will be made available on the Fund’s website (http://etp.tortoiseindexsolutions.com), and you will be notified by mail each time a report is posted and provided with a website link to access the report. If you already elected to receive shareholder reports electronically, you will not be affected by this change and you need not take any action. You may elect to receive shareholder reports and other communications from the Fund electronically anytime by contacting your financial intermediary (such as a broker-dealer or bank) or, if you are a direct investor, by calling 844-TR-INDEX (844-874-6339) or by sending an e-mail request to info@tortoiseindexsolutions.com. You may elect to receive all future reports in paper free of charge. If you invest through a financial intermediary, you can contact your financial intermediary to request that you continue to receive paper copies of your shareholder reports. If you invest directly with the Fund, you can call 844-TR-INDEX (844-874-6339) or send an email request to info@tortoiseindexsolutions.com to let the Fund know you wish to continue receiving paper copies of your shareholder reports. Your election to receive reports in paper will apply to all funds held in your account if you invest through your financial intermediary or all Funds held with the fund complex if you invest directly with the Fund. | |
| |
| |
| |
| |
| Tortoise |
| 2019 Annual Report |
| |
Table of Contents
| Letter to Shareholders | | 2 |
| | | |
| TPYP: Fund Focus | | 5 |
| | | |
| TBLU: Fund Focus | | 7 |
| | | |
| TCLD: Fund Focus | | 9 |
| | | |
| TPAY: Fund Focus | | 11 |
| | | |
| Expense Example | | 15 |
| | | |
| Financial Statements | | 17 |
| | | |
| Notes to Financial Statements | | 31 |
| | | |
| Report of Independent Registered Public Accounting Firm | | 37 |
| | | |
| Trustees and Officers | | 38 |
| | | |
| Additional Information | | 40 |
| |
| |
| 2019 Annual Report| November 30, 2019 |
| |
| |
| |
| Sector allocations |
| | | | | | | | |
| Name/Ticker | | Primary focus | | Total assets
($ 000’s)1 | | By asset type2 | | By ownership structure2 |
Tortoise North American
Pipeline Fund NYSE Arca: TPYP
Inception: 6/29/2015 | | North American
pipeline
companies | | $483,328.7 | | 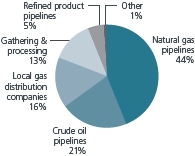 | | 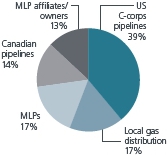 |
| Name/Ticker | | Primary focus | | Total assets
($ 000’s)1 | | By sector2 | | By geography2 |
Tortoise Global Water
ESG Fund CBOE Bzx: TBLU
Inception: 2/14/2017 | | Water
companies | | $15,278.1 | | 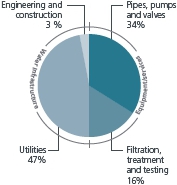 | | 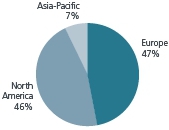 |
| Name/Ticker | | Primary focus | | Total assets
($ 000’s)1 | | By sector2 | | By revenue2 |
Tortoise Cloud
Infrastructure Fund CBOE Bzx: TCLD
Inception: 1/31/2019 | | Cloud
infrastructure
companies | | N/A | | 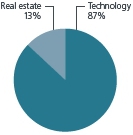 | | 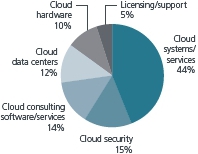 |
| Name/Ticker | | Primary focus | | Total assets
($ 000’s)1 | | By sector2 | | By revenue2 |
Tortoise Digital Payments
Infrastructure Fund CBOE Bzx: TPAY
Inception: 1/31/2019 | | Digital payment
companies | | $9,502.1 | |  | |  |
| 1 | As of 12/31/2019 |
| 2 | As of 11/30/2019 |
| 3 | Tortoise Cloud Infrastructure Fund liquidated on December 31, 2019. |
Dear shareholder,
Tortoise invests in essential assets and creates product solutions that allow investors to participate in the opportunities, innovations and development of these critical and essential assets including energy infrastructure, sustainable water and digital infrastructure.
Energy value chain
The broader energy sector, as represented by the S&P Energy Select Sector®Index, finished the fourth fiscal quarter ending November 30, 2019 in positive territory, returning 3.3%, bringing fiscal year 2019 performance to -7.7%. Oil markets experienced significant volatility during the period. Prices were caught in a tug-of-war between escalating tensions in the Middle East culminating in significant, but temporary supply outages, mixed signals from U.S.-China trade negotiations impacting demand growth.
Upstream
The Tortoise North American Oil and Gas Producers IndexSMreturned -1.3% in the fourth fiscal quarter, bringing fiscal year performance to -22.7%. Crude oil prices, represented by West Texas Intermediate (WTI), began the fiscal quarter at $53.94 per barrel and peaked at $62.90 on Sept. 16, 2019 following the attacks on Saudi oil infrastructure. Prices troughed quickly thereafter at $52.45 on Oct. 3, 2019 on Saudi claims of minimal disruption to production and the potential for a U.S.-Iran deal before ending the fiscal year at $58.11.
U.S. crude oil production growth is expected to broadly moderate in 2020 as compared to the rapid growth over the past two years. Specifically, U.S. crude oil production is projected to average 12.3 million barrels per day (MMbbl/d) in 2019 and 13.2 MMbbl/d in 2020. U.S. producers are facing increased pressure from investors to exhibit capital discipline and reign in production growth in favor of higher free cash flow generation and return of capital to shareholders. Nonetheless, with multiple years of tremendous production growth, propelled by the U.S. shale revolution, the U.S. transitioned into a net exporter of oil and petroleum products for the first time in recent history. The U.S. became a net exporter of oil and petroleum products in September 2019 with net exports projected to grow in 2020 and beyond1. Rising U.S. energy exports of liquids and natural gas are expected to positively affect the U.S. trade deficit and will ultimately help reduce global Co2emissions, along with renewables, as they take market share from coal.
Following the end of the fiscal year, the Organization of Petroleum Exporting Countries (OPEC) and their Non-OPEC partners (OPEC+) announced in December a clear goal of establishing a floor for crude prices through the seasonally weaker first quarter of 2020. OPEC+ members agreed to an incremental 0.5 MMbbl/d cut to the existing agreement taking the official cut to 1.7 MMbbl/d for 1Q20. In addition, Saudi Arabia agreed to continue its over-compliance of 0.4 MMbbl/d implying a new commitment level of cutting 2.1 MMbbl/d. Saudi Arabia is focused on stabilizing crude oil prices following the recent Saudi Aramco IPO. While the deal was not extended, OPEC+ did set a date for an extraordinary meeting to be held in early March 2020 to determine the need for additional cuts. Emphasis will likely be placed upon improved compliance from various OPEC members with poor historical compliance (Iraq, Nigeria, and UAE). With trade tensions easing and the global economy not showing any signs of a true slowdown, oil demand growth is currently expected to improve in 2020, which should bring worldwide supply and demand into better balance.
Natural gas demand has remained robust supported by record levels of domestic power burn, increased exports to Mexico and record liquefied natural gas (LNG) exports driven by the startup of three new liquefaction and export facilities (Elba Island, Cameron LNG, Freeport LNG). However, surging natural gas supply more than offset strong demand, resulting in an elevated pace of inventory builds and pricing pressure through much of the period. Natural gas prices, represented by Henry Hub, opened the fiscal quarter at $2.39 per million British thermal units, hit a low of $2.08 on Oct. 18, and then peaked at $2.87 in November, due to colder than average weather in the midwest, before ending the fiscal year back down to $2.46.
Persistently low natural gas prices have prompted natural gas producers to reign in capex budgets and drilling programs in 2020. While natural gas production is expected to continue growing, the pace of supply growth is set to slow measurably, with production expected to average 91.8 billion cubic feet per day (Bcf/d) in 2019 and 93.8 Bcf/d in 2020. The backdrop of slowing production growth and strong domestic and export demand paints a picture of improving natural gas fundamentals in the future. The second wave of LNG export facilities, led by final investment decisions (FIDs) made to Exxon’s Golden Pass and Venture Global’s Calcasieu Pass LNG export facilities in 2019 will provide another meaningful catalyst for natural gas export demand growth from 2022 to 2025.
Midstream
Midstream energy performance lagged broader energy in the fourth fiscal quarter with the Tortoise North American Pipeline IndexSMreturning -2.6% and the Tortoise MLP Index®returning -8.9%, bringing fiscal year performance to 5.9% and -7.0%, respectively. The sharp contrast in midstream index performance is due to midstream companies structured as C-Corps outperforming those structured as MLPs. C-Corps benefitted from several items versus MLPs, including: stronger corporate governance, broad market index inclusion for some companies, lack of K-1s, and a more certain corporate structure. Contributing to broad midstream underperformance for the fiscal quarter were concerns regarding a slowdown in U.S. production growth, political rhetoric regarding proposed fracking bans from Democratic Presidential candidates and tax loss selling. Gathering and processing companies in particular suffered following lower natural gas and natural gas liquids (NGL) pricing and the ‘going concern’ language introduced into Chesapeake Energy’s (CHK) quarterly filing. These items drove negative sentiment and raised questions related to producer financial health, counterparty risk and companies’ exposure to drilling slowdowns. However, the U.S. has seen tremendous production growth in recent years and we believe a more moderate pace of growth is healthy for the midstream sector through the reduction in growth capital expenditures and reduced risk of takeaway capacity overbuild.
| |
| |
| 2019 Annual Report| November 30, 2019 |
| |
| |
| |
| |
DCP Midstream LP (DCP) became the latest MLP to announce the elimination of its Incentive Distribution Rights (IDRs) in the fourth fiscal quarter. As the era of simplification comes to a close, the results have advanced the midstream sector in our view and accomplished widespread cost of capital and corporate governance improvements. Looking forward, the midstream sector continues to evolve. There has been an industry-wide shift to higher distribution coverage and self-funding the equity portion of capital expenditure programs. With the expected moderation in U.S. production growth, midstream companies are now shifting focus toward executing on delivering value through the return of capital to shareholders in the form of debt reduction, sustainable yields and distribution growth, and potential stock buybacks. A particular emphasis on the generation of free cash flow yields comparable to other S&P 500 sectors continues to emerge, achieved through the sale of non-core assets and the reduction of growth capital expenditures.
Interest in publicly traded midstream companies and assets, from both public and private entities, has remained elevated, highlighting their strategic value and attractive valuations. Recently announced or closed transactions include Energy Transfer’s (ET) acquisition of SemGroup Corporation (SEMG), DTE Energy’s (DTE) acquisition of a natural gas gathering system in the Haynesville Shale and Pembina Pipeline Corp’s (PPL CN) acquisition of Kinder Morgan Canada and the Cochin pipeline.
Capital markets activity increased during the fourth fiscal quarter with MLPs and other pipeline companies raising approximately $10.8 billion in total capital, with nearly all of the issuance in debt. This brings the total capital raised for the fiscal year to approximately $36.4 billion, slightly lower than the previous fiscal year. As expected, alternative options for capital and self-funding projects have continued to trend higher.
Merger and acquisition activity among MLPs and other pipeline companies in the last fiscal quarter of the year was largely driven by Energy Transfer’s acquisition of SemGroup Corporation, which at $5.1 billion made up nearly all of the merger and acquisition activity in the quarter. This brought the fiscal year’s announced transactions to $26.6 billion. This is significantly below the previous year when many large simplification transactions were announced. This fiscal year’s activity was driven by three large transactions. In addition to Energy Transfer’s acquisition of SemGroup Corporation, MPLX purchased Andeavor Logistics for approximately $13.5 billion and Pembina Pipeline Corporation purchased two businesses from Kinder Morgan for approximately $4.4 billion combined.
Downstream
Refinery utilization has remained challenged in 2019 due to heavy spring and fall turnarounds in preparation for the International Maritime Organization’s Jan. 1, 2020 implementation of sulfur reduction regulations on the shipping industry (IMO 2020), unplanned refinery outages, as well as the closure of Philadelphia Energy Solutions’ 350 Mbbl/d Philadelphia refinery, the largest refining complex on the east coast. IMO 2020 has positioned U.S. refiners to take advantage of higher distillate pricing and more heavily discounted medium-heavy sour crude oils as they have more flexibility than international refiners to use a wide range of crude oil feedstocks. We expected that U.S. refinery utilization and throughput will exhibit strong growth as refiners attempt to capture margin upside driven by IMO 2020.
Incremental NGL supply from completed Permian takeaway projects and overall liquids production growth surpassed current levels of domestic NGL demand, primarily from petrochemical facilities, resulting in price pressure. We expect that moderating northeast liquids production growth and increased demand from petrochemical projects coming online in late 2019 and early 2020 will begin to draw down inventories.
The solar industry is set to install 13 gigawatts (GWs) of capacity in the U.S. in 2019, the second highest annual installation on record. Much of the activity has been concentrated in the southwest and southeast, with Florida and Texas ranking behind California in year-to-date installations. Signed solar PPA prices range from $18-35 megawatts/ hour, putting solar on par with new gas generation and competitive with the operating costs of existing coal plants. Costs continue to decline, as evidenced by the 12% decline year-over-year in Q3 2019 to $0.95/watt for utility-scale projects. On the policy front, the investment tax credit (ITC) is set to phase down for projects beginning construction at the end of 2019. We continue to monitor efforts to extend the ITC as we enter 2020, but do not view an extension as necessary given anticipated continued cost declines.
Wind installations totaled 1,927 megawatts (MWs) in the third calendar quarter of 2019, reaching a total installed capacity of more than 100,000 MW across the U.S. with an additional 46,500 MW of capacity currently under construction or in advanced development. Nineteen states now have more than 1,000 MW under construction or advanced development. Texas hosts 19% of the total development pipeline, followed by Wyoming (11%), Oklahoma (7%), Iowa (6%), and Virginia (6%). It is also important to have offtake agreements in place. Currently, 44% of capacity in the pipeline has a Power Purchase Agreement (PPA) in place, while 28% is utility-owned and 6% has a hedge contract.4New developments are largely being driven by corporate customers who have signed 64% of capacity contracted in the third quarter. Turbine technology continues to improve with 22% of new turbines installed year to date rated between 3.4 MW and 3.6 MW in size.4
Water
The water sector, as measured by the Tortoise Global Water ESG Index, returned 23.9% for the fiscal year period ending November 30, 2019. The Tortoise Global Water ESG Fund seeks to track this index. The leading performance contributor during the period was the water infrastructure subsector, which is primarily comprised of water utilities. The water infrastructure subsector continues to benefit from a large backlog of growth projects as the group is focused on directing capital toward improving infrastructure across the globe. Organic projects are driving attractive earnings growth. In addition, governments are increasingly selling publically owned water systems to investor-owned utilities, providing further support for earnings growth. The water equipment/services providers also contributed to positive performance during the period. The subsector continues to profit from increased spending by water utilities and industrial users of water. We believe technology-oriented companies, including those with smart meters, filtration, treatment, and test offerings, are best positioned to capture future growth opportunities. The long-term earnings growth prospects are appealing as the subsector continues to innovate and adopt technologies to solve water shortfalls and improve demand efficiency.
Our long-term outlook remains positive for the water sector as we believe investment in infrastructure and technology is needed now to solve the water crisis. The investment opportunity is compelling, with visibility into a long runway of investment, driving strong earnings growth. While slower economic growth may present a headwind to the group, we believe the sector will benefit from executing on projects and adopting leading technologies to ensure a safe and reliable water supply across the world for years to come.
Digital Infrastructure
Cloud Infrastructure
For the fiscal period January 31, 2019 through November 30, 2019, the Tortoise Global Cloud Infrastructure IndexSMreturned 13.3%, compared to the S&P 500, which returned 18.2% over the same time period. We believe the long-term growth trajectory of the cloud computing industry is strong as enterprises increasingly rely on cloud providers for many services ranging from software delivery to full service computing infrastructure. Increased data consumption and storage, demand for real time data interactions, and a host of other factors continue to drive demand for computing space and power. Cloud systems and services companies contributed the most to the index return. The best performing sectors were data centers, and cloud security, which were driven by solid fundamentals as the need for computing, storage and interconnections grow.
Digital Payments Infrastructure
For the fiscal period January 31, 2019 through November 30, 2019, the Tortoise Global Digital Payments Infrastructure Index returned 30.2%, well outperforming the S&P 500. Merger and acquisition activity drove some actual returns. In March, Worldpay, Inc. announced the planned acquisition by Fidelity National Information Services and at the end of May, Total Systems Services announced the planned acquisition by Global Payments. Due to these transactions, the electronic transaction processing segment was the best performing sector for the fiscal year. Other credit value chain participants, such as the merchant payment products/services and the major credit card networks, also performed extremely well as the entire digital value chain grew. Companies in the financial services market place were the worst performing group as crackdowns on the industry, specifically in Asia, impacted company returns materially.
Concluding thoughts
We expect plenty of opportunities in essential assets in 2020. We are optimistic across the energy sector where we expect supply and demand will find better balance and companies will shine a brighter light on their cash flow as they return it to shareholders. We continue to believe in the sustainable water sector as the world strives to solve the global water crisis. Our outlook on digital infrastructure remains positive, particularly in the electronic payments segment. We maintain conviction in essential assets as they continue to highlight their critical nature across the globe.
| 1 | Energy Information Administration, Short-Term Energy Outlook, July 2019 |
| 2 | PIRA, May 2019 |
| 3 | Wood Mackenzie, Power and Renewables, December 2019 |
| 4 | AWEA, July – September 2019 |
The S&P Energy Select Sector®Index is a capitalization-weighted index of S&P 500®Index companies in the energy sector involved in the development or production of energy products. The Tortoise North American Oil and Gas Producers IndexSMis a float-adjusted, capitalization-weighted index of North American energy companies engaged primarily in the production of crude oil, condensate, natural gas or natural gas liquids (NGLs). The Tortoise North American Pipeline IndexSMis a float adjusted, capitalization-weighted index of energy pipeline companies domiciled in the United States and Canada. The Tortoise MLP Index®is a float-adjusted, capitalization-weighted index of energy master limited partnerships. The Tortoise Global Water ESG IndexSMis a proprietary, rules-based, modified capitalization-weighted, float-adjusted index comprised of companies that are materially engaged in the water infrastructure or water management industries. The Tortoise Global Cloud Infrastructure IndexSMis a proprietary, rules-based, modified market capitalization-weighted, float-adjusted index comprised of companies that are materially engaged in the cloud infrastructure industry, including cloud systems/services, cloud consulting software/services, cloud security, cloud hardware and cloud data centers. The Tortoise Global Digital Payments Infrastructure IndexSMis a proprietary, rules-based, modified market capitalization-weighted, float-adjusted index comprised of companies that are materially engaged in digital payments, including merchant processing and settlement, real time record keeping, settlement networks, and fintech products/services that facilitate the ease, efficiency and speed of electronic transactions. This includes companies whose primary business is comprised of one or a combination of the following categories: credit card networks, electronic transaction processing and associated products/services, credit card issuers, electronic transaction processing software (payments fintech) or online financial services market places.
Tortoise Index Solutions, LLC has contracted with S&P Opco, LLC(a subsidiary of S&P Dow Jones Indices LLC) to calculate and maintain the Tortoise MLP Index®, Tortoise North American Pipeline IndexSM, Tortoise North American Oil and Gas Producers IndexSMand Tortoise Global Water ESG IndexSM. These Indices are not sponsored by S&P Dow Jones Indices or its affiliates or its third party licensors (collectively, “S&P Dow Jones Indices LLC”). S&P Dow Jones Indices will not be liable for any errors or omission in calculating these Indices. “Calculated by S&P Dow Jones Indices” and its related stylized mark(s) are service marks of S&P Dow Jones Indices and have been licensed for use by Tortoise Index Solutions, LLC and its affiliates. S&P®is a registered trademark of Standard & Poor’s Financial Services LLC (“SPFS”), and Dow Jones®is a registered trademark of Dow Jones Trademark Holdings LLC (“Dow Jones”).
Tortoise Index Solutions, LLC has contracted with Solactive AG (“Solactive”) to calculate the Tortoise Global Cloud Infrastructure IndexSMand Tortoise Global Digital Payments Infrastructure IndexSM. The financial instruments that are based on these indices are not sponsored, endorsed, promoted or sold by Solactive in any way, and Solactive makes no express or implied representation, guarantee or assurance with regard to: (a) the advisability in investing in the financial instruments; (b) the quality, accuracy and/or completeness of these indices or the calculations thereof; and/or (c) the results obtained or to be obtained by any person or entity from the use of these indices.
Tortoise Indices are the exclusive property of Tortoise Index Solutions. LLC.
Free cash flow is the cash a company produces through its operations, less the cost of total capital expenditures (growth and maintenance).
It is not possible to invest directly in an index.
Performance data quoted represents past performance; past performance does not guarantee future results. Like any other stock, total return and market value will fluctuate so that an investment, when sold, may be worth more or less than its original cost.
| |
| |
| 2019 Annual Report| November 30, 2019 |
| |
| Tortoise North American Pipeline Fund |
| |
| |
Top ten holdings(as of November 30, 2019)
| 1. | | Enbridge Inc. | | 8.5% |
| 2. | | TC Energy Corporation | | 8.0% |
| 3. | | ONEOK, Inc. | | 7.9% |
| 4. | | Kinder Morgan, Inc. | | 7.7% |
| 5. | | The Williams Companies, Inc. | | 7.6% |
| 6. | | Pembina Pipeline Corporation | | 6.5% |
| 7. | | Enterprise Products Partners L.P. | | 5.0% |
| 8. | | Cheniere Energy, Inc. | | 4.9% |
| 9. | | Atmos Energy Corporation | | 4.6% |
| 10. | | Energy Transfer LP | | 3.7% |
TPYP key benefits
| ● | Access to the sizable pipeline network of one of the world’s largest consumers of energy |
| ● | Attractive total return potential in a historically defensive sector |
| ● | Flow-through structure allows for tax-efficient access to the pipeline sector |
| ● | Exposure to Tortoise North American Pipeline IndexSM |
| – | Effectively represents the characteristics of the market |
| – | A leading benchmark for analysis of the pipeline sector |
| – | Proprietary, research-driven and rules-based methodology |
| – | Constituent caps to allow for broader representation of the market and investability |
Value of $10,000 vs. Tortoise North American Pipeline IndexSM
Since inception on June 29, 2015 through November 30, 2019 |
 |
This chart illustrates the performance of a hypothetical $10,000 investment made on June 29, 2015 and is not intended to imply any future performance. The returns shown do not reflect the deduction of taxes that a shareholder would pay on the fund’s distributions or the redemption of fund shares. The chart assumes reinvestment of capital gains and dividends for the fund and dividends for the index.
The performance data quoted above represents past performance since June 29, 2015 through November 30, 2019. Past performance is no guarantee of future results. The investment return and value of an investment will fluctuate so that an investor’s shares, when redeemed, may be worth more or less than their original cost. Current performance of the fund may be obtained through the most recent month-end by calling 844-TR-INDEX (844-874-6339). Future performance may be lower or higher than the performance stated above.
The Tortoise North American Pipeline IndexSMis a float-adjusted, capitalization weighted index of pipeline companies headquartered in the United States and Canada. Returns include reinvested dividends. You cannot invest directly in an index.
| |
| |
| |
| |
| Tortoise North American Pipeline Fund(continued) |
| |
| |
Key asset performance drivers
| Top five contributors | | Company type | | Performance driver |
| TC Energy Corporation | | Midstream natural gas/natural gas liquids pipeline company | | Asset sales leading to reduced leverage high quality contracted cash flows with large back large back log of infrastructure projects across North America |
| Enbridge Inc. | | Midstream crude oil pipeline company | | Anticipated dividend growth of 5-7% in 2020+ |
| ONEOK, Inc. | | Midstream natural gas/natural gas liquids pipeline company | | Continued execution of backlog of infrastructure projects with high returns |
| Kinder Morgan, Inc. | | Midstream natural gas/natural gas liquids pipeline company | | Dividend increase of 25%, announced share buyback authorization and attractive multiple Canadian asset sale, exposure to liquefied natural gas (LNG) exports with significant insider buying |
| Atmos Energy Corporation | | Local gas distribution company | | Steady business model rewarded following lower interest rates |
| Bottom five contributors | | Company type | | Performance driver |
| Antero Midstream Corporation | | Midstream gathering and processing company | | Concerns around potential recontracting of gathering and process contracts and financial health of parent company Antero Resources (AR) as natural gas prices moved lower |
| Equitrans Midstream Corporation | | Midstream natural gas/natural gas liquids pipeline company | | Uncertainty around Mountain Valley Pipeline project |
| EnLink Midstream, LLC | | Midstream gathering and processing company | | Concern around producers slowing drilling activity in Oklahoma |
| Energy Transfer LP | | Midstream natural gas/natural gas liquids pipeline company | | Unexpected acquisition of SemGroup Corporation |
| Targa Resources Corp. | | Midstream gathering and processing company | | Leverage levels remain relatively high |
Total returns(as of November 30, 2019)
| Ticker | 1 year | | 3 year | | Since inception(1) | | Gross expense ratio |
| TPYP @ Market | 5.24% | | | 2.48% | | | | 1.28% | | | | 0.40% | |
| TPYP @ NAV | 5.22% | | | 2.50% | | | | 1.24% | | | | 0.40% | |
| S&P 500®Index(2) | 16.11% | | | 14.88% | | | | 12.32% | | | | — | |
| TNAPT(3) | 5.88% | | | 3.10% | | | | 1.85% | | | | — | |
| (1) | Reflects period from fund inception on June 29, 2015 through November 30, 2019. |
| (2) | The S&P 500®Index is an unmanaged market-value weighted index of stocks, which is widely regarded as the standard for measuring large-cap U.S. stock market performance. Returns include reinvested dividends. You cannot invest directly in an index. |
| (3) | The Tortoise North American Pipeline IndexSMis a float-adjusted, capitalization weighted index of pipeline companies headquartered in the United States and Canada. You cannot invest directly in an index. |
Note: For periods over 1 year, performance reflected is for the average annual returns.
Performance data quoted represents past performance; past performance does not guarantee future results. The investment return and principal value of an investment will fluctuate so that an investor’s shares, when redeemed, may be worth more or less than their original cost. Current performance of the portfolio may be lower or higher than the performance quoted. Performance data current to the most recent month end may be obtained by calling 844-TR-INDEX (844-874-6339).
| |
| |
| 2019 Annual Report| November 30, 2019 |
| |
| Tortoise Global Water ESG Fund |
| |
| |
Top ten holdings(as of November 30, 2019)
| 1. | | Ferguson PLC | | 8.0% |
| 2. | | Geberit AG | | 7.9% |
| 3. | | Veolia Environnement SA | | 7.7% |
| 4. | | American Water Works Co., Inc. | | 7.1% |
| 5. | | Xylem, Inc. | | 6.9% |
| 6. | | Aqua America Inc. | | 5.3% |
| 7. | | Pentair PLC | | 4.4% |
| 8. | | Severn Trent Plc | | 4.4% |
| 9. | | United Utilities Group PLC | | 4.3% |
| 10. | | Pennon Group Plc | | 3.8% |
TBLU key benefits
| ● | Provides access to the water infrastructure, management and treatment companies that we believe appear poised to benefit from the expected and much needed investment in rebuilding existing infrastructure, constructing new infrastructure and better managing this vital, but finite resource |
| ● | Flow-through ETF structure provides tax-efficient access to the water sector |
| ● | Purest exposure to the water industry by incorporating a fundamental weighting aspect |
| ● | Continuous liquidity |
| ● | Exposure to the Tortoise Global Water ESG Index® |
| – | Proprietary, rules-based, research-driven methodology |
| – | Fundamental weighting technique provides significant direct exposure to the water industry |
| – | A leading benchmark for analysis of the water sector |
| – | Backed by Tortoise’s proprietary fundamental research and index generation process |
Value of $10,000 vs. Tortoise Global Water ESG Index®
Since inception on February 14, 2017 through November 30, 2019 |
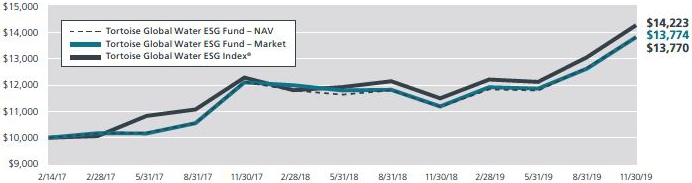 |
This chart illustrates the performance of a hypothetical $10,000 investment made on February 14, 2017 and is not intended to imply any future performance. The returns shown do not reflect the deduction of taxes that a shareholder would pay on the fund’s distributions or the redemption of fund shares. The chart assumes reinvestment of capital gains and dividends for the fund and dividends for the index.
The performance data quoted above represents past performance since February 14, 2017 through November 30, 2019. Past performance is no guarantee of future results. The investment return and value of an investment will fluctuate so that an investor’s shares, when redeemed, may be worth more or less than their original cost. Current performance of the fund may be obtained through the most recent month-end by calling 844-TR-INDEX (844-874-6339). Future performance may be lower or higher than the performance stated above.
The Tortoise Global Water ESG Index®is a proprietary, rules-based, modified capitalization-weighted, float-adjusted index comprised of companies that are materially engaged in the water infrastructure or water management industries. Water infrastructure companies’ principal business is providing public water distribution or supporting water distribution infrastructure via equipment or engineering and construction. Water management companies’ primary business is providing technologies or products that manage or facilitate water distribution and usage, including the fields of water efficiency, water treatment and irrigation. You cannot invest directly in an index.
| |
| |
| |
| |
| Tortoise Global Water ESG Fund(continued) |
| |
| |
Key asset performance drivers
| Top five contributors | | Company type | | Performance driver |
| Ferguson PLC | | Pipes, pumps, & valves | | Benefitted from exposure to rebound in U.S. residential housing market |
| Geberit AG | | Filtration, treatment, & test | | Better than expected margin expansion on lower input prices and price increases |
| Cia de Saneamento Basico do Estado de Sao Paulo – ADR | | Water utility | | Potential to benefit from privatization and sale by Brazilian government |
| American Water Works Company, Inc. | | Water utility | | Demand for less-volatile securities during period of mixed economic signals |
| Veolia Environnement SA | | Water utility | | Demand for less-volatile securities during period of mixed economic signals |
| Bottom five contributors | | Company type | | Performance driver |
| China Water Affairs Group Limited | | Water utility | | Geopolitical headwinds from U.S./China trade war as well as Hong Kong unrest |
| Beijing Enterprises Water Group Ltd. | | E&C | | Geopolitical headwinds from U.S./China trade war as well as Hong Kong unrest |
| Oyo Corp | | E&C | | Geopolitical headwinds from U.S./China trade war as well as Hong Kong unrest |
| NIHON TRIM Co., Ltd. | | Filtration, treatment, & test | | Headwinds from stagnant sales and declining profit margin during overhaul of business strategy |
| CT Environmental Group Limited | | Water utility | | Geopolitical headwinds from U.S./China trade war as well as Hong Kong unrest |
Total returns(as of November 30, 2019)
| Ticker | | 1 year | | Since inception(1) | | Gross expense ratio |
| TBLU @ Market | | 23.25% | | 12.15% | | | 0.40 | % | |
| TBLU @ NAV | | 23.42% | | 12.14% | | | 0.40 | % | |
| S&P 500®Index(2) | | 16.11% | | 13.39% | | | — | | |
| Tortoise Global Water ESG Index®(3) | | 23.91% | | 13.45% | | | — | | |
| (1) | Reflects period from fund inception on February 14, 2017 through November 30, 2019. |
| (2) | The S&P 500®Index is an unmanaged market-value weighted index of stocks, which is widely regarded as the standard for measuring large-cap U.S. stock market performance. Returns include reinvested dividends. You cannot invest directly in an index. |
| (3) | The Tortoise Global Water ESG Index®is a proprietary, rules-based, modified capitalization-weighted, float-adjusted index comprised of companies that are materially engaged in the water infrastructure or water management industries. Water infrastructure companies’ principal business is providing public water distribution or supporting water distribution infrastructure via equipment or engineering and construction. Water management companies’ primary business is providing technologies or products that manage or facilitate water distribution and usage, including the fields of water efficiency, water treatment and irrigation. You cannot invest directly in an index. |
Note: For periods over 1 year, performance reflected is for the average annual returns.
Performance data quoted represents past performance; past performance does not guarantee future results. The investment return and principal value of an investment will fluctuate so that an investor’s shares, when redeemed, may be worth more or less than their original cost. Current performance of the portfolio may be lower or higher than the performance quoted. Performance data current to the most recent month end may be obtained by calling 844-TR-INDEX (844-874-6339).
| |
| |
| 2019 Annual Report| November 30, 2019 |
| |
| Tortoise Cloud Infrastructure Fund |
| |
| |
Top ten holdings(as of November 30, 2019)
| 1. | | Splunk Inc. | | 5.6% |
| 2. | | Alibaba Group Holding Limited - ADR | | 4.9% |
| 3. | | Microsoft Corporation | | 4.8% |
| 4. | | Equinix, Inc. | | 4.6% |
| 5. | | Alphabet Inc. | | 4.5% |
| 6. | | Hewlett Packard Enterprise Company | | 4.4% |
| 7. | | Oracle Corporation | | 4.3% |
| 8. | | Fortinet, Inc. | | 4.2% |
| 9. | | Amazon.com, Inc. | | 4.2% |
| 10. | | Digital Realty Trust, Inc. | | 4.0% |
TCLD key benefits
| ● | The fund invests in companies that have the potential to benefit from the expected growing investments, rapid adoption and fast paced innovation of the cloud industry |
| – | Access to companies that provide and support cloud-based infrastructure |
| – | Exposure to companies that provide cloud services, cloud management software, data centers and cloud security |
| ● | Direct exposure to companies that we believe should benefit from the growth of the cloud |
| – | Users of the cloud are not included; their businesses and risks don’t align with the cloud industry |
| ● | Market cap and liquidity filters provide a comparatively high level of liquidity |
Value of $10,000 vs. Tortoise Global Cloud Infrastructure IndexSM
Since inception on January 31, 2019 through November 30, 2019 |
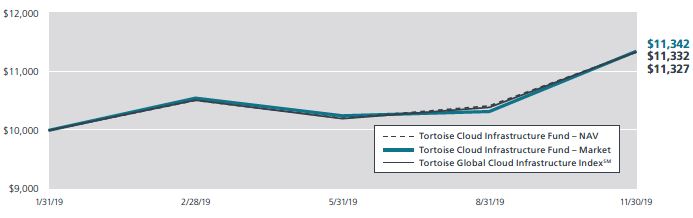 |
This chart illustrates the performance of a hypothetical $10,000 investment made on January 31, 2019, and is not intended to imply any future performance. The returns shown do not reflect the deduction of taxes that a shareholder would pay on the fund’s distributions or the redemption of fund shares. The chart assumes reinvestment of capital gains and dividends for the fund and dividends for the index.
The performance data quoted above represents past performance since January 31, 2019 through November 30, 2019. Past performance is no guarantee of future results. The investment return and value of an investment will fluctuate so that an investor’s shares, when redeemed, may be worth more or less than their original cost. Current performance of the fund may be obtained through the most recent month-end by calling 844-TR-INDEX (844-874-6339). Future performance may be lower or higher than the performance stated above.
The Tortoise Global Cloud Infrastructure IndexSMrepresents the existing global cloud infrastructure landscape. It is a proprietary, rules-based, modified market capitalization-weighted, float-adjusted index comprised of companies that are materially engaged in the cloud infrastructure industry, including cloud systems/services, cloud consulting software/services, cloud security, cloud hardware and cloud data centers.
| |
| |
| |
| |
| Tortoise Cloud Infrastructure Fund(continued) |
| |
| |
Key asset performance drivers
| Top five contributors | | Company type | | Performance driver |
| Atos SE | | Cloud systems/services | | Strong fundamental performance, continued announcement of partnerships |
| Equinix, Inc. | | Cloud data center | | Demand for co-location and hyperscale data centers, lower interest rates |
| Microsoft Corporation | | Licensing and support | | Continued growing cloud and cloud related revenue as a percentage of total revenue |
| Okta, Inc. | | Cloud security | | Strong fundamental and technical performance |
| Fortinet, Inc. | | Cloud security | | Strong fundamentals, big partnership announcements |
| Bottom five contributors | | Company type | | Performance driver |
| Worldline SA | | Software and services | | Underperformance relative to sector |
| Teradata Corporation | | Cloud systems/services | | Poor guidance, CEO transition |
| Nutanix, Inc. | | Cloud hardware | | Weak February earnings forecast |
| Dropbox, Inc. | | Cloud management software | | Disappointing fundamental growth and earnings |
| F5 Networks, Inc. | | Cloud systems/services | | Shifting business mix from hardware to software has disrupted financial performance |
Total returns(as of November 30, 2019)
| Ticker | | Since inception(1) | | Gross expense ratio |
| TCLD @ Market | | 13.42% | | | 0.40 | % | |
| TCLD @ NAV | | 13.27% | | | 0.40 | % | |
| S&P 500®Index(2) | | 18.16% | | | — | | |
| Tortoise Global Cloud Infrastructure IndexSM(3) | | 13.32% | | | — | | |
| (1) | Reflects period from fund inception on January 31, 2019 through November 30, 2019. |
| (2) | The S&P 500®Index is an unmanaged market-value weighted index of stocks, which is widely regarded as the standard for measuring large-cap U.S. stock market performance. Returns include reinvested dividends. You cannot invest directly in an index. |
| (3) | The Tortoise Cloud Infrastructure IndexSMrepresents the existing global cloud infrastructure landscape. It is a proprietary, rules-based, modified market capitalization-weighted, float-adjusted index comprised of companies that are materially engaged in the cloud infrastructure industry, including cloud system/services, cloud consulting software/services, cloud security, cloud hardware and cloud data centers. |
Performance data quoted represents past performance; past performance does not guarantee future results. The investment return and principal value of an investment will fluctuate so that an investor’s shares, when redeemed, may be worth more or less than their original cost. Current performance of the portfolio may be lower or higher than the performance quoted. Performance data current to the most recent month end may be obtained by calling 844-TR-INDEX (844-874-6339).
| |
| |
| 2019 Annual Report| November 30, 2019 |
| |
| Tortoise Digital Payments Infrastructure Fund |
| |
| |
Top ten holdings(as of November 30, 2019)
| 1. | | Square, Inc. | | 5.4% |
| 2. | | Fiserv, Inc. | | 5.2% |
| 3. | | Global Payments Inc. | | 5.0% |
| 4. | | FleetCor Technologies Inc. | | 4.9% |
| 5. | | Fidelity National Information Services, Inc. | | 4.8% |
| 6. | | PayPal Holdings, Inc. | | 4.8% |
| 7. | | Jack Henry & Associates, Inc. | | 4.8% |
| 8. | | American Express Company | | 4.7% |
| 9. | | Western Union Company | | 4.6% |
| 10. | | Discover Financial Services | | 4.6% |
TPAY key benefits
| ● | The fund invests in companies that we believe have the potential to benefit as the world continues to evolve from traditional cash payments to the speed, accuracy and efficiency of digital payments |
| ● | Access to all participants in the fee-based credit card value chain, including merchant acquirers, processors, networks and issuers |
| ● | Exposure to new forms of digital payments, such as mobile, point-of-sale devices and P2P matching engines |
| ● | Market cap and liquidity filters that provide a comparatively high level of liquidity |
Value of $10,000 vs. Tortoise Global Digital Payments Infrastructure IndexSM
Since inception on January 31, 2019 through November 30, 2019 |
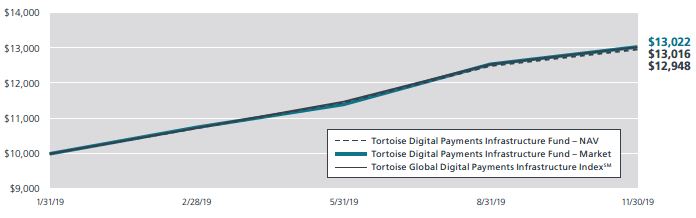 |
This chart illustrates the performance of a hypothetical $10,000 investment made on January 31, 2019, and is not intended to imply any future performance. The returns shown do not reflect the deduction of taxes that a shareholder would pay on the fund’s distributions or the redemption of fund shares. The chart assumes reinvestment of capital gains and dividends for the fund and dividends for the index.
Performance data quoted above represents past performance since January 31, 2019 through November 30, 2019. Past performance is no guarantee of future results. The investment return and value of an investment will fluctuate so that an investor’s shares, when redeemed, may be worth more or less than their original cost. Current performance of the fund may be obtained through the most recent month-end by calling 844-TR-INDEX (844-874-6339). Future performance may be lower or higher than the performance stated above.
The Tortoise Global Digital Payments Infrastructure IndexSMrepresents the existing global digital payments landscape. It is a proprietary, rules-based, modified market capitalization-weighted, float-adjusted index comprised of companies that are materially engaged in digital payments, including merchant processing and settlement, real time record keeping, settlement networks, and fintech products/services that facilitate the ease, efficiency and speed of electronic transactions.
| |
| |
| |
| |
| Tortoise Digital Payments Infrastructure Fund(continued) |
| |
| |
Key asset performance drivers
| Top five contributors | | Company type | | Performance driver |
| Worldpay Inc | | Electronic transaction processing | | Being acquired by Fidelity National Information Services |
| Total System Services | | Electronic transaction processing | | Being acquired by Global Payments |
| Global Payments Inc. | | Merchant payment products/services | | Growth through acquisition in robust payments industry |
| FleetCor Technologies Inc. | | Electronic transaction processing | | B2B and other internal growth opportunities |
| Fiserv, Inc. | | Electronic transaction processing | | Acquisition of First Data Corp, General growth in electronic payments |
| Bottom five contributors | | Company type | | Performance driver |
| Green Dot Corporation | | Electronic transaction processing | | Reduced earnings guidance |
| Wirecard AG | | Electronic transaction processing | | Inquiries into accounting practices |
| Yiren Digital Ltd. | | Financial services market place | | Increased Chinese regulation on on-line lenders |
| AEON Financial Service Co. Ltd. | | Credit card issuer | | Disappointing financial results |
| Provident Financial plc | | Credit card issuer | | Sub-prime business and Brexit |
Total returns(as of November 30, 2019)
| Ticker | | Since inception(1) | | Gross expense ratio |
| TPAY @ Market | | 30.22% | | | 0.40 | % | |
| TPAY @ NAV | | 29.48% | | | 0.40 | % | |
| S&P 500®Index(2) | | 18.16% | | | — | | |
| Tortoise Global Digital Payments IndexSM(3) | | 30.16% | | | — | | |
| (1) | Reflects period from fund inception on January 31, 2019 through November 30, 2019. |
| (2) | The S&P 500®Index is an unmanaged market-value weighted index of stocks, which is widely regarded as the standard for measuring large-cap U.S. stock market performance. Returns include reinvested dividends. You cannot invest directly in an index. |
| (3) | The Tortoise Global Digital Payments Infrastructure IndexSMrepresents the existing global digital payments landscape. It is a proprietary, rules-based, modified market capitalization-weighted, float-adjusted index comprised of companies that are materially engaged in digital payments, including merchant processing and settlement, real time record keeping, settlement networks, and fintech products/services that facilitate the ease, efficiency and speed of electronic transactions. |
Performance data quoted represents past performance; past performance does not guarantee future results. The investment return and principal value of an investment will fluctuate so that an investor’s shares, when redeemed, may be worth more or less than their original cost. Current performance of the portfolio may be lower or higher than the performance quoted. Performance data current to the most recent month end may be obtained by calling 844-TR-INDEX (844-874-6339).
| |
| |
| 2019 Annual Report| November 30, 2019 |
| |
| |
| |
| |
Tortoise North American Pipeline Fund
Investing involves risk. Principal loss is possible. The Fund has the same risks as the underlying securities traded on the exchange throughout the day. Redemptions are limited and often commissions are charged on each trade, and ETFs may trade at a premium or discount to their net asset value. The Fund is non-diversified, meaning it may concentrate its assets in fewer individual holdings than a diversified fund. Therefore, the Fund is more exposed to individual stock volatility than a diversified fund. The Fund may experience tracking error to a greater extent than a fund that seeks to replicate an index. The Fund is not actively managed and may be affected by a general decline in market segments related to the index. Unlike mutual funds, ETFs may trade at a premium or discount to their net asset value. Investing in specific sectors such as energy infrastructure may involve greater risk and volatility than less concentrated investments. Risks include, but are not limited to, risks associated with companies owning and/or operating pipelines and complementary assets, as well as Master Limited Partnerships (MLPs), MLP affiliates, capital markets, terrorism, natural disasters, climate change, operating, regulatory, environmental, supply and demand, and price volatility risks. The tax benefits received by an investor investing in the portfolio differs from that of a direct investment in an MLP by an investor. The value of the portfolio’s investment in an MLP will depend largely on the MLP’s treatment as a partnership for U.S. federal income tax purposes. If the MLP is deemed to be a corporation then its income would be subject to federal taxation, reducing the amount of cash available for distribution to the portfolio which could result in a reduction of the portfolio’s value. Investments in foreign issuers involve risk not ordinarily associated with investments in securities and instruments of U.S. issuers, including risks related to political, social and economic developments abroad, differences between U.S. and foreign regulatory and accounting requirements, tax risk and market practices, as well as fluctuations in foreign currencies. The portfolio invests in small and mid-cap companies, which involve additional risks such as limited liquidity and greater volatility than larger companies. Investments in debt securities typically decrease in value when interest rates rise. This risk is usually greater for longer-term debt securities. Investment in lower-rated and non-rated securities presents a greater risk of loss to principal and interest than higher-rated securities. The portfolio may also write call options which may limit the portfolio’s ability to profit from increases in the market value of a security, but cause it to retain the risk of loss should the price of the security decline.
Tortoise Global Water ESG Fund
Investment in the water infrastructure and management industry may significantly affect the value of the shares of the fund. Companies in the water industry are subject to environmental considerations, taxes, government regulation, price and supply fluctuations, competition and water conservation influences. Investments in non-U.S. companies (including Canadian issuers) involve risk not ordinarily associated with investments in securities and instruments of U.S. issuers, including risks related to political, social and economic developments abroad, differences between U.S. and foreign regulatory and accounting requirements, tax risk and market practices, as well as fluctuations in foreign currencies. The fund invests in small and mid-cap companies, which involve additional risks such as limited liquidity and greater volatility than larger companies. The fund is not actively managed, and therefore the fund generally will not sell a security due to current or projected underperformance of a security, industry or sector, unless that security is removed from the index or the selling of the security is otherwise required upon a rebalancing of the index. There is no guarantee that the fund will achieve a high degree of correlation to the index and therefore achieve its investment objective. The fund has elected to be, and intends to qualify each year for treatment as, a regulated investment company (RIC). To maintain the fund’s qualification for federal income tax treatment as a RIC, the fund must meet certain source of income, asset diversification and annual distribution requirements. If for any taxable year the fund fails to qualify for the special federal income tax treatment afforded to RICs, all of the fund’s taxable income will be subject to federal income tax at regular corporate rates (without any deduction for distributions to its shareholders) and its income available for distribution will be reduced. Derivatives involve risks different from, and in certain cases, greater than the risks presented by more traditional investments. The fund is non-diversified, meaning it may concentrate its assets in fewer individual holdings than a diversified fund. Therefore, the fund is more exposed to individual stock volatility than a diversified fund.
Tortoise Cloud Infrastructure Fund
Investing involves risk. Principal loss is possible. Investing in specific sectors such as digital infrastructure may involve greater risk and volatility than less concentrated investments. Risks include, but are not limited to, risks associated with investing in cloud infrastructure industry including disruption of service, security breaches, evolving internet regulation and technology risk. Investments in non-U.S. companies (including Canadian issuers) involve risk not ordinarily associated with investments in securities and instruments of U.S. issuers, including risks related to political, social and economic developments abroad, differences between U.S. and foreign regulatory and accounting requirements, tax risk and market practices, as well as fluctuations in foreign currencies. The fund invests in small and mid-cap companies, which involve additional risks such as limited liquidity and greater volatility than larger companies. The fund is not actively managed and therefore the fund generally will not sell a security due to current or projected underperformance of a security, industry or sector, unless that security is removed from the index or the selling of the security is otherwise required upon a rebalancing of the index. There is no guarantee that the fund will achieve a high degree of correlation to the index and therefore achieve its investment objective. Shares may trade at prices different than net asset value per share.
Tortoise Digital Payments Infrastructure Fund
Investing involves risk. Principal loss is possible. Investing in specific sectors such as digital payments may involve greater risk and volatility than less concentrated investments. Risks include, but are not limited to, risks associated with investing in digital payments industry including major changes in technology, security considerations, taxes, government regulations, economic conditions, competition, political influences, the cyclical nature of the industry, and consumer preferences. Investments in non-U.S. companies (including Canadian issuers) involve risk not ordinarily associated with investments in securities and instruments of U.S. issuers, including risks related to political, social and economic developments abroad, differences between U.S. and foreign regulatory and accounting requirements, tax risk and market practices, as well as fluctuations in foreign currencies. The fund invests in small and mid-cap companies, which involve additional risks such as limited liquidity and greater volatility than larger companies. The fund is not actively managed and therefore the fund generally will not sell a security due to current or projected underperformance of a security, industry or sector, unless that security is removed from the index or the selling of the security is otherwise required upon a rebalancing of the index. There is no guarantee that the fund will achieve a high degree of correlation to the index and therefore achieve its investment objective. Shares may trade at prices different than net asset value per share.
Cash flow is the total amount of money moving into and out of a business.
Nothing contained on this communication constitutes tax, legal, or investment advice. Investors must consult their tax advisor or legal counsel for advice and information concerning their particular situation.
This report reflects our views and opinions as of the date herein, which are subject to change at any time based on market and other conditions. We disclaim any responsibility to update these views. The views should not be relied on as investment advice or an indication of trading intent on behalf of the fund.
Portfolio holdings and sector allocations are subject to change at any time and should not be considered recommendations to buy or sell any security. For a complete list of fund holdings, please refer to the Schedule of Investments in this report.
| |
| |
| 2019 Annual Report| November 30, 2019 |
| |
| |
| |
| |
Expense example
As a shareholder of the Fund, you incur two types of costs: (1) transaction costs, including brokerage commissions on purchases and sales of Fund shares, and (2) ongoing costs, including management fees and other Fund expenses. This example is intended to help you understand your ongoing costs (in dollars) of investing in the Fund and to compare these costs with the ongoing costs of investing in other funds. The example is based on an investment of $1,000 invested at the beginning of the period and held for the entire period (June 1, 2019 – November 30, 2019).
Actual expenses
The first line of the table below provides information about actual account values based on actual returns and actual expenses. You may use the information in this line, together with the amount you invested, to estimate the expenses that you paid over the period. Simply divide your account value by $1,000 (for example, an $8,600 account value divided by $1,000 = 8.6), then multiply the result by the number in the first line under the heading entitled “Expenses Paid During Period” to estimate the expenses you paid on your account during this period.
Hypothetical example for comparison purposes
The second line of the table below provides information about hypothetical account values and hypothetical expenses based on the Fund’s actual expense ratio and an assumed rate of return of 5% per year before expenses, which is not the Fund’s actual return. The hypothetical account values and expenses may not be used to estimate the actual ending account balance or expenses you paid for the period. You may use this information to compare the ongoing costs of investing in the Fund and other funds. To do so, compare this 5% hypothetical example with the 5% hypothetical examples that appear in the shareholder reports of the other funds.
Please note that the expenses shown in the table are meant to highlight your ongoing costs only and do not reflect any transactional costs, such as redemption fees or exchange fees. Therefore, the second line of the table is useful in comparing ongoing costs only, and will not help you determine the relative total costs of owning different funds. In addition, if these transactional costs were included, your costs would have been higher.
| Tortoise North American Pipeline Fund | | | | | | | | | |
| | | | | | | | | Expenses Paid |
| | Beginning | | Ending | | During Period(1) |
| | Account Value | | Account Value | | (06/01/2019 – |
| | (06/01/2019) | | (11/30/2019) | | 11/30/2019) |
| Actual(2) | | $1,000.00 | | | $ | 974.90 | | | $1.98 |
| Hypothetical (5% annual return before expenses) | | $1,000.00 | | | $ | 1,023.06 | | | $2.03 |
| (1) | Expenses are equal to the Fund’s annualized expense ratio for the most recent six-month period of 0.40%, multiplied by the average account value over the period, multiplied by 183/365 to reflect the one-half year period. |
| (2) | Based on the actual returns for the six-month period ended November 30, 2019 of -2.51%. |
| Tortoise Global Water ESG Fund | | | | | | |
| | | | | | Expenses Paid |
| | Beginning | | Ending | | During Period(1) |
| | Account Value | | Account Value | | (06/01/2019 – |
| | (06/01/2019) | | (11/30/2019) | | 11/30/2019) |
| Actual(2) | | $1,000.00 | | $1,170.00 | | $2.18 |
| Hypothetical (5% annual return before expenses) | | $1,000.00 | | $1,023.06 | | $2.03 |
| (1) | Expenses are equal to the Fund’s annualized expense ratio for the most recent six-month period of 0.40%, multiplied by the average account value over the period, multiplied by 183/365 to reflect to reflect the one-half year period. |
| (2) | Based on the actual returns for the six-month period ended November 30, 2019 of 17.00%. |
| Tortoise Cloud Infrastructure Fund | | | | | | |
| | | | | | Expenses Paid |
| | Beginning | | Ending | | During Period(1) |
| | Account Value | | Account Value | | (06/01/2019 – |
| | (06/01/2019) | | (11/30/2019) | | 11/30/2019) |
| Actual(2) | | $1,000.00 | | $1,109.80 | | $2.12 |
| Hypothetical (5% annual return before expenses) | | $1,000.00 | | $1,023.06 | | $2.03 |
| (1) | Expenses are equal to the Fund’s annualized expense ratio for the period since inception of 0.40%, multiplied by the average account value over the period, multiplied by 183/365 to reflect the one-half year period. |
| (2) | Based on the actual returns for the six-month period ended November 30, 2019 of 10.98%. |
| Tortoise Digital Payments Infrastructure Fund | | | | | | |
| | | | | | Expenses Paid |
| | Beginning | | Ending | | During Period(1) |
| | Account Value | | Account Value | | (06/01/2019 – |
| | (06/01/2019) | | (11/30/2019) | | 11/30/2019) |
| Actual(2) | | $1,000.00 | | $1,131.20 | | $2.14 |
| Hypothetical (5% annual return before expenses) | | $1,000.00 | | $1,023.06 | | $2.03 |
| (1) | Expenses are equal to the Fund’s annualized expense ratio for the period since inception of 0.40%, multiplied by the average account value over the period, multiplied by 183/365 to reflect the one-half year period. |
| (2) | Based on the actual returns for the six-month period ended November 30, 2019 of 13.12%. |
| |
| |
| 2019 Annual Report| November 30, 2019 |
| |
| Tortoise North American Pipeline Fund |
| Schedule of Investments |
| November 30, 2019 |
| | Shares | | Fair Value |
| Common Stock — 81.5%(1) | | | | | |
| | | | | | |
| Canada Crude Oil Pipelines — 18.4%(1) | | | | | |
| Enbridge Inc. | | 916,938 | | $ | 34,843,644 |
| Gibson Energy Inc. | | 212,485 | | | 3,992,792 |
| Inter Pipeline Ltd. | | 611,635 | | | 10,130,219 |
| Kinder Morgan Canada Limited | | 49,706 | | | 530,627 |
| Pembina Pipeline Corporation | | 762,490 | | | 26,623,719 |
| | | | | 76,121,001 |
| | | | | | |
| Canada Natural Gas/Natural Gas Liquids Pipelines — 11.2%(1) |
| AltaGas Ltd. | | 411,122 | | | 6,097,345 |
| Keyera Corp. | | 317,524 | | | 7,747,462 |
| TC Energy Corporation | | 638,854 | | | 32,536,834 |
| | | | | 46,381,641 |
| | | | | | |
| United States Crude Oil Pipelines — 0.8%(1) | | | |
| Plains GP Holdings, L.P. | | 111,236 | | | 1,943,293 |
| SemGroup Corporation | | 93,861 | | | 1,442,643 |
| | | | | 3,385,936 |
| | | | | | |
| United States Local Distribution Companies — 16.3%(1) | |
| Atmos Energy Corporation | | 176,276 | | | 18,854,481 |
| Chesapeake Utilities Corporation | | 25,417 | | | 2,316,505 |
| New Jersey Resources Corporation | | 133,299 | | | 5,670,540 |
| NiSource Inc. | | 552,262 | | | 14,607,330 |
| Northwest Natural Holding Co. | | 44,162 | | | 3,037,021 |
| ONE Gas, Inc. | | 77,985 | | | 6,930,527 |
| South Jersey Industries, Inc. | | 135,150 | | | 4,222,086 |
| Southwest Gas Corporation | | 80,586 | | | 6,105,195 |
| Spire Inc. | | 75,382 | | | 5,836,074 |
| | | | | 67,579,759 |
| | | | | | |
| United States Natural Gas Gathering/Processing — 12.0%(1) |
| Antero Midstream Corp. | | 445,970 | | | 2,042,542 |
| Archrock, Inc. | | 182,619 | | | 1,535,826 |
| EnLink Midstream, LLC | | 377,907 | | | 1,795,058 |
| Rattler Midstream LP | | 20,970 | | | 333,633 |
| Targa Resources Corp. | | 347,011 | | | 12,676,312 |
| The Williams Companies, Inc. | | 1,365,961 | | | 31,034,634 |
| | | | | 49,418,005 |
| | | | | | |
| United States Natural Gas/Natural Gas Liquids Pipelines — 22.7%(1) |
| Altus Midstream Co.(2) | | 82,490 | | $ | 159,206 |
| Cheniere Energy, Inc.(2) | | 332,250 | | | 20,114,415 |
| Equitrans Midstream Corp. | | 298,290 | | | 2,973,951 |
| Kinder Morgan, Inc. | | 1,599,569 | | | 31,367,548 |
| National Fuel Gas Company | | 126,286 | | | 5,685,396 |
| ONEOK, Inc. | | 450,819 | | | 32,030,690 |
| Tallgrass Energy LP | | 81,016 | | | 1,450,996 |
| | | | | 93,782,202 |
| | | | | | |
| United States Other — 0.1%(1) | | | | | |
| New Fortress Energy LLC(2) | | 22,450 | | | 336,077 |
| Total Common Stock | | | | | |
| (Cost $324,237,609) | | | | | 337,004,621 |
| | | | | | |
| Master Limited Partnerships — 17.1%(1) | | | |
| | | | |
| United States Crude Oil Pipelines — 1.8%(1) | | | |
| BP Midstream Partners LP | | 22,229 | | | 324,543 |
| Delek Logistics Partners LP | | 3,849 | | | 123,630 |
| Genesis Energy, L.P. | | 59,506 | | | 1,131,209 |
| PBF Logistics LP | | 16,846 | | | 344,501 |
| Plains All American Pipeline, L.P. | | 247,776 | | | 4,311,302 |
| Shell Midstream Partners, L.P. | | 71,313 | | | 1,402,014 |
| USD Partners LP | | 5,309 | | | 50,223 |
| | | | | 7,687,422 |
| | | | | | |
| United States Natural Gas Gathering/Processing — 1.1%(1) |
| CNX Midstream Partners LP | | 22,656 | | | 328,512 |
| DCP Midstream, LP | | 49,803 | | | 1,051,341 |
| Enable Midstream Partners, LP | | 30,488 | | | 280,185 |
| Hess Midstream Partners LP | | 7,224 | | | 147,731 |
| Noble Midstream Partners LP | | 11,984 | | | 249,867 |
| Oasis Midstream Partners LP | | 5,227 | | | 83,632 |
| USA Compression Partners LP | | 26,591 | | | 437,156 |
| Western Midstream Partners LP | | 107,648 | | | 1,908,599 |
| | | | | 4,487,023 |
| See accompanying Notes to Financial Statements. | |
| | |
| Tortoise | 17 |
| |
| |
| |
| |
| Tortoise North American Pipeline Fund |
| Schedule of Investments(continued) |
| November 30, 2019 |
| | Shares | | Fair Value |
| United States Natural Gas/Natural Gas Liquids Pipelines — 9.5%(1) | | | | | |
| Cheniere Energy Partners, L.P. | | 23,022 | | $ | 894,865 |
| Crestwood Equity Partners LP | | 26,682 | | | 846,353 |
| Energy Transfer LP | | 1,278,732 | | | 15,101,825 |
| Enterprise Products Partners L.P. | | 772,089 | | | 20,321,382 |
| EQM Midstream Partners LP | | 44,406 | | | 1,028,887 |
| TC PipeLines, LP | | 29,129 | | | 1,135,740 |
| | | | | 39,329,052 |
| | | | | | |
| United States Refined Product Pipelines — 4.7%(1) | | | | | |
| CrossAmerica Partners LP | | 5,732 | | | 104,781 |
| Global Partners LP | | 12,741 | | | 255,075 |
| Holly Energy Partners, L.P. | | 25,019 | | | 559,425 |
| Magellan Midstream Partners, L.P. | | 129,469 | | | 7,570,052 |
| MPLX LP | | 215,443 | | | 5,095,227 |
| NuStar Energy L.P. | | 58,820 | | | 1,659,900 |
| Phillips 66 Partners LP | | 55,256 | | | 3,079,417 |
| Sprague Resources LP | | 4,579 | | | 73,264 |
| Sunoco LP | | 31,038 | | | 966,834 |
| | | | | 19,363,975 |
| Total Master Limited Partnerships | | | | | |
| (Cost $73,811,356) | | | | | 70,867,472 |
| | | | | | |
| Short-Term Investment — 1.2%(1) | | | | | |
| | | | | | |
| United States Investment Company — 1.2%(1) | | | | | |
| Invesco Government & Agency Portfolio — Institutional Class, 1.53%(3) | | | | | |
| (Cost $5,042,013) | | 5,042,013 | | | 5,042,013 |
| | | | | | |
| Total Investments — 99.8%(1) | | | | | |
| (Cost $403,090,978) | | | | | 412,914,106 |
Other Assets in Excess of Liabilities, Net — 0.2%(1) | | | | | 671,085 |
| Total Net Assets — 100.0%(1) | | | | $ | 413,585,191 |
| (1) | Calculated as a percentage of net assets. |
| (2) | Non-income producing security. |
| (3) | Rate indicated is the current yield as of November 30, 2019. |
| See accompanying Notes to Financial Statements. | |
| | |
| 18 | Tortoise |
| |
| |
| 2019 Annual Report| November 30, 2019 |
| |
| Tortoise Global Water ESG Fund |
| Schedule of Investments |
| November 30, 2019 |
| | Shares | | Fair Value |
| Common Stock — 99.0%(1) | | | | | |
| | | | | | |
| Brazil Water Utilities — 3.5%(1) | | | | | |
| Cia de Saneamento Basico do Estado de | | | | | |
| Sao Paulo — ADR | | 38,925 | | $ | 520,816 |
| | | | | | |
| Finland Water Equipment/Services — 0.6%(1) | | | | | |
| Uponor OYJ | | 6,411 | | | 82,291 |
| | | | | | |
| France Water Infrastructure — 11.3%(1) | | | | | |
| Suez | | 36,560 | | | 541,184 |
| Veolia Environnement SA | | 44,229 | | | 1,132,515 |
| | | | | | 1,673,699 |
| | | | | | |
| Hong Kong Water Equipment/Services — 0.8%(1) | | | | | |
| China Lesso Group Holdings Ltd. | | 113,089 | | | 118,460 |
| | | | | | |
| Hong Kong Water Infrastructure — 2.7%(1) | | | | | |
| Beijing Enterprises Water Group Ltd. | | 672,870 | | | 330,066 |
| China Water Affairs Group Limited | | 99,533 | | | 76,415 |
| CT Environmental Group Limited(2) | | 113,060 | | | — |
| | | | | | 406,481 |
| | | | | | |
| Japan Water Equipment/Services — 2.5%(1) | | | | | |
| Kurita Water Industries Ltd. | | 12,171 | | | 340,370 |
| NIHON TRIM Co., Ltd. | | 551 | | | 25,052 |
| | | | | 365,422 |
| | | | | | |
| Japan Water Infrastructure — 0.3%(1) | | | | | |
| METAWATER Co. Ltd. | | 1,269 | | | 46,274 |
| | | | | | |
| Netherlands Water Equipment/Services — 3.1%(1) | | | | | |
| Aalberts Industries N.V. | | 10,945 | | | 463,674 |
| | | | | | |
| Switzerland Water Equipment/Services — 12.0%(1) | | | | | |
| Ferguson PLC | | 13,511 | | | 1,174,581 |
| Georg Fischer AG | | 470 | | | 460,480 |
| Sulzer AG | | 1,433 | | | 153,656 |
| | | | | | 1,788,717 |
| | | | | | |
| Switzerland Water Management — 7.8%(1) | | | | | |
| Geberit AG | | 2,165 | | | 1,162,463 |
| | | | | | |
| United Kingdom Water Infrastructure — 16.7%(1) | | | | | |
| Pennon Group Plc | | 47,342 | | | 558,391 |
| Pentair PLC | | 14,592 | | | 647,155 |
| Severn Trent Plc | | 22,308 | | | 647,123 |
| United Utilities Group PLC | | 57,710 | | | 636,943 |
| | | | | 2,489,612 |
| | | | | | |
| United States Water Infrastructure — 16.6%(1) | | | | | |
| Advanced Drainage Systems, Inc. | | 4,710 | | | 179,734 |
| Aegion Corp.(3) | | 3,591 | | | 77,781 |
| Franklin Electric Co., Inc. | | 4,377 | | | 242,792 |
| Middlesex Water Company | | 1,855 | | | 116,513 |
| Mueller Water Products, Inc. | | 18,029 | | | 203,367 |
| Rexnord Corporation(3) | | 11,943 | | | 377,279 |
| SJW Group | | 2,657 | | | 188,169 |
| The York Water Company | | 1,469 | | | 65,121 |
| Xylem, Inc. | | 13,144 | | | 1,018,791 |
| | | | | 2,469,547 |
| | | | | | |
| United States Water Management — 3.8%(1) | | | | | |
| AquaVenture Holdings Limited(3) | | 2,218 | | | 49,373 |
| Badger Meter, Inc. | | 3,306 | | | 204,972 |
| Watts Water Technologies, Inc. | | 3,145 | | | 304,939 |
| | | | | 559,284 |
| | | | | |
| United States Water Treatment — 0.8%(1) | | | | | |
| Evoqua Water Technologies Corp.(3) | | 6,589 | | | 124,796 |
| | | | | |
| United States Water Utilities — 16.5%(1) | | | | | |
| American States Water Company | | 4,188 | | | 357,194 |
| American Water Works Co., Inc. | | 8,596 | | | 1,040,374 |
| Aqua America Inc. | | 17,669 | | | 782,207 |
| California Water Service Group | | 5,475 | | | 281,415 |
| | | | | 2,461,190 |
| Total Common Stock | | | | | |
| (Cost $13,650,982) | | | | | 14,732,726 |
| | | | | |
| Short-Term Investment — 0.7%(1) | | | | | |
| | | | | | |
| United States Investment Company — 0.7%(1) | | | | | |
| Invesco Government & Agency Portfolio — Institutional Class, 1.53%(4) | | | | | |
| (Cost $103,214) | | 103,214 | | | 103,214 |
| | | | | |
| Total Investments — 99.7%(1) | | | | | |
| (Cost $13,754,196) | | | | | 14,835,940 |
| Other Assets in Excess of Liabilities, Net — 0.3%(1) | | | | | 39,128 |
| Total Net Assets — 100.0%(1) | | | | $ | 14,875,068 |
| (1) | Calculated as a percentage of net assets. |
| (2) | Security considered illiquid and is categorized in Level 3 of the fair value hierarchy. |
| (3) | Non-income producing security. |
| (4) | Rate indicated is the current yield as of November 30, 2019. |
| ADR – American Depository Receipt |
| See accompanying Notes to Financial Statements. | |
| | |
| Tortoise | 19 |
| |
| |
| |
| |
| Tortoise Cloud Infrastructure Fund |
| Schedule of Investments |
| November 30, 2019 |
| | Shares | | Fair Value |
| Common Stock — 99.4%(1) | | | | | |
| | | | | | |
| France Cloud Systems — Services — 2.2%(1) | | | | | |
| Atos SE | | 1,127 | | $ | 95,712 |
| | | | | | |
| Hong Kong Online Retail — 4.8%(1) | | | | | |
| Alibaba Group Holding Limited — ADR(2) | | 1,030 | | | 206,000 |
| | | | | | |
| Israel Cloud Security — 4.2%(1) | | | | | |
| Check Point Software Technologies Ltd.(2) | | 1,411 | | | 166,329 |
| Radware Ltd.(2) | | 423 | | | 10,190 |
| | | | | | 176,519 |
| | | | | | |
| Netherlands Cloud Management Software — 1.8%(1) | | | | | |
| InterXion Holding N.V.(2) | | 880 | | | 74,835 |
| | | | | | |
| Netherlands Payments Fintech — 0.8%(1) | | | | | |
| Elastic N.V.(2) | | 417 | | | 33,114 |
| | | | | | |
| United States Cloud Hardware — 9.5%(1) | | | | | |
| Cisco Systems, Inc. | | 3,621 | | | 164,067 |
| j2 Global, Inc. | | 537 | | | 52,100 |
| Juniper Networks, Inc. | | 3,993 | | | 100,065 |
| NetScout Systems, Inc.(2) | | 850 | | | 21,420 |
| Nutanix, Inc.(2) | | 1,769 | | | 66,072 |
| | | | | | 403,724 |
| | | | | | |
| United States Cloud Management Software — 6.0%(1) | | | | | |
| Box, Inc.(2) | | 1,630 | | | 29,731 |
| Dropbox, Inc.(2) | | 2,471 | | | 45,689 |
| NetApp, Inc. | | 2,768 | | | 167,713 |
| Pivotal Software, Inc.(2) | | 928 | | | 13,939 |
| | | | | | 257,072 |
| | | | | | |
| United States Cloud Security — 10.5%(1) | | | | | |
| A10 Networks Inc.(2) | | 600 | | | 4,002 |
| Carbonite Inc.(2) | | 337 | | | 7,751 |
| CommVault Systems, Inc.(2) | | 481 | | | 24,348 |
| Fortinet, Inc.(2) | | 1,705 | | | 179,213 |
| MobileIron, Inc.(2) | | 1,099 | | | 5,308 |
| Okta, Inc.(2) | | 1,222 | | | 158,591 |
| Qualys, Inc.(2) | | 384 | | | 33,604 |
| Zscaler, Inc.(2) | | 637 | | | 33,207 |
| | | | | | 446,024 |
| | | | | | |
| United States Cloud Systems — Services — 27.5%(1) | | | | | |
| Akamai Technologies, Inc.(2) | | 1,874 | | | 163,263 |
| Citrix Systems, Inc. | | 1,441 | | | 162,559 |
| F5 Networks, Inc.(2) | | 700 | | | 101,997 |
| Hewlett Packard Enterprise Company | | 11,794 | | | 186,699 |
| International Business Machines | | | | | |
| Corporation | | 1,261 | | | 169,541 |
| Oracle Corporation | | 3,219 | | | 180,715 |
| SolarWinds Corporation(2) | | 546 | | | 10,560 |
| Teradata Corporation(2) | | 1,309 | | | 34,767 |
| VMware, Inc. | | 892 | | | 138,813 |
| Yext, Inc.(2) | | 1,018 | | | 17,571 |
| | | | | 1,166,485 |
| | | | | | |
| United States Cyber Security — 6.2%(1) | | | | | |
| Crowdstrike Holdings, Inc.(2) | | 240 | | | 13,920 |
| Splunk Inc.(2) | | 1,591 | | | 237,409 |
| Tenable Holdings, Inc.(2) | | 438 | | | 11,892 |
| | | | | | 263,221 |
| | | | | | |
| United States Data Center — Cloud Hosting — 12.4%(1) | | | | | |
| CoreSite Realty Corporation | | 423 | | | 47,964 |
| CyrusOne Inc. | | 1,306 | | | 81,364 |
| Digital Realty Trust, Inc. | | 1,408 | | | 170,297 |
| Equinix, Inc. | | 342 | | | 193,863 |
| QTS Realty Trust Inc. | | 634 | | | 33,646 |
| | | | | | 527,134 |
| | | | | | |
| United States Internet Advertising Portals — 4.5%(1) | | | | | |
| Alphabet Inc.(2) | | 147 | | | 191,701 |
| | | | | | |
| United States Licensing/Support — 4.7%(1) | | | | | |
| Microsoft Corporation | | 1,330 | | | 201,335 |
| United States Online Retail — 4.2%(1) | | | | | |
| Amazon.com, Inc.(2) | | 99 | | | 178,279 |
| | | | | | |
| United States Software and Services — 0.1%(1) | | | | | |
| Fastly, Inc.(2) | | 117 | | | 2,388 |
| Total Common Stock | | | | | |
| (Cost $3,917,446) | | | | | 4,223,543 |
| | | | | | |
| Short-Term Investment — 0.5%(1) | | | | | |
| | | | | | |
| United States Investment Company — 0.5%(1) | | | | | |
| First American Government Obligations Fund, Class X, 1.56%(3) | | | | | |
| (Cost $20,414) | | 20,414 | | | 20,414 |
| | | | | | |
| Total Investments — 99.9%(1) | | | | | |
| (Cost $3,937,860) | | | | | 4,243,957 |
| Other Assets in Excess of Liabilities, Net — 0.1%(1) | | | | | 3,514 |
| Total Net Assets — 100.0%(1) | | | | $ | 4,247,471 |
| (1) | Calculated as a percentage of net assets. |
| (2) | Non-income producing security. |
| (3) | Rate indicated is the current yield as of November 30, 2019. |
| ADR – American Depository Receipt |
| See accompanying Notes to Financial Statements. | |
| | |
| 20 | Tortoise |
| |
| |
| 2019 Annual Report| November 30, 2019 |
| |
| Tortoise Digital Payments Infrastructure Fund |
| Schedule of Investments |
| November 30, 2019 |
| | Shares | | Fair Value |
| Common Stock — 97.9%(1) | | | | | |
| | | | | | |
| Australia Electronic Transaction Processing — 1.5%(1) | | | | | |
| Afterpay Touch Group Limited(2) | | 5,805 | | $ | 124,077 |
| | | | | | |
| Australia Payments Fintech — 0.5%(1) | | | | | |
| Iress Limited | | 4,745 | | | 41,756 |
| | | | | | |
| Brazil Electronic Transaction Processing — 3.9%(1) | | | | | |
| Pagseguro Digital Ltd.(2) | | 5,272 | | | 178,932 |
| StoneCo Ltd.(2) | | 3,293 | | | 134,947 |
| | | | | | 313,879 |
| | | | | | |
| France Electronic Transaction Processing — 2.7%(1) | | | | | |
| Ingenico Group | | 2,020 | | | 215,574 |
| | | | | | |
| Germany Electronic Transaction Processing — 3.6%(1) | | | | | |
| Wirecard AG | | 2,173 | | | 286,825 |
| | | | | | |
| Hong Kong Credit Card Issuer — 0.3%(1) | | | | | |
| China Youzan Limited(2) | | 371,666 | | | 22,552 |
| | | | | | |
| Hong Kong Merchant Payment Products/Services — 0.2%(1) | | | | | |
| Huifu Payment Limited(2) | | 19,066 | | | 7,745 |
| PAX Global Technology Ltd. | | 17,931 | | | 7,834 |
| | | | | | 15,579 |
| | | | | | |
| Japan Credit Card Issuer — 1.8%(1) | | | | | |
| AEON Financial Service Co. Ltd. | | 3,406 | | | 51,516 |
| Credit Saison Co., Ltd. | | 4,666 | | | 77,184 |
| Orient Corporation | | 12,862 | | | 18,690 |
| | | | | | 147,390 |
| | | | | | |
| Japan Electronic Transaction Processing — 1.1%(1) | | | | | |
| GMO Payment Gateway, Inc. | | 1,250 | | | 88,649 |
| | | | | | |
| Netherlands Electronic Transaction Processing — 3.2%(1) | | | | | |
| Adyen N.V.(2) | | 341 | | | 261,571 |
| | | | | | |
| New Zealand Electronic Transaction Processing — 0.1%(1) | | | | | |
| Pushpay Holdings Limited(2) | | 3,850 | | | 9,417 |
| | | | | | |
| United Kingdom Credit Card Issuer — 0.6%(1) | | | | | |
| Provident Financial plc | | 8,120 | | | 45,062 |
| | | | | | |
| United Kingdom Software and Services — 1.4%(1) | | | | | |
| Network International Holdings PLC(2) | | 14,578 | | | 109,163 |
| | | | | | |
| United States Credit Card Networks — 16.8%(1) | | | | | |
| American Express Company | | 3,088 | | | 370,931 |
| Discover Financial Services | | 4,316 | | | 366,299 |
| Mastercard, Inc. | | 1,080 | | | 315,608 |
| Visa Inc. | | 1,663 | | | 306,840 |
| | | | | | 1,359,678 |
| | | | | | |
| United States Electric Transmission — 0.5%(1) | | | | | |
| 9F Inc — ADR(2) | | 4,123 | | | 42,549 |
| | | | | | |
| United States Electronic Payment Processing/Management — 3.1%(1) | | | | | |
| ACI Worldwide, Inc.(2) | | 3,688 | | | 138,300 |
| Bottomline Technologies(de), Inc.(2) | | 1,385 | | | 68,544 |
| Zuora, Inc.(2) | | 2,463 | | | 39,260 |
| | | | | | 246,104 |
| | | | | | |
| United States Electronic Transaction Processing — 30.4%(1) | | | | | |
| Cass Information Systems, Inc. | | 430 | | | 24,282 |
| CSG Systems International, Inc. | | 1,045 | | | 59,764 |
| EVERTEC, Inc. | | 1,913 | | | 62,019 |
| Evo Payments, Inc.(2) | | 1,150 | | | 32,280 |
| Fidelity National Information Services, Inc. | | 2,773 | | | 383,090 |
| Fiserv, Inc.(2) | | 3,573 | | | 415,326 |
| FleetCor Technologies Inc.(2) | | 1,275 | | | 391,323 |
| Green Dot Corporation(2) | | 1,535 | | | 36,472 |
| PayPal Holdings, Inc.(2) | | 3,503 | | | 378,359 |
| QIWI plc — ADR | | 1,588 | | | 31,474 |
| Western Union Company | | 13,680 | | | 367,718 |
| WEX Inc.(2) | | 1,390 | | | 279,571 |
| | | | | 2,461,678 |
| See accompanying Notes to Financial Statements. | |
| | |
| Tortoise | 21 |
| |
| |
| |
| |
| Tortoise Digital Payments Infrastructure Fund |
| Schedule of Investments(continued) |
| November 30, 2019 |
| | Shares | | Fair Value |
| United States Financial Services Market Place — 0.8%(1) | | | | | |
| GreenSky, Inc.(2) | | 1,635 | | $ | 12,165 |
| LendingClub Corporation(2) | | 2,768 | | | 38,226 |
| Yirendai Ltd. — ADR(2) | | 3,007 | | | 15,576 |
| | | | | | 65,967 |
| | | | | | |
| United States Merchant Payment Products/Services — 15.0%(1) | | | | | |
| Euronet Worldwide, Inc.(2) | | 1,698 | | | 266,908 |
| Global Payments Inc. | | 2,198 | | | 398,058 |
| NCR Corporation(2) | | 3,853 | | | 126,494 |
| Square, Inc.(2) | | 6,157 | | | 425,572 |
| | | | | | 1,217,032 |
| | | | | | |
| United States Payments Fintech — 10.4%(1) | | | | | |
| DocuSign, Inc.(2) | | 4,638 | | | 330,272 |
| Jack Henry & Associates, Inc. | | 2,478 | | | 376,507 |
| OneSpan Inc.(2) | | 1,050 | | | 19,582 |
| Q2 Holdings, Inc.(2) | | 1,385 | | | 116,936 |
| | | | | | 843,297 |
| Total Common Stock | | | | | |
| (Cost $7,037,523) | | | | | 7,917,799 |
| | | | | | |
| Short-Term Investment — 0.1%(1) | | | | | |
| | | | | | |
| United States Investment Company — 0.1%(1) | | | | | |
| First American Government Obligations Fund, Class X, 1.56%(3) | | | | | |
| (Cost $11,892) | | 11,892 | | | 11,892 |
| | | | | | |
| Total Investments — 98.0%(1) | | | | | |
| (Cost $7,049,415) | | | | | 7,929,691 |
| Other Assets in Excess of Liabilities, Net — 2.0%(1) | | | | | 163,083 |
| Total Net Assets — 100.0%(1) | | | | $ | 8,092,774 |
| (1) | Calculated as a percentage of net assets. |
| (2) | Non-income producing security. |
| (3) | Rate indicated is the current yield as of November 30, 2019. |
| ADR – American Depository Receipt |
| See accompanying Notes to Financial Statements. | |
| | |
| 22 | Tortoise |
| |
| |
| 2019 Annual Report| November 30, 2019 |
| |
| Statements of Assets & Liabilities |
| November 30, 2019 |
| |
| | | | | | | | | Tortoise | | Tortoise |
| | Tortoise | | Tortoise | | Cloud | | Digital Payments |
| | North American | | Global Water | | Infrastructure | | Infrastructure |
| | Pipeline Fund | | ESG Fund | | Fund | | Fund |
| Assets: | | | | | | | | | | | | |
| Investments, at fair value (cost $403,090,978, | | | | | | | | | | | | |
| $13,754,196, $3,937,860 and $7,049,415, respectively) | | $ | 412,914,106 | | $ | 14,835,940 | | $ | 4,243,957 | | $ | 7,929,691 |
| Dividends and interest receivable | | | 738,457 | | | 43,471 | | | 4,534 | | | 4,356 |
| Receivable for capital shares sold | | | 3,342,690 | | | — | | | — | | | 160,538 |
| Total assets | | | 416,995,253 | | | 14,879,411 | | | 4,248,491 | | | 8,094,585 |
| Liabilities: | | | | | | | | | | | | |
| Payable for capital activity | | | 3,288,016 | | | — | | | — | | | — |
| Payable to Adviser | | | 122,046 | | | 4,343 | | | 1,020 | | | 1,811 |
| Total liabilities | | | 3,410,062 | | | 4,343 | | | 1,020 | | | 1,811 |
| Net Assets | | $ | 413,585,191 | | $ | 14,875,068 | | $ | 4,247,471 | | $ | 8,092,774 |
| Net Assets Consist of: | | | | | | | | | | | | |
| Capital Stock | | $ | 410,397,898 | | $ | 13,846,652 | | $ | 3,873,880 | | $ | 7,045,854 |
| Total distributable earnings (loss) | | | 3,187,293 | | | 1,028,416 | | | 373,591 | | | 1,046,920 |
| Net Assets | | $ | 413,585,191 | | $ | 14,875,068 | | $ | 4,247,471 | | $ | 8,092,774 |
| | | | | | | | | | | | | |
| Net Assets | | $ | 413,585,191 | | $ | 14,875,068 | | $ | 4,247,471 | | $ | 8,092,774 |
| Shares issued and outstanding(1) | | | 18,650,000 | | | 450,000 | | | 150,000 | | | 250,000 |
| Net asset value, redemption price and offering price per share | | $ | 22.18 | | $ | 33.06 | | $ | 28.32 | | $ | 32.37 |
| (1) | Unlimited shares authorized. |
| See accompanying Notes to Financial Statements. | |
| | |
| Tortoise | 23 |
| |
| |
| |
| |
| Statements of Operations |
| For the Period Ended November 30, 2019 |
| | | | | | | | | | | Tortoise | | Tortoise |
| | Tortoise | | Tortoise | | Cloud | | Digital Payments |
| | North American | | Global Water | | Infrastructure | | Infrastructure |
| | Pipeline Fund | | ESG Fund | | Fund(1) | | Fund(1) |
| Investment Income: | | | | | | | | | | | | | | | | |
| Dividends and distributions from common stock | | $ | 13,072,815 | | | $ | 147,279 | | | $ | 32,200 | | | $ | 25,274 | |
| Distributions from master limited partnerships | | | 5,258,344 | | | | — | | | | — | | | | — | |
| Less: return of capital on distributions | | | (9,666,260 | ) | | | — | | | | — | | | | — | |
| Less: foreign taxes withheld | | | (775,574 | ) | | | (7,622 | ) | | | (1,958 | ) | | | (610 | ) |
| Net dividends and distributions from investments | | | 7,889,325 | | | | 139,657 | | | | 30,242 | | | | 24,664 | |
| Dividends from money market mutual funds | | | 49,465 | | | | 519 | | | | 942 | | | | 771 | |
| Total investment income | | | 7,938,790 | | | | 140,176 | | | | 31,184 | | | | 25,435 | |
| Expenses: | | | | | | | | | | | | | | | | |
| Advisory fees (See Note 5) | | | 1,318,451 | | | | 23,232 | | | | 10,906 | | | | 15,773 | |
| Total expenses | | | 1,318,451 | | | | 23,232 | | | | 10,906 | | | | 15,773 | |
| Net Investment Income | | | 6,620,339 | | | | 116,944 | | | | 20,278 | | | | 9,662 | |
| Realized and Unrealized Gain (Loss) on Investments and | | | | | | | | | | | | | | | | |
| Translations of Foreign Currency: | | | | | | | | | | | | | | | | |
| Net realized gain (loss) on investments, including foreign | | | | | | | | | | | | | | | | |
| currency gain (loss) | | | 998,822 | | | | (68,562 | ) | | | 47,219 | | | | 156,998 | |
| Net change in unrealized appreciation (depreciation) of investments | | | | | | | | | | | | | | | | |
| and translations of foreign currency | | | 16,451,396 | | | | 1,170,786 | | | | 306,094 | | | | 880,260 | |
| Net Realized and Unrealized Gain on Investments and | | | | | | | | | | | | | | | | |
| Translations of Foreign Currency: | | | 17,450,218 | | | | 1,102,224 | | | | 353,313 | | | | 1,037,258 | |
| Net Increase in Net Assets Resulting from Operations | | $ | 24,070,557 | | | $ | 1,219,168 | | | $ | 373,591 | | | $ | 1,046,920 | |
| (1) | Period from January 31, 2019 (inception date of the Fund) to November 30, 2019. |
| See accompanying Notes to Financial Statements. | |
| | |
| 24 | Tortoise |
| |
| |
| 2019 Annual Report| November 30, 2019 |
| |
| Statements of Changes in Net Assets |
| |
| |
| | | Tortoise North American Pipeline Fund | | Tortoise Global Water ESG Fund |
| | Year Ended | | Year Ended | | Year Ended | | Year Ended |
| | November 30, | | November 30, | | November 30, | | November 30, |
| | 2019 | | 2018 | | 2019 | | 2018 |
| Operations | | | | | | | | | | | | | | | | |
| Net investment income | | $ | 6,620,339 | | | $ | 2,961,448 | | | $ | 116,944 | | | $ | 51,480 | |
| Net realized gain (loss) on investments, | | | | | | | | | | | | | | | | |
| including foreign currency gain (loss) | | | 998,822 | | | | 302,799 | | | | (68,562 | ) | | | 171,796 | |
| Net change in unrealized appreciation (depreciation) | | | | | | | | | | | | | | | | |
| of investments and translations of foreign currency | | | 16,451,396 | | | | (5,235,572 | ) | | | 1,170,786 | | | | (571,881 | ) |
| Net increase (decrease) in net assets resulting | | | | | | | | | | | | | | | | |
| from operations | | | 24,070,557 | | | | (1,971,325 | ) | | | 1,219,168 | | | | (348,605 | ) |
| Capital Share Transactions | | | | | | | | | | | | | | | | |
| Proceeds from shares sold | | | 230,383,290 | | | | 137,583,435 | | | | 9,644,285 | | | | 4,348,680 | |
| Payments for shares redeemed | | | (14,907,125 | ) | | | (24,276,095 | ) | | | — | | | | (2,854,060 | ) |
| Net increase in net assets resulting from | | | | | | | | | | | | | | | | |
| capital share transactions | | | 215,476,165 | | | | 113,307,340 | | | | 9,644,285 | | | | 1,494,620 | |
| Distributions to Shareholders | | | | | | | | | | | | | | | | |
| From distributable earnings | | | (6,397,624 | ) | | | (3,219,856 | ) | | | (79,267 | ) | | | (62,050 | ) |
| From tax return of capital | | | (7,556,816 | ) | | | (2,457,119 | ) | | | — | | | | — | |
| Total distributions to shareholders | | | (13,954,440 | ) | | | (5,676,975 | ) | | | (79,267 | ) | | | (62,050 | ) |
| Total Increase in Net Assets | | | 225,592,282 | | | | 105,659,040 | | | | 10,784,186 | | | | 1,083,965 | |
| Net Assets | | | | | | | | | | | | | | | | |
| Beginning of period | | | 187,992,909 | | | | 82,333,869 | | | | 4,090,882 | | | | 3,006,917 | |
| End of period | | $ | 413,585,191 | | | $ | 187,992,909 | | | $ | 14,875,068 | | | $ | 4,090,882 | |
| Transactions in Shares | | | | | | | | | | | | | | | | |
| Shares sold | | | 10,750,000 | | | | 6,050,000 | | | | 300,000 | | | | 150,000 | |
| Shares redeemed | | | (650,000 | ) | | | (1,100,000 | ) | | | — | | | | (100,000 | ) |
| Net increase | | | 10,100,000 | | | | 4,950,000 | | | | 300,000 | | | | 50,000 | |
| See accompanying Notes to Financial Statements. | |
| | |
| Tortoise | 25 |
| |
| |
| |
| |
| Statements of Changes in Net Assets(continued) |
| |
| | | Tortoise Cloud | | Tortoise Digital Payments |
| | Infrastructure Fund | | Infrastructure Fund |
| | Period from | | Period from |
| | January 31, 2019(1) | | January 31, 2019(1) |
| | to November 30, 2019 | | to November 30, 2019 |
| Operations | | | | | | |
| Net investment income | | $ | 20,278 | | $ | 9,662 |
| Net realized gain on investments, including foreign currency gain (loss) | | | 47,219 | | | 156,998 |
| Net change in unrealized appreciation of investments and translations of foreign currency | | | 306,094 | | | 880,260 |
| Net increase in net assets resulting from operations | | | 373,591 | | | 1,046,920 |
| Capital Share Transactions | | | | | | |
| Proceeds from shares sold | | | 3,873,880 | | | 7,043,985 |
| Payments for shares redeemed | | | — | | | — |
| Transaction fees (See Note 1) | | | — | | | 1,869 |
| Net increase in net assets resulting from capital share transactions | | | 3,873,880 | | | 7,045,854 |
| Distributions to Shareholders | | | | | | |
| From distributable earnings | | | — | | | — |
| Total Increase in Net Assets | | | 4,247,471 | | | 8,092,774 |
| Net Assets | | | | | | |
| Beginning of period | | | — | | | — |
| End of period | | $ | 4,247,471 | | $ | 8,092,774 |
| Transactions in Shares | | | | | | |
| Shares sold | | | 150,000 | | | 250,000 |
| Shares redeemed | | | — | | | — |
| Net increase | | | 150,000 | | | 250,000 |
| (1) | Inception date of the fund. |
| See accompanying Notes to Financial Statements. | |
| | |
| 26 | Tortoise |
| |
| |
| 2019 Annual Report| November 30, 2019 |
| |
| Tortoise North American Pipeline Fund |
| Financial Highlights |
| |
| | | | | | | | | | | | | | | | | | | Period from |
| | Year Ended | | Year Ended | | Year Ended | | Year Ended | | June 29, 2015(1) |
| | November 30, | | November 30, | | November 30, | | November 30, | | to November 30, |
| | 2019 | | 2018 | | 2017 | | 2016 | | 2015 |
| Per Common Share Data(2) | | | | | | | | | | | | | | | | | | | | |
| Net asset value, beginning of period | | $ | 21.99 | | | $ | 22.87 | | | $ | 23.23 | | | $ | 19.59 | | | $ | 25.00 | |
| Investment operations: | | | | | | | | | | | | | | | | | | | | |
| Net investment income(3) | | | 0.62 | | | | 0.69 | | | | 0.64 | | | | 0.67 | | | | 0.24 | |
| Net realized and unrealized gain (loss) | | | | | | | | | | | | | | | | | | | | |
| on investments and translations | | | | | | | | | | | | | | | | | | | | |
| of foreign currency(3) | | | 0.55 | | | | (0.64 | ) | | | (0.13 | ) | | | 3.85 | | | | (5.43 | ) |
| Total from investment operations | | | 1.17 | | | | 0.05 | | | | 0.51 | | | | 4.52 | | | | (5.19 | ) |
| Less distributions from: | | | | | | | | | | | | | | | | | | | | |
| Net investment income | | | (0.45 | ) | | | (0.53 | ) | | | (0.58 | ) | | | (0.65 | ) | | | (0.22 | ) |
| Net realized gains | | | — | | | | —– | | | | — | | | | — | | | | — | |
| Return of capital | | | (0.53 | ) | | | (0.40 | ) | | | (0.29 | ) | | | (0.23 | ) | | | — | |
| Total distributions | | | (0.98 | ) | | | (0.93 | ) | | | (0.87 | ) | | | (0.88 | ) | | | (0.22 | ) |
| Net asset value, end of period | | $ | 22.18 | | | $ | 21.99 | | | $ | 22.87 | | | $ | 23.23 | | | $ | 19.59 | |
| Total Return(4) | | | 5.22 | % | | | 0.15 | % | | | 2.19 | % | | | 23.84 | % | | | (20.81 | )% |
| Supplemental Data and Ratios | | | | | | | | | | | | | | | | | | | | |
| Net assets, end of period (in 000's) | | $ | 413,585 | | | $ | 187,993 | | | $ | 82,334 | | | $ | 44,133 | | | $ | 20,564 | |
| Ratios to average net assets: | | | | | | | | | | | | | | | | | | | | |
| Expenses(5) | | | 0.40 | % | | | 0.40 | % | | | 0.40 | % | | | 0.50 | % | | | 0.70 | % |
| Net investment income(5) | | | 2.01 | % | | | 2.11 | % | | | 2.22 | % | | | 2.40 | % | | | 2.68 | % |
| Portfolio turnover rate(4) | | | 13 | % | | | 16 | % | | | 18 | % | | | 28 | % | | | 17 | % |
| (1) | Inception date of the Fund. |
| (2) | For a Fund share outstanding for the entire period. |
| (3) | The per common share data for the years ended November 30, 2018, 2017 and 2016 and the period from June 29, 2015 to November 30, 2015 does not reflect the change in estimate of investment income and return of capital. See Note 2 to the financial statements for further disclosure. |
| (4) | Not annualized for periods less than one year. |
| (5) | Annualized for periods less than one year. |
| See accompanying Notes to Financial Statements. | |
| | |
| Tortoise | 27 |
| |
| |
| |
| |
| Tortoise Global Water ESG Fund |
| Financial Highlights |
| |
| | | | | | | | | | Period from |
| | | | | | | | | | February 14, |
| | Year Ended | | Year Ended | | 2017(1)to |
| | November 30, | | November 30, | | November 30, |
| | 2019 | | 2018 | | 2017 |
| Per Common Share Data(2) | | | | | | | | | | | | |
| Net asset value, beginning of period | | $ | 27.27 | | | $ | 30.07 | | | $ | 25.00 | |
| Investment operations: | | | | | | | | | | | | |
| Net investment income | | | 0.56 | | | | 0.34 | | | | 0.21 | |
| Net realized and unrealized gain (loss) on investments | | | | | | | | | | | | |
| and translations of foreign currency | | | 5.76 | | | | (2.65 | ) | | | 5.01 | |
| Total from investment operations | | | 6.32 | | | | (2.31 | ) | | | 5.22 | |
| Less distributions from: | | | | | | | | | | | | |
| Net investment income | | | (0.53 | ) | | | (0.30 | ) | | | (0.15 | ) |
| Net realized gains | | | — | | | | (0.19 | ) | | | — | |
| Total distributions | | | (0.53 | ) | | | (0.49 | ) | | | (0.15 | ) |
| Net asset value, end of period | | $ | 33.06 | | | $ | 27.27 | | | $ | 30.07 | |
| Total Return(3) | | | 23.42 | % | | | (7.76 | )% | | | 20.96 | % |
| Supplemental Data and Ratios | | | | | | | | | | | | |
| Net assets, end of period (in 000's) | | $ | 14,875 | | | $ | 4,091 | | | $ | 3,007 | |
| Ratios to average net assets: | | | | | | | | | | | | |
| Expenses(4) | | | 0.40 | % | | | 0.40 | % | | | 0.40 | % |
| Net investment income(4) | | | 2.01 | % | | | 1.24 | % | | | 0.98 | % |
| Portfolio turnover rate(3) | | | 16 | % | | | 36 | % | | | 22 | % |
| (1) | Inception date of the Fund. |
| (2) | For a Fund share outstanding for the entire period. |
| (3) | Not annualized for periods less than one year. |
| (4) | Annualized for periods less than one year. |
| See accompanying Notes to Financial Statements. | |
| | |
| 28 | Tortoise |
| |
| |
| 2019 Annual Report| November 30, 2019 |
| |
| Tortoise Cloud Infrastructure Fund |
| Financial Highlights |
| |
| | Period from |
| | January 31, |
| | 2019(1)to |
| | November 30, 2019 |
| Per Common Share Data(2) | | | | |
| Net asset value, beginning of period | | $ | 25.00 | |
| Investment operations: | | | | |
| Net investment income | | | 0.14 | |
| Net realized and unrealized gain on investments and translations of foreign currency | | | 3.18 | |
| Total from investment operations | | | 3.32 | |
| Less distributions from: | | | | |
| Net investment income | | | — | |
| Net realized gains | | | — | |
| Total distributions | | | — | |
| Net asset value, end of period | | $ | 28.32 | |
| Total Return(3) | | | 13.27 | % |
| Supplemental Data and Ratios | | | | |
| Net assets, end of period (in 000's) | | $ | 4,247 | |
| Ratios to average net assets: | | | | |
| Expenses(4) | | | 0.40 | % |
| Net investment income(4) | | | 0.74 | % |
| Portfolio turnover rate(3) | | | 17 | % |
| (1) | Inception date of the Fund. |
| (2) | For a Fund share outstanding for the entire period. |
| (3) | Not annualized for periods less than one year. |
| (4) | Annualized for periods less than one year. |
| See accompanying Notes to Financial Statements. | |
| | |
| Tortoise | 29 |
| |
| |
| |
| |
| Tortoise Digital Payments Infrastructure Fund |
| Financial Highlights |
| |
| | Period from |
| | January 31, |
| | 2019(1)to |
| | November 30, 2019 |
| Per Common Share Data(2) | | | | |
| Net asset value, beginning of period | | $ | 25.00 | |
| Investment operations: | | | | |
| Net investment income | | | 0.04 | |
| Net realized and unrealized gain on investments and translations of foreign currency | | | 7.33 | |
| Total from investment operations | | | 7.37 | |
| Less distributions from: | | | | |
| Net investment income | | | — | |
| Net realized gains | | | — | |
| Total distributions | | | — | |
| Net asset value, end of period | | $ | 32.37 | |
| Total Return(3) | | | 29.48 | % |
| Supplemental Data and Ratios | | | | |
| Net assets, end of period (in 000's) | | $ | 8,093 | |
| Ratios to average net assets: | | | | |
| Expenses(4) | | | 0.40 | % |
| Net investment income(4) | | | 0.25 | % |
| Portfolio turnover rate(3) | | | 34 | % |
| (1) | Inception date of the Fund. |
| (2) | For a Fund share outstanding for the entire period. |
| (3) | Not annualized for periods less than one year. |
| (4) | Annualized for periods less than one year. |
| See accompanying Notes to Financial Statements. | |
| | |
| 30 | Tortoise |
| |
| |
| 2019 Annual Report| November 30, 2019 |
| |
| Notes to Financial Statements |
| November 30, 2019 |
| |
1. Organization
Managed Portfolio Series (the “Trust”) was organized as a Delaware statutory trust on January 27, 2011. The Trust is registered under the Investment Company Act of 1940, as amended (the “1940 Act”), as an open-end management investment company. The Tortoise North American Pipeline Fund (the “North American Pipeline Fund”), the Tortoise Global Water ESG Fund (the “Global Water ESG Fund”), the Tortoise Cloud Infrastructure Fund (the “Cloud Infrastructure Fund”) and the Tortoise Digital Payments Infrastructure Fund (the “Digital Payments Infrastructure Fund”) (or collectively, “the Funds”) are each a non-diversified series with their own investment objectives and policies within the Trust. The Trust has evaluated the structure, objective and activities of the Funds and determined that they meet the characteristics of an investment company. As such, these financial statements have applied the guidance as set forth in the Accounting Standards Codifications (“ASC”) 946, Financial Services Investment Companies.
The investment objective of the North American Pipeline Fund seeks investment results that correspond generally to the price and distribution rate (total return) performance of the Tortoise North American Pipeline IndexSM(the “North American Pipeline Index”). The Fund commenced operations on June 29, 2015.
The investment objective of the Global Water ESG Fund seeks investment results that correspond (before fees and expenses) generally to the price and distribution rate (total return) performance of the Tortoise Global Water ESG Index®(the “Water Index”). The Fund commenced operations on February 14, 2017.
The investment objective of the Cloud Infrastructure Fund seeks investment results that correspond (before fees and expenses) generally to the price and distribution rate (total return) performance of the Tortoise Global Cloud Infrastructure IndexSM(the “Cloud Infrastructure Index”). The Fund commenced operations on January 31, 2019.
The investment objective of the Digital Payments Infrastructure Fund seeks investment results that correspond (before fees and expenses) generally to the price and distribution rate (total return) performance of the Tortoise Global Digital Payments Infrastructure IndexSM(the “Digital Payments Index”). The Fund commenced operations on January 31, 2019.
Shares of the North American Pipeline Fund are listed and traded on the NYSE Arca, Inc. (the “NYSE”) and shares of the Global Water ESG Fund, Cloud Infrastructure Fund and Digital Payments Infrastructure Fund are listed and traded on CBOE Bzx Exchange, Inc. (“CBOE”). Market prices for the shares may be different from their net asset value (“NAV”). The Funds issue and redeem shares on a continuous basis at NAV only in blocks of 50,000 shares, called “Creation Units.” Creation Units are issued and redeemed principally in-kind for securities included in a specified universe, with cash included to balance to the Creation Unit total. Once created, shares generally trade in the secondary market at market prices that change throughout the day in amounts less than a Creation Unit. Except when aggregated in Creation Units, shares are not redeemable securities of the Funds. Shares of the Funds may only be purchased or redeemed by certain financial institutions (“Authorized Participants”). An Authorized Participant is either (i) a broker-dealer or other participant in the clearing process through the Continuous Net Settlement System of the National Securities Clearing Corporation or (ii) a Depository Trust Company participant and, in each case, must have executed a Participation Agreement with the Distributor. Most retail investors do not qualify as Authorized Participants nor have the resources to buy and sell whole Creation Units. Therefore, they are unable to purchase or redeem the shares directly from the Funds. Rather, most retail investors may purchase shares in the secondary market with the assistance of a broker and are subject to customary brokerage commissions or fees.
The Funds currently offer one class of shares, which have no front-end sales load, no deferred sales charge, and no redemption fee. A purchase (i.e. creation) transaction fee is imposed for the transfer and other transaction costs associated with the purchase of Creation Units. The standard fixed creation transaction fee for each Fund is $500, which is payable by the Advisor. In addition, a variable fee may be charged on all cash transactions or substitutes for Creation Units of up to a maximum of 2% as a percentage of the value of the Creation Units subject to the transaction. Variable fees are imposed to compensate the Funds for the transaction costs associated with the cash transactions. Variable fees received by the Funds are displayed in the capital shares transaction section of the Statement of Changes in Net Assets. The Funds may issue an unlimited number of shares of beneficial interest, with no par value. All shares of the Funds have equal rights and privileges.
2. Significant Accounting Policies
The following is a summary of significant accounting policies followed by the Funds in the preparation of its financial statements. These policies are in conformity with generally accepted accounting principles in the United States of America (“GAAP”).
Securities Valuation— All investments in securities are recorded at their estimated fair value, as described in Note 3.
Foreign Currency Translation— The books and records relating to the Funds’ non-U.S. dollar denominated investments are maintained in U.S. dollars on the following bases: (1) market value of investment securities, assets, and liabilities are translated at the current rate of exchange; and (2) purchases and sales of investment securities, income, and expenses are translated at the relevant rates of exchange prevailing on the respective dates of such transactions. The Funds do not isolate the portion of gains and losses on investments in equity securities that is due to changes in the foreign exchange rates from that which is due to changes in market prices of equity securities. The Funds report certain foreign currency-related transactions as components of realized gains for financial reporting purposes, whereas such components are treated as ordinary income for federal income tax purposes.
| |
| |
| |
| |
| Notes to Financial Statements(continued) |
| |
| |
Federal Income Taxes— The Funds intend to meet the requirements of subchapter M of the Internal Revenue Code applicable to regulated investment companies and to distribute substantially all net taxable investment income and net realized gains to shareholders in a manner which results in no tax cost to the Funds. Therefore, no federal income or excise tax provision is required. As of November 30, 2019, the Funds did not have any tax positions that did not meet the “more-likely-than-not” threshold of being sustained by the applicable tax authority. The Funds recognize interest and penalties, if any, related to unrecognized tax benefits on uncertain tax positions as income tax expense in the Statement of Operations. During the period ended November 30, 2019, the Funds did not incur any interest or penalties. Each of the tax years in the four-year period ended November 30, 2019 remains subject to examination by taxing authorities for North American Pipeline Fund. The Global Water ESG Fund, Cloud Infrastructure Fund and Digital Payments Infrastructure Fund are subject to examination by U.S. taxing authorities for the tax periods since the commencement of operations.
Securities Transactions, Income and Distributions— Security transactions are accounted for on the date the securities are purchased or sold (trade date). Realized gains and losses are reported on a specific identified cost basis. Interest income is recognized on an accrual basis, including amortization of premiums and accretion of discounts. Dividend income and distributions are recorded on the ex-dividend date. Withholding taxes on foreign dividends have been provided for in accordance with the Fund’s understanding of the applicable country’s tax rules and regulations. Distributions received from the Funds’ investments generally are comprised of ordinary income and return of capital. The Funds allocate distributions between investment income and return of capital based on estimates made at the time such distributions are received. Such estimates are based on information provided by each portfolio company and other industry sources. These estimates may subsequently be revised based on actual allocations received from the portfolio companies after their tax reporting periods are concluded, as the actual character of these distributions is not known until after the fiscal year end of the Funds.
During the year ended November 30, 2019, the North American Pipeline Fund reallocated the amount of 2018 investment income and return of capital it recognized based on the 2018 tax reporting information received from investments. This reclassification amounted to a decrease in accumulated net investment income of approximately $63,544 or $0.003 per share, a decrease in accumulated net realized gain of approximately $8,135 or $0.000 per share and an increase in unrealized appreciation of investments of approximately $71,679 or $0.004 per share.
The North American Pipeline Fund will make distributions of net investment income, if any, quarterly. The Global Water ESG Fund will make distributions of net investment income, if any, semiannually. The Cloud Infrastructure Fund and the Digital Payments Infrastructure Fund will make distributions of net investment income, if any, annually. The Funds will also distribute net realized capital gains, if any, annually. Distributions to shareholders are recorded on the ex-dividend date. The treatment for financial reporting purposes of distributions made to shareholders during the year from net investment income or net realized capital gains may differ from their ultimate treatment for federal income tax purposes. These differences are caused primarily by differences in the timing of the recognition of certain components of income, expense or realized capital gain for federal income tax purposes. Where such differences are permanent in nature, GAAP requires that they be reclassified in the components of the net assets based on their ultimate characterization for federal income tax purposes. Any such reclassifications will have no effect on net assets, results of operations or net asset values per share of the Funds.
For the period ended November 30, 2019, the following reclassifications were made:
| | Distributable | | |
| Fund | | Earnings (Losses) | | Paid-in Capital |
| North American Pipeline Fund | | $(2,637,580) | | $2,637,580 |
Use of Estimates— The preparation of financial statements in conformity with GAAP requires management to make estimates and assumptions that affect the reported amounts of assets and liabilities and disclosure of contingent assets and liabilities at the date of the financial statements and the reported amounts of revenues and expenses during the reporting period. Actual results could differ from those estimates.
Share Valuation— The NAV per share of the Funds are calculated by dividing the sum of the value of the securities held by the Funds, plus cash and other assets, minus all liabilities (including estimated accrued expenses) by the total number of shares outstanding for the Funds, rounded to the nearest cent. The North American Pipeline Fund’s shares will not be priced on the days on which the NYSE is closed for trading and the Global Water ESG Fund’s, the Cloud Infrastructure Fund’s and the Digital Payments Infrastructure Fund’s shares will not be priced on the days on which CBOE is closed for trading. The offering and redemption price per share for the Funds are equal to the Funds’ net asset value per share.
Indemnifications— Under the Trust’s organizational documents, its officers and trustees are indemnified against certain liabilities arising out of the performance of their duties to the Trust. In addition, in the normal course of business, the Trust may enter into contracts that provide general indemnification to other parties. The Trust’s maximum exposure under these arrangements is unknown, as this would involve future claims that may be made against the Trust that have not yet occurred and may not occur. However, the Trust has not had prior claims or losses pursuant to these contracts and expects the risk of loss to be remote.
Cash and Cash Equivalents— Cash and cash equivalents include short-term, liquid investments with an original maturity of three months or less and include money market fund accounts.
| |
| |
| 2019 Annual Report| November 30, 2019 |
| |
| Notes to Financial Statements(continued) |
| |
| |
New Accounting Pronouncements and Other Matters— In August 2018, FASB issued Accounting Standards Update 2018-13,Fair Value Measurement (Topic 820): Disclosure Framework-Changes to the Disclosure Requirements for Fair Value Measurement(“ASU 2018-13”). The primary focus of ASU 2018-13 is to improve the effectiveness of the disclosure requirements for fair value measurements. The changes affect all companies that are required to include fair value measurement disclosures. In general, the amendments in ASU 2018-13 are effective for all entities for fiscal years and interim periods within those fiscal years, beginning after December 15, 2019. An entity is permitted to early adopt the removed or modified disclosures upon the issuance of ASU 2018-13 and may delay adoption of the additional disclosures, which are required for public companies only, until their effective date. Management has evaluated the ASU 2018-13 and has adopted the disclosure requirements.
Illiquid Securities— A security may be considered illiquid if it lacks a readily available market. Securities are generally considered liquid if they can be sold or disposed of in the ordinary course of business within seven days at approximately the price at which the security is valued by the Fund. Illiquid securities may be valued under methods approved by the Board of Trustees (the “Board”) as reflecting fair value. The Fund will not hold more than 15% of the value of its net assets in illiquid securities. At November 30, 2019, the Global Water ESG Fund had investments in illiquid securities with a total value of $0 or 0.0% of total net assets. At November 30, 2019, the North American Pipeline Fund, Cloud Infrastructure Fund and Digital Payments Infrastructure Fund did not hold any illiquid securities.
| Security | | Shares | | Date Acquired | | Cost Basis |
| CT Environmental Group Limited | | 113,060 | | 6/2018 | | $ 15,150 |
3. Securities Valuation
The Funds have adopted fair value accounting standards, which establish an authoritative definition of fair value and set out a hierarchy for measuring fair value. These standards require additional disclosures about the various inputs and valuation techniques used to develop the measurements of fair value, a discussion in changes in valuation techniques and related inputs during the period and expanded disclosure of valuation levels for major security types. These inputs are summarized in the three broad levels listed below:
Level 1 — Quoted prices in active markets for identical assets or liabilities.
Level 2 — Observable inputs other than quoted prices included in Level 1. These inputs may include quoted prices for similar instruments, interest rates, prepayment speeds, credit risk, yield curves, default rates and similar data.
Level 3 — Significant unobservable inputs for the asset or liability, representing the Fund’s view of assumptions a market participant would use in valuing the asset or liability.
Following is a description of the valuation techniques applied to each Fund’s major categories of assets and liabilities measured at fair value on a recurring basis. Each Fund’s investments are carried at fair value.
Common stock (including MLPs)— Securities that are primarily traded on a national securities exchange are valued at the last sale price on the exchange on which they are primarily traded on the day of valuation or, if there has been no sale on such day, at the mean between the bid and ask prices. Securities traded primarily on the Nasdaq Global Market System for which market quotations are readily available are valued using the Nasdaq Official Closing Price (“NOCP”). If the NOCP is not available, such securities are valued at the last sale price on the day of valuation, or if there has been no sale on such day, at the mean between the bid and ask prices. To the extent these securities are actively traded and valuation adjustments are not applied, they are categorized in Level 1 of the fair value hierarchy.
Investment Companies— Investments in other mutual funds, including money market funds, are valued at their net asset value per share. To the extent these securities are actively traded and valuation adjustments are not applied, they are categorized in Level 1 of the fair value hierarchy.
Securities for which market quotations are not readily available, or if the closing price does not represent fair value, are valued following procedures approved by the Board of Trustees. These procedures consider many factors, including the type of security, size of holding, trading volume and news events. There can be no assurance that the Fund could obtain the fair value assigned to a security if they were to sell the security at approximately the time at which the Fund determines their net asset values per share. The Board of Trustees has established a Valuation Committee to administer, implement, and oversee the fair valuation process, and to make fair value decisions when necessary.The Board of Trustees regularly reviews reports that describe any fair value determinations and methods.
The inputs or methodology used for valuing securities are not an indication of the risk associated with investing in those securities.
| |
| |
| |
| |
| Notes to Financial Statements(continued) |
| |
| |
The following table is a summary of the inputs used to value each Fund’s securities by level within the fair value hierarchy as of November 30, 2019:
| North American Pipeline Fund | | Level 1 | | Level 2 | | Level 3 | | Total |
| Common stock | | $ | 337,004,621 | | $ | — | | $ | — | | $ | 337,004,621 |
| Master limited partnerships | | | 70,867,472 | | | — | | | — | | | 70,867,472 |
| Short-term investment | | | 5,042,013 | | | — | | | — | | | 5,042,013 |
| Total investments in securities | | $ | 412,914,106 | | $ | — | | $ | — | | $ | 412,914,106 |
| | | | | | | | | | | | | |
| Global Water ESG Fund | | Level 1 | | Level 2 | | Level 3 | | Total |
| Common stock | | $ | 14,732,726 | | $ | — | | $ | 0 | | $ | 14,732,726 |
| Short-term investment | | | 103,214 | | | — | | | — | | | 103,214 |
| Total investments in securities | | $ | 14,835,940 | | $ | — | | $ | — | | $ | 14,835,940 |
| | | | | | | | | | | | | |
| Cloud Infrastructure Fund | | Level 1 | | Level 2 | | Level 3 | | Total |
| Common stock | | $ | 4,223,543 | | $ | — | | $ | — | | $ | 4,223,543 |
| Short-term investment | | | 20,414 | | | — | | | — | | | 20,414 |
| Total investments in securities | | $ | 4,243,957 | | $ | — | | $ | — | | $ | 4,243,957 |
| | | | | | | | | | | | | |
| Digital Payments Infrastructure Fund | | Level 1 | | Level 2 | | Level 3 | | Total |
| Common stock | | $ | 7,917,799 | | $ | — | | $ | — | | $ | 7,917,799 |
| Short-term investment | | | 11,892 | | | — | | | — | | | 11,892 |
| Total investments in securities | | $ | 7,929,691 | | $ | — | | $ | — | | $ | 7,929,691 |
Refer to each Fund’s Schedule of Investments for additional industry information.
The following is a reconciliation of Level 3 assets for which significant unobservable inputs were used to determine fair value.
| | Investments in |
| Global Water ESG Fund | | Securities |
| Balance as of 11/30/2018 | | $ | — | |
| Accrued discounts/premiums | | | — | |
| Realized gain (loss) | | | — | |
| Change in net unrealized appreciation (depreciation) | | | — | |
| Net purchases (sales) | | | — | |
| Transfers into and/or out of Level 3 | | | — | |
| Balance as of 11/30/2019 | | $ | — | |
| Net unrealized depreciation of Level 3 Securities as of November 30, 2019 | | $ | (15,150 | ) |
4. Concentration Risk
Because the North American Pipeline Fund’s assets are concentrated in the energy pipeline industry, the Tortoise Global Water ESG Fund’s assets are concentrated in the water industry, the Tortoise Cloud Infrastructure Fund’s assets are concentrated in the cloud computing industry and the Tortoise Digital Payments Infrastructure Fund’s assets are concentrated in the digital payments industry, the Funds are subject to loss due to adverse occurrences that may affect those industries. Funds that primarily invest in a particular industry may experience greater volatility than funds investing in a broad range of industries.
5. Investment Advisory Fee and Other Transactions with Affiliates
The Trust has an agreement with Tortoise Index Solutions, L.L.C. (the “Adviser”) to furnish investment advisory services to the Funds. Pursuant to an Investment Advisory Agreement between the Trust and the Adviser, the Adviser is entitled to receive, on a monthly basis, an annual advisory fee equal to 0.40% of each Fund’s average daily net assets. The Adviser bears the cost of all advisor and non-advisory services required to operate each Fund.
| |
| |
| 2019 Annual Report| November 30, 2019 |
| |
| Notes to Financial Statements(continued) |
| |
| |
U.S. Bancorp Fund Services, LLC, doing business as U.S. Global Fund Services (“Fund Services” or the “Administrator”) acts as the Funds’ Administrator, Transfer Agent and Fund Accountant. U.S. Bank, N.A. (the “Custodian”) serves as the custodian to the Funds. The Custodian is an affiliate of the Administrator. The Administrator performs various administrative and accounting services for the Funds. The Administrator prepares various federal and state regulatory filings, reports and returns for the Funds; prepares reports and materials to be supplied to the Trustees and monitors the activities of the Funds’ custodian, transfer agent and accountants. The officers of the Trust including the Chief Compliance Officer are employees of the Administrator. As compensation for its services, the Administrator is entitled to a monthly fee at an annual rate based upon the average daily net assets of the Funds, subject to annual minimums.
Quasar Distributors, LLC (the “Distributor”) acts as the Funds’ principal underwriter in a continuous public offering of the Funds’ shares. The Distributor is an affiliate of the Administrator.
6. Investment Transactions
The aggregate purchases and sales, excluding U.S. government securities, short-term investments and in-kind transactions, by each Fund for the period ended November 30, 2019, were as follows:
| | Purchases | | Sales |
| North American Pipeline Fund | | $ | 44,743,671 | | $ | 43,494,943 |
| Global Water ESG Fund | | | 982,526 | | | 967,935 |
| Cloud Infrastructure Fund | | | 575,771 | | | 513,856 |
| Digital Payments Infrastructure Fund | | | 1,836,701 | | | 1,506,672 |
| | | | | | | |
| During the period ended November 30, 2019, in-kind transactions associated with creation and redemptions were as follows: |
| | | | | | | |
| | Purchases | | Sales |
| North American Pipeline Fund | | $ | 227,918,398 | | $ | 14,830,130 |
| Global Water ESG Fund | | | 9,547,149 | | | — |
| Cloud Infrastructure Fund | | | 3,810,922 | | | — |
| Digital Payments Infrastructure Fund | | | 6,567,730 | | | — |
| | | | | | | |
| During the period ended November 30, 2019, net capital gains resulting from in-kind redemptions were as follows: |
| | | | | | | |
| North American Pipeline Fund | | $ | 2,858,607 | | | |
| Global Water ESG Fund | | | — | | | |
| Cloud Infrastructure Fund | | | — | | | |
| Digital Payments Infrastructure Fund | | | — | | | |
7. Federal Tax Information
As of November 30, 2019, the cost basis of investments for federal income tax purposes and the components of accumulated losses on a tax basis were as follows:
| | | | | | | | | | Cloud | | Digital Payments |
| | North American | | Global Water | | Infrastructure | | Infrastructure |
| | Pipeline Fund | | ESG Fund | | Fund | | Fund |
| Cost of investments | | $ | 404,943,503 | | | $ | 13,780,366 | | | $ | 3,939,175 | | | $ | 7,049,655 | |
| Gross unrealized appreciation | | | 35,817,893 | | | | 1,288,868 | | | | 431,634 | | | | 1,044,841 | |
| Gross unrealized depreciation | | | (31,991,632 | ) | | | (233,323 | ) | | | (126,855 | ) | | | (164,821 | ) |
| Net unrealized appreciation | | | 3,826,261 | | | | 1,055,545 | | | | 304,779 | | | | 880,020 | |
| Undistributed ordinary income | | | — | | | | 45,748 | | | | 68,812 | | | | 166,900 | |
| Undistributed long-term capital gain | | | — | | | | — | | | | — | | | | — | |
| Total distributable income and capital gains | | | — | | | | 45,748 | | | | 68,812 | | | | 166,900 | |
| Other accumulated losses | | | (638,968 | ) | | | (72,877 | ) | | | — | | | | — | |
| Total distributable earnings | | $ | 3,187,293 | | | $ | 1,028,416 | | | $ | 373,591 | | | $ | 1,046,920 | |
The difference between book and tax-basis cost is attributable primarily to wash sales and master limited partnership (“MLP”) adjustments.
As of November 30, 2019, the North American Pipeline Fund had a long-term capital loss carryforward of $638,968, the Global Water ESG Fund had short-term capital loss carryforward of $63,985 and a long-term capital loss carryforward of $8,892, which may be carried forward for an unlimited period under the Regulated Investment Company Modernization Act of 2010. To the extent Funds realize future net capital gains, those gains will be offset by any unused capital loss carryforwards. Capital loss carryforwards will retain their character as either short-term or long-term
| |
| |
| |
| |
| Notes to Financial Statements (continued) |
| |
| |
capital losses. Thus, such losses must be used first to offset gains of the same character; for example, long-term loss carryforwards will first offset long-term gains, before they can be used to offset short-term gains. The capital gains and losses have been estimated based on information currently available and are subject to revision upon receipt of the 2019 tax reporting information from the individual MLPs.
In order to meet certain excise tax distribution requirements, the Funds are required to measure and distribute annually net capital gains realized during a twelve month period ending November 30 and net investment income earned during a twelve month period ending December 31. In connection with this, the Funds are permitted for tax purposes to defer into its next fiscal year qualified late year ordinary losses. Qualified late year ordinary losses are generally losses incurred between January 1 and the end of its fiscal year, November 30, 2019. The Funds did not defer any late year ordinary losses for the taxable year ended November 30, 2019.
During the year ended November 30, 2019, the Funds paid the following distributions to shareholders:
| | | | | | | | Cloud | | Digital Payments |
| | North American | | Global Water | | Infrastructure | | Infrastructure |
| | Pipeline Fund | | ESG Fund | | Fund | | Fund |
| Ordinary income* | | $ | 6,397,624 | | $ | 79,267 | | $ | — | | $ | — |
| Long-term capital gains** | | | — | | | — | | | — | | | — |
| Return of capital | | | 7,556,816 | | | — | | | — | | | — |
| Total distributions | | $ | 13,954,440 | | $ | 79,267 | | $ | — | | $ | — |
During the year ended November 30, 2018, the Funds paid the following distributions to shareholders:
| | North American | | Global Water |
| | Pipeline Fund | | ESG Fund |
| Ordinary income* | | $ | 3,219,856 | | $ | 62,050 |
| Long-term capital gains** | | | — | | | — |
| Return of capital | | | 2,457,119 | | | — |
| Total distributions | | $ | 5,676,975 | | $ | 62,050 |
| * | For federal income tax purposes, distributions of short-term capital gains are treated as ordinary income distributions. |
| ** | The Fund designates as long-term capital gain distributions, pursuant to Internal Revenue Code Section 852(b)(3)(C). |
8. Subsequent Events
On December 30, 2019, the North American Pipeline Fund paid an income distribution to shareholders in the amount of $4,648,800 or $0.22350000 per share.
On December 30, 2019, the Global Water ESG Fund paid an income distribution to shareholders in the amount of $53,415 or $0.11870001 per share.
On December 31, 2019, the Cloud Infrastructure Fund paid an income distribution to shareholders in the amount of $25,984 or $0.17322753 per share and a short-term gain distribution of $310,243, or $2.06828406 per share.
On December 30, 2019, the Digital Payments Infrastructure Fund paid an income distribution to shareholders in the amount of $11,181 or $0.03727000 per share and a short-term gain distribution of $158,112, or $0.52704 per share.
On November 25, 2019, U.S. Bancorp, the parent company of Quasar Distributors, LLC, the Funds’ distributor, announced that it had signed a purchase agreement to sell Quasar to Foreside Financial Group, LLC such that Quasar will become a wholly-owned broker-dealer subsidiary of Foreside. The transaction is expected to close by the end of March 2020. Quasar will remain the Funds’ distributor at the close of the transaction, subject to Board approval.
Based upon a recommendation by the Adviser, the Board of Trustees of the Trust approved a plan of liquidation for the Cloud Infrastructure Fund. The liquidation occurred on December 31, 2019 (the “Liquidation”). The Adviser determined that the Fund had limited prospects for meaningful growth. As a result, the Adviser and the Board of Trustees believed the Liquidation of the Cloud Infrastructure Fund was in the best interest of shareholders.
On March 16, 2020, the Funds will hold a special shareholder meeting to consider a vote on a new investment sub-advisory agreement between Tortoise Index Solutions, L.L.C. (the “Adviser”) and Vident Investment Advisory, LLC (the “Sub-Adviser”) and to consider a vote on a “manager of managers” arrangement that would grant each Fund and the Adviser greater flexibility to change sub-advisory arrangements without shareholder approval, subject to prior approval by the Board of Trustees of the Trust. Shareholders of record of the Funds at the close of business on the record date, January 14, 2020, are entitled to notice of and to vote at the Special Meeting and any adjournment(s) or postponements thereof. The Notice of Special Meeting of Shareholders, proxy statement and proxy card are being mailed on or about January 28, 2020, to such shareholders of record.
Management has performed an evaluation of subsequent events through the date the financial statements were issued and has determined that no additional items require recognition or disclosure.
| |
| |
| 2019 Annual Report| November 30, 2019 |
| |
| Report of Independent Registered Public Accounting Firm |
| |
| |
To the Shareholders and the Board of Trustees
Tortoise North American Pipeline Fund
Tortoise Global Water ESG Fund
Tortoise Cloud Infrastructure Fund
Tortoise Digital Payments Infrastructure Fund
Opinion on the Financial Statements
We have audited the accompanying statements of assets and liabilities of Tortoise North American Pipeline Fund, Tortoise Global Water ESG Fund, Tortoise Cloud Infrastructure Fund, and Tortoise Digital Payments Infrastructure Fund (collectively referred to as the “Funds”), (four of the Funds constituting the Managed Portfolio Series (the Trust)), including the schedules of investments, as of November 30, 2019, and the related statements of operations, the changes in net assets, and the financial highlights for each of the periods indicated in the table below and the related notes (collectively referred to as the “financial statements”). In our opinion, the financial statements present fairly, in all material respects, the financial position of each of the Funds (four of the funds constituting Managed Portfolio Series) at November 30, 2019, the results of their operations, changes in their net assets and their financial highlights for the periods indicated in the table below, in conformity with U.S. generally accepted accounting principles.
Funds constituting
Managed Portfolio Series | | Statement of
operations | | Statement of changes
in net assets | | Financial highlights |
| Tortoise North American Pipeline Fund | | For the year ended November 30, 2019 | | For each of the two years in the period ended November 30, 2019 | | For each of the four years in the period ended November 30, 2019 and the period from June 29, 2015 (commencement of operations) to November 30, 2015 |
| Tortoise Global Water ESG Fund | | For the year ended November 30, 2019 | | For each of the two years in the period ended November 30, 2019 | | For each of the two years in the period ended November 30, 2019 and the period from February 14, 2017 (commencement of operations) to November 30, 2017 |
Tortoise Cloud Infrastructure Fund
Tortoise Digital Payments
Infrastructure Fund | | For the period from January 31, 2019 to November 30,2019 |
Basis for Opinion
These financial statements are the responsibility of the Trust’s management. Our responsibility is to express an opinion on each of the Funds’ financial statements based on our audits. We are a public accounting firm registered with the Public Company Accounting Oversight Board (United States) (“PCAOB”) and are required to be independent with respect to the Trust in accordance with the U.S. federal securities laws and the applicable rules and regulations of the Securities and Exchange Commission and the PCAOB.
We conducted our audits in accordance with the standards of the PCAOB. Those standards require that we plan and perform the audit to obtain reasonable assurance about whether the financial statements are free of material misstatement, whether due to error or fraud. The Trust is not required to have, nor were we engaged to perform, an audit of the Trust’s internal control over financial reporting. As part of our audits we are required to obtain an understanding of internal control over financial reporting but not for the purpose of expressing an opinion on the effectiveness of the Trust’s internal control over financial reporting. Accordingly, we express no such opinion.
Our audits included performing procedures to assess the risks of material misstatement of the financial statements, whether due to error or fraud, and performing procedures that respond to those risks. Such procedures included examining, on a test basis, evidence regarding the amounts and disclosures in the financial statements. Our procedures included confirmation of securities owned as of November 30, 2019, by correspondence with the custodian and brokers or by other appropriate auditing procedures where replies from brokers were not received. Our audits also included evaluating the accounting principles used and significant estimates made by management, as well as evaluating the overall presentation of the financial statements. We believe that our audits provide a reasonable basis for our opinion.

We have served as the auditor of one or more of the portfolios that comprise the Managed Portfolio Series since 2011
Minneapolis, Minnesota
January 29, 2020
| |
| |
| |
| |
| Trustees & Officers(unaudited) |
| November 30, 2019 |
| |
| | | | | | Number of | | | | |
| | | | | | Portfolios | | | | |
| | | | Term of Office | | in Trust | | | | Other Directorships |
| Name, Address | | Position(s) Held | | and Length of | | Overseen | | Principal Occupation(s) | | Held by Trustee During |
| and Year of Birth | | with the Trust | | Time Served | | by Trustee | | During the Past Five Years | | the Past Five Years |
| Independent Trustees | | | | | | | | | | |
Leonard M. Rush, CPA
615 E. Michigan St.
Milwaukee, WI 53202
Year of Birth: 1946 | | Lead Independent Trustee and Audit Committee Chairman | | Indefinite Term;
Since April 2011 | | 39 | | Retired, Chief Financial Officer, Robert W. Baird & Co. Incorporated (2000-2011). | | Independent Trustee,
ETF Series Solutions
(52 Portfolios) (2012-Present); Director, Anchor Bancorp Wisconsin, Inc. (2011-2013). |
David A. Massart
615 E. Michigan St.
Milwaukee, WI 53202
Year of Birth: 1967 | | Trustee and Valuation Committee Chairman | | Indefinite Term;
Since April 2011 | | 39 | | Co-Founder and Chief Investment Strategist, Next Generation Wealth Management, Inc. (2005-present). | | Independent Trustee,
ETF Series Solutions
(52 Portfolios) (2012-Present). |
David M. Swanson
615 E. Michigan St.
Milwaukee, WI 53202
Year of Birth: 1957 | | Trustee and Nominating & Governance Committee Chairman | | Indefinite Term;
Since April 2011 | | 39 | | Founder and Managing Principal, SwanDog Strategic Marketing, LLC (2006-present). | | Independent Trustee,
ALPS Variable Investment Trust
(10 Portfolios) (2006-Present); Independent Trustee, RiverNorth Opportunities Closed-End Fund (2015-Present). |
| Interested Trustee | | | | | | | | | | |
Robert J. Kern*
615 E. Michigan St.
Milwaukee, WI 53202
Year of Birth: 1958 | | Chairman, and Trustee | | Indefinite Term;
Since January 2011 | | 39 | | Retired Executive Vice President, U.S. Bancorp Fund Services, LLC (1994-2018). | | None |
| * | Mr. Kern is an “interested person” of the Trust as defined by the 1940 Act by virtue of the fact that he was a board member of the Fund’s principal underwriter, Quasar Distributors, LLC, an affiliate of the Administrator. |
| |
| |
| 2019 Annual Report| November 30, 2019 |
| |
| Trustees & Officers (unaudited) (continued) |
| November 30, 2019 |
| |
| | | | | | Number of | | | | |
| | | | | | Portfolios | | | | |
| | | | Term of Office | | in Trust | | | | Other Directorships |
| Name, Address | | Position(s) Held | | and Length of | | Overseen | | Principal Occupation(s) | | Held by Trustee During |
| and Year of Birth | | with the Trust | | Time Served | | by Trustee | | During the Past Five Years | | the Past Five Years |
| Officers | | | | | | | | | | |
Brian R. Wiedmeyer
615 E. Michigan St.
Milwaukee, WI 53202
Year of Birth: 1973 | | President and Principal
Executive Officer | | Indefinite Term;
Since November 2018 | | N/A | | Vice President,
U.S. Bancorp Fund Services, LLC
(2005-present). | | N/A |
Deborah Ward
615 E. Michigan St.
Milwaukee, WI 53202
Year of Birth: 1966 | | Vice President,
Chief Compliance
Officer and Anti-Money
Laundering Officer | | Indefinite Term;
Since April 2013 | | N/A | | Senior Vice President,
U.S. Bancorp Fund Services, LLC
(2004-present). | | N/A |
Benjamin Eirich
615 E. Michigan St.
Milwaukee, WI 53202
Year of Birth: 1981 | | Vice President,
Treasurer and Principal
Financial Officer | | Indefinite Term;
Since August 2019
(Treasurer); Since
November 2018
(Vice President) | | N/A | | Assistant Vice President,
U.S. Bancorp Fund Services, LLC
(2008-present). | | N/A |
Thomas A. Bausch, Esq.
615 E. Michigan St.
Milwaukee, WI 53202
Year of Birth: 1979 | | Secretary | | Indefinite Term;
Since November 2017 | | N/A | | Vice President,
U.S. Bancorp Fund Services, LLC
(2016-Present); Associate,
Godfrey & Kahn S.C. (2012-2016). | | N/A |
Douglas Schafer
615 E. Michigan St.
Milwaukee, WI 53202
Year of Birth: 1970 | | Vice President and
Assistant Treasurer | | Indefinite Term;
Since May 2016
(Assistant Treasurer);
Since November 2018
(Vice President) | | N/A | | Assistant Vice President,
U.S. Bancorp Fund Services, LLC
(2002-present). | | N/A |
Michael Cyr II
615 E. Michigan St.
Milwaukee, WI 53202
Year of Birth: 1992 | | Vice President and
Assistant Treasurer | | Indefinite Term;
Since August 2019 | | N/A | | Officer,
U.S. Bancorp Fund Services, LLC
(2013-present). | | N/A |
| |
| |
| |
| |
| Additional Information (unaudited) |
| |
| |
Availability of Fund Portfolio Information
The Fund files complete schedules of portfolio holdings with the SEC for the first and third quarters of each fiscal year on Part F of Form N-PORT. The Funds’ Part F of Form N-PORT are available on the SEC’s website at www.sec.gov and may be reviewed and copied at the SEC’s Public Reference Room in Washington, D.C. Information on the operation of the Public Reference Room may be obtained by calling 1-800-732-0330. The Funds’ Part F of Form N-PORT may also be obtained by calling toll-free 1-844-TR-INDEX or 1-844-874-6339.
Availability of Proxy Voting Information
A description of the Fund’s Proxy Voting Policies and Procedures is available without charge, upon request, by calling 1-844-TR-INDEX or 1-844-874-6339. Information regarding how the Fund voted proxies relating to portfolio securities during the most recent 12 month period ended June 30, is available (1) without charge, upon request, by calling 1-844-TR-INDEX or 1-844-874-6339, or (2) on the SEC’s website at www.sec.gov.
Qualified Dividend Income/Dividends Received Deduction
For the fiscal year ended November 30, 2019, certain dividends paid by the Funds may be reported as qualified dividend income and may be eligible for taxation at capital gain rates. The percentage of dividends declared from ordinary income designated as qualified dividend income was 100.00%, 100.00%, 0.00%, and 0.00% for the North American Pipeline Fund, Global Water ESG Fund, Cloud Infrastructure Fund, and the Digital Payments Infrastructure Fund, respectively.
For corporate shareholders, the percent of ordinary income distributions qualifying for the corporate dividends received deduction for the fiscal year ended November 30, 2019 was 56.72%, 36.97%, 0.00%, and 0.00% for the North American Pipeline Fund, Global Water ESG Fund, Cloud Infrastructure Fund, and the Digital Payments Infrastructure Fund, respectively.
The percentage of taxable ordinary income distributions that are designated as short-term capital gain distributions under Internal Revenue Section 871(k)(2)(C) was 0.00%, 0.00%, 0.00%, and 0.00% for the North American Pipeline Fund, Global Water ESG Fund, Cloud Infrastructure Fund, and the Digital Payments Infrastructure Fund, respectively.
Frequency Distribution of Premiums and Discounts
Information regarding how often shares of the Fund trades on the Exchange at a price about (i.e., at a premium) or below (i.e., at a discount) the NAV of the Fund is available, free of charge, on the Fund’s website at etp.tortoiseindexsolutions.com.
| |
| |
| 2019 Annual Report| November 30, 2019 |
| |
| Additional Information(unaudited) (continued) |
| |
| |
Privacy Notice
The Funds collect only relevant information about you that the law allows or requires us to have in order to conduct our business and properly service you. The Funds collect financial and personal information about you (“Personal Information”) directly (e.g., information on account applications and other forms, such as your name, address, and social security number, and information provided to access account information or conduct account transactions online, such as password, account number, e-mail address, and alternate telephone number), and indirectly (e.g., information about your transactions with us, such as transaction amounts, account balance and account holdings).
The Funds do not disclose any non-public personal information about its shareholders or former shareholders other than for everyday business purposes such as to process a transaction, service an account, to respond to court orders and legal investigations or as otherwise permitted by law. Third parties that may receive this information include companies that provide transfer agency, technology and administrative services to the Funds, as well as the Funds’ investment adviser who is an affiliate of the Funds. If you maintain a retirement/educational custodial account directly with the Funds, we may also disclose your Personal Information to the custodian for that account for shareholder servicing purposes. We limit access to your Personal Information provided to unaffiliated third parties to information necessary to carry out their assigned responsibilities to the Funds. All shareholder records will be disposed of in accordance with applicable law.
The Trust maintains physical, electronic and procedural safeguards to protect Personal Information and requires its third parties service provides with access to such information to treat the Personal Information with the same high degree of confidentiality.
In the event that you hold shares of a Fund through a financial intermediary, including, but not limited to, a broker-dealer, bank, credit union or trust company, the privacy policy of the your financial intermediary would govern how their non-public personal information would be shared with unaffiliated third parties.
With respect to the Funds, issues and redemptions of their shares at net asset value (“NAV”) occur only in large aggregations of a specified number of shares (e.g., 50,000) called “Creation Units.” Only Authorized Participants (“APs”) may acquire shares directly from an ETF, and only APs may tender their ETF shares for redemption directly to the ETF, at NAV. APs must be (i) a broker-dealer or other participant in the clearing process through the Continuous Net Settlement System of the NSCC, a clearing agency that is registered with the SEC; or (ii) a DTC participant. In addition, each AP must execute a Participant Agreement that has been agreed to by the Funds’ distributor, and that has been accepted by the Funds’ transfer agent, with respect to purchases and redemptions of Creation Units.
Because of this structure, the Funds do not have any information regarding any “consumers” as defined in Rule 3 of Regulation S-P with respect to any ETFs, and consequently are not required by Regulation S-P to deliver a notice of the Funds’ privacy policy to any ETF shareholders.
| Contacts |
| |
| Board of Trustees |
| |
David Massart
Leonard Rush, CPA
David Swanson
Robert Kern |
| |
| Investment Adviser |
| |
Tortoise Index Solutions, L.L.C.
5100 W. 115th Place
Leawood, KS 66211 |
| |
Independent Registered Public
Accounting Firm |
| |
Ernst & Young, LLP
220 South Sixth Street, Suite 1400
Minneapolis, MN 55402 |
| |
Transfer Agent, Fund Accountant
and Fund Administrator |
| |
U.S. Bancorp Fund Services, LLC
615 E. Michigan Street
Milwaukee, WI 53202 |
| |
| Distributor |
| |
Quasar Distributors, LLC
777 E. Wisconsin Ave.
Milwaukee, WI 53202 |
| |
|
| Custodian |
| |
U.S. Bank, N.A.
1555 North Rivercenter Drive
Milwaukee, WI 53212 |
| |
| Fund Counsel |
| |
Stradley Ronon Stevens & Young LLP
2005 Market Street
Suite 2600
Philadelphia, PA 19103 |
| |
844-TR-INDEX
(844-874-6339) |
| |
| This report must be accompanied or preceded by a prospectus. |
| |
| The Fund’s Statement of Additional Information contains additional information about the Fund’s trustees and is available without charge upon request by calling 1-844-TR-INDEX or 1-844-874-6339. |

5100 W. 115th Place
Leawood, KS 66211
www.tortoiseadvisors.com
Item 2. Code of Ethics.
The registrant has adopted a code of ethics that applies to the registrant’s principal executive officer and principal financial officer. The registrant has not made any substantive amendments to its code of ethics during the period covered by this period.
The registrant has not granted any waivers from any provisions of the code of ethics during the period covered by this report.
A copy of the registrant’s code of ethics that applies to the registrant’s principal executive officer and principal financial officer is filed herewith.
Item 3. Audit Committee Financial Expert.
The registrant’s Board of Trustees has determined that there is at least one audit committee financial expert serving on its audit committee. Leonard M. Rush is the “audit committee financial expert” and is considered to be “independent” as each term is defined in Item 3 of Form N-CSR.
Item 4. Principal Accountant Fees and Services.
The registrant has engaged its principal accountant to perform audit services, audit-related services, tax services and other services during the past fiscal year. “Audit services” refer to performing an audit of the registrant's annual financial statements or services that are normally provided by the accountant in connection with statutory and regulatory filings or engagements for the past fiscal year. “Audit-related services” refer to the assurance and related services by the principal accountant that are reasonably related to the performance of the audit. “Tax services” refer to professional services rendered by the principal accountant for tax compliance, tax advice, and tax planning, including reviewing the Fund’s tax returns and distribution calculations. There were no “other services” provided by the principal accountant. For the fiscal years ended November 30, 2019 and November 30, 2018, the Fund’s principal accountant was Ernst & Young. The following table details the aggregate fees billed or expected to be billed for each of the last fiscal year for audit fees, audit-related fees, tax fees and other fees by the principal accountant.
| | FYE 11/30/2019 | | FYE 11/30/2018 |
| Audit Fees | | $194,000 | | $143,100 |
| Audit-Related Fees | | $0 | | $0 |
| Tax Fees | | $91,645 | | $73,170 |
| All Other Fees | | $0 | | $0 |
The audit committee has adopted pre-approval policies and procedures that require the audit committee to pre-approve all audit and non-audit services of the registrant, including services provided to any entity affiliated with the registrant.
The percentage of fees billed by Ernst & Young applicable to non-audit services pursuant to waiver of pre-approval requirement was as follows:
| | FYE 11/30/2019 | | FYE 11/30/2018 |
| Audit-Related Fees | | 0% | | 0% |
| Tax Fees | | 0% | | 0% |
| All Other Fees | | 0% | | 0% |
All of the principal accountant’s hours spent on auditing the registrant’s financial statements were attributed to work performed by full-time permanent employees of the principal accountant.
The following table indicates the non-audit fees, other than the tax services as noted above, billed or expected to be billed by the registrant’s accountant for services to the registrant and to the registrant’s investment adviser (and any other controlling entity, etc.—not sub-adviser) for the last two years. The audit committee of the board of trustees/directors has considered whether the provision of non-audit services that were rendered to the registrant's investment adviser is compatible with maintaining the principal accountant's independence and has concluded that the provision of such non-audit services by the accountant has not compromised the accountant’s independence.
| Non-Audit Related Fees | | FYE 11/30/2019 | | FYE 11/30/2018 |
| Registrant | | $0 | | $0 |
| Registrant’s Investment Adviser | | $45,100 | | $136,497 |
Item 5. Audit Committee of Listed Registrants.
Not applicable to registrants who are not listed issuers (as defined in Rule 10A-3 under the Securities Exchange Act of 1934).
Item 6. Investments.
(a) Schedule of Investments is included as part of the report to shareholders filed under Item 1 of this Form.
(b) Not applicable.
Item 7. Disclosure of Proxy Voting Policies and Procedures for Closed-End Management Investment Companies.
Not applicable to open-end investment companies.
Item 8. Portfolio Managers of Closed-End Management Investment Companies.
Not applicable to open-end investment companies.
Item 9. Purchases of Equity Securities by Closed-End Management Investment Company and Affiliated Purchasers.
Not applicable to open-end investment companies.
Item 10. Submission of Matters to a Vote of Security Holders.
There have been no material changes to the procedures by which shareholders may recommend nominees to the registrant’s board of trustees.
Item 11. Controls and Procedures.
| (a) | The Registrant’s President and Treasurer have reviewed the Registrant's disclosure controls and procedures (as defined in Rule 30a-3(c) under the Investment Company Act of 1940 (the “Act”)) as of a date within 90 days of the filing of this report, as required by Rule 30a-3(b) under the Act and Rules 13a-15(b) or 15d-15(b) under the Securities Exchange Act of 1934. Based on their review, such officers have concluded that the disclosure controls and procedures are effective in ensuring that information required to be disclosed in this report is appropriately recorded, processed, summarized and reported and made known to them by others within the Registrant and by the Registrant’s service provider. |
| | |
| (b) | There were no significant changes in the Registrant's internal control over financial reporting (as defined in Rule 30a-3(d) under the Act) that occurred during the period covered by this report that has materially affected, or is reasonably likely to materially affect, the Registrant's internal control over financial reporting. |
Item 12. Disclosure of Securities Lending Activities for Closed-End Management Investment Companies
Not applicable to open-end investment companies.
Item 13. Exhibits.
| (a) | (1)Any code of ethics or amendment thereto, that is subject of the disclosure required by Item 2, to the extent that the registrant intends to satisfy Item 2 requirements through filing an exhibit.1) Filed herewith |
| | |
| (2)Certifications pursuant to Section 302 of the Sarbanes-Oxley Act of 2002.Filed herewith. |
| | |
| (3)Any written solicitation to purchase securities under Rule 23c-1 under the Act sent or given during the period covered by the report by or on behalf of the registrant to 10 or more persons.Not applicable to open-end investment companies. |
| | |
| (4)Change in the registrant’s independent public accountant.There was no change in the registrant’s independent public accountant for the period covered by this report. |
| | |
| (b) | Certification pursuant to Section 906 of the Sarbanes-Oxley Act of 2002.Furnished herewith. |
SIGNATURES
Pursuant to the requirements of the Securities Exchange Act of 1934 and the Investment Company Act of 1940, the registrant has duly caused this report to be signed on its behalf by the undersigned, thereunto duly authorized.
| | (Registrant) | Managed Portfolio Series |
| | By (Signature and Title)* | /s/ Brian R. Wiedmeyer |
| | Brian R. Wiedmeyer, President |
Pursuant to the requirements of the Securities Exchange Act of 1934 and the Investment Company Act of 1940, this report has been signed below by the following persons on behalf of the registrant and in the capacities and on the dates indicated.
| | By (Signature and Title)* | /s/ Brian R. Wiedmeyer |
| | Brian R. Wiedmeyer, President |
| | By (Signature and Title)* | /s/ Benjamin J. Eirich |
| | Benjamin J. Eirich, Treasurer |
* Print the name and title of each signing officer under his or her signature.