TorrayResolute Small/Mid Cap Growth Fund
Investor Class Shares – TRSDX
Institutional Class Shares – TRSMX
Annual Report
| funds.torrayresolute.com | December 31, 2019 |
Beginning on January 1, 2021, as permitted by regulations adopted by the Securities and Exchange Commission, paper copies of the Fund’s annual and semi-annual shareholder reports will no longer be sent by mail, unless you specifically request paper copies of the reports from the Fund (defined herein), or from your financial intermediary, such as a broker-dealer or bank. Instead, the reports will be made available on the Fund’s website (funds.torrayresolute.com), and you will be notified by mail each time a report is posted and provided with a website link to access the report.
If you already elected to receive shareholder reports electronically, you will not be affected by this change and you need not take any action. You may elect to receive shareholder reports and other communications from the Fund electronically anytime by contacting your financial intermediary (such as a broker-dealer or bank) or, if you are a direct investor, by calling 1-844-406-4960 or by sending an e-mail request to info@torray.com.
You may elect to receive all future reports in paper free of charge. If you invest through a financial intermediary, you can contact your financial intermediary to request that you continue to receive paper copies of your shareholder reports. If you invest directly with the Fund, you can call 1-844-406-4960 or send an email request to info@torray.com to let the Fund know you wish to continue receiving paper copies of your shareholder reports. Your election to receive reports in paper will apply to all funds held in your account if you invest through your financial intermediary.
TORRAYRESOLUTE SMALL/MID CAP GROWTH FUND
Management Discussion and Analysis (Unaudited)
Portfolio Commentary
The Fund employs a concentrated approach, investing in 25 to 30 stocks, with a long-term orientation, quality focus and valuation discipline. Our investment philosophy is based on the view that selective investments in diverse growth businesses with superior operating and financial characteristics generate excess returns with below-market risk. We believe risk is systematically mispriced in the market, and that a focus on low volatility in underlying business fundamentals improves the probability of generating attractive returns over time.
For the year ended December 31, 2019, the TorrayResolute Small/Mid Cap Growth Fund’s Institutional Class gained 30.19% compared to 32.65% for the Russell 2500 Growth Index and 27.77% for the Russell 2500 Index. The sector allocation effect was modestly positive and security selection was negative. On an absolute basis, Real Estate was the Fund’s best performing sector, Consumer Staples its worst. At the security level, top contributors were Copart (CPRT), ANSYS (ANSS) and Aspen Technologies (AZPN). The largest detractors were Healthcare Services Group (HCSG), Dycom Industries (DY) and Verra Mobility (VRRM).
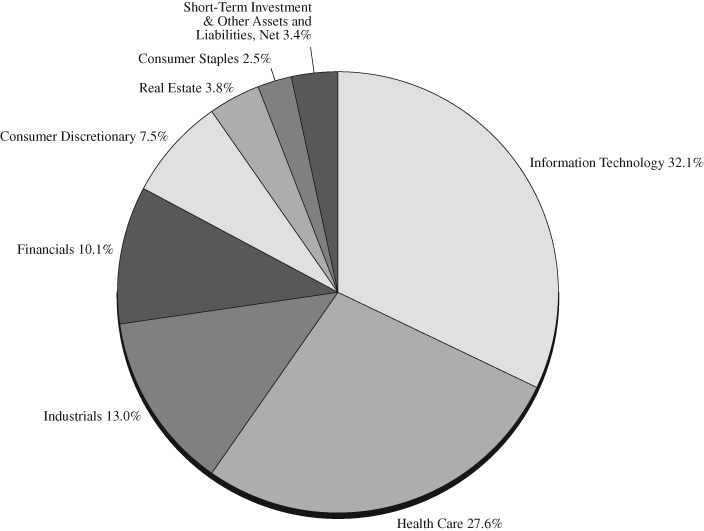
At the close of the year, the Fund held 28 positions, the top 10 constituting 42.4% of the portfolio with a cash position of 3.4%. The average cash position over the period was 3.3%. Information Technology and Health Care were the two largest sector weights at 32.1% and 27.6%, respectively. Compared to the benchmark, the largest sector overweights were Information Technology and Financials, the largest sector underweights were Consumer Discretionary and Industrials.
Market Overview
During the final quarter of 2019, equity markets applauded improving fundamentals and closed out the year and decade on a decisively high note. In stark contrast to a year earlier, global growth metrics broadly stabilized and improved, the Federal Reserve and other central banks around the world were uniformly accommodative and incremental progress was made on the trade dispute between the U.S. and China. It was a period where market bulls declared victory and skeptics capitulated.
|
| Here, we remind ourselves that successful investing is not about timing markets, but what is done with volatility when it arrives.
|
Outlook
While we don’t make market predictions, we do gain useful perspective from our fundamental work. Progress on the U.S.–China trade front, the resolution of Brexit, strong domestic employment, a healthy consumer, reaccelerating earnings growth, low interest rates and accommodative central banks all point to a constructive environment for equity investors. At the same time, we recognize much of this good news is reflected in current prices, leaving little margin for error, and it’s certainly reasonable to expect the current political cycle and continuing trade negotiations to be sources of market volatility. Here, we remind ourselves that successful investing is not about timing markets, but what is done with volatility when it arrives. As we have in the past, we remain disciplined and opportunistic, looking to manage risk by differentiating short-term uncertainties from long-term opportunities.
As ever, we appreciate your interest and trust.
Nicholas C. Haffenreffer
January 29, 2020
TORRAYRESOLUTE SMALL/MID CAP GROWTH FUND
Management Discussion and Analysis (Unaudited) – Continued
| Top Contributors & Detractors | | |
| | Top 10 Holdings |
| | | | | | | |
| | | % | % | | | % of |
| Security | Sector | Weight | Contribution | | Security | Holdings |
| Copart | Industrials | 4.7 | +3.3 | | Copart | 5.2 |
| ANSYS | Info Tech | 3.8 | +2.5 | | Aspen Technology | 5.0 |
| Aspen Technology | Info Tech | 5.2 | +2.4 | | ANSYS | 4.3 |
| Hexcel | Industrials | 5.8 | +2.0 | | Webster Financial | 4.2 |
| Catalent | Health Care | 3.5 | +1.8 | | Catalent | 4.2 |
| Healthcare Services Group | Industrials | 1.8 | -1.4 | | Pool | 4.1 |
| Dycom Industries, Inc. | Industrials | 1.8 | -0.5 | | Hexcel | 3.9 |
| Verra Mobility | Info Tech | 0.9 | 0.0 | | ICF International | 3.9 |
| BioMarin Pharmaceutical | Health Care | 3.3 | 0.0 | | SBA Communications – REIT | 3.8 |
| CyberArk Software | Info Tech | 2.1 | +0.1 | | Qualys | 3.8 |
| | | | | | Percentage of total portfolio | 42.4 |
| Holdings are subject to change and are not recommendations to buy or sell a security. To obtain information about the calculation methodology used to select the largest contributors to and detractors from performance or to obtain a list showing every holding’s contribution to performance during the measurement period, contact bscalise@torray.com. | |
Activity Summary
Buys (5)
Rocket Pharmaceuticals (RCKT) is a clinical-stage gene therapy company developing treatments for several rare diseases with high unmet medical needs. We are enthusiastic about the efficacy and market opportunities that gene therapies have demonstrated, particularly over the past few years. The FDA and strategic buyers such as large pharmaceutical companies have also taken note and are increasingly active in this field. With four ongoing clinical programs, Rocket’s basket approach to gene therapy is appealing from a risk management perspective. Recent data presented on two of Rocket’s programs led us to initiate a position in the company.
Teladoc Health (TDOC) operates the largest telehealth platform based on participants and revenues. Its state-licensed, board-certified clinicians diagnose a broad array of medical conditions telephonically. Teladoc has built a member population exceeding 27 million by delivering a convenient, cost-effective service, offering consumers and payors an alternative to higher cost, in-person options. At ten times the size of its closest competitor, we appreciate its first mover advantage, subscription-based business model and high recurring revenues. While the company is not yet profitable, we believe it is near an inflection point where increasing utilization should achieve the operating leverage required to generate profits in a reasonable timeframe.
Verra Mobility (VRRM) provides transportation solutions to state and local governments and commercial organization throughout the U.S., Canada and Europe. With a market capitalization of $2.3 billion and annualized revenues of approximately $450 million, Verra operates in two segments – Government Solutions, which delivers automated traffic enforcement services (red light and speed cameras), and the Commercial Services segment, which delivers tolling and violation management services to rental car companies and commercial vehicle fleets. Primary investment attributes include high barriers to entry, high recurring revenues, low capital intensity, and what we consider to be generous cash flow characteristics and a reasonable valuation.
TORRAYRESOLUTE SMALL/MID CAP GROWTH FUND
Management Discussion and Analysis (Unaudited) – Continued
Catalent (CTLT) is a $5 billion Contract Manufacturing Organization (CMO) specializing in the production of drugs on behalf of pharmaceutical and biopharmaceutical clients. The company benefits from the growing demand for complex biological medicines, while avoiding most of the binary outcomes that plague drug developers. With $2.5 billion in sales and an extensive manufacturing footprint across five continents, Catalent enjoys a broadly diversified client base. Following share price weakness resulting from a temporary supply shortage, we initiated a position at what we considered to be an attractive price.
CyberArk Software (CYBR) is a $4.5 billion Israel-based cybersecurity company specializing in Privileged Account Management (PAM) security, an area that focuses on protecting a network’s most important users. Beginning in 1999, CYBR and its CEO founder were pioneers of the PAM market and remain an important source of industry innovation. Having acquired more than 50% of the Fortune 100 as customers, revenue and profits have increased at an impressive rate of over 30% annually. New pricing models and positive business mix should improve the stability of the company’s profits over time. While valuations in the industry are at a premium, we believe strong secular demand can support current levels.
Sales (4)
Genmab (GMAB) was sold following a significant increase in its share price which reflected the positive clinical progress and financial results of the company’s treatment for multiple myeloma. While we remain confident about Genmab’s prospects, valuation and market capitalization reached the high end of what we believe is appropriate for the company and strategy.
Dycom Industries (DY) is a specialty contractor that provides engineering and construction services to telecommunications providers. The company seeks to capture long-term contracts with major carriers investing in faster and more reliable internet and wireless services known as the 5G expansion. While opportunities associated with the 5G buildout are large, timing and execution has been challenging. The negative operating leverage associated with the engineering and construction industry led us to reevaluate the company’s position in the portfolio, which typically seeks to invest in companies with stable earnings growth.
Healthcare Services Group (HCSG) provides housekeeping and dining services to over 3,500 health care facilities, predominately nursing homes. Our investment thesis was based on positive demographics and a record of growth and profitability. While we were aware of the reimbursement challenges health care operators face, we believed Healthcare Services Group’s dominant market position and high recurring revenues would translate to consistent, stable growth in sales and earnings. However, industry headwinds have persisted, impacting HCSG and other service providers.
LKQ Corporation (LKQ), a leading supplier of replacement and aftermarket auto parts, was sold based on operational challenges overseas and diminishing economic returns associated with domestic consolidation opportunities.
Disclosures:
This commentary is for informational purposes only and should not be viewed as a recommendation to buy or sell any security. Investors should seek financial advice regarding the appropriateness of investing in any securities or investment strategies discussed in this documentation and should understand that statements regarding future prospects may not be realized. Investors should note that income from such securities may fluctuate and that each security’s price or value may rise or fall. Accordingly, investors may receive back less than originally invested. There is no guarantee that the views expressed will come to pass. Torray LLC is an independent registered investment adviser. Registration of an
TORRAYRESOLUTE SMALL/MID CAP GROWTH FUND
Management Discussion and Analysis (Unaudited) – Continued
investment adviser does not imply any level of skill of training. Torray LLC claims compliance with the Global Investment Performance Standards (GIPS®). To receive a list of composite descriptions of Torray LLC and/or a GIPS® compliant presentation, please contact Breck Scalise at 855.753.8174 or email bscalise@torray.com. For additional information about Torray LLC, including fees and services, please contact us or refer to the Investment Adviser Public Disclosure website (www.adviserinfo.sec.gov).
For comparison purposes, the strategy is measured against the Russell 2500 Index and the Russell 2500 Growth Index. The Russell 2500 Index measures the performance of the 2,500 smallest companies in the Russell 3000 Index. The Russell 2500™ Growth Index measures the performance of the small to mid-cap growth segment of the U.S. equity universe. It includes those Russell 2500 Index companies with higher growth earning potential. The volatility of the index may be materially different from that of the strategy due to varying degrees of diversification and other factors. Index returns do not reflect the deduction of any fees. You cannot invest directly in an index.
Fund holdings and sector allocations are subject to change at any time and should not be considered a recommendation to buy or sell and security. Please see the Schedule of Investments in this report for a complete list of fund holdings.
Must be accompanied or preceded by a Prospectus.
Mutual Fund investing involves risk. Principal loss is possible. The Fund’s investment in securities of mid-cap and small-cap companies may be more volatile and less liquid than the securities of larger, more established companies. The Fund may have a relatively high percentage of assets in a single or small number of issuers, which may result in increased volatility. Foreign companies involve risks not generally associated with investment in the securities of U.S. companies, including risks relating to political, social and economic developments abroad and differences between U.S. and foreign regulatory requirements and market practices, including fluctuations in foreign currencies. The Fund has limited operating history and there can be no assurance that the Fund will grow to or maintain an economically viable size.
Shares of the TorrayResolute Small/Mid Cap Growth Fund are distributed by Quasar Distributors, LLC.
Past performance is not indicative of future results.
TORRAYRESOLUTE SMALL/MID CAP GROWTH FUND
Value of $100,000 Investment (Unaudited)
The chart assumes an initial investment of $100,000 at the inception of the Fund(1) and is provided for informational purposes only. Performance reflects waivers of fee and operating expenses in effect. In the absence of such waivers, total return would be reduced by the applicable management fee, operating expenses and all other expenses incurred due to maintenance of the account. Past performance is not predictive of future performance. Investment return and principal value will fluctuate, so that your shares, when redeemed may be worth more or less than their original cost. Performance assumes the reinvestment of capital gains and income distributions. The performance does not reflect the deduction of taxes that a shareholder would pay on Fund distributions or the redemption of Fund shares.
Annualized Rates of Return as of December 31, 2019
| | 1-Year | 3-Year | 5-Year | Since Inception(1) |
| Investor Class | 29.87% | 13.21% | 7.88% | 7.88% |
| Institutional Class | 30.19% | 13.45% | 8.14% | 8.14% |
Russell 2500 Growth Index(2) | 32.65% | 15.17% | 10.84% | 10.84% |
Russell 2500 Index(3) | 27.77% | 10.33% | 8.93% | 8.93% |
(1) | January 1, 2015. |
(2) | The Russell 2500 Growth Index measures the performance of the small to mid-cap growth segment of the U.S. equity universe. It includes those Russell 2500 companies with higher growth earning potential as defined by Russell’s leading style methodology. You cannot invest directly in an index. |
(3) | The Russell 2500 Index measures the performance of the small to mid-cap segment of the U.S. equity universe, commonly referred to as “smid” cap. The Russell 2500 Index is a subset of the Russell 3000 Index. It includes approximately 2500 of the smallest securities based on a combination of their market cap and current index membership. You cannot invest directly in an index. |
TORRAYRESOLUTE SMALL/MID CAP GROWTH FUND
Expense Example (Unaudited)
December 31, 2019
As a shareholder of the Fund, you incur two types of costs: (1) transaction costs and (2) ongoing costs, including management fees; distribution (12b-1) fees; and other Fund expenses. This Example is provided for informational purposes only and is intended to help you understand your ongoing costs (in dollars) of investing in the Fund and to compare these costs with the ongoing costs of investing in other mutual funds. The Example is based on an investment of $1,000 invested at the beginning of the period and held for the entire period (July 1, 2019 – December 31, 2019).
ACTUAL EXPENSES
For each class, the first line of the table provides information about actual account values and actual expenses. You may use the information in this line, together with the amount you invested, to estimate the expenses that you paid over the period. Simply divide your account value by $1,000 (for example, an $8,600 account value divided by $1,000 = 8.6), then multiply the result by the number in the first line under the heading entitled “Expenses Paid During Period” to estimate the expenses you paid on your account during this period.
HYPOTHETICAL EXAMPLE FOR COMPARISON PURPOSES
For each class, the second line of the table below provides information about hypothetical account values and hypothetical expenses based on the Fund’s actual expense ratio and an assumed rate of return of 5% per year before expenses. Please note that this is not the Fund’s actual return, but is used for informational purposes only to showcase how to calculate the ongoing costs associated with the Fund. The hypothetical account values and expenses may not be used to estimate the actual ending account balance or expenses you paid for the period. You may use this information to compare the ongoing costs of investing in the Fund and other funds. To do so, compare this 5% hypothetical example with the 5% hypothetical examples that appear in the shareholder reports of the other funds.
Please note that the expenses shown in the table are meant to highlight your ongoing costs only. Therefore, the second line of the table is useful in comparing ongoing costs only, and will not help you determine the relative total costs of owning different funds. In addition, if transactional costs were included, your costs may have been higher.
| | Beginning | Ending | Expenses Paid |
| | Account Value | Account Value | During Period(1) |
| | (7/1/19) | (12/31/19) | (7/1/19 to 12/31/19) |
Investor Class Actual(2) | $1,000.00 | $1,057.90 | $6.49 |
Investor Class Hypothetical | | | |
(5% annual return before expenses) | 1,000.00 | 1,018.90 | 6.36 |
Institutional Class Actual(2) | 1,000.00 | 1,059.50 | 5.19 |
Institutional Class Hypothetical | | | |
(5% annual return before expenses) | 1,000.00 | 1,020.16 | 5.09 |
(1) | Expenses are equal to the Fund’s annualized expense ratio for the most recent six-month period of 1.25% and 1.00% for the Investor Class and Institutional Class, respectively, multiplied by the average account value over the period, multiplied by 184/365 to reflect the one-half year period. |
(2) | Based on the actual returns for the six-month period ended December 31, 2019, of 5.79% and 5.95% for the Investor Class and Institutional Class, respectively. |
TORRAYRESOLUTE SMALL/MID CAP GROWTH FUND
Allocation of Portfolio Net Assets(1) (Unaudited)
As of December 31, 2019
(% of Net Assets)
Top Ten Equity Holdings(1) (Unaudited)
As of December 31, 2019
(% of Net Assets)
| | Copart | | | 5.2 | % |
| | Aspen Technology | | | 5.0 | % |
| | ANSYS | | | 4.3 | % |
| | Webster Financial | | | 4.2 | % |
| | Catalent | | | 4.2 | % |
| | Pool | | | 4.1 | % |
| | Hexcel | | | 3.9 | % |
| | ICF International | | | 3.9 | % |
| | SBA Communications — REIT | | | 3.8 | % |
| | Qualys | | | 3.8 | % |
(1) | Fund holdings and sector allocations are subject to change at any time and are not recommendations to buy or sell any security. |
TORRAYRESOLUTE SMALL/MID CAP GROWTH FUND
Schedule of Investments
December 31, 2019
Description | | Shares | | | Value | |
| | | | | | | |
| COMMON STOCKS — 96.6% | | | | | | |
| | | | | | | |
| Consumer Discretionary — 7.5% | | | | | | |
Dunkin’ Brands Group | | | 5,214 | | | $ | 393,866 | |
Pool | | | 2,195 | | | | 466,174 | |
| | | | | | | | 860,040 | |
| | | | | | | | | |
| Consumer Staples — 2.5% | | | | | | | | |
Church & Dwight | | | 4,058 | | | | 285,440 | |
| | | | | | | | | |
| Financials — 10.1% | | | | | | | | |
Enstar Group* | | | 1,642 | | | | 339,664 | |
PRA Group* | | | 9,165 | | | | 332,690 | |
Webster Financial | | | 8,995 | | | | 479,973 | |
| | | | | | | | 1,152,327 | |
| | | | | | | | | |
Health Care# — 27.6% | | | | | | | | |
AMN Healthcare Services* | | | 5,748 | | | | 358,158 | |
BioMarin Pharmaceutical* | | | 3,855 | | | | 325,940 | |
Catalent* | | | 8,483 | | | | 477,593 | |
Cooper Companies | | | 862 | | | | 276,952 | |
Halozyme Therapeutics* | | | 18,174 | | | | 322,225 | |
Mettler-Toledo International* | | | 506 | | | | 401,400 | |
Omnicell* | | | 4,335 | | | | 354,256 | |
Rocket Pharmaceuticals* | | | 10,578 | | | | 240,755 | |
Teladoc Health* | | | 4,816 | | | | 403,196 | |
| | | | | | | | 3,160,475 | |
| | | | | | | | | |
| Industrials — 13.0% | | | | | | | | |
Copart* | | | 6,543 | | | | 595,020 | |
Hexcel | | | 6,141 | | | | 450,197 | |
ICF International | | | 4,878 | | | | 446,922 | |
| | | | | | | | 1,492,139 | |
| | | | | | | | | |
Information Technology# — 32.1% | | | | | | | | |
ANSYS* | | | 1,925 | | | | 495,514 | |
Aspen Technology* | | | 4,755 | | | | 575,022 | |
CyberArk Software* | | | 3,567 | | | | 415,841 | |
IPG Photonics* | | | 2,080 | | | | 301,434 | |
Jack Henry & Associates | | | 2,631 | | | | 383,258 | |
MKS Instruments | | | 3,185 | | | | 350,382 | |
Monolithic Power Systems | | | 2,272 | | | | 404,461 | |
Qualys* | | | 5,185 | | | | 432,273 | |
Verra Mobility* | | | 22,273 | | | | 311,599 | |
| | | | | | | | 3,669,784 | |
See Notes to the Financial Statements
TORRAYRESOLUTE SMALL/MID CAP GROWTH FUND
Schedule of Investments – Continued
December 31, 2019
Description | | Shares | | | Value | |
| | | | | | | |
| Real Estate — 3.8% | | | | | | |
SBA Communications — REIT | | | 1,812 | | | $ | 436,674 | |
| TOTAL COMMON STOCKS | | | | | | | | |
| (Cost $8,774,438) | | | | | | | 11,056,879 | |
| | | | | | | | | |
| SHORT-TERM INVESTMENT — 3.5% | | | | | | | | |
First American Government Obligations Fund, Class X, 1.51%^ | | | | | | | | |
| TOTAL SHORT-TERM INVESTMENT | | | | | | | | |
| (Cost $404,234) | | | 404,234 | | | | 404,234 | |
| Total Investments — 100.1% | | | | | | | | |
| (Cost $9,178,672) | | | | | | | 11,461,113 | |
| Other Assets and Liabilities, Net — (0.1)% | | | | | | | (9,817 | ) |
| Total Net Assets — 100.0% | | | | | | $ | 11,451,296 | |
| * | Non-income producing security. |
| # | As of December 31, 2019, the Fund had a significant portion of its assets invested in this sector. See Note 9 in the Notes to the Financial Statements. |
| ^ | The rate shown is the annualized seven day effective yield as of December 31, 2019. |
REIT – Real Estate Investment Trust
The Global Industry Classification Standard (“GICS”®) was developed by and is the exclusive property of MSCI, Inc. (“MSCI”) and Standard & Poor’s Financial Services LLC (“S&P”). GICS is a service mark of MSCI and S&P and has been licensed for use.
See Notes to the Financial Statements
TORRAYRESOLUTE SMALL/MID CAP GROWTH FUND
Statement of Assets and Liabilities
December 31, 2019
| ASSETS: | | | |
Investments, at value | | | |
(Cost $9,178,672) | | $ | 11,461,113 | |
Dividends and interest receivable | | | 1,763 | |
Receivable for capital shares sold | | | 10,485 | |
Receivable from adviser | | | 14,121 | |
Prepaid expenses | | | 20,816 | |
Total assets | | | 11,508,298 | |
| | | | | |
| LIABILITIES: | | | | |
Payable for fund administration & accounting fees | | | 16,942 | |
Payable for audit fees | | | 17,504 | |
Payable for postage & printing fees | | | 5,452 | |
Payable for compliance fees | | | 2,169 | |
Payable for transfer agent fees & expenses | | | 7,747 | |
Payable for custody fees | | | 1,004 | |
Payable for trustee fees | | | 2,930 | |
Accrued other fees | | | 1,471 | |
Accrued distribution fees | | | 1,783 | |
Total liabilities | | | 57,002 | |
| | | | | |
| NET ASSETS | | $ | 11,451,296 | |
| | | | | |
| NET ASSETS CONSIST OF: | | | | |
Paid-in capital | | $ | 10,357,927 | |
Total distributable earnings | | | 1,093,369 | |
Net Assets | | $ | 11,451,296 | |
| | | Investor Class | | | Institutional Class | |
Net Assets | | $ | 984,673 | | | $ | 10,466,623 | |
Shares issued and outstanding(1) | | | 67,380 | | | | 707,538 | |
Net asset value, redemption price and offering price per share | | $ | 14.61 | | | $ | 14.79 | |
(1) | Unlimited shares authorized without par value. |
See Notes to the Financial Statements
TORRAYRESOLUTE SMALL/MID CAP GROWTH FUND
Statement of Operations
For the Year Ended December 31, 2019
| INVESTMENT INCOME: | | | |
Interest income | | $ | 6,195 | |
Dividend income | | | 43,842 | |
Total investment income | | | 50,037 | |
| | | | | |
| EXPENSES: | | | | |
Fund administration & accounting fees (See Note 4) | | | 104,119 | |
Investment adviser fees (See Note 4) | | | 68,531 | |
Transfer agent fees & expenses (See Note 4) | | | 42,301 | |
Federal & state registration fees | | | 34,984 | |
Audit fees | | | 17,506 | |
Legal fees | | | 14,725 | |
Trustee fees (See Note 4) | | | 13,857 | |
Compliance fees (See Note 4) | | | 13,000 | |
Postage & printing fees | | | 6,154 | |
Custody fees (See Note 4) | | | 5,926 | |
Other fees | | | 4,735 | |
Distribution fees – Investor Class (See Note 5) | | | 2,341 | |
Total expenses before reimbursement/waiver | | | 328,179 | |
| Less: reimbursement/waiver from investment adviser (See Note 4) | | | (240,174 | ) |
Net expenses | | | 88,005 | |
| | | | | |
| NET INVESTMENT LOSS | | | (37,968 | ) |
| | | | | |
| REALIZED AND UNREALIZED GAIN ON INVESTMENTS: | | | | |
Net realized gain on investments | | | 50,092 | |
Net change in unrealized appreciation/depreciation on investments | | | 2,215,209 | |
Net realized and unrealized gain on investments | | | 2,265,301 | |
| | | | | |
| NET INCREASE IN NET ASSETS RESULTING FROM OPERATIONS | | $ | 2,227,333 | |
See Notes to the Financial Statements
TORRAYRESOLUTE SMALL/MID CAP GROWTH FUND
Statements of Changes in Net Assets
| | | Year Ended | | | Year Ended | |
| | | December 31, 2019 | | | December 31, 2018 | |
| OPERATIONS: | | | | | | |
| Net investment loss | | $ | (37,968 | ) | | $ | (41,427 | ) |
| Net realized gain on investments | | | 50,092 | | | | 12,819 | |
| Net change in unrealized appreciation/depreciation on investments | | | 2,215,209 | | | | (773,492 | ) |
| Net increase (decrease) in net assets resulting from operations | | | 2,227,333 | | | | (802,100 | ) |
| | | | | | | | | |
| CAPITAL SHARE TRANSACTIONS: | | | | | | | | |
Investor Class: | | | | | | | | |
| Proceeds from shares sold | | | 63,000 | | | | 146,629 | |
| Proceeds from reinvestment of distributions | | | — | | | | — | |
| Payments for shares redeemed | | | (153,923 | ) | | | (80,681 | ) |
Increase (decrease) in net assets from Investor Class transactions | | | (90,923 | ) | | | 65,948 | |
Institutional Class: | | | | | | | | |
| Proceeds from shares sold | | | 3,449,103 | | | | 1,873,916 | |
| Proceeds from reinvestment of distributions | | | — | | | | — | |
| Payments for shares redeemed | | | (2,815,896 | ) | | | (801,880 | ) |
Increase in net assets from Institutional Class transactions | | | 633,207 | | | | 1,072,036 | |
Net increase in net assets resulting from capital share transactions | | | 542,284 | | | | 1,137,984 | |
| | | | | | | | | |
| DISTRIBUTIONS TO SHAREHOLDERS: | | | | | | | | |
| Net distributions to shareholders – Investor Class | | | — | | | | — | |
| Net distributions to shareholders – Institutional Class | | | — | | | | — | |
| Total distributions to shareholders | | | — | | | | — | |
| | | | | | | | | |
| TOTAL INCREASE IN NET ASSETS | | | 2,769,617 | | | | 335,884 | |
| | | | | | | | | |
| NET ASSETS: | | | | | | | | |
Beginning of year | | | 8,681,679 | | | | 8,345,795 | |
End of year | | $ | 11,451,296 | | | $ | 8,681,679 | |
See Notes to the Financial Statements
TORRAYRESOLUTE SMALL/MID CAP GROWTH FUND
Financial Highlights
For a Fund share outstanding throughout the year.
| | | Years Ended December 31: | |
| | | 2019 | | | 2018 | | | 2017 | | | 2016 | | | 2015 | |
| Investor Class | | | | | | | | | | | | | | | |
| | | | | | | | | | | | | | | | |
| PER SHARE DATA: | | | | | | | | | | | | | | | |
| Net asset value, beginning of year | | $ | 11.25 | | | $ | 12.27 | | | $ | 10.07 | | | $ | 9.39 | | | $ | 10.00 | |
| | | | | | | | | | | | | | | | | | | | | |
| Investment operations: | | | | | | | | | | | | | | | | | | | | |
| Net investment loss | | | (0.09 | ) | | | (0.08 | ) | | | (0.06 | ) | | | (0.03 | ) | | | (0.06 | ) |
| Net realized and unrealized | | | | | | | | | | | | | | | | | | | | |
| gain (loss) on investments | | | 3.45 | | | | (0.94 | ) | | | 2.26 | | | | 0.71 | | | | (0.55 | ) |
| Total from investment operations | | | 3.36 | | | | (1.02 | ) | | | 2.20 | | | | 0.68 | | | | (0.61 | ) |
| | | | | | | | | | | | | | | | | | | | | |
| Less distributions from: | | | | | | | | | | | | | | | | | | | | |
| Net investment income | | | — | | | | — | | | | — | | | | — | | | | — | |
| Net capital gains | | | — | | | | — | | | | — | | | | — | | | | — | |
| Total distributions | | | — | | | | — | | | | — | | | | — | | | | — | |
| Net asset value, end of year | | $ | 14.61 | | | $ | 11.25 | | | $ | 12.27 | | | $ | 10.07 | | | $ | 9.39 | |
| | | | | | | | | | | | | | | | | | | | | |
| TOTAL RETURN | | | 29.87 | % | | | -8.31 | % | | | 21.85 | % | | | 7.24 | % | | | -6.10 | % |
| | | | | | | | | | | | | | | | | | | | | |
| SUPPLEMENTAL DATA | | | | | | | | | | | | | | | | | | | | |
| AND RATIOS: | | | | | | | | | | | | | | | | | | | | |
| Net assets, at end of year (000’s) | | $ | 985 | | | $ | 836 | | | $ | 851 | | | $ | 40 | | | $ | 12 | |
| | | | | | | | | | | | | | | | | | | | | |
| Ratio of expenses to average net assets: | | | | | | | | | | | | | | | | | | | | |
| Before expense reimbursement/waiver | | | 4.11 | % | | | 3.51 | % | | | 6.62 | % | | | 2.15 | % | | | 20.48 | % |
| After expense reimbursement/waiver | | | 1.25 | % | | | 1.25 | % | | | 1.25 | % | | | 1.25 | % | | | 1.25 | % |
| | | | | | | | | | | | | | | | | | | | | |
| Ratio of net investment loss | | | | | | | | | | | | | | | | | | | | |
| to average net assets: | | | | | | | | | | | | | | | | | | | | |
| Before expense reimbursement/waiver | | | (3.54 | )% | | | (2.92 | )% | | | (6.23 | )% | | | (1.58 | )% | | | (19.89 | )% |
| After expense reimbursement/waiver | | | (0.68 | )% | | | (0.66 | )% | | | (0.86 | )% | | | (0.68 | )% | | | (0.66 | )% |
| | | | | | | | | | | | | | | | | | | | | |
| Portfolio turnover rate | | | 53 | % | | | 30 | % | | | 134 | % | | | 40 | % | | | 65 | % |
See Notes to the Financial Statements
TORRAYRESOLUTE SMALL/MID CAP GROWTH FUND
Financial Highlights
For a Fund share outstanding throughout the year.
| | | Years Ended December 31: | |
| | | 2019 | | | 2018 | | | 2017 | | | 2016 | | | 2015 | |
| Institutional Class | | | | | | | | | | | | | | | |
| | | | | | | | | | | | | | | | |
| PER SHARE DATA: | | | | | | | | | | | | | | | |
| Net asset value, beginning of year | | $ | 11.36 | | | $ | 12.35 | | | $ | 10.13 | | | $ | 9.41 | | | $ | 10.00 | |
| | | | | | | | | | | | | | | | | | | | | |
| Investment operations: | | | | | | | | | | | | | | | | | | | | |
| Net investment loss | | | (0.04 | ) | | | (0.05 | ) | | | (0.04 | ) | | | (0.04 | ) | | | (0.03 | ) |
| Net realized and unrealized | | | | | | | | | | | | | | | | | | | | |
| gain (loss) on investments | | | 3.47 | | | | (0.94 | ) | | | 2.26 | | | | 0.76 | | | | (0.56 | ) |
| Total from investment operations | | | 3.43 | | | | (0.99 | ) | | | 2.22 | | | | 0.72 | | | | (0.59 | ) |
| | | | | | | | | | | | | | | | | | | | | |
| Less distributions from: | | | | | | | | | | | | | | | | | | | | |
| Net investment income | | | — | | | | — | | | | — | | | | — | | | | — | |
| Net capital gains | | | — | | | | — | | | | — | | | | — | | | | — | |
| Total distributions | | | — | | | | — | | | | — | | | | — | | | | — | |
| Net asset value, end of year | | $ | 14.79 | | | $ | 11.36 | | | $ | 12.35 | | | $ | 10.13 | | | $ | 9.41 | |
| | | | | | | | | | | | | | | | | | | | | |
| TOTAL RETURN | | | 30.19 | % | | | -8.02 | % | | | 21.92 | % | | | 7.65 | % | | | -5.90 | % |
| | | | | | | | | | | | | | | | | | | | | |
| SUPPLEMENTAL DATA | | | | | | | | | | | | | | | | | | | | |
| AND RATIOS: | | | | | | | | | | | | | | | | | | | | |
| Net assets, at end of year (000’s) | | $ | 10,466 | | | $ | 7,845 | | | $ | 7,495 | | | $ | 20,951 | | | $ | 20,963 | |
| | | | | | | | | | | | | | | | | | | | | |
| Ratio of expenses to average net assets: | | | | | | | | | | | | | | | | | | | | |
| Before expense reimbursement/waiver | | | 3.80 | % | | | 3.26 | % | | | 5.71 | % | | | 1.94 | % | | | 2.52 | % |
| After expense reimbursement/waiver | | | 1.00 | % | | | 1.00 | % | | | 1.00 | % | | | 1.00 | % | | | 1.00 | % |
| | | | | | | | | | | | | | | | | | | | | |
| Ratio of net investment loss | | | | | | | | | | | | | | | | | | | | |
| to average net assets: | | | | | | | | | | | | | | | | | | | | |
| Before expense reimbursement/waiver | | | (3.21 | )% | | | (2.67 | )% | | | (5.32 | )% | | | (1.37 | )% | | | (1.93 | )% |
| After expense reimbursement/waiver | | | (0.41 | )% | | | (0.41 | )% | | | (0.61 | )% | | | (0.43 | )% | | | (0.41 | )% |
| | | | | | | | | | | | | | | | | | | | | |
| Portfolio turnover rate | | | 53 | % | | | 30 | % | | | 134 | % | | | 40 | % | | | 65 | % |
See Notes to the Financial Statements
TORRAYRESOLUTE SMALL/MID CAP GROWTH FUND
Notes to the Financial Statements
December 31, 2019
1. ORGANIZATION
Managed Portfolio Series (the “Trust”) was organized as a Delaware statutory trust under a Declaration of Trust dated January 27, 2011. The Trust is registered under the Investment Company Act of 1940, as amended (the “1940 Act”), as an open-end management investment company. The TorrayResolute Small/Mid Cap Growth Fund (the “Fund”) is a diversified series with its own investment objectives and policies within the Trust. The investment objective of the Fund is long-term capital appreciation. The Fund is an investment company and accordingly follows the investment company accounting and reporting guidance of the Financial Accounting Standards Board (“FASB”) Accounting Standards Codification Topic 946 Financial Services – Investment Companies. The Fund commenced operations on January 1, 2015. The Fund currently offers two classes of shares, the Investor Class and the Institutional Class. Investor Class shares are subject to a 0.25% distribution fee and each class of shares is subject to a shareholder servicing fee of up to 0.15%. Each class of shares has identical rights and privileges except with respect to the distribution fees and voting rights on matters affecting a single share class. The Fund may issue an unlimited number of shares of beneficial interest, with no par value.
2. SIGNIFICANT ACCOUNTING POLICIES
The following is a summary of significant accounting policies consistently followed by the Fund in preparation of its financial statements. These policies are in conformity with generally accepted accounting principles in the United States of America (“GAAP”).
Security Valuation — All investments in securities are recorded at their estimated fair value, as described in Note 3.
Federal Income Taxes — The Fund complies with the requirements of subchapter M of the Internal Revenue Code of 1986, as amended, necessary to qualify as a regulated investment company and distributes substantially all net taxable investment income and net realized gains to shareholders in a manner which results in no tax cost to the Fund. Therefore, no federal income tax provision is required. As of and during the year ended December 31, 2019, the Fund did not have any tax positions that did not meet the “more-likely-than-not” threshold of being sustained by the applicable tax authority. The Fund recognizes interest and penalties, if any, related to unrecognized tax benefits on uncertain tax positions as income tax expense in the Statement of Operations. As of and during the year ended December 31, 2019, the Fund did not incur any interest or penalties. The Fund is not subject to examination by U.S. tax authorities for the tax years prior to the period ended December 31, 2016.
Security Transactions and Investment Income — The Fund follows industry practice and records security transactions on the trade date. Realized gains and losses on sales of securities are calculated on the basis of identified cost. Dividend income is recorded on the ex-dividend date and interest income is recorded on an accrual basis. Withholding taxes on foreign dividends have been provided for in accordance with the Fund’s understanding of the applicable country’s tax rules and regulations. Discounts and premiums on securities purchased are amortized over the expected life of the respective securities using the constant yield method.
The Fund distributes all net investment income, if any, and net realized capital gains, if any, annually. Distributions to shareholders are recorded on the ex-dividend date. The Fund may utilize earnings and profits distributed to shareholders on redemptions of shares as part of the dividends paid deduction. The treatment for financial reporting purposes of distributions made to shareholders during the year from net investment income or net realized capital gains may differ from their ultimate treatment for federal income tax purposes. These differences are caused primarily by differences in the timing of the recognition of certain components of income, expense or realized capital gain for
TORRAYRESOLUTE SMALL/MID CAP GROWTH FUND
Notes to the Financial Statements – Continued
December 31, 2019
federal income tax purposes. Where such differences are permanent in nature, GAAP requires that they be reclassified in the components of the net assets based on their ultimate characterization for federal income tax purposes. Any such reclassifications will have no effect on net assets, results of operations or net asset values per share of the Fund. For the year ended December 31, 2019, the fund increased total distributable earnings by $37,968 and decreased paid in capital by $37,968. The adjustments are primarily due to net operating losses.
Use of Estimates — The preparation of financial statements in conformity with GAAP requires management to make estimates and assumptions that affect the reported amounts of assets and liabilities and disclosure of contingent assets and liabilities at the date of the financial statements and the reported amounts of revenues and expenses during the reporting period. Actual results could differ from those estimates.
Allocation of Income, Expenses and Gains/Losses — Income, expenses (other than those deemed attributable to a specific share class), and gains and losses of the Fund are allocated daily to each class of shares based upon the ratio of net assets represented by each class as a percentage of the net assets of the Fund. Expenses deemed directly attributable to a class of shares are recorded by the specific class. Most Fund expenses are allocated by class based on relative net assets. Distribution fees are expensed at 0.25% of average daily net assets of Investor Class shares. Expenses associated with a specific fund in the Trust are charged to that fund. Common Trust expenses are typically allocated evenly between the funds of the Trust, or by other equitable means.
3. SECURITIES VALUATION
The Fund has adopted authoritative fair value accounting standards which establish an authoritative definition of fair value and set out a hierarchy for measuring fair value. These standards require additional disclosures about the various inputs and valuation techniques used to develop the measurements of fair value, a discussion of changes in valuation techniques and related inputs during the period and expanded disclosure of valuation levels for major security types. These inputs are summarized in the three broad levels listed below:
| Level 1 — | Unadjusted quoted prices in active markets for identical assets or liabilities that the Fund has the ability to access. |
| | |
| Level 2 — | Observable inputs other than quoted prices included in Level 1 that are observable for the asset or liability, either directly or indirectly. These inputs may include quoted prices for the identical instrument on an inactive market, prices for similar instruments, interest rates, prepayment speeds, credit risk, yield curves, default rates and similar data. |
| | |
| Level 3 — | Unobservable inputs for the asset or liability, to the extent relevant observable inputs are not available, representing the Fund’s own assumptions about the assumptions a market participant would use in valuing the asset or liability, and would be based on the best information available. |
Following is a description of the valuation techniques applied to the Fund’s major categories of assets and liabilities measured at fair value on a recurring basis. The Fund’s investments are carried at fair value.
Equity Securities — Equity securities, including common stocks, preferred stocks, exchange-traded funds (“ETFs”) and real estate investment trusts (“REITs”), that are primarily traded on a national securities exchange are valued at the last sale price on the exchange on which they are primarily traded on the day of valuation or, if there has been no sale on such day, at the mean between the bid and ask prices. Securities traded primarily in the Nasdaq Global
TORRAYRESOLUTE SMALL/MID CAP GROWTH FUND
Notes to the Financial Statements – Continued
December 31, 2019
Market System for which market quotations are readily available are valued using the Nasdaq Official Closing Price (“NOCP”). If the NOCP is not available, such securities are valued at the last sale price on the day of valuation, or if there has been no sale on such day, at the mean between the bid and ask prices. To the extent these securities are actively traded and valuation adjustments are not applied, they are categorized in Level 1 of the fair value hierarchy. If the market for a particular security is not active, and the mean between bid and ask prices is used, these securities are categorized in Level 2 of the fair value hierarchy.
Short-Term Investments — Investments in money market funds are valued at their net asset value per share. To the extent these securities are actively traded and valuation adjustments are not applied, they are categorized in Level 1 of the fair value hierarchy.
Securities for which market quotations are not readily available, or if the closing price does not represent fair value, are valued following procedures approved by the Board of Trustees (the “Board”). These procedures consider many factors, including the type of security, size of holding, trading volume and news events. There can be no assurance that the Fund could obtain the fair value assigned to a security if they were to sell the security at approximately the time at which the Fund determines their net asset values per share. The Board has established a Valuation Committee to administer, implement, and oversee the fair valuation process, and to make fair value decisions when necessary. The Board regularly reviews reports of the Valuation Committee that describe any fair value determinations and methods.
The inputs or methodology used for valuing securities are not an indication of the risk associated with investing in those securities. The following is a summary of the inputs used to value the Fund’s securities as of December 31, 2019:
| | | Level 1 | | | Level 2 | | | Level 3 | | | Total | |
| Common Stocks | | $ | 11,056,879 | | | $ | — | | | $ | — | | | $ | 11,056,879 | |
| Short-Term Investment | | | 404,234 | | | | — | | | | — | | | | 404,234 | |
| Total Investments in Securities | | $ | 11,461,113 | | | $ | — | | | $ | — | | | $ | 11,461,113 | |
Refer to the Schedule of Investments for further information on the classification of investments.
4. INVESTMENT ADVISORY FEE AND OTHER TRANSACTIONS WITH AFFILIATES
The Trust has an agreement with Torray LLC (“Adviser”) to furnish investment advisory services to the Fund. Pursuant to an Investment Advisory Agreement (“Agreement”) between the Trust and the Adviser, the Adviser is entitled to receive, on a monthly basis, an annual advisory fee equal to 0.80% of the Fund’s average daily net assets.
The Fund’s Adviser has contractually agreed to waive its management fees and pay the Fund expenses in order to ensure that total annual operating expenses (excluding 12b-1 fees, shareholder servicing fees, acquired fund fees and expenses, leverage/borrowing interest (including interest incurred in connection with bank and custody overdrafts), interest expense, dividends paid on short sales, taxes, brokerage commissions and extraordinary expenses) do not exceed 1.00% of average daily net assets of the Fund. Fees waived and expenses paid by the Adviser may be recouped by the Adviser for a period of thirty-six months following the month during which such fee waiver and expense payment was made, if such recoupment can be achieved without exceeding the expense limit in effect at the time the fee waiver and expense payment occurred and the expense limit in place at the time of recoupment. The Operating Expenses Limitation Agreement is in effect and cannot be terminated through April 30, 2026. Thereafter, the agreement may be terminated at any time upon 60 days’ written notice by the Trust’s Board or the Adviser, with the consent of the Board.
TORRAYRESOLUTE SMALL/MID CAP GROWTH FUND
Notes to the Financial Statements – Continued
December 31, 2019
Waived fees and reimbursed expenses subject to potential recovery by year of expiration are as follows:
| | Expiration | Amount | |
| | January 2020 – December 2020 | $219,133 | |
| | January 2021 – December 2021 | $213,790 | |
| | January 2022 – December 2022 | $240,174 | |
U.S. Bancorp Fund Services, LLC (the “Administrator”), doing business as U.S. Bank Global Fund Services, acts as the Fund’s Administrator, Transfer Agent, and Fund Accountant. U.S. Bank, N.A. (the “Custodian”) serves as the Custodian to the Fund. The Custodian is an affiliate of the Administrator. The Administrator performs various administrative and accounting services for the Fund. The Administrator prepares various federal and state regulatory filings, reports and returns for the Fund; prepares reports and materials to be supplied to the Trustees; monitors the activities of the Custodian; coordinates the payment of the Fund’s expenses and reviews the Fund’s expense accruals. The officers of the Trust, including the Chief Compliance Officer, are employees of the Administrator. As compensation for its services, the Administrator is entitled to a monthly fee at an annual rate based upon the average daily net assets of the Fund, subject to annual minimums. Fees incurred by the Fund for administration and accounting, transfer agency, custody and chief compliance officer services for the year ended December 31, 2019, are disclosed in the Statement of Operations.
Quasar Distributors, LLC (the “Distributor”) acts as the Funds’ principal underwriter in a continuous public offering of the Funds’ shares. The Distributor is an affiliate of the Administrator.
On November 25, 2019, U.S. Bancorp, the parent company of Quasar Distributors, LLC (“Quasar”), the Fund’s distributor, announced it had signed a purchase agreement to sell Quasar to Foreside Financial Group, LLC (“Foreside”) such that Quasar will become a wholly-owned-broker-dealer subsidiary of Foreside. The transaction is expected to close by the end of March 2020. Quasar will remain the Funds’ distributor at the close of the transaction subject to Board approval.
5. DISTRIBUTION & SHAREHOLDER SERVICING FEES
The Fund has adopted a Distribution Plan pursuant to Rule 12b-1 (the “Plan”) in the Investor Class only. The Plan permits the Fund to pay for distribution and related expenses at an annual rate of 0.25% of the average daily net assets of the Investor Class. The expenses covered by the Plan may include the cost of preparing and distributing prospectuses and other sales material, advertising and public relations expenses, payments to financial intermediaries and compensation of personnel involved in selling shares of the Fund. Payments made pursuant to the Plan will represent reimbursement for distribution and service activities. For the year ended December 31, 2019, the Investor Class incurred expenses of $2,341 pursuant to the Plan.
The Fund has entered into a shareholder servicing agreement (the “Agreement”) with the Adviser, under which the Fund may pay servicing fees at an annual rate of up to 0.15% of the average daily net assets of each class. Payments to the Adviser under the Agreement may reimburse the Adviser for payments it makes to selected brokers, dealers and administrators which have entered into service agreements with the Adviser for services provided to shareholders of the Fund. The services provided by such intermediaries are primarily designed to assist shareholders of the Fund and include the furnishing of office space and equipment, telephone facilities, personnel and assistance to the Fund in servicing such shareholders. Services provided by such intermediaries also include the provision of support services to the Fund and includes establishing and maintaining shareholders’ accounts and record processing, purchase and
TORRAYRESOLUTE SMALL/MID CAP GROWTH FUND
Notes to the Financial Statements – Continued
December 31, 2019
redemption transactions, answering routine client inquiries regarding the Fund, and providing such other personal services to shareholders as the Fund may reasonably request. For the year ended December 31, 2019, the Investor and Institutional Class did not incur any shareholder servicing fees.
6. CAPITAL SHARE TRANSACTIONS
Transactions in shares of the Fund were as follows:
| | | Year Ended | | | Year Ended | |
| | | December 31, 2019 | | | December 31, 2018 | |
| Investor Class: | | | | | | |
| Shares sold | | | 4,662 | | | | 11,582 | |
| Shares issued to holders in reinvestment of distributions | | | — | | | | — | |
| Shares redeemed | | | (11,602 | ) | | | (6,628 | ) |
Net increase (decrease) in Investor Class shares | | | (6,940 | ) | | | 4,954 | |
| Institutional Class: | | | | | | | | |
| Shares sold | | | 234,975 | | | | 147,779 | |
| Shares issued to holders in reinvestment of distributions | | | — | | | | — | |
| Shares redeemed | | | (218,016 | ) | | | (63,951 | ) |
Net increase in Institutional Class Shares | | | 16,959 | | | | 83,828 | |
Net increase in shares outstanding | | | 10,019 | | | | 88,782 | |
7. INVESTMENT TRANSACTIONS
The aggregate purchases and sales, excluding short-term investments, by the Fund for the year ended December 31, 2019, were as follows:
| | | | Purchases | | | Sales | |
| | U.S. Government | | $ | — | | | $ | — | |
| | Other | | $ | 4,944,581 | | | $ | 4,479,302 | |
8. FEDERAL TAX INFORMATION
The aggregate gross unrealized appreciation and depreciation of securities held by the Fund and the total cost of securities for federal income tax purposes at December 31, 2019, the Fund’s most recent fiscal year end, were as follows:
| Aggregate | Aggregate | | Federal | |
| Gross | Gross | Net | Income | |
| Appreciation | Depreciation | Appreciation | Tax Cost | |
| $2,367,575 | $(114,538) | $2,253,037 | $9,208,076 | |
The difference between book-basis and tax-basis unrealized appreciation is attributable primarily to the deferral of wash sale losses.
TORRAYRESOLUTE SMALL/MID CAP GROWTH FUND
Notes to the Financial Statements – Continued
December 31, 2019
At December 31, 2019, the Fund’s most recent fiscal year end, components of distributable earnings on a tax-basis were as follows:
| Undistributed | Other | | Total | |
| Ordinary | Accumulated | Unrealized | Distributable | |
| Income | Losses | Appreciation | Earnings | |
| $ — | $(1,159,668) | $2,253,037 | $1,093,369 | |
As of December 31, 2019, the Fund had $1,159,668 in short-term capital loss carryovers which will be permitted to be carried over for an unlimited period. During the year ended December 31, 2019, the Fund utilized $46,998 of short-term capital loss carryovers. A regulated investment company may elect for any taxable year to treat any portion of any qualified late year loss as arising on the first day of the next taxable year. Qualified late year losses are certain capital and ordinary losses which occur during the portion of the Fund’s taxable year subsequent to October 31. For the taxable year ended December 31, 2019, the Fund does not plan to defer any qualified late year losses.
There were no distributions made by the Fund for the year ended December 31, 2019, and the year ended December 31, 2018.
9. SECTOR RISK
As of December 31, 2019, the Fund had a significant portion of its assets invested in the health care and information technology sectors. The health care sector may be more greatly impacted by adverse regulatory, political, legal and other changes affecting the issuers of such securities. The information technology sector may be more sensitive to short product cycles, competition and more aggressive pricing than the overall market.
10. CONTROL OWNERSHIP
The beneficial ownership, either directly or indirectly, of more than 25% of the voting securities of a fund creates a presumption of control of the fund, under Section 2(a)(9) of the 1940 Act. As of December 31, 2019, Charles Schwab & Company, for the benefit of its customers, owned 30.09%, and Robert E. Torray, an affiliated person of the Adviser, owned 57.41% of the outstanding shares of the Fund.
TORRAYRESOLUTE SMALL/MID CAP GROWTH FUND
Report of Independent Registered Public Accounting Firm
To the Shareholders of TorrayResolute Small/Mid Cap Growth Fund and
Board of Trustees of Managed Portfolio Series
Opinion on the Financial Statements
We have audited the accompanying statement of assets and liabilities, including the schedule of investments, of TorrayResolute Small/Mid Cap Growth Fund (the “Fund”), a series of Managed Portfolio Series, as of December 31, 2019, the related statement of operations for the year then ended, the statements of changes in net assets for each of the two years in the period then ended, including the related notes, and the financial highlights for each of the five years in the period then ended (collectively referred to as the “financial statements”). In our opinion, the financial statements present fairly, in all material respects, the financial position of the Fund as of December 31, 2019, the results of its operations for the year then ended, the changes in its net assets for each of the two years in the period then ended, and the financial highlights for each of the five years in the period then ended, in conformity with accounting principles generally accepted in the United States of America.
Basis for Opinion
These financial statements are the responsibility of the Fund’s management. Our responsibility is to express an opinion on the Fund’s financial statements based on our audits. We are a public accounting firm registered with the Public Company Accounting Oversight Board (United States) (“PCAOB”) and are required to be independent with respect to the Fund in accordance with the U.S. federal securities laws and the applicable rules and regulations of the Securities and Exchange Commission and the PCAOB.
We conducted our audits in accordance with the standards of the PCAOB. Those standards require that we plan and perform the audit to obtain reasonable assurance about whether the financial statements are free of material misstatement whether due to error or fraud.
Our audits included performing procedures to assess the risks of material misstatement of the financial statements, whether due to error or fraud, and performing procedures that respond to those risks. Such procedures included examining, on a test basis, evidence regarding the amounts and disclosures in the financial statements. Our procedures included confirmation of securities owned as of December 31, 2019, by correspondence with the custodian. Our audits also included evaluating the accounting principles used and significant estimates made by management, as well as evaluating the overall presentation of the financial statements. We believe that our audits provide a reasonable basis for our opinion.
We have served as the Fund’s auditor since 2015.
COHEN & COMPANY, LTD.
Cleveland, Ohio
February 21, 2020
TORRAYRESOLUTE SMALL/MID CAP GROWTH FUND
Additional Information (Unaudited)
December 31, 2019
TRUSTEES AND OFFICERS
| | | | Number of | | Other |
| | | | Portfolios | | Directorships |
| | Position(s) | Term of Office | in Trust | | Held by Trustee |
| Name, Address and | Held with | and Length of | Overseen | Principal Occupation(s) | During the |
Year of Birth | the Trust | Time Served | by Trustee | During the Past Five Years | Past Five Years |
| | | | | | |
| Independent Trustees | | | | | |
| | | | | | |
Leonard M. Rush, CPA | Lead | Indefinite Term; | 39 | Retired, Chief Financial | Independent |
615 E. Michigan St. | Independent | Since | | Officer, Robert W. Baird | Trustee, ETF |
Milwaukee, WI 53202 | Trustee | April 2011 | | & Co. Incorporated | Series Solutions |
Year of Birth: 1946 | and Audit | | | (2000-2011). | (52 Portfolios) |
| | Committee | | | | (2012-Present); |
| | Chairman | | | | Director, Anchor |
| | | | | | Bancorp |
| | | | | | Wisconsin, Inc. |
| | | | | | (2011-2013) |
| | | | | | |
David A. Massart | Trustee and | Indefinite Term; | 39 | Co-Founder and Chief | Independent |
615 E. Michigan St. | Valuation | Since | | Investment Strategist, | Trustee, ETF |
Milwaukee, WI 53202 | Committee | April 2011 | | Next Generation Wealth | Series Solutions |
Year of Birth: 1967 | Chairman | | | Management, Inc. | (52 Portfolios) |
| | | | | (2005-Present). | (2012-Present) |
| | | | | | |
David M. Swanson | Trustee and | Indefinite Term; | 39 | Founder and Managing | Independent |
615 E. Michigan St. | Nominating | Since | | Principal, SwanDog | Trustee, ALPS |
Milwaukee, WI 53202 | & | April 2011 | | Strategic Marketing, LLC | Variable |
Year of Birth: 1957 | Governance | | | (2006-Present). | Investment Trust |
| | Committee | | | | (10 Portfolios) |
| | Chairman | | | | (2006-Present); |
| | | | | | Independent |
| | | | | | Trustee, |
| | | | | | RiverNorth |
| | | | | | Opportunities |
| | | | | | Closed-End |
| | | | | | Fund |
| | | | | | (2015-Present) |
| | | | | | |
| Interested Trustee | | | | | |
| | | | | | |
Robert J. Kern* | Chairman, | Indefinite Term; | 39 | Retired, Executive Vice | None |
615 E. Michigan St. | and | Since | | President, U.S. Bancorp | |
Milwaukee, WI 53202 | Trustee | January 2011 | | Fund Services, LLC | |
Year of Birth: 1958 | | | | (1994-2018). | |
| * | Mr. Kern is an “interested person” of the Trust as defined by the 1940 Act by virtue of the fact that he was a board member of the Fund’s principal underwriter, Quasar Distributors, LLC, an affiliate of the Administrator. |
TORRAYRESOLUTE SMALL/MID CAP GROWTH FUND
Additional Information (Unaudited) – Continued
December 31, 2019
| | | | Number of | | Other |
| | | | Portfolios | | Directorships |
| | Position(s) | Term of Office | in Trust | | Held by Trustee |
| Name, Address and | Held with | and Length of | Overseen | Principal Occupation(s) | During the |
Year of Birth | the Trust | Time Served | by Trustee | During the Past Five Years | Past Five Years |
| | | | | | |
| Officers | | | | | |
| | | | | | |
Brian R. Wiedmeyer | President | Indefinite Term; | N/A | Vice President, U.S. | N/A |
615 E. Michigan St. | and | Since | | Bancorp Fund Services, | |
Milwaukee, WI 53202 | Principal | November 2018 | | LLC (2005-Present). | |
Year of Birth: 1973 | Executive | | | | |
| | Officer | | | | |
| | | | | | |
Deborah Ward | Vice | Indefinite Term; | N/A | Senior Vice President, | N/A |
615 E. Michigan St. | President, | Since | | U.S. Bancorp Fund | |
Milwaukee, WI 53202 | Chief | April 2013 | | Services, LLC | |
Year of Birth: 1966 | Compliance | | | (2004-Present). | |
| | Officer and | | | | |
| | Anti-Money | | | | |
| | Laundering | | | | |
| | Officer | | | | |
| | | | | | |
Benjamin Eirich | Vice | Indefinite Term; | N/A | Assistant Vice President, | N/A |
615 E. Michigan St. | President, | Since | | U.S. Bancorp Fund Services, | |
Milwaukee, WI 53202 | Treasurer | August 2019 | | LLC (2008-Present). | |
Year of Birth: 1981 | and | (Treasurer); | | | |
| | Principal | Since | | | |
| | Financial | November 2018 | | | |
| | Officer | (Vice President) | | | |
| | | | | | |
Thomas A. Bausch, Esq. | Secretary | Indefinite Term; | N/A | Vice President, U.S. | N/A |
615 E. Michigan St. | | Since | | Bancorp Fund Services, | |
Milwaukee, WI 53202 | | November 2017 | | LLC (2016-Present); | |
Year of Birth: 1979 | | | | Associate, Godfrey & | |
| | | | | Kahn S.C. (2012-2016). | |
| | | | | | |
Douglas Schafer | Vice | Indefinite Term; | N/A | Assistant Vice President, | N/A |
615 E. Michigan St. | President | Since | | U.S. Bancorp Fund Services, | |
Milwaukee, WI 53202 | and | May 2016 | | LLC (2002-Present). | |
Year of Birth: 1970 | Assistant | (Assistant Treasurer); | | | |
| | Treasurer | Since | | | |
| | | November 2018 | | | |
| | | (Vice President) | | | |
| | | | | | |
Michael Cyr II | Vice | Indefinite Term; | N/A | Officer, U.S. Bancorp Fund | N/A |
615 E. Michigan St. | President | Since | | Services, LLC (2013-Present). | |
Milwaukee, WI 53202 | and | August 2019 | | | |
Year of Birth: 1992 | Assistant | | | | |
| | Treasurer | | | | |
TORRAYRESOLUTE SMALL/MID CAP GROWTH FUND
Additional Information (Unaudited) – Continued
December 31, 2019
AVAILABILITY OF FUND PORTFOLIO INFORMATION
The Fund files complete schedules of portfolio holdings with the SEC for the first and third quarters of each fiscal year on Form N-Q, which is available on the SEC’s website at www.sec.gov. The Fund’s Form N-Q may be reviewed and copied at the SEC’s Public Reference Room in Washington, D.C. For information on the Public Reference Room call 1-800-SEC-0330. In addition, the Fund’s Form N-Q is available without charge upon request by calling 1-844-406-4960.
AVAILABILITY OF PROXY VOTING INFORMATION
A description of the Fund’s Proxy Voting Policies and Procedures is available without charge, upon request, by calling 1-844-406-4960. Information regarding how the Fund voted proxies relating to portfolio securities during the most recent 12 month period ended June 30, is available (1) without charge, upon request, by calling 1-844-406-4960, or (2) on the SEC’s website at www.sec.gov.
TORRAYRESOLUTE SMALL/MID CAP GROWTH FUND
Privacy Notice
The Fund collects only relevant information about you that the law allows or requires it to have in order to conduct its business and properly service you. The Fund collects financial and personal information about you (“Personal Information”) directly (e.g., information on account applications and other forms, such as your name, address, and social security number, and information provided to access account information or conduct account transactions online, such as password, account number, e-mail address, and alternate telephone number), and indirectly (e.g., information about your transactions with us, such as transaction amounts, account balance and account holdings).
The Fund does not disclose any non-public personal information about its shareholders or former shareholders other than for everyday business purposes such as to process a transaction, service an account, respond to court orders and legal investigations or as otherwise permitted by law. Third parties that may receive this information include companies that provide transfer agency, technology and administrative services to the Fund, as well as the Fund’s investment adviser who is an affiliate of the Fund. If you maintain a retirement/educational custodial account directly with the Fund, we may also disclose your Personal Information to the custodian for that account for shareholder servicing purposes. The Fund limits access to your Personal Information provided to unaffiliated third parties to information necessary to carry out their assigned responsibilities to the Fund. All shareholder records will be disposed of in accordance with applicable law. The Fund maintains physical, electronic and procedural safeguards to protect your Personal Information and requires its third party service providers with access to such information to treat your Personal Information with the same high degree of confidentiality.
In the event that you hold shares of the Fund through a financial intermediary, including, but not limited to, a broker-dealer, bank, credit union or trust company, the privacy policy of your financial intermediary governs how your non-public personal information is shared with unaffiliated third parties.
INVESTMENT ADVISER
Torray LLC
7501 Wisconsin Avenue, Suite 750 W
Bethesda, MD 20814-6519
DISTRIBUTOR
Quasar Distributors, LLC
777 East Wisconsin Avenue
Milwaukee, WI 53202
CUSTODIAN
U.S. Bank, N.A.
1555 North River Center Drive
Milwaukee, WI 53212
ADMINISTRATOR, FUND ACCOUNTANT
AND TRANSFER AGENT
U.S. Bancorp Fund Services, LLC
615 East Michigan Street
Milwaukee, WI 53202
INDEPENDENT REGISTERED PUBLIC ACCOUNTING FIRM
Cohen & Company, Ltd.
1350 Euclid Avenue, Suite 800
Cleveland, OH 44115
LEGAL COUNSEL
Stradley Ronon Stevens & Young, LLP.
2005 Market Street, Suite 2600
Philadelphia, PA 19103
This report must be accompanied or preceded by a prospectus.
The Fund’s Statement of Additional Information contains additional information about the
Fund’s trustees and is available without charge upon request by calling 1-844-406-4960.
TT-ANNUAL
Item 2. Code of Ethics.
The registrant has adopted a code of ethics that applies to the registrant’s principal executive officer and principal financial officer. The registrant has not made any substantive amendments to its code of ethics during the period covered by this period.
The registrant has not granted any waivers from any provisions of the code of ethics during the period covered by this report.
A copy of the registrant’s code of ethics that applies to the registrant’s principal executive officer and principal financial officer is filed herewith.
Item 3. Audit Committee Financial Expert.
The registrant’s Board of Trustees has determined that there is at least one audit committee financial expert serving on its audit committee. Leonard M. Rush is the “audit committee financial expert” and is considered to be “independent” as each term is defined in Item 3 of Form N-CSR.
Item 4. Principal Accountant Fees and Services.
The registrant has engaged its principal accountant to perform audit services, audit-related services, tax services and other services during the past fiscal year. “Audit services” refer to performing an audit of the registrant's annual financial statements or services that are normally provided by the accountant in connection with statutory and regulatory filings or engagements for those fiscal years. “Audit-related services” refer to the assurance and related services by the principal accountant that are reasonably related to the performance of the audit. “Tax services” refer to professional services rendered by the principal accountant for tax compliance, tax advice, and tax planning, including reviewing the Fund’s tax returns and distribution calculations. There were no “other services” provided by the principal accountant. For the fiscal years ended December 31, 2019, and December 31, 2018, the Fund’s principal accountant was Cohen & Company, LTD. The following table details the aggregate fees billed or expected to be billed for the past fiscal year for audit fees, audit-related fees, tax fees and other fees by the principal accountant.
| | FYE 12/31/2019 | FYE 12/31/2018 |
Audit Fees | $14,500 | $14,000 |
Audit-Related Fees | $0 | $0 |
Tax Fees | $3,000 | $3,000 |
All Other Fees | $0 | $0 |
The audit committee has adopted pre-approval policies and procedures that require the audit committee to pre‑approve all audit and non‑audit services of the registrant, including services provided to any entity affiliated with the registrant.
The percentage of fees billed by Cohen & Company, LTD. applicable to non-audit services pursuant to waiver of pre-approval requirement was as follows:
| | FYE 12/31/2019 | FYE 12/31/2018 |
Audit-Related Fees | 0% | 0% |
Tax Fees | 0% | 0% |
All Other Fees | 0% | 0% |
All of the principal accountant’s hours spent on auditing the registrant’s financial statements were attributed to work performed by full‑time permanent employees of the principal accountant.
The following table indicates the non-audit fees billed or expected to be billed by the registrant’s accountant for services to the registrant and to the registrant’s investment adviser (and any other controlling entity, etc.—not sub-adviser) for the past year. The audit committee of the board of trustees/directors has considered whether the provision of non-audit services that were rendered to the registrant's investment adviser is compatible with maintaining the principal accountant's independence and has concluded that the provision of such non-audit services by the accountant has not compromised the accountant’s independence.
Non-Audit Related Fees | FYE 12/31/2019 | FYE 12/31/2018 |
Registrant | $0 | $0 |
Registrant’s Investment Adviser | $0 | $0 |
Item 5. Audit Committee of Listed Registrants.
Not applicable to registrants who are not listed issuers (as defined in Rule 10A-3 under the Securities Exchange Act of 1934).
Item 6. Investments.
(a) Schedule of Investments is included as part of the report to shareholders filed under Item 1 of this Form.
(b) Not applicable.
Item 7. Disclosure of Proxy Voting Policies and Procedures for Closed-End Management Investment Companies.
Not applicable to open-end investment companies.
Item 8. Portfolio Managers of Closed-End Management Investment Companies.
Not applicable to open-end investment companies.
Item 9. Purchases of Equity Securities by Closed‑End Management Investment Company and Affiliated Purchasers.
Not applicable to open-end investment companies.
Item 10. Submission of Matters to a Vote of Security Holders.
There have been no material changes to the procedures by which shareholders may recommend nominees to the registrant’s board of trustees.
Item 11. Controls and Procedures.
(a) | The Registrant’s President and Treasurer have reviewed the Registrant's disclosure controls and procedures (as defined in Rule 30a-3(c) under the Investment Company Act of 1940 (the “Act”)) as of a date within 90 days of the filing of this report, as required by Rule 30a-3(b) under the Act and Rules 13a-15(b) or 15d‑15(b) under the Securities Exchange Act of 1934. Based on their review, such officers have concluded that the disclosure controls and procedures are effective in ensuring that information required to be disclosed in this report is appropriately recorded, processed, summarized and reported and made known to them by others within the Registrant and by the Registrant’s service provider. |
(b) | There were no changes in the Registrant's internal control over financial reporting (as defined in Rule 30a-3(d) under the Act) that occurred during the period covered by this report that has materially affected, or is reasonably likely to materially affect, the Registrant's internal control over financial reporting. |
Item 12. Disclosure of Securities Lending Activities for Closed-End Management Investment Companies.
Not applicable to open-end investment companies.
Item 13. Exhibits.
| (a) | (1) Any code of ethics or amendment thereto, that is the subject of the disclosure required by Item 2, to the extent that the registrant intends to satisfy Item 2 requirements through filing an exhibit. Filed herewith. |
(2) Certifications pursuant to Section 302 of the Sarbanes-Oxley Act of 2002. Filed herewith.
(3) Any written solicitation to purchase securities under Rule 23c‑1 under the Act sent or given during the period covered by the report by or on behalf of the registrant to 10 or more persons. Not applicable to open-end investment companies.
(4) Change in the registrant’s independent public accountant. There was no change in the registrant’s independent public accountant for the period covered by this report.
| (b) | Certification pursuant to Section 906 of the Sarbanes‑Oxley Act of 2002. Furnished herewith. |
SIGNATURES
Pursuant to the requirements of the Securities Exchange Act of 1934 and the Investment Company Act of 1940, the registrant has duly caused this report to be signed on its behalf by the undersigned, thereunto duly authorized.
(Registrant) Managed Portfolio Series
By (Signature and Title)* /s/Brian R. Wiedmeyer
Brian R. Wiedmeyer, President
Date March 2, 2020
Pursuant to the requirements of the Securities Exchange Act of 1934 and the Investment Company Act of 1940, this report has been signed below by the following persons on behalf of the registrant and in the capacities and on the dates indicated.
By (Signature and Title)* /s/Brian R. Wiedmeyer
Brian R. Wiedmeyer, President
Date March 2, 2020
By (Signature and Title)* /s/Benjamin J. Eirich
Benjamin J. Eirich, Treasurer
Date March 2, 2020
* Print the name and title of each signing officer under his or her signature.