UNITED STATES
SECURITIES AND EXCHANGE COMMISSION
Washington, D.C. 20549
FORM N-CSR
CERTIFIED SHAREHOLDER REPORT OF REGISTERED
MANAGEMENT INVESTMENT COMPANIES
Investment Company Act file number811-22525
Managed Portfolio Series
(Exact name of registrant as specified in charter)
615 East Michigan Street
Milwaukee, WI 53202
(Address of principal executive offices) (Zip code)
Brian R. Wiedmeyer, President
Managed Portfolio Series
c/o U.S. Bancorp Fund Services, LLC
777 East Wisconsin Ave, 5thFl
Milwaukee, WI 53202
(Name and address of agent for service)
(414) 765-6844
Registrant's telephone number, including area code
Date of fiscal year end:November 30, 2019
Date of reporting period:November 30, 2019
Item 1. Reports to Stockholders.
 |
| |
| |
Beginning on January 1, 2021, as permitted by regulations adopted by the Securities and Exchange Commission, paper copies of the Funds’ annual and semi-annual shareholder reports will no longer be sent by mail, unless you specifically request paper copies of the reports. Instead, the reports will be made available on the Funds’ website (www.tortoiseadvisors.com), and you will be notified by mail each time a report is posted and provided with a website link to access the report. If you already elected to receive shareholder reports electronically, you will not be affected by this change and you need not take any action. You may elect to receive shareholder reports and other communications from a Fund electronically anytime by contacting your financial intermediary (such as a broker-dealer or bank) or, if you are a direct investor, by calling 1-855-TCA-FUND (855-822-3863) or by sending an e-mail request to info@tortoiseadvisors.com. You may elect to receive all future reports in paper free of charge. If you invest through a financial intermediary, you can contact your financial intermediary to request that you continue to receive paper copies of your shareholder reports. If you invest directly with a Fund, you can call 1-855-822-3863 or send an email request to info@tortoiseadvisors.com to let the Fund know you wish to continue receiving paper copies of your shareholder reports. Your election to receive reports in paper will apply to all funds held in your account if you invest through your financial intermediary or all Funds held with the fund complex if you invest directly with a Fund. |
| |
| |
| |
| |
| Tortoise |
| 2019 Annual Report |
| |
This combined financial report provides you with a comprehensive review of our funds that span the entire energy value chain.
Tortoise Capital Advisors is one of the largest managers of energy investments, including closed-end funds, open-end funds, private funds and separate accounts.
| | | | |
| Table of Contents | | | |
| | | | |
| Letter to Shareholders | | 2 | |
| | | | |
| Tortoise MLP & Pipeline Fund | | 5 | |
| | | | |
| Tortoise MLP & Energy Income Fund | | 8 | |
| | | | |
| Tortoise MLP & Energy Infrastructure Fund | | 11 | |
| | | | |
| Tortoise Select Opportunity Fund | | 14 | |
| | | | |
| Expense Examples | | 18 | |
| | | | |
| Financial Statements | | 20 | |
| | | | |
| Notes to Financial Statements | | 42 | |
| | | | |
| Report of Independent Registered Public Accounting Firm | | 51 | |
| | | | |
| Investment Advisory Agreement | | 52 | |
| | | | |
| Trustees & Officers | | 54 | |
| | | | |
| Additional Information | | 55 | |
| |
| |
| 2019 Annual Report| November 30, 2019 |
| |
| |
| |
| |
| Open-end fund comparison |
| | Name/Ticker | | Primary focus | | Total assets
($ Millions)1 | | Portfolio mix by asset type2 | | Portfolio mix by ownership2 |
 | | Tortoise MLP & Pipeline Fund Institutional Class (TORIX)
A Class (TORTX)
Inception: 5/2011
C Class (TORCX)
Inception: 9/2012 | | North American pipeline companies | | $4,127.8 | | 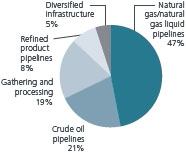 | | 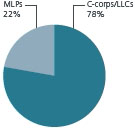 |
| Tortoise MLP & Energy Income Fund Institutional Class (INFIX)
A Class (INFRX)
Inception: 5/2011
C Class (INFFX)
Inception: 4/2012 | | Energy infrastructure equity and debt | | $742.9 | | 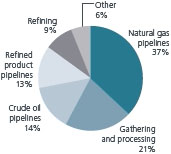 | | 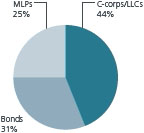 |
| Tortoise MLP & Energy Infrastructure Fund Institutional Class (MLPPX) | | Energy infrastructure equity and debt | | $82.8 | |  | | 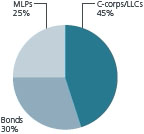 |
 | | Tortoise Select Opportunity Fund Institutional Class (TOPIX)
Investor Class (TOPTX)
C Class (TOPCX)
Inception: 9/2013 | | North American energy companies and beneficiaries | | $18.7 | | Portfolio mix by underlying investments2 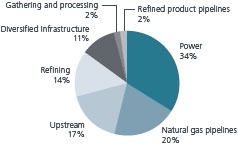
|
| (1) | As of 12/31/2019 |
| (2) | As of 11/30/2019 |
| |
| |
| |
| |
| Tortoise |
| 2019 Annual Report |
| |
Dear shareholder,
With our emphasis on essential assets, we focus on the trends and opportunities occurring across the sectors. One of our biggest focuses is on the energy evolution that is underway globally. Energy demand is growing worldwide, particularly from electrification in emerging countries. This increasing demand needs to be met with lower-carbon supply in order to decrease global carbon emissions. For this to happen, natural gas and renewables must take market share from coal for electricity generation. Additionally, U.S. midstream energy is playing a big role, exporting cheap and lower carbon energy to the rest of the world, increasing the need for critical infrastructure to support these exports.
The broader energy sector, as represented by the S&P Energy Select Sector®Index, finished the fourth fiscal quarter ending November 30, 2019 in positive territory, returning 3.3%, bringing fiscal year 2019 performance to -7.7%. Oil markets experienced significant volatility during the period. Prices were caught in a tug-of-war between escalating tensions in the Middle East culminating in significant, but temporary supply outages, mixed signals from U.S.-China trade negotiations impacting demand growth.
Midstream fixed income performance was strong during the fiscal year, perhaps evidence of the longer-term investment horizon bondholders have compared to investors on the equity side of the market for similar issuers. While midstream equity issuance slowed dramatically during the period, midstream debt capital markets remained open to companies. The ongoing process of delevering continued during the period as companies focused on asset sales and finding co-investment partners to reduce capital needs. With increasing cash flows from projects coming online, declining capital expenditures and improving leverage metrics, midstream companies are in a strong position from a balance sheet perspective. Finally, while there have been an increasing number of smaller exploration and production company bankruptcies, midstream companies do not have meaningful customer concentration which should alleviate investor concerns.
Upstream
The Tortoise North American Oil and Gas Producers IndexSMreturned -1.3% in the fourth fiscal quarter, bringing fiscal year performance to -22.7%. Crude oil prices, represented by West Texas Intermediate (WTI), began the fiscal quarter at $53.94 per barrel and peaked at $62.90 on Sept. 16, 2019 following the attacks on Saudi oil infrastructure. Prices troughed quickly thereafter at $52.45 on Oct. 3, 2019 on Saudi claims of minimal disruption to production and the potential for a U.S.-Iran deal before ending the fiscal year at $58.11.
U.S. crude oil production growth is expected to broadly moderate in 2020 as compared to the rapid growth over the past two years. Specifically, U.S. crude oil production is projected to average 12.3 million barrels per day (MMbbl/d) in 2019 and 13.2 MMbbl/d in 20201. U.S. producers are facing increased pressure from investors to exhibit capital discipline and reign in production growth in favorof higher free cash flow generation and return of capital to shareholders. Nonetheless, with multiple years of tremendous production growth, propelled by the U.S. shale revolution, the U.S. transitioned into a net exporter of oil and petroleum products for the first time in recent history. The U.S. became a net exporter of oil and petroleum products in September 2019 with net exports projected to grow in 2020 and beyond1. Rising U.S. energy exports of liquids and natural gas are expected to positively affect the U.S. trade deficit and will ultimately help reduce global Co2emissions along with renewables, as they take market share from coal.
Following the end of the fiscal year, the Organization of Petroleum Exporting Countries (OPEC) and their Non-OPEC partners (OPEC+) announced in December a clear goal of establishing a floor for crude prices through the seasonally weaker first quarter of 2020. OPEC+ members agreed to an incremental 0.5 MMbbl/d cut to the existing agreement taking the official cut to 1.7 MMbbl/d for Q1 2020.In addition, Saudi Arabia agreed to continue its over-compliance of 0.4 MMbbl/d implying a new commitment level of cutting 2.1 MMbbl/d. Saudi Arabia is focused on stabilizing crude oil prices following the recent Saudi Aramco initial public offering. While the deal was not extended, OPEC+ did set a date for an extraordinary meeting to be held in early March 2020 to determine the need for additional cuts. Emphasis will likely be placed upon improved compliance from various OPEC members with poor historical compliance (Iraq, Nigeria, and UAE). With trade tensions easing and the global economy not showing any signs of a true slowdown, oil demand growth is currently expected to improve in 2020, which should bring worldwide supply and demand into better balance.
Natural gas demand has remained robust supported by record levels of domestic power burn, increased exports to Mexico and record liquefied natural gas (LNG) exports driven by the startup of three new liquefaction and export facilities (Elba Island, Cameron LNG, Freeport LNG). However, surging natural gas supply more than offset strong demand, resulting in an elevated pace of inventory builds and pricing pressure through much of the period. Natural gas prices, represented by Henry Hub, opened the fiscal quarter at $2.39 per million British thermal units, hit a low of $2.08 on Oct. 18, and then peaked at $2.87 in November, due to colder than average weather in the Midwest, before ending the fiscal year back down to $2.46.
Persistently low natural gas prices have prompted natural gas producers to reign in capex budgets and drilling programs in 2020. While natural gas production is expected to continue growing, the pace of supply growth is set to slow measurably, with production expected to average 91.8 billion cubic feet per day (Bcf/d) in 2019 and 93.8 Bcf/d in 20202. The backdrop of slowing production growth and strong domestic and export demand paints a picture of improving natural gas fundamentals in the future. The second wave of LNG export facilities, led by final investment decisions (FIDs) made to Exxon’s Golden Pass and Venture Global’s Calcasieu Pass LNG export facilities in 2019 will provide another meaningful catalyst for natural gas export demand growth from 2022 to 2025.
| |
| |
| 2019 Annual Report| November 30, 2019 |
| |
| |
| |
| |
Midstream
Midstream energy performance lagged broader energy in the fourth fiscal quarter with the Tortoise North American Pipeline IndexSMreturning -2.6% and the Tortoise MLP Index®returning -8.9%, bringing fiscal year performance to 5.9% and -7.0%, respectively. The sharp contrast in midstream index performance is due to midstream companies structured as C-Corps outperforming those structured as MLPs. C-Corps benefitted from several items versus MLPs, including: stronger corporate governance, broad market index inclusion for some companies, lack of K-1s, and a more certain corporate structure. Contributing to broad midstream underperformance for the fiscal quarter were concerns regarding a slowdown in U.S. production growth, political rhetoric regarding proposed fracking bans from Democratic Presidential candidates and tax loss selling. Gathering and processing companies in particular suffered following lower natural gas and natural gas liquids (NGL) pricing and the ‘going concern’ language introduced into Chesapeake Energy’s (CHK) quarterly filing. These items drove negative sentiment and raised questions related to producer financial health, counterparty risk and companies’ exposure to drilling slowdowns. However, the U.S. has seen tremendous production growth in recent years and we believe a more moderate pace of growth is healthy for the midstream sector through the reduction in growth capital expenditures and reduced risk of takeaway capacity overbuild.
DCP Midstream LP (DCP) became the latest MLP to announce the elimination of its Incentive Distribution Rights (IDRs) in the fourth fiscal quarter. As the era of simplification comes to a close, the results have advanced the midstream sector in our view and accomplished widespread cost of capital and corporate governance improvements. Looking forward, the midstream sector continues to evolve. There has been an industry-wide shift to higher distribution coverage and self-funding the equity portion of capital expenditure programs. With the expected moderation in U.S. production growth, midstream companies are now shifting focus toward executing on delivering value through the return of capital to shareholders in the form of debt reduction, sustainable yields and distribution growth, and potential stock buybacks. A particular emphasis on the generation of free cash flow yields comparable to other S&P 500 sectors continues to emerge, achieved through the sale of non-core assets and the reduction of growth capital expenditures.
Interest in publicly traded midstream companies and assets, from both public and private entities, has remained elevated, highlighting their strategic value and attractive valuations. Recently announced or closed transactions include Energy Transfer’s (ET) acquisition of SemGroup Corporation (SEMG), DTE Energy’s (DTE) acquisition of a natural gas gathering system in the Haynesville Shale and Pembina Pipeline Corp’s (PPL CN) acquisition of Kinder Morgan Canada and the Cochin pipeline.
Capital Markets
Capital markets activity increased during the fourth fiscal quarter with MLPs and other pipeline companies raising approximately $10.8 billion in total capital, with nearly all of the issuance in debt. This brings the total capital raised for the fiscal year to approximately $36.4 billion, slightly lower than the previous fiscal year. As expected, alternative options for capital and self-funding projects have continued to trend higher.
Merger and acquisition activity among MLPs and other pipeline companies in the last fiscal quarter of the year was largely driven by Energy Transfer’s acquisition of SemGroup Corporation, which at $5.1 billion made up nearly all of the merger and acquisition activity in the quarter. This brought the fiscal year’s announced transactions to $26.6 billion. This is significantly below the previous year when many large simplification transactions were announced. This fiscal year’s activity was driven by three large transactions. In addition to Energy Transfer’s acquisition of SemGroup Corporation, MPLX purchased Andeavor Logistics for approximately $13.5 billion and Pembina Pipeline Corporation purchased two businesses from Kinder Morgan for approximately $4.4 billion combined.
Downstream
Refinery utilization has remained challenged in 2019 due to heavy spring and fall turnarounds in preparation for the International Maritime Organization’s January 1, 2020 implementation of sulfur reduction regulations on the shipping industry (IMO 2020), unplanned refinery outages as well as the closure of Philadelphia Energy Solutions’ 350 Mbbl/d Philadelphia refinery, the largest refining complex on the east coast. IMO 2020 has positioned U.S. refiners to take advantage of higher distillate pricing and more heavily discounted medium-heavy sour crude oils as they have more flexibility than international refiners to use a wide range of crude oil feedstocks. We expected that U.S. refinery utilization and throughput will exhibit strong growth as refiners attempt to capture margin upside driven by IMO 2020.
Incremental NGL supply from completed Permian takeaway projects and overall liquids production growth surpassed current levels of domestic NGL demand, primarily from petrochemical facilities, resulting in price pressure. We expect that moderating Northeast liquids production growth and increased demand from petrochemical projects coming online in late 2019 and early 2020 will begin to draw down inventories.
The solar industry is set to install 13 gigawatts (GWs) of capacity in the U.S. in 2019, the second highest annual installation on record. Much of the activity has been concentrated in the Southwest and Southeast, with Florida and Texas ranking behind California in year-to-date installations. Signed solar PPA prices range from $18-35 megawatts/hour, putting solar on par with new gas
generation and competitive with the operating costs of existing coal plants. Costs continue to decline, as evidenced by the 12% decline year-over-year in Q3 2019 to $0.95/watt for utility-scale projects. On the policy front, the investment tax credit (ITC) is set to phase down for projects beginning construction at the end of 2019. We continue to monitor efforts to extend the ITC as we enter 2020, but do not view an extension as necessary given anticipated continued cost declines.
Wind installations totaled 1,927 megawatts (MWs) in the third calendar quarter of 2019, reaching a total installed capacity of more than 100,000 MW across the U.S. with an additional 46,500 MW of capacity currently under construction or in advanced development. Nineteen states now have more than 1,000 MW under construction or advanced development. Texas hosts 19% of the total development pipeline, followed by Wyoming (11%), Oklahoma (7%), Iowa (6%), and Virginia (6%). It is also important to have offtake agreements in place. Currently, 44% of capacity in the pipeline has a Power Purchase Agreement (PPA) in place, while 28% is utility-owned and 6% has a hedge contract. New developments are largely being driven by corporate customers who have signed 64% of capacity contracted in the third quarter. Turbine technology continues to improve with 22% of new turbines installed year-to-date rated between 3.4 MW and 3.6 MW in size.
Concluding thoughts
We expect plenty of opportunities in essential assets in 2020.We are optimistic across the energy sector where we expect supply and demand will find better balance and companies will shine a brighter light on their cash flow as they return it to shareholders. Our long-term outlook is built around worldwide electricity demand doubling by 2050. In our view, natural gas and renewables need to replace coal in power generation. This is the fastest and most economical way to lower global carbon emissions and improve living standards for people around the globe.
The S&P Energy Select Sector®Index is a capitalization-weighted index of S&P 500®Index companies in the energy sector involved in the development or production of energy products. The Tortoise North American Oil and Gas Producers IndexSMis a float-adjusted, capitalization-weighted index of North American energy companies engaged primarily in the production of crude oil, condensate, natural gas or natural gas liquids (NGLs). The Tortoise North American Pipeline IndexSMis a float adjusted, capitalization-weighted index of energy pipeline companies domiciled in the United States and Canada. The Tortoise MLP Index®is a float-adjusted, capitalization-weighted index of energy master limited partnerships.
The Tortoise indices are the exclusive property of Tortoise Index Solutions, LLC, which has contracted with S&P Opco, LLC (a subsidiary of S&P Dow Jones Indices LLC) to calculate and maintain the Tortoise MLP Index®, Tortoise North American Pipeline IndexSMand Tortoise North American Oil and Gas Producers IndexSM(the “Indices”). The Indices are not sponsored by S&P Dow Jones Indices or its affiliates or its third party licensors (collectively, “S&P Dow Jones Indices LLC”). S&P Dow Jones Indices will not be liable for any errors or omission in calculating the Indices. “Calculated by S&P Dow Jones Indices” and its related stylized mark(s) are service marks of S&P Dow Jones Indices and have been licensed for use by Tortoise Index Solutions, LLC and its affiliates. S&P®is a registered trademark of Standard & Poor’s Financial Services LLC (“SPFS”), and Dow Jones®is a registered trademark of Dow Jones Trademark Holdings LLC (“Dow Jones”).
Free cash flow is the cash a company produces through its operations, less the cost of total capital expenditures (growth and maintenance).
It is not possible to invest directly in an index.
Performance data quoted represent past performance; past performance does not guarantee future results. Like any other stock, total return and market value will fluctuate so that an investment, when sold, may be worth more or less than its original cost.
| 1 | Energy Information Administration, Short-Term Outlook, December 2019 |
| 2 | BTU Analytics |
| 3 | Wood Mackenzie, Power and Renewables, December 2019 |
| 4 | AWEA July-September 2019 |
| |
| |
| 2019 Annual Report| November 30, 2019 |
| |
| Tortoise |
| MLP & Pipeline Fund |
| |
Basic fund facts
Investment objective:Total return
Structure:Regulated investment company
| | Institutional | | A Class | | C Class |
| Ticker | | | TORIX | | | | TORTX | | | | TORCX | |
| Gross expense ratio | | | 0.93% | | | | 1.18% | | | | 1.93% | |
| Redemption fee | | | None | | | | None | | | | None | |
| Maximum front-end sales load | | | None | (1) | | | 5.50% | (2) | | | None | (1) |
| Maximum deferred sales load | | | None | | | | None | (3) | | | 1.00% | (4) |
| (1) | While the Institutional and C Classes have no front-end load, advisory and other expenses still apply. |
| (2) | You may qualify for sales charge discounts if you invest at least $50,000. |
| (3) | No front-end sales charge is payable on A Class investments of $1 million or more, although the fund may impose a Contingent Deferred Sales Charge (“CDSC”) of 1% on certain redemptions made within 12 months of purchase. |
| (4) | The C Class CDSC applies to redemptions made within 12 months of purchase. |
Top ten holdings(as of November 30, 2019)
| 1. | | ONEOK, Inc. | | 8.5% |
| 2. | | Kinder Morgan, Inc. | | 8.2% |
| 3. | | The Williams Companies, Inc. | | 8.1% |
| 4. | | Cheniere Energy, Inc. | | 7.8% |
| 5. | | TC Energy Corporation | | 7.6% |
| 6. | | Targa Resources Corp. | | 6.1% |
| 7. | | Enbridge Inc. | | 5.0% |
| 8. | | Pembina Pipeline Corporation | | 4.9% |
| 9. | | Energy Transfer LP | | 4.4% |
| 10. | | Enterprise Products Partners L.P. | | 4.2% |
Targeted investment characteristics
The fund’s targeted investments generally will have the following characteristics:
| ● | Strategic assets that fuel the economy |
| | |
| ● | Diversified asset base |
| | |
| ● | Limited direct commodity price exposure |
| | |
| ● | History of predictable, recurring cash flows |
| | |
| ● | Total-return potential through growth and current income |
| | |
| ● | Experienced management teams |
Value of $1,000,000 vs. S&P 500® Index
Since inception on May 31, 2011 through November 30, 2019 |
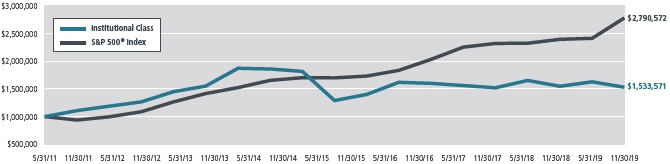 |
This chart illustrates the performance of a hypothetical $1,000,000 investment made on May 31, 2011 and is not intended to imply any future performance. The returns shown do not reflect the deduction of taxes that a shareholder would pay on fund distributions or the redemption of fund shares. The returns reflect fee waivers in effect. In the absence of such waivers, total return would be reduced. The chart assumes reinvestment of capital gains and dividends for a fund and dividends for the index.
The performance data quoted above represents past performance since inception on May 31, 2011 through November 30, 2019. Past performance is no guarantee of future results. The investment return and value of an investment will fluctuate so that an investor’s shares, when redeemed, may be worth more or less than their original cost. Current performance of the fund may be obtained through the most recent month-end by calling 855-TCA-FUND (855-822-3863). Future performance may be lower or higher than the performance stated above.
The S&P 500®Index is an unmanaged market-value weighted index of stocks, which is widely regarded as the standard for measuring large-cap U.S. stock market performance. Returns include reinvested dividends. You cannot invest directly in an index.
| |
| |
| |
| |
| Tortoise |
| MLP & Pipeline Fund(continued) |
| |
Performance was negative for the year as relatively high capital expenditures, corporate structure evolution, and increasing counterparty risk offset growing energy production, improved balance sheets and visibility to more return of capital to shareholders. Midstream energy returns were bifurcated with C-Corp pipelines in positive territory and MLPs negative as there was strong tax loss selling within MLPs during the month of November. In the fund, larger cap, higher quality, stable cash flow long-haul pipelines outperformed midstream companies focused on gathering and processing.
Our positive outlook for midstream remains as energy production growth continues and more capital is returned to shareholders. Our focus continues to be on midstream companies best positioned for continued growth in areas with the strongest production growth (supply push) as well exposure to growing export markets and products (demand pull) within the North American energy value chain.
Key asset performance drivers
| Top five contributors | | Company type | | Performance driver |
| Kinder Morgan Inc. | | Midstream natural gas/natural gas liquids pipeline company | | Dividend increase of 25% , announced share buyback authorization and attractive multiple Canadian asset sale, exposure to liquefied natural gas (LNG) exports with significant insider buying |
| ONEOK, Inc. | | Midstream natural gas/natural gas liquids pipeline company | | Continued execution of backlog of infrastructure projects with high returns |
| TC Energy Corporation | | Midstream natural gas/natural gas liquids pipeline company | | Asset sales leading to reduced leverage high quality contracted cash flows with large back large back log of infrastructure projects across North America |
| Enbridge Inc. | | Midstream crude oil pipeline company | | Anticipated dividend growth of 5-7% in 2020+ |
| Phillips 66 Partners LP | | Midstream refined product pipeline MLP | | Eliminated incentive distribution rights (IDRs) leading to a lower cost of capital |
| Bottom five contributors | | Company type | | Performance driver |
| Antero Midstream Corporation | | Midstream gathering and processing company | | Concerns around potential recontracting of gathering and process contracts and financial health of parent company Antero Resources (AR) as natural gas prices moved lower |
| Equitrans Midstream Corporation | | Midstream natural gas/natural gas liquids pipeline company | | Uncertainty around Mountain Valley Pipeline project |
| EnLink Midstream, LLC | | Midstream gathering and processing MLP | | Concern around producers slowing drilling activity in Oklahoma |
| Western Midstream Partners, LP | | Midstream gathering and processing MLP | | Carrying out strategic review |
| Plains GP Holdings, L.P. | | Midstream crude oil pipeline company | | Uncertain crude oil production growth from Permian in 2020 leading to concerns to potential of over build |
| |
| |
| 2019 Annual Report| November 30, 2019 |
| |
| |
| |
| |
Total returns(as of November 30, 2019)
| Ticker | | Class | | 1 year | | 3 years | | 5 years | | Since inception(1) | | Gross expense ratio |
| TORIX | | Institutional | | | -1.09% | | | | -1.88% | | | | -3.84% | | | | 5.16% | | | | 0.93% | |
| TORTX | | A Class (excluding load)(2) | | | -1.38% | | | | -2.17% | | | | -4.12% | | | | 4.85% | | | | 1.18% | |
| TORTX | | A Class (maximum load)(2) | | | -6.81% | | | | -4.01% | | | | -5.20% | | | | 4.16% | | | | 1.18% | |
| TORCX | | C Class (excluding CDSC) | | | -2.13% | | | | -2.85% | | | | -4.80% | | | | 4.09% | | | | 1.93% | |
| TORCX | | C Class (including CDSC) | | | -3.07% | | | | -2.85% | | | | -4.80% | | | | 4.09% | | | | 1.93% | |
| S&P 500®Index(3) | | | | | 16.11% | | | | 14.88% | | | | 10.98% | | | | 12.83% | | | | — | |
| TNAPT(4) | | | | | 5.88% | | | | 3.10% | | | | 0.32% | | | | — | | | | — | |
| (1) | Reflects period from fund inception on May 31, 2011 through November 30, 2019. The Institutional and A Class Shares commenced operations on May 31, 2011 and C Class Shares commenced operations on September 19, 2012. Performance shown for the C Class prior to inception of the C Class Shares is based on the performance of the Institutional Class Shares, adjusted for the higher expenses applicable to C Class Shares. |
| (2) | Prior to March 30, 2019, A Class Shares were known as Investor Class Shares. |
| (3) | The S&P 500®Index is an unmanaged market-value weighted index of stocks, which is widely regarded as the standard for measuring large-cap U.S. stock market performance. Returns include reinvested dividends. You cannot invest directly in an index. |
| (4) | The Tortoise North American Pipeline IndexSMis a float-adjusted, capitalization weighted index of pipeline companies headquartered in the United States and Canada. You cannot invest directly in an index. |
Note: For periods over 1 year, performance reflected is for the average annual returns. Performance data shown for the A Class (maximum load) reflects a sales charge of 5.50%. Performance data shown “excluding load” does not reflect the deduction of the maximum sales load. Performance data shown for the C Class (including CDSC) reflects a contingent deferred sales charge (“CDSC”) of 1% for the first 12 months of investment. Performance data shown “excluding CDSC” does not reflect the deduction of the CDSC. If reflected, the load and CDSC would reduce the performance quoted. Investment performance reflects fee waivers in effect. In the absence of such waivers, total return would be reduced.
Performance data quoted represents past performance; past performance does not guarantee future results. The investment return and principal value of an investment will fluctuate so that an investor’s shares, when redeemed, may be worth more or less than their original cost. Current performance of the portfolio may be lower or higher than the performance quoted. Performance data current to the most recent month end may be obtained by calling 855-TCA-FUND (855-822-3863).
| |
| |
| |
| |
| Tortoise |
| MLP & Energy Income Fund |
| |
Basic fund facts
Investment objective:Current income and long-term capital appreciation
Structure:Regulated investment company
| | Institutional | | A Class | | C Class |
| Ticker | | | INFIX | | | | INFRX | | | | INFFX | |
| Gross expense ratio | | | 1.09% | | | | 1.34% | | | | 2.09% | |
| Redemption fee | | | None | | | | None | | | | None | |
| Maximum front-end sales load | | | None | (1) | | | 5.50% | (2) | | | None | (1) |
| Maximum deferred sales load | | | None | | | | 1.00% | (3) | | | 1.00% | (4) |
| (1) | While the Institutional and C Classes have no front-end load, advisory and other expenses still apply. |
| (2) | You may qualify for sales charge discounts if you invest at least $50,000. |
| (3) | No front-end sales charge is payable on A Class investments of $1 million or more, although the fund may impose a Contingent Deferred Sales Charge (“CDSC”) of 1% on certain redemptions made within 18 months of purchase. |
| (4) | The C Class CDSC applies to redemptions made within 12 months of purchase. |
Top ten holdings(as of November 30, 2019)
| 1. | | Enbridge Inc. | | 5.8% |
| 2. | | ONEOK, Inc. | | 5.1% |
| 3. | | The Williams Companies, Inc. | | 4.8% |
| 4. | | Magellan Midstream Partners, L.P. | | 4.7% |
| 5. | | PBF Holding Co. LLC / PBF Finance Corp., 7.250%, 06/15/2025 | | 4.7% |
| 6. | | Enterprise Products Partners, L.P. | | 4.6% |
| 7. | | Plains GP Holdings, L.P. | | 4.6% |
| 8. | | TC Energy Corporation | | 4.2% |
| 9. | | Energy Transfer LP | | 4.1% |
| 10. | | MPLX LP | | 4.0% |
Targeted investment characteristics
The fund’s targeted investments generally will have the following characteristics:
| ● | Securities from across the capital structure and energy value chain |
| | |
| ● | Strategic assets that fuel the economy |
| | |
| ● | Diversified asset base |
| | |
| ● | Limited direct commodity price exposure |
| | |
| ● | History of predictable, recurring cash flows |
| | |
| ● | Current income through distributions |
| | |
| ● | A flexible asset allocation dependent on current market opportunities |
| | |
| ● | Experienced management team |
Value of $1,000,000 vs. the Alerian MLP Index
Since inception on December 27, 2010 through November 30, 2019 |
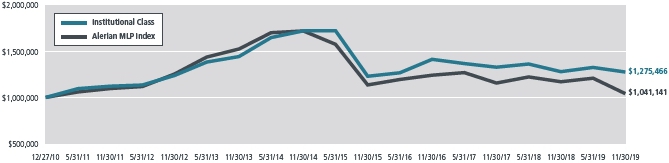 |
This chart illustrates the performance of a hypothetical $1,000,000 investment made on December 27, 2010 and is not intended to imply any future performance. The returns shown do not reflect the deduction of taxes that a shareholder would pay on fund distributions or the redemption of fund shares. The returns reflect fee waivers in effect. In the absence of such waivers, total return would be reduced. The chart assumes reinvestment of capital gains and dividends for a fund and dividends for the index.
The performance data quoted above represents past performance since inception on December 27, 2010 through November 30, 2019. Past performance is no guarantee of future results. The investment return and value of an investment will fluctuate so that an investor’s shares, when redeemed, may be worth more or less than their original cost. Current performance of the fund may be obtained through the most recent month-end by calling 855-TCA-FUND (855-822-3863). Future performance may be lower or higher than the performance stated above.
The Alerian MLP Index is the leading gauge of energy infrastructure Master Limited Partnerships (MLPs). The capped, float-adjusted, capitalization-weighted index, whose constituents earn the majority of their cash flow from midstream activities involving energy commodities, is disseminated real-time on a price-return basis (AMZ) and on a total-return basis (AMZX).
| |
| |
| 2019 Annual Report| November 30, 2019 |
| |
| |
| |
| |
While the fiscal period was a difficult one for overall returns, the fund benefitted from active management and its ability to invest across the capital structure. All three segments of the fund: MLPs, energy infrastructure equities, and fixed income, outperformed the benchmark. The fixed income portion was the largest contributor to performance. The fund’s allocation to large-cap, diversified c-corp equities also helped drive performance throughout the period.
Our positive outlook for the asset class remains and as fundamentals continue to improve, we are likely to favor an allocation towards equities versus bonds. Our equity holdings continue to be concentrated in higher quality, stable cash flow companies. As the broad sustainability of distributions become more certain, performance should improve for our underlying equity holdings. Bonds issued by energy companies should experience moderate returns moving forward, whereas we believe the equities issued by these same companies remain significantly discounted.
Key asset performance drivers
| Top five contributors | | Company type | | Performance driver |
| Enbridge Inc. | | Midstream crude oil pipeline company | | Anticipated dividend growth of 5-7% in 2020+ |
| Kinder Morgan Inc. | | Midstream natural gas/natural gas liquids pipeline company | | Dividend increase of 25% , announced share buyback authorization and attractive multiple Canadian asset sale, exposure to liquefied natural gas (LNG) exports with significant insider buying |
| ONEOK, Inc. | | Midstream natural gas/natural gas liquids pipeline company | | Continued execution of backlog of infrastructure projects with high returns |
| TC Energy Corporation | | Midstream natural gas/natural gas liquids pipeline company | | Asset sales leading to reduced leverage high quality contracted cash flows with large back large back log of infrastructure projects across North America |
| Phillips 66 Partners LP | | Midstream refined product pipeline MLP | | Eliminated incentive distribution rights (IDRs) leading to lower cost of capital |
| Bottom five contributors | | Company type | | Performance driver |
| Equitrans Midstream Corporation | | Midstream natural gas/natural gas liquids pipeline company | | Uncertainty around Mountain Valley Pipeline project |
| Altus Midstream Company | | Midstream crude oil pipeline company | | Largest counterparty, Apache, lowered 2019 capital investment |
| MPLX LP | | Refined products pipeline company | | Continued uncertainty regarding organizational structure and parental support combined with north east natural gas gathering & processing exposure |
| Plains GP Holdings, L.P. | | Midstream crude oil pipeline company | | Uncertain crude oil production growth from Permian in 2020 leading to concerns to potential of over build |
| DCP Midstream, LP | | Midstream gathering and processing MLP | | Reduced drilling activity lower commodity prices and negatively impacted non fee-based |
| |
| |
| |
| |
| Tortoise |
| MLP & Energy Income Fund(continued) |
| |
Total returns(as of November 30, 2019)
| Ticker | | Class | | 1 year | | 3 years | | 5 years | | Since inception(1) | | Gross expense ratio |
| INFIX | | Institutional | | -0.29% | | -3.35% | | -5.82% | | 2.76% | | | 1.09% | |
| INFRX | | A Class (excluding load) | | -0.41% | | -3.57% | | -6.04% | | 2.53% | | | 1.34% | |
| INFRX | | A Class (maximum load) | | -5.89% | | -5.36% | | -7.10% | | 1.88% | | | 1.34% | |
| INFFX | | C Class (excluding CDSC) | | -1.30% | | -4.32% | | -6.77% | | 1.84% | | | 2.09% | |
| INFFX | | C Class (including CDSC) | | -2.20% | | -4.32% | | -6.77% | | 1.84% | | | 2.09% | |
| Alerian MLP Index(2) | | | | -11.00% | | -5.68% | | -9.56% | | 0.45% | | | — | |
| (1) | Reflects period from fund inception on December 27, 2010 through November 30, 2019. The Institutional Class commenced operations on December 27, 2010, the A Class Shares commenced operation on May 18, 2011 and the C Class Shares commenced operations on April 2, 2012. Performance shown for the A Class and C Class prior to the inception of the A Class Shares and C Class Shares is based on the performance of the Institutional Class Shares, adjusted for the higher expenses applicable to the A Class Shares and the C Class Shares, respectively. |
| (2) | The Alerian MLP Index is the leading gauge of energy infrastructure Master Limited Partnerships (MLPs). The capped, float-adjusted, capitalization-weighted index, whose constituents earn the majority of their cash flow from midstream activities involving energy commodities, is disseminated real-time on a price return basis (AMZ) and on a total-return basis (AMZX). |
Note: For periods over 1 year, performance reflected is for the average annual returns. Performance data shown for the A Class (maximum load) reflects a sales charge of 5.50%. Performance data shown “excluding load” does not reflect the deduction of the maximum sales load. Performance data shown for the C Class (including CDSC) reflects a contingent deferred sales charge (“CDSC”) of 1% for the first 12 months of investment. Performance data shown “excluding CDSC” does not reflect the deduction of the CDSC. If reflected, the load and CDSC would reduce the performance quoted. Investment performance reflects fee waivers in effect. In the absence of such waivers, total return would be reduced.
Fund statistics(as of November 30, 2019)
| | 1 year | | 3 years | | 5 years | | Since inception |
| Volatility* (Institutional Shares) | | 13.63% | | 13.80% | | 18.48% | | 15.65% |
| Volatility* (Alerian MLP Index) | | 18.89% | | 18.05% | | 25.14% | | 21.40% |
| Correlation (Institutional Shares) to Index | | 0.94 | | 0.94 | | 0.94 | | 0.93 |
| * | | Standard deviation measures the dispersion of a set of data from its mean. Standard deviation is annualized based on daily total returns and indicates the volatility of a fund’s total returns. In general, the higher the standard deviation, the greater the volatility of return. |
Performance data quoted represents past performance; past performance does not guarantee future results. The investment return and principal value of an investment will fluctuate so that an investor’s shares, when redeemed, may be worth more or less than their original cost. Current performance of the portfolio may be lower or higher than the performance quoted. Performance data current to the most recent month end may be obtained by calling 855-TCA-FUND (855-822-3863).
| |
| |
| 2019 Annual Report| November 30, 2019 |
| |
| Tortoise |
| MLP & Energy Infrastructure Fund |
| |
Basic fund facts
Investment objective:Current income and long-term capital appreciation
Structure:Regulated investment company
| | Institutional |
| Ticker | | | MLPPX | |
| Gross expense ratio | | | 0.91% | |
| Redemption fee | | | None | |
| Maximum front-end sales load | | | None | (1) |
| Maximum deferred sales load | | | None | |
| (1) | While the Institutional Class has no front-end load, advisory and other expenses still apply. |
Top ten holdings(as of November 30, 2019)
| 1. | Enbridge Inc. | | 6.0% |
| 2. | ONEOK, Inc. | | 5.2% |
| 3. | The Williams Companies, Inc. | | 5.0% |
| 4. | Plains GP Holdings, L.P. | | 4.7% |
| 5. | PBF Holding Co. LLC / PBF Finance Corp.,
7.250%, 06/15/2025 | | 4.6% |
| 6. | Magellan Midstream Partners, L.P. | | 4.5% |
| 7. | Enterprise Products Partners, L.P. | | 4.5% |
| 8. | TC Energy Corporation | | 4.3% |
| 9. | MPLX LP | | 4.2% |
| 10. | Cheniere Energy, Inc. | | 4.2% |
Targeted investment characteristics
The fund’s targeted investments generally will have the following characteristics:
| ● | Securities from across the capital structure and energy value chain |
| ● | Strategic assets that fuel the economy |
| ● | Diversified asset base |
| ● | Limited direct commodity price exposure |
| ● | History of predictable, recurring cash flows |
| ● | Current income through distributions |
| ● | A flexible asset allocation dependent on current market opportunities |
| ● | Experienced management team |
Value of $5,000,000 vs. the Alerian MLP Index
Since inception on September 9, 2010 through November 30, 2019 |
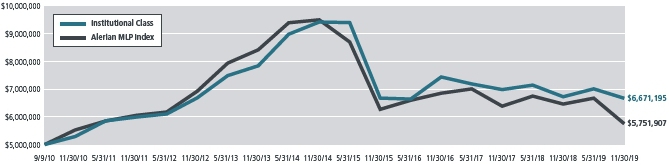 |
This chart illustrates the performance of a hypothetical $5,000,000 investment made on September 9, 2010 and is not intended to imply any future performance. The returns shown do not reflect the deduction of taxes that a shareholder would pay on fund distributions or the redemption of fund shares. The returns reflect fee waivers in effect. In the absence of such waivers, total return would be reduced. The chart assumes reinvestment of capital gains and dividends for a fund and dividends for the index.
The performance data quoted above represents past performance since September 9, 2010 through November 30, 2019. Past performance is no guarantee of future results. The investment return and value of an investment will fluctuate so that an investor’s shares, when redeemed, may be worth more or less than their original cost. Current performance of the fund may be obtained through the most recent month-end by calling 855-TCA-FUND (855-822-3863). Future performance may be lower or higher than the performance stated above.
The Alerian MLP Index is the leading gauge of energy infrastructure Master Limited Partnerships (MLPs). The capped, float-adjusted, capitalization-weighted index, whose constituents earn the majority of their cash flow from midstream activities involving energy commodities, is disseminated real-time on a price-return basis (AMZ) and on a total-return basis (AMZX).
| |
| |
| |
| |
| Tortoise |
| MLP & Energy Infrastructure Fund(continued) |
| |
While the fiscal period was a difficult one for overall returns, the fund benefitted from active management and its ability to invest across the capital structure. All three segments of the fund, MLPs, energy infrastructure equities, and fixed income, outperformed the benchmark. The fixed income portion was the largest contributor to performance. The fund’s allocation to large-cap, diversified c-corp equity securities helped drive performance throughout the period.
Our positive outlook for the asset class remains and as fundamentals continue to improve, we are likely to favor an allocation towards equities versus bonds. Our equity holdings continue to be concentrated in higher quality, stable cash flow companies. As the broad sustainability of distributions become more certain, performance should improve for our underlying equity holdings. Bonds issued by energy companies should experience moderate returns moving forward, whereas we believe the equities issued by these same companies remain significantly discounted.
Key asset performance drivers
| Top five contributors | | Company type | | Performance driver |
| Kinder Morgan Inc. | | Midstream natural gas/natural gas liquids pipeline company | | Dividend increase of 25% , announced share buyback authorization and attractive multiple Canadian asset sale, exposure to liquefied natural gas (LNG) exports with significant insider buying |
| Enbridge Inc. | | Midstream crude oil pipeline company | | Anticipated dividend growth of 5-7% in 2020+ |
| TC Energy Corporation | | Midstream natural gas/natural gas liquids pipeline company | | Asset sales leading to reduced leverage high quality contracted cash flows with large back large back log of infrastructure projects across North America |
| ONEOK, Inc. | | Midstream natural gas/natural gas liquids pipeline company | | Continued execution of backlog of infrastructure projects with high returns |
| Phillips 66 Partners LP | | Midstream refined product pipeline MLP | | Eliminated incentive distribution rights (IDRs) leading to lower cost of capital |
| Bottom five contributors | | Company type | | Performance driver |
| Equitrans Midstream Corporation | | Midstream natural gas/natural gas liquids pipeline company | | Uncertainty around Mountain Valley Pipeline project |
| MPLX LP | | Refined products pipeline company | | Continued uncertainty regarding organizational structure and parental support combined with north east natural gas gathering & processing exposure |
| Altus Midstream Company | | Midstream crude oil pipeline company | | Largest counterparty, Apache, lowered 2019 capital investment |
| Plains GP Holdings, L.P. | | Midstream crude oil pipeline company | | Uncertain crude oil production growth from Permian in 2020 leading to concerns to potential of over build |
| DCP Midstream LP | | Midstream gathering and processing MLP | | Reduced drilling activity lower commodity prices and negatively impacted non fee-based contracts |
| |
| |
| 2019 Annual Report| November 30, 2019 |
| |
| |
| |
| |
Total returns(as of November 30, 2019)
| Ticker | | Class | | 1 year | | 3 years | | 5 years | | Since inception(1) | | Gross expense ratio |
| MLPPX | | Institutional | | -0.83% | | -3.58% | | -6.68% | | 3.18% | | | 0.91% | |
| Alerian MLP Index(2) | | | | -11.00% | | -5.68% | | -9.56% | | 1.53% | | | — | |
| (1) | Reflects period from fund inception on September 9, 2010 through November 30, 2019. |
| (2) | The Alerian MLP Index is the leading gauge of energy infrastructure Master Limited Partnerships (MLPs). The capped, float-adjusted, capitalization-weighted index, whose constituents earn the majority of their cash flow from midstream activities involving energy commodities, is disseminated real-time on a price-return basis (AMZ) and on a total-return basis (AMZX). |
Fund statistics(as of November 30, 2019)
| | 1 year | | 3 years | | 5 years | | Since inception |
| Volatility* (Institutional Shares) | | 13.46% | | 13.67% | | 19.03% | | 15.83% |
| Volatility* (Alerian MLP Index) | | 18.89% | | 18.05% | | 25.14% | | 21.11% |
| Correlation (Institutional Shares) to Index | | 0.95 | | 0.94 | | 0.94 | | 0.93 |
| * | Standard deviation measures the dispersion of a set of data from its mean. Standard deviation is annualized based on daily total returns and indicates the volatility of a fund’s total returns. In general, the higher the standard deviation, the greater the volatility of return. |
Performance data quoted represents past performance; past performance does not guarantee future results. The investment return and principal value of an investment will fluctuate so that an investor’s shares, when redeemed, may be worth more or less than their original cost. Current performance of the portfolio may be lower or higher than the performance quoted. Performance data current to the most recent month end may be obtained by calling 855-TCA-FUND (855-822-3863).
| |
| |
| |
| |
| Tortoise |
| Select Opportunity Fund |
| |
Basic fund facts
Investment objective:Total return
Structure:Regulated investment company
| | Institutional | | A Class | | C Class |
| Ticker | | TOPIX | | | TOPTX | | | TOPCX | |
| Net expense ratio(1) | | 1.10% | | | 1.35% | | | 2.10% | |
| Redemption fee | | None | | | None | | | None | |
Maximum front-end
sales load | | None | (2) | | 5.50% | (3) | | None | (2) |
Maximum deferred
sales load | | None | | | None | (4) | | 1.00% | (5) |
| (1) | Tortoise has contractually agreed to limit total operating expenses (excluding acquired fund fees and expenses, brokerage commissions, leverage/borrowing interest, interest expense, taxes and extraordinary expenses) through 3/31/2020. Reimbursed expenses may be recouped for a period of thirty-six months if such recoupment can be achieved without exceeding these expense limits. |
| (2) | While the Institutional and C Classes have no front-end load, advisory and other expenses still apply. |
| (3) | You may qualify for sales charge discounts if you invest at least $50,000. |
| (4) | No front-end sales charge is payable on A Class investments of $1 million or more, although the fund may impose a Contingent Deferred Sales Charge (“CDSC”) of 1% on certain redemptions made within 12 months of purchase. |
| (5) | The C Class CDSC applies to redemptions made within 12 months of purchase. |
Top ten holdings(as of November 30, 2019)
| 1. | | Cheniere Energy, Inc. | | 7.5% |
| 2. | | Marathon Petroleum Corporation | | 6.7% |
| 3. | | NextEra Energy, Inc. | | 5.9% |
| 4. | | ConocoPhillips | | 5.5% |
| 5. | | Sempra Energy | | 5.4% |
| 6. | | Phillips 66 | | 5.1% |
| 7. | | Royal Dutch Shell - PLC | | 5.0% |
| 8. | | Enel SpA | | 3.6% |
| 9. | | TC Energy Corporation | | 3.1% |
| 10. | | Enterprise Products Partners L.P. | | 3.0% |
Targeted investment characteristics
The fund’s targeted investments generally will have the following characteristics:
| ● | 15 – 40 holdings across energy value chain |
| | |
| ● | Sector ranges will vary over time based on targeted catalyst and trend exposure |
| | |
| ● | Value chain segment and company specific exposure will fluctuate based on areas of highest conviction |
| Value of $1,000,000 vs. S&P 500®Index |
| Since inception on September 30, 2013 through November 30, 2019 |
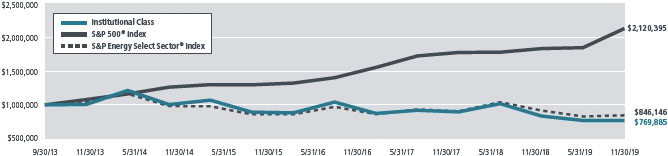 |
This chart illustrates the performance of a hypothetical $1,000,000 investment made on September 30, 2013 and is not intended to imply any future performance. The returns shown do not reflect the deduction of taxes that a shareholder would pay on fund distributions or the redemption of fund shares. The returns reflect fee waivers in effect. In the absence of such waivers, total return would be reduced. The chart assumes reinvestment of capital gains and dividends for a fund and dividends for the index.
The performance data quoted above represents past performance since inception on September 30, 2013 through November 30, 2019. Past performance is no guarantee of future results. The investment return and value of an investment will fluctuate so that an investor’s shares, when redeemed, may be worth more or less than their original cost. Current performance of the fund may be obtained through the most recent month-end by calling 855-TCA-FUND (855-822-3863). Future performance may be lower or higher than the performance stated above.
The S&P 500®Index is an unmanaged market-value weighted index of stocks, which is widely regarded as the standard for measuring large-cap U.S. stock market performance. Returns include reinvested dividends. You cannot invest directly in an index.
The S&P Energy Select Sector®Index is a modified market capitalization-based index of S&P 500 companies in the energy sector that develop and produce crude oil and natural gas and provide drilling and other energy related services. Returns include reinvested dividends. You cannot invest directly in an index.
| |
| |
| 2019 Annual Report| November 30, 2019 |
| |
| |
| |
| |
Performance was negative for the year as relatively high capital expenditures, corporate structure evolution, and increasing counterparty risk offset growing energy production, improved balance sheets and visibility to more return of capital to shareholders. Midstream energy returns were bifurcated with C-Corp pipelines in positive territory and MLPs negative as there was strong tax loss selling within MLPs during the month of November. In the fund, larger cap, higher quality, stable cash flow long-haul pipelines outperformed midstream companies focused on gathering and processing.
Our positive outlook for midstream remains as energy production growth continues and more capital is returned to shareholders. Our focus continues to be on midstream companies best positioned for continued growth in areas with the strongest production growth (supply push) as well exposure to growing export markets and products (demand pull) within the North American energy value chain.
Key asset performance drivers
| Top five contributors | | Company type | | Performance driver |
| Nextera Energy, Inc. | | Integrated infrastructure | | Highly visible growth from renewable buildout |
| Anadarko Petroleum Corporation | | Upstream oil and natural gas producer | | Occidental Petroleum offered premium to acquire all of the outstanding shares |
| Phillips 66 | | Downstream refiner | | Diversified business mix with large backlog of growth projects leading to high returns on capital employed |
| Valero Energy Corporation | | Downstream refiner | | Increased exports and International Maritime Organization (IMO) exposure and margin capture leading to improved earnings outlook |
| ONEOK, Inc | | Midstream natural gas/natural gas liquids pipeline company | | Continued execution of backlog of infrastructure projects with high returns |
| Bottom five contributors | | Company type | | Performance driver |
| Equitrans Midstream Corp. | | Midstream natural gas/natural gas liquids pipeline company | | Uncertainty around Mountain Valley Pipeline project |
| Concho Resources Inc. | | Upstream liquids producer | | Unexpected operational challenge tied to well spacing raised concerns about future growth |
| Diamondback Energy, Inc. | | Upstream oil and natural gas producer | | Operational miss combined with lower oil prices and lower growth |
| EOG Resources, Inc. | | Upstream liquids producer | | Negative investor sentiment surrounding exploration and production (E&P) companies given low price commodity environment |
| ConocoPillips | | Upstream natural gas producer | | Low absolute natural gas prices caused concerns for growth outlook of Marcellus producers |
| |
| |
| |
| |
| Tortoise |
| Select Opportunity Fund(continued) |
| |
Total returns(as of November 30, 2019)
| Ticker | | Class | | 1 year | | 3 years | | 5 years | | Since inception(1) | | Gross expense ratio |
| TOPIX | | Institutional | | -7.83% | | -9.55% | | -5.18% | | | -4.15% | | | | 1.40% | |
| TOPTX | | A Class (excluding load)(2) | | -8.00% | | -9.76% | | -5.44% | | | -4.40% | | | | 1.70% | |
| TOPTX | | A Class (maximum load)(2) | | -13.04% | | -11.44% | | -6.51% | | | -5.27% | | | | 1.70% | |
| TOPCX | | C Class (excluding CDSC) | | -8.66% | | -10.44% | | -6.12% | | | -5.09% | | | | 2.44% | |
| TOPCX | | C Class (including CDSC) | | -9.58% | | -10.44% | | -6.12% | | | -5.09% | | | | 2.44% | |
| S&P 500®Index(3) | | | | 16.11% | | 14.88% | | 10.98% | | | 12.96% | | | | — | |
S&P Energy Select
Sector®Index(4) | | | | -7.67% | | -4.49% | | -2.95% | | | -2.67% | | | | — | |
| (1) | Reflects period from fund inception on September 30, 2013 through November 30, 2019. |
| (2) | Prior to March 30, 2019, A Class Shares were known as Investor Class Shares. |
| (3) | The S&P 500®Index is an unmanaged market-value weighted index of stocks, which is widely regarded as the standard for measuring large-cap U.S. stock market performance. Returns include reinvested dividends. You cannot invest directly in an index. |
| (4) | The S&P Energy Select Sector®Index is a modified market capitalization-based index of S&P 500 companies in the energy sector that develop and produce crude oil and natural gas and provide drilling and other energy related services. Returns include reinvested dividends. You cannot invest directly in an index. |
Note: For periods over 1 year, performance reflected is for the average annual returns. Performance data shown for the A Class (maximum load) reflects a sales charge of 5.50%. Performance data shown “excluding load” does not reflect the deduction of the maximum sales load. Performance data shown for the C Class (including CDSC) reflects a contingent deferred sales charge (“CDSC”) of 1% for the first 12 months of investment. Performance data shown “excluding CDSC” does not reflect the deduction of the CDSC. If reflected, the load and CDSC would reduce the performance quoted. Investment performance reflects fee waivers in effect. In the absence of such waivers, total return would be reduced.
Performance data quoted represents past performance; past performance does not guarantee future results. The investment return and principal value of an investment will fluctuate so that an investor’s shares, when redeemed, may be worth more or less than their original cost. Current performance of the portfolio may be lower or higher than the performance quoted. Performance data current to the most recent month end may be obtained by calling 855-TCA-FUND (855-822-3863).
| |
| |
| 2019 Annual Report| November 30, 2019 |
| |
| |
| |
| |
Mutual fund investing involves risk. Principal loss is possible. The funds are non-diversified, meaning they may concentrate their assets in fewer individual holdings than a diversified fund. Therefore, the funds are more exposed to individual stock volatility than diversified funds. Investing in specific sectors such as North American energy may involve greater risk and volatility than less concentrated investments. Risks include, but are not limited to, risks associated with energy investments, including upstream energy companies, midstream companies, downstream companies, energy company beneficiaries, master limited partnerships (MLPs), MLP affiliates, commodity price volatility, supply and demand, regulatory, environmental, operating, capital markets, terrorism, natural disaster and climate change risks. The tax benefits received by an investor investing in the funds differ from that of a direct investment in an MLP by an investor. The value of the funds’ investments in an MLP will depend largely on the MLP’s treatment as a partnership for U.S. federal income tax purposes. If the MLP is deemed to be a corporation then its income would be subject to federal taxation, reducing the amount of cash available for distribution to the funds which could result in a reduction of the funds’ values. Investments in foreign companies involve risk not ordinarily associated with investments in securities and instruments of U.S. issuers, including risks related to political, social and economic developments abroad, differences between U.S. and foreign regulatory and accounting requirements, tax risk and market practices, as well as fluctuations in foreign currencies. The funds invest in large, small and mid-cap companies, which involve additional risks such as limited liquidity and greater volatility than larger companies. Investments in debt securities typically decrease in value when interest rates rise. This risk is usually greater for longer-term debt securities. Investment in lower-rated and non-rated securities presents a greater risk of lossto principal and interest than higher-rated securities. The funds may also write call options which may limit the funds’ abilities to profit from increases in the market value of a security, but cause it to retain the risk of loss should the price of the security decline. Some funds may invest in other derivatives including options, futures and swap agreements, which can be highly volatile, illiquid and difficult to value, and changes in the value of a derivative held by the funds may not correlate with the underlying instrument or the fund’s other investments and can include additional risks such as liquidity risk, leverage risk and counterparty risk that are possibly greater than risks associated with investing directly in the underlying investments. Some funds may engage in short sales and in doing so are subject to the risk that they may not always be able to borrow a security, or close out a short position at a particular time or at an acceptable price.
Nothing contained on this communication constitutes tax, legal, or investment advice. Investors must consult their tax advisor or legal counsel for advice and information concerning their particular situation.
This report reflects our views and opinions as of the date herein, which are subject to change at any time based on market and other conditions. We disclaim any responsibility to update these views. The views should not be relied on as investment advice or an indication of trading intent on behalf of the funds.
Fund holdings and allocations are subject to change at any time and should not be considered a recommendation to buy or sell any security. For a complete list of fund holdings, please refer to the fund’s Schedule of Investments in this report.
Expense example
As a shareholder of the Fund, you incur two types of costs: (1) transaction costs, including sales charges (loads) on purchase payments, reinvested dividends, or other distributions; exchange fees; and (2) ongoing costs, including management fees; distribution (12b-1) fees; and other Fund expenses. This example is intended to help you understand your ongoing costs (in dollars) of investing in the Fund and to compare these costs with the ongoing costs of investing in other mutual funds. The example is based on an investment of $1,000 invested at the beginning of the period and held for the entire period (June 1, 2019 – November 30, 2019).
Actual expenses
For each class, the first line of the table below provides information about actual account values and actual expenses. You may use the information in this line, together with the amount you invested, to estimate the expenses that you paid over the period. Simply divide your account value by $1,000 (for example, an $8,600 account value divided by $1,000 = 8.6), then multiply the result by the number in the first line under the heading entitled “Expenses Paid During Period” to estimate the expenses you paid on your account during this period.
Hypothetical example for comparison purposes
For each class, the second line of the table below provides information about hypothetical account values and hypothetical expenses based on the Fund’s actual expense ratio and an assumed rate of return of 5% per year before expenses, which is not the Fund’s actual return. The hypothetical account values and expenses may not be used to estimate the actual ending account balance or expenses you paid for the period. You may use this information to compare the ongoing costs of investing in the Fund and other funds. To do so, compare this 5% hypothetical example with the 5% hypothetical examples that appear in the shareholder reports of the other funds.
Please note that the expenses shown in the table are meant to highlight your ongoing costs only and do not reflect any transactional costs, such as redemption fees or exchange fees. Therefore, the second line of the table is useful in comparing ongoing costs only, and will not help you determine the relative total costs of owning different funds. In addition, if these transactional costs were included, your costs would have been higher.
| Tortoise MLP & Pipeline Fund | | | | | | | | | | | | | | | |
| | Beginning | | Ending | | Expenses Paid |
| | Account Value | | Account Value | | During Period(1) |
| | (06/01/2019) | | (11/30/2019) | | (06/01/2019 – 11/30/2019) |
| Institutional Class Actual(2) | | | $ | 1,000.00 | | | | $ | 939.60 | | | | $ | 4.52 | |
| Institutional Class Hypothetical (5% annual return before expenses) | | | $ | 1,000.00 | | | | $ | 1,020.41 | | | | $ | 4.71 | |
| A Class Actual(2) | | | $ | 1,000.00 | | | | $ | 938.30 | | | | $ | 5.73 | |
| A Class Hypothetical (5% annual return before expenses) | | | $ | 1,000.00 | | | | $ | 1,019.15 | | | | $ | 5.97 | |
| C Class Actual(2) | | | $ | 1,000.00 | | | | $ | 934.80 | | | | $ | 9.36 | |
| C Class Hypothetical (5% annual return before expenses) | | | $ | 1,000.00 | | | | $ | 1,015.39 | | | | $ | 9.75 | |
| (1) | Expenses are equal to the Fund’s annualized expense ratio for the most recent six-month period of 0.93%, 1.18%, and 1.93% for the Institutional Class, A Class and C Class, respectively, multiplied by the average account value over the period, multiplied by 183/365 to reflect the one-half year period. |
| (2) | Based on the actual returns for the six-month period ended November 30, 2019 of -6.04%, -6.17% and -6.52% for the Institutional Class, A Class and C Class, respectively. |
| |
| |
| 2019 Annual Report| November 30, 2019 |
| |
| |
| |
| |
Tortoise MLP & Energy Income Fund |
| | Beginning | | Ending | | Expenses Paid |
| | Account Value | | Account Value | | During Period(1) |
| | (06/01/2019) | | (11/30/2019) | | (06/01/2019 – 11/30/2019) |
| Institutional Class Actual(2) | | | $ | 1,000.00 | | | | $ | 962.50 | | | | $ | 5.76 | |
| Institutional Class Hypothetical (5% annual return before expenses) | | | $ | 1,000.00 | | | | $ | 1,019.20 | | | | $ | 5.92 | |
| A Class Actual(2) | | | $ | 1,000.00 | | | | $ | 961.10 | | | | $ | 6.98 | |
| A Class Hypothetical (5% annual return before expenses) | | | $ | 1,000.00 | | | | $ | 1,017.95 | | | | $ | 7.18 | |
| C Class Actual(2) | | | $ | 1,000.00 | | | | $ | 957.60 | | | | $ | 10.65 | |
| C Class Hypothetical (5% annual return before expenses) | | | $ | 1,000.00 | | | | $ | 1,014.19 | | | | $ | 10.96 | |
| (1) | Expenses are equal to the Fund’s annualized expense ratio for the most recent six-month period of 1.17%, 1.42%, and 2.17% for the Institutional Class, A Class and C Class, respectively, multiplied by the average account value over the period, multiplied by 183/365 to reflect the one-half year period. |
| (2) | Based on the actual returns for the six-month period ended November 30, 2019 of -3.75%, -3.89% and -4.24% for the Institutional Class, A Class and C Class, respectively. |
Tortoise MLP & Energy Infrastructure Fund |
| | Beginning | | Ending | | Expenses Paid |
| | Account Value | | Account Value | | During Period(1) |
| | (06/01/2019) | | (11/30/2019) | | (06/01/2019 – 11/30/2019) |
| Institutional Class Actual(2) | | | $ | 1,000.00 | | | | $ | 951.30 | | | | $ | 4.99 | |
| Institutional Class Hypothetical (5% annual return before expenses) | | | $ | 1,000.00 | | | | $ | 1,019.95 | | | | $ | 5.16 | |
| (1) | Expenses are equal to the Fund’s annualized expense ratio for the most recent six-month period of 1.02%, multiplied by the average account value over the period, multiplied by 183/365 to reflect the one-half year period. |
| (2) | Based on the actual returns for the six-month period ended November 30, 2019 of -4.87%. |
Tortoise Select Opportunity Fund |
| | Beginning | | Ending | | Expenses Paid |
| | Account Value | | Account Value | | During Period(1) |
| | (06/01/2019) | | (11/30/2019) | | (06/01/2019 – 11/30/2019) |
| Institutional Class Actual(2) | | | $ | 1,000.00 | | | | $ | 998.70 | | | | $ | 5.51 | |
| Institutional Class Hypothetical (5% annual return before expenses) | | | $ | 1,000.00 | | | | $ | 1,019.55 | | | | $ | 5.57 | |
| A Class Actual(2) | | | $ | 1,000.00 | | | | $ | 997.30 | | | | $ | 6.76 | |
| A Class Hypothetical (5% annual return before expenses) | | | $ | 1,000.00 | | | | $ | 1,018.30 | | | | $ | 6.83 | |
| C Class Actual(2) | | | $ | 1,000.00 | | | | $ | 994.50 | | | | $ | 10.50 | |
| C Class Hypothetical (5% annual return before expenses) | | | $ | 1,000.00 | | | | $ | 1,014.54 | | | | $ | 10.61 | |
| (1) | Expenses are equal to the Fund’s annualized expense ratio for the most recent six-month period of 1.10%, 1.35%, and 2.10% for the Institutional Class, A Class and C Class, respectively, multiplied by the average account value over the period, multiplied by 183/365 to reflect the one-half year period. |
| (2) | Based on the actual returns for the six-month period ended November 30, 2019 of -0.13%, -0.27% and -0.55% for the Institutional Class, A Class and C Class, respectively. |
| |
| |
| |
| |
| Tortoise MLP & Pipeline Fund |
| Schedule of Investments |
| November 30, 2019 |
| | | | | |
| | | Shares | | Fair Value |
| Common Stock — 77.4%(1) | | | | | |
| |
| Canadian Crude Oil Pipelines — 13.0%(1) |
| Enbridge Inc. | | 4,846,937 | | $ | 184,183,606 |
| Inter Pipeline Ltd. | | 7,163,274 | | | 118,641,894 |
| Pembina Pipeline Corporation | | 5,238,930 | | | 182,926,729 |
| | | | | 485,752,229 |
| | | | | | |
| Canadian Natural Gas/Natural Gas Liquids Pipelines — 10.5%(1) |
| Keyera Corp. | | 4,541,038 | | | 110,799,549 |
| TC Energy Corporation | | 5,564,975 | | | 283,424,177 |
| | | | | 394,223,726 |
| | | | | | |
| Monaco Marine Transportation — 0.2%(1) | | | | | |
| GasLog Partners LP | | 445,939 | | | 6,488,413 |
| | | | | | |
| United States Crude Oil Pipelines — 4.0%(1) | | | | | |
| Plains GP Holdings, L.P. | | 8,603,956 | | | 150,311,111 |
| | | | | | |
| United States Diversified Infrastructure — 5.3%(1) | | | | | |
| NextEra Energy, Inc. | | 346,676 | | | 81,059,782 |
| Sempra Energy | | 791,174 | | | 116,516,195 |
| | | | | 197,575,977 |
| | | | | | |
| United States Natural Gas Gathering/Processing — 10.5%(1) |
| Antero Midstream Corporation | | 9,790,575 | | | 44,840,833 |
| EnLink Midstream, LLC | | 5,667,325 | | | 26,919,794 |
| Equitrans Midstream Corporation | | 7,111,618 | | | 70,902,831 |
| Rattler Midstream LP | | 1,304,255 | | | 20,750,697 |
| Targa Resources Corp. | | 6,191,552 | | | 226,177,395 |
| | | | | 389,591,550 |
| | | | | | |
| United States Natural Gas/Natural Gas Liquids Pipelines — 33.9%(1) |
| Altus Midstream Company(2) | | 3,195,575 | | | 6,167,460 |
| Cheniere Energy, Inc.(2) | | 4,822,212 | | | 291,936,715 |
| Kinder Morgan, Inc. | | 15,649,397 | | | 306,884,675 |
| ONEOK, Inc. | | 4,466,541 | | | 317,347,738 |
| Tallgrass Energy LP | | 2,473,363 | | | 44,297,931 |
| The Williams Companies, Inc. | | 13,215,832 | | | 300,263,703 |
| | | | | 1,266,898,222 |
| Total Common Stock | | | | | |
| (Cost $2,970,413,707) | | | | | 2,890,841,228 |
| | | | | | |
| Master Limited Partnerships — 22.2%(1) | | | |
| | | | |
| United States Crude Oil Pipelines — 3.7%(1) | | | |
| BP Midstream Partners LP | | 1,426,079 | | | 20,820,754 |
| PBF Logistics LP | | 790,574 | | | 16,167,238 |
| Shell Midstream Partners, L.P. | | 5,142,255 | | | 101,096,733 |
| | | | | | 138,084,725 |
| |
| United States Natural Gas Gathering/Processing — 1.9%(1) |
| CNX Midstream Partners LP | | 593,902 | | | 8,611,579 |
| EQM Midstream Partners LP | | 331,220 | | | 7,674,367 |
| Noble Midstream Partners LP(3) | | 470,050 | | | 9,133,072 |
| Western Midstream Partners, LP | | 2,577,536 | | | 45,699,713 |
| | | | | | 71,118,731 |
| |
| United States Natural Gas/Natural Gas Liquids Pipelines — 8.6%(1) |
| Energy Transfer LP | | 13,718,861 | | | 162,019,748 |
| Enterprise Products Partners L.P. | | 5,959,446 | | | 156,852,619 |
| | | | | 321,872,367 |
| | | | | | |
| United States Other — 0.1%(1) | | | | | |
| Westlake Chemical Partners LP | | 205,381 | | | 4,557,404 |
| | | | |
| United States Refined Product Pipelines — 7.9%(1) | | | |
| Holly Energy Partners LP | | 851,706 | | | 19,044,146 |
| Magellan Midstream Partners, L.P. | | 1,619,353 | | | 94,683,570 |
| MPLX LP | | 4,458,093 | | | 105,433,900 |
| Phillips 66 Partners LP | | 1,386,196 | | | 77,252,703 |
| | | | | 296,414,319 |
| Total Master Limited Partnerships | | | | | |
| (Cost $887,247,202) | | | | | 829,047,546 |
| | | | |
| Short-Term Investment — 0.0%(1) | | | |
| | | | |
| United States Investment Company — 0.0%(1) | | | |
| First American Government Obligations Fund, | | | |
| Class X, 1.56%(4) | | | | | |
| (Cost $702) | | 702 | | | 702 |
| | | | | | |
| Total Investments — 99.6%(1) | | | | | |
| (Cost $3,857,661,611) | | | | | 3,719,889,476 |
| Other Assets in Excess of | | | | | |
| Liabilities, Net — 0.4%(1) | | | | | 14,330,759 |
| Total Net Assets — 100.0%(1) | | | | $ | 3,734,220,235 |
| (1) | Calculated as a percentage of net assets. |
| (2) | Non-income producing security. |
| (3) | Security is restricted from resale, considered illiquid and classified as a Level 2 security in the fair value hierarchy. Restricted securities have been fair valued in accordance with procedures approved by the Board of Trustees and have a total fair value of $9,133,072 which represents 0.2% of net assets. See Note 2 in Notes to the Financial Statements for further disclosure. |
| (4) | Rate indicated is the current yield as of November 30, 2019. |
| See accompanying Notes to Financial Statements. | |
| | |
| 20 | Tortoise |
| |
| |
| 2019 Annual Report| November 30, 2019 |
| |
| Tortoise MLP & Energy Income Fund |
| Schedule of Investments |
| November 30, 2019 |
| | | | | | |
| | | Principal | | | |
| | Amount/Shares | | Fair Value |
| Common Stock — 42.4%(1) | | | | | | |
| | | | |
| Canadian Crude Oil Pipelines — 5.6%(1) | | | |
| Enbridge Inc. | | | 1,057,963 | | $ | 40,202,594 |
| |
| Canadian Natural Gas Pipelines — 4.0%(1) | | | |
| TC Energy Corporation | | | 566,005 | | | 28,826,635 |
| |
| United States Crude Oil Pipelines — 4.4%(1) | | | |
| Plains GP Holdings L.P. | | | 1,812,645 | | | 31,666,908 |
| |
| United States Gathering and Processing — 1.6%(1) | | | |
| EnLink Midstream, LLC | | | 624,951 | | | 2,968,517 |
| Targa Resources Corp.(2) | | | 229,304 | | | 8,376,475 |
| | | | | | 11,344,992 |
| |
| United States Natural Gas Pipelines — 20.8%(1) | | | |
| Altus Midstream Company(3) | | | 1,085,500 | | | 2,095,015 |
| Cheniere Energy, Inc.(2)(3) | | | 460,485 | | | 27,877,762 |
| Kinder Morgan, Inc. | | | 1,412,933 | | | 27,707,616 |
| ONEOK, Inc.(2) | | | 495,564 | | | 35,209,823 |
| Tallgrass Energy LP | | | 1,315,577 | | | 23,561,984 |
| The Williams Companies, Inc.(2) | | | 1,477,172 | | | 33,561,348 |
| | | | | | 150,013,548 |
| |
| United States Power — 1.4%(1) | | | | | | |
| NextEra Energy Partners LP | | | 190,277 | | | 10,109,417 |
| |
| United States Refining — 4.6%(1) | | | | | | |
| Marathon Petroleum Corporation(2) | | | 264,410 | | | 16,033,822 |
| Valero Energy Corporation(2) | | | 178,875 | | | 17,080,774 |
| | | | | | 33,114,596 |
| Total Common Stock | | | | | | |
| (Cost $333,974,726) | | | | | | 305,278,690 |
| |
| Corporate Bonds — 29.5%(1) | | | | | | |
| | | | |
| Canadian Natural Gas Pipelines — 2.8%(1) | | | |
| Rockpoint Gas Storage Canada Ltd. | | | | | | |
| 7.000%, 03/31/2023(4) | | $ | 19,950,000 | | | 20,033,092 |
| |
| Marshall Island Marine Transportation — 2.0%(1) | | | |
| Teekay Corporation | | | | | | |
| 9.250%, 11/15/2022(4) | | | 2,500,000 | | | 2,619,530 |
| Teekay Offshore Partners LP / Teekay | | | | | | |
| Offshore Finance Corp. | | | | | | |
| 8.500%, 07/15/2023(4) | | | 11,550,000 | | | 11,583,668 |
| | | | | | 14,203,198 |
| |
| United States Crude Oil Pipelines — 3.4%(1) | | | |
| SemGroup Corp. / Rose Rock | | | | | | |
| Finance Corp. | | | | | | |
| 5.625%, 11/15/2023 | | | 6,390,000 | | | 6,568,377 |
| SemGroup Corporation | | | | | | |
| 7.250%, 03/15/2026 | | | 7,125,000 | | | 7,837,678 |
| 7.250%, 03/15/2026(4) | | | 9,150,000 | | | 10,065,229 |
| | | | | | 24,471,284 |
| | | | | |
| | Principal Amount | | |
| United States Gathering and Processing — 10.1%(1) | | | |
| Antero Midstream Partners LP / | | | | | | |
| Antero Midstream Finance Corp. | | | | | | |
| 5.750%, 03/01/2027(4) | | $ | 9,050,000 | | | 7,172,351 |
| Blue Racer Midstream LLC / Blue | | | | | | |
| Racer Finance Corp. | | | | | | |
| 6.125%, 11/15/2022(4) | | | 19,125,000 | | | 17,302,263 |
| EnLink Midstream, LLC | | | | | | |
| 5.375%, 06/01/2029 | | | 9,895,000 | | | 8,406,025 |
| EnLink Midstream Partners, LP | | | | | | |
| 4.850%, 07/15/2026 | | | 16,400,000 | | | 14,536,509 |
| Hess Infrastructure Partners LP / Hess | | | | | | |
| Infrastructure Partners Finance Corp. | | | | | | |
| 5.625%, 02/15/2026(4) | | | 8,750,000 | | | 9,120,322 |
| Targa Resources Partners LP / Targa | | | | | | |
| Resources Partners Finance Corp. | | | | | | |
| 6.750%, 03/15/2024 | | | 4,475,000 | | | 4,659,549 |
| 6.500%, 07/15/2027(4) | | | 10,875,000 | | | 11,626,327 |
| | | | | | | 72,823,346 |
| United States Natural Gas Pipelines — 4.9%(1) | | | |
| NGPL Pipeco LLC | | | | | | |
| 4.875%, 08/15/2027(4) | | | 1,100,000 | | | 1,167,507 |
| 7.768%, 12/15/2037(4) | | | 16,250,000 | | | 20,817,330 |
| ONEOK, Inc. | | | | | | |
| 4.550%, 07/15/2028 | | | 6,125,000 | | | 6,632,127 |
| Tallgrass Energy Partners LP / | | | | | | |
| Tallgrass Energy Finance Corp. | | | | | | |
| 5.500%, 01/15/2028(4) | | | 3,825,000 | | | 3,547,085 |
| The Williams Companies, Inc. | | | | | | |
| 3.750%, 06/15/2027 | | | 3,200,000 | | | 3,278,900 |
| | | | | | | 35,442,949 |
| United States Oil Field Services — 1.9%(1) | | | |
| Archrock Partners LP / Archrock | | | | | | |
| Partners Finance Corp. | | | | | | |
| 6.000%, 10/01/2022 | | | 1,575,000 | | | 1,583,366 |
| 6.875%, 04/01/2027(4) | | | 11,725,000 | | | 12,099,350 |
| | | | | | | 13,682,716 |
| United States Refining — 4.4%(1) | | | | | | |
| PBF Holding Co. LLC / PBF | | | | | | |
| Finance Corp. | | | | | | |
| 7.250%, 06/15/2025 | | | 30,400,000 | | | 32,223,696 |
| Total Corporate Bonds | | | | | | |
| (Cost $210,802,481) | | | | | | 212,880,281 |
| See accompanying Notes to Financial Statements. | |
| | |
| Tortoise | 21 |
| |
| |
| |
| |
| Tortoise MLP & Energy Income Fund |
| Schedule of Investments(continued) |
| November 30, 2019 |
| | | | | | |
| | Shares | | Fair Value |
| Master Limited Partnerships — 24.2%(1) | | | |
| | | | |
| United States Crude Oil Pipelines — 0.2%(1) | | | |
| PBF Logistics LP | | 86,036 | | $ | 1,759,436 |
| |
| United States Gathering and Processing — 1.9%(1) | | | |
| Noble Midstream Partners LP(5) | | 704,234 | | | 13,683,267 |
| |
| United States Natural Gas Pipelines — 9.8%(1) | | | |
| DCP Midstream, LP | | 508,412 | | | 10,732,577 |
| Energy Transfer LP | | 2,382,112 | | | 28,132,742 |
| Enterprise Products Partners, L.P. | | 1,209,715 | | | 31,839,699 |
| | | | | 70,705,018 |
| |
| United States Refined Product Pipelines — 12.3%(1) | | | |
| Magellan Midstream Partners, L.P. | | 560,650 | | | 32,781,205 |
| MPLX LP | | 1,182,541 | | | 27,967,095 |
| Phillips 66 Partners LP | | 496,720 | | | 27,682,206 |
| | | | | 88,430,506 |
| Total Master Limited Partnerships | | | | | |
| (Cost $183,351,160) | | | | | 174,578,227 |
| | | | | | |
| Short-Term Investments — 2.9%(1) | | | |
| | | | |
| United States Investment Companies — 2.9%(1) | | | |
| Fidelity Investments Treasury Portfolio, | | | | | |
| Institutional Class, 1.53%(6) | | 823,447 | | | 823,447 |
| First American Government | | | | | |
| Obligations Fund, | | | | | |
| Class X, 1.56%(6) | | 19,781,964 | | | 19,781,964 |
| (Cost $20,605,411) | | | | | 20,605,411 |
| |
| Total Investments — 99.0%(1) | | | | | |
| (Cost $748,733,778) | | | | | 713,342,609 |
| Other Assets in Excess of | | | | | |
| Liabilities, Net — 1.0%(1) | | | | | 7,424,116 |
| Total Net Assets — 100.0%(1) | | | | $ | 720,766,725 |
| (1) | Calculated as a percentage of net assets. |
| (2) | Security segregated as cover for open written option contracts. |
| (3) | Non-income producing security. |
| (4) | Security purchased within the terms of a private placement memorandum, except from registration under Rule 144A of the Securities Act 0f 1933, as amended, and may be sold only to dealers in that program or other “qualified institutional buyers.” As of November 30, 2019, the value of this investment was $127,154,054 or 17.6% of total net assets. |
| (5) | Security is restricted from resale, considered illiquid and classified as a Level 2 security in the fair value hierarchy. Restricted securities have been fair valued in accordance with procedures approved by the Board of Trustees and have a total fair value of $13,683,267 which represents 1.9% of net assets. See Note 2 in the Notes to the Financial Statements for further disclosure. |
| (6) | Rate indicated is the current yield as of November 30, 2019. |
Schedule of Options Written
November 30, 2019
| | | | Contracts | | | | Notional | | Exercise | | | |
| Description | | Call/Put | | Written | | Expiration Date | | Amount | | Price | | Fair Value |
| Cheniere Energy, Inc. | | Call | | | 3,476 | | | December 2019 | | $ | 21,043,704 | | | $ | 70 | | | $ | (20,856) |
| Marathon Petroleum Corporation | | Call | | | 2,644 | | | January 2020 | | | 16,033,216 | | | | 80 | | | | (11,898) |
| ONEOK, Inc. | | Call | | | 2,920 | | | January 2020 | | | 20,746,600 | | | | 75 | | | | (167,900) |
| Targa Resources Corp. | | Call | | | 747 | | | January 2020 | | | 2,728,791 | | | | 40 | | | | (41,085) |
| Targa Resources Corp. | | Call | | | 400 | | | January 2020 | | | 1,461,200 | | | | 41 | | | | (15,000) |
| Valero Energy Corporation | | Call | | | 1,788 | | | January 2020 | | | 17,073,612 | | | | 110 | | | | (30,396) |
| The Williams Companies, Inc. | | Call | | | 7,422 | | | January 2020 | | | 16,862,784 | | | | 26 | | | | (25,977) |
| | | | | | | | | | | | | | | | | | $ | (313,112) |
| See accompanying Notes to Financial Statements. | |
| | |
| 22 | Tortoise |
| |
| |
| 2019 Annual Report| November 30, 2019 |
| |
| Tortoise MLP & Energy Infrastructure Fund |
| Schedule of Investments |
| November 30, 2019 |
| | | | | | |
| | Principal | | | |
| | Amount/Shares | | Fair Value |
| Common Stock — 43.5%(1) | | | | | | |
| | | | |
| Canadian Crude Oil Pipelines — 5.8%(1) | | | |
| Enbridge Inc. | | | 115,159 | | $ | 4,376,042 |
| |
| Canadian Natural Gas Pipelines — 4.2%(1) | | | |
| TC Energy Corporation | | | 62,255 | | | 3,170,647 |
| |
| United States Crude Oil Pipelines — 4.5%(1) | | | |
| Plains GP Holdings LP | | | 197,815 | | | 3,455,828 |
| |
| United States Gathering and Processing — 1.6%(1) | | | |
| EnLink Midstream, LLC | | | 68,020 | | | 323,095 |
| Targa Resources Corp.(2) | | | 25,001 | | | 913,287 |
| | | | | | 1,236,382 |
| |
| United States Natural Gas Pipelines — 21.2%(1) | | | |
| Altus Midstream Company(3) | | | 67,255 | | | 129,802 |
| Cheniere Energy, Inc.(2)(3) | | | 50,385 | | | 3,050,308 |
| Kinder Morgan, Inc. | | | 144,155 | | | 2,826,879 |
| ONEOK, Inc.(2) | | | 54,136 | | | 3,846,363 |
| Tallgrass Energy LP | | | 143,756 | | | 2,574,670 |
| The Williams Companies, Inc.(2) | | | 161,471 | | | 3,668,621 |
| | | | | | 16,096,643 |
| |
| United States Power — 1.4%(1) | | | | | | |
| NextEra Energy Partners LP | | | 20,748 | | | 1,102,341 |
| United States Refining — 4.8%(1) | | | | | | |
| Marathon Petroleum Corporation(2) | | | 28,890 | | | 1,751,890 |
| Valero Energy Corporation(2) | | | 19,570 | | | 1,868,739 |
| | | | | | 3,620,629 |
| Total Common Stock | | | | | | |
| (Cost $39,689,808) | | | | | | 33,058,512 |
| |
| Corporate Bonds — 28.8%(1) | | | | | | |
| | | | | | | |
| Canadian Natural Gas Pipelines — 2.8%(1) | | | |
| Rockpoint Gas Storage Canada Ltd. | | | | | | |
| 7.000%, 03/31/2023(4) | | $ | 2,075,000 | | | 2,083,642 |
| |
| Marshall Island Marine Transportation — 1.8%(1) | | | |
| Teekay Corporation | | | | | | |
| 9.250%, 11/15/2022(4) | | | 200,000 | | | 209,563 |
| Teekay Offshore Partners LP / Teekay | | | | | | |
| Offshore Finance Corp. | | | | | | |
| 8.500%, 07/15/2023(4) | | | 1,150,000 | | | 1,153,352 |
| | | | | | 1,362,915 |
| |
| United States Crude Oil Pipelines — 3.4%(1) | | | |
| SemGroup Corp. / Rose Rock | | | | | | |
| Finance Corp. | | | | | | |
| 5.625%, 11/15/2023 | | | 510,000 | | | 524,237 |
| SemGroup Corporation | | | | | | |
| 7.250%, 03/15/2026(4) | | | 1,850,000 | | | 2,035,046 |
| | | | | | 2,559,283 |
| | | | | | |
| | | Principal Amount | | | |
| United States Gathering and Processing — 9.8%(1) | | | |
| Antero Midstream Partners LP / Antero | | | | | | |
| Midstream Finance Corp. | | | | | | |
| 5.750%, 03/01/2027(4) | | $ | 850,000 | | | 673,646 |
| Blue Racer Midstream LLC / Blue | | | | | | |
| Racer Finance Corp. | | | | | | |
| 6.125%, 11/15/2022(4) | | | 2,000,000 | | | 1,809,387 |
| EnLink Midstream, LLC | | | | | | |
| 5.375%, 06/01/2029 | | | 1,000,000 | | | 849,523 |
| EnLink Midstream Partners, LP | | | | | | |
| 4.850%, 07/15/2026 | | | 1,650,000 | | | 1,462,515 |
| Hess Infrastructure Partners LP / Hess | | | | | | |
| Infrastructure Partners Finance Corp. | | | | | | |
| 5.625%, 02/15/2026(4) | | | 950,000 | | | 990,206 |
| Targa Resources Partners LP / Targa | | | | | | |
| Resources Partners Finance Corp. | | | | | | |
| 6.750%, 03/15/2024 | | | 388,000 | | | 404,001 |
| 6.500%, 07/15/2027(4) | | | 1,187,000 | | | 1,269,007 |
| | | | | | 7,458,285 |
| |
| United States Natural Gas Pipelines — 4.8%(1) | | | |
| NGPL Pipeco LLC | | | | | | |
| 4.875%, 08/15/2027(4) | | | 300,000 | | | 318,411 |
| 7.768%, 12/15/2037(4) | | | 1,575,000 | | | 2,017,680 |
| ONEOK, Inc. | | | | | | |
| 4.550%, 07/15/2028 | | | 600,000 | | | 649,678 |
| Tallgrass Energy Partners LP / | | | | | | |
| Tallgrass Energy Finance Corp. | | | | | | |
| 5.500%, 01/15/2028(4) | | | 425,000 | | | 394,120 |
| The Williams Companies, Inc. | | | | | | |
| 3.750%, 06/15/2027 | | | 275,000 | | | 281,781 |
| | | | | | 3,661,670 |
| |
| United States Oil Field Services — 1.8%(1) | | | |
| Archrock Partners LP / Archrock | | | | | | |
| Partners Finance Corp. | | | | | | |
| 6.000%, 10/01/2022 | | | 100,000 | | | 100,531 |
| 6.875%, 04/01/2027(4) | | | 1,225,000 | | | 1,264,111 |
| | | | | | 1,364,642 |
| |
| United States Refining — 4.4%(1) | | | | | | |
| PBF Holding Co. LLC / PBF | | | | | | |
| Finance Corp. | | | | | | |
| 7.250%, 06/15/2025 | | | 3,175,000 | | | 3,365,468 |
| Total Corporate Bonds | | | | | | |
| (Cost $21,614,696) | | | | | | 21,855,905 |
| See accompanying Notes to Financial Statements. | |
| | |
| Tortoise | 23 |
| |
| |
| |
| |
| Tortoise MLP & Energy Infrastructure Fund |
| Schedule of Investments(continued) |
| November 30, 2019 |
| |
| | Shares | | Fair Value |
| Master Limited Partnerships — 24.4%(1) | | | | | |
| | | | | | |
| United States Crude Oil Pipelines — 0.3%(1) | | | | | |
| PBF Logistics LP | | 9,454 | | $ | 193,334 |
| | | | | | |
| United States Natural Gas Gathering/Processing — 1.9%(1) | | | | | |
| Noble Midstream Partners LP(5) | | 74,470 | | | 1,446,952 |
| | | | | | |
| United States Natural Gas Pipelines — 9.8%(1) | | | | | |
| DCP Midstream, LP | | 55,023 | | | 1,161,535 |
| Energy Transfer LP | | 252,983 | | | 2,987,729 |
| Enterprise Products Partners, L.P. | | 124,945 | | | 3,288,553 |
| | | | | 7,437,817 |
| | | | | | |
| United States Refined Product Pipelines — 12.4%(1) | | | | | |
| Magellan Midstream Partners, L.P. | | 57,045 | | | 3,335,421 |
| MPLX LP | | 129,156 | | | 3,054,539 |
| Phillips 66 Partners L.P | | 54,290 | | | 3,025,582 |
| | | | | 9,415,542 |
| Total Master Limited Partnerships | | | | | |
| (Cost $15,119,364) | | | | | 18,493,645 |
| | | | | | |
| Short-Term Investments — 2.8%(1) | | | | | |
| | | | | | |
| United States Investment Companies — 2.8%(1) | | | | | |
| Fidelity Investments Treasury Portfolio, | | | | | |
| Institutional Class, 1.53%(6) | | 98,891 | | | 98,891 |
| First American Government | | | | | |
| Obligations Fund, | | | | | |
| Class X, 1.56%(6) | | 2,038,013 | | | 2,038,014 |
| (Cost $2,136,905) | | | | | 2,136,905 |
| | | | | | |
| Total Investments — 99.5%(1) | | | | | |
| (Cost $78,560,773) | | | | | 75,544,967 |
| Other Assets in Excess of | | | | | |
| Liabilities, Net — 0.5%(1) | | | | | 364,920 |
| Total Net Assets — 100.0%(1) | | | | $ | 75,909,887 |
| (1) | Calculated as a percentage of net assets. |
| (2) | Security segregated as cover for open written option contracts. |
| (3) | Non-income producing security. |
| (4) | Security purchased within the terms of a private placement memorandum, except from registration under Rule 144A of the Securities Act 0f 1933, as amended, and may be sold only to dealers in that program or other “qualified institutional buyers.” As of November 30, 2019, the value of this investment was $14,218,171 or 18.7% of total net assets. |
| (5) | Security is restricted from resale, considered illiquid and classified as a Level 2 security in the fair value hierarchy. Restricted securities have been fair valued in accordance with procedures approved by the Board of Trustees and have a total fair value of $1,446,952 which represents 1.9% of net assets. See Note 2 in the Notes to the Financial Statements for further disclosure. |
| (6) | Rate indicated is the current yield as of November 30, 2019. |
Schedule of Options Written
November 30, 2019
| | | | Contracts | | | | Notional | | Exercise | | | | |
| Description | | Call/Put | | Written | | Expiration Date | | Amount | | Price | | Fair Value |
| Cheniere Energy, Inc. | | Call | | | 324 | | | December 2019 | | $ | 1,961,496 | | | $ | 70 | | | $ | (1,944 | ) |
| Marathon Petroleum Corporation | | Call | | | 288 | | | January 2020 | | | 1,746,432 | | | | 80 | | | | (1,296 | ) |
| ONEOK, Inc. | | Call | | | 293 | | | January 2020 | | | 2,081,765 | | | | 75 | | | | (16,847 | ) |
| Targa Resources Corp. | | Call | | | 72 | | | January 2020 | | | 263,016 | | | | 40 | | | | (3,960 | ) |
| Targa Resources Corp. | | Call | | | 54 | | | January 2020 | | | 197,262 | | | | 41 | | | | (2,025 | ) |
| Valero Energy Corporation | | Call | | | 195 | | | January 2020 | | | 1,862,055 | | | | 110 | | | | (3,315 | ) |
| The Williams Companies, Inc. | | Call | | | 713 | | | January 2020 | | | 1,619,936 | | | | 26 | | | | (2,496 | ) |
| | | | | | | | | | | | | | | | | | $ | (31,883 | ) |
| See accompanying Notes to Financial Statements. | |
| | |
| 24 | Tortoise |
| |
| |
| 2019 Annual Report| November 30, 2019 |
| |
| Tortoise Select Opportunity Fund |
| Schedule of Investments |
| November 30, 2019 |
| |
| | Shares | | Fair Value |
| Common Stock — 94.4%(1) | | | | | |
| | | | | | |
| Canadian Natural Gas/Natural Gas Liquids Pipelines — 3.0%(1) | | | | | |
| TC Energy Corporation | | 15,153 | | $ | 771,742 |
| Canadian Power — 5.7%(1) | | | | | |
| Algonquin Power & Utilities Corp. | | 51,733 | | | 725,579 |
| Innergex Renewable Energy Inc. | | 55,461 | | | 715,235 |
| | | | | 1,440,814 |
| | | | | | |
| Denmark Power — 2.8%(1) | | | | | |
| Orsted A/S | | 7,762 | | | 715,371 |
| | | | | | |
| France Power — 2.8%(1) | | | | | |
| Engie SA | | 45,753 | | | 723,707 |
| | | | | | |
| Germany Power — 2.8%(1) | | | | | |
| RWE AG | | 23,794 | | | 704,948 |
| | | | | | |
| Italy Power — 6.1%(1) | | | | | |
| Enel SpA | | 121,121 | | | 915,439 |
| Terna – Rete Elettrica Nazionale SpA | | 100,971 | | | 648,024 |
| | | | | 1,563,463 |
| | | | | | |
| Spain Power — 2.8%(1) | | | | | |
| Iberdrola, S.A. | | 72,421 | | | 712,455 |
| | | | | | |
| United States Diversified Infrastructure — 11.2%(1) | | | | | |
| NextEra Energy, Inc. | | 6,360 | | | 1,487,095 |
| Sempra Energy | | 9,226 | | | 1,358,713 |
| | | | | 2,845,808 |
| | | | | | |
| United States Natural Gas/Natural Gas Liquids Pipelines — 15.5%(1) | | | | | |
| Cheniere Energy, Inc.(2) | | 31,483 | | | 1,905,981 |
| Kinder Morgan, Inc. | | 38,632 | | | 757,573 |
| ONEOK, Inc. | | 10,719 | | | 761,585 |
| The Williams Companies, Inc. | | 22,279 | | | 506,179 |
| | | | | 3,931,318 |
| | | | | | |
| United States Oil & Gas Production — 16.3%(1) | | | | | |
| Chevron Corporation | | 5,432 | | | 636,250 |
| ConocoPhillips | | 22,990 | | | 1,378,021 |
| Equinor ASA – ADR | | 20,034 | | | 371,230 |
| Royal Dutch Shell PLC – ADR | | 21,909 | | | 1,259,549 |
| TOTAL S.A. – ADR | | 9,534 | | | 500,916 |
| | | | | 4,145,966 |
| | | | |
| United States Power — 11.2%(1) | | | | | |
| American Electric Power Company, Inc. | | 7,770 | | | 709,789 |
| Covanta Holding Corporation | | 48,708 | | | 716,495 |
| Exelon Corporation | | 15,982 | | | 709,601 |
| Public Service Enterprise Group | | | | | |
| Incorporated | | 11,856 | | | 703,179 |
| | | | | 2,839,064 |
| | | | | | |
| United States Refining — 14.2%(1) | | | | | |
| Marathon Petroleum Corporation | | 28,045 | | | 1,700,649 |
| Phillips 66 | | 11,138 | | | 1,277,751 |
| Valero Energy Corporation | | 6,605 | | | 630,712 |
| | | | | 3,609,112 |
| Total Common Stock | | | | | |
| (Cost $23,968,780) | | | | | 24,003,768 |
| | | | | | |
| Master Limited Partnerships — 4.9%(1) | | | | | |
| United States Natural Gas/Natural Gas Liquids Pipelines — 3.0%(1) | | | | | |
| Enterprise Products Partners L.P. | | 29,153 | | | 767,307 |
| | | | | | |
| United States Refined Product Pipelines — 1.9%(1) | | | | | |
| Magellan Midstream Partners, L.P. | | 8,411 | | | 491,791 |
| Total Master Limited Partnerships | | | | | |
| (Cost $1,294,459) | | | | | 1,259,098 |
| | | | | | |
| Short-Term Investment — 0.6%(1) | | | | | |
| United States Investment Company — 0.6%(1) | | | | | |
| First American Government Obligations Fund, | | | | | |
| Class X, 1.56%(3) | | | | | |
| (Cost $141,776) | | 141,776 | | | 141,776 |
| | | | | | |
| Total Investments — 99.9%(1) | | | | | |
| (Cost $25,405,015) | | | | | 25,404,642 |
| Other Assets in Excess of | | | | | |
| Liabilities, Net — 0.1%(1) | | | | | 24,673 |
| Total Net Assets — 100.0%(1) | | | | $ | 25,429,315 |
| (1) | Calculated as a percentage of net assets. |
| (2) | Non-income producing security. |
| (3) | Rate indicated is the current yield as of November 30, 2019. |
| | |
| ADR — American Depository Receipt |
| See accompanying Notes to Financial Statements. | |
| | |
| Tortoise | 25 |
| |
| |
| |
| |
| Statements of Assets & Liabilities |
| November 30, 2019 |
| |
| |
| | | | | | Tortoise MLP | | Tortoise MLP | | | | |
| | Tortoise MLP & | | & Energy | | & Energy | | Tortoise Select |
| | Pipeline Fund | | Income Fund | | Infrastructure Fund | | Opportunity Fund |
| Assets: | | | | | | | | | | |
| Investments, at fair value | | | | | | | | | | | | | | | | |
| (cost $3,857,661,611, $748,733,778, | | | | | | | | | | | | | | | | |
| $78,560,773 and $25,405,015, respectively) | | $ | 3,719,889,476 | | | $ | 713,342,609 | | | $ | 75,544,967 | | | $ | 25,404,642 | |
| Dividends & interest receivable | | | 4,562,751 | | | | 5,004,261 | | | | 518,901 | | | | 76,249 | |
| Receivable for investment securities sold | | | 36,116,331 | | | | — | | | | — | | | | — | |
| Receivable for capital shares sold | | | 15,515,707 | | | | 6,884,818 | | | | 5,084 | | | | 637 | |
| Receivable for Adviser expense reimbursement | | | — | | | | — | | | | 317 | | | | 31,492 | |
| Prepaid expenses and other assets | | | 75,989 | | | | 5,938 | | | | 3,438 | | | | 24,315 | |
| Total assets | | | 3,776,160,254 | | | | 725,237,626 | | | | 76,072,707 | | | | 25,537,335 | |
| Liabilities: | | | | | | | | | | | | | | | | |
| Written option contracts, at value | | | | | | | | | | | | | | | | |
| (premiums received $ —, $2,071,836, | | | | | | | | | | | | | | | | |
| $209,329 and $ —, respectively) | | | — | | | | 313,112 | | | | 31,883 | | | | — | |
| Payable for line of credit | | | 7,305,000 | | | | — | | | | — | | | | — | |
| Payable for capital shares redeemed | | | 31,237,625 | | | | 3,270,923 | | | | 20,104 | | | | 4,401 | |
| Payable for fund distributions | | | 1,120 | | | | 4,798 | | | | — | | | | — | |
| Payable to Adviser | | | 2,716,731 | | | | 598,226 | | | | 47,353 | | | | 15,260 | |
| Payable for fund administration & accounting fees | | | 234,208 | | | | 113,439 | | | | 16,293 | | | | 16,718 | |
| Payable for compliance fees | | | 1,752 | | | | 928 | | | | 928 | | | | 1,749 | |
| Payable for custody fees | | | 35,066 | | | | 1,350 | | | | — | | | | 1,014 | |
| Payable for audit & tax | | | 56,194 | | | | 28,905 | | | | 28,845 | | | | 47,596 | |
| Payable for transfer agent fees & expenses | | | 98,165 | | | | 55,420 | | | | 12,924 | | | | 8,601 | |
| Payable for interest expense | | | 1,928 | | | | — | | | | — | | | | — | |
| Accrued expenses | | | 136,963 | | | | 53,395 | | | | 4,490 | | | | 11,287 | |
| Accrued distribution fees | | | 115,267 | | | | 30,405 | | | | — | | | | 1,394 | |
| Total liabilities | | | 41,940,019 | | | | 4,470,901 | | | | 162,820 | | | | 108,020 | |
| Net Assets | | $ | 3,734,220,235 | | | $ | 720,766,725 | | | $ | 75,909,887 | | | $ | 25,429,315 | |
| Net Assets Consist of: | | | | | | | | | | | | | | | | |
| Capital Stock | | $ | 4,218,215,929 | | | $ | 959,348,960 | | | $ | 201,019,306 | | | $ | 55,116,088 | |
| Total distributable earnings (loss) | | | (483,995,694 | ) | | | (238,582,235 | ) | | | (125,109,419 | ) | | | (29,686,773 | ) |
| Net Assets | | $ | 3,734,220,235 | | | $ | 720,766,725 | | | $ | 75,909,887 | | | $ | 25,429,315 | |
| | | | | | | | | | | | | | | | | |
| | | | | | | | | | | | | | | | | |
| Institutional Class | | | | | | | | | | | | | | | | |
| Net Assets | | $ | 3,226,449,868 | | | $ | 628,295,348 | | | $ | 75,909,887 | | | $ | 21,748,357 | |
| Shares issued and outstanding(1) | | | 277,870,203 | | | | 93,253,392 | | | | 11,638,855 | | | | 2,888,521 | |
| Net asset value, redemption price and minimum | | | | | | | | | | | | | | | | |
| offering price per share | | $ | 11.61 | | | $ | 6.74 | | | $ | 6.52 | | | $ | 7.53 | |
| | | | | | | | | | | | | | | | | |
| A Class | | | | | | | | | | | | | | | | |
| Net Assets | | $ | 469,881,945 | | | $ | 45,492,427 | | | $ | — | | | $ | 2,349,240 | |
| Shares issued and outstanding(1) | | | 40,846,446 | | | | 6,625,081 | | | $ | — | | | | 314,382 | |
| Net asset value, redemption price and minimum | | | | | | | | | | | | | | | | |
| offering price per share | | $ | 11.50 | | | $ | 6.87 | | | $ | — | | | $ | 7.47 | |
| Maximum offering price per share(2) | | $ | 12.17 | | | $ | 7.27 | | | $ | — | | | $ | 7.90 | |
| | | | | | | | | | | | | | | | | |
| C Class | | | | | | | | | | | | | | | | |
| Net Assets | | $ | 37,888,422 | | | $ | 46,978,950 | | | $ | — | | | $ | 1,331,718 | |
| Shares issued and outstanding(1) | | | 3,325,617 | | | | 6,819,360 | | | $ | — | | | | 185,717 | |
| Net asset value, redemption price and minimum | | | | | | | | | | | | | | | | |
| offering price per share | | $ | 11.39 | | | $ | 6.89 | | | $ | — | | | $ | 7.17 | |
| (1) | Unlimited shares authorized. |
| (2) | The offering price is calculated by dividing the net asset value by 1 minus the maximum sales charge of 5.50%. |
| See accompanying Notes to Financial Statements. | |
| | |
| 26 | Tortoise |
| |
| |
| 2019 Annual Report| November 30, 2019 |
| |
| Statements of Operations |
| For the Year Ended November 30, 2019 |
| |
| |
| | | | | | Tortoise MLP | | Tortoise MLP | | | | |
| | Tortoise MLP & | | & Energy | | & Energy | | Tortoise Select |
| | Pipeline Fund | | Income Fund | | Infrastructure Fund | | Opportunity Fund |
| Investment Income: | | | | | | | | | | | | | | | | |
| Dividends and distributions from common stock | | $ | 180,152,332 | | | $ | 21,630,048 | | | $ | 4,187,603 | | | $ | 757,815 | |
| Distributions from master limited partnerships | | | 74,685,512 | | | | 15,001,790 | | | | 2,821,637 | | | | 119,761 | |
| Less: return of capital on distributions from investments | | | (168,663,921 | ) | | | (27,799,735 | ) | | | (5,335,909 | ) | | | (308,864 | ) |
| Less: foreign taxes withheld | | | (7,538,520 | ) | | | (524,240 | ) | | | (72,304 | ) | | | (2,597 | ) |
| Net dividends and distributions from investments | | | 78,635,403 | | | | 8,307,863 | | | | 1,601,027 | | | | 566,115 | |
| Dividends from money market mutual funds | | | 737,885 | | | | 326,133 | | | | 142,686 | | | | 5,456 | |
| Interest income | | | — | | | | 14,667,270 | | | | 2,538,712 | | | | — | |
| Total investment income | | | 79,373,288 | | | | 23,301,266 | | | | 4,282,425 | | | | 571,571 | |
| Expenses: | | | | | | | | | | | | | | | | |
| Advisory fees (See Note 6) | | | 34,692,348 | | | | 8,064,777 | | | | 1,137,108 | | | | 212,302 | |
| Fund administration & accounting fees (See Note 6) | | | 1,727,253 | | | | 714,855 | | | | 125,450 | | | | 103,972 | |
| Transfer agent fees & expenses (See Note 6) | | | 642,326 | | | | 348,459 | | | | 89,559 | | | | 53,024 | |
| Shareholder communication fees | | | 306,483 | | | | 101,767 | | | | 2,931 | | | | 3,872 | |
| Custody fees (See Note 6) | | | 210,844 | | | | 3,344 | | | | 1,565 | | | | 12,536 | |
| Registration fees | | | 181,475 | | | | 96,864 | | | | 34,879 | | | | 52,943 | |
| Audit & tax fees | | | 59,246 | | | | 28,947 | | | | 28,829 | | | | 50,150 | |
| Other | | | 38,068 | | | | 25,720 | | | | 8,127 | | | | 18,330 | |
| Trustee fees (See Note 6) | | | 19,719 | | | | 13,928 | | | | 10,832 | | | | 13,840 | |
| Legal fees | | | 10,596 | | | | 5,802 | | | | 8,594 | | | | 8,419 | |
| Compliance fees (See Note 6) | | | 10,314 | | | | 18,957 | | | | 6,207 | | | | 10,314 | |
| Distribution fees (See Note 7): | | | | | | | | | | | | | | | | |
| A Class | | | 1,234,899 | | | | 133,848 | | | | — | | | | 7,482 | |
| C Class | | | 456,028 | | | | 524,037 | | | | — | | | | 20,260 | |
| Total expenses before interest expense | | | | | | | | | | | | | | | | |
| on line of credit | | | 39,589,599 | | | | 10,081,305 | | | | 1,454,081 | | | | 567,444 | |
| Interest expense on line of credit (See Note 10) | | | 66,232 | | | | — | | | | — | | | | — | |
| Total expenses before reimbursement | | | 39,655,831 | | | | 10,081,305 | | | | 1,454,081 | | | | 567,444 | |
| Less: expense reimbursement by Adviser | | | — | | | | — | | | | (11,763 | ) | | | (264,958 | ) |
| Net expenses | | | 39,655,831 | | | | 10,081,305 | | | | 1,442,318 | | | | 302,486 | |
| Net Investment Income | | | 39,717,457 | | | | 13,219,961 | | | | 2,840,107 | | | | 269,085 | |
| Realized and Unrealized Gain (Loss) on Investments | | | | | | | | | | | | | | | | |
| and Translations of Foreign Currency | | | | | | | | | | | | | | | | |
| Net realized gain (loss) on: | | | | | | | | | | | | | | | | |
| Investments, including foreign currency gain (loss) | | | (118,356,314 | ) | | | (42,109,655 | ) | | | (30,858,694 | ) | | | (7,232,326 | ) |
| Written options contracts | | | — | | | | (3,514,653 | ) | | | (161,846 | ) | | | — | |
| Net change in unrealized appreciation (depreciation) of: | | | | | | | | | | | | | | | | |
| Investments and translations of foreign currency | | | 38,511,279 | | | | 24,377,535 | | | | 36,793,494 | | | | 4,113,782 | |
| Written options contracts | | | — | | | | 1,644,342 | | | | 66,831 | | | | — | |
| Net Realized and Unrealized Gain (Loss) on | | | | | | | | | | | | | | | | |
| Investments and Translations of Foreign Currency | | | (79,845,035 | ) | | | (19,602,431 | ) | | | 5,839,785 | | | | (3,118,544 | ) |
| Net Increase (Decrease) in Net Assets Resulting | | | | | | | | | | | | | | | | |
| from Operations | | $ | (40,127,578 | ) | | $ | (6,382,470 | ) | | $ | 8,679,892 | | | $ | (2,849,459 | ) |
| See accompanying Notes to Financial Statements. | |
| | |
| Tortoise | 27 |
| |
| |
| |
| |
| Statements of Changes in Net Assets |
| |
| |
| |
| | Tortoise MLP & Pipeline Fund | | Tortoise MLP & Energy Income Fund |
| | Year Ended | | Year Ended | | Year Ended | | Year Ended |
| | November 30, 2019 | | November 30, 2018 | | November 30, 2019 | | November 30, 2018 |
| Operations | | | | | | | | | | | | | | | | |
| Net investment income | | $ | 39,717,457 | | | $ | 39,678,602 | | | $ | 13,219,961 | | | $ | 8,515,100 | |
| Net realized loss on investments, written | | | | | | | | | | | | | | | | |
| options contracts and foreign currency | | | (118,356,314 | ) | | | (63,097,321 | ) | | | (45,624,308 | ) | | | (3,227,474 | ) |
| Net change in unrealized appreciation (depreciation) | | | | | | | | | | | | | | | | |
| of investments, written options contracts | | | | | | | | | | | | | | | | |
| and translations of foreign currency | | | 38,511,279 | | | | (71,468,426 | ) | | | 26,021,877 | | | | (43,922,466 | ) |
| Net decrease in net assets resulting | | | | | | | | | | | | | | | | |
| from operations | | | (40,127,578 | ) | | | (94,887,145 | ) | | | (6,382,470 | ) | | | (38,634,840 | ) |
| Capital Share Transactions | | | | | | | | | | | | | | | | |
| Institutional Class: | | | | | | | | | | | | | | | | |
| Proceeds from shares sold | | | 1,735,478,141 | | | | 2,057,563,357 | | | | 331,280,795 | | | | 439,701,041 | |
| Proceeds from reinvestment of distributions | | | 116,680,997 | | | | 91,861,649 | | | | 41,875,525 | | | | 43,613,402 | |
| Payments for shares redeemed | | | (1,985,311,239 | ) | | | (1,276,912,162 | ) | | | (423,416,384 | ) | | | (365,977,556 | ) |
| Proceeds from redemption fees | | | — | | | | — | | | | 64,051 | | | | 96,203 | |
| Increase (Decrease) in net assets from | | | | | | | | | | | | | | | | |
| Institutional Class transactions | | | (133,152,101 | ) | | | 872,512,844 | | | | (50,196,013 | ) | | | 117,433,090 | |
| A Class(1): | | | | | | | | | | | | | | | | |
| Proceeds from shares sold | | | 99,215,372 | | | | 272,254,175 | | | | 17,094,555 | | | | 26,404,884 | |
| Proceeds from reinvestment of distributions | | | 20,142,451 | | | | 15,715,327 | | | | 1,766,514 | | | | 2,119,107 | |
| Payments for shares redeemed | | | (95,709,057 | ) | | | (85,871,296 | ) | | | (23,666,932 | ) | | | (27,677,619 | ) |
| Proceeds from redemption fees | | | — | | | | — | | | | 18,653 | | | | 12,302 | |
| Increase (Decrease) in net assets from | | | | | | | | | | | | | | | | |
| A Class transactions | | | 23,648,766 | | | | 202,098,206 | | | | (4,787,210 | ) | | | 858,674 | |
| C Class: | | | | | | | | | | | | | | | | |
| Proceeds from shares sold | | | 8,742,459 | | | | 13,894,594 | | | | 12,441,343 | | | | 13,723,793 | |
| Proceeds from reinvestment of distributions | | | 1,273,399 | | | | 1,281,770 | | | | 2,060,859 | | | | 2,433,656 | |
| Payments for shares redeemed | | | (21,390,810 | ) | | | (19,609,310 | ) | | | (17,917,138 | ) | | | (21,941,448 | ) |
| Proceeds from redemption fees | | | — | | | | — | | | | 10,027 | | | | 9,459 | |
| Decrease in net assets from C Class transactions | | | (11,374,952 | ) | | | (4,432,946 | ) | | | (3,404,909 | ) | | | (5,774,540 | ) |
| Net increase (decrease) in net assets | | | | | | | | | | | | | | | | |
| resulting from capital share transactions | | | (120,878,287 | ) | | | 1,070,178,104 | | | | (58,388,132 | ) | | | 112,517,224 | |
| Distributions to Shareholders | | | | | | | | | | | | | | | | |
| From distributable earnings | | | | | | | | | | | | | | | | |
| Institutional Class | | | (54,033,930 | ) | | | (43,120,239 | ) | | | (1,078,191 | ) | | | (42,255,244 | ) |
| A Class(1) | | | (6,745,708 | ) | | | (5,867,041 | ) | | | (78,538 | ) | | | (3,060,819 | ) |
| C Class | | | (340,815 | ) | | | (523,295 | ) | | | (74,983 | ) | | | (2,865,644 | ) |
| From tax return of capital | | | | | | | | | | | | | | | | |
| Institutional Class | | | (99,340,629 | ) | | | (75,695,002 | ) | | | (63,519,356 | ) | | | (28,811,354 | ) |
| A Class(1) | | | (13,841,994 | ) | | | (10,299,240 | ) | | | (4,711,756 | ) | | | (2,089,883 | ) |
| C Class | | | (1,115,300 | ) | | | (918,612 | ) | | | (4,192,292 | ) | | | (1,953,577 | ) |
| Total distributions to shareholders | | | (175,418,376 | ) | | | (136,423,429 | ) | | | (73,655,116 | ) | | | (81,036,521 | ) |
| Total Increase (Decrease) in Net Assets | | | (336,424,241 | ) | | | 838,867,530 | | | | (138,425,718 | ) | | | (7,154,137 | ) |
| Net Assets | | | | | | | | | | | | | | | | |
| Beginning of year | | | 4,070,644,476 | | | | 3,231,776,946 | | | | 859,192,443 | | | | 866,346,580 | |
| End of year | | $ | 3,734,220,235 | | | $ | 4,070,644,476 | | | $ | 720,766,725 | | | $ | 859,192,443 | |
| (1) | Prior to March 30, 2019, A Class Shares of the MLP & Pipeline Fund were known as Investor Class Shares. |
| | |
| See accompanying Notes to Financial Statements. | |
| | |
| 28 | Tortoise |
| |
| |
| 2019 Annual Report| November 30, 2019 |
| |
| Statements of Changes in Net Assets(continued) |
| |
| | Tortoise MLP & Pipeline Fund | | Tortoise MLP & Energy Income Fund |
| | Year Ended | | Year Ended | | Year Ended | | Year Ended |
| | November 30, 2019 | | November 30, 2018 | | November 30, 2019 | | November 30, 2018 |
| Transactions in Shares: | | | | | | | | | | | | |
| Institutional Class: | | | | | | | | | | | | |
| Shares sold | | 140,773,462 | | | 155,439,492 | | | 45,267,457 | | | 52,334,913 | |
| Shares issued to holders in reinvestment | | | | | | | | | | | | |
| of dividends | | 9,729,012 | | | 7,245,786 | | | 5,824,325 | | | 5,401,253 | |
| Shares redeemed | | (160,919,033 | ) | | (97,882,557 | ) | | (58,583,809 | ) | | (44,358,142 | ) |
| Increase (Decrease) in Institutional Class | | | | | | | | | | | | |
| shares outstanding | | (10,416,559 | ) | | 64,802,721 | | | (7,492,027 | ) | | 13,378,024 | |
| A Class(1): | | | | | | | | | | | | |
| Shares sold | | 7,957,922 | | | 20,740,146 | | | 2,290,349 | | | 3,080,176 | |
| Shares issued to holders in reinvestment | | | | | | | | | | | | |
| of dividends | | 1,689,780 | | | 1,248,732 | | | 241,586 | | | 257,092 | |
| Shares redeemed | | (7,776,547 | ) | | (6,577,696 | ) | | (3,235,462 | ) | | (3,257,326 | ) |
| Increase (Decrease) in A Class shares outstanding | | 1,871,155 | | | 15,411,182 | | | (703,527 | ) | | 79,942 | |
| C Class: | | | | | | | | | | | | |
| Shares sold | | 734,617 | | | 1,065,832 | | | 1,665,205 | | | 1,600,826 | |
| Shares issued to holders in reinvestment | | | | | | | | | | | | |
| of dividends | | 106,172 | | | 103,970 | | | 280,410 | | | 294,859 | |
| Shares redeemed | | (1,785,450 | ) | | (1,511,922 | ) | | (2,419,130 | ) | | (2,574,899 | ) |
| Decrease in C Class shares outstanding | | (944,661 | ) | | (342,120 | ) | | (473,515 | ) | | (679,214 | ) |
| Net increase (decrease) in shares outstanding | | (9,490,065 | ) | | 79,871,783 | | | (8,669,069 | ) | | 12,778,752 | |
| (1) | Prior to March 30, 2019, A Class Shares for the MLP & Pipeline Fund were known as Investor Class Shares. |
| See accompanying Notes to Financial Statements. | |
| | |
| Tortoise | 29 |
| |
| |
| |
| |
| Statements of Changes in Net Assets(continued) |
| |
| | Tortoise MLP & Energy Infrastructure Fund | | Tortoise Select Opportunity Fund |
| | Year Ended | | Year Ended | | Year Ended | | Year Ended |
| | November 30, 2019 | | November 30, 2018 | | November 30, 2019 | | November 30, 2018 |
| Operations | | | | | | | | | | | | | | | | |
| Net investment income (loss) | | $ | 2,840,107 | | | $ | 4,004,472 | | | $ | 269,085 | | | $ | (145,489 | ) |
| Net realized gain (loss) on investments, | | | | | | | | | | | | | | | | |
| written options contracts and foreign currency | | | (31,020,540 | ) | | | (4,916,370 | ) | | | (7,232,326 | ) | | | 4,612,361 | |
| Net change in unrealized appreciation (depreciation) | | | | | | | | | | | | | | | | |
| of investments, written options contracts and | | | | | | | | | | | | | | | | |
| translations of foreign currency | | | 36,860,325 | | | | (13,566,718 | ) | | | 4,113,782 | | | | (6,261,788 | ) |
| Net increase (decrease) in net assets resulting | | | | | | | | | | | | | | | | |
| from operations | | | 8,679,892 | | | | (14,478,616 | ) | | | (2,849,459 | ) | | | (1,794,916 | ) |
| Capital Share Transactions | | | | | | | | | | | | | | | | |
| Institutional Class: | | | | | | | | | | | | | | | | |
| Proceeds from shares sold | | | 28,824,075 | | | | 42,883,068 | | | | 10,542,931 | | | | 17,736,308 | |
| Proceeds from reinvestment of distributions | | | 14,452,643 | | | | 26,577,283 | | | | — | | | | — | |
| Payments for shares redeemed | | | (227,497,717 | ) | | | (90,998,879 | ) | | | (19,258,055 | ) | | | (41,010,884 | ) |
| Proceeds from redemption fees | | | 11,367 | | | | — | | | | — | | | | — | |
| Decrease in net assets from Institutional | | | | | | | | | | | | | | | | |
| Class transactions | | | (184,209,632 | ) | | | (21,538,528 | ) | | | (8,715,124 | ) | | | (23,274,576 | ) |
| A Class(1): | | | | | | | | | | | | | | | | |
| Proceeds from shares sold | | | — | | | | — | | | | 480,956 | | | | 2,105,031 | |
| Proceeds from reinvestment of distributions | | | — | | | | — | | | | — | | | | — | |
| Payments for shares redeemed | | | — | | | | — | | | | (1,581,843 | ) | | | (2,336,506 | ) |
| Decrease in net assets from A Class transactions | | | — | | | | — | | | | (1,100,887 | ) | | | (231,475 | ) |
| C Class: | | | | | | | | | | | | | | | | |
| Proceeds from shares sold | | | — | | | | — | | | | 1,747,294 | | | | 1,238,282 | |
| Proceeds from reinvestment of distributions | | | — | | | | — | | | | — | | | | — | |
| Payments for shares redeemed | | | — | | | | — | | | | (2,056,386 | ) | | | (1,391,347 | ) |
| Decrease in net assets from C Class transactions | | | — | | | | — | | | | (309,092 | ) | | | (153,065 | ) |
| Net decrease in net assets resulting from | | | | | | | | | | | | | | | | |
| capital share transactions | | | (184,209,632 | ) | | | (21,538,528 | ) | | | (10,125,103 | ) | | | (23,659,116 | ) |
| Distributions to Shareholders | | | | | | | | | | | | | | | | |
| From distributable earnings | | | | | | | | | | | | | | | | |
| Institutional Class | | | (8,869,767 | ) | | | (17,751,685 | ) | | | — | | | | — | |
| A Class(1) | | | — | | | | — | | | | — | | | | — | |
| C Class | | | — | | | | — | | | | — | | | | — | |
| From tax return of capital | | | | | | | | | | | | | | | | |
| Institutional Class | | | (5,582,876 | ) | | | (8,879,368 | ) | | | — | | | | — | |
| A Class(1) | | | — | | | | — | | | | — | | | | — | |
| C Class | | | — | | | | — | | | | — | | | | — | |
| Total distributions to shareholders | | | (14,452,643 | ) | | | (26,631,053 | ) | | | — | | | | — | |
| Total Decrease in Net Assets | | | (189,982,383 | ) | | | (62,648,197 | ) | | | (12,974,562 | ) | | | (25,454,032 | ) |
| Net Assets | | | | | | | | | | | | | | | | |
| Beginning of year | | | 265,892,270 | | | | 328,540,467 | | | | 38,403,877 | | | | 63,857,909 | |
| End of year | | $ | 75,909,887 | | | $ | 265,892,270 | | | $ | 25,429,315 | | | $ | 38,403,877 | |
| (1) | Prior to March 30, 2019, A Class Shares for the Select Opportunity Fund were known as Investor Class Shares. |
| See accompanying Notes to Financial Statements. | |
| | |
| 30 | Tortoise |
| |
| |
| 2019 Annual Report| November 30, 2019 |
| |
| Statements of Changes in Net Assets(continued) |
| |
| | Tortoise MLP & Energy Infrastructure Fund | | Tortoise Select Opportunity Fund |
| | Year Ended | | Year Ended | | Year Ended | | Year Ended |
| | November 30, 2019 | | November 30, 2018 | | November 30, 2019 | | November 30, 2018 |
| Transactions in Shares: | | | | | | | | | | | | |
| Institutional Class: | | | | | | | | | | | | |
| Shares sold | | 4,072,546 | | | 5,279,703 | | | 1,358,682 | | | 1,843,044 | |
| Shares issued to holders in reinvestment | | | | | | | | | | | | |
| of dividends | | 2,031,608 | | | 3,376,303 | | | — | | | — | |
| Shares redeemed | | (31,200,191 | ) | | (11,820,080 | ) | | (2,509,009 | ) | | (4,184,435 | ) |
| Decrease in Institutional Class shares outstanding | | (25,096,037 | ) | | (3,164,074 | ) | | (1,150,327 | ) | | (2,341,391 | ) |
| A Class(1): | | | | | | | | | | | | |
| Shares sold | | — | | | — | | | 64,578 | | | 220,230 | |
| Shares issued to holders in reinvestment | | | | | | | | | | | | |
| of dividends | | — | | | — | | | — | | | — | |
| Shares redeemed | | — | | | — | | | (210,561 | ) | | (246,764 | ) |
| Decrease in A Class shares outstanding | | — | | | — | | | (145,983 | ) | | (26,534 | ) |
| C Class: | | | | | | | | | | | | |
| Shares sold | | — | | | — | | | 247,613 | | | 139,057 | |
| Shares issued to holders in reinvestment | | | | | | | | | | | | |
| of dividends | | — | | | — | | | — | | | — | |
| Shares redeemed | | — | | | — | | | (275,689 | ) | | (160,420 | ) |
| Decrease in C Class shares outstanding | | — | | | — | | | (28,076 | ) | | (21,363 | ) |
| Net decrease in shares outstanding | | (25,096,037 | ) | | (3,164,074 | ) | | (1,324,386 | ) | | (2,389,288 | ) |
| (1) | Prior to March 30, 2019, A Class Shares for the Select Opportunity Fund were known as Investor Class Shares. |
| See accompanying Notes to Financial Statements. | |
| | |
| Tortoise | 31 |
| |
| |
| |
| |
Tortoise MLP & Pipeline Fund
Financial Highlights |
| Institutional Class |
| | Year Ended | | Year Ended | | Year Ended | | Year Ended | | Year Ended |
| | November 30, | | November 30, | | November 30, | | November 30, | | November 30, |
| | 2019 | | 2018 | | 2017 | | 2016 | | 2015 |
| Per Common Share Data(1) | | | | | | | | | | | | | | | | | | | | | | | | | |
| Net asset value, beginning of year | | $ | 12.29 | | | | $ | 12.85 | | | | $ | 13.76 | | | | $ | 11.28 | | | | $ | 16.84 | | |
| Investment operations: | | | | | | | | | | | | | | | | | | | | | | | | | |
| Net investment income(2) | | | 0.14 | | | | | 0.16 | | | | | 0.15 | | | | | 0.21 | | (3) | | | 0.24 | | |
| Net realized and unrealized gain (loss) on investments | | | | | | | | | | | | | | | | | | | | | | | | | |
| and translations of foreign currency(2) | | | (0.26 | ) | | | | (0.26 | ) | | | | (0.64 | ) | | | | 2.59 | | | | | (5.37 | ) | |
| Total from investment operations | | | (0.12 | ) | | | | (0.10 | ) | | | | (0.49 | ) | | | | 2.80 | | | | | (5.13 | ) | |
| Less distributions from: | | | | | | | | | | | | | | | | | | | | | | | | | |
| Net investment income | | | (0.20 | ) | | | | (0.17 | ) | | | | (0.22 | ) | | | | (0.27 | ) | | | | (0.34 | ) | |
| Net realized gains | | | — | | | | | — | | | | | — | | | | | — | | | | | (0.02 | ) | |
| Return of capital | | | (0.36 | ) | | | | (0.29 | ) | | | | (0.20 | ) | | | | (0.05 | ) | | | | (0.07 | ) | |
| Total distributions | | | (0.56 | ) | | | | (0.46 | ) | | | | (0.42 | ) | | | | (0.32 | ) | | | | (0.43 | ) | |
| Net asset value, end of year | | $ | 11.61 | | | | $ | 12.29 | | | | $ | 12.85 | | | | $ | 13.76 | | | | $ | 11.28 | | |
| Total Return | | | (1.09 | ) | % | | | (0.88 | ) | % | | | (3.63 | ) | % | | | 25.62 | | % | | | (30.71 | ) | % |
| Supplemental Data and Ratios | | | | | | | | | | | | | | | | | | | | | | | | | |
| Net assets, end of year (in 000’s) | | $ | 3,226,450 | | | | $ | 3,544,401 | | | | $ | 2,872,704 | | | | $ | 2,213,434 | | | | $ | 1,242,133 | | |
| Ratio of expenses to average net assets | | | 0.93 | | % | | | 0.93 | | % | | | 0.96 | | % | | | 0.97 | | % | | | 0.99 | | % |
| Ratio of net investment income to average net assets | | | 1.01 | | % | | | 1.06 | | % | | | 1.17 | | % | | | 1.73 | | % | | | 1.71 | | % |
| Portfolio turnover rate | | | 19 | | % | | | 14 | | % | | | 15 | | % | | | 25 | | % | | | 34 | | % |
| (1) | For an Institutional Class Share outstanding for the entire period. |
| (2) | The per common share data for the years ended November 30, 2018, 2017, 2016 and 2015 do not reflect the change in estimate of investment income and return of capital. See Note 2 to the financial statements for further disclosure. |
| (3) | Per share amounts calculated using average shares method. |
| See accompanying Notes to Financial Statements. | |
| | |
| 32 | Tortoise |
| |
| |
| 2019 Annual Report| November 30, 2019 |
| |
Tortoise MLP & Pipeline Fund
Financial Highlights(continued) |
| A Class |
| | Year Ended | | Year Ended | | Year Ended | | Year Ended | | Year Ended |
| | November 30, | | November 30, | | November 30, | | November 30, | | November 30, |
| | 2019 | | 2018 | | 2017 | | 2016 | | 2015 |
| Per Common Share Data(1) | | | | | | | | | | | | | | | | | | | | | | | | | |
| Net asset value, beginning of year | | $ | 12.18 | | | | $ | 12.77 | | | | $ | 13.67 | | | | $ | 11.23 | | | | $ | 16.76 | | |
| Investment operations: | | | | | | | | | | | | | | | | | | | | | | | | | |
| Net investment income(2) | | | 0.11 | | | | | 0.06 | | | | | 0.13 | | | | | 0.18 | | (3) | | | 0.31 | | |
| Net realized and unrealized gain (loss) on investments | | | | | | | | | | | | | | | | | | | | | | | | | |
| and translations of foreign currency(2) | | | (0.26 | ) | | | | (0.22 | ) | | | | (0.64 | ) | | | | 2.56 | | | | | (5.45 | ) | |
| Total from investment operations | | | (0.15 | ) | | | | (0.16 | ) | | | | (0.51 | ) | | | | 2.74 | | | | | (5.14 | ) | |
| Less distributions from: | | | | | | | | | | | | | | | | | | | | | | | | | |
| Net investment income | | | (0.18 | ) | | | | (0.16 | ) | | | | (0.20 | ) | | | | (0.25 | ) | | | | (0.30 | ) | |
| Net realized gains | | | — | | | | | — | | | | | — | | | | | — | | | | | (0.02 | ) | |
| Return of capital | | | (0.35 | ) | | | | (0.27 | ) | | | | (0.19 | ) | | | | (0.05 | ) | | | | (0.07 | ) | |
| Total distributions | | | (0.53 | ) | | | | (0.43 | ) | | | | (0.39 | ) | | | | (0.30 | ) | | | | (0.39 | ) | |
| Net asset value, end of year | | $ | 11.50 | | | | $ | 12.18 | | | | $ | 12.77 | | | | $ | 13.67 | | | | $ | 11.23 | | |
| Total Return(4) | | | (1.38 | ) | % | | | (1.31 | ) | % | | | (3.81 | ) | % | | | 25.25 | | % | | | (30.90 | ) | % |
| Supplemental Data and Ratios | | | | | | | | | | | | | | | | | | | | | | | | | |
| Net assets, end of year (in 000’s) | | $ | 469,882 | | | | $ | 474,785 | | | | $ | 300,926 | | | | $ | 312,642 | | | | $ | 123,237 | | |
| Ratio of expenses to average net assets | | | 1.18 | | % | | | 1.18 | | % | | | 1.21 | | % | | | 1.22 | | % | | | 1.24 | | % |
| Ratio of net investment income to average net assets | | | 0.76 | | % | | | 0.81 | | % | | | 0.92 | | % | | | 1.48 | | % | | | 1.46 | | % |
| Portfolio turnover rate | | | 19 | | % | | | 14 | | % | | | 15 | | % | | | 25 | | % | | | 34 | | % |
| (1) | For an A Class Share outstanding for the entire period. Prior to March 30, 2019, A Class Shares were known as Investor Class Shares. |
| (2) | The per common share data for the years ended November 30, 2018, 2017, 2016 and 2015 do not reflect the change in estimate of investment income and return of capital. See Note 2 to the financial statements for further disclosure. |
| (3) | Per share amounts calculated using average shares method. |
| (4) | Total return does not reflect sales charges. |
| See accompanying Notes to Financial Statements. | |
| | |
| Tortoise | 33 |
| |
| |
| |
| |
| Tortoise MLP & Pipeline Fund |
| Financial Highlights(continued) |
| C Class |
| | | Year Ended | | Year Ended | | Year Ended | | Year Ended | | Year Ended |
| | November 30, | | November 30, | | November 30, | | November 30, | | November 30, |
| | 2019 | | 2018 | | 2017 | | 2016 | | 2015 |
| Per Common Share Data(1) | | | | | | | | | | | | | | | | | | | | | | | | | |
| Net asset value, beginning of year | | $ | 12.05 | | | | $ | 12.61 | | | | $ | 13.51 | | | | $ | 11.14 | | | | $ | 16.62 | | |
| Investment operations: | | | | | | | | | | | | | | | | | | | | | | | | | |
| Net investment income (loss)(2) | | | (0.01 | ) | | | | — | (3) | | | 0.02 | | | | | 0.08 | (4) | | | 0.12 | | |
| Net realized and unrealized gain (loss) on investments | | | | | | | | | | | | | | | | | | | | | | | | | |
| and translations of foreign currency(2) | | | (0.23 | ) | | | | (0.23 | ) | | | | (0.62 | ) | | | | 2.55 | | | | | (5.32 | ) | |
| Total from investment operations | | | (0.24 | ) | | | | (0.23 | ) | | | | (0.60 | ) | | | | 2.63 | | | | | (5.20 | ) | |
| Less distributions from: | | | | | | | | | | | | | | | | | | | | | | | | | |
| Net investment income | | | (0.15 | ) | | | | (0.12 | ) | | | | (0.16 | ) | | | | (0.22 | ) | | | | (0.19 | ) | |
| Net realized gains | | | — | | | | | — | | | | | — | | | | | — | | | | | (0.02 | ) | |
| Return of capital | | | (0.27 | ) | | | | (0.21 | ) | | | | (0.14 | ) | | | | (0.04 | ) | | | | (0.07 | ) | |
| Total distributions | | | (0.42 | ) | | | | (0.33 | ) | | | | (0.30 | ) | | | | (0.26 | ) | | | | (0.28 | ) | |
| Net asset value, end of year | | $ | 11.39 | | | | $ | 12.05 | | | | $ | 12.61 | | | | $ | 13.51 | | | | $ | 11.14 | | |
| Total Return(5) | | | (2.13 | ) | % | | | (1.89 | ) | % | | | (4.51 | ) | % | | | 24.37 | | % | | | (31.42 | ) | % |
| Supplemental Data and Ratios | | | | | | | | | | | | | | | | | | | | | | | | | |
| Net assets, end of year (in 000’s) | | $ | 37,888 | | | | $ | 51,458 | | | | $ | 58,147 | | | | $ | 60,170 | | | | $ | 48,928 | | |
| Ratio of expenses to average net assets | | | 1.93 | | % | | | 1.93 | | % | | | 1.96 | | % | | | 1.97 | | % | | | 1.99 | | % |
| Ratio of net investment income to average net assets | | | 0.01 | | % | | | 0.06 | | % | | | 0.17 | | % | | | 0.73 | | % | | | 0.71 | | % |
| Portfolio turnover rate | | | 19 | | % | | | 14 | | % | | | 15 | | % | | | 25 | | % | | | 34 | | % |
| (1) | For a C Class Share outstanding for the entire period. |
| (2) | The per common share data for the years ended November 30, 2018, 2017, 2016 and 2015 do not reflect the change in estimate of investment income and return of capital. See Note 2 to the financial statements for further disclosure. |
| (3) | Amount per share is less than $0.01. |
| (4) | Per share amounts calculated using average shares method. |
| (5) | Total return does not reflect sales charges. |
| See accompanying Notes to Financial Statements. | |
| | |
| 34 | Tortoise |
| |
| |
| 2019 Annual Report| November 30, 2019 |
| |
| Tortoise MLP & Energy Income Fund |
| Financial Highlights |
| Institutional Class |
| | | Year Ended | | Year Ended | | Year Ended | | Year Ended | | Year Ended |
| | November 30, | | November 30, | | November 30, | | November 30, | | November 30, |
| | 2019 | | 2018 | | 2017 | | 2016 | | 2015 |
| Per Common Share Data(1) | | | | | | | | | | | | | | | | | | | | | | | | | |
| Net asset value, beginning of year | | $ | 7.43 | | | | $ | 8.42 | | | | $ | 9.70 | | | | $ | 9.20 | | | | $ | 13.70 | | |
| Investment operations: | | | | | | | | | | | | | | | | | | | | | | | | | |
| Net investment income | | | 0.81 | | | | | 0.08 | (2) | | | 0.11 | (2) | | | 0.23 | (2) | | | 0.24 | (2) |
| Net realized and unrealized gain (loss) on investments | | | | | | | | | | | | | | | | | | | | | | | | | |
| and translations of foreign currency | | | (0.82 | ) | | | | (0.35 | ) | | | | (0.68 | ) | | | | 1.01 | | | | | (4.03 | ) | |
| Total from investment operations | | | (0.01 | ) | | | | (0.27 | ) | | | | (0.57 | ) | | | | 1.24 | | | | | (3.79 | ) | |
| Less distributions from: | | | | | | | | | | | | | | | | | | | | | | | | | |
| Net investment income | | | (0.01 | ) | | | | (0.43 | ) | | | | (0.16 | ) | | | | (0.25 | ) | | | | (0.22 | ) | |
| Net realized gains | | | — | | | | | — | | | | | — | | | | | — | | | | | — | | |
| Return of capital | | | (0.67 | ) | | | | (0.29 | ) | | | | (0.55 | ) | | | | (0.49 | ) | | | | (0.49 | ) | |
| Total distributions | | | (0.68 | ) | | | | (0.72 | ) | | | | (0.71 | ) | | | | (0.74 | ) | | | | (0.71 | ) | |
| Redemption fee proceeds | | | — | (3) | | | — | (2)(3) | | | — | (2)(3) | | | — | (2)(3) | | | — | (2)(3) |
| Net asset value, end of year | | $ | 6.74 | | | | $ | 7.43 | | | | $ | 8.42 | | | | $ | 9.70 | | | | $ | 9.20 | | |
| Total Return | | | (0.29 | ) | % | | | (3.66 | ) | % | | | (6.03 | ) | % | | | 14.93 | | % | | | (28.59 | ) | % |
| Supplemental Data and Ratios | | | | | | | | | | | | | | | | | | | | | | | | | |
| Net assets, end of year (in 000’s) | | $ | 628,295 | | | | $ | 748,415 | | | | $ | 735,670 | | | | $ | 733,365 | | | | $ | 592,034 | | |
| Ratio of expenses to average net assets | | | 1.17 | | % | | | 1.16 | | % | | | 1.14 | | % | | | 1.15 | | % | | | 1.15 | | % |
| Ratio of net investment income to average net assets | | | 1.68 | | % | | | 0.99 | | % | | | 1.23 | | % | | | 2.61 | | % | | | 1.93 | | % |
| Portfolio turnover rate | | | 48 | | % | | | 55 | | % | | | 30 | | % | | | 65 | | % | | | 37 | | % |
| (1) | For an Institutional Class Share outstanding for the entire period. |
| (2) | Per share amounts calculated using average shares method. |
| (3) | Amount per share is less than $0.01. |
| See accompanying Notes to Financial Statements. | |
| | |
| Tortoise | 35 |
| |
| |
| |
| |
| Tortoise MLP & Energy Income Fund |
| Financial Highlights(continued) |
| A Class |
| | | Year Ended | | Year Ended | | Year Ended | | Year Ended | | Year Ended |
| | November 30, | | November 30, | | November 30, | | November 30, | | November 30, |
| | 2019 | | 2018 | | 2017 | | 2016 | | 2015 |
| Per Common Share Data(1) | | | | | | | | | | | | | | | | | | | | | | | | | |
| Net asset value, beginning of year | | $ | 7.56 | | | | $ | 8.57 | | | | $ | 9.87 | | | | $ | 9.35 | | | | $ | 13.93 | | |
| Investment operations: | | | | | | | | | | | | | | | | | | | | | | | | | |
| Net investment income | | | 0.79 | | | | | 0.60 | (2) | | | 0.09 | (2) | | | 0.20 | (2) | | | 0.21 | (2) |
| Net realized and unrealized gain (loss) on investments | | | | | | | | | | | | | | | | | | | | | | | | | |
| and translations of foreign currency | | | (0.80 | ) | | | | (0.36 | ) | | | | (0.69 | ) | | | | 1.04 | | | | | (4.10 | ) | |
| Total from investment operations | | | (0.01 | ) | | | | (0.30 | ) | | | | (0.60 | ) | | | | 1.24 | | | | | (3.89 | ) | |
| Less distributions from: | | | | | | | | | | | | | | | | | | | | | | | | | |
| Net investment income | | | (0.01 | ) | | | | (0.42 | ) | | | | (0.16 | ) | | | | (0.24 | ) | | | | (0.21 | ) | |
| Net realized gains | | | — | | | | | — | | | | | — | | | | | — | | | | | — | | |
| Return of capital | | | (0.67 | ) | | | | (0.29 | ) | | | | (0.54 | ) | | | | (0.48 | ) | | | | (0.48 | ) | |
| Total distributions | | | (0.68 | ) | | | | (0.71 | ) | | | | (0.70 | ) | | | | (0.72 | ) | | | | (0.69 | ) | |
| Redemption fee proceeds | | | — | (3) | | | — | (2)(3) | | | — | (2)(3) | | | — | (2)(3) | | | — | (2)(3) |
| Net asset value, end of year | | $ | 6.87 | | | | $ | 7.56 | | | | $ | 8.57 | | | | $ | 9.87 | | | | $ | 9.35 | | |
| Total Return(4) | | | (0.41 | ) | % | | | (3.95 | ) | % | | | (6.26 | ) | % | | | 14.74 | | % | | | 28.82 | | % |
| Supplemental Data and Ratios | | | | | | | | | | | | | | | | | | | | | | | | | |
| Net assets, end of year (in 000’s) | | $ | 45,492 | | | | $ | 55,436 | | | | $ | 62,135 | | | | $ | 54,418 | | | | $ | 82,726 | | |
| Ratio of expenses to average net assets | | | 1.42 | | % | | | 1.41 | | % | | | 1.39 | | % | | | 1.40 | | % | | | 1.40 | | % |
| Ratio of net investment income to average net assets | | | 1.43 | | % | | | 0.74 | | % | | | 0.98 | | % | | | 2.36 | | % | | | 1.68 | | % |
| Portfolio turnover rate | | | 48 | | % | | | 55 | | % | | | 30 | | % | | | 65 | | % | | | 37 | | % |
| (1) | For an A Class Share outstanding for the entire period. |
| (2) | Per share amounts calculated using average shares method. |
| (3) | Amount per share is less than $0.01. |
| (4) | Total return does not reflect sales charges. |
| See accompanying Notes to Financial Statements. | |
| | |
| 36 | Tortoise |
| |
| |
| 2019 Annual Report| November 30, 2019 |
| |
| Tortoise MLP & Energy Income Fund |
| Financial Highlights(continued) |
| C Class |
| | | Year Ended | | Year Ended | | Year Ended | | Year Ended | | Year Ended |
| | November 30, | | November 30, | | November 30, | | November 30, | | November 30, |
| | 2019 | | 2018 | | 2017 | | 2016 | | 2015 |
| Per Common Share Data(1) | | | | | | | | | | | | | | | | | | | | | | | | | |
| Net asset value, beginning of year | | $ | 7.59 | | | | $ | 8.60 | | | | $ | 9.90 | | | | $ | 9.37 | | | | $ | 13.96 | | |
| Investment operations: | | | | | | | | | | | | | | | | | | | | | | | | | |
| Net investment income | | | 0.67 | | | | | — | (2)(3) | | | 0.02 | (3) | | | 0.14 | (3) | | | 0.12 | (3) |
| Net realized and unrealized gain (loss) on investments | | | | | | | | | | | | | | | | | | | | | | | | | |
| and translations of foreign currency | | | (0.75 | ) | | | | (0.37 | ) | | | | (0.69 | ) | | | | 1.04 | | | | | (4.12 | ) | |
| Total from investment operations | | | (0.08 | ) | | | | (0.37 | ) | | | | (0.67 | ) | | | | 1.18 | | | | | (4.00 | ) | |
| Less distributions from: | | | | | | | | | | | | | | | | | | | | | | | | | |
| Net investment income | | | (0.01 | ) | | | | (0.38 | ) | | | | (0.14 | ) | | | | (0.21 | ) | | | | (0.17 | ) | |
| Net realized gains | | | — | | | | | — | | | | | — | | | | | — | | | | | — | | |
| Return of capital | | | (0.61 | ) | | | | (0.26 | ) | | | | (0.49 | ) | | | | (0.44 | ) | | | | (0.42 | ) | |
| Total distributions | | | (0.62 | ) | | | | (0.64 | ) | | | | (0.63 | ) | | | | (0.65 | ) | | | | (0.59 | ) | |
| Redemption fee proceeds | | | — | (2) | | | — | (2)(3) | | | — | (2)(3) | | | — | (2)(3) | | | — | (2)(3) |
| Net asset value, end of year | | $ | 6.89 | | | | $ | 7.59 | | | | $ | 8.60 | | | | $ | 9.90 | | | | $ | 9.37 | | |
| Total Return(4) | | | (1.30 | ) | % | | | (4.64 | ) | % | | | (6.95 | ) | % | | | 13.89 | | % | | | (29.40 | ) | % |
| Supplemental Data and Ratios | | | | | | | | | | | | | | | | | | | | | | | | | |
| Net assets, end of year (in 000’s) | | $ | 46,979 | | | | $ | 55,341 | | | | $ | 68,541 | | | | $ | 92,873 | | | | $ | 98,460 | | |
| Ratio of expenses to average net assets | | | 2.17 | | % | | | 2.16 | | % | | | 2.14 | | % | | | 2.15 | | % | | | 2.15 | | % |
| Ratio of net investment income (loss) | | | | | | | | | | | | | | | | | | | | | | | | | |
| to average net assets | | | 0.68 | | % | | | (0.01 | ) | % | | | 0.23 | | % | | | 1.61 | | % | | | 0.93 | | % |
| Portfolio turnover rate | | | 48 | | % | | | 55 | | % | | | 30 | | % | | | 65 | | % | | | 37 | | % |
| (1) | For a C Class Share outstanding for the entire period. |
| (2) | Amount per share is less than $0.01. |
| (3) | Per share amounts calculated using average shares method. |
| (4) | Total return does not reflect sales charges. |
| See accompanying Notes to Financial Statements. | |
| | |
| Tortoise | 37 |
| |
| |
| |
| |
| Tortoise MLP & Energy Infrastructure Fund |
| Financial Highlights |
| Institutional Class |
| | | Year Ended | | Year Ended | | Year Ended | | Year Ended | | Year Ended |
| | November 30, | | November 30, | | November 30, | | November 30, | | November 30, |
| | 2019 | | 2018 | | 2017 | | 2016 | | 2015 |
| Per Common Share Data(1) | | | | | | | | | | | | | | | | | | | | | | | | | |
| Net asset value, beginning of year | | $ | 7.24 | | | | $ | 8.23 | | | | $ | 9.51 | | | | $ | 9.31 | | | | $ | 13.97 | | |
| Investment operations: | | | | | | | | | | | | | | | | | | | | | | | | | |
| Net investment income (loss) | | | (0.97 | ) | | | | 0.11 | (2) | | | | 0.13 | (2) | | | | 0.25 | (2) | | | | 0.26 | (2) | |
| Net realized and unrealized gain (loss) on investments | | | | | | | | | | | | | | | | | | | | | | | | | |
| and translations of foreign currency | | | 0.92 | | | | | (0.38 | ) | | | | (0.69 | ) | | | | 0.68 | | | | | (4.20 | ) | |
| Total from investment operations | | | (0.05 | ) | | | | (0.27 | ) | | | | (0.56 | ) | | | | 0.93 | | | | | (3.94 | ) | |
| Less distributions from: | | | | | | | | | | | | | | | | | | | | | | | | | |
| Net investment income | | | (0.41 | ) | | | | (0.48 | ) | | | | (0.27 | ) | | | | (0.25 | ) | | | | (0.20 | ) | |
| Net realized gains | | | — | | | | | — | | | | | — | | | | | — | | | | | — | | |
| Return of capital | | | (0.26 | ) | | | | (0.24 | ) | | | | (0.45 | ) | | | | (0.48 | ) | | | | (0.52 | ) | |
| Total distributions | | | (0.67 | ) | | | | (0.72 | ) | | | | (0.72 | ) | | | | (0.73 | ) | | | | (0.72 | ) | |
| Redemption fee proceeds | | | — | (3) | | | — | (2)(3) | | | — | (2)(3) | | | — | (2)(3) | | | — | (2)(3) |
| Net asset value, end of year | | $ | 6.52 | | | | $ | 7.24 | | | | $ | 8.23 | | | | $ | 9.51 | | | | $ | 9.31 | | |
| Total Return | | | (0.83 | ) | % | | | (3.71 | ) | % | | | (6.13 | ) | % | | | 11.45 | | % | | | (29.18 | ) | % |
| Supplemental Data and Ratios | | | | | | | | | | | | | | | | | | | | | | | | | |
| Net assets, end of year (in 000’s) | | $ | 75,910 | | | | $ | 265,892 | | | | $ | 328,540 | | | | $ | 432,631 | | | | $ | 429,246 | | |
| Ratio of expenses to average net assets: | | | | | | | | | | | | | | | | | | | | | | | | | |
| Before expense waiver | | | 0.95 | | % | | | 0.93 | | % | | | 0.90 | | % | | | 0.90 | | % | | | 0.94 | | % |
| After expense waiver | | | 0.94 | | % | | | 0.93 | | % | | | 0.90 | | % | | | 0.94 | | % | | | 1.00 | | % |
| Ratio of net investment income to average net assets: | | | | | | | | | | | | | | | | | | | | | | | | | |
| Before expense waiver | | | 1.79 | | % | | | 1.32 | | % | | | 1.42 | | % | | | 3.01 | | % | | | 2.23 | | % |
| After expense waiver | | | 1.80 | | % | | | 1.32 | | % | | | 1.42 | | % | | | 2.97 | | % | | | 2.17 | | % |
| Portfolio turnover rate | | | 75 | | % | | | 73 | | % | | | 28 | | % | | | 71 | | % | | | 29 | | % |
| (1) | For an Institutional Class Share outstanding for the entire period. |
| (2) | Per share amounts calculated using average shares method. |
| (3) | Amount per share is less than $0.01. |
| See accompanying Notes to Financial Statements. | |
| | |
| 38 | Tortoise |
| |
| |
| 2019 Annual Report| November 30, 2019 |
| |
| Tortoise Select Opportunity Fund |
| Financial Highlights |
| Institutional Class |
| | | Year Ended | | Year Ended | | Year Ended | | Year Ended | | Year Ended |
| | November 30, | | November 30, | | November 30, | | November 30, | | November 30, |
| | 2019 | | 2018 | | 2017 | | 2016 | | 2015 |
| Per Common Share Data(1) | | | | | | | | | | | | | | | | | | | | | | | | | |
| Net asset value, beginning of year | | $ | 8.17 | | | | $ | 9.00 | | | | $ | 10.22 | | | | $ | 8.83 | | | | $ | 9.95 | | |
| Investment operations: | | | | | | | | | | | | | | | | | | | | | | | | | |
| Net investment income (loss)(2) | | | 0.09 | | | | | (0.03 | ) | | | | (0.02 | ) | | | | 0.03 | | | | | 0.07 | | |
| Net realized and unrealized gain (loss) on investments | | | | | | | | | | | | | | | | | | | | | | | | | |
| and translations of foreign currency(2) | | | (0.73 | ) | | | | (0.80 | ) | | | | (1.16 | ) | | | | 1.41 | | | | | (1.17 | ) | |
| Total from investment operations | | | (0.64 | ) | | | | (0.83 | ) | | | | (1.18 | ) | | | | 1.44 | | | | | (1.10 | ) | |
| Less distributions from: | | | | | | | | | | | | | | | | | | | | | | | | | |
| Net investment income | | | — | | | | | — | | | | | (0.04 | ) | | | | (0.05 | ) | | | | (0.02 | ) | |
| Net realized gains | | | — | | | | | — | | | | | — | | | | | — | | | | | — | | |
| Total distributions | | | — | | | | | — | | | | | (0.04 | ) | | | | (0.05 | ) | | | | (0.02 | ) | |
| Net asset value, end of year | | $ | 7.53 | | | | $ | 8.17 | | | | $ | 9.00 | | | | $ | 10.22 | | | | $ | 8.83 | | |
| Total Return | | | (7.83 | ) | % | | | (9.22 | ) | | | | (11.57 | ) | | | | 16.52 | | % | | | (11.10 | ) | % |
| Supplemental Data and Ratios | | | | | | | | | | | | | | | | | | | | | | | | | |
| Net assets, end of year (in 000’s) | | $ | 21,748 | | | | $ | 32,984 | | | | $ | 57,431 | | | | $ | 38,363 | | | | $ | 35,030 | | |
| Ratio of expenses to average net assets: | | | | | | | | | | | | | | | | | | | | | | | | | |
| Before expense waiver | | | 2.16 | | % | | | 1.40 | | % | | | 1.42 | | % | | | 1.70 | | % | | | 1.66 | | % |
| After expense waiver | | | 1.10 | | % | | | 1.10 | | % | | | 1.10 | | % | | | 1.10 | | % | | | 1.10 | | % |
| Ratio of net investment income (loss) to average net assets: | | | | | | | | | | | | | | | | | | | | | | | | | |
| Before expense waiver | | | 0.13 | | % | | | (0.49 | ) | % | | | (0.52 | ) | % | | | 0.06 | | % | | | 0.22 | | % |
| After expense waiver | | | 1.19 | | % | | | (0.19 | ) | % | | | (0.20 | ) | % | | | 0.66 | | % | | | 0.78 | | % |
| Portfolio turnover rate | | | 124 | | % | | | 100 | | % | | | 105 | | %(3) | | | 168 | | % | | | 126 | | % |
| (1) | For an Institutional Class Share outstanding for the entire period. |
| (2) | The per common share data for the years ended November 30, 2018, 2017, 2016 and 2015 does not reflect the change in estimate of investment income and return of capital. See Note 2 to the financial statements for further disclosure. |
| (3) | Portfolio turnover excludes the purchases and sales of the Tortoise North American Energy Independence Fund (TNPTX) prior to the merger on June 16, 2017. If these transactions were included portfolio turnover would have been higher. |
| See accompanying Notes to Financial Statements. | |
| | |
| Tortoise | 39 |
| |
| |
|
| |
| Tortoise Select Opportunity Fund |
| Financial Highlights(continued) |
| A Class |
| | | Year Ended | | Year Ended | | Year Ended | | Year Ended | | Year Ended |
| | November 30, | | November 30, | | November 30, | | November 30, | | November 30, |
| | 2019 | | 2018 | | 2017 | | 2016 | | 2015 |
| Per Common Share Data(1) | | | | | | | | | | | | | | | | | | | | | | | | | |
| Net asset value, beginning of year | | $ | 8.12 | | | | $ | 8.98 | | | | $ | 10.19 | | | | $ | 8.80 | | | | $ | 9.93 | | |
| Investment operations: | | | | | | | | | | | | | | | | | | | | | | | | | |
| Net investment income (loss)(2) | | | 0.09 | | | | | (0.04 | ) | | | | (0.05 | ) | | | | 0.03 | | | | | 0.07 | | |
| Net realized and unrealized gain (loss) on investments | | | | | | | | | | | | | | | | | | | | | | | | | |
| and translations of foreign currency(2) | | | (0.74 | ) | | | | (0.82 | ) | | | | (1.14 | ) | | | | 1.38 | | | | | (1.19 | ) | |
| Total from investment operations | | | (0.65 | ) | | | | (0.86 | ) | | | | (1.19 | ) | | | | 1.41 | | | | | (1.12 | ) | |
| Less distributions from: | | | | | | | | | | | | | | | | | | | | | | | | | |
| Net investment income | | | — | | | | | — | | | | | (0.02 | ) | | | | (0.02 | ) | | | | (0.01 | ) | |
| Net realized gains | | | — | | | | | — | | | | | — | | | | | — | | | | | — | | |
| Total distributions | | | — | | | | | — | | | | | (0.02 | ) | | | | (0.02 | ) | | | | (0.01 | ) | |
| Net asset value, end of year | | $ | 7.47 | | | | $ | 8.12 | | | | $ | 8.98 | | | | $ | �� 10.19 | | | | $ | 8.80 | | |
| Total Return(3) | | | (8.00 | ) | % | | | (9.58 | ) | % | | | (11.67 | ) | % | | | 16.06 | | % | | | (11.34 | ) | % |
| Supplemental Data and Ratios | | | | | | | | | | | | | | | | | | | | | | | | | |
| Net assets, end of year (in 000’s) | | $ | 2,349 | | | | $ | 3,740 | | | | $ | 4,371 | | | | $ | 3,068 | | | | $ | 2,392 | | |
| Ratio of expenses to average net assets: | | | | | | | | | | | | | | | | | | | | | | | | | |
| Before expense waiver | | | 2.41 | | % | | | 1.70 | | % | | | 1.67 | | % | | | 1.95 | | % | | | 1.91 | | % |
| After expense waiver | | | 1.35 | | % | | | 1.35 | | % | | | 1.35 | | % | | | 1.35 | | % | | | 1.35 | | % |
| Ratio of net investment income (loss) to average net assets: | | | | | | | | | | | | | | | | | | | | | | | | | |
| Before expense waiver | | | (0.12 | ) | % | | | (0.79 | ) | % | | | (0.77 | ) | % | | | (0.19 | ) | % | | | (0.03 | ) | % |
| After expense waiver | | | 0.94 | | % | | | (0.44 | ) | % | | | (0.45 | ) | % | | | 0.41 | | % | | | 0.53 | | % |
| Portfolio turnover rate | | | 124 | | % | | | 100 | | % | | | 105 | | %(4) | | | 168 | | % | | | 126 | | % |
| (1) | For an A Class Share outstanding for the entire period. Prior to March 30, 2019, A Class Shares were known as Investor Class Shares. |
| (2) | The per common share data for the years ended November 30, 2018, 2017, 2016 and 2015 does not reflect the change in estimate of investment income and return of capital. See Note 2 to the financial statements for further disclosure. |
| (3) | Total return does not reflect sales charges. |
| (4) | Portfolio turnover excludes the purchases and sales of the Tortoise North American Energy Independence Fund (TNPTX) prior to the merger on June 16, 2017. If these transactions were included portfolio turnover would have been higher. |
| See accompanying Notes to Financial Statements. | |
| | |
| 40 | Tortoise |
| |
| |
| 2019 Annual Report| November 30, 2019 |
| |
| Tortoise Select Opportunity Fund |
| Financial Highlights(continued) |
| C Class |
| | | Year Ended | | Year Ended | | Year Ended | | Year Ended | | Year Ended |
| | November 30, | | November 30, | | November 30, | | November 30, | | November 30, |
| | 2019 | | 2018 | | 2017 | | 2016 | | 2015 |
| Per Common Share Data(1) | | | | | | | | | | | | | | | | | | | | | | | | | |
| Net asset value, beginning of year | | $ | 7.85 | | | | $ | 8.74 | | | | $ | 9.98 | | | | $ | 8.67 | | | | $ | 9.86 | | |
| Investment operations: | | | | | | | | | | | | | | | | | | | | | | | | | |
| Net investment income (loss)(2) | | | (0.01 | ) | | | | (0.15 | ) | | | | (0.04 | ) | | | | (0.03 | ) | | | | 0.04 | | |
| Net realized and unrealized gain (loss) on investments | | | | | | | | | | | | | | | | | | | | | | | | | |
| and translations of foreign currency(2) | | | (0.67 | ) | | | | (0.74 | ) | | | | (1.20 | ) | | | | 1.36 | | | | | (1.23 | ) | |
| Total from investment operations | | | (0.68 | ) | | | | (0.89 | ) | | | | (1.24 | ) | | | | 1.33 | | | | | (1.19 | ) | |
| Less distributions from: | | | | | | | | | | | | | | | | | | | | | | | | | |
| Net investment income | | | — | | | | | — | | | | | — | | | | | (0.02 | ) | | | | (— | ) | (3) |
| Net realized gains | | | — | | | | | — | | | | | — | | | | | — | | | | | — | | |
| Total distributions | | | — | | | | | — | | | | | — | | | | | (0.02 | ) | | | | (— | ) | (3) |
| Net asset value, end of year | | $ | 7.17 | | | | $ | 7.85 | | | | $ | 8.74 | | | | $ | 9.98 | | | | $ | 8.67 | | |
| Total Return(4) | | | (8.66 | ) | % | | | (10.18 | ) | % | | | (12.42 | ) | % | | | 15.41 | | % | | | (12.06 | ) | % |
| Supplemental Data and Ratios | | | | | | | | | | | | | | | | | | | | | | | | | |
| Net assets, end of year (in 000’s) | | $ | 1,332 | | | | $ | 1,679 | | | | $ | 2,056 | | | | $ | 1,379 | | | | $ | 1,151 | | |
| Ratio of expenses to average net assets: | | | | | | | | | | | | | | | | | | | | | | | | | |
| Before expense waiver | | | 3.15 | | % | | | 2.44 | | % | | | 2.42 | | % | | | 2.70 | | % | | | 2.66 | | % |
| After expense waiver | | | 2.10 | | % | | | 2.10 | | % | | | 2.10 | | % | | | 2.10 | | % | | | 2.10 | | % |
| Ratio of net investment income (loss) to average net assets: | | | | | | | | | | | | | | | | | | | | | | | | | |
| Before expense waiver | | | (0.87 | ) | % | | | (1.53 | ) | % | | | (1.52 | ) | % | | | (0.94 | ) | % | | | (0.78 | ) | % |
| After expense waiver | | | 0.19 | | % | | | (1.19 | ) | % | | | (1.20 | ) | % | | | (0.34 | ) | % | | | (0.22 | ) | % |
| Portfolio turnover rate | | | 124 | | % | | | 100 | | % | | | 105 | | %(5) | | | 168 | | % | | | 126 | | % |
| (1) | For a C Class Share outstanding for the entire period. |
| (2) | The per common share data for the years ended November 30, 2018, 2017, 2016 and 2015 does not reflect the change in estimate of investment income and return of capital. See Note 2 to the financial statements for further disclosure. |
| (3) | Amount per share is less than $0.01. |
| (4) | Total return does not reflect sales charges. |
| (5) | Portfolio turnover excludes the purchases and sales of the Tortoise North American Energy Independence Fund (TNPTX) prior to the merger on June 16, 2017. If these transactions were included portfolio turnover would have been higher. |
| See accompanying Notes to Financial Statements. | |
| | |
| Tortoise | 41 |
| |
| |
| |
| |
| Notes to Financial Statements |
| November 30, 2019 |
1. Organization
Managed Portfolio Series (the “Trust”) was organized as a Delaware statutory trust on January 27, 2011. The Trust is registered under the Investment Company Act of 1940, as amended (the “1940 Act”), as an open-end management investment company. The Tortoise MLP & Pipeline Fund (“MLP & Pipeline Fund”), the Tortoise MLP & Energy Income Fund (“MLP & Energy Income Fund”), the Tortoise MLP & Energy Infrastructure Fund (“MLP & Energy Infrastructure Fund”), and the Tortoise Select Opportunity Fund (“Select Opportunity Fund”), (or collectively, “the Funds”) are each a non-diversified series with their own investment objectives and policies within the Trust. The Trust has evaluated the structure, objective and activities of the Funds and determined that they meet the characteristics of an investment company. As such, these financial statements have applied the guidance as set forth in the Accounting Standards Codifications (“ASC”) 946, Financial Services Investment Companies.
The investment objective of the MLP & Pipeline Fund is total return. The MLP & Pipeline Fund seeks to achieve its objective by investing primarily in equity securities of master limited partnerships (“MLPs”) and pipeline companies that own and operate a network of energy infrastructure asset systems that transport, store, distribute, gather and/or process crude oil, refined petroleum products (including biodiesel and ethanol), natural gas or natural gas liquids. The MLP & Pipeline Fund commenced operations on May 31, 2011.
The investment objective of the MLP & Energy Income Fund is primarily to seek current income and secondarily to seek long-term capital appreciation. The MLP & Energy Income Fund primarily invests in equity and debt securities of MLPs focused in the energy infrastructure sector and in equity and debt securities of other companies focused in the energy infrastructure sector. The MLP & Energy Income Fund commenced operations on December 27, 2010.
The investment objective of the MLP & Energy Infrastructure Fund is primarily to seek current income and secondarily to seek long-term capital appreciation. The MLP & Energy Infrastructure Fund primarily invests in equity and debt securities of MLPs focused in the energy infrastructure sector and in equity and debt securities of other companies focused in the energy infrastructure sector. The MLP & Energy Infrastructure Fund commenced operations on September 9, 2010.
The investment objective of the Select Opportunity Fund is total return. The Select Opportunity Fund invests primarily in the securities of North American Energy companies or other companies that benefit from the operations of such North American energy companies. The Select Opportunity Fund seeks to achieve its objective by investing typically in 15 to 40 common stocks issued by companies of any capitalization that are publicly traded on an exchange or in the over-the-counter market. The Select Opportunity Fund commenced operations on September 30, 2013.
The MLP & Pipeline Fund, MLP & Energy Income Fund and the Select Opportunity Fund offer three classes of shares: the Institutional Class, the A Class and the C Class. The MLP & Energy Infrastructure Fund offers one class of shares: the Institutional Class. Institutional Class shares have no sales charge and are offered only to qualifying institutional investors and certain other qualifying accounts. A Class shares may be subject to a front-end sales charge of up to 5.50%, prior to November 15, 2019 the MLP & Pipeline Fund and the Select Opportunity Fund A class shares were subject to a front-end sales charge of up to 5.75%. C Class shares may be subject to a deferred sales charge of up to 1.00%.
2. Significant Accounting Policies
The following is a summary of significant accounting policies followed by the Funds in the preparation of its financial statements. These policies are in conformity with generally accepted accounting principles in the United States of America (“GAAP”).
Securities Valuation— All investments in securities are recorded at their estimated fair value, as described in Note 3.
Foreign Currency Translation— The books and records relating to the Funds’ non-U.S. dollar denominated investments are maintained in U.S. dollars on the following bases: (1) market value of investment securities, assets, and liabilities are translated at the current rate of exchange; and (2) purchases and sales of investment securities, income, and expenses are translated at the relevant rates of exchange prevailing on the respective dates of such transactions. The Funds do not isolate the portion of gains and losses on investments in equity securities that is due to changes in the foreign exchange rates from that which is due to changes in market prices of equity securities. The Funds report certain foreign currency-related transactions as components of realized gains for financial reporting purposes, whereas such components are treated as ordinary income for federal income tax purposes.
Federal Income Taxes— The Funds intend to meet the requirements of subchapter M of the Internal Revenue Code applicable to regulated investment companies and to distribute substantially all net taxable investment income and net realized gains to shareholders in a manner which results in no tax cost to the Funds. Therefore, no federal income or excise tax provision is required. As of November 30, 2019, the Funds did not have any tax positions that did not meet the “more-likely-than-not” threshold of being sustained by the applicable tax authority. The Funds recognize interest and penalties, if any, related to unrecognized tax benefits on uncertain tax positions as income tax expense in the Statements of Operations. During the period ended November 30, 2019, the Funds did not incur any interest or penalties. The Funds are subject to examination by U.S. taxing authorities for the tax years ended November 30, 2016 through 2019.
Securities Transactions, Income and Distributions— Securities transactions are accounted for on the date the securities are purchased or sold (trade date). Realized gains and losses are reported on a specific identified cost basis. Interest income is recognized on an accrual basis, including amortization of premiums and accretion of discounts. Dividend income and distributions are recorded on the ex-dividend date.
| |
| |
| 2019 Annual Report| November 30, 2019 |
| |
| Notes to Financial Statements(continued) |
| |
Withholding taxes on foreign dividends have been provided for in accordance with the Funds’ understanding of the applicable country’s tax rules and regulations. Distributions received from the Funds’ investments generally are comprised of ordinary income and return of capital. The Funds allocate distributions between investment income and return of capital based on estimates made at the time such distributions are received. Such estimates are based on information provided by each portfolio company and other industry sources. These estimates may subsequently be revised based on actual allocations received from the portfolio companies after their tax reporting periods are concluded, as the actual character of these distributions is not known until after the fiscal year end of the Funds.
During the year ended November 30, 2019, the MLP & Pipeline Fund reallocated the amount of 2018 investment income and return of capital it recognized based on the 2018 tax reporting information received from individual investments. This reclassification amounted to a decrease in net investment income of $7,462,595 or $0.023 per share, a decrease in unrealized depreciation of investments of $7,657,343 or $0.024 per share, and an increase in realized loss on investments of $194,748 or $0.001 per share for the year ended November 30, 2019.
During the year ended November 30, 2019, the MLP & Energy Income Fund reallocated the amount of cumulative realized gains and cost of investments reported based on the tax reporting information received from individual investments. This reclassification amounted to an increase in unrealized depreciation of investments of $12,568,209 or $0.118 per share, and a decrease in realized loss on investments of $12,568,209 or $0.118 per share for the year ended November 30, 2019.
During the year ended November 30, 2019, the MLP & Energy Infrastructure Fund reallocated the amount of cumulative realized gains and cost of investments reported based on the tax reporting information received from individual investments. This reclassification amounted to a decrease in unrealized appreciation of investments of $7,676,323 or $0.660 per share, and a decrease in realized loss on investments of $7,676,323 or $0.660 per share for the year ended November 30, 2019.
During the year ended November 30, 2019, the Select Opportunity Fund reallocated the amount of 2018 investment income and return of capital it recognized based on the 2018 tax reporting information received from individual investments. This reclassification amounted to an increase in net investment income of $35,082 or $0.010 per share, an increase in unrealized depreciation of investments of $21,539 or $0.006 per share, and an increase in realized loss on investments of $13,543 or $0.004 per share for the year ended November 30, 2019.
The Select Opportunity Fund distributes all net investment income, if any, and net realized capital gains, if any, annually in December. The MLP & Pipeline Fund will make distributions of net investment income, if any, semi-annually and net realized capital gains, if any, annually. The MLP & Energy Income Fund and the MLP & Energy Infrastructure Fund will make distributions of net investment income, if any, quarterly and net realized capital gains, if any, annually. Distributions to shareholders are recorded on the ex-dividend date. The treatment for financial reporting purposes of distributions made to shareholders during the year from net investment income or net realized capital gains may differ from their ultimate treatment for federal income tax purposes. These differences are caused primarily by differences in the timing of the recognition of certain components of income, expense or realized capital gain for federal income tax purposes. Where such differences are permanent in nature, GAAP requires that they be reclassified in the components of the net assets based on their ultimate characterization for federal income tax purposes. Any such reclassifications will have no effect on net assets, results of operations or net asset values per share of the Funds.
Reclassification of Capital Accounts— GAAP requires that certain components of net assets relating to permanent differences be reclassified between financial and tax reporting. These differences are caused primarily by differences in the timing of the recognition of certain components of income, expense or realized capital gain for federal income tax purposes. These reclassifications have no effect on net assets, results of operations or net asset value per share. For the year ended November 30, 2019, the following reclassifications were made:
| | Distributable | | | | |
| Fund | | Earnings (Losses) | | Paid-in Capital |
| MLP & Pipeline Fund | | $ | 21,375,891 | | $ | (21,375,891 | ) |
| MLP & Energy Income Fund* | | | 67,843,270 | | | (67,843,270 | ) |
| MLP & Energy Infrastructure Fund* | | | 19,133,273 | | | (19,133,273 | ) |
| Select Opportunity Fund | | | 79,647 | | | (79,647 | ) |
| * | Reclassifications include a one time prior period adjustment for certain temporary timing differences relating to MLPs. |
Use of Estimates— The preparation of financial statements in conformity with GAAP requires management to make estimates and assumptions that affect the reported amounts of assets and liabilities and disclosure of contingent assets and liabilities at the date of the financial statements and the reported amounts of revenues and expenses during the reporting period. Actual results could differ from those estimates.
Allocation of Income, Expenses and Gains/Losses— Income, expenses (other than those deemed attributable to a specific share class), and gains and losses of the Funds are allocated daily to each class of shares based upon the ratio of net assets represented by each class as a percentage of the net assets of each Fund. Expenses deemed directly attributable to a class of shares are recorded by the specific class. Most Fund expenses are allocated by class based on relative net assets. 12b-1 fees are expensed at 0.25% and 1.00% of average daily net assets of A Class shares and C Class shares, respectively. Trust expenses associated with a specific fund in the Trust are charged to that fund. Common Trust expenses are typically allocated evenly between the funds of the Trust, or by other equitable means.
Illiquid or Restricted Securities— A security may be considered illiquid if it lacks a readily available market. Securities are generally considered liquid if they can be sold or disposed of in the ordinary course of business within seven days at approximately the price at which the security is valued by the Funds. Illiquid securities may be valued under methods approved by the Board of Trustees as reflecting fair value. Each Fund will
| |
| |
| |
| |
| Notes to Financial Statements(continued) |
| |
| |
not hold more than 15% of the value of its net assets in illiquid securities. Certain restricted securities may be considered illiquid. Restricted securities are often purchased in private placement transactions, are not registered under the Securities Act of 1933, may have contractual restrictions on resale, and may be valued under methods approved by the Board of Trustees as reflecting fair value. At November 30, 2019, the Select Opportunity Fund did not hold any illiquid securities. At November 30, 2019, the MLP & Pipeline Fund, the MLP & Energy Income Fund, and the MLP & Energy Infrastructure Fund had investments in illiquid securities with a total value of $9,133,072 or 0.2% of total net assets, $13,683,267 or 1.9% of total net assets, and $1,446,952 or 1.9% of total net assets, respectively.
| Security | | Fund | | Shares | | Date Acquired | | Acquisition Cost |
| Noble Midstream Partners LP | | MLP & Pipeline Fund | | 470,050 | | 11/21/2019 | | $ | 9,730,035 |
| Noble Midstream Partners LP | | MLP & Energy Income Fund | | 704,234 | | 11/21/2019 | | | 14,577,644 |
| Noble Midstream Partners LP | | MLP & Energy Infrastructure Fund | | 74,470 | | 11/21/2019 | | | 1,541,529 |
Indemnifications— Under the Trust’s organizational documents, its officers and trustees are indemnified against certain liabilities arising out of the performance of their duties to the Trust. In addition, in the normal course of business, the Trust may enter into contracts that provide general indemnification to other parties. The Trust’s maximum exposure under these arrangements is unknown, as this would involve future claims that may be made against the Trust that have not yet occurred and may not occur. However, the Trust has not had prior claims or losses pursuant to these contracts and expects the risk of loss to be remote.
Cash and Cash Equivalents— Cash and cash equivalents include short-term, liquid investments with an original maturity of three months or less and include money market fund accounts.
3. Securities Valuation
The Funds have adopted fair value accounting standards, which establish an authoritative definition of fair value and set out a hierarchy for measuring fair value. These standards require additional disclosures about the various inputs and valuation techniques used to develop the measurements of fair value, a discussion of changes in valuation techniques and related inputs during the period and expanded disclosure of valuation levels for major security types. These inputs are summarized in the three broad levels listed below:
| Level 1 — | Quoted prices in active markets for identical assets or liabilities. |
| | |
| Level 2 — | Observable inputs other than quoted prices included in Level 1. These inputs may include quoted prices for similar instruments, interest rates, prepayment speeds, credit risk, yield curves, default rates and similar data. |
| | |
| Level 3 — | Significant unobservable inputs for the asset or liability, representing the Fund’s view of assumptions a market participant would use in valuing the asset or liability. |
Following is a description of the valuation techniques applied to each Fund’s major categories of assets and liabilities measured at fair value on a recurring basis. Each Fund’s investments are carried at fair value.
Common stock (including MLPs)— Securities that are primarily traded on a national securities exchange are valued at the last sale price on the exchange on which they are primarily traded on the day of valuation or, if there has been no sale on such day, at the mean between the bid and ask prices. Securities traded primarily on the Nasdaq Global Market System for which market quotations are readily available are valued using the Nasdaq Official Closing Price (“NOCP”). If the NOCP is not available, such securities are valued at the last sale price on the day of valuation, or if there has been no sale on such day, at the mean between the bid and ask prices. To the extent these securities are actively traded and valuation adjustments are not applied, they are categorized in Level 1 of the fair value hierarchy.
Corporate and Municipal Bonds— Corporate and municipal bonds, including listed issues, are valued at fair value on the basis of valuation furnished by an independent pricing service which utilized both dealer-supplied valuations and formula-based techniques. The pricing service may consider recently executed transactions in securities of the issuer or comparable issuers, market price quotations (where observable), bond spreads, and fundamental data relating to the issuer. Most corporate and municipal bonds are categorized in Level 2 of the fair value hierarchy.
Investment Companies— Investments in other mutual funds, including money market funds, are valued at their net asset value per share. To the extent these securities are actively traded and valuation adjustments are not applied, they are categorized in Level 1 of the fair value hierarchy.
Restricted Securities— Restricted securities are subject to statutory or contractual restrictions on their public resale, which may make it more difficult to obtain a valuation and may limit a Fund’s ability to dispose of them. Investments in private placement securities and other securities for which market quotations are not readily available are valued in good faith by using fair value procedures. Such fair value procedures may consider factors such as discounts to publicly traded issues and time until conversion date.
Derivative Instruments— Listed derivatives, including options, rights, warrants and futures that are actively traded are valued based on quoted prices from the exchange and categorized in Level 1 of the fair value hierarchy.
Securities for which market quotations are not readily available, or if the closing price does not represent fair value, are valued following procedures approved by the Board of Trustees. These procedures consider many factors, including the type of security, size of holding, trading volume and news events. There can be no assurance that the Funds could obtain the fair value assigned to a security if they were to sell the
| |
| |
| 2019 Annual Report| November 30, 2019 |
| |
| Notes to Financial Statements(continued) |
| |
| |
security at approximately the time at which the Funds determine their net asset value per share. The Board of Trustees has established a Valuation Committee to administer, implement, and oversee the fair valuation process, and to make fair value decisions when necessary. The Board of Trustees regularly reviews reports that describe any fair value determinations and methods.
The inputs or methodology used for valuing securities are not an indication of the risk associated with investing in those securities.
The following table is a summary of the inputs used to value each Fund’s securities by level within the fair value hierarchy as of November 30, 2019:
| MLP & Pipeline Fund | | Level 1 | | Level 2 | | Level 3 | | Total |
| Common stock | | $ | 2,890,841,228 | | | $ | — | | $ | — | | $ | 2,890,841,228 | |
| Master limited partnerships | | | 819,914,474 | | | | 9,133,072 | | | — | | | 829,047,546 | |
| Short-term investment | | | 702 | | | | — | | | — | | | 702 | |
| Total investments in securities | | $ | 3,710,756,404 | | | $ | 9,133,072 | | $ | — | | $ | 3,719,889,476 | |
| | | | | | | | | | | | | | |
| MLP & Energy Income Fund | | Level 1 | | Level 2 | | Level 3 | | Total |
| Common stock | | $ | 305,278,690 | | | $ | — | | $ | — | | $ | 305,278,690 | |
| Corporate bonds | | | — | | | | 212,880,281 | | | — | | | 212,880,281 | |
| Master limited partnerships | | | 160,894,960 | | | | 13,683,267 | | | — | | | 174,578,227 | |
| Short-term investments | | | 20,605,411 | | | | — | | | — | | | 20,605,411 | |
| Total investments in securities | | $ | 486,779,061 | | | $ | 226,563,548 | | $ | — | | $ | 713,342,609 | |
| | | | | | | | | | | | | | | |
| As of November 30, 2019, the Fund’s investments in other financial instruments* were classified as follows: |
| | | | | | | | | | | | | | | |
| Written Call Options | | $ | (313,112 | ) | | $ | — | | $ | — | | $ | (313,112 | ) |
| Total Other Financial Instruments | | $ | (313,112 | ) | | $ | — | | $ | — | | $ | (313,112 | ) |
| | | | | | | | | | | | | | | |
| MLP & Energy Infrastructure Fund | | Level 1 | | Level 2 | | Level 3 | | Total |
| Common stock | | $ | 33,058,512 | | | $ | — | | $ | — | | $ | 33,058,512 | |
| Corporate bonds | | | — | | | | 21,855,905 | | | — | | | 21,855,905 | |
| Master limited partnerships | | | 17,046,693 | | | | 1,446,952 | | | — | | | 18,493,645 | |
| Short-term investments | | | 2,136,905 | | | | — | | | — | | | 2,136,905 | |
| Total investments in securities | | $ | 52,242,110 | | | $ | 22,302,857 | | $ | — | | $ | 75,544,967 | |
| | | | | | | | | | | | | | | |
| As of November 30, 2019, the Fund’s investments in other financial instruments* were classified as follows: | |
| | | | | | | | | | | | | | | |
| Written Call Options | | $ | (31,883 | ) | | $ | — | | $ | — | | $ | (31,883 | ) |
| Total Other Financial Instruments | | $ | (31,883 | ) | | $ | — | | $ | — | | $ | (31,883 | ) |
| | | | | | | | | | | | | | | |
| *Other financial instruments are derivative instruments not reflected in the Schedule of Investments, such as futures and written options. |
| | | | | | | | | | | | | | | |
| Select Opportunity Fund | | Level 1 | | Level 2 | | Level 3 | | Total |
| Common stock | | $ | 20,299,195 | | | $ | 3,704,573 | | $ | — | | $ | 24,003,768 | |
| Master limited partnerships | | | 1,259,098 | | | | — | | | — | | | 1,259,098 | |
| Short-term investment | | | 141,776 | | | | — | | | — | | | 141,776 | |
| Total investments in securities | | $ | 21,700,069 | | | $ | 3,704,573 | | $ | — | | $ | 25,404,642 | |
Refer to each Fund’s Schedule of Investments for additional industry information.
4. Derivatives Transactions
The Funds may use derivatives for different purposes, such as a substitute for taking a position in the underlying asset and/or as part of a strategy designed to reduce exposure to other risks, such as interest rate or currency risk. The various derivative instruments that the Funds may use are options, futures contracts and options on futures contracts and other derivative securities. The Funds may also use derivatives for leverage, in which case their use would involve leveraging risk. A Fund investing in a derivative instrument could lose more than the principal amount invested.
FASB Accounting Standards Codification 815, Derivatives and Hedging (“ASC 815”) requires enhanced disclosures about each Fund’s use of, and accounting for, derivative instruments and the effect of derivative instruments on each Fund’s results of operations and financial position. Tabular disclosure regarding derivative fair value and gain/loss by contract type (e.g., interest rate contracts, foreign exchange contracts, credit contracts, etc.) is required and derivatives accounted for as hedging instruments under ASC 815 must be disclosed separately from those that do not qualify for hedge accounting. Even though the Funds may use derivatives in an attempt to achieve an economic hedge, the Funds’ derivatives are not accounted for as hedging instruments under ASC 815 because investment companies account for their derivatives at fair value and record any changes in fair value in current period earnings.
| |
| |
| |
| |
| Notes to Financial Statements(continued) |
| |
| |
For the year ended November 30, 2019, the Funds’ average quarterly notional values are as follows:
| | Purchased Option | | Written Option |
| Fund | | Contracts | | Contracts |
| MLP & Energy Income | | $ | — | | $ | (54,619,071 | ) |
| MLP & Energy Infrastructure | | $ | — | | $ | (7,365,052 | ) |
The locations on the Statements of Assets and Liabilities of the Funds’ derivative positions by type of exposure, all of which are not accounted for as hedging instruments under ASC 815, are as follows: Values of Derivative Instruments as of November 30, 2019, on the Statements of Assets and Liabilities:
| MLP & Energy Income |
| | Assets | | Liabilities |
| Derivatives not accounted for as | | | | | | | | | | | |
| hedging instruments under ASC 815 | | Location | | Fair Value | | Location | | | Fair Value | |
| | Written option contracts, | | | | | Written option contracts, | | | | |
| Equity Contracts – Written Options | | at fair value | | $ | — | | at fair value | | $ | (313,112 | ) |
| |
| MLP & Energy Infrastructure | | | | | | | | | | | |
| | Assets | | Liabilities |
| Derivatives not accounted for as | | | | | | | | | | | |
| hedging instruments under ASC 815 | | Location | | Fair Value | | Location | | | Fair Value | |
| | Written option contracts, | | | | | Written option contracts, | | | | |
| Equity Contracts – Written Options | | at fair value | | $ | — | | at fair value | | $ | (31,883 | ) |
The effect of Derivative Instruments on the Statements of Operations for the year ended November 30, 2019:
Amount of Realized Loss on Derivatives
| | MLP & Energy Income | | MLP & Energy Infrastructure |
| Derivatives not accounted for as | | | | | | | | | | | | |
| hedging instruments under ASC 815 | | | Written Options | | | | Written Options | |
| Equity Contracts | | | $ | (3,514,653 | ) | | | | $ | (161,846 | ) | |
| | | | | | | | | | | | | |
| Change in Unrealized Appreciation or (Depreciation) on Derivatives | |
| | | | | | | | | | | | | |
| | MLP & Energy Income | | MLP & Energy Infrastructure |
| Derivatives not accounted for as | | | | | | | | | | | | |
| hedging instruments under ASC 815 | | | Written Options | | | | Written Options | |
| Equity Contracts | | | $ | 1,644,342 | | | | | $ | 66,831 | | |
Balance Sheet Offsetting Information
The following table provides a summary of offsetting financial liabilities and derivatives and the effect of derivative instruments on the Statements of Assets and Liabilities as of November 30, 2019.
| MLP & Energy Income | | | | | | | | | | | | | | | | | | | | | | | | | | | | | | |
| | | | | | | | | | | | | | | | | Gross Amounts Not Offset in |
| | | | | | | | | | | | | | | | | Statements of Assets and Liabilities |
| | | | | | | Gross Amounts | | Net Amounts | | | | | | | | | | | | | | | |
| | | | | | | Offset in | | of Assets Presented | | | | | | | | | | | | | | | |
| | Gross Amounts | | Statements of | | in Statements of | | Financial | | Cash Collateral | | | | | |
| Liabilities: | | Recognized | | Assets and Liabilities | | Assets and Liabilities | | Instruments | | Pledged | | Net Amount |
| Written Option Contracts | | | $ | 313,112 | | | | $ | — | | | | $ | 313,112 | | | | $ | 313,112 | | | | $ | — | | | | $ | — | |
| | | | | | | | | | | | | | | | | | | | | | | | | | | | | | | |
| MLP & Energy Infrastructure | | | | | | | | | | | | | | | | | | | | | | | | | | | | | | |
| | | | | | | | | | | | | | | | | | Gross Amounts Not Offset in |
| | | | | | | | | | | | | | | | | Statements of Assets and Liabilities |
| | | | | | | Gross Amounts | | Net Amounts | | | | | | | | | | | | | | | |
| | | | | | | Offset in | | of Assets Presented | | | | | | | | | | | | | | | |
| | Gross Amounts | | Statements of | | in Statements of | | Financial | | Cash Collateral | | | | | |
| Liabilities: | | Recognized | | Assets and Liabilities | | Assets and Liabilities | | Instruments | | Pledged | | Net Amount |
| Written Option Contracts | | | $ | 31,883 | | | | $ | — | | | | $ | 31,883 | | | | $ | 31,883 | | | | $ | — | | | | $ | — | |
During the ordinary course of business, the Funds may enter into transactions subject to enforceable netting agreements or other similar arrangements (“netting agreements”). Generally, the right to offset in netting agreements allows the Funds to offset any exposure to a specific counterparty with any collateral received or delivered to that counterparty based on the terms of the agreement. Generally, each fund manages its cash collateral and securities collateral on a counterparty basis. As of November 30, 2019, the Funds did not enter into any netting agreements which would require any portfolio securities to be netted.
| |
| |
| 2019 Annual Report| November 30, 2019 |
| |
| Notes to Financial Statements(continued) |
| |
| |
5. Concentration Risk
The MLP & Pipeline Fund seeks to achieve its investment objective by investing, under normal market conditions, at least 80% of its net assets in securities of MLP and pipeline companies. Funds that primarily invest in a particular sector may experience greater volatility than funds investing in a broad range of industry sectors.
The MLP & Energy Income Fund and the MLP & Energy Infrastructure Fund seek to achieve their investment objective by investing, under normal market conditions, at least 80% of its net assets in securities of companies focused in the energy infrastructure sector. Funds that primarily invest in a particular sector may experience greater volatility than funds investing in a broad range of industry sectors.
The Select Opportunity Fund seeks to achieve its investment objective by investing, under normal market conditions, at least 80% of its net assets in securities of North American energy companies. Funds that primarily invest in a particular sector may experience greater volatility than funds investing in a broad range of industry sectors.
6. Investment Advisory Fee and Other Transactions with Affiliates
The Trust has an agreement with Tortoise Capital Advisors, L.L.C. (the “Adviser”) to furnish investment advisory services to the Funds. Pursuant to an Investment Advisory Agreement between the Trust and the Adviser, the Adviser is entitled to receive, on a monthly basis, an annual advisory fee equal to 0.75% for the MLP & Energy Infrastructure Fund, 0.85% for the MLP & Pipeline Fund and the Select Opportunity Fund, and 1.00% for the MLP & Energy Income Fund of each Fund’s average daily net assets.
The Funds’ Adviser has contractually agreed to reimburse the Fund for its expenses to ensure that total annual operating expenses (excluding Rule 12b-1 fees, acquired fund fees and expenses, interest, taxes, brokerage commissions and extraordinary expenses) for each Fund do not exceed 1.10% for the MLP & Pipeline Fund and the Select Opportunity Fund, 1.25% for the MLP & Energy Income Fund and 1.00% for the MLP & Energy Infrastructure Fund of the average daily net assets of each Fund. Expenses reimbursed by the Adviser may be recouped by the Adviser for a period of thirty-six months following the date on which such reimbursement was made if such recoupment can be achieved without exceeding the expense limit in effect at the time the expense reimbursement occurred and at the time of recoupment. The Operating Expense Limitation Agreement is intended to be continual in nature and cannot be terminated within a year after the effective date of the Fund’s prospectus. During the year ended November 30, 2019, the Adviser did not recoup any previously reimbursed fees. Reimbursed expenses subject to potential recovery by month of expiration are as follows:
| MLP & Energy Infrastructure Fund | | | | Select Opportunity Fund | | |
| December 2019 – November 2020 | | $ | — | | December 2019 – November 2020 | | $ | 176,920 |
| December 2020 – November 2021 | | | — | | December 2020 – November 2021 | | | 180,617 |
| December 2021 – November 2022 | | | 11,763 | | December 2021 – November 2022 | | | 264,958 |
U.S. Bancorp Fund Services, LLC, doing business as U.S. Bank Global Fund Services (“Fund Services” or the “Administrator”) acts as the Funds’ Administrator, Transfer Agent and fund accountant. U.S. Bank, N.A. (the “Custodian”) serves as the custodian to the Funds. The Custodian is an affiliate of the Administrator. The Administrator performs various administrative and accounting services for the Funds. The Administrator prepares various federal and state regulatory filings, reports and returns for the Funds; prepares reports and materials to be supplied to the Trustees; monitors the activities of the Funds’ custodian; coordinates the payment of the Funds’ expenses and reviews the Funds’ expense accruals. The officers of the Trust including the Chief Compliance Officer are employees of the Administrator. As compensation for its services, the Administrator is entitled to a monthly fee at an annual rate of 0.07% of the first $125 million of the average daily net assets of each fund, 0.05% on the next $250 million of the average daily net assets and 0.0325% of the daily average net assets in excess of $375 million, subject to an annual minimum of $60,000 per fund. Fees paid by the Funds for administration and accounting, transfer agency, custody and compliance services for the year ended November 30, 2019 are disclosed in the Statements of Operations.
Quasar Distributors, LLC (the “Distributor”) acts as the Funds’ principal underwriter in a continuous public offering of the Funds’ shares. The Distributor is an affiliate of the Administrator.
7. Distribution Costs
The MLP & Pipeline Fund, MLP & Energy Income Fund and the Select Opportunity Fund have adopted a Distribution Plan pursuant to Rule 12b-1 (the “Plan”) in the A Class and the C Class. The Plan permits each Fund to pay for distribution and related expenses at an annual rate of 0.25% of the A Class and 1.00% of the C Class average daily net assets. The expenses covered by the Plan may include the cost of preparing and distributing prospectuses and other sales material, advertising and public relations expenses, payments to financial intermediaries and compensation of personnel involved in selling shares of the Funds. For the y ear ended November 30, 2019, expenses incurred by the A Class and C Class pursuant to the Plan were as follows:
| Fund | | A Class | | C Class |
| MLP & Pipeline Fund | | $ | 1,234,899 | | $ | 456,028 |
| MLP & Energy Income | | | 133,848 | | | 524,037 |
| Select Opportunity Fund | | | 7,482 | | | 20,260 |
| |
| |
| |
| |
| Notes to Financial Statements(continued) |
| |
| |
8. Investment Transactions
The aggregate purchases and sales, excluding U.S. government securities and short-term investments, by the Funds for the year ended November 30, 2019, were as follows:
| Fund | | Purchases | | Sales |
| MLP & Pipeline Fund | | $ | 775,321,029 | | $ | 827,338,311 |
| MLP & Energy Income Fund | | | 407,343,606 | | | 524,491,611 |
| MLP & Energy Infrastructure Fund | | | 107,593,231 | | | 288,188,646 |
| Select Opportunity Fund | | | 31,061,459 | | | 40,558,645 |
9. Federal Tax Information
As of November 30, 2019, cost basis of investments for federal income tax purposes and the components of accumulated losses on a tax basis were as follows:
| | Tortoise | | Tortoise | | Tortoise | | Tortoise |
| | MLP & Pipeline | | MLP & Energy | | MLP & Energy | | Select Opportunity |
| | Fund | | Income Fund | | Infrastructure Fund | | Fund |
| Cost of investments | | $ | 3,764,715,359 | | | $ | 677,167,316 | | | $ | 68,137,532 | | | $ | 25,781,618 | |
| Gross unrealized appreciation | | $ | 412,386,592 | | | $ | 139,368,160 | | | $ | 35,549,181 | | | $ | 708,355 | |
| Gross unrealized depreciation | | | (606,841,658 | ) | | | (137,649,420 | ) | | | (40,375,763 | ) | | | (1,144,302 | ) |
| Net unrealized appreciation (depreciation) | | | (194,455,066 | ) | | | 1,718,740 | | | | (4,826,582 | ) | | | (435,947 | ) |
| Undistributed ordinary income | | | — | | | | — | | | | — | | | | 356,595 | |
| Undistributed long-term capital gain | | | — | | | | — | | | | — | | | | — | |
| Total distributable income and capital gains | | | — | | | | — | | | | — | | | | 356,595 | |
| Other accumulated losses | | | (289,540,628 | ) | | | (240,300,975 | ) | | | (120,282,837 | ) | | | (29,607,421 | ) |
| Total distributable earnings (loss) | | $ | (483,995,694 | ) | | $ | (238,582,235 | ) | | $ | (125,109,419 | ) | | $ | (29,686,773 | ) |
The difference between book and tax-basis cost is attributable primarily to wash sales and MLP adjustments, if any.
As of November 30, 2019, the MLP & Pipeline Fund, the MLP & Energy Income Fund, the MLP & Energy Infrastructure Fund and the Select Opportunity Fund had short-term capital loss carryforwards of $42,273,143, $126,841,117, $60,741,514 and $17,446,341, respectively, and long-term capital loss carryforwards of $228,443,960, $108,306,996, $57,548,053 and $12,161,080, respectively, which may be carried forward for an unlimited period under the Regulated Investment Company Modernization Act of 2010. Included in the total capital loss carryforward, the Select Opportunity Fund has a short-term carryforward of $1,741,778 and a long-term carryforward of $5,470,474 that it inherited as the result of the merger with North American Energy Independence Fund. These capital loss carryforwards are further subject to an annual limitation of $105,999 pursuant to Section 382. To the extent the Funds realize future net capital gains, those gains will be offset by any unused capital loss carryforwards. Capital loss carryforwards will retain their character as either short-term or long-term capital losses. Thus, such losses must be used first to offset gains of the same character; for example, long-term loss carryforwards will first offset long-term gains, before they can be used to offset short-term gains. For the MLP & Pipeline Fund, MLP & Energy Income Fund, MLP & Energy Infrastructure Fund, and the Select Opportunity Fund, the capital gains and losses have been estimated based on information currently available and are subject to revision upon receipt of the 2019 tax reporting information from the individual MLPs.
In order to meet certain excise tax distribution requirements, the Funds are required to measure and distribute annually net capital gains realized during a twelve month period ending November 30 and net investment income earned during a twelve month period ending December 31. In connection with this, the Funds are permitted for tax purposes to defer into their next fiscal year qualified late year losses. Qualified late year ordinary losses are any net ordinary capital losses incurred between January 1 and the end of their fiscal year, November 30, 2019. For the taxable year ended November 30, 2019, The MLP & Pipeline Fund, the MLP & Energy Infrastructure Fund and the Select Opportunity Fund do not plan to defer any late year losses. The MLP & Energy Income Fund deferred, on a tax basis, late year ordinary losses of $1,030,656.
During the year ended November 30, 2019, the Funds paid the following distributions to shareholders:
| | | | | | | | MLP & Energy | | Select |
| | MLP & Pipeline | | MLP & Energy | | Infrastructure | | Opportunity |
| | Fund | | Income Fund | | Fund | | Fund |
| Ordinary income* | | $ | 61,120,453 | | $ | 1,231,712 | | $ | 8,869,767 | | $ | — |
| Long-term capital gains** | | | — | | | — | | | — | | | — |
| Return of capital | | | 114,297,923 | | | 72,423,404 | | | 5,582,876 | | | — |
| Total distributions | | $ | 175,418,376 | | $ | 73,655,116 | | $ | 14,452,643 | | $ | — |
| |
| |
| 2019 Annual Report| November 30, 2019 |
| |
| Notes to Financial Statements(continued) |
| |
During the year ended November 30, 2018, the Funds paid the following distributions to shareholders:
| | | | | | | | MLP & Energy | | Select |
| | MLP & Pipeline | | MLP & Energy | | Infrastructure | | Opportunity |
| | Fund | | Income Fund | | Fund | | Fund |
| Ordinary income* | | $ | 49,510,575 | | $ | 48,181,707 | | $ | 17,751,685 | | $ | — |
| Long-term capital gains** | | | — | | | — | | | — | | | — |
| Return of capital | | | 86,912,854 | | | 32,854,814 | | | 8,879,368 | | | — |
| Total distributions | | $ | 136,423,429 | | $ | 81,036,521 | | $ | 26,631,053 | | $ | — |
| * | For federal income tax purposes, distributions of short-term capital gains are treated as ordinary income distributions. |
| ** | The Funds designate as long-term capital gain distributions, pursuant to Internal Revenue Code Section 852(b)(3)(c). |
10. Transactions with Affiliates
If the Fund’s holding represents ownership of 5% or more of the voting securities of a company, the company is deemed to be an affiliate as defined by the 1940 Act. The MLP & Pipeline Fund conducted transactions during the year ended November 30, 2019 with affiliated companies as so defined:
| | Beginning shares | | Additions | | Reductions | | Ending shares | |
| Plains GP Holdings LP(1) | | | 8,998,140 | | | 282,243 | | 676,427 | | 8,603,956 | |
| SemGroup Corporation(1) | | | 4,278,476 | | | 1,197,548 | | 5,476,024 | | — | |
| | Value as of | | | | | | | | | | | | Change in |
| | November 30, | | | | | | | | Realized Gain | | Unrealized |
| | 2019 | | Dividend Income | | Return of Capital | | (Loss) | | Depreciation |
| Plains GP Holdings LP(1) | | $ | 150,311,111 | | $ | — | | $ | 11,726,299 | | $ | 3,029,836 | | | $ | (30,960,330 | ) |
| SemGroup Corporation(1) | | | — | | | 2,321,535 | | | 5,404,576 | | | (35,330,453 | ) | | | 46,239,583 | |
| (1) | Security is unaffiliated as of November 30, 2019. |
11. Line of Credit
The MLP & Pipeline Fund established a line of credit (“LOC”) in the amount of $200,000,000. Borrowings under the loan agreement are charged an interest rate equal to prime, 4.75% as of November 30, 2019. This LOC is intended to provide short-term financing, if necessary, subject to certain restrictions, in connection with shareholder redemptions. The credit facility is with the MLP & Pipeline Fund’s custodian, U.S. Bank, N.A. During the year ended November 30, 2019, the MLP & Pipeline Fund had average outstanding borrowings of $1,193,175 under the LOC and paid a weighted-average interest rate of 5.10%. As of November 30, 2019, the amount of outstanding borrowing was $7,305,000.
12. Control Ownership
The beneficial ownership, either directly or indirectly, of more than 25% of the voting securities of a fund creates a presumption of control of the fund, under Section 2(a)(9) of the Investment Company Act of 1940. As of November 30, 2019, each Fund’s percentage of control ownership positions greater than 25% are as follows:
| Fund | | Shareholder | | Percent of Shares Held |
| MLP & Energy Income Fund | | Merrill Lynch, Pierce, Fenner & Smith Inc. | | | 35.53% | |
| MLP & Energy Infrastructure Fund | | T. Rowe Price | | | 66.58% | |
| Select Opportunity Fund | | Morgan Stanley Smith Barney, LLC | | | 36.59% | |
13. Change in Independent Public Accountant
On June 26, 2019, the appointment of Tait, Weller & Baker LLP (“Tait”) as the MLP & Energy Income Fund’s and the MLP & Energy Infrastructure Fund’s independent registered public accountant ended, and upon the recommendation of the Trust’s Audit Committee and approval of the Board of Trustees, the MLP & Energy Income Fund and MLP & Energy Infrastructure Fund engaged Ernst & Young LLP (“E&Y”) as the MLP & Energy Income Fund’s and MLP & Energy Infrastructure Fund’s principal independent auditors for the fiscal year ending November 30, 2019. Tait had served as the principal independent auditor from the MLP & Energy Income Fund’s and the MLP & Energy Infrastructure Fund’s fiscal years ended November 30, 2017 and November 30, 2018. The reports of Tait on the financial statements of the MLP & Energy Income Fund and the MLP & Energy Infrastructure Fund for such periods contained no adverse opinion or disclaimer of opinion, and were not qualified or modified as to uncertainty, audit scope or accounting principles. During the MLP & Energy Income Fund’s and the MLP & Energy Infrastructure Fund’s fiscal years ended November 30,2017 and November 30, 2018, there were no disagreements with Tait on any matter of accounting principles or practices, financial statement disclosures or auditing scope or procedures, which disagreements, if not resolved to the satisfaction of Tait, would have caused Tait to make references thereto in their report on the financial statements of such years.
| |
| |
| |
| |
| Notes to Financial Statements(continued) |
| |
14. Reorganization of MLP & Energy Income Fund and MLP & Energy Infrastructure Fund
On November 15, 2019, as the result of a tax-free reorganization, the Advisory Research MLP & Energy Income Fund and the Advisory Research MLP & Energy Infrastructure Fund (collectively the “Predecessor Funds”), each a series of the Investment Managers Series Trust, a registered open-end investment company, were reorganized into the Trust. The plan of reorganization was approved by the shareholders of the Advisory Research MLP & Energy Income Fund on November 6, 2019 and the Advisory Research MLP & Energy Infrastructure Fund on November 13, 2019. Effective on that date, the Predecessor Funds were renamed the Tortoise MLP & Energy Income Fund and the Tortoise MLP & Energy Infrastructure Fund, and all of their shares were exchanged for shares of the corresponding classes of the MLP & Energy Income Fund and the MLP & Energy Infrastructure Fund. The Predecessor Funds were deemed to be the accounting survivors for financial reporting purposes and as a result, the financial statements of the MLP & Energy Income Fund and the MLP & Energy Infrastructure Fund reflect the operations of the Predecessor Funds for the period prior to the reorganization date. As a part of the reorganization, to align accounting policies to the Trust, certain beginning balances have been reclassified.
As a tax-free reorganization, any unrealized appreciation or depreciation on the securities on the date of reorganization was treated as a non-taxable event, thus the cost basis of the securities held reflect their historical cost basis as of the date of reorganization. Immediately prior to the reorganization, the net assets, fair value of investments, and net unrealized appreciation of the Predecessor Funds were as follows:
| | | | | | | | Net Unrealized |
| | | | | Fair Value of | | Appreciation |
| Fund | | Net Assets | | Investments | | (Depreciation) |
| Advisory Research MLP & Energy Income Fund | | $ | 727,486,011 | | $ | 724,808,363 | | $ | (92,114,936 | ) |
| Advisory Research MLP & Energy Infrastructure Fund | | | 76,847,206 | | | 76,285,778 | | | (14,270,869 | ) |
At the date of the reorganization, total fund shares outstanding totaled 104,343,165 and 11,414,232 for the Predecessor MLP & Energy Income Fund and the Predecessor MLP & Energy Infrastructure Fund, respectively.
15. Subsequent Events
On December 27, 2019, the MLP & Pipeline Fund paid a distribution to the Institutional Class in the amount of $22,325,375 or $0.078 per share and the A Class in the amount of $2,402,796 or $0.059 per share.
On December 27, 2019, the MLP & Energy Income Fund paid a distribution to the Institutional Class in the amount of $193,185 or $0.002 per share and the A Class in the amount of $2,553 or $0.0004 per share.
On December 27, 2019, the MLP & Energy Infrastructure Fund paid a distribution to the Institutional Class in the amount of $105,517 or $0.009 per share.
On December 27, 2019, the Select Opportunity Fund paid a distribution to the Institutional Class in the amount of $316,197 or $0.159 per share, the A Class in the amount of $39,647 or $0.132 per share, and the C Class in the amount of $3,679 or $0.023 per share.
On November 25, 2019, U.S. Bancorp, the parent company of Quasar Distributors, LLC, the Fund’s distributor, announced that it had signed a purchase agreement to sell Quasar to Foreside Financial Group, LLC such that Quasar will become a wholly-owned broker-dealer subsidiary of Foreside. The transaction is expected to close by the end of March 2020. Quasar will remain the Fund’s distributor at the close of the transaction, subject to Board approval.
On December 23, 2019, the Select Opportunity Fund will hold a special shareholder meeting to consider a vote on a new investment sub-advisory agreement (the “Sub-Advisory Agreement”) between Tortoise Capital Advisors, L.L.C. (the “Adviser”) and Tortoise Advisors UK Limited (the “Sub-Adviser”) with respect to the Select Opportunity Fund. Shareholders of record of the Select Opportunity Fund at the close of business on the record date, November 22, 2019, are entitled to notice of and to vote at the Special Meeting and any adjournment(s) or postponements thereof. The Board of Trustees approved the Sub-Advisory Agreement at a meeting held on November 20, 2019 and is proposing shareholders approve the Sub-Advisory Agreement. The Notice of Special Meeting of Shareholders, proxy statement and proxy card are being mailed on or about December 6, 2019, to such shareholders of record.
On December 31, 2019, the Select Opportunity Fund changed its name to Tortoise Energy Evolution Fund. On December 31, 2019, the Tortoise Energy Evolution Fund also changed its principal investment strategy to invest in securities benefiting from the long-term growth associated with the changes in energy supply relating to the energy transition that is currently underway.
Management has performed an evaluation of subsequent events through the date the financial statements were issued and has determined that no additional items require recognition or disclosure.
| |
| |
| 2019 Annual Report| November 30, 2019 |
| |
| Report of Independent Registered Public Accounting Firm |
| |
To the Shareholders and the Board of Trustees
Tortoise MLP & Pipeline Fund
Tortoise MLP & Energy Income Fund
Tortoise MLP & Energy Infrastructure Fund
Tortoise Select Opportunity Fund
Opinion on the Financial Statements
We have audited the accompanying statements of assets and liabilities of Tortoise MLP & Pipeline Fund, Tortoise MLP & Energy Income Fund, Tortoise MLP & Energy Infrastructure Fund, and Tortoise Select Opportunity Fund, (collectively referred to as the “Funds”) (four of the funds constituting the Managed Portfolio Series (the “Trust”)), including the schedules of investments, as of November 30, 2019, and the related statements of operations for the year then ended, the statements of changes in net assets for each of the two years in the period then ended, the financial highlights for each of five years in the period then ended and the related notes (collectively referred to as the “financial statements). In our opinion, the financial statements present fairly, in all material respects, the financial position of each of the Funds (four of the funds constituting the Trust) at November 30, 2019, the results of their operations for the year then ended, the changes in their net assets for each of the two years in the period then ended and their financial highlights for each of the five years in the period then ended, in conformity with U.S. generally accepted accounting principles.
Basis for Opinion
These financial statements are the responsibility of the Trust’s management. Our responsibility is to express an opinion on each of the Funds’ financial statements based on our audits. We are a public accounting firm registered with the Public Company Accounting Oversight Board (United States) (“PCAOB”) and are required to be independent with respect to the Trust in accordance with the U.S. federal securities laws and the applicable rules and regulations of the Securities and Exchange Commission and the PCAOB.
We conducted our audits in accordance with the standards of the PCAOB. Those standards require that we plan and perform the audit to obtain reasonable assurance about whether the financial statements are free of material misstatement, whether due to error or fraud. The Trust is not required to have, nor were we engaged to perform, an audit of the Trust’s internal control over financial reporting. As part of our audits we are required to obtain an understanding of internal control over financial reporting but not for the purpose of expressing an opinion on the effectiveness of the Trust’s internal control over financial reporting. Accordingly, we express no such opinion.
Our audits included performing procedures to assess the risks of material misstatement of the financial statements, whether due to error or fraud, and performing procedures that respond to those risks. Such procedures included examining, on a test basis, evidence regarding the amounts and disclosures in the financial statements. Our procedures included confirmation of securities owned as of November 30, 2019, by correspondence with the custodian and brokers or by other appropriate auditing procedures where replies from brokers were not received. Our audits also included evaluating the accounting principles used and significant estimates made by management, as well as evaluating the overall presentation of the financial statements. We believe that our audits provide a reasonable basis for our opinion.

We have served as the auditor for one or more of the portfolios that comprise the Managed Portfolio Series since 2011.
Minneapolis, Minnesota
January 29, 2020
| |
| |
| |
| |
| Investment Advisory Agreement(unaudited) |
| |
Approval of Investment Advisory Agreement — Tortoise Capital Advisors, L.L.C.
At the special meeting of the Board of Trustees of Managed Portfolio Series (“Trust”) on June 26, 2019, the Trust’s Board of Trustees (“Board”), including all of the Trustees who are not “interested persons” of the Trust, as that term is defined in Section 2(a)(19) of the Investment Company Act of 1940, as amended, (“Independent Trustees”) considered and approved the Investment Advisory Agreement between the Trust and Tortoise Capital Advisors, L.L.C. (“TCA” or the “Adviser”) regarding the Tortoise MLP & Energy Income Fund (the “Energy Income Fund”) and the Tortoise MLP & Energy Infrastructure Fund (the “Energy Infrastructure Fund”) (together, the “Funds”) (the “Advisory Agreement”) for an initial two-year term.
Prior to the meeting, the Board received and considered information from TCA and the Trust’s administrator designed to provide the Board with the information necessary to evaluate the approval of the Advisory Agreement (“Support Materials”). In addition, at the June meeting, representatives of TCA and Advisory Research, Inc. (“ARI”) met with the Board telephonically to discuss the proposed reorganization (the “Reorganization”) of the Advisory Research MLP & Energy Income Fund (the “Target Energy Income Fund”) and the Advisory Research MLP & Energy Infrastructure Fund (the “Target Energy Infrastructure Fund,” and together with the Target Energy Income Fund the “Target Funds”), two series of Investment Managers Series Trust (the “Target Trust”) into the Energy Income Fund and the Energy Infrastructure Fund. Before voting to approve the Advisory Agreement, the Board reviewed the Support Materials with Trust management and with counsel to the Independent Trustees, and received a memorandum from such counsel discussing the legal standards for the Board’s consideration of the Advisory Agreement. This information formed the primary basis for the Board’s determinations.
In determining whether to approve the Advisory Agreement, the Trustees considered all factors they believed relevant, including the following with respect to each Fund: (1) the nature, extent, and quality of the services to be provided by TCA with respect to the Fund; (2) the cost of the services to be provided and the profits to be realized by TCA from services rendered to the Fund; (3) comparative fee and expense data for the Fund and other investment companies with similar investment objectives; (4) the extent to which economies of scale may be realized as the Fund grows, and whether the proposed advisory fee for the Fund reflects such economies of scale for the Fund’s benefit; and (5) other benefits to TCA resulting from services rendered to the Fund. In their deliberations, the Trustees did not identify any particular information that was all-important or controlling.
Based upon TCA’s presentation and information from TCA and the Trust’s administrator designed to provide the Trustees with the information necessary to evaluate the terms of the proposed Advisory Agreement, the Board concluded that the overall arrangements between the Trust and TCA as will be set forth in the Advisory Agreement, as the proposed agreement relates to each Fund, are fair and reasonable in light of the services that TCA will perform, the investment advisory fees that TCA will receive for such services, and such other matters as the Trustees considered relevant in the exercise of their reasonable business judgment. The material factors and conclusions that formed the basis of the Trustees’ determination to approve the Advisory Agreement, as it relates to each Fund, are summarized below.
Nature, Extent and Quality of Services Provided.The Trustees considered the scope of services that TCA will provide under the Advisory Agreement with respect to each Fund, noting that such services include but are not limited to the following with respect to each Fund: (1) investing the Fund’s assets consistent with the Fund’s investment objective and investment policies; (2) determining the portfolio securities to be purchased, sold, or otherwise disposed of and the timing of such transactions; (3) voting all proxies with respect to the Fund’s portfolio securities; (4) maintaining the required books and records for transactions effected by TCA on behalf of the Fund; and (5) selecting broker-dealers to execute orders on behalf of the Fund. The Trustees considered that TCA and its affiliate, Tortoise Index Solutions, LLC currently manage six other series of the Trust. The Trustees noted that TCA is well capitalized. The Trustees also considered TCA’s assets under management. The Trustees also considered that TCA would be hiring the portfolio management team that had managed each Fund since its respective inception date and certain support staff that had worked on the Funds. The Trustees also considered the significant experience of the portfolio management team for the Funds managing closed-end funds or separately managed accounts in strategies similar to those of the Funds. The Trustees concluded that they were satisfied with the nature, extent, and quality of services that TCA proposed to provide to each Acquiring Fund under the Advisory Agreement.
Fund Historical Performance and the Overall Performance of TCA.In assessing the quality of the portfolio management that would be delivered by TCA, the Trustees reviewed the short-term and long-term performance of the Target Funds, as managed by the same portfolio management team proposed to manage the Funds, on both an absolute basis and in comparison to appropriate benchmark indices, and the Fund’s peer funds according to Morningstar classifications. When comparing each Fund’s performance against its respective Morningstar peer group, the Trustees took into account that the investment objective and strategies of each Fund, as well as the Fund’s level of risk tolerance, may differ significantly from the funds in the peer group.
| ● | Energy Income Fund.The Trustees noted that the Target Energy Income Fund had underperformed its peer group median and average for the year-to-date period ended May 31, 2019 but had outperformed its peer group average over the one-year, three-year and five-year periods ended May 31, 2019. The Trustees also noted that the Fund had outperformed its primary benchmark index over the year-to-date period ended May 31, 2019 but underperformed the primary benchmark over the one-year, three-year and five-year periods ended May 31, 2019. The Trustees also considered that the Fund had underperformed its secondary, industry-specific benchmark over the year-to-date and one-year periods ended May 31, 2019, but outperformed the secondary benchmark over the three-year and five-year periods ended May 31, 2019. |
| |
| |
| 2019 Annual Report| November 30, 2019 |
| |
| Investment Advisory Agreement (unaudited) (continued) |
| |
| ● | Energy Infrastructure Fund.The Trustees noted the Target Energy Infrastructure Fund had underperformed its peer group median and average for the year-to-date period ended May 31, 2019 but had outperformed its peer group median and average over the one-year, three-year and five-year periods ended May 31, 2019. The Trustees also noted that the Fund had outperformed its primary benchmark index over the year-to-date period ended May 31, 2019 but underperformed the primary benchmark over the one-year, three-year and five-year periods ended May 31, 2019. The Trustees also considered that the Fund had underperformed its secondary, industry-specific benchmark over the year-to-date and one-year periods ended May 31, 2019, but outperformed the secondary benchmark over the three-year and five-year periods ended May 31, 2019 |
Cost of Advisory Services and Profitability.The Trustees considered the proposed annual management fee that each Fund would pay to TCA under the Advisory Agreement in the amount of 1.00% of the Energy Income Fund’s average annual daily net assets and 0.75% of the Energy Infrastructure Fund’s average annual daily net assets. They also considered TCA’s pro forma profitability analysis for the first 12 months of each Fund’s operations as a series of the Trust. In that regard, the Trustees noted that TCA anticipated that the Energy Income Fund would be profitable to TCA over the first 12 months of operations as a series of the Trust but that the Energy Infrastructure Fund was not expected to be profitable to TCA over the same period. The Trustees noted that TCA currently manages private funds, closed-end funds and separately managed accounts with investment strategies that are substantially similar to each Fund. TCA identified additional services provided to the Funds to justify a higher management fee relative to the private funds or separately managed accounts managed with similar investment strategies to the Funds. The Trustees also noted that TCA had contractually agreed, for a period of at least two years, to waive its management fees and reimburse the Fund for its operating expenses to the extent necessary to ensure that Total Annual Fund Operating Expenses (excluding Rule 12b-1 fees, shareholder servicing fees, acquired fund fees and expenses, interest expense, taxes, and non-routine expenses) do not exceed 1.25% of the average daily net assets of the Energy Income Fund and 1.00% of the Energy Infrastructure Fund. The Trustees expected that TCA’s service relationship with the Energy Income Fund would yield a reasonable profit but that the relationship with the Energy Infrastructure Fund would not be profitable.
Comparative Fee and Expense Data.The Trustees considered a comparative analysis of contractual expenses that each Fund will bear and those of funds in the Morningstar benchmark peer group. The Trustees noted that:
| ● | Energy Income Fund.The Fund’s proposed management fee of 1.00% was equal to the median and slightly above the average management fee for the peer group. The projected total expenses of the Fund’s Institutional Class shares were below the peer group median and average total expenses while the projected total expenses of the Fund’s A Class and C Class shares were above the peer group median and average total expenses. |
| |
| ● | Energy Infrastructure Fund.The Fund’s proposed management fee of 0.75% was significantly below the median and average management fees for the peer group. The projected total expenses of the Fund were also significantly below the peer group median and average total expenses. |
Noting the similarity in strategy between the Funds, the Trustees considered that the Funds invest in high yield fixed income securities which are labor intensive to source, research and negotiate for purchase. The Trustees further considered that that, as a result, managing the Energy Income Fund, with three share classes, significantly greater cash flows and a significantly greater shareholder base, requires significantly more time and resources to manage than the Energy Infrastructure Fund. The Trustees concluded that, due to those factors, it was reasonable to compensate TCA a greater amount for managing the Energy Income Fund. While recognizing that it is difficult to compare advisory fees because the scope of advisory services provided may vary from one investment adviser to another, the Trustees concluded that TCA’s proposed advisory fee for each Fund is reasonable.
Economies of Scale.The Trustees considered whether the Funds would benefit from any economies of scale, noting that the proposed management fees for the Funds did not have breakpoints. The Trustees concluded that it is not necessary to consider the implementation of fee breakpoints at this time, but committed to revisit this issue in the future as circumstances change and asset levels increase.
Other Benefits.The Trustees considered the direct and indirect benefits that could be realized by TCA, and its affiliates, from their respective relationships with the Funds. The Trustees noted that TCA did not anticipate utilizing soft dollar arrangements with respect to portfolio transactions. The Trustees noted that TCA will not use affiliated brokers to execute the Funds’ portfolio transactions. The Trustees considered that TCA may receive some form of reputational benefit from services rendered to the Funds, but that such benefits are immaterial and cannot otherwise be quantified. The Trustees concluded that TCA will not receive additional material benefits from their relationship with the Acquiring Funds.
| |
| |
| |
| |
| Trustees & Officers(unaudited) |
| November 30, 2019 |
Name, Address
and Year of Birth | | Position(s) Held
with the Trust | | Term of Office
and Length of
Time Served | | Number of
Portfolios
in Trust
Overseen
by Trustee | | Principal Occupation(s)
During the Past Five Years | | Other Directorships
Held by Trustee During
the Past Five Years |
| Independent Trustees | | | | | | | | | | |
Leonard M. Rush, CPA
615 E. Michigan St.
Milwaukee, WI 53202
Year of Birth: 1946 | | Lead Independent
Trustee and Audit
Committee Chairman | | Indefinite Term;
Since April 2011 | | 39 | | Retired, Chief Financial Officer, Robert W. Baird & Co. Incorporated (2000-2011). | | Independent Trustee, ETF Series Solutions (52 Portfolios) (2012-Present); Director, Anchor Bancorp Wisconsin, Inc. (2011-2013). |
David A. Massart
615 E. Michigan St.
Milwaukee, WI 53202
Year of Birth: 1967 | | Trustee and Valuation
Committee Chairman | | Indefinite Term;
Since April 2011 | | 39 | | Co-Founder and Chief Investment Strategist, Next Generation Wealth Management, Inc. (2005-present). | | Independent Trustee, ETF Series Solutions (52 Portfolios) (2012-Present). |
David M. Swanson
615 E. Michigan St.
Milwaukee, WI 53202
Year of Birth: 1957 | | Trustee and Nominating
& Governance
Committee Chairman | | Indefinite Term;
Since April 2011 | | 39 | | Founder and Managing Principal, SwanDog Strategic Marketing, LLC (2006-present). | | Independent Trustee, ALPS Variable Investment Trust (10 Portfolios) (2006-Present); Independent Trustee, RiverNorth Opportunities Closed-End Fund (2015-Present). |
| Interested Trustee | | | | | | | | | | |
Robert J. Kern*
615 E. Michigan St.
Milwaukee, WI 53202
Year of Birth: 1958 | | Chairman, and Trustee | | Indefinite Term;
Since January
2011 | | 39 | | Retired Executive Vice President, U.S. Bancorp Fund Services, LLC (1994-2018). | | None |
| Officers | | | | | | | | | | |
Brian R. Wiedmeyer
615 E. Michigan St.
Milwaukee, WI 53202
Year of Birth: 1973 | | President and Principal
Executive Officer | | Indefinite Term;
Since November 2018 | | N/A | | Vice President, U.S. Bancorp Fund Services, LLC (2005-present). | | N/A |
Deborah Ward
615 E. Michigan St.
Milwaukee, WI 53202
Year of Birth: 1966 | | Vice President,
Chief Compliance
Officer and Anti-Money
Laundering Officer | | Indefinite Term;
Since April 2013 | | N/A | | Senior Vice President, U.S. Bancorp Fund Services, LLC (2004-present). | | N/A |
Benjamin Eirich
615 E. Michigan St.
Milwaukee, WI 53202
Year of Birth: 1981 | | Vice President,
Treasurer and Principal
Financial Officer | | Indefinite Term;
Since August 2019
(Treasurer);
Since November 2018
(Vice President) | | N/A | | Assistant Vice President, U.S. Bancorp Fund Services, LLC (2008-present). | | N/A |
Thomas A. Bausch, Esq.
615 E. Michigan St.
Milwaukee, WI 53202
Year of Birth: 1979 | | Secretary | | Indefinite Term;
Since November 2017 | | N/A | | Vice President, U.S. Bancorp Fund Services, LLC (2016-Present); Associate, Godfrey & Kahn S.C. (2012-2016). | | N/A |
Douglas Schafer
615 E. Michigan St.
Milwaukee, WI 53202
Year of Birth: 1970 | | Vice President and
Assistant Treasurer | | Indefinite Term;
Since May 2016
(Assistant Treasurer);
Since November 2018
(Vice President) | | N/A | | Assistant Vice President, U.S. Bancorp Fund Services, LLC (2002-present). | | N/A |
Michael Cyr II
615 E. Michigan St.
Milwaukee, WI 53202
Year of Birth: 1992 | | Vice President and
Assistant Treasurer | | Indefinite Term;
Since August 2019 | | N/A | | Officer,
U.S. Bancorp Fund Services, LLC
(2013-present). | | N/A |
| * | Mr. Kern is an “interested person” of the Trust as defined by the 1940 Act by virtue of the fact that he was a board member of the Fund’s principal underwriter, Quasar Distributors, LLC, an affiliate of the Administrator. |
| |
| |
| 2019 Annual Report| November 30, 2019 |
| |
| Additional Information (unaudited) |
| |
| |
Availability of Fund Portfolio Information
The Fund files complete schedules of portfolio holdings with the SEC for the first and third quarters of each fiscal year on Part F of Form N-PORT. The Funds’ Part F of Form N-PORT are available on the SEC’s website at www.sec.gov and may be reviewed and copied at the SEC’s Public Reference Room in Washington, D.C. Information on the operation of the Public Reference Room may be obtained by calling 1-800-732-0330. The Funds’ Forms N-Q or Part F of Form N-PORT may also be obtained by calling toll-free 1-855-TCA-Fund or 1-855-822-3863.
Availability of Proxy Voting Information
A description of the Funds’ Proxy Voting Policies and Procedures is available without charge, upon request, by calling 1-855-TCA-Fund or 1-855-822-3863. Information regarding how the Funds voted proxies relating to portfolio securities during the most recent 12 month period ended June 30, is available (1) without charge, upon request, by calling 1-855-TCA-Fund or 1-855-822-3863, or (2) on the SEC’s website at www.sec.gov.
Qualified Dividend Income/Dividends Received Deduction
For the fiscal year ended November 30, 2019, certain dividends paid by the Funds may be reported as qualified dividend income and may be eligible for taxation at capital gain rates. The Percentage of dividends declared from ordinary income designated as qualified dividend income was 100.00%, 100.00%, 15.60%, and 0.00% for the MLP & Pipeline Fund, MLP & Energy Income Fund, MLP & Energy Infrastructure Fund, and Select Opportunity Fund, respectively.
For corporate shareholders, the percent of ordinary income distributions qualifying for the corporate dividends received deduction for the fiscal year ended November 30, 2019 was 68.72%, 100.00%, 14.85%, and 0.00% for the MLP & Pipeline Fund, MLP & Energy Income Fund, MLP & Energy Infrastructure Fund, and Select Opportunity Fund, respectively.
The percentage of taxable ordinary income distributions that are designated as short-term capital gain distributions under Internal Revenue Section 871 (k)(2)(C) was 0.00%, 0.00%, 0.00%, and 0.00% for the MLP & Pipeline Fund, MLP & Energy Income Fund, MLP & Energy Infrastructure Fund, and Select Opportunity Fund, respectively.
Results of Special Shareholder Meeting
All Fund shareholders of record at the close of business on November 22, 2019, were entitled to vote. As of the record date, the Select Opportunity Fund had 3,403,052 shares outstanding. Of the 2,308,372 Select Opportunity Fund shares present in person or by Proxy at the meeting December 23, 2019: 2,274,910 shares or 99.55% voted in favor of the proposals, 6,605 voted against and 10,794 shares abstained from voting. Accordingly, the proposals were approved
PRIVACY NOTICE
The Funds collect only relevant information about you that the law allows or requires it to have in order to conduct its business and properly service you. The Funds collect financial and personal information about you (“Personal Information”) directly (e.g., information on account applications and other forms, such as your name, address, and social security number, and information provided to access account information or conduct account transactions online, such as password, account number, e-mail address, and alternate telephone number), and indirectly (e.g., information about your transactions with us, such as transaction amounts, account balance and account holdings).
The Funds do not disclose any non-public personal information about its shareholders or former shareholders other than for everyday business purposes such as to process a transaction, service an account, respond to court orders and legal investigations or as otherwise permitted by law. Third parties that may receive this information include companies that provide transfer agency, technology and administrative services to the Funds, as well as the Funds’ investment adviser who is an affiliate of the Funds. If you maintain a retirement/educational custodial account directly with the Funds, we may also disclose your Personal Information to the custodian for that account for shareholder servicing purposes. The Funds limit access to your Personal Information provided to unaffiliated third parties to information necessary to carry out their assigned responsibilities to the Fund. All shareholder records will be disposed of in accordance with applicable law. The Funds maintain physical, electronic and procedural safeguards to protect your Personal Information and requires its third party service providers with access to such information to treat your Personal Information with the same high degree of confidentiality.
In the event that you hold shares of the Funds through a financial intermediary, including, but not limited to, a broker-dealer, credit union, bank or trust company, the privacy policy of your financial intermediary governs how your non-public personal information is shared with unaffiliated third parties.
Contacts
Board of Trustees
David Massart
Leonard Rush, CPA
David Swanson
Robert Kern Investment Adviser
Tortoise Capital Advisors, L.L.C.
5100 W. 115th Place
Leawood, KS 66211 Independent Registered Public
Accounting Firm
Ernst & Young, LLP
220 South Sixth Street, Suite 1400
Minneapolis, MN 55402 Transfer Agent, Fund Accountant
And Fund Administrator
U.S. Bancorp Fund Services, LLC
777 East Wisconsin Avenue
Milwaukee, WI 53202 Distributor
Quasar Distributors, LLC
777 East Wisconsin Avenue
Milwaukee, WI 53202 | Custodian
U.S. Bank, N.A.
1555 North Rivercenter Drive
Milwaukee, WI 53212 Fund Counsel
Stradley Ronon Stevens & Young, LLP
2005 Market Street, Suite 2600
Philadelphia, PA 19103-7096 855-TCA-FUND
(855-822-3863) This report must be accompanied or preceded by a prospectus. The Fund’s Statement of Additional Information contains additional information about the Fund’s trustees and is available without charge upon request by calling 1-855-TCA-Fund or 1-855-822-3863. |

5100 W. 115th Place
Leawood, KS 66211
www.tortoiseadvisors.com
Item 2. Code of Ethics.
The registrant has adopted a code of ethics that applies to the registrant’s principal executive officer and principal financial officer. The registrant has not made any substantive amendments to its code of ethics during the period covered by this period.
The registrant has not granted any waivers from any provisions of the code of ethics during the period covered by this report.
A copy of the registrant’s code of ethics that applies to the registrant’s principal executive officer and principal financial officer is filed herewith.
Item 3. Audit Committee Financial Expert.
The registrant’s Board of Trustees has determined that there is at least one audit committee financial expert serving on its audit committee. Leonard M. Rush is the “audit committee financial expert” and is considered to be “independent” as each term is defined in Item 3 of Form N-CSR.
Item 4. Principal Accountant Fees and Services.
The registrant has engaged its principal accountant to perform audit services, audit-related services, tax services and other services during the past fiscal year. “Audit services” refer to performing an audit of the registrant's annual financial statements or services that are normally provided by the accountant in connection with statutory and regulatory filings or engagements for the past fiscal year. “Audit-related services” refer to the assurance and related services by the principal accountant that are reasonably related to the performance of the audit. “Tax services” refer to professional services rendered by the principal accountant for tax compliance, tax advice, and tax planning, including reviewing the Fund’s tax returns and distribution calculations. There were no “other services” provided by the principal accountant. For the fiscal years ended November 30, 2019 and November 30, 2018, the Fund’s principal accountant was Ernst & Young. The following table details the aggregate fees billed or expected to be billed for each of the last fiscal year for audit fees, audit-related fees, tax fees and other fees by the principal accountant.
| | FYE 11/30/2019 | | FYE 11/30/2018 |
| Audit Fees | | $194,000 | | $143,100 |
| Audit-Related Fees | | $0 | | $0 |
| Tax Fees | | $91,645 | | $73,170 |
| All Other Fees | | $0 | | $0 |
The audit committee has adopted pre-approval policies and procedures that require the audit committee to pre-approve all audit and non-audit services of the registrant, including services provided to any entity affiliated with the registrant.
The percentage of fees billed by Ernst & Young applicable to non-audit services pursuant to waiver of pre-approval requirement was as follows:
| | FYE 11/30/2019 | | FYE 11/30/2018 |
| Audit-Related Fees | | 0% | | 0% |
| Tax Fees | | 0% | | 0% |
| All Other Fees | | 0% | | 0% |
All of the principal accountant’s hours spent on auditing the registrant’s financial statements were attributed to work performed by full-time permanent employees of the principal accountant.
The following table indicates the non-audit fees, other than the tax services as noted above, billed or expected to be billed by the registrant’s accountant for services to the registrant and to the registrant’s investment adviser (and any other controlling entity, etc.—not sub-adviser) for the last two years. The audit committee of the board of trustees/directors has considered whether the provision of non-audit services that were rendered to the registrant's investment adviser is compatible with maintaining the principal accountant's independence and has concluded that the provision of such non-audit services by the accountant has not compromised the accountant’s independence.
| Non-Audit Related Fees | | FYE 11/30/2019 | | FYE 11/30/2018 |
| Registrant | | $0 | | $0 |
| Registrant’s Investment Adviser | | $45,100 | | $136,497 |
Item 5. Audit Committee of Listed Registrants.
Not applicable to registrants who are not listed issuers (as defined in Rule 10A-3 under the Securities Exchange Act of 1934).
Item 6. Investments.
(a) Schedule of Investments is included as part of the report to shareholders filed under Item 1 of this Form.
(b) Not applicable.
Item 7. Disclosure of Proxy Voting Policies and Procedures for Closed-End Management Investment Companies.
Not applicable to open-end investment companies.
Item 8. Portfolio Managers of Closed-End Management Investment Companies.
Not applicable to open-end investment companies.
Item 9. Purchases of Equity Securities by Closed-End Management Investment Company and Affiliated Purchasers.
Not applicable to open-end investment companies.
Item 10. Submission of Matters to a Vote of Security Holders.
There have been no material changes to the procedures by which shareholders may recommend nominees to the registrant’s board of trustees.
Item 11. Controls and Procedures.
| (a) | The Registrant’s President and Treasurer have reviewed the Registrant's disclosure controls and procedures (as defined in Rule 30a-3(c) under the Investment Company Act of 1940 (the “Act”)) as of a date within 90 days of the filing of this report, as required by Rule 30a-3(b) under the Act and Rules 13a-15(b) or 15d-15(b) under the Securities Exchange Act of 1934. Based on their review, such officers have concluded that the disclosure controls and procedures are effective in ensuring that information required to be disclosed in this report is appropriately recorded, processed, summarized and reported and made known to them by others within the Registrant and by the Registrant’s service provider. |
| | |
| (b) | There were no significant changes in the Registrant's internal control over financial reporting (as defined in Rule 30a-3(d) under the Act) that occurred during the period covered by this report that has materially affected, or is reasonably likely to materially affect, the Registrant's internal control over financial reporting. |
Item 12. Disclosure of Securities Lending Activities for Closed-End Management Investment Companies
Not applicable to open-end investment companies.
Item 13. Exhibits.
| (a) | (1)Any code of ethics or amendment thereto, that is subject of the disclosure required by Item 2, to the extent that the registrant intends to satisfy Item 2 requirements through filing an exhibit.1) Filed herewith |
| | |
| (2)Certifications pursuant to Section 302 of the Sarbanes-Oxley Act of 2002.Filed herewith. |
| | |
| (3)Any written solicitation to purchase securities under Rule 23c-1 under the Act sent or given during the period covered by the report by or on behalf of the registrant to 10 or more persons.Not applicable to open-end investment companies. |
| | |
| (4)Change in the registrant’s independent public accountant.There was a change in the registrant’s independent public accountant for the period covered by this report. Filed herewith. |
| | |
| (b) | Certification pursuant to Section 906 of the Sarbanes-Oxley Act of 2002.Furnished herewith. |
SIGNATURES
Pursuant to the requirements of the Securities Exchange Act of 1934 and the Investment Company Act of 1940, the registrant has duly caused this report to be signed on its behalf by the undersigned, thereunto duly authorized.
| | (Registrant) | Managed Portfolio Series |
| | By (Signature and Title)* | /s/ Brian R. Wiedmeyer |
| | Brian R. Wiedmeyer, President |
Pursuant to the requirements of the Securities Exchange Act of 1934 and the Investment Company Act of 1940, this report has been signed below by the following persons on behalf of the registrant and in the capacities and on the dates indicated.
| | By (Signature and Title)* | /s/ Brian R. Wiedmeyer |
| | Brian R. Wiedmeyer, President |
| | By (Signature and Title)* | /s/ Benjamin J. Eirich |
| | Benjamin J. Eirich, Treasurer |
* Print the name and title of each signing officer under his or her signature.
