 | | | Annual Report |
| | | December 31, 2019 |
| | | |
| | | |
| | | Friess Small Cap Growth Fund |
| | | |
| | | Institutional Class – SCGFX |
| | | Investor Class – SCGNX |
| | | |
| | | |
Beginning on January 1, 2021, as permitted by regulations adopted by the SEC, paper copies of the Fund’s shareholder reports will no longer be sent by mail, unless you specifically request paper copies of the reports from the Fund (defined herein) or from your financial intermediary, such as a broker-dealer or bank. Instead, the reports will be made available on the Fund’s website (www.friessfunds.com), and you will be notified by mail each time a report is posted and provided with a website link to access the report.
If you already elected to receive shareholder reports electronically, you will not be affected by this change and you need not take any action. You may elect to receive shareholder reports and other communications from the Fund by contacting your financial intermediary (such as a broker-dealer or bank) or, if you are a direct investor, by calling 855-656-3017 or by sending an e-mail request to info@friess.com.
You may elect to receive all future reports in paper free of charge. If you invest through a financial intermediary, you can contact your financial intermediary to request that you continue to receive paper copies of your shareholder reports. If you invest directly with the Fund, you can call 855-656-3017 or send an e-mail request to info@friess.com to let the Fund know you wish to continue receiving paper copies of your shareholder reports. Your election to receive reports in paper will apply to all funds held in your account if you invest through your financial intermediary.
(This Page Intentionally Left Blank.)
| | | Friess Small Cap Growth Fund |
| | | | Annual Report | December 31, 2019 |
Dear Fellow Shareholders:
After slowing midyear and changing direction in the third quarter, small-cap stocks resumed their rise with purpose in the final three months of 2019. Strong returns in the December quarter recalled the enthusiasm that marked the year’s opening months.
Friess Small Cap Growth Fund’s Institutional Class shares grew 11.72 percent in the three months through December. The Russell 2000® and Russell 2000® Growth Indexes gained 9.94 and 11.39 percent.
While politics dominated news reports during the quarter, the impeachment process did not appear to be a material concern to the broader investment community. From public hearings to approval of the articles of impeachment by the House of Representatives, daily market action didn’t demonstrate a meaningful relationship with the fate of stocks.
U.S.-China trade relations, on the other hand, seemed to be a major influence on the market’s mood. Sentiment was mostly positive as investors viewed an impending deadline in the standoff, the imposition of new U.S. tariffs scheduled to take place on December 15, as a milestone unlikely to be reached. Stocks behaved as if the odds of a compromise increased as the deadline approached.
Trade-related optimism sank briefly in early December when comments from the president threw a near-term deal into doubt, but by the next day investors reinterpreted the words as a negotiating ploy. In the end, events confirmed the market’s hypothesis about an imminent truce, with the U.S. and China agreeing to a “phase one” trade deal on December 13.
Late-quarter confidence regarding trade was a continuation of an upbeat attitude evident in October, when investors anticipated, then celebrated the U.S. Federal Reserve Bank’s third interest rate reduction for the year. The impact of trade-related uncertainty on business confidence was cited as a lingering risk at the time.
Throughout the period, the most pronounced threat to stocks all year, the risk of recession highlighted by an inversion of the yield curve in August, retreated as a stream of comforting economic data flowed. Good news regarding employment, wage growth, consumer spending and housing activity were among the highlights.
In summary, the December-quarter climate was positive. Friess Small Cap Growth Fund gained ground in eight out of the nine economic sectors represented in its portfolio during the three months through December. The Fund outperformed its primary benchmark, the Russell 2000® Growth Index, in five out of those nine sectors.
Consumer discretionary holdings were top contributors as consumer spending strength was evident in reported results. Representing the third largest portfolio position, consumer discretionary holdings outperformed the sector within the index and were among the most significant contributors to absolute return. They were the second biggest contributors to relative results.
Casual footwear maker Crocs was a top performer thanks to success in the back-to-school shopping season that fueled an eightfold increase in September-quarter earnings, surpassing the consensus estimate by 46 percent. Yeti Holdings, the maker of coolers, travel mugs and related products, topped expectations with 25 percent September-quarter earnings growth. Decker’s Outdoor Corp., Boot Barn Holdings and America’s Car-Mart were also notable contributors that delivered expectation-beatings earnings results.
Holdings from the financial sector, particularly insurance-related companies, were standout performers. Equal-weighted versus the index, financial holdings were the biggest contributors to relative results. Online insurance marketplace operator EverQuote and internet-based insurance agency eHealth rose amid surges in demand that drove revenue 38 and 72 percent higher, respectively, in the September quarter. The only other insurance-related holding, Health Insurance Innovations, detracted from performance after investor hopes regarding a potential sale faded.
The energy sector was also a material contributor to absolute and relative results. Investors deemed shipping company Scorpio Tankers a likely beneficiary of new regulations requiring vessels to use low-sulfur fuel. Scorpio’s fleet includes product tankers ready to comply with the new standards and fuel tankers able to deliver compliant fuel to other operators that need it. Rates for the company’s ships increased as a result.
While the portfolio’s largest concentration of assets, technology holdings, were major contributors to absolute results, their impact on results relative to the benchmark was neutral. Outperformance among technology holdings was offset by the portfolio’s overweight position in a period when the sector generated a smaller return than the overall index.
Likewise, health care holdings, which comprised the second largest portfolio position, were noteworthy in terms
of contribution to total return. As for relative performance, they were the biggest detractors. Health care was the Russell 2000® Growth Index’s best performing sector during the quarter. Health care holdings underperformed the sector’s return and represented an underweight position relative to the index. Biotechnology-related holdings posted solid returns, just not as strong as the health care sector’s robust gain.
For more information on holdings that influenced December-quarter results, please see Roses & Thorns on page 6.
We continue to see ample opportunity to isolate above-average earnings strength in the year ahead. Based on consensus estimates compiled by FactSet Research Systems as of December 31, the typical Friess Small Cap Growth Fund holding is expected to grow 2020 earnings 23.4 percent versus 13.4 percent for the Russell 2000® Growth Index.
Thanks for your continued confidence.
Scott Gates
Chief Investment Officer
Management’s Discussion of Results
Friess Small Cap Growth Fund (the Fund) employs an investment strategy that is based on the premise that company-specific fundamentals, with a particular emphasis on earnings, drive stock prices. While conceding that broader trends influence stocks as a group during certain periods, this approach considers such periods to be finite, with investors ultimately returning to judge each company on its individual merits over time.
Stocks began 2019 by rebounding powerfully from a pronounced downturn in late 2018. The market slowed in the second quarter before retreating in the third quarter amid uncertainty regarding U.S.-China trade relations. Stocks resumed their rise at the end of the year as a trade compromise, an interest rate cut and encouraging economic news revived the early-year enthusiasm.
While the environment was mostly positive, we believe that macro factors, with trade tensions chief among them, overshadowed individual-company fundamentals as the primary influence on stock prices during the 12 months through December. The Fund’s Institutional Class shares grew 17.02 percent in its fiscal year. The Russell 2000® and Russell 2000® Growth Indexes gained 25.52 and 28.48 percent.
Technology holdings, which represented the Fund’s largest portfolio position, contributed the most to absolute performance and results relative to the Russell 2000® Growth Index. Semiconductor-related holdings such as Enphase Energy were the most significant contributors, followed by software holdings, including Smartsheet and Trade Desk. Financial holdings were also standouts on an absolute and relative basis, led by online insurance marketplace operator EverQuote and internet-based insurance agency eHealth.
Representing the Fund’s second largest portfolio position, health care holdings posted muted returns in a period when the health care sector enjoyed strong performance in the benchmark, helping make them the largest detractors from relative results. CryoPort, Fluidigm Corp. and Vapotherm were notable detractors. Consumer discretionary holdings were material contributors to absolute performance, but were the second biggest detractors from results versus the index. Detractors included El Pollo Loco, MarineMax and Shoe Carnival.
The Fund gained ground in seven out of the nine economic sectors represented in its portfolio during the period.
Mutual fund investing involves risk. Principal loss is possible. Friess Small Cap Growth Fund invests in small-cap companies, which involve additional risks such as limited liquidity and greater volatility. The Fund may also invest in depositary receipts, which are generally subject to the same risks as the foreign securities because their values depend on the performance of the underlying foreign securities.
Friess Small Cap Growth Fund
Portfolio Characteristics as of December 31, 2019 (Unaudited)
Top Ten Equity Holdings(1)
Security Name | % of Net Assets | | % Change from Book Cost |
| Scorpio Tankers, Inc. | | 3.0 | % | | | | 41.1 | % | |
| Tandem Diabetes Care, Inc. | | 3.0 | % | | | | 175.5 | % | |
| Papa John’s International, Inc. | | 2.8 | % | | | | 29.8 | % | |
| Crocs, Inc. | | 2.8 | % | | | | 57.9 | % | |
| Lumentum Holdings, Inc. | | 2.7 | % | | | | 50.5 | % | |
| McGrath RentCorp | | 2.5 | % | | | | 12.5 | % | |
| America’s Car-Mart, Inc. | | 2.4 | % | | | | 49.0 | % | |
| Ceridian HCM Holding, Inc. | | 2.4 | % | | | | 54.4 | % | |
| DHT Holdings, Inc. | | 2.4 | % | | | | 15.0 | % | |
| Boot Barn Holdings, Inc. | | 2.3 | % | | | | 21.9 | % | |
| Top Ten as a Group | | 26.3 | % | | | | | | |
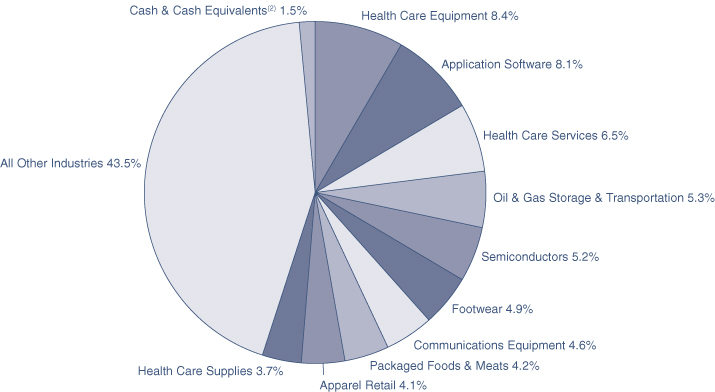
Top Ten Industry Groups(1)
(% of net assets)
(1) | Fund holdings and sector allocations are subject to change at any time and are not recommendations to buy or sell any security. |
(2) | Includes money market deposit accounts, investments purchased with cash proceeds from securities lending, and liabilities in excess of other assets. |
Friess Small Cap Growth Fund
December Quarter “Roses & Thorns” (Unaudited)
| Biggest $ Winners | $ Gain (in thousands) | % Gain | Reasons for Move |
EverQuote Inc. (EVER) | $2,141 | 43.5 | The online insurance marketplace operator earned $0.01 per share in the September quarter, up from a $0.15 year-ago loss, as customers increasingly embraced the platform in search of car, home and life insurance products. Revenue rose 38 percent, exceeding expectations. Quote requests increased 81 percent. |
Crocs Inc. (CROX) | $1,514 | 50.9 | The casual footwear maker earned $0.57 per share in the September quarter, up from $0.07 in the year-ago period and $0.18 higher than the consensus estimate. Revenue rose 20 percent as the company enjoyed its best-ever results in the critical back-to-school season. Crocs raised guidance for the quarter ahead and 2020. |
Lumentum Holdings Inc. (LITE) | $1,399 | 48.1 | The optical networking product maker earned $1.44 per share in the September quarter, exceeding the consensus estimate by 20 percent. The company’s optical communications segment drove 27 percent revenue growth amid strong demand driven by communications infrastructure activity. Lumentum raised guidance for the upcoming quarter. |
eHealth Inc. (EHTH) | $1,294 | 42.2 | The internet-based health insurance agency grew September-quarter revenue 72 percent. The company’s Medicare segment, its largest business unit, grew 75 percent. eHealth also invested in its future growth potential by bolstering its sales staff ahead of Medicare’s upcoming annual enrollment period. |
Scorpio Tankers Inc. (STNG) | $1,178 | 32.2 | New regulations taking effect in January requiring low-sulfur fuel usage by marine vessels drove demand for product tankers at a time when fleet levels remain low. Scorpio also operates fuel tankers likely to benefit. Contracted rates for the company’s ships moved higher during the quarter in anticipation of the changing dynamics. |
| Biggest $ Losers | $ Loss (in thousands) | % Loss | Reasons for Move |
TTEC Holdings Inc. (TTEC) | $783 | 24.3 | The customer experience technology and services company grew September-quarter earnings 90 percent, exceeding the consensus estimate. Revenue climbed 9 percent to $396 million. The company disclosed the loss of a Canadian telecommunications company as a customer, injecting uncertainty into its near-term outlook. |
Impinj Inc. (PI) | $677 | 21.7 | The company, which provides radio frequency identification (RFID) solutions for inventory management, item tracking and other applications, earned $0.09 per share in the September quarter, up from a $0.05 year-ago loss and ahead of the consensus estimate. The midpoint of the company’s range of projected December-quarter revenue was lower than the consensus estimate. |
Health Insurance Innovations Inc. (HIIQ) | $599 | 18.7 | The health insurance product distributor earned $0.66 per share in the September quarter, doubling the consensus estimate. The company in November announced plans to share findings from an ongoing strategic review within 60 days. In December, Health Insurance Innovations announced that it would emphasize growing its Medicare business, disappointing investors who hoped the review, although still ongoing, would result in a sale of the company. |
Cubic Corp. (CUB) | $530 | 16.5 | The company, which makes systems used for revenue collection in transportation and training simulation in defense, among other things, earned $1.86 per share in the September quarter, up from $0.80 the year before. While revenue topped expectations, the earnings result fell short of the consensus estimate when foreign exchange headwinds were taken into account. Investors found 2020 earnings guidance to be disappointing amid an increase in R&D spending. |
Taylor Morrison Home Corp. (TMHC) | $492 | 14.0 | The homebuilder reported September-quarter earnings just below the consensus estimate as the company pushed 50 to 75 homes into the year’s final quarter due to weather-related delays. The company subsequently announced an acquisition, contributing to some near-term uncertainty related to integration, purchase accounting and other one-time costs. |
All gains/losses are calculated on an average cost basis from September 30, 2019 through December 31, 2019.
This commentary reflects the viewpoints of Friess Associates, LLC as of December 31, 2019 and is not intended as a forecast or guarantee of future results.
Friess Small Cap Growth Fund
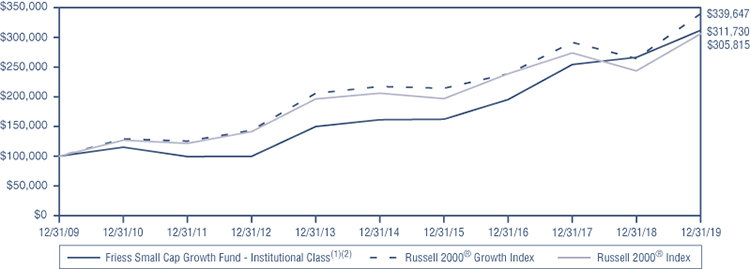
Value of $100,000 Investment (Unaudited)
The chart assumes an initial investment of $100,000. Performance reflects waivers of fee and operating expenses in effect. In the absence of such waivers, total return would be reduced. Past performance is not predictive of future performance. Investment return and principal value will fluctuate, so that your shares, when redeemed, may be worth more or less than their original cost. Performance assumes the reinvestment of capital gains and income distributions. The performance does not reflect deduction of taxes that a shareholder would pay on Fund distributions or the redemption of Fund shares.
| | One Year | Five Years | Ten Years | Since Inception |
Institutional Class(1)(2) | 17.02% | 14.08% | 12.04% | 9.42% |
Investor Class(1)(3) | 16.70% | 13.79% | 11.76% | 9.15% |
Russell 2000® Growth Index(4) | 28.48% | 9.34% | 13.01% | 11.07% |
Russell 2000® Index(5) | 25.52% | 8.23% | 11.83% | 10.33% |
(1) | Fund commenced operations on May 31, 2017. |
(2) | The performance data quoted for the period prior to May 31, 2017, is that of the Series B Units of the Friess Small Cap Trust (the “Predecessor Fund”) and has not been adjusted to reflect the Fund’s share class’ fees and expenses and would be lower if reflected. The Predecessor Fund commenced operations on August 6, 2002 and was not a registered mutual fund subject to the same investment and tax restrictions as the Fund. If it had been, the Predecessor Fund’s performance might have been lower. The Predecessor Fund’s shares were exchanged for the Fund’s Institutional Class shares on May 31, 2017. |
(3) | Performance for the Investor Class prior to the inception of the class is based on the performance of the Predecessor Fund, adjusted for the higher expenses applicable to the class as compared to the Institutional Class. |
(4) | The Russell 2000® Growth Index is a market capitalization weighted index that measures the performance of those Russell 2000® companies with higher price-to-book ratios and higher forecasted growth values. Unlike the Fund, the Russell 2000® Growth Index is unmanaged, is not available for investment, and does not incur expenses. |
(5) | The Russell 2000® Index measures the performance of approximately 2,000 of the largest securities based on a combination of their market cap and current index membership. Unlike the Fund, the Russell 2000® Index is unmanaged, is not available for investment, and does not incur expenses. |
The performance shown represents past performance and is not a guarantee of future results. Current performance may be lower or higher than the performance data quoted. The investment return and principal value of an investment will fluctuate so that an investor’s shares, when redeemed, may be worth more or less than their original cost. From time to time, the Investment Adviser has waived fees or reimbursed expenses, which may have resulted in higher returns. The listed Fund returns are net of expenses, and the listed index returns exclude expenses. Inception date for “Since Inception” performance is August 6, 2002. Operating expenses (gross) are 1.39% for the Fund’s Institutional Class and 1.63% for its Investor Class. Total operating expenses (net) are 1.20% and 1.45%, respectively, due to the Adviser’s contractual agreement, through at least April 30, 2020, to waive its management fees and/or pay Fund expenses. Fund returns would be lower if the gross expense ratio were reflected. For the most recent month-end performance, please visit the Fund’s website at www.friessfunds.com.
Friess Small Cap Growth Fund
Schedule of Investments
December 31, 2019
| Shares | | | | Cost | | | Value | |
| Common Stocks - 98.5% | | | | | | |
| | | | | | | |
| COMMUNICATION SERVICES | | | | | | |
| | | | | | | | | |
| | | Integrated Telecommunication | | | | | | |
| | | Services - 1.0% | | | | | | |
| | 117,381 | | Ooma, Inc.* | | $ | 1,622,542 | | | $ | 1,552,951 | |
| | | | | | | | | | | | |
| | | | Interactive Media | | | | | | | | |
| | | | & Services - 1.9% | | | | | | | | |
| | 89,553 | | EverQuote, Inc., Class A*+ | | | 534,546 | | | | 3,076,145 | |
| | | | Total Communication Services | | | 2,157,088 | | | | 4,629,096 | |
| | | | | | | | | |
| CONSUMER DISCRETIONARY | | | | | | | | |
| | | | | | | | | | | | |
| | | | Apparel Retail - 4.1% | | | | | | | | |
| | 84,407 | | Boot Barn Holdings, Inc.* | | | 3,082,606 | | | | 3,758,644 | |
| | 82,855 | | Zumiez, Inc.* | | | 2,196,823 | | | | 2,861,812 | |
| | | | | | | | | | | | |
| | | | Automotive Retail - 2.4% | | | | | | | | |
| | 35,735 | | America’s Car-Mart, Inc.* | | | 2,629,954 | | | | 3,918,700 | |
| | | | | | | | | | | | |
| | | | Footwear - 4.9% | | | | | | | | |
| | 107,168 | | Crocs, Inc.* | | | 2,842,262 | | | | 4,489,267 | |
| | 20,045 | | Deckers Outdoor Corp.* | | | 1,401,363 | | | | 3,384,799 | |
| | | | | | | | | | | | |
| | | | Home Furnishings - 1.9% | | | | | | | | |
| | 35,601 | | Tempur Sealy | | | | | | | | |
| | | | International, Inc.* | | | 3,041,498 | | | | 3,099,423 | |
| | | | | | | | | | | | |
| | | | Homebuilding - 1.9% | | | | | | | | |
| | 137,934 | | Taylor Morrison Home | | | | | | | | |
| | | | Corp., Class A* | | | 3,507,081 | | | | 3,015,237 | |
| | | | | | | | | | | | |
| | | | Leisure Products - 2.3% | | | | | | | | |
| | 105,860 | | YETI Holdings, Inc.*+ | | | 3,385,324 | | | | 3,681,811 | |
| | | | | | | | | | | | |
| | | | Restaurants - 2.8% | | | | | | | | |
| | 71,176 | | Papa John’s | | | | | | | | |
| | | | International, Inc.+ | | | 3,461,654 | | | | 4,494,764 | |
| | | | Total Consumer Discretionary | | | 25,548,565 | | | | 32,704,457 | |
| | | | | | | | | |
| CONSUMER STAPLES | | | | | | | | |
| | | | | | | | | | | | |
| | | | Packaged Foods | | | | | | | | |
| | | | & Meats - 4.2% | | | | | | | | |
| | 221,805 | | Hostess Brands, Inc., Class A*+ | | | 3,217,433 | | | | 3,225,045 | |
| | 122,030 | | The Simply Good Foods Co.* | | | 3,428,369 | | | | 3,482,736 | |
| | | | Total Consumer Staples | | | 6,645,802 | | | | 6,707,781 | |
| | | | | | | | | |
| ENERGY | | | | | | | | |
| | | | | | | | | | | | |
| | | | Oil & Gas Storage | | | | | | | | |
| | | | & Transportation - 5.3% | | | | | | | | |
| | 457,735 | | DHT Holdings, Inc.+ | | | 3,295,931 | | | | 3,790,046 | |
| | 122,991 | | Scorpio Tankers, Inc. | | | 3,429,254 | | | | 4,838,466 | |
| | | | Total Energy | | | 6,725,185 | | | | 8,628,512 | |
| | | | | | | | | |
| FINANCIALS | | | | | | | | |
| | | | | | | | | | | | |
| | | | Insurance Brokers - 2.1% | | | | | | | | |
| | 35,134 | | eHealth, Inc.*+ | | | 652,644 | | | | 3,375,675 | |
| | | | Total Financials | | | 652,644 | | | | 3,375,675 | |
| | | | | | | | | |
| HEALTH CARE | | | | | | | | |
| | | | | | | | | | | | |
| | | | Health Care Equipment - 8.4% | | | | | | | | |
| | 140,996 | | Cryoport, Inc.*+ | | | 2,435,537 | | | | 2,320,794 | |
| | 47,568 | | LeMaitre Vascular, Inc. | | | 1,716,579 | | | | 1,710,070 | |
| | 21,671 | | NuVasive, Inc.*+ | | | 1,351,254 | | | | 1,676,035 | |
| | 180,864 | | Oxford Immunotec Global PLC* | | | 3,073,447 | | | | 3,002,343 | |
| | 80,169 | | Tandem Diabetes Care, Inc.*+ | | | 1,734,346 | | | | 4,778,874 | |
| | | | | | | | | | | | |
| | | | Health Care Facilities - 0.3% | | | | | | | | |
| | 25,972 | | Joint Corp.*+ | | | 456,415 | | | | 419,188 | |
| | | | | | | | | | | | |
| | | | Health Care Services - 6.5% | | | | | | | | |
| | 37,109 | | Addus HomeCare Corp.* | | | 2,982,963 | | | | 3,607,737 | |
| | 24,257 | | LHC Group, Inc.*+ | | | 2,635,933 | | | | 3,341,644 | |
| | 278,200 | | R1 RCM, Inc.* | | | 3,371,666 | | | | 3,611,036 | |
| | | | | | | | | | | | |
| | | | Health Care Supplies - 3.7% | | | | | | | | |
| | 51,362 | | OrthoPediatrics Corp.*+ | | | 2,121,419 | | | | 2,413,500 | |
| | 47,248 | | Quidel Corp.* | | | 3,474,008 | | | | 3,545,018 | |
| | | | | | | | | | | | |
| | | | Health Care Technology - 3.5% | | | | | | | | |
| | 84,256 | | Health Catalyst, Inc.*+ | | | 3,054,218 | | | | 2,923,683 | |
| | 103,812 | | Phreesia, Inc.* | | | 2,723,415 | | | | 2,765,552 | |
| | | | | | | | | | | | |
| | | | Life Sciences Tools | | | | | | | | |
| | | | & Services - 2.1% | | | | | | | | |
| | 30,457 | | PRA Health Sciences, Inc.*+ | | | 2,174,651 | | | | 3,385,296 | |
| | | | Total Health Care | | | 33,305,851 | | | | 39,500,770 | |
| | | | | | | | | |
| INDUSTRIALS | | | | | | | | |
| | | | | | | | | | | | |
| | | | Construction & | | | | | | | | |
| | | | Engineering - 2.0% | | | | | | | | |
| | 51,006 | | MasTec, Inc.*+ | | | 3,369,928 | | | | 3,272,545 | |
| | | | | | | | | | | | |
| | | | Diversified Support | | | | | | | | |
| | | | Services - 2.5% | | | | | | | | |
| | 53,062 | | McGrath RentCorp | | | 3,609,966 | | | | 4,061,366 | |
| | | | | | | | | | | | |
| | | | Industrial Machinery - 3.5% | | | | | | | | |
| | 116,035 | | Harsco Corp.* | | | 2,377,155 | | | | 2,669,965 | |
| | 87,078 | | Kornit Digital Ltd.*+ | | | 1,866,970 | | | | 2,980,680 | |
| | | | | | | | | | | | |
| | | | Trading Companies | | | | | | | | |
| | | | & Distributors - 3.7% | | | | | | | | |
| | 108,894 | | BMC Stock Holdings, Inc.* | | | 3,206,111 | | | | 3,124,169 | |
| | 83,247 | | H&E Equipment Services, Inc. | | | 2,328,614 | | | | 2,782,947 | |
| | | | Total Industrials | | | 16,758,744 | | | | 18,891,672 | |
| | | | | | | | | |
| INFORMATION TECHNOLOGY | | | | | | | | |
| | | | | | | | | | | | |
| | | | Application Software - 8.1% | | | | | | | | |
| | 56,568 | | Ceridian HCM Holding, Inc.*+ | | | 2,487,567 | | | | 3,839,836 | |
| | 405,440 | | Digital Turbine, Inc.*+ | | | 2,384,161 | | | | 2,890,787 | |
| | 74,013 | | Smartsheet, Inc., Class A* | | | 1,461,563 | | | | 3,324,664 | |
| | 83,936 | | Upland Software, Inc.*+ | | | 1,870,764 | | | | 2,997,355 | |
| | | | | | | | | | | | |
| | | | Communications | | | | | | | | |
| | | | Equipment - 4.6% | | | | | | | | |
| | 396,968 | | Calix, Inc.* | | | 2,628,705 | | | | 3,175,744 | |
| | 54,346 | | Lumentum Holdings, Inc.*+ | | | 2,863,724 | | | | 4,309,638 | |
| | | | | | | | | | | | |
| | | | Data Processing & | | | | | | | | |
| | | | Outsourced Services - 3.7% | | | | | | | | |
| | 104,820 | | EVO Payments, Inc., Class A*+ | | | 2,917,251 | | | | 2,768,296 | |
| | 225,713 | | Verra Mobility Corp.*+ | | | 3,119,106 | | | | 3,157,725 | |
| | | | | | | | | | | | |
| | | | Electronic Equipment | | | | | | | | |
| | | | & Instruments - 2.2% | | | | | | | | |
| | 120,127 | | Napco Security | | | | | | | | |
| | | | Technologies, Inc.*+ | | | 3,506,565 | | | | 3,530,532 | |
| | | | | | | | | | | | |
| | | | Internet Services | | | | | | | | |
| | | | & Infrastructure - 1.8% | | | | | | | | |
| | 721,223 | | Limelight Networks, Inc.* | | | 2,288,603 | | | | 2,942,590 | |
| | | | | | | | | | | | |
| | | | IT Consulting & | | | | | | | | |
| | | | Other Services - 1.1% | | | | | | | | |
| | 58,025 | | KBR, Inc. | | | 1,479,976 | | | | 1,769,762 | |
See Notes to the Financial Statements.
Friess Small Cap Growth Fund
Schedule of Investments (Continued)
December 31, 2019
| Shares | | | | Cost | | | Value | |
| Common Stocks - 98.5% (Continued) | | | | | | |
| | | | | | | |
| INFORMATION TECHNOLOGY (continued) | | | | | | |
| | | | | | | | | |
| | | Semiconductors - 5.2% | | | | | | |
| | 49,941 | | Diodes, Inc.* | | $ | 2,117,360 | | | $ | 2,815,174 | |
| | 94,739 | | Impinj, Inc.*+ | | | 3,127,431 | | | | 2,449,950 | |
| | 61,227 | | Silicon Motion Technology | | | | | | | | |
| | | | Corp. - ADR | | | 2,926,042 | | | | 3,104,821 | |
| | | | Total Information Technology | | | 35,178,818 | | | | 43,076,874 | |
| | | | | | | | | |
| MATERIALS | | | | | | | | |
| | | | | | | | | | | | |
| | | | Construction Materials - 0.8% | | | | | | | | |
| | 161,789 | | Tecnoglass, Inc. | | | 1,297,035 | | | | 1,334,759 | |
| | | | Total Materials | | | 1,297,035 | | | | 1,334,759 | |
| | | | | | | | | | | | |
| | | | Total Common Stocks | | | 128,269,732 | | | | 158,849,596 | |
| | | | | | | | | | | | |
| Short-Term Investment - 2.1% | | | | | | | | |
| | | | | | | | | | | | |
| | | | Money Market | | | | | | | | |
| | | | Deposit Account - 2.1% | | | | | | | | |
| | 3,443,671 | | U.S. Bank N.A., 0.30%^ | | | 3,443,671 | | | | 3,443,671 | |
| | | | Total Money Market | | | | | | | | |
| | | | Deposit Account | | | 3,443,671 | | | | 3,443,671 | |
| | | | | | | | | | | | |
| | | | Total Short-Term Investment | | | 3,443,671 | | | | 3,443,671 | |
| | | | | | | | | | | | |
| Investment Purchased with | | | | | | | | |
| the Cash Proceeds from | | | | | | | | |
| Securities Lending - 28.4% | | | | | | | | |
| | | | | | | | | | | | |
| | | | Investment Companies - 28.4% | | | | | | | | |
| | 45,762,706 | | Mount Vernon Liquid Asset | | | | | | | | |
| | | | Portfolio, LLC, 1.81%# | |
| 45,762,706 | | |
| 45,762,706 | |
| | | | Total Investment Companies | | | 45,762,706 | | | | 45,762,706 | |
| | | | | | | | | | | | |
| | | | Total Investment Purchased | | | | | | | | |
| | | | with the Cash Proceeds from | | | | | | | | |
| | | | Securities Lending | | | 45,762,706 | | | | 45,762,706 | |
| | | | | | | | | | | | |
| | | | Total Investments - 129.0% | | $ | 177,476,109 | | | | 208,055,973 | |
| | | | Liabilities in Excess | | | | | | | | |
| | | | of Other Assets - (29.0)% | | | | | | | (46,793,746 | ) |
| | | | TOTAL | | | | | | | | |
| | | | NET ASSETS - 100.0% | | | | | | $ | 161,262,227 | |
| ADR | | American Depositary Receipt |
| PLC | | Public Limited Company |
| + | | All or a portion of this security was out on loan at December 31, 2019. Total loaned securities had a value of $44,796,005 at December 31, 2019. |
| ^ | | The Money Market Deposit Account (“MMDA”) is a short-term investment vehicle in which the Fund holds cash balances. The MMDA will bear interest at a variable rate that is determined based on market conditions and may change daily and by any amount. The rate shown is as of December 31, 2019. |
| * | | Non Income Producing. |
| # | | The rate shown is the annualized seven day effective yield as of December 31, 2019. |
See Notes to the Financial Statements.
Friess Small Cap Growth Fund
Statement of Assets and Liabilities
December 31, 2019
| Assets: | | | |
| Investments at value* (Including securities on loan valued at $44,796,005) | | $ | 208,055,973 | |
| Receivable for investment securities sold | | | 931,260 | |
| Securities lending income receivable | | | 25,517 | |
| Receivable for capital shares sold | | | 24,861 | |
| Dividends and interest receivable | | | 4,717 | |
| Prepaid expenses | | | 10,534 | |
| Total assets | | | 209,052,862 | |
| | | | | |
| Liabilities: | | | | |
| Payable upon return of securities loaned | | | 45,762,706 | |
| Payable for investment securities purchased | | | 1,827,717 | |
| Payable to investment adviser | | | 128,775 | |
| Payable for fund administration & accounting fees | | | 22,743 | |
| Payable for compliance fees | | | 2,000 | |
| Payable for transfer agent fees & expenses | | | 11,533 | |
| Payable for custody fees | | | 3,795 | |
| Payable for trustee fees | | | 3,919 | |
| Accrued distribution and shareholder servicing fees | | | 1,286 | |
| Accrued other expenses | | | 26,161 | |
| Total liabilities | | | 47,790,635 | |
| | | | | |
| Net Assets | | $ | 161,262,227 | |
| | | | | |
| Net Assets Consist Of: | | | | |
| Paid-in capital | | $ | 132,101,710 | |
| Total distributable earnings | | | 29,160,517 | |
| Net Assets | | $ | 161,262,227 | |
| | | | | |
| Calculation of net asset value per share: | | | | |
| Institutional Class: | | | | |
| Net assets | | $ | 161,038,999 | |
Shares issued and outstanding(1) | | | 6,813,494 | |
| Net asset value, offering and redemption price per share | | $ | 23.64 | |
| | | | | |
| Investor Class: | | | | |
| Net assets | | $ | 223,228 | |
Shares issued and outstanding(1) | | | 9,512 | |
| Net asset value, offering and redemption price per share | | $ | 23.47 | |
| | | | | |
| * Investments at cost | | $ | 177,476,109 | |
(1) | Unlimited shares authorized without par value. |
See Notes to the Financial Statements.
Friess Small Cap Growth Fund
Statement of Operations
For the Year Ended December 31, 2019
| Investment Income: | | | |
| Dividend income | | $ | 397,555 | |
| Securities lending income, net | | | 340,105 | |
| Interest income | | | 131,813 | |
| Total investment income | | | 869,473 | |
| | | | | |
| Expenses: | | | | |
| Investment adviser fees (See Note 4) | | | 1,538,992 | |
| Fund administration & accounting fees (See Note 4) | | | 134,085 | |
| Transfer agent fees & expenses (See Note 4) | | | 68,395 | |
| Federal & state registration fees | | | 37,547 | |
| Custody fees (See Note 4) | | | 22,895 | |
| Audit fees | | | 19,504 | |
| Trustee fees | | | 14,437 | |
| Compliance fees (See Note 4) | | | 12,003 | |
| Legal fees | | | 11,657 | |
| Postage and printing fees | | | 9,523 | |
| Other expenses | | | 7,427 | |
| Distribution and/or shareholder servicing fees (See Note 5) | | | | |
| Institutional Class | | | 13,286 | |
| Investor Class | | | 592 | |
| Total expenses before waiver | | | 1,890,343 | |
| Less: waiver from investment adviser (See Note 4) | | | (43,011 | ) |
| Net expenses | | | 1,847,332 | |
| Net investment loss | | | (977,859 | ) |
| | | | | |
| Realized and Unrealized Gain on Investments: | | | | |
| Net realized gain on investments | | | 6,417,323 | |
| Net change in unrealized appreciation/depreciation on investments | | | 17,432,108 | |
| Net realized and unrealized gain on investments | | | 23,849,431 | |
| Net increase in net assets resulting from operations | | $ | 22,871,572 | |
See Notes to the Financial Statements.
Friess Small Cap Growth Fund
Statements of Changes in Net Assets
| | | For the | | | For the | |
| | | Year Ended | | | Year Ended | |
| | | December 31, 2019 | | | December 31, 2018 | |
| Operations: | | | | | | |
| Net investment loss | | $ | (977,859 | ) | | $ | (831,430 | ) |
| Net realized gain on investments | | | 6,417,323 | | | | 8,473,982 | |
| Net change in unrealized appreciation/depreciation on investments | | | 17,432,108 | | | | (3,001,803 | ) |
| Net increase in net assets resulting from operations | | | 22,871,572 | | | | 4,640,749 | |
| | | | | | | | | |
| Capital Share Transactions: | | | | | | | | |
| Institutional Class: | | | | | | | | |
| Proceeds from shares sold | | | 8,996,425 | | | | 33,752,791 | |
| Proceeds from reinvestment of distributions | | | 143,952 | | | | 17,011,292 | |
| Payments for shares redeemed | | | (3,452,688 | ) | | | (2,316,553 | ) |
| Increase in net assets from Institutional Class transactions | | | 5,687,689 | | | | 48,447,530 | |
| Investor Class: | | | | | | | | |
| Proceeds from shares sold | | | 121,500 | | | | 72,122 | |
| Proceeds from reinvestment of distributions | | | 201 | | | | 14,072 | |
| Payments for shares redeemed | | | (29,021 | ) | | | (45 | ) |
| Increase in net assets from Investor Class transactions | | | 92,680 | | | | 86,149 | |
| | | | | | | | | |
| Net increase in net assets resulting from capital share transactions | | | 5,780,369 | | | | 48,533,679 | |
| | | | | | | | | |
| Distributions to shareholders: | | | | | | | | |
| Institutional Class | | | (144,376 | ) | | | (17,071,791 | ) |
| Investor Class | | | (201 | ) | | | (14,072 | ) |
| Total distributions to shareholders | | | (144,577 | ) | | | (17,085,863 | ) |
| | | | | | | | | |
| Total increase in net assets | | | 28,507,364 | | | | 36,088,565 | |
| | | | | | | | | |
| Net Assets: | | | | | | | | |
| Beginning of year | | | 132,754,863 | | | | 96,666,298 | |
| End of year | | $ | 161,262,227 | | | $ | 132,754,863 | |
See Notes to the Financial Statements.
Friess Small Cap Growth Fund
Financial Highlights
For a Fund share outstanding throughout the periods
Institutional Class
| | | For the | | | For the | | | For the Period | |
| | | Year Ended | | | Year Ended | | | Inception(1) through | |
| | | December 31, 2019 | | | December 31, 2018 | | | December 31, 2017 | |
| Per Share Data | | | | | | | | | |
| Net asset value, beginning of period | | $ | 20.22 | | | $ | 22.40 | | | $ | 20.00 | |
| | | | | | | | | | | | | |
| Investment operations: | | | | | | | | | | | | |
| Net investment loss | | | (0.14 | ) | | | (0.13 | ) | | | (0.06 | ) |
| Net realized and unrealized gain on investments | | | 3.58 | | | | 0.97 | | | | 3.20 | |
| Total from investment operations | | | 3.44 | | | | 0.84 | | | | 3.14 | |
| | | | | | | | | | | | | |
| Less distributions from: | | | | | | | | | | | | |
| Net investment income | | | — | | | | — | | | | — | |
| Net realized gains | | | (0.02 | ) | | | (3.02 | ) | | | (0.74 | ) |
| Total distributions | | | (0.02 | ) | | | (3.02 | ) | | | (0.74 | ) |
| Net asset value, end of period | | $ | 23.64 | | | $ | 20.22 | | | $ | 22.40 | |
| | | | | | | | | | | | | |
Total Return(2) | | | 17.02 | % | | | 4.78 | % | | | 15.68 | % |
| | | | | | | | | | | | | |
| Supplemental Data and Ratios: | | | | | | | | | | | | |
| Net assets, end of period (in 000’s) | | $ | 161,039 | | | $ | 132,646 | | | $ | 96,627 | |
| | | | | | | | | | | | | |
| Ratio of expenses to average net assets: | | | | | | | | | | | | |
Before expense waiver(3) | | | 1.23 | % | | | 1.24 | % | | | 1.35 | % |
After expense waiver(3) | | | 1.20 | % | | | 1.20 | % | | | 1.20 | % |
| | | | | | | | | | | | | |
| Ratio of net investment loss to average net assets: | | | | | | | | | | | | |
After expense waiver(3) | | | (0.64 | )% | | | (0.62 | )% | | | (0.54 | )% |
| | | | | | | | | | | | | |
Portfolio turnover rate(2) | | | 205 | % | | | 220 | % | | | 126 | % |
(1) | Inception Date of the Institutional Class was May 31, 2017. |
(2) | Not annualized for periods less than one year. |
(3) | Annualized for periods less than one year. |
Investor Class
| | | For the | | | For the | | | For the Period | |
| | | Year Ended | | | Year Ended | | | Inception(1) through | |
| | | December 31, 2019 | | | December 31, 2018 | | | December 31, 2017 | |
| Per Share Data | | | | | | | | | |
| Net asset value, beginning of period | | $ | 20.13 | | | $ | 22.37 | | | $ | 20.00 | |
| | | | | | | | | | | | | |
| Investment operations: | | | | | | | | | | | | |
| Net investment loss | | | (0.20 | ) | | | (0.12 | ) | | | (0.07 | ) |
| Net realized and unrealized gain on investments | | | 3.56 | | | | 0.90 | | | | 3.18 | |
| Total from investment operations | | | 3.36 | | | | 0.78 | | | | 3.11 | |
| | | | | | | | | | | | | |
| Less distributions from: | | | | | | | | | | | | |
| Net investment income | | | — | | | | — | | | | — | |
| Net realized gains | | | (0.02 | ) | | | (3.02 | ) | | | (0.74 | ) |
| Total distributions | | | (0.02 | ) | | | (3.02 | ) | | | (0.74 | ) |
| Net asset value, end of period | | $ | 23.47 | | | $ | 20.13 | | | $ | 22.37 | |
| | | | | | | | | | | | | |
Total Return(2) | | | 16.70 | % | | | 4.51 | % | | | 15.53 | % |
| | | | | | | | | | | | | |
| Supplemental Data and Ratios: | | | | | | | | | | | | |
| Net assets, end of period (in 000’s) | | $ | 223 | | | $ | 109 | | | $ | 39 | |
| | | | | | | | | | | | | |
| Ratio of expenses to average net assets: | | | | | | | | | | | | |
Before expense waiver(3) | | | 1.49 | % | | | 1.48 | % | | | 1.59 | % |
After expense waiver(3) | | | 1.45 | % | | | 1.45 | % | | | 1.45 | % |
| | | | | | | | | | | | | |
| Ratio of net investment loss to average net assets: | | | | | | | | | | | | |
After expense waiver(3) | | | (0.88 | )% | | | (0.87 | )% | | | (0.79 | )% |
| | | | | | | | | | | | | |
Portfolio turnover rate(2) | | | 205 | % | | | 220 | % | | | 126 | % |
(1) | Inception Date of the Investor Class was May 31, 2017. |
(2) | Not annualized for periods less than one year. |
(3) | Annualized for periods less than one year. |
See Notes to the Financial Statements.
Friess Small Cap Growth Fund
Notes to Financial Statements
December 31, 2019
1. Organization
Managed Portfolio Series (the “Trust”) was organized as a Delaware statutory trust on January 27, 2011. The Trust is registered under the Investment Company Act of 1940, as amended (the “1940 Act”), as an open-end management investment company. The Friess Small Cap Growth Fund (the “Fund”) is a diversified series with its own investment objectives and policies within the Trust. The investment objective of the Fund is capital appreciation. The Fund is an investment company and accordingly follows the investment company accounting and reporting guidance of the Financial Accounting Standards Board (“FASB”) Accounting Standards Codification Topic 946 Financial Services – Investment Companies. Prior to June 1, 2017, the Fund’s investment adviser managed a limited partnership with an investment objective and investment policies that were, in all material respects, equivalent to those of the Fund. The limited partnership, which incepted on August 6, 2002, converted into, and the Fund commenced operations in the Trust on, May 31, 2017. The Fund currently offers two classes of shares, the Investor Class and the Institutional Class. Each class of shares has identical rights and privileges except with respect to shareholder servicing fees, distribution fees and voting rights on matters affecting a single share class. Institutional Class shares are subject to a maximum 0.15% shareholder servicing fee. Investor Class shares are subject to a 0.25% Rule 12b-1 distribution and servicing fee and a maximum 0.15% shareholder servicing fee. The Fund may issue an unlimited number of shares of beneficial interest, with no par value.
2. Significant Accounting Policies
The following is a summary of significant accounting policies consistently followed by the Fund in preparation of its financial statements. These policies are in conformity with generally accepted accounting principles in the United States of America (“GAAP”).
Security Valuation – All investments in securities are recorded at their estimated fair value, as described in Note 3.
Federal Income Taxes – The Fund complies with the requirements of subchapter M of the Internal Revenue Code of 1986, as amended, as necessary to qualify as a regulated investment company and distributes substantially all net taxable investment income and net realized gains to shareholders in a manner which results in no cost to the Fund. Therefore, no federal income or excise tax provision is required. As of and during the year ended December 31, 2019, the Fund did not have any tax positions that did not meet the “more-likely-than-not” threshold of being sustained by the applicable tax authority. As of and during the year ended December 31, 2019, the Fund did not have liabilities for any unrecognized tax benefits. The Fund recognizes interest and penalties, if any, related to unrecognized tax benefits on unrecognized tax positions as income tax expense in the Statement of Operations. As of and during the year ended December 31, 2019, the Fund did not incur any interest or penalties. The Fund is subject to examination by U.S. tax authorities for all tax years since the commencement of operations.
Security Transactions, Income, and Distributions – The Fund follows industry practice and records security transactions on the trade date. Realized gains and losses on sales of securities are calculated on the basis of identified cost. Dividend income is recorded on the ex-dividend date and interest income and expense is recorded on an accrual basis. Withholding taxes on foreign dividends have been provided for in accordance with the Fund’s understanding of the applicable country’s tax rules and regulations. Discounts and premiums on securities purchased are amortized over the expected life of the respective securities using the constant yield method.
The Fund distributes substantially all net investment income and net realized capital gains, if any, at least annually. Distributions to shareholders are recorded on the ex-dividend date. The treatment for financial reporting purposes of distributions made to shareholders during the year from net investment income or net realized capital gains may differ from their ultimate treatment for federal income tax purposes. These differences are caused primarily by differences in the timing of the recognition of certain components of income, expense or realized capital gains for federal income tax purposes. Where such differences are permanent in nature, GAAP requires that they be reclassified in the components of the net assets based on their ultimate characterization for federal income tax purposes. Any such reclassifications will have no effect on net assets, results of operations or net asset value (“NAV”) per share of the Fund. For the year ended December 31, 2019, the Fund decreased paid-in capital by $977,876 and increased distributable earnings by $977,876. This reclassification relates to net operating loss forfeited.
Allocation of Income, Expenses and Gains/Losses – Income, expenses (other than those deemed attributable to a specific share class), and gains and losses of the Fund are allocated daily to each class of shares based upon the ratio of net assets represented by each class as a percentage of the net assets of the Fund. Expenses deemed directly attributable to a class of shares are
Friess Small Cap Growth Fund
Notes to Financial Statements (Continued)
December 31, 2019
recorded by the specific class. Most Fund expenses are allocated by class based on relative net assets. Shareholder servicing fees are expensed at an annual rate up to 0.15% of Institutional Class and Investor Class average daily net assets and 12b-1 fees are expensed at 0.25% of average daily net assets of Investor Class shares (see Note 5). Expenses associated with a specific fund in the Trust are charged to that fund. Common Trust expenses are typically allocated evenly between the funds of the Trust, or by other equitable means.
Use of Estimates – The preparation of financial statements in conformity with GAAP requires management to make estimates and assumptions that affect the reported amounts of assets and liabilities and disclosure of contingent assets and liabilities at the date of the financial statements and the reported amounts of revenues and expenses during the reporting period. Actual results could differ from those estimates.
3. Securities Valuation
The Fund has adopted authoritative fair value accounting standards which establish an authoritative definition of fair value and set out a hierarchy for measuring fair value. These standards require additional disclosures about the various inputs and valuation techniques used to develop the measurements of fair value, a discussion of changes in valuation techniques and related inputs during the period and expanded disclosure of valuation Levels for major security types. These inputs are summarized in the three broad Levels listed below:
| Level 1 – | Unadjusted quoted prices in active markets for identical assets or liabilities that the Fund has the ability to access. |
| | |
| Level 2 – | Observable inputs other than quoted prices included in Level 1 that are observable for the asset or liability, either directly or indirectly. These inputs may include quoted prices for the identical instrument on an inactive market, prices for similar instruments, interest rates, prepayment speeds, credit risk, yield curves, default rates and similar data. |
| | |
| Level 3 – | Unobservable inputs for the asset or liability, to the extent relevant observable inputs are not available, representing the Fund’s own assumptions about the assumptions a market participant would use in valuing the asset or liability, and would be based on the best information available. |
Following is a description of the valuation techniques applied to the Fund’s major categories of assets and liabilities measured at fair value on a recurring basis. The Fund’s investments are carried at fair value.
Equity Securities – Equity securities that are primarily traded on a national securities exchange are valued at the last sale price on the exchange on which they are primarily traded on the day of valuation or, if there has been no sale on such day, at the mean between the bid and ask prices. Securities traded primarily in the Nasdaq Global Market System for which market quotations are readily available are valued using the Nasdaq Official Closing Price (“NOCP”). If the NOCP is not available, such securities are valued at the last sale price on the day of valuation, or if there has been no sale on such day, at the mean between the bid and ask prices. To the extent these securities are actively traded and valuation adjustments are not applied, they are categorized in Level 1 of the fair value hierarchy. If the market for a particular security is not active, and the mean between bid and ask prices is used, these securities are categorized in Level 2 of the fair value hierarchy.
Short-Term Investments – Investments in other mutual funds, including money market funds, are valued at their NAV per share. Deposit accounts are valued at acquisition cost, which approximates fair value. To the extent these securities are actively traded and valuation adjustments are not applied, they are categorized in Level 1 of the fair value hierarchy. Investments maturing in 60 days or less, including commercial paper, are valued using the mean between the closing bid and ask prices provided by a pricing service and categorized in Level 2 of the fair value hierarchy.
Securities for which market quotations are not readily available, or if the closing price does not represent fair value, are valued following procedures approved by the Board of Trustees (the “Board”). These procedures consider many factors, including the type of security, size of holding, trading volume and news events. There can be no assurance that the Fund could obtain the fair value assigned to a security if it were to sell the security at approximately the time at which the Fund determines its NAV per share. The Board has established a Valuation Committee to administer, implement, and oversee the fair valuation process, and to make fair value decisions when necessary. The Board regularly reviews reports of the Valuation Committee that describe any fair value determinations and methods.
Friess Small Cap Growth Fund
Notes to Financial Statements (Continued)
December 31, 2019
The inputs or methodology used for valuing securities are not an indication of the risk associated with investing in those securities. The following is a summary of the inputs used to value the Fund’s securities as of December 31, 2019:
| | | | Uncategorized | | | Level 1 | | | Level 2 | | | Level 3 | | | Total | |
| | Common Stocks | | $ | — | | | $ | 158,849,596 | | | $ | — | | | $ | — | | | $ | 158,849,596 | |
| | Short-Term Investment | | | — | | | | 3,443,671 | | | | — | | | | — | | | | 3,443,671 | |
| | Investment Purchased with | | | | | | | | | | | | | | | | | | | | |
| | the Cash Proceeds from | | | | | | | | | | | | | | | | | | | | |
| | Securities Lending* | | | 45,762,706 | | | | — | | | | — | | | | — | | | | 45,762,706 | |
| | Total Investments in Securities | | $ | 45,762,706 | | | $ | 162,293,267 | | | $ | — | | | $ | — | | | $ | 208,055,973 | |
| | * | Certain investments that are measured at fair value using the NAV per share (or its equivalent) as a practical expedient have not been characterized in the fair value hierarchy. The fair value amounts presented in the table are intended to permit reconciliation of the fair value hierarchy to the amount presented in the Statement of Assets and Liabilities. See Note 9 for additional information regarding securities lending activity. |
Refer to the Schedule of Investments for further information on the classification of investments.
4. Investment Advisory Fee and Other Related Party Transactions
The Trust has an agreement with the Friess Associates, LLC (the “Adviser”) to furnish investment advisory services to the Fund. Pursuant to an Investment Advisory Agreement between the Trust and the Adviser, the Adviser is entitled to receive, on a monthly basis, an annual advisory fee equal to 1.00% of the Fund’s average daily net assets.
The Adviser has engaged its affiliate, Friess Associates of Delaware, LLC as Sub-Adviser to the Fund. Subject to the supervision of the Adviser, the Sub-Adviser assists the Adviser in the day-to-day management of the Fund’s portfolio, including purchase, retention and sale of securities. The Adviser compensates the Sub-Adviser based on a percentage of monthly expenses incurred by the Sub-Adviser. This relationship does not increase the annual management fee the Fund pays to the Adviser.
The Fund’s Adviser has contractually agreed to waive a portion or all of its management fees and reimburse the Fund for its expenses to ensure that total annual operating expenses (excluding acquired fund fees and expenses, leverage/borrowing interest, interest expense, taxes, brokerage commissions and other transactional expenses, dividends paid on short sales, and extraordinary expenses) for the Fund do not exceed 1.20% and 1.45% of the average daily net assets of the Institutional Class and Investor Class, respectively.
Fees waived and expenses reimbursed by the Adviser may be recouped by the Adviser for a period of thirty-six months following the month during which such waiver or reimbursement was made if such recoupment can be achieved without exceeding the expense limit in effect at the time the waiver and reimbursement occurred. The Operating Expenses Limitation Agreement for the Fund is indefinite in term, but cannot be terminated within a year after the effective date of the Fund’s prospectus. After that date, the agreement may be terminated at any time upon 60 days’ written notice by the Board or the Adviser, with the consent of the Board. Waived fees subject to potential recovery by month of expiration are as follows:
| | Expiration | Amount | |
| | June – December 2020 | $77,315 | |
| | January – December 2021 | 50,181 | |
| | January – December 2022 | 43,011 | |
U.S. Bancorp Fund Services, LLC (the “Administrator”), doing business as U.S. Bank Global Fund Services, acts as the Fund’s Administrator, Transfer Agent, and Fund Accountant. U.S. Bank N.A. (the “Custodian”) serves as the Custodian to the Fund. The Custodian is an affiliate of the Administrator. The Administrator performs various administrative and accounting services for the Fund. The Administrator prepares various federal and state regulatory filings, reports and returns for the Fund; prepares reports and materials to be supplied to the Board; monitors the activities of the Custodian; coordinates the payment of the Fund’s expenses and reviews the Fund’s expense accruals. The officers of the Trust, including the Chief Compliance Officer, are employees of the Administrator. As compensation for its services, the Administrator is entitled to a monthly fee at an annual rate based upon the average daily net assets of the Fund, subject to annual minimums. Fees paid by the Fund for administration and accounting, transfer agency, custody and compliance services for the year ended December 31, 2019, are disclosed in the Statement of Operations.
Friess Small Cap Growth Fund
Notes to Financial Statements (Continued)
December 31, 2019
5. Distribution and Shareholder Servicing Fees
The Fund has adopted a Distribution Plan pursuant to Rule 12b-1 (the “Plan”) in the Investor Class only. The Plan permits the Fund to pay for distribution and related expenses at an annual rate of 0.25% of the Investor Class’ average daily net assets. The expenses covered by the Plan may include the cost of preparing and distributing prospectuses and other sales material, advertising and public relations expenses, payments to financial intermediaries and compensation of personnel involved in selling shares of the Fund. For the year ended December 31, 2019, the Fund’s Investor Class incurred expenses of $542 pursuant to the Plan.
The Fund has entered into a shareholder servicing agreement (the “Agreement”) with the Adviser, under which the Fund may pay servicing fees at an annual rate of up to 0.15% of the average daily net assets of the Institutional Class and Investor Class. Payments to the Adviser under the Agreement may reimburse the Adviser for payments it makes to selected brokers, dealers and administrators which have entered into service agreements with the Adviser for services provided to shareholders of the Fund. The services provided by such intermediaries are primarily designed to assist shareholders of the Fund and include the furnishing of office space and equipment, telephone facilities, personnel and assistance to the Fund in servicing such shareholders. Services provided by such intermediaries also include the provision of support services to the Fund and include establishing and maintaining shareholders’ accounts and record processing, purchase and redemption transactions, answering routine client inquiries regarding the Fund, and providing such other personal services to shareholders as the Fund may reasonably request. For the year ended December 31, 2019, the Fund incurred shareholder servicing fees of $13,286 and $50 in the Institutional Class and Investor Class, respectively.
6. Capital Share Transactions
Transactions in shares of the Fund were as follows:
| | | Year Ended | | | Year Ended | |
| | | December 31, 2019 | | | December 31, 2018 | |
| Institutional Class: | | | | | | |
| Shares sold | | | 397,778 | | | | 1,433,009 | |
| Shares issued in reinvestment of distributions | | | 6,159 | | | | 905,820 | |
| Shares redeemed | | | (150,829 | ) | | | (91,726 | ) |
| Net increase | | | 253,108 | | | | 2,247,103 | |
| | | | | | | | | |
| Investor Class: | | | | | | | | |
| Shares sold | | | 5,434 | | | | 2,933 | |
| Shares issued in reinvestment of distributions | | | 9 | | | | 753 | |
| Shares redeemed | | | (1,345 | ) | | | (2 | ) |
| Net increase | | | 4,098 | | | | 3,684 | |
| Net increase in capital shares | | | 257,206 | | | | 2,250,787 | |
7. Investment Transactions
The aggregate purchases and sales, excluding short-term investments, by the Fund for the year ended December 31, 2019, were as follows:
| | | Purchases | | | Sales | |
| U.S. Government Securities | | $ | — | | | $ | — | |
| Other | | $ | 309,533,755 | | | $ | 305,094,500 | |
8. Federal Tax Information
The aggregate gross unrealized appreciation and depreciation of securities held by the Fund and the total cost of securities for federal income tax purposes at December 31, 2019, were as follows:
| Aggregate | Aggregate | | Federal |
| Gross | Gross | Net | Income |
Appreciation | Depreciation | Appreciation | Tax Cost |
| $32,750,340 | $(3,303,389) | $29,446,951 | $178,609,022 |
Any difference between book-basis and tax-basis unrealized appreciation (depreciation) is attributable primarily to the tax deferral of losses on wash sales in the Fund.
Friess Small Cap Growth Fund
Notes to Financial Statements (Continued)
December 31, 2019
At December 31, 2019 components of accumulated earnings on a tax-basis were as follows:
| Undistributed | Undistributed | Other | Net | Total |
| Ordinary | Long-Term | Accumulated | Unrealized | Distributable |
Income | Capital Gains | Losses | Appreciation | Earnings |
| $ — | $ — | $(286,434) | $29,446,951 | $29,160,517 |
As of December 31, 2019, the Fund had short-term capital loss carryovers of $286,434, which will be permitted to be carried over for an unlimited period. A regulated investment company may elect for any taxable year to treat any portion of any qualified late year loss as arising on the first day of the next taxable year. Qualified late year losses are certain capital, and ordinary losses which occur during the portion of the Fund’s taxable year subsequent to October 31 and December 31, respectively. For the taxable year ended December 31, 2019, the Fund did not defer any qualified late year losses.
The tax character of distributions paid during the year ended December 31, 2019, was as follows:
Ordinary Income* | Long-Term Capital Gains | Total |
| $ — | $144,577 | $144,577 |
The tax character of distributions paid during the year ended December 31, 2018, was as follows:
Ordinary Income* | Long-Term Capital Gains | Total |
| $12,572,519 | $4,513,344 | $17,085,863 |
* For federal income tax purposes, distributions of short-term capital gains are treated as ordinary income distributions.
9. Securities Lending
Following terms of a securities lending agreement with the Custodian, the Fund may lend securities from its portfolio to brokers, dealers and financial institutions in order to increase the return on its portfolio, primarily through the receipt of borrowing fees and earnings on invested collateral. Any such loan must be continuously secured by collateral in cash or cash equivalents maintained on a current basis in an amount at least equal to 105% of the value of the loaned securities that are foreign securities or 102% of the value of any U.S. loaned securities. Loans shall be marked to market daily and the margin restored in the event the collateralization is below 100% of the market value of the securities loaned. During the time securities are on loan, the borrower will pay the applicable Fund any accrued income on those securities, and the Fund may invest the cash collateral and earn income or receive an agreed-upon fee from a borrower that has delivered cash-equivalent collateral. In determining whether or not to lend a security to a particular broker, dealer or financial institution, the Adviser considers all relevant facts and circumstances, including the size, creditworthiness and reputation of the broker, relevant facts dealer or financial institution. Securities lending involves the risk of a default or insolvency of the borrower. In either of these cases, a Fund could experience delays in recovering securities or collateral or could lose all or part of the value of the loaned securities. A Fund also could lose money in the event of a decline in the value of the collateral provided for loaned securities. Additionally, the loaned portfolio securities may not be available to the Fund on a timely basis and the Fund may therefore lose the opportunity to sell the securities at a desirable price. Any decline in the value of a security that occurs while the security is out on loan would continue to be borne by the Fund. As of December 31, 2019, the Fund had 24 securities out on loan.
The Fund receives cash as collateral in return for securities lent as part of the securities lending program. The collateral is invested in the Mount Vernon Liquid Assets Portfolio, LLC of which the investment objective is to seek to maximize current income to the extent with the preservation of capital and liquidity and maintain a stable NAV of $1.00 per unit. The Fund held $45,762,706 as of December 31, 2019. The remaining contractual maturity of all securities lending transactions is overnight and continuous. The Fund is not subject to a master netting agreement with respect to securities lending; therefore no additional disclosures are required. The net income earned by the Fund on investments of cash collateral received from borrowers for the securities loaned to them is reflected in the Fund’s Statement of Operations. Securities lending income, as disclosed in the Fund’s Statement of Operations, represents the income earned from the investment of cash collateral, net of fee rebates paid to the borrower and net of fees paid to the Custodian as lending agent.
10. Control Ownership
The beneficial ownership, either directly or indirectly, of more than 25% of the voting securities of a fund creates a presumption of control of the fund, under Section 2(a)(9) of the 1940 Act. As of December 31, 2019, an individual investor held 53.0% of the Fund.
Report of Independent Registered Public Accounting Firm
To the Shareholders of Friess Small Cap Growth Fund and Board of Trustees of Managed Portfolio Series
Opinion on the Financial Statements
We have audited the accompanying statement of assets and liabilities, including the schedule of investments, of Friess Small Cap Growth Fund (the “Fund”), a series of Managed Portfolio Series, as of December 31, 2019, and the related statement of operations for the year then ended, the statements of changes in net assets for each of the two years in the period then ended, including the related notes, and the financial highlights for each of the three periods in the period then ended (collectively referred to as the “financial statements”). In our opinion, the financial statements present fairly, in all material respects, the financial position of the Fund as of December 31, 2019, the results of its operations for the year then ended, the changes in its net assets for each of the two years in the period then ended, and the financial highlights for each of the three periods in the period then ended, in conformity with accounting principles generally accepted in the United States of America.
Basis for Opinion
These financial statements are the responsibility of the Fund’s management. Our responsibility is to express an opinion on the Fund’s financial statements based on our audits. We are a public accounting firm registered with the Public Company Accounting Oversight Board (United States) (“PCAOB”) and are required to be independent with respect to the Fund in accordance with the U.S. federal securities laws and the applicable rules and regulations of the Securities and Exchange Commission and the PCAOB.
We conducted our audits in accordance with the standards of the PCAOB. Those standards require that we plan and perform the audit to obtain reasonable assurance about whether the financial statements are free of material misstatement, whether due to error or fraud.
Our audits included performing procedures to assess the risks of material misstatement of the financial statements, whether due to error or fraud, and performing procedures that respond to those risks. Such procedures included examining, on a test basis, evidence regarding the amounts and disclosures in the financial statements. Our procedures included confirmation of securities owned as of December 31, 2019, by correspondence with the custodian and brokers. Our audits also included evaluating the accounting principles used and significant estimates made by management, as well as evaluating the overall presentation of the financial statements. We believe that our audits provide a reasonable basis for our opinion.
We have served as the Fund’s auditor since 2017.
COHEN & COMPANY, LTD.
Milwaukee, Wisconsin
January 23, 2020
Friess Small Cap Growth Fund
Expense Example
December 31, 2019 (Unaudited)
As a shareholder of the Fund, you may incur two types of costs: (1) transaction costs, including brokerage commissions on purchases and sales of Fund shares, and (2) ongoing costs, including management fees, distribution and/or service (12b-1) fees, shareholder servicing fees, and other Fund expenses. This Example is intended to help you understand your ongoing costs (in dollars) of investing in the Fund and to compare these costs with the ongoing costs of investing in other mutual funds. The example is based on $1,000 invested at the beginning of the period and held for the entire period (July 1, 2019 – December 31, 2019).
Actual Expenses
For each class, the first line of the table provides information about actual account values and actual expenses. You may use the information in this line, together with the amount you invested, to estimate the expenses that you paid over the period. Simply divide your account value by $1,000 (for example, an $8,600 account value divided by $1,000 = 8.6), then multiply the result by the number in the first line under the heading entitled “Expenses Paid During Period” to estimate the expenses you paid on your account during this period.
Hypothetical Example for Comparison Purposes
For each class, the second line of the table below provides information about hypothetical account values and hypothetical expenses based on the Fund’s actual expense ratio and an assumed rate of return of 5% per year before expenses, which is not the Fund’s actual return. The hypothetical account values and expenses may not be used to estimate the actual ending account balance or expenses you paid for the period. You may use this information to compare the ongoing costs of investing in the Fund and other funds. To do so, compare this 5% hypothetical example with the 5% hypothetical examples that appear in the shareholder reports of the other funds.
Please note that the expenses shown in the table are meant to highlight your ongoing costs only and do not reflect any transactional costs. Therefore, the second line of the table for each class is useful in comparing ongoing costs only, and will not help you determine the relative total costs of owning different funds. In addition, if these transactional costs were included, your costs may have been higher.
| | Beginning | Ending | Expenses Paid |
| | Account | Account | During Period(1) |
| | Value | Value | 7/1/19 to |
| | 7/1/19 | 12/31/19 | 12/31/19 |
| Institutional Class | | | |
Actual(2) | $1,000.00 | $1,004.70 | $6.06 |
| | | | |
| Hypothetical | | | |
| (5% return | | | |
| before expenses) | $1,000.00 | $1,019.16 | $6.11 |
| | | | |
| Investor Class | | | |
Actual(2) | $1,000.00 | $1,003.50 | $7.32 |
| | | | |
| Hypothetical | | | |
| (5% return | | | |
| before expenses) | $1,000.00 | $1,017.90 | $7.37 |
(1) | Expenses are equal to the Fund’s annualized expense ratio for the most recent six-month period of 1.20% and 1.45% for the Institutional Class and Investor Class, respectively, multiplied by the average account value over the period, multiplied by 184/365 to reflect the one-half year period. |
(2) | Based on the actual returns for the six-month period ended December 31, 2019 of 0.47% and 0.35% of the Institutional Class and Investor Class, respectively. |
Friess Small Cap Growth Fund
Additional Information
December 31, 2019 (Unaudited)
| | | | Number of | | |
| | | Term of | Portfolios | | Other Directorships |
| | Position(s) | Office and | in Trust | | Held by Trustee |
| Name, Address | Held with | Length of | Overseen | Principal Occupation(s) | During the |
and Year of Birth | the Trust | Time Served | by Trustee | During the Past Five Years | Past Five Years |
| Independent Trustees | | | | | |
| | | | | | |
| Leonard M. Rush, CPA | Lead | Indefinite | 39 | Retired, Chief Financial | Independent Trustee, |
| 615 E. Michigan St. | Independent | Term; Since | | Officer, Robert W. Baird & Co. | ETF Series Solutions |
| Milwaukee, WI 53202 | Trustee and | April 2011 | | Incorporated (2000-2011). | (52 Portfolios) |
| Year of Birth: 1946 | Audit | | | | (2012-Present); Director, |
| | Committee | | | | Anchor Bancorp |
| | Chairman | | | | Wisconsin, Inc. |
| | | | | | (2011-2013) |
| | | | | | |
| David A. Massart | Trustee and | Indefinite | 39 | Co-Founder and Chief | Independent Trustee, |
| 615 E. Michigan St. | Valuation | Term; Since | | Investment Strategist, | ETF Series Solutions |
| Milwaukee, WI 53202 | Committee | April 2011 | | Next Generation Wealth | (52 Portfolios) |
| Year of Birth: 1967 | Chairman | | | Management, Inc. | (2012-Present) |
| | | | | (2005-Present). | |
| | | | | | |
| David M. Swanson | Trustee | Indefinite | 39 | Founder and Managing Principal, | Independent Trustee, |
| 615 E. Michigan St. | | Term; Since | | SwanDog Strategic Marketing, | ALPS Variable |
| Milwaukee, WI 53202 | | April 2011 | | LLC (2006-Present). | Investment Trust |
| Year of Birth: 1957 | | | | | (10 Portfolios) |
| | | | | | (2006-Present); |
| | | | | | Independent Trustee, |
| | | | | | RiverNorth |
| | | | | | Opportunities Closed- |
| | | | | | End Fund (2015-Present) |
| Interested Trustee | | | | | |
| | | | | | |
| Robert J. Kern* | Chairman, | Indefinite | 39 | Retired, Executive Vice | None |
| 615 E. Michigan St. | and Trustee | Term; Since | | President, U.S. Bancorp | |
| Milwaukee, WI 53202 | | January 2011 | | Fund Services, LLC | |
| Year of Birth: 1958 | | | | (1994-2018). | |
| * | Mr. Kern is an “interested person” of the Trust as defined by the 1940 Act by virtue of the fact that he was a board member of Quasar Distributors, LLC, an affiliate of the Administrator. |
Friess Small Cap Growth Fund
Additional Information (Continued)
December 31, 2019 (Unaudited)
| | | | Number of | | |
| | | Term of | Portfolios | | Other Directorships |
| | Position(s) | Office and | in Trust | | Held by Trustee |
| Name, Address | Held with | Length of | Overseen | Principal Occupation(s) | During the |
and Year of Birth | the Trust | Time Served | by Trustee | During the Past Five Years | Past Five Years |
| Officers | | | | | |
| | | | | | |
| Brian R. Wiedmeyer | President | Indefinite | N/A | Vice President, U.S. | N/A |
| 615 E. Michigan St. | and Principal | Term; Since | | Bancorp Fund Services, | |
| Milwaukee, WI 53202 | Executive | November 2018 | | LLC (2005-Present). | |
| Year of Birth: 1973 | Officer | | | | |
| | | | | | |
| Deborah Ward | Vice President, | Indefinite | N/A | Senior Vice President, | N/A |
| 615 E. Michigan St. | Chief | Term; Since | | U.S. Bancorp Fund Services, | |
| Milwaukee, WI 53202 | Compliance | April 2013 | | LLC (2004-Present). | |
| Year of Birth: 1966 | Officer and | | | | |
| | Anti-Money | | | | |
| | Laundering | | | | |
| | Officer | | | | |
| | | | | | |
| Benjamin Eirich | Vice | Indefinite | N/A | Assistant Vice President, | N/A |
| 615 E. Michigan St. | President, | Term; Since | | U.S. Bancorp Fund Services, | |
| Milwaukee, WI 53202 | Treasurer | August 2019 | | LLC (2008-Present). | |
| Year of Birth: 1981 | and Principal | (Treasurer); | | | |
| | Financial | Since | | | |
| | Officer | November 2018 | | | |
| | | (Vice President) | | | |
| | | | | | |
| Thomas A. Bausch, Esq. | Secretary | Indefinite | N/A | Vice President, U.S. Bancorp | N/A |
| 615 E. Michigan St. | | Term; Since | | Fund Services, LLC | |
| Milwaukee, WI 53202 | | November 2017 | | (2016-Present); | |
| Year of Birth: 1979 | | | | Associate, Godfrey & | |
| | | | | Kahn S.C. (2012-2016). | |
| | | | | | |
| Douglas Schafer | Vice President | Indefinite | N/A | Assistant Vice President, | N/A |
| 615 E. Michigan St. | and | Term; Since | | U.S. Bancorp Fund Services, | |
| Milwaukee, WI 53202 | Assistant | May 2016 | | LLC (2002-Present). | |
| Year of Birth: 1970 | Treasurer | (Assistant | | | |
| | | Treasurer); | | | |
| | | Since | | | |
| | | November 2018 | | | |
| | | (Vice President) | | | |
| | | | | | |
| Michael J. Cyr II | Vice President | Indefinite | N/A | Officer, U.S. Bancorp Fund | N/A |
| 615 E. Michigan St. | and | Term; Since | | Services, LLC (2013-Present). | |
| Milwaukee, WI 53202 | Assistant | August 2019 | | | |
| Year of Birth: 1992 | Treasurer | | | | |
Friess Small Cap Growth Fund
Additional Information (Continued)
December 31, 2019 (Unaudited)
AVAILABILITY OF FUND PORTFOLIO INFORMATION
The Fund files complete schedules of portfolio holdings with the SEC for the first and third quarters of each fiscal year on Form N-Q, which is available on the SEC’s website at www.sec.gov. The Fund’s Form N-Q may be reviewed and copied at the SEC’s Public Reference Room in Washington, D.C. For information on the Public Reference Room call 1-800-SEC-0330. In addition, the Fund’s Form N-Q is available without charge upon request by calling 1-855-656-3017.
AVAILABILITY OF PROXY VOTING INFORMATION
A description of the Fund’s Proxy Voting Policies and Procedures is available without charge, upon request, by calling 1-855-656-3017. Information regarding how the Fund voted proxies relating to portfolio securities during the most recent 12 month period ended June 30, is available (1) without charge, upon request, by calling 1-855-656-3017, or (2) on the SEC’s website at www.sec.gov.
PRIVACY NOTICE (Unaudited)
The Fund collects only relevant information about you that the law allows or requires it to have in order to conduct its business and properly service you. The Fund collects financial and personal information about you (“Personal Information”) directly (e.g., information on account applications and other forms, such as your name, address, and social security number, and information provided to access account information or conduct account transactions online, such as password, account number, e-mail address, and alternate telephone number), and indirectly (e.g., information about your transactions with us, such as transaction amounts, account balance and account holdings).
The Fund does not disclose any non-public personal information about its shareholders or former shareholders other than for everyday business purposes such as to process a transaction, service an account, respond to court orders and legal investigations or as otherwise permitted by law. Third parties that may receive this information include companies that provide transfer agency, technology and administrative services to the Fund, as well as the Fund’s investment adviser who is an affiliate of the Fund. If you maintain a retirement/educational custodial account directly with the Fund, we may also disclose your Personal Information to the custodian for that account for shareholder servicing purposes. The Fund limits access to your Personal Information provided to unaffiliated third parties to information necessary to carry out their assigned responsibilities to the Fund. All shareholder records will be disposed of in accordance with applicable law. The Fund maintains physical, electronic and procedural safeguards to protect your Personal Information and requires its third party service providers with access to such information to treat your Personal Information with the same high degree of confidentiality.
In the event that you hold shares of the Fund through a financial intermediary, including, but not limited to, a broker-dealer, credit union, bank or trust company, the privacy policy of your financial intermediary governs how your non-public personal information is shared with unaffiliated third parties.
INVESTMENT ADVISER
Friess Associates, LLC
P.O. Box 576
Jackson, WY 83001
INVESTMENT SUB-ADVISER
Friess Associates of Delaware, LLC
P.O. Box 4166
Greenville, DE 19807
DISTRIBUTOR
Foreside Fund Services, LLC
Three Canal Plaza, Suite 100
Portland, ME 04101
CUSTODIAN
U.S. Bank N.A.
1555 North Rivercenter Drive, Suite 302
Milwaukee, WI 53212
ADMINISTRATOR, FUND ACCOUNTANT
AND TRANSFER AGENT
U.S. Bancorp Fund Services, LLC
615 East Michigan Street
Milwaukee, WI 53202
INDEPENDENT REGISTERED PUBLIC ACCOUNTING FIRM
Cohen & Company, Ltd.
342 North Water Street, Suite 830
Milwaukee, WI 53202
LEGAL COUNSEL
Stradley Ronon Stevens & Young, LLP
2005 Market Street, Suite 2600
Philadelphia, PA 19103
This report is submitted for the general information of the shareholders of the Fund. It is not authorized for distribution to
prospective investors unless preceded or accompanied by an effective prospectus, which includes information regarding the Fund’s
risks, objectives, fees and expenses, experience of its management, and other information.
The Fund’s Statement of Additional Information contains additional information about the Fund’s trustees and
is available without charge upon request by calling 1-855-656-3017.
Item 2. Code of Ethics.
The Registrant has adopted a code of ethics that applies to the Registrant’s principal executive officer and principal financial officer. The Registrant has not made any substantive amendments to its code of ethics during the period covered by this period.
The Registrant has not granted any waivers from any provisions of the code of ethics during the period covered by this report.
A copy of the Registrant’s code of ethics that applies to the registrant’s principal executive officer and principal financial officer is filed herewith.
Item 3. Audit Committee Financial Expert.
The Registrant’s Board of Trustees has determined that there is at least one audit committee financial expert serving on its audit committee. Leonard M. Rush is the “audit committee financial expert” and is considered to be “independent” as each term is defined in Item 3 of Form N-CSR.
Item 4. Principal Accountant Fees and Services.
The Registrant has engaged its principal accountant to perform audit services, audit-related services, tax services and other services during the past fiscal period. “Audit services” refer to performing an audit of the registrant's annual financial statements or services that are normally provided by the accountant in connection with statutory and regulatory filings or engagements for those fiscal periods. “Audit-related services” refer to the assurance and related services by the principal accountant that are reasonably related to the performance of the audit. “Tax services” refer to professional services rendered by the principal accountant for tax compliance, tax advice, and tax planning; including reviewing the Fund’s tax returns and distribution calculations. There were no “other services” provided by the principal accountant. For the fiscal years ended December 31, 2019 and December 31, 2018, the Fund’s principal accountant was Cohen & Company, Ltd. The following table details the aggregate fees billed or expected to be billed for each of the last fiscal period audit fees, audit-related fees, tax fees and other fees by the principal accountant.
| | FYE 12/31/2019 | FYE 12/31/2018 |
Audit Fees | $16,500 | $16,000 |
Audit-Related Fees | $0 | $0 |
Tax Fees | $ 3,000 | $ 3,000 |
All Other Fees | $0 | $0 |
The audit committee has adopted pre-approval policies and procedures that require the audit committee to pre‑approve all audit and non‑audit services of the registrant, including services provided to any entity affiliated with the Registrant.
The percentage of fees billed by Cohen & Company, Ltd. applicable to non-audit services pursuant to waiver of pre-approval requirement was as follows:
| | FYE 12/31/2019 | FYE 12/31/2018 |
Audit-Related Fees | 0% | 0% |
Tax Fees | 0% | 0% |
All Other Fees | 0% | 0% |
All of the principal accountant’s hours spent on auditing the Registrant’s financial statements were attributed to work performed by full‑time permanent employees of the principal accountant.
The following table indicates the non-audit fees billed or expected to be billed by the registrant’s accountant for services to the registrant and to the Registrant’s investment adviser (and any other controlling entity, etc.—not sub-adviser) for the last year. The audit committee of the board of trustees/directors has considered whether the provision of non-audit services that were rendered to the Registrant's investment adviser is compatible with maintaining the principal accountant's independence and has concluded that the provision of such non-audit services by the accountant has not compromised the accountant’s independence.
Non-Audit Related Fees | FYE 12/31/2019 | FYE 12/31/2018 |
Registrant | $0 | $0 |
Registrant’s Investment Adviser | $0 | $0 |
Item 5. Audit Committee of Listed Registrants.
Not applicable to Registrants who are not listed issuers (as defined in Rule 10a-3 under the Securities Exchange Act of 1934).
Item 6. Investments.
(a) Schedule of Investments is included as part of the report to shareholders filed under Item 1 of this Form.
(b) Not applicable
Item 7. Disclosure of Proxy Voting Policies and Procedures for Closed-End Management Investment Companies.
Not applicable to open-end investment companies.
Item 8. Portfolio Managers of Closed-End Management Investment Companies.
Not applicable to open-end investment companies.
Item 9. Purchases of Equity Securities by Closed‑End Management Investment Company and Affiliated Purchasers.
Not applicable to open-end investment companies.
Item 10. Submission of Matters to a Vote of Security Holders.
There have been no material changes to the procedures by which shareholders may recommend nominees to the Registrant’s board of trustees.
Item 11. Controls and Procedures.
(a) | The Registrant’s President and Treasurer have reviewed the Registrant's disclosure controls and procedures (as defined in Rule 30a-3(c) under the Investment Company Act of 1940 (the “Act”)) as of a date within 90 days of the filing of this report, as required by Rule 30a-3(b) under the Act and Rules 13a-15(b) or 15d‑15(b) under the Securities Exchange Act of 1934. Based on their review, such officers have concluded that the disclosure controls and procedures are effective in ensuring that information required to be disclosed in this report is appropriately recorded, processed, summarized and reported and made known to them by others within the Registrant and by the Registrant’s service provider. |
(b) | There were no significant changes in the Registrant's internal control over financial reporting (as defined in Rule 30a-3(d) under the Act) that occurred during the second fiscal quarter of the period covered by this report that has materially affected, or is reasonably likely to materially affect, the Registrant's internal control over financial reporting. |
Item 12. Disclosure of Securities Lending Activities for Closed-End Management Investment Companies
Not applicable to open-end investment companies.
Item 13. Exhibits.
(a) | (1) Any code of ethics or amendment thereto, that is subject of the disclosure required by Item 2, to the extent that the Registrant intends to satisfy Item 2 requirements through filing an exhibit. 1) Filed herewith. |
(2) Certifications pursuant to Section 302 of the Sarbanes-Oxley Act of 2002. Filed herewith.
(3) Any written solicitation to purchase securities under Rule 23c‑1 under the Act sent or given during the period covered by the report by or on behalf of the Registrant to 10 or more persons. Not applicable to open-end investment companies.
(4) Change in the registrant’s independent public accountant. There was no change in the registrant’s independent public accountant for the period covered by this report.
| (b) | Certification pursuant to Section 906 of the Sarbanes‑Oxley Act of 2002. Furnished herewith. |
SIGNATURES
Pursuant to the requirements of the Securities Exchange Act of 1934 and the Investment Company Act of 1940, the registrant has duly caused this report to be signed on its behalf by the undersigned, thereunto duly authorized.
(Registrant) Managed Portfolio Series
By (Signature and Title)* /s/Brian R. Wiedmeyer
Brian R. Wiedmeyer, President
Date February 3, 2020
Pursuant to the requirements of the Securities Exchange Act of 1934 and the Investment Company Act of 1940, this report has been signed below by the following persons on behalf of the registrant and in the capacities and on the dates indicated.
By (Signature and Title)* /s/Brian R. Wiedmeyer
Brian R. Wiedmeyer, President
Date February 3, 2020
By (Signature and Title)* /s/Benjamin J. Eirich
Benjamin J. Eirich, Treasurer
Date February 3, 2020
* Print the name and title of each signing officer under his or her signature.