UNITED STATES
SECURITIES AND EXCHANGE COMMISSION
Washington, D.C. 20549
FORM N-CSR
CERTIFIED SHAREHOLDER REPORT OF REGISTERED
MANAGEMENT INVESTMENT COMPANIES
Investment Company Act file number 811-22525
Managed Portfolio Series
(Exact name of Registrant as specified in charter)
615 East Michigan Street
Milwaukee, WI 53202
(Address of principal executive offices) (Zip code)
Brian R. Wiedmeyer, President
Managed Portfolio Series
c/o U.S. Bancorp Fund Services, LLC
777 East Wisconsin Ave, 5th Fl
Milwaukee, WI 53202
(Name and address of agent for service)
(414) 765-6844
Registrant's telephone number, including area code
Date of fiscal year end: October 31, 2019
Date of reporting period: October 31, 2019
Item 1. Reports to Stockholders.
| | | Ticker Symbols | |
| | Investor Class | Institutional Class | IS Class |
| | | | |
| Jackson Square | [Not available | [Not available | |
| All-Cap Growth Fund | for purchase] | for purchase] | JSSSX |
| | | | |
| Jackson Square | [Not available | | |
| Global Growth Fund | for purchase] | JSPTX | JSPUX |
| | | | |
| Jackson Square | | | |
| Large-Cap Growth Fund | JSPJX | JSPIX | DPLGX |
| | | | |
| Jackson Square | [Not available | [Not available | |
| Select 20 Growth Fund | for purchase] | for purchase] | DPCEX |
| | | | |
| Jackson Square | | | |
| SMID-Cap Growth Fund | JSMVX | JSMTX | DCGTX |
Beginning on January 1, 2021, as permitted by regulations adopted by the Securities and Exchange Commission, paper copies of the Funds’ annual and semi-annual shareholder reports will no longer be sent by mail, unless you specifically request paper copies of the reports. Instead, the reports will be made available on the Funds’ website (www.jspfunds.com), and you will be notified by mail each time a report is posted and provided with a website link to access the report.
If you already elected to receive shareholder reports electronically, you will not be affected by this change and you need not take any action. You may elect to receive shareholder reports and other communications from a Fund electronically anytime by contacting your financial intermediary (such as a broker-dealer or bank) or, if you are a direct investor, by calling 1-844-577-3863 or by sending an e-mail request to info@jspfunds.com.
Beginning on January 1, 2019, you may elect to receive all future reports in paper free of charge. If you invest through a financial intermediary, you can contact your financial intermediary to request that you continue to receive paper copies of your shareholder reports. If you invest directly with a Fund, you can call 1-844-577-3863 or send an email request to info@jspfunds.com to let the Fund know you wish to continue receiving paper copies of your shareholder reports. Your election to receive reports in paper will apply to all funds held in your account if you invest through your financial intermediary or all Funds held with the fund complex if you invest directly with a Fund.
| | Annual Report |
| www.jspfunds.com | October 31, 2019 |
Jackson Square Funds
October 31, 2019
Dear Shareholders:
Jackson Square Partners, LLC (“Jackson Square”), a U.S. registered investment adviser, is the adviser to the Jackson Square All-Cap Growth Fund, Jackson Square Global Growth Fund, Jackson Square Large-Cap Growth Fund, Jackson Square Select 20 Growth Fund, and Jackson Square SMID-Cap Growth Fund.
After significant positive absolute returns in the equity market over the past several years, we saw volatility return in late 2018 and sporadically in 2019. The volatility appears to be both technical and fundamental, leaving investors continuing to struggle with accurately predicting the pace of global economic recovery and assessing external factors that threaten economic fundamentals, such as central bank actions and fiscal policy debates across the globe. In any given period, including the fiscal year, the markets oscillate quickly from sector rotations to stock differentiation and then back again. The result can sometimes be investor focus on equities as an asset class as opposed to a focus on company-specific fundamentals. Within this backdrop, investors have generally leaned toward equities as a preferred asset allocation choice resulting in a strong U.S. equity market with only minor pullbacks.
Adding to investor consideration is not only President Trump’s unconventional style as a head of state, but now an impeachment inquiry process that may hamper the administration’s goals of significant policy changes. We are also mindful of the potential macroeconomic implications of President Trump’s exiting policy positions, including his comments and public positioning on global trade negotiations with China that could have deleterious impacts on global economic conditions. We believe it is too early to determine the long-term magnitude of such outcomes but we will closely monitor President Trump’s tenure with a keen eye on ongoing controversies and challenges as well as the effectiveness of potential policy shifts. Nonetheless, regardless of policy outcomes, we remain consistent in our long-term investment philosophy:
We want to own what we view as strong secular-growth companies with solid business models and competitive positions that we believe can grow market share and have the potential to deliver shareholder value in a variety of market environments.
Jackson Square All-Cap Growth Fund
Jackson Square All-Cap Growth Fund (the “All-Cap Growth Fund”)
Within the Fund
For the fiscal year ended Oct. 31, 2019, All-Cap Growth Fund IS Class shares gained 11.85%. These figures reflect all distributions reinvested. During the same period, the Fund’s benchmark, the Russell 3000® Growth Index, rose 16.34%. For complete, annualized performance of All-Cap Growth Fund, please see the table on page 4.
Strong relative performance in information technology was unable to overcome weak relative performance in communication services. On a stock-specific level, the following were the most significant contributors and detractors during the period.
Chewy Inc., an online retailer of pet food and other pet-related products, was purchased during the fiscal year and contributed to the Fund’s performance. The stock went public to significant investor interest due to its strong brand recognition, subscription-heavy model, and brand and industry barriers to new entrants. We like the high reoccurring revenue from pet-product sales and what we view as Chewy’s competitive position in the pet-supply area. While profit margins are low today as Chewy invests in fulfillment and brand recognition, we see the upside potential over time to financial metrics and to the stock as customer lifetime value grows with each new cohort of customers.
Applied Materials Inc., the global leader in providing equipment for advanced semiconductors and flat-panel displays, added to the Fund’s performance. The sector drifted higher on stronger foundry investment from Taiwanese semiconductor manufacturer TSMC, signs of a bottom in the NAND flash memory (a type of nonvolatile storage technology that does not require power to retain data) market, along with positive commentary from management on market-share gains in 2020. We remain confident that Applied Materials is undervalued by the market and is attractively positioned in a consolidating sector with high barriers to entry.
Charter Communications Inc., a cable telecommunications company, also contributed. The company continues to report strong earnings driven by well-above consensus broadband-subscriber additions. Charter Communications generated margin expansion of earnings before interest, taxes, depreciation, and amortization (EBITDA), driven by the economically accretive mix shift towards broadband and declines in capital intensity. We believe these trends support our thesis and should continue to do so for the foreseeable future. The stock remains undervalued versus our intrinsic business value estimate even with strong year-to-date stock performance. Overall, we like the company’s cable business given the structurally high barriers to entry, limited competition in broadband, inherent long-term pricing power, and that it directly benefits from the durable and inexorable secular trends underlying consumer high-speed data consumption.
Liberty TripAdvisor Holdings Inc., a travel website providing travel advice and planning features, detracted from the Fund’s performance during the fiscal year. The company’s hotel segment has struggled against competitive headwinds, including increased challenges from Google’s search business. That said, we believe Liberty TripAdvisor Holdings’ commitment to increased focus on its experiences and dining products – a growing business line that enhances the company’s overall profitability – is the right strategic move. We continue to monitor the fundamentals closely.
Farfetch Ltd., a UK-based online retail business selling multi-brand digital luxury goods in 122 countries, detracted from the Fund’s performance. The company announced an unexpected acquisition of New Guards Group, owner of Off-White, which caught investors by surprise. This acquisition gives Farfetch exclusive rights to sell Off-White goods that attract a younger demographic and adds exposure to this demographic for its other customers. Additionally, Farfetch announced it faced greater headwinds from increased promotions by both offline and online retailers. This pressure is expected to be temporary, lasting two-to-four quarters, as brands withdraw inventory from
Jackson Square All-Cap Growth Fund
the wholesale channel and continue to accelerate supply growth at Farfetch. Lastly, the company announced the departure of its chief operating officer. While each of these events can be reasonably explained, we believe the clustering of these negative data points in a single quarter has damaged management’s credibility in its first year as a public company. We remain constructive on Farfetch’s long-term opportunity to be the primary destination for online, multi-brand shopping in the luxury segment, but are carefully evaluating recent events.
LiveRamp Holdings Inc., a global technology and enablement-services company, also weighed on the Fund’s performance during the fiscal year. Despite slightly disappointing earnings, we believe recent stock weakness can be partly attributed to concerns about upcoming changes to Google Chrome’s security policy. That said, the absence of third-party cookie data as a result of changes in security policy should increase the relative value of first-party data for marketers. Further, the company announced that it had agreed to acquire Data Plus Math Corp., raising questions among investors regarding execution risk. Although we remain untroubled on its merits, we will monitor the acquisition. We continue to believe that LiveRamp Holdings is well-positioned to drive value over the long term given the combination of new management, an attractive software-as-a-service (SaaS) data platform, and a strong balance sheet with excess cash.
Jackson Square All-Cap Growth Fund
Value of $1,000,000 Investment (Unaudited)
The chart assumes an initial investment of $1,000,000. Performance reflects waivers of fee and operating expenses in effect. In the absence of such waivers, total return would be reduced. Past performance is not predictive of future performance. Investment return and principal value will fluctuate, so that your shares, when redeemed may be worth more or less than their original cost. Performance assumes the reinvestment of capital gains and income distributions. The performance does not reflect the deduction of taxes that a shareholder would pay on Fund distributions or the redemption of Fund shares.
Annualized Rates of Return as of October 31, 2019
| | 1 year | 3 years | Since Inception(1) |
| IS Class | 11.85% | 13.14% | 11.72% |
Russell 3000® Growth Index(2) | 16.34% | 18.50% | 17.24% |
| (1) | The IS Class commenced operations on September 19, 2016. |
| (2) | The Russell 3000® Growth Index measures the growth segment of the U.S. equity universe. It includes those Russell 3000® Index companies with higher price-to-book ratios and higher forecasted growth values. One cannot invest directly in an Index. |
Jackson Square All-Cap Growth Fund
Sector Allocation(1) (Unaudited)
As of October 31, 2019
(% of Net Assets)
Top Ten Equity Holdings(1) (Unaudited)
As of October 31, 2019
(% of Net Assets)
| | Microsoft | | | 8.4 | % |
| | New York Times – Class A | | | 7.6 | % |
| | LiveRamp Holdings | | | 5.1 | % |
| | KKR & Co. – Class A | | | 3.6 | % |
| | Ball | | | 3.6 | % |
| | Charter Communications – Class A | | | 3.3 | % |
| | Dollar Tree | | | 3.2 | % |
| | IQVIA Holdings | | | 3.0 | % |
| | Varonis Systems | | | 2.8 | % |
| | Autodesk | | | 2.7 | % |
| (1) | Fund holdings and sector allocations are subject to change at any time and are not recommendations to buy or sell any security. |
Jackson Square Global Growth Fund
Jackson Square Global Growth Fund (the “Global Growth Fund”)
Within the Fund
For the fiscal year ended Oct. 31, 2019, the Global Growth Fund IS Class and Institutional Class shares gained 13.47% and 13.53%, respectively. These figures reflect all distributions reinvested. During the same period, the Fund’s benchmark, the MSCI All Country World Index, rose 12.59%. For complete, annualized performance of Jackson Square Global Growth Fund, please see the table on page 8.
Strong relative performance in Industrials outperformance weak relative performance in communication services. On a stock-specific level, the following were the most significant contributors and detractors during the period.
MercadoLibre, Inc., a top online retailer in Latin America, was a contributor to performance during the fiscal year. The company has continued to solidify its position in e-commerce and digital payments throughout Latin America as demonstrated by its robust growth and improved monetization of marketplaces as well as continued execution in its off-platform revenue streams. During the year, it raised capital to continue to expand its e-commerce platform; investing in the logistics infrastructure and digital payment solutions. As the digital marketplace leader in Latin America, we believe that MercadoLibre is well positioned to benefit from the secular growth of e-commerce within the region.
Arco Platform Ltd., a provider of educational content, was a contributor to performance during the fiscal year. The company continues to track ahead of its guidance for top line growth as well as margin improvement. The company made two small acquisitions during the year that we believe will help broaden its product functionality as well as open additional cross selling opportunities for its base of 4,800 partner schools and 1 million students. Arco continues to execute on its plan to digitize content and curriculum for the Brazilian private education market with a business model similar to many U.S. SaaS businesses: an asset-light platform with high visibility; strong recurring revenues; high returns on capital; and strong free cash flow. Further, we believe Arco is unique among many education companies that are typically dependent on government funding or policies, as its end user is 100% private pay.
Mastercard Incorporated, a financial service corporation that facilitates electronic funds transfer, was a contributor to performance during the fiscal year. The company reported a string of positive earnings. Additionally, the company committed to an additional three years of high-teens EPS growth. We continue to believe the global payment trend away from paper currency and checks toward electronic payments (credit and debit) is inexorable. We believe Mastercard is well positioned to take advantage of this trend; the company’s revenues are based on transactions executed over an existing network with minimal incremental capital investment required, resulting in high incremental margins.
Farfetch Ltd., a UK-based online retail business selling multi-brand digital luxury goods in 122 countries, detracted from the Fund’s performance. The company announced an unexpected acquisition of New Guards Group, owner of Off-White, which caught investors by surprise. This acquisition gives Farfetch exclusive rights to sell Off-White goods that attract a younger demographic and adds exposure to this demographic for its other customers. Additionally, Farfetch announced it faced greater headwinds from increased promotions by both offline and online retailers. This pressure is expected to be temporary, lasting two-to-four quarters, as brands withdraw inventory from the wholesale channel and continue to accelerate supply growth at Farfetch. Lastly, the company announced the departure of its chief operating officer. While each of these events can be reasonably explained, we believe the clustering of these negative data points in a single quarter has damaged management’s credibility in its first year as a public company. We remain constructive on Farfetch’s long-term opportunity to be the primary destination for online, multi-brand shopping in the luxury segment, but are carefully evaluating recent events.
Jackson Square Global Growth Fund
Ubisoft Entertainment, a global console video game publisher, was a detractor from performance during the fiscal year. The stock was impacted by the underperformance of its latest game, “Ghost Recon: Breakpoint”, and the company made the difficult decision to delay its remaining three games (originally scheduled for this fiscal year) in order to optimize the net present value and lifetime engagement of those games. While the fundamental news has been disappointing, we believe the issues are transitory in nature and caused an overreaction to the stock price from short-term investors. We believe Ubisoft is doing the right thing for the health of its franchises and monetization potential and that our long-term growth thesis remains intact.
HealthEquity, Inc., a platform for Health Savings Accounts (HAS) and consumer driven health and retirement solutions, was a detractor for the fiscal year. During the year, HealthEquity announced a definitive agreement to acquire WageWorks--a leading independent provider of consumer directed benefits--for $2B. In August, WageWorks reported 2Q19 numbers that were below analyst expectations and showed year-over-year declines in revenue and EBITDA. While not unexpected given the challenges at the business, the declines were larger than expected and highlighted that the integration with HealthEquity will take time for the benefits to be fully realized. Nonetheless, we believe in the reasonable synergy assumptions of the WageWorks deal and that management will be able to adequately reset the combined company.
Jackson Square Global Growth Fund
Value of $1,000,000 Investment (Unaudited)
The chart assumes an initial investment of $1,000,000. Performance reflects waivers of fee and operating expenses in effect. In the absence of such waivers, total return would be reduced. Past performance is not predictive of future performance. Investment return and principal value will fluctuate, so that your shares, when redeemed may be worth more or less than their original cost. Performance assumes the reinvestment of capital gains and income distributions. The performance does not reflect the deduction of taxes that a shareholder would pay on Fund distributions or the redemption of Fund shares.
Annualized Rates of Return as of October 31, 2019
| | 1 year | 3 years | Since Inception(1) |
| IS Class | 13.47% | 15.11% | 13.83% |
| Institutional Class | 13.53% | 15.10% | 13.81% |
MSCI All Country World Index(2) | 12.59% | 11.33% | 10.76% |
| (1) | Both the IS Class and Institutional Class commenced operations on September 19, 2016. |
| (2) | The MSCI All Country World Index is a free float-adjusted market capitalization weighted index that is designed to measure the equity market performance of developed markets worldwide. One cannot invest directly in an Index. |
Jackson Square Global Growth Fund
Country Allocation(1) (Unaudited)
As of October 31, 2019
(% of Net Assets)
Top Ten Equity Holdings(1) (Unaudited)
As of October 31, 2019
(% of Net Assets)
| | Microsoft | | | 4.8 | % |
| | Airbus | | | 4.5 | % |
| | Mastercard – Class A | | | 4.3 | % |
| | Visa – Class A | | | 4.1 | % |
| | New York Times – Class A | | | 4.0 | % |
| | IQVIA Holdings | | | 3.9 | % |
| | Experian | | | 3.3 | % |
| | KKR & Co. – Class A | | | 3.1 | % |
| | CME Group | | | 3.1 | % |
| | Haemonetics | | | 3.1 | % |
| (1) | Fund holdings and sector allocations are subject to change at any time and are not recommendations to buy or sell any security. |
Jackson Square Large-Cap Growth Fund
Jackson Square Large-Cap Growth Fund (the “Large-Cap Growth Fund”)
Within the Fund
For the fiscal year ended Oct. 31, 2019, the Large-Cap Growth Fund IS, Institutional and Investor Classes shares gained 14.40%, 14.44% and 14.18%, respectively. These figures reflect all distributions reinvested. During the same period, the Fund’s benchmark, the Russell 1000® Growth Index, gained 17.10%. For complete, annualized performance of Large-Cap Growth Fund, please see the table on page 12.
Strong relative performance in information technology was unable to overcome weak relative performance in communication services. On a stock-specific level, the following were the most significant contributors and detractors during the period.
Applied Materials Inc., the global leader in providing equipment for advanced semiconductors and flat-panel displays, contributed to the Fund’s performance during the fiscal year. The sector drifted higher on stronger foundry investment from Taiwanese semiconductor manufacturer TSMC, signs of a bottom in the NAND flash memory (a type of nonvolatile storage technology that does not require power to retain data) market, along with positive commentary from management on market share-gains in 2020. We remain confident that Applied Materials is undervalued by the market and is attractively positioned in a consolidating sector with high barriers to entry.
Charter Communications Inc., a cable telecommunications company, added to the Fund’s performance during the fiscal year. The company continues to report strong earnings driven by well-above consensus broadband-subscriber additions. Charter Communications generated margin expansion of earnings before interest, taxes, depreciation, and amortization (EBITDA), driven by the economically accretive mix shift towards broadband and declines in capital intensity. We believe these trends support our thesis and should continue to do so for the foreseeable future. The stock remains undervalued versus our intrinsic business value estimate even with strong year-to-date stock performance. Overall, we like the company’s cable business given the structurally high barriers to entry, limited competition in broadband, inherent long-term pricing power, and that it directly benefits from the durable and inexorable secular trends underlying consumer high-speed data consumption.
Microsoft Corp., a multinational technology company, was also a contributor to performance during the fiscal period. Microsoft has continued to report double-digit growth in Azure, its enterprise cloud computing offering. We believe the conversion of clients to Office 365 subscriptions from packaged software and increased integration of LinkedIn to corporate customers have helped to strengthen its competitive position in the enterprise business. Our thesis of Microsoft’s becoming one of just a few key competitors in the cloud computing space and consequently transitioning to more consistent, stable revenue streams is intact, and the stock remains a significant holding in the Fund’s portfolio.
TripAdvisor Inc., a travel website providing travel advice and planning features, detracted from the Fund’s performance during the fiscal year. The company’s hotel segment has struggled against competitive headwinds, including increased challenges from Google’s search business. That said, we believe TripAdvisor’s commitment to increased focus on its experiences and dining products – a growing business line that enhances the company’s overall profitability – is the right strategic move. We continue to monitor the fundamentals closely.
Take-Two Interactive Software Inc., a publisher and distributor of video games, detracted from the Fund’s performance. The stock had a drawdown earlier in 2019 caused primarily by its correlation to poor results from peers. A related issue is skeptics’ lingering perception that Fortnite and the “free-to-play” gaming concept are impairing industry fundamentals via deflation and reduced barriers to entry, a view we continue to dispute. Long term, we continue to believe Take-Two is in the early stages of its journey towards increased scale, profitability,
Jackson Square Large-Cap Growth Fund
and diversification, all of which has been underappreciated by the market. Additionally, the company’s balance sheet remains strong, in our view, with significant cash, short-term investments, and no debt.
Liberty Global Plc, an international telecommunications and diversified cable company, also weighed on the Fund’s performance during the fiscal period. Increased concern about the potential for a hard Brexit has investors worried about the company’s UK business, which represents 60% of operating profits. As such, the stock has underperformed. We continue to believe that Liberty Global’s UK business has held up better operationally than sentiment suggests, and that it should ultimately benefit from its advantaged network with sustainable pricing power in a consolidating industry.
Jackson Square Large-Cap Growth Fund
Value of $1,000,000 Investment (Unaudited)
The chart assumes an initial investment of $1,000,000. Performance reflects waivers of fee and operating expenses in effect. In the absence of such waivers, total return would be reduced. Past performance is not predictive of future performance. Investment return and principal value will fluctuate, so that your shares, when redeemed may be worth more or less than their original cost. Performance assumes the reinvestment of capital gains and income distributions. The performance does not reflect the deduction of taxes that a shareholder would pay on Fund distributions or the redemption of Fund shares.
Annualized Rates of Return as of October 31, 2019
| | 1 year | 5 years | 10 years | Since Inception(1) |
| IS Class | 14.40% | 9.41% | 13.96% | 8.77% |
| Institutional Class | 14.44% | 9.37% | 13.88% | 8.69% |
| Investor Class | 14.18% | 9.10% | 13.60% | 8.42% |
Russell 1000® Growth Index(2) | 17.10% | 13.43% | 15.41% | 10.65% |
| (1) | The IS Class commenced operations on November 1, 2005, and the Institutional Class and Investor Class shares commenced operations on September 19, 2016. Performance for the Institutional Class and Investor Class prior to the inception of each class is based on the performance of the IS Class shares, adjusted for higher expenses applicable to each class’ shares. |
| (2) | The Russell 1000® Growth Index measures the performance of the large cap growth segment of the U.S. equity universe. It includes those Russell 1000® Index companies with higher price-to-book ratios and higher forecasted growth values. One cannot invest directly in an Index. |
Jackson Square Large-Cap Growth Fund
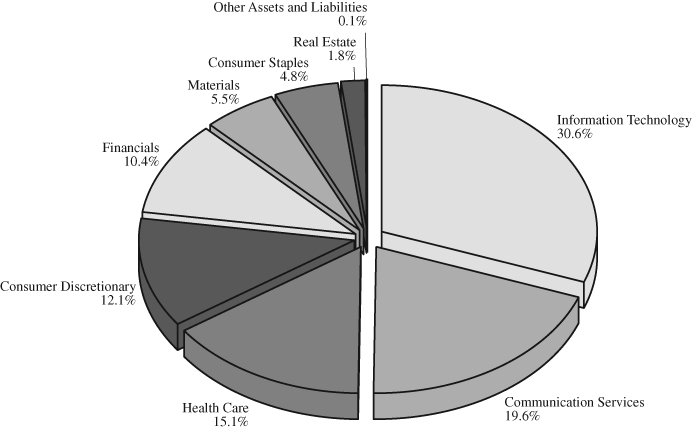
Sector Allocation(1) (Unaudited)
As of October 31, 2019
(% of Net Assets)
Top Ten Equity Holdings(1) (Unaudited)
As of October 31, 2019
(% of Net Assets)
| | Microsoft | | | 10.2 | % |
| | Ball | | | 5.4 | % |
| | IQVIA Holdings | | | 5.4 | % |
| | Charter Communications – Class A | | | 4.9 | % |
| | Dollar Tree | | | 4.8 | % |
| | Constellation Brands – Class A | | | 4.8 | % |
| | KKR & Co. – Class A | | | 4.8 | % |
| | Hasbro | | | 4.2 | % |
| | UnitedHealth Group | | | 4.0 | % |
| | Mastercard – Class A | | | 3.9 | % |
| (1) | Fund holdings and sector allocations are subject to change at any time and are not recommendations to buy or sell any security. |
Jackson Square Select 20 Growth Fund
Jackson Square Select 20 Growth Fund (the “Select 20 Growth Fund”)
Within the Fund
For the fiscal year ended Oct. 31, 2019, Jackson Square Select 20 Fund IS Class shares gained 10.47%. These figures reflect all distributions reinvested. During the same period, the Fund’s benchmark, the Russell 3000® Growth Index, rose 16.34%. For complete, annualized performance of Jackson Square Select 20 Fund, please see the table on page 16.
Strong relative performance in Healthcare could not overcome the relative weak performance in communication services. On a stock-specific level, the following were the most significant contributors and detractors during the period.
Applied Materials Inc., the global leader in providing equipment for advanced semiconductors and flat-panel displays, added to the Fund’s performance. The sector drifted higher on stronger foundry investment from Taiwanese semiconductor manufacturer TSMC, signs of a bottom in the NAND flash memory (a type of nonvolatile storage technology that does not require power to retain data) market, along with positive commentary from management on market-share gains in 2020. We remain confident that Applied Materials is undervalued by the market and is attractively positioned in a consolidating sector with high barriers to entry.
Chewy Inc., an online retailer of pet food and other pet-related products, was purchased during the fiscal year and contributed to the Fund’s performance. The stock went public to significant investor interest due to its strong brand recognition, subscription-heavy model, and brand and industry barriers to new entrants. We like the high reoccurring revenue from pet-product sales and what we view as Chewy’s competitive position in the pet-supply area. While profit margins are low today as Chewy invests in fulfillment and brand recognition, we see the upside potential over time to financial metrics and to the stock as customer lifetime value grows with each new cohort of customers.
Nevro Corp., a global medical device company that is providing innovative, evidence-based solutions for the treatment of chronic pain conditions, was a contributor to performance during the fiscal year end. The company’s results in 2019 have confirmed the business is turning around rapidly under new CEO Keith Grossman, with the company reporting better revenue than expected and showing an inflection in leading indicators such as implant trials. The company is on track to launch its new Omnia product by the end of the year which we believe will further accelerate both overall market growth and Nevro’s market share gains.
Farfetch Ltd., a UK-based online retail business selling multi-brand digital luxury goods in 122 countries, detracted from the Fund’s performance. The company announced an unexpected acquisition of New Guards Group, owner of Off-White, which caught investors by surprise. This acquisition gives Farfetch exclusive rights to sell Off-White goods that attract a younger demographic and adds exposure to this demographic for its other customers. Additionally, Farfetch announced it faced greater headwinds from increased promotions by both offline and online retailers. This pressure is expected to be temporary, lasting two-to-four quarters, as brands withdraw inventory from the wholesale channel and continue to accelerate supply growth at Farfetch. Lastly, the company announced the departure of its chief operating officer. While each of these events can be reasonably explained, we believe the clustering of these negative data points in a single quarter has damaged management’s credibility in its first year as a public company. We remain constructive on Farfetch’s long-term opportunity to be the primary destination for online, multi-brand shopping in the luxury segment, but are carefully evaluating recent events.
Jackson Square Select 20 Growth Fund
Liberty TripAdvisor Holdings Inc., a travel website providing travel advice and planning features, detracted from the Fund’s performance during the fiscal year. The company’s hotel segment has struggled against competitive headwinds, including increased challenges from Google’s search business. That said, we believe Liberty TripAdvisor Holdings’ commitment to increased focus on its experiences and dining products – a growing business line that enhances the company’s overall profitability – is the right strategic move. We continue to monitor the fundamentals closely.
LiveRamp Holdings Inc., a global technology and enablement-services company, also weighed on the Fund’s performance during the fiscal year. Despite slightly disappointing earnings, we believe recent stock weakness can be partly attributed to concerns about upcoming changes to Google Chrome’s security policy. That said, the absence of third-party cookie data as a result of changes in security policy should increase the relative value of first-party data for marketers. Further, the company announced that it had agreed to acquire Data Plus Math Corp., raising questions among investors regarding execution risk. Although we remain untroubled on its merits, we will monitor the acquisition. We continue to believe that LiveRamp Holdings is well-positioned to drive value over the long term given the combination of new management, an attractive software-as-a-service (SaaS) data platform, and a strong balance sheet with excess cash.
Jackson Square Select 20 Growth Fund
Value of $1,000,000 Investment (Unaudited)
The chart assumes an initial investment of $1,000,000. Performance reflects waivers of fee and operating expenses in effect. In the absence of such waivers, total return would be reduced. Past performance is not predictive of future performance. Investment return and principal value will fluctuate, so that your shares, when redeemed may be worth more or less than their original cost. Performance assumes the reinvestment of capital gains and income distributions. The performance does not reflect the deduction of taxes that a shareholder would pay on Fund distributions or the redemption of Fund shares.
Annualized Rates of Return as of October 31, 2019
| | 1 year | 5 years | 10 years | Since Inception(1) |
| IS Class | 10.47% | 7.29% | 12.55% | 3.37% |
Russell 3000® Growth Index(2) | 16.34% | 13.05% | 15.26% | 4.55% |
| (1) | The IS Class commenced operations on March 31, 2000. |
| (2) | The Russell 3000® Growth Index measures the growth segment of the U.S. equity universe. It includes those Russell 3000® Index composites with higher price-to-book ratios and higher forecasted growth values. One cannot invest directly in an Index. |
Jackson Square Select 20 Growth Fund
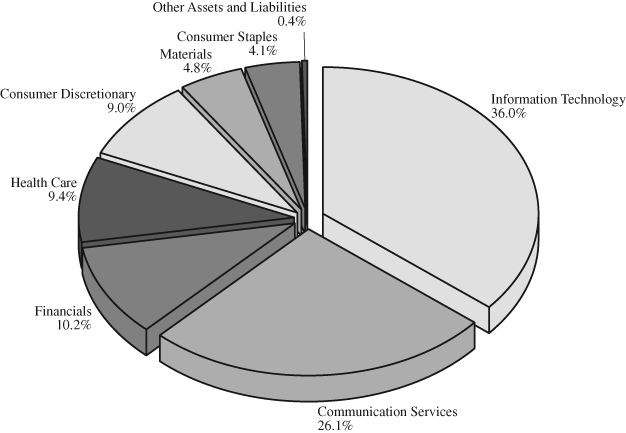
Sector Allocation(1) (Unaudited)
As of October 31, 2019
(% of Net Assets)
Top Ten Equity Holdings(1) (Unaudited)
As of October 31, 2019
(% of Net Assets)
| | Microsoft | | | 11.9 | % |
| | Visa – Class A | | | 6.7 | % |
| | New York Times – Class A | | | 6.0 | % |
| | GCI Liberty – Class A | | | 6.0 | % |
| | KKR & Co. – Class A | | | 5.8 | % |
| | LiveRamp Holdings | | | 4.9 | % |
| | Hasbro | | | 4.8 | % |
| | Autodesk | | | 4.8 | % |
| | Ball | | | 4.7 | % |
| | TripAdvisor | | | 4.7 | % |
| (1) | Fund holdings and sector allocations are subject to change at any time and are not recommendations to buy or sell any security. |
Jackson Square SMID-Cap Growth Fund
Jackson Square SMID-Cap Growth Fund (the “SMID-Cap Growth Fund”)
Within the Fund
For the fiscal year ended Oct. 31, 2019, SMID-Cap Growth Fund IS, Institutional and Investor Class shares gained 14.02%, 14.08% and 13.69%, respectively. These figures reflect all distributions reinvested. During the same period, the Fund’s benchmark, the Russell 2500® Growth Index, rose 11.77%. For complete, annualized performance of Jackson Square SMID-Cap Growth Fund, please see the table on page 20.
Strong relative performance in Financials outperformed weak relative performance in communication services. On a stock-specific level, the following were the most significant contributors and detractors during the period.
Coupa Software, Inc., a cloud platform for business spend management, was a contributor to performance during the fiscal year. The company continued to reported strong earnings, demonstrating 50% billings growth, beating consensus expectations by 22%. The company also signed USPS as its first federal customer. We believe that Coupa Software is moving rapidly from an early stage disruptor start-up to a gold-standard choice for procurement teams in large enterprises.
LendingTree, Inc., an online loan marketplace, was a contributor to performance during the fiscal year. With the Federal Reserve lowering interest rates during 2019, mortgage activity has increased and has allowed individuals to refinance or purchase a home more quickly and to lock-in costs. We believe this positive mortgage data has encouraged investors to question the pervading bear thesis in 2018 around the lending industry. We continue to believe that LendingTree will not only continue to be a leader in online loan referrals, but will also strengthen its business model by successfully diversifying its product offerings.
Paycom Software, Inc., an online payroll and human resource technology company, was a contributor to performance during the fiscal year. The company raised earnings expectations guidance and is performing well operationally through the year. We continue to believe Paycom is a unique human resources software business with strong profitability that is taking share from legacy incumbents due to its SaaS platform and unique sales culture led by the company’s founder.
Farfetch Ltd., a UK-based online retail business selling multi-brand digital luxury goods in 122 countries, detracted from the Fund’s performance. The company announced an unexpected acquisition of New Guards Group, owner of Off-White, which caught investors by surprise. This acquisition gives Farfetch exclusive rights to sell Off-White goods that attract a younger demographic and adds exposure to this demographic for its other customers. Additionally, Farfetch announced it faced greater headwinds from increased promotions by both offline and online retailers. This pressure is expected to be temporary, lasting two-to-four quarters, as brands withdraw inventory from the wholesale channel and continue to accelerate supply growth at Farfetch. Lastly, the company announced the departure of its chief operating officer. While each of these events can be reasonably explained, we believe the clustering of these negative data points in a single quarter has damaged management’s credibility in its first year as a public company. We remain constructive on Farfetch’s long-term opportunity to be the primary destination for online, multi-brand shopping in the luxury segment, but are carefully evaluating recent events.
Cars.com, Inc., an automotive classified site, was a detractor from performance during the fiscal year. While desktop and mobile traffic continue to improve, revenue growth has remained challenged and the fundamentals have deteriorated in the most recent quarter. We had hoped activist activity and a strategic review to catalyze new management or the potential sale of the company could happen, but it has not materialized. Therefore, we have moved on from the position.
Jackson Square SMID-Cap Growth Fund
LiveRamp Holdings Inc., a global technology and enablement-services company, also weighed on the Fund’s performance during the fiscal year. Despite slightly disappointing earnings, we believe recent stock weakness can be partly attributed to concerns about upcoming changes to Google Chrome’s security policy. That said, the absence of third-party cookie data as a result of changes in security policy should increase the relative value of first-party data for marketers. Further, the company announced that it had agreed to acquire Data Plus Math Corp., raising questions among investors regarding execution risk. Although we remain untroubled on its merits, we will monitor the acquisition. We continue to believe that LiveRamp Holdings is well-positioned to drive value over the long term given the combination of new management, an attractive software-as-a-service (SaaS) data platform, and a strong balance sheet with excess cash.
Jackson Square SMID-Cap Growth Fund
Value of $1,000,000 Investment (Unaudited)
The chart assumes an initial investment of $1,000,000. Performance reflects waivers of fee and operating expenses in effect. In the absence of such waivers, total return would be reduced. Past performance is not predictive of future performance. Investment return and principal value will fluctuate, so that your shares, when redeemed may be worth more or less than their original cost. Performance assumes the reinvestment of capital gains and income distributions. The performance does not reflect the deduction of taxes that a shareholder would pay on Fund distributions or the redemption of Fund shares.
Annualized Rates of Returns as of October 31, 2019
| | 1 year | 5 years | 10 years | Since Inception(1) |
| IS Class | 14.02% | 12.67% | 16.64% | 11.26% |
| Institutional Class | 14.08% | 12.62% | 16.56% | 11.16% |
| Investor Class | 13.69% | 12.30% | 16.25% | 10.88% |
Russell 2500® Growth Index(2) | 11.77% | 9.83% | 14.42% | 9.59% |
| (1) | The IS Class commenced operations on December 1, 2003, the Institutional Class commenced operations on September 16, 2016 and the Investor Class commenced operations on September 19, 2016. Performance of the Institutional Class and Investor Class prior to inception of each class is based on the performance of the IS Class, adjusted for the higher expenses applicable to each class’ shares. |
| (2) | The Russell 2500® Growth Index measures the performance of the small to mid-cap growth segment of the U.S. equity universe. It includes those Russell 2500® companies with higher price-to-book ratios and higher forecasted growth values. One cannot invest directly in an Index. |
Jackson Square SMID-Cap Growth Fund
Sector Allocation(1) (Unaudited)
As of October 31, 2019
(% of Net Assets)
Top Ten Equity Holdings(1) (Unaudited)
As of October 31, 2019
(% of Net Assets)
| | New York Times – Class A | | | 6.6 | % |
| | Equity Commonwealth – REIT | | | 5.4 | % |
| | Bio-Techne | | | 5.0 | % |
| | GCI Liberty – Class A | | | 4.9 | % |
| | j2 Global | | | 4.8 | % |
| | Guidewire Software | | | 4.6 | % |
| | Wyndham Hotels & Resorts | | | 4.4 | % |
| | Dunkin’ Brands Group | | | 4.3 | % |
| | LiveRamp Holdings | | | 4.3 | % |
| | Papa John’s International | | | 3.6 | % |
| (1) | Fund holdings and sector allocations are subject to change at any time and are not recommendations to buy or sell any security. |
Jackson Square Funds
Expense Examples (Unaudited)
October 31, 2019
As a shareholder of a Fund, you incur two types of costs: (1) transactions costs, including brokerage commissions on purchases and sales of Fund shares, and (2) ongoing costs, including management fees; distribution and/or service (12b-1) fees, shareholder servicing fees; interest expense, and other Fund expenses. This Example is intended to help you understand your ongoing costs (in dollars) of investing in the Fund and to compare these costs with the ongoing costs of investing in other mutual funds. The Example is based on an investment of $1,000 invested at the beginning of the period and held for the entire period (May 1, 2019 – October 31, 2019).
ACTUAL EXPENSES
For each class, the first line of the table provides information about actual account values and actual expenses. You may use the information in this line, together with the amount you invested, to estimate the expenses that you paid over the period. Simply divide your account value by $1,000 (for example, an $8,600 account value divided by $1,000 = 8.6), then multiply the result by the number in the first line under the heading entitled “Expenses Paid During Period” to estimate the expenses you paid on your account during this period.
HYPOTHETICAL EXAMPLE FOR COMPARISON PURPOSES
For each class, the second line of the table below provides information about hypothetical account values and hypothetical expenses based on the Fund’s actual expense ratio and an assumed rate of return of 5% per year before expenses, which is not the Fund’s actual return. The hypothetical account values and expenses may not be used to estimate the actual ending account balance or expenses you paid for the period.You may use this information to compare the ongoing costs of investing in the Fund and other funds. To do so, compare this 5% hypothetical example with the 5% hypothetical examples that appear in the shareholder reports of the other funds.
Please note that the expenses shown in the tables are meant to highlight your ongoing costs only. Therefore, the second line of the tables are useful in comparing ongoing costs only, and will not help you determine the relative total costs of owning different funds, In addition, if transactional costs were included, your costs may have been higher.
All-Cap Growth Fund
| | Beginning | Ending | Expenses Paid |
| | Account Value | Account Value | During Period(1) |
| | (5/1/2019) | (10/31/2019) | (5/1/2019 to 10/31/2019) |
IS Class Actual(2) | $1,000.00 | $ 986.00 | $4.51 |
| IS Class Hypothetical | | | |
| (5% return before expenses) | $1,000.00 | $1,020.67 | $4.58 |
| (1) | Expenses are equal to the Fund’s annualized expense ratio for the most recent six-month period of 0.90% for the IS Class, multiplied by the average account value over the period, multiplied by 184/365 to reflect the one-half year period. |
| (2) | Based on the actual returns for the six-month period ended October 31, 2019 of -1.40% for the IS Class. |
Jackson Square Funds
Expense Examples (Unaudited) – Continued
October 31, 2019
Global Growth Fund
| | Beginning | Ending | Expenses Paid |
| | Account Value | Account Value | During Period(1) |
| | (5/1/2019) | (10/31/2019) | (5/1/2019 to 10/31/2019) |
IS Class Actual(2) | $1,000.00 | $1,020.20 | $5.35 |
| IS Class Hypothetical | | | |
| (5% return before expenses) | $1,000.00 | $1,019.91 | $5.35 |
Institutional Class Actual(2) | $1,000.00 | $1,020.30 | $5.35 |
| Institutional Class Hypothetical | | | |
| (5% return before expenses) | $1,000.00 | $1,019.91 | $5.35 |
| (1) | Expenses are equal to the Fund’s annualized expense ratio for the most recent six-month period of 1.05% and 1.05% for the IS Class and Institutional Class, respectively, multiplied by the average account value over the period, multiplied by 184/365 to reflect the one-half year period. |
| (2) | Based on the actual returns for the six-month period ended October 31, 2019 of 2.02% and 2.03% for the IS Class and Institutional Class, respectively. |
Large-Cap Growth Fund
| | Beginning | Ending | Expenses Paid |
| | Account Value | Account Value | During Period(3) |
| | (5/1/2019) | (10/31/2019) | (5/1/2019 to 10/31/2019) |
IS Class Actual(4) | $1,000.00 | $1,027.40 | $3.27 |
| IS Class Hypothetical | | | |
| (5% return before expenses) | $1,000.00 | $1,021.98 | $3.26 |
Institutional Class Actual(4) | $1,000.00 | $1,028.30 | $3.27 |
| Institutional Class Hypothetical | | | |
| (5% return before expenses) | $1,000.00 | $1,021.98 | $3.26 |
Investor Class Actual(4) | $1,000.00 | $1,026.60 | $4.55 |
| Investor Class Hypothetical | | | |
| (5% return before expenses) | $1,000.00 | $1,020.72 | $4.53 |
| (3) | Expenses are equal to the Fund’s annualized expense ratio for the most recent six-month period of 0.64%, 0.64% and 0.89% for the IS Class, Institutional Class and Investor Class, respectively, multiplied by the average account value over the period, multiplied by 184/365 to reflect the one-half year period. |
| (4) | Based on the actual returns for the six-month period ended October 31, 2019 of 2.74%, 2.83% and 2.66% for the IS Class, Institutional Class and Investor Class, respectively. |
Jackson Square Funds
Expense Examples (Unaudited) – Continued
October 31, 2019
Select 20 Growth Fund
| | Beginning | Ending | Expenses Paid |
| | Account Value | Account Value | During Period(1) |
| | (5/1/2019) | (10/31/2019) | (5/1/2019 to 10/31/2019) |
IS Class Actual(2) | $1,000.00 | $ 985.50 | $4.35 |
| IS Class Hypothetical | | | |
| (5% return before expenses) | $1,000.00 | $1,020.82 | $4.43 |
| (1) | Expenses are equal to the Fund’s annualized expense ratio for the most recent six-month period of 0.87% for the IS Class, multiplied by the average account value over the period, multiplied by 184/365 to reflect the one-half year period. |
| (2) | Based on the actual returns for the six-month period ended October 31, 2019 of -1.45% for the IS Class. |
SMID-Cap Growth Fund
| | Beginning | Ending | Expenses Paid |
| | Account Value | Account Value | During Period(3) |
| | (5/1/2019) | (10/31/2019) | (5/1/2019 to 10/31/2019) |
IS Class Actual(4) | $1,000.00 | $ 957.90 | $4.29 |
| IS Class Hypothetical | | | |
| (5% return before expenses) | $1,000.00 | $1,020.82 | $4.43 |
Institutional Class Actual(4) | $1,000.00 | $ 957.50 | $4.69 |
| Institutional Class Hypothetical | | | |
| (5% return before expenses) | $1,000.00 | $1,020.42 | $4.84 |
Investor Class Actual(4) | $1,000.00 | $ 956.00 | $6.01 |
| Investor Class Hypothetical | | | |
| (5% return before expenses) | $1,000.00 | $1,019.06 | $6.21 |
| (3) | Expenses are equal to the Fund’s annualized expense ratio for the most recent six-month period of 0.87%, 0.95% and 1.22% for the IS Class, Institutional Class and Investor Class, respectively, multiplied by the average account value over the period, multiplied by 184/365 to reflect the one-half year period. |
| (4) | Based on the actual returns for the six-month period ended October 31, 2019 of -4.21%, -4.25% and -4.40% for the IS Class, Institutional Class and Investor Class, respectively. |
Jackson Square All-Cap Growth Fund
Schedule of Investments
October 31, 2019
Description | | Shares | | | Value | |
| | | | | | | |
| COMMON STOCKS – 98.1% | | | | | | |
| | | | | | | |
| Communication Services – 18.8% | | | | | | |
Alphabet – Class A* | | | 18 | | | $ | 22,658 | |
Alphabet – Class C* | | | 18 | | | | 22,682 | |
Charter Communications – Class A* | | | 424 | | | | 198,373 | |
GCI Liberty – Class A* | | | 468 | | | | 32,751 | |
Liberty Global – Series C* (a) | | | 3,299 | | | | 78,747 | |
Liberty TripAdvisor Holdings – Series A* | | | 7,150 | | | | 68,998 | |
Netflix* | | | 235 | | | | 67,541 | |
New York Times – Class A | | | 14,708 | | | | 454,477 | |
Take-Two Interactive Software* | | | 1,139 | | | | 137,079 | |
TripAdvisor* | | | 1,118 | | | | 45,167 | |
| | | | | | | | 1,128,473 | |
| | | | | | | | | |
| Consumer Discretionary – 14.1% | | | | | | | | |
Afya – Class A* | | | 164 | | | | 4,428 | |
Alibaba Group Holding – ADR* | | | 124 | | | | 21,907 | |
Arco Platform – Class A* | | | 398 | | | | 16,517 | |
Chewy – Class A* | | | 1,894 | | | | 46,725 | |
Dollar Tree* | | | 1,727 | | | | 190,661 | |
Domino’s Pizza | | | 47 | | | | 12,766 | |
Dunkin’ Brands Group | | | 536 | | | | 42,140 | |
Farfetch – Class A* | | | 3,130 | | | | 27,951 | |
Hasbro | | | 1,522 | | | | 148,106 | |
Papa John’s International | | | 2,003 | | | | 117,276 | |
Stitch Fix – Class A* | | | 4,883 | | | | 111,625 | |
Wyndham Hotels & Resorts | | | 1,980 | | | | 106,860 | |
| | | | | | | | 846,962 | |
| | | | | | | | | |
| Consumer Staples – 2.5% | | | | | | | | |
Constellation Brands – Class A | | | 776 | | | | 147,696 | |
| | | | | | | | | |
| Energy – 0.3% | | | | | | | | |
Kinder Morgan | | | 856 | | | | 17,103 | |
| | | | | | | | | |
| Financials – 8.4% | | | | | | | | |
Charles Schwab | | | 3,601 | | | | 146,597 | |
CME Group | | | 626 | | | | 128,799 | |
KKR & Co. – Class A | | | 7,482 | | | | 215,706 | |
LendingTree* | | | 28 | | | | 10,076 | |
| | | | | | | | 501,178 | |
See Notes to the Financial Statements
Jackson Square All-Cap Growth Fund
Schedule of Investments – Continued
October 31, 2019
Description | | Shares | | | Value | |
| | | | | | | |
| COMMON STOCKS – 98.1% (Continued) | | | | | | |
| | | | | | | |
| Health Care – 11.9% | | | | | | |
ABIOMED* | | | 140 | | | $ | 29,061 | |
Biogen* | | | 233 | | | | 69,599 | |
Haemonetics* | | | 356 | | | | 42,980 | |
HealthEquity* | | | 1,411 | | | | 80,131 | |
Illumina* | | | 385 | | | | 113,775 | |
IQVIA Holdings* | | | 1,237 | | | | 178,648 | |
Nevro* | | | 100 | | | | 8,620 | |
Portola Pharmaceuticals* | | | 1,602 | | | | 46,314 | |
UnitedHealth Group | | | 572 | | | | 144,544 | |
| | | | | | | | 713,672 | |
| | | | | | | | | |
| Industrials – 4.4% | | | | | | | | |
Airbus (a)(b) | | | 298 | | | | 42,750 | |
Expeditors International of Washington | | | 567 | | | | 41,357 | |
Experian (a)(b) | | | 739 | | | | 23,294 | |
IHS Markit* | | | 555 | | | | 38,861 | |
Safran (a)(b) | | | 417 | | | | 66,049 | |
Waste Management | | | 484 | | | | 54,310 | |
| | | | | | | | 266,621 | |
| | | | | | | | | |
Information Technology – 32.6%# | | | | | | | | |
Amadeus IT Group (a)(b) | | | 63 | | | | 4,661 | |
Applied Materials | | | 851 | | | | 46,175 | |
Arista Networks* | | | 347 | | | | 84,866 | |
ASML Holding (a)(b) | | | 53 | | | | 13,892 | |
Autodesk* | | | 1,104 | | | | 162,685 | |
Coupa Software* | | | 97 | | | | 13,337 | |
Guidewire Software* | | | 202 | | | | 22,773 | |
IPG Photonics* | | | 67 | | | | 8,997 | |
j2 Global | | | 698 | | | | 66,282 | |
LiveRamp Holdings* | | | 7,763 | | | | 303,456 | |
Logitech International (a)(b) | | | 1,016 | | | | 41,704 | |
Mastercard – Class A | | | 490 | | | | 135,637 | |
Microsoft | | | 3,494 | | | | 500,935 | |
Paycom Software* | | | 37 | | | | 7,827 | |
PayPal Holdings* | | | 944 | | | | 98,270 | |
SailPoint Technologies Holding* | | | 451 | | | | 8,731 | |
Samsung Electronics (a)(b) | | | 364 | | | | 15,732 | |
ServiceNow* | | | 127 | | | | 31,402 | |
Ubisoft Entertainment* (a)(b) | | | 85 | | | | 5,023 | |
See Notes to the Financial Statements
Jackson Square All-Cap Growth Fund
Schedule of Investments – Continued
October 31, 2019
Description | | Shares | | | Value | |
| | | | | | | |
| COMMON STOCKS – 98.1% (Continued) | | | | | | |
| | | | | | | |
Information Technology – 32.6%# (Continued) | | | | | | |
Varonis Systems* | | | 2,350 | | | $ | 168,143 | |
Visa – Class A | | | 906 | | | | 162,047 | |
Wix.com* | | | 417 | | | | 50,903 | |
| | | | | | | | 1,953,478 | |
| | | | | | | | | |
| Materials – 3.6% | | | | | | | | |
Ball | | | 3,068 | | | | 214,668 | |
| | | | | | | | | |
| Real Estate – 1.5% | | | | | | | | |
Crown Castle International – REIT | | | 152 | | | | 21,096 | |
Equity Commonwealth – REIT | | | 469 | | | | 15,093 | |
Redfin* | | | 3,016 | | | | 52,448 | |
| | | | | | | | 88,637 | |
| | | | | | | | | |
| TOTAL COMMON STOCKS | | | | | | | | |
| (Cost $4,957,380) | | | | | | | 5,878,488 | |
| Total Investments – 98.1% | | | | | | | | |
| (Cost $4,957,380) | | | | | | | 5,878,488 | |
| Other Assets and Liabilities, Net – 1.9% | | | | | | | 111,465 | |
| Total Net Assets – 100.0% | | | | | | $ | 5,989,953 | |
| * | | Non-income producing security. |
| (a) | | Foreign Security. |
| (b) | | Level 2 Security. |
| # | | As of October 31, 2019, the Fund had a significant portion of its assets invested in this sector and therefore is subject to additional risks. See Note 10 in Notes to the Financial Statements. |
ADR – American Depositary Receipt
REIT – Real Estate Investment Trust
The Global Industry Classification Standard (GICS®) was developed by and/or is the exclusive property of MSCI, Inc. (“MSCI”) and Standard & Poor’s Financial Services LLC (“S&P”). GICS® is a service mark of MSCI and S&P and has been licensed for use.
See Notes to the Financial Statements
Jackson Square Global Growth Fund
Schedule of Investments
October 31, 2019
Description | | Shares | | | Value | |
| | | | | | | |
| COMMON STOCKS – 98.0% | | | | | | |
| | | | | | | |
| Brazil – 7.3% | | | | | | |
Afya – Class A* | | | 4,714 | | | $ | 127,278 | |
Arco Platform – Class A* | | | 5,921 | | | | 245,721 | |
Localiza Rent a Car | | | 26,276 | | | | 281,727 | |
MercadoLibre* | | | 384 | | | | 200,264 | |
| | | | | | | | 854,990 | |
| | | | | | | | | |
| Denmark – 2.5% | | | | | | | | |
DSV (a) | | | 3,029 | | | | 294,386 | |
| | | | | | | | | |
| France – 8.8% | | | | | | | | |
Airbus (a) | | | 3,679 | | | | 527,783 | |
Safran (a) | | | 1,909 | | | | 302,367 | |
Ubisoft Entertainment* (a) | | | 3,356 | | | | 198,337 | |
| | | | | | | | 1,028,487 | |
| | | | | | | | | |
| Israel – 1.8% | | | | | | | | |
Wix.com* | | | 1,696 | | | | 207,031 | |
| | | | | | | | | |
| Japan – 5.5% | | | | | | | | |
MonotaRO (a) | | | 9,637 | | | | 291,140 | |
Otsuka Holdings (a) | | | 8,506 | | | | 354,617 | |
| | | | | | | | 645,757 | |
| | | | | | | | | |
| Netherlands – 2.6% | | | | | | | | |
ASML Holding (a) | | | 1,170 | | | | 306,674 | |
| | | | | | | | | |
| South Korea – 2.5% | | | | | | | | |
Samsung Electronics (a) | | | 6,590 | | | | 284,819 | |
| | | | | | | | | |
| Spain – 2.2% | | | | | | | | |
Amadeus IT Group (a) | | | 3,384 | | | | 250,342 | |
| | | | | | | | | |
| United Kingdom – 9.6% | | | | | | | | |
Experian (a) | | | 12,276 | | | | 386,957 | |
InterContinental Hotels Group (a) | | | 4,027 | | | | 243,694 | |
Intertek Group (a) | | | 3,925 | | | | 272,144 | |
Liberty Global – Series C* | | | 9,289 | | | | 221,728 | |
| | | | | | | | 1,124,523 | |
| | | | | | | | | |
| United States – 55.2% | | | | | | | | |
Ball | | | 4,473 | | | | 312,976 | |
CME Group | | | 1,756 | | | | 361,297 | |
Guidewire Software* | | | 2,642 | | | | 297,859 | |
Haemonetics* | | | 2,958 | | | | 357,119 | |
See Notes to the Financial Statements
Jackson Square Global Growth Fund
Schedule of Investments – Continued
October 31, 2019
Description | | Shares | | | Value | |
| | | | | | | |
| COMMON STOCKS – 98.0% (Continued) | | | | | | |
| | | | | | | |
| United States – 55.2% (Continued) | | | | | | |
HealthEquity* | | | 4,288 | | | $ | 243,516 | |
IHS Markit* | | | 4,414 | | | | 309,068 | |
Illumina* | | | 904 | | | | 267,150 | |
IPG Photonics* | | | 1,816 | | | | 243,852 | |
IQVIA Holdings* | | | 3,149 | | | | 454,779 | |
KKR & Co. – Class A | | | 12,646 | | | | 364,584 | |
LiveRamp Holdings* | | | 5,022 | | | | 196,310 | |
Mastercard – Class A | | | 1,833 | | | | 507,393 | |
Microsoft | | | 3,944 | | | | 565,451 | |
Netflix* | | | 934 | | | | 268,441 | |
New York Times – Class A | | | 15,162 | | | | 468,506 | |
PayPal Holdings* | | | 2,555 | | | | 265,976 | |
TripAdvisor* | | | 4,669 | | | | 188,628 | |
UnitedHealth Group | | | 1,179 | | | | 297,933 | |
Visa – Class A | | | 2,644 | | | | 472,906 | |
| | | | | | | | 6,443,744 | |
| | | | | | | | | |
| TOTAL COMMON STOCKS | | | | | | | | |
| (Cost $8,704,669) | | | | | | | 11,440,753 | |
| Total Investments – 98.0% | | | | | | | | |
| (Cost $8,704,669) | | | | | | | 11,440,753 | |
| Other Assets and Liabilities, Net – 2.0% | | | | | | | 228,372 | |
| Total Net Assets – 100.0% | | | | | | $ | 11,669,125 | |
| * | | Non-income producing security. |
| (a) | | Level 2 Security. |
The Global Industry Classification Standard (GICS®) was developed by and/or is the exclusive property of MSCI, Inc. (“MSCI”) and Standard & Poor’s Financial Services LLC (“S&P”). GICS® is a service mark of MSCI and S&P and has been licensed for use.
See Notes to the Financial Statements
Jackson Square Global Growth Fund
Schedule of Investments – Continued
October 31, 2019
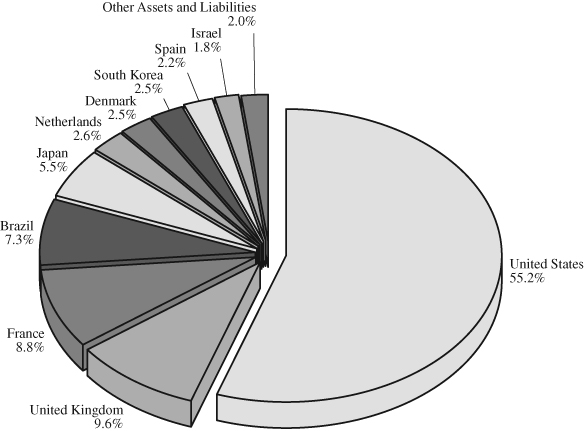
At October 31, 2019, the sector diversification for the Fund was as follows:
| | | % of | |
| Sector | | Net Assets | |
Information Technology# | | | 32.5 | % |
Industrials | | | 22.9 | % |
Health Care | | | 16.9 | % |
Communication Services | | | 9.8 | % |
Consumer Discretionary | | | 7.0 | % |
Financials | | | 6.2 | % |
Materials | | | 2.7 | % |
Other Assets and Liabilities, Net | | | 2.0 | % |
Total | | | 100.0 | % |
| # | As of October 31, 2019, the Fund has a significant portion of its assets invested in this sector and therefore is subject to additional risks. See Note 10 in Notes to the Financial Statements. |
See Notes to the Financial Statements
Jackson Square Large-Cap Growth Fund
Schedule of Investments
October 31, 2019
Description | | Shares | | | Value | |
| | | | | | | |
| COMMON STOCKS – 99.9% | | | | | | |
| | | | | | | |
| Communication Services – 19.6% | | | | | | |
Alphabet – Class A* | | | 2,337 | | | $ | 2,941,816 | |
Charter Communications – Class A* | | | 7,891 | | | | 3,691,883 | |
Liberty Global – Series C* (a) | | | 109,166 | | | | 2,605,793 | |
Netflix* | | | 7,066 | | | | 2,030,839 | |
Take-Two Interactive Software* | | | 18,504 | | | | 2,226,956 | |
TripAdvisor* | | | 28,315 | | | | 1,143,926 | |
| | | | | | | | 14,641,213 | |
| | | | | | | | | |
| Consumer Discretionary – 12.1% | | | | | | | | |
Dollar Tree* | | | 32,495 | | | | 3,587,448 | |
Domino’s Pizza | | | 8,670 | | | | 2,354,946 | |
Hasbro | | | 32,272 | | | | 3,140,388 | |
| | | | | | | | 9,082,782 | |
| | | | | | | | | |
| Consumer Staples – 4.8% | | | | | | | | |
Constellation Brands – Class A | | | 18,809 | | | | 3,579,917 | |
| | | | | | | | | |
| Financials – 10.4% | | | | | | | | |
Charles Schwab | | | 55,672 | | | | 2,266,407 | |
CME Group | | | 9,407 | | | | 1,935,490 | |
KKR & Co. – Class A | | | 123,732 | | | | 3,567,194 | |
| | | | | | | | 7,769,091 | |
| | | | | | | | | |
| Health Care – 15.1% | | | | | | | | |
Biogen* | | | 5,388 | | | | 1,609,449 | |
Illumina* | | | 8,978 | | | | 2,653,179 | |
IQVIA Holdings* | | | 28,137 | | | | 4,063,546 | |
UnitedHealth Group | | | 11,872 | | | | 3,000,054 | |
| | | | | | | | 11,326,228 | |
| | | | | | | | | |
Information Technology – 30.6%# | | | | | | | | |
Applied Materials | | | 36,239 | | | | 1,966,328 | |
Arista Networks* | | | 7,845 | | | | 1,918,652 | |
Autodesk* | | | 14,075 | | | | 2,074,092 | |
Mastercard – Class A | | | 10,657 | | | | 2,949,964 | |
Microsoft | | | 53,412 | | | | 7,657,678 | |
PayPal Holdings* | | | 22,886 | | | | 2,382,433 | |
ServiceNow* | | | 4,782 | | | | 1,182,397 | |
Visa – Class A | | | 15,641 | | | | 2,797,549 | |
| | | | | | | | 22,929,093 | |
See Notes to the Financial Statements
Jackson Square Large-Cap Growth Fund
Schedule of Investments – Continued
October 31, 2019
Description | | Shares | | | Value | |
| | | | | | | |
| COMMON STOCKS – 99.9% (Continued) | | | | | | |
| | | | | | | |
| Materials – 5.5% | | | | | | |
Ball | | | 58,267 | | | $ | 4,076,942 | |
| | | | | | | | | |
| Real Estate – 1.8% | | | | | | | | |
Crown Castle International – REIT | | | 9,833 | | | | 1,364,722 | |
| TOTAL COMMON STOCKS | | | | | | | | |
| (Cost $64,147,526) | | | | | | | 74,769,988 | |
| Total Investments – 99.9% | | | | | | | | |
| (Cost $64,147,526) | | | | | | | 74,769,988 | |
| Other Assets and Liabilities, Net – 0.1% | | | | | | | 76,008 | |
| Total Net Assets – 100.0% | | | | | | $ | 74,845,996 | |
| * | | Non-income producing security. |
| (a) | | Foreign Security. |
| # | | As of October 31, 2019, the Fund had a significant portion of its assets invested in this sector and therefore is subject to additional risks. See Note 10 in Notes to the Financial Statements. |
REIT – Real Estate Investment Trust
The Global Industry Classification Standard (GICS®) was developed by and/or is the exclusive property of MSCI, Inc. (“MSCI”) and Standard & Poor’s Financial Services LLC (“S&P”). GICS® is a service mark of MSCI and S&P and has been licensed for use.
See Notes to the Financial Statements
Jackson Square Select 20 Growth Fund
Schedule of Investments
October 31, 2019
Description | | Shares | | | Value | |
| | | | | | | |
| COMMON STOCKS – 99.6% | | | | | | |
| | | | | | | |
Communication Services – 26.1%# | | | | | | |
GCI Liberty – Class A* | | | 4,694 | | | $ | 328,486 | |
Liberty Global – Series C* (a) | | | 10,946 | | | | 261,281 | |
New York Times – Class A | | | 10,689 | | | | 330,290 | |
Take-Two Interactive Software* | | | 2,166 | | | | 260,678 | |
TripAdvisor* | | | 6,475 | | | | 261,590 | |
| | | | | | | | 1,442,325 | |
| | | | | | | | | |
| Consumer Discretionary – 9.0% | | | | | | | | |
Dollar Tree* | | | 2,106 | | | | 232,502 | |
Hasbro | | | 2,738 | | | | 266,435 | |
| | | | | | | | 498,937 | |
| | | | | | | | | |
| Consumer Staples – 4.1% | | | | | | | | |
Constellation Brands – Class A | | | 1,192 | | | | 226,873 | |
| | | | | | | | | |
| Financials – 10.2% | | | | | | | | |
CME Group | | | 1,181 | | | | 242,991 | |
KKR & Co. – Class A | | | 11,102 | | | | 320,071 | |
| | | | | | | | 563,062 | |
| | | | | | | | | |
| Health Care – 9.4% | | | | | | | | |
IQVIA Holdings* | | | 1,780 | | | | 257,067 | |
Nevro* | | | 3,013 | | | | 259,721 | |
| | | | | | | | 516,788 | |
| | | | | | | | | |
Information Technology – 36.0%# | | | | | | | | |
Applied Materials | | | 3,889 | | | | 211,017 | |
Autodesk* | | | 1,803 | | | | 265,690 | |
LiveRamp Holdings* | | | 6,970 | | | | 272,457 | |
Microsoft | | | 4,566 | | | | 654,628 | |
Varonis Systems* | | | 3,042 | | | | 217,655 | |
Visa – Class A | | | 2,056 | | | | 367,736 | |
| | | | | | | | 1,989,183 | |
See Notes to the Financial Statements
Jackson Square Select 20 Growth Fund
Schedule of Investments – Continued
October 31, 2019
Description | | Shares | | | Value | |
| | | | | | | |
| COMMON STOCKS – 99.6% (Continued) | | | | | | |
| | | | | | | |
| Materials – 4.8% | | | | | | |
Ball | | | 3,747 | | | $ | 262,178 | |
| TOTAL COMMON STOCKS | | | | | | | | |
| (Cost $4,317,227) | | | | | | | 5,499,346 | |
| Total Investments – 99.6% | | | | | | | | |
| (Cost $4,317,227) | | | | | | | 5,499,346 | |
| Other Assets and Liabilities, Net – 0.4% | | | | | | | 20,343 | |
| Total Net Assets – 100.0% | | | | | | $ | 5,519,689 | |
| * | | Non-income producing security. |
| (a) | | Foreign Security. |
| # | | As of October 31, 2019, the Fund had a significant portion of its assets invested in this sector and therefore is subject to additional risks. See Note 10 in Notes to the Financial Statements. |
The Global Industry Classification Standard (GICS®) was developed by and/or is the exclusive property of MSCI, Inc. (“MSCI”) and Standard & Poor’s Financial Services LLC (“S&P”). GICS® is a service mark of MSCI and S&P and has been licensed for use.
See Notes to the Financial Statements
Jackson Square SMID-Cap Growth Fund
Schedule of Investments
October 31, 2019
Description | | Shares | | | Value | |
| | | | | | | |
| COMMON STOCKS – 95.0% | | | | | | |
| | | | | | | |
| Communication Services – 15.0% | | | | | | |
GCI Liberty – Class A* | | | 723,949 | | | $ | 50,661,951 | |
Liberty TripAdvisor Holdings – Series A* | | | 1,860,755 | | | | 17,956,286 | |
New York Times – Class A | | | 2,193,605 | | | | 67,782,394 | |
TripAdvisor* | | | 444,384 | | | | 17,953,114 | |
| | | | | | | | 154,353,745 | |
| | | | | | | | | |
| Consumer Discretionary – 16.7% | | | | | | | | |
Dunkin’ Brands Group | | | 566,403 | | | | 44,530,604 | |
Farfetch – Class A* | | | 1,887,280 | | | | 16,853,410 | |
Papa John’s International | | | 626,621 | | | | 36,688,660 | |
Stitch Fix – Class A* | | | 1,256,073 | | | | 28,713,829 | |
Wyndham Hotels & Resorts | | | 834,965 | | | | 45,063,061 | |
| | | | | | | | 171,849,564 | |
| | | | | | | | | |
| Financials – 2.7% | | | | | | | | |
LendingTree* | | | 77,252 | | | | 27,799,132 | |
| | | | | | | | | |
| Health Care – 17.7% | | | | | | | | |
ABIOMED* | | | 58,410 | | | | 12,124,748 | |
Bio-Techne | | | 246,816 | | | | 51,379,686 | |
Haemonetics* | | | 236,801 | | | | 28,588,985 | |
HealthEquity* | | | 572,429 | | | | 32,508,243 | |
Nevro* | | | 390,475 | | | | 33,658,945 | |
Portola Pharmaceuticals* | | | 852,431 | | | | 24,643,780 | |
| | | | | | | | 182,904,387 | |
| | | | | | | | | |
| Industrials – 5.1% | | | | | | | | |
Expeditors International of Washington | | | 349,857 | | | | 25,518,570 | |
Graco | | | 593,834 | | | | 26,841,297 | |
| | | | | | | | 52,359,867 | |
| | | | | | | | | |
Information Technology – 29.3%# | | | | | | | | |
Coupa Software* | | | 179,107 | | | | 24,625,421 | |
Guidewire Software* | | | 422,780 | | | | 47,664,217 | |
j2 Global | | | 516,513 | | | | 49,048,074 | |
LiveRamp Holdings* | | | 1,126,940 | | | | 44,052,085 | |
Logitech International (a)(b) | | | 697,323 | | | | 28,623,083 | |
Paycom Software* | | | 69,356 | | | | 14,670,875 | |
PTC* | | | 158,248 | | | | 10,588,374 | |
SailPoint Technologies Holding* | | | 903,102 | | | | 17,484,055 | |
Varonis Systems* | | | 459,390 | | | | 32,869,354 | |
Wix.com* | | | 265,490 | | | | 32,408,364 | |
| | | | | | | | 302,033,902 | |
See Notes to the Financial Statements
Jackson Square SMID-Cap Growth Fund
Schedule of Investments – Continued
October 31, 2019
Description | | Shares/Par | | | Value | |
| | | | | | | |
| COMMON STOCKS – 95.0% (Continued) | | | | | | |
| | | | | | | |
| Real Estate – 8.5% | | | | | | |
| Equity Commonwealth – REIT | | | 1,724,890 | | | $ | 55,506,960 | |
| Redfin* | | | 1,836,710 | | | | 31,940,387 | |
| | | | | | | | 87,447,347 | |
| | | | | | | | | |
| TOTAL COMMON STOCKS | | | | | | | | |
| (Cost $909,477,415) | | | | | | | 978,747,944 | |
| | | | | | | | | |
| SHORT-TERM INVESTMENTS – 2.3% | | | | | | | | |
| United States Treasury Bill | | | | | | | | |
| 1.445%, 12/19/2019 (b)^ | | $ | 16,500,000 | | | | 16,468,210 | |
| 1.528%, 03/05/2020 (b)^ | | | 7,880,000 | | | | 7,838,206 | |
| TOTAL SHORT-TERM INVESTMENTS | | | | | | | | |
| (Cost $24,285,736) | | | | | | | 24,306,416 | |
| Total Investments – 97.3% | | | | | | | | |
| (Cost $933,763,151) | | | | | | | 1,003,054,360 | |
| Other Assets and Liabilities, Net – 2.7% | | | | | | | 27,459,240 | |
| Total Net Assets – 100.0% | | | | | | $ | 1,030,513,600 | |
| * | | Non-income producing security. |
| (a) | | Foreign Security. |
| (b) | | Level 2 Security. |
| # | | As of October 31, 2019, the Fund had a significant portion of its assets invested in this sector and therefore is subject to additional risks. See Note 10 in Notes to the Financial Statements. |
| ^ | | The rate shown is the effective yield as of October 31, 2019. |
REIT – Real Estate Investment Trust
The Global Industry Classification Standard (GICS®) was developed by and/or is the exclusive property of MSCI, Inc. (“MSCI”) and Standard & Poor’s Financial Services LLC (“S&P”). GICS® is a service mark of MSCI and S&P and has been licensed for use.
See Notes to the Financial Statements
Jackson Square Funds
Statements of Assets and Liabilities
October 31, 2019
| | | All-Cap | | | Global | | | Large-Cap | |
| | | Growth Fund | | | Growth Fund | | | Growth Fund | |
| ASSETS: | | | | | | | | | |
| Investment securities: | | | | | | | | | |
| At cost | | $ | 4,957,380 | | | $ | 8,704,669 | | | $ | 64,147,526 | |
| At value | | $ | 5,878,488 | | | $ | 11,440,753 | | | $ | 74,769,988 | |
| Cash | | | 165,896 | | | | 254,478 | | | | 523,846 | |
| Receivable for investment securities sold | | | 2,536 | | | | — | | | | — | |
| Dividends receivable | | | 1,980 | | | | 5,461 | | | | 24,746 | |
| Receivable from investment adviser | | | 5,934 | | | | 2,747 | | | | — | |
| Prepaid expenses | | | 2,536 | | | | 3,033 | | | | 26,358 | |
| Total Assets | | | 6,057,370 | | | | 11,706,472 | | | | 75,344,938 | |
| LIABILITIES: | | | | | | | | | | | | |
| Payable for investment securities purchased | | | 34,913 | | | | — | | | | 430,971 | |
| Payable to investment adviser | | | — | | | | — | | | | 14,742 | |
| Payable for fund administration & accounting fees | | | 2,235 | | | | 3,651 | | | | 10,536 | |
| Payable for compliance fees | | | 44 | | | | 85 | | | | 872 | |
| Payable for transfer agent fees & expenses | | | 3,554 | | | | 6,197 | | | | 10,543 | |
| Payable for custody fees | | | 2,403 | | | | 2,503 | | | | 2,697 | |
| Payable for trustee fees | | | 119 | | | | 139 | | | | 221 | |
| Accrued distribution and/or shareholder service fees | | | — | | | | 42 | | | | 143 | |
| Payable for audit fees | | | 16,501 | | | | 16,998 | | | | 18,002 | |
| Payable for legal fees | | | 5,877 | | | | 5,875 | | | | 6,375 | |
| Accrued expenses | | | 1,771 | | | | 1,857 | | | | 3,840 | |
| Total Liabilities | | | 67,417 | | | | 37,347 | | | | 498,942 | |
| NET ASSETS | | $ | 5,989,953 | | | $ | 11,669,125 | | | $ | 74,845,996 | |
| NET ASSETS CONSIST OF: | | | | | | | | | | | | |
| Paid-in capital | | $ | 4,839,754 | | | $ | 8,708,239 | | | $ | 50,801,688 | |
| Total distributable earnings | | | 1,150,199 | | | | 2,960,886 | | | | 24,044,308 | |
| Total net assets | | $ | 5,989,953 | | | $ | 11,669,125 | | | $ | 74,845,996 | |
| | | | | | | | | | | | | |
IS Class Shares: | | | | | | | | | | | | |
| Net Assets | | $ | 5,989,953 | | | $ | 11,599,466 | | | $ | 72,149,469 | |
Shares issued and outstanding(1) | | | 265,070 | | | | 469,522 | | | | 6,016,705 | |
| Net asset value, offering price, and redemption price per share | | $ | 22.60 | | | $ | 24.70 | | | $ | 11.99 | |
| | | | | | | | | | | | | |
Institutional Class Shares: | | | | | | | | | | | | |
| Net Assets | | $ | — | | | $ | 69,659 | | | $ | 2,654,224 | |
Shares issued and outstanding(1) | | | — | | | | 2,822 | | | | 220,999 | |
| Net asset value, offering price, and redemption price per share | | $ | — | | | $ | 24.68 | | | $ | 12.01 | |
| | | | | | | | | | | | | |
Investor Class Shares: | | | | | | | | | | | | |
| Net Assets | | $ | — | | | $ | — | | | $ | 42,303 | |
Shares issued and outstanding(1) | | | — | | | | — | | | | 3,541 | |
| Net asset value, offering price, and redemption price per share | | $ | — | | | $ | — | | | $ | 11.95 | |
(1) | Unlimited shares authorized without par value |
See Notes to the Financial Statements
Jackson Square Funds
Statements of Assets and Liabilities – Continued
October 31, 2019
| | | Select 20 | | | SMID-Cap | |
| | | Growth Fund | | | Growth Fund | |
| ASSETS: | | | | | | |
| Investment securities: | | | | | | |
| At cost | | $ | 4,317,227 | | | $ | 933,763,151 | |
| At value | | $ | 5,499,346 | | | $ | 1,003,054,360 | |
| Cash | | | 54,782 | | | | 23,898,732 | |
| Dividends receivable | | | 4,179 | | | | 357,052 | |
| Receivable from investment adviser | | | 7,731 | | | | — | |
| Receivable for capital shares sold | | | — | | | | 4,252,124 | |
| Prepaid expenses | | | 11,035 | | | | 27,112 | |
| Total Assets | | | 5,577,073 | | | | 1,031,589,380 | |
| LIABILITIES: | | | | | | | | |
| Payable for investment securities purchased | | | 27,124 | | | | — | |
| Payable for capital shares redeemed | | | — | | | | 166,593 | |
| Payable to investment adviser | | | — | | | | 623,350 | |
| Payable for fund administration & accounting fees | | | 1,497 | | | | 102,989 | |
| Payable for compliance fees | | | 38 | | | | 7,015 | |
| Payable for transfer agent fees & expenses | | | 3,533 | | | | 19,603 | |
| Payable for custody fees | | | 1,001 | | | | 19,018 | |
| Payable for trustee fees | | | 134 | | | | 413 | |
| Accrued distribution and/or shareholder service fees | | | — | | | | 49,988 | |
| Payable for audit fees | | | 16,497 | | | | 18,002 | |
| Payable for legal fees | | | 5,879 | | | | 6,375 | |
| Accrued expenses | | | 1,681 | | | | 62,434 | |
| Total Liabilities | | | 57,384 | | | | 1,075,780 | |
| NET ASSETS | | $ | 5,519,689 | | | $ | 1,030,513,600 | |
| NET ASSETS CONSIST OF: | | | | | | | | |
| Paid-in capital | | $ | 3,944,734 | | | $ | 919,313,754 | |
| Total distributable earnings | | | 1,574,955 | | | | 111,199,846 | |
| Total net assets | | $ | 5,519,689 | | | $ | 1,030,513,600 | |
| | | | | | | | | |
IS Class Shares: | | | | | | | | |
| Net Assets | | $ | 5,519,689 | | | $ | 452,234,033 | |
Shares issued and outstanding(1) | | | 902,510 | | | | 18,936,253 | |
| Net asset value, offering price, and redemption price per share | | $ | 6.12 | | | $ | 23.88 | |
| | | | | | | | | |
Institutional Class Shares: | | | | | | | | |
| Net Assets | | $ | — | | | $ | 499,461,117 | |
Shares issued and outstanding(1) | | | — | | | | 20,908,533 | |
| Net asset value, offering price, and redemption price per share | | $ | — | | | $ | 23.89 | |
| | | | | | | | | |
Investor Class Shares: | | | | | | | | |
| Net Assets | | $ | — | | | $ | 78,818,450 | |
Shares issued and outstanding(1) | | | — | | | | 3,327,934 | |
| Net asset value, offering price, and redemption price per share | | $ | — | | | $ | 23.68 | |
(1) | Unlimited shares authorized without par value |
See Notes to the Financial Statements
Jackson Square Funds
Statements of Operations
For the Year Ended October 31, 2019
| | | All-Cap | | | Global | | | Large-Cap | |
| | | Growth Fund | | | Growth Fund | | | Growth Fund | |
| INVESTMENT INCOME: | | | | | | | | | |
| Dividend income | | $ | 42,600 | | | $ | 102,039 | | | $ | 906,866 | |
| Less: Foreign taxes withheld | | | (559 | ) | | | (5,988 | ) | | | (26,971 | ) |
| Interest income | | | — | | | | — | | | | 18,604 | |
| Total investment income | | | 42,041 | | | | 96,051 | | | | 898,499 | |
| | | | | | | | | | | | | |
| EXPENSES: | | | | | | | | | | | | |
| Investment advisory fees (See Note 4) | | | 37,490 | | | | 87,800 | | | | 610,338 | |
| Transfer agent fees & expenses (See Note 4) | | | 21,296 | | | | 37,223 | | | | 64,246 | |
| Audit fees | | | 16,494 | | | | 16,999 | | | | 18,006 | |
| Custody fees (See Note 4) | | | 14,784 | | | | 16,652 | | | | 16,316 | |
| Fund administration & accounting fees (See Note 4) | | | 14,131 | | | | 21,773 | | | | 85,995 | |
| Trustee fees | | | 13,878 | | | | 13,892 | | | | 14,039 | |
| Other expenses | | | 11,381 | | | | 11,429 | | | | 7,489 | |
| Legal fees | | | 7,414 | | | | 7,918 | | | | 8,269 | |
| Federal & state registration fees | | | 4,466 | | | | 5,616 | | | | 54,170 | |
| Postage & printing fees | | | 1,116 | | | | 1,207 | | | | 4,056 | |
| Compliance fees (See Note 4) | | | 295 | | | | 562 | | | | 6,028 | |
| Distribution and/or shareholder service fees (See Note 5) | | | | | | | | | | | | |
| Institutional Class | | | — | | | | — | | | | — | |
| Investor Class | | | — | | | | — | | | | 104 | |
| Total expenses before reimbursement/waiver | | | 142,745 | | | | 221,071 | | | | 889,056 | |
| Less: reimbursement/waiver from adviser (See Note 4) | | | (90,835 | ) | | | (105,833 | ) | | | (178,742 | ) |
| Total net expenses | | | 51,910 | | | | 115,238 | | | | 710,314 | |
| NET INVESTMENT INCOME (LOSS) | | | (9,869 | ) | | | (19,187 | ) | | | 188,185 | |
| | | | | | | | | | | | | |
| REALIZED AND UNREALIZED GAIN (LOSS) ON INVESTMENTS | | | | | | | | | | | | |
| AND TRANSLATIONS OF FOREIGN CURRENCY | | | | | | | | | | | | |
| Net realized gain on investments, including foreign currency gain (loss) | | | 251,265 | | | | 247,482 | | | | 19,553,135 | |
| Net change in unrealized appreciation/depreciation | | | | | | | | | | | | |
| of investments and translations of foreign currency | | | 379,637 | | | | 1,142,278 | | | | (4,323,129 | ) |
| Net realized and unrealized gain on investments | | | | | | | | | | | | |
| and translations of foreign currency | | | 630,902 | | | | 1,389,760 | | | | 15,230,006 | |
| | | | | | | | | | | | | |
| NET INCREASE IN NET ASSETS RESULTING FROM OPERATIONS | | $ | 621,033 | | | $ | 1,370,573 | | | $ | 15,418,191 | |
See Notes to the Financial Statements
Jackson Square Funds
Statements of Operations – Continued
For the Year Ended October 31, 2019
| | | Select 20 | | | SMID-Cap | |
| | | Growth Fund | | | Growth Fund | |
| INVESTMENT INCOME: | | | | | | |
| Dividend income | | $ | 41,227 | | | $ | 7,246,553 | |
| Less: Foreign taxes withheld | | | — | | | | (76,437 | ) |
| Interest income | | | — | | | | 352,979 | |
| Total investment income | | | 41,227 | | | | 7,523,095 | |
| | | | | | | | | |
| EXPENSES: | | | | | | | | |
| Investment advisory fees (See Note 4) | | | 34,261 | | | | 6,216,708 | |
| Federal & state registration fees | | | 25,712 | | | | 110,869 | |
| Transfer agent fees & expenses (See Note 4) | | | 21,198 | | | | 120,664 | |
| Audit fees | | | 16,501 | | | | 18,006 | |
| Trustee fees | | | 13,885 | | | | 14,916 | |
| Fund administration & accounting fees (See Note 4) | | | 8,235 | | | | 532,898 | |
| Legal fees | | | 7,415 | | | | 8,269 | |
| Other expenses | | | 7,145 | | | | 11,416 | |
| Custody fees (See Note 4) | | | 5,685 | | | | 102,343 | |
| Postage & printing fees | | | 1,102 | | | | 26,200 | |
| Compliance fees (See Note 4) | | | 260 | | | | 40,920 | |
| Distribution and/or shareholder service fees (See Note 5) | | | | | | | | |
| Institutional Class | | | — | | | | 324,475 | |
| Investor Class | | | — | | | | 298,603 | |
| Total expenses before interest expense | | | 141,399 | | | | 7,826,287 | |
| Interest expense (See Note 9) | | | — | | | | 76 | |
| Total expenses before reimbursement/waiver | | | 141,399 | | | | 7,826,363 | |
| Add: fee recoupment (See Note 4) | | | — | | | | 26,934 | |
| Less: reimbursement/waiver from adviser (See Note 4) | | | (95,542 | ) | | | (18,761 | ) |
| Total net expenses | | | 45,857 | | | | 7,834,536 | |
| NET INVESTMENT LOSS | | | (4,630 | ) | | | (311,441 | ) |
| | | | | | | | | |
| REALIZED AND UNREALIZED GAIN (LOSS) ON INVESTMENTS | | | | | | | | |
| AND TRANSLATIONS OF FOREIGN CURRENCY | | | | | | | | |
| Net realized gain on investments, including foreign currency gain (loss) | | | 422,067 | | | | 48,398,577 | |
| Net change in unrealized appreciation/depreciation | | | | | | | | |
| of investments and translations of foreign currency | | | 111,203 | | | | 37,241,052 | |
Net realized and unrealized gain on investments and translations of foreign currency | | | 533,270 | | | | 85,639,629 | |
| | | | | | | | | |
| NET INCREASE IN NET ASSETS RESULTING FROM OPERATIONS | | $ | 528,640 | | | $ | 85,328,188 | |
See Notes to the Financial Statements
Jackson Square All-Cap Growth Fund
Statements of Changes in Net Assets
| | | For the | | | For the | |
| | | Year Ended | | | Year Ended | |
| | | October 31, 2019 | | | October 31, 2018 | |
| OPERATIONS: | | | | | | |
| Net investment loss | | $ | (9,869 | ) | | $ | (6,672 | ) |
| Net realized gain on investments, including foreign currency gain (loss) | | | 251,265 | | | | 568,237 | |
| Net change in unrealized appreciation/depreciation | | | | | | | | |
| on investments and translations of foreign currency | | | 379,637 | | | | (201,317 | ) |
| Net increase in net assets resulting from operations | | | 621,033 | | | | 360,248 | |
| | | | | | | | | |
| CAPITAL SHARE TRANSACTIONS: | | | | | | | | |
| IS Class: | | | | | | | | |
| Proceeds from shares sold | | | 53,077 | | | | 42,301 | |
| Proceeds from reinvestment of distributions | | | 416,586 | | | | 6,279 | |
| Payments for shares redeemed | | | (20,070 | ) | | | (21 | ) |
| Increase in net assets resulting from IS Class transactions | | | 449,593 | | | | 48,559 | |
Net increase in net assets resulting from capital share transactions | | | 449,593 | | | | 48,559 | |
| | | | | | | | | |
| DISTRIBUTIONS TO SHAREHOLDERS: | | | | | | | | |
| IS Class | | | (551,144 | ) | | | (8,332 | ) |
Total distributions to shareholders | | | (551,144 | ) | | | (8,332 | ) |
| TOTAL INCREASE IN NET ASSETS | | | 519,482 | | | | 400,475 | |
| | | | | | | | | |
| NET ASSETS: | | | | | | | | |
| Beginning of year | | | 5,470,471 | | | | 5,069,996 | |
| End of year | | $ | 5,989,953 | | | $ | 5,470,471 | |
See Notes to the Financial Statements
Jackson Square Global Growth Fund
Statements of Changes in Net Assets
| | | For the | | | For the | |
| | | Year Ended | | | Year Ended | |
| | | October 31, 2019 | | | October 31, 2018 | |
| OPERATIONS: | | | | | | |
| Net investment loss | | $ | (19,187 | ) | | $ | (30,925 | ) |
| Net realized gain on investments, including foreign currency gain (loss) | | | 247,482 | | | | 608,805 | |
| Net change in unrealized appreciation/depreciation | | | | | | | | |
| on investments and translations of foreign currency | | | 1,142,278 | | | | (164,468 | ) |
Net increase in net assets resulting from operations | | | 1,370,573 | | | | 413,412 | |
| | | | | | | | | |
| CAPITAL SHARE TRANSACTIONS: | | | | | | | | |
| IS Class: | | | | | | | | |
| Proceeds from shares sold | | | 392,985 | | | | 569,638 | |
| Proceeds from reinvestment of distributions | | | 534,970 | | | | 159,266 | |
| Payments for shares redeemed | | | (148,704 | ) | | | (549 | ) |
| Increase in net assets resulting from IS Class transactions | | | 779,251 | | | | 728,355 | |
| Institutional Class: | | | | | | | | |
| Proceeds from shares sold | | | — | | | | — | |
| Proceeds from reinvestment of distributions | | | — | | | | — | |
| Payments for shares redeemed | | | — | | | | — | |
| Increase in net assets resulting from Institutional Class transactions | | | — | | | | — | |
Net increase in net assets resulting from capital share transactions | | | 779,251 | | | | 728,355 | |
| | | | | | | | | |
| DISTRIBUTIONS TO SHAREHOLDERS: | | | | | | | | |
| IS Class | | | (616,474 | ) | | | (185,930 | ) |
| Institutional Class | | | (3,968 | ) | | | (1,298 | ) |
Total distributions to shareholders | | | (620,442 | ) | | | (187,228 | ) |
| | | | | | | | | |
| TOTAL INCREASE IN NET ASSETS | | | 1,529,382 | | | | 954,539 | |
| | | | | | | | | |
| NET ASSETS: | | | | | | | | |
| Beginning of year | | | 10,139,743 | | | | 9,185,204 | |
| End of year | | $ | 11,669,125 | | | $ | 10,139,743 | |
See Notes to the Financial Statements
Jackson Square Large-Cap Growth Fund
Statements of Changes in Net Assets
| | | For the | | | For the | |
| | | Year Ended | | | Year Ended | |
| | | October 31, 2019 | | | October 31, 2018 | |
| OPERATIONS: | | | | | | |
| Net investment income | | $ | 188,185 | | | $ | 183,618 | |
| Net realized gain on investments, including foreign currency gain (loss) | | | 19,553,135 | | | | 31,921,984 | |
| Net change in unrealized appreciation/depreciation | | | | | | | | |
| on investments and translations of foreign currency | | | (4,323,129 | ) | | | (21,850,400 | ) |
Net increase in net assets resulting from operations | | | 15,418,191 | | | | 10,255,202 | |
| | | | | | | | | |
| CAPITAL SHARE TRANSACTIONS: | | | | | | | | |
| IS Class: | | | | | | | | |
| Proceeds from shares sold | | | 2,154,671 | | | | 20,975,723 | |
| Proceeds from reinvestment of distributions | | | 24,070,256 | | | | 15,804,171 | |
| Payments for shares redeemed | | | (59,238,083 | ) | | | (68,459,791 | ) |
| Decrease in net assets resulting from IS Class transactions | | | (33,013,156 | ) | | | (31,679,897 | ) |
| Institutional Class: | | | | | | | | |
| Proceeds from shares sold | | | 583,043 | | | | 1,576,805 | |
| Proceeds from reinvestment of distributions | | | 399,968 | | | | 13,607 | |
| Payments for shares redeemed | | | — | | | | — | |
| Increase in net assets resulting from Institutional Class transactions | | | 983,011 | | | | 1,590,412 | |
| Investor Class: | | | | | | | | |
| Proceeds from shares sold | | | — | | | | — | |
| Proceeds from reinvestment of distributions | | | — | | | | — | |
| Payments for shares redeemed | | | — | | | | — | |
| Increase in net assets resulting from Investor Class transactions | | | — | | | | — | |
Net decrease in net assets resulting from capital share transactions | | | (32,030,145 | ) | | | (30,089,485 | ) |
| | | | | | | | | |
| DISTRIBUTIONS TO SHAREHOLDERS: | | | | | | | | |
| IS Class | | | (26,818,122 | ) | | | (17,147,758 | ) |
| Institutional Class | | | (411,593 | ) | | | (19,374 | ) |
| Investor Class | | | (11,363 | ) | | | (5,549 | ) |
Total distributions to shareholders | | | (27,241,078 | ) | | | (17,172,681 | ) |
| TOTAL DECREASE IN NET ASSETS | | | (43,853,032 | ) | | | (37,006,964 | ) |
| | | | | | | | | |
| NET ASSETS: | | | | | | | | |
| Beginning of year | | | 118,699,028 | | | | 155,705,992 | |
| End of year | | $ | 74,845,996 | | | $ | 118,699,028 | |
See Notes to the Financial Statements
Jackson Square Select 20 Growth Fund
Statements of Changes in Net Assets
| | | For the | | | For the | |
| | | Year Ended | | | Year Ended | |
| | | October 31, 2019 | | | October 31, 2018 | |
| OPERATIONS: | | | | | | |
| Net investment income (loss) | | $ | (4,630 | ) | | $ | 7,427 | |
| Net realized gain on investments, including foreign currency gain (loss) | | | 422,067 | | | | 11,311,469 | |
| Net change in unrealized appreciation/depreciation | | | | | | | | |
| on investments and translations of foreign currency | | | 111,203 | | | | (10,748,101 | ) |
Net increase in net assets resulting from operations | | | 528,640 | | | | 570,795 | |
| | | | | | | | | |
| CAPITAL SHARE TRANSACTIONS: | | | | | | | | |
| IS Class: | | | | | | | | |
| Proceeds from shares sold | | | 188,787 | | | | 70,738 | |
| Proceeds from reinvestment of distributions | | | — | | | | 10,827,172 | |
| Payments for redemption-in-kind | | | — | | | | (25,497,525 | ) |
| Payments for shares redeemed | | | (677 | ) | | | (4,005,847 | ) |
| Increase (Decrease) in net assets resulting from IS Class transactions | | | 188,110 | | | | (18,605,462 | ) |
Net increase (decrease) in net assets resulting from capital share transactions | | | 188,110 | | | | (18,605,462 | ) |
| | | | | | | | | |
| DISTRIBUTIONS TO SHAREHOLDERS: | | | | | | | | |
| IS Class | | | — | | | | (11,244,462 | ) |
Total distributions to shareholders | | | — | | | | (11,244,462 | ) |
| TOTAL INCREASE (DECREASE) IN NET ASSETS | | | 716,750 | | | | (29,279,129 | ) |
| | | | | | | | | |
| NET ASSETS: | | | | | | | | |
| Beginning of year | | | 4,802,939 | | | | 34,082,068 | |
| End of year | | $ | 5,519,689 | | | $ | 4,802,939 | |
See Notes to the Financial Statements
Jackson Square SMID-Cap Growth Fund
Statements of Changes in Net Assets
| | | For the | | | For the | |
| | | Year Ended | | | Year Ended | |
| | | October 31, 2019 | | | October 31, 2018 | |
| OPERATIONS: | | | | | | |
| Net investment income (loss) | | $ | (311,441 | ) | | $ | 1,260,869 | |
| Net realized gain on investments, including foreign currency gain (loss) | | | 48,398,577 | | | | 69,575,762 | |
| Net change in unrealized appreciation/depreciation | | | | | | | | |
| on investments and translations of foreign currency | | | 37,241,052 | | | | (31,823,692 | ) |
Net increase in net assets resulting from operations | | | 85,328,188 | | | | 39,012,939 | |
| | | | | | | | | |
| CAPITAL SHARE TRANSACTIONS: | | | | | | | | |
| IS Class: | | | | | | | | |
| Proceeds from shares sold | | | 275,696,568 | | | | 54,799,940 | |
| Proceeds from reinvestment of distributions | | | 20,860,812 | | | | 913,627 | |
| Payments for shares redeemed | | | (50,981,990 | ) | | | (37,683,664 | ) |
| Increase in net assets resulting from IS Class transactions | | | 245,575,390 | | | | 18,029,903 | |
| Institutional Class: | | | | | | | | |
| Proceeds from shares sold | | | 237,880,527 | | | | 96,615,943 | |
| Proceeds from reinvestment of distributions | | | 34,730,983 | | | | 1,193,075 | |
| Payments for shares redeemed | | | (78,850,138 | ) | | | (33,384,762 | ) |
| Increase in net assets resulting from Institutional Class transactions | | | 193,761,372 | | | | 64,424,256 | |
| Investor Class: | | | | | | | | |
| Proceeds from shares sold | | | 36,420,311 | | | | 79,281,692 | |
| Proceeds from reinvestment of distributions | | | 8,137,647 | | | | 37,350 | |
| Payments for shares redeemed | | | (35,837,698 | ) | | | (14,329,990 | ) |
| Increase in net assets resulting from Investor Class transactions | | | 8,720,260 | | | | 64,989,052 | |
Net increase in net assets resulting from capital share transactions | | | 448,057,022 | | | | 147,443,211 | |
| | | | | | | | | |
| DISTRIBUTIONS TO SHAREHOLDERS: | | | | | | | | |
| IS Class | | | (22,085,967 | ) | | | (923,726 | ) |
| Institutional Class | | | (35,681,080 | ) | | | (1,216,938 | ) |
| Investor Class | | | (8,138,155 | ) | | | (37,350 | ) |
Total distributions to shareholders | | | (65,905,202 | ) | | | (2,178,014 | ) |
| TOTAL INCREASE IN NET ASSETS | | | 467,480,008 | | | | 184,278,136 | |
| | | | | | | | | |
| NET ASSETS: | | | | | | | | |
| Beginning of year | | | 563,033,592 | | | | 378,755,456 | |
| End of year | | $ | 1,030,513,600 | | | $ | 563,033,592 | |
See Notes to the Financial Statements
Jackson Square All-Cap Growth Fund
Financial Highlights
For a Fund share outstanding throughout the periods.
IS Class
| | | Year Ended | | | Year Ended | | | Year Ended | | | For the Period | |
| | | October 31, | | | October 31, | | | October 31, | | | Inception(1) through | |
| | | 2019 | | | 2018 | | | 2017 | | | October 31, 2016 | |
| Per Share Data | | | | | | | | | | | | |
| | | | | | | | | | | | | |
| Net asset value, beginning of period | | $ | 22.68 | | | $ | 21.21 | | | $ | 17.55 | | | $ | 18.00 | |
| | | | | | | | | | | | | | | | | |
| Investment operations: | | | | | | | | | | | | | | | | |
Net investment loss(2) | | | (0.04 | ) | | | (0.03 | ) | | | (0.02 | ) | | | (0.01 | ) |
| Net realized and unrealized gain (loss) on investments | | | 2.24 | | | | 1.53 | | | | 3.69 | | | | (0.44 | ) |
| Total from investment operations | | | 2.20 | | | | 1.50 | | | | 3.67 | | | | (0.45 | ) |
| | | | | | | | | | | | | | | | | |
| Less distributions from: | | | | | | | | | | | | | | | | |
| Net investment income | | | — | (3) | | | — | | | | (0.01 | ) | | | — | |
| Net realized gains | | | (2.28 | ) | | | (0.03 | ) | | | — | | | | — | |
| Total distributions | | | (2.28 | ) | | | (0.03 | ) | | | (0.01 | ) | | | — | |
| Net asset value, end of period | | $ | 22.60 | | | $ | 22.68 | | | $ | 21.21 | | | $ | 17.55 | |
| | | | | | | | | | | | | | | | | |
Total Return(4) | | | 11.85 | % | | | 7.10 | % | | | 20.90 | % | | | -2.50 | % |
| | | | | | | | | | | | | | | | | |
| Supplemental Data and Ratios | | | | | | | | | | | | | | | | |
| Net assets, end of period (in 000’s) | | $ | 5,990 | | | $ | 5,470 | | | $ | 5,070 | | | $ | 2,681 | |
| | | | | | | | | | | | | | | | | |
| Ratio of expenses to average net assets: | | | | | | | | | | | | | | | | |
Before expense reimbursement/waiver(5) | | | 2.47 | % | | | 2.45 | % | | | 2.93 | % | | | 18.59 | % |
After expense reimbursement/waiver(5) | | | 0.90 | % | | | 0.90 | % | | | 0.90 | % | | | 0.90 | % |
| | | | | | | | | | | | | | | | | |
| Ratio of net investment loss to average net assets: | | | | | | | | | | | | | | | | |
After expense reimbursement/waiver(5) | | | (0.17 | )% | | | (0.12 | )% | | | (0.10 | )% | | | (0.50 | )% |
| | | | | | | | | | | | | | | | | |
Portfolio Turnover(4) | | | 49 | % | | | 61 | % | | | 60 | % | | | 3 | % |
(1) | Inception date of the IS Class was September 19, 2016. |
(2) | Per share amounts calculated using the average shares method. |
(3) | Amount is less than $0.01 per share. |
(4) | Not annualized for periods less than one year. |
(5) | Annualized for periods less than one year. |
See Notes to the Financial Statements
Jackson Square Global Growth Fund
Financial Highlights
For a Fund share outstanding throughout the periods.
IS Class
| | | Year Ended | | | Year Ended | | | Year Ended | | | For the Period | |
| | | October 31, | | | October 31, | | | October 31, | | | Inception(1) through | |
| | | 2019 | | | 2018 | | | 2017 | | | October 31, 2016 | |
| Per Share Data | | | | | | | | | | | | |
| | | | | | | | | | | | | |
| Net asset value, beginning of period | | $ | 23.28 | | | $ | 22.73 | | | $ | 17.66 | | | $ | 18.00 | |
| | | | | | | | | | | | | | | | | |
| Investment operations: | | | | | | | | | | | | | | | | |
Net investment loss(2) | | | (0.04 | ) | | | (0.07 | ) | | | (0.02 | ) | | | (0.01 | ) |
| Net realized and unrealized gain (loss) on investments | | | 2.87 | | | | 1.08 | | | | 5.09 | | | | (0.33 | ) |
| Total from investment operations | | | 2.83 | | | | 1.01 | | | | 5.07 | | | | (0.34 | ) |
| | | | | | | | | | | | | | | | | |
| Less distributions from: | | | | | | | | | | | | | | | | |
| Net investment income | | | — | | | | (0.01 | ) | | | — | | | | — | |
| Net realized gains | | | (1.41 | ) | | | (0.45 | ) | | | — | | | | — | |
| Total distributions | | | (1.41 | ) | | | (0.46 | ) | | | — | | | | — | |
| Net asset value, end of period | | $ | 24.70 | | | $ | 23.28 | | | $ | 22.73 | | | $ | 17.66 | |
| | | | | | | | | | | | | | | | | |
Total Return(3) | | | 13.47 | % | | | 4.49 | % | | | 28.71 | % | | | -1.89 | % |
| | | | | | | | | | | | | | | | | |
| Supplemental Data and Ratios | | | | | | | | | | | | | | | | |
| Net assets, end of period (in 000’s) | | $ | 11,599 | | | $ | 10,074 | | | $ | 9,121 | | | $ | 3,516 | |
| | | | | | | | | | | | | | | | | |
| Ratio of expenses to average net assets: | | | | | | | | | | | | | | | | |
Before expense reimbursement/waiver(4) | | | 2.01 | % | | | 2.00 | % | | | 2.39 | % | | | 14.49 | % |
After expense reimbursement/waiver(4) | | | 1.05 | % | | | 1.05 | % | | | 1.05 | % | | | 1.05 | % |
| | | | | | | | | | | | | | | | | |
| Ratio of net investment loss to average net assets: | | | | | | | | | | | | | | | | |
After expense reimbursement/waiver(4) | | | (0.17 | )% | | | (0.31 | )% | | | (0.12 | )% | | | (0.62 | )% |
| | | | | | | | | | | | | | | | | |
Portfolio Turnover(3)(5) | | | 28 | % | | | 41 | % | | | 37 | % | | | 3 | % |
(1) | Inception date of the IS Class was September 19, 2016. |
(2) | Per share amounts calculated using the average shares method. |
(3) | Not annualized for periods less than one year. |
(4) | Annualized for periods less than one year. |
(5) | Portfolio turnover disclosed is for the Fund as a whole. |
See Notes to the Financial Statements
Jackson Square Global Growth Fund
Financial Highlights
For a Fund share outstanding throughout the periods.
Institutional Class
| | | Year Ended | | | Year Ended | | | Year Ended | | | For the Period | |
| | | October 31, | | | October 31, | | | October 31, | | | Inception(1) through | |
| | | 2019 | | | 2018 | | | 2017 | | | October 31, 2016 | |
| Per Share Data | | | | | | | | | | | | |
| | | | | | | | | | | | | |
| Net asset value, beginning of period | | $ | 23.25 | | | $ | 22.71 | | | $ | 17.66 | | | $ | 18.00 | |
| | | | | | | | | | | | | | | | | |
| Investment operations: | | | | | | | | | | | | | | | | |
Net investment loss(2) | | | (0.04 | ) | | | (0.07 | ) | | | (0.04 | ) | | | (0.02 | ) |
| Net realized and unrealized gain (loss) on investments | | | 2.88 | | | | 1.07 | | | | 5.09 | | | | (0.32 | ) |
| Total from investment operations | | | 2.84 | | | | 1.00 | | | | 5.05 | | | | (0.34 | ) |
| | | | | | | | | | | | | | | | | |
| Less distributions from: | | | | | | | | | | | | | | | | |
| Net investment income | | | — | | | | (0.01 | ) | | | — | | | | — | |
| Net realized gains | | | (1.41 | ) | | | (0.45 | ) | | | — | | | | — | |
| Total distributions | | | (1.41 | ) | | | (0.46 | ) | | | — | | | | — | |
| Net asset value, end of period | | $ | 24.68 | | | $ | 23.25 | | | $ | 22.71 | | | $ | 17.66 | |
| | | | | | | | | | | | | | | | | |
Total Return(3) | | | 13.53 | % | | | 4.45 | % | | | 28.60 | % | | | -1.89 | % |
| | | | | | | | | | | | | | | | | |
| Supplemental Data and Ratios | | | | | | | | | | | | | | | | |
| Net assets, end of period (in 000’s) | | $ | 70 | | | $ | 66 | | | $ | 64 | | | $ | 49 | |
| | | | | | | | | | | | | | | | | |
| Ratio of expenses to average net assets: | | | | | | | | | | | | | | | | |
Before expense reimbursement/waiver(4) | | | 2.01 | % | | | 2.01 | % | | | 2.59 | % | | | 14.61 | % |
After expense reimbursement/waiver(4) | | | 1.05 | % | | | 1.05 | % | | | 1.12 | % | | | 1.15 | % |
| | | | | | | | | | | | | | | | | |
| Ratio of net investment loss to average net assets: | | | | | | | | | | | | | | | | |
After expense reimbursement/waiver(4) | | | (0.18 | )% | | | (0.31 | )% | | | (0.19 | )% | | | (0.72 | )% |
| | | | | | | | | | | | | | | | | |
Portfolio Turnover(3)(5) | | | 28 | % | | | 41 | % | | | 37 | % | | | 3 | % |
(1) | Inception date of the Institutional Class was September 19, 2016. |
(2) | Per share amounts calculated using the average shares method |
(3) | Not annualized for periods less than one year. |
(4) | Annualized for periods less than one year. |
(5) | Portfolio turnover disclosed is for the Fund as a whole. |
See Notes to the Financial Statements
Jackson Square Large-Cap Growth Fund
Financial Highlights
For a Fund share outstanding throughout the years.
IS Class
| | | Year Ended | | | Year Ended | | | Year Ended | | | Year Ended | | | Year Ended | |
| | | October 31, | | | October 31, | | | October 31, | | | October 31, | | | October 31, | |
| | | 2019 | | | 2018 | | | 2017 | | | 2016 | | | 2015 | |
| Per Share Data | | | | | | | | | | | | | | | |
| | | | | | | | | | | | | | | | |
Net asset value, beginning of year | | $ | 13.94 | | | $ | 14.79 | | | $ | 13.89 | | | $ | 16.79 | | | $ | 17.04 | |
| | | | | | | | | | | | | | | | | | | | | |
| Investment operations: | | | | | | | | | | | | | | | | | | | | |
Net investment income(1) | | | 0.02 | | | | 0.02 | | | | 0.04 | | | | 0.05 | | | | 0.11 | |
| Net realized and unrealized gain (loss) on investments | | | 1.26 | | | | 0.74 | | | | 2.83 | | | | (0.51 | ) | | | 1.19 | |
| Total from investment operations | | | 1.28 | | | | 0.76 | | | | 2.87 | | | | (0.46 | ) | | | 1.30 | |
| | | | | | | | | | | | | | | | | | | | | |
| Less distributions from: | | | | | | | | | | | | | | | | | | | | |
| Net investment income | | | (0.02 | ) | | | (0.04 | ) | | | (0.04 | ) | | | (0.11 | ) | | | (0.11 | ) |
| Net realized gains | | | (3.21 | ) | | | (1.57 | ) | | | (1.93 | ) | | | (2.33 | ) | | | (1.44 | ) |
| Total distributions | | | (3.23 | ) | | | (1.61 | ) | | | (1.97 | ) | | | (2.44 | ) | | | (1.55 | ) |
Net asset value, end of year | | $ | 11.99 | | | $ | 13.94 | | | $ | 14.79 | | | $ | 13.89 | | | $ | 16.79 | |
| | | | | | | | | | | | | | | | | | | | | |
| Total Return | | | 14.40 | % | | | 5.49 | % | | | 24.21 | % | | | -3.20 | % | | | 8.06 | % |
| | | | | | | | | | | | | | | | | | | | | |
| Supplemental Data and Ratios | | | | | | | | | | | | | | | | | | | | |
Net assets, end of year (in 000’s) | | $ | 72,150 | | | $ | 116,867 | | | $ | 155,475 | | | $ | 191,583 | | | $ | 313,511 | |
| | | | | | | | | | | | | | | | | | | | | |
Ratio of expenses to average net assets: | | | | | | | | | | | | | | | | | | | | |
| Before expense waiver | | | 0.80 | % | | | 0.76 | % | | | 0.76 | % | | | 0.65 | % | | | 0.64 | % |
| After expense waiver | | | 0.64 | % | | | 0.64 | % | | | 0.64 | % | | | 0.64 | % | | | 0.64 | % |
| | | | | | | | | | | | | | | | | | | | | |
Ratio of net investment income to average net assets: | | | | | | | | | | | | | | | | | | | | |
| After expense waiver | | | 0.17 | % | | | 0.12 | % | | | 0.29 | % | | | 0.36 | % | | | 0.67 | % |
| | | | | | | | | | | | | | | | | | | | | |
Portfolio Turnover(2) | | | 37 | % | | | 53 | % | | | 25 | % | | | 27 | %(3) | | | 49 | % |
(1) | Per share amounts calculated using the average shares method. |
(2) | Portfolio turnover disclosed is for the Fund as a whole. |
(3) | Excludes value of Fund securities received or delivered as a result of in-kind purchases or redemptions of the Fund’s capital shares. |
See Notes to the Financial Statements
Jackson Square Large-Cap Growth Fund
Financial Highlights
For a Fund share outstanding throughout the periods.
Institutional Class
| | | Year Ended | | | Year Ended | | | Year Ended | | | For the Period | |
| | | October 31, | | | October 31, | | | October 31, | | | Inception(1) through | |
| | | 2019 | | | 2018 | | | 2017 | | | October 31, 2016 | |
| Per Share Data | | | | | | | | | | | | |
| | | | | | | | | | | | | |
| Net asset value, beginning of period | | $ | 13.95 | | | $ | 14.78 | | | $ | 13.89 | | | $ | 14.12 | |
| | | | | | | | | | | | | | | | | |
| Investment operations: | | | | | | | | | | | | | | | | |
Net investment income (loss)(2) | | | 0.02 | | | | 0.02 | | | | 0.03 | | | | (0.01 | ) |
| Net realized and unrealized gain (loss) on investments | | | 1.26 | | | | 0.75 | | | | 2.83 | | | | (0.22 | ) |
| Total from investment operations | | | 1.28 | | | | 0.77 | | | | 2.86 | | | | (0.23 | ) |
| | | | | | | | | | | | | | | | | |
| Less distributions from: | | | | | | | | | | | | | | | | |
| Net investment income | | | (0.01 | ) | | | (0.03 | ) | | | (0.04 | ) | | | — | |
| Net realized gains | | | (3.21 | ) | | | (1.57 | ) | | | (1.93 | ) | | | — | |
| Total distributions | | | (3.22 | ) | | | (1.60 | ) | | | (1.97 | ) | | | — | |
| Net asset value, end of period | | $ | 12.01 | | | $ | 13.95 | | | $ | 14.78 | | | $ | 13.89 | |
| | | | | | | | | | | | | | | | | |
Total Return(3) | | | 14.44 | % | | | 5.54 | % | | | 24.08 | % | | | -1.63 | % |
| | | | | | | | | | | | | | | | | |
| Supplemental Data and Ratios | | | | | | | | | | | | | | | | |
| Net assets, end of period (in 000’s) | | $ | 2,654 | | | $ | 1,783 | | | $ | 179 | | | $ | 49 | |
| | | | | | | | | | | | | | | | | |
| Ratio of expenses to average net assets: | | | | | | | | | | | | | | | | |
Before expense waiver(4) | | | 0.81 | % | | | 0.75 | % | | | 0.82 | % | | | 0.83 | % |
After expense waiver(4) | | | 0.64 | % | | | 0.64 | % | | | 0.70 | % | | | 0.74 | % |
| | | | | | | | | | | | | | | | | |
| Ratio of net investment income (loss) to average net assets: | | | | | | | | | | | | | | | | |
After expense waiver(4) | | | 0.17 | % | | | 0.12 | % | | | 0.23 | % | | | (0.60 | )% |
| | | | | | | | | | | | | | | | | |
Portfolio Turnover(3)(5) | | | 37 | % | | | 53 | % | | | 25 | % | | | 27 | %(6) |
(1) | Inception date of the Institutional Class was September 19, 2016. |
(2) | Per share amounts calculated using the average shares method. |
(3) | Not annualized for periods less than one year. |
(4) | Annualized for periods less than one year. |
(5) | Portfolio turnover disclosed is for the Fund as a whole. |
(6) | Excludes value of Fund securities received or delivered as a result of in-kind purchases or redemptions of the Fund’s capital shares. |
See Notes to the Financial Statements
Jackson Square Large-Cap Growth Fund
Financial Highlights
For a Fund share outstanding throughout the periods.
Investor Class
| | | Year Ended | | | Year Ended | | | Year Ended | | | For the Period | |
| | | October 31, | | | October 31, | | | October 31, | | | Inception(1) through | |
| | | 2019 | | | 2018 | | | 2017 | | | October 31, 2016 | |
| Per Share Data | | | | | | | | | | | | |
| | | | | | | | | | | | | |
| Net asset value, beginning of period | | $ | 13.91 | | | $ | 14.75 | | | $ | 13.89 | | | $ | 14.12 | |
| | | | | | | | | | | | | | | | | |
| Investment operations: | | | | | | | | | | | | | | | | |
Net investment loss(2) | | | (0.01 | )(3) | | | (0.02 | ) | | | — | (4) | | | (0.01 | ) |
| Net realized and unrealized gain (loss) on investments | | | 1.26 | | | | 0.75 | | | | 2.82 | | | | (0.22 | ) |
| Total from investment operations | | | 1.25 | | | | 0.73 | | | | 2.82 | | | | (0.23 | ) |
| | | | | | | | | | | | | | | | | |
| Less distributions from: | | | | | | | | | | | | | | | | |
| Net investment income | | | — | | | | — | | | | (0.03 | ) | | | — | |
| Net realized gains | | | (3.21 | ) | | | (1.57 | ) | | | (1.93 | ) | | | — | |
| Total distributions | | | (3.21 | ) | | | (1.57 | ) | | | (1.96 | ) | | | — | |
| Net asset value, end of period | | $ | 11.95 | | | $ | 13.91 | | | $ | 14.75 | | | $ | 13.89 | |
| | | | | | | | | | | | | | | | | |
Total Return(5) | | | 14.18 | % | | | 5.25 | % | | | 23.74 | % | | | -1.63 | % |
| | | | | | | | | | | | | | | | | |
| Supplemental Data and Ratios | | | | | | | | | | | | | | | | |
| Net assets, end of period (in 000’s) | | $ | 42 | | | $ | 49 | | | $ | 52 | | | $ | 49 | |
| | | | | | | | | | | | | | | | | |
| Ratio of expenses to average net assets: | | | | | | | | | | | | | | | | |
Before expense waiver(6) | | | 1.06 | % | | | 1.01 | % | | | 1.08 | % | | | 1.08 | % |
After expense waiver(6) | | | 0.89 | % | | | 0.89 | % | | | 0.96 | % | | | 0.99 | % |
| | | | | | | | | | | | | | | | | |
| Ratio of net investment income (loss) to average net assets: | | | | | | | | | | | | | | | | |
After expense waiver(6) | | | (0.08 | )% | | | (0.13 | )% | | | (0.03 | )% | | | (0.84 | )% |
| | | | | | | | | | | | | | | | | |
Portfolio Turnover(5)(7) | | | 37 | % | | | 53 | % | | | 25 | % | | | 27 | %(8) |
| | | | | | | | | | | | | | | | | |
(1) | Inception date of the Investor Class was September 19, 2016. |
(2) | Per share amounts calculated using the average shares method. |
| (3) | Net realized and unrealized loss per share in this caption is a balancing amount necessary to reconcile the change in net asset per value per share for the year, and may not reconcile with the aggregate gain on the Statement of Operations due to share transactions for the year. |
(4) | Amount is less than $0.01 per share. |
(5) | Not annualized for periods less than one year. |
(6) | Annualized for periods less than one year. |
(7) | Portfolio turnover disclosed is for the Fund as a whole. |
(8) | Excludes value of Fund securities received or delivered as a result of in-kind purchases or redemptions of the Fund’s capital shares. |
See Notes to the Financial Statements
Jackson Square Select 20 Growth Fund
Financial Highlights
For a Fund share outstanding throughout the years.
IS Class
| | | Year Ended | | | Year Ended | | | Year Ended | | | Year Ended | | | Year Ended | |
| | | October 31, | | | October 31, | | | October 31, | | | October 31, | | | October 31, | |
| | | 2019 | | | 2018 | | | 2017 | | | 2016 | | | 2015 | |
| Per Share Data | | | | | | | | | | | | | | | |
| | | | | | | | | | | | | | | | |
Net asset value, beginning of year | | $ | 5.54 | | | $ | 7.80 | | | $ | 6.83 | | | $ | 8.95 | | | $ | 11.05 | |
| | | | | | | | | | | | | | | | | | | | | |
| Investment operations: | | | | | | | | | | | | | | | | | | | | |
Net investment income (loss)(1) | | | (0.01 | ) | | | 0.01 | | | | — | (2) | | | — | (2) | | | — | (2) |
| Net realized and unrealized gain on investments | | | 0.59 | | | | 0.44 | | | | 0.97 | | | | (0.52 | ) | | | 0.98 | |
| Total from investment operations | | | 0.58 | | | | 0.45 | | | | 0.97 | | | | (0.52 | ) | | | 0.98 | |
| | | | | | | | | | | | | | | | | | | | | |
| Less distributions from: | | | | | | | | | | | | | | | | | | | | |
| Net investment income | | | — | | | | — | | | | — | | | | (0.01 | ) | | | (0.01 | ) |
| Net realized gains | | | — | | | | (2.71 | ) | | | — | | | | (1.59 | ) | | | (3.07 | ) |
| Total distributions | | | — | | | | (2.71 | ) | | | — | | | | (1.60 | ) | | | (3.08 | ) |
| Net asset value, end of year | | $ | 6.12 | | | $ | 5.54 | | | $ | 7.80 | | | $ | 6.83 | | | $ | 8.95 | |
| | | | | | | | | | | | | | | | | | | | | |
| Total Return | | | 10.47 | % | | | 9.05 | % | | | 14.20 | % | | | -6.54 | % | | | 10.60 | % |
| | | | | | | | | | | | | | | | | | | | | |
| Supplemental Data and Ratios | | | | | | | | | | | | | | | | | | | | |
Net assets, end of period (in 000’s) | | $ | 5,520 | | | $ | 4,803 | | | $ | 34,082 | | | $ | 79,941 | | | $ | 93,625 | |
| | | | | | | | | | | | | | | | | | | | | |
Ratio of expenses to average net assets: | | | | | | | | | | | | | | | | | | | | |
| Before expense reimbursement/waiver | | | 2.68 | % | | | 2.00 | % | | | 0.89 | % | | | 0.90 | % | | | 0.89 | % |
| After expense reimbursement/waiver | | | 0.87 | % | | | 0.87 | % | | | 0.87 | % | | | 0.89 | % | | | 0.89 | % |
| | | | | | | | | | | | | | | | | | | | | |
Ratio of net investment income (loss) to average net assets: | | | | | | | | | | | | | | | | | | | | |
| After expense reimbursement/waiver | | | (0.09 | )% | | | 0.10 | % | | | 0.01 | % | | | 0.04 | % | | | 0.00 | % |
| | | | | | | | | | | | | | | | | | | | | |
Portfolio Turnover | | | 42 | % | | | 41 | %(3) | | | 40 | % | | | 22 | % | | | 31 | % |
(1) | Per share amounts calculated using the average shares method. |
(2) | Amount is less than $0.01 per share. |
(3) | Excludes value of Fund securities received or delivered as a result of in-kind purchases or redemptions of the Fund’s capital shares. |
See Notes to the Financial Statements
Jackson Square SMID-Cap Growth Fund
Financial Highlights
For a Fund share outstanding throughout the years.
IS Class
| | | Year Ended | | | Year Ended | | | Year Ended | | | Year Ended | | | Year Ended | |
| | | October 31, | | | October 31, | | | October 31, | | | October 31, | | | October 31, | |
| | | 2019 | | | 2018 | | | 2017 | | | 2016 | | | 2015 | |
| Per Share Data | | | | | | | | | | | | | | | |
| | | | | | | | | | | | | | | | |
Net asset value, beginning of year | | $ | 23.83 | | | $ | 21.37 | | | $ | 17.24 | | | $ | 18.44 | | | $ | 21.85 | |
| | | | | | | | | | | | | | | | | | | | | |
| Investment operations: | | | | | | | | | | | | | | | | | | | | |
Net investment income(1) | | | 0.01 | (2) | | | 0.08 | | | | 0.02 | | | | 0.05 | | | | 0.07 | |
| Net realized and unrealized gain on investments | | | 2.70 | | | | 2.50 | | | | 4.20 | | | | 0.91 | | | | 1.49 | |
| Total from investment operations | | | 2.71 | | | | 2.58 | | | | 4.22 | | | | 0.96 | | | | 1.56 | |
| | | | | | | | | | | | | | | | | | | | | |
| Less distributions from: | | | | | | | | | | | | | | | | | | | | |
| Net investment income | | | (0.06 | ) | | | — | | | | (0.02 | ) | | | (0.04 | ) | | | (0.08 | ) |
| Net realized gains | | | (2.60 | ) | | | (0.12 | ) | | | (0.07 | ) | | | (2.12 | ) | | | (4.89 | ) |
| Total distributions | | | (2.66 | ) | | | (0.12 | ) | | | (0.09 | ) | | | (2.16 | ) | | | (4.97 | ) |
Net asset value, end of year | | $ | 23.88 | | | $ | 23.83 | | | $ | 21.37 | | | $ | 17.24 | | | $ | 18.44 | |
| | | | | | | | | | | | | | | | | | | | | |
| Total Return | | | 14.02 | % | | | 12.13 | % | | | 24.59 | % | | | 5.27 | % | | | 8.30 | % |
| | | | | | | | | | | | | | | | | | | | | |
| Supplemental Data and Ratios | | | | | | | | | | | | | | | | | | | | |
Net assets, end of period (in 000’s) | | $ | 452,234 | | | $ | 197,380 | | | $ | 162,033 | | | $ | 72,224 | | | $ | 51,443 | |
| | | | | | | | | | | | | | | | | | | | | |
Ratio of expenses to average net assets: | | | | | | | | | | | | | | | | | | | | |
| Before expense waiver/recoupment | | | 0.87 | % | | | 0.89 | % | | | 0.93 | % | | | 0.91 | % | | | 0.92 | % |
| After expense waiver/recoupment | | | 0.87 | % | | | 0.87 | % | | | 0.87 | % | | | 0.90 | % | | | 0.92 | % |
| | | | | | | | | | | | | | | | | | | | | |
Ratio of net investment income to average net assets: | | | | | | | | | | | | | | | | | | | | |
| After expense waiver/recoupment | | | 0.04 | % | | | 0.33 | % | | | 0.10 | % | | | 0.27 | % | | | 0.38 | % |
| | | | | | | | | | | | | | | | | | | | | |
Portfolio Turnover(3) | | | 35 | % | | | 47 | % | | | 23 | % | | | 20 | % | | | 21 | % |
(1) | Per share amounts calculated using the average shares method. |
| (2) | Net realized and unrealized loss per share in this caption is a balancing amount necessary to reconcile the change in net asset per value per share for the year, and may not reconcile with the aggregate gain on the Statement of Operations due to share transactions for the year. |
(3) | Portfolio turnover disclosed is for the Fund as a whole. |
See Notes to the Financial Statements
Jackson Square SMID-Cap Growth Fund
Financial Highlights
For a Fund share outstanding throughout the periods.
Institutional Class
| | | Year Ended | | | Year Ended | | | Year Ended | | | For the Period | |
| | | October 31, | | | October 31, | | | October 31, | | | Inception(1) through | |
| | | 2019 | | | 2018 | | | 2017 | | | October 31, 2016 | |
| Per Share Data | | | | | | | | | | | | |
| | | | | | | | | | | | | |
| Net asset value, beginning of period | | $ | 23.81 | | | $ | 21.37 | | | $ | 17.24 | | | $ | 17.82 | |
| | | | | | | | | | | | | | | | | |
| Investment operations: | | | | | | | | | | | | | | | | |
Net investment income (loss)(2) | | | (0.01 | ) | | | 0.06 | | | | 0.01 | | | | — | (3) |
| Net realized and unrealized gain (loss) on investments | | | 2.74 | | | | 2.50 | | | | 4.21 | | | | (0.58 | )(4) |
| Total from investment operations | | | 2.73 | | | | 2.56 | | | | 4.22 | | | | (0.58 | ) |
| | | | | | | | | | | | | | | | | |
| Less distributions from: | | | | | | | | | | | | | | | | |
| Net investment income | | | (0.05 | ) | | | — | | | | (0.02 | ) | | | — | |
| Net realized gains | | | (2.60 | ) | | | (0.12 | ) | | | (0.07 | ) | | | — | |
| Total distributions | | | (2.65 | ) | | | (0.12 | ) | | | (0.09 | ) | | | — | |
| Net asset value, end of period | | $ | 23.89 | | | $ | 23.81 | | | $ | 21.37 | | | $ | 17.24 | |
| | | | | | | | | | | | | | | | | |
Total Return(5) | | | 14.08 | % | | | 12.04 | % | | | 24.50 | % | | | -3.25 | % |
| | | | | | | | | | | | | | | | | |
| Supplemental Data and Ratios | | | | | | | | | | | | | | | | |
| Net assets, end of period (in 000’s) | | $ | 499,461 | | | $ | 297,203 | | | $ | 211,787 | | | $ | 87,274 | |
| | | | | | | | | | | | | | | | | |
| Ratio of expenses to average net assets: | | | | | | | | | | | | | | | | |
Before expense waiver/recoupment(6) | | | 0.95 | % | | | 0.97 | % | | | 0.99 | % | | | 1.00 | % |
After expense waiver/recoupment(6) | | | 0.95 | % | | | 0.95 | % | | | 0.92 | % | | | 0.97 | % |
| | | | | | | | | | | | | | | | | |
| Ratio of net investment income (loss) to average net assets: | | | | | | | | | | | | | | | | |
After expense waiver/recoupment(6) | | | (0.04 | )% | | | 0.26 | % | | | 0.04 | % | | | 0.05 | % |
| | | | | | | | | | | | | | | | | |
Portfolio Turnover(5)(7) | | | 35 | % | | | 47 | % | | | 23 | % | | | 20 | % |
| (1) | Inception date of the Institutional Class was September 16, 2016. |
| (2) | Per share amounts calculated using the average shares method. |
| (3) | Amount is less than $0.01 per share. |
| (4) | Net realized and unrealized loss per share in this caption is a balancing amount necessary to reconcile the change in net asset value per share for the period, and may not reconcile with the aggregate gain on the Statement of Operations due to share transactions for the period. |
| (5) | Not annualized for periods less than one year. |
| (6) | Annualized for periods less than one year. |
| (7) | Portfolio turnover disclosed is for the Fund as a whole. |
See Notes to the Financial Statements
Jackson Square SMID-Cap Growth Fund
Financial Highlights
For a Fund share outstanding throughout the periods.
Investor Class
| | | Year Ended | | | Year Ended | | | Year Ended | | | For the Period | |
| | | October 31, | | | October 31, | | | October 31, | | | Inception(1) through | |
| | | 2019 | | | 2018 | | | 2017 | | | October 31, 2016 | |
| Per Share Data | | | | | | | | | | | | |
| | | | | | | | | | | | | |
| Net asset value, beginning of period | | $ | 23.67 | | | $ | 21.30 | | | $ | 17.23 | | | $ | 17.84 | |
| | | | | | | | | | | | | | | | | |
| Investment operations: | | | | | | | | | | | | | | | | |
Net investment income (loss)(2) | | | (0.07 | ) | | | — | (3) | | | (0.05 | ) | | | — | (3) |
| Net realized and unrealized gain on investments | | | 2.70 | | | | 2.49 | | | | 4.21 | | | | (0.61 | )(4) |
| Total from investment operations | | | 2.63 | | | | 2.49 | | | | 4.16 | | | | (0.61 | ) |
| | | | | | | | | | | | | | | | | |
| Less distributions from: | | | | | | | | | | | | | | | | |
| Net investment income | | | (0.02 | ) | | | — | | | | (0.02 | ) | | | — | |
| Net realized gains | | | (2.60 | ) | | | (0.12 | ) | | | (0.07 | ) | | | — | |
| Total distributions | | | (2.62 | ) | | | (0.12 | ) | | | (0.09 | ) | | | — | |
| Net asset value, end of period | | $ | 23.68 | | | $ | 23.67 | | | $ | 21.30 | | | $ | 17.23 | |
| | | | | | | | | | | | | | | | | |
Total Return(5) | | | 13.69 | % | | | 11.75 | % | | | 24.12 | % | | | -3.42 | % |
| | | | | | | | | | | | | | | | | |
| Supplemental Data and Ratios | | | | | | | | | | | | | | | | |
| Net assets, end of period (in 000’s) | | $ | 78,819 | | | $ | 68,451 | | | $ | 4,935 | | | $ | 48 | |
| | | | | | | | | | | | | | | | | |
| Ratio of expenses to average net assets: | | | | | | | | | | | | | | | | |
Before expense waiver/recoupment(6) | | | 1.22 | % | | | 1.24 | % | | | 1.28 | % | | | 1.25 | % |
After expense waiver/recoupment(6) | | | 1.22 | % | | | 1.22 | % | | | 1.22 | % | | | 1.22 | % |
| | | | | | | | | | | | | | | | | |
| Ratio of net investment loss to average net assets: | | | | | | | | | | | | | | | | |
After expense waiver/recoupment(6) | | | (0.31 | )% | | | (0.02 | )% | | | (0.25 | )% | | | (0.20 | )% |
| | | | | | | | | | | | | | | | | |
Portfolio Turnover(5)(7) | | | 35 | % | | | 47 | % | | | 23 | % | | | 20 | % |
| (1) | Inception date of the Investor Class was September 19, 2016. |
| (2) | Per share amounts calculated using the average shares method. |
| (3) | Amount is less than $0.01 per share. |
| (4) | Net realized and unrealized loss per share in this caption is a balancing amount necessary to reconcile the change in net asset value per share for the period, and may not reconcile with the aggregate gain on the Statement of Operations due to share transactions for the period. |
| (5) | Not annualized for periods less than one year. |
| (6) | Annualized for periods less than one year. |
| (7) | Portfolio turnover disclosed is for the Fund as a whole. |
See Notes to the Financial Statements
Jackson Square Funds
Notes to the Financial Statements
October 31, 2019
1. ORGANIZATION
Managed Portfolio Series (the “Trust”) was organized as a Delaware statutory trust on January 27, 2011. The Trust is registered under the Investment Company Act of 1940, as amended (the “1940 Act”), as an open-end management investment company. The Jackson Square All-Cap Growth Fund (“All-Cap Growth Fund”), Jackson Square Global Growth Fund (“Global Growth Fund”), Jackson Square Large-Cap Growth Fund (“Large-Cap Growth Fund”), Jackson Square Select 20 Growth Fund (“Select 20 Growth Fund”), and Jackson Square SMID-Cap Growth Fund (“SMID-Cap Growth Fund”) (each a “Fund” and collectively, the “Funds”) are investment companies and therefore follow the investment company accounting and reporting guidance of the Financial Accounting Standards Board (“FASB”) Accounting Standards Codification Topic 946 Financial Services – Investment Companies. The All-Cap Growth Fund and Global Growth Fund are each a diversified series with their own investment objectives and policies within the Trust. The Large-Cap Growth Fund, Select 20 Growth Fund, and SMID-Cap Growth Fund are each a non-diversified series with their own investment objectives and policies within the Trust. The investment objective of each Fund is long-term capital appreciation. The Funds offer three different share classes – Investor Class, Institutional Class, and IS class; although not all share classes have commenced operations for certain Funds as of October 31, 2019, and therefore are not currently available for purchase. The All-Cap Growth Fund currently offers the IS Class shares, which commenced operations on September 19, 2016. The Global Growth Fund currently offers the IS Class shares and Institutional Class shares, each of which commenced operations on September 19, 2016. The Large-Cap Growth Fund currently offers the IS Class shares, which commenced operations on November 1, 2005, and the Institutional Class shares and Investor Class shares, each of which commenced operations on September 19, 2016. The Select 20 Growth Fund currently offers the IS Class shares, which commenced operations on March 31, 2000. The SMID-Cap Growth Fund currently offers the IS Class shares, which commenced operations on November 1, 2005, the Institutional Class shares which commenced operations on September 16, 2016, and the Investor Class shares, which commenced operations on September 19, 2016. Each class of shares has identical rights and privileges except with respect to shareholder servicing fees, 12b-1 fees, and voting rights on matters affecting a single share class. Institutional Class shares are subject to a maximum 0.10% shareholder servicing fee. Investor Class shares are subject to a 0.25% Rule 12b-1 distribution and servicing fee and a maximum 0.10% shareholder servicing fee. The Funds may issue an unlimited number of shares of beneficial interest with no par value.
2. SIGNIFICANT ACCOUNTING POLICIES
The following is a summary of significant accounting policies consistently followed by the Funds in preparation of its financial statements. These policies are in conformity with generally accepted accounting principles in the United States of America (“GAAP”).
Security Valuation – All investments in securities are recorded at their estimated fair value, as described in Note 3.
Federal Income Taxes – The Funds comply with the requirements of subchapter M of the Internal Revenue Code of 1986, as amended, necessary to qualify as regulated investment companies and distribute substantially all net taxable investment income and net realized gains to shareholders in a manner which results in no tax cost to the Funds. Therefore, no federal income or excise tax provision is required. As of and during the year ended October 31, 2019, the Funds did not have any tax positions that did not meet the “more-likely-than-not” threshold of being sustained by the applicable tax authority. As of and during the year ended October 31, 2019, the Funds did not have liabilities for any unrecognized tax benefits. The Funds recognize interest and penalties, if any, related to unrecognized tax benefits on uncertain tax positions as income tax expense in the Statement of
Jackson Square Funds
Notes to the Financial Statements – Continued
October 31, 2019
Operations. As of and during the year ended October 31, 2019, the Funds did not incur any interest or penalties. The Funds are not subject to examination by U.S. tax authorities for tax years prior to the fiscal year ended October 31, 2016.
Security Transactions, Investment Income and Distributions – The Funds follow industry practice and record security transactions on the trade date. Realized gains and losses on sales of securities are calculated on the basis of identified cost. Dividend income is recorded on the ex-dividend date and interest income is recorded on an accrual basis. Withholding taxes on foreign dividends have been provided for in accordance with the Funds’ understanding of the applicable country’s tax rules and regulations. Discounts and premiums on securities purchased are amortized over the expected life of the respective securities using the constant yield method.
The Funds distribute substantially all net investment income and net realized capital gains, if any, at least annually. Distributions to shareholders are recorded on the ex-dividend date. The treatment for financial reporting purposes of distributions made to shareholders during the year from net investment income or net realized capital gains may differ from their treatment for federal income tax purposes. These differences are caused primarily by differences in the timing of the recognition of certain components of income, expense, or realized capital gain for federal income tax purposes. Where such differences are permanent in nature, GAAP requires that they be reclassified in the components of the net assets based on their ultimate characterization for federal income tax purposes. Any such reclassifications will have no effect on net assets, results of operations or net asset value (“NAV”) per share of the Funds. For the year ended October 31, 2019, the following reclassifications were made:
| Fund | | Distributable Earnings | | | Paid-in Capital | |
Global Growth Fund | | $ | 43,810 | | | $ | (43,810 | ) |
Large-Cap Growth Fund | | | (4,161,175 | ) | | | 4,161,175 | |
SMID-Cap Growth Fund | | | (5,359,809 | ) | | | 5,359,809 | |
Adjustments to the Funds shown in the table above were due to one or more of the following reasons: net operating loss forfeiture or equalization utilized.
Foreign Currency – Investment securities and other assets and liabilities denominated in foreign currencies are translated into U.S. dollar amounts at the date of valuation. Purchases and sales of investment securities and income and expense items denominated in foreign currencies are translated into U.S. dollar amounts on the respective dates of such transactions. The Funds do not isolate that portion of the results of operations resulting from changes in foreign exchange rates on investments from the fluctuations arising from changes in market prices of securities held. Such fluctuations are included with the net realized and unrealized gain or loss from investments and translations of foreign currency. The Funds report net realized foreign exchange gains or losses that arise from sales of foreign currencies, currency gains or losses realized between the trade and settlement dates on securities transactions, and the difference between the amounts of dividends, interest, and foreign withholding taxes recorded on the Funds’ books and the U.S. dollar equivalent of the amounts actually received or paid. Net unrealized foreign exchange gains and losses arise from changes in the fair values of assets and liabilities, other than investments in securities at fiscal period end, resulting from changes in exchange rates.
Allocation of Income, Expenses and Gains/Losses – Income, expenses (other than those deemed attributable to a specific share class), and gains and losses of the Funds are allocated daily to each class of shares based upon the ratio of net assets represented by each class as a percentage of the net assets of each Fund. Expenses deemed directly attributable to a class of shares are recorded by the specific class. Most Fund expenses are allocated by class based on relative net assets. Shareholder servicing fees are expensed at an annual rate up to 0.10% of Institutional
Jackson Square Funds
Notes to the Financial Statements – Continued
October 31, 2019
Class and Investor Class shares and 12b-1 fees are expensed at annual rate of 0.25% of average daily net assets of Investor Class shares (See Note 5). Expenses associated with a specific Fund in the Trust are charged to that Fund. Common Trust expenses are typically allocated evenly between the Funds of the Trust, or by other equitable means.
Use of Estimates – The preparation of financial statements in conformity with GAAP requires management to make estimates and assumptions that affect the reported amounts of assets and liabilities and disclosure of contingent assets and liabilities at the date of the financial statements and the reported amounts of revenues and expenses during the reporting period. Actual results could differ from those estimates.
3. SECURITIES VALUATION
The Funds have adopted authoritative fair value accounting standards which establish an authoritative definition of fair value and set out a hierarchy for measuring fair value. These standards require additional disclosures about the various inputs and valuation techniques used to develop the measurements of fair value, a discussion in changes in valuation techniques and related inputs during the period and expanded disclosure of valuation Levels for major security types. These inputs are summarized in the three broad Levels listed below:
| Level 1 – | Unadjusted quoted prices in active markets for identical assets or liabilities that the Funds have the ability to access. |
| | |
| Level 2 – | Observable inputs other than quoted prices included in Level 1 that are observable for the asset or liability, either directly or indirectly. These inputs may include quoted prices for the identical instrument on an inactive market, prices for similar instruments, interest rates, prepayment speeds, credit risk, yield curves, default rates and similar data. |
| | |
| Level 3 – | Unobservable inputs for the asset or liability, to the extent relevant observable inputs are not available, representing the Funds’ own assumptions about the assumptions a market participant would use in valuing the asset or liability, and would be based on the best information available. |
Following is a description of the valuation techniques applied to each Fund’s major categories of assets and liabilities measured at fair value on a recurring basis. Each Fund’s investments are carried at fair value.
Equity Securities – Equity securities that are primarily traded on a national securities exchange shall be valued at the last sale price on the exchange on which they are primarily traded on the day of valuation or, if there has been no sale on such day, at the mean between the bid and ask prices. Securities traded primarily in the Nasdaq Global Market System for which market quotations are readily available shall be valued using the Nasdaq Official Closing Price (“NOCP”). If the NOCP is not available, such securities shall be valued at the last sale price on the day of valuation, or if there has been no sale on such day, at the mean between the bid and ask prices. To the extent these securities are actively traded and valuation adjustments are not applied, they are categorized in Level 1 of the fair value hierarchy. If the market for a particular security is not active, and the mean between bid and ask prices is used, these securities are categorized in Level 2 of the fair value hierarchy.
In the case of foreign securities, the occurrence of events after the close of foreign markets, but prior to the time the Funds’ NAV is calculated will result in an adjustment to the trading prices of foreign securities when foreign markets open on the following business day. The Funds will value foreign securities at fair value, taking into account such events in calculating the NAV. In such cases, use of fair valuation can reduce an investor’s ability to seek to profit by estimating the Funds’ NAV in advance of the time the NAV is calculated. All foreign securities,
Jackson Square Funds
Notes to the Financial Statements – Continued
October 31, 2019
with the exception of Canadian securities and those listed on a U.S. exchange, have an adjustment applied to their trade price and therefore are automatically deemed to be in Level 2 of the fair value hierarchy.
Short-Term Investments – Investments in other mutual funds, including money market funds, are valued at their NAV per share. To the extent these securities are actively traded and valuation adjustments are not applied, they are categorized in Level 1 of the fair value hierarchy.
U.S. government securities are normally valued using a model that incorporates market observable data such as reported sales of similar securities, broker quotes, yields, bids, offers, and reference data. These securities are valued principally using dealer quotations. U.S. government securities are categorized in Level 2 of the fair value hierarchy depending on the inputs used and market activity levels for specific securities.
Securities for which market quotations are not readily available, or if the closing price does not represent fair value, are valued following procedures approved by the Board of Trustees (the “Board”). These procedures consider many factors, including the type of security, size of holding, trading volume and news events. There can be no assurance that the Funds could obtain the fair value assigned to a security if they were to sell the security at approximately the time at which the Funds determine their net asset values per share. The Board has established a Valuation Committee to administer, implement, and oversee the fair valuation process, and to make fair value decisions when necessary. The Board regularly reviews reports of the Valuation Committee that describe any fair value determinations and methods.
The inputs or methodology used for valuing securities are not an indication of the risk associated with investing in those securities. The following tables are a summary of the inputs used to value each Fund’s securities as of October 31, 2019:
| All-Cap Growth Fund | | Level 1 | | | Level 2 | | | Level 3 | | | Total | |
| Common Stocks | | $ | 5,665,383 | | | $ | 213,105 | | | $ | — | | | $ | 5,878,488 | |
| Total Investments in Securities | | $ | 5,665,383 | | | $ | 213,105 | | | $ | — | | | $ | 5,878,488 | |
| | | | | | | | | | | | | | | | | |
| Global Growth Fund | | Level 1 | | | Level 2 | | | Level 3 | | | Total | |
| Common Stocks | | $ | 7,727,493 | | | $ | 3,713,260 | | | $ | — | | | $ | 11,440,753 | |
| Total Investments in Securities | | $ | 7,727,493 | | | $ | 3,713,260 | | | $ | — | | | $ | 11,440,753 | |
| | | | | | | | | | | | | | | | | |
| Large-Cap Growth Fund | | Level 1 | | | Level 2 | | | Level 3 | | | Total | |
| Common Stocks | | $ | 74,769,988 | | | $ | — | | | $ | — | | | $ | 74,769,988 | |
| Total Investments in Securities | | $ | 74,769,988 | | | $ | — | | | $ | — | | | $ | 74,769,988 | |
| | | | | | | | | | | | | | | | | |
| Select 20 Growth Fund | | Level 1 | | | Level 2 | | | Level 3 | | | Total | |
| Common Stocks | | $ | 5,499,346 | | | $ | — | | | $ | — | | | $ | 5,499,346 | |
| Total Investments in Securities | | $ | 5,499,346 | | | $ | — | | | $ | — | | | $ | 5,499,346 | |
| | | | | | | | | | | | | | | | | |
| SMID-Cap Growth Fund | | Level 1 | | | Level 2 | | | Level 3 | | | Total | |
| Common Stocks | | $ | 950,124,861 | | | $ | 28,623,083 | | | $ | — | | | $ | 978,747,944 | |
| Short-Term Investments | | | — | | | | 24,306,416 | | | | — | | | | 24,306,416 | |
| Total Investments in Securities | | $ | 950,124,861 | | | $ | 52,929,499 | | | $ | — | | | $ | 1,003,054,360 | |
Refer to the Schedule of Investments for further information on the classification of investments.
Jackson Square Funds
Notes to the Financial Statements – Continued
October 31, 2019
4. INVESTMENT ADVISORY FEE AND OTHER TRANSACTIONS WITH AFFILIATES
The Trust has an agreement with Jackson Square Partners, LLC (the “Adviser”) to furnish investment advisory services to the Funds. For its services, the Funds pay the Adviser a monthly management fee based upon the average daily net assets of the Funds at the following annual rates:
| Fund | | | | |
All-Cap Growth Fund | | | 0.65 | % | |
Global Growth Fund | | | 0.80 | % | |
Large-Cap Growth Fund | | | 0.55 | % | |
Select 20 Growth Fund | | | 0.65 | % | |
SMID-Cap Growth Fund | | | 0.75 | % | |
The Funds’ Adviser has contractually agreed to waive a portion or all of its management fees and/or reimburse the Funds for their expenses to ensure that total annual operating expenses (excluding Rule 12b-1 fees, shareholder servicing fees, acquired fund fees and expenses, brokerage commissions, leverage, interest, taxes, and extraordinary expenses) do not exceed the following rates (based upon the average daily net assets of the Funds):
| Fund | | | | |
All-Cap Growth Fund | | | 0.90 | % | |
Global Growth Fund | | | 1.05 | % | |
Large-Cap Growth Fund | | | 0.64 | % | |
Select 20 Growth Fund | | | 0.87 | % | |
SMID-Cap Growth Fund | | | 0.87 | % | |
Fees waived and expenses reimbursed by the Adviser may be recouped by the Adviser for a period of thirty-six months following the month during which such waiver or reimbursement was made if such recoupment can be achieved without exceeding the expense limit in effect at the time the waiver or reimbursement occurred. The Operating Expense Limitation Agreement is indefinite in term, but cannot be terminated within a year after the effective date of the Funds’ prospectus. After that date, the agreement may be terminated at any time upon 60 days’ written notice by the Board or the Adviser with the consent of the Board. During the year ended October 31, 2019, the Adviser was able to recoup $26,934 from the SMID-Cap Growth Fund, $10,450 relating to fees in the current year and $16,484 relating to fees waived in prior fiscal years. Waived fees and reimbursed expenses subject to potential recovery by month of expiration are as follows:
| | | November 2019 – | | | November 2020 – | | | November 2021 – | |
| Fund | | October 2020 | | | October 2021 | | | October 2022 | |
All-Cap Growth Fund | | $ | 80,625 | | | $ | 84,947 | | | $ | 90,835 | |
Global Growth Fund | | | 96,508 | | | | 96,571 | | | | 105,833 | |
Large-Cap Growth Fund | | | 205,262 | | | | 171,824 | | | | 178,742 | |
Select 20 Growth Fund | | | 11,510 | | | | 81,765 | | | | 95,542 | |
SMID-Cap Growth Fund | | | 172,928 | | | | 102,233 | | | | 8,310 | |
U.S. Bancorp Fund Services, LLC (the “Administrator”), doing business as U.S. Bank Global Fund Services, acts as the Funds’ Administrator, Transfer Agent, and Fund Accountant. U.S. Bank N.A. (the “Custodian”) serves as the Custodian to the Funds. The Custodian is an affiliate of the Administrator. The Administrator performs various administrative and accounting services for the Funds. The Administrator prepares various federal and
Jackson Square Funds
Notes to the Financial Statements – Continued
October 31, 2019
state regulatory filings, reports and returns for the Funds; prepares reports and materials to be supplied to the Trustees; monitors the activities of the Custodian; coordinates the payment of the Funds’ expenses and reviews the Funds’ expense accruals. The officers of the Trust, including the Chief Compliance Officer, are employees of the Administrator. As compensation for its services, the Administrator is entitled to a monthly fee at an annual rate based upon the average daily net assets of the Fund, subject to annual minimums. Fees paid by the Funds for administration and fund accounting, transfer agency, custody and compliance services for the year ended October 31, 2019, are disclosed in the Statements of Operations.
Quasar Distributors, LLC (the “Distributor”) acts as the Funds’ principal underwriter in a continuous public offering of the Funds’ shares. The Distributor is an affiliate of the Administrator.
5. DISTRIBUTION & SHAREHOLDER SERVICING FEES
The Large-Cap Growth Fund and SMID-Cap Growth Fund have adopted a Distribution Plan pursuant to Rule 12b-1 (the “Plan”) in the Investor Class only. The Plan permits the Funds to pay for distribution and related expenses at an annual rate of 0.25% of the Investor Class average daily net assets. The expenses covered by the Plan may include the cost of preparing and distributing prospectuses and other sales material, advertising and public relations expenses, payments to financial intermediaries and compensation of personnel involved in selling shares of the Funds. For the year ended October 31, 2019, the Investor Class of the Large-Cap Growth Fund and SMID-Cap Growth Fund incurred expenses of $104 and $213,288, respectively, pursuant to the Plan.
The Global Growth Fund, Large-Cap Growth Fund, and SMID-Cap Growth Fund have entered into a shareholder servicing agreement (the “Agreement”) with the Adviser, under which the Funds may pay servicing fees at an annual rate of up to 0.10% of the average daily net assets of the Institutional Class and Investor Class. Payments to the Adviser under the Agreement may reimburse the Adviser for payments it makes to selected brokers, dealers and administrators which have entered into service agreements with the Adviser for services provided to shareholders of the Funds. The services provided by such intermediaries are primarily designed to assist shareholders of the Fund and include the furnishing of office space and equipment, telephone facilities, personnel and assistance to the Funds in servicing such shareholders. Services provided by such intermediaries also include the provision of support services to the Funds and include establishing and maintaining shareholders’ accounts and record processing, purchase and redemption transactions, answering routine client inquiries regarding the Funds, and providing such other personal services to shareholders as the Fund may reasonably request. For the year ended October 31, 2019, the Global Growth Fund, Large-Cap Growth Fund, and SMID-Cap Growth Fund incurred shareholder servicing fees of $0, $0, and $324,475, respectively in the Institutional Class. The Large-Cap Growth Fund and SMID-Cap Growth Fund also incurred additional shareholder service fees of $0 and $85,315, respectively, in the Investor Class.
Jackson Square Funds
Notes to the Financial Statements – Continued
October 31, 2019
6. CAPITAL SHARE TRANSACTIONS
Transactions in shares of the Funds were as follows:
| | | All-Cap Growth Fund | | | Global Growth Fund | |
| | | Year Ended | | | Year Ended | | | Year Ended | | | Year Ended | |
| | | October 31, 2019 | | | October 31, 2018 | | | October 31, 2019 | | | October 31, 2018 | |
| IS Class: | | | | | | | | | | | | |
| Shares sold | | | 2,509 | | | | 1,863 | | | | 17,092 | | | | 24,558 | |
| Shares issued in reinvestment | | | | | | | | | | | | | | | | |
| of distributions | | | 22,361 | | | | 292 | | | | 26,418 | | | | 7,007 | |
| Shares redeemed | | | (957 | ) | | | (1 | ) | | | (6,808 | ) | | | (24 | ) |
| Net increase | | | 23,913 | | | | 2,154 | | | | 36,702 | | | | 31,541 | |
| Institutional Class: | | | | | | | | | | | | | | | | |
| Shares sold | | | — | | | | — | | | | — | | | | — | |
| Shares issued in reinvestment | | | | | | | | | | | | | | | | |
| of distributions | | | — | | | | — | | | | — | | | | — | |
| Shares redeemed | | | — | | | | — | | | | — | | | | — | |
| Net increase | | | — | | | | — | | | | — | | | | — | |
| Net increase in capital shares | | | 23,913 | | | | 2,154 | | | | 36,702 | | | | 31,541 | |
| | | | | | | | | | | | | | | | | |
| | | Large-Cap Growth Fund | | | Select 20 Growth Fund | |
| | | Year Ended | | | Year Ended | | | Year Ended | | | Year Ended | |
| | | October 31, 2019 | | | October 31, 2018 | | | October 31, 2019 | | | October 31, 2018 | |
| IS Class: | | | | | | | | | | | | | | | | |
| Shares sold | | | 198,856 | | | | 1,413,317 | | | | 34,922 | | | | 12,415 | |
| Shares issued in reinvestment | | | | | | | | | | | | | | | | |
| of distributions | | | 2,463,691 | | | | 1,170,679 | | | | — | | | | 2,139,758 | |
| Shares redeemed-in-kind | | | — | | | | — | | | | — | | | | (5,003,439 | ) |
| Shares redeemed | | | (5,030,337 | ) | | | (4,713,460 | ) | | | (119 | ) | | | (650,946 | ) |
| Net increase (decrease) | | | (2,367,790 | ) | | | (2,129,464 | ) | | | 34,803 | | | | (3,502,212 | ) |
| Institutional Class: | | | | | | | | | | | | | | | | |
| Shares sold | | | 52,291 | | | | 114,677 | | | | — | | | | — | |
| Shares issued in reinvestment | | | | | | | | | | | | | | | | |
| of distributions | | | 40,896 | | | | 1,007 | | | | — | | | | — | |
| Shares redeemed | | | — | | | | — | | | | — | | | | — | |
| Net increase | | | 93,187 | | | | 115,684 | | | | — | | | | — | |
| Investor Class: | | | | | | | | | | | | | | | | |
| Shares sold | | | — | | | | — | | | | — | | | | — | |
| Shares issued in reinvestment | | | | | | | | | | | | | | | | |
| of distributions | | | — | | | | — | | | | — | | | | — | |
| Shares redeemed | | | — | | | | — | | | | — | | | | — | |
| Net increase | | | — | | | | — | | | | — | | | | — | |
| Net increase (decrease) | | | | | | | | | | | | | | | | |
| in capital shares | | | (2,274,603 | ) | | | (2,013,780 | ) | | | 34,803 | | | | (3,502,212 | ) |
Jackson Square Funds
Notes to the Financial Statements – Continued
October 31, 2019
| | | SMID-Cap Growth Fund | |
| | | Year Ended | | | Year Ended | |
| | | October 31, 2019 | | | October 31, 2018 | |
| IS Class: | | | | | | |
| Shares sold | | | 11,928,453 | | | | 2,259,775 | |
| Shares issued in reinvestment of distributions | | | 1,080,311 | | | | 42,083 | |
| Shares redeemed | | | (2,354,501 | ) | | | (1,600,626 | ) |
| Net increase | | | 10,654,263 | | | | 701,232 | |
| Institutional Class: | | | | | | | | |
| Shares sold | | | 10,096,836 | | | | 3,936,516 | |
| Shares issued in reinvestment of distributions | | | 1,796,740 | | | | 54,980 | |
| Shares redeemed | | | (3,468,849 | ) | | | (1,418,215 | ) |
| Net increase | | | 8,424,727 | | | | 2,573,281 | |
| Investor Class: | | | | | | | | |
| Shares sold | | | 1,558,415 | | | | 3,241,951 | |
| Shares issued in reinvestment of distributions | | | 423,615 | | | | 1,727 | |
| Shares redeemed | | | (1,546,148 | ) | | | (583,267 | ) |
| Net increase | | | 435,882 | | | | 2,660,411 | |
| Net increase in capital shares | | | 19,514,872 | | | | 5,934,924 | |
7. INVESTMENT TRANSACTIONS
The aggregate purchases and sales, excluding short-term investments, by Fund for the year ended October 31, 2019, were as follows:
| | | U.S. Government Securities | | | Other | |
| Fund | | Purchases | | | Sales | | | Purchases | | | Sales | |
| All-Cap Growth Fund | | $ | — | | | $ | — | | | $ | 2,722,649 | | | $ | 2,772,049 | |
| Global Growth Fund | | | — | | | | — | | | | 3,014,684 | | | | 3,036,450 | |
| Large-Cap Growth Fund | | | — | | | | — | | | | 40,316,219 | | | | 96,391,174 | |
| Select 20 Growth Fund | | | — | | | | — | | | | 2,340,420 | | | | 2,164,718 | |
| SMID-Cap Growth Fund | | | — | | | | — | | | | 615,584,850 | | | | 273,935,161 | |
8. FEDERAL TAX INFORMATION
The aggregate gross unrealized appreciation and depreciation of securities held by the Funds and the total cost of securities for federal income tax purposes at October 31, 2019, were as follows:
| | | Aggregate Gross | | | Aggregate Gross | | | Net | | | Federal Income | |
| Fund | | Appreciation | | | Depreciation | | | Appreciation | | | Tax Cost | |
| All-Cap Growth Fund | | $ | 1,107,197 | | | $ | (190,574 | ) | | $ | 916,623 | | | $ | 4,961,865 | |
| Global Growth Fund | | | 3,163,996 | | | | (428,238 | ) | | | 2,735,758 | | | | 8,704,995 | |
| Large-Cap Growth Fund | | | 12,801,361 | | | | (2,789,801 | ) | | | 10,011,560 | | | | 64,758,428 | |
| Select 20 Growth Fund | | | 1,329,196 | | | | (162,684 | ) | | | 1,166,512 | | | | 4,332,834 | |
| SMID-Cap Growth Fund | | | 133,477,752 | | | | (66,194,864 | ) | | | 67,282,888 | | | | 935,769,148 | |
The differences between book-basis and tax-basis unrealized appreciation (depreciation) is attributable primarily to the deferral of wash sale losses.
Jackson Square Funds
Notes to the Financial Statements – Continued
October 31, 2019
At October 31, 2019, the Funds’ most recently completed fiscal year end, the components of distributable earnings on a tax-basis were as follows:
| | | Undistributed | | | Undistributed | | | Other | | | Net | | | Total | |
| | | Ordinary | | | Long-Term | | | Accumulated | | | Unrealized | | | Distributable | |
Fund
| | Income | | | Capital Gains
| | | | | | Appreciation | | | Earnings
| |
All-Cap Growth Fund | | $ | 6,140 | | | $ | 236,915 | | | $ | (9,479 | ) | | $ | 916,623 | | | $ | 1,150,199 | |
Global Growth Fund | | | — | | | | 247,545 | | | | (22,417 | ) | | | 2,735,758 | | | | 2,960,886 | |
Large-Cap Growth Fund | | | 1,576,204 | | | | 12,456,543 | | | | 1 | | | | 10,011,560 | | | | 24,044,308 | |
Select 20 Growth Fund | | | — | | | | 413,121 | | | | (4,678 | ) | | | 1,166,512 | | | | 1,574,955 | |
SMID-Cap Growth Fund | | | 1,182,745 | | | | 42,734,213 | | | | — | | | | 67,282,888 | | | | 111,199,846 | |
As of October 31, 2019, the Funds had no capital loss carryovers. A regulated investment company may elect for any taxable year to treat any portion of any qualified late year loss as arising on the first day of the next taxable year. Qualified late year losses are certain capital, and ordinary losses which occur during the portion of the Fund’s taxable year subsequent to October 31 and December 31, respectively. For the taxable year ended October 31, 2019, the Funds did not defer any post-October losses. The All-Cap Growth Fund, Global Growth Fund and Select 20 Growth Fund deferred, on a tax basis, qualified late year losses of $9,479, $22,397, and $4,630, respectively.
The tax character of distributions paid during the year ended October 31, 2019 was as follows:
| Fund | | Ordinary Income* | | | Long-Term Capital Gains | | | Total | |
All-Cap Growth Fund | | $ | 56,608 | | | $ | 494,536 | | | $ | 551,144 | |
Global Growth Fund | | | — | | | | 620,442 | | | | 620,442 | |
Large-Cap Growth Fund | | | 3,266,521 | | | | 23,974,557 | | | | 27,241,078 | |
Select 20 Growth Fund | | | — | | | | — | | | | — | |
SMID-Cap Growth Fund | | | 13,751,068 | | | | 52,154,134 | | | | 65,905,202 | |
The tax character of distributions paid during the year ended October 31, 2018 was as follows:
| Fund | | Ordinary Income* | | | Long-Term Capital Gains | | | Total | |
All-Cap Growth Fund | | $ | — | | | $ | 8,332 | | | $ | 8,332 | |
Global Growth Fund | | | 183,966 | | | | 3,262 | | | | 187,228 | |
Large-Cap Growth Fund | | | 1,524,583 | | | | 15,648,098 | | | | 17,172,681 | |
Select 20 Growth Fund | | | — | | | | 11,244,462 | | | | 11,244,462 | |
SMID-Cap Growth Fund | | | — | | | | 2,178,014 | | | | 2,178,014 | |
| * | For Federal income tax purposes, distributions of short-term capital gains are treated as ordinary income distributions. |
9. LINE OF CREDIT
The Large-Cap Growth Fund and SMID-Cap Growth Fund (collectively, the “Funds”) have established an unsecured line of credit (“LOC”) in the amount of $25,000,000, 15% of a Fund’s gross market value or 33.33% of the fair value of the Fund’s investments, whichever is less. The LOC matures, unless renewed on July 24, 2020. The LOC is intended to provide short-term financing, if necessary, subject to certain restrictions and covenants, in connection with shareholder redemptions and other short-term liquidity needs of the Funds. The LOC is with the Custodian. Interest is charged at the prime rate which was 4.75% as of October 31, 2019. The interest rate during
Jackson Square Funds
Notes to the Financial Statements – Continued
October 31, 2019
the year was between 4.75%-5.50%. The Funds have authorized the Custodian to charge any of the accounts of the Funds for any missed payments. For the year ended October 31, 2019, the Large-Cap Growth Fund did not have any borrowings under the LOC. For the year ended October 31, 2019, the SMID-Cap Growth Fund LOC activity was as follows:
| | | Amount | | | Date of |
| | Average | Outstanding as | Interest | Maximum | Maximum |
| LOC Agent | Borrowings | of October 31, 2019 | Expense | Borrowing | Borrowing |
U.S. Bank N.A. | $1,419 | $— | $76 | $518,000 | 11/01/2018 |
10. SECTOR RISKS
As of October 31, 2019, each Fund had a significant portion of their assets invested in the information technology sector. The information technology sector may be more sensitive to changes in domestic and international competition, economic cycles, financial resources, personnel availability, rapid innovation and intellectual property issues.
As of October 31, 2019, the Select 20 Growth Fund had a significant portion of its assets invested in the communication services sector. The communication services sector may be vulnerable to obsolescence of products and services due to the technological advancement and the innovation of competitors, as well as other competitive pressure, such as pricing competition, research and development costs, capital requirements and government regulation.
11. CONTROL OWNERSHIP
The beneficial ownership, either directly or indirectly, of more than 25% of the voting securities of a fund creates a presumption of control of the fund, under Section 2(a)(9) of the 1940 Act. As of October 31, 2019, each Fund’s percentage of control ownership positions greater than 25% are as follows:
| Fund | Shareholder | Percent of Shares Held |
Global Growth Fund | Charles Schwab | 44.85% |
Select 20 Growth Fund | Charles Schwab | 31.27% |
| | 26.72% |
SMID-Cap Growth Fund | National Financial Services | 31.54% |
12. SUBSEQUENT EVENTS
On November 25, 2019, U.S. Bancorp, the parent company of Quasar Distributors, LLC (“Quasar”), the Funds’ distributor, announced that it had signed a purchase agreement to sell Quasar to Foreside Financial Group, LLC (“Foreside”) such that Quasar will become a wholly-owned broker-dealer subsidiary of Foreside. The transaction is expected to close by the end of March 2020. Quasar will remain the Funds’ distributor at the close of the transaction, subject to Board approval.
Jackson Square Funds
Notes to the Financial Statements – Continued
October 31, 2019
On December 18, 2019, the following Funds paid ordinary income distributions in the amount as shown in the table.
| | | Ordinary Income | | | Ordinary Income | |
| Fund | | Dollar Amount | | | Per Share Amount | |
Large-Cap Growth Fund – Investor Class | | $ | 24 | | | $ | 0.00690886 | |
Large-Cap Growth Fund – Institutional Class | | | 6,324 | | | | 0.02861479 | |
Large-Cap Growth Fund – IS Class | | | 167,260 | | | | 0.02861479 | |
Select 20 Growth Fund – IS Class | | | 9,588 | | | | 0.01061713 | |
SMID-Cap Growth Fund – Investor Class | | | 25,238 | | | | 0.00794782 | |
SMID-Cap Growth Fund – Institutional Class | | | 395,006 | | | | 0.01878909 | |
SMID-Cap Growth Fund – IS Class | | | 426,414 | | | | 0.02250018 | |
On December 18, 2019, the following Funds paid short-term capital gain distributions in the amount as shown in the table.
| | | Short-Term Capital | | | Short-Term Capital | |
| Fund | | Gain Dollar Amount | | | Gain Per Share Amount | |
| All-Cap Growth Fund – IS Class | | $ | 6,140 | | | $ | 0.02315 | |
| Large-Cap Growth Fund – Investor Class | | | 861 | | | | 0.24305 | |
| Large-Cap Growth Fund – Institutional Class | | | 53,714 | | | | 0.24305 | |
| Large-Cap Growth Fund – IS Class | | | 1,420,681 | | | | 0.24305 | |
| SMID-Cap Growth Fund – Investor Class | | | 87,039 | | | | 0.02741 | |
| SMID-Cap Growth Fund – Institutional Class | | | 576,245 | | | | 0.02741 | |
| SMID-Cap Growth Fund – IS Class | | | 519,463 | | | | 0.02741 | |
On December 18, 2019, the following Funds paid long-term capital gain distributions in the amount as shown in the table.
| | | Long-Term Capital | | | Long-Term Capital | |
| Fund | | Gain Dollar Amount | | | Gain Per Share Amount | |
| All-Cap Growth Fund – IS Class | | $ | 236,915 | | | $ | 0.89323 | |
| Global Growth Fund – Institutional Class | | | 1,488 | | | | 0.52732 | |
| Global Growth Fund – IS Class | | | 247,951 | | | | 0.52732 | |
| Large-Cap Growth Fund – Investor Class | | | 7,267 | | | | 2.05223 | |
| Large-Cap Growth Fund – Institutional Class | | | 453,541 | | | | 2.05223 | |
| Large-Cap Growth Fund – IS Class | | | 11,995,736 | | | | 2.05223 | |
| Select 20 Growth Fund – IS Class | | | 413,127 | | | | 0.45747 | |
| SMID-Cap Growth Fund – Investor Class | | | 3,150,768 | | | | 0.99223 | |
| SMID-Cap Growth Fund – Institutional Class | | | 20,859,827 | | | | 0.99223 | |
| SMID-Cap Growth Fund – IS Class | | | 18,804,329 | | | | 0.99223 | |
Management has performed an evaluation of subsequent events through the date the financial statements were issued and has determined that no additional items require recognition or disclosure.
Jackson Square Funds
Report of Independent Registered Public Accounting Firm
To the Shareholders of Jackson Square Funds and
Board of Trustees of Managed Portfolio Series
Opinion on the Financial Statements
We have audited the accompanying statements of assets and liabilities, including the schedules of investments, of Jackson Square Funds comprising Jackson Square All-Cap Growth Fund, Jackson Square Global Growth Fund, Jackson Square Large-Cap Growth Fund, Jackson Square Select 20 Growth Fund, and Jackson Square SMID-Cap Growth Fund (“Jackson Square Funds” or the “Funds”), each a series of Managed Portfolio Series, as of October 31, 2019, and the related statements of operations for the year then ended, the statements of changes in net assets for each of the two years in the period then ended, including the related notes, and the financial highlights for each of the four periods in the period then ended (collectively referred to as the “financial statements”). In our opinion, the financial statements present fairly, in all material respects, the financial position of each of the Funds as of October 31, 2019, the results of their operations for the year then ended, the changes in their net assets for each of the two years in the period then ended, and the financial highlights for each of the four periods in the period then ended, in conformity with accounting principles generally accepted in the United States of America.
The Funds’ financial highlights for the year ended October 31, 2015, were audited by other auditors whose report dated December 18, 2015, expressed an unqualified opinion on those financial highlights.
Basis for Opinion
These financial statements are the responsibility of the Funds’ management. Our responsibility is to express an opinion on the Funds’ financial statements based on our audits. We are a public accounting firm registered with the Public Company Accounting Oversight Board (United States) (“PCAOB”) and are required to be independent with respect to the Funds in accordance with the U.S. federal securities laws and the applicable rules and regulations of the Securities and Exchange Commission and the PCAOB.
We conducted our audits in accordance with the standards of the PCAOB. Those standards require that we plan and perform the audit to obtain reasonable assurance about whether the financial statements are free of material misstatement, whether due to error or fraud.
Our audits included performing procedures to assess the risks of material misstatement of the financial statements, whether due to error or fraud, and performing procedures that respond to those risks. Such procedures included examining, on a test basis, evidence regarding the amounts and disclosures in the financial statements. Our procedures included confirmation of securities owned as of October 31, 2019, by correspondence with the custodian and brokers. Our audits also included evaluating the accounting principles used and significant estimates made by management, as well as evaluating the overall presentation of the financial statements. We believe that our audits provide a reasonable basis for our opinion.
We have served as the Funds’ auditor since 2016.
COHEN & COMPANY, LTD.
Milwaukee, Wisconsin
December 20, 2019
Jackson Square Funds
Additional Information (Unaudited)
October 31, 2019
TRUSTEES AND OFFICERS
| |
| | | | Other |
| |
| | | | Directorships |
| | | | | Held by |
| Name, Address and | Held with | Time | Overseen | Principal Occupation(s) | Trustee During |
| Year of Birth | the Trust | Served | by Trustee | During the Past Five Years | the Past Five Years |
| | | | | | |
| Independent Trustees | | | | | |
| | | | | | |
| Leonard M. Rush, CPA | Lead | Indefinite | 39 | Retired, Chief Financial Officer, | Independent Trustee, |
| 615 E. Michigan St. | Independent | Term; Since | | Robert W. Baird & Co. Incorporated | ETF Series Solutions |
| Milwaukee, WI 53202 | Trustee | April 2011 | | (2000-2011). | (50 Portfolios) |
| Year of Birth: 1946 | and Audit | | | | (2012-Present); |
| | Committee | | | | Director, Anchor |
| | Chairman | | | | Bancorp Wisconsin, |
| | | | | | Inc. (2011-2013) |
| | | | | | |
| David A. Massart | Trustee | Indefinite | 39 | Co-Founder and Chief Investment | Independent Trustee, |
| 615 E. Michigan St. | and | Term; Since | | Strategist, Next Generation Wealth | ETF Series Solutions |
| Milwaukee, WI 53202 | Valuation | April 2011 | | Management, Inc. (2005-Present). | (50 Portfolios) |
| Year of Birth: 1967 | Committee | | | | (2012-Present) |
| | Chairman | | | | |
| | | | | | |
| David M. Swanson | Trustee | Indefinite | 39 | Founder and Managing Principal, | Independent Trustee, |
| 615 E. Michigan St. | | Term; Since | | SwanDog Strategic Marketing, | ALPS Variable |
| Milwaukee, WI 53202 | | April 2011 | | LLC (2006-Present). | Investment Trust |
| Year of Birth: 1957 | | | | | (10 Portfolios) |
| | | | | | (2006-Present); |
| | | | | | Independent Trustee, |
| | | | | | RiverNorth |
| | | | | | Opportunities |
| | | | | | Closed-End Fund |
| | | | | | (2015-Present) |
| | | | | | |
| Interested Trustee | | | | | |
| | | | | | |
| Robert J. Kern* | Chairman, | Indefinite | 39 | Retired, Executive Vice President, | None |
| 615 E. Michigan St. | and Trustee | Term; Since | | U.S. Bancorp Fund Services, LLC | |
| Milwaukee, WI 53202 | | January 2011 | | (1994-2018). | |
| Year of Birth: 1958 | | | | | |
| * | Mr. Kern is an “interested person” of the Trust as defined by the 1940 Act by virtue of the fact that he was a board member of the Funds’ principal underwriter, Quasar Distributors, LLC, an affiliate of the Administrator. |
Jackson Square Funds
Additional Information (Unaudited) – Continued
October 31, 2019
| |
| | | | Other |
| |
| | | | Directorships |
| | | | | Held by |
| Name, Address and | Held with | Time | Overseen | Principal Occupation(s) | Trustee During |
| Year of Birth | the Trust | Served | by Trustee | During the Past Five Years | the Past Five Years |
| | | | | | |
| Officers | | | | | |
| | | | | | |
Brian R. Wiedmeyer | President and | Indefinite | N/A | Vice President, U.S. Bancorp Fund | N/A |
615 E. Michigan St. | Principal | Term; Since | | Services, LLC (2005-Present). | |
Milwaukee, WI 53202 | Executive | November 2018 | | | |
Year of Birth: 1973 | Officer | | | | |
| | | | | | |
Deborah Ward | Vice President, | Indefinite | N/A | Senior Vice President, U.S. Bancorp | N/A |
615 E. Michigan St. | Chief | Term; Since | | Fund Services, LLC (2004-Present). | |
Milwaukee, WI 53202 | Compliance | April 2013 | | | |
Year of Birth: 1966 | Officer and | | | | |
| | Anti-Money | | | | |
| | Laundering | | | | |
| | Officer | | | | |
| | | | | | |
Benjamin Eirich | Vice President, | Indefinite | N/A | Assistant Vice President, U.S. Bancorp | N/A |
615 E. Michigan St. | Treasurer and | Term; Since | | Fund Services, LLC (2008-Present). | |
Milwaukee, WI 53202 | Principal | August 2019 | | | |
Year of Birth: 1981 | Financial | (Treasurer); | | | |
| | Officer | Since | | | |
| | | November 2018 | | | |
| | | (Vice President) | | | |
| | | | | | |
Thomas A. Bausch, Esq. | Secretary | Indefinite | N/A | Vice President, U.S. Bancorp Fund | N/A |
615 E. Michigan St. | | Term; Since | | Services, LLC (2016-Present); Associate, | |
Milwaukee, WI 53202 | | November 2017 | | Godfrey & Kahn S.C. (2012-2016). | |
Year of Birth: 1979 | | | | | |
| | | | | | |
Douglas Schafer | Vice President | Indefinite | N/A | Assistant Vice President, U.S. Bancorp | N/A |
615 E. Michigan St. | and | Term; Since | | Fund Services, LLC (2002-Present). | |
Milwaukee, WI 53202 | Assistant | May 2016 | | | |
Year of Birth: 1970 | Treasurer | (Assistant | | | |
| | | Treasurer); | | | |
| | | Since | | | |
| | | November 2018 | | | |
| | | (Vice President) | | | |
| | | | | | |
Michael Cyr II | Vice President | Indefinite | N/A | Officer, U.S. Bancorp Fund Services, | N/A |
615 E. Michigan St. | and | Term; Since | | LLC (2013-Present). | |
Milwaukee, WI 53202 | Assistant | August 2019 | | | |
Year of Birth: 1992 | Treasurer | | | | |
Jackson Square Funds
Additional Information (Unaudited) – Continued
October 31, 2019
AVAILABILITY OF FUND PORTFOLIO INFORMATION
Each Fund files complete schedules of portfolio holdings with the SEC for the first and third quarters of each fiscal year on Form N-Q, which is available on the SEC’s website at www.sec.gov. Each Fund’s Form N-Q may be reviewed and copied at the SEC’s Public Reference Room in Washington, D.C. For information on the Public Reference Room call 1-800-SEC-0330. In addition, each Fund’s Form N-Q is available without charge upon request by calling 1-844-577-3863.
AVAILABILITY OF FUND PROXY VOTING INFORMATION
A description of the Funds’ Proxy Voting Policies and Procedures is available without charge, upon request, by calling 1-844-577-3863. Information regarding how the Funds voted proxies relating to portfolio securities during the most recent 12 month period ended June 30 is available (1) without charge, upon request, by calling 1-844-577-3863, or (2) on the SEC’s website at www.sec.gov.
QUALIFIED DIVIDEND INCOME/DIVIDENDS RECEIVED DEDUCTION
For the fiscal year ended October 31, 2019, certain dividends paid by the Funds may be reported as qualified dividend income and may be eligible for taxation at capital gain rates. The percentage of dividends declared from ordinary income designated as qualified dividend income was as follows:
| Fund | | |
| All-Cap Growth Fund | 71.45% | |
| Large-Cap Growth Fund | 29.31% | |
| SMID-Cap Growth Fund | 35.78% | |
For corporate shareholders, the percent of ordinary income distributions qualifying for the corporate dividends received deduction for the fiscal year ended October 31, 2019, was as follows:
| Fund | | |
| All-Cap Growth Fund | 64.00% | |
| Large-Cap Growth Fund | 26.29% | |
| SMID-Cap Growth Fund | 31.81% | |
The percentage of taxable ordinary income distributions that are designated as short-term capital gain distributions under Internal Revenue Section 871(k)(2)(C) for each Fund were as follows:
| Fund | | |
| All-Cap Growth Fund | 97.98% | |
| Large-Cap Growth Fund | 95.99% | |
| SMID-Cap Growth Fund | 91.19% | |
Jackson Square Funds
Privacy Notice (Unaudited)
The Funds collect only relevant information about you that the law allows or requires it to have in order to conduct its business and properly service you. The Funds collect financial and personal information about you (“Personal Information”) directly (e.g., information on account applications and other forms, such as your name, address, and social security number, and information provided to access account information or conduct account transactions online, such as password, account number, e-mail address, and alternate telephone number), and indirectly (e.g., information about your transactions with us, such as transaction amounts, account balance and account holdings).
The Funds do not disclose any non-public personal information about its shareholders or former shareholders other than for everyday business purposes such as to process a transaction, service an account, respond to court orders and legal investigations or as otherwise permitted by law. Third parties that may receive this information include companies that provide transfer agency, technology and administrative services to the Funds, as well as the Funds’ investment adviser who is an affiliate of the Funds. If you maintain a retirement/educational custodial account directly with the Funds, we may also disclose your Personal Information to the custodian for that account for shareholder servicing purposes. The Funds limit access to your Personal Information provided to unaffiliated third parties to information necessary to carry out their assigned responsibilities to the Funds. All shareholder records will be disposed of in accordance with applicable law. The Funds maintain physical, electronic and procedural safeguards to protect your Personal Information and requires its third party service providers with access to such information to treat your Personal Information with the same high degree of confidentiality.
In the event that you hold shares of the Funds through a financial intermediary, including, but not limited to, a broker-dealer, credit union, bank or trust company, the privacy policy of your financial intermediary governs how your non-public personal information is shared with unaffiliated third parties.
Jackson Square Funds
Disclosures (Unaudited)
The materials provided herein are for general information purposes only and may not be copied or redistributed without Jackson Square’s prior consent. The views expressed represent Jackson Square’s assessment of the strategy and market environment as of the date identified herein and should not be considered a recommendation to buy, hold, or sell any security, and should not be relied on as research or investment advice. The information in this presentation, including statements concerning financial markets is based on current market conditions, which will fluctuate and may be superseded by subsequent market events or for other reasons.
Opinions expressed are those of Jackson Square Partners, LLC and are subject to change, are not guaranteed and should not be considered investment advice.
Holdings are as of the date provided and subject to change. Please note that where a partial list of holdings has been provided, a full list is available upon request.
Mutual fund investing involves risk. Principal loss is possible. With the exception of the All-Cap Growth Fund and Global Growth Fund, the Funds are non-diversified meaning they may concentrate their assets in fewer individual holdings than a diversified fund. Therefore each Fund is more exposed to individual stock volatility than a diversified fund. Small- and Mid-capitalization companies tend to have limited liquidity and greater price volatility than large capitalization companies. Investments in foreign securities involve greater volatility and political economic and currency risks and differences in accounting methods. These risks are greater in emerging and frontier markets. Frontier market countries generally have smaller economies and even less developed capital markets than traditional emerging markets, and, as a result, the risks of investing in emerging market countries are magnified in frontier market countries. Investments in Real Estate Investment Trusts (REITs) involve additional risks such as declines in the value of real estate and increased susceptibility to adverse economic or regulatory developments. When the Funds buy or sell securities on a foreign stock exchange, the transaction is undertaken in the local currency rather than in U.S. dollars. The value of the foreign currency may increase or decrease against the value of the U.S. dollar, which may impact the value of the Fund’s portfolio holdings and your investment. Other countries may adopt economic policies and/or currency exchange controls that affect their currency valuations in a manner that is disadvantageous to U.S. investors and companies. From time to time, the trading market for a particular security or type of security in which the Funds invest may become less liquid or even illiquid.
Past performance is no guarantee of future results.
Diversification does not assure a profit, nor does it protect against a loss in a declining market.
For comparison purposes, the indices are fully invested and include the reinvestment of income. Index returns do not reflect management fees, transaction costs, or expenses. The indices are unmanaged, and one cannot invest directly in an index. Benchmark information contained herein has been obtained from third party sources believed to be reliable, but we cannot guarantee its accuracy or completeness. All third-party marks are the property of their respective owners. All performance data regarding the indices are historical and are not indicative of future results, and there can be no assurance that these or comparable results will actually be achieved by the strategies or that the strategies’ investment objectives will be achieved.
Russell 1000® Growth Index measures the performance of the large-cap growth segment of the U.S. equity universe. It includes those Russell 1000® companies with higher price-to-book ratios and higher forecasted growth values. The index is unmanned and an investment cannot be made into the index.
Russell 2500® Growth Index. The Russell 2500® Growth Index measures the performance of the small- to mid-cap growth segment of the U.S. equity universe. It includes those Russell 2500® companies with higher price-to-book ratios and higher forecasted growth values. The index is unmanned and an investment cannot be made into the index.
Russell 3000® Growth Index measures the performance of the broad growth segment of the U.S. equity universe. It includes those Russell 3000® companies with higher price-to-book ratios and higher forecasted growth values. The index is unmanned and an investment cannot be made into the index.
Jackson Square Funds
Disclosures (Unaudited) – Continued
MSCI All Country World Index. The MSCI All Country World Index is a free float-adjusted market capitalization weighted index designed to measure equity market performance across developed markets world-wide. Index “net” return reflects minimum possible dividend reinvestment, after deduction of withholding tax at the highest possible rate. The index is unmanned and an investment cannot be made into the index. The index is a service mark of MSCI Barra. MSCI makes no express or implied warranties or representations and shall have no liability whatsoever with respect to any MSCI data contained herein. The MSCI data may not be further redistributed or used as a basis for other indices or any securities or financial products. This report is not approved, reviewed, or produced by MSCI.
The report must be preceded or accompanied by a prospectus.
Jackson Square Partners, LLC is the adviser to the Jackson Square Funds, which are distributed by Quasar Distributors, LLC.
Investment Adviser
Jackson Square Partners, LLC
101 California Street, Suite 3750
San Francisco, California 94111
Distributor
Quasar Distributors, LLC
777 East Wisconsin Avenue
Milwaukee, Wisconsin 53202
Custodian
U.S. Bank N.A.
1555 North Rivercenter Drive, Suite 302
Milwaukee, Wisconsin 53212
Administrator, Fund Accountant
And Transfer Agent
U.S. Bancorp Fund Services, LLC
615 East Michigan Street
Milwaukee, Wisconsin 53202
Independent Registered Public Accounting Firm
Cohen & Company, Ltd.
342 North Water Street, Suite 830
Milwaukee, Wisconsin 53202
Legal Counsel
Stradley Ronon Stevens & Young, LLP
2005 Market Street, Suite 2600
Philadelphia, Pennsylvania 19103
This report should be accompanied or preceded by a prospectus.
The Funds’ Statement of Additional Information contains additional information about the
Funds’ trustees and is available without charge upon request by calling 1-844-577-3863.
Item 2. Code of Ethics.
The Registrant has adopted a code of ethics that applies to the Registrant’s principal executive officer and principal financial officer. The Registrant has not made any substantive amendments to its code of ethics during the period covered by this period.
The Registrant has not granted any waivers from any provisions of the code of ethics during the period covered by this report.
A copy of the Registrant’s code of ethics that applies to the Registrant’s principal executive officer and principal financial officer is filed herewith.
Item 3. Audit Committee Financial Expert.
The Registrant’s Board of Trustees has determined that there is at least one audit committee financial expert serving on its audit committee. Leonard M. Rush is the “audit committee financial expert” and is considered to be “independent” as each term is defined in Item 3 of Form N-CSR.
Item 4. Principal Accountant Fees and Services.
The Registrant has engaged its principal accountant to perform audit services, audit-related services, tax services and other services during the past two fiscal years. “Audit services” refer to performing an audit of the Registrant's annual financial statements or services that are normally provided by the accountant in connection with statutory and regulatory filings or engagements for the past fiscal year. “Audit-related services” refer to the assurance and related services by the principal accountant that are reasonably related to the performance of the audit. “Tax services” refer to professional services rendered by the principal accountant for tax compliance, tax advice, and tax planning, including reviewing the Fund’s tax returns and distribution calculations. There were no “other services” provided by the principal accountant. For the fiscal years ended October 31, 2019 and October 31, 2018, the Funds’ principal accountant was Cohen & Company, Ltd. The following table details the aggregate fees billed or expected to be billed for each of the last fiscal year for audit fees, audit-related fees, tax fees and other fees by the principal accountant.
| | FYE 10/31/2019 | FYE 10/31/2018 |
Audit Fees | $68,000 | $65,500 |
Audit-Related Fees | $0 | $0 |
Tax Fees | $18,000 | $15,000 |
All Other Fees | $0 | $0 |
The audit committee has adopted pre-approval policies and procedures that require the audit committee to pre‑approve all audit and non‑audit services of the Registrant, including services provided to any entity affiliated with the Registrant.
The percentage of fees billed by Cohen & Company, Ltd. applicable to non-audit services pursuant to waiver of pre-approval requirement was as follows:
| | FYE 10/31/2019 | FYE 10/31/2018 |
Audit-Related Fees | 0% | 0% |
Tax Fees | 0% | 0% |
All Other Fees | 0% | 0% |
All of the principal accountant’s hours spent on auditing the Registrant’s financial statements were attributed to work performed by full‑time permanent employees of the principal accountant.
The following table indicates the non-audit fees billed or expected to be billed by the Registrant’s accountant for services to the Registrant and to the Registrant’s investment adviser (and any other controlling entity, etc.—not sub-adviser) for the last two years. The audit committee of the board of trustees/directors has considered whether the provision of non-audit services that were rendered to the Registrant's investment adviser is compatible with maintaining the principal accountant's independence and has concluded that the provision of such non-audit services by the accountant has not compromised the accountant’s independence.
Non-Audit Related Fees | FYE 10/31/2019 | FYE 10/31/2018 |
Registrant | 0% | 0% |
Registrant’s Investment Adviser | 0% | 0% |
Item 5. Audit Committee of Listed Registrants.
Not applicable to Registrants who are not listed issuers (as defined in Rule 10A-3 under the Securities Exchange Act of 1934).
Item 6. Schedule of Investments.
(a) Schedule of Investments is included as part of the report to shareholders filed under Item 1 of this Form.
(b) Not applicable.
Item 7. Disclosure of Proxy Voting Policies and Procedures for Closed-End Management Investment Companies.
Not applicable to open-end investment companies.
Item 8. Portfolio Managers of Closed-End Management Investment Companies.
Not applicable to open-end investment companies.
Item 9. Purchases of Equity Securities by Closed‑End Management Investment Company and Affiliated Purchasers.
Not applicable to open-end investment companies.
Item 10. Submission of Matters to a Vote of Security Holders.
There have been no material changes to the procedures by which shareholders may recommend nominees to the Registrant’s Board of Trustees.
Item 11. Controls and Procedures.
(a) | The Registrant’s President and Treasurer have reviewed the Registrant's disclosure controls and procedures (as defined in Rule 30a-3(c) under the Investment Company Act of 1940 (the “Act”)) as of a date within 90 days of the filing of this report, as required by Rule 30a-3(b) under the Act and Rules 13a-15(b) or 15d‑15(b) under the Securities Exchange Act of 1934. Based on their review, such officers have concluded that the disclosure controls and procedures are effective in ensuring that information required to be disclosed in this report is appropriately recorded, processed, summarized and reported and made known to them by others within the Registrant and by the Registrant’s service provider. |
(b) | There were no significant changes in the Registrant's internal control over financial reporting (as defined in Rule 30a-3(d) under the Act) that occurred during the second fiscal quarter of the period covered by this report that has materially affected, or is reasonably likely to materially affect, the Registrant's internal control over financial reporting. |
Item 12. Disclosure of Securities Lending Activities for Closed-End Management Investment Companies
Not applicable to open-end investment companies.
Item 13. Exhibits.
(a) | (1) Any code of ethics or amendment thereto, that is subject of the disclosure required by Item 2, to the extent that the Registrant intends to satisfy Item 2 requirements through filing an exhibit. 1) Filed herewith |
(2) Certifications pursuant to Section 302 of the Sarbanes-Oxley Act of 2002. Filed herewith.
(3) Any written solicitation to purchase securities under Rule 23c‑1 under the Act sent or given during the period covered by the report by or on behalf of the Registrant to 10 or more persons. Not applicable to open-end investment companies.
(4) Change in the Registrant’s independent public accountant. There was no change in the Registrant’s independent public accountant for the period covered by this report.
| (b) | Certification pursuant to Section 906 of the Sarbanes‑Oxley Act of 2002. Furnished herewith. |
SIGNATURES
Pursuant to the requirements of the Securities Exchange Act of 1934 and the Investment Company Act of 1940, the Registrant has duly caused this report to be signed on its behalf by the undersigned, thereunto duly authorized.
(Registrant) Managed Portfolio Series
By (Signature and Title) /s/Brian R. Wiedmeyer
Brian R. Wiedmeyer, President
Date 1/3/2020
Pursuant to the requirements of the Securities Exchange Act of 1934 and the Investment Company Act of 1940, this report has been signed below by the following persons on behalf of the Registrant and in the capacities and on the dates indicated.
By (Signature and Title) /s/Brian R. Wiedmeyer
Brian R. Wiedmeyer, President
Date 1/3/2020
By (Signature and Title) /s/Benjamin J. Eirich
Benjamin J. Eirich, Treasurer
Date 1/3/2020