Great Lakes Disciplined Equity Fund
Institutional Class Shares – GLDNX
Great Lakes Large Cap Value Fund
Institutional Class Shares – GLLIX
Great Lakes Small Cap Opportunity Fund
Investor Class Shares – GLSCX
Institutional Class Shares – GLSIX
Annual Report
March 31, 2022
1-855-278-2020
www.glafunds.com
Distributed by Quasar Distributors, LLC
Member FINRA
Great Lakes Disciplined Equity Fund
May 20, 2022
Dear Shareholders,
I. INVESTMENT RESULTS
Market Review
During the one-year period ended March 31, 2022, investors continued to be whipsawed by new Covid variants and the related policies of decision makers that came with each new wave of infection. In early summer what was thought to be the long awaited value rally was grinded to a halt by a new wave of infections and the lockdowns that coincided. As the worst of investors’ fears subsided, we were presented with the omicron strain which the market largely shrugged off. As winter approached we began to turn the page on this chapter and year, investors shifted their attention to The Fed as they tried to properly telegraph the beginning of the end of easy monetary policy. The unwinding of the balance sheet, and lift-off from zero interest rate policy, are creating market swings of the likes we haven’t seen in over a decade. This change in policy has given new energy to value purists and caused growth investors to reexamine their appetite for risk.
Against this backdrop, for the year ended March 31st of 2022, your Great Lakes Disciplined Equity Fund returned the following:
Share Class | 12 Months ended 3/31/22 | |
| Institutional Class | 8.72% | |
| S&P 500 Index | 15.65% | |
Size/Style
Growth stocks outperformed value stocks by a substantial margin during the one-year period with the S&P 500 Growth index adding 18.83% while the S&P 500 Value index added 12.58%.
| | • | Mega-caps slightly outperformed large-caps as measured by the S&P 100 and S&P 500. |
| | | |
| | • | Growth Edged value, as measured by the S&P 500 Growth and S&P 500 Value Indexes. |
| | | o | When looking at the growth and value returns for YTD 2022 we find value with a sizable lead of roughly 8.5%. |
S&P 500 Sectors
Inconsistency across cyclical and defensive sectors is observed, as the market is transitioning from expansionary to contractionary.
| | • | Energy continued its spectacular rise advancing 64.30% over the period. |
| | | |
| | • | Sectors showing continued strength include Real Estate 25.75%, Technology 20.90% and Utilities 19.93% |
| | | |
| | • | Communication Services -0.93% was the lone sector with a negative return of the previous year, shedding almost a full percent. |
Great Lakes Disciplined Equity Fund
II. ATTRIBUTION
Below is attribution for the Great Lakes Disciplined Equity Fund.
Common Factor Positioning and Individual stock selection were both detractors over the year.
From an industry perspective, an overweight to Grocery Stores and an underweight to Home Products both contributed positively to the relative return.
From a factor perspective, an overweight to Volatility and Momentum both were detractors from relative performance.
Our two largest contributing stocks for the year were Tesla (TSLA) and Alphabet (GOOG). An overweight to both names added to relative performance, as both names outperformed the benchmark by a sizable amount.
Our two largest detracting stocks for the year were Disney (DIS) and Expedia (EXPE). A sizable active position in both names detracted from performance, as both lagged the benchmark on the trailing 1 year.
III. OUTLOOK
While we still see Covid in the news – most recently a flare-up in Shanghai which forced Tesla to send workers home – most evidence continues to support the notion that Covid will end with a whimper, not a bang. Our belief is that the unprecedented nature of the pandemic greatly reduced investors’ collective ability to discount the future. As such, we saw very high levels of volatility punctuated by periods of record factor correlations and significant rotations. While there will always be “exogenous” events impacting the markets, no market participants are able to draw from experience to know how global markets would respond to this pandemic.
But, onward!
Investors expect the Fed’s balance sheet to stop growing and indeed begin to shrink later this year. The fiscal stimulus bills are in the rear view mirror (although most of the infrastructure money is yet to be doled out). The first of what’s expected to be several rate hikes is under our belt. The yield curve has inverted – which typically portends below average economic growth. In other words, the days of easy money are fading, and higher volatility is likely here to stay.
However…Profit margins have remained high to date – 40+ year highs in input cost increases have been largely passed through to the consumer, and productivity has been strong. The amount of slack which has been removed from the labor market should begin to bite at some point… the marginal worker is less productive. The Employment Cost Index is increasing at a 20 year high pace.
The housing market remains solid as of this writing, but mortgage rates have surged more quickly than ever, reducing affordability somewhat. We don’t really see the impact in the overall numbers at this point… but our guess is we will.
Weak equity returns during Q1 combined with the aforementioned still-strong earnings means valuation of the major US indices has come in. Markets still aren’t cheap, however. The Fed will have to successfully kill inflation, and kill it softly as the great Roberta Flack once crooned (or Lauryn Hill, take your pick). And they’ll have to kill it without killing economic activity.
So the question in large part is, can Powell and the Fed sing a good song, and sing it with style?
Jon Quigley, CFA. MSc
CIO, Disciplined Equity
Great Lakes Disciplined Equity Fund
Definitions:
The S&P 500 Index is a broad based index of 500 stocks, which is widely recognized as representative of the equity market in general.
The S&P 100 Index is an index, weighted for market capitalization, of 100 blue chip stocks from a variety of industries. The stocks listed on the S&P 100 are the top 100 stocks on the S&P 500 by market capitalization. Its ticker symbol is OEX, and it was originally operated by the Chicago Board Options Exchange.
The S&P 500 Growth index tracks the investment results of the S&P 500 index composed of large-capitalization U.S. equities that exhibit growth characteristics.
The S&P 500 Value Index measures the performance of the large-capitalization value sector in the US equity market. It is a subset of the S&P 500 Index and consists of those stocks in the S&P 500 Index exhibiting the strongest value characteristics.
It is not possible to invest directly in an index.
Past performance does not guarantee future results.
Opinions expressed are subject to change at any time, are not guaranteed and should not be considered investment advice.
Fund holdings and sector allocations are subject to change and are not recommendations to buy or sell any security. Please refer to the schedules of investments for complete holdings information.
Mutual fund investing involves risk. Principal loss is possible. The Fund may invest in ETFs. Investing in ETFs are subject to additional risks that do not apply to conventional mutual funds, including the risks that the market price of the shares may trade at a discount to its net asset value ("NAV"), an active secondary trading market may not develop or be maintained, or trading may be halted by the exchange in which they trade, which may impact a Funds ability to sell its shares. ETFs have management and other expense. The Fund will bear its pro rata portion of these expenses and therefore the Fund’s expenses may be higher than if it invested directly in securities. The Fund invests in foreign securities which involve greater volatility and political, economic and currency risks and differences in accounting methods. These risks are greater in emerging markets. Growth stocks typically are more volatile than value stocks; however, value stocks have a lower expected growth rate in earnings and sales.
Great Lakes Disciplined Equity Fund
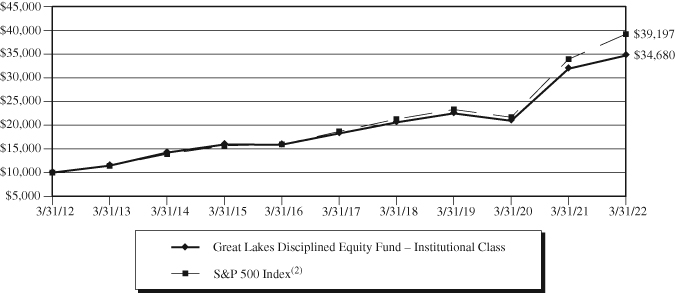
Value of $10,000 Investment (Unaudited)
The chart assumes an initial investment of $10,000. Performance reflects waivers of fee and operating expenses in effect. In the absence of such waivers, total return would be reduced. Performance data quoted represents past performance and does not guarantee future results. Investment returns and principal value will fluctuate, and when sold, may be worth more or less than their original cost. Performance current to the most recent month-end may be lower or higher than the performance quoted and can be obtained by calling 855-278-2020. Performance assumes the reinvestment of capital gains and income distributions. The performance does not reflect the deduction of taxes that a shareholder would pay on Fund distributions or the redemption of Fund shares.
Annualized Rates of Return as of March 31, 2022
| | 1-Year | 3-Year | 5-Year | 10-Year | Since Inception(1) |
| Institutional Class | 8.72% | 15.53% | 13.69% | 13.24% | 13.98% |
S&P 500 Index(2) | 15.65% | 18.92% | 15.99% | 14.64% | 15.29% |
| (1) | Inception date of the Fund was June 1, 2009. |
| (2) | The S&P 500 Index is a broad based unmanaged index of 500 stocks, which is widely recognized as representative of the equity market in general. This index can not be invested in directly. |
The following is expense information for the Great Lakes Disciplined Equity Fund as disclosed in the Fund’s most recent prospectus dated July 29, 2021:
Gross Expenses: 1.13%; Net Expenses: 0.86%. Great Lakes Advisors, LLC (the “Adviser” or “Great Lakes”) has contractually agreed to waive its management fees and pay Fund expenses in order to ensure that Total Annual Fund Operating Expenses (excluding acquired fund fees and expenses (“AFFE”), leverage/borrowing interest, interest expense, dividends paid on short sales, taxes, brokerage commissions and other transactional expenses, and extraordinary expenses) do not exceed 0.85% of the average daily net assets of the Fund. Fees waived and expenses paid by the Adviser may be recouped by the Adviser for a period of 36 months following the month during which such fee waiver and expense payment was made if such recoupment can be achieved without exceeding the expense limit in effect at the time the fee waiver and expense payment occurred and at the time of recoupment. The Operating Expense Limitation Agreement is indefinite in term and cannot be terminated through at least July 29, 2022. Thereafter, the agreement may be terminated at any time upon 60 days’ written notice by the Trust’s Board or the Adviser, with the consent of the Board.
The actual net expense ratio applicable to investors, as disclosed in the Financial Highlights for the year ended March 31, 2022 was 0.85%.
Great Lakes Disciplined Equity Fund
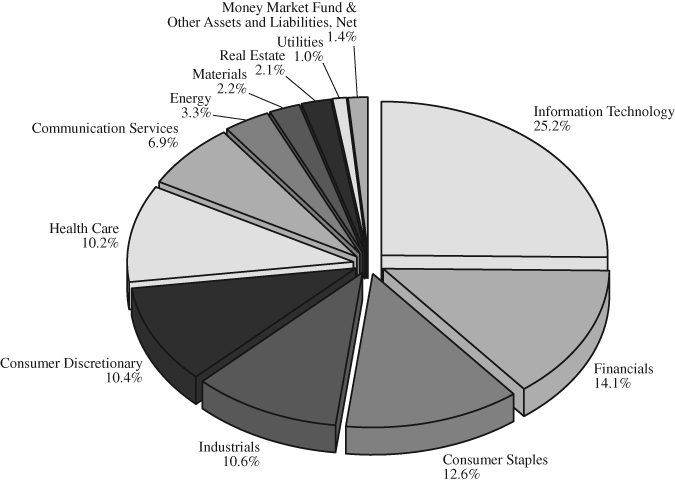
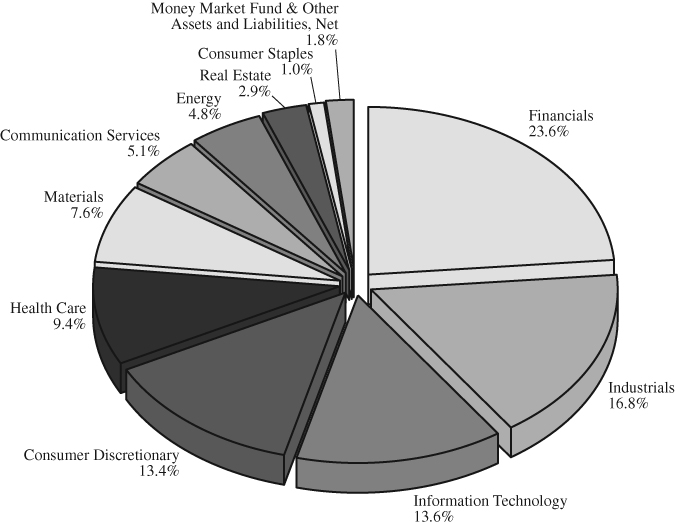
Allocation of Portfolio Net Assets (Unaudited)
March 31, 2022(1)
(% of Net Assets)
Top 10 Equity Holdings (Unaudited)
March 31, 2022(1)
(% of Net Assets)
| | Apple, Inc. | | | 7.3 | % |
| | UnitedHealth Group, Inc. | | | 4.2 | % |
| | Costco Wholesale Corp. | | | 3.9 | % |
| | Bank of America Corp. | | | 3.7 | % |
| | Alphabet, Inc. – Class C | | | 3.3 | % |
| | Tesla, Inc. | | | 3.2 | % |
| | NVIDIA Corp. | | | 3.1 | % |
| | Microsoft Corp. | | | 2.7 | % |
| | Cisco Systems, Inc. | | | 2.5 | % |
| | CDW Corp. | | | 2.4 | % |
(1) | Fund holdings and sector allocations are subject to change at any time and are not recommendations to buy or sell any security. |
Great Lakes Large Cap Value Fund
May 10, 2022
Dear Shareholders,
I. INVESTMENT RESULTS
The unexpected became the expected during the fiscal year as high volatility in financial and investment markets coupled with an unstable geopolitical environment.
Inflation returned near mid-2021 after a multi-decade absence. Measures ran through the Federal Reserve Board objective of 2% to the 5-7% area. Persistence of higher inflation has been longer than first projected, and spread to most areas of the economy is wider than hoped. Expectations of future inflation (from surveys) have risen above the 2% objective.
In response, a sharp pivot in monetary policy occurred as the Federal Reserve Board became determined to restore price stability. As intentions became known, bond market returns in the January-March quarter were the worst in decades.
The U.S. economy continued to expand into March. Commodity markets have soared, reaching the highest levels in decades for a wide range of goods. Unemployment rates dropped almost to record lows of the past several decades. Corporate profit recovery from the 2020 decline has been strong into early 2022.
After rising through calendar 2021, equity markets declined in the fourth fiscal quarter. Still, during the fiscal year, the equity market (S&P 500 Index) advance was at a mid-teens rate while value style indexes, which picked up as the fiscal year progressed, rose near 12%.
Share Class | 12 Months ended 3/31/22 | |
| Institutional Class | 11.93% | |
| Russell 1000 Value Index | 11.67% | |
II. ATTRIBUTION
Fund results were close to value style benchmarks in fiscal 2022. Generally, areas more sensitive to the economic pace limited results on both the consumer and industrial sides of the strategy, but industry and company-specific factors were important.
Nine positions in six broad areas declined more than 5% over the year to limit returns. These areas included consumer big-ticket items (auto components, toys) and streaming video entertainment (Comcast, down 13% in price; Disney, down over 25%) on the consumer side. Among industrials, areas included truck expenses and components (Cummins, down over 20%), semiconductors (Intel, declining over 22%) and aircraft engines (General Electric slipped almost 13%).
In contrast, fifteen positions in five broad areas led results by rising over 20% during the year. Four were in the broad health care area (a pharmaceutical and three services firms providing insurance, pharmacy benefit management, health products, retail and drug distribution), five in the financial area (three insurers, one charge and credit card lender and a wealth manager), and three in energy (oil and gas production, oil services).
III. Outlook
Volatility and uncertainty remain high. Prospects for investment markets in 2022 have already changed since the year began. At this time, inflation is higher, broader and longer-lasting than originally thought. Easing of supply chain pressures may bring about a lower inflation level later in the year, but problems persisted in March-April.
Great Lakes Large Cap Value Fund
The Federal Reserve Board may increase the overnight rate at each of the meetings to come in 2022 and into 2023 as it moves from monetary accommodation toward a more normal rate level. Longer maturity fixed income instruments have already begun to shift to provide higher yields, and offer more competition to equities.
As the economic recovery from the pandemic-influenced downturn could be near a peak, profit gains are likely to slow in 2022 and possibly in 2023 as well. Labor costs (compensation follows inflation) and the supply chain problem areas of raw materials, transportation and a wide range of other expenses all are also likely to pressure margins. Valuation of equities remains high by historical standards.
Following three years of above-average equity returns, the prospects of higher inflation, slowing corporate profits, less accommodative monetary policy and exogenous factors (pandemic variants ebbs and flows, war) together are less favorable for another above-average period of equity market returns.
Edward J. Calkins, CFA
Senior Portfolio Manager
Fund Shareholder
Definitions:
The Russell 1000® Value Index measures the performance of those Russell 1000® Index companies with lower price-to-book ratios and lower forecasted growth rates.
The S&P 500 Index is a broad based index of 500 stocks, which is widely recognized as representative of the equity market in general.
One cannot invest directly in an index.
Past performance does not guarantee future results.
Diversification does not assure a profit nor protect against loss in a declining market.
Opinions expressed are subject to change at any time, are not guaranteed and should not be considered investment advice.
Fund holdings and sector allocations are subject to change and are not recommendations to buy or sell any security. For a complete list of fund holdings, please see the Schedule of Investments included in this report.
Mutual fund investing involves risk. Principal loss is possible. The Fund’s value investments are subject to the risk that their intrinsic values may not be recognized by the broad market or that their prices may decline. Investing in ETFs are subject to additional risks that do not apply to conventional mutual funds, including the risks that the market price of the shares may trade at a discount to its net asset value (“NAV”), an active secondary trading market may not develop or be maintained, or trading may be halted by the exchange in which they trade, which may impact a Funds ability to sell its shares. The Fund invests in foreign securities which involve greater volatility and political, economic and currency risks and differences in accounting methods. These risks are greater in emerging markets.
Great Lakes Large Cap Value Fund
Value of $10,000 Investment (Unaudited)
The chart assumes an initial investment of $10,000. Performance reflects waivers of fee and operating expenses in effect. In the absence of such waivers, total return would be reduced. Performance data quoted represents past performance and does not guarantee future results. Investment returns and principal value will fluctuate, and when sold, may be worth more or less than their original cost. Performance current to the most recent month-end may be lower or higher than the performance quoted and can be obtained by calling 855-278-2020. Performance assumes the reinvestment of capital gains and income distributions. The performance does not reflect the deduction of taxes that a shareholder would pay on Fund distributions or the redemption of Fund shares.
Annualized Rates of Return as of March 31, 2022
| | 1-Year | 3-Year | 5-Year | Since Inception(1) |
| Institutional Class | 11.93% | 13.22% | 9.71% | 11.61% |
Russell 1000 Value Index(2) | 11.67% | 13.02% | 10.29% | 11.86% |
| (1) | Inception date of the Fund was September 28, 2012. |
| (2) | The Russell 1000 Value Index measures the performance of the large-cap value segment of the U.S. equity universe. It includes those Russell 1000 Index companies with lower price-to-book ratios and lower expected growth values. This index can not be invested in directly. |
The following is expense information for the Great Lakes Large Cap Value Fund as disclosed in the Fund’s most recent prospectus dated July 29, 2021:
Gross Expenses: 1.04%; Net Expenses: 0.85%. Great Lakes Advisors, LLC (the “Adviser” or “Great Lakes”) has contractually agreed to waive its management fees and pay Fund expenses in order to ensure that Total Annual Fund Operating Expenses (excluding acquired fund fees and expenses (“AFFE”), leverage/borrowing interest, interest expense, dividends paid on short sales, taxes, brokerage commissions and other transactional expenses, and extraordinary expenses) do not exceed 0.85% of the average daily net assets of the Fund. Fees waived and expenses paid by the Adviser may be recouped by the Adviser for a period of 36 months following the month during which such fee waiver and expense payment was made if such recoupment can be achieved without exceeding the expense limit in effect at the time the fee waiver and expense payment occurred and at the time of recoupment. The Operating Expense Limitation Agreement is indefinite in term and cannot be terminated through at least July 29, 2022. Thereafter, the agreement may be terminated at any time upon 60 days’ written notice by the Trust’s Board or the Adviser, with the consent of the Board.
The actual net expense ratio applicable to investors, as disclosed in the Financial Highlights for the year ended March 31, 2022 was 0.85%.
Great Lakes Large Cap Value Fund
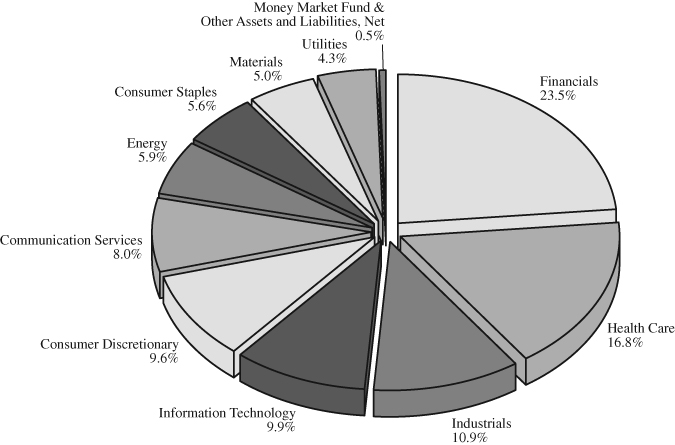
Allocation of Portfolio Net Assets (Unaudited)
March 31, 2022(1)
(% of Net Assets)
Top 10 Equity Holdings (Unaudited)
March 31, 2022(1)
(% of Net Assets)
| | Comcast Corp. – Class A | | | 4.0 | % |
| | BorgWarner, Inc. | | | 3.6 | % |
| | Citigroup, Inc. | | | 3.5 | % |
| | RenaissanceRe Holdings, Ltd. | | | 3.5 | % |
| | Berkshire Hathaway, Inc. – Class B | | | 3.2 | % |
| | Public Service Enterprise Group, Inc. | | | 3.2 | % |
| | Merck & Co., Inc. | | | 3.1 | % |
| | AbbVie, Inc. | | | 3.1 | % |
| | Shell Plc – ADR | | | 3.0 | % |
| | Chubb Ltd. | | | 3.0 | % |
(1) | Fund holdings and sector allocations are subject to change at any time and are not recommendations to buy or sell any security. |
Great Lakes Small Cap Opportunity Fund
May 10, 2022
Dear Shareholders,
I. INVESTMENT RESULTS
The Great Lakes Small Cap Opportunity Institutional Class (GLSIX) increased 1.65% for the twelve months ended March 31, 2022, outperforming the Russell 2000 index return which was down 5.79%.
Share Class | 12 Months ended 3/31/22 | |
| Institutional Class | 1.65% | |
| Russell 2000 Index | -5.79% | |
It was a volatile start to the 2022 year as the equity markets grappled with a litany of headline risks; with the primary development revolved around the repricing of the Fed rate hike path and Russia’s invasion of Ukraine. At its lowest point in the first quarter of 2022, the Russell 2000 index declined 20% and then rallied to finish the quarter down 7.5%, the worst quarterly returns since Q12020.
In periods of market distress, we seek to build a portfolio which provides attractive risk mitigation relative to the benchmark. We are pleased the Fund was able to accomplish that goal during the volatile 1Q2022 and post a positive return for the twelve month period ended March 31, 2022 while the Russell 2000 declined in value.
What has helped us to outperform is value stocks significantly outperforming growth stocks by 17.7% (+3.4% for the Russell 2000 Value Index versus -14.3% for the Russell 2000 Growth Index) over the twelve-month period ended March 31, 2022. Despite the nice recovery from value, growth is still solidly ahead of value over the past 5- and 10-year time horizon. Therefore in our view, there is plenty of room for value to continue its relative outperformance.
Perhaps, more promising, is the continued underperformance of the basket of unprofitable, high multiple stocks, namely in the biotechnology and software industries. Both of these industries were among the worst performers over the past 12 month period, -43.3% and -20.9%, respectively. Yet, unprofitable companies still represent over a third of the Russell 2000 Index, off its all-time high of nearly 40% and well above the historical average of around 20%. Our investment strategy seeks to invest in quality, cash generating companies at a discount to value. The value of price is starting to matter, and if this pattern holds, we believe it should bode well for the Fund in the ensuing years.
While we do not forecast macroeconomic variables to make investment decisions, it does appear that the period of relative low inflation has come to an end, and there are signs that it may linger for longer than what investors think. In expectation of this, how are we thinking about the portfolio’s positioning in an era of higher inflation in the future? We believe our active, fundamental investing framework should help us identify the relative beneficiaries and relative losers.
Given our quality-bent, we feel good that our companies have strong competitive positions to maintain its profitability in inflationary times. An example of this is Crane, a manufacturer of highly engineered, specialized industrial components. The company has dominate market share in niche markets (i.e. aircraft braking systems) with little substitution risk. These competitive characteristics should provide the company with pricing power.
This is why we continue to like the setup of our portfolio. We believe it is full of cash-generating, quality companies with durable competitive advantages that should be able to generate strong risk-adjusted returns throughout the economic cycles.
Great Lakes Small Cap Opportunity Fund
II. ATTRIBUTION
For the twelve months ended March 31, 2022, the Fund returned 1.65%, outperforming the Russell 2000 benchmark’s return of -5.79%. The Fund’s 744 basis points of outperformance relative to the index was driven by both sector allocation and stock selection. The positive sector allocation was largely due to our underweight in Healthcare, which was the worst performing sector for the index. Strong stock selection in Healthcare, Technology, and Financials were the largest contributors to our relative performance. On the flip side, our worst performing sector was Communication Services.
Healthcare was one of our best performing sector, adding nearly 600 basis point of alpha. As noted above, our underweight position, particularly in the biotechnology industry where the portfolio had zero exposure helped us to outperform. From a stock selection perspective, five out of our six healthcare holdings contributed to relative outperformance. Prestige Consumer Healthcare (a manufacturer of consumer healthcare products), was the clear standout, advancing 20% as the company delivered healthy earnings aided by a rebound in demand for its products that were adversely impacted by COVID.
The Technology sector was also a bright spot for the Fund. We outperformed due to strong stock selection plus our limited exposure to the high-multiple areas of the sector (i.e. software industry) that took a pummeling. Seven of our ten technology holdings posted gains in the period. Extreme Networks (networking equipment supplier), ViaSat (satellite services firm), and Progress Software (enterprise software company) led the way as fundamentals for each of these businesses continues to track our expectations.
The Fund’s outperformance in Financials was driven by First American Financial (a title insurance company), PRA Group (debt collector), Axis Capital (insurance company), and Jefferies (an investment bank). First American posted record earnings, driven by a strong refinance market. PRA’s earnings topped consensus estimates as their portfolio performed better than expected, and the company bought back nearly 5% of its shares throughout the year. Axis Capital continues to execute on its strategy to shift its book away from re-insurance toward more specialty lines that should earn better returns in the future. Lastly, Jefferies benefited from a robust merger and acquisition and transaction environment. Jefferies has been an outstanding investment for us and we exited the position as it reached our fair value estimate.
Our largest underperformance came from the Communication services sector. TripAdvisor, on-line travel agent, declined 49.6% as the company was hit with a number of issues including weaker than expected earnings, CEO departure, and concerns over the Omicron virus. We believe these concerns are overblown, and TRIP remains in great position to benefit from the recovering demand in travel. Quotient Technology, a digital marketing platform operator, tumbled 64% due to weaker than expected guidance, and management did a poor job of explaining their earnings guidance. We exited this position as we lost confidence with the management team.
Thanks for your trust and patience,
Benjamin Kim, CFA
Definitions:
The Russell 2000 Index consists of the smallest 2,000 companies in a group of 3,000 U.S. companies in the Russell 3000 Index, as ranked by market capitalization.
The Russell 2000 Value index consists of 2,000 companies in a group of 3,000 U.S. companies in the Russell 3000 Index that also exhibit a value probability.
Great Lakes Small Cap Opportunity Fund
The Russell 2000 Growth index consists of 2,000 companies in a group of 3,000 U.S. companies in the Russell 3000 Index that exhibit a growth probability.
One cannot invest directly in an index.
Past performance does not guarantee future results.
Basis point (bp) is a unit equal to 1/100th of 1% and is used to denote the change in a financial instrument.
Alpha is used as a measure of performance, indicating when a strategy has managed to beat the market return over some period. Alpha, often considered the active return on an investment, gauges the performance of an investment against a market index or benchmark that is considered to represent the market’s movement as a whole. The excess return of an investment relative to the return of a benchmark index is the investment’s alpha. Alpha may be positive or negative and is the result of active investing.
Opinions expressed are subject to change at any time, are not guaranteed and should not be considered investment advice.
Fund holdings and sector allocations are subject to change and are not recommendations to buy or sell any security. Please refer to the schedules of investments for complete holdings information.
Mutual fund investing involves risk. Principal loss is possible. Investing in ETFs are subject to additional risks that do not apply to conventional mutual funds, including the risks that the market price of the shares may trade at a discount to its net asset value (“NAV”), an active secondary trading market may not develop or be maintained, or trading may be halted by the exchange in which they trade, which may impact a Funds ability to sell its shares. Small-capitalization companies tend to have limited liquidity and greater price volatility than large-capitalization companies. The Fund invests in foreign securities which involve greater volatility and political, economic and currency risks and differences in accounting methods. These risks are greater in emerging markets. The Fund’s value investments are subject to the risk that their intrinsic values may not be recognized by the broad market or that their prices may decline.
Growth stocks typically are more volatile than value stocks; however, value stocks have a lower expected growth rate in earnings and sales.
Great Lakes Small Cap Opportunity Fund
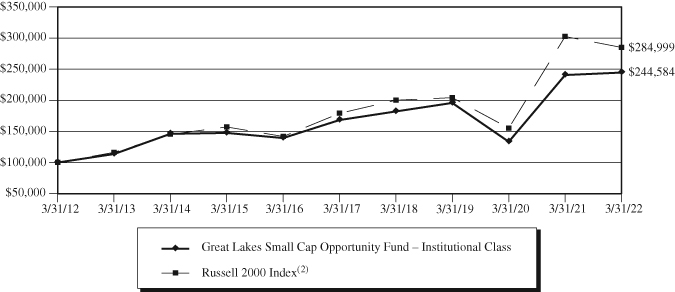
Value of $100,000 Investment (Unaudited)
The chart assumes an initial investment of $100,000. Performance reflects waivers of fee and operating expenses in effect. In the absence of such waivers, total return would be reduced. Performance data quoted represents past performance and does not guarantee future results. Investment returns and principal value will fluctuate, and when sold, may be worth more or less than their original cost. Performance current to the most recent month-end may be lower or higher than the performance quoted and can be obtained by calling 855-278-2020. Performance assumes the reinvestment of capital gains and income distributions. The performance does not reflect the deduction of taxes that a shareholder would pay on Fund distributions or the redemption of Fund shares.
Annualized Rates of Return as of March 31, 2022
| | 1-Year | 3-Year | 5-Year | 10-Year | Since Inception(1) |
| Investor Class | 1.40% | 7.42% | 7.51% | 9.09% | 12.92% |
| Institutional Class | 1.65% | 7.70% | 7.76% | 9.36% | 13.21% |
Russell 2000 Index(2) | -5.79% | 11.74% | 9.74% | 11.04% | 13.46% |
| (1) | Inception date of each class was December 5, 2008. |
| (2) | The Russell 2000 Index is a market capitalization-weighted index comprised of the 2,000 smallest companies listed on the Russell 3000 Index, which contains the 3,000 largest companies in the U.S. based on market capitalization. This index can not be invested in directly. |
The following is expense information for the Great Lakes Small Cap Opportunity Fund as disclosed in the Fund’s most recent prospectus dated July 29, 2021:
| Investor Class Gross Expense Ratio: 1.30% | Net Expense Ratio: 1.24% |
| Institutional Class Gross Expense Ratio: 1.05% | Net Expense Ratio: 0.99% |
Great Lakes Advisors, LLC (the “Adviser” or “Great Lakes”) has contractually agreed to waive its management fees and pay Fund expenses in order to ensure that Total Annual Fund Operating Expenses (excluding acquired fund fees and expenses (“AFFE”), leverage/borrowing interest, interest expense, dividends paid on short sales, taxes, brokerage commissions and other transactional expenses, and extraordinary expenses) do not exceed 1.24% and 0.99% of the average daily net assets of the Investor Class and Institutional Class, respectively. Fees waived and expenses paid by the Adviser may be recouped by the Adviser for a period of 36 months following the month during which such fee waiver and expense payment was made if such recoupment can be achieved without exceeding the expense limit in effect at the time the fee waiver and expense payment occurred and at the time of recoupment. The Operating Expense Limitation Agreement is indefinite in term and cannot be terminated through at least July 29, 2022. Thereafter, the agreement may be terminated at any time upon 60 days’ written notice by the Trust’s Board or the Adviser, with the consent of the Board.
The actual net expense ratio applicable to investors, as disclosed in the Financial Highlights for the year ended March 31, 2022, was 1.24% and 0.99% for the Investor Class and Institutional Class, respectively.
Great Lakes Small Cap Opportunity Fund
Allocation of Portfolio Net Assets (Unaudited)
March 31, 2022(1)(2)
(% of Net Assets)
Top 10 Equity Holdings (Unaudited)
March 31, 2022(1)
(% of Net Assets)
| | Axis Capital Holdings Ltd. | | | 3.7 | % |
| | Patterson Companies, Inc. | | | 3.1 | % |
| | Crane Co. | | | 3.1 | % |
| | ViaSat, Inc. | | | 3.1 | % |
| | Flowserve Corp. | | | 3.0 | % |
| | Prosperity Bancshares, Inc. | | | 2.9 | % |
| | Park Hotels & Resorts, Inc. – REIT | | | 2.9 | % |
| | Dril-Quip, Inc. | | | 2.8 | % |
| | TripAdvisor, Inc. | | | 2.8 | % |
| | Berry Global Group, Inc. | | | 2.7 | % |
(1) | Fund holdings and sector allocations are subject to change at any time and are not recommendations to buy or sell any security. |
(2) | Excludes securities lending collateral. |
Great Lakes Funds
Expense Examples (Unaudited)
March 31, 2022
As a shareholder of a Fund, you incur two types of costs: (1) transaction costs and (2) ongoing costs, including management fees; distribution (12b-1) fees (Investor Class only), and other Fund expenses. This Example is intended to help you understand your ongoing costs (in dollars) of investing in the Fund and to compare these costs with the ongoing costs of investing in other mutual funds. The Example is based on an investment of $1,000 invested at the beginning of the period and held for the entire period (October 1, 2021 – March 31, 2022).
ACTUAL EXPENSES
For each class, the first line of the table provides information about actual account values and actual expenses. You may use the information in this line, together with the amount you invested, to estimate the expenses that you paid over the period. Simply divide your account value by $1,000 (for example, an $8,600 account value divided by $1,000 = 8.6), then multiply the result by the number in the first line under the heading entitled “Expenses Paid During Period” to estimate the expenses you paid on your account during this period.
HYPOTHETICAL EXAMPLE FOR COMPARISON PURPOSES
For each class, the second line of the table below provides information about hypothetical account values and hypothetical expenses based on the Fund’s actual expense ratio and an assumed rate of return of 5% per year before expenses, which is not the Fund’s actual return. The hypothetical account values and expenses may not be used to estimate the actual ending account balance or expenses you paid for the period. You may use this information to compare the ongoing costs of investing in the Fund and other funds. To do so, compare this 5% hypothetical example with the 5% hypothetical examples that appear in the shareholder reports of the other funds.
Please note that the expenses shown in the table are meant to highlight your ongoing costs only. Therefore, the second line of the table is useful in comparing ongoing costs only, and will not help you determine the relative total costs of owning different funds.
Great Lakes Disciplined Equity Fund
| | | | Expenses Paid |
| | Beginning Account | Ending Account | During Period(1) |
| | Value (10/1/2021) | Value (3/31/2022) | (10/1/2021 to 3/31/2022) |
Institutional Class Actual(2) | $1,000.00 | $1,053.80 | $4.35 |
Institutional Class Hypothetical | | | |
(5% return before expenses) | $1,000.00 | $1,020.69 | $4.28 |
| (1) | Expenses are equal to the Fund’s annualized expense ratio for the most recent six-month period of 0.85%, multiplied by the average account value over the period, multiplied by 182/365 to reflect the one-half year period. |
| (2) | Based on the actual returns for the six-month period ended March 31, 2022, of 5.38%. |
Great Lakes Large Cap Value Fund
| | | | Expenses Paid |
| | Beginning Account | Ending Account | During Period(3) |
| | Value (10/1/2021) | Value (3/31/2022) | (10/1/2021 to 3/31/2022) |
Institutional Class Actual(4) | $1,000.00 | $1,082.50 | $4.41 |
Institutional Class Hypothetical | | | |
(5% return before expenses) | $1,000.00 | $1,020.69 | $4.28 |
| (3) | Expenses are equal to the Fund’s annualized expense ratio for the most recent six-month period of 0.85%, multiplied by the average account value over the period, multiplied by 182/365 to reflect the one-half year period. |
| (4) | Based on the actual returns for the six-month period ended March 31, 2022, of 8.25%. |
Great Lakes Funds
Expense Examples (Unaudited) – Continued
March 31, 2022
Great Lakes Small Cap Opportunity Fund
| | | | Expenses Paid |
| | Beginning Account | Ending Account | During Period(1) |
| | Value (10/1/2021) | Value (3/31/2022) | (10/1/2021 to 3/31/2022) |
Investor Class Actual(2) | $1,000.00 | $1,009.10 | $6.21 |
Investor Class Hypothetical | | | |
(5% return before expenses) | $1,000.00 | $1,018.75 | $6.24 |
Institutional Class Actual(2) | $1,000.00 | $1,010.20 | $4.96 |
Institutional Class Hypothetical | | | |
(5% return before expenses) | $1,000.00 | $1,020.00 | $4.99 |
| (1) | Expenses are equal to the Fund’s annualized expense ratio for the most recent six-month period of 1.24% and 0.99% for the Investor Class and Institutional Class, respectively, multiplied by the average account value over the period, multiplied by 182/365 to reflect the one-half year period. |
| (2) | Based on the actual returns for the six-month period ended March 31, 2022, of 0.91% and 1.02% for the Investor Class and Institutional Class, respectively. |
Great Lakes Disciplined Equity Fund
Schedule of Investments
March 31, 2022
Description | | Shares | | | Value | |
| | | | | | | |
| COMMON STOCKS – 98.6% | | | | | | |
| | | | | | | |
| Communication Services – 6.9% | | | | | | |
Alphabet, Inc. – Class C* | | | 335 | | | $ | 935,652 | |
Charter Communications, Inc. – Class A* | | | 200 | | | | 109,104 | |
Interpublic Group of Companies, Inc | | | 2,200 | | | | 77,990 | |
News Corp. – Class A | | | 3,200 | | | | 70,880 | |
News Corp. – Class B | | | 4,200 | | | | 94,584 | |
Paramount Global – Class B | | | 11,900 | | | | 449,939 | |
Omnicom Group, Inc. | | | 1,200 | | | | 101,856 | |
AT&T, Inc. | | | 6,204 | | | | 146,601 | |
| | | | | | | | 1,986,606 | |
| | | | | | | | | |
| Consumer Discretionary – 10.4% | | | | | | | | |
Amazon.com, Inc.* | | | 114 | | | | 371,634 | |
Best Buy Co., Inc. | | | 1,873 | | | | 170,256 | |
BorgWarner, Inc. | | | 1,900 | | | | 73,910 | |
Domino’s Pizza, Inc. | | | 299 | | | | 121,696 | |
Lowe’s Companies, Inc. | | | 2,396 | | | | 484,447 | |
O’Reilly Automotive, Inc.* | | | 580 | | | | 397,277 | |
Target Corp. | | | 511 | | | | 108,444 | |
Tesla, Inc.* | | | 848 | | | | 913,805 | |
TJX Companies, Inc. | | | 1,800 | | | | 109,044 | |
Ulta Beauty, Inc.* | | | 532 | | | | 211,853 | |
| | | | | | | | 2,962,366 | |
| | | | | | | | | |
| Consumer Staples – 12.6% | | | | | | | | |
Altria Group, Inc. | | | 3,401 | | | | 177,702 | |
Costco Wholesale Corp. | | | 1,924 | | | | 1,107,935 | |
General Mills, Inc. | | | 1,951 | | | | 132,122 | |
Kroger Co. | | | 9,543 | | | | 547,482 | |
Procter & Gamble Co. | | | 2,100 | | | | 320,880 | |
Sysco Corp. | | | 6,879 | | | | 561,670 | |
Tyson Foods, Inc. – Class A | | | 4,839 | | | | 433,720 | |
Walmart, Inc. | | | 2,100 | | | | 312,732 | |
| | | | | | | | 3,594,243 | |
| | | | | | | | | |
| Energy – 3.3% | | | | | | | | |
APA Corp. | | | 3,900 | | | | 161,187 | |
Chevron Corp. | | | 525 | | | | 85,486 | |
ConocoPhillips | | | 2,345 | | | | 234,500 | |
Exxon Mobil Corp. | | | 3,755 | | | | 310,125 | |
Valero Energy Corp. | | | 1,400 | | | | 142,156 | |
| | | | | | | | 933,454 | |
See Notes to the Financial Statements
Great Lakes Disciplined Equity Fund
Schedule of Investments – Continued
March 31, 2022
Description | | Shares | | | Value | |
| | | | | | | |
| COMMON STOCKS – 98.6% (Continued) | | | | | | |
| | | | | | | |
| Financials – 14.1% | | | | | | |
Aflac, Inc. | | | 1,600 | | | $ | 103,024 | |
Bank of America Corp. | | | 25,685 | | | | 1,058,736 | |
Bank of New York Mellon Corp. | | | 4,582 | | | | 227,405 | |
Berkshire Hathaway, Inc. – Class B* | | | 1,697 | | | | 598,888 | |
Capital One Financial Corp. | | | 3,225 | | | | 423,410 | |
Charles Schwab Corp. | | | 755 | | | | 63,654 | |
Chubb Ltd. | | | 247 | | | | 52,833 | |
Hartford Financial Services Group, Inc. | | | 2,421 | | | | 173,852 | |
MetLife, Inc. | | | 900 | | | | 63,252 | |
Principal Financial Group, Inc. | | | 2,200 | | | | 161,502 | |
Raymond James Financial, Inc. | | | 600 | | | | 65,946 | |
Synchrony Financial | | | 1,800 | | | | 62,658 | |
Travelers Companies, Inc. | | | 722 | | | | 131,931 | |
W.R. Berkley Corp. | | | 2,978 | | | | 198,272 | |
Wells Fargo & Co. | | | 13,334 | | | | 646,166 | |
| | | | | | | | 4,031,529 | |
| | | | | | | | | |
| Health Care – 10.2% | | | | | | | | |
AbbVie, Inc. | | | 3,930 | | | | 637,092 | |
Anthem, Inc. | | | 125 | | | | 61,403 | |
Centene Corp.* | | | 900 | | | | 75,771 | |
Cerner Corp. | | | 1,181 | | | | 110,494 | |
Cigna Corp. | | | 900 | | | | 215,649 | |
HCA Healthcare, Inc. | | | 300 | | | | 75,186 | |
Hologic, Inc.* | | | 2,719 | | | | 208,874 | |
Humana, Inc. | | | 200 | | | | 87,034 | |
Laboratory Corporation of America Holdings* | | | 700 | | | | 184,562 | |
UnitedHealth Group, Inc. | | | 2,352 | | | | 1,199,449 | |
Viatris, Inc. | | | 5,000 | | | | 54,400 | |
| | | | | | | | 2,909,914 | |
| | | | | | | | | |
| Industrials – 10.6% | | | | | | | | |
3M Co. | | | 1,057 | | | | 157,366 | |
C.H. Robinson Worldwide, Inc. | | | 1,200 | | | | 129,252 | |
Caterpillar, Inc. | | | 677 | | | | 150,849 | |
Emerson Electric Co. | | | 1,061 | | | | 104,031 | |
Expeditors International of Washington, Inc. | | | 1,000 | | | | 103,160 | |
General Dynamics Corp. | | | 1,363 | | | | 328,728 | |
JB Hunt Transport Services, Inc. | | | 288 | | | | 57,828 | |
Lockheed Martin Corp. | | | 517 | | | | 228,204 | |
Masco Corp. | | | 1,500 | | | | 76,500 | |
See Notes to the Financial Statements
Great Lakes Disciplined Equity Fund
Schedule of Investments – Continued
March 31, 2022
Description | | Shares | | | Value | |
| | | | | | | |
| COMMON STOCKS – 98.6% (Continued) | | | | | | |
| | | | | | | |
| Industrials – 10.6% (Continued) | | | | | | |
Norfolk Southern Corp. | | | 1,696 | | | $ | 483,733 | |
Union Pacific Corp. | | | 2,011 | | | | 549,425 | |
United Parcel Service, Inc. – Class B | | | 2,511 | | | | 538,509 | |
Waste Management, Inc. | | | 830 | | | | 131,555 | |
| | | | | | | | 3,039,140 | |
| | | | | | | | | |
| Information Technology# – 25.2% | | | | | | | | |
Adobe, Inc.* | | | 348 | | | | 158,556 | |
Apple, Inc. | | | 12,024 | | | | 2,099,510 | |
CDW Corp. | | | 3,908 | | | | 699,102 | |
Cisco Systems, Inc. | | | 12,700 | | | | 708,152 | |
Cognizant Technology Solutions Corp. – Class A | | | 5,747 | | | | 515,333 | |
Hewlett Packard Enterprise Co. | | | 5,100 | | | | 85,221 | |
HP, Inc. | | | 6,400 | | | | 232,320 | |
Intel Corp. | | | 6,900 | | | | 341,964 | |
Microsoft Corp. | | | 2,483 | | | | 765,534 | |
NetApp, Inc. | | | 700 | | | | 58,100 | |
NortonLifeLock, Inc. | | | 7,731 | | | | 205,026 | |
NVIDIA Corp. | | | 3,294 | | | | 898,801 | |
Texas Instruments, Inc. | | | 2,035 | | | | 373,382 | |
Western Digital Corp.* | | | 1,100 | | | | 54,615 | |
| | | | | | | | 7,195,616 | |
| | | | | | | | | |
| Materials – 2.2% | | | | | | | | |
Freeport-McMoRan, Inc. | | | 1,624 | | | | 80,778 | |
Mosaic Co. | | | 2,500 | | | | 166,250 | |
Nucor Corp. | | | 800 | | | | 118,920 | |
Southern Copper Corp. | | | 2,500 | | | | 189,750 | |
Westrock Co. | | | 1,400 | | | | 65,842 | |
| | | | | | | | 621,540 | |
| | | | | | | | | |
| Real Estate – 2.1% | | | | | | | | |
Extra Space Storage, Inc. – REIT | | | 667 | | | | 137,135 | |
Prologis, Inc. – REIT | | | 2,489 | | | | 401,924 | |
Host Hotels & Resorts, Inc. – REIT | | | 3,800 | | | | 73,834 | |
| | | | | | | | 612,893 | |
See Notes to the Financial Statements
Great Lakes Disciplined Equity Fund
Schedule of Investments – Continued
March 31, 2022
Description | | Shares | | | Value | |
| | | | | | | |
| COMMON STOCKS – 98.6% (Continued) | | | | | | |
| | | | | | | |
| Utilities – 1.0% | | | | | | |
Constellation Energy Corp. | | | 1,195 | | | $ | 67,219 | |
Exelon Corp. | | | 3,585 | | | | 170,753 | |
Pinnacle West Capital Corp. | | | 790 | | | | 61,699 | |
| | | | | | | | 299,671 | |
| Total Common Stocks | | | | | | | | |
| (Cost $25,412,570) | | | | | | | 28,186,972 | |
| | | | | | | | | |
| MONEY MARKET FUND – 1.1% | | | | | | | | |
First American Government Obligations Fund – Class Z, 0.15%^ | | | | | | | | |
| Total Money Market Fund | | | | | | | | |
| (Cost $300,458) | | | 300,458 | | | | 300,458 | |
| Total Investments – 99.7% | | | | | | | | |
| (Cost $25,713,028) | | | | | | | 28,487,430 | |
| Other Assets and Liabilities, Net – 0.3% | | | | | | | 80,987 | |
| Total Net Assets – 100.0% | | | | | | $ | 28,568,417 | |
| * | Non-income producing security. |
| # | As of March 31, 2022, the Fund had a significant portion of its assets invested in the information technology sector. See Note 11 in the Notes to the Financial Statements. |
| ^ | The rate shown is the annualized seven-day effective yield as of March 31, 2022. |
REIT – Real Estate Investment Trust
The Global Industry Classification Standard (“GICS”®) was developed by and is the exclusive property of MSCI, Inc. (“MSCI”) and Standard & Poor’s Financial Services LLC (“S&P”). GICS is a service mark of MSCI and S&P and has been licensed for use.
See Notes to the Financial Statements
Great Lakes Large Cap Value Fund
Schedule of Investments
March 31, 2022
Description | | Shares | | | Value | |
| | | | | | | |
| COMMON STOCKS – 99.5% | | | | | | |
| | | | | | | |
| Communication Services – 8.0% | | | | | | |
Alphabet, Inc. – Class C* | | | 155 | | | $ | 432,913 | |
Comcast Corp. – Class A | | | 36,929 | | | | 1,729,016 | |
Walt Disney Co.* | | | 9,260 | | | | 1,270,102 | |
| | | | | | | | 3,432,031 | |
| | | | | | | | | |
| Consumer Discretionary – 9.6% | | | | | | | | |
Booking Holdings, Inc.* | | | 297 | | | | 697,490 | |
BorgWarner, Inc. | | | 39,249 | | | | 1,526,786 | |
Dollar General Corp. | | | 2,829 | | | | 629,821 | |
Expedia Group, Inc.* | | | 3,363 | | | | 658,038 | |
Hasbro, Inc. | | | 7,272 | | | | 595,722 | |
| | | | | | | | 4,107,857 | |
| | | | | | | | | |
| Consumer Staples – 5.6% | | | | | | | | |
Anheuser-Busch InBev SA/NV – ADR | | | 14,405 | | | | 865,164 | |
JM Smucker Co. | | | 5,072 | | | | 686,799 | |
Philip Morris International, Inc. | | | 9,224 | | | | 866,503 | |
| | | | | | | | 2,418,466 | |
| | | | | | | | | |
| Energy – 5.9% | | | | | | | | |
Chevron Corp. | | | 5,150 | | | | 838,575 | |
Schlumberger Ltd. | | | 9,980 | | | | 412,274 | |
Shell Plc – ADR | | | 23,525 | | | | 1,292,228 | |
| | | | | | | | 2,543,077 | |
| | | | | | | | | |
| Financials – 23.5% | | | | | | | | |
American Express Co. | | | 5,711 | | | | 1,067,957 | |
Ameriprise Financial, Inc. | | | 1,440 | | | | 432,518 | |
Bank of America Corp. | | | 30,285 | | | | 1,248,348 | |
Berkshire Hathaway, Inc. – Class B* | | | 3,949 | | | | 1,393,642 | |
Chubb Ltd. | | | 6,014 | | | | 1,286,395 | |
Citigroup, Inc. | | | 28,318 | | | | 1,512,181 | |
PNC Financial Services Group, Inc. | | | 4,489 | | | | 827,996 | |
Prudential Financial, Inc. | | | 7,214 | | | | 852,478 | |
RenaissanceRe Holdings, Ltd. | | | 9,363 | | | | 1,484,129 | |
| | | | | | | | 10,105,644 | |
| | | | | | | | | |
| Health Care – 16.8% | | | | | | | | |
AbbVie, Inc. | | | 8,165 | | | | 1,323,628 | |
Biogen, Inc.* | | | 3,115 | | | | 656,019 | |
Boston Scientific Corp.* | | | 19,588 | | | | 867,552 | |
CVS Health Corp. | | | 10,090 | | | | 1,021,209 | |
See Notes to the Financial Statements
Great Lakes Large Cap Value Fund
Schedule of Investments – Continued
March 31, 2022
Description | | Shares | | | Value | |
| | | | | | | |
| COMMON STOCKS – 99.5% (Continued) | | | | | | |
| | | | | | | |
| Health Care – 16.8% (Continued) | | | | | | |
McKesson Corp. | | | 3,620 | | | $ | 1,108,191 | |
Merck & Co., Inc. | | | 16,423 | | | | 1,347,507 | |
UnitedHealth Group, Inc. | | | 1,711 | | | | 872,559 | |
| | | | | | | | 7,196,665 | |
| | | | | | | | | |
| Industrials – 10.9% | | | | | | | | |
Canadian National Railway Co. | | | 4,974 | | | | 667,212 | |
Cummins, Inc. | | | 5,237 | | | | 1,074,161 | |
Emerson Electric Co. | | | 4,262 | | | | 417,889 | |
General Electric Co. | | | 11,326 | | | | 1,036,329 | |
Lockheed Martin Corp. | | | 1,922 | | | | 848,371 | |
Westinghouse Air Brake Technologies Corp. | | | 6,756 | | | | 649,725 | |
| | | | | | | | 4,693,687 | |
| | | | | | | | | |
| Information Technology – 9.9% | | | | | | | | |
Cisco Systems, Inc. | | | 15,475 | | | | 862,886 | |
DXC Technology Co.* | | | 19,567 | | | | 638,471 | |
Intel Corp. | | | 16,821 | | | | 833,649 | |
Oracle Corp. | | | 7,953 | | | | 657,952 | |
SS&C Technologies Holdings, Inc. | | | 16,465 | | | | 1,235,204 | |
| | | | | | | | 4,228,162 | |
| | | | | | | | | |
| Materials – 5.0% | | | | | | | | |
Avery Dennison Corp. | | | 5,062 | | | | 880,636 | |
DuPont de Nemours, Inc. | | | 8,469 | | | | 623,149 | |
International Flavors & Fragrances, Inc. | | | 5,031 | | | | 660,721 | |
| | | | | | | | 2,164,506 | |
| | | | | | | | | |
| Utilities – 4.3% | | | | | | | | |
Ameren Corp. | | | 4,930 | | | | 462,237 | |
Public Service Enterprise Group, Inc. | | | 19,450 | | | | 1,361,500 | |
| | | | | | | | 1,823,737 | |
| Total Common Stocks | | | | | | | | |
| (Cost $35,072,181) | | | | | | | 42,713,832 | |
See Notes to the Financial Statements
Great Lakes Large Cap Value Fund
Schedule of Investments – Continued
March 31, 2022
Description | | Shares | | | Value | |
| | | | | | | |
| MONEY MARKET FUND – 0.7% | | | | | | |
First American Government Obligations Fund – Class Z, 0.15%^ | | | | | | |
| Total Money Market Fund | | | | | | |
| (Cost $297,332) | | | 297,332 | | | $ | 297,332 | |
| Total Investments – 100.2% | | | | | | | | |
| (Cost $35,369,513) | | | | | | | 43,011,164 | |
| Other Assets and Liabilities, Net – (0.2)% | | | | | | | (77,020 | ) |
| Total Net Assets – 100.0% | | | | | | $ | 42,934,144 | |
| * | Non-income producing security. |
| ADR – American Depositary Receipt |
| ^ | The rate shown is the annualized seven-day effective yield as of March 31, 2022. |
The Global Industry Classification Standard (“GICS”®) was developed by and is the exclusive property of MSCI, Inc. (“MSCI”) and Standard & Poor’s Financial Services LLC (“S&P”). GICS is a service mark of MSCI and S&P and has been licensed for use.
See Notes to the Financial Statements
Great Lakes Small Cap Opportunity Fund
Schedule of Investments
March 31, 2022
Description | | Shares | | | Value | |
| | | | | | | |
| COMMON STOCKS – 98.2% | | | | | | |
| | | | | | | |
| Communication Services – 5.1% | | | | | | |
Manchester United plc – Class A (a) | | | 54,097 | | | $ | 782,783 | |
TripAdvisor, Inc.* | | | 35,130 | | | | 952,726 | |
| | | | | | | | 1,735,509 | |
| | | | | | | | | |
| Consumer Discretionary – 13.4% | | | | | | | | |
Cheesecake Factory Inc. (a)* | | | 18,872 | | | | 750,917 | |
frontdoor, Inc.* | | | 29,558 | | | | 882,306 | |
Garrett Motion, Inc.* | | | 60,771 | | | | 436,943 | |
Gildan Activewear, Inc. | | | 14,044 | | | | 526,369 | |
Green Brick Partners, Inc.* | | | 15,522 | | | | 306,715 | |
Mattel, Inc.* | | | 22,409 | | | | 497,704 | |
Stitch Fix, Inc. – Class A* | | | 23,902 | | | | 240,693 | |
Urban Outfitters, Inc. (a)* | | | 35,762 | | | | 897,984 | |
| | | | | | | | 4,539,631 | |
| | | | | | | | | |
| Consumer Staples – 1.0% | | | | | | | | |
Sprouts Farmers Market, Inc. (a)* | | | 10,752 | | | | 343,849 | |
| | | | | | | | | |
| Energy – 4.8% | | | | | | | | |
Dril-Quip, Inc.* | | | 25,628 | | | | 957,206 | |
NOV, Inc. (a) | | | 35,029 | | | | 686,919 | |
| | | | | | | | 1,644,125 | |
| | | | | | | | | |
| Financials – 23.6% | | | | | | | | |
Axis Capital Holdings Ltd. | | | 20,667 | | | | 1,249,733 | |
Bank OZK (a) | | | 19,265 | | | | 822,615 | |
Cannae Holdings, Inc.* | | | 35,604 | | | | 851,648 | |
First American Financial Corp. | | | 12,516 | | | | 811,287 | |
Horace Mann Educators Corp. | | | 12,367 | | | | 517,312 | |
Investors Bancorp, Inc. | | | 58,783 | | | | 877,630 | |
PRA Group, Inc. (a)* | | | 19,195 | | | | 865,311 | |
PROG Holdings, Inc.* | | | 17,885 | | | | 514,551 | |
Prosperity Bancshares, Inc. (a) | | | 14,336 | | | | 994,632 | |
Pzena Investment Management, Inc. – Class A | | | 62,585 | | | | 501,932 | |
| | | | | | | | 8,006,651 | |
| | | | | | | | | |
| Health Care – 9.4% | | | | | | | | |
Haemonetics Corp.* | | | 6,280 | | | | 397,021 | |
MEDNAX, Inc. (a)* | | | 21,906 | | | | 514,353 | |
Medpace Holdings, Inc. (a)* | | | 3,466 | | | | 567,003 | |
See Notes to the Financial Statements
Great Lakes Small Cap Opportunity Fund
Schedule of Investments – Continued
March 31, 2022
Description | | Shares | | | Value | |
| | | | | | | |
| COMMON STOCKS – 98.2% (Continued) | | | | | | |
| | | | | | | |
| Health Care – 9.4% (Continued) | | | | | | |
Patterson Companies, Inc. (a) | | | 32,789 | | | $ | 1,061,380 | |
Prestige Consumer Healthcare, Inc.* | | | 12,018 | | | | 636,233 | |
| | | | | | | | 3,175,990 | |
| | | | | | | | | |
| Industrials – 16.8% | | | | | | | | |
Crane Co. | | | 9,798 | | | | 1,060,927 | |
EnerSys | | | 8,172 | | | | 609,386 | |
Flowserve Corp. | | | 28,122 | | | | 1,009,580 | |
MillerKnoll, Inc. (a) | | | 15,238 | | | | 526,625 | |
KAR Auction Services, Inc. (a)* | | | 27,751 | | | | 500,905 | |
Resideo Technologies, Inc.* | | | 19,873 | | | | 473,574 | |
Sensata Technologies Holding plc* | | | 9,716 | | | | 494,059 | |
CACI International, Inc. – Class A* | | | 1,694 | | | | 510,334 | |
UniFirst Corp. (a) | | | 2,845 | | | | 524,277 | |
| | | | | | | | 5,709,667 | |
| | | | | | | | | |
| Information Technology – 13.6% | | | | | | | | |
ACI Worldwide, Inc.* | | | 21,155 | | | | 666,171 | |
Avnet, Inc. | | | 15,917 | | | | 646,071 | |
Extreme Networks, Inc.* | | | 46,142 | | | | 563,394 | |
Knowles Corp.* | | | 31,998 | | | | 688,917 | |
Onto Innovation, Inc. (a)* | | | 4,345 | | | | 377,537 | |
Progress Software Corp. | | | 13,486 | | | | 635,056 | |
ViaSat, Inc.* | | | 21,644 | | | | 1,056,227 | |
| | | | | | | | 4,633,373 | |
| | | | | | | | | |
| Materials – 7.6% | | | | | | | | |
Berry Global Group, Inc.* | | | 15,934 | | | | 923,535 | |
NewMarket Corp. | | | 2,622 | | | | 850,524 | |
Valvoline, Inc. | | | 25,515 | | | | 805,254 | |
| | | | | | | | 2,579,313 | |
| | | | | | | | | |
| Real Estate – 2.9% | | | | | | | | |
Park Hotels & Resorts, Inc. – REIT* | | | 50,136 | | | | 979,156 | |
| Total Common Stocks | | | | | | | | |
| (Cost $31,087,982) | | | | | | | 33,347,264 | |
See Notes to the Financial Statements
Great Lakes Small Cap Opportunity Fund
Schedule of Investments – Continued
March 31, 2022
Description | | Shares | | | Value | |
| | | | | | | |
| MONEY MARKET FUND – 1.9% | | | | | | |
First American Government Obligations Fund – Class Z, 0.15%^ | | | | | | |
| Total Money Market Fund | | | | | | |
| (Cost $645,022) | | | 645,022 | | | $ | 645,022 | |
| | | | | | | | | |
| INVESTMENTS PURCHASED WITH | | | | | | | | |
| PROCEEDS FROM SECURITIES LENDING – 27.0% | | | | | | | | |
Mount Vernon Liquid Assets Portfolio, LLC, 0.41%^ | | | | | | | | |
| Total Investments Purchased with | | | | | | | | |
| Proceeds from Securities Lending | | | | | | | | |
| (Cost $9,148,350) | | | 9,148,350 | | | | 9,148,350 | |
| Total Investments – 127.1% | | | | | | | | |
| (Cost $40,881,354) | | | | | | | 43,140,636 | |
| Other Assets and Liabilities, Net – (27.1)% | | | | | | | (9,199,955 | ) |
| Total Net Assets – 100.0% | | | | | | $ | 33,940,681 | |
| (a) | All or a portion of this security was out on loan at March 31, 2022. Total loaned securities had a market value of $8,914,020 at March 31, 2022. |
| * | Non-income producing security. |
| REIT – Real Estate Investment Trust |
| ^ | The rate shown is the annualized seven-day effective yield as of March 31, 2022. |
The Global Industry Classification Standard (“GICS”®) was developed by and is the exclusive property of MSCI, Inc. (“MSCI”) and Standard & Poor’s Financial Services LLC (“S&P”). GICS is a service mark of MSCI and S&P and has been licensed for use.
See Notes to the Financial Statements
Great Lakes Funds
Statements of Assets and Liabilities
March 31, 2022
| | | | | | | | | Small Cap | |
| | | Disciplined | | | Large Cap | | | Opportunity | |
| | | Equity Fund | | | Value Fund | | | Fund | |
| ASSETS | | | | | | | | | |
| Investment securities: | | | | | | | | | |
| At cost | | $ | 25,713,028 | | | $ | 35,369,513 | | | $ | 40,881,354 | |
At value(1) | | $ | 28,487,430 | | | | | | | $ | 43,140,636 | |
| Cash | | | — | | | | 2,111 | | | | — | |
| Dividends & interest receivable | | | 12,260 | | | | 38,925 | | | | 38,520 | |
| Receivable for capital shares sold | | | 200,092 | | | | 47,573 | | | | 3,830 | |
| Interest receivable from securities lending | | | — | | | | — | | | | 820 | |
| Receivable for adviser reimbursements | | | 1,215 | | | | — | | | | — | |
| Prepaid expenses | | | 11,741 | | | | 9,824 | | | | 17,678 | |
| Total Assets | | | 28,712,738 | | | | 43,109,597 | | | | 43,201,484 | |
| LIABILITIES | | | | | | | | | | | | |
| Payable upon return of securities loaned (See Note 9) | | | — | | | | — | | | | 9,148,350 | |
| Payable for capital shares redeemed | | | 79,963 | | | | 102,456 | | | | 25,596 | |
| Payable to investment adviser | | | — | | | | 10,938 | | | | 12,714 | |
| Payable for fund administration & accounting fees | | | 23,441 | | | | 22,199 | | | | 25,901 | |
| Payable for compliance fees | | | 3,951 | | | | 3,950 | | | | 3,947 | |
| Payable for transfer agent fees & expenses | | | 5,761 | | | | 6,016 | | | | 10,378 | |
| Payable for custody fees | | | 1,087 | | | | 804 | | | | 993 | |
| Payable for audit and tax fees | | | 16,997 | | | | 17,000 | | | | 17,501 | |
| Payable for trustee fees | | | 4,607 | | | | 4,606 | | | | 2,365 | |
| Accrued other fees | | | 8,514 | | | | 7,484 | | | | 8,592 | |
| Accrued distribution fees – Investor Class | | | — | | | | — | | | | 4,466 | |
| Total Liabilities | | | 144,321 | | | | 175,453 | | | | 9,260,803 | |
| NET ASSETS | | $ | 28,568,417 | | | $ | 42,934,144 | | | $ | 33,940,681 | |
| COMPOSITION OF NET ASSETS | | | | | | | | | | | | |
| Paid-in capital | | $ | 25,412,463 | | | $ | 32,429,964 | | | $ | 28,064,426 | |
| Total distributable earnings | | | 3,155,954 | | | | 10,504,180 | | | | 5,876,255 | |
Total net assets | | $ | 28,568,417 | | | $ | 42,934,144 | | | $ | 33,940,681 | |
(1) Includes loaned securities of: | | $ | — | | | $ | — | | | $ | 8,914,020 | |
| | | | | | | | | | | | | |
Investor Class Shares: | | | | | | | | | | | | |
| Net Assets | | $ | — | | | $ | — | | | $ | 4,693,428 | |
Shares issued and outstanding(2) | | | — | | | | — | | | | 262,933 | |
| Net asset value, offering price, and redemption price per share | | $ | — | | | $ | — | | | $ | 17.85 | |
| | | | | | | | | | | | | |
Institutional Class Shares: | | | | | | | | | | | | |
| Net Assets | | $ | 28,568,417 | | | $ | 42,934,144 | | | $ | 29,247,253 | |
Shares issued and outstanding(2) | | | 2,604,603 | | | | 2,738,765 | | | | 1,603,182 | |
| Net asset value, offering price, and redemption price per share | | $ | 10.97 | | | $ | 15.68 | | | $ | 18.24 | |
| (2) | Unlimited shares authorized without par value. |
See Notes to the Financial Statements
Great Lakes Funds
Statements of Operations
For the Year Ended March 31, 2022
| | | | | | | | | Small Cap | |
| | | Disciplined | | | Large Cap | | | Opportunity | |
| | | Equity Fund | | | Value Fund | | | Fund | |
| INVESTMENT INCOME: | | | | | | | | | |
| Interest income | | $ | 90 | | | $ | 306 | | | $ | 299 | |
| Dividend income | | | 415,269 | | | | 814,496 | | | | 565,308 | |
| Less: Foreign taxes withheld | | | (111 | ) | | | (8,497 | ) | | | (3,124 | ) |
| Securities lending income | | | — | | | | — | | | | 6,664 | |
| Total investment income | | | 415,248 | | | | 806,305 | | | | 569,147 | |
| | | | | | | | | | | | | |
| EXPENSES: | | | | | | | | | | | | |
| Investment advisory fees (See Note 4) | | | 186,893 | | | | 254,286 | | | | 294,913 | |
| Fund administration & accounting fees (See Note 4) | | | 71,305 | | | | 68,745 | | | | 78,953 | |
| Federal & state registration fees | | | 22,069 | | | | 13,066 | | | | 33,455 | |
| Audit and tax fees | | | 20,500 | | | | 20,500 | | | | 21,000 | |
| Trustee fees | | | 18,463 | | | | 18,463 | | | | 16,219 | |
| Transfer agent fees & expenses (See Note 4) | | | 16,658 | | | | 17,684 | | | | 31,103 | |
| Compliance fees (See Note 4) | | | 12,045 | | | | 12,045 | | | | 12,041 | |
| Legal fees | | | 10,773 | | | | 10,773 | | | | 10,766 | |
| Custody fees (See Note 4) | | | 7,363 | | | | 4,530 | | | | 5,319 | |
| Other fees | | | 6,498 | | | | 6,506 | | | | 6,986 | |
| Postage & printing fees | | | 4,109 | | | | 4,114 | | | | 5,051 | |
| Insurance fees | | | 1,821 | | | | 1,866 | | | | 1,887 | |
| Distribution fees – Investor Class (See Note 5) | | | — | | | | — | | | | 12,677 | |
| Total expenses before interest expense and waiver | | | 378,497 | | | | 432,578 | | | | 530,370 | |
| Interest expense (See Note 10) | | | 417 | | | | 65 | | | | — | |
| Total expenses before waiver | | | 378,914 | | | | 432,643 | | | | 530,370 | |
| Less: Fee waiver from investment adviser (See Note 4) | | | (114,024 | ) | | | (72,339 | ) | | | (31,096 | ) |
| Total net expenses | | | 264,890 | | | | 360,304 | | | | 499,274 | |
| NET INVESTMENT INCOME | | | 150,358 | | | | 446,001 | | | | 69,873 | |
| | | | | | | | | | | | | |
| REALIZED AND UNREALIZED GAIN (LOSS) ON INVESTMENTS | | | | | | | | | | | | |
| Net realized gain (loss) on: | | | | | | | | | | | | |
| Investments | | | 8,597,594 | | | | 6,430,721 | | | | 7,731,248 | |
| Foreign currency translation | | | — | | | | (19 | ) | | | — | |
| Net change in unrealized appreciation/depreciation of: | | | | | | | | | | | | |
| Investments | | | (5,199,571 | ) | | | (2,053,008 | ) | | | (6,943,913 | ) |
| Foreign currency translation | | | — | | | | 16 | | | | — | |
| Net realized and unrealized gain on investments | | | 3,398,023 | | | | 4,377,710 | | | | 787,335 | |
| | | | | | | | | | | | | |
| NET INCREASE IN NET ASSETS FROM OPERATIONS | | $ | 3,548,381 | | | $ | 4,823,711 | | | $ | 857,208 | |
See Notes to the Financial Statements
Great Lakes Disciplined Equity Fund
Statements of Changes in Net Assets
| | | For the | | | For the | |
| | | Year Ended | | | Year Ended | |
| | | March 31, 2022 | | | March 31, 2021 | |
| OPERATIONS: | | | | | | |
| Net investment income | | $ | 150,358 | | | $ | 88,587 | |
| Net realized gain on investments | | | 8,597,594 | | | | 6,479,624 | |
| Net change in unrealized appreciation/depreciation of investments | | | (5,199,571 | ) | | | 7,498,133 | |
Net increase resulting from operations | | | 3,548,381 | | | | 14,066,344 | |
| | | | | | | | | |
| CAPITAL SHARE TRANSACTIONS: | | | | | | | | |
| Institutional Class: | | | | | | | | |
| Proceeds from shares sold | | | 13,647,082 | | | | 2,892,898 | |
| Proceeds from reinvestment of distributions | | | 5,633,663 | | | | 1,085,158 | |
| Payments for shares redeemed | | | (16,671,756 | ) | | | (8,689,583 | ) |
Net increase (decrease) in net assets from capital share transactions | | | 2,608,989 | | | | (4,711,527 | ) |
| | | | | | | | | |
| DISTRIBUTIONS TO SHAREHOLDERS: | | | | | | | | |
Total distributions to shareholders | | | (13,633,800 | ) | | | (2,562,569 | ) |
| TOTAL INCREASE (DECREASE) IN NET ASSETS | | | (7,476,430 | ) | | | 6,792,248 | |
| | | | | | | | | |
| NET ASSETS: | | | | | | | | |
| Beginning of Year | | | 36,044,847 | | | | 29,252,599 | |
| End of Year | | $ | 28,568,417 | | | $ | 36,044,847 | |
See Notes to the Financial Statements
Great Lakes Large Cap Value Fund
Statements of Changes in Net Assets
| | | For the | | | For the | |
| | | Year Ended | | | Year Ended | |
| | | March 31, 2022 | | | March 31, 2021 | |
| OPERATIONS: | | | | | | |
| Net investment income | | $ | 446,001 | | | $ | 626,318 | |
| Net realized gain (loss) on: | | | | | | | | |
| Investments | | | 6,430,721 | | | | 108,622 | |
| Foreign currency translation | | | (19 | ) | | | 5 | |
| Net change in unrealized appreciation/depreciation of: | | | | | | | | |
| Investments | | | (2,053,008 | ) | | | 17,035,669 | |
| Foreign currency translation | | | 16 | | | | 36 | |
Net increase resulting from operations | | | 4,823,711 | | | | 17,770,650 | |
| | | | | | | | | |
| CAPITAL SHARE TRANSACTIONS: | | | | | | | | |
| Institutional Class: | | | | | | | | |
| Proceeds from shares sold | | | 6,043,017 | | | | 1,935,310 | |
| Proceeds from reinvestment of distributions | | | 1,063,690 | | | | 294,289 | |
| Payments for shares redeemed | | | (9,828,191 | ) | | | (11,985,518 | ) |
Net decrease in net assets from capital share transactions | | | (2,721,484 | ) | | | (9,755,919 | ) |
| | | | | | | | | |
| DISTRIBUTIONS TO SHAREHOLDERS: | | | | | | | | |
| From distributable earnings | | | (3,697,176 | ) | | | (904,201 | ) |
| From return of capital | | | — | | | | (4,900 | ) |
Total distributions to shareholders | | | (3,697,176 | ) | | | (909,101 | ) |
| TOTAL INCREASE (DECREASE) IN NET ASSETS | | | (1,594,949 | ) | | | 7,105,630 | |
| | | | | | | | | |
| NET ASSETS: | | | | | | | | |
| Beginning of Year | | | 44,529,093 | | | | 37,423,463 | |
| End of Year | | $ | 42,934,144 | | | $ | 44,529,093 | |
See Notes to the Financial Statements
Great Lakes Small Cap Opportunity Fund
Statements of Changes in Net Assets
| | | For the | | | For the | |
| | | Year Ended | | | Year Ended | |
| | | March 31, 2022 | | | March 31, 2021 | |
| OPERATIONS: | | | | | | |
| Net investment income | | $ | 69,873 | | | $ | 139,709 | |
| Net realized gain (loss) on investments | | | 7,731,248 | | | | (36,665 | ) |
| Net change in unrealized appreciation/depreciation of investments | | | (6,943,913 | ) | | | 26,989,577 | |
Net increase resulting from operations | | | 857,208 | | | | 27,092,621 | |
| | | | | | | | | |
| CAPITAL SHARE TRANSACTIONS: | | | | | | | | |
| Investor Class: | | | | | | | | |
| Proceeds from shares sold | | | 22,194 | | | | 152,593 | |
| Proceeds from reinvestment of distributions | | | 279,289 | | | | 28,798 | |
| Payments for shares redeemed | | | (595,918 | ) | | | (4,643,391 | ) |
| Decrease in net assets from Investor Class transactions | | | (294,435 | ) | | | (4,462,000 | ) |
| Institutional Class: | | | | | | | | |
| Proceeds from shares sold | | | 4,573,274 | | | | 3,309,932 | |
| Proceeds from reinvestment of distributions | | | 1,721,941 | | | | 250,539 | |
| Payments for shares redeemed | | | (19,732,256 | ) | | | (17,761,934 | ) |
| Decrease in net assets from Institutional Class transactions | | | (13,437,041 | ) | | | (14,201,463 | ) |
Net decrease in net assets from capital share transactions | | | (13,731,476 | ) | | | (18,663,463 | ) |
| | | | | | | | | |
| DISTRIBUTIONS TO SHAREHOLDERS: | | | | | | | | |
| Net Distributions to Shareholders – Investor Class | | | (279,344 | ) | | | (28,802 | ) |
| Net Distributions to Shareholders – Institutional Class | | | (2,461,252 | ) | | | (387,358 | ) |
Total distributions to shareholders | | | (2,740,596 | ) | | | (416,160 | ) |
| TOTAL INCREASE (DECREASE) IN NET ASSETS | | | (15,614,864 | ) | | | 8,012,998 | |
| | | | | | | | | |
| NET ASSETS: | | | | | | | | |
| Beginning of Year | | | 49,555,545 | | | | 41,542,547 | |
| End of Year | | $ | 33,940,681 | | | $ | 49,555,545 | |
See Notes to the Financial Statements
Great Lakes Disciplined Equity Fund
Financial Highlights
For a Fund share outstanding throughout the year
Institutional Class
| | | Year Ended | | | Year Ended | | | Year Ended | | | Year Ended | | | Year Ended | |
| | | March 31, | | | March 31, | | | March 31, | | | March 31, | | | March 31, | |
| | | 2022 | | | 2021 | | | 2020 | | | 2019 | | | 2018 | |
| Per Common Share Data | | | | | | | | | | | | | | | |
| | | | | | | | | | | | | | | | |
Net asset value, beginning of year | | $ | 19.02 | | | $ | 13.43 | | | $ | 14.97 | | | $ | 15.16 | | | $ | 15.61 | |
| | | | | | | | | | | | | | | | | | | | | |
| Investment operations: | | | | | | | | | | | | | | | | | | | | |
| Net investment income | | | 0.08 | | | | 0.05 | | | | 0.13 | | | | 0.13 | | | | 0.15 | |
| Net realized and unrealized gain (loss) on investments | | | 2.02 | | | | 6.89 | | | | (1.08 | ) | | | 1.13 | | | | 1.87 | |
| Total from investment operations | | | 2.10 | | | | 6.94 | | | | (0.95 | ) | | | 1.26 | | | | 2.02 | |
| | | | | | | | | | | | | | | | | | | | | |
| Less distributions from: | | | | | | | | | | | | | | | | | | | | |
| Net investment income | | | (0.08 | ) | | | (0.05 | ) | | | (0.13 | ) | | | (0.14 | ) | | | (0.15 | ) |
| Net realized gains | | | (10.07 | ) | | | (1.30 | ) | | | (0.46 | ) | | | (1.31 | ) | | | (2.32 | ) |
| Total distributions | | | (10.15 | ) | | | (1.35 | ) | | | (0.59 | ) | | | (1.45 | ) | | | (2.47 | ) |
Net asset value, end of year | | $ | 10.97 | | | $ | 19.02 | | | $ | 13.43 | | | $ | 14.97 | | | $ | 15.16 | |
| | | | | | | | | | | | | | | | | | | | | |
| Total return | | | 8.72 | % | | | 52.43 | % | | | -6.88 | % | | | 9.22 | % | | | 12.76 | % |
| | | | | | | | | | | | | | | | | | | | | |
| Supplemental Data and Ratios | | | | | | | | | | | | | | | | | | | | |
Net assets, at end of year (000’s) | | $ | 28,568 | | | $ | 36,045 | | | $ | 29,253 | | | $ | 42,835 | | | $ | 44,160 | |
| | | | | | | | | | | | | | | | | | | | | |
Ratio of expenses to average net assets: | | | | | | | | | | | | | | | | | | | | |
| Before expense waiver | | | 1.22 | % | | | 1.13 | % | | | 0.98 | % | | | 0.95 | % | | | 0.95 | % |
| After expense waiver | | | 0.85 | % | | | 0.86 | % | | | 0.85 | % | | | 0.85 | % | | | 0.85 | % |
| | | | | | | | | | | | | | | | | | | | | |
Ratio of expenses excluding interest | | | | | | | | | | | | | | | | | | | | |
expense to average net assets: | | | | | | | | | | | | | | | | | | | | |
| Before expense waiver | | | 1.22 | % | | | 1.12 | % | | | 0.98 | % | | | 0.95 | % | | | 0.95 | % |
| After expense waiver | | | 0.85 | % | | | 0.85 | % | | | 0.85 | % | | | 0.85 | % | | | 0.85 | % |
| | | | | | | | | | | | | | | | | | | | | |
Ratio of net investment income to average net assets: | | | | | | | | | | | | | | | | | | | | |
| After expense waiver | | | 0.48 | % | | | 0.25 | % | | | 0.85 | % | | | 0.85 | % | | | 0.91 | % |
| | | | | | | | | | | | | | | | | | | | | |
Portfolio Turnover Rate | | | 163 | % | | | 99 | % | | | 97 | % | | | 107 | % | | | 104 | % |
See Notes to the Financial Statements
Great Lakes Large Cap Value Fund
Financial Highlights
For a Fund share outstanding throughout the year
Institutional Class
| | | Year Ended | | | Year Ended | | | Year Ended | | | Year Ended | | | Year Ended | |
| | | March 31, | | | March 31, | | | March 31, | | | March 31, | | | March 31, | |
| | | 2022 | | | 2021 | | | 2020 | | | 2019 | | | 2018 | |
| Per Common Share Data | | | | | | | | | | | | | | | |
| | | | | | | | | | | | | | | | |
Net asset value, beginning of year | | $ | 15.36 | | | $ | 10.09 | | | $ | 12.75 | | | $ | 14.29 | | | $ | 15.23 | |
| | | | | | | | | | | | | | | | | | | | | |
| Investment operations: | | | | | | | | | | | | | | | | | | | | |
| Net investment income | | | 0.17 | | | | 0.19 | | | | 0.22 | | | | 0.25 | | | | 0.20 | |
| Net realized and unrealized gain (loss) on investments | | | 1.60 | | | | 5.36 | | | | (2.19 | ) | | | (0.08 | ) | | | 1.01 | |
| Total from investment operations | | | 1.77 | | | | 5.55 | | | | (1.97 | ) | | | 0.17 | | | | 1.21 | |
| | | | | | | | | | | | | | | | | | | | | |
| Less distributions from: | | | | | | | | | | | | | | | | | | | | |
| Net investment income | | | (0.17 | ) | | | (0.19 | ) | | | (0.22 | ) | | | (0.25 | ) | | | (0.20 | ) |
| Net realized gains | | | (1.28 | ) | | | (0.09 | ) | | | (0.47 | ) | | | (1.46 | ) | | | (1.95 | ) |
| Return of capital | | | — | | | | (0.00 | )(1) | | | — | | | | — | | | | — | |
| Total distributions | | | (1.45 | ) | | | (0.28 | ) | | | (0.69 | ) | | | (1.71 | ) | | | (2.15 | ) |
Net asset value, end of year | | $ | 15.68 | | | $ | 15.36 | | | $ | 10.09 | | | $ | 12.75 | | | $ | 14.29 | |
| | | | | | | | | | | | | | | | | | | | | |
| Total return | | | 11.93 | % | | | 55.58 | % | | | -16.64 | % | | | 1.98 | % | | | 7.36 | % |
| | | | | | | | | | | | | | | | | | | | | |
| Supplemental Data and Ratios | | | | | | | | | | | | | | | | | | | | |
Net assets, at end of year (000’s) | | $ | 42,934 | | | $ | 44,529 | | | $ | 37,423 | | | $ | 46,804 | | | $ | 50,135 | |
| | | | | | | | | | | | | | | | | | | | | |
Ratio of expenses to average net assets: | | | | | | | | | | | | | | | | | | | | |
| Before expense waiver | | | 1.02 | % | | | 1.04 | % | | | 0.93 | % | | | 0.90 | % | | | 0.90 | % |
| After expense waiver | | | 0.85 | % | | | 0.85 | % | | | 0.85 | % | | | 0.85 | % | | | 0.85 | % |
| | | | | | | | | | | | | | | | | | | | | |
Ratio of net investment income | | | | | | | | | | | | | | | | | | | | |
to average net assets: | | | | | | | | | | | | | | | | | | | | |
| After expense waiver | | | 1.05 | % | | | 1.51 | % | | | 1.62 | % | | | 1.76 | % | | | 1.28 | % |
| | | | | | | | | | | | | | | | | | | | | |
Portfolio Turnover Rate | | | 56 | % | | | 35 | % | | | 27 | % | | | 42 | % | | | 61 | % |
| (1) | Amount per share is less than $0.01. |
See Notes to the Financial Statements
Great Lakes Small Cap Opportunity Fund
Financial Highlights
For a Fund share outstanding throughout the year
Investor Class
| | | Year Ended | | | Year Ended | | | Year Ended | | | Year Ended | | | Year Ended | |
| | | March 31, | | | March 31, | | | March 31, | | | March 31, | | | March 31, | |
| | | 2022 | | | 2021 | | | 2020 | | | 2019 | | | 2018 | |
| Per Common Share Data | | | | | | | | | | | | | | | |
| | | | | | | | | | | | | | | | |
Net asset value, beginning of year | | $ | 18.68 | | | $ | 10.44 | | | $ | 16.50 | | | $ | 17.36 | | | $ | 17.24 | |
| | | | | | | | | | | | | | | | | | | | | |
| Investment operations: | | | | | | | | | | | | | | | | | | | | |
| Net investment income (loss) | | | (0.01 | ) | | | 0.13 | | | | 0.18 | | | | (0.01 | ) | | | 0.02 | |
| Net realized and unrealized gain (loss) on investments | | | 0.27 | | | | 8.20 | | | | (5.07 | ) | | | 1.05 | | | | 1.35 | |
| Total from investment operations | | | 0.26 | | | | 8.33 | | | | (4.89 | ) | | | 1.04 | | | | 1.37 | |
| | | | | | | | | | | | | | | | | | | | | |
| Less distributions from: | | | | | | | | | | | | | | | | | | | | |
| Net investment income | | | — | | | | (0.09 | ) | | | (0.14 | ) | | | — | | | | (0.06 | ) |
| Net realized gains | | | (1.09 | ) | | | — | | | | (1.03 | ) | | | (1.90 | ) | | | (1.19 | ) |
| Total distributions | | | (1.09 | ) | | | (0.09 | ) | | | (1.17 | ) | | | (1.90 | ) | | | (1.25 | ) |
Net asset value, end of year | | $ | 17.85 | | | $ | 18.68 | | | $ | 10.44 | | | $ | 16.50 | | | $ | 17.36 | |
| | | | | | | | | | | | | | | | | | | | | |
| Total return | | | 1.40 | % | | | 79.97 | % | | | -32.07 | % | | | 7.28 | % | | | 7.98 | % |
| | | | | | | | | | | | | | | | | | | | | |
| Supplemental Data and Ratios | | | | | | | | | | | | | | | | | | | | |
Net assets, at end of year (000’s) | | $ | 4,693 | | | $ | 5,186 | | | $ | 6,531 | | | $ | 10,868 | | | $ | 7,238 | |
| | | | | | | | | | | | | | | | | | | | | |
Ratio of expenses to average net assets: | | | | | | | | | | | | | | | | | | | | |
| Before expense waiver | | | 1.31 | % | | | 1.30 | % | | | 1.13 | % | | | 1.10 | % | | | 1.10 | % |
| After expense waiver | | | 1.24 | % | | | 1.24 | % | | | 1.13 | % | | | 1.10 | % | | | 1.10 | % |
| | | | | | | | | | | | | | | | | | | | | |
Ratio of net investment income to average net assets: | | | | | | | | | | | | | | | | | | | | |
| After expense waiver | | | -0.08 | % | | | 0.37 | % | | | 1.06 | % | | | 0.00 | % | | | 0.05 | % |
| | | | | | | | | | | | | | | | | | | | | |
Portfolio Turnover Rate | | | 46 | % | | | 64 | % | | | 53 | % | | | 115 | % | | | 101 | % |
| | | | | | | | | | | | | | | | | | | | | |
See Notes to the Financial Statements
Great Lakes Small Cap Opportunity Fund
Financial Highlights
For a Fund share outstanding throughout the year
Institutional Class
| | | Year Ended | | | Year Ended | | | Year Ended | | | Year Ended | | | Year Ended | |
| | | March 31, | | | March 31, | | | March 31, | | | March 31, | | | March 31, | |
| | | 2022 | | | 2021 | | | 2020 | | | 2019 | | | 2018 | |
| Per Common Share Data | | | | | | | | | | | | | | | |
| | | | | | | | | | | | | | | | |
Net asset value, beginning of year | | $ | 19.04 | | | $ | 10.65 | | | $ | 16.80 | | | $ | 17.64 | | | $ | 17.51 | |
| | | | | | | | | | | | | | | | | | | | | |
| Investment operations: | | | | | | | | | | | | | | | | | | | | |
| Net investment income | | | 0.03 | | | | 0.06 | | | | 0.23 | | | | 0.04 | | | | 0.06 | |
| Net realized and unrealized gain (loss) on investments | | | 0.28 | | | | 8.47 | | | | (5.18 | ) | | | 1.06 | | | | 1.37 | |
| Total from investment operations | | | 0.31 | | | | 8.53 | | | | (4.95 | ) | | | 1.10 | | | | 1.43 | |
| | | | | | | | | | | | | | | | | | | | | |
| Less distributions from: | | | | | | | | | | | | | | | | | | | | |
| Net investment income | | | (0.02 | ) | | | (0.14 | ) | | | (0.18 | ) | | | (0.04 | ) | | | (0.11 | ) |
| Net realized gains | | | (1.09 | ) | | | — | | | | (1.02 | ) | | | (1.90 | ) | | | (1.19 | ) |
| Total distributions | | | (1.11 | ) | | | (0.14 | ) | | | (1.20 | ) | | | (1.94 | ) | | | (1.30 | ) |
Net asset value, end of year | | $ | 18.24 | | | $ | 19.04 | | | $ | 10.65 | | | $ | 16.80 | | | $ | 17.64 | |
| | | | | | | | | | | | | | | | | | | | | |
| Total return | | | 1.65 | % | | | 80.39 | % | | | -31.87 | % | | | 7.51 | % | | | 8.21 | % |
| | | | | | | | | | | | | | | | | | | | | |
| Supplemental Data and Ratios | | | | | | | | | | | | | | | | | | | | |
Net assets, at end of year (000’s) | | $ | 29,247 | | | $ | 44,370 | | | $ | 35,011 | | | $ | 67,804 | | | $ | 74,626 | |
| | | | | | | | | | | | | | | | | | | | | |
Ratio of expenses to average net assets: | | | | | | | | | | | | | | | | | | | | |
| Before expense waiver | | | 1.05 | % | | | 1.05 | % | | | 0.88 | % | | | 0.85 | % | | | 0.85 | % |
| After expense waiver | | | 0.99 | % | | | 0.99 | % | | | 0.88 | % | | | 0.85 | % | | | 0.85 | % |
| | | | | | | | | | | | | | | | | | | | | |
Ratio of net investment income to average net assets: | | | | | | | | | | | | | | | | | | | | |
| After expense waiver | | | 0.17 | % | | | 0.29 | % | | | 1.32 | % | | | 0.25 | % | | | 0.30 | % |
| | | | | | | | | | | | | | | | | | | | | |
Portfolio Turnover Rate | | | 46 | % | | | 64 | % | | | 53 | % | | | 115 | % | | | 101 | % |
See Notes to the Financial Statements
Great Lakes Funds
Notes to the Financial Statements
March 31, 2022
1. ORGANIZATION
Managed Portfolio Series (the “Trust”) was organized as a Delaware statutory trust on January 27, 2011. The Trust is registered under the Investment Company Act of 1940 (the “1940 Act”), as amended, as an open-end management investment company. The Great Lakes Disciplined Equity Fund (“Disciplined Equity Fund”), Great Lakes Large Cap Value Fund (“Large Cap Value Fund”), and Great Lakes Small Cap Opportunity Fund (“Small Cap Opportunity Fund”) (each a “Fund” and collectively, the “Funds”) are each a diversified series with their own investment objectives and policies within the Trust. The investment objective of each Fund is total return. The Funds are investment companies and accordingly follow the investment company accounting and reporting guidance of the Financial Accounting Standards Board (“FASB”) Accounting Standards Codification Topic 946 Financial Services – Investment Companies. The Large Cap Value Fund commenced operations on September 28, 2012. The Disciplined Equity Fund commenced operations on June 1, 2009 and the Small Cap Opportunity Fund commenced operations on December 5, 2008. The Small Cap Opportunity Fund currently offers two classes of shares, the Investor Class and the Institutional Class. Each class of shares has identical rights and privileges except with respect to the distribution fees and voting rights on matters affecting a single share class. The Disciplined Equity Fund and Large Cap Value Fund currently offer only Institutional Class shares. The Funds may issue an unlimited number of shares of beneficial interest, with no par value.
2. SIGNIFICANT ACCOUNTING POLICIES
The following is a summary of significant accounting policies consistently followed by the Funds in preparation of its financial statements. These policies are in conformity with generally accepted accounting principles in the United States of America (“GAAP”).
Security Valuation – All investments in securities are recorded at their estimated fair value, as described in Note 3.
Federal Income Taxes – The Funds comply with the requirements of subchapter M of the Internal Revenue Code of 1986, as amended, necessary to qualify as regulated investment companies and distribute substantially all net taxable investment income and net realized gains to shareholders in a manner which results in no cost to the Funds. Therefore, no federal income or excise tax provision is required. As of and during the year ended March 31, 2022, the Funds did not have any tax positions that did not meet the “more-likely-than-not” threshold of being sustained by the applicable tax authority. The Funds recognize interest and penalties, if any, related to unrecognized tax benefits on uncertain tax positions as income tax expense in the Statements of Operations. As of and during the year ended March 31, 2022, the Funds did not incur any interest or penalties. The Funds are not subject to examination by U.S. tax authorities for the years prior to March 31, 2019.
Security Transactions, Investment Income and Distributions – The Funds follow industry practice and record security transactions on the trade date. Realized gains and losses on sales of securities are calculated on the basis of identified cost. Dividend income is recorded on the ex-dividend date and interest income is recorded on an accrual basis. Withholding taxes on foreign dividends have been provided for in accordance with the Funds’ understanding of the applicable country’s tax rules and regulations. Gains realized by the Funds on the sale of securities in certain countries may also be subject to non-U.S. taxes. Discounts and premiums on securities purchased are amortized over the expected life of the respective securities using the constant yield method.
The Large Cap Value Fund and the Disciplined Equity Fund will make distributions, if any, of net investment income quarterly. The Small Cap Opportunity Fund will make distributions, if any, of net investment income annually. The Funds will also distribute net capital gains, if any, at least annually, typically during the month of December. The
Great Lakes Funds
Notes to the Financial Statements – Continued
March 31, 2022
Funds may make additional distributions if deemed to be desirable any time during the year. Distributions to shareholders are recorded on the ex-dividend date. The treatment for financial reporting purposes of distributions made to shareholders during the year from net investment income or net realized capital gains may differ from their treatment for federal income tax purposes. Where such differences are permanent in nature, GAAP requires that they be reclassified in the components of the net assets based on their ultimate characterization for federal income tax purposes. For the year ended March 31, 2022, no such reclassifications were made.
Foreign Currency – Investment securities and other assets and liabilities denominated in foreign currencies are translated into U.S. dollar amounts at the date of valuation. Purchases and sales of investment securities and income and expense items denominated in foreign currencies are translated into U.S. dollar amounts on the respective dates of such transactions. The Funds do not isolate that portion of the results of operations resulting from changes in foreign exchange rates on investments from the fluctuations arising from changes in market prices of securities held. Such fluctuations are included with the net realized and unrealized gain or loss from investments. The Funds report net realized foreign exchange gains or losses that arise from sales of foreign currencies, currency gains or losses realized between the trade and settlement dates on securities transactions, and the difference between the amounts of dividends, interest, and foreign withholding taxes recorded on the Funds’ books and the U.S. dollar equivalent of the amounts actually received or paid. Net unrealized foreign exchange gains and losses arise from changes in the fair values of assets and liabilities, other than investments in securities at fiscal period end, resulting from changes in exchange rates.
Use of Estimates – The preparation of financial statements in conformity with GAAP requires management to make estimates and assumptions that affect the reported amounts of assets and liabilities and disclosure of contingent assets and liabilities at the date of the financial statements and the reported amounts of revenues and expenses during the reporting period. Actual results could differ from those estimates.
Allocation of Income, Expenses and Gains/Losses – Income, expenses (other than those deemed attributable to a specific share class), and gains and losses of the Funds are allocated daily to each class of shares based upon the ratio of net assets represented by each class as a percentage of the net assets of each Fund. Expenses deemed directly attributable to a class of shares are recorded by the specific class. Most Fund expenses are allocated by class based on relative net assets. 12b-1 fees are expensed at 0.25% of average daily net assets of Investor Class shares. Expenses associated with a specific fund in the Trust are charged to that fund. Common Trust expenses are typically allocated evenly between the funds of the Trust, or by other equitable means.
Illiquid Securities – A security may be considered illiquid if it lacks a readily available market. Securities are generally considered liquid if they can be sold or disposed of in the ordinary course of business within seven days at approximately the price at which the security is valued by the Fund. Illiquid securities may be valued under methods approved by the Board of Trustees (the “Board”) as reflecting fair value. The Funds will not hold more than 15% of the value of their net assets in illiquid securities. At March 31, 2022, the Funds did not hold any illiquid securities.
Security Loans – When the Funds loan securities held in their portfolios, the Funds receive compensation in the form of fees, or retain a portion of the interest on the investment of any cash received as collateral. The Funds also continue to receive dividends on the securities loaned. The loans are secured by collateral at least equal to 105% of the value of the loaned securities that are foreign securities or 102% of the value of any other loaned securities marked-to-market daily. Loans shall be marked to market daily and the margin restored in the event collateralization is below 100% of the value of securities loaned. Gain or loss in the value of securities loaned that may occur during the term
Great Lakes Funds
Notes to the Financial Statements – Continued
March 31, 2022
of the loan will be for the account of the Funds. The Funds have the right under the lending agreement to recover the securities from the borrower on demand. Currently, only the Small Cap Opportunity Fund is eligible to participate in securities lending. See Note 9.
3. SECURITIES VALUATION
The Funds have adopted authoritative fair value accounting standards which establish an authoritative definition of fair value and set out a hierarchy for measuring fair value. These standards require additional disclosures about the various inputs and valuation techniques used to develop the measurements of fair value, a discussion in changes in valuation techniques and related inputs during the period and expanded disclosure of valuation levels for major security types. These inputs are summarized in the three broad levels listed below:
| Level 1 – | Unadjusted quoted prices in active markets for identical assets or liabilities that the Funds have the ability to access. |
| | |
| Level 2 – | Observable inputs other than quoted prices included in Level 1 that are observable for the asset or liability, either directly or indirectly. These inputs may include quoted prices for the identical instrument on an inactive market, prices for similar instruments, interest rates, prepayment speeds, credit risk, yield curves, default rates and similar data. |
| | |
| Level 3 – | Unobservable inputs for the asset or liability, to the extent relevant observable inputs are not available, representing the Funds’ own assumptions about the assumptions a market participant would use in valuing the asset or liability, and would be based on the best information available. |
Following is a description of the valuation techniques applied to each Fund’s major categories of assets and liabilities measured at fair value on a recurring basis. Each Fund’s investments are carried at fair value.
Equity Securities – Equity securities, including common stocks and exchange traded funds (“ETFs”) and real estate investment trusts (“REITs”), that are primarily traded on a national securities exchange shall be valued at the last sale price on the exchange on which they are primarily traded on the day of valuation or, if there has been no sale on such day, at the mean between the bid and ask prices. Securities traded primarily in the Nasdaq Global Market System for which market quotations are readily available shall be valued using the Nasdaq Official Closing Price (“NOCP”). If the NOCP is not available, such securities shall be valued at the last sale price on the day of valuation, or if there has been no sale on such day, at the mean between the bid and ask prices. To the extent these securities are actively traded, and valuation adjustments are not applied, they are categorized in Level 1 of the fair value hierarchy. If the market for a particular security is not active, and the mean between bid and ask prices is used, these securities are categorized in Level 2 of the fair value hierarchy.
Investment Companies – Investments in other mutual funds, including money market funds, are valued at their NAV per share and are categorized in Level 1 of the fair value hierarchy.
Securities for which market quotations are not readily available, or if the closing price does not represent fair value, are valued following procedures approved by the Board. These procedures consider many factors, including the type of security, size of holding, trading volume and news events. There can be no assurance that the Fund could obtain the fair value assigned to a security if they were to sell the security at approximately the time at which the Fund determines their net asset values per share. The Board has established a Valuation Committee to administer, implement, and oversee the fair valuation process, and to make fair value decisions when necessary. The Board regularly reviews reports of the Valuation Committee that describe any fair value determinations and methods.
Great Lakes Funds
Notes to the Financial Statements – Continued
March 31, 2022
The inputs or methodology used for valuing securities are not an indication of the risk associated with investing in those securities. The following is a summary of the inputs used to value each Fund’s securities as of March 31, 2022:
| Disciplined Equity Fund | | Level 1 | | | Level 2 | | | Level 3 | | | Total | |
| Common Stocks | | $ | 28,186,972 | | | $ | — | | | $ | — | | | $ | 28,186,972 | |
| Money Market Fund | | | 300,458 | | | | — | | | | — | | | | 300,458 | |
| Total Investments | | $ | 28,487,430 | | | $ | — | | | $ | — | | | $ | 28,487,430 | |
| | | | | | | | | | | | | | | | | |
| Large Cap Value Fund | | Level 1 | | | Level 2 | | | Level 3 | | | Total | |
| Common Stocks | | $ | 42,713,832 | | | $ | — | | | $ | — | | | $ | 42,713,832 | |
| Money Market Fund | | | 297,332 | | | | — | | | | — | | | | 297,332 | |
| Total Investments | | $ | 43,011,164 | | | $ | — | | | $ | — | | | $ | 43,011,164 | |
| Small Cap Opportunity Fund | | Uncategorized | | | Level 1 | | | Level 2 | | | Level 3 | | | Total | |
| Common Stocks | | $ | — | | | $ | 33,347,264 | | | $ | — | | | $ | — | | | $ | 33,347,264 | |
| Investment Purchased | | | | | | | | | | | | | | | | | | | | |
| with Proceeds from | | | | | | | | | | | | | | | | | | | | |
| Securities Lending* | | | 9,148,350 | | | | — | | | | — | | | | — | | | | 9,148,350 | |
| Money Market Fund | | | — | | | | 645,022 | | | | — | | | | — | | | | 645,022 | |
| Total Investments | | $ | 9,148,350 | | | $ | 33,992,286 | | | $ | — | | | $ | — | | | $ | 43,140,636 | |
| * | Certain investments that are measured at fair value using the NAV per share (or its equivalent) as a practical expedient have not been characterized in the fair value hierarchy. The fair value amounts presented in the table are intended to permit reconciliation of the fair value hierarchy to the amount presented in the Statements of Assets and Liabilities. See Note 9 for additional information regarding securities lending activity. |
Refer to the Schedule of Investments for further information on the classification of investments.
In December 2020, the SEC adopted a new rule providing a framework for fund valuation practices (“Rule 2a-5”). Rule 2a-5 establishes requirements for determining fair value in good faith for purposes of the 1940 Act. Rule 2a-5 will permit fund boards to designate certain parties to perform fair value determinations, subject to board oversight and certain other conditions. Rule 2a-5 also defines when market quotations are “readily available” for purposes of the 1940 Act and the threshold for determining whether a fund must fair value a security. In connection with Rule 2a-5, the SEC also adopted related recordkeeping requirements and is rescinding previously issued guidance, including with respect to the role of a board in determining fair value and the accounting and auditing of fund investments. The Funds will be required to comply with the rules by September 8, 2022. Management is currently assessing the potential impact of the new rules on the Funds' financial statements.
The global outbreak of COVID-19 (commonly referred to as “coronavirus”) has disrupted economic markets and the prolonged economic impact is uncertain. The ultimate economic fallout from the pandemic, and the long-term impact on economies, markets, industries and individual issuers, are not known. The operational and financial performance of the issuers of securities in which the Funds invest depends on future developments, including the duration and spread of the outbreak, and such uncertainty may in turn adversely affect the value and liquidity of the Funds’ investments, impair the Funds’ ability to satisfy redemption requests, and negatively impact the Funds’ performance.
On February 24, 2022, Russia commenced a military attack on Ukraine. The outbreak of hostilities between the two countries could result in more widespread conflict and could have a severe adverse effect on the region and the markets.
Great Lakes Funds
Notes to the Financial Statements – Continued
March 31, 2022
In addition, sanctions imposed on Russia by the United States and other countries, and any sanctions imposed in the future could have a significant adverse impact on the Russian economy and related markets. The price and liquidity of investments may fluctuate widely as a result of the conflict and related events. How long such conflict and related events will last and whether it will escalate further cannot be predicted, nor its effect on the Funds.
4. INVESTMENT ADVISORY FEE AND OTHER TRANSACTIONS WITH AFFILIATES
The Trust has an agreement with Great Lakes Advisors, LLC (the “Adviser”) to furnish investment advisory services to the Funds. For its services, the Funds pay the Adviser a monthly management fee based upon the average daily net assets of the Funds at the following annual rates:
| Fund | | | | |
| Disciplined Equity Fund | | | 0.60 | % | |
| Large Cap Value Fund | | | 0.60 | % | |
| Small Cap Opportunity Fund | | | 0.60 | % | |
The Funds’ Adviser has contractually agreed to waive its management fees and pay Fund expenses to ensure that total annual operating expenses (excluding acquired fund fees and expenses, leverage/borrowing interest, interest expense, taxes, brokerage commissions, and extraordinary expenses) do not exceed the following rates (based upon the average daily net assets of the Funds):
| Fund | Investor Class | Institutional Class | |
| Disciplined Equity Fund | N/A | 0.85% | |
| Large Cap Value Fund | N/A | 0.85% | |
| Small Cap Opportunity Fund | 1.24% | 0.99% | |
Fees waived and expenses paid by the Adviser may be recouped by the Adviser for a period of thirty-six months following the date on which such fee waiver and expense payment was made, if such recoupment can be achieved without exceeding the expense limit in effect at the time the fee waiver and expense payment occurred and the expense limit in effect at the time of recoupment. The Operating Expenses Limitation Agreement is intended to be continual in nature and cannot be terminated within a year after the effective date of the Funds’ prospectus. After that date, the agreement may be terminated at any time upon 60 days’ written notice by the Trust’s Board or the Adviser, with the consent of the Board. Waived fees and reimbursed expenses subject to potential recovery by month of expiration are as follows:
| | | April 2022 – | | | April 2023 – | | | April 2024 – | |
| Fund | | March 2023 | | | March 2024 | | | March 2025 | |
| Disciplined Equity Fund | | $ | 56,140 | | | $ | 94,494 | | | $ | 114,024 | |
| Large Cap Value Fund | | | 40,009 | | | | 79,283 | | | | 72,339 | |
| Small Cap Opportunity Fund | | | 887 | | | | 31,351 | | | | 31,096 | |
U.S. Bancorp Fund Services, LLC (the “Administrator”), doing business as U.S. Bank Global Fund Services, acts as the Funds’ Administrator, Transfer Agent, and Fund Accountant. U.S. Bank, N.A. (the “Custodian”) serves as the custodian to the Funds. The Custodian is an affiliate of the Administrator. The Administrator performs various administrative and accounting services for the Funds. The Administrator prepares various federal and state regulatory filings, reports and returns for the Funds; prepares reports and materials to be supplied to the Trustees; monitors the activities of the Funds’ custodian; coordinates the payment of the Funds’ expenses and reviews the Funds’ expense accruals. The officers of the Trust, including the Chief Compliance Officer, are employees of the Administrator. As compensation for its services, the Administrator is entitled to a monthly fee at an annual rate based upon the average daily net assets of the Funds,
Great Lakes Funds
Notes to the Financial Statements – Continued
March 31, 2022
subject to annual minimums. Fees paid by the Funds for administration and accounting, transfer agency, custody and compliance services for the year ended March 31, 2022, are disclosed in the Statements of Operations.
5. DISTRIBUTION AND SHAREHOLDER SERVICING FEES
The Small Cap Opportunity Fund has adopted a Distribution Plan pursuant to Rule 12b-1 (the “Plan”) in the Investor Class only. The Plan permits the Fund to pay for distribution and related expenses at an annual rate of 0.25% of the Investor Class average daily net assets. The expenses covered by the Plan may include the cost of preparing and distributing prospectuses and other sales material, advertising and public relations expenses, payments to financial intermediaries and compensation of personnel involved in selling shares of the Fund. Payments made pursuant to the Plan will represent compensation for distribution and service activities, not reimbursements for specific expenses incurred. For the year ended March 31, 2022, the Fund’s Investor Class incurred the following expenses pursuant to the Plan:
| Fund | Amount | |
| Small Cap Opportunity Fund | $12,677 | |
6. CAPITAL SHARE TRANSACTIONS
Transactions in shares of the Funds were as follows:
| | | Disciplined Equity Fund | | | Large Cap Value Fund | |
| | | Year Ended | | | Year Ended | | | Year Ended | | | Year Ended | |
| | | March 31, 2022 | | | March 31, 2021 | | | March 31, 2022 | | | March 31, 2021 | |
| Institutional Class: | | | | | | | | | | | | |
| Shares sold | | | 1,180,293 | | | | 163,060 | | | | 388,965 | | | | 160,658 | |
| Shares issued in reinvestment | | | | | | | | | | | | | | | | |
| of distributions | | | 488,686 | | | | 60,347 | | | | 70,076 | | | | 22,911 | |
| Shares redeemed | | | (959,112 | ) | | | (507,145 | ) | | | (618,861 | ) | | | (993,310 | ) |
| Net increase (decrease) | | | | | | | | | | | | | | | | |
| in capital shares | | | 709,867 | | | | (283,738 | ) | | | (159,820 | ) | | | (809,741 | ) |
| | | Small Cap Opportunity Fund | |
| | | Year Ended | | | Year Ended | |
| | | March 31, 2022 | | | March 31, 2021 | |
| Investor Class: | | | | | | |
| Shares sold | | | 1,156 | | | | 12,984 | |
| Shares issued in reinvestment of distributions | | | 15,646 | | | | 1,818 | |
| Shares redeemed | | | (31,501 | ) | | | (362,683 | ) |
| Net decrease | | | (14,699 | ) | | | (347,881 | ) |
| Institutional Class: | | | | | | | | |
| Shares sold | | | 238,761 | | | | 285,112 | |
| Shares issued in reinvestment of distributions | | | 94,508 | | | | 15,532 | |
| Shares redeemed | | | (1,060,497 | ) | | | (1,257,042 | ) |
| Net decrease | | | (727,228 | ) | | | (956,398 | ) |
| Net decrease in capital shares | | | (741,927 | ) | | | (1,304,279 | ) |
Great Lakes Funds
Notes to the Financial Statements – Continued
March 31, 2022
7. INVESTMENT TRANSACTIONS
The aggregate purchases and sales, excluding short-term investments, by the Funds for the year ended March 31, 2022, were as follows:
| | | U.S. Government Securities | | | Other | |
| Fund | | Purchases | | | Sales | | | Purchases | | | Sales | |
| Disciplined Equity Fund | | $ | — | | | $ | — | | | $ | 50,230,939 | | | $ | 60,905,852 | |
| Large Cap Value Fund | | | — | | | | — | | | | 23,016,228 | | | | 27,831,675 | |
| Small Cap Opportunity Fund | | | — | | | | — | | | | 21,554,190 | | | | 37,609,168 | |
8. INCOME TAX INFORMATION
The aggregate gross unrealized appreciation and depreciation of securities held by the Funds and the total cost of securities for federal income tax purposes at March 31, 2022, were as follows:
| | | Aggregate Gross | | | Aggregate Gross | | | Net | | | Federal Income | |
| Fund | | Appreciation | | | Depreciation | | | Appreciation | | | Tax Cost | |
| Disciplined Equity Fund | | $ | 3,166,857 | | | $ | (392,798 | ) | | $ | 2,774,059 | | | $ | 25,713,371 | |
| Large Cap Value Fund | | | 8,579,883 | | | | (943,659 | ) | | | 7,636,224 | | | | 35,374,940 | |
| Small Cap Opportunity Fund | | | 4,551,197 | | | | (2,824,370 | ) | | | 1,726,827 | | | | 32,265,459 | |
The difference between book-basis and tax-basis unrealized appreciation (depreciation) is attributable primarily to the differences in tax treatment of wash sales.
At March 31, 2022, the components of accumulated earnings (deficit) on a tax-basis were as follows:
| | | Undistributed | | | Undistributed | | | Other | | | | | | Total | |
| | | Ordinary | | | Long-Term | | | Accumulated | | | Net | | | Distributable | |
| Fund | | Income | | | Capital Gains | | | Gain/Loss | | | Appreciation | | | Earnings | |
| Disciplined Equity Fund | | $ | — | | | $ | 381,895 | | | $ | — | | | $ | 2,774,059 | | | $ | 3,155,954 | |
| Large Cap Value Fund | | | 75,135 | | | | 2,792,769 | | | | 52 | | | | 7,636,224 | | | | 10,504,180 | |
| Small Cap Opportunity Fund | | | 383,831 | | | | 3,765,597 | | | | — | | | | 1,726,827 | | | | 5,876,255 | |
As of March 31, 2022, the Funds did not have any capital loss carryovers. A regulated investment company may elect for any taxable year to treat any portion of any qualified late year loss as arising on the first day of the next taxable year. Qualified late year losses are certain capital and ordinary losses which occur during the portion of each Fund’s taxable year subsequent to October 31 and December 31, respectively. For the taxable year ended March 31, 2022, the Funds do not plan to defer any late year losses.
The tax character of distributions paid during the year ended March 31, 2022, was as follows:
| Fund | | Ordinary Income* | | | Long-Term Capital Gains** | | | Return of Capital | | | Total | |
| Disciplined Equity Fund | | $ | 2,797,794 | | | $ | 10,836,006 | | | $ | — | | | $ | 13,633,800 | |
| Large Cap Value Fund | | | 1,045,942 | | | | 2,651,234 | | | | — | | | | 3,697,176 | |
| Small Cap Opportunity Fund | | | 1,445,737 | | | | 1,294,859 | | | | — | | | | 2,740,596 | |
Great Lakes Funds
Notes to the Financial Statements – Continued
March 31, 2022
The tax character of distributions paid during the year ended March 31, 2021, the Funds’ most recently completed fiscal year end, was as follows:
| Fund | | Ordinary Income* | | | Long-Term Capital Gains** | | | Return of Capital | | | Total | |
| Disciplined Equity Fund | | $ | 104,406 | | | $ | 2,458,163 | | | $ | — | | | $ | 2,562,569 | |
| Large Cap Value Fund | | | 892,361 | | | | 11,840 | | | | 4,900 | | | | 909,101 | |
| Small Cap Opportunity Fund | | | 416,160 | | | | — | | | | — | | | | 416,160 | |
| * | For Federal income tax purposes, distributions of short-term capital gains are treated as ordinary income. |
| ** | The Fund designated as long-term capital gain dividend, pursuant to Internal Revenue Code Section 852(b)(3), the amount necessary to reduce the earnings and profits of the Fund related to net capital gain to zero for the tax year ended March 31, 2022. To the extent necessary to fully distribute such capital gain, the Funds also designate earnings and profits distributed to shareholders on the redemption of shares. |
9. SECURITIES LENDING
Following the terms of a securities lending agreement with the Funds’ Custodian, the Funds may lend securities from its portfolio to brokers, dealers and financial institutions in order to increase the return on its portfolio, primarily through the receipt of borrowing fees and earnings on invested collateral. Loans must be continuously secured by collateral consisting of: (i) cash or cash equivalents; (ii) securities issued or guaranteed by the U.S. government or one of its agencies or instrumentalities; (iii) an irrevocable bank letter of credit; or (iv) any combination thereof, equal to not less than (a) 102% of the market value of the securities loaned that are principally settled in the United States at the inception of the Loan and (b) 105% of the market value for securities that are cleared and principally settled outside the United States at the inception of the Loan. Loans shall be marked to market daily and the margin restored in the event the collateralization is below 100% of the value of the securities loaned. During the time securities are on loan, the borrower will pay the applicable Fund any accrued income on those securities, and the Fund may invest the cash collateral and earn income or receive an agreed-upon fee from a borrower that has delivered cash-equivalent collateral. In determining whether or not to lend a security to a particular broker, dealer or financial institution, the Adviser considers all relevant facts and circumstances, including the size, creditworthiness and reputation of the broker, relevant facts dealer or financial institution. Securities lending involves the risk of a default or insolvency of the borrower. In either of these cases, a Fund could experience delays in recovering securities or collateral or could lose all or part of the value of the loaned securities. A Fund also could lose money in the event of a decline in the value of the collateral provided for loaned securities. Additionally, the loaned portfolio securities may not be available to a Fund on a timely basis and that Fund may therefore lose the opportunity to sell the securities at a desirable price. Any decline in the value of a security that occurs while the security is out on loan would continue to be borne by the applicable Fund. Currently, only the Small Cap Opportunity Fund is eligible to participate in securities lending. As of March 31, 2022, the Small Cap Opportunity Fund had securities on loan with a value of $8,914,020 and collateral value of $9,148,350.
The Fund receives cash as collateral in return for securities lent as part of the securities lending program. The collateral is invested in the Mount Vernon Liquid Assets Portfolio, LLC of which the investment objective is to seek to maximize current income to the extent with the preservation of capital and liquidity and maintain a stable NAV of $1.00 per unit. The remaining contractual maturity of all securities lending transactions is overnight and continuous. The Fund is not subject to a master netting agreement with respect to securities lending; therefore, no additional disclosures are required. The net income earned by the Fund on investments of cash collateral received from borrowers for the securities loaned to them are reflected in the Fund’s Statements of Operations. Securities lending income, as disclosed in the Fund’s Statements of Operations, represents the income earned from the investment of cash collateral, net of fee rebates paid to the borrower and net of fees paid to the Custodian as lending agent.
Great Lakes Funds
Notes to the Financial Statements – Continued
March 31, 2022
10. LINE OF CREDIT
The Funds have established an unsecured line of credit (“LOC”) in the amount of $25,000,000, 15% of a Fund’s gross market value or 33.33% of the fair value of the Fund’s investments, whichever is less. The LOC matured on July 23, 2021 and was not renewed. The LOC is intended to provide short-term financing, if necessary, subject to certain restrictions and covenants, in connection with shareholder redemptions and other short-term liquidity needs of the Funds. The LOC is with the Custodian. Interest is charged at the prime rate which was 3.25% as of and during the period the LOC was in effect of July 23, 2021. The Funds have authorized U.S. Bank N.A. to charge any of the accounts of the Funds for any missed payments. For the period ended March 31, 2022, the Funds’ LOC activity was as follows:
| | | | | | | Amount | | | | | | | | Date of |
| | | | Average | | | Outstanding as | | | Interest | | | Maximum | | Maximum |
| LOC Agent | Fund | | Borrowings | | | of March 31, 2022 | | | Expense | | | Borrowing | | Borrowing |
| U.S. Bank N.A. | Disciplined Equity Fund | | $ | 12,671 | | | $ | — | | | $ | 417 | | | $ | 1,482,000 | | 04/20/2021 |
| U.S. Bank N.A. | Large Cap Value Fund | | | 1,967 | | | | — | | | | 65 | | | | 376,000 | | 04/20/2021 |
11. SECTOR RISK
As of March 31, 2022, the Disciplined Equity Fund had a significant portion of its assets invested in the information technology sector. The information technology sector may be more sensitive to short product cycles, competition, and more aggressive pricing than the overall market.
12. CONTROL OWNERSHIP
The beneficial ownership, either directly or indirectly, of more than 25% of the voting securities of a fund creates a presumption of control of the fund, under Section 2(a)(9) of the 1940 Act. As of March 31, 2022, each Fund’s percentage of control ownership positions greater than 25% are as follows:
| Fund | Shareholder | Percent of Shares Held |
Disciplined Equity Fund | Maril & Co. FBO | 53.33% |
| | Wells Fargo Clearing | 39.67% |
Large Cap Value Fund | Maril & Co. FBO | 41.73% |
| | Wells Fargo Clearing | 27.10% |
| | Wintrust Financial | 25.29% |
Small Cap Opportunity Fund | Wells Fargo Clearing | 40.80% |
Great Lakes Funds
Report of Independent Registered Public Accounting Firm
To the Shareholders of Great Lakes Funds and
Board of Trustees of Managed Portfolio Series
Opinion on the Financial Statements
We have audited the accompanying statements of assets and liabilities, including the schedules of investments, of Great Lakes Disciplined Equity Fund, Great Lakes Large Cap Value Fund, and Great Lakes Small Cap Opportunity Fund (the “Great Lakes Funds” or the “Funds”), each a series of Managed Portfolio Series, as of March 31, 2022, the related statements of operations for the year then ended, the statements of changes in net assets for each of the two years in the period then ended, the related notes, and the financial highlights for each of the five years in the period then ended (collectively referred to as the “financial statements”). In our opinion, the financial statements present fairly, in all material respects, the financial position of each of the Funds as of March 31, 2022, the results of their operations for the year then ended, the changes in net assets for each of the two years in the period then ended, and the financial highlights for each of the five years in the period then ended, in conformity with accounting principles generally accepted in the United States of America.
Basis for Opinion
These financial statements are the responsibility of the Funds’ management. Our responsibility is to express an opinion on the Funds’ financial statements based on our audits. We are a public accounting firm registered with the Public Company Accounting Oversight Board (United States) (“PCAOB”) and are required to be independent with respect to the Funds in accordance with the U.S. federal securities laws and the applicable rules and regulations of the Securities and Exchange Commission and the PCAOB.
We conducted our audits in accordance with the standards of the PCAOB. Those standards require that we plan and perform the audit to obtain reasonable assurance about whether the financial statements are free of material misstatement whether due to error or fraud.
Our audits included performing procedures to assess the risks of material misstatement of the financial statements, whether due to error or fraud, and performing procedures that respond to those risks. Such procedures included examining, on a test basis, evidence regarding the amounts and disclosures in the financial statements. Our procedures included confirmation of securities owned as of March 31, 2022, by correspondence with the custodian. Our audits also included evaluating the accounting principles used and significant estimates made by management, as well as evaluating the overall presentation of the financial statements. We believe that our audits provide a reasonable basis for our opinion.
We have served as the Funds’ auditor since 2015.
COHEN & COMPANY, LTD.
Milwaukee, Wisconsin
May 25, 2022
Great Lakes Funds
Additional Information (Unaudited)
March 31, 2022
APPROVAL OF INVESTMENT ADVISORY AGREEMENT – Great Lakes Advisors, LLC
At the regular meeting of the Board of Trustees of Managed Portfolio Series (“Trust”) on February 22-23, 2022, the Trust’s Board of Trustees (“Board”), each of whom were present in person, including all of the Trustees who are not “interested persons” of the Trust, as that term is defined in Section 2(a)(19) of the Investment Company Act of 1940, as amended, (“Independent Trustees”) considered and approved the continuation of the Investment Advisory Agreement between the Trust and Great Lakes Advisors, LLC (“Great Lakes” or the “Adviser”) regarding Great Lakes Large Cap Value Fund, the Great Lakes Disciplined Equity Fund, and the Great Lakes Small Cap Opportunity Fund (each a “Fund” or collectively, the “Funds”) (the “Investment Advisory Agreement”) for another annual term.
Prior to the meeting and at a meeting held on January 11, 2022, the Trustees received and considered information from Great Lakes and the Trust’s administrator designed to provide the Trustees with the information necessary to evaluate the continuance of the Investment Advisory Agreement (“Support Materials”). Before voting to approve the continuance of the Investment Advisory Agreement, the Trustees reviewed the Support Materials with Trust management and with counsel to the Independent Trustees, and received a memorandum from such counsel discussing the legal standards for their consideration of the renewal of the Investment Advisory Agreement. This information, together with the information provided to the Board throughout the course of the year, formed the primary (but not exclusive) basis for the Board’s determinations.
In determining whether to continue the Investment Advisory Agreement, the Trustees considered all factors they believed relevant, including the following with respect to each Fund: (1) the nature, extent, and quality of the services provided by Great Lakes with respect to the Fund; (2) the Fund’s historical performance and the performance of other investment accounts managed by Great Lakes; (3) the costs of the services provided by Great Lakes and the profits realized by Great Lakes from services rendered to the Fund; (4) comparative fee and expense data for the Fund and other investment companies with similar investment objectives; (5) the extent to which economies of scale may be realized as the Fund grows, and whether the advisory fee for the Fund reflects such economies of scale for the Fund’s benefit; and (6) other benefits to Great Lakes resulting from its relationship with the Funds. In their deliberations, the Trustees weighed to varying degrees the importance of the information provided to them, did not identify any particular information that was all-important or controlling, and considered the information and made its determinations for each Fund separately and independently of the other Fund.
Based upon the information provided to the Board throughout the course of the year, including at an in-person presentation by representatives of Great Lakes, and the Support Materials, the Board concluded that the overall arrangements between the Trust and Great Lakes set forth in the Investment Advisory Agreement, as it relates to each Fund, continue to be fair and reasonable in light of the services that Great Lakes performs, the investment advisory fees that each Fund pays, and such other matters as the Trustees considered relevant in the exercise of their reasonable business judgment. The material factors and conclusions that formed the basis of the Trustees’ determination to approve the continuation of the Investment Advisory Agreement as it relates to each Fund are summarized below.
Nature, Extent and Quality of Services Provided. The Trustees considered the scope of services that Great Lakes provides under the Investment Advisory Agreement with respect to each Fund, noting that such services include, but are not limited to, the following: (1) investing each Fund’s assets consistent with the Fund’s investment objective and investment policies; (2) determining the portfolio securities to be purchased, sold or otherwise disposed of, and the timing of such transactions; (3) voting all proxies with respect to the Funds’ portfolio securities; (4) maintaining the required books and records for transactions that Great Lakes effects on behalf of the Funds; (5) selecting
Great Lakes Funds
Additional Information (Unaudited) – Continued
March 31, 2022
broker-dealers to execute orders on behalf of the Funds; (6) monitoring and maintaining each Fund’s compliance with policies and procedures of the Trust and with applicable securities laws. The Trustees reviewed Great Lakes’ unaudited financial statements and considered Great Lakes’ strong capitalization and its assets under management. In addition, the Board considered the fact that Great Lakes is a wholly-owned subsidiary of Wintrust Financial Corporation, a financial services holding company. In that regard, the Trustees concluded that Great Lakes had sufficient resources to support the management of the Funds. The Trustees then considered the Funds’ portfolio managers and noted each portfolio manager’s extensive portfolio management and security research and analysis experience. The Trustees concluded that they were satisfied with the nature, extent and quality of services that Great Lakes provides to each of the Funds under the Investment Advisory Agreement.
Fund Historical Performance and the Overall Performance of Great Lakes. In assessing the quality of the portfolio management delivered by Great Lakes, the Trustees considered the short-term and long-term performance of each Fund on both an absolute basis and in comparison to an appropriate benchmark index, each Fund’s respective peer funds according to Morningstar classifications, and as compiled by Barrington Partners (each, a “Morningstar BP Cohort”), and each Fund’s respective composite of separate accounts that Great Lakes manages utilizing a similar investment strategy. When comparing each Fund’s performance against its respective Morningstar BP Cohort, the Trustees took into account that the investment objective and strategies of each Fund, as well as the Fund’s level of risk tolerance, may differ significantly from the funds in the peer group.
| | • | Great Lakes Disciplined Equity Fund. The Trustees noted that the Fund had underperformed its Morningstar BP Cohort average over the one-year, three-year, five-year and ten-year periods ended September 30, 2021. The Trustees also observed that the Fund trailed its benchmark index for year-to-date periods ended September 30, 2021, and for the three-year, five-year and ten-year periods ended December 30, 2020, but outperformed its benchmark index for the one-year period ended December 30, 2020. The Trustees considered that the Fund had achieved positive total returns across each time period reviewed since inception and also observed that the Fund’s performance was consistent with the performance of a composite of Great Lakes’ similarly managed accounts over all relevant time periods. |
| | | |
| | • | Great Lakes Large Cap Value Fund. The Trustees noted that the Fund had underperformed its Morningstar BP Cohort average over the one-year, three-year and five-year periods ended September 30, 2021. The Trustees also observed that the Fund had also underperformed its benchmark index over all periods ended December 30, 2020. The Trustees also considered that the Fund had achieved positive total returns since inception. The Trustees also observed that the Fund’s performance was consistent with the performance of a composite of Great Lakes’ similarly managed accounts over all relevant time periods. |
| | | |
| | • | Great Lakes Small Cap Opportunity Fund. The Trustees noted that the Fund’s Institutional Class had underperformed the Morningstar BP Cohort average over the one-year, three-year, five-year and ten-year periods ended September 30, 2021. The Trustees also observed that the Fund had outperformed its benchmark index for the year-to-date period ended September 30, 2021, but underperformed its benchmark index over all other periods ended December 30, 2020. The Trustees also considered that the Fund had achieved positive total returns across the five-year and ten-year periods ended September 30, 2021. The Trustees also observed that the Fund’s performance was consistent over the longer-term with the performance of a composite of Great Lakes’ similarly managed accounts over all relevant time periods. |
Great Lakes Funds
Additional Information (Unaudited) – Continued
March 31, 2022
Cost of Advisory Services and Profitability. The Trustees considered the annual management fee that each Fund pays to Great Lakes under the Investment Advisory Agreement, as well as Great Lakes’ profitability from services that it rendered to each Fund during the 12-month period ended September 30, 2021. In that regard, the Trustees considered the effect of an expense limitation agreement on Great Lakes’ compensation and that Great Lakes has contractually agreed to reduce its advisory fees and, if necessary, reimburse each Fund for operating expenses, as specified in the Funds’ prospectus. The Trustees noted that Great Lakes had waived a portion of its management fees during the 12 months ended September 30, 2021 with respect to each Fund. The Trustees noted that the relationship with each of the Great Lakes Funds had been profitable. The Trustees then considered that the management fees that Great Lakes charges to separately managed accounts with similar investment strategies to those of the Great Lakes Large Cap Value Fund and Great Lakes Disciplined Equity Fund are generally lower than the management fee for the corresponding Fund. The Trustees observed that the fee charged to accounts utilizing a similar investment strategy to the Great Lakes Small Cap Opportunity Fund is higher than the fee charged to the Fund. The Trustees took into account that Great Lakes has additional responsibilities with respect to the Funds, including additional compliance obligations, greater cash management responsibilities and increased trading. The Trustees concluded that Great Lakes’ service relationship with each of the Funds yields a reasonable profit.
Comparative Fee and Expense Data. The Trustees considered a comparative analysis of contractual expenses borne by the Funds and those of funds in corresponding Morningstar BP Cohort. The Trustees noted:
| | • | Great Lakes Disciplined Equity Fund. The Fund’s management fee was above the Morningstar BP Cohort average. The total expenses of the Fund (after fee waivers and expense reimbursements) were above the Morningstar BP Cohort average. |
| | | |
| | • | Great Lakes Large Cap Value Fund. The Fund’s management fee was below the Morningstar BP Cohort average. The total expenses of the Fund (after fee waivers and expense reimbursements) were below the Morningstar BP Cohort average. |
| | | |
| | • | Great Lakes Small Cap Opportunity Fund. The Fund’s management fee was significantly lower than the Morningstar BP Cohort average management fees. The total expenses of the Fund’s Institutional Class (after fee waivers and expense reimbursements) were lower than the Morningstar BP Cohort average. |
While recognizing that it is difficult to compare advisory fees because the scope of advisory services provided may vary from one investment adviser to another, the Trustees concluded that Great Lakes’ advisory fees with respect to each Fund continue to be reasonable.
Economies of Scale. The Trustees considered whether the Funds would benefit from any economies of scale, noting that the investment advisory fees for the Funds do not contain breakpoints. The Trustees took into account the fact that Great Lakes had agreed to consider breakpoints in the future in response to asset growth in each of the Funds, but had also expressed some reservation about doing so for the Great Lakes Small Cap Opportunity Fund because of concerns about potential capacity constraints associated with the Fund’s strategy of investing in small cap stocks. The Trustees noted that given current asset levels, it was not necessary to consider the implementation of fee breakpoints at the present time, but agreed to revisit the issue in the future as circumstances change and Fund asset levels increase.
Great Lakes Funds
Additional Information (Unaudited) – Continued
March 31, 2022
Other Benefits. The Trustees considered the direct and indirect benefits that could be realized by the Adviser and its affiliates from the Adviser’s relationship with the Funds. The Trustees considered the extent to which Great Lakes utilizes soft dollar arrangements with respect to portfolio transactions of certain Funds. The Trustees noted that Great Lakes does not use affiliated brokers to execute the portfolio transactions of the Funds. While the Trustees noted the Great Lakes Small Cap Opportunity Fund utilizes Rule 12b-1 fees to pay for shareholder and distribution services performed on behalf of the Fund, the Trustees observed that distribution expenses that Great Lakes incurred significantly exceed any Rule 12b-1 payments from the Great Lakes Small Cap Opportunity Fund. The Trustees considered that Great Lakes may receive some form of reputational benefit from services rendered to the Funds, but that such benefits are immaterial and cannot otherwise be quantified. The Trustees concluded that Great Lakes does not receive any additional material benefits from its relationship with the Funds.
Great Lakes Funds
Additional Information (Unaudited) – Continued
March 31, 2022
TRUSTEES AND OFFICERS
| | | Term of | Number of | | Other |
| | | Office and | Portfolios | | Directorships |
| | Position(s) | Length of | in Trust | | Held by |
| Name, Address | Held with | Time | Overseen | Principal Occupation(s) | Trustee During |
and Year of Birth | the Trust | Served | by Trustee | During the Past Five Years | the Past Five Years |
| Independent Trustees | | | | | |
| | | | | | |
Leonard M. Rush, CPA | Chairman, | Indefinite | 38 | Retired, Chief Financial Officer, | Independent Trustee, |
615 E. Michigan St. | Trustee | Term; Since | | Robert W. Baird & Co. Incorporated | ETF Series Solutions |
Milwaukee, WI 53202 | and Audit | April 2011 | | (2000-2011). | (60 Portfolios) |
Year of Birth: 1946 | Committee | | | | (2012-Present). |
| | Chairman | | | | |
| | | | | | |
David A. Massart | Trustee | Indefinite | 38 | Partner and Managing Director, | Independent Trustee, |
615 E. Michigan St. | | Term; Since | | Beacon Pointe Advisors, LLC | ETF Series Solutions |
Milwaukee, WI 53202 | | April 2011 | | (since 2022); Co-Founder and | (60 Portfolios) |
Year of Birth: 1967 | | | | Chief Investment Strategist, | (2012-Present). |
| | | | | Next Generation Wealth | |
| | | | | Management, Inc. (2005-2021). | |
| | | | | | |
David M. Swanson | Trustee | Indefinite | 38 | Founder and Managing Principal, | Independent Trustee, |
615 E. Michigan St. | and | Term; Since | | SwanDog Strategic Marketing, LLC | ALPS Variable |
Milwaukee, WI 53202 | Nominating | April 2011 | | (2006-Present); Executive Vice | Investment Trust |
Year of Birth: 1957 | & Governance | | | President, Calamos Investments | (7 Portfolios) |
| | Committee | | | (2004-2006). | (2006-Present); |
| | Chairman | | | | Independent Trustee, |
| | | | | | RiverNorth Funds |
| | | | | | (3 Portfolios) |
| | | | | | (2018-Present); |
| | | | | | RiverNorth Managed |
| | | | | | Duration Municipal |
| | | | | | Income Fund Inc. |
| | | | | | (1 Portfolio) |
| | | | | | (2019-Present); |
| | | | | | RiverNorth Specialty |
| | | | | | Finance Corporation |
| | | | | | (1 Portfolio) |
| | | | | | (2018-Present); |
| | | | | | RiverNorth/ DoubleLine |
| | | | | | Strategic Opportunity |
| | | | | | Fund, Inc. (1 Portfolio) |
| | | | | | (2018-Present); |
| | | | | | RiverNorth Opportunities |
| | | | | | Fund, Inc. (1 Portfolio) |
| | | | | | (2015-Present); |
| | | | | | RiverNorth |
| | | | | | Opportunistic |
| | | | | | Municipal Income |
| | | | | | Fund, Inc. (1 Portfolio) |
| | | | | | (2018-Present); |
| | | | | | RiverNorth Flexible |
| | | | | | Municipal Income |
| | | | | | Fund (2020-Present). |
Great Lakes Funds
Additional Information (Unaudited) – Continued
March 31, 2022
| | | Term of | Number of | | Other |
| | | Office and | Portfolios | | Directorships |
| | Position(s) | Length of | in Trust | | Held by |
| Name, Address | Held with | Time | Overseen | Principal Occupation(s) | Trustee During |
and Year of Birth | the Trust | Served | by Trustee | During the Past Five Years | the Past Five Years |
| | | | | | |
Robert J. Kern | Trustee | Indefinite | 38 | Retired (July 2018-Present); | None |
615 E. Michigan St. | | Term; Since | | Executive Vice President, | |
Milwaukee, WI 53202 | | January 2011 | | U.S. Bancorp Fund Services, | |
Year of Birth: 1958 | | | | LLC (1994-2018). | |
| | | | | | |
| Officers | | | | | |
| | | | | | |
Brian R. Wiedmeyer | President and | Indefinite | N/A | Vice President, U.S. Bancorp | N/A |
615 E. Michigan St. | Principal | Term; Since | | Fund Services, LLC | |
Milwaukee, WI 53202 | Executive | November 2018 | | (2005-Present). | |
Year of Birth: 1973 | Officer | | | | |
| | | | | | |
Deborah Ward | Vice President, | Indefinite | N/A | Senior Vice President, U.S. | N/A |
615 E. Michigan St. | Chief | Term; Since | | Bancorp Fund Services, LLC | |
Milwaukee, WI 53202 | Compliance | April 2013 | | (2004-Present). | |
Year of Birth: 1966 | Officer and | | | | |
| | Anti-Money | | | | |
| | Laundering Officer | | | | |
| | | | | | |
Benjamin Eirich | Treasurer, | Indefinite | N/A | Assistant Vice President, U.S. | N/A |
615 E. Michigan St. | Principal | Term; Since | | Bancorp Fund Services, LLC | |
Milwaukee, WI 53202 | Financial | August 2019 | | (2008-Present). | |
Year of Birth: 1981 | Officer and | (Treasurer); Since | | | |
| | Vice President | November 2018 | | | |
| |
| (Vice President) | | | |
| | | | | | |
John Hadermayer | Secretary | Indefinite | N/A | U.S. Bancorp Fund Services, | N/A |
615 E. Michigan St. | | Term; Since | | LLC (2022-Present); Executive | |
Milwaukee, WI 53202 | | May 2022 | | Director, AQR Capital | |
Year of Birth: 1977 | | | | Management, LLC (2013-2022). | |
| | | | | | |
Douglas Schafer | Assistant | Indefinite Term; | N/A | Assistant Vice President, U.S. | N/A |
615 E. Michigan St. | Treasurer | Since May 2016 | | Bancorp Fund Services, LLC | |
Milwaukee, WI 53202 | and Vice | (Assistant | | (2002-Present). | |
Year of Birth: 1970 | President | Treasurer); | | | |
| | | Indefinite Term; | | | |
| | | Since November 2018 | | | |
| | | (Vice President) | | | |
| | | | | | |
Sara J. Bollech | Assistant | Indefinite | N/A | Officer, U.S. Bancorp Fund | N/A |
615 E. Michigan St. | Treasurer | Term; Since | | Services, LLC (2007-Present). | |
Milwaukee, WI 53202 | and Vice | November 2021 | | | |
Year of Birth: 1977 | President | | | | |
| | | | | | |
Peter A. Walker, CPA | Assistant | Indefinite | N/A | Officer, U.S. Bancorp Fund | N/A |
615 E. Michigan St. | Treasurer | Term; Since | | Services, LLC (2016-Present). | |
Milwaukee, WI 53202 | and Vice | November 2021 | | | |
Year of Birth: 1993 | President | | | | |
Great Lakes Funds
Additional Information (Unaudited)
March 31, 2022
AVAILABILITY OF FUND PORTFOLIO INFORMATION
Each Fund files complete schedules of portfolio holdings with the SEC for the first and third quarters of each fiscal year on Part F of Form N-PORT. The Funds’ Part F of Form N-PORT are available on the SEC’s website at www.sec.gov and may be reviewed and copied at the SEC’s Public Reference Room in Washington, D.C. For information on the Public Reference Room call 1-800-SEC-0330. In addition, each Fund’s Part F of Form N-PORT is available without charge upon request by calling 1-855-278-2020.
AVAILABILITY OF FUND PROXY VOTING INFORMATION
A description of the Funds’ Proxy Voting Policies and Procedures is available without charge, upon request, by calling 1-855-278-2020. Information regarding how the Funds voted proxies relating to portfolio securities during the most recent 12-month period ended June 30 is available (1) without charge, upon request, by calling 1-855-278-2020, or (2) on the SEC’s website at www.sec.gov.
QUALIFIED DIVIDEND INCOME/DIVIDENDS RECEIVED DEDUCTION
For the fiscal year ended March 31, 2022, certain dividends paid by the Funds may be reported as qualified dividend income and may be eligible for taxation at capital gain rates. The percentage of dividends declared from ordinary income designated as qualified dividend income was as follows:
| Fund | | |
| Disciplined Equity Fund | 25.45% | |
| Large Cap Value Fund | 70.95% | |
| Small Cap Opportunity Fund | 28.08% | |
For corporate shareholders, the percent of ordinary income distributions qualifying for the corporate dividends received deduction for the fiscal year ended March 31, 2022, was as follows:
| Fund | | |
| Disciplined Equity Fund | 25.04% | |
| Large Cap Value Fund | 62.84% | |
| Small Cap Opportunity Fund | 26.97% | |
The percentage of taxable ordinary income distributions that are designated as short-term capital gain distributions under Internal Revenue Section 871(k)(2)(C) for each Fund were as follows:
| Fund | | |
| Disciplined Equity Fund | 94.63% | |
| Large Cap Value Fund | 57.92% | |
| Small Cap Opportunity Fund | 96.57% | |
Great Lakes Funds
PRIVACY NOTICE (UNAUDITED)
The Funds collect only relevant information about you that the law allows or requires it to have in order to conduct its business and properly service you. The Funds collect financial and personal information about you (“Personal Information”) directly (e.g., information on account applications and other forms, such as your name, address, and social security number, and information provided to access account information or conduct account transactions online, such as password, account number, e-mail address, and alternate telephone number), and indirectly (e.g., information about your transactions with us, such as transaction amounts, account balance and account holdings).
The Funds do not disclose any non-public personal information about its shareholders or former shareholders other than for everyday business purposes such as to process a transaction, service an account, respond to court orders and legal investigations or as otherwise permitted by law. Third parties that may receive this information include companies that provide transfer agency, technology and administrative services to the Funds, as well as the Funds’ investment adviser who is an affiliate of the Funds. If you maintain a retirement/educational custodial account directly with the Funds, we may also disclose your Personal Information to the custodian for that account for shareholder servicing purposes. The Funds limit access to your Personal Information provided to unaffiliated third parties to information necessary to carry out their assigned responsibilities to the Funds. All shareholder records will be disposed of in accordance with applicable law. The Funds maintain physical, electronic and procedural safeguards to protect your Personal Information and requires its third-party service providers with access to such information to treat your Personal Information with the same high degree of confidentiality.
In the event that you hold shares of the Funds through a financial intermediary, including, but not limited to, a broker-dealer, credit union, bank or trust company, the privacy policy of your financial intermediary governs how your non-public personal information is shared with unaffiliated third parties.
INVESTMENT ADVISER
Great Lakes Advisors, LLC
231 South LaSalle Street, 4th Floor
Chicago, Illinois 60604
DISTRIBUTOR
Quasar Distributors, LLC
111 East Kilbourn Avenue, Suite 2200
Milwaukee, Wisconsin 53202
CUSTODIAN
U.S. Bank, N.A.
1555 North River Center Drive
Milwaukee, Wisconsin 53212
ADMINISTRATOR, FUND ACCOUNTANT
AND TRANSFER AGENT
U.S. Bancorp Fund Services, LLC
615 E. Michigan Street
Milwaukee, Wisconsin 53202
INDEPENDENT REGISTERED PUBLIC ACCOUNTING FIRM
Cohen & Company, Ltd.
342 Water Street, Suite 830
Milwaukee, Wisconsin 53202
LEGAL COUNSEL
Stradley Ronon Stevens & Young, LLP
2005 Market Street, Suite 2600
Philadelphia, Pennsylvania 19103
This report must be accompanied or preceded by a prospectus.
The Funds’ Statement of Additional Information contains additional information about the
Funds’ trustees and is available without charge upon request by calling 1-855-278-2020.
(b) Not Applicable.
Item 2. Code of Ethics.
The registrant has adopted a code of ethics that applies to the Registrant’s principal executive officer and principal financial officer. The registrant has not made any substantive amendments to its code of ethics during the period covered by this report.
The registrant has not granted any waivers from any provisions of the code of ethics during the period covered by this report.
A copy of the registrant’s code of ethics that applies to the registrant’s principal executive officer and principal financial officer is filed herewith.
Item 3. Audit Committee Financial Expert.
The registrant’s board of Trustees has determined that there is at least one audit committee financial expert serving on its audit committee. Leonard M. Rush is the “audit committee financial expert” and is considered to be “independent” as each term is defined in Item 3 of Form N‑CSR.
Item 4. Principal Accountant Fees and Services.
The registrant has engaged its principal accountant to perform audit services, audit-related services, tax services and other services during the past two fiscal years. “Audit services” refer to performing an audit of the registrant's annual financial statements or services that are normally provided by the accountant in connection with statutory and regulatory filings or engagements for those fiscal years. “Audit-related services” refer to the assurance and related services by the principal accountant that are reasonably related to the performance of the audit. “Tax services” refer to professional services rendered by the principal accountant for tax compliance, tax advice, and tax planning; including reviewing the Funds’ tax returns and distribution calculations. There were no “other services” provided by the principal accountant. For the fiscal years ended March 31, 2021 and March 31, 2022, the Funds’ principal accountant was Cohen & Company, Ltd. The following table details the aggregate fees billed or expected to be billed for each of the last two fiscal years for audit fees, audit-related fees, tax fees and other fees by the principal accountant.
| | FYE 3/31/2022 | FYE 3/31/2021 |
Audit Fees | $41,000 | $56,500 |
Audit-Related Fees | $0 | $0 |
Tax Fees | $10,500 | $28,000 |
All Other Fees | $0 | $0 |
The audit committee has adopted pre-approval policies and procedures that require the audit committee to pre‑approve all audit and non‑audit services of the registrant, including services provided to any entity affiliated with the registrant.
The percentage of fees billed by Cohen & Company, Ltd. for the fiscal years ended March 31, 2021 and March 31, 2022, applicable to non-audit services pursuant to waiver of pre-approval requirement were as follows:
| | FYE 3/31/2022 | FYE 3/31/2021 |
Audit-Related Fees | 0% | 0% |
Tax Fees | 0% | 0% |
All Other Fees | 0% | 0% |
All of the principal accountant’s hours spent on auditing the registrant’s financial statements were attributed to work performed by full‑time permanent employees of the principal accountant.
The following table indicates the non-audit fees billed or expected to be billed by the registrant’s accountant for services to the registrant and to the registrant’s investment adviser (and any other controlling entity, etc.—not sub-adviser) for the last two years.
Non-Audit Related Fees | FYE 3/31/2022 | FYE 3/31/2021 |
Registrant | $0 | $0 |
Registrant’s Investment Adviser | $0 | $0 |
The audit committee of the board of trustees/directors has considered whether the provision of non-audit services that were rendered to the registrant's investment adviser is compatible with maintaining the principal accountant's independence and has concluded that the provision of such non-audit services by the accountant has not compromised the accountant’s independence.
(i) Not applicable.
(j) Not applicable.
Item 5. Audit Committee of Listed Registrants.
Not applicable to registrants who are not listed issuers (as defined in Rule 10A-3 under the Securities Exchange Act of 1934).
Item 6. Investments.
(a) | Schedule of Investments is included as part of the report to shareholders filed under Item 1 of this Form. |
Item 7. Disclosure of Proxy Voting Policies and Procedures for Closed-End Management Investment Companies.
Not applicable to open-end investment companies.
Item 8. Portfolio Managers of Closed-End Management Investment Companies.
Not applicable to open-end investment companies.
Item 9. Purchases of Equity Securities by Closed‑End Management Investment Company and Affiliated Purchasers.
Not applicable to open-end investment companies.
Item 10. Submission of Matters to a Vote of Security Holders.
There have been no material changes to the procedures by which shareholders may recommend nominees to the Registrant’s board of trustees.
Item 11. Controls and Procedures.
(a) | The Registrant’s President and Treasurer have reviewed the Registrant's disclosure controls and procedures (as defined in Rule 30a-3(c) under the Investment Company Act of 1940 (the “Act”)) as of a date within 90 days of the filing of this report, as required by Rule 30a-3(b) under the Act and Rules 13a-15(b) or 15d‑15(b) under the Securities Exchange Act of 1934. Based on their review, such officers have concluded that the disclosure controls and procedures are effective in ensuring that information required to be disclosed in this report is appropriately recorded, processed, summarized and reported and made known to them by others within the Registrant and by the Registrant’s service provider. |
(b) | There were no changes in the Registrant's internal control over financial reporting (as defined in Rule 30a-3(d) under the Act) that occurred during the period covered by this report that has materially affected, or is reasonably likely to materially affect, the Registrant's internal control over financial reporting. |
Item 12. Disclosure of Securities Lending Activities for Closed-End Management Investment Companies.
Not applicable to open-end investment companies.
Item 13. Exhibits.
(3) Any written solicitation to purchase securities under Rule 23c‑1 under the Act sent or given during the period covered by the report by or on behalf of the registrant to 10 or more persons. Not applicable to open-end investment companies.
(4) Change in the registrant’s independent public accountant. There was no change in the registrant’s independent public accountant for the period covered by this report.
SIGNATURES
Pursuant to the requirements of the Securities Exchange Act of 1934 and the Investment Company Act of 1940, the registrant has duly caused this report to be signed on its behalf by the undersigned, thereunto duly authorized.
(Registrant) Managed Portfolio Series
By (Signature and Title) * /s/Brian R. Wiedmeyer
Brian R. Wiedmeyer, President
Date June 1, 2022
Pursuant to the requirements of the Securities Exchange Act of 1934 and the Investment Company Act of 1940, this report has been signed below by the following persons on behalf of the registrant and in the capacities and on the dates indicated.
By (Signature and Title) * /s/Brian R. Wiedmeyer
Brian R. Wiedmeyer, President
Date June 1, 2022
By (Signature and Title)* /s/Benjamin J. Eirich
Benjamin J. Eirich, Treasurer
Date June 1, 2022
* Print the name and title of each signing officer under his or her signature.