| | Annual Report |
| |
| |
| |
| |
| |
| |
| |
| |
| | | |
December 31, 2021
Friess Funds
Friess Small Cap Growth Fund – Institutional Class – SCGFX
Friess Small Cap Growth Fund – Investor Class – SCGNX
Friess Brandywine Fund – Class I – FBRWX
Friess Brandywine Blue Fund – Class I – FBLUX
friessfunds.com
(This Page Intentionally Left Blank.)
| Friess Funds
Annual Report | |
| |
| |
| |
| |
|
| December 31, 2021 |
| | |
| | | |
Dear Fellow Shareholders:
After a shaky September, major market indexes returned to positive form in the year’s final quarter. Investors looked past potential problems, including resurging Covid-19 cases, as individual-company earnings trends provided reason for continued optimism in stocks.
Returns showed lingering caution in the small-cap category, with enthusiasm greatest among the higher rungs of the market-cap ladder.
Friess Brandywine Fund grew 9.15 percent in the three months through December. The Russell 3000® and Russell 3000® Growth Indexes gained 9.28 and 10.89 percent during that time. Friess Brandywine Blue Fund grew 7.94 percent in the quarter as the S&P 500, Russell 1000® and Russell 1000® Growth Indexes gained 11.03, 9.78 and 11.64 percent.
Friess Small Cap Growth Fund’s Institutional Class shares grew 7.18 percent in the December quarter. The Russell 2000® Index gained 2.14 percent while the Russell 2000® Growth Index was mostly unchanged at 0.01 percent.
Recent results capped off a year in which performance for the Friess Small Cap Growth Fund diverged sharply from small-cap growth stocks as a group. The Fund’s institutional class shares grew 32.68 percent in 2021 versus a 2.83 percent return in the Russell 2000® Growth Index. The Russell 2000® Index gained 14.82 for the calendar year. The Fund outperformed both indexes in each of the year’s four quarters.
September’s volatility carried into early October amid uncertainty related to political tension surrounding the nation’s debt ceiling, the tax implications of proposed government spending and a less accommodative Federal Reserve Bank. Compromise and clear messaging assuaged these concerns as third-quarter earnings reporting season got into full swing.
Third-quarter results, especially among the high-profile companies in the S&P 500 Index, were marked by an above-average rate of positive surprises and upward revisions, bolstering investor confidence in the ability of companies to overcome headwinds such as supply chain disruptions, labor shortages and inflation.
Just in time for the holidays, SARS-CoV-2 gave us variant B.1.1.529. First identified from a specimen collected on November 9, the latest version of the novel coronavirus came to the attention of the World Health Organization on November 24. WHO deemed the fast-spreading mutation a “variant of concern” on November 26. Omicron ultimately became the most consequential story of the final month of 2021 as infection rates soared to new pandemic highs.
After initially weighing on the market, investor enthusiasm resurfaced as evidence suggested that omicron, although highly contagious, typically resulted in less severe Covid-19 infections. The combination of economic and epidemiological optimism contributed to positive sentiment to close out the December quarter.
Technology holdings contributed the most to Brandywine’s absolute and relative performance by a wide margin. They represented the largest concentration of portfolio assets while outperforming the sector within the Russell 3000® Growth Index.
Expectation-beating earnings strength was a common characteristic among Brandywine’s top performers. Calix, which makes broadband access equipment for communications service providers, exceeded the third-quarter consensus earnings estimate by 23 percent, reported record quarterly revenue and raised guidance. The company said it was starting the year’s final quarter “in the strongest financial position in our history.” Other top performers, including Marvell Technology, SiTime Corp. and Teradyne, also exceeded earnings estimates in their most recently reported quarter.
The communications services sector was the only material detractor from Brandywine’s absolute return. Magnite, which operates a digital ad buying platform, was the biggest detractor after citing stalled supply chains among customers, soft travel-related spending and comparisons to year-ago results boosted by political advertising for its in-line third-quarter results. The sector was the second biggest detractor from relative results. Consumer discretionary holdings, while contributors to absolute performance, were the biggest detractors from relative results.
Technology holdings also contributed the most to Brandywine Blue’s absolute return. The Fund held several top performers in common with Brandywine, including Marvell Technology, Teradyne and Advanced Micro Devices. Technology holdings represented the second largest portfolio position and the second biggest contributor to performance versus the Russell 1000® Growth Index. Health care holdings, including Pfizer and Tenet Healthcare Corp., were the most significant influence on Brandywine Blue’s relative results.
friessfunds.com
Representing Brandywine Blue’s largest commitment, consumer discretionary holdings contributed to absolute performance, but detracted the most from relative results. Delivery service provider DoorDash was a notable detractor. Shares retreated from their highs in November following a benefits-related settlement with San Francisco drivers and selling among company insiders. Communications services holdings detracted the most from absolute performance and the second most from relative results, led by declines in Walt Disney Co. and Electronic Arts.
Technology holdings, including Calix and Alpha & Omega Semiconductor Ltd., contributed the most to Friess Small Cap Growth Fund’s absolute and relative December-quarter results. Technology represented the largest portfolio position while outperforming the sector within the Russell 2000® Growth Index. Alpha & Omega earned of $1.06 per share in the third quarter, up from $0.55 in the year-ago period and ahead of the consensus estimate.
Industrial holdings represented Friess Small Cap Growth Fund’s second largest sector and contributed the second most to absolute and relative performance. Encore Wire Corp. was a standout contributor. Encore Wire reported third-quarter earnings of $8.51 per share, up from $1.02 the year before. The consensus estimate was $2.92 per share.
For more information on the companies that influenced December-quarter performance, please see Roses & Thorns on page 10 for Brandywine, page 15 for Brandywine Blue and page 5 for Friess Small Cap Growth Fund.
Thanks for your confidence in our research-driven investment approach and the team that implements it. We’re grateful for the opportunity to serve you. Best wishes from your entire Friess team.
Scott Gates
Chief Investment Officer
Management’s Discussion of Results
Investors maintained a positive bias in the 12 months through December 31, 2021, with a particular affinity for large-cap companies. The S&P 500 Index advanced in 11 out of the year’s 12 months and set 70 new all-time highs during the period. Although smaller companies also fared well, their performance became more mixed as risk tolerance appeared to ebb amid rising inflation and impending action by the Federal Reserve Bank to arrest it.
The Friess Funds employ an investment strategy that is based on the premise that company-specific fundamentals, with a particular emphasis on earnings, drive stock prices. While conceding that broader trends influence stocks as a group during certain periods, this approach considers such periods to be finite, with investors ultimately returning to judge each company on its individual merits over time.
The Funds seek to capitalize on the relationship between earnings and stock prices by isolating companies with superior earnings profiles that show promise to exceed consensus earnings expectations. This approach was mostly effective in 2021 as investors appeared to emphasize earnings in determining share prices.
Buoyed by stimulative monetary policy and massive government spending, stocks carried the previous year’s momentum into 2022 despite developments with potential to move the market, including an attack on the U.S. Capitol and the collapse of a major hedge fund. In fact, speculative excess appeared to be a notable risk at the beginning of the year. Shares of Gamestop Corp. rose more than 2,000 percent in the first quarter due to coordinated efforts among users of the Robinhood trading app. At its peak share price in February, Tesla’s market value was 10 times higher than General Motors, the nation’s largest car maker.
Positive sentiment continued into the second quarter, though the market’s speculative streak dissipated as investors were forced to confront the potentially troubling side effects of the government’s enthusiastic economic intervention. May’s inflation rate represented the biggest year-over-year gain since 2008, sparking concern. Amid otherwise positive data points and assurances from the Federal Reserve Bank, investors concluded that more time was needed to determine whether inflation should figure prominently in their thinking.
Seemingly unshakable throughout the first half of the year, investor sentiment ultimately turned during the third quarter. After a mostly uneventful summer, stocks declined in September as inflation persisted and the coronavirus remained a lingering threat to public health and economic normalcy. Supply chain bottlenecks, a political showdown over the debt ceiling and a looming crisis at a Chinese company that is world’s most indebted property developer rounded out the list of matters that sapped enthusiasm for stocks in the quarter.
The market’s mood quickly improved in the fourth quarter as companies began delivering third-quarter earnings reports. The results continued a strong operational showing in 2021 and relieved fears about companies being able to overcome challenges related to labor availability, supply
Friess Funds
Management’s Discussion of Results (Continued)
chain functionality and inflation. Even concerns regarding the emergence of the new omicron variant of the coronavirus faded as early reports showed it to typically result in less severe infections.
Friess Small Cap Growth Fund
Friess Small Cap Growth Fund’s institutional class shares grew 32.68 percent in 2021 versus a 2.83 percent return in its primary benchmark, the Russell 2000® Growth Index. The Fund outperformed the index in each of the year’s four quarters.
Technology holdings, which comprised the largest percentage of assets during the period, contributed the most to absolute and relative results. They represented an overweight position versus the index and outperformed the sector within the benchmark by a wide margin.
Voyager Digital Ltd., which provides cryptocurrency brokerage services, and Calix, which makes broadband access equipment, were top contributors. Voyager reached an earnings inflection point and became profitable during the year amid surging cryptocurrency trading volume. Calix exceeded earning estimates in each quarter it reported during the year as demand for its products increased along with video streaming.
Holdings from the industrial sector were the second biggest contributors to absolute and relative performance. Representing the third largest concentration of assets and an overweight position relative to the index, they outperformed the sector within the benchmark. Encore Wire Corp. was a notable contributor. Purchased in April, the company exceeded the consensus estimate in the subsequent three quarters it reported by 131, 541 and 192 percent.
Health care holdings detracted from absolute performance. Bioanalytical product maker Aspira Women’s Health, surgical instrument manufacturer Axogen and therapy device maker Neuronetics were among the most significant detractors. Although health care holdings underperformed the sector, the portfolio’s underweight position versus the index helped make health care holdings contributors to relative results.
Friess Brandywine Fund
Friess Brandywine Fund grew 7.40 percent from its July 6 inception through December. Its primary benchmark, the Russell 3000 Growth Index gained 9.73 percent in that period.
Technology holdings contributed the most to absolute and relative results. Representing the largest percentage of assets, they outperformed the sector within the benchmark. Despite their leading presence in the portfolio, technology holdings represented an underweight position relative to the index, which ate into their relative performance advantage.
SiTime Corp. and Marvell Technology were standout performers. Both companies were original portfolio holdings for Brandywine’s debut. Both companies exceeded consensus earnings estimates in the two quarters they reported after being purchased.
Communications services holdings, including Magnite and Roblox Corp., detracted the most from absolute performance. They underperformed versus the sector within the benchmark, helping make them the second biggest detractors from relative results. Consumer discretionary holdings, which were a modest drag on absolute performance, detracted the most from relative performance. They comprised the second largest concentration of assets.
Friess Brandywine Blue Fund
Friess Brandywine Blue Fund grew 10.75 percent from its July 6 inception through December as its primary benchmark, the Russell 1000 Growth Index, gained 10.75 percent.
Technology holdings contributed the most to absolute performance. They represented the second largest percentage of assets and outperformed the sector within the benchmark. The Fund shared top performers with Brandywine such as Marvell Technology, Advanced Micro Devices and Teradyne. Technology holdings were the second biggest relative performance contributors.
Health care holdings contributed the most to performance relative to the benchmark. The portfolio was equal weighted versus the index, with health care holdings outperforming the sector within the benchmark. Pfizer and Thermo Fisher Scientific, which both topped expectations in their most recently reported quarter, were standouts.
Holdings from the communications services sector weighed the most on absolute and relative results. Magnite, Roblox and Walt Disney Co. were among the detractors Brandywine Blue held in common with Brandywine.
Friess Small Cap Growth Fund
Portfolio Characteristics as of December 31, 2021 (Unaudited)
Top Ten Equity Holdings(1)
Security Name | % of Net Assets | % Change from Book Cost |
| Hovnanian Enterprises, Inc., Class A | | | 3.5 | % | | | | 8.3 | % | |
| Identiv, Inc. | | | 3.2 | % | | | | 78.0 | % | |
| NV5 Global, Inc. | | | 3.0 | % | | | | 51.2 | % | |
| ArcBest Corp. | | | 2.9 | % | | | | 44.0 | % | |
| Kornit Digital Ltd. | | | 2.9 | % | | | | 288.6 | % | |
| Silicon Motion Technology Corp. - ADR | | | 2.8 | % | | | | 32.8 | % | |
| Academy Sports & Outdoors, Inc. | | | 2.7 | % | | | | 27.3 | % | |
| Encore Wire Corp. | | | 2.7 | % | | | | 101.7 | % | |
| SMART Global Holdings, Inc. | | | 2.5 | % | | | | 20.0 | % | |
| Calix, Inc. | | | 2.5 | % | | | | 282.8 | % | |
| Top Ten as a Group | | | 28.7 | % | | | | | | |
Top Ten Industry Groups(1)
(% of Net Assets)
(1) | Fund holdings and sector allocations are subject to change at any time and are not recommendations to buy or sell any security. |
(2) | Includes money market deposit account. |
Friess Small Cap Growth Fund
December Quarter “Roses & Thorns” (Unaudited)
| | $ Gain | | | | |
| Biggest $ Winners | (in thousands) | % Gain | | Reasons for Move | |
Alpha & Omega Semiconductor Ltd. (AOSL) | $859 | 92.0 | | The maker of power-related semiconductor products benefitted amid strong demand. As a vertically integrated chipmaker, the company did not experience the allocation pressures that were common among fabless semiconductor companies. September-quarter earnings grew 93 percent, beating the consensus estimate by 12 percent. The company’s 23 percent revenue growth also exceeded expectations. | |
Calix Inc. (CALX) | $563 | 46.7 | | Calix, which makes broadband access equipment used by communications service providers, reported record third-quarter revenue and expectation-beating earnings. “We start the fourth quarter of 2021 in the strongest financial position in our history with robust bookings, clear customer and product focus and believe we are perfectly placed to execute on the opportunity ahead,” the company stated in its release. | |
Encore Wire Corp. (WIRE) | $531 | 49.3 | | Encore supplies building wire for interior electrical wiring used in residential homes and commercial buildings. September-quarter earnings grew more than 700 percent as sales doubled and gross profit margins expanded amid higher costs for copper and aluminum. The company benefitted from its ability to meet customer demand at a time when supply chain constraints weighed on smaller competitors. | |
Identiv Inc. (INVE) | $520 | 49.4 | | Identiv, which makes physical access control and video, logical access control, credentials, and RFID inlays and tags, grew September-quarter earnings per share to $0.09 from $0.01 a year ago, beating the consensus estimate by 50 percent. The company benefited from tailwinds in both its on-premises and identity segments, with the latter tied to the RFID market. | |
ArcBest Corp. (ARCB) | $432 | 43.7 | | The provider of trucking and logistics services benefitted as strong demand led to higher volume and pricing. Additionally, the company has been successful in attracting and retaining drivers in a challenging staffing environment. September-quarter earnings more than doubled from year ago levels, beating the consensus estimate. | |
| | | | | | |
| | $ Loss | | | | |
| Biggest $ Losers | (in thousands) | % Loss | | Reasons for Move | |
PLx Pharma Inc. (PLXP) | $715 | 58.5 | | The pharmaceutical company’s shares began the quarter trading near highs on enthusiasm for retail acceptance for its new product Vazalore, a liquid-filled aspirin capsule designed to avoid stomach-related issues associated with traditional aspirin. Shares declined amid uncertainty stemming from U.S. Preventative Services Task Force guidance against using aspirin as a preventative measure against cardiovascular disease. The guidance was not new information and it did not apply to Vazalore’s target customer, patients who experienced a cardiac event who take aspirin to prevent another heart attack or stroke. | |
Scorpio Tankers Inc. (STNG) | $352 | 32.7 | | While spot rates for large ocean tankers that transport petroleum-derived products showed signs of improvement, shares traded with near-term demand for energy that was seen as limited by resurging Covid-19 cases. | |
Axogen Inc. (AXGN) | $347 | 40.7 | | Axogen makes medical and surgical instruments used in peripheral nerve reconstruction and regeneration. While the company exceeded third-quarter earnings expectations, third-quarter revenue and fourth-quarter guidance came in below expectations. Axogen cited delayed procedures and hospital staffing shortages stemming from the pandemic as contributing factors. | |
Stronghold Digital Mining Inc. (SDIG) | $346 | 31.5 | | Shares of Stronghold Digital Mining, which focuses on mining Bitcoin, declined as Bitcoin decreased in value following the Federal Reserve’s announced intention to accelerate its plans to taper its bond buying program. Also, technology supply chain constraints delayed the company’s ability to add mining capacity at its forecasted pace. | |
Sientra Inc. (SIEN) | $333 | 36.3 | | The company, which makes implants used in cosmetic and reconstructive surgical procedures, exceeded September-quarter expectations for earnings and revenue. Shares declined as resurging Covid-19 hospitalizations raised concerns about potential for a downturn in elective procedures. | |
All gains/losses are calculated on an average cost basis from September 30, 2021 through December 31, 2021.
This commentary reflects the viewpoints of Friess Associates, LLC as of December 31, 2021, and is not intended as a forecast or guarantee of future results.
Friess Small Cap Growth Fund
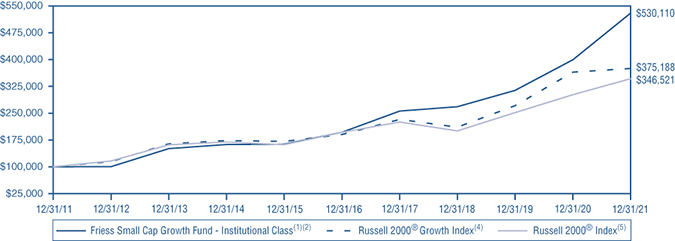
Value of $100,000 Investment (Unaudited)
The chart assumes an initial investment of $100,000. Performance reflects waivers of fee and operating expenses in effect. In the absence of such waivers, total return would be reduced. Past performance is not predictive of future performance. Investment return and principal value will fluctuate, so that your shares, when redeemed, may be worth more or less than their original cost. Performance current to the most recent month-end may be lower or higher than the performance quoted and can be obtained by calling 855-656-3017. Performance assumes the reinvestment of capital gains and income distributions. The performance does not reflect deduction of taxes that a shareholder would pay on Fund distributions or the redemption of Fund shares.
| | One Year | Five Years | Ten Years | Since Inception |
Institutional Class(1)(2) | 32.68% | 21.93% | 18.15% | 11.38% |
Investor Class(1)(3) | 32.39% | 21.63% | 17.86% | 11.10% |
Russell 2000® Growth Index(4) | 2.83% | 14.53% | 14.14% | 11.73% |
Russell 2000® Index(5) | 14.82% | 12.02% | 13.23% | 11.04% |
(1) | Fund commenced operations on May 31, 2017. |
(2) | The performance data quoted for the period prior to May 31, 2017, is that of the Series B Units of the Friess Small Cap Trust (the “Predecessor Fund”) and has not been adjusted to reflect the Fund’s share class’ fees and expenses and would be lower if reflected. The Predecessor Fund commenced operations on August 6, 2002 and was not a registered mutual fund subject to the same investment and tax restrictions as the Fund. If it had been, the Predecessor Fund’s performance might have been lower. The Predecessor Fund’s shares were exchanged for the Fund’s Institutional Class shares on May 31, 2017. |
(3) | Performance for the Investor Class prior to the inception of the class is based on the performance of the Predecessor Fund, adjusted for the higher expenses applicable to the class as compared to the Institutional Class. |
(4) | The Russell 2000® Growth Index is a market capitalization weighted index that measures the performance of those Russell 2000® companies with higher price-to-book ratios and higher forecasted growth values. Unlike the Fund, the Russell 2000® Growth Index is unmanaged, is not available for investment, and does not incur expenses. |
(5) | The Russell 2000® Index measures the performance of approximately 2,000 of the largest securities based on a combination of their market cap and current index membership. Unlike the Fund, the Russell 2000® Index is unmanaged, is not available for investment, and does not incur expenses. |
The performance shown represents past performance and is not a guarantee of future results. Current performance may be lower or higher than the performance data quoted. The investment return and principal value of an investment will fluctuate so that an investor’s shares, when redeemed, may be worth more or less than their original cost. From time to time, the Investment Adviser has waived fees or reimbursed expenses, which may have resulted in higher returns. The listed Fund returns are net of expenses, and the listed index returns exclude expenses. Inception date for “Since Inception” performance is August 6, 2002. Operating expenses (gross) are 1.64% for the Fund’s Institutional Class and 2.13% for its Investor Class. Total operating expenses (net) are 1.20% and 1.45%, respectively, due to the Adviser’s contractual agreement, through at least April 30, 2022, to waive its management fees and/or pay Fund expenses. Fund returns would be lower if the gross expense ratio was reflected. For the most recent month-end performance, please visit the Fund’s website at www.friessfunds.com.
The actual expense ratio applicable to investors, as disclosed in the Financial Highlights for the period ended December 31, 2021, was 1.20% and 1.45% for the Institutional Class and Investor Class, respectively.
Friess Small Cap Growth Fund
Schedule of Investments
December 31, 2021
| Shares | | | | Cost | | | Value | |
| Common Stocks - 96.2% | | | | | | |
| | | | | | | |
| COMMUNICATION SERVICES | | | | | | |
| | | Advertising - 0.9% | | | | | | |
| | 23,745 | | Magnite, Inc.* | | $ | 405,054 | | | $ | 415,538 | |
| | | | Total Communication Services | | | 405,054 | | | | 415,538 | |
| | | | | | | | | |
| CONSUMER DISCRETIONARY | | | | | | | | |
| | | | | | | | | | | | |
| | | | Apparel Retail - 2.0% | | | | | | | | |
| | 37,640 | | American Eagle | | | | | | | | |
| | | | Outfitters, Inc.+ | | | 934,498 | | | | 953,045 | |
| | | | | | | | | | | | |
| | | | Automotive Retail - 4.5% | | | | | | | | |
| | 9,172 | | Penske Automotive | | | | | | | | |
| | | | Group, Inc. | | | 693,452 | | | | 983,422 | |
| | 23,429 | | TravelCenters of | | | | | | | | |
| | | | America, Inc.* | | | 1,298,712 | | | | 1,209,405 | |
| | | | | | | | | | | | |
| | | | Education Services - 2.1% | | | | | | | | |
| | 64,071 | | Houghton Mifflin | | | | | | | | |
| | | | Harcourt Co.+* | | | 1,061,600 | | | | 1,031,543 | |
| | | | | | | | | | | | |
| | | | Footwear - 1.7% | | | | | | | | |
| | 6,617 | | Crocs, Inc.* | | | 229,644 | | | | 848,432 | |
| | | | | | | | | | | | |
| | | | Homebuilding - 8.0% | | | | | | | | |
| | 3,816 | | Cavco Industries, Inc.* | | | 929,086 | | | | 1,212,152 | |
| | 13,355 | | Hovnanian Enterprises, | | | | | | | | |
| | | | Inc., Class A* | | | 1,570,057 | | | | 1,699,958 | |
| | 18,070 | | MDC Holdings, Inc. | | | 989,519 | | | | 1,008,848 | |
| | | | | | | | | | | | |
| | | | Leisure Products - 1.5% | | | | | | | | |
| | 9,037 | | YETI Holdings, Inc.* | | | 384,362 | | | | 748,535 | |
| | | | | | | | | | | | |
| | | | Specialty Stores - 4.9% | | | | | | | | |
| | 30,421 | | Academy Sports & | | | | | | | | |
| | | | Outdoors, Inc.* | | | 1,048,724 | | | | 1,335,482 | |
| | 18,339 | | MarineMax, Inc.* | | | 465,022 | | | | 1,082,734 | |
| | | | Total Consumer Discretionary | | | 9,604,676 | | | | 12,113,556 | |
| | | | | | | | | |
| HEALTH CARE | | | | | | | | |
| | | | | | | | | | | | |
| | | | Health Care Equipment - 3.0% | | | | | | | | |
| | 54,020 | | AxoGen, Inc.* | | | 1,060,905 | | | | 506,168 | |
| | 16,525 | | Cryoport, Inc.* | | | 296,305 | | | | 977,784 | |
| | | | | | | | | | | | |
| | | | Health Care Services - 2.0% | | | | | | | | |
| | 13,331 | | Apollo Medical | | | | | | | | |
| | | | Holdings, Inc.+* | | | 911,168 | | | | 979,562 | |
| | | | | | | | | | | | |
| | | | Health Care Supplies - 2.5% | | | | | | | | |
| | 23,358 | | Figs, Inc., Class A* | | | 910,266 | | | | 643,746 | |
| | 159,479 | | Sientra, Inc.* | | | 740,366 | | | | 585,288 | |
| | | | | | | | | | | | |
| | | | Pharmaceuticals - 1.0% | | | | | | | | |
| | 63,337 | | PLx Pharma, Inc.+* | | | 623,857 | | | | 507,329 | |
| | | | Total Health Care | | | 4,542,867 | | | | 4,199,877 | |
| | | | | | | | | |
| INDUSTRIALS | | | | | | | | |
| | | | | | | | | | | | |
| | | | Air Freight & Logistics - 2.2% | | | | | | | | |
| | 12,655 | | Hub Group, Inc., Class A* | | | 838,997 | | | | 1,066,057 | |
| | | | | | | | | | | | |
| | | | Building Products - 2.2% | | | | | | | | |
| | 41,315 | | Tecnoglass, Inc.+ | | | 471,399 | | | | 1,082,040 | |
| | | | | | | | | | | | |
| | | | Construction & | | | | | | | | |
| | | | Engineering - 3.0% | | | | | | | | |
| | 10,728 | | NV5 Global, Inc.* | | | 979,766 | | | | 1,481,751 | |
| | | | | | | | | | | | |
| | | | Diversified Support | | | | | | | | |
| | | | Services - 2.1% | | | | | | | | |
| | 30,209 | | Driven Brands Holdings, Inc.* | | | 872,349 | | | | 1,015,627 | |
| | | | | | | | | | | | |
| | | | Electrical Components | | | | | | | | |
| | | | & Equipment - 2.7% | | | | | | | | |
| | 9,089 | | Encore Wire Corp. | | | 644,804 | | | | 1,300,636 | |
| | | | | | | | | | | | |
| | | | Industrial Machinery - 5.4% | | | | | | | | |
| | 11,100 | | EnPro Industries, Inc. | | | 1,211,984 | | | | 1,221,777 | |
| | 9,286 | | Kornit Digital Ltd.* | | | 363,773 | | | | 1,413,794 | |
| | | | | | | | | | | | |
| | | | Research & Consulting | | | | | | | | |
| | | | Services - 2.0% | | | | | | | | |
| | 10,534 | | CRA International, Inc. | | | 927,917 | | | | 983,454 | |
| | | | | | | | | | | | |
| | | | Trading Companies & | | | | | | | | |
| | | | Distributors - 4.4% | | | | | | | | |
| | 6,733 | | Herc Holdings, Inc. | | | 1,145,373 | | | | 1,054,051 | |
| | 32,735 | | Titan Machinery, Inc.* | | | 874,473 | | | | 1,102,842 | |
| | | | | | | | | | | | |
| | | | Trucking - 5.3% | | | | | | | | |
| | 11,863 | | ArcBest Corp. | | | 987,321 | | | | 1,421,781 | |
| | 116,834 | | Daseke, Inc.* | | | 953,300 | | | | 1,173,013 | |
| | | | Total Industrials | | | 10,271,456 | | | | 14,316,823 | |
| | | | | | | | | |
| INFORMATION TECHNOLOGY | | | | | | | | |
| | | | | | | | | | | | |
| | | | Application Software - 3.7% | | | | | | | | |
| | 35,809 | | Clear Secure, Inc., Class A+* | | | 1,027,603 | | | | 1,123,328 | |
| | 55,022 | | Voyager Digital Ltd.* | | | 240,294 | | | | 686,675 | |
| | | | | | | | | | | | |
| | | | Communications | | | | | | | | |
| | | | Equipment - 2.5% | | | | | | | | |
| | 15,421 | | Calix, Inc.* | | | 322,190 | | | | 1,233,217 | |
| | | | | | | | | | | | |
| | | | Electronic Equipment & | | | | | | | | |
| | | | Instruments - 3.2% | | | | | | | | |
| | 55,927 | | Identiv, Inc.* | | | 884,380 | | | | 1,573,786 | |
| | | | | | | | | | | | |
| | | | IT Consulting & | | | | | | | | |
| | | | Other Services - 2.1% | | | | | | | | |
| | 135,786 | | Information Services | | | | | | | | |
| | | | Group, Inc. | | | 1,042,039 | | | | 1,034,689 | |
| | | | | | | | | | | | |
| | | | Semiconductor | | | | | | | | |
| | | | Equipment - 6.0% | | | | | | | | |
| | 7,024 | | ACM Research, Inc., Class A* | | | 539,696 | | | | 598,936 | |
| | 16,205 | | Axcelis Technologies, Inc.* | | | 1,027,326 | | | | 1,208,245 | |
| | 19,860 | | Ultra Clean Holdings, Inc.* | | | 1,000,362 | | | | 1,139,170 | |
| | | | | | | | | | | | |
| | | | Semiconductors - 13.0% | | | | | | | | |
| | 15,154 | | Alpha & Omega | | | | | | | | |
| | | | Semiconductor Ltd.* | | | 475,982 | | | | 917,726 | |
| | 164,844 | | Pixelworks, Inc.* | | | 533,697 | | | | 725,314 | |
| | 11,654 | | Semtech Corp.* | | | 911,915 | | | | 1,036,390 | |
| | 14,472 | | Silicon Motion | | | | | | | | |
| | | | Technology Corp. - ADR | | | 1,035,401 | | | | 1,375,274 | |
| | 3,653 | | SiTime Corp.* | | | 471,674 | | | | 1,068,649 | |
| | 17,546 | | SMART Global | | | | | | | | |
| | | | Holdings, Inc.* | | | 1,038,105 | | | | 1,245,590 | |
| | | | | | | | | | | | |
| | | | Technology Hardware, | | | | | | | | |
| | | | Storage & Peripherals - 2.3% | | | | | | | | |
| | 45,446 | | Stratasys Ltd.* | | | 1,062,441 | | | | 1,112,972 | |
| | | | Total Information Technology | | | 11,613,105 | | | | 16,079,961 | |
| | | | | | | | | | | | |
| | | | Total Common Stocks | | | 36,437,158 | | | | 47,125,755 | |
See Notes to the Financial Statements.
Friess Small Cap Growth Fund
Schedule of Investments (Continued)
December 31, 2021
| Shares | | | | Cost | | | Value | |
| Short-Term Investment - 4.0% | | | | | | |
| | | | | | | | | |
| | | Money Market | | | | | | |
| | | Deposit Account - 4.0% | | | | | | |
| | 1,942,857 | | U.S. Bank N.A., 0.00%^ | | $ | 1,942,857 | | | $ | 1,942,857 | |
| | | | Total Money Market | | | | | | | | |
| | | | Deposit Account | | | 1,942,857 | | | | 1,942,857 | |
| | | | | | | | | | | | |
| | | | Total Short-Term Investment | | | 1,942,857 | | | | 1,942,857 | |
| | | | | | | | | | | | |
| Investment Purchased | | | | | | | | |
| With The Cash Proceeds | | | | | | | | |
| From Securities Lending - 8.6% | | | | | | | | |
| | | | | | | | | | | | |
| | | | Investment Company - 8.6% | | | | | | | | |
| | 4,229,384 | | Mount Vernon Liquid Asset | | | | | | | | |
| | | | Portfolio, LLC, 0.12%# | | | 4,229,384 | | | | 4,229,384 | |
| | | | Total Investment Company | | | 4,229,384 | | | | 4,229,384 | |
| | | | | | | | | | | | |
| | | | Total Investment Purchased | | | | | | | | |
| | | | with the Cash Proceeds | | | | | | | | |
| | | | from Securities Lending | | | 4,229,384 | | | | 4,229,384 | |
| | | | | | | | | | | | |
| | | | Total Investments - 108.8% | | $ | 42,609,399 | | | | 53,297,996 | |
| | | | Other Assets & | | | | | | | | |
| | | | Liabilities, Net - (8.8)% | | | | | | | (4,327,520 | ) |
| | | | TOTAL NET | | | | | | | | |
| | | | ASSETS - 100.0% | | | | | | $ | 48,970,476 | |
ADR - American Depositary Receipt
| * | Non Income Producing. |
| + | All or a portion of this security was out on loan at December 31, 2021. Total loaned securities had a market value of $4,069,916 at December 31, 2021. |
| ^ | The Money Market Deposit Account (“MMDA”) is a short-term investment vehicle in which the Fund holds cash balances. The MMDA will bear interest at a variable rate that is determined based on conditions and may change daily and by any amount. The rate shown is as of December 31, 2021. |
| # | The rate shown is the annualized seven day effective yield as of December 31, 2021. |
See Notes to the Financial Statements.
Friess Brandywine Fund
Portfolio Characteristics as of December 31, 2021 (Unaudited)
Top Ten Equity Holdings(1)
Security Name | % of Net Assets | % Change from Book Cost |
| Hub Group, Inc., Class A | | | 2.8 | % | | | | 22.2 | % | |
| ArcBest Corp. | | | 2.7 | % | | | | 40.7 | % | |
| Silicon Motion Technology Corp. - ADR | | | 2.7 | % | | | | 33.0 | % | |
| Marvell Technology, Inc. | | | 2.7 | % | | | | 45.6 | % | |
| Amazon.com, Inc. | | | 2.6 | % | | | | -4.7 | % | |
| Titan Machinery, Inc. | | | 2.6 | % | | | | 14.4 | % | |
| Cavco Industries, Inc. | | | 2.6 | % | | | | 27.8 | % | |
| The Trade Desk, Inc., Class A | | | 2.5 | % | | | | 15.1 | % | |
| Kornit Digital Ltd. | | | 2.4 | % | | | | 15.8 | % | |
| Academy Sports & Outdoors, Inc. | | | 2.4 | % | | | | 10.3 | % | |
| Top Ten as a Group | | | 26.0 | % | | | | | | |
Top Ten Industry Groups(1)
(1) | Fund holdings and sector allocations are subject to change at any time and are not recommendations to buy or sell any security. |
(2) | Includes money market deposit account. |
Friess Brandywine Fund
December Quarter “Roses & Thorns” (Unaudited)
| | $ Gain | | | | |
| Biggest $ Winners | (in thousands) | % Gain | | Reasons for Move | |
Calix Inc. (CALX) | $83 | 36.2 | | Calix, which makes broadband access equipment used by communications service providers, reported record third-quarter revenue and expectation-beating earnings. “We start the fourth quarter of 2021 in the strongest financial position in our history with robust bookings, clear customer and product focus and believe we are perfectly placed to execute on the opportunity ahead,” the company stated in its release. | |
Marvell Technology Inc. (MRVL) | $77 | 40.5 | | The semiconductor manufacturer exceeded expectations for its fiscal third quarter, reporting record revenue, raising fourth-quarter guidance and sharing encouraging longer-term commentary. Marvell shares posted their largest single-day percentage gain in 13 years on the day of the company’s earnings report. | |
Ford Motor Co. (F) | $65 | 19.3 | | The automaker’s shares rose on enthusiasm surrounding the company’s fully electric F-150 Lightning pickup truck. Ford received so many reservations for the truck, which becomes available in 2022, that the company announced it would double its planned production to 150,000 units per year. The company also increased production of its Mustang Mach-E electric SUV. Ford exceeded the third-quarter consensus earnings estimate by 86 percent. | |
SiTime Corp. (SITM) | $62 | 34.0 | | The company, which makes silicon-based timing solutions used in computing devices, graphics cards and mobile phones, among other applications, exceeded third-quarter expectations with 93 percent revenue growth. SiTime also became a component company in the S&P MidCap 400 Index at the end of November. | |
Advanced Micro Devices Inc. (AMD) | $61 | 34.8 | | The semiconductor manufacturer grew third-quarter earnings and revenue 78 percent and 54 percent, respectively, exceeded consensus expectations in both instances. Data center sales were a highlight, more than doubling on a year-over-year basis. The company also raised guidance for the fourth quarter. | |
| | | | | | |
| | $ Loss | | | | |
| Biggest $ Losers | (in thousands) | % Loss | | Reasons for Move | |
Kirkland’s Inc. (KIRK) | $67 | 43.0 | | The home accessories retailer fell short of third-quarter earnings and revenue expectations due to softer-than-expected sales in the quarter’s final weeks. Citing supply chain headwinds, labor constraints and choppy sales patterns, Kirkland’s also tempered its fourth-quarter guidance. | |
Affirm Holdings Inc. (AFRM) | $51 | 35.1 | | Although shares traded higher following better-than-expected sales results for the September quarter, a subsequent convertible debt offering in November was unpopular with investors. Additionally, shares came under pressure as consumer advocacy groups focused on potential downsides to “buy now pay later” platforms. | |
Proto Labs Inc. (PRLB) | $39 | 20.2 | | Proto Labs, which makes prototypes and low-volume production parts using 3-D printing, CNC machining, sheet metal fabrication and injection molding, reported record third-quarter revenue, but lower-than-expected earnings as its gross profit margin narrowed on a year-over-year basis. The company’s chief financial officer resigned in November to join another firm. | |
DoorDash Inc. (DASH) | $39 | 26.7 | | Shares retreated from their highs in November following a benefits-related settlement with San Francisco drivers and selling among company insiders. The delivery service provider also came under pressure with other growth stocks when Fed Chairman Jerome Powell indicated that the central bank may accelerate the timeline for tapering its bond purchasing initiative. | |
Magnite Inc. (MGNI) | $34 | 37.4 | | The company, which operates a digital ad buying platform, explained that its in-line results for the third quarter were negatively impacted by stalled supply chains among customers, soft travel-related spending and comparisons to year-ago results boosted by political advertising. Shares declined as investors concluded those headwinds were likely to persist. | |
All gains/losses are calculated on an average cost basis from September 30, 2021 through December 31, 2021.
This commentary reflects the viewpoints of Friess Associates, LLC as of December 31, 2021, and is not intended as a forecast or guarantee of future results.
Friess Brandywine Fund
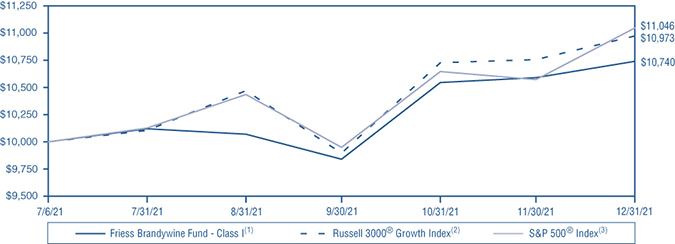
Value of $10,000 Investment (Unaudited)
The chart assumes an initial investment of $10,000. Performance reflects waivers of fee and operating expenses in effect. In the absence of such waivers, total return would be reduced. Past performance is not predictive of future performance. Investment return and principal value will fluctuate, so that your shares, when redeemed, may be worth more or less than their original cost. Performance current to the most recent month-end may be lower or higher than the performance quoted and can be obtained by calling 855-656-3017. Performance assumes the reinvestment of capital gains and income distributions. The performance does not reflect deduction of taxes that a shareholder would pay on Fund distributions or the redemption of Fund shares.
| | Since Inception |
Class I(1) | 7.40% |
Russell 3000® Growth Index(2) | 9.73% |
S&P 500® Index(3) | 10.46% |
(1) | Fund commenced operations on July 6, 2021. |
(2) | Russell 3000® Growth Index measures the performance of those Russell 3000® Index companies with higher price-to-book ratios and higher forecasted growth values. The stocks in this index are also members of either the Russell 1000® Growth or the Russell 2000® Growth indexes. Unlike the Fund, the Russell 3000® Growth Index is unmanaged, is not available for investment, and does not incur expenses. |
(3) | The S&P 500® Index widely regarded as the best single gauge of the U.S. equities market, this index includes a representative sample of 500 leading companies in leading industries of the U.S. economy. Although the S&P 500® focuses on the large-cap segment of the market, with over 80% coverage of U.S. equities, it is also an ideal proxy for the total market. Unlike the Fund, the S&P 500® Index is unmanaged, is not available for investment, and does not incur expenses. |
The performance shown represents past performance and is not a guarantee of future results. Current performance may be lower or higher than the performance data quoted. The investment return and principal value of an investment will fluctuate so that an investor’s shares, when redeemed, may be worth more or less than their original cost. From time to time, the Investment Adviser has waived fees or reimbursed expenses, which may have resulted in higher returns. The listed Fund returns are net of expenses, and the listed index returns exclude expenses. Inception date for “Since Inception” performance is July 6, 2021. Operating expenses (gross) are 1.15% for the Fund’s Class I. Total operating expenses (net) are 1.00%, due to the Adviser’s contractual agreement, through at least July 1, 2022, to waive its management fees and/or pay Fund expenses. Fund returns would be lower if the gross expense ratio was reflected. For the most recent month-end performance, please visit the Fund’s website at www.friessfunds.com.
The actual expense ratio applicable to investors, as disclosed in the Financial Highlights for the period ended December 31, 2021, was 1.00% for Class I.
Friess Brandywine Fund
Schedule of Investments
December 31, 2021
| Shares | | | | Cost | | | Value | |
| Common Stocks - 98.5% | | | | | | |
| | | | | | | |
| COMMUNICATION SERVICES | | | | | | |
| | | | | | | | | |
| | | Advertising - 0.7% | | | | | | |
| | 3,213 | | Magnite, Inc.* | | $ | 100,606 | | | $ | 56,228 | |
| | | | | | | | | | | | |
| | | | Interactive Home | | | | | | | | |
| | | | Entertainment - 3.4% | | | | | | | | |
| | 754 | | Electronic Arts, Inc. | | | 105,040 | | | | 99,453 | |
| | 1,578 | | ROBLOX Corp., Class A* | | | 172,932 | | | | 162,786 | |
| | | | | | | | | | | | |
| | | | Movies & Entertainment - 3.3% | | | | | | | | |
| | 214 | | Netflix, Inc.* | | | 120,717 | | | | 128,922 | |
| | 567 | | Spotify Technology SA* | | | 130,136 | | | | 132,695 | |
| | | | Total Communication Services | | | 629,431 | | | | 580,084 | |
| | | | | | | | | |
| CONSUMER DISCRETIONARY | | | | | | | | |
| | | | | | | | | | | | |
| | | | Apparel Retail - 2.0% | | | | | | | | |
| | 6,174 | | American Eagle | | | | | | | | |
| | | | Outfitters, Inc. | | | 153,500 | | | | 156,326 | |
| | | | | | | | | | | | |
| | | | Automobile | | | | | | | | |
| | | | Manufacturers - 1.8% | | | | | | | | |
| | 6,800 | | Ford Motor Co. | | | 134,911 | | | | 141,236 | |
| | | | | | | | | | | | |
| | | | Automotive Retail - 1.7% | | | | | | | | |
| | 1,265 | | Penske Automotive | | | | | | | | |
| | | | Group, Inc. | | | 103,345 | | | | 135,633 | |
| | | | | | | | | | | | |
| | | | Education Services - 1.8% | | | | | | | | |
| | 8,608 | | Houghton Mifflin | | | | | | | | |
| | | | Harcourt Co.* | | | 141,728 | | | | 138,589 | |
| | | | | | | | | | | | |
| | | | Footwear - 2.0% | | | | | | | | |
| | 1,192 | | Crocs, Inc.* | | | 150,822 | | | | 152,838 | |
| | | | | | | | | | | | |
| | | | Home Improvement | | | | | | | | |
| | | | Retail - 2.1% | | | | | | | | |
| | 1,240 | | Floor & Decor | | | | | | | | |
| | | | Holdings, Inc., Class A* | | | 142,513 | | | | 161,212 | |
| | | | | | | | | | | | |
| | | | Homebuilding - 4.3% | | | | | | | | |
| | 626 | | Cavco Industries, Inc.* | | | 155,620 | | | | 198,849 | |
| | 1,085 | | Hovnanian Enterprises, | | | | | | | | |
| | | | Inc., Class A* | | | 105,369 | | | | 138,110 | |
| | | | | | | | | | | | |
| | | | Hotels, Resorts & | | | | | | | | |
| | | | Cruise Lines - 2.1% | | | | | | | | |
| | 68 | | Booking Holdings, Inc.* | | | 150,193 | | | | 163,148 | |
| | | | | | | | | | | | |
| | | | Internet & Direct | | | | | | | | |
| | | | Marketing Retail - 3.9% | | | | | | | | |
| | 61 | | Amazon.com, Inc.* | | | 213,481 | | | | 203,395 | |
| | 692 | | DoorDash, Inc., Class A* | | | 131,732 | | | | 103,039 | |
| | | | | | | | | | | | |
| | | | Leisure Products - 1.4% | | | | | | | | |
| | 1,358 | | YETI Holdings, Inc.* | | | 126,391 | | | | 112,483 | |
| | | | | | | | | | | | |
| | | | Specialty Stores - 2.4% | | | | | | | | |
| | 4,306 | | Academy Sports & | | | | | | | | |
| | | | Outdoors, Inc.* | | | 171,425 | | | | 189,033 | |
| | | | Total Consumer Discretionary | | | 1,881,030 | | | | 1,993,891 | |
| HEALTH CARE | | | | | | | | |
| | | | | | | | | | | | |
| | | | Health Care Equipment - 1.3% | | | | | | | | |
| | 1,762 | | Cryoport, Inc.* | | | 109,468 | | | | 104,258 | |
| | | | | | | | | | | | |
| | | | Health Care Facilities - 2.0% | | | | | | | | |
| | 1,920 | | Tenet Healthcare Corp.* | | | 144,644 | | | | 156,845 | |
| | | | | | | | | | | | |
| | | | Health Care Services - 1.9% | | | | | | | | |
| | 1,984 | | Apollo Medical | | | | | | | | |
| | | | Holdings, Inc.* | | | 135,509 | | | | 145,784 | |
| | | | | | | | | | | | |
| | | | Health Care Supplies - 1.3% | | | | | | | | |
| | 3,704 | | Figs, Inc., Class A* | | | 141,821 | | | | 102,082 | |
| | | | | | | | | | | | |
| | | | Life Sciences Tools | | | | | | | | |
| | | | & Services - 4.0% | | | | | | | | |
| | 3,680 | | Avantor, Inc.* | | | 136,611 | | | | 155,075 | |
| | 236 | | Thermo Fisher Scientific, Inc. | | | 132,680 | | | | 157,469 | |
| | | | Total Health Care | | | 800,733 | | | | 821,513 | |
| | | | | | | | | |
| INDUSTRIALS | | | | | | | | |
| | | | | | | | | | | | |
| | | | Air Freight & Logistics - 2.8% | | | | | | | | |
| | 2,615 | | Hub Group, Inc., Class A* | | | 180,241 | | | | 220,288 | |
| | | | | | | | | | | | |
| | | | Building Products - 1.8% | | | | | | | | |
| | 1,530 | | Owens Corning | | | 134,640 | | | | 138,465 | |
| | | | | | | | | | | | |
| | | | Diversified Support | | | | | | | | |
| | | | Services - 1.7% | | | | | | | | |
| | 3,852 | | Driven Brands Holdings, Inc.* | | | 112,412 | | | | 129,504 | |
| | | | | | | | | | | | |
| | | | Industrial Machinery - 4.4% | | | | | | | | |
| | 1,380 | | EnPro Industries, Inc. | | | 148,365 | | | | 151,897 | |
| | 1,258 | | Kornit Digital Ltd.* | | | 165,402 | | | | 191,530 | |
| | | | | | | | | | | | |
| | | | Trading Companies & | | | | | | | | |
| | | | Distributors - 4.2% | | | | | | | | |
| | 812 | | Herc Holdings, Inc. | | | 138,233 | | | | 127,119 | |
| | 5,954 | | Titan Machinery, Inc.* | | | 175,366 | | | | 200,590 | |
| | | | | | | | | | | | |
| | | | Trucking - 2.7% | | | | | | | | |
| | 1,776 | | ArcBest Corp. | | | 151,324 | | | | 212,853 | |
| | | | Total Industrials | | | 1,205,983 | | | | 1,372,246 | |
| | | | | | | | | |
| INFORMATION TECHNOLOGY | | | | | | | | |
| | | | | | | | | | | | |
| | | | Application Software - 5.5% | | | | | | | | |
| | 206 | | Adobe, Inc.* | | | 124,015 | | | | 116,815 | |
| | 3,740 | | Clear Secure, Inc., Class A* | | | 107,172 | | | | 117,324 | |
| | 2,166 | | The Trade Desk, Inc., Class A* | | | 172,480 | | | | 198,492 | |
| | | | | | | | | | | | |
| | | | Communications | | | | | | | | |
| | | | Equipment - 2.4% | | | | | | | | |
| | 2,306 | | Calix, Inc.* | | | 105,994 | | | | 184,411 | |
| | | | | | | | | | | | |
| | | | Data Processing & | | | | | | | | |
| | | | Outsourced Services - 1.2% | | | | | | | | |
| | 899 | | Affirm Holdings, Inc.* | | | 140,186 | | | | 90,403 | |
| | | | | | | | | | | | |
| | | | Semiconductor | | | | | | | | |
| | | | Equipment - 8.9% | | | | | | | | |
| | 825 | | ACM Research, Inc., Class A* | | | 69,530 | | | | 70,348 | |
| | 941 | | Applied Materials, Inc. | | | 128,443 | | | | 148,076 | |
| | 2,206 | | Axcelis Technologies, Inc.* | | | 138,561 | | | | 164,479 | |
| | 1,027 | | Teradyne, Inc. | | | 119,738 | | | | 167,945 | |
| | 2,505 | | Ultra Clean Holdings, Inc.* | | | 132,618 | | | | 143,687 | |
| | | | | | | | | | | | |
| | | | Semiconductors - 15.3% | | | | | | | | |
| | 1,109 | | Advanced Micro Devices, Inc.* | | | 105,973 | | | | 159,585 | |
| | 1,343 | | Diodes, Inc.* | | | 145,005 | | | | 147,475 | |
| | 2,387 | | Marvell Technology, Inc. | | | 143,454 | | | | 208,838 | |
| | 1,617 | | Semtech Corp.* | | | 127,774 | | | | 143,800 | |
| | 2,213 | | Silicon Motion | | | | | | | | |
| | | | Technology Corp. - ADR | | | 158,159 | | | | 210,301 | |
See Notes to the Financial Statements.
Friess Brandywine Fund
Schedule of Investments (Continued)
December 31, 2021
| Shares | | | | Cost | | | Value | |
| Common Stocks - 98.5% (Continued) | | | | | | |
| | | | | | | |
| INFORMATION TECHNOLOGY (continued) | | | | | | |
| | | | | | | | | |
| | | Semiconductors - 15.3% (continued) | | | | | | |
| | 529 | | SiTime Corp.* | | $ | 79,399 | | | $ | 154,754 | |
| | 2,478 | | SMART Global | | | | | | | | |
| | | | Holdings, Inc.* | | | 146,591 | | | | 175,913 | |
| | | | | | | | | | | | |
| | | | Technology Hardware, | | | | | | | | |
| | | | Storage & Peripherals - 2.0% | | | | | | | | |
| | 6,452 | | Stratasys Ltd.* | | | 155,413 | | | | 158,010 | |
| | | | Total Information Technology | | | 2,300,505 | | | | 2,760,656 | |
| | | | | | | | | |
| MATERIALS | | | | | | | | |
| | | | | | | | | | | | |
| | | | Fertilizers & | | | | | | | | |
| | | | Agricultural Chemicals - 2.2% | | | | | | | | |
| | 4,464 | | The Mosaic Co. | | | 143,473 | | | | 175,390 | |
| | | | Total Materials | | | 143,473 | | | | 175,390 | |
| | | | | | | | | | | | |
| | | | Total Common Stocks | | | 6,961,155 | | | | 7,703,780 | |
| | | | | | | | | | | | |
| Short-Term Investment - 2.2% | | | | | | | | |
| | | | | | | | | | | | |
| | | | Money Market | | | | | | | | |
| | | | Deposit Account - 2.2% | | | | | | | | |
| | 171,103 | | U.S. Bank N.A., 0.00%^ | | | 171,103 | | | | 171,103 | |
| | | | Total Money Market | | | | | | | | |
| | | | Deposit Account | | | 171,103 | | | | 171,103 | |
| | | | | | | | | | | | |
| | | | Total Short-Term Investment | | | 171,103 | | | | 171,103 | |
| | | | | | | | | | | | |
| | | | Total Investments - 100.7% | | $ | 7,132,258 | | | | 7,874,883 | |
| | | | Other Assets & | | | | | | | | |
| | | | Liabilities, Net - (0.7)% | | | | | | | (51,213 | ) |
| | | | TOTAL NET | | | | | | | | |
| | | | ASSETS - 100.0% | | | | | | $ | 7,823,670 | |
ADR - American Depositary Receipt
| * | Non Income Producing. |
| ^ | The Money Market Deposit Account (“MMDA”) is a short-term investment vehicle in which the Fund holds cash balances. The MMDA will bear interest at a variable rate that is determined based on conditions and may change daily and by any amount. The rate shown is as of December 31, 2021. |
See Notes to the Financial Statements.
Friess Brandywine Blue Fund
Portfolio Characteristics as of December 31, 2021 (Unaudited)
Top Ten Equity Holdings(1)
Security Name | % of Net Assets | % Change from Book Cost |
| Applied Materials, Inc. | | | 3.8 | % | | | | 12.1 | % | |
| Thermo Fisher Scientific, Inc. | | | 3.8 | % | | | | 13.0 | % | |
| The Trade Desk, Inc., Class A | | | 3.8 | % | | | | 2.7 | % | |
| Tenet Healthcare Corp. | | | 3.7 | % | | | | 8.8 | % | |
| The Mosaic Co. | | | 3.6 | % | | | | 19.5 | % | |
| Penske Automotive Group, Inc. | | | 3.6 | % | | | | 21.0 | % | |
| Chesapeake Energy Corp. | | | 3.6 | % | | | | -1.6 | % | |
| ROBLOX Corp., Class A | | | 3.5 | % | | | | -10.3 | % | |
| Marvell Technology, Inc. | | | 3.4 | % | | | | 43.0 | % | |
| Electronic Arts, Inc. | | | 3.4 | % | | | | -3.9 | % | |
| Top Ten as a Group | | | 36.2 | % | | | | | | |
Top Ten Industry Groups(1)
(% of Net Assets)
(1) | Fund holdings and sector allocations are subject to change at any time and are not recommendations to buy or sell any security. |
(2) | Includes money market deposit account. |
Friess Brandywine Blue Fund
December Quarter “Roses & Thorns” (Unaudited)
| | $ Gain | | | | |
| Biggest $ Winners | (in thousands) | % Gain | | Reasons for Move | |
Marvell Technology Inc. (MRVL) | $57 | 33.1 | | The semiconductor manufacturer exceeded expectations for its fiscal third quarter, reporting record revenue, raising fourth-quarter guidance and sharing encouraging longer-term commentary. Marvell shares posted their largest single-day percentage gain in 13 years on the day of the company’s earnings report. | |
Teradyne Inc. (TER) | $51 | 29.7 | | The maker of semiconductor test systems grew September-quarter earnings 35 percent, beating the consensus estimate by 11 percent. Demand from foundry and logic customers was driven by increasing chip complexity as the trend toward smaller, more powerful chips continued. | |
Ford Motor Co. (F) | $46 | 17.6 | | The automaker’s shares rose on enthusiasm surrounding the company’s fully electric F-150 Lightning pickup truck. Ford received so many reservations for the truck, which becomes available in 2022, that the company announced it would double its planned production to 150,000 units per year. The company also increased production of its Mustang Mach-E electric SUV. Ford exceeded the third-quarter consensus earnings estimate by 86 percent. | |
Advanced Micro Devices Inc. (AMD) | $35 | 19.7 | | The semiconductor manufacturer grew third-quarter earnings and revenue 78 percent and 54 percent, respectively, exceeding consensus expectations in both instances. Data center sales were a highlight, more than doubling on a year-over-year basis. The company also raised guidance for the fourth quarter. | |
Pfizer Inc. (PFE) | $29 | 11.2 | | Already playing a leading role in vaccines, the global biopharmaceutical manufacturer announced in early November successful trial results for an oral antiviral treatment for Covid-19. The FDA issued emergency use authorization for the pill in late December. September-quarter earnings grew 86 percent, topping the consensus estimate by 24 percent. | |
| | | | | | |
| | $ Loss | | | | |
| Biggest $ Losers | (in thousands) | % Loss | | Reasons for Move | |
Affirm Holdings Inc. (AFRM) | $53 | 31.6 | | Although shares traded higher following better-than-expected sales results for the September quarter, a subsequent convertible debt offering in November was unpopular with investors. Additionally, shares came under pressure as consumer advocacy groups focused on potential downsides to “buy now pay later” platforms. | |
DoorDash Inc. (DASH) | $42 | 22.2 | | Shares retreated from their highs in November following a benefits-related settlement with San Francisco drivers and selling among company insiders. The delivery service provider also came under pressure with other growth stocks when Fed Chairman Jerome Powell indicated that the central bank may accelerate the timeline for tapering its bond purchasing initiative. | |
Roblox Corp. (RBLX) | $26 | 9.2 | | Shares of Roblox, which operates an online video game platform, declined after reporting estimated bookings for November of between $208 million and $211 million, up from $189 million to $192 million for October. Analysts expected more growth in November because October bookings were adversely affected by an outage over Halloween weekend. | |
Crocs Inc. (CROX) | $21 | 12.4 | | After reaching an all-time high in November, Crocs shares declined in December following the footwear company’s announcement that it intended to acquire the privately owned casual shoe brand Heydude for $2.5 billion. Investors raised questions about the price and the likelihood that Crocs would add debt to help finance the deal. | |
Adobe Inc. (ADBE) | $13 | 6.4 | | The graphics software company reported revenue and earnings growth of 20 percent and 14 percent, respectively, for its fiscal fourth quarter (the three months through December 3). Shares declined in response to the company’s fiscal 2022 guidance, which implied that revenue and earnings growth would slow to 13 percent and 10 percent. | |
All gains/losses are calculated on an average cost basis from September 30, 2021 through December 31, 2021.
This commentary reflects the viewpoints of Friess Associates, LLC as of December 31, 2021, and is not intended as a forecast or guarantee of future results.
Friess Brandywine Blue Fund
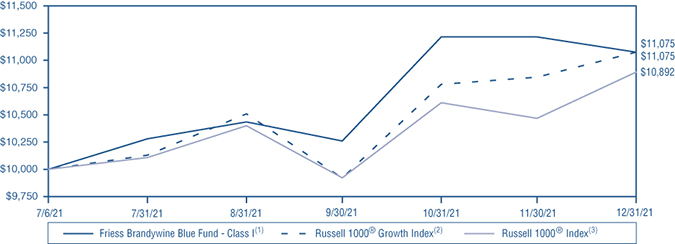
Value of $10,000 Investment (Unaudited)
The chart assumes an initial investment of $10,000. Performance reflects waivers of fee and operating expenses in effect. In the absence of such waivers, total return would be reduced. Past performance is not predictive of future performance. Investment return and principal value will fluctuate, so that your shares, when redeemed, may be worth more or less than their original cost. Performance current to the most recent month-end may be lower or higher than the performance quoted and can be obtained by calling 855-656-3017. Performance assumes the reinvestment of capital gains and income distributions. The performance does not reflect deduction of taxes that a shareholder would pay on Fund distributions or the redemption of Fund shares.
| | Since Inception |
Class I(1) | 10.75% |
Russell 1000® Growth Index(2) | 10.75% |
Russell 1000® Index(3) | 8.92% |
(1) | Fund commenced operations on July 6, 2021. |
(2) | The Russell 1000® Growth Index is a market capitalization weighted index that measures the performance of those Russell 1000® companies with higher price-to-book ratios and higher forecasted growth values. Unlike the Fund, the Russell 1000® Growth Index is unmanaged, is not available for investment, and does not incur expenses. |
(3) | The Russell 1000® Index measures the performance of the 1,000 largest companies in the Russell 3000® Index, which represents approximately 92% of the total market capitalization of the Russell 3000® Index. Unlike the Fund, the Russell 1000® Index is unmanaged, is not available for investment, and does not incur expenses. |
The performance shown represents past performance and is not a guarantee of future results. Current performance may be lower or higher than the performance data quoted. The investment return and principal value of an investment will fluctuate so that an investor’s shares, when redeemed, may be worth more or less than their original cost. From time to time, the Investment Adviser has waived fees or reimbursed expenses, which may have resulted in higher returns. The listed Fund returns are net of expenses, and the listed index returns exclude expenses. Inception date for “Since Inception” performance is July 6, 2021. Operating expenses (gross) are 1.15% for the Fund’s Class I. Total operating expenses (net) are 1.00%, due to the Adviser’s contractual agreement, through at least July 1, 2022, to waive its management fees and/or pay Fund expenses. Fund returns would be lower if the gross expense ratio was reflected. For the most recent month-end performance, please visit the Fund’s website at www.friessfunds.com.
The actual expense ratio applicable to investors, as disclosed in the Financial Highlights for the period ended December 31, 2021, was 1.00% for Class I.
Friess Brandywine Blue Fund
Schedule of Investments
December 31, 2021
| Shares | | | | Cost | | | Value | |
| Common Stocks - 97.8% | | | | | | |
| | | | | | | |
| COMMUNICATION SERVICES | | | | | | |
| | | | | | | | | |
| | | Interactive Home | | | | | | |
| | | Entertainment - 6.9% | | | | | | |
| | 1,392 | | Electronic Arts, Inc. | | $ | 190,973 | | | $ | 183,605 | |
| | 1,805 | | ROBLOX Corp., Class A* | | | 207,639 | | | | 186,204 | |
| | | | | | | | | | | | |
| | | | Movies & Entertainment - 6.2% | | | | | | | | |
| | 272 | | Netflix, Inc.* | | | 161,676 | | | | 163,864 | |
| | 716 | | Spotify Technology SA* | | | 169,616 | | | | 167,565 | |
| | | | Total Communication Services | | | 729,904 | | | | 701,238 | |
| | | | | | | | | |
| CONSUMER DISCRETIONARY | | | | | | | | |
| | | | | | | | | | | | |
| | | | Automobile Manufacturers - 3.1% | | | | | | | | |
| | 8,000 | | Ford Motor Co. | | | 158,718 | | | | 166,160 | |
| | | | | | | | | | | | |
| | | | Automotive Retail - 3.6% | | | | | | | | |
| | 1,793 | | Penske Automotive | | | | | | | | |
| | | | Group, Inc. | | | 158,834 | | | | 192,246 | |
| | | | | | | | | | | | |
| | | | Footwear - 2.4% | | | | | | | | |
| | 1,028 | | Crocs, Inc.* | | | 136,618 | | | | 131,810 | |
| | | | | | | | | | | | |
| | | | Home Improvement | | | | | | | | |
| | | | Retail - 2.9% | | | | | | | | |
| | 1,203 | | Floor & Decor | | | | | | | | |
| | | | Holdings, Inc., Class A* | | | 141,798 | | | | 156,402 | |
| | | | | | | | | | | | |
| | | | Hotels, Resorts & | | | | | | | | |
| | | | Cruise Lines - 3.3% | | | | | | | | |
| | 73 | | Booking Holdings, Inc.* | | | 160,558 | | | | 175,144 | |
| | | | | | | | | | | | |
| | | | Internet & Direct | | | | | | | | |
| | | | Marketing Retail - 5.9% | | | | | | | | |
| | 51 | | Amazon.com, Inc.* | | | 177,653 | | | | 170,051 | |
| | 981 | | DoorDash, Inc., Class A* | | | 179,928 | | | | 146,071 | |
| | | | | | | | | | | | |
| | | | Leisure Products - 3.1% | | | | | | | | |
| | 2,030 | | YETI Holdings, Inc.* | | | 187,717 | | | | 168,145 | |
| | | | Total Consumer Discretionary | | | 1,301,824 | | | | 1,306,029 | |
| | | | | | | | | |
| ENERGY | | | | | | | | |
| | | | | | | | | | | | |
| | | | Oil & Gas Exploration | | | | | | | | |
| | | | & Production - 3.6% | | | | | | | | |
| | 2,970 | | Chesapeake Energy Corp. | | | 194,833 | | | | 191,624 | |
| | | | Total Energy | | | 194,833 | | | | 191,624 | |
| | | | | | | | | |
| HEALTH CARE | | | | | | | | |
| | | | | | | | | | | | |
| | | | Health Care Facilities - 3.6% | | | | | | | | |
| | 2,408 | | Tenet Healthcare Corp.* | | | 180,798 | | | | 196,710 | |
| | | | | | | | | | | | |
| | | | Life Sciences Tools | | | | | | | | |
| | | | & Services - 7.1% | | | | | | | | |
| | 4,170 | | Avantor, Inc.* | | | 158,939 | | | | 175,724 | |
| | 307 | | Thermo Fisher Scientific, Inc. | | | 181,204 | | | | 204,842 | |
| | | | | | | | | | | | |
| | | | Pharmaceuticals - 3.0% | | | | | | | | |
| | 2,705 | | Pfizer, Inc. | | | 152,078 | | | | 159,730 | |
| | | | Total Health Care | | | 673,019 | | | | 737,006 | |
| | | | | | | | | |
| INDUSTRIALS | | | | | | | | |
| | | | | | | | | | | | |
| | | | Building Products - 3.2% | | | | | | | | |
| | 1,899 | | Owens Corning | | | 173,285 | | | | 171,860 | |
| | | | | | | | | | | | |
| | | | Construction & | | | | | | | | |
| | | | Engineering - 3.1% | | | | | | | | |
| | 4,030 | | WillScot Mobile Mini | | | | | | | | |
| | | | Holdings Corp., Class A* | | | 161,011 | | | | 164,585 | |
| | | | | | | | | | | | |
| | | | Industrial Machinery - 6.5% | | | | | | | | |
| | 2,700 | | Ingersoll Rand, Inc. | | | 154,993 | | | | 167,049 | |
| | 1,189 | | Kornit Digital Ltd.* | | | 166,051 | | | | 181,025 | |
| | | | Total Industrials | | | 655,340 | | | | 684,519 | |
| | | | | | | | | |
| INFORMATION TECHNOLOGY | | | | | | | | |
| | | | | | | | | | | | |
| | | | Application Software - 6.2% | | | | | | | | |
| | 230 | | Adobe, Inc.* | | | 140,490 | | | | 130,424 | |
| | 2,226 | | The Trade Desk, | | | | | | | | |
| | | | Inc., Class A* | | | 198,713 | | | | 203,990 | |
| | | | | | | | | | | | |
| | | | Data Processing & | | | | | | | | |
| | | | Outsourced Services - 1.2% | | | | | | | | |
| | 637 | | Affirm Holdings, Inc.* | | | 90,491 | | | | 64,057 | |
| | | | | | | | | | | | |
| | | | IT Consulting & | | | | | | | | |
| | | | Other Services - 3.0% | | | | | | | | |
| | 512 | | Globant SA* | | | 140,586 | | | | 160,814 | |
| | | | | | | | | | | | |
| | | | Semiconductor | | | | | | | | |
| | | | Equipment - 6.4% | | | | | | | | |
| | 1,308 | | Applied Materials, Inc. | | | 183,627 | | | | 205,827 | |
| | 862 | | Teradyne, Inc. | | | 101,098 | | | | 140,963 | |
| | | | | | | | | | | | |
| | | | Semiconductors - 6.7% | | | | | | | | |
| | 1,216 | | Advanced Micro | | | | | | | | |
| | | | Devices, Inc.* | | | 141,543 | | | | 174,982 | |
| | 2,122 | | Marvell Technology, Inc. | | | 129,793 | | | | 185,654 | |
| | | | Total Information Technology | | | 1,126,341 | | | | 1,266,711 | |
| | | | | | | | | |
| MATERIALS | | | | | | | | |
| | | | | | | | | | | | |
| | | | Copper - 3.2% | | | | | | | | |
| | 4,102 | | Freeport-McMoRan, Inc. | | | 149,916 | | | | 171,177 | |
| | | | | | | | | | | | |
| | | | Fertilizers & Agricultural | | | | | | | | |
| | | | Chemicals - 3.6% | | | | | | | | |
| | 4,897 | | The Mosaic Co. | | | 160,985 | | | | 192,403 | |
| | | | Total Materials | | | 310,901 | | | | 363,580 | |
| | | | | | | | | | | | |
| | | | Total Common Stocks | | | 4,992,162 | | | | 5,250,707 | |
| | | | | | | | | | | | |
| Short-Term Investment - 4.8% | | | | | | | | |
| | | | | | | | | | | | |
| | | | Money Market Deposit Account - 4.8% | | | | | | | | |
| | 260,026 | | U.S. Bank N.A., 0.00%^ | | | 260,026 | | | | 260,026 | |
| | | | Total Money Market | | | | | | | | |
| | | | Deposit Account | | | 260,026 | | | | 260,026 | |
| | | | | | | | | | | | |
| | | | Total Short-Term Investment | | | 260,026 | | | | 260,026 | |
| | | | | | | | | | | | |
| | | | Total Investments - 102.6% | | $ | 5,252,188 | | | | 5,510,733 | |
| | | | Other Assets & | | | | | | | | |
| | | | Liabilities, Net - (2.6)% | | | | | | | (140,328 | ) |
| | | | TOTAL NET | | | | | | | | |
| | | | ASSETS - 100.0% | | | | | | $ | 5,370,405 | |
| * | Non Income Producing. |
| ^ | The Money Market Deposit Account (“MMDA”) is a short-term investment vehicle in which the Fund holds cash balances. The MMDA will bear interest at a variable rate that is determined based on conditions and may change daily and by any amount. The rate shown is as of December 31, 2021. |
See Notes to the Financial Statements.
Friess Funds
Statements of Assets and Liabilities
December 31, 2021
| | | Friess | | | Friess | | | Friess | |
| | | Small Cap | | | Brandywine | | | Brandywine | |
| | | Growth Fund | | | Fund | | | Blue Fund | |
| Assets: | | | | | | | | | |
| Investments at value* (Including securities on loan | | | | | | | | | |
| valued at $4,069,916, $0 and $0, respectively) | | $ | 53,297,996 | | | $ | 7,874,883 | | | $ | 5,510,733 | |
| Securities lending income receivable | | | 1,619 | | | | — | | | | — | |
| Dividends & interest receivable | | | 2,687 | | | | 61 | | | | 80 | |
| Receivable from investment adviser | | | — | | | | 2,138 | | | | 2,761 | |
| Prepaid expenses | | | 12,311 | | | | 16,168 | | | | 15,617 | |
| Total assets | | | 53,314,613 | | | | 7,893,250 | | | | 5,529,191 | |
| | | | | | | | | | | | | |
| Liabilities: | | | | | | | | | | | | |
| Payable for securities loaned | | | 4,229,384 | | | | — | | | | — | |
| Payable for investment securities purchased | | | — | | | | — | | | | 91,274 | |
| Payable to investment adviser | | | 23,166 | | | | — | | | | — | |
| Payable for fund administration & accounting fees | | | 24,082 | | | | 23,403 | | | | 23,507 | |
| Payable for compliance fees | | | 2,915 | | | | 2,912 | | | | 2,912 | |
| Payable for transfer agent fees & expenses | | | 14,104 | | | | 4,795 | | | | 4,422 | |
| Payable for custody fees | | | 1,240 | | | | 789 | | | | 714 | |
| Payable for trustee fees | | | 4,471 | | | | 4,475 | | | | 4,475 | |
| Payable for audit fees | | | 20,002 | | | | 19,996 | | | | 19,996 | |
| Accrued distribution & shareholder servicing fees | | | 7,567 | | | | 4,065 | | | | 2,259 | |
| Accrued legal fees | | | 10,439 | | | | 7,498 | | | | 7,498 | |
| Accrued other expenses | | | 6,767 | | | | 1,647 | | | | 1,729 | |
| Total liabilities | | | 4,344,137 | | | | 69,580 | | | | 158,786 | |
| | | | | | | | | | | | | |
| Net Assets | | $ | 48,970,476 | | | $ | 7,823,670 | | | $ | 5,370,405 | |
| | | | | | | | | | | | | |
| Net Assets Consist Of: | | | | | | | | | | | | |
| Paid-in capital | | $ | 37,965,795 | | | $ | 7,291,732 | | | $ | 5,096,353 | |
| Total distributable earnings | | | 11,004,681 | | | | 531,938 | | | | 274,052 | |
| Net Assets | | $ | 48,970,476 | | | $ | 7,823,670 | | | $ | 5,370,405 | |
| | | | | | | | | | | | | |
| Calculation of net asset value per share: | | | | | | | | | | | | |
| Institutional Class/Class I: | | | | | | | | | | | | |
| Net assets | | $ | 47,411,539 | | | $ | 7,823,670 | | | $ | 5,370,405 | |
Shares issued and outstanding(1) | | | 1,396,089 | | | | 364,248 | | | | 242,500 | |
| Net asset value, offering and redemption price per share | | $ | 33.96 | | | $ | 21.48 | | | $ | 22.15 | |
| | | | | | | | | | | | | |
| Investor Class: | | | | | | | | | | | | |
| Net assets | | $ | 1,558,937 | | | | — | | | | — | |
Shares issued and outstanding(1) | | | 46,550 | | | | — | | | | — | |
| Net asset value, offering and redemption price per share | | $ | 33.49 | | | | — | | | | — | |
| | | | | | | | | | | | | |
| * Investments at cost | | $ | 42,609,399 | | | $ | 7,132,258 | | | $ | 5,252,188 | |
(1) | Unlimited shares authorized without par value. |
See Notes to the Financial Statements.
Friess Funds
Statements of Operations
For the Year Ended December 31, 2021
| | | Friess | | | Friess | | | Friess | |
| | | Small Cap | | | Brandywine | | | Brandywine | |
| | | Growth Fund | | | Fund | | | Blue Fund | |
| Investment Income: | | | | | | | | | |
| Dividend income | | $ | 124,603 | | | $ | 8,001 | | | $ | 6,618 | |
| Securities lending income, net | | | 42,692 | | | | — | | | | — | |
| Interest income | | | 9 | | | | 2 | | | | 1 | |
| Total investment income | | | 167,304 | | | | 8,003 | | | | 6,619 | |
| | | | | | | | | | | | | |
| Expenses: | | | | | | | | | | | | |
| Investment adviser fees (See Note 4) | | | 467,654 | | | | 22,050 | | | | 12,500 | |
| Fund administration & accounting fees (See Note 4) | | | 100,212 | | | | 47,368 | | | | 47,313 | |
| Transfer agent fees & expenses (See Note 4) | | | 59,306 | | | | 10,946 | | | | 10,231 | |
| Federal & state registration fees | | | 36,974 | | | | 11,089 | | | | 10,839 | |
| Audit fees | | | 20,006 | | | | 20,303 | | | | 20,303 | |
| Trustee fees | | | 17,650 | | | | 9,142 | | | | 9,142 | |
| Custody fees (See Note 4) | | | 16,490 | | | | 4,876 | | | | 3,688 | |
| Postage and printing fees | | | 14,610 | | | | 1,497 | | | | 1,497 | |
| Compliance fees (See Note 4) | | | 13,330 | | | | 5,667 | | | | 5,667 | |
| Legal fees | | | 9,277 | | | | 7,498 | | | | 7,498 | |
| Other expenses | | | 3,729 | | | | 2,003 | | | | 2,003 | |
| Insurance fees | | | 1,923 | | | | — | | | | — | |
| Distribution and/or shareholder servicing fees (See Note 5) | | | | | | | | | | | | |
| Institutional Class/Class I | | | 26,918 | | | | 4,065 | | | | 2,259 | |
| Investor Class | | | 2,487 | | | | — | | | | — | |
| Total expenses before waiver | | | 790,566 | | | | 146,504 | | | | 132,940 | |
| Less: waiver/reimbursement from | | | | | | | | | | | | |
| investment adviser (See Note 4) | | | (227,566 | ) | | | (117,104 | ) | | | (116,274 | ) |
| Net expenses | | | 563,000 | | | | 29,400 | | | | 16,666 | |
| Net investment loss | | | (395,696 | ) | | | (21,397 | ) | | | (10,047 | ) |
| | | | | | | | | | | | | |
| Realized and Unrealized Gain (Loss) on Investments: | | | | | | | | | | | | |
| Net realized gain (loss) on investments | | | 14,590,858 | | | | (210,687 | ) | | | 19,022 | |
| Net change in unrealized appreciation/depreciation on investments | | | (990,620 | ) | | | 742,625 | | | | 258,545 | |
| Net realized and unrealized gain on investments | | | 13,600,238 | | | | 531,938 | | | | 277,567 | |
| Net increase in net assets resulting from operations | | $ | 13,204,542 | | | $ | 510,541 | | | $ | 267,520 | |
See Notes to the Financial Statements.
Friess Small Cap Growth Fund
Statements of Changes in Net Assets
| | | For the | | | For the | |
| | | Year Ended | | | Year Ended | |
| | | December 31, 2021 | | | December 31, 2020 | |
| Operations: | | | | | | |
| Net investment loss | | $ | (395,696 | ) | | $ | (569,779 | ) |
| Net realized gain (loss) on investments | | | 14,590,858 | | | | (7,194,061 | ) |
| Net change in unrealized appreciation/depreciation on investments | | | (990,620 | ) | | | (18,900,647 | ) |
| Net increase (decrease) in net assets resulting from operations | | | 13,204,542 | | | | (26,664,487 | ) |
| | | | | | | | | |
| Capital Share Transactions: | | | | | | | | |
| Institutional Class: | | | | | | | | |
| Proceeds from shares sold | | | 5,414,822 | | | | 1,229,030 | |
| Proceeds from reinvestment of distributions | | | 6,505,963 | | | | — | |
Payments for redemption-in-kind(1) | | | — | | | | (81,125,571 | ) |
| Payments for shares redeemed | | | (13,025,832 | ) | | | (12,434,025 | ) |
| Decrease in net assets from | | | | | | | | |
| Institutional Class transactions | | | (1,105,047 | ) | | | (92,330,566 | ) |
| Investor Class: | | | | | | | | |
| Proceeds from shares sold | | | 1,673,848 | | | | 30,800 | |
| Proceeds from reinvestment of distributions | | | 213,369 | | | | — | |
| Payments for shares redeemed | | | (439,837 | ) | | | (81,060 | ) |
| Increase (Decrease) in net assets from | | | | | | | | |
| Investor Class transactions | | | 1,447,380 | | | | (50,260 | ) |
| | | | | | | | | |
| Net increase (decrease) in net assets resulting | | | | | | | | |
| from capital share transactions | | | 342,333 | | | | (92,380,826 | ) |
| | | | | | | | | |
| Distributions to shareholders: | | | | | | | | |
| Institutional Class | | | (6,578,359 | ) | | | — | |
| Investor Class | | | (214,954 | ) | | | — | |
| Total distributions to shareholders | | | (6,793,313 | ) | | | — | |
| | | | | | | | | |
| Total increase (decrease) in net assets | | | 6,753,562 | | | | (119,045,313 | ) |
| | | | | | | | | |
| Net Assets: | | | | | | | | |
| Beginning of year | | | 42,216,914 | | | | 161,262,227 | |
| End of year | | $ | 48,970,476 | | | $ | 42,216,914 | |
(1) | Comprised of investments at fair value of $73,501,280 and cash of $7,624,291. |
See Notes to the Financial Statements.
Friess Brandywine Fund
Statement of Changes in Net Assets
| | | For the Period | |
| | | Inception(1) Through | |
| | | December 31, 2021 | |
| Operations: | | | |
| Net investment loss | | $ | (21,397 | ) |
| Net realized loss on investments | | | (210,687 | ) |
| Net change in unrealized appreciation/depreciation on investments | | | 742,625 | |
| Net increase in net assets resulting from operations | | | 510,541 | |
| | | | | |
| Capital Share Transactions: | | | | |
| Class I: | | | | |
| Proceeds from shares sold | | | 7,986,651 | |
| Proceeds from reinvestment of distributions | | | — | |
| Payments for shares redeemed | | | (673,522 | ) |
| Net increase in net assets resulting from capital share transactions | | | 7,313,129 | |
| | | | | |
| Distributions to shareholders: | | | | |
| Class I | | | — | |
| Total distributions to shareholders | | | — | |
| | | | | |
| Total increase in net assets | | | 7,823,670 | |
| | | | | |
| Net Assets: | | | | |
| Beginning of period | | | — | |
| End of period | | $ | 7,823,670 | |
(1) | Inception date of the Fund was July 6, 2021. |
See Notes to the Financial Statements.
Friess Brandywine Blue Fund
Statement of Changes in Net Assets
| | | For the Period | |
| | | Inception(1) Through | |
| | | December 31, 2021 | |
| Operations: | | | |
| Net investment loss | | $ | (10,047 | ) |
| Net realized gain on investments | | | 19,022 | |
| Net change in unrealized appreciation/depreciation on investments | | | 258,545 | |
| Net increase in net assets resulting from operations | | | 267,520 | |
| | | | | |
| Capital Share Transactions: | | | | |
| Class I: | | | | |
| Proceeds from shares sold | | | 5,363,538 | |
| Proceeds from reinvestment of distributions | | | — | |
| Payments for shares redeemed | | | (260,653 | ) |
| Net increase in net assets resulting from capital share transactions | | | 5,102,885 | |
| | | | | |
| Distributions to shareholders: | | | | |
| Class I | | | — | |
| Total distributions to shareholders | | | — | |
| | | | | |
| Total increase in net assets | | | 5,370,405 | |
| | | | | |
| Net Assets: | | | | |
| Beginning of period | | | — | |
| End of period | | $ | 5,370,405 | |
(1) | Inception date of the Fund was July 6, 2021. |
See Notes to the Financial Statements.
Friess Small Cap Growth Fund
Financial Highlights
For a Fund share outstanding throughout the periods
Institutional Class
| | | | | | | | | | | | | | | For the Period | |
| | | For the | | | For the | | | For the | | | For the | | | Inception(1) | |
| | | Year Ended | | | Year Ended | | | Year Ended | | | Year Ended | | | Through | |
| | | December 31, | | | December 31, | | | December 31, | | | December 31, | | | December 31, | |
| | | 2021 | | | 2020 | | | 2019 | | | 2018 | | | 2017 | |
| Per Share Data | | | | | | | | | | | | | | | |
| Net asset value, beginning of period | | $ | 30.10 | | | $ | 23.64 | | | $ | 20.22 | | | $ | 22.40 | | | $ | 20.00 | |
| | | | | | | | | | | | | | | | | | | | | |
| Investment operations: | | | | | | | | | | | | | | | | | | | | |
| Net investment loss | | | (0.31 | )(2) | | | (0.21 | )(2) | | | (0.14 | ) | | | (0.13 | ) | | | (0.06 | ) |
| Net realized and unrealized | | | | | | | | | | | | | | | | | | | | |
| gains on investments | | | 9.71 | | | | 6.67 | (3) | | | 3.58 | | | | 0.97 | | | | 3.20 | |
| Total from investment operations | | | 9.40 | | | | 6.46 | | | | 3.44 | | | | 0.84 | | | | 3.14 | |
| Less distributions from: | | | | | | | | | | | | | | | | | | | | |
| Net investment income | | | — | | | | — | | | | — | | | | — | | | | — | |
| Net realized gains | | | (5.54 | ) | | | — | | | | (0.02 | ) | | | (3.02 | ) | | | (0.74 | ) |
| Total distributions | | | (5.54 | ) | | | — | | | | (0.02 | ) | | | (3.02 | ) | | | (0.74 | ) |
| Net asset value, end of period | | $ | 33.96 | | | $ | 30.10 | | | $ | 23.64 | | | $ | 20.22 | | | $ | 22.40 | |
Total Return(4) | | | 32.68 | % | | | 27.33 | % | | | 17.02 | % | | | 4.78 | % | | | 15.68 | % |
| | | | | | | | | | | | | | | | | | | | | |
| Supplemental Data and Ratios | | | | | | | | | | | | | | | | | | | | |
| Net assets, end of period (in 000’s) | | $ | 47,411 | | | $ | 41,990 | | | $ | 161,039 | | | $ | 132,646 | | | $ | 96,627 | |
| Ratio of expenses to average net assets: | | | | | | | | | | | | | | | | | | | | |
Before expense waiver(5) | | | 1.69 | % | | | 1.52 | % | | | 1.23 | % | | | 1.24 | % | | | 1.35 | % |
After expense waiver(5) | | | 1.20 | % | | | 1.20 | % | | | 1.20 | % | | | 1.20 | % | | | 1.20 | % |
| | | | | | | | | | | | | | | | | | | | | |
| Ratio of net investment loss | | | | | | | | | | | | | | | | | | | | |
| to average net assets: | | | | | | | | | | | | | | | | | | | | |
After expense waiver(5) | | | (0.84 | )% | | | (0.93 | )% | | | (0.64 | )% | | | (0.62 | )% | | | (0.54 | )% |
Portfolio turnover rate(4) | | | 200 | % | | | 216 | %(6) | | | 205 | % | | | 220 | % | | | 126 | % |
(1) | Inception date of the Institutional Class was May 31, 2017. |
(2) | Per share amounts calculated using the average shares method. |
(3) | Realized and unrealized gains and losses per share in this caption are balancing amounts necessary to reconcile the change in net asset value per share for the period, and may not reconcile with the aggregate gains and losses in the Statement of Operations due to share transactions for the period. |
(4) | Not annualized for periods less than one year. |
(5) | Annualized for periods less than one year. |
(6) | Excludes value of Fund securities received or delivered as a result of in-kind redemptions of the Fund’s capital shares. |
See Notes to the Financial Statements.
Friess Small Cap Growth Fund
Financial Highlights
For a Fund share outstanding throughout the periods
Investor Class
| | | | | | | | | | | | | | | For the Period | |
| | | For the | | | For the | | | For the | | | For the | | | Inception(1) | |
| | | Year Ended | | | Year Ended | | | Year Ended | | | Year Ended | | | Through | |
| | | December 31, | | | December 31, | | | December 31, | | | December 31, | | | December 31, | |
| | | 2021 | | | 2020 | | | 2019 | | | 2018 | | | 2017 | |
| Per Share Data | | | | | | | | | | | | | | | |
| Net asset value, beginning of period | | $ | 29.81 | | | $ | 23.47 | | | $ | 20.13 | | | $ | 22.37 | | | $ | 20.00 | |
| | | | | | | | | | | | | | | | | | | | | |
| Investment operations: | | | | | | | | | | | | | | | | | | | | |
| Net investment loss | | | (0.40 | )(2) | | | (0.29 | )(2) | | | (0.20 | ) | | | (0.12 | ) | | | (0.07 | ) |
| Net realized and unrealized | | | | | | | | | | | | | | | | | | | | |
| gains on investments | | | 9.62 | | | | 6.63 | (3) | | | 3.56 | | | | 0.90 | | | | 3.18 | |
| Total from investment operations | | | 9.22 | | | | 6.34 | | | | 3.36 | | | | 0.78 | | | | 3.11 | |
| Less distributions from: | | | | | | | | | | | | | | | | | | | | |
| Net investment income | | | — | | | | — | | | | — | | | | — | | | | — | |
| Net realized gains | | | (5.54 | ) | | | — | | | | (0.02 | ) | | | (3.02 | ) | | | (0.74 | ) |
| Total distributions | | | (5.54 | ) | | | — | | | | (0.02 | ) | | | (3.02 | ) | | | (0.74 | ) |
| Net asset value, end of period | | $ | 33.49 | | | $ | 29.81 | | | $ | 23.47 | | | $ | 20.13 | | | $ | 22.37 | |
Total Return(4) | | | 32.39 | % | | | 27.01 | % | | | 16.70 | % | | | 4.51 | % | | | 15.53 | % |
| | | | | | | | | | | | | | | | | | | | | |
| Supplemental Data and Ratios | | | | | | | | | | | | | | | | | | | | |
| Net assets, end of period (in 000’s) | | $ | 1,559 | | | $ | 227 | | | $ | 223 | | | $ | 109 | | | $ | 39 | |
| Ratio of expenses to average net assets: | | | | | | | | | | | | | | | | | | | | |
Before expense waiver(5) | | | 1.98 | % | | | 1.98 | % | | | 1.49 | % | | | 1.48 | % | | | 1.59 | % |
After expense waiver(5) | | | 1.45 | % | | | 1.45 | % | | | 1.45 | % | | | 1.45 | % | | | 1.45 | % |
| | | | | | | | | | | | | | | | | | | | | |
| Ratio of net investment | | | | | | | | | | | | | | | | | | | | |
| loss to average net assets: | | | | | | | | | | | | | | | | | | | | |
After expense waiver(5) | | | (1.09 | )% | | | (1.31 | )% | | | (0.88 | )% | | | (0.87 | )% | | | (0.79 | )% |
Portfolio turnover rate(4) | | | 200 | % | | | 216 | %(6) | | | 205 | % | | | 220 | % | | | 126 | % |
(1) | Inception date of the Investor Class was May 31, 2017. |
(2) | Per share amounts calculated using the average shares method. |
(3) | Realized and unrealized gains and losses per share in this caption are balancing amounts necessary to reconcile the change in net asset value per share for the period, and may not reconcile with the aggregate gains and losses in the Statement of Operations due to share transactions for the period. |
(4) | Not annualized for periods less than one year. |
(5) | Annualized for periods less than one year. |
(6) | Excludes value of Fund securities received or delivered as a result of in-kind redemptions of the Fund’s capital shares. |
See Notes to the Financial Statements.
Friess Brandywine Fund
Financial Highlights
For a Fund share outstanding throughout the period
Class I
| | | For the Period | |
| | | Inception(1) | |
| | | Through | |
| | | December 31, | |
| | | 2021 | |
| Per Share Data | | | |
| Net asset value, beginning of period | | $ | 20.00 | |
| | | | | |
| Investment operations: | | | | |
Net investment loss(2) | | | (0.07 | ) |
| Net realized and unrealized gains on investments | | | 1.55 | |
| Total from investment operations | | | 1.48 | |
| Less distributions from: | | | | |
| Net investment income | | | — | |
| Net realized gains | | | — | |
| Total distributions | | | — | |
| Net asset value, end of period | | $ | 21.48 | |
Total Return(3) | | | 7.40 | % |
| | | | | |
| Supplemental Data and Ratios | | | | |
| Net assets, end of period (in 000’s) | | $ | 7,824 | |
| Ratio of expenses to average net assets: | | | | |
Before expense waiver/reimbursement(4) | | | 4.98 | % |
After expense waiver/reimbursement(4) | | | 1.00 | % |
| | | | | |
| Ratio of net investment loss to average net assets: | | | | |
After expense waiver/reimbursement(4) | | | (0.73 | )% |
Portfolio turnover rate(3) | | | 94 | % |
(1) | Inception date of the Fund was July 6, 2021. |
(2) | Per share amounts calculated using the average shares method. |
(3) | Not annualized for periods less than one year. |
(4) | Annualized for periods less than one year. |
See Notes to the Financial Statements.
Friess Brandywine Blue Fund
Financial Highlights
For a Fund share outstanding throughout the period
Class I
| | | For the Period | |
| | | Inception(1) | |
| | | Through | |
| | | December 31, | |
| | | 2021 | |
| Per Share Data | | | |
| Net asset value, beginning of period | | $ | 20.00 | |
| | | | | |
| Investment operations: | | | | |
Net investment loss(2) | | | (0.06 | ) |
| Net realized and unrealized gains on investments | | | 2.21 | |
| Total from investment operations | | | 2.15 | |
| Less distributions from: | | | | |
| Net investment income | | | — | |
| Net realized gains | | | — | |
| Total distributions | | | — | |
| Net asset value, end of period | | $ | 22.15 | |
Total Return(3) | | | 10.75 | % |
| | | | | |
| Supplemental Data and Ratios | | | | |
| Net assets, end of period (in 000’s) | | $ | 5,370 | |
| Ratio of expenses to average net assets: | | | | |
Before expense waiver/reimbursement(4) | | | 7.98 | % |
After expense waiver/reimbursement(4) | | | 1.00 | % |
| | | | | |
| Ratio of net investment loss to average net assets: | | | | |
After expense waiver/reimbursement(4) | | | (0.60 | )% |
Portfolio turnover rate(3) | | | 99 | % |
(1) | Inception date of the Fund was July 6, 2021. |
(2) | Per share amounts calculated using the average shares method. |
(3) | Not annualized for periods less than one year. |
(4) | Annualized for periods less than one year. |
See Notes to the Financial Statements.
Friess Funds
Notes to Financial Statements
December 31, 2021
1. Organization
Managed Portfolio Series (the “Trust”) was organized as a Delaware statutory trust on January 27, 2011. The Trust is registered under the Investment Company Act of 1940, as amended (the “1940 Act”), as an open-end management investment company. The Friess Small Cap Growth Fund (“Small Cap Growth Fund”), Friess Brandywine Fund (“Brandywine Fund”) and Friess Brandywine Blue Fund (“Brandywine Blue Fund”) (each a “Fund” and together the “Funds”), are each a diversified series with its own investment objectives and policies within the Trust. The investment objective of each Fund is capital appreciation. Each Fund is an investment company and accordingly follows the investment company accounting and reporting guidance of the Financial Accounting Standards Board (“FASB”) Accounting Standards Codification Topic 946, Financial Services – Investment Companies. Prior to June 1, 2017, the Small Cap Growth Fund’s investment adviser managed a limited partnership with an investment objective and investment policies that were, in all material respects, equivalent to those of the Fund. The limited partnership, which incepted on August 6, 2002, converted into, and the Fund commenced operations in the Trust on, May 31, 2017. The Small Cap Growth Fund currently offers two classes of shares, the Investor Class and the Institutional Class. Each class of shares has identical rights and privileges except with respect to shareholder servicing fees, distribution fees and voting rights on matters affecting a single share class. Institutional Class shares are subject to a maximum 0.15% shareholder servicing fee. Investor Class shares are subject to a 0.25% Rule 12b-1 distribution and servicing fee and a maximum 0.15% shareholder servicing fee. The Brandywine Fund and Brandywine Blue Fund commenced operations on July 6, 2021. The Brandywine Fund and Brandywine Blue Fund currently offer one class of shares, Class I. Class I shares are subject to a maximum 0.15% shareholder servicing fee. Organizational costs that were incurred by the Brandywine Fund and Brandywine Blue Fund and enable them to do business were paid for by Friess Associates, LLC (the "Adviser"). These payments are not recoupable by the Adviser. The Funds may issue an unlimited number of shares of beneficial interest, with no par value.
2. Significant Accounting Policies
The following is a summary of significant accounting policies consistently followed by the Funds in preparation of its financial statements. These policies are in conformity with generally accepted accounting principles in the United States of America (“GAAP”).
Security Valuation – All investments in securities are recorded at their estimated fair value, as described in Note 3.
Federal Income Taxes – The Funds comply with the requirements of subchapter M of the Internal Revenue Code of 1986, as amended, as necessary to qualify as a regulated investment company and distributes substantially all net taxable investment income and net realized gains to shareholders in a manner which results in no tax cost to the Funds. Therefore, no federal income or excise tax provision is required. As of and during the period ended December 31, 2021, the Funds did not have any tax positions that did not meet the “more-likely-than-not” threshold of being sustained by the applicable tax authority. As of and during the period ended December 31, 2021, the Funds did not have liabilities for any unrecognized tax benefits. The Funds recognize interest and penalties, if any, related to unrecognized tax benefits on unrecognized tax positions as income tax expense in the Statement of Operations. As of and during the period ended December 31, 2021, the Funds did not incur any interest or penalties. The Small Cap Growth Fund is not subject to examination by U.S. tax authorities prior to the fiscal year ended December 31, 2018. The Brandywine Fund and Brandywine Blue Fund are subject to examination by U.S. tax authorities for all tax years since the commencement of operations.
Security Transactions, Income, and Distributions – The Funds follow industry practice and records security transactions on the trade date. Realized gains and losses on sales of securities are calculated on the basis of identified cost. Dividend income is recorded on the ex-dividend date and interest income and expense is recorded on an accrual basis. Withholding taxes on foreign dividends have been provided for in accordance with the Funds’ understanding of the applicable country’s tax rules and regulations. Discounts and premiums on securities purchased are amortized over the expected life of the respective securities using the constant yield method.
The Funds distribute substantially all net investment income and net realized capital gains, if any, at least annually. Distributions to shareholders are recorded on the ex-dividend date. The treatment for financial reporting purposes of distributions made to shareholders during the year from net investment income or net realized capital gains may differ from their ultimate treatment for federal income tax purposes. These differences are caused primarily by differences in the
Friess Funds
Notes to Financial Statements (Continued)
December 31, 2021
timing of the recognition of certain components of income, expense or realized capital gains for federal income tax purposes. Where such differences are permanent in nature, GAAP requires that they be reclassified in the components of the net assets based on their ultimate characterization for federal income tax purposes. Any such reclassifications will have no effect on net assets, results of operations or net asset value (“NAV”) per share of the Funds. For the period ended December 31, 2021, the following reclassifications were made:
Fund | Paid-in Capital | Distributable Earnings |
| Brandywine Fund | $(21,397) | $21,397 |
| Brandywine Blue Fund | (6,532) | 6,532 |
These reclassifications relate to net operating loss and stock issuance expenses paid by the Funds.
Allocation of Income, Expenses and Gains/Losses – Income, expenses (other than those deemed attributable to a specific share class), and gains and losses of the Funds are allocated daily to each class of shares based upon the ratio of net assets represented by each class as a percentage of the net assets of each Fund. Expenses deemed directly attributable to a class of shares are recorded by the specific class. Most Fund expenses are allocated by class based on relative net assets. Shareholder servicing fees are expensed at an annual rate up to 0.15% of Class I, Institutional Class and Investor Class shares and 12b-1 fees are expensed at 0.25% of average daily net assets of Investor Class shares (see Note 5). Expenses associated with a specific fund in the Trust are charged to that fund. Common Trust expenses are typically allocated evenly between the funds of the Trust, or by other equitable means.
Use of Estimates – The preparation of financial statements in conformity with GAAP requires management to make estimates and assumptions that affect the reported amounts of assets and liabilities and disclosure of contingent assets and liabilities at the date of the financial statements and the reported amounts of revenues and expenses during the reporting period. Actual results could differ from those estimates.
3. Securities Valuation
The Funds have adopted authoritative fair value accounting standards which establish an authoritative definition of fair value and set out a hierarchy for measuring fair value. These standards require additional disclosures about the various inputs and valuation techniques used to develop the measurements of fair value, a discussion of changes in valuation techniques and related inputs during the period and expanded disclosure of valuation Levels for major security types. These inputs are summarized in the three broad Levels listed below:
| Level 1 – | Unadjusted quoted prices in active markets for identical assets or liabilities that the Funds have the ability to access. |
| | |
| Level 2 – | Observable inputs other than quoted prices included in Level 1 that are observable for the asset or liability, either directly or indirectly. These inputs may include quoted prices for the identical instrument on an inactive market, prices for similar instruments, interest rates, prepayment speeds, credit risk, yield curves, default rates and similar data. |
| | |
| Level 3 – | Unobservable inputs for the asset or liability, to the extent relevant observable inputs are not available, representing the Fund’s own assumptions about the assumptions a market participant would use in valuing the asset or liability, and would be based on the best information available. |
Following is a description of the valuation techniques applied to the Funds’ major categories of assets and liabilities measured at fair value on a recurring basis. The Funds’ investments are carried at fair value.
Equity Securities – Equity securities that are primarily traded on a national securities exchange are valued at the last sale price on the exchange on which they are primarily traded on the day of valuation or, if there has been no sale on such day, at the mean between the bid and ask prices. Securities traded primarily in the Nasdaq Global Market System for which market quotations are readily available are valued using the Nasdaq Official Closing Price (“NOCP”). If the NOCP is not available, such securities are valued at the last sale price on the day of valuation, or if there has been no sale on such day, at the mean between the bid and ask prices. To the extent these securities are actively traded and valuation adjustments are not applied, they are categorized in Level 1 of the fair value hierarchy. If the market for a particular security is not active, and the mean between bid and ask prices is used, these securities are categorized in Level 2 of the fair value hierarchy.
Friess Funds
Notes to Financial Statements (Continued)
December 31, 2021
Short-Term Investments – Investments in other mutual funds, including money market funds, are valued at their NAV per share. Deposit accounts are valued at acquisition cost, which approximates fair value. To the extent these securities are actively traded and valuation adjustments are not applied, they are categorized in Level 1 of the fair value hierarchy. Investments maturing in 60 days or less are valued using the mean between the closing bid and ask prices provided by a pricing service and categorized in Level 2 of the fair value hierarchy.
Securities for which market quotations are not readily available, or if the closing price does not represent fair value, are valued following procedures approved by the Board of Trustees (the “Board”). These procedures consider many factors, including the type of security, size of holding, trading volume and news events. There can be no assurance that the Funds could obtain the fair value assigned to a security if it were to sell the security at approximately the time at which each Fund determines its NAV per share. The Board has established a Valuation Committee to administer, implement, and oversee the fair valuation process, and to make fair value decisions when necessary. The Board regularly reviews reports of the Valuation Committee that describe any fair value determinations and methods.
The inputs or methodology used for valuing securities are not an indication of the risk associated with investing in those securities. The following is a summary of the inputs used to value the Funds’ securities as of December 31, 2021:
| Small Cap Growth Fund | | | | | | | | | | | | | | | |
| | | Non-Categorized | | | Level 1 | | | Level 2 | | | Level 3 | | | Total | |
| Common Stocks | | $ | — | | | $ | 47,125,755 | | | $ | — | | | $ | — | | | $ | 47,125,755 | |
| Short-Term Investment | | | — | | | | 1,942,857 | | | | — | | | | — | | | | 1,942,857 | |
| Investment Purchased | | | | | | | | | | | | | | | | | | | | |
| with the Cash Proceeds from | | | | | | | | | | | | | | | | | | | | |
| Securities Lending* | | | 4,229,384 | | | | — | | | | — | | | | — | | | | 4,229,384 | |
| Total Investments in Securities | | $ | 4,229,384 | | | $ | 49,068,612 | | | $ | — | | | $ | — | | | $ | 53,297,996 | |
| | | | | | | | | | | | | | | | | | | | | |
| Brandywine Fund | | | | | | | | | | | | | | | | | | | | |
| | | | | | | Level 1 | | | Level 2 | | | Level 3 | | | Total | |
| Common Stocks | | $ | — | | | $ | 7,703,780 | | | $ | — | | | $ | — | | | $ | 7,703,780 | |
| Short-Term Investment | | | — | | | | 171,103 | | | | — | | | | — | | | | 171,103 | |
| Total Investments in Securities | | $ | — | | | $ | 7,874,883 | | | $ | — | | | $ | — | | | $ | 7,874,883 | |
| | | | | | | | | | | | | | | | | | | | | |
| Brandywine Blue Fund | | | | | | | | | | | | | | | | | | | | |
| | | | | | | Level 1 | | | Level 2 | | | Level 3 | | | Total | |
| Common Stocks | | $ | — | | | $ | 5,250,707 | | | $ | — | | | $ | — | | | $ | 5,250,707 | |
| Short-Term Investment | | | — | | | | 260,026 | | | | — | | | | — | | | | 260,026 | |
| Total Investments in Securities | | $ | — | | | $ | 5,510,733 | | | $ | — | | | $ | — | | | $ | 5,510,733 | |
| * | Certain investments that are measured at fair value using the NAV per share (or its equivalent) as a practical expedient have not been characterized in the fair value hierarchy. The fair value amounts presented in the table are intended to permit reconciliation of the fair value hierarchy to the amount presented in the Statement of Assets and Liabilities. See Note 9 for additional information regarding securities lending activity. |
Refer to the Schedules of Investments for further information on the classification of investments.
4. Investment Advisory Fee and Other Related Party Transactions
The Trust has an agreement with the Friess Associates, LLC (the “Adviser”) to furnish investment advisory services to the Funds. Pursuant to an Investment Advisory Agreement between the Trust and the Adviser, the Adviser is entitled to receive a monthly management fee based upon the average daily net assets of the Funds at the following annual rates:
Fund | | |
| Small Cap Growth Fund | 1.00% | |
| Brandywine Fund | 0.75% | |
| Brandywine Blue Fund | 0.75% | |
Friess Funds
Notes to Financial Statements (Continued)
December 31, 2021
Prior to November 22, 2021, the Adviser had engaged its affiliate, Friess Associates of Delaware, LLC as Sub-Adviser to the Small Cap Growth Fund. Subject to the supervision of the Adviser, the Sub-Adviser assisted the Adviser in the day-to-day management of the Small Cap Growth Fund’s portfolio, including purchase, retention and sale of securities. The Adviser compensated the Sub-Adviser based on a percentage of monthly expenses incurred by the Sub-Adviser. This relationship did not increase the annual management fee the Fund paid to the Adviser. Effective November 22, 2021, the Sub-Adviser merged with the Adviser.
The Funds’ Adviser has contractually agreed to waive a portion or all of its management fees and reimburse the Funds for its expenses to ensure that total annual operating expenses (excluding acquired fund fees and expenses, leverage/borrowing interest, interest expense, taxes, brokerage commissions and other transactional expenses, dividends paid on short sales, and extraordinary expenses) for the Funds do not exceed the following rates (based upon the average daily net assets of the Funds):
Fund | | |
| Small Cap Growth Fund – Institutional Class | 1.20% | |
| Small Cap Growth Fund – Investor Class | 1.45% | |
| Brandywine Fund – Class I | 1.00% | |
| Brandywine Blue Fund – Class I | 1.00% | |
Fees waived and expenses reimbursed by the Adviser may be recouped by the Adviser for a period of thirty-six months following the month during which such waiver or reimbursement was made if such recoupment can be achieved without exceeding the expense limit in effect at the time the waiver and reimbursement occurred. The Operating Expenses Limitation Agreement for the Funds is indefinite in term, but cannot be terminated within a year after the effective date of the Funds’ prospectus. After that date, the agreement may be terminated at any time upon 60 days’ written notice by the Board or the Adviser, with the consent of the Board. Waived fees subject to potential recovery by month of expiration are as follows:
Fund | January – December 2022 | January – December 2023 | January – December 2024 |
| Small Cap Growth Fund | | $ | 43,011 | | | $ | 197,176 | | | $ | 227,566 | |
| Brandywine Fund | | | — | | | | — | | | | 117,104 | * |
| Brandywine Blue Fund | | | — | | | | — | | | | 116,274 | * |
* The range for the Brandywine Fund and Brandywine Blue Fund is July 2024-December 2024
U.S. Bancorp Fund Services, LLC (the “Administrator”), doing business as U.S. Bank Global Fund Services, acts as the Fund’s Administrator, Transfer Agent, and Fund Accountant. U.S. Bank N.A. (the “Custodian”) serves as the Custodian to the Fund. The Custodian is an affiliate of the Administrator. The Administrator performs various administrative and accounting services for the Funds. The Administrator prepares various federal and state regulatory filings, reports and returns for the Funds; prepares reports and materials to be supplied to the Trustees; monitors the activities of the Custodian; coordinates the payment of the Funds’ expenses and reviews the Funds’ expense accruals. The officers of the Trust, including the Chief Compliance Officer, are employees of the Administrator. As compensation for its services, the Administrator is entitled to a monthly fee at an annual rate based upon the average daily net assets of the Funds, subject to annual minimums. Fees paid by the Funds for administration and accounting, transfer agency, custody and compliance services for the period ended December 31, 2021, are disclosed in the Statement of Operations.
5. Distribution and Shareholder Servicing Fees
The Small Cap Growth Fund has adopted a Distribution Plan pursuant to Rule 12b-1 (the “Plan”) in the Investor Class only. The Plan permits the Small Cap Growth Fund to pay for distribution and related expenses at an annual rate of 0.25% of the Investor Class’ average daily net assets. The expenses covered by the Plan may include the cost of preparing and distributing prospectuses and other sales material, advertising and public relations expenses, payments to financial intermediaries and compensation of personnel involved in selling shares of the Small Cap Growth Fund. For the year ended December 31, 2021, the Small Cap Growth Fund’s Investor Class incurred expenses of $1,815 pursuant to the Plan.
The Funds have entered into a shareholder servicing agreement (the “Agreement”) where the Adviser acts as the shareholder agent, under which the Funds may pay servicing fees at an annual rate up to 0.15% of the average daily net assets of Class I, Institutional Class and Investor Class. Payments to the Adviser, if any, under the Agreement may reimburse the Adviser for payments it makes to selected brokers, dealers and administrators which have entered into
Friess Funds
Notes to Financial Statements (Continued)
December 31, 2021
service agreements with the Adviser for services provided to shareholders of the Funds. Payments may also be made directly to the intermediaries providing shareholder services. The services provided by such intermediaries are primarily designed to assist shareholders of the Funds and include the furnishing of office space and equipment, telephone facilities, personnel and assistance to the Funds in servicing such shareholders. Services provided by such intermediaries also include the provision of support services to the Funds and include establishing and maintaining shareholders’ accounts and record processing, purchase and redemption transactions, answering routine client inquiries regarding the Funds, and providing such other personal services to shareholders as the Funds may reasonably request. For the period ended December 31, 2021, the Funds incurred the following amounts of shareholder servicing fees:
Fund | | |
| Small Cap Growth Fund – Institutional Class | $26,918 | |
| Small Cap Growth Fund – Investor Class | 672 | |
| Brandywine Fund – Class I | 4,065 | |
| Brandywine Blue Fund – Class I | 2,259 | |
6. Capital Share Transactions
Transactions in shares of the Funds were as follows:
| Small Cap Growth Fund | | | | | | |
| | | Year Ended | | | Year Ended | |
| | | December 31, 2021 | | | December 31, 2020 | |
| Institutional Class: | | | | | | |
| Shares sold | | | 147,541 | | | | 47,918 | |
| Shares issued in reinvestment of distributions | | | 206,735 | | | | — | |
| Shares redeemed-in-kind | | | — | | | | (4,891,857 | ) |
| Shares redeemed | | | (353,282 | ) | | | (574,460 | ) |
| Net increase (decrease) | | | 994 | | | | (5,418,399 | ) |
| | | | | | | | | |
| Investor Class: | | | | | | | | |
| Shares sold | | | 43,978 | | | | 1,663 | |
| Shares issued in reinvestment of distributions | | | 6,874 | | | | — | |
| Shares redeemed | | | (11,928 | ) | | | (3,549 | ) |
| Net increase (decrease) | | | 38,924 | | | | (1,886 | ) |
| Net increase (decrease) in capital shares | | | 39,918 | | | | (5,420,285 | ) |
| | | | | | | | | |
| Brandywine Fund | | | | | | | | |
| | | | | | | Period Inception(1) | |
| | | | | | | through | |
| | | | | | | December 31, 2021 | |
| Class I: | | | | | | | | |
| Shares sold | | | | | | | 395,607 | |
| Shares issued in reinvestment of distributions | | | | | | | — | |
| Shares redeemed | | | | | | | (31,359 | ) |
| Net increase in capital shares | | | | | | | 364,248 | |
| | | | | | | | | |
| Brandywine Blue Fund | | | | | | | | |
| | | | | | | Period Inception(1) | |
| | | | | | | through | |
| | | | | | | December 31, 2021 | |
| Class I: | | | | | | | | |
| Shares sold | | | | | | | 254,060 | |
| Shares issued in reinvestment of distributions | | | | | | | — | |
| Shares redeemed | | | | | | | (11,560 | ) |
| Net increase in capital shares | | | | | | | 242,500 | |
(1) | Inception date of the Brandywine Fund and Brandywine Blue Fund was July 6, 2021. |
Friess Funds
Notes to Financial Statements (Continued)
December 31, 2021
7. Investment Transactions
The aggregate purchases and sales, excluding short-term investments, by the Funds for the period ended December 31, 2021, were as follows:
Fund | | U.S. Government Securities | | | Other Securities | |
| Small Cap Growth Fund | | $ | — | | | $ | — | | | $ | 90,481,861 | | | $ | 97,910,985 | |
| Brandywine Fund | | | — | | | | — | | | | 12,056,231 | | | | 4,884,389 | |
| Brandywine Blue Fund | | | — | | | | — | | | | 8,074,242 | | | | 3,101,102 | |
8. Federal Tax Information
The aggregate gross unrealized appreciation and depreciation of securities held by the Funds and the total cost of securities for federal income tax purposes at December 31, 2021, were as follows:
| | | Aggregate | | | Aggregate | | | Federal | | | | |
| | | Gross | | | Gross | | | Net | | | Income | |
Fund | | Appreciation | | | Depreciation | | | Appreciation | | | Tax Cost | |
| Small Cap Growth Fund | | $ | 12,213,742 | | | $ | (1,685,672 | ) | | $ | 10,528,070 | | | $ | 42,769,926 | |
| Brandywine Fund | | | 995,686 | | | | (278,725 | ) | | | 716,961 | | | | 7,157,922 | |
| Brandywine Blue Fund | | | 452,247 | | | | (224,907 | ) | | | 227,340 | | | | 5,283,393 | |
Any difference between book-basis and tax-basis unrealized appreciation (depreciation) is attributable primarily to the tax deferral of losses on wash sales in the Funds.
At December 31, 2021, components of accumulated earnings on a tax-basis were as follows:
| | | Undistributed | | | Undistributed | | | Other | | | Total | | | | |
| | | Ordinary | | | Long-Term | | | Accumulated | | | Net | | | Distributable | |
Fund | | Income | | | Capital Gains | | | Losses | | | Appreciation | | | Earnings | |
| Small Cap Growth Fund | | $ | 765,790 | | | $ | — | | | $ | (289,179 | ) | | $ | 10,528,070 | | | $ | 11,004,681 | |
| Brandywine Fund | | | — | | | | — | | | | (185,023 | ) | | | 716,961 | | | | 531,938 | |
| Brandywine Blue Fund | | | 46,712 | | | | — | | | | — | | | | 227,340 | | | | 274,052 | |
As of December 31, 2021, the Brandywine Fund had short-term capital loss carryovers of $185,023. The Small Cap Growth Fund utilized $6,994,301 of short-term capital loss carryovers during the year ended December 31, 2021. A regulated investment company may elect for any taxable year to treat any portion of any qualified late year loss as arising on the first day of the next taxable year. Qualified late year losses are certain capital, and ordinary losses which occur during the portion of the Funds’ taxable year subsequent to October 31 and December 31, respectively. For the taxable year ended December 31, 2021, the Small Cap Growth Fund deferred $289,179 in post-October losses.
The tax character of distributions paid during the year ended December 31, 2021, was as follows:
Fund | Ordinary Income* | Long-Term Capital Gains | Total |
| Small Cap Growth Fund | $3,681,747 | $3,111,566 | $6,793,313 |
| * | For federal income tax purposes, distributions of short-term capital gains are treated as ordinary income distributions. |
The Funds made no distributions during the year ended December 31, 2020.
9. Securities Lending
Following terms of a securities lending agreement with the Custodian, the Small Cap Growth Fund (the “Fund”) may lend securities from its portfolio to brokers, dealers and financial institutions in order to increase the return on its portfolio, primarily through the receipt of borrowing fees and earnings on invested collateral. Any such loan must be continuously secured by collateral in cash or cash equivalents maintained on a current basis in an amount at least equal to 105% of the value of the loaned securities that are foreign securities or 102% of the value of any U.S. loaned securities. Loans shall be marked to market daily and the margin restored in the event the collateralization is below 100% of the market value of the securities loaned. During the time securities are on loan, the borrower will pay the Fund any accrued income on those securities, and the Fund may invest the cash collateral and earn income or receive an agreed-
Friess Funds
Notes to Financial Statements (Continued)
December 31, 2021
upon fee from a borrower that has delivered cash-equivalent collateral. In determining whether or not to lend a security to a particular broker, dealer or financial institution, the Adviser considers all relevant facts and circumstances, including the size, creditworthiness and reputation of the broker, relevant facts dealer or financial institution. Securities lending involves the risk of a default or insolvency of the borrower. In either of these cases, the Fund could experience delays in recovering securities or collateral or could lose all or part of the value of the loaned securities. The Fund also could lose money in the event of a decline in the value of the collateral provided for loaned securities. Additionally, the loaned portfolio securities may not be available to the Fund on a timely basis and the Fund may therefore lose the opportunity to sell the securities at a desirable price. Any decline in the value of a security that occurs while the security is out on loan would continue to be borne by the Fund. As of December 31, 2021, the Fund had 6 securities out on loan.
The Fund receives cash as collateral in return for securities lent, if any, as part of the securities lending program. The collateral is invested in the Mount Vernon Liquid Assets Portfolio, LLC of which the investment objective is to seek to maximize current income to the extent with the preservation of capital and liquidity and maintain a stable NAV of $1.00 per unit. The Fund held $4,229,384 as of December 31, 2021. The remaining contractual maturity of all securities lending transactions is overnight and continuous. The Fund is not subject to a master netting agreement with respect to securities lending; therefore no additional disclosures are required. The income earned by the Fund on investments of cash collateral received from borrowers for the securities loaned to them are reflected in the Fund’s Statement of Operations. Securities lending income, as disclosed in the Fund’s Statement of Operations, represents the income earned from the investment of cash collateral, net of fee rebates paid to the borrower and net of fees paid to the Custodian as lending agent.
10. Control Ownership
The beneficial ownership, either directly or indirectly, of more than 25% of the voting securities of a fund creates a presumption of control of the fund, under Section 2(a)(9) of the 1940 Act. As of December 31, 2021, each Fund’s percentage of control ownership positions greater than 25% is as follows:
Fund | Shareholder | Percent of Shares Held |
| Small Cap Growth Fund | Charles Schwab | 47.49% |
| Brandywine Fund | Reliance Trust Company | 42.61% |
| Brandywine Blue Fund | Individual Investor | 33.21% |
| Brandywine Blue Fund | Reliance Trust Company | 28.95% |
11. COVID-19
The global outbreak of COVID-19 (commonly referred to as “coronavirus”) has disrupted economic markets and the prolonged economic impact is uncertain. The ultimate economic fallout from the pandemic, and the long-term impact on economies, markets, industries and individual issuers, are not known. The operational and financial performance of the issuers of securities in which the Funds invest depends on future developments, including the duration and spread of the outbreak, and such uncertainty may in turn adversely affect the value and liquidity of the Funds’ investments, impair the Funds’ ability to satisfy redemption requests, and negatively impact the Funds’ performance.
Friess Funds
Expense Example
December 31, 2021 (Unaudited)
As a shareholder of a Fund, you may incur two types of costs: (1) transaction costs, including brokerage commissions on purchases and sales of Fund shares, and (2) ongoing costs, including management fees, distribution and/or service (12b-1) fees, shareholder servicing fees, and other Fund expenses. This Example is intended to help you understand your ongoing costs (in dollars) of investing in a Fund and to compare these costs with the ongoing costs of investing in other mutual funds. The example is based on $1,000 invested at the beginning of the period and held for the entire period (July 1, 2021 – December 31, 2021).
Actual Expenses
For each class, the first line of the table provides information about actual account values and actual expenses. You may use the information in this line, together with the amount you invested, to estimate the expenses that you paid over the period. Simply divide your account value by $1,000 (for example, an $8,600 account value divided by $1,000 = 8.6), then multiply the result by the number in the first line under the heading entitled “Expenses Paid During Period” to estimate the expenses you paid on your account during this period.
Hypothetical Example for Comparison Purposes
For each class, the second line of the table below provides information about hypothetical account values and hypothetical expenses based on the Funds’ actual expense ratios and an assumed rate of return of 5% per year before expenses, which is not the Funds’ actual returns. The hypothetical account values and expenses may not be used to estimate the actual ending account balance or expenses you paid for the period. You may use this information to compare the ongoing costs of investing in the Fund and other funds. To do so, compare this 5% hypothetical example with the 5% hypothetical examples that appear in the shareholder reports of the other funds.
Please note that the expenses shown in the table are meant to highlight your ongoing costs only and do not reflect any transactional costs. Therefore, the second line of the table for each class is useful in comparing ongoing costs only, and will not help you determine the relative total costs of owning different funds. In addition, if these transactional costs were included, your costs may have been higher.
Friess Funds
Expense Example (Continued)
December 31, 2021 (Unaudited)
Friess Small Cap Growth Fund
| | Beginning | Ending | Expenses Paid |
| | Account | Account | During Period(1) |
| | Value | Value | 7/1/21 to |
| | 7/1/21 | 12/31/21 | 12/31/21 |
| Institutional Class | | | |
Actual(2) | $1,000.00 | $1,042.40 | $6.18 |
| Hypothetical | | | |
| (5% return | | | |
| before expenses) | $1,000.00 | $1,019.16 | $6.11 |
| | | | |
| Investor Class | | | |
Actual(2) | $1,000.00 | $1,041.00 | $7.46 |
| Hypothetical | | | |
| (5% return | | | |
| before expenses) | $1,000.00 | $1,017.90 | $7.37 |
(1) | Expenses are equal to the Fund’s annualized expense ratio for the most recent six-month period of 1.20% and 1.45% for the Institutional Class and Investor Class, respectively, multiplied by the average account value over the period, multiplied by 184/365 to reflect the one-half year period. |
(2) | Based on the actual returns for the six-month period ended December 31, 2021, of 4.24% and 4.10% of the Institutional Class and Investor Class, respectively. |
Friess Brandywine Fund
| | Beginning | Ending | Expenses Paid |
| | Account | Account | During Period(1) |
| | Value | Value | 7/6/21 to |
| | 7/6/21 | 12/31/21 | 12/31/21 |
| Class I | | | |
Actual(2) | $1,000.00 | $1,074.00 | $5.06 |
| Hypothetical | | | |
| (5% return | | | |
| before expenses) | $1,000.00 | $1,019.51 | $4.92 |
(1) | Expenses are equal to the Fund’s annualized expense ratio for the most recent period since inception of 1.00%, multiplied by the average account value over the period, multiplied by 178/365 to reflect the period since inception. |
(2) | Based on the actual returns for the period since inception ended December 31, 2021 of 7.40%. |
Friess Brandywine Blue Fund
| | Beginning | Ending | Expenses Paid |
| | Account | Account | During Period(1) |
| | Value | Value | 7/6/21 to |
| | 7/6/21 | 12/31/21 | 12/31/21 |
| Class I | | | |
Actual(2) | $1,000.00 | $1,107.50 | $5.14 |
| Hypothetical | | | |
| (5% return | | | |
| before expenses) | $1,000.00 | $1,019.51 | $4.92 |
(1) | Expenses are equal to the Fund’s annualized expense ratio for the most recent period since inception of 1.00%, multiplied by the average account value over the period, multiplied by 178/365 to reflect the period since inception. |
(2) | Based on the actual returns for the period since inception ended December 31, 2021 of 10.75%. |
Report of Independent Registered Public Accounting Firm
To the Shareholders of Friess Funds and Board of Trustees of Managed Portfolio Series
Opinion on the Financial Statements
We have audited the accompanying statements of assets and liabilities, including the schedules of investments, of the funds listed below (“Friess Funds” or the “Funds”), each a series of Managed Portfolio Series, as of December 31, 2021, the related statements of operations, the statements of changes in net assets, the related notes, and the financial highlights for each of the periods indicated below (collectively referred to as the “financial statements”). In our opinion, the financial statements present fairly, in all material respects, the financial position of each of the Funds as of December 31, 2021, the results of their operations, the changes in net assets, and the financial highlights for each of the periods indicated below in conformity with accounting principles generally accepted in the United States of America.
| | | Statement(s) of | |
| | Statements of | Changes in | |
| Fund Name | Operations | Net Assets | Financial Highlights |
| Friess Small Cap Growth Fund | For the year ended | For the years ended | For the years ended |
| | December 31, 2021 | December 31, 2021 | December 31, 2021, 2020, |
| | | and 2020 | 2019, 2018, and for the period |
| | | | from May 31, 2017 |
| | | | (commencement of operations) |
| | | | through December 31, 2017 |
| Friess Brandywine Fund and | For the period from July 6, 2021 | |
| Friess Brandywine Blue Fund | (commencement of operations) through December 31, 2021 |
Basis for Opinion
These financial statements are the responsibility of the Funds’ management. Our responsibility is to express an opinion on the Funds’ financial statements based on our audits. We are a public accounting firm registered with the Public Company Accounting Oversight Board (United States) (“PCAOB”) and are required to be independent with respect to the Funds in accordance with the U.S. federal securities laws and the applicable rules and regulations of the Securities and Exchange Commission and the PCAOB.
We conducted our audits in accordance with the standards of the PCAOB. Those standards require that we plan and perform the audit to obtain reasonable assurance about whether the financial statements are free of material misstatement whether due to error or fraud.
Our audits included performing procedures to assess the risks of material misstatement of the financial statements, whether due to error or fraud, and performing procedures that respond to those risks. Such procedures included examining, on a test basis, evidence regarding the amounts and disclosures in the financial statements. Our procedures included confirmation of securities owned as of December 31, 2021, by correspondence with the custodian and brokers. Our audits also included evaluating the accounting principles used and significant estimates made by management, as well as evaluating the overall presentation of the financial statements. We believe that our audits provide a reasonable basis for our opinion.
We have served as the auditor of one or more investment companies advised by Friess Associates, LLC since 2017.
COHEN & COMPANY, LTD.
Milwaukee, Wisconsin
January 31, 2022
Friess Funds
Additional Information
December 31, 2021 (Unaudited)
TRUSTEES & OFFICERS
| | | | Number of | | |
| | | Term of | Portfolios | | Other Directorships |
| | Position(s) | Office and | in Trust | | Held by Trustee |
| Name, Address | Held with | Length of | Overseen | Principal Occupation(s) | During the |
and Year of Birth | the Trust | Time Served | by Trustee | During the Past Five Years | Past 5 Years |
| | | | | | |
| Independent Trustees | | | | | |
| | | | | | |
| Leonard M. Rush, CPA | Chairman, | Indefinite | 37 | Retired, Chief Financial | Independent Trustee, |
| 615 E. Michigan St. | Trustee and | Term; Since | | Officer, Robert W. Baird & Co. | ETF Series Solutions |
| Milwaukee, WI 53202 | Audit | April 2011 | | Incorporated, (2000-2011). | (53 Portfolios) |
| Year of Birth: 1946 | Committee | | | (2012-Present) | |
| | Chairman | | | | |
| | | | | | |
| David A. Massart | Trustee | Indefinite | 37 | Co-Founder and Chief | Independent Trustee, |
| 615 E. Michigan St. | | Term; Since | | Investment Strategist, | ETF Series Solutions |
| Milwaukee, WI 53202 | | April 2011 | | Next Generation Wealth | (53 Portfolios) |
| Year of Birth: 1967 | | | | Management, Inc. | (2012-Present) |
| | | | | (2005-present). | |
| | | | | | |
| David M. Swanson | Trustee and | Indefinite | 37 | Founder and Managing Partner, | Independent Trustee, |
| 615 E. Michigan St. | Nominating & | Term; Since | | SwanDog Strategic Marketing, | ALPS Variable |
| Milwaukee, WI 53202 | Governance | April 2011 | | LLC (2006-present); Executive | Investment Trust |
| Year of Birth: 1957 | Committee | | | Vice President, Calamos | (7 Portfolios) |
| | Chairman | | | Investments (2004-2006). | (2006-Present); |
| | | | | | Independent Trustee, |
| | | | | | RiverNorth Funds |
| | | | | | (3 Portfolios) |
| | | | | | (2018-Present); |
| | | | | | RiverNorth Managed |
| | | | | | Duration Municipal |
| | | | | | Income Fund Inc. |
| | | | | | (1 Portfolio) |
| | | | | | (2019-Present); |
| | | | | | RiverNorth Specialty |
| | | | | | Finance Corporation |
| | | | | | (1 Portfolio) |
| | | | | | (2018-Present); |
| | | | | | RiverNorth/DoubleLine |
| | | | | | Strategic Opportunity |
| | | | | | Fund, Inc. (1 Portfolio) |
| | | | | | (2018-Present); |
| | | | | | RiverNorth |
| | | | | | Opportunities Fund, Inc. |
| | | | | | (1 Portfolio) |
| | | | | | (2015-Present); |
| | | | | | RiverNorth |
| | | | | | Opportunistic Municipal |
| | | | | | Income Fund, Inc. |
| | | | | | (1 Portfolio) |
| | | | | | (2018-Present); |
| | | | | | RiverNorth Flexible |
| | | | | | Municipal Income Fund |
| | | | | | (2020-Present). |
| | | | | | |
| Robert J. Kern | Trustee | Indefinite | 37 | Retired (2018-present); Executive | None |
| 615 E. Michigan St. | | Term; Since | | Vice President, U.S. Bancorp | |
| Milwaukee, WI 53202 | | January 2011 | | Fund Services, LLC (1994-2018). | |
| Year of Birth: 1958 | | | | | |
Friess Funds
Additional Information (Continued)
December 31, 2021 (Unaudited)
| | | | Number of | | |
| | | Term of | Portfolios | | Other Directorships |
| | Position(s) | Office and | in Trust | | Held by Trustee |
| Name, Address | Held with | Length of | Overseen | Principal Occupation(s) | During the |
and Year of Birth | the Trust | Time Served | by Trustee | During the Past Five Years | Past 5 Years |
| | | | | | |
| Officers | | | | | |
| | | | | | |
| Brian R. Wiedmeyer | President | Indefinite | N/A | Vice President, U.S. | N/A |
| 615 E. Michigan St. | and Principal | Term, Since | | Bancorp Fund Services, | |
| Milwaukee, WI 53202 | Executive | November 2018 | | LLC (2005-present). | |
| Year of Birth: 1973 | Officer | | | | |
| | | | | | |
| Deborah Ward | Vice President, | Indefinite | N/A | Senior Vice President, U.S. | N/A |
| 615 E. Michigan St. | Chief | Term; Since | | Bancorp Fund Services, LLC | |
| Milwaukee, WI 53202 | Compliance | April 2013 | | (2004-present). | |
| Year of Birth: 1966 | Officer and | | | | |
| | Anti-Money | | | | |
| | Laundering | | | | |
| | Officer | | | | |
| | | | | | |
| Benjamin Eirich | Treasurer, | Indefinite | N/A | Assistant Vice President, | N/A |
| 615 E. Michigan St. | Principal | Term; Since | | U.S. Bancorp Fund Services, | |
| Milwaukee, WI 53202 | Financial | August 2019 | | LLC (2008-present). | |
| Year of Birth: 1981 | Officer and | (Treasurer); | | | |
| | Vice President | Indefinite | | | |
| | | Term; Since | | | |
| | | November 2018 | | | |
| | | (Vice President) | | | |
| | | | | | |
| Joseph Destache | Secretary | Indefinite | N/A | Assistant Vice President, | N/A |
| 615 E. Michigan St. | | Term; Since | | U.S. Bancorp Fund Services, | |
| Milwaukee, WI 53202 | | March 2021 | | LLC (2019-present); | |
| Year of Birth: 1991 | | | | Regulatory Administration | |
| | | | | Intern, U.S. Bancorp Fund | |
| | | | | Services, LLC (2018–2019); | |
| | | | | Law Student (2016–2019). | |
| | | | | | |
| Douglas Schafer | Assistant | Indefinite | N/A | Assistant Vice President, | N/A |
| 615 E. Michigan St. | Treasurer and | Term; Since | | U.S. Bancorp Fund Services, | |
| Milwaukee, WI 53202 | Vice President | May 2016 | | LLC (2002-present). | |
| Year of Birth: 1970 | | (Assistant | | | |
| | | Treasurer); | | | |
| | | Indefinite | | | |
| | | Term; Since | | | |
| | | November 2018 | | | |
| | | (Vice President) | | | |
| | | | | | |
| Sara Bollech | Assistant | Indefinite | N/A | Officer, U.S. Bancorp Fund | N/A |
| 615 E. Michigan St. | Treasurer and | Term: Since | | Services, LLC (2007-present). | |
| Milwaukee, WI 53202 | Vice President | November 2021 | | | |
| Year of Birth: 1992 | | | | | |
| | | | | | |
| Peter Walker, CPA | Assistant | Indefinite | N/A | Officer, U.S. Bancorp Fund | N/A |
| 615 E. Michigan St. | Treasurer and | Term: Since | | Services, LLC (2016-present). | |
| Milwaukee, WI 53202 | Vice President | November 2021 | | | |
| Year of Birth: 1993 | | | | | |
Friess Funds
Approval of Investment Advisory Agreement (Unaudited)
At the regular meeting of the Board of Trustees of Managed Portfolio Series (“Trust”) on May 18-19, 2021, the Trust’s Board of Trustees (“Board”), each of whom were present virtually, including all of the Trustees who are not “interested persons” of the Trust, as that term is defined in Section 2(a)(19) of the Investment Company Act of 1940, as amended, (“Independent Trustees”) considered and approved the Investment Advisory Agreement between the Trust and Friess Associates, LLC (“Friess” or “Adviser”) regarding the Friess Brandywine Fund and Friess Brandywine Blue Fund (each a “Fund” and together the “Funds”) (the “Advisory Agreement”) for an initial two-year term.
Prior to the meeting and at the meeting, the Trustees received and considered information from the Adviser, the Sub-Adviser, and the Trust’s administrator designed to provide the Trustees with the information necessary to evaluate the approval of the Advisory Agreement (“Support Materials”). The Independent Trustees then reviewed the Support Materials with regard to the Adviser and the Funds. They discussed initial SEC filings for the Funds. They reviewed and considered the Adviser’s responses to the due diligence questionnaire regarding the Funds’ investment strategy, services that Friess proposed to provide to the Funds, proposed Fund management fees and the profitability that Friess expects to realize from its management of the Funds, any additional benefits that Friess expects to realize from its management of the Funds, and other matters that the Trustees deemed relevant. The Trustees also reviewed Friess’s financial statements and considered the financial condition of the firm. They also reviewed analyses which were prepared by the administrator of the Funds’ proposed and projected expenses relative to other funds in the same Morningstar category. Before voting to approve the Advisory Agreement, the Trustees reviewed the Support Materials with Trust management and with counsel to the Independent Trustees, and received a memorandum from such counsel discussing the legal standards for the Trustees’ consideration of the approval of the Advisory Agreement. This information, together with the information provided to the Board throughout the course of the year, formed the primary (but not exclusive) basis for the Board’s determinations.
In determining whether to approve the Advisory Agreement, the Trustees considered all factors they believed relevant, including the following with respect to the Funds: 1) the nature, extent, and quality of the services to be provided by Friess with respect to the Funds; (2) the cost of the services to be provided and the profits to be realized by Friess, from services rendered to the Funds; (3) comparative fee and expense data for the Funds and other investment companies with similar investment objectives; (4) the extent to which economies of scale may be realized as the Funds grow, and whether the proposed advisory fee for the Funds reflect such economies of scale for the Funds’ benefit; and (5) other benefits to Friess resulting from services rendered to the Funds. In their deliberations, the Trustees weighed to varying degrees the importance of the information provided to them and did not identify any particular information that was all-important or controlling.
Based upon the information provided to the Board throughout the course of the year, including at a presentation by representatives from Friess, and the Support Materials, the Board concluded that the overall arrangements between the Trust and Friess as set forth in the Advisory Agreement, as the agreement relates to the Funds, continue to be fair and reasonable in light of the services that Friess performs, the investment advisory fees that it receives for such services, and such other matters as the Trustees considered relevant in the exercise of their reasonable business judgment. The material factors and conclusions that formed the basis of the Trustees’ determination to approve the Advisory Agreement are summarized below.
Nature, Extent and Quality of Services Provided. The Trustees considered the scope of services that Friess will collectively provide under the Advisory Agreement with respect to the Funds, noting that such services include but are not limited to the following: (1) investing the Funds’ assets consistent with the Funds’ investment objectives and investment policies; (2) determining the portfolio securities to be purchased, sold, or otherwise disposed of and the timing of such transactions; (3) voting all proxies with respect to the Funds’ portfolio securities; (4) maintaining the required books and records for transactions effected by Friess or Friess Associates of Delaware on behalf of the Funds; and (5) selecting broker-dealers to execute orders on behalf of the Funds. The Trustees noted that Friess is well capitalized. The Trustees also considered Friess’s assets under management. The Trustees considered the experience of the proposed portfolio managers in managing funds with substantially identical investment objectives, policies, and restrictions. The Trustees further noted that Friess would be responsible for portfolio management and trading for the Funds. The Trustees
Friess Funds
Approval of Investment Advisory Agreement (Unaudited) (Continued)
concluded that they were satisfied with the nature, extent, and quality of services that Friess proposes to provide to the Funds under the Advisory Agreement.
Cost of Advisory Services and Profitability. The Trustees considered the proposed management fee that the Funds will pay to Friess under the Advisory Agreement in the amount of 0.75% of the Funds’ average annual daily net assets. They also considered Friess’s profitability analysis (12-month pro-forma) for services that Friess will render to the Funds. In that regard, the Trustees noted that Friess expects to waive a portion of its management fees during the first 12 months of the Funds’ operations under the proposed operating expenses limitation agreement. The Trustees expected that Friess’s service relationship with the Funds would not be profitable during the first 12 months of operations.
Comparative Fee and Expense Data. The Trustees considered an analysis that the Trust’s administrator had prepared, comparing the contractual expenses that the Funds will bear to those of funds in the same Morningstar category. The Trustees noted that the Funds’ proposed management fee of 0.75% was above both funds’ peer group median and average. The Trustees also noted that the projected total contractual expenses of the Friess Brandywine Fund were slightly above the peer group median and slightly above the average. The Trustees additionally noted that the Friess Brandywine Blue Fund projected total contractual expenses were equal to the peer group median and below the average. While recognizing that it is difficult to compare advisory fees because the scope of advisory services provided may vary from one investment adviser to another, the Trustees concluded that Friess’s proposed management fee is reasonable.
Economies of Scale. The Trustees considered whether the Funds would benefit from any economies of scale, noting that the proposed investment advisory fee for the Funds do not contain breakpoints. The Trustees took into account the fact that Friess had agreed to consider breakpoints in the future in response to asset growth in the Funds. The Trustees concluded that it is not necessary to consider the implementation of fee breakpoints at this time, but committed to revisit this issue in the future as circumstances change and asset levels increase.
Other Benefits. The Trustees considered the direct and indirect benefits that could be realized by Friess from its relationships with the Funds. The Trustees noted that Friess will not use affiliated brokers to execute the Funds’ portfolio transactions. The Trustees considered that Friess may receive some form of reputational benefit from services rendered to the Funds, but that such benefits are immaterial and cannot otherwise be quantified. The Trustees concluded that Friess does not receive additional material benefits from its relationship with the Funds.
Friess Funds
Additional Information (Continued)
December 31, 2021 (Unaudited)
AVAILABILITY OF FUND PORTFOLIO INFORMATION
The Funds file complete schedules of portfolio holdings with the SEC for the first and third quarters of each fiscal year on Part F of Form N-PORT. The Funds’ Part F of Form N-PORT is available on the SEC’s website at www.sec.gov and may be reviewed and copied at the SEC’s Public Reference Room in Washington, D.C. For information on the Public Reference Room call 1-800-SEC-0330. In addition, the Funds’ Part F of Form N-PORT is available without charge upon request by calling 1-855-656-3017.
AVAILABILITY OF PROXY VOTING INFORMATION
A description of the Funds’ Proxy Voting Policies and Procedures is available without charge, upon request, by calling 1-855-656-3017. Information regarding how the Fund voted proxies relating to portfolio securities during the most recent 12 month period ended June 30, is available (1) without charge, upon request, by calling 1-855-656-3017, or (2) on the SEC’s website at www.sec.gov.
QUALIFIED DIVIDEND INCOME/DIVIDENDS RECEIVED DEDUCTION
For the fiscal year ended December 31, 2021, certain dividends paid by the Funds may be reported as qualifies dividend income and may be eligible for taxation at capital gain rates. The percentage of dividends declared from ordinary income designated as qualified dividend income was 2.52% for the Small Cap Growth Fund.
For corporate shareholders, the percent of ordinary income distributions qualifying for the corporate dividends received deduction for the fiscal year ended October 31, 2021 was 2.20% for the Small Cap Growth Fund.
The percentage of taxable ordinary income distributions that are designated as short-term capital gain distributions under Internal Revenue Section 871(k)(2)(C) for the Small Cap Growth Fund was 100.00%.
PRIVACY NOTICE (Unaudited)
The Funds collects only relevant information about you that the law allows or requires it to have in order to conduct its business and properly service you. The Funds collect financial and personal information about you (“Personal Information”) directly (e.g., information on account applications and other forms, such as your name, address, and social security number, and information provided to access account information or conduct account transactions online, such as password, account number, e-mail address, and alternate telephone number), and indirectly (e.g., information about your transactions with us, such as transaction amounts, account balance and account holdings).
The Funds do not disclose any non-public personal information about its shareholders or former shareholders other than for everyday business purposes such as to process a transaction, service an account, respond to court orders and legal investigations or as otherwise permitted by law. Third parties that may receive this information include companies that provide transfer agency, technology and administrative services to the Funds, as well as the Funds’ investment adviser who is an affiliate of the Funds. If you maintain a retirement/educational custodial account directly with the Funds, we may also disclose your Personal Information to the custodian for that account for shareholder servicing purposes. The Funds limit access to your Personal Information provided to unaffiliated third parties to information necessary to carry out their assigned responsibilities to the Funds. All shareholder records will be disposed of in accordance with applicable law. The Funds maintain physical, electronic and procedural safeguards to protect your Personal Information and requires its third party service providers with access to such information to treat your Personal Information with the same high degree of confidentiality.
In the event that you hold shares of the Funds through a financial intermediary, including, but not limited to, a broker-dealer, credit union, bank or trust company, the privacy policy of your financial intermediary governs how your non-public personal information is shared with unaffiliated third parties.
INVESTMENT ADVISER
Friess Associates, LLC
P.O. Box 576
Jackson, WY 83001
DISTRIBUTOR
Foreside Fund Services, LLC
Three Canal Plaza, Suite 100
Portland, ME 04101
CUSTODIAN
U.S. Bank N.A.
1555 North Rivercenter Drive, Suite 302
Milwaukee, WI 53212
ADMINISTRATOR, FUND ACCOUNTANT
AND TRANSFER AGENT
U.S. Bancorp Fund Services, LLC
615 East Michigan Street
Milwaukee, WI 53202
INDEPENDENT REGISTERED PUBLIC ACCOUNTING FIRM
Cohen & Company, Ltd.
342 Water Street, Suite 830
Milwaukee, WI 53202
LEGAL COUNSEL
Stradley Ronon Stevens & Young, LLP
2005 Market Street, Suite 2600
Philadelphia, PA 19103
This report is submitted for the general information of the shareholders of the Funds. It is not authorized for distribution to
prospective investors unless preceded or accompanied by an effective prospectus, which includes information regarding the Funds’
risks, objectives, fees and expenses, experience of its management, and other information.
The Funds’ Statement of Additional Information contains additional information about the Funds’ trustees and
is available without charge upon request by calling 1-855-656-3017.
Item 2. Code of Ethics.
The Registrant has adopted a code of ethics that applies to the Registrant’s principal executive
officer and principal financial officer. The Registrant has not made any substantive amendments
to its code of ethics during the period covered by this report.
The Registrant has not granted any waivers from any provisions of the code of ethics during the period covered by this report.
A copy of the Registrant’s code of ethics that applies to the Registrant’s principal executive officer and principal financial officer is filed herewith.
Item 3. Audit Committee Financial Expert.
The Registrant’s Board of Trustees has determined that there is at least one audit committee financial expert serving on its audit committee. Leonard M. Rush is the “audit committee financial expert” and is considered to be “independent” as each term is defined in Item 3 of Form N-CSR.
Item 4. Principal Accountant Fees and Services.
The Registrant has engaged its principal accountant to perform audit services, audit-related services, tax services and other services during the past fiscal period. “Audit services” refer to performing an audit of the Registrant's annual financial statements or services that are normally provided by the accountant in connection with statutory and regulatory filings or engagements for those fiscal periods. “Audit-related services” refer to the assurance and related services by the principal accountant that are reasonably related to the performance of the audit. “Tax services” refer to professional services rendered by the principal accountant for tax compliance, tax advice, and tax planning; including reviewing the Funds’ tax returns and distribution calculations. There were no “other services” provided by the principal accountant. For the fiscal years ended December 31, 2021 and December 31, 2020, the Funds’ principal accountant was Cohen & Company, Ltd. The following table details the aggregate fees billed or expected to be billed for each of the last fiscal period audit fees, audit-related fees, tax fees and other fees by the principal accountant.
| | FYE 12/31/2021 | FYE 12/31/2020 |
(a) Audit Fees | $47,000 | $16,000 |
(b) Audit-Related Fees | $615 | $0 |
(c) Tax Fees | $10,500 | $ 3,000 |
(d) All Other Fees | $0 | $0 |
(e (1) The audit committee has adopted pre-approval policies and procedures that require the audit committee to pre‑approve all audit and non‑audit services of the Registrant, including services provided to any entity affiliated with the Registrant.
(e)(2) The percentage of fees billed by Cohen & Company, Ltd. applicable to non-audit services pursuant to waiver of pre-approval requirement was as follows:
| | FYE 12/31/2021 | FYE 12/31/2020 |
Audit-Related Fees | 0% | 0% |
Tax Fees | 0% | 0% |
All Other Fees | 0% | 0% |
(f) All of the principal accountant’s hours spent on auditing the Registrant’s financial statements were attributed to work performed by full‑time permanent employees of the principal accountant.
(g) The following table indicates the non-audit fees billed or expected to be billed by the Registrant’s accountant for services to the Registrant and to the Registrant’s investment adviser (and any other controlling entity, etc.—not sub-adviser) for the last year.
Non-Audit Related Fees | FYE 12/31/2021 | FYE 12/31/2020 |
Registrant | $0 | $0 |
Registrant’s Investment Adviser | $0 | $0 |
(h) The audit committee of the board of trustees/directors has considered whether the provision of non-audit services that were rendered to the Registrant's investment adviser is compatible with maintaining the principal accountant's independence and has concluded that the provision of such non-audit services by the accountant has not compromised the accountant’s independence.
(i) Not applicable.
(j) Not applicable.
Item 5. Audit Committee of Listed Registrants.
Not applicable to Registrants who are not listed issuers (as defined in Rule 10a-3 under the Securities Exchange Act of 1934).
Item 6. Investments.
(a) Schedule of Investments is included as part of the report to shareholders filed under Item 1 of this Form.
(b) Not applicable
Item 7. Disclosure of Proxy Voting Policies and Procedures for Closed-End Management Investment Companies.
Not applicable to open-end investment companies.
Item 8. Portfolio Managers of Closed-End Management Investment Companies.
Not applicable to open-end investment companies.
Item 9. Purchases of Equity Securities by Closed‑End Management Investment Company and Affiliated Purchasers.
Not applicable to open-end investment companies.
Item 10. Submission of Matters to a Vote of Security Holders.
There have been no material changes to the procedures by which shareholders may recommend nominees to the Registrant’s board of trustees.
Item 11. Controls and Procedures.
(a) | The Registrant’s President and Treasurer have reviewed the Registrant's disclosure controls and procedures (as defined in Rule 30a-3(c) under the Investment Company Act of 1940 (the “Act”)) as of a date within 90 days of the filing of this report, as required by Rule 30a-3(b) under the Act and Rules 13a-15(b) or 15d‑15(b) under the Securities Exchange Act of 1934. Based on their review, such officers have concluded that the disclosure controls and procedures are effective in ensuring that information required to be disclosed in this report is appropriately recorded, processed, summarized and reported and made known to them by others within the Registrant and by the Registrant’s service provider. |
(b) | There were no significant changes in the Registrant's internal control over financial reporting (as defined in Rule 30a-3(d) under the Act) that occurred during the period covered by this report that has materially affected, or is reasonably likely to materially affect, the Registrant's internal control over financial reporting. |
Item 12. Disclosure of Securities Lending Activities for Closed-End Management Investment Companies
Not applicable to open-end investment companies.
Item 13. Exhibits.
(3) Any written solicitation to purchase securities under Rule 23c‑1 under the Act sent or given during the period covered by the report by or on behalf of the Registrant to 10 or more persons. Not applicable to open-end investment companies.
(4) Change in the Registrant’s independent public accountant. There was no change in the Registrant’s independent public accountant for the period covered by this report.
SIGNATURES
Pursuant to the requirements of the Securities Exchange Act of 1934 and the Investment Company Act of 1940, the Registrant has duly caused this report to be signed on its behalf by the undersigned, thereunto duly authorized.
(Registrant) Managed Portfolio Series
By (Signature and Title)* /s/Brian R. Wiedmeyer
Brian R. Wiedmeyer, President
Date February 9, 2022
Pursuant to the requirements of the Securities Exchange Act of 1934 and the Investment Company Act of 1940, this report has been signed below by the following persons on behalf of the Registrant and in the capacities and on the dates indicated.
By (Signature and Title)* /s/Brian R. Wiedmeyer
Brian R. Wiedmeyer, President
Date February 9, 2022
By (Signature and Title)* /s/Benjamin J. Eirich
Benjamin J. Eirich, Treasurer
Date February 9, 2022
* Print the name and title of each signing officer under his or her signature.