| | Olstein |
| | All Cap Value Fund |
| | |
| | Olstein |
| | Strategic Opportunities Fund |
| | |
| | |
| | |
| | |
| | |
| | |
| | ANNUAL REPORT |
| | |
| | JUNE 30, 2022 |
| | |
| | |
| | |
| | |
| | |
| | |
| | |
| | |
| | |
| | |
| |  |
| | |
| | The Olstein Funds |
CONTENTS
| 3 | | Letters to Shareholders |
| | | |
| | | |
| 14 | | Value of $10,000 Investment |
| | | |
| | | |
| 20 | | Expense Examples |
| | | |
| | | |
| 23 | | Schedules of Investments |
| | | |
| | | |
| 32 | | Statements of Assets |
| | | and Liabilities |
| | | |
| | | |
| 34 | | Statements of Operations |
| | | |
| | | |
| 36 | | Statements of Changes |
| | | in Net Assets |
| | | |
| | | |
| 40 | | Financial Highlights |
| | | |
| | | |
| 46 | | Notes to Financial Statements |
| | | |
| | | |
| 58 | | Report of Independent |
| | | Registered Public Accounting Firm |
| | | |
| | | |
| 59 | | Additional Information |
| | | |
| | | |
| 71 | | Privacy Policy |
OLSTEIN FUNDS
Letter to Shareholders
THE CURRENT ENVIRONMENT IS A VALUE INVESTOR’S DREAM
August 5, 2022
Dear Fellow Shareholders:
We are pleased to report that earlier this year Olstein Capital Management, L.P., promoted Timothy S. Kang and John D. Sullivan, Jr., to the role of Portfolio Manager on the investment team which manages the Olstein All Cap Value and Olstein Strategic Opportunities Funds. Tim and John have been with the firm for more than 16 years and over that time they have developed a keen understanding of Olstein’s unique accounting-driven approach to value investing. We believe these promotions have strengthened the investment team here at Olstein, and we invite you to visit our website at https://www.olsteinfunds.com/about-us/leadership-team to review Tim’s and John’s backgrounds.
MARKET ENVIRONMENT
A combination of negative factors severely hampered U.S. equity markets during the Funds’ fiscal year ended June 30, 2022. Inflation, rising interest rates, tighter financial conditions and recession risks have weighed heavily on equity markets and triggered periods of severe volatility and sell-offs during the past twelve months. Compounding these factors was the Russian invasion of Ukraine, which shocked equity markets and forced the broad S&P 500 Index into correction territory in February. The ongoing conflict in the Ukraine has severely impacted commodities prices, particularly oil and gas prices, contributing to a surge in inflation and further disrupting the global supply chain.
We expect investor nervousness and doubts about the global economy to weigh heavily on equity markets in the near term, causing periods of increased market volatility. Yet, despite the challenges and uncertainty weighing on markets, as value investors we see an environment full of opportunity. As we have said many times before, we believe that a difficult economic environment provides the best time to find good investment ideas at the right price.
We remain focused on individual companies and their operations and prospects for maintaining or growing sustainable free cash flow. A majority of current market prognosticators are issuing daily warnings of an imminent recession, higher interest rates, continued market volatility, continued prod-
uct shortages, and increasing rates of inflation. The overall economic pessimism has led to a 20% market correction in the S&P 500 Index (from December 2021 through June 2022) and has resulted in future growth prospects being called into question. The overall doubts about future growth have resulted in momentum and high growth-oriented stocks (which generally had outstanding performance for the last five years) suffering the brunt of the last year’s poor stock market performance.
STRATEGY
Then why are we extremely long-term bullish about the Funds’ current portfolios despite the continued pessimistic environment and market decline? As we have said many times before, we believe a difficult environment provides the best time to find good investment ideas at the right discounts (because paying the right price determines the degree of our long-term investment returns). Although we expect investor nervousness and doubts about the global economy to affect equity markets in the near term (creating extreme volatility), as value investors we believe the indiscriminate selling taking place in reaction to the current negativity has resulted in many high-quality companies’ market values being unfairly punished by the indiscriminate selling creating material discounts to intrinsic value. During the current market correction, we have been able to add to our positions or purchase new holdings at material discounts which we believe have sound financials, unique business models, and management focused on adding shareholder value.
The pessimism is creating bargain prices in good companies. We believe the price you pay for good companies is the main determinant of above-average future returns. Although short-term returns during periods of pessimism are often disappointing, patience is the most important attribute of successful value investors. In our 27-year history, we have been through many similar negative periods that have disrupted and adversely affected equity markets. During these periods, we strive to buy high-quality companies at the right discounted price. As always, we are company oriented and have no interest in the conventional market or stock timing suggested by many in the analyst community or the media every minute of the day. We believe overall market timing is a long-term failure process. We have yet to find anybody or any service that has been able to time overall market directions with enough regularity and/or precision to make the timing of stock markets a profitable long-term endeavor. We believe that the major determinant of long-term returns is paying the right price that provides enough of a discount to stack the risk-reward ratio in our favor. The discount we require is a function of our assessment of the risk taken to correctly estimate the future cash flow that we believe is necessary to justify our estimate of long-term value.
The current market malaise has enabled our Funds to add to their portfolios strong balance sheet companies with some of these companies offering over 4% dividend yields and price-earnings ratios under eight times and future free cash flow yields of 10% or more. We believe our strong emphasis and experience over the years in valuing companies utilizing our unique accounting-based inferential analysis of financial statements, footnotes, management disclosures, and management assumptions have provided the Funds with a decided advantage in valuing companies. Most companies today report adjusted earnings – that is, GAAP (generally accepted accounting principles) earnings adjusted by the company’s management – and most analysts use these management-adjusted earnings to value companies. Our valuations are based on our estimate of a company’s normalized ability to produce future free cash flow which in many cases can deviate materially from management-reported earnings. We will continue to make our own adjustments to management reported earnings using our methodology of performing an inferential look behind the numbers of financial statements, footnotes, management disclosures, etc., looking for clues that our estimate of a company’s future normalized free cash flow is not being appropriately reflected in a company’s current public market price.
Throughout our history, we have concentrated on analyzing risk (which we define as permanent loss of capital) before considering potential gains. Our attempt to control losses includes paying the right price and forensically examining management accounting assumptions to produce our own adjusted numbers. As previously stated, we believe our knowledge and experience in accounting and finance give the Funds a decided advantage versus those analysts who focus mainly on management’s adjusted earnings to value companies. Is the fox guarding the chicken coop?
The FANG (Facebook, Apple, Netflix, and Google), medical, and social media stocks have declined sharply in the past year as many investors are now questioning whether their future growth and earnings can justify the high prices they climbed to. For example, Netflix investors experienced a five-fold price increase over the last seven years, valuing the company at $313 billion dollars at the peak price. Of course, based on 20/20 hindsight, we wished we had bought NFLX around $200 a share and sold it at its high. However, our discipline rejected taking the risk based on our inability to accept that the price to free cash flow ratio at the time was indicative of a realistic valuation of Netflix’s intrinsic value. In essence, although Netflix was a successful young high-growth company, we were not willing to take the risk that the company’s future expenditures necessary to build a competitive library would allow the company to produce the amount of future free cash flow necessary to justify its lofty market prices. When Netflix stunned shareholders in April of 2022 by reporting its first customer decline in more than a decade, the stock crashed, reducing NFLX’S market capitalization by $35 billion in one day. Many ana-
lysts then began to cut the company’s estimated market value by up to $100 billion in one day. The stock fell back from an all-time high of almost $700 a share (achieved only one and a half years ago) and was trading around $225 a share in June of 2022. We estimate that at its all-time high, many analysts and Netflix investors were valuing the company at 200 times free cash flow despite clear signs that heavy competition was entering their marketplace. Many Netflix analysts and investors obviously missed the signs that companies with stronger libraries than Netflix, such as Disney, Paramount, and Warner, were in the process of building their own competitive offerings which would require increased spending by Netflix to stay competitive.
As in the past, we have used the current pessimistic environment to add to the portfolios free cash flow companies whose market prices have been driven down to the point that their prices have little to do with the company’s future ability to generate either current or future free cash flow.
As previously stated, throughout our history managing the Funds, we have concentrated on analyzing risk before weighing potential capital gains. The number and size of losses are more important to future returns than a few oversized gains. Paying the right price in combination with a forensic accounting analysis of the financial statements to determine the conservatism of the balance sheet and whether or not the financial statements or management’s adjusted earnings are in accord with economic reality is another technique we utilize in our attempt to limit risk.
ALL CAP VALUE FUND
For the twelve-month reporting period ended June 30, 2022, Adviser Class shares of the Olstein All Cap Value Fund depreciated -15.76%; load-waived Class A shares depreciated -15.99% and load-waived Class C shares depreciated -16.62%.1 The Fund’s primary benchmark, the Russell 3000® Value
1 | The performance data quoted represents past performance and does not guarantee future results. The Olstein All Cap Value Fund’s Class C average annual return for the one-year, five-year, and ten-year periods ended 06/30/22, assuming reinvestment of dividends and capital gain distributions and deduction of the Olstein All Cap Value Fund’s maximum CDSC of 1% during the one-year period, was -16.62%, 6.07%, and 9.26%, respectively. Pursuant to the Fund’s prospectus dated 10/28/21, the expense ratio for the Olstein All Cap Value Fund Class C was 2.14%. Performance and expense ratios for other share classes will vary due to differences in sales charge structure and class expenses. The investment return and principal value of an investment will fluctuate so that an investor’s shares, when redeemed, may be worth more or less than their original cost. Current performance may be lower or higher than performance quoted. To obtain performance data current to the most recent month end, please go to our website at www.olsteinfunds.com. |
Index, fell -7.46% and the Fund’s secondary benchmark, Russell 3000® Index fell -13.87%, during the same time period.
PORTFOLIO REVIEW
As of June 30, 2022, the Olstein All Cap Value Fund’s portfolio consisted of 85 holdings with an average weighted market capitalization of $144.16 billion. During the twelve-month reporting period, the Fund initiated positions in six companies and eliminated its holdings in seven companies. Positions initiated during the past fiscal year include: ABM Industries, Cushman & Wakefield plc, FIS (Fidelity National Information Services), Fortive Corp., Hormel Foods, and The Scotts Miracle-Gro Company. Positions eliminated during the reporting period include Accenture plc, Aon plc, Dollar Tree, Inc., JetBlue Airways Corp., Keysight Technologies, Lowes Companies, and The Timken Company.
During the reporting period, the All Cap Value Fund sold its holdings in Accenture plc, Aon plc, Dollar Tree, Inc., Keysight Technologies and Lowe’s as the price of each company’s stock reached its valuation level. The Fund eliminated its holdings in JetBlue to reduce the portfolio’s exposure to the airline industry. Although we continue to see a significant discount in the stock of The Timken Company, the Fund eliminated its holding in Timken and used the proceeds to invest in opportunities that we believed offered a better risk-reward tradeoff.
Our Leaders
The Olstein All Cap Value Fund’s leading performers for the twelve-month reporting period ended June 30, 2022, include: Dollar Tree, Inc., Lowe’s, Keysight Technologies, UnitedHealth Group, and Aon plc. At the close of the fiscal year the Fund continued to maintain a position in UnitedHealth Group.
Our Laggards
Laggards during the twelve-month reporting period include: Meta Platforms Inc., JetBlue Airways, Generac Holdings, Stanley Black & Decker, and Denny’s Corp. At the close of the fiscal year the Fund continued to maintain positions in Meta Platforms Inc., Generac Holdings, Stanley Black & Decker, and Denny’s Corp.
THE OLSTEIN STRATEGIC OPPORTUNITIES FUND
For the twelve-month reporting period ended June 30, 2022, Adviser Class shares of the Strategic Opportunities Fund depreciated -27.65%; load-waived Class A shares depreciated -27.83% and load-waived Class C shares depreciated -28.38%.2 The Fund’s primary benchmark, the Russell 2500® Value Index, fell -13.19% and the Fund’s secondary benchmark, Russell 2500® Index, fell -21.00%, during the same time period.
PORTFOLIO REVIEW
As of June 30, 2022, the Olstein Strategic Opportunities Fund portfolio consisted of 40 holdings with an average weighted market capitalization of $4.51 billion. During the reporting period, the Fund initiated positions in two companies and eliminated five holdings. The Fund initiated positions in ABM Industries, and Cushman & Wakefield plc. The Fund eliminated its holdings in CoreCard Corp., JetBlue Airways, Keysight Technologies, Korn/Ferry International, and UFP Technologies, Inc. The Fund sold its holdings in CoreCard Corp., Keysight Technologies, Korn/Ferry International, and UFP Technologies, Inc. as the price of each company’s stock reached our valuation levels. During the extreme volatility that characterized equity markets during the last half of the fiscal year, the Fund eliminated its holdings in JetBlue in order to take advantage of perceived better risk-reward opportunities in other companies. It was a tough year for many small-cap funds after achieving outstanding performance the previous year.
Our Leaders
Leading performers for the twelve-month reporting period include: UFP Technologies, Prestige Consumer Healthcare, Keysight Technologies,
2 | The performance data quoted represents past performance and does not guarantee future results. The Olstein Strategic Opportunities Fund Class C return as of 06/30/22 for the one-year, five-year, and ten-year periods, assuming deduction of the maximum Class C contingent deferred sales charge of 1% during the one-year period, was -28.38%, 2.65% and 7.53%, respectively. Per the Fund’s 10/28/21 prospectus, the gross expense ratio for the Class C share was 2.46% and the net expense ratio was 2.35%. The Adviser has contractually agreed to waive certain fees/expenses until October 28, 2022. Performance would have been lower without waivers in effect. Expense ratios for other share classes will vary. Performance for other share classes will vary due to differences in sales charge structure and class expenses. The investment return and principal value of an investment will fluctuate so that an investor’s shares, when redeemed, may be worth more or less than their original cost. Current performance may be lower or higher than performance quoted. To obtain performance data current to the most recent month end, please visit our website at www.olsteinfunds.com. |
Korn/Ferry International, and WESCO International. At the close of the fiscal year the Fund continued to maintain positions in Prestige Consumer Healthcare and WESCO International.
Our Laggards
Laggards during the twelve-month reporting period include: Big Lots Inc., Blue Bird Corp., JetBlue Airways, The Shyft Group, and Generac Holdings. At the close of the fiscal year, the Fund continued to maintain positions in Big Lots Inc., Blue Bird Corp., The Shyft Group, and Generac Holdings.
FINAL THOUGHTS
We believe the current period is no different than others we have experienced over the past 27 years. As has happened many times in the past, we see above-average undervaluation opportunities becoming more plentiful during this period of market pessimism. We intend to stay the course utilized over our past 27 years of buying and selling securities based on discounts to our calculation of intrinsic value after an exhaustive fundamental analysis of a company’s business, management, financial statements, and quality of earnings (defined as financial statements that are in accord with economic reality). We believe that markets are at the beginning of at least a three-to-five-year trend in which company fundamentals, free cash flow levels, and realistic accounting assumptions again become more important to valuing a company than quarterly earnings beats and misses. The probability of the permanent loss of capital (risk) should again be considered before selecting individual stocks or investment advisors. We believe that managers performing fundamental research should again be valued rather than just relying on index investing (S&P 500 Index was heavily influenced by FANG Stocks) or managers who only focus on high-growth companies without considering the price paid for this growth. While the style box treats growth stocks and value stocks as different categories for diversification purposes, we believe investing according to the style box philosophy won’t necessarily accomplish its diversification goal because growth is merely a component of value.
The intrinsic value of a company is determined by the difference between the company’s market price and its discounted normalized future ability to produce free cash flow. To characterize “value” as being in or out of style is a misuse of the word when it comes to investing. Whether a stock is undervalued, fairly valued, or overvalued is determined by whether or not its constantly changing market price is fairly valuing the company’s future free cash flow. Thus, individual stocks can fall in and out of value territory as their prices and free cash flow change. A rapidly growing good company can become overvalued if its stock price increases are a result of unrealistic future free cash flow assumptions that are not realistic. Overvalued high-growth
free cash flow companies can take precipitous falls when it becomes apparent that their growth rates may be slowing down. Remember Netflix investors lost $35 billion of dollars of cumulative market value when the latest earnings report revealed a slowdown in Netflix’s growth rate. Another example would be Microsoft and Cisco investors who paid ridiculously overvalued prices during the internet boom in 1999. Despite continued free cash flow growth in both companies, the growth rate eventually slowed. Microsoft and Cisco investors had to wait ten years just to get even. Great young high growth companies often attract speculators who are attracted to the constant high earnings growth but rarely pay attention to value. The stampede into these stocks can eventually result in periods of extreme overvaluation. Paying the wrong price even for good companies can become very costly to long-term investment results.
As short-term economic news and events overwhelm equity markets from time to time (recently the pandemic), we believe it is important that we maintain perspective and take advantage of the short-term noise affecting individual stock prices which can have little to do with long-term values.
Growth companies are not a separate investment category from value companies. Growth companies can be undervalued or overvalued, and we continue to believe that growth rates by themselves are merely factors to consider when valuing a company.
Throughout our 27-year history, we have experienced many investment panics that led to indiscriminate selling. However, we were able to weather the intermittent storms and panics by following our long-term looking behind-the-numbers investment philosophy, which relies on paying the right price in order to put the risk-reward ratios in our favor. Remember, great growth companies can become overvalued, and paying the wrong price could become costly to long-term investment results.
We value your trust and remind you that your money is invested alongside ours as we work hard to accomplish the Funds’ objectives of long-term capital appreciation. We invite you to look at the chart on page 11 showing how a patient investor who invested in our initial fund – the All Cap Value Fund – since its inception in September 1995 would have fared.
Sincerely,
 |  |
| | |
| Robert A. Olstein | Eric R. Heyman |
| Chairman and Chief Investment Officer | Co-Lead Portfolio Manager |
The following chart illustrates the growth, on a quarterly basis, of a hypothetical $10,000 investment made in the Olstein All Cap Value Fund’s Class C share at the Olstein All Cap Value Fund’s inception date of September 21, 1995 (with dividends and capital gain distributions reinvested but no deduction of taxes on reinvested distributions—see important disclosures below):
(UNAUDITED)
| | Value of Shares |
| | Owned, If Initial |
| | Investment |
| Date | was $10,000 |
| 9/21/95 | $10,000 |
| 9/30/95 | 10,010 |
| 12/31/95 | 10,261 |
| 3/31/96 | 10,882 |
| 6/30/96 | 11,462 |
| 9/30/96 | 11,713 |
| 12/31/96 | 12,760 |
| 3/31/97 | 13,327 |
| 6/30/97 | 14,602 |
| 9/30/97 | 17,250 |
| 12/31/97 | 17,205 |
| 3/31/98 | 19,851 |
| 6/30/98 | 18,468 |
| 9/30/98 | 15,499 |
| 12/31/98 | 19,788 |
| 3/31/99 | 20,717 |
| 6/30/99 | 25,365 |
| 9/30/99 | 23,675 |
| 12/31/99 | 26,692 |
| 3/31/00 | 28,170 |
| 6/30/00 | 28,899 |
| 9/30/00 | 30,596 |
| 12/31/00 | 30,142 |
| 3/31/01 | 30,207 |
| 6/30/01 | 36,192 |
| 9/30/01 | 28,213 |
| 12/31/01 | 35,340 |
| 3/31/02 | 38,259 |
| 6/30/02 | 33,797 |
| 9/30/02 | 25,870 |
| 12/31/02 | 28,528 |
| 3/31/03 | 26,226 |
| 6/30/03 | 31,448 |
| 9/30/03 | 33,797 |
| 12/31/03 | 38,853 |
| 3/31/04 | 40,870 |
| 6/30/04 | 41,297 |
| 9/30/04 | 39,043 |
| 12/31/04 | 43,146 |
| 3/31/05 | 42,640 |
| 6/30/05 | 42,302 |
| 9/30/05 | 43,749 |
| 12/31/05 | 44,350 |
| 3/31/06 | 46,566 |
| 6/30/06 | 44,241 |
| 9/30/06 | 46,836 |
| 12/31/06 | 50,755 |
| 3/31/07 | 51,863 |
| 6/30/07 | 55,536 |
| 9/30/07 | 53,029 |
| 12/31/07 | 49,012 |
| 3/31/08 | 42,447 |
| 6/30/08 | 40,189 |
| 9/30/08 | 38,452 |
| 12/31/08 | 27,545 |
| 3/31/09 | 24,767 |
| 6/30/09 | 30,102 |
| 9/30/09 | 35,648 |
| 12/31/09 | 37,741 |
| 3/31/10 | 40,392 |
| 6/30/10 | 35,788 |
| 9/30/10 | 39,695 |
| 12/31/10 | 43,845 |
| 3/31/11 | 45,276 |
| 6/30/11 | 45,310 |
| 9/30/11 | 37,497 |
| 12/31/11 | 41,962 |
| 3/31/12 | 48,519 |
| 6/30/12 | 45,555 |
| 9/30/12 | 47,159 |
| 12/31/12 | 48,380 |
| 3/31/13 | 54,275 |
| 6/30/13 | 56,786 |
| 9/30/13 | 60,379 |
| 12/31/13 | 65,995 |
| 3/31/14 | 66,867 |
| 6/30/14 | 69,134 |
| 9/30/14 | 69,413 |
| 12/31/14 | 75,913 |
| 3/31/15 | 77,290 |
| 6/30/15 | 75,525 |
| 9/30/15 | 66,631 |
| 12/31/15 | 68,694 |
| 3/31/16 | 70,220 |
| 6/30/16 | 68,859 |
| 9/30/16 | 73,312 |
| 12/31/16 | 76,612 |
| 3/31/17 | 80,372 |
| 6/30/17 | 82,232 |
| 9/30/17 | 82,438 |
| 12/31/17 | 87,561 |
| 3/31/18 | 86,683 |
| 6/30/18 | 86,815 |
| 9/30/18 | 91,553 |
| 12/31/18 | 77,934 |
| 3/31/19 | 87,094 |
| 6/30/19 | 91,214 |
| 9/30/19 | 91,699 |
| 12/31/19 | 99,092 |
| 3/31/20 | 67,832 |
| 6/30/20 | 82,811 |
| 9/30/20 | 89,674 |
| 12/31/20 | 109,015 |
| 3/31/21 | 126,682 |
| 6/30/21 | 132,404 |
| 9/30/21 | 130,095 |
| 12/31/21 | 136,354 |
| 3/31/22 | 131,948 |
| 6/30/22 | 110,399 |
Details:
The performance data quoted represents past performance and does not guarantee future results. The Olstein All Cap Value Fund’s Class C average annual return for the one-year, five-year, and ten-year periods ended 06/30/22, assuming reinvestment
of dividends and capital gain distributions and deduction of the Olstein All Cap Value Fund’s maximum CDSC of 1% during the one-year period, was -16.62%, 6.07%, and 9.26%, respectively. Pursuant to the Fund’s prospectus dated 10/28/21, the expense ratio for the Olstein All Cap Value Fund Class C was 2.14%. Performance and expense ratios for other share classes will vary due to differences in sales charge structure and class expenses. The investment return and principal value of an investment will fluctuate so that an investor’s shares, when redeemed, may be worth more or less than their original cost. Current performance may be lower or higher than performance quoted. To obtain performance data current to the most recent month end, please go to our website at www.olsteinfunds.com.
The above represents the opinion of the Manager and is not intended to be a forecast of future events, a guarantee of future results, or investment advice. The references to securities are not buy or sell recommendations but are intended to be descriptive examples of the Funds’ investment philosophy and are subject to change. Do not make investments based on the securities referenced. A full schedule of Fund holdings as of 06/30/22 is contained in this report and is subject to change. This information should be preceded or accompanied by a current prospectus, which contains more complete information, including investment objectives, risks, charges, and expenses of the Olstein Funds and should be read carefully before investing. A current prospectus may be obtained by calling (800) 799-2113 or visiting the Olstein Funds’ website at www.olsteinfunds.com.
The Olstein Funds follow a value-oriented investment approach. However, a particular value stock may not increase in price as the Investment Manager anticipates and may actually decline in price if other investors fail to recognize the stock’s value or if a catalyst that the Investment Manager believes will increase the price of the stock does not occur or does not affect the price of the stock in the manner or to the degree that the Investment Manager anticipated. Also, the Investment Manager’s calculation of a stock’s private market value involves estimates of future cash flow which may prove to be incorrect and, therefore, could result in sales of the stock at prices lower than the Fund’s original purchase price. The investment return and principal value of an investment will fluctuate so that an investor’s shares, when redeemed, may be worth more or less than their original cost. There is no assurance that the Fund will achieve its investment objective.
Regarding the Olstein Strategic Opportunities Fund, an investment in a portfolio containing small- and mid-cap companies is subject to additional risks, as the share prices of small- and mid-cap companies are often more volatile than those of larger companies due to several factors, including limited trading volumes, products, financial resources, management inexperience and less publicly available information. The activist strategy invests in stocks of underperforming companies and any
shareholder activism might not result in a change in performance or corporate governance. These stocks could also experience less liquidity and higher share price and trading volume volatility than stocks of other companies.
The Russell 3000® Index is an unmanaged index that seeks to represent the broad U.S. equity universe accounting for approximately 98% of the U.S. market capitalization. The Russell 3000® Value Index measures the performance of the broad value segment of U.S. equity value universe. It includes those Russell 3000® companies with lower price-to-book ratios and lower forecasted growth values. The Russell 3000® Value Index is constructed to provide a comprehensive and unbiased barometer of the broad value market. The S&P 500® Index is an unmanaged index created by Standard & Poor’s Corporation that includes a representative sample of 500 leading companies in leading industries of the U.S. economy and is considered to be a broad-based indicator representing the U.S. stock market performance in general. The Russell 2500® Index measures the performance of the small to mid-cap segment of the U.S. equity universe, commonly referred to as “SMID” cap. The Russell 2500® Index is a subset of the Russell 3000® Index. It includes approximately 2,500 of the smallest securities based on a combination of their market cap and current index membership. The Russell 2500® Value Index measures the performance of the small to mid-cap value segment of the U.S. equity universe. It includes those Russell 2500® companies that are considered more value oriented relative to the overall market as defined by Russell’s leading style methodology. The Russell 2500® Value Index is constructed to provide a comprehensive and unbiased barometer of the small to mid-cap value market. Past performance does not guarantee future results. Index returns do not reflect payment of any expenses, fees or sales charges an investor would pay to purchase the securities the Index represents. Such costs would lower performance. One cannot invest directly in an index. Cash flow is the net amount of cash and cash-equivalents being transferred into and out of a business. At the most fundamental level, a company’s ability to create value for shareholders is determined by its ability to generate positive cash flows, or more specifically, maximize long-term free cash flow. Free cash flow represents the cash a company generates after accounting for cash outflows to support operations and maintain its capital assets. Unlike earnings or net income, free cash flow is a measure of profitability that excludes the non-cash expenses of the income statement and includes spending on equipment and assets as well as changes in working capital from the balance sheet. The price-earnings ratio (P/E ratio) is the ratio for valuing a company that measures its current share price relative to its per-share earnings.
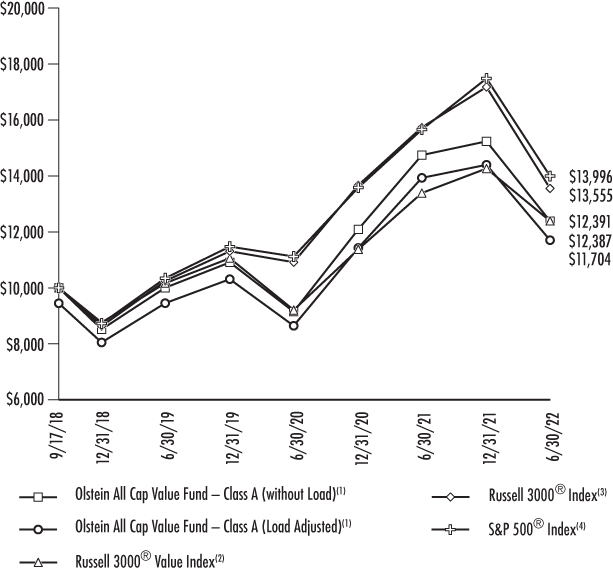
Value of $10,000 Investment (Unaudited)
Comparison of the Change in Value of a Hypothetical $10,000 Investment from the Fund’s Class A shares from Inception through the Fiscal Year End of June 30, 2022. The returns listed in the table do not reflect the deduction of taxes on reinvested dividends.
| | Average Annual Rate of Return For Periods Ended June 30, 2022 | |
| | | 1 Year | 3 Year | Inception(5) | |
| | Olstein All Cap Value – Class A (without Load)(1) | -15.99% | 7.38% | 5.82% | |
| | Olstein All Cap Value – Class A (Load Adjusted)(1) | -20.62% | 5.38% | 4.25% | |
| | Russell 3000® Value Index(2) | -7.46% | 6.82% | 5.83% | |
| | Russell 3000® Index(3) | -13.87% | 9.77% | 8.37% | |
| | S&P 500® Index(4) | -10.62% | 10.60% | 9.29% | |
| (1) | Assumes reinvestment of dividends and capital gains. Reflects the effect of the maximum sale load charge of 5.50% in load adjusted return. Past performance is not necessarily indicative of future results. Investment returns and principal values may fluctuate, so that, when redeemed, shares may be worth more or less than their original cost. |
| (2) | The Russell 3000® Value Index return is adjusted upward to reflect reinvested dividends, but does not reflect the deduction of any fees or expenses associated with investments in the index, and thus represents a “gross return”. One cannot invest directly in an index. |
| (3) | The Russell 3000® Index reflects the broad U.S. equity universe and represents approximately 98% of the U.S. market. The Russell 3000® Index return is adjusted upward to reflect reinvested dividends, but does not reflect the deduction of any fees or expenses associated with investments in the index, and thus represents a “gross return”. One cannot invest directly in an index. |
| (4) | The S&P 500® Index return is adjusted upward to reflect reinvested dividends, but does not reflect the deduction of any fees or expenses associated with investment in the index, and thus represents a “gross return”. One cannot invest directly in an index. |
| (5) | Commenced operations on September 17, 2018. |
| OLSTEIN ALL CAP VALUE FUND |
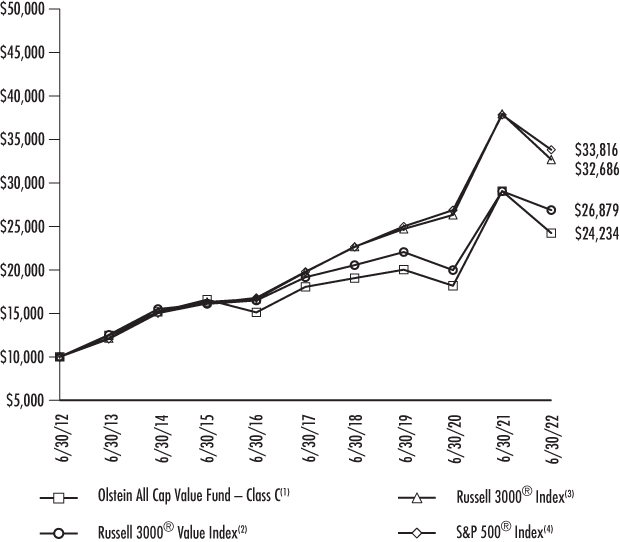
Value of $10,000 Investment (Unaudited)
Comparison of the Change in Value of a Hypothetical $10,000 Investment from the Fund’s Class C for the past 10 years through the Fiscal Year End of June 30, 2022. The line chart does not reflect any applicable Contingent Deferred Sales Charge. The returns listed in the table do not reflect the deduction of taxes on reinvested dividends.
| | Average Annual Rate of Return For Periods Ended June 30, 2022 | |
| | | 1 Year | 5 Year | 10 Year | 15 Year | Inception(5) | |
| | Olstein All Cap Value – Class C(1) | -17.31% | 6.07% | 9.26% | 4.69% | 9.38% | |
| | Russell 3000 Value® Index(2) | -7.46% | 7.01% | 10.39% | 6.06% | 8.79% | |
| | Russell 3000® Index(3) | -13.87% | 10.60% | 12.57% | 8.36% | 9.18% | |
| | S&P 500® Index(4) | -10.62% | 11.31% | 12.96% | 8.54% | 9.27% | |
| (1) | Assumes reinvestment of dividends and capital gains. Also includes all expenses at the end of each period and assumes the deduction of the appropriate CDSC as if an investor had redeemed at the end of the one year period, and thus represents a “net return”. The CDSC is based on the lesser of the original purchase price and the value of such shares at the time of redemption. Past performance is not necessarily indicative of future results. Investment returns and principal values may fluctuate, so that, when redeemed, shares may be worth more or less than their original cost. |
| (2) | The Russell 3000® Value Index return is adjusted upward to reflect reinvested dividends, but does not reflect the deduction of any fees or expense associated with investments in the index, and thus represents a “gross return”. One cannot invest directly in an index. |
| (3) | The Russell 3000® Index reflects the broad U.S. equity universe and represents approximately 98% of the U.S. market. The Russell 3000® Index return is adjusted upward to reflect reinvested dividends, but does not reflect the deduction of any fees or expenses associated with investments in the index, and thus represents a “gross return”. One cannot invest directly in an index. |
| (4) | The S&P 500® Index return is adjusted upward to reflect reinvested dividends, but does not reflect the deduction of any fees or expenses associated with investment in the index, and thus represents a “gross return”. One cannot invest directly in an index. |
| (5) | Commenced operations on September 21, 1995. |
| OLSTEIN ALL CAP VALUE FUND |
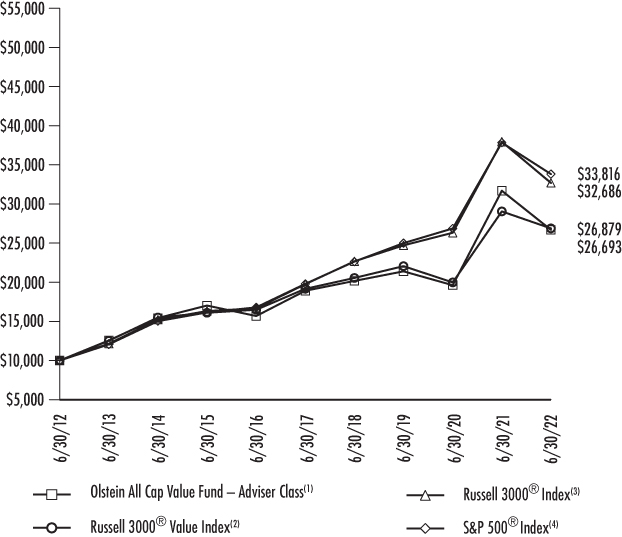
Value of $10,000 Investment (Unaudited)
Comparison of the Change in Value of a Hypothetical $10,000 Investment from the Fund’s Adviser Class for the past 10 years through the Fiscal Year End of June 30, 2022. The returns listed in the table do not reflect the deduction of taxes on reinvested dividends.
| | Average Annual Rate of Return For Periods Ended June 30, 2022 | |
| | | 1 Year | 5 Year | 10 Year | 15 Year | Inception(5) | |
| | Olstein All Cap Value – | | | | | | |
| | Adviser Class(1) | -15.76% | 7.14% | 10.32% | 5.63% | 7.72% | |
| | Russell 3000® Value Index(2) | -7.46% | 7.01% | 10.39% | 6.06% | 7.02% | |
| | Russell 3000® Index(3) | -13.87% | 10.60% | 12.57% | 8.36% | 7.05% | |
| | S&P 500® Index(4) | -10.62% | 11.31% | 12.96% | 8.54% | 6.78% | |
| (1) | Assumes reinvestment of dividends and capital gains. Also includes all expenses at the end of each period and thus represents a “net return”. Past performance is not necessarily indicative of future results. Investment returns and principal values may fluctuate, so that, when redeemed, shares may be worth more or less than their original cost. |
| (2) | The Russell 3000® Value Index return is adjusted upward to reflect reinvested dividends, but does not reflect the deduction of any fees or expense associated with investments in the index, and thus represents a “gross return”. One cannot invest directly in an index. |
| (3) | The Russell 3000® Index reflects the broad U.S. equity universe and represents approximately 98% of the U.S. market. The Russell 3000® Index return is adjusted upward to reflect reinvested dividends, but does not reflect the deduction of any fees or expenses associated with investments in the index, and thus represents a “gross return”. One cannot invest directly in an index. |
| (4) | The S&P 500® Index return is adjusted upward to reflect reinvested dividends, but does not reflect the deduction of any fees or expenses associated with investment in the index, and thus represents a “gross return”. One cannot invest directly in an index. |
| (5) | Commenced operations on September 21, 1999. |
| OLSTEIN ALL CAP VALUE FUND |
Value of $10,000 Investment (Unaudited)
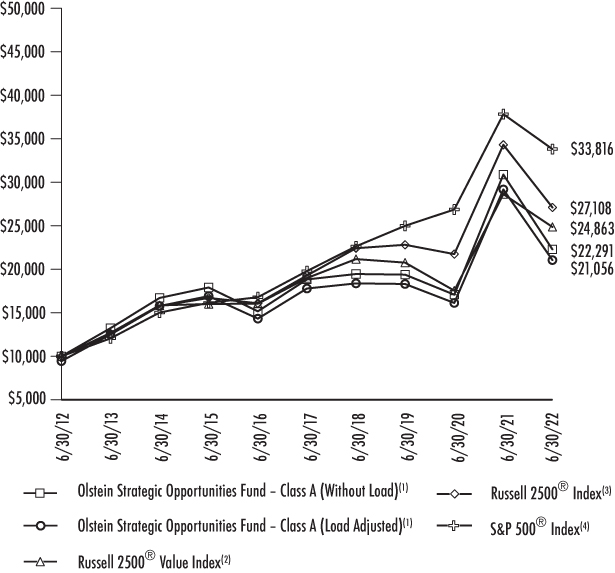
Comparison of the Change in Value of a Hypothetical $10,000 Investment from the Fund’s Class A Inception through the Fiscal Year End of June 30, 2022. The returns listed in the table do not reflect the deduction of taxes on reinvested dividends.
| | Average Annual Rate of Return For Periods Ended June 30, 2022 | |
| | | 1 Year | 5 Year | 10 Year | 15 Year | Inception(5) | |
| | Olstein Strategic Opportunities – | | | | | | |
| | Class A (without Load)(1) | -27.83% | 3.43% | 8.35% | 5.33% | 6.29% | |
| | Olstein Strategic Opportunities – | | | | | | |
| | Class A (Load Adjusted)(1) | -31.80% | 2.27% | 7.73% | 4.93% | 5.91% | |
| | Russell 2500® Value Index(2) | -13.19% | 5.54% | 9.54% | 6.19% | 6.69% | |
| | Russell 2500® Index(3) | -21.00% | 7.04% | 10.49% | 7.29% | 7.89% | |
| | S&P 500® Index(4) | -10.62% | 11.31% | 12.96% | 8.54% | 8.91% | |
| (1) | Assumes reinvestment of dividends and capital gains. Reflects the effect of the maximum sale load charge of 5.50% in load adjusted return. Past performance is not necessarily indicative of future results. Investment returns and principal values may fluctuate, so that, when redeemed, shares may be worth more or less than their original cost. |
| (2) | The Russell 2500® Value Index return is adjusted upward to reflect reinvested dividends, but does not reflect the deduction of any fees or expenses associated with investments in the index, and thus represents a “gross return”. One cannot invest directly in an index. |
| (3) | The Russell 2500® Index measures the performance of the 2,500 smallest companies in the Russell 3000® Index. The Russell 2500® Index return is adjusted upward to reflect reinvested dividends, but does not reflect the deduction of any fees or expenses associated with investments in the index, and thus represents a “gross return”. One cannot invest directly in an index. |
| (4) | The S&P 500® Index return is adjusted upward to reflect reinvested dividends, but does not reflect the deduction of any fees or expenses associated with investment in the index, and thus represents a “gross return”. One cannot invest directly in an index. |
| (5) | Commencement of operation was November 1, 2006. |
| OLSTEIN STRATEGIC OPPORTUNITIES FUND |
| |
Value of $10,000 Investment (Unaudited)
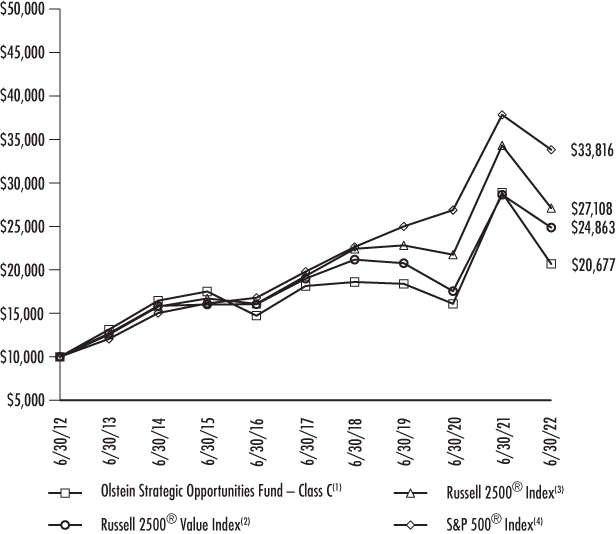
Comparison of the Change in Value of a Hypothetical $10,000 Investment from the Fund’s Class C Inception through the Fiscal Year End of June 30, 2022. The line chart does not reflect any applicable Contingent Deferred Sales Charge. The returns listed in the table do not reflect the deduction of taxes on reinvested dividends.
| | Average Annual Rate of Return For Periods Ended June 30, 2022 | |
| |
| 1 Year | 5 Year | 10 Year | 15 Year | Inception(5) | |
| | Olstein Strategic Opportunities – | | | | | | |
| | Class C(1) | -29.02% | 2.65% | 7.53% | 4.54% | 5.52% | |
| | Russell 2500® Value Index(2) | -13.19% | 5.54% | 9.54% | 6.19% | 6.69% | |
| | Russell 2500® Index(3) | -21.00% | 7.04% | 10.49% | 7.29% | 7.89% | |
| | S&P 500® Index(4) | -10.62% | 11.31% | 12.96% | 8.54% | 8.91% | |
| (1) | Assumes reinvestment of dividends and capital gains. Also includes all expenses at the end of each period and assumes the deduction of the appropriate CDSC as if an investor had redeemed at the end of the one year period, and thus represents a “net return”. The CDSC is based on the lesser of the original purchase price and the value of such shares at the time of redemption. Past performance is not necessarily indicative of future results. Investment returns and principal values may fluctuate, so that, when redeemed, shares may be worth more or less than their original cost. |
| (2) | The Russell 2500® Value Index return is adjusted upward to reflect reinvested dividends, but does not reflect the deduction of any fees or expenses associated with investments in the index, and thus represents a “gross return”. One cannot invest directly in an index. |
| (3) | The Russell 2500® Index measures the performance of the 2,500 smallest companies in the Russell 3000® Index. The Russell 2500® Index return is adjusted upward to reflect reinvested dividends, but does not reflect the deduction of any fees or expenses associated with investments in the index, and thus represents a “gross return”. One cannot invest directly in an index. |
| (4) | The S&P 500® Index return is adjusted upward to reflect reinvested dividends, but does not reflect the deduction of any fees or expenses associated with investment in the index, and thus represents a “gross return”. One cannot invest directly in an index. |
| (5) | Commencement of operations was November 1, 2006. |
| OLSTEIN STRATEGIC OPPORTUNITIES FUND |
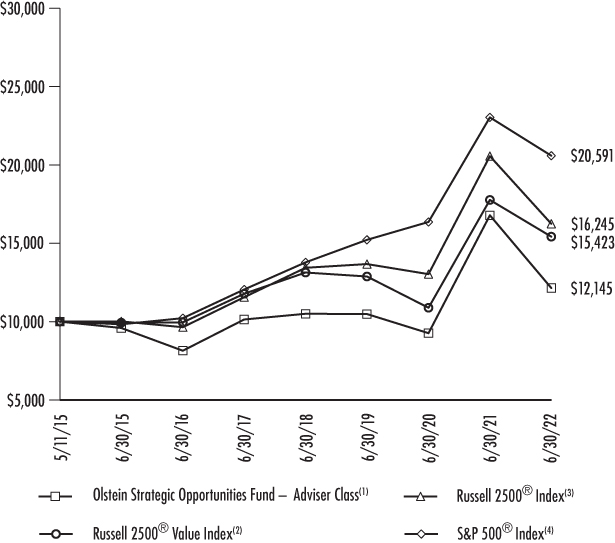
Value of $10,000 Investment (Unaudited)
Comparison of the Change in Value of a Hypothetical $10,000 Investment from the Fund’s Adviser Class shares from Inception through the Fiscal Year End of June 30, 2022. The line chart does not reflect any applicable Contingent Deferred Sales Charge. The returns listed in the table do not reflect the deduction of taxes on reinvested dividends.
| | Average Annual Rate of Return For Periods Ended June 30, 2022 | |
| |
| 1 Year | 3 Year | 5 Year | Inception(5) | |
| | Olstein Strategic Opportunities – | | | | | |
| | Adviser Class(1) | -27.65% | 5.02% | 3.68% | 2.76% | |
| | Russell 2500® Value Index(2) | -13.19% | 6.19% | 5.54% | 6.26% | |
| | Russell 2500® Index(3) | -21.00% | 5.91% | 7.04% | 7.04% | |
| | S&P 500® Index(4) | -10.62% | 10.60% | 11.31% | 10.65% | |
| (1) | Assumes reinvestment of dividends and capital gains. Also include all expense at the end of the period and thus represents a “net return”. Past performance is not necessarily indicative of future results. Investment returns and principal values may fluctuate, so that, when redeemed, shares may be worth more or less than their original cost. |
| (2) | The Russell 2500® Value Index return is adjusted upward to reflect reinvested dividends, but does not reflect the deduction of any fees or expenses associated with investments in the index, and thus represents a “gross return”. One cannot invest directly in an index. |
| (3) | The Russell 2500® Index measures the performance of the 2,500 smallest companies in the Russell 3000® Index. The Russell 2500® Index return is adjusted upward to reflect reinvested dividends, but does not reflect the deduction of any fees or expenses associated with investments in the index, and thus represents a “gross return”. One cannot invest directly in an index. |
| (4) | The S&P 500® Index return is adjusted upward to reflect reinvested dividends, but does not reflect the deduction of any fees or expenses associated with investment in the index, and thus represents a “gross return”. One cannot invest directly in an index. |
| (5) | Commencement of operation was May 11, 2015. |
| OLSTEIN STRATEGIC OPPORTUNITIES FUND |
The Olstein Funds
Expense Examples as of June 30, 2022 (Unaudited)
As a shareholder of a Fund, you incur two types of costs: (1) transaction costs, including brokerage commissions on purchase and sales of Fund shares, sales loads on purchase payments or contingent deferred sales charges on redemptions, if any, and (2) ongoing costs, including management fees, distribution and/or service (12b-1) fees, interest expense and other Fund expenses. This Example is intended to help you understand your ongoing costs (in dollars) of investing in a Fund and to compare these costs with the ongoing costs of investing in other mutual funds. The Example is based on an investment of $1,000 invested at the beginning of the period and held for the entire period, January 1, 2022 – June 30, 2022.
Actual Expenses For each class, the first line of the table provides information about actual account values and actual expenses. You may use the information in this table, together with the amount you invested, to estimate the expenses that you paid over the period. Simply divide your account value by $1,000 (for example, an $8,600 account value divided by $1,000 = 8.6), then multiply the result by the number in the table under the heading entitled “Expenses Paid During Period’’ to estimate the expenses you paid on your account during this period.
Hypothetical Example for Comparison Purposes For each class, the second line of the following table provides information about hypothetical account values and hypothetical expenses based on the Fund’s actual expense ratio and an assumed rate of return of 5% per year before expenses, which is not the Fund’s actual return. The hypothetical account values and expenses may not be used to estimate the actual ending account balance or expenses you paid for the period. You may use this information to compare the ongoing costs of investing in the Fund and other funds. To do so, compare this 5% hypothetical example with the 5% hypothetical examples that appear in the shareholder reports of the other funds.
Please note that the expenses shown in the table are meant to highlight your ongoing costs only and do not reflect any transactional costs. Therefore, the hypothetical information is useful in comparing ongoing costs only, and will not help you determine the relative total costs of owning different funds. In addition, if these transactional costs were included, your costs may have been higher.
Olstein All Cap Value Fund
| | Beginning | Ending | Expenses Paid |
| | Account Value | Account Value | During Period(1) |
| | 1/1/22 | 6/30/22 | 1/1/22 – 6/30/22 |
| Actual | | | |
Class A(2) | $1,000.00 | $ 812.90 | $ 6.38 |
Class C(2) | $1,000.00 | $ 809.70 | $ 9.60 |
Adviser Class(2) | $1,000.00 | $ 813.90 | $ 5.26 |
| Hypothetical (5% annual return | | | |
| before expenses) | | | |
| Class A | $1,000.00 | $1,017.75 | $ 7.10 |
| Class C | $1,000.00 | $1,014.18 | $10.69 |
| Adviser Class | $1,000.00 | $1,018.99 | $ 5.86 |
| (1) | Expenses are equal to the Fund’s annualized expense ratio for the most recent six-month period of 1.42%, 2.14% and 1.17% for Class A, Class C, and Adviser Class, respectively, multiplied by the average account value over the period, multiplied by 181/365 to reflect the one-half year period. |
| (2) | Based on the actual returns for the six-month period ended June 30, 2022 of -18.71%, -19.03%, and -18.61% for the Class A, Class C and the Adviser Class, respectively. |
Olstein Strategic Opportunities Fund
| | Beginning | Ending | Expenses Paid |
| | Account Value | Account Value | During Period(3) |
| | 1/1/22 | 6/30/22 | 1/1/22 – 6/30/22 |
| Actual | | | |
Class A(4) | $1,000.00 | $ 735.00 | $ 6.88 |
Class C(4) | $1,000.00 | $ 732.10 | $10.09 |
Adviser Class(4) | $1,000.00 | $ 735.40 | $ 5.81 |
Hypothetical (5% annual return | | | |
| before expenses) | | | |
| Class A | $1,000.00 | $1,016.86 | $ 8.00 |
| Class C | $1,000.00 | $1,013.14 | $11.73 |
| Adviser Class | $1,000.00 | $1,018.10 | $ 6.76 |
| (3) | Expenses are equal to the Fund’s annualized expense ratio for the most recent six-month period of 1.60%, 2.35% and 1.35% for Class A, Class C, and Adviser Class, respectively, multiplied by the average account value over the period, multiplied by 181/365 to reflect the one-half year period. |
| (4) | Based on the actual returns for the six-month period ended June 30, 2022 of -26.50%, -26.79%, and -26.46% for the Class A, Class C and the Adviser Class, respectively. |
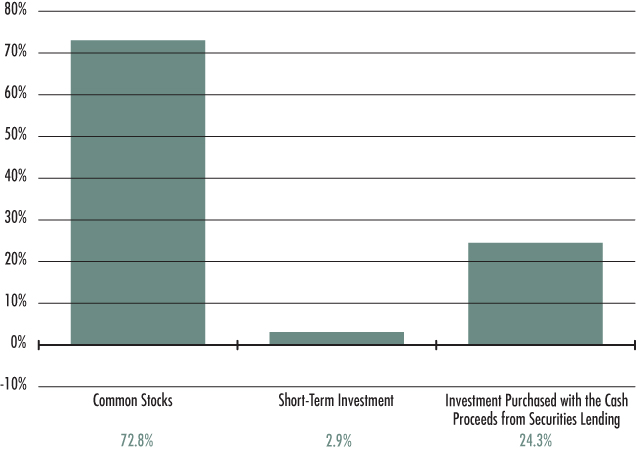
Olstein All Cap Value Fund
Allocation of Portfolio Assets as a Percentage of Investments
June 30, 2022 (Unaudited)
Olstein Strategic Opportunities Fund
Allocation of Portfolio Assets as a Percentage of Investments
June 30, 2022 (Unaudited)
Olstein All Cap Value Fund
Schedule of Investments as of June 30, 2022
| COMMON STOCKS – 93.9% | | | | | | |
| ADVERTISING AGENCIES – 1.3% | | Shares | | | Value | |
Omnicom Group, Inc. (a) | | | 124,000 | | | $ | 7,887,640 | |
| | | | | | | | | |
| AEROSPACE & DEFENSE – 2.1% | | | | | | | | |
L3Harris Technologies, Inc. | | | 20,000 | | | | 4,834,000 | |
Raytheon Technologies Corporation | | | 82,000 | | | | 7,881,020 | |
| | | | | | | | 12,715,020 | |
| | | | | | | | | |
| AIR DELIVERY & FREIGHT SERVICES – 3.2% | | | | | | | | |
FedEx Corporation | | | 43,000 | | | | 9,748,530 | |
United Parcel Service, Inc. – Class B | | | 52,000 | | | | 9,492,080 | |
| | | | | | | | 19,240,610 | |
| | | | | | | | | |
| | | | | | | | | |
| AIRLINES – 2.0% | | | | | | | | |
Delta Air Lines, Inc. (b) | | | 242,000 | | | | 7,010,740 | |
Southwest Airlines Company (b) | | | 139,000 | | | | 5,020,680 | |
| | | | | | | | 12,031,420 | |
| | | | | | | | | |
| AUTO MANUFACTURERS – 1.1% | | | | | | | | |
General Motors Company (b) | | | 206,000 | | | | 6,542,560 | |
| | | | | | | | | |
| AUTOMOBILES – 0.8% | | | | | | | | |
Winnebago Industries, Inc. (a) | | | 97,987 | | | | 4,758,249 | |
| | | | | | | | | |
| BEVERAGES – 0.5% | | | | | | | | |
Keurig Dr. Pepper, Inc. (a) | | | 84,000 | | | | 2,972,760 | |
| | | | | | | | | |
| BUILDING PRODUCTS – 1.1% | | | | | | | | |
Carrier Global Corporation | | | 192,000 | | | | 6,846,720 | |
| | | | | | | | | |
| CAPITAL MARKETS – 1.4% | | | | | | | | |
Goldman Sachs Group, Inc. | | | 27,500 | | | | 8,168,050 | |
| | | | | | | | | |
| CHEMICALS – 3.3% | | | | | | | | |
Corteva, Inc. | | | 157,000 | | | | 8,499,980 | |
Eastman Chemical Company | | | 71,000 | | | | 6,373,670 | |
Scotts Miracle-Gro Company – Class A (a) | | | 59,000 | | | | 4,660,410 | |
| | | | | | | | 19,534,060 | |
The accompanying notes are an integral part of these financial statements.
| OLSTEIN ALL CAP VALUE FUND |
COMMON STOCKS – 93.9% – continued | | | | | | |
| COMMERCIAL BANKS – 4.9% | | Shares | | | Value | |
Citizens Financial Group, Inc. | | | 137,800 | | | $ | 4,918,082 | |
Fifth Third Bancorp | | | 146,000 | | | | 4,905,600 | |
Prosperity Bancshares, Inc. | | | 72,889 | | | | 4,976,132 | |
U.S. Bancorp | | | 160,000 | | | | 7,363,200 | |
Wells Fargo & Company | | | 177,000 | | | | 6,933,090 | |
| | | | | | | | 29,096,104 | |
| | | | | | | | | |
| COMMERCIAL SERVICES – 1.6% | | | | | | | | |
Moody’s Corporation | | | 23,500 | | | | 6,391,295 | |
S&P Global, Inc. | | | 10,000 | | | | 3,370,600 | |
| | | | | | | | 9,761,895 | |
| | | | | | | | | |
| COMMERCIAL SERVICES & SUPPLIES – 1.0% | | | | | | | | |
ABM Industries, Inc. (a) | | | 132,050 | | | | 5,733,611 | |
| | | | | | | | | |
| COMMUNICATIONS EQUIPMENT – 1.8% | | | | | | | | |
Cisco Systems, Inc. | | | 246,000 | | | | 10,489,440 | |
| | | | | | | | | |
| COMPUTERS – 1.9% | | | | | | | | |
Apple, Inc. | | | 48,000 | | | | 6,562,560 | |
Western Digital Corporation (b) | | | 105,000 | | | | 4,707,150 | |
| | | | | | | | 11,269,710 | |
| | | | | | | | | |
| CONSUMER FINANCE – 4.3% | | | | | | | | |
American Express Company | | | 44,000 | | | | 6,099,280 | |
Equifax, Inc. | | | 45,000 | | | | 8,225,100 | |
MasterCard, Inc. – Class A | | | 14,500 | | | | 4,574,460 | |
Visa, Inc. – Class A (a) | | | 33,000 | | | | 6,497,370 | |
| | | | | | | | 25,396,210 | |
| | | | | | | | | |
| CONTAINERS & PACKAGING – 1.2% | | | | | | | | |
WestRock Company | | | 180,650 | | | | 7,197,096 | |
| | | | | | | | | |
| DISTRIBUTORS – 1.3% | | | | | | | | |
LKQ Corporation | | | 158,800 | | | | 7,795,492 | |
| | | | | | | | | |
| DIVERSIFIED FINANCIAL SERVICES – 1.8% | | | | | | | | |
Berkshire Hathaway, Inc. – Class B (b) | | | 11,000 | | | | 3,003,220 | |
Invesco Ltd. (c) | | | 464,200 | | | | 7,487,546 | |
| | | | | | | | 10,490,766 | |
The accompanying notes are an integral part of these financial statements.
| OLSTEIN ALL CAP VALUE FUND |
COMMON STOCKS – 93.9% – continued | | | | | | |
| E-COMMERCE – 1.0% | | Shares | | | Value | |
eBay, Inc. | | | 149,000 | | | $ | 6,208,830 | |
| | | | | | | | | |
| ELECTRICAL EQUIPMENT – 1.5% | | | | | | | | |
Generac Holdings, Inc. (b) | | | 43,000 | | | | 9,054,940 | |
| | | | | | | | | |
| ELECTRONICS – 1.3% | | | | | | | | |
Sensata Technologies Holding PLC (c) | | | 186,850 | | | | 7,718,773 | |
| | | | | | | | | |
| ENERGY EQUIPMENT & SERVICES – 0.4% | | | | | | | | |
Schlumberger Ltd. (c) | | | 75,000 | | | | 2,682,000 | |
| | | | | | | | | |
| ENTERTAINMENT – 1.4% | | | | | | | | |
Warner Bros Discovery, Inc. (b) | | | 609,000 | | | | 8,172,780 | |
| | | | | | | | | |
| FOOD & DRUG RETAILERS – 2.6% | | | | | | | | |
CVS Health Corporation | | | 76,000 | | | | 7,042,160 | |
Walgreens Boots Alliance, Inc. | | | 223,000 | | | | 8,451,700 | |
| | | | | | | | 15,493,860 | |
| | | | | | | | | |
| FOOD PRODUCTS – 0.6% | | | | | | | | |
Hormel Foods Corporation | | | 76,266 | | | | 3,611,958 | |
| | | | | | | | | |
| HEALTH CARE EQUIPMENT & SUPPLIES – 6.5% | | | | | | | | |
Baxter International, Inc. | | | 140,000 | | | | 8,992,200 | |
Becton, Dickinson and Company | | | 38,000 | | | | 9,368,140 | |
Hologic, Inc. (b) | | | 92,000 | | | | 6,375,600 | |
Medtronic PLC (c) | | | 77,000 | | | | 6,910,750 | |
Zimmer Biomet Holdings, Inc. | | | 66,034 | | | | 6,937,532 | |
| | | | | | | | 38,584,222 | |
| | | | | | | | | |
| HEALTH CARE PROVIDERS & SERVICES – 3.3% | | | | | | | | |
Quest Diagnostics Inc. | | | 67,400 | | | | 8,962,852 | |
UnitedHealth Group, Inc. | | | 10,000 | | | | 5,136,300 | |
Universal Health Services, Inc. – Class B (a) | | | 54,000 | | | | 5,438,340 | |
| | | | | | | | 19,537,492 | |
| | | | | | | | | |
| HOTELS, RESTAURANTS & LEISURE – 1.9% | | | | | | | | |
Booking Holdings, Inc. (b) | | | 3,800 | | | | 6,646,162 | |
Denny’s Corporation (a)(b) | | | 555,970 | | | | 4,825,820 | |
| | | | | | | | 11,471,982 | |
The accompanying notes are an integral part of these financial statements.
| OLSTEIN ALL CAP VALUE FUND |
COMMON STOCKS – 93.9% – continued | | | | | | |
| HOUSEHOLD DURABLES – 1.2% | | Shares | | | Value | |
Mohawk Industries, Inc. (b) | | | 59,206 | | | $ | 7,346,873 | |
| | | | | | | | | |
| HOUSEHOLD PRODUCTS – 2.5% | | | | | | | | |
Kimberly-Clark Corporation (a) | | | 58,000 | | | | 7,838,700 | |
Reynolds Consumer Products, Inc. (a) | | | 262,750 | | | | 7,165,192 | |
| | | | | | | | 15,003,892 | |
| | | | | | | | | |
| INDUSTRIAL EQUIPMENT WHOLESALE – 1.3% | | | | | | | | |
WESCO International, Inc. (b) | | | 72,400 | | | | 7,754,040 | |
| | | | | | | | | |
| INSURANCE – 2.4% | | | | | | | | |
Marsh & McLennan Companies, Inc. | | | 16,000 | | | | 2,484,000 | |
Travelers Companies, Inc. | | | 27,000 | | | | 4,566,510 | |
Willis Towers Watson PLC (c) | | | 37,000 | | | | 7,303,430 | |
| | | | | | | | 14,353,940 | |
| | | | | | | | | |
| INTERACTIVE MEDIA & SERVICES – 1.1% | | | | | | | | |
Meta Platforms, Inc. – Class A (b) | | | 42,000 | | | | 6,772,500 | |
| | | | | | | | | |
| INTERNET SOFTWARE & SERVICES – 2.0% | | | | | | | | |
Alphabet, Inc. – Class C (b) | | | 5,400 | | | | 11,812,230 | |
| | | | | | | | | |
| IT SERVICES – 2.0% | | | | | | | | |
Automatic Data Processing, Inc. | | | 16,000 | | | | 3,360,640 | |
Fidelity National Information Services, Inc. | | | 93,700 | | | | 8,589,479 | |
| | | | | | | | 11,950,119 | |
| | | | | | | | | |
| MACHINERY – 2.9% | | | | | | | | |
Cummins, Inc. | | | 39,300 | | | | 7,605,729 | |
Fortive Corp. | | | 69,059 | | | | 3,755,428 | |
Stanley Black & Decker, Inc. (a) | | | 58,000 | | | | 6,081,880 | |
| | | | | | | | 17,443,037 | |
| | | | | | | | | |
| MATERIALS – 0.9% | | | | | | | | |
Axalta Coating Systems Ltd. (b)(c) | | | 231,000 | | | | 5,107,410 | |
| | | | | | | | | |
| MEDIA – 3.4% | | | | | | | | |
Comcast Corporation – Class A | | | 195,000 | | | | 7,651,800 | |
Walt Disney Company (b) | | | 75,000 | | | | 7,080,000 | |
Paramount Global (a) | | | 216,000 | | | | 5,330,880 | |
| | | | | | | | 20,062,680 | |
The accompanying notes are an integral part of these financial statements.
| OLSTEIN ALL CAP VALUE FUND |
COMMON STOCKS – 93.9% – continued | | | | | | |
| PHARMACEUTICALS – 1.8% | | Shares | | | Value | |
Johnson & Johnson | | | 61,000 | | | $ | 10,828,110 | |
| | | | | | | | | |
| REAL ESTATE MANAGEMENT & DEVELOPMENT – 3.1% | | | | | | | | |
CBRE Group, Inc. – Class A (b) | | | 88,000 | | | | 6,477,680 | |
Cushman & Wakefield PLC (b)(c) | | | 289,050 | | | | 4,405,122 | |
Jones Lang LaSalle, Inc. (b) | | | 44,000 | | | | 7,693,840 | |
| | | | | | | | 18,576,642 | |
| | | | | | | | | |
| RESTAURANTS – 2.8% | | | | | | | | |
Cracker Barrel Old Country Store, Inc. (a) | | | 70,500 | | | | 5,886,045 | |
Dine Brands Global, Inc. (a) | | | 108,000 | | | | 7,028,640 | |
McDonald’s Corporation | | | 15,000 | | | | 3,703,200 | |
| | | | | | | | 16,617,885 | |
| | | | | | | | | |
| SEMICONDUCTORS & SEMICONDUCTOR EQUIPMENT – 3.2% | | | | | | | | |
Intel Corporation | | | 218,000 | | | | 8,155,380 | |
Kulicke and Soffa Industries, Inc. (a) | | | 147,000 | | | | 6,293,070 | |
Texas Instruments, Inc. | | | 30,500 | | | | 4,686,325 | |
| | | | | | | | 19,134,775 | |
| | | | | | | | | |
| SOFTWARE – 3.6% | | | | | | | | |
Microsoft Corporation | | | 22,000 | | | | 5,650,260 | |
Oracle Corporation | | | 95,000 | | | | 6,637,650 | |
SS&C Technologies Holdings, Inc. | | | 160,000 | | | | 9,291,200 | |
| | | | | | | | 21,579,110 | |
| | | | | | | | | |
| TELECOMMUNICATIONS – 1.6% | | | | | | | | |
Corning, Inc. | | | 294,000 | | | | 9,263,940 | |
| | | | | | | | | |
| TEXTILES, APPAREL & LUXURY GOODS – 1.0% | | | | | | | | |
Tapestry, Inc. | | | 205,450 | | | | 6,270,334 | |
| TOTAL COMMON STOCKS (Cost $538,975,065) | | | | | | | 560,341,767 | |
The accompanying notes are an integral part of these financial statements.
| OLSTEIN ALL CAP VALUE FUND |
| SHORT-TERM INVESTMENT – 6.3% | | | | | | |
| MONEY MARKET DEPOSIT ACCOUNT – 6.3% | | Shares | | | Value | |
U.S. Bank N.A., 1.25% (d) | | | | | | |
| Total Money Market Deposit Account | | | 37,606,606 | | | $ | 37,606,606 | |
| TOTAL SHORT-TERM INVESTMENT (Cost $37,606,606) | | | | | | | 37,606,606 | |
| | | | | | | | | |
| INVESTMENT PURCHASED WITH THE CASH | | | | | | | | |
| PROCEEDS FROM SECURITIES LENDING – 10.9% | | | | | | | | |
| | | | | | | | | |
| INVESTMENT COMPANY – 10.9% | | | | | | | | |
Mount Vernon Liquid Assets Portfolio, LLC, 1.64% (e) | | | | | | | | |
| Total Investment Company | | | 64,755,004 | | | | 64,755,004 | |
| TOTAL INVESTMENT PURCHASED WITH THE CASH | | | | | | | | |
| PROCEEDS FROM SECURITIES LENDING (Cost $64,755,004) | | | | | | | 64,755,004 | |
| | | | | | | | | |
| TOTAL INVESTMENTS – 111.1% | | | | | | | | |
| (Cost $641,336,675) | | | | | | | 662,703,377 | |
| OTHER ASSETS & LIABILITIES, NET – (11.1)% | | | | | | | (66,304,185 | ) |
| TOTAL NET ASSETS – 100.0% | | | | | | $ | 596,399,192 | |
| | PLC – Public Limited Company |
| (a) | All or a portion of this security was out on loan at June 30, 2022. Total loaned securities, including those sold and pending settlement, had a value of $62,752,528 at June 30, 2022. |
| (b) | Non-income producing security. |
| (c) | U.S. Dollar-denominated foreign security. |
| (d) | The Money Market Deposit Account (the “MMDA”) is a short-term investment vehicle in which the Fund holds cash balances. The MMDA will bear interest at a variable rate that is determined based on conditions and may change daily and by any amount. The rate shown is as of June 30, 2022. |
| (e) | The rate quoted is the annualized seven-day yield for the Fund as of June 30, 2022. |
The accompanying notes are an integral part of these financial statements.
| OLSTEIN ALL CAP VALUE FUND |
Olstein Strategic Opportunities Fund
Schedule of Investments as of June 30, 2022
| COMMON STOCKS – 95.4% | | | | | | |
| AUTO COMPONENTS – 1.9% | | Shares | | | Value | |
Miller Industries, Inc. | | | 71,000 | | | $ | 1,609,570 | |
| | | | | | | | | |
| AUTO MANUFACTURERS – 2.2% | | | | | | | | |
Blue Bird Corporation (a) | | | 203,000 | | | | 1,869,630 | |
| | | | | | | | | |
| AUTOMOBILES – 2.4% | | | | | | | | |
Winnebago Industries, Inc. (b) | | | 41,300 | | | | 2,005,528 | |
| | | | | | | | | |
| BANKS – 1.4% | | | | | | | | |
First Hawaiian, Inc. (b) | | | 54,000 | | | | 1,226,340 | |
| | | | | | | | | |
| COMMERCIAL BANKS – 7.3% | | | | | | | | |
Citizens Financial Group, Inc. | | | 53,000 | | | | 1,891,570 | |
Home BancShares, Inc. (b) | | | 124,000 | | | | 2,575,480 | |
Prosperity Bancshares, Inc. | | | 26,000 | | | | 1,775,020 | |
| | | | | | | | 6,242,070 | |
| | | | | | | | | |
| COMMERCIAL SERVICES & SUPPLIES – 4.8% | | | | | | | | |
ABM Industries, Inc. (b) | | | 32,803 | | | | 1,424,306 | |
Brady Corporation – Class A | | | 57,000 | | | | 2,692,680 | |
| | | | | | | | 4,116,986 | |
| | | | | | | | | |
| CONTAINERS & PACKAGING – 2.3% | | | | | | | | |
WestRock Company | | | 49,350 | | | | 1,966,104 | |
| | | | | | | | | |
| DIVERSIFIED FINANCIAL SERVICES – 4.0% | | | | | | | | |
Invesco Ltd. (c) | | | 213,000 | | | | 3,435,690 | |
| | | | | | | | | |
| ELECTRICAL EQUIPMENT – 0.8% | | | | | | | | |
Generac Holdings, Inc. (a) | | | 3,410 | | | | 718,078 | |
| | | | | | | | | |
| ELECTRONIC EQUIPMENT, INSTRUMENTS & COMPONENTS – 3.3% | | | | | | | | |
Vishay Intertechnology, Inc. | | | 160,000 | | | | 2,851,200 | |
| | | | | | | | | |
| ELECTRONICS – 3.1% | | | | | | | | |
Sensata Technologies Holding PLC (c) | | | 63,150 | | | | 2,608,727 | |
| | | | | | | | | |
| ENTERTAINMENT – 2.2% | | | | | | | | |
Warner Bros Discovery, Inc. (a) | | | 140,000 | | | | 1,878,800 | |
The accompanying notes are an integral part of these financial statements.
| OLSTEIN STRATEGIC OPPORTUNITIES FUND |
COMMON STOCKS – 95.4% – continued | | | | | | |
| HEALTH CARE EQUIPMENT & SUPPLIES – 2.3% | | Shares | | | Value | |
Zimmer Biomet Holdings, Inc. | | | 18,966 | | | $ | 1,992,568 | |
| | | | | | | | | |
| HEALTH CARE PRODUCTS – 2.9% | | | | | | | | |
Integra LifeSciences Holdings Corporation (a)(b) | | | 45,000 | | | | 2,431,350 | |
| | | | | | | | | |
| HOTELS, RESTAURANTS & LEISURE – 2.3% | | | | | | | | |
Denny’s Corporation (a) | | | 224,200 | | | | 1,946,056 | |
| | | | | | | | | |
| HOUSEHOLD DURABLES – 8.4% | | | | | | | | |
Central Garden & Pet Company – Class A (a)(b) | | | 80,000 | | | | 3,200,800 | |
Lifetime Brands, Inc. | | | 156,767 | | | | 1,730,708 | |
Mohawk Industries, Inc. (a)(b) | | | 18,000 | | | | 2,233,620 | |
| | | | | | | | 7,165,128 | |
| | | | | | | | | |
| HOUSEHOLD PRODUCTS – 2.5% | | | | | | | | |
Reynolds Consumer Products, Inc. (b) | | | 76,800 | | | | 2,094,336 | |
| | | | | | | | | |
| INDUSTRIAL EQUIPMENT WHOLESALE – 3.0% | | | | | | | | |
WESCO International, Inc. (a) | | | 24,000 | | | | 2,570,400 | |
| | | | | | | | | |
| LEISURE PRODUCTS – 2.3% | | | | | | | | |
Johnson Outdoors, Inc. | | | 31,500 | | | | 1,926,540 | |
| | | | | | | | | |
| MACHINERY – 9.7% | | | | | | | | |
Federal Signal Corporation | | | 45,800 | | | | 1,630,480 | |
Gates Industrial Corporation PLC (a)(c) | | | 200,000 | | | | 2,162,000 | |
Graham Corporation | | | 161,000 | | | | 1,114,120 | |
Shyft Group, Inc. | | | 115,000 | | | | 2,137,850 | |
Timken Company | | | 24,000 | | | | 1,273,200 | |
| | | | | | | | 8,317,650 | |
| | | | | | | | | |
| MATERIALS – 2.2% | | | | | | | | |
Axalta Coating Systems Ltd. (a)(c) | | | 85,450 | | | | 1,889,299 | |
| | | | | | | | | |
| PHARMACEUTICALS – 4.2% | | | | | | | | |
Prestige Consumer Healthcare, Inc. (a) | | | 61,000 | | | | 3,586,800 | |
| | | | | | | | | |
| REAL ESTATE MANAGEMENT & DEVELOPMENT – 4.2% | | | | | | | | |
Cushman & Wakefield PLC (a)(c) | | | 98,000 | | | | 1,493,520 | |
Jones Lang LaSalle, Inc. (a) | | | 12,000 | | | | 2,098,320 | |
| | | | | | | | 3,591,840 | |
The accompanying notes are an integral part of these financial statements.
| OLSTEIN STRATEGIC OPPORTUNITIES FUND |
COMMON STOCKS – 95.4% – continued | | | | | | |
| RESTAURANTS – 5.8% | | Shares | | | Value | |
Cracker Barrel Old Country Store, Inc. (b) | | | 23,500 | | | $ | 1,962,015 | |
Dine Brands Global, Inc. (b) | | | 46,000 | | | | 2,993,680 | |
| | | | | | | | 4,955,695 | |
| | | | | | | | | |
| SEMICONDUCTORS & SEMICONDUCTOR EQUIPMENT – 2.6% | | | | | | | | |
Kulicke and Soffa Industries, Inc. (b) | | | 51,000 | | | | 2,183,310 | |
| | | | | | | | | |
| SPECIALTY RETAIL – 1.2% | | | | | | | | |
Big Lots, Inc. (b) | | | 49,000 | | | | 1,027,530 | |
| | | | | | | | | |
| TEXTILES, APPAREL & LUXURY GOODS – 3.5% | | | | | | | | |
Kontoor Brands, Inc. (b) | | | 57,000 | | | | 1,902,090 | |
Tapestry, Inc. | | | 36,550 | | | | 1,115,506 | |
| | | | | | | | 3,017,596 | |
| | | | | | | | | |
| TRANSPORTATION EQUIPMENT – 2.6% | | | | | | | | |
Wabash National Corporation (b) | | | 165,000 | | | | 2,240,700 | |
| TOTAL COMMON STOCKS (Cost $86,979,977) | | | | | | | 81,465,521 | |
| | | | | | | | | |
| SHORT-TERM INVESTMENT – 3.7% | | | | | | | | |
| | | | | | | | | |
| MONEY MARKET DEPOSIT ACCOUNT – 3.7% | | | | | | | | |
U.S. Bank N.A., 1.25% (d) | | | | | | | | |
| Total Money Market Deposit Account | | | 3,181,767 | | | | 3,181,767 | |
| TOTAL SHORT-TERM INVESTMENT (Cost $3,181,767) | | | | | | | 3,181,767 | |
| | | | | | | | | |
| INVESTMENT PURCHASED WITH THE CASH | | | | | | | | |
| PROCEEDS FROM SECURITIES LENDING – 31.9% | | | | | | | | |
| | | | | | | | | |
| INVESTMENT COMPANY – 31.9% | | | | | | | | |
Mount Vernon Liquid Assets Portfolio, LLC, 1.64% (e) | | | | | | | | |
| Total Investment Company | | | 27,204,291 | | | | 27,204,291 | |
| TOTAL INVESTMENT PURCHASED WITH THE CASH | | | | | | | | |
| PROCEEDS FROM SECURITIES LENDING (Cost $27,204,291) | | | | | | | 27,204,291 | |
| | | | | | | | | |
| TOTAL INVESTMENTS – 131.0% | | | | | | | | |
| (Cost $117,366,035) | | | | | | | 111,851,579 | |
| OTHER ASSETS & LIABILITIES, NET – (31.0)% | | | | | | | (26,456,807 | ) |
| TOTAL NET ASSETS – 100.0% | | | | | | $ | 85,394,772 | |
| | PLC – Public Limited Company |
| (a) | Non-income producing security. |
| (b) | All or a portion of this security was out on loan at June 30, 2022. Total loaned securities, including those sold and pending settlement, had a value of $26,323,500 at June 30, 2022. |
| (c) | U.S. Dollar-denominated foreign security. |
| (d) | The Money Market Deposit Account (the “MMDA”) is a short-term investment vehicle in which the Fund holds cash balances. The MMDA will bear interest at a variable rate that is determined based on conditions and may change daily and by any amount. The rate shown is as of June 30, 2022. |
| (e) | The rate quoted is the annualized seven-day yield for the Fund as of June 30, 2022. |
The accompanying notes are an integral part of these financial statements.
| OLSTEIN STRATEGIC OPPORTUNITIES FUND |
The Olstein Funds
Statements of Assets and Liabilities as of June 30, 2022
| | | | | | Olstein | |
| | | Olstein | | | Strategic | |
| | | All Cap | | | Opportunities | |
| | | Value Fund | | | Fund | |
| Assets: | | | | | | |
Investments, at value(1) (at cost $641,336,675 | | | | | | |
| and $117,366,035, respectively) | | $ | 662,703,377 | | | $ | 111,851,579 | |
| Receivable for investment securities sold | | | — | | | | 1,948,362 | |
| Receivable for capital shares sold | | | 203,934 | | | | 69,265 | |
| Dividends and interest receivable | | | 801,413 | | | | 52,131 | |
| Securities lending income receivable | | | 5,537 | | | | 1,532 | |
| Prepaid expenses | | | 60,975 | | | | 28,523 | |
| Total Assets | | $ | 663,775,236 | | | $ | 113,951,392 | |
| | | | | | | | | |
| Liabilities: | | | | | | | | |
| Payable upon return of securities loaned | | | 64,755,004 | | | | 27,204,291 | |
| Payable for investment securities purchased | | | 1,573,326 | | | | — | |
| Payable for capital shares redeemed | | | 151,995 | | | | 1,154,389 | |
| Payable to investment adviser | | | 512,631 | | | | 64,100 | |
| Accrued distribution fees | | | 98,082 | | | | 12,093 | |
| Payable for transfer agent fees & expenses | | | 105,382 | | | | 33,705 | |
| Payable for fund administration & accounting fees | | | 93,402 | | | | 34,808 | |
| Payable for trustee fees | | | 4,007 | | | | 4,122 | |
| Payable for compliance fees | | | 3,122 | | | | 3,121 | |
| Payable for custody fees | | | 18,807 | | | | 2,960 | |
| Payable for audit fees | | | 20,496 | | | | 20,504 | |
| Accrued expenses and other liabilities | | | 39,790 | | | | 22,527 | |
| Total Liabilities | | | 67,376,044 | | | | 28,556,620 | |
| Net Assets | | $ | 596,399,192 | | | $ | 85,394,772 | |
| | | | | | | | | |
| Net Assets Consist of: | | | | | | | | |
| Paid-in capital | | $ | 534,548,462 | | | $ | 92,277,823 | |
| Total distributable earnings (accumulated loss) | | | 61,850,730 | | | | (6,883,051 | ) |
| Total net assets | | $ | 596,399,192 | | | $ | 85,394,772 | |
(1) Includes securities on loan with a value of $62,752,528 and $26,323,500, including those sold and pending settlement, respectively.
The accompanying notes are an integral part of these financial statements.
| | | | | | Olstein | |
| | | Olstein | | | Strategic | |
| | | All Cap | | | Opportunities | |
| | | Value Fund | | | Fund | |
| Class A: | | | | | | |
| Net assets | | $ | 293,746,588 | | | $ | 25,917,038 | |
Shares of beneficial interest outstanding(1) | | | 11,700,335 | | | | 1,442,628 | |
| Net asset value, offering price and redemption price per share | | $ | 25.11 | | | $ | 17.97 | |
Maximum offering price per share(2) | | $ | 26.57 | | | $ | 19.02 | |
| | | | | | | | | |
| Class C: | | | | | | | | |
| Net assets | | $ | 40,368,225 | | | $ | 7,340,745 | |
Shares of beneficial interest outstanding(1) | | | 2,207,298 | | | | 472,961 | |
Net asset value, offering price and redemption price per share(3) | | $ | 18.29 | | | $ | 15.52 | |
| | | | | | | | | |
| Adviser Class: | | | | | | | | |
| Net assets | | $ | 262,284,379 | | | $ | 52,136,989 | |
Shares of beneficial interest outstanding(1) | | | 10,340,357 | | | | 2,845,863 | |
| Net asset value, offering price and redemption price per share | | $ | 25.37 | | | $ | 18.32 | |
| (1) | Unlimited number of shares authorized without par value. |
| (2) | The offering price is calculated by dividing the net asset value by 1 minus the maximum sales charge of 5.50%. |
| (3) | May be subject to a contingent deferred sales charge of 1.00% on certain shares redeemed within 12 months of purchase on Class C shares. |
The accompanying notes are an integral part of these financial statements.
The Olstein Funds
Statements of Operations
For the Year Ended June 30, 2022
| | | | | | Olstein | |
| | | Olstein | | | Strategic | |
| | | All Cap | | | Opportunities | |
| | | Value Fund | | | Fund | |
| Investment Income: | | | | | | |
| Dividend income | | $ | 10,346,944 | | | $ | 1,452,232 | |
| Interest income | | | 29,658 | | | | 3,241 | |
| Securities lending income, net | | | 58,411 | | | | 20,768 | |
| Total investment income | | | 10,435,013 | | | | 1,476,241 | |
| | | | | | | | | |
| Expenses: | | | | | | | | |
| Investment advisory fees (See Note 4) | | | 7,199,701 | | | | 1,220,603 | |
| Fund administration & accounting fees (See Note 4) | | | 490,377 | | | | 140,284 | |
| Transfer agent fees & expenses (See Note 4) | | | 457,669 | | | | 152,482 | |
| Federal & state registration fees | | | 51,234 | | | | 47,961 | |
| Custody fees (See Note 4) | | | 47,579 | | | | 8,131 | |
| Postage & printing fees | | | 31,740 | | | | 13,641 | |
| Audit fees | | | 21,993 | | | | 22,006 | |
| Insurance fees | | | 21,355 | | | | 5,624 | |
| Trustee fees | | | 17,747 | | | | 17,750 | |
| Compliance fees (See Note 4) | | | 12,500 | | | | 12,500 | |
| Legal fees | | | 11,238 | | | | 11,229 | |
| Other expenses | | | 10,297 | | | | 8,210 | |
| Distribution fees (See Note 5) | | | | | | | | |
| Class A | | | 599,931 | | | | 80,875 | |
| Class C | | | 1,675,050 | | | | 123,616 | |
| Total expenses | | | 10,648,411 | | | | 1,864,912 | |
| Plus: adviser recoupment (See Note 4) | | | — | | | | 20,368 | |
| Less: waiver from investment adviser (See Note 4) | | | — | | | | (32,891 | ) |
| Net expenses | | | 10,648,411 | | | | 1,852,389 | |
| Net investment loss | | | (213,398 | ) | | | (376,148 | ) |
| | | | | | | | | |
| Realized and Unrealized Gain (Loss) on Investments: | | | | | | | | |
| Net realized gain on investments | | | 70,911,394 | | | | 5,654,061 | |
| Net change in unrealized appreciation/depreciation on investments | | | (184,504,312 | ) | | | (40,183,177 | ) |
| Net realized and unrealized loss on investments | | | (113,592,918 | ) | | | (34,529,116 | ) |
| Net decrease in net assets resulting from operations | | $ | (113,806,316 | ) | | $ | (34,905,264 | ) |
The accompanying notes are an integral part of these financial statements.
(THIS PAGE INTENTIONALLY LEFT BLANK).
Olstein All Cap Value Fund
Statements of Changes in Net Assets
| | | For the | | | For the | |
| | | Year Ended | | | Year Ended | |
| | | June 30, 2022 | | | June 30, 2021 | |
| Operations: | | | | | | |
| Net investment loss | | $ | (213,398 | ) | | $ | (1,940,765 | ) |
| Net realized gain on investments | | | 70,911,394 | | | | 91,651,975 | |
| Change in unrealized appreciation/depreciation on investments | | | (184,504,312 | ) | | | 200,353,815 | |
| Net increase (decrease) in net assets resulting from operations | | | (113,806,316 | ) | | | 290,065,025 | |
| | | | | | | | | |
| Capital Share Transactions: | | | | | | | | |
| Class A: | | | | | | | | |
| Proceeds from shares sold | | | 240,377,091 | | | | 20,482,197 | |
| Proceeds from reinvestment of distributions | | | 12,289,756 | | | | 436,281 | |
| Payments for shares redeemed | | | (17,399,974 | ) | | | (27,354,921 | ) |
| Increase (Decrease) in net assets resulting | | | | | | | | |
| from Class A transactions | | | 235,266,873 | | | | (6,436,443 | ) |
| Class C: | | | | | | | | |
| Proceeds from shares sold | | | 4,534,840 | | | | 3,833,334 | |
| Proceeds from reinvestment of distributions | | | 44,385,728 | | | | 512,387 | |
| Payments for shares redeemed | | | (252,096,829 | ) | | | (98,162,990 | ) |
| Decrease in net assets resulting from Class C transactions | | | (203,176,261 | ) | | | (93,817,269 | ) |
| Adviser Class: | | | | | | | | |
| Proceeds from shares sold | | | 20,956,327 | | | | 81,948,325 | |
| Proceeds from reinvestment of distributions | | | 40,632,866 | | | | 1,080,886 | |
| Payments for shares redeemed | | | (30,905,718 | ) | | | (24,484,710 | ) |
| Increase in net assets resulting from Adviser Class transactions | | | 30,683,475 | | | | 58,544,501 | |
| Net increase (decrease) in net assets from capital share transactions | | | 62,774,087 | | | | (41,709,211 | ) |
The accompanying notes are an integral part of these financial statements.
| OLSTEIN ALL CAP VALUE FUND |
| | | For the | | | For the | |
| | | Year Ended | | | Year Ended | |
| | | June 30, 2022 | | | June 30, 2021 | |
| Distributions to Shareholders: | | | | | | |
| Class A | | $ | (18,648,736 | ) | | $ | (624,826 | ) |
| Class C | | | (46,222,371 | ) | | | (546,347 | ) |
| Adviser Class | | | (42,013,039 | ) | | | (1,139,976 | ) |
| Total distributions to shareholders | | | (106,884,146 | ) | | | (2,311,149 | ) |
| | | | | | | | | |
| Total increase (decrease) in net assets: | | | (157,916,375 | ) | | | 246,044,665 | |
| | | | | | | | | |
| Net Assets: | | | | | | | | |
| Beginning of year | | | 754,315,567 | | | | 508,270,902 | |
| End of year | | $ | 596,399,192 | | | $ | 754,315,567 | |
The accompanying notes are an integral part of these financial statements.
| OLSTEIN ALL CAP VALUE FUND |
Olstein Strategic Opportunities Fund
Statements of Changes in Net Assets
| | | For the | | | For the | |
| | | Year Ended | | | Year Ended | |
| | | June 30, 2022 | | | June 30, 2021 | |
| Operations: | | | | | | |
| Net investment loss | | $ | (376,148 | ) | | $ | (618,819 | ) |
| Net realized gain on investments | | | 5,654,061 | | | | 12,639,365 | |
| Change in unrealized appreciation/depreciation on investments | | | (40,183,177 | ) | | | 36,986,472 | |
| Net increase (decrease) in net assets resulting from operations | | | (34,905,264 | ) | | | 49,007,018 | |
| | | | | | | | | |
| Capital Share Transactions: | | | | | | | | |
| Class A: | | | | | | | | |
| Proceeds from shares sold | | | 9,803,282 | | | | 6,708,992 | |
| Proceeds from reinvestment of distributions | | | 2,546,684 | | | | — | |
| Payments for shares redeemed | | | (5,112,693 | ) | | | (3,023,261 | ) |
| Increase in net assets resulting from Class A transactions | | | 7,237,273 | | | | 3,685,731 | |
| Class C: | | | | | | | | |
| Proceeds from shares sold | | | 855,452 | | | | 1,497,077 | |
| Proceeds from reinvestment of distributions | | | 1,506,519 | | | | — | |
| Payments for shares redeemed | | | (6,860,256 | ) | | | (4,092,117 | ) |
| Decrease in net assets resulting from Class C transactions | | | (4,498,285 | ) | | | (2,595,040 | ) |
| Adviser Class: | | | | | | | | |
| Proceeds from shares sold | | | 11,776,055 | | | | 43,533,836 | |
| Proceeds from reinvestment of distributions | | | 7,339,658 | | | | — | |
| Payments for shares redeemed | | | (29,708,713 | ) | | | (9,316,947 | ) |
| Increase (Decrease) in net assets resulting | | | | | | | | |
| from Adviser Class transactions | | | (10,593,000 | ) | | | 34,216,889 | |
| Net increase (decrease) in net assets from capital share transactions | | | (7,854,012 | ) | | | 35,307,580 | |
The accompanying notes are an integral part of these financial statements.
| OLSTEIN STRATEGIC OPPORTUNITIES FUND |
| | | For the | | | For the | |
| | | Year Ended | | | Year Ended | |
| | | June 30, 2022 | | | June 30, 2021 | |
| Distributions to Shareholders: | | | | | | |
| Class A | | $ | (3,035,519 | ) | | $ | — | |
| Class C | | | (1,580,780 | ) | | | — | |
| Adviser Class | | | (7,763,051 | ) | | | — | |
| Total distributions to shareholders | | | (12,379,350 | ) | | | — | |
| | | | | | | | | |
| Total increase (decrease) in net assets | | | (55,138,626 | ) | | | 84,314,598 | |
| | | | | | | | | |
| Net Assets | | | | | | | | |
| Beginning of year | | | 140,533,398 | | | | 56,218,800 | |
| End of year | | $ | 85,394,772 | | | $ | 140,533,398 | |
The accompanying notes are an integral part of these financial statements.
| OLSTEIN STRATEGIC OPPORTUNITIES FUND |
Olstein All Cap Value Fund
Financial Highlights
Class A
| | | For the | | | For the | | | For the | | | Period | |
| | | Year | | | Year | | | Year | | | Inception(1) | |
| | | Ended | | | Ended | | | Ended | | | through | |
| | | June 30, | | | June 30, | | | June 30, | | | June 30, | |
| | | 2022 | | | 2021 | | | 2020 | | | 2019 | |
| Net Asset Value, Beginning of Period | | $ | 34.32 | | | $ | 21.40 | | | $ | 24.10 | | | $ | 26.07 | |
| | | | | | | | | | | | | | | | | |
| Investment Operations: | | | | | | | | | | | | | | | | |
Net investment income (loss)(2) | | | 0.01 | | | | (0.01 | ) | | | 0.17 | | | | 0.13 | |
| Net realized and unrealized gain (loss) on investments | | | (4.77 | )(3) | | | 13.06 | | | | (2.12 | ) | | | (0.32 | ) |
| Total from investment operations | | | (4.76 | ) | | | 13.05 | | | | (1.95 | ) | | | (0.19 | ) |
| Less distributions from: | | | | | | | | | | | | | | | | |
| Net investment income | | | — | | | | (0.13 | ) | | | (0.10 | ) | | | — | |
| Net realized gains | | | (4.45 | ) | | | — | | | | (0.65 | ) | | | (1.78 | ) |
| Total distributions | | | (4.45 | ) | | | (0.13 | ) | | | (0.75 | ) | | | (1.78 | ) |
| Net Asset Value, End of Period | | $ | 25.11 | | | $ | 34.32 | | | $ | 21.40 | | | $ | 24.10 | |
| | | | | | | | | | | | | | | | | |
Total Return(4)(5) | | | -15.99 | % | | | 61.15 | % | | | -8.54 | % | | | 0.04 | % |
| | | | | | | | | | | | | | | | | |
| Supplemental Data and Ratios | | | | | | | | | | | | | | | | |
Net assets, end of period (000’s omitted) | | $ | 293,747 | | | $ | 142,863 | | | $ | 93,359 | | | $ | 12,920 | |
Ratio of expenses to average net assets(6) | | | 1.42 | % | | | 1.39 | % | | | 1.40 | % | | | 1.43 | % |
Ratio of net investment income (loss) to average net assets(6) | | | 0.03 | % | | | (0.05 | )% | | | 0.75 | % | | | 0.68 | % |
Portfolio Turnover(5)(7) | | | 43 | % | | | 42 | % | | | 48 | % | | | 39 | % |
| (1) | Inception date of Class A was September 17, 2018. |
| (2) | Per share amounts calculated using the average shares method. |
| (3) | Net realized and unrealized loss per share in this caption is a balancing amount necessary to reconcile changes in net asset value per share for the year, and may not reconcile with the aggregate gain on the Statement of Operations due to share transactions for the year. |
| (4) | Total return does not reflect sales charges. |
| (5) | Not annualized for periods less than one year. |
| (6) | Annualized for periods less than one year. |
| (7) | Portfolio turnover disclosed is for the Fund as a whole. |
The accompanying notes are an integral part of these financial statements.
| OLSTEIN ALL CAP VALUE FUND |
Olstein All Cap Value Fund
Financial Highlights
Class C
| | | For the | | | For the | | | For the | | | For the | | | For the | |
| | | Year | | | Year | | | Year | | | Year | | | Year | |
| | | Ended | | | Ended | | | Ended | | | Ended | | | Ended | |
| | | June 30, | | | June 30, | | | June 30, | | | June 30, | | | June 30, | |
| | | 2022 | | | 2021 | | | 2020 | | | 2019 | | | 2018 | |
| Net Asset Value, Beginning of Year | | $ | 26.38 | | | $ | 16.53 | | | $ | 18.82 | | | $ | 19.79 | | | $ | 19.90 | |
| | | | | | | | | | | | | | | | | | | | | |
| Investment Operations: | | | | | | | | | | | | | | | | | | | | |
Net investment loss(1) | | | (0.18 | ) | | | (0.17 | ) | | | (0.00 | )(2) | | | (0.03 | ) | | | (0.12 | ) |
| Net realized and unrealized | | | | | | | | | | | | | | | | | | | | |
| gain (loss) on investments | | | (3.46 | ) | | | 10.06 | | | | (1.64 | ) | | | 0.84 | | | | 1.22 | |
| Total from investment operations | | | (3.64 | ) | | | 9.89 | | | | (1.64 | ) | | | 0.81 | | | | 1.10 | |
| Less distributions from: | | | | | | | | | | | | | | | | | | | | |
| Net investment income | | | — | | | | (0.04 | ) | | | — | | | | — | | | | — | |
| Net realized gains | | | (4.45 | ) | | | — | | | | (0.65 | ) | | | (1.78 | ) | | | (1.21 | ) |
| Total distributions | | | (4.45 | ) | | | (0.04 | ) | | | (0.65 | ) | | | (1.78 | ) | | | (1.21 | ) |
| Net Asset Value, End of Year | | $ | 18.29 | | | $ | 26.38 | | | $ | 16.53 | | | $ | 18.82 | | | $ | 19.79 | |
| | | | | | | | | | | | | | | | | | | | | |
Total Return(3) | | | -16.62 | % | | | 59.89 | % | | | -9.21 | % | | | 5.07 | % | | | 5.57 | % |
| | | | | | | | | | | | | | | | | | | | | |
| Supplemental Data and Ratios | | | | | | | | | | | | | | | | | | | | |
Net assets, end of year (000’s omitted) | | $ | 40,368 | | | $ | 289,103 | | | $ | 248,420 | | | $ | 400,820 | | | $ | 456,794 | |
Ratio of expenses to average net assets | | | 2.15 | % | | | 2.14 | % | | | 2.15 | % | | | 2.19 | % | | | 2.25 | % |
Ratio of net investment loss to average net assets | | | (0.70 | )% | | | (0.80 | )% | | | (0.00 | )%(5) | | | (0.15 | )% | | | (0.60 | )% |
Portfolio Turnover(4) | | | 43 | % | | | 42 | % | | | 48 | % | | | 39 | % | | | 54 | % |
| (1) | Per share amounts calculated using the average shares method. |
| (2) | Amount rounds to less than $0.01 per share. |
| (3) | Total return does not reflect sales charges. |
| (4) | Portfolio turnover disclosed is for the Fund as a whole. |
| (5) | Amount rounds to less than 0.01% per share. |
The accompanying notes are an integral part of these financial statements.
| OLSTEIN ALL CAP VALUE FUND |
Olstein All Cap Value Fund
Financial Highlights
Adviser Class
| | | For the | | | For the | | | For the | | | For the | | | For the | |
| | | Year | | | Year | | | Year | | | Year | | | Year | |
| | | Ended | | | Ended | | | Ended | | | Ended | | | Ended | |
| | | June 30, | | | June 30, | | | June 30, | | | June 30, | | | June 30, | |
| | | 2022 | | | 2021 | | | 2020 | | | 2019 | | | 2018 | |
| Net Asset Value, Beginning of Year | | $ | 34.54 | | | $ | 21.51 | | | $ | 24.15 | | | $ | 24.64 | | | $ | 24.25 | |
| | | | | | | | | | | | | | | | | | | | | |
| Investment Operations: | | | | | | | | | | | | | | | | | | | | |
Net investment income(1) | | | 0.09 | | | | 0.06 | | | | 0.23 | | | | 0.20 | | | | 0.10 | |
| Net realized and unrealized | | | | | | | | | | | | | | | | | | | | |
| gain (loss) on investments | | | (4.81 | )(2) | | | 13.13 | (2) | | | (2.13 | ) | | | 1.09 | | | | 1.50 | |
| Total from investment operations | | | (4.72 | ) | | | 13.19 | | | | (1.90 | ) | | | 1.29 | | | | 1.60 | |
| Less distributions from: | | | | | | | | | | | | | | | | | | | | |
| Net investment income | | | — | | | | (0.16 | ) | | | (0.09 | ) | | | — | | | | — | |
| Net realized gains | | | (4.45 | ) | | | — | | | | (0.65 | ) | | | (1.78 | ) | | | (1.21 | ) |
| Total distributions | | | (4.45 | ) | | | (0.16 | ) | | | (0.74 | ) | | | (1.78 | ) | | | (1.21 | ) |
| Net Asset Value, End of Year | | $ | 25.37 | | | $ | 34.54 | | | $ | 21.51 | | | $ | 24.15 | | | $ | 24.64 | |
| | | | | | | | | | | | | | | | | | | | | |
| Total Return | | | -15.76 | % | | | 61.49 | % | | | -8.27 | % | | | 6.06 | % | | | 6.66 | % |
| | | | | | | | | | | | | | | | | | | | | |
| Supplemental Data and Ratios | | | | | | | | | | | | | | | | | | | | |
Net assets, end of year (000’s omitted) | | $ | 262,284 | | | $ | 322,350 | | | $ | 166,492 | | | $ | 194,298 | | | $ | 204,963 | |
Ratio of expenses to average net assets | | | 1.16 | % | | | 1.14 | % | | | 1.15 | % | | | 1.19 | % | | | 1.25 | % |
Ratio of net investment income to average net assets | | | 0.29 | % | | | 0.20 | % | | | 1.00 | % | | | 0.85 | % | | | 0.40 | % |
Portfolio Turnover(3) | | | 43 | % | | | 42 | % | | | 48 | % | | | 39 | % | | | 54 | % |
| (1) | Per share amounts calculated using the average shares method. |
| (2) | Net realized and unrealized loss per share in this caption is a balancing amount necessary to reconcile changes in net asset value per share for the year, and may not reconcile with the aggregate gain on the Statement of Operations due to share transactions for the year. |
| (3) | Portfolio turnover disclosed is for the Fund as a whole. |
The accompanying notes are an integral part of these financial statements.
| OLSTEIN ALL CAP VALUE FUND |
Olstein Strategic Opportunities Fund
Financial Highlights
Class A
| | | For the | | | For the | | | For the | | | For the | | | For the | |
| | | Year | | | Year | | | Year | | | Year | | | Year | |
| | | Ended | | | Ended | | | Ended | | | Ended | | | Ended | |
| | | June 30, | | | June 30, | | | June 30, | | | June 30, | | | June 30, | |
| | | 2022 | | | 2021 | | | 2020 | | | 2019 | | | 2018 | |
| Net Asset Value, Beginning of Year | | $ | 27.47 | | | $ | 15.19 | | | $ | 17.24 | | | $ | 17.46 | | | $ | 16.90 | |
| | | | | | | | | | | | | | | | | | | | | |
| Investment Operations: | | | | | | | | | | | | | | | | | | | | |
Net investment loss(1) | | | (0.09 | ) | | | (0.15 | ) | | | (0.01 | ) | | | (0.03 | ) | | | (0.09 | ) |
| Net realized and unrealized | | | | | | | | | | | | | | | | | | | | |
| gain (loss) on investments | | | (6.90 | ) | | | 12.43 | | | | (2.04 | ) | | | (0.05 | ) | | | 0.65 | |
| Total from investment operations | | | (6.99 | ) | | | 12.28 | | | | (2.05 | ) | | | (0.08 | ) | | | 0.56 | |
| Less distributions from: | | | | | | | | | | | | | | | | | | | | |
| Net realized gains | | | (2.51 | ) | | | — | | | | — | | | | (0.14 | ) | | | — | |
| Total distributions | | | (2.51 | ) | | | — | | | | — | | | | (0.14 | ) | | | — | |
| Net Asset Value, End of Year | | $ | 17.97 | | | $ | 27.47 | | | $ | 15.19 | | | $ | 17.24 | | | $ | 17.46 | |
| | | | | | | | | | | | | | | | | | | | | |
Total Return(2) | | | -27.83 | % | | | 80.84 | % | | | -11.89 | % | | | -0.38 | % | | | 3.31 | % |
| | | | | | | | | | | | | | | | | | | | | |
| Supplemental Data and Ratios | | | | | | | | | | | | | | | | | | | | |
Net assets end of year (000’s omitted) | | $ | 25,917 | | | $ | 31,827 | | | $ | 15,873 | | | $ | 17,801 | | | $ | 23,176 | |
Ratio of expenses to average net assets: | | | | | | | | | | | | | | | | | | | | |
| Before expense waiver/recoupment | | | 1.62 | % | | | 1.70 | % | | | 1.81 | % | | | 1.73 | % | | | 1.62 | % |
| After expense waiver/recoupment | | | 1.60 | % | | | 1.60 | % | | | 1.60 | % | | | 1.60 | % | | | 1.60 | % |
Ratio of net investment loss to average net assets: | | | | | | | | | | | | | | | | | | | | |
| After expense waiver/recoupment | | | (0.39 | )% | | | (0.68 | )% | | | (0.07 | )% | | | (0.17 | )% | | | (0.54 | )% |
Portfolio Turnover | | | 32 | % | | | 47 | % | | | 45 | % | | | 35 | % | | | 53 | % |
| (1) | Per share amounts calculated using the average shares method. |
| (2) | Total return does not reflect sales charges. |
The accompanying notes are an integral part of these financial statements.
| OLSTEIN STRATEGIC OPPORTUNITIES FUND |
Olstein Strategic Opportunities Fund
Financial Highlights
Class C
| | | For the | | | For the | | | For the | | | For the | | | For the | |
| | | Year | | | Year | | | Year | | | Year | | | Year | |
| | | Ended | | | Ended | | | Ended | | | Ended | | | Ended | |
| | | June 30, | | | June 30, | | | June 30, | | | June 30, | | | June 30, | |
| | | 2022 | | | 2021 | | | 2020 | | | 2019 | | | 2018 | |
| Net Asset Value, Beginning of Year | | $ | 24.25 | | | $ | 13.52 | | | $ | 15.45 | | | $ | 15.78 | | | $ | 15.39 | |
| | | | | | | | | | | | | | | | | | | | | |
| Investment Operations: | | | | | | | | | | | | | | | | | | | | |
Net investment loss(1) | | | (0.24 | ) | | | (0.28 | ) | | | (0.12 | ) | | | (0.14 | ) | | | (0.20 | ) |
| Net realized and unrealized | | | | | | | | | | | | | | | | | | | | |
| gain (loss) on investments | | | (5.98 | ) | | | 11.01 | | | | (1.81 | ) | | | (0.05 | ) | | | 0.59 | |
| Total from investment operations | | | (6.22 | ) | | | 10.73 | | | | (1.93 | ) | | | (0.19 | ) | | | 0.39 | |
| Less distributions from: | | | | | | | | | | | | | | | | | | | | |
| Net realized gains | | | (2.51 | ) | | | — | | | | — | | | | (0.14 | ) | | | — | |
| Total distributions | | | (2.51 | ) | | | — | | | | — | | | | (0.14 | ) | | | — | |
| Net Asset Value, End of Year | | $ | 15.52 | | | $ | 24.25 | | | $ | 13.52 | | | $ | 15.45 | | | $ | 15.78 | |
| | | | | | | | | | | | | | | | | | | | | |
Total Return(2) | | | -28.38 | % | | | 79.36 | % | | | -12.49 | % | | | -1.12 | % | | | 2.53 | % |
| | | | | | | | | | | | | | | | | | | | | |
| Supplemental Data and Ratios | | | | | | | | | | | | | | | | | | | | |
Net assets end of year (000’s omitted) | | $ | 7,341 | | | $ | 16,515 | | | $ | 11,135 | | | $ | 19,532 | | | $ | 24,484 | |
Ratio of expenses to average net assets: | | | | | | | | | | | | | | | | | | | | |
| Before expense waiver/recoupment | | | 2.35 | % | | | 2.46 | % | | | 2.55 | % | | | 2.48 | % | | | 2.37 | % |
| After expense waiver/recoupment | | | 2.35 | % | | | 2.35 | % | | | 2.35 | % | | | 2.35 | % | | | 2.35 | % |
Ratio of net investment loss to average net assets: | | | | | | | | | | | | | | | | | | | | |
| After expense waiver/recoupment | | | (1.14 | )% | | | (1.43 | )% | | | (0.82 | )% | | | (0.92 | )% | | | (1.29 | )% |
Portfolio Turnover | | | 32 | % | | | 47 | % | | | 45 | % | | | 35 | % | | | 53 | % |
| (1) | Per share amounts calculated using the average shares method. |
| (2) | Total return does not reflect sales charges. |
The accompanying notes are an integral part of these financial statements.
| OLSTEIN STRATEGIC OPPORTUNITIES FUND |
Olstein Strategic Opportunities Fund
Financial Highlights
Adviser Class
| | | For the | | | For the | | | For the | | | For the | | | For the | |
| | | Year | | | Year | | | Year | | | Year | | | Year | |
| | | Ended | | | Ended | | | Ended | | | Ended | | | Ended | |
| | | June 30, | | | June 30, | | | June 30, | | | June 30, | | | June 30, | |
| | | 2022 | | | 2021 | | | 2020 | | | 2019 | | | 2018 | |
| Net Asset Value, Beginning of Year | | $ | 27.89 | | | $ | 15.39 | | | $ | 17.42 | | | $ | 17.60 | | | $ | 16.99 | |
| | | | | | | | | | | | | | | | | | | | | |
| Investment Operations: | | | | | | | | | | | | | | | | | | | | |
Net investment income (loss)(1) | | | (0.03 | ) | | | (0.10 | ) | | | 0.03 | | | | 0.01 | | | | (0.05 | ) |
| Net realized and unrealized | | | | | | | | | | | | | | | | | | | | |
| gain (loss) on investments | | | (7.03 | ) | | | 12.60 | | | | (2.06 | ) | | | (0.05 | ) | | | 0.66 | |
| Total from investment operations | | | (7.06 | ) | | | 12.50 | | | | (2.03 | ) | | | (0.04 | ) | | | 0.61 | |
| Less distributions from: | | | | | | | | | | | | | | | | | | | | |
| Net realized gains | | | (2.51 | ) | | | — | | | | — | | | | (0.14 | ) | | | — | |
| Total distributions | | | (2.51 | ) | | | — | | | | — | | | | (0.14 | ) | | | — | |
| Net Asset Value, End of Year | | $ | 18.32 | | | $ | 27.89 | | | $ | 15.39 | | | $ | 17.42 | | | $ | 17.60 | |
| | | | | | | | | | | | | | | | | | | | | |
| Total Return | | | -27.65 | % | | | 81.22 | % | | | -11.65 | % | | | -0.15 | % | | | 3.59 | % |
| Supplemental Data and Ratios | | | | | | | | | | | | | | | | | | | | |
Net assets end of year (000’s omitted) | | $ | 52,137 | | | $ | 92,191 | | | $ | 29,211 | | | $ | 41,256 | | | $ | 73,788 | |
Ratio of expenses to average net assets: | | | | | | | | | | | | | | | | | | | | |
| Before expense waiver/recoupment | | | 1.36 | % | | | 1.43 | % | | | 1.55 | % | | | 1.48 | % | | | 1.37 | % |
| After expense waiver/recoupment | | | 1.35 | % | | | 1.35 | % | | | 1.35 | % | | | 1.35 | % | | | 1.35 | % |
Ratio of net investment income (loss) | | | | | | | | | | | | | | | | | | | | |
to average net assets: | | | | | | | | | | | | | | | | | | | | |
| After expense waiver/recoupment | | | (0.14 | )% | | | (0.43 | )% | | | 0.18 | % | | | 0.08 | % | | | (0.29 | )% |
Portfolio Turnover | | | 32 | % | | | 47 | % | | | 45 | % | | | 35 | % | | | 53 | % |
| (1) | Per share amounts calculated using the average shares method. |
The accompanying notes are an integral part of these financial statements.
| OLSTEIN STRATEGIC OPPORTUNITIES FUND |
The Olstein Funds
Notes to Financial Statements
| 1 | Organization Managed Portfolio Series (the “Trust”) was organized as a Delaware statutory trust on January 27, 2011. The Trust is registered under the Investment Company Act of 1940, as amended (the “1940 Act”), as an open-end management investment company. The Olstein All Cap Value Fund (“All Cap Value Fund”) and Olstein Strategic Opportunities Fund (“Strategic Fund”) (each a “Fund” and collectively, the “Funds”) are each a diversified series with their own investment objectives and policies within the Trust. The investment objective of each Fund is long-term capital appreciation with a secondary objective of income. The Funds are investment companies and accordingly follow the investment company accounting and reporting guidance of the Financial Accounting Standards Board (“FASB”) Accounting Standards Codification Topic 946, Financial Services – Investment Companies. Each Fund offers three different share classes – Adviser Class, Class A, and Class C. The All Cap Value Fund commenced operations on September 21, 1995. The Class C shares commenced operations on September 21, 1995, the Adviser Class shares commenced operations on September 1, 1999, and the Class A shares commenced operations on September 17, 2018. The Strategic Fund commenced operations on November 1, 2006. The Class A shares and Class C shares each commenced operations on November 1, 2006 and the Adviser Class shares commenced operations on May 11, 2015. Each class of shares has identical rights and privileges except with respect to distribution fees and voting rights on matters affecting a single share class. Class A shares are subject to a front-end sales charge of up to 5.50% and a 0.25% Rule 12b-1 distribution and shareholder servicing fee. Class C shares may be subject to a deferred sales charge of up to 1.00% and are subject to a 1.00% Rule 12b-1 distribution and shareholder servicing fee. The Funds may issue an unlimited number of shares of beneficial interest without par value. |
| | |
| 2 | Significant Accounting Policies The following is a summary of significant accounting policies consistently followed by the Funds in preparation of their financial statements. These policies are in conformity with generally accepted accounting principles in the United States of America (“GAAP”). |
| | Security Valuation. All investments in securities are recorded at their estimated fair value, as described in Note 3. |
| | |
| | Federal Income Taxes. The Funds comply with the requirements of subchapter M of the Internal Revenue Code of 1986, as amended, necessary to qualify as regulated investment companies and distribute substantially all net taxable investment income and net realized gains to shareholders in a manner which results in no tax cost to the Funds. Therefore, no federal income or excise tax provision is required. As of and during the year ended June 30, 2022, the Funds did not have any tax positions that did not meet the “more-likely-than-not” threshold of being sustained by the applicable tax authority. As of and during the year ended June 30, 2022, the Funds did not have liabilities for any unrecognized tax benefits. The Funds recognize interest and penalties, if any, related to unrecognized tax benefits on uncertain tax positions as income tax expense in the Statement of Operations. As of and during the year ended June 30, 2022, the Funds did not incur any interest or penalties. The Funds are not subject to examination by U.S. tax authorities for tax years prior to the fiscal year ended June 30, 2019. |
| | |
| | Security Transactions, Income and Distributions. The Funds follow industry practice and record security transactions on the trade date. Realized gains and losses on sales of securities are calculated on the basis of identified cost. Dividend income is recorded on the ex-dividend date and interest income is recorded on an accrual basis. Withholding taxes on foreign dividends have been provided for in accordance with the Funds’ understanding of the applicable country’s tax rules and regulations. Discounts and premiums on securities purchased are amortized over the expected life of the respective securities using the constant yield method. |
| | |
| | The Funds distribute substantially all net investment income and net realized capital gains, if any, at least annually. Distributions to shareholders are recorded on the ex-dividend date. The treatment for financial reporting purposes of distributions made to shareholders during the year from net investment income or net realized capital gains may differ from their treatment for federal income tax purposes. These differences are caused primarily by differences in the timing of the recognition of certain components of income, expense or realized capital gain for federal income tax purposes. Where such differences are permanent in nature, GAAP requires that they be reclassified in the components of the net assets based on their ultimate characterization for |
| | federal income tax purposes. Any such reclassifications will have no effect on net assets, results of operations on net asset value (“NAV”) per share of the Funds. For the year ended June 30, 2022, the following reclassifications were made: |
| | Fund | | Total Distributable Earnings | | | Paid-In Capital | |
| | All Cap Value Fund | | $ | (3,473,308 | ) | | $ | 3,473,308 | |
| | Strategic Fund | | | (1,058,442 | ) | | | 1,058,442 | |
| | Adjustments to the Funds shown in the above table were due to net operating loss reclassification and the utilization of tax equalization. |
| | |
| | Allocation of Income, Expenses and Gains/Losses. Income, expenses (other than those deemed attributable to a specific share class), and gains and losses of the Funds are allocated daily to each class of shares based upon the ratio of net assets represented by each class as a percentage of the net assets of each Fund. Expenses deemed directly attributable to a class of shares are recorded by the specific class. Most Fund expenses are allocated by class based on relative net assets. 12b-1 fees are expensed at an annual rate of 0.25% and 1.00% of the Class A shares and Class C shares average daily net assets, respectively (See Note 5). Expenses associated with a specific fund in the Trust are charged to that fund. Common Trust expenses are typically allocated evenly between the Funds of the Trust, or by other equitable means. |
| | |
| | Use of Estimates. The preparation of financial statements in conformity with GAAP requires management to make estimates and assumptions that affect the reported amounts of assets and liabilities and disclosure of contingent assets and liabilities at the date of the financial statements and the reported amounts of revenues and expenses during the reporting period. Actual results could differ from those estimates. |
| | |
| 3 | Securities Valuation The Funds have adopted authoritative fair value accounting standards which establish an authoritative definition of fair value and set out a hierarchy for measuring fair value. These standards require additional disclosures about the various inputs and valuation techniques used to develop the measurements of fair value, a discussion in changes in valuation techniques and related inputs during the period and expanded disclosure of valuation Levels for major security types. These inputs are summarized in the three broad Levels listed below: |
| | Level 1 – | Unadjusted quoted prices in active markets for identical assets or liabilities that the Funds have the ability to access. |
| | Level 2 – | Observable inputs other than quoted prices included in Level 1 that are observable for the asset or liability, either directly or indirectly. These inputs may include quoted prices for the identical instrument on an inactive market, prices for similar instruments, interest rates, prepayment speeds, credit risk, yield curves, default rates and similar data. |
| | | |
| | Level 3 – | Unobservable inputs for the asset or liability, to the extent relevant observable inputs are not available, representing the Funds’ own assumptions about the assumptions a market participant would use in valuing the asset or liability, and would be based on the best information available. |
| | Following is a description of the valuation techniques applied to each Fund’s major categories of assets and liabilities measured at fair value on a recurring basis. Each Fund’s investments are carried at fair value. |
| | |
| | Equity Securities. Equity securities that are primarily traded on a national securities exchange are valued at the last sale price on the exchange on which they are primarily traded on the day of valuation or, if there has been no sale on such day, at the mean between the bid and ask prices. Securities traded primarily in the Nasdaq Global Market System for which market quotations are readily available are valued using the Nasdaq Official Closing Price (“NOCP”). If the NOCP is not available, such securities are valued at the last sale price on the day of valuation, or if there has been no sale on such day, at the mean between the bid and ask prices. To the extent these securities are actively traded and valuation adjustments are not applied, they are categorized in Level 1 of the fair value hierarchy. If the market for a particular security is not active, and the mean between bid and ask prices is used, these securities are categorized in Level 2 of the fair value hierarchy. |
| | |
| | Short-Term Investments. Investments in other mutual funds, including money market funds, are valued at their NAV per share. Deposit accounts are valued at acquisition cost, which approximates fair value. To the extent these securities are actively traded and valuation adjustments are not applied, they are categorized in Level 1 of the fair value hierarchy. |
| | |
| | Securities for which market quotations are not readily available, or if the closing price does not represent fair value, are valued following procedures approved by the Board of Trustees (the “Board”). These procedures consider many factors, including the type of security, size of holding, trading volume and news events. There can be no assurance |
| | that the Fund could obtain the fair value assigned to a security if they were to sell the security at approximately the time at which the Fund determines their NAVs per share. The Board has established a Valuation Committee to administer, implement, and oversee the fair valuation process, and to make fair value decisions when necessary. The Board regularly reviews reports of the Valuation Committee that describe any fair value determinations and methods. |
| | |
| | The inputs or methodology used for valuing securities are not an indication of the risk associated with investing in those securities. The following tables are a summary of the inputs used to value each Fund’s securities as of June 30, 2022: |
| | | | Uncategorized | | | Level 1 | | | Level 2 | | | Level 3 | | | Total | |
| | All Cap Value Fund | | | | | | | | | | | | | | | |
| | Common Stocks | | $ | — | | | $ | 560,341,767 | | | $ | — | | | $ | — | | | $ | 560,341,767 | |
| | Short-Term Investment | | | — | | | | 37,606,606 | | | | — | | | | — | | | | 37,606,606 | |
| | Investment Purchased with the Cash | | | | | | | | | | | | | | | | | | | | |
| | Proceeds from Securities Lending* | | | 64,755,004 | | | | — | | | | — | | | | — | | | | 64,755,004 | |
| | Total Investments in Securities | | $ | 64,755,004 | | | $ | 597,948,373 | | | $ | — | | | $ | — | | | $ | 662,703,377 | |
| | | | | | | | | | | | | | | | | |
| | | | Uncategorized | | | Level 1 | | | Level 2 | | | Level 3 | | | Total | |
| | Strategic Fund | | | | | | | | | | | | | | | | | | | | |
| | Common Stocks | | $ | — | | | $ | 81,465,521 | | | $ | — | | | $ | — | | | $ | 81,465,521 | |
| | Short-Term Investment | | | — | | | | 3,181,767 | | | | — | | | | — | | | | 3,181,767 | |
| | Investment Purchased with the Cash | | | | | | | | | | | | | | | | | | | | |
| | Proceeds from Securities Lending* | | | 27,204,291 | | | | — | | | | — | | | | — | | | | 27,204,291 | |
| | Total Investments in Securities | | $ | 27,204,291 | | | $ | 84,647,288 | | | $ | — | | | $ | — | | | $ | 111,851,579 | |
| | * | Certain investments that are measured at fair value using the NAV per share (or its equivalent) as a practical expedient have not been characterized in the fair value hierarchy. The fair value amounts presented in the table are intended to permit reconciliation of the fair value hierarchy to the amount presented in the Statements of Assets and Liabilities. See Note 9 for additional information regarding securities lending activity. |
| | Refer to the Schedule of Investments for further information on the classification of investments. |
| | |
| 4 | Investment Advisory Fee and Other Related Party Transactions The Trust has an agreement with Olstein Capital Management, L.P. (the “Adviser”) to furnish investment advisory services to the Funds. For its services, the All Cap Value Fund pays the Adviser an annualized monthly management fee of 1.00% of the Fund’s average daily net assets up to $1 billion, 0.95% of the Fund’s average daily net assets on the next $500 million, 0.90% of the Fund’s average daily net assets on the next |
| | $500 million, 0.85% of the Fund’s average daily net assets on the next $500 million, 0.80% of the Fund’s average daily net assets on the next $500 million, and 0.75% of the Fund’s average daily net assets in excess of $3 billion. The Strategic Fund pays the Adviser an annualized monthly management fee of 1.00% of the Fund’s average daily net assets. |
| | |
| | The Adviser has contractually agreed to waive a portion or all of its management fees and reimburse the Strategic Fund for its expenses to ensure that total operating expenses (excluding Rule 12b-1 fees, acquired fund fees and expenses, leverage, interest, taxes, brokerage commissions and extraordinary expenses), based upon the average daily net assets of the Fund, do not exceed an annual rate of 1.35%. |
| | |
| | Fees waived and expenses reimbursed by the Adviser may be recouped by the Adviser for a period of thirty-six months following the month during which such waiver or reimbursement was made if such recoupment can be achieved without exceeding the expense limit in effect at the time the waiver or reimbursement occurred. The Operating Expense Limitation Agreement for the Strategic Fund is indefinite in term, but cannot be terminated within a year after the effective date of the prospectus. After that date, the agreement may be terminated at any time upon 60 days’ written notice by the Board or the Adviser, with the consent of the Board. During the year ended June 30, 2022, the Adviser was able to recoup $20,368 from the Strategic Opportunities Fund relating to fees waived in the prior fiscal years. Waived fees subject to potential recovery by month of expiration are as follows: |
| | Expiration – Strategic Fund | | | |
| | July 2022 – June 2023 | | $ | 142,803 | |
| | July 2023 – June 2024 | | | 92,513 | |
| | July 2024 – June 2025 | | | 32,891 | |
| | U.S. Bancorp Fund Services, LLC (the “Administrator”), doing business as U.S. Bank Global Fund Services, acts as the Funds’ Administrator, Transfer Agent, and Fund Accountant. U.S. Bank N.A. (the “Custodian”) serves as the Custodian to the Funds. The Custodian is an affiliate of the Administrator. The Administrator performs various administrative and accounting services for the Funds. The Administrator prepares various federal and state regulatory filings, reports and returns for the Funds; prepares reports and materials to be supplied to the Trustees; monitors the activities of the Custodian; coordinates the payment of the Funds’ expenses and reviews the Funds’ expense accruals. |
| | The officers of the Trust, including the Chief Compliance Officer, are employees of the Administrator. As compensation for its services, the Administrator is entitled to a monthly fee at an annual rate based upon the average daily net assets of the Funds, subject to annual minimums. Fees paid by the Funds for administration and accounting, transfer agency, custody and compliance services for the year ended June 30, 2022, are disclosed in the Statements of Operations. |
| | |
| 5 | Distribution Costs The Funds have adopted a Distribution Plan pursuant to Rule 12b-1 (the “Plan”) in Class A and Class C only. The Plan permits the Funds to pay for distribution and related expenses at an annual rate of 0.25% and 1.00% of Class A and Class C average daily net assets, respectively. The expenses covered by the Plan may include the cost of preparing and distributing prospectuses and other sales material, advertising and public relations expenses, payments to financial intermediaries and compensation of personnel involved in selling shares of the Funds. For the year ended June 30, 2022, the All Cap Value Fund and Strategic Fund incurred expenses of $599,931 and $80,875, respectively in Class A pursuant to the Plan. The All Cap Value Fund and Strategic Fund also incurred additional expenses of $1,675,050 and $123,616, respectively in Class C. |
| | |
| 6 | Capital Share Transactions Transactions in shares of the Funds were as follows: |
| | All Cap Value Fund | | | | | | |
| | | | Year Ended | | | Year Ended | |
| | | | June 30, 2022 | | | June 30, 2021 | |
| | Class A: | | | | | | |
| | Shares sold | | | 7,699,379 | | | | 775,939 | |
| | Shares issued in reinvestment of distributions | | | 409,249 | | | | 15,756 | |
| | Shares redeemed | | | (571,514 | ) | | | (991,243 | ) |
| | Net increase (decrease) | | | 7,537,114 | | | | (199,548 | ) |
| | | | | | | | | | |
| | Class C: | | | | | | | | |
| | Shares sold | | | 196,481 | | | | 160,050 | |
| | Shares issued in reinvestment of distributions | | | 2,020,288 | | | | 23,966 | |
| | Shares redeemed | | | (10,968,046 | ) | | | (4,257,128 | ) |
| | Net decrease | | | (8,751,277 | ) | | | (4,073,112 | ) |
| | | | | | | | | | |
| | Adviser Class: | | | | | | | | |
| | Shares sold | | | 672,602 | | | | 2,550,050 | |
| | Shares issued in reinvestment of distributions | | | 1,341,019 | | | | 38,839 | |
| | Shares redeemed | | | (1,004,958 | ) | | | (999,018 | ) |
| | Net increase | | | 1,008,663 | | | | 1,589,871 | |
| | Net decrease in capital shares | | | (205,500 | ) | | | (2,682,789 | ) |
| | Strategic Fund | | | | | | |
| | | | Year Ended | | | Year Ended | |
| | | | June 30, 2022 | | | June 30, 2021 | |
| | Class A: | | | | | | |
| | Shares sold | | | 396,437 | | | | 257,125 | |
| | Shares issued in reinvestment of distributions | | | 104,888 | | | | — | |
| | Shares redeemed | | | (217,417 | ) | | | (143,072 | ) |
| | Net increase | | | 283,908 | | | | 114,053 | |
| | | | | | | | | | |
| | Class C: | | | | | | | | |
| | Shares sold | | | 40,461 | | | | 63,657 | |
| | Shares issued in reinvestment of distributions | | | 71,534 | | | | — | |
| | Shares redeemed | | | (320,038 | ) | | | (206,495 | ) |
| | Net decrease | | | (208,043 | ) | | | (142,838 | ) |
| | | | | | | | | | |
| | Adviser Class: | | | | | | | | |
| | Shares sold | | | 480,622 | | | | 1,804,502 | |
| | Shares issued in reinvestment of distributions | | | 296,912 | | | | — | |
| | Shares redeemed | | | (1,236,806 | ) | | | (397,332 | ) |
| | Net increase (decrease) | | | (459,272 | ) | | | 1,407,170 | |
| | Net increase (decrease) in capital shares | | | (383,407 | ) | | | 1,378,385 | |
| 7 | Investment Transactions The aggregate purchases and sales, excluding short-term investments, by Fund for the year ended June 30, 2022, were as follows: |
| | | | U.S. Government Securities | | | Other Securities | |
| | Fund | | Purchases | | | Sales | | | Purchases | | | Sales | |
| | All Cap Value Fund | | $ | — | | | $ | — | | | $ | 298,947,899 | | | $ | 290,403,416 | |
| | Strategic Fund | | | — | | | | — | | | | 37,215,843 | | | | 50,151,078 | |
| 8 | Federal Tax Information The aggregate gross unrealized appreciation and depreciation of securities held by the Funds and the total cost of securities for federal income tax purposes at June 30, 2022, were as follows: |
| | | | | | | | | | Net Unrealized | | | | |
| | | | Aggregate | | | Aggregate | | | Appreciation/ | | | Federal Income | |
| | Fund | | Gross Appreciation | | | Gross Depreciation | | | (Depreciation) | | | Tax Cost | |
| | All Cap Value Fund | | $ | 80,538,646 | | | $ | (60,170,474 | ) | | $ | 20,368,172 | | | $ | 642,335,205 | |
| | Strategic Fund | | | 10,170,941 | | | | (16,023,597 | ) | | | (5,852,656 | ) | | | 117,704,235 | |
| | Any differences between book-basis and tax-basis unrealized appreciation/depreciation is attributable primarily to the tax deferral of losses on wash sales. |
| | At June 30, 2022, the components of distributable earnings/accumulated loss on a tax-basis were as follows: |
| | | | | | | | | | | | | Net | | | Total | |
| | | | Undistributed | | | Undistributed | | | Other | | | Unrealized | | | Distributable | |
| | | | Ordinary | | | Long-Term | | | Accumulated | | | Appreciation/ | | | Earnings | |
| | Fund | | Income | | | Capital Gains | | | Losses | | | (Depreciation) | | | (Accumulated Loss) | |
| | All Cap Value Fund | | $ | — | | | $ | 41,482,559 | | | $ | (1 | ) | | $ | 20,368,172 | | | $ | 61,850,730 | |
| | Strategic Fund | | | — | | | | 1,420,608 | | | | (2,451,003 | ) | | | (5,852,656 | ) | | | (6,883,051 | ) |
| | As of June 30, 2022, the Funds did not have any short-term capital loss carryforwards. A regulated investment company may elect for any taxable year to treat any portion of any qualified late year loss as arising on the first day of the next taxable year. Qualified late year losses are certain capital, and ordinary losses which occur during the portion of the Funds’ taxable year subsequent to October 31 and December 31, respectively. For the taxable year ended June 30, 2022, the Strategic Fund deferred, on a tax basis, post-October capital losses of $2,393,743. The Strategic Fund deferred, on a tax basis, qualified late year ordinary losses of $57,260. |
| | |
| | The tax character of distributions paid for the year ended June 30, 2022, was as follows: |
| | | | Ordinary* | | | Long Term | | | | |
| | Fund | | Income | | | Capital Gains | | | Total | |
| | All Cap Value Fund | | $ | 6,893,691 | | | $ | 99,990,455 | | | $ | 106,884,146 | |
| | Strategic Fund | | | 819,749 | | | | 11,559,601 | | | | 12,379,350 | |
| | The tax character of distributions paid for the year ended June 30, 2021, was as follows: |
| | | | Ordinary* | | | Long Term | | | | |
| | Fund | | Income | | | Capital Gains | | | Total | |
| | All Cap Value Fund | | $ | 2,311,149 | | | $ | — | | | $ | 2,311,149 | |
| | Strategic Fund | | | — | | | | — | | | | — | |
| | | |
| | * For Federal income tax purposes, distributions of short-term capital gains are treated as ordinary income distributions. | |
| 9. | Securities Lending Following terms of a securities lending agreement with the Funds’ Custodian, each Fund may lend securities from its portfolio to brokers, dealers and financial institutions in order to increase the return on its portfolio, primarily through the receipt of borrowing fees and earnings on invested collateral. Any such loan must be secured by collateral in cash or cash equivalents maintained on a current basis in an amount at least equal to 105% of the value of the loaned securities that |
| | are foreign securities or 102% of the value of any U.S. loaned securities at the inception of the loan. Loans shall be marked to market daily and the margin restored in the event the collateralization is below 100% of the value of the securities loaned. During the time securities are on loan, the borrower will pay the applicable Fund any accrued income on those securities, and the Fund may invest the cash collateral and earn income or receive an agreed-upon fee from a borrower that has delivered cash-equivalent collateral. In determining whether or not to lend a security to a particular broker, dealer or financial institution, the Adviser considers all relevant facts and circumstances, including the size, creditworthiness and reputation of the broker, dealer or financial institution. Securities lending involves the risk of a default or insolvency of the borrower. In either of these cases, a Fund could experience delays in recovering securities or collateral or could lose all or part of the value of the loaned securities. A Fund also could lose money in the event of a decline in the value of the collateral provided for loaned securities. Additionally, the loaned portfolio securities may not be available to a Fund on a timely basis and a Fund may therefore lose the opportunity to sell the securities at a desirable price. Any decline in the value of a security that occurs while the security is out on loan would continue to be borne by the Funds. As of June 30, 2022, the All Cap Value Fund and the Strategic Fund each had 15 securities out on loan. |
| | |
| | The Funds receive cash as collateral in return for securities lent as part of the securities lending program. The collateral is invested in the Mount Vernon Liquid Assets Portfolio, LLC of which the investment objective is to seek to maximize current income to the extent consistent with the preservation of capital and liquidity and maintain a stable NAV of $1.00 per unit. The All Cap Value Fund and the Strategic Fund held $64,755,004 and $27,204,291 as of June 30, 2022, respectively. The remaining contractual maturity of all securities lending transactions is overnight and continuous. The Funds are not subject to a master netting agreement with respect to securities lending; therefore no additional disclosures are required. The net income earned by the Funds on investments of cash collateral received from borrowers for the securities loaned to them is reflected in the Funds’ Statements of Operations. Securities lending income, as disclosed in the Funds’ Statements of Operations, represents the income earned from the investment of cash collateral, net of fee rebates paid to the borrower and net of fees paid to the Custodian as lending agent. |
| 10. | Line Of Credit The All Cap Value Fund and Strategic Fund each has established an unsecured Line of Credit (“LOC”) in the amount of $50,000,000 and $15,000,000, respectively, or 33.33% of the fair value of each Fund’s unencumbered assets, whichever is less. Each LOC matures unless renewed on July 22, 2022. These LOCs are intended to provide short-term financing, if necessary, subject to certain restrictions and covenants in connection with shareholder redemptions and other short-term liquidity needs of the Funds. The LOCs are with the Custodian. Interest is charged at the prime rate which was 4.75% as of June 30, 2022. The interest rate during the year was between 3.25% and 4.75%. Each Fund has authorized the Custodian to charge any of each Fund’s accounts for missed payments. For the year ended June 30, 2022, the Funds did not have any borrowing under the LOCs. Prior to July 23, 2021, the All Cap Value Fund and Strategic Fund had a maximum borrowing limit of $40,000,000 and $10,000,000, respectively. |
| | |
| | On July 22, 2022, The Funds renewed their LOCs through July 21, 2023. |
| | |
| 11. | Regulatory Update In December 2020, the SEC adopted a new rule providing a framework for fund valuation practices (“Rule 2a-5”). Rule 2a-5 establishes requirements for determining fair value in good faith for purposes of the 1940 Act. Rule 2a-5 will permit fund boards to designate certain parties to perform fair value determinations, subject to board oversight and certain other conditions. Rule 2a-5 also defines when market quotations are “readily available” for purposes of the 1940 Act and the threshold for determining whether a fund must fair value a security. In connection with Rule 2a-5, the SEC also adopted related recordkeeping requirements and is rescinding previously issued guidance, including with respect to the role of a board in determining fair value and the accounting and auditing of fund investments. The Funds will be required to comply with the rules by September 8, 2022. Management is currently assessing the potential impact of the new rules on the Funds’ financial statements. |
| | |
| 12. | General Risk The global outbreak of COVID-19 has disrupted economic markets and the prolonged economic impact is uncertain. The operational and financial performance of the issuers of securities in which each Fund invests depends on future developments, including the duration and spread of the outbreak, and such uncertainty may in turn impact the value of the Funds’ investments. |
| | On February 24, 2022, Russia commenced a military attack on Ukraine. The outbreak of hostilities between the two countries could result in more widespread conflict and could have a severe adverse effect on the region and the markets. In addition, sanctions imposed on Russia by the United States and other countries, and any sanctions imposted in the future could have a significant adverse impact on the Russian economy and related markets. The price and liquidity of investments may fluctuate widely as a result of the conflict and related events. How long such conflict and related events will last and whether it will escalate further cannot be predicted, nor its effect on the Funds |
Report of Independent Registered Public Accounting Firm
To the Shareholders of Olstein Funds and
Board of Trustees of Managed Portfolio Series
Opinion on the Financial Statements
We have audited the accompanying statements of assets and liabilities, including the schedules of investments, of Olstein All Cap Value Fund and Olstein Strategic Opportunities Fund (“Olstein Funds” or the “Funds”), each a series of Managed Portfolio Series, as of June 30, 2022, the related statements of operations for the year then ended, the statements of changes in net assets for each of the two years in the period then ended, the related notes, and the financial highlights for each of the five years in the period then ended (collectively referred to as the “financial statements”). In our opinion, the financial statements present fairly, in all material respects, the financial position of each of the Funds as of June 30, 2022, the results of their operations for the year then ended, the changes in net assets for each of the two years in the period then ended, and the financial highlights for each of the five years in the period then ended, in conformity with accounting principles generally accepted in the United States of America.
Basis for Opinion
These financial statements are the responsibility of the Funds’ management. Our responsibility is to express an opinion on the Funds’ financial statements based on our audits. We are a public accounting firm registered with the Public Company Accounting Oversight Board (United States) (“PCAOB”) and are required to be independent with respect to the Funds in accordance with the U.S. federal securities laws and the applicable rules and regulations of the Securities and Exchange Commission and the PCAOB.
We conducted our audits in accordance with the standards of the PCAOB. Those standards require that we plan and perform the audit to obtain reasonable assurance about whether the financial statements are free of material misstatement whether due to error or fraud.
Our audits included performing procedures to assess the risks of material misstatement of the financial statements, whether due to error or fraud, and performing procedures that respond to those risks. Such procedures included examining, on a test basis, evidence regarding the amounts and disclosures in the financial statements. Our procedures included confirmation of securities owned as of June 30, 2022, by correspondence with the custodian and brokers. Our audits also included evaluating the accounting principles used and significant estimates made by management, as well as evaluating the overall presentation of the financial statements. We believe that our audits provide a reasonable basis for our opinion.
We have served as the Funds’ auditor since 2012.

COHEN & COMPANY, LTD.
Milwaukee, Wisconsin
August 29, 2022
THE OLSTEIN FUNDS
Additional Information (Unaudited)
APPROVAL OF INVESTMENT ADVISORY AGREEMENT
At the regular meeting of the Board of Trustees of Managed Portfolio Series (“Trust”) on February 22-23, 2022, the Trust’s Board of Trustees (“Board”), each of whom were present virtually via video conference, including all of the Trustees who are not “interested persons” of the Trust, as that term is defined in Section 2(a)(19) of the Investment Company Act of 1940, as amended, (“Independent Trustees”) considered and approved the continuation of the Investment Advisory Agreement between the Trust and Olstein Capital Management, L.P. (“OCM” or the “Adviser���) regarding the Olstein All Cap Value Fund (the “All Cap Value Fund”) and the Olstein Strategic Opportunities Fund (the “Strategic Opportunities Fund” and together with the All Cap Value Fund, the “Funds”) (the “Investment Advisory Agreement”) for an additional one-year term.
Prior to the meeting and at a meeting held on January 11, 2022, the Trustees received and considered information from OCM and the Trust’s administrator designed to provide the Trustees with the information necessary to evaluate the continuance of the Investment Advisory Agreement (“Support Materials”). Before voting to approve the continuance of the Investment Advisory Agreement, the Trustees reviewed the Support Materials with Trust management and with counsel to the Independent Trustees, and received a memorandum from such counsel discussing the legal standards for the Trustees’ consideration of the renewal of the Investment Advisory Agreement. This information, together with the information provided to the Board throughout the course of the year, formed the primary (but not exclusive) basis for the Board’s determinations.
In determining whether to continue the Investment Advisory Agreement, the Trustees considered all factors they believed relevant, including the following with respect to each Fund: (1) the nature, extent, and quality of the services provided by OCM with respect to the Fund; (2) the Fund’s historical performance as managed by OCM; (3) the costs of the services to be provided by OCM and the profits to be realized by OCM from services rendered to the Fund; (4) comparative fee and expense data for the Fund and other investment companies with similar investment objectives; (5) the extent to
Additional Information (Unaudited) Continued
which economies of scale may be realized as the Fund grows, and whether the advisory fee for the Fund reflects such economies of scale for the Fund’s benefit; and (6) other benefits to OCM resulting from its relationship with the Fund. In their deliberations, the Trustees weighed to varying degrees the importance of the information provided to them, did not identify any particular information that was all-important or controlling, and considered the information and made its determinations for each Fund separately and independently of the other Fund.
Based upon OCM’s presentation and information from OCM and the Trust’s administrator designed to provide the Trustees with the information necessary to evaluate the terms of the Advisory Agreement, the Board concluded that the overall arrangements between the Trust and OCM set forth in the Investment Advisory Agreement, as the agreement relates to each Fund, continue to be fair and reasonable in light of the services that OCM performs, the investment advisory fees that each Fund pays, and such other matters as the Trustees considered relevant in the exercise of their reasonable business judgment. The material factors and conclusions that formed the basis of the Trustees’ determination to approve the continuation of the Investment Advisory Agreement, as it relates to each Fund, are summarized below.
Nature, Extent and Quality of Services Provided. The Trustees considered the scope of services that OCM provides under the Investment Advisory Agreement with respect to each Fund, noting that such services include, but are not limited to, the following: (1) investing each Fund’s assets consistent with the Fund’s investment objective and investment policies; (2) determining the portfolio securities to be purchased, sold, or otherwise disposed of and the timing of such transactions; (3) voting all proxies, if any, with respect to each Fund’s portfolio securities; (4) maintaining the required books and records for transactions effected by OCM on behalf of the Funds; (5) selecting broker-dealers to execute orders on behalf of the Funds; and (6) monitoring and maintaining each Fund’s compliance with policies and procedures of the Trust and with applicable securities laws. The Trustees reviewed OCM’s financial statements, assets under management and capitalization. In that regard, the Trustees concluded that OCM had sufficient resources to support the management of the Funds. The Trustees noted that OCM has been managing the Funds, since 1996 in the case of the All Cap Value Fund and 2006 in the case of the Strategic Opportunities Fund, and manages a composite of
Additional Information (Unaudited) Continued
separately managed accounts with investment objectives and investment strategies that are substantially similar to each Fund. The Trustees also considered the experience of the portfolio managers that OCM utilizes in managing each Fund’s assets and that the lead portfolio manager has been the same since each Fund’s inception. The Trustees concluded that they were satisfied with the nature, extent and quality of services that OCM provides to each Fund under the Investment Advisory Agreement.
Fund Historical Performance and the Overall Performance of OCM. In assessing the quality of the portfolio management delivered by OCM, the Trustees reviewed the short-term and longer-term performance of each Fund on both an absolute basis and in comparison to an appropriate securities benchmark index, each Fund’s peer funds according to Morningstar classifications (the “Peer Group”), and as compiled by Barrington Partners (the, a “Morningstar BP Cohort”), and each Fund’s respective composite of separate accounts that OCM manages utilizing investment strategies similar to those of the Funds. When reviewing each Fund’s performance against its respective Morningstar BP Cohort, the Trustees took into account that the investment objective and strategies of each Fund, as well as the Fund’s level of risk tolerance, may differ significantly from funds in its Morningstar BP Cohort.
| | • | All Cap Value Fund. The Trustees considered that the All Cap Value Fund outperformed its Morningstar BP Cohort average over the one-year, three-year, five-year and ten-year periods ended September 30, 2021. The Trustees also considered that the Fund had outperformed its primary benchmark over the year-to-date period ended September 30, 2021, and for the one-year, three-year, five-year, ten-year and since inception periods ended December 31, 2020. The Trustees also considered that the Fund had outperformed its primary benchmark over the year-to-date period ended September 30, 2021, but underperformed its secondary benchmark across all other periods reviewed. The Trustees then observed that the Fund’s performance was consistent with the performance of a composite of similar accounts managed by OCM over all relevant time periods. |
| | | |
| | • | Strategic Opportunities Fund. The Trustees considered that the Strategic Opportunities Fund outperformed its peer group median and average over the one-year, three-year and five-year periods ended September 30, 2021. The Trustees also considered that the Fund had underperformed its primary benchmark over the year-to-date period |
Additional Information (Unaudited) Continued
| | | ended September 30, 2021, and outperformed its primary benchmark for the one-year, three-year, five-year, ten-year and since inception periods ended December 31, 2020. The Trustees also considered that the Fund had outperformed its primary benchmark over the year-to-date period ended September 30, 2021, but underperformed its secondary benchmark across all other periods reviewed. The Trustees then observed that the Fund’s performance was consistent with the performance of a composite of similar accounts managed by OCM over all relevant time periods. |
Cost of Advisory Services and Profitability. The Trustees considered the annual management fee that each Fund pays to OCM under the Advisory Agreement in the amount of 1.00% of the Fund’s average annual daily net assets. They also considered OCM’s profitability analysis for the 12-month period ended September 30, 2021 for services that OCM rendered to each Fund. In that regard, the Trustees noted that each Fund had been profitable to OCM over that period. The Trustees noted that OCM manages a composite of separately managed accounts with investment strategies that are substantially similar to each Fund. The Trustees noted that the management fee charged to the separately managed accounts is equal to or lower than the management fee charged by corresponding Fund. OCM identified additional services provided to the Funds to justify a higher management fee. The Trustees also noted that OCM had contractually agreed, for a period of at least one year from the effective date of the Strategic Opportunities Fund’s prospectus, to waive its management fees and reimburse the Fund for its operating expenses to the extent necessary to ensure that total operating expenses of the Fund do not exceed the amount set forth in the Fund’s prospectus. In that regard, the Trustees noted that OCM had waived a portion of its management fee during the 12-month period ended September 30, 2021 with respect to the Strategic Opportunities Fund. The Trustees concluded that OCM’s service relationship with each Fund yielded a reasonable profit.
Comparative Fee and Expense Data. The Trustees considered a comparative analysis of contractual expenses that each Fund will bear and those of funds in the Morningstar peer group for each Fund. The Trustees noted that:
| | • | All Cap Value Fund. The All Cap Value Fund’s management fee was above the Morningstar BP Cohort average. The total expenses of each class of the All Cap Value Fund were also above the Morningstar BP |
Additional Information (Unaudited) Continued
| | | Cohort average total expenses. The Trustees further took into account that the average net assets of the funds comprising the peer group were significantly higher than the assets of the All Cap Value Fund. |
| | | |
| | • | Strategic Opportunities Fund. The Strategic Opportunities Fund’s management fee was above the Morningstar BP Cohort average. The total expenses of each class of the Strategic Opportunities Fund (after fee waivers and expense reimbursements) was higher than the Morningstar BP Cohort average. |
While recognizing that it is difficult to compare advisory fees because the scope of advisory services provided may vary from one investment adviser to another, the Trustees concluded that OCM’s advisory fee with respect to each Fund continues to be reasonable.
Economies of Scale. The Trustees considered whether the Funds would benefit from any economies of scale, noting that the management fee for the All Cap Value Fund includes breakpoints once the Fund hits $1 billion in assets. The Trustees also took into account that the Strategic Opportunities Fund’s management fee did not have breakpoints. Given the current size of the Strategic Opportunities Fund the Trustees concluded that it is not necessary to consider the implementation of fee breakpoints at the present time, but committed to revisit this issue in the future as circumstances change and asset levels increase.
Other Benefits. The Trustees considered the direct and indirect benefits that could be realized by OCM and its affiliates from their respective relationships with the Funds. The Trustees noted that OCM utilizes soft dollar arrangements with respect to portfolio transactions. The Trustees also noted that OCM is reimbursed under the Trust’s 12b-1 plan for expenses incurred in connection with distribution-related activities of OCM personnel and related expenses incurred by OCM. The Trustees noted that OCM does not consider such reimbursements to be a fall out benefit to OCM. The Trustees noted that OCM does not use affiliated brokers to execute the Funds’ portfolio transactions. The Trustees considered that OCM may receive some form of reputational benefit from services rendered to the Funds, but that such benefits are immaterial and cannot otherwise be quantified. The Trustees concluded that OCM does not receive additional material benefits from their relationship with the Funds.
Additional Information (Unaudited) Continued
STATEMENT REGARDING THE FUNDS’
LIQUIDITY RISK MANAGEMENT PROGRAM
Pursuant to Rule 22e-4 under the Investment Company Act of 1940, Managed Portfolio Series (the “Trust”), on behalf of the Olstein All Cap Value Fund and Olstein Strategic Opportunities Fund (each a “Fund” and together, the “Funds”), has adopted and implemented a written liquidity risk management program (the “Program”) that includes policies and procedures reasonably designed to comply with the requirements of Rule 22e-4, including: (i) assessment, management and periodic review of liquidity risk; (ii) classification of portfolio holdings; (iii) establishment of a highly liquid investment minimum (“HLIM”), as applicable; (iv) limitation on illiquid investments; and (v) redemptions in-kind. The Trust’s Board of Trustees (the “Board”) has approved the designation of Olstein Capital, L.P. (“Olstein”) as the administrator of the Program (the “Program Administrator”). Personnel of Olstein conduct the day-to-day operation of the Program pursuant to policies and procedures administered by the Olstein Liquidity Committee.
In accordance with Rule 22e-4, the Board reviewed a report prepared by the Program Administrator (the “Report”) regarding the operation of the Program and its adequacy and effectiveness of implementation for the period January 1, 2021, through December 31, 2021 (the “Reporting Period”). No significant liquidity events impacting the Funds during the Reporting Period or material changes to the Program were noted in the Report.
Under the Program, Olstein manages and periodically reviews each Fund’s liquidity risk, including consideration of applicable factors specified in Rule 22e-4 and the Program. Liquidity risk is defined as the risk that a Fund could not meet shareholder redemption requests without significant dilution of remaining shareholders’ interests in the Fund. In general, this risk was managed during the Reporting Period by monitoring the degree of liquidity of each Fund’s investments, limiting the amount of each Fund’s illiquid investments, and utilizing various risk management tools and facilities available to each Fund for meeting shareholder redemptions, among other means. In the Report, Olstein provided its assessment that, based on the information considered in its review, the Program remains reasonably designed to manage each Fund’s liquidity risk and each Fund’s investment strategy remains appropriate for an open-end fund.
Additional Information (Unaudited) Continued
Pursuant to the Program, the Olstein Liquidity Committee oversaw the classification of each of the Funds’ portfolio investments as highly liquid, moderately liquid, less liquid or illiquid during the Reporting Period, including in connection with recording investment classifications on Form N-PORT. Olstein’s process of determining the degree of liquidity of each Fund’s investments is supported by one or more third-party liquidity assessment vendors.
Each Fund qualified as a “primarily highly liquid fund” as defined in the Program during the Reporting Period. Accordingly, each Fund was not required to establish a HLIM or comply with the related Program provisions during the Reporting Period.
During the Reporting Period, each Fund’s investments were monitored for compliance with the 15% limitation on illiquid investments pursuant to the Program and in accordance with Rule 22e-4.
While there were no redemptions in-kind during the Reporting Period, the Report noted that such transactions would be in compliance with the Trust’s Redemption in Kind Policy. The Report concluded, with respect to each Fund: (i) the Program was implemented and operated effectively to achieve the goal of assessing and managing the Fund’s liquidity risk during the Reporting Period; and (ii) the Fund was able to meet requests for redemption without significant dilution of remaining investors’ interests in the Fund during the Reporting Period.
Additional Information (Unaudited) Continued
TRUSTEES AND OFFICERS
| | | Term of | Number of | | Other |
| | | Office | Portfolios | | Directorships |
| | Position(s) | and Length | in Trust | Principal | Held by Trustee |
| Name, Address and | Held with | of Time | Overseen | Occupation(s) During | During the |
Year of Birth | the Trust | Served | by Trustee | the Past Five Years | Past Five Years |
| Independent Trustees | | | | | |
| | | | | | |
Leonard M. Rush, CPA | Chairman, | Indefinite | 38 | Retired; Chief | Independent |
615 E. Michigan St. | Trustee | Term; | | Financial Officer, | Trustee, ETF |
Milwaukee, WI 53202 | and Audit | Since | | Robert W. | Series |
Year of Birth: 1946 | Committee | April | | Baird & Co. | Solutions (60 |
| | Chairman | 2011 | | Incorporated, | Portfolios) |
| | | | | (2000-2011). | (2012- |
| | | | | | Present) |
| | | | | | |
David A. Massart* | Trustee | Indefinite | 38 | Partner and | Independent |
615 E. Michigan St. | | Term; | | Managing | Trustee, |
Milwaukee, WI 53202 | | Since | | Director, | ETF Series |
Year of Birth: 1967 | | April | | Beacon Pointe | Solutions (60 |
| | | 2011 | | Advisors, LLC | Portfolios) |
| | | | | (since 2022); | (2012- |
| | | | | Co-Founder and | Present) |
| | | | | Chief Investment | |
| | | | | Strategist, Next | |
| | | | | Generation | |
| | | | | Wealth | |
| | | | | Management Inc. | |
| | | | | (2005-2021). | |
| | | | | | |
David M. Swanson | Trustee | Indefinite | 38 | Founder and | Independent |
615 E. Michigan St. | and | Term; | | Managing | Trustee, |
Milwaukee, WI 53202 | Nominating | Since | | Principal, | ALPS |
Year of Birth: 1957 | & | April | | SwanDog | Variable |
| | Governance | 2011 | | Strategic | Investment |
| | Committee | | | Marketing, LLC | Trust |
| | Chairman | | | (2006-present); | (7 Portfolios) |
| | | | | Executive | (2006- |
| | | | | Vice President, | Present); |
| | | | | Calamos | Independent |
| | | | | Investments | Trustee, |
| | | | | (2004-2006). | RiverNorth |
| | | | | | Funds |
| | | | | | (3 Portfolios) |
| | | | | | (2018- |
| | | | | | Present); |
| | | | | | RiverNorth |
| | | | | | Managed |
| | | | | | Duration |
| | | | | | Municipal |
Additional Information (Unaudited) Continued
TRUSTEES AND OFFICERS
| | | Term of | Number of | | Other |
| | | Office | Portfolios | | Directorships |
| | Position(s) | and Length | in Trust | Principal | Held by Trustee |
| Name, Address and | Held with | of Time | Overseen | Occupation(s) During | During the |
Year of Birth | the Trust | Served | by Trustee | the Past Five Years | Past Five Years |
David M. Swanson | | | | | Income |
Continued | | | | | Fund Inc. |
| | | | | | (1 Portfolio) |
| | | | | | (2019- |
| | | | | | Present); |
| | | | | | RiverNorth |
| | | | | | Specialty |
| | | | | | Finance |
| | | | | | Corporation |
| | | | | | (1 Portfolio) |
| | | | | | (2018- |
| | | | | | Present); |
| | | | | | RiverNorth/ |
| | | | | | DoubleLine |
| | | | | | Strategic |
| | | | | | Opportunity |
| | | | | | Fund, Inc. |
| | | | | | (1 Portfolio) |
| | | | | | (2018- |
| | | | | | Present); |
| | | | | | RiverNorth |
| | | | | | Opportunities |
| | | | | | Fund, Inc. |
| | | | | | (1 Portfolio) |
| | | | | | (2015- |
| | | | | | Present); |
| | | | | | RiverNorth |
| | | | | | Opportunistic |
| | | | | | Municipal |
| | | | | | Income |
| | | | | | Fund, Inc. |
| | | | | | (1 Portfolio) |
| | | | | | (2018- |
| | | | | | Present); |
| | | | | | RiverNorth |
| | | | | | Flexible |
| | | | | | Municipal |
| | | | | | Income Fund |
| | | | | | (2020- |
| | | | | | Present). |
Additional Information (Unaudited) Continued
TRUSTEES AND OFFICERS
| | | Term of | Number of | | Other |
| | | Office | Portfolios | | Directorships |
| | Position(s) | and Length | in Trust | Principal | Held by Trustee |
| Name, Address and | Held with | of Time | Overseen | Occupation(s) During | During the |
Year of Birth | the Trust | Served | by Trustee | the Past Five Years | Past Five Years |
Robert J. Kern | Trustee | Indefinite | 38 | Retired (July | None |
615 E. Michigan St. | | Term; | | 2018 – present); | |
Milwaukee, WI 53202 | | Since | | Executive Vice | |
Year of Birth: 1958 | | January | | President, U.S. | |
| | | 2011 | | Bancorp Fund | |
| | | | | Services, LLC | |
| | | | | (1994-2018). | |
| | | | | | |
| Officers | | | | | |
Brian R. Wiedmeyer | President | Indefinite | N/A | Vice President, | N/A |
615 E. Michigan St. | and | Term; | | U.S. Bancorp | |
Milwaukee, WI 53202 | Principal | Since | | Fund Services, | |
Year of Birth: 1973 | Executive | November | | LLC (2005- | |
| | Officer | 2018 | | present). | |
| | | | | | |
Deborah Ward | Vice | Indefinite | N/A | Senior Vice | N/A |
615 E. Michigan St. | President, | Term; | | President, U.S. | |
Milwaukee, WI 53202 | Chief | Since | | Bancorp Fund | |
Year of Birth: 1966 | Compliance | April | | Services, LLC | |
| | Officer and | 2013 | | (2004-present). | |
| | Anti-Money | | | | |
| | Laundering | | | | |
| | Officer | | | | |
| | | | | | |
Benjamin Eirich | Treasurer, | Indefinite | N/A | Assistant Vice | N/A |
615 E. Michigan St. | Principal | Term; | | President, U.S. | |
Milwaukee, WI 53202 | Financial | Since | | Bancorp Fund | |
Year of Birth: 1981 | Officer | August | | Services, LLC | |
| | and Vice | 2019 | | (2008-present). | |
| | President | (Treasurer); | | | |
| | | Indefinite | | | |
| | | Term; | | | |
| | | Since | | | |
| | | November | | | |
| | | 2018 | | | |
| | | (Vice | | | |
| | | President) | | | |
Additional Information (Unaudited) Continued
TRUSTEES AND OFFICERS
| | | Term of | Number of | | Other |
| | | Office | Portfolios | | Directorships |
| | Position(s) | and Length | in Trust | Principal | Held by Trustee |
| Name, Address and | Held with | of Time | Overseen | Occupation(s) During | During the |
Year of Birth | the Trust | Served | by Trustee | the Past Five Years | Past Five Years |
John Hadermayer | Secretary | Indefinite | N/A | Vice President, | N/A |
615 E. Michigan St. | | Term; | | U.S. Bank Global | |
Milwaukee, WI 53202 | | Since | | Fund Services | |
Year of Birth: 1977 | | May 2022 | | (2022-present); | |
| | | | | Executive | |
| | | | | Director, | |
| | | | | AQR Capital | |
| | | | | Management, | |
| | | | | LLC | |
| | | | | (2013-2022). | |
| | | | | | |
Douglas Schafer | Assistant | Indefinite | N/A | Assistant Vice | N/A |
615 E. Michigan St. | Treasurer | Term; | | President, U.S. | |
Milwaukee, WI 53202 | and Vice | Since | | Bancorp Fund | |
Year of Birth: 1970 | President | May 2016 | | Services, LLC | |
| | | (Assistant | | (2002-present). | |
| | | Treasurer); | | | |
| | | Indefinite | | | |
| | | Term; | | | |
| | | Since | | | |
| | | November | | | |
| | | 2018 | | | |
| | | (Vice | | | |
| | | President) | | | |
| | | | | | |
Sara J. Bollech | Assistant | Indefinite | N/A | Officer, U.S. | N/A |
615 E. Michigan St. | Treasurer | Term: | | Bancorp Fund | |
Milwaukee, WI 53202 | and Vice | Since | | Services, LLC | |
Year of Birth: 1977 | President | November | | (2007-present). | |
| | | 2021 | | | |
| | | | | | |
Peter A. Walker, CPA | Assistant | Indefinite | N/A | Officer, U.S. | N/A |
615 E. Michigan St. | Treasurer | Term: | | Bancorp Fund | |
Milwaukee, WI 53202 | and Vice | Since | | Services, LLC | |
Year of Birth: 1993 | President | November | | (2016-present). | |
| | | 2021 | | | |
Additional Information (Unaudited) Continued
AVAILABILITY OF FUND PORTFOLIO INFORMATION
Each Fund files complete schedules of portfolio holdings with the SEC for the first and third quarters of each fiscal year on Part F of Form N-PORT. Each Fund’s Part F of Form N-PORT is available on the SEC’s website at www.sec.gov and may be reviewed and copied at the SEC’s Public Reference Room in Washington, D.C. For information on the Public Reference Room call 1-800-SEC-0330. In addition, each Fund’s Part F of Form N-PORT is available without charge upon request by calling 1-800-799-2113.
AVAILABILITY OF FUND PROXY VOTING INFORMATION
A description of the Funds’ Proxy Voting Policies and Procedures is available without charge, upon request, by calling 1-800-799-2113. Information regarding how the Funds voted proxies relating to portfolio securities during the most recent 12 month period ended June 30 is available (1) without charge, upon request, by calling 1-800-799-2113, or (2) on the SEC’s website at www.sec.gov.
QUALIFIED DIVIDEND INCOME/DIVIDENDS
RECEIVED DEDUCTION
For the fiscal year ended June 30, 2022 certain dividends paid by the Funds may be reported as qualified dividend income and may be eligible for taxation at capital gain rates. The percentage of dividends declared from ordinary income designated as qualified dividend income was 100.00% and 100.00% for the Olstein All Cap Value Fund and Olstein Strategic Opportunities Fund, respectively.
For corporate shareholders, the percent of ordinary income distributions qualifying for the corporate dividends received deduction for the year ended June 30, 2022 was 100.00% and 100.00% for the Olstein All Cap Value Fund and Olstein Strategic Opportunities Fund, respectively.
The percentage of taxable ordinary income distributions that are designated as short-term capital gain distributions under Internal Revenue Section 871(k)(2)(C) was 100.00% and 100.00% for the Olstein All Cap Value Fund and Olstein Strategic Opportunities Fund, respectively.
PRIVACY POLICY (UNAUDITED)
The Funds collect only relevant information about you that the law allows or requires it to have in order to conduct its business and properly service you. The Funds collect financial and personal information about you (“Personal Information”) directly (e.g., information on account applications and other forms, such as your name, address, and social security number, and information provided to access account information or conduct account transactions online, such as password, account number, e-mail address, and alternate telephone number), and indirectly (e.g., information about your transactions with us, such as transaction amounts, account balance and account holdings).
The Funds do not disclose any non-public personal information about its shareholders or former shareholders other than for everyday business purposes such as to process a transaction, service an account, respond to court orders and legal investigations or as otherwise permitted by law. Third parties that may receive this information include companies that provide transfer agency, technology and administrative services to the Funds, as well as the Funds’ investment adviser who is an affiliate of the Funds. If you maintain a retirement/educational custodial account directly with the Funds, we may also disclose your Personal Information to the custodian for that account for shareholder servicing purposes. The Funds limit access to your Personal Information provided to unaffiliated third parties to information necessary to carry out their assigned responsibilities to the Funds. All shareholder records will be disposed of in accordance with applicable law. The Funds maintain physical, electronic and procedural safeguards to protect your Personal Information and requires its third party service providers with access to such information to treat your Personal Information with the same high degree of confidentiality.
In the event that you hold shares of the Funds through a financial intermediary, including, but not limited to, a broker-dealer, credit union, bank or trust company, the privacy policy of your financial intermediary governs how your non-public personal information is shared with unaffiliated third parties.
| Olstein | Investment Adviser |
| All Cap Value Fund | Olstein Capital Management, L.P. |
| | 4 Manhattanville Road, Suite 204 |
| Olstein | Purchase, New York 10577 |
| Strategic Opportunities Fund | |
| | Distributor |
| | Compass Distributors, LLC |
| | Three Canal Plaza, Suite 100 |
| | Portland, Maine 04101 |
| | |
| | Custodian |
| | U.S. Bank N.A. |
| | 1555 North Rivercenter Drive, Suite 302 |
| | Milwaukee, Wisconsin 53212 |
| | |
| | Administrator, Fund Accountant |
| | and Transfer Agent |
| | U.S. Bancorp Fund Services, LLC |
| | 615 East Michigan Street |
| | Milwaukee, Wisconsin 53202 |
| | |
| | Independent Registered Public |
| | Accounting Firm |
| | Cohen & Company, Ltd. |
| | 342 North Water Street, Suite 830 |
| | Milwaukee, Wisconsin 53202 |
| | |
| | Legal Counsel |
| | Stradley Ronon Stevens & Young, LLP |
| | 2005 Market Street, Suite 2600 |
| | Philadelphia, Pennsylvania 19103 |
| | |
| | This report is submitted for the general information of the shareholders of the Funds. It is not authorized for distribution to prospective investors unless preceded or accompanied by an effective prospectus, which includes information regarding the Funds’ risks, objectives, fees and expenses, experience of its management, and other information. |
| | |
| | The Funds’ Statement of Additional Information contains additional information about the Funds’ trustees and is available without charge upon request by calling 1-800-799-2113. |
| | |
| The Olstein Funds | |
4 Manhattanville Road, Suite 204 | |
Purchase, New York 10577 | |
(b) Not applicable.
Item 2. Code of Ethics.
The Registrant has adopted a code of ethics that applies to the Registrant’s principal executive officer and principal financial officer. The Registrant has not made any amendments to its code of ethics during the period covered by this report. The Registrant has not granted any waivers from any provisions of the code of ethics during the period covered by this report.
A copy of the Registrant’s Code of Ethics that applies to the Registrant’s principal executive officer and principal financial officer is filed herewith.
Item 3. Audit Committee Financial Expert.
The Registrant’s board of trustees has determined that there is at least one audit committee financial expert serving on its audit committee. Leonard M. Rush is the “audit committee financial expert” and is considered to be “independent” as each term is defined in Item 3 of Form N‑CSR.
Item 4. Principal Accountant Fees and Services.
The Registrant has engaged its principal accountant to perform audit services, audit-related services, tax services and other services during the past two fiscal years. “Audit services” refer to performing an audit of the Registrant's annual financial statements or services that are normally provided by the accountant in connection with statutory and regulatory filings or engagements for those fiscal years. “Audit-related services” refer to the assurance and related services by the principal accountant that are reasonably related to the performance of the audit. “Tax services” refer to professional services rendered by the principal accountant for tax compliance, tax advice, and tax planning; including reviewing the Fund’s tax returns and distributions calculations. There were no “other services” provided by the principal accountant. For the fiscal years ended June 30, 2022 and June 30, 2021, the Fund’s principal accountant was Cohen & Company, Ltd. The following table details the aggregate fees billed or expected to be billed for each of the last two fiscal years for audit fees, audit-related fees, tax fees and other fees by the principal accountant.
| | FYE 6/30/2022 | FYE 6/30/2021 |
(a) Audit Fees | $31,000 | $31,000 |
(b) Audit-Related Fees | $0 | $0 |
(c) Tax Fees | $10,000 | $10,000 |
(d) All Other Fees | $- | $- |
(e)(1) The audit committee has adopted pre-approval policies and procedures that require the audit committee to pre‑approve all audit and non‑audit services of the Registrant, including services provided to any entity affiliated with the Registrant.
(e)(2) The percentage of fees billed by Cohen & Company, Ltd applicable to non-audit services pursuant to waiver of pre-approval requirement were as follows:
| | FYE 6/30/2022 | FYE 6/30/2021 |
Audit-Related Fees | 0% | 0% |
Tax Fees | 0% | 0% |
All Other Fees | 0% | 0% |
(f) All of the principal accountant’s hours spent on auditing the Registrant’s financial statements were attributed to work performed by full‑time permanent employees of the principal accountant.
(g) The following table indicates the non-audit fees billed or expected to be billed by the Registrant’s accountant for services to the Registrant and to the Registrant’s investment adviser (and any other controlling entity, etc.—not sub-adviser) for the last two years.
Non-Audit Related Fees | FYE 6/30/2022 | FYE 6/30/2021 |
Registrant | N/A | N/A |
Registrant’s Investment Adviser | N/A | N/A |
(h) The audit committee of the board of trustees/directors has considered whether the provision of non-audit services that were rendered to the Registrant's investment adviser is compatible with maintaining the principal accountant's independence and has concluded that the provision of such non-audit services by the accountant has not compromised the accountant’s independence.
(i) Not Applicable.
(j) Not Applicable.
Item 5. Audit Committee of Listed Registrants.
Not applicable to Registrants who are not listed issuers (as defined in Rule 10A-3 under the Securities Exchange Act of 1934).
Item 6. Schedule of Investments.
| (a) | Schedule of Investments is included as part of the report to shareholders filed under Item 1 of this Form. |
Item 7. Disclosure of Proxy Voting Policies and Procedures for Closed-End Management Investment Companies.
Not applicable to open-end investment companies.
Item 8. Portfolio Managers of Closed-End Management Investment Companies.
Not applicable to open-end investment companies.
Item 9. Purchases of Equity Securities by Closed‑End Management Investment Company and Affiliated Purchasers.
Not applicable to open-end investment companies.
Item 10. Submission of Matters to a Vote of Security Holders.
There have been no material changes to the procedures by which shareholders may recommend nominees to the Registrant’s board of trustees.
Item 11. Controls and Procedures.
(a) | The Registrant’s President and Treasurer have reviewed the Registrant's disclosure controls and procedures (as defined in Rule 30a-3(c) under the Investment Company Act of 1940 (the “Act”)) as of a date within 90 days of the filing of this report, as required by Rule 30a-3(b) under the Act and Rules 13a-15(b) or 15d‑15(b) under the Securities Exchange Act of 1934. Based on their review, such officers have concluded that the disclosure controls and procedures are effective in ensuring that information required to be disclosed in this report is appropriately recorded, processed, summarized and reported and made known to them by others within the Registrant and by the Registrant’s service provider. |
(b) | There were no significant changes in the Registrant's internal control over financial reporting (as defined in Rule 30a-3(d) under the Act) that occurred during the period covered by this report that has materially affected, or is reasonably likely to materially affect, the Registrant's internal control over financial reporting. |
Item 12. Disclosures of Securities Lending Activities for Closed-End Management Investment Companies.
Not applicable to open-end investment companies.
Item 13. Exhibits.
(3) Any written solicitation to purchase securities under Rule 23c‑1 under the Act sent or given during the period covered by the report by or on behalf of the Registrant to 10 or more persons. Not applicable to open-end investment companies.
(4) Change in the Registrant’s independent public accountant. There was no change in the Registrant’s independent public accountant for the period covered by this report.
SIGNATURES
Pursuant to the requirements of the Securities Exchange Act of 1934 and the Investment Company Act of 1940, the Registrant has duly caused this report to be signed on its behalf by the undersigned, thereunto duly authorized.
(Registrant) Managed Portfolio Series
By (Signature and Title) /s/Brian R. Wiedmeyer
Brian R. Wiedmeyer, President
Date September 7, 2022
Pursuant to the requirements of the Securities Exchange Act of 1934 and the Investment Company Act of 1940, this report has been signed below by the following persons on behalf of the Registrant and in the capacities and on the dates indicated.
By (Signature and Title) /s/Brian R. Wiedmeyer
Brian R. Wiedmeyer, President
Date September 7, 2022
By (Signature and Title) /s/Benjamin J. Eirich
Benjamin J. Eirich, Treasurer
Date September 7, 2022