UNITED STATES
SECURITIES AND EXCHANGE COMMISSION
Washington, D.C. 20549
FORM N-CSR
CERTIFIED SHAREHOLDER REPORT OF REGISTERED
MANAGEMENT INVESTMENT COMPANIES
Investment Company Act file number 811-22525
Managed Portfolio Series
(Exact name of registrant as specified in charter)
615 East Michigan Street
Milwaukee, WI 53202
(Address of principal executive offices) (Zip code)
Brian Wiedmeyer, President
Managed Portfolio Series
c/o U.S. Bank Global Fund Services
777 East Wisconsin Ave., 6th Floor
Milwaukee, WI 53202
(Name and address of agent for service)
(414) 516-1712
Registrant’s telephone number, including area code
Date of fiscal year end: 05/31/2024
Date of reporting period: 05/31/2024
Item 1. Reports to Stockholders.
| | |
| Reinhart Midcap PMV Fund | |
| Investor Class | RPMMX |
| Annual Shareholder Report | May 31, 2024 |
This annual shareholder report contains important information about the Reinhart Midcap PMV Fund for the period of June 1, 2023, to May 31, 2024. You can find additional information about the Fund at https://reinhartfunds.com. You can also request this information by contacting us at 1-855-774-3863.
This report describes changes to the Fund that occurred during the reporting period.
WHAT WERE THE FUND COSTS FOR THE PAST YEAR? (based on a hypothetical $10,000 investment)
| | |
Class Name | Costs of a $10,000 investment | Costs paid as a percentage of a $10,000 investment |
| Investor Class | $140 | 1.30% |
HOW DID THE FUND PERFORM LAST YEAR AND WHAT AFFECTED ITS PERFORMANCE?
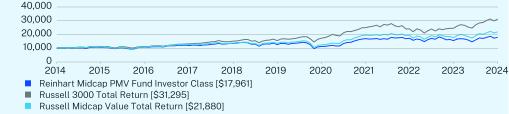
The Reinhart Mid Cap PMV Fund – Investor Class generated a return of +15.41% for the twelve-month period ended May 31, 2024, underperforming the Russell 3000 Index return of +27.58% over the same period. Over half our holdings now trade at a 25% or greater discount to private market value. The skewed market environment is thus providing significant measurable opportunities for our clients in Mid Cap PMV. We would highlight two stylistic headwinds during the period: 1) large-capitalization companies outperformed small and mid-capitalization companies by over 600 bps during the period (Russell 1000 Index +28.01% vs. Russell 2500 Index +21.70%) and 2) Growth outperformed Value by over 1000 bps (Russell 3000 Growth Index +32.81% vs. Russell 3000 Value Index +21.71%). Within the portfolio, stock selection and sector allocation were both negative. At the sector level, Information Technology, Materials and Industrials were the largest relative detractors while Health Care and Consumer Staples (one stock) were contributors. Regarding stock selection, several of the largest detractors – including Sealed Air, FMC Corp. and Leslie’s – were hit by severe destocking headwinds following the overstocking that occurred when customers were scrambling to build inventory after the pandemic-induced recent supply chain challenges.
HOW DID THE FUND PERFORM SINCE INCEPTION?1
The $10,000 chart reflects a hypothetical $10,000 investment in the class of shares noted and assumes the maximum sales charge. The chart uses total return NAV performance and assumes reinvestment of dividends and capital gains. Fund expenses, including 12b-1 fees, management fees and other expenses were deducted.
CUMULATIVE PERFORMANCE (Initial Investment of $10,000)
ANNUAL AVERAGE TOTAL RETURN (%)
| | | |
| | 1 Year | 5 Year | 10 Year |
Investor Class | 15.41 | 7.22 | 6.03 |
Russell 3000 Total Return | 27.58 | 15.00 | 12.09 |
Russell Midcap Value Total Return | 23.67 | 10.28 | 8.14 |
| Reinhart Midcap PMV Fund | PAGE 1 | TSR_AR_56166Y842 |
Visit https://reinhartfunds.com for more recent performance information.
| 1 | The fund’s past performance is not a good predictor of how the fund will perform in the future. The graph and table do not reflect the deduction of taxes that a shareholder would pay on fund distributions or redemption of fund shares. |
KEY FUND STATISTICS (as of May 31, 2024)
| |
Net Assets | $122,289,501 |
Number of Holdings | 43 |
Net Advisory Fee | $903,304 |
Portfolio Turnover | 18% |
Visit https://reinhartfunds.com for more recent performance information.
WHAT DID THE FUND INVEST IN? (as of May 31, 2024)*
| |
Industry | (%)** |
Financials | 25.3% |
Industrials | 12.1% |
Health Care | 11.9% |
Real Estate | 11.7% |
Consumer Discretionary | 8.6% |
Information Technology | 8.4% |
Materials | 6.1% |
Communication Services | 5.1% |
Consumer Staples | 3.0% |
Cash & Other | 7.8% |
| |
Top 10 Issuers | (%)** |
Lantheus Holdings | 4.1% |
First American Treasury Obligations Fund | 3.7% |
SS&C Technologies Holdings | 3.6% |
Fidelity National Information Services | 3.4% |
Encompass Health | 3.4% |
Live Nation Entertainment | 3.2% |
Fidelity National Financial | 3.0% |
BJ’s Wholesale Club Holdings | 3.0% |
Affiliated Managers Group | 2.9% |
Insperity | 2.8% |
| * | The Global Industry Classification Standard (“GICS®”) was developed by and/or is the exclusive property of MSCI, Inc. (“MSCI”) and Standard & Poor’s Financial Services LLC (“S&P”). GICS® is a service mark of MSCI and S&P and has been licensed for use by U.S. Bank Global Fund Services. |
| ** | Percentages are stated as a % of net assets. |
For additional information about the Fund; including its prospectus, financial information, holdings and proxy information, scan the QR code or visit https://reinhartfunds.com
The Reinhart Midcap PMV Fund is distributed by Quasar Distributors, LLC.
HOUSEHOLDING
To reduce Fund expenses, only one copy of most shareholder documents may be mailed to shareholders with multiple accounts at the same address (Householding). If you would prefer that your Reinhart Partners, Inc. documents not be householded, please contact Reinhart Partners, Inc. at 1-855-774-3863, or contact your financial intermediary. Your instructions will typically be effective within 30 days of receipt by Reinhart Partners, Inc. or your financial intermediary.
| Reinhart Midcap PMV Fund | PAGE 2 | TSR_AR_56166Y842 |
100001067210930119681347012678113241700517248155631796110000111861121113194151811556017344249602404024529312951000011009109741265013703134161248919560195491769221880
| | |
| Reinhart Midcap PMV Fund | |
| Advisor Class | RPMVX |
| Annual Shareholder Report | May 31, 2024 |
This annual shareholder report contains important information about the Reinhart Midcap PMV Fund for the period of June 1, 2023, to May 31, 2024. You can find additional information about the Fund at https://reinhartfunds.com. You can also request this information by contacting us at 1-855-774-3863.
This report describes changes to the Fund that occurred during the reporting period.
WHAT WERE THE FUND COSTS FOR THE PAST YEAR? (based on a hypothetical $10,000 investment)
| | |
Class Name | Costs of a $10,000 investment | Costs paid as a percentage of a $10,000 investment |
| Advisor Class | $113 | 1.05% |
HOW DID THE FUND PERFORM LAST YEAR AND WHAT AFFECTED ITS PERFORMANCE?
The Reinhart Mid Cap PMV Fund – Advisor Class generated a return of +15.71% for the twelve-month period ended May 31, 2024, underperforming the Russell 3000 Index return of +27.58% over the same period. Over half our holdings now trade at a 25% or greater discount to private market value. The skewed market environment is thus providing significant measurable opportunities for our clients in Mid Cap PMV. We would highlight two stylistic headwinds during the period: 1) large-capitalization companies outperformed small and mid-capitalization companies by over 600 bps during the period (Russell 1000 Index +28.01% vs. Russell 2500 Index +21.70%) and 2) Growth outperformed Value by over 1000 bps (Russell 3000 Growth Index +32.81% vs. Russell 3000 Value Index +21.71%). Within the portfolio, stock selection and sector allocation were both negative. At the sector level, Information Technology, Materials and Industrials were the largest relative detractors while Health Care and Consumer Staples (one stock) were contributors. Regarding stock selection, several of the largest detractors – including Sealed Air, FMC Corp. and Leslie’s – were hit by severe destocking headwinds following the overstocking that occurred when customers were scrambling to build inventory after the pandemic-induced recent supply chain challenges.
HOW DID THE FUND PERFORM SINCE INCEPTION?1
The $10,000 chart reflects a hypothetical $10,000 investment in the class of shares noted and assumes the maximum sales charge. The chart uses total return NAV performance and assumes reinvestment of dividends and capital gains. Fund expenses, including 12b-1 fees, management fees and other expenses were deducted.
CUMULATIVE PERFORMANCE (Initial Investment of $10,000)
ANNUAL AVERAGE TOTAL RETURN (%)
| | | |
| | 1 Year | 5 Year | 10 Year |
Advisor Class | 15.71 | 7.49 | 6.30 |
Russell 3000 Total Return | 27.58 | 15.00 | 12.09 |
Russell Midcap Value Total Return | 23.67 | 10.28 | 8.14 |
| Reinhart Midcap PMV Fund | PAGE 1 | TSR_AR_56166Y834 |
Visit https://reinhartfunds.com for more recent performance information.
| 1 | The fund’s past performance is not a good predictor of how the fund will perform in the future. The graph and table do not reflect the deduction of taxes that a shareholder would pay on fund distributions or redemption of fund shares. |
KEY FUND STATISTICS (as of May 31, 2024)
| |
Net Assets | $122,289,501 |
Number of Holdings | 43 |
Net Advisory Fee | $903,304 |
Portfolio Turnover | 18% |
Visit https://reinhartfunds.com for more recent performance information.
WHAT DID THE FUND INVEST IN? (as of May 31, 2024)*
| |
Industry | (%)** |
Financials | 25.3% |
Industrials | 12.1% |
Health Care | 11.9% |
Real Estate | 11.7% |
Consumer Discretionary | 8.6% |
Information Technology | 8.4% |
Materials | 6.1% |
Communication Services | 5.1% |
Consumer Staples | 3.0% |
Cash & Other | 7.8% |
| |
Top 10 Issuers | (%)** |
Lantheus Holdings | 4.1% |
First American Treasury Obligations Fund | 3.7% |
SS&C Technologies Holdings | 3.6% |
Fidelity National Information Services | 3.4% |
Encompass Health | 3.4% |
Live Nation Entertainment | 3.2% |
Fidelity National Financial | 3.0% |
BJ’s Wholesale Club Holdings | 3.0% |
Affiliated Managers Group | 2.9% |
Insperity | 2.8% |
| * | The Global Industry Classification Standard (“GICS®”) was developed by and/or is the exclusive property of MSCI, Inc. (“MSCI”) and Standard & Poor’s Financial Services LLC (“S&P”). GICS® is a service mark of MSCI and S&P and has been licensed for use by U.S. Bank Global Fund Services. |
| ** | Percentages are stated as a % of net assets. |
For additional information about the Fund; including its prospectus, financial information, holdings and proxy information, scan the QR code or visit https://reinhartfunds.com
The Reinhart Midcap PMV Fund is distributed by Quasar Distributors, LLC.
HOUSEHOLDING
To reduce Fund expenses, only one copy of most shareholder documents may be mailed to shareholders with multiple accounts at the same address (Householding). If you would prefer that your Reinhart Partners, Inc. documents not be householded, please contact Reinhart Partners, Inc. at 1-855-774-3863, or contact your financial intermediary. Your instructions will typically be effective within 30 days of receipt by Reinhart Partners, Inc. or your financial intermediary.
| Reinhart Midcap PMV Fund | PAGE 2 | TSR_AR_56166Y834 |
100001070310985120601360412830114941730517596159131841410000111861121113194151811556017344249602404024529312951000011009109741265013703134161248919560195491769221880
| | |
| Reinhart Midcap PMV Fund | |
| Institutional Class | RPMNX |
| Annual Shareholder Report | May 31, 2024 |
This annual shareholder report contains important information about the Reinhart Midcap PMV Fund for the period of June 1, 2023, to May 31, 2024. You can find additional information about the Fund at https://reinhartfunds.com. You can also request this information by contacting us at 1-855-774-3863.
This report describes changes to the Fund that occurred during the reporting period.
WHAT WERE THE FUND COSTS FOR THE PAST YEAR? (based on a hypothetical $10,000 investment)
| | |
Class Name | Costs of a $10,000 investment | Costs paid as a percentage of a $10,000 investment |
| Institutional Class | $97 | 0.90% |
HOW DID THE FUND PERFORM LAST YEAR AND WHAT AFFECTED ITS PERFORMANCE?
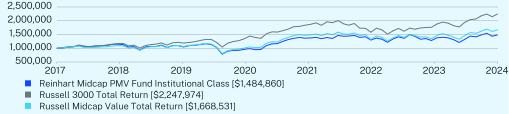
The Reinhart Mid Cap PMV Fund – Institutional Class generated a return of +15.84% for the twelve-month period ended May 31, 2024, underperforming the Russell 3000 Index return of +27.58% over the same period. Over half our holdings now trade at a 25% or greater discount to private market value. The skewed market environment is thus providing significant measurable opportunities for our clients in Mid Cap PMV. We would highlight two stylistic headwinds during the period: 1) large-capitalization companies outperformed small and mid-capitalization companies by over 600 bps during the period (Russell 1000 Index +28.01% vs. Russell 2500 Index +21.70%) and 2) Growth outperformed Value by over 1000 bps (Russell 3000 Growth Index +32.81% vs. Russell 3000 Value Index +21.71%). Within the portfolio, stock selection and sector allocation were both negative. At the sector level, Information Technology, Materials and Industrials were the largest relative detractors while Health Care and Consumer Staples (one stock) were contributors. Regarding stock selection, several of the largest detractors – including Sealed Air, FMC Corp. and Leslie’s – were hit by severe destocking headwinds following the overstocking that occurred when customers were scrambling to build inventory after the pandemic-induced recent supply chain challenges.
HOW DID THE FUND PERFORM SINCE INCEPTION?1
The $1,000,000 chart reflects a hypothetical $1,000,000 investment in the class of shares noted. The chart uses total return NAV performance and assumes reinvestment of dividends and capital gains. Fund expenses, including 12b-1 fees, management fees and other expenses were deducted.
CUMULATIVE PERFORMANCE (Initial Investment of $1,000,000)
| Reinhart Midcap PMV Fund | PAGE 1 | TSR_AR_56167N654 |
ANNUAL AVERAGE TOTAL RETURN (%)
| | | |
| | 1 Year | 5 Year | Since Inception
(09/29/2017) |
Institutional Class | 15.84 | 7.62 | 6.11 |
Russell 3000 Total Return | 27.58 | 15.00 | 12.92 |
Russell Midcap Value Total Return | 23.67 | 10.28 | 7.98 |
Visit https://reinhartfunds.com for more recent performance information.
| 1 | The fund’s past performance is not a good predictor of how the fund will perform in the future. The graph and table do not reflect the deduction of taxes that a shareholder would pay on fund distributions or redemption of fund shares. |
KEY FUND STATISTICS (as of May 31, 2024)
| |
Net Assets | $122,289,501 |
Number of Holdings | 43 |
Net Advisory Fee | $903,304 |
Portfolio Turnover | 18% |
Visit https://reinhartfunds.com for more recent performance information.
WHAT DID THE FUND INVEST IN? (as of May 31, 2024)*
| |
Industry | (%)** |
Financials | 25.3% |
Industrials | 12.1% |
Health Care | 11.9% |
Real Estate | 11.7% |
Consumer Discretionary | 8.6% |
Information Technology | 8.4% |
Materials | 6.1% |
Communication Services | 5.1% |
Consumer Staples | 3.0% |
Cash & Other | 7.8% |
| |
Top 10 Issuers | (%)** |
Lantheus Holdings | 4.1% |
First American Treasury Obligations Fund | 3.7% |
SS&C Technologies Holdings | 3.6% |
Fidelity National Information Services | 3.4% |
Encompass Health | 3.4% |
Live Nation Entertainment | 3.2% |
Fidelity National Financial | 3.0% |
BJ’s Wholesale Club Holdings | 3.0% |
Affiliated Managers Group | 2.9% |
Insperity | 2.8% |
| * | The Global Industry Classification Standard (“GICS®”) was developed by and/or is the exclusive property of MSCI, Inc. (“MSCI”) and Standard & Poor’s Financial Services LLC (“S&P”). GICS® is a service mark of MSCI and S&P and has been licensed for use by U.S. Bank Global Fund Services. |
| ** | Percentages are stated as a % of net assets. |
For additional information about the Fund; including its prospectus, financial information, holdings and proxy information, scan the QR code or visit https://reinhartfunds.com
The Reinhart Midcap PMV Fund is distributed by Quasar Distributors, LLC.
HOUSEHOLDING
To reduce Fund expenses, only one copy of most shareholder documents may be mailed to shareholders with multiple accounts at the same address (Householding). If you would prefer that your Reinhart Partners, Inc. documents not be householded, please contact Reinhart Partners, Inc. at 1-855-774-3863, or contact your financial intermediary. Your instructions will typically be effective within 30 days of receipt by Reinhart Partners, Inc. or your financial intermediary.
| Reinhart Midcap PMV Fund | PAGE 2 | TSR_AR_56167N654 |
1089236102852792277413911191417090128185714848601090474111769512458221792883172683417619702247974104494610230599524001491587149074513492011668531
| | |
| Reinhart Genesis PMV Fund | |
| Investor Class | RPMAX |
| Annual Shareholder Report | May 31, 2024 |
This annual shareholder report contains important information about the Reinhart Genesis PMV Fund for the period of June 1, 2023, to May 31, 2024. You can find additional information about the Fund at https://reinhartfunds.com. You can also request this information by contacting us at 1-855-774-3863.
This report describes changes to the Fund that occurred during the reporting period.
WHAT WERE THE FUND COSTS FOR THE PAST YEAR? (based on a hypothetical $10,000 investment)
| | |
Class Name | Costs of a $10,000 investment | Costs paid as a percentage of a $10,000 investment |
| Investor Class | $136 | 1.20% |
HOW DID THE FUND PERFORM LAST YEAR AND WHAT AFFECTED ITS PERFORMANCE?
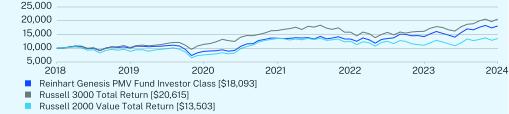
The Reinhart Genesis PMV Fund – Investor Class generated a return of +27.04% for the twelve-month period ended May 31, 2024, essentially inline with the Russell 3000 Index return of +27.58% over the same period. Given our focus on smaller capitalization companies and Private Market Value valuation discipline, we are pleased with these results given two stylistic headwinds during the period: 1) large-capitalization companies outperformed small-capitalization companies by nearly 800 bps during the period (Russell 1000 Index +28.01% vs. Russell 2000 Index +20.13%) and 2) Growth outperformed Value by over 1000 bps (Russell 3000 Growth Index +32.81% vs. Russell 3000 Value Index +21.71%). Within the portfolio, stock selection offset negative sector allocation. At the sector level, Consumer Staples (one stock) and Financials were the largest relative contributors while Information Technology and Real Estate were a drag during the period. Finally, with just four new purchases and two complete sales during the trailing fiscal year, portfolio activity has remained subdued as we continue to believe our companies are well-positioned and attractively valued.
HOW DID THE FUND PERFORM SINCE INCEPTION?1
The $10,000 chart reflects a hypothetical $10,000 investment in the class of shares noted and assumes the maximum sales charge. The chart uses total return NAV performance and assumes reinvestment of dividends and capital gains. Fund expenses, including 12b-1 fees, management fees and other expenses were deducted.
CUMULATIVE PERFORMANCE (Initial Investment of $10,000)
| Reinhart Genesis PMV Fund | PAGE 1 | TSR_AR_56166Y248 |
ANNUAL AVERAGE TOTAL RETURN (%)
| | | |
| | 1 Year | 5 Year | Since Inception
(05/31/2018) |
Investor Class | 27.04 | 12.44 | 10.39 |
Russell 3000 Total Return | 27.58 | 15.00 | 12.81 |
Russell 2000 Value Total Return | 21.76 | 8.77 | 5.13 |
Visit https://reinhartfunds.com for more recent performance information.
| 1 | The fund’s past performance is not a good predictor of how the fund will perform in the future. The graph and table do not reflect the deduction of taxes that a shareholder would pay on fund distributions or redemption of fund shares. |
KEY FUND STATISTICS (as of May 31, 2024)
| |
Net Assets | $430,659,537 |
Number of Holdings | 39 |
Net Advisory Fee | $2,718,744 |
Portfolio Turnover | 21% |
Visit https://reinhartfunds.com for more recent performance information.
WHAT DID THE FUND INVEST IN? (as of May 31, 2024)*
| |
Industry | (%)** |
Financials | 26.7% |
Information Technology | 19.5% |
Industrials | 16.4% |
Consumer Discretionary | 13.9% |
Health Care | 9.4% |
Real Estate | 6.3% |
Consumer Staples | 2.7% |
Materials | 1.4% |
Cash & Other | 3.7% |
| |
Top 10 Issuers | (%)** |
Lantheus Holdings | 5.1% |
First Citizens BancShares | 4.9% |
ACI Worldwide | 4.3% |
frontdoor | 4.2% |
U-Haul Holding, Series N | 3.8% |
Wintrust Financial | 3.8% |
Insperity | 3.8% |
Air Lease, Class A | 3.7% |
First American Treasury Obligations Fund | 3.7% |
Assured Guaranty | 3.6% |
| * | The Global Industry Classification Standard (“GICS®”) was developed by and/or is the exclusive property of MSCI, Inc. (“MSCI”) and Standard & Poor’s Financial Services LLC (“S&P”). GICS® is a service mark of MSCI and S&P and has been licensed for use by U.S. Bank Global Fund Services. |
| ** | Percentages are stated as a % of net assets. |
For additional information about the Fund; including its prospectus, financial information, holdings and proxy information, scan the QR code or visit https://reinhartfunds.com
The Reinhart Genesis PMV Fund is distributed by Quasar Distributors, LLC.
HOUSEHOLDING
To reduce Fund expenses, only one copy of most shareholder documents may be mailed to shareholders with multiple accounts at the same address (Householding). If you would prefer that your Reinhart Partners, Inc. documents not be householded, please contact Reinhart Partners, Inc. at 1-855-774-3863, or contact your financial intermediary. Your instructions will typically be effective within 30 days of receipt by Reinhart Partners, Inc. or your financial intermediary.
| Reinhart Genesis PMV Fund | PAGE 2 | TSR_AR_56166Y248 |
100001006988601362913344142421809310000102501142516441158361615820615100008868756613571125311109013503
| | |
| Reinhart Genesis PMV Fund | |
| Advisor Class | RPMFX |
| Annual Shareholder Report | May 31, 2024 |
This annual shareholder report contains important information about the Reinhart Genesis PMV Fund for the period of June 1, 2023, to May 31, 2024. You can find additional information about the Fund at https://reinhartfunds.com. You can also request this information by contacting us at 1-855-774-3863.
This report describes changes to the Fund that occurred during the reporting period.
WHAT WERE THE FUND COSTS FOR THE PAST YEAR? (based on a hypothetical $10,000 investment)
| | |
Class Name | Costs of a $10,000 investment | Costs paid as a percentage of a $10,000 investment |
| Advisor Class | $108 | 0.95% |
HOW DID THE FUND PERFORM LAST YEAR AND WHAT AFFECTED ITS PERFORMANCE?
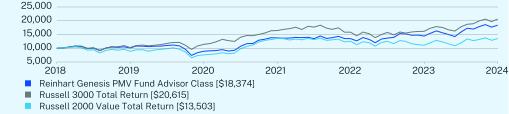
The Reinhart Genesis PMV Fund – Advisor Class generated a return of +27.33% for the twelve-month period ended May 31, 2024, essentially inline with the Russell 3000 Index return of +27.58% over the same period. Given our focus on smaller capitalization companies and Private Market Value valuation discipline, we are pleased with these results given two stylistic headwinds during the period: 1) large-capitalization companies outperformed small-capitalization companies by nearly 800 bps during the period (Russell 1000 Index +28.01% vs. Russell 2000 Index +20.13%) and 2) Growth outperformed Value by over 1000 bps (Russell 3000 Growth Index +32.81% vs. Russell 3000 Value Index +21.71%). Within the portfolio, stock selection offset negative sector allocation. At the sector level, Consumer Staples (one stock) and Financials were the largest relative contributors while Information Technology and Real Estate were a drag during the period. Finally, with just four new purchases and two complete sales during the trailing fiscal year, portfolio activity has remained subdued as we continue to believe our companies are well-positioned and attractively valued.
HOW DID THE FUND PERFORM SINCE INCEPTION?1
The $10,000 chart reflects a hypothetical $10,000 investment in the class of shares noted and assumes the maximum sales charge. The chart uses total return NAV performance and assumes reinvestment of dividends and capital gains. Fund expenses, including 12b-1 fees, management fees and other expenses were deducted.
CUMULATIVE PERFORMANCE (Initial Investment of $10,000)
| Reinhart Genesis PMV Fund | PAGE 1 | TSR_AR_56166Y230 |
ANNUAL AVERAGE TOTAL RETURN (%)
| | | |
| | 1 Year | 5 Year | Since Inception
(05/31/2018) |
Advisor Class | 27.33 | 12.70 | 10.67 |
Russell 3000 Total Return | 27.58 | 15.00 | 12.81 |
Russell 2000 Value Total Return | 21.76 | 8.77 | 5.13 |
Visit https://reinhartfunds.com for more recent performance information.
| 1 | The fund’s past performance is not a good predictor of how the fund will perform in the future. The graph and table do not reflect the deduction of taxes that a shareholder would pay on fund distributions or redemption of fund shares. |
KEY FUND STATISTICS (as of May 31, 2024)
| |
Net Assets | $430,659,537 |
Number of Holdings | 39 |
Net Advisory Fee | $2,718,744 |
Portfolio Turnover | 21% |
Visit https://reinhartfunds.com for more recent performance information.
WHAT DID THE FUND INVEST IN? (as of May 31, 2024)*
| |
Industry | (%)** |
Financials | 26.7% |
Information Technology | 19.5% |
Industrials | 16.4% |
Consumer Discretionary | 13.9% |
Health Care | 9.4% |
Real Estate | 6.3% |
Consumer Staples | 2.7% |
Materials | 1.4% |
Cash & Other | 3.7% |
| |
Top 10 Issuers | (%)** |
Lantheus Holdings | 5.1% |
First Citizens BancShares | 4.9% |
ACI Worldwide | 4.3% |
frontdoor | 4.2% |
U-Haul Holding, Series N | 3.8% |
Wintrust Financial | 3.8% |
Insperity | 3.8% |
Air Lease, Class A | 3.7% |
First American Treasury Obligations Fund | 3.7% |
Assured Guaranty | 3.6% |
| * | The Global Industry Classification Standard (“GICS®”) was developed by and/or is the exclusive property of MSCI, Inc. (“MSCI”) and Standard & Poor’s Financial Services LLC (“S&P”). GICS® is a service mark of MSCI and S&P and has been licensed for use by U.S. Bank Global Fund Services. |
| ** | Percentages are stated as a % of net assets. |
For additional information about the Fund; including its prospectus, financial information, holdings and proxy information, scan the QR code or visit https://reinhartfunds.com
The Reinhart Genesis PMV Fund is distributed by Quasar Distributors, LLC.
HOUSEHOLDING
To reduce Fund expenses, only one copy of most shareholder documents may be mailed to shareholders with multiple accounts at the same address (Householding). If you would prefer that your Reinhart Partners, Inc. documents not be householded, please contact Reinhart Partners, Inc. at 1-855-774-3863, or contact your financial intermediary. Your instructions will typically be effective within 30 days of receipt by Reinhart Partners, Inc. or your financial intermediary.
| Reinhart Genesis PMV Fund | PAGE 2 | TSR_AR_56166Y230 |
100001010489071374513489144301837410000102501142516441158361615820615100008868756613571125311109013503
| | |
| Reinhart International PMV Fund | |
| Advisor Class | RPMYX |
| Annual Shareholder Report | May 31, 2024 |
This annual shareholder report contains important information about the Reinhart International PMV Fund for the period of June 1, 2023, to May 31, 2024. You can find additional information about the Fund at https://reinhartfunds.com. You can also request this information by contacting us at 1-855-774-3863.
This report describes changes to the Fund that occurred during the reporting period.
WHAT WERE THE FUND COSTS FOR THE PAST YEAR? (based on a hypothetical $10,000 investment)
| | |
Class Name | Costs of a $10,000 investment | Costs paid as a percentage of a $10,000 investment |
| Advisor Class | $102 | 0.95% |
HOW DID THE FUND PERFORM LAST YEAR AND WHAT AFFECTED ITS PERFORMANCE?
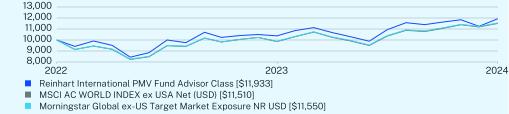
The Reinhart International PMV Fund – Advisor Class generated a return of +15.00% for the twelve-month period ended May 31, 2024, modestly underperforming the MSCI ACWI ex-US Index return of +16.74% over the same period. Moving onto the specific performance drivers for the fiscal year, solid portfolio results within Materials (one stock) and Information Technology were more than offset by weakness in Financials, Consumer Discretionary and Energy (no holdings in best performing sector; +31.97%). As can be the case within a concentrated portfolio and bottom-up investment process, our largest detractors – including Mercari, Edenred, Endava and JD Logistics were largely idiosyncratic and company-specific with a mix macro concerns, business investments and regulatory headwinds. Conversely, positive standouts included Buzzi Spa, Taiwan Semiconductor, as well as our first buyout in the portfolio with the announced acquisition of Adevinta ASA in November.
| |
Top Contributors |
| ↑ | Buzzi Unicem SpA |
| ↑ | BAWAG Group AG |
| ↑ | Taiwan Semiconductor Manufacturing ADR |
| ↑ | International Distribution Services plc |
| ↑ | Adevinta ASA |
| |
Top Detractors |
| ↓ | Mercari, Inc. |
| ↓ | Edenred SA |
| ↓ | Endava Plc ADR |
| ↓ | JD Logistics, Inc. |
| ↓ | Bolsa Mexicana de Valores SAB de CV |
HOW DID THE FUND PERFORM SINCE INCEPTION?1
The $10,000 chart reflects a hypothetical $10,000 investment in the class of shares noted and assumes the maximum sales charge. The chart uses total return NAV performance and assumes reinvestment of dividends and capital gains. Fund expenses, including 12b-1 fees, management fees and other expenses were deducted.
| Reinhart International PMV Fund | PAGE 1 | TSR_AR_56167N365 |
CUMULATIVE PERFORMANCE (Initial Investment of $10,000)
ANNUAL AVERAGE TOTAL RETURN (%)
| | |
| | 1 Year | Since Inception
(05/31/2022) |
Advisor Class | 15.00 | 9.24 |
MSCI AC WORLD INDEX ex USA Net (USD) | 16.74 | 7.29 |
Morningstar Global ex-US Target Market Exposure NR USD | 16.90 | 7.47 |
Visit https://reinhartfunds.com for more recent performance information.
| 1 | The fund’s past performance is not a good predictor of how the fund will perform in the future. The graph and table do not reflect the deduction of taxes that a shareholder would pay on fund distributions or redemption of fund shares. |
KEY FUND STATISTICS (as of May 31, 2024)
| |
Net Assets | $1,718,197 |
Number of Holdings | 42 |
Net Advisory Fee | -$152,652 |
Portfolio Turnover | 12% |
Visit https://reinhartfunds.com for more recent performance information.
WHAT DID THE FUND INVEST IN? (as of May 31, 2024)*
| |
Industry | (%)** |
Financials | 23.6% |
Information Technology | 17.7% |
Consumer Discretionary | 16.8% |
Industrials | 15.0% |
Consumer Staples | 8.2% |
Real Estate | 6.9% |
Materials | 4.9% |
Communication Services | 3.6% |
Health Care | 1.4% |
Cash & Other | 1.9% |
| |
Top 10 Issuers | (%)** |
Silicon Motion Technology | 4.2% |
Taiwan Semiconductor Manufacturing | 4.0% |
Jeronimo Martins SGPS SA | 3.8% |
Bank of Ireland Group plc | 3.3% |
Edenred | 3.3% |
Euronet Worldwide | 3.3% |
BAWAG Group AG | 3.2% |
Buzzi Unicem SpA | 3.1% |
B&M European Value Retail SA | 3.1% |
Capgemini SE | 2.9% |
| |
Top Ten Countries | (%)** |
United Kingdom | 13.5% |
United States | 10.8% |
France | 10.7% |
Canada | 10.1% |
Taiwan, Province Of China | 8.2% |
Japan | 6.5% |
China | 4.8% |
Portugal | 3.8% |
Ireland | 3.3% |
Cash & Other | 28.3% |
| * | The Global Industry Classification Standard (“GICS®”) was developed by and/or is the exclusive property of MSCI, Inc. (“MSCI”) and Standard & Poor’s Financial Services LLC (“S&P”). GICS® is a service mark of MSCI and S&P and has been licensed for use by U.S. Bank Global Fund Services. |
| ** | Percentages are stated as a % of net assets. |
| Reinhart International PMV Fund | PAGE 2 | TSR_AR_56167N365 |
For additional information about the Fund; including its prospectus, financial information, holdings and proxy information, scan the QR code or visit https://reinhartfunds.com
The Reinhart International PMV Fund is distributed by Quasar Distributors, LLC.
HOUSEHOLDING
To reduce Fund expenses, only one copy of most shareholder documents may be mailed to shareholders with multiple accounts at the same address (Householding). If you would prefer that your Reinhart Partners, Inc. documents not be householded, please contact Reinhart Partners, Inc. at 1-855-774-3863, or contact your financial intermediary. Your instructions will typically be effective within 30 days of receipt by Reinhart Partners, Inc. or your financial intermediary.
| Reinhart International PMV Fund | PAGE 3 | TSR_AR_56167N365 |
1000010376119331000098591151010000988011550
OR
Not applicable.
Item 2. Code of Ethics.
The registrant has adopted a code of ethics that applies to the registrant’s principal executive officer and principal financial officer. The registrant has not made any substantive amendments to its code of ethics during the period covered by this report. The registrant has not granted any waivers from any provisions of the code of ethics during the period covered by this report.
A copy of the registrant’s Code of Ethics is filed herewith.
Item 3. Audit Committee Financial Expert.
The registrant’s board of trustees] has determined that there is at least one audit committee financial expert serving on its audit committee. Leonard M. Rush is the “audit committee financial expert” and is considered to be “independent” as each term is defined in Item 3 of Form N-CSR.
Item 4. Principal Accountant Fees and Services.
The registrant has engaged its principal accountant to perform audit services, audit-related services, tax services and other services during the past two fiscal years. “Audit services” refer to performing an audit of the registrant’s annual financial statements or services that are normally provided by the accountant in connection with statutory and regulatory filings or engagements for those fiscal years. “Audit-related services” refer to the assurance and related services by the principal accountant that are reasonably related to the performance of the audit. “Tax services” refer to professional services rendered by the principal accountant for tax compliance, tax advice, and tax planning. There were no “Other Services” provided by the principal accountant. The following table details the aggregate fees billed or expected to be billed for each of the last two fiscal years for audit fees, audit-related fees, tax fees and other fees by the principal accountant.
| | FYE 05/31/2024 | FYE 05/31/2023 |
| (a) Audit Fees | $47,000 | $44,750 |
| (b) Audit-Related Fees | $0 | $0 |
| (c) Tax Fees | $10,500 | $10,500 |
| (d) All Other Fees | $0 | $0 |
(e)(1) The audit committee has adopted pre-approval policies and procedures that require the audit committee to pre-approve all audit and non-audit services of the registrant, including services provided to any entity affiliated with the registrant.
(e)(2) The percentage of fees billed by Cohen & Company applicable to non-audit services pursuant to waiver of pre-approval requirement were as follows:
| | FYE 05/31/2024 | FYE 05/31/2023 |
| Audit-Related Fees | 0% | 0% |
| Tax Fees | 0% | 0% |
| All Other Fees | 0% | 0% |
(f) Not applicable
(g) The following table indicates the non-audit fees billed or expected to be billed by the registrant’s accountant for services to the registrant and to the registrant’s investment adviser (and any other controlling entity, etc.—not sub-adviser) for the last two years.
| Non-Audit Related Fees | FYE 05/31/2024 | FYE 05/31/2023 |
| Registrant | $0 | $0 |
| Registrant’s Investment Adviser | $0 | $0 |
(h) The audit committee of the board of trustees/directors has considered whether the provision of non-audit services that were rendered to the registrant’s investment adviser is compatible with maintaining the principal accountant’s independence and has concluded that the provision of such non-audit services by the accountant has not compromised the accountant’s independence.
(i) Not applicable
(j) Not applicable
OR
Item 5. Audit Committee of Listed Registrants.
Not applicable
Item 6. Investments.
| (a) | Schedule of Investments is included within the financial statements filed under Item 7 of this Form. |
Item 7. Financial Statements and Financial Highlights for Open-End Investment Companies.
.
Reinhart Mid Cap PMV Fund
Reinhart Genesis PMV Fund
Reinhart International PMV Fund
Core Financial Statements
May 31, 2024
TABLE OF CONTENTS
| | | | |
Schedule of Investments
| | | |
| | | |
| | | |
| | | |
| | | |
| | | |
Statements of Changes in Net Assets
| | | |
| | | |
| | | |
| | | |
Financial Highlights
| | | |
| | | |
| | | |
| | | |
| | | |
| | | |
| | | |
| | | |
| | | | |
Back to Table of Contents
Reinhart Mid Cap PMV Fund
Schedule of Investments
as of May 31, 2024
| | | | | | | |
COMMON STOCKS - 96.4%
| |
Communication Services - 5.1%
| | | |
Interpublic Group of Companies | | | 76,145 | | | $ 2,388,668 |
Live Nation Entertainment(a) | | | 41,805 | | | 3,918,801 |
| | | | | | 6,307,469 |
Consumer Discretionary - 8.6%
| | | |
Allison Transmission Holdings | | | 31,830 | | | 2,413,032 |
Leslie’s(a) | | | 350,130 | | | 2,002,744 |
LKQ | | | 69,735 | | | 3,000,697 |
TransUnion | | | 42,870 | | | 3,083,210 |
| | | | | | 10,499,683 |
Consumer Staples - 3.0%
| | | |
BJ’s Wholesale Club Holdings(a) | | | 41,440 | | | 3,649,621 |
Energy - 2.1%
| | | |
Baker Hughes, Class A | | | 77,035 | | | 2,579,132 |
Financials - 25.3%(b)
| | | |
Affiliated Managers Group | | | 21,930 | | | 3,565,818 |
American Financial Group | | | 19,620 | | | 2,548,834 |
BOK Financial | | | 31,341 | | | 2,840,121 |
Fidelity National Information Services | | | 54,810 | | | 4,158,983 |
Global Payments | | | 27,335 | | | 2,784,070 |
Intercontinental Exchange | | | 21,085 | | | 2,823,282 |
Loews | | | 25,765 | | | 1,978,752 |
M&T Bank | | | 19,075 | | | 2,891,770 |
Northern Trust | | | 25,705 | | | 2,165,389 |
Progressive | | | 8,985 | | | 1,897,452 |
White Mountains Insurance Group | | | 1,818 | | | 3,285,126 |
| | | | | | 30,939,597 |
Health Care - 11.9%
| | | |
Charles River Laboratories International(a) | | | 16,165 | | | 3,369,433 |
Encompass Health | | | 48,042 | | | 4,150,348 |
Lantheus Holdings(a) | | | 61,425 | | | 5,026,408 |
Zimmer Biomet Holdings | | | 17,170 | | | 1,977,125 |
| | | | | | 14,523,314 |
Industrials - 12.1%
| | | |
Insperity | | | 35,760 | | | 3,387,187 |
Sensata Technologies Holding | | | 68,680 | | | 2,837,858 |
Snap-on | | | 7,075 | | | 1,930,484 |
Stanley Black & Decker | | | 15,300 | | | 1,333,701 |
U-Haul Holding, Series N | | | 50,740 | | | 3,084,485 |
WillScot Mobile Mini Holdings Corp.(a) | | | 56,250 | | | 2,217,938 |
| | | | | | 14,791,653 |
Information Technology - 8.4%
| | | |
Cognizant Technology Solutions - Class A | | | 33,735 | | | 2,231,571 |
Fidelity National Financial | | | 72,775 | | | 3,664,949 |
| | | | | | | |
The accompanying notes are an integral part of these financial statements.
Back to Table of Contents
Reinhart Mid Cap PMV Fund
Schedule of Investments
as of May 31, 2024 (Continued)
| | | | | | | |
COMMON STOCKS - (Continued)
| |
Information Technology - (Continued)
| |
SS&C Technologies Holdings | | | 70,305 | | | $4,362,425 |
| | | | | | 10,258,945 |
Materials - 6.1%
| | | |
Avantor(a) | | | 136,230 | | | 3,280,418 |
Eagle Materials | | | 9,800 | | | 2,277,422 |
FMC | | | 30,460 | | | 1,856,537 |
| | | | | | 7,414,377 |
Real Estate - 11.7%
| | | |
Alexandria Real Estate Equities, Inc. - REIT | | | 19,925 | | | 2,371,075 |
Americold Realty Trust - REIT | | | 115,970 | | | 3,092,920 |
Camden Property Trust - REIT | | | 27,795 | | | 2,853,157 |
Rexford Industrial Realty - REIT | | | 40,525 | | | 1,838,214 |
Ventas - REIT | | | 47,020 | | | 2,363,225 |
Weyerhaeuser - REIT | | | 61,230 | | | 1,838,737 |
| | | | | | 14,357,328 |
Utilities - 2.1%
| | | |
Xcel Energy, Inc. | | | 46,665 | | | 2,587,574 |
TOTAL COMMON STOCKS
(Cost $95,087,073) | | | | | | 117,908,693 |
SHORT-TERM INVESTMENTS - 3.7%
| |
Money Market Funds - 3.7%
| |
First American Treasury Obligations Fund - Class X, 5.22%(c) | | | 4,560,081 | | | 4,560,081 |
TOTAL SHORT-TERM INVESTMENTS
(Cost $4,560,081) | | | | | | 4,560,081 |
TOTAL INVESTMENTS - 100.1%
(Cost $99,647,154) | | | | | | $122,468,774 |
Liabilities in Excess of Other Assets - (0.1)% | | | | | | (179,273) |
TOTAL NET ASSETS - 100.0% | | | | | | $122,289,501 |
| | | | | | | |
Percentages are stated as a percent of net assets.
The Global Industry Classification Standard (“GICS®”) was developed by and/or is the exclusive property of MSCI, Inc. (“MSCI”) and Standard & Poor’s Financial Services LLC (“S&P”). GICS® is a service mark of MSCI and S&P and has been licensed for use by U.S. Bank Global Fund Services.
REIT - Real Estate Investment Trust
(a)
| Non-income producing security.
|
(b)
| To the extent that the Fund invests more heavily in a particular industry or sector of the economy, its performance will be especially sensitive to developments that significantly affect those industries or sectors.
|
(c)
| The rate shown represents the 7-day effective yield as of May 31, 2024. |
The accompanying notes are an integral part of these financial statements.
Back to Table of Contents
Reinhart Genesis PMV Fund
Schedule of Investments
as of May 31, 2024
| | | | | | | |
COMMON STOCKS - 96.3%
|
Consumer Discretionary - 13.9%
|
Carter’s | | | 62,250 | | | $4,257,900 |
frontdoor(a) | | | 510,105 | | | 18,042,414 |
Gentex | | | 240,430 | | | 8,415,050 |
Grand Canyon Education(a) | | | 65,400 | | | 9,316,884 |
Hillman Solutions(a) | | | 1,592,000 | | | 14,630,480 |
Thor Industries | | | 54,680 | | | 5,426,443 |
| | | | | | 60,089,171 |
Consumer Staples - 2.7%
|
Sprouts Farmers Market(a) | | | 147,000 | | | 11,610,060 |
Financials - 26.7%(b)
|
1st Source | | | 35,860 | | | 1,843,921 |
Air Lease, Class A | | | 333,980 | | | 15,910,807 |
Assured Guaranty | | | 197,000 | | | 15,310,840 |
First American Financial | | | 216,000 | | | 12,005,280 |
First Citizens BancShares - Class A | | | 12,330 | | | 20,941,642 |
First Hawaiian | | | 510,490 | | | 10,378,262 |
International Bancshares | | | 132,520 | | | 7,531,112 |
LPL Financial Holdings | | | 13,500 | | | 3,863,835 |
White Mountains Insurance Group | | | 6,000 | | | 10,842,000 |
Wintrust Financial | | | 166,100 | | | 16,379,121 |
| | | | | | 115,006,820 |
Health Care - 9.4%
| |
AdaptHealth(a) | | | 937,000 | | | 8,882,760 |
Encompass Health | | | 107,920 | | | 9,323,209 |
Lantheus Holdings(a) | | | 270,000 | | | 22,094,100 |
| | | | | | 40,300,069 |
Industrials - 16.4%
| |
GMS(a) | | | 108,562 | | | 10,200,485 |
GXO Logistics(a) | | | 130,000 | | | 6,529,900 |
Insperity | | | 172,830 | | | 16,370,458 |
MAXIMUS | | | 78,000 | | | 6,715,800 |
Modine Manufacturing(a) | | | 97,000 | | | 9,789,240 |
TriNet Group | | | 44,000 | | | 4,574,680 |
U-Haul Holding, Series N | | | 272,187 | | | 16,546,248 |
| | | | | | 70,726,811 |
Information Technology - 19.5%
| |
ACI Worldwide(a) | | | 510,000 | | | 18,365,100 |
ASGN(a) | | | 118,000 | | | 11,081,380 |
Axcelis Technologies, Inc.(a) | | | 93,000 | | | 10,461,570 |
Euronet Worldwide(a) | | | 125,000 | | | 14,572,500 |
FormFactor(a) | | | 121,000 | | | 6,621,120 |
PAR Technology(a) | | | 202,375 | | | 9,029,972 |
Silicon Motion Technology - ADR | | | 175,000 | | | 13,665,750 |
| | | | | | 83,797,392 |
| | | | | | | |
The accompanying notes are an integral part of these financial statements.
Back to Table of Contents
Reinhart Genesis PMV Fund
Schedule of Investments
as of May 31, 2024 (Continued)
| | | | | | | |
COMMON STOCKS - (Continued)
|
Materials - 1.4%
|
Element Solutions | | | 255,000 | | | $6,127,650 |
Real Estate - 6.3%
|
Alexander & Baldwin - REIT | | | 516,836 | | | 8,682,844 |
Marcus & Millichap | | | 324,060 | | | 10,476,860 |
Ryman Hospitality Properties - REIT | | | 76,440 | | | 8,031,551 |
| | | | | | 27,191,255 |
TOTAL COMMON STOCKS
(Cost $317,461,625) | | | | | | 414,849,228 |
SHORT-TERM INVESTMENTS - 3.7%
| | | | | | |
Money Market Funds - 3.7%
| | | | | | |
First American Treasury Obligations Fund - Class X, 5.22%(c) | | | 15,890,600 | | | 15,890,600 |
TOTAL SHORT-TERM INVESTMENTS
(Cost $15,890,600) | | | | | | 15,890,600 |
TOTAL INVESTMENTS - 100.0%
(Cost $333,352,225) | | | | | | $430,739,828 |
Liabilities in Excess of Other Assets - 0.0%(d) | | | | | | (80,291) |
TOTAL NET ASSETS - 100.0% | | | | | | $430,659,537 |
| | | | | | | |
Percentages are stated as a percent of net assets.
The Global Industry Classification Standard (“GICS®”) was developed by and/or is the exclusive property of MSCI, Inc. (“MSCI”) and Standard & Poor’s Financial Services LLC (“S&P”). GICS® is a service mark of MSCI and S&P and has been licensed for use by U.S. Bank Global Fund Services.
ADR - American Depositary Receipt
REIT - Real Estate Investment Trust
(a)
| Non-income producing security.
|
(b)
| To the extent that the Fund invests more heavily in a particular industry or sector of the economy, its performance will be especially sensitive to developments that significantly affect those industries or sectors.
|
(c)
| The rate shown represents the 7-day effective yield as of May 31, 2024. |
(d)
| Represents less than 0.05% of net assets. |
The accompanying notes are an integral part of these financial statements.
Back to Table of Contents
Reinhart International PMV Fund
Schedule of Investments
as of May 31, 2024
| | | | | | | |
COMMON STOCKS - 98.1%
|
Austria - 3.2%
|
BAWAG Group AG | | | 840 | | | $ 55,567 |
Canada - 10.1%
|
Boyd Group Services | | | 150 | | | 25,110 |
CCL Industries - Class B | | | 600 | | | 30,926 |
Constellation Software | | | 12 | | | 33,378 |
Dollarama | | | 200 | | | 18,929 |
Element Fleet Management | | | 2,000 | | | 35,541 |
Granite Real Estate Investment Trust - REIT | | | 600 | | | 29,680 |
| | | | | | 173,564 |
China - 4.8%
|
China Feihe | | | 35,000 | | | 17,371 |
JD Logistics(a) | | | 35,000 | | | 38,275 |
NetEase - ADR | | | 300 | | | 26,709 |
| | | | | | 82,355 |
France - 10.7%
|
Capgemini SE | | | 250 | | | 50,650 |
Edenred | | | 1,200 | | | 55,994 |
Elis SA | | | 1,200 | | | 30,509 |
La Francaise des Jeux SAEM | | | 1,300 | | | 46,800 |
| | | | | | 183,953 |
Germany - 2.0%
|
CTS Eventim AG | | | 400 | | | 34,701 |
Ireland - 3.3%
|
Bank of Ireland Group plc | | | 5,000 | | | 57,465 |
Israel - 2.3%
|
Sapiens International Corp. NV | | | 1,200 | | | 40,224 |
Italy - 3.1%
|
Buzzi Unicem SpA | | | 1,260 | | | 53,271 |
Japan - 6.5%
|
Hoya | | | 200 | | | 24,347 |
Mercari(a) | | | 4,200 | | | 49,230 |
Sanwa Holdings Corp. | | | 2,000 | | | 37,233 |
| | | | | | 110,810 |
Luxembourg - 3.1%
|
B&M European Value Retail SA | | | 7,500 | | | 52,434 |
Mexico - 2.5%
|
Bolsa Mexicana de Valores SAB de CV | | | 24,000 | | | 43,625 |
Netherlands - 2.9%
|
Euronext NV(a) | | | 500 | | | 49,233 |
| | | | | | | |
The accompanying notes are an integral part of these financial statements.
Back to Table of Contents
Reinhart International PMV Fund
Schedule of Investments
as of May 31, 2024 (Continued)
| | | | | | | |
COMMON STOCKS - (Continued)
|
Portugal - 3.8%
|
Jeronimo Martins SGPS SA | | | 2,900 | | | $65,060 |
Republic of Korea - 2.9%
|
Coway | | | 1,200 | | | 49,143 |
Spain - 2.8%
|
Aena SME SA | | | 250 | | | 48,890 |
Sweden - 2.4%
|
Svenska Handelsbanken AB - Class A | | | 4,400 | | | 41,407 |
Taiwan, Province Of China - 8.2%
|
Silicon Motion Technology - ADR | | | 935 | | | 73,014 |
Taiwan Semiconductor Manufacturing - ADR | | | 450 | | | 67,968 |
| | | | | | 140,982 |
United Kingdom - 13.5%
|
Compass Group plc | | | 1,200 | | | 33,691 |
Endava plc - ADR(a) | | | 1,430 | | | 38,524 |
International Distributions Services plc(a) | | | 10,000 | | | 43,140 |
London Stock Exchange Group plc | | | 400 | | | 46,886 |
Nomad Foods | | | 1,500 | | | 26,340 |
UNITE Group plc - REIT | | | 3,600 | | | 42,940 |
| | | | | | 231,521 |
United States - 8.2%
|
Booking Holdings | | | 10 | | | 37,764 |
Cushman & Wakefield plc(a) | | | 4,200 | | | 46,662 |
Euronet Worldwide(a) | | | 480 | | | 55,958 |
| | | | | | 140,384 |
Vietnam - 1.8%
|
Vietnam Dairy Products JSC | | | 12,200 | | | 31,408 |
TOTAL COMMON STOCKS
(Cost $1,492,415) | | | | | | 1,685,997 |
| | | | | | | |
| | | | | | | |
WARRANTS - 0.0%(b)
| |
Canada - 0.0%(b)
|
Constellation Software, Expires 03/31/2040, Exercise Price $0.00(a)(c) | | | 20 | | | 0 |
TOTAL WARRANTS
(Cost $0) | | | | | | 0 |
| | | | | | | |
The accompanying notes are an integral part of these financial statements.
Back to Table of Contents
Reinhart International PMV Fund
Schedule of Investments
as of May 31, 2024 (Continued)
| | | | | | | |
SHORT-TERM INVESTMENTS - 2.6%
| |
Money Market Funds - 2.6%
|
First American Treasury Obligations Fund - Class X, 5.22%(d) | | | 44,696 | | | $44,696 |
TOTAL SHORT-TERM INVESTMENTS
(Cost $44,696) | | | | | | 44,696 |
TOTAL INVESTMENTS - 100.7%
(Cost $1,537,111) | | | | | | 1,730,693 |
Liabilities in Excess of Other Assets - (0.7)% | | | | | | (12,496) |
TOTAL NET ASSETS - 100.0% | | | | | | $1,718,197 |
| | | | | | | |
Percentages are stated as a percent of net assets.
The Global Industry Classification Standard (“GICS®”) was developed by and/or is the exclusive property of MSCI, Inc. (“MSCI”) and Standard & Poor’s Financial Services LLC (“S&P”). GICS® is a service mark of MSCI and S&P and has been licensed for use by U.S. Bank Global Fund Services.
ADR - American Depositary Receipt
PLC - Public Limited Company
REIT - Real Estate Investment Trust
(a)
| Non-income producing security.
|
(b)
| Represents less than 0.05% of net assets.
|
(c)
| Fair value determined using significant unobservable inputs in accordance with procedures established by and under the supervision of the Adviser, acting as Valuation Designee. These securities represented $0 or 0.0% of net assets as of May 31, 2024.
|
(d)
| The rate shown represents the 7-day effective yield as of May 31, 2024. |
| |
Financials | | | $406,135 | | | 23.6% |
Information Technology | | | 303,759 | | | 17.7 |
Consumer Discretionary | | | 287,992 | | | 16.8 |
Industrials | | | 258,698 | | | 15.0 |
Consumer Staples | | | 140,179 | | | 8.2 |
Real Estate | | | 119,282 | | | 6.9 |
Materials | | | 84,196 | | | 4.9 |
Communication Services | | | 61,409 | | | 3.6 |
Health Care | | | 24,347 | | | 1.4 |
Money Market Funds | | | 44,696 | | | 2.6 |
Liabilities in Excess of Other Assets | | | (12,496) | | | (0.7) |
| | | 1,718,197 | | | 100.0% |
| | | | | | | |
The accompanying notes are an integral part of these financial statements.
Back to Table of Contents
Reinhart Funds
STATEMENTS OF ASSETS AND LIABILITIES
May 31, 2024
| | | | | | | | | | |
ASSETS:
| |
Investments, at value (cost $99,647,154, $333,352,225,
and $1,537,111) | | | $122,468,774 | | | $430,739,828 | | | $ 1,730,693 |
Dividends & interest receivable | | | 50,572 | | | 161,948 | | | 4,207 |
Receivable for capital shares sold | | | 17,350 | | | 257,638 | | | — |
Foreign Currencies (cost $1,790) | | | — | | | — | | | 1,790 |
Receivable for foreign withholding tax reclaim | | | 1,357 | | | — | | | 848 |
Receivable due from investment adviser | | | — | | | — | | | 18,780 |
Prepaid expenses | | | 23,851 | | | 44,374 | | | 4,926 |
Total assets | | | 122,561,904 | | | 431,203,788 | | | 1,761,244 |
LIABILITIES:
| | | | | | | | | |
Payable for capital shares redeemed | | | 98,028 | | | 79,274 | | | 188 |
Payable to investment adviser | | | 69,316 | | | 271,522 | | | — |
Payable for fund administration & accounting fees | | | 37,262 | | | 86,108 | | | 15,888 |
Payable for compliance fees | | | 3,247 | | | 3,245 | | | 3,246 |
Payable for transfer agent fees & expenses | | | 18,096 | | | 16,096 | | | 1,321 |
Payable for trustee fees | | | 157 | | | — | | | — |
Payable for custody fees | | | 1,125 | | | 3,850 | | | 1,820 |
Accrued distribution & shareholder service fees | | | 15,007 | | | 50,586 | | | 129 |
Accrued other fees | | | 30,165 | | | 33,570 | | | 20,455 |
Total liabilities | | | 272,403 | | | 544,251 | | | 43,047 |
NET ASSETS | | | $122,289,501 | | | $430,659,537 | | | $ 1,718,197 |
Net Assets Consists of:
| |
Paid-in capital | | | $98,190,974 | | | $331,671,479 | | | $ 1,471,531 |
Total distributable earnings | | | 24,098,527 | | | 98,988,058 | | | 246,666 |
Net assets | | | $122,289,501 | | | $430,659,537 | | | $ 1,718,197 |
Investor Class
| | | | | | | | | |
Net assets | | | $26,218,410 | | | $24,787,326 | | | — |
Shares issued and outstanding(1) | | | 1,524,489 | | | 1,611,680 | | | — |
Net asset value, redemption price and offering price per share | | | $17.20 | | | $15.38 | | | — |
Advisor Class
| | | | | | | | | |
Net assets | | | $92,000,624 | | | $405,872,211 | | | $ 1,718,197 |
Shares issued and outstanding(1) | | | 5,349,317 | | | 26,193,917 | | | 148,237 |
Net asset value, redemption price and offering price per share | | | $17.20 | | | $15.49 | | | $11.59 |
Institutional Class
| | | | | | | | | |
Net assets | | | $ 4,070,467 | | | $ — | | | $ — |
Shares issued and outstanding(1) | | | 235,362 | | | — | | | — |
Net asset value, redemption price and offering price per share | | | $17.29 | | | — | | | — |
| | | | | | | | | | |
(1)
| Unlimited shares authorized without par value. |
The accompanying notes are an integral part of these financial statements.
Back to Table of Contents
Reinhart Funds
STATEMENTS OF OPERATIONS
For the Year Ended May 31, 2024
| | | | | | | | | | |
INVESTMENT INCOME:
| |
Dividend income | | | $2,130,584 | | | $4,150,232 | | | $41,585 |
Interest income | | | 209,690 | | | 712,440 | | | 3,571 |
Less: foreign taxes withheld | | | — | | | — | | | (5,520) |
Total investment income | | | 2,340,274 | | | 4,862,672 | | | 39,636 |
EXPENSES:
| | | | | | | | | |
Investment adviser fees (See Note 4) | | | 1,168,340 | | | 3,461,150 | | | 14,911 |
Fund administration & accounting fees (See Note 4) | | | 153,522 | | | 304,553 | | | 108,296 |
Transfer agent fees & expenses (See Note 4) | | | 71,404 | | | 69,438 | | | 8,715 |
Federal & state registration fees | | | 51,847 | | | 34,986 | | | 3,811 |
Custody fees (See Note 4) | | | 29,170 | | | 20,696 | | | 14,916 |
Trustee fees | | | 22,366 | | | 22,027 | | | 21,776 |
Audit fees | | | 21,747 | | | 19,748 | | | 18,749 |
Postage & printing fees | | | 13,709 | | | 26,988 | | | 207 |
Legal fees | | | 18,667 | | | 18,667 | | | 18,697 |
Compliance fees (See Note 4) | | | 11,993 | | | 11,993 | | | 11,993 |
Other fees | | | 6,376 | | | 5,939 | | | 4,218 |
Insurance fees | | | 3,175 | | | 4,078 | | | 2,323 |
Distribution & shareholder service fees (See Note 5):
|
Investor Class | | | 66,204 | | | 54,971 | | | — |
Advisor Class | | | 45,558 | | | 203,293 | | | 2,013 |
Total expenses before waiver | | | 1,684,078 | | | 4,258,527 | | | 230,625 |
Less: waiver from investment adviser (See Note 4) | | | (265,036) | | | (742,406) | | | (215,713) |
Net expenses | | | 1,419,042 | | | 3,516,121 | | | 14,912 |
Net Investment Income | | | 921,232 | | | 1,346,551 | | | 24,724 |
REALIZED AND UNREALIZED GAIN (LOSS) ON INVESTMENTS:
| | | | | | | | | |
Net realized gain on:
| | | | | | | | | |
Investments | | | 7,043,837 | | | 7,049,362 | | | 50,835 |
Foreign currency translation | | | — | | | — | | | 189 |
Net change in unrealized appreciation/depreciation on investments
|
Investments | | | 9,758,948 | | | 77,842,916 | | | 141,679 |
Foreign currency translation | | | — | | | — | | | 53 |
Net realized and unrealized gain on investments | | | 16,802,785 | | | 84,892,278 | | | 192,756 |
NET INCREASE IN NET ASSETS RESULTING FROM OPERATIONS | | | $17,724,017 | | | $86,238,829 | | | $217,480 |
| | | | | | | | | | |
The accompanying notes are an integral part of these financial statements.
Back to Table of Contents
STATEMENTS OF CHANGES IN NET ASSETS
| | | | |
OPERATIONS:
| |
Net investment income | | | $921,232 | | | $1,434,497 |
Net realized gain on investments | | | 7,043,837 | | | 11,707,515 |
Net change in unrealized appreciation/depreciation on investments | | | 9,758,948 | | | (32,800,213) |
Net increase (decrease) in net assets resulting from operations | | | 17,724,017 | | | (19,658,201) |
CAPITAL SHARE TRANSACTIONS:
| |
Investor Class:
| |
Proceeds from shares sold | | | 2,516,211 | | | 2,097,930 |
Proceeds from reinvestment of distributions | | | 1,376,151 | | | 1,226,913 |
Payments for shares redeemed | | | (2,524,933) | | | (2,762,638) |
Increase in net assets from Investor Class transactions | | | 1,367,429 | | | 562,205 |
Advisor Class:
| |
Proceeds from shares sold | | | 9,585,232 | | | 12,673,968 |
Proceeds from reinvestment of distributions | | | 4,853,160 | | | 6,875,088 |
Payments for shares redeemed | | | (46,929,692) | | | (53,881,921) |
Decrease in net assets from Advisor Class transactions | | | (32,491,300) | | | (34,332,865) |
Institutional Class:
| |
Proceeds from shares sold | | | — | | | 785,905 |
Proceeds from reinvestment of distributions | | | 215,706 | | | 180,406 |
Payments for shares redeemed | | | (334,894) | | | (28,676,877) |
Decrease in net assets from Institutional Class transactions | | | (119,188) | | | (27,710,566) |
Net Decrease in Net Assets Resulting from Capital Share Transactions | | | (31,243,059) | | | (61,481,226) |
DISTRIBUTIONS TO SHAREHOLDERS:
| |
Net distributions to shareholders - Investor Class | | | (1,381,920) | | | (1,227,874) |
Net distributions to shareholders - Advisor Class | | | (5,259,798) | | | (7,310,232) |
Net distributions to shareholders - Institutional Class | | | (220,654) | | | (201,175) |
Total distributions to shareholders | | | (6,862,372) | | | (8,739,281) |
Total Decrease in Net Assets | | | (20,381,414) | | | (89,878,708) |
NET ASSETS:
| |
Beginning of year | | | 142,670,915 | | | 232,549,623 |
End of year | | | $122,289,501 | | | $142,670,915 |
| | | | | | | |
The accompanying notes are an integral part of these financial statements.
Back to Table of Contents
STATEMENTS OF CHANGES IN NET ASSETS (Continued)
| | | | |
OPERATIONS:
| | | | | | |
Net investment income | | | $1,346,551 | | | $994,071 |
Net realized gain on investments | | | 7,049,362 | | | 15,731,419 |
Net change in unrealized appreciation/depreciation on investments | | | 77,842,916 | | | 1,458,186 |
Net increase in net assets resulting from operations | | | 86,238,829 | | | 18,183,676 |
CAPITAL SHARE TRANSACTIONS:
| | | | | | |
Investor Class:
| | | | | | |
Proceeds from shares sold | | | 281,500 | | | 800,000 |
Proceeds from reinvestment of distributions | | | 644,198 | | | 1,179,222 |
Payments for shares redeemed | | | (475) | | | — |
Increase in net assets from Investor Class transactions | | | 925,223 | | | 1,979,222 |
Advisor Class:
| | | | | | |
Proceeds from shares sold | | | 121,732,388 | | | 76,161,974 |
Proceeds from reinvestment of distributions | | | 10,135,703 | | | 16,463,865 |
Payments for shares redeemed | | | (71,958,319) | | | (79,868,292) |
Increase in net assets from Advisor Class transactions | | | 59,909,772 | | | 12,757,547 |
Net Increase in Net Assets Resulting from Capital Share Transactions | | | 60,834,995 | | | 14,736,769 |
DISTRIBUTIONS TO SHAREHOLDERS:
| | | | | | |
Net distributions to shareholders - Investor Class | | | (644,198) | | | (1,179,223) |
Net distributions to shareholders - Advisor Class | | | (10,665,024) | | | (17,199,714) |
Total distributions to shareholders | | | (11,309,222) | | | (18,378,937) |
Total Increase in Net Assets | | | 135,764,602 | | | 14,541,508 |
NET ASSETS:
| | | | | | |
Beginning of year | | | 294,894,935 | | | 280,353,427 |
End of year | | | $430,659,537 | | | $294,894,935 |
| | | | | | | |
The accompanying notes are an integral part of these financial statements.
Back to Table of Contents
STATEMENTS OF CHANGES IN NET ASSETS (Continued)
| | | | |
OPERATIONS:
| | | | | | |
Net investment income | | | $24,724 | | | $17,583 |
Net realized gain on:
| | | | | | |
Investments | | | 50,835 | | | 800 |
Foreign currency translation | | | 189 | | | 305 |
Net change in unrealized appreciation/depreciation on investments
| | | | | | |
Investments | | | 141,679 | | | 51,903 |
Foreign currency translation | | | 53 | | | (46) |
Net increase in net assets resulting from operations | | | 217,480 | | | 70,545 |
CAPITAL SHARE TRANSACTIONS:
| | | | | | |
Advisor Class:
| | | | | | |
Proceeds from shares sold | | | 88,087 | | | 1,354,518 |
Proceeds from reinvestment of distributions | | | 28,402 | | | 13,313 |
Payments for shares redeemed | | | (5,397) | | | (7,036) |
Net increase in net assets resulting from capital share transactions | | | 111,092 | | | 1,360,795 |
DISTRIBUTIONS TO SHAREHOLDERS:
| | | | | | |
Total distributions to shareholders | | | (28,402) | | | (13,313) |
Total Increase in Net Assets | | | 300,170 | | | 1,418,027 |
NET ASSETS:
| | | | | | |
Beginning of year | | | 1,418,027 | | | — |
End of year | | | $ 1,718,197 | | | $ 1,418,027 |
| | | | | | | |
The accompanying notes are an integral part of these financial statements.
Back to Table of Contents
Reinhart Mid Cap PMV Fund
FINANCIAL HIGHLIGHTS
For a Fund share outstanding throughout each year.
| | | | |
Investor Class
|
PER SHARE DATA:
| |
Net asset value, beginning of year | | | $15.76 | | | $18.35 | | | $18.23 | | | $12.23 | | | $13.76 |
|
INVESTMENT OPERATIONS:
| |
Net investment income | | | 0.09 | | | 0.10(1) | | | 0.12 | | | 0.10 | | | 0.09 |
Net realized and unrealized gain (loss) on investments | | | 2.30 | | | (1.84) | | | 0.14 | | | 6.01 | | | (1.54) |
Total from investment operations | | | 2.39 | | | (1.74) | | | 0.26 | | | 6.11 | | | (1.45) |
|
LESS DISTRIBUTIONS FROM:
| |
Net investment income | | | (0.13) | | | (0.12) | | | (0.14) | | | (0.11) | | | (0.08) |
Net realized gains | | | (0.82) | | | (0.73) | | | — | | | — | | | — |
Total distributions | | | (0.95) | | | (0.85) | | | (0.14) | | | (0.11) | | | (0.08) |
Net asset value, end of year | | | $ 17.20 | | | $ 15.76 | | | $ 18.35 | | | $ 18.23 | | | $12.23 |
Total Return | | | 15.41% | | | (9.77)%(2) | | | 1.43% | | | 50.16% | | | (10.67)% |
|
SUPPLEMENTAL DATA AND RATIOS:
|
Net assets, end of year (in millions) | | | $26.2 | | | $22.7 | | | $25.8 | | | $21.0 | | | $14.4 |
Ratio of expenses to average net assets:
|
Before expense waiver | | | 1.48% | | | 1.41% | | | 1.48% | | | 1.57% | | | 1.58% |
After expense waiver | | | 1.30% | | | 1.30% | | | 1.30% | | | 1.30% | | | 1.30% |
Ratio of net investment income to
average net assets:
|
Before expense waiver | | | 0.32% | | | 0.47% | | | 0.57% | | | 0.38% | | | 0.33% |
After expense waiver | | | 0.50% | | | 0.58% | | | 0.75% | | | 0.65% | | | 0.61% |
Portfolio turnover rate | | | 18% | | | 42% | | | 31% | | | 38% | | | 53% |
| | | | | | | | | | | | | | | | |
(1)
| Per share amounts calculated using the average shares method. |
(2)
| Net increase from payments by invesment adviser on the disposal of investments due to trade error added 0.22% to this return (See Note 4) |
The accompanying notes are an integral part of these financial statements.
Back to Table of Contents
Reinhart Mid Cap PMV Fund
FINANCIAL HIGHLIGHTS (Continued)
For a Fund share outstanding throughout each year.
| | | | |
Advisor Class
|
PER SHARE DATA:
|
Net asset value, beginning of year | | | $15.75 | | | $18.32 | | | $18.22 | | | $12.22 | | | $13.75 |
|
INVESTMENT OPERATIONS:
|
Net investment income | | | 0.15 | | | 0.14(1) | | | 0.19 | | | 0.15 | | | 0.12 |
Net realized and unrealized gain (loss) on investments | | | 2.28 | | | (1.84) | | | 0.12 | | | 6.00 | | | (1.53) |
Total from investment operations | | | 2.43 | | | (1.70) | | | 0.31 | | | 6.15 | | | (1.41) |
|
LESS DISTRIBUTIONS FROM:
|
Net investment income | | | (0.16) | | | (0.14) | | | (0.21) | | | (0.15) | | | (0.12) |
Net realized gains | | | (0.82) | | | (0.73) | | | — | | | — | | | — |
Total distributions | | | (0.98) | | | (0.87) | | | (0.21) | | | (0.15) | | | (0.12) |
Net asset value, end of year | | | $ 17.20 | | | $ 15.75 | | | $ 18.32 | | | $ 18.22 | | | $12.22 |
Total Return | | | 15.71% | | | (9.56)%(2) | | | 1.68% | | | 50.56% | | | (10.41)% |
|
SUPPLEMENTAL DATA AND RATIOS:
|
Net assets, end of year (in millions) | | | $92.0 | | | $116.1 | | | $ 172.6 | | | $ 167.3 | | | $123.8 |
Ratio of expenses to average net assets:
|
Before expense waiver | | | 1.25% | | | 1.20% | | | 1.16% | | | 1.24% | | | 1.25% |
After expense waiver | | | 1.05% | | | 1.05% | | | 1.05% | | | 1.05% | | | 1.05% |
Ratio of net investment income to
average net assets:
|
Before expense waiver | | | 0.55% | | | 0.69% | | | 0.89% | | | 0.71% | | | 0.65% |
After expense waiver | | | 0.75% | | | 0.84% | | | 1.00% | | | 0.90% | | | 0.86% |
Portfolio turnover rate | | | 18% | | | 42% | | | 31% | | | 38% | | | 53% |
| | | | | | | | | | | | | | | | |
(1)
| Per share amounts calculated using the average shares method. |
(2)
| Net increase from payments by invesment adviser on the disposal of investments due to trade error added 0.22% to this return (See Note 4) |
The accompanying notes are an integral part of these financial statements.
Back to Table of Contents
Reinhart Mid Cap PMV Fund
FINANCIAL HIGHLIGHTS (Continued)
For a Fund share outstanding throughout each year.
| | | | |
Institutional Class
|
PER SHARE DATA:
|
Net asset value, beginning of year | | | $15.82 | | | $18.40 | | | $18.27 | | | $12.25 | | | $13.77 |
|
INVESTMENT OPERATIONS:
|
Net investment income | | | 0.18 | | | 0.17(1) | | | 0.21 | | | 0.16 | | | 0.15 |
Net realized and unrealized gain (loss) on investments | | | 2.28 | | | (1.88) | | | 0.13 | | | 6.02 | | | (1.54) |
Total from investment operations | | | 2.46 | | | (1.71) | | | 0.34 | | | 6.18 | | | (1.39) |
|
LESS DISTRIBUTIONS FROM:
|
Net investment income | | | (0.17) | | | (0.14) | | | (0.21) | | | (0.16) | | | (0.13) |
Net realized gains | | | (0.82) | | | (0.73) | | | — | | | — | | | — |
Total distributions | | | (0.99) | | | (0.87) | | | (0.21) | | | (0.16) | | | (0.13) |
Net asset value, end of year | | | $ 17.29 | | | $ 15.82 | | | $ 18.40 | | | $ 18.27 | | | $12.25 |
Total Return | | | 15.84% | | | (9.54)%(2) | | | 1.87% | | | 50.75% | | | (10.28)% |
|
SUPPLEMENTAL DATA AND RATIOS:
|
Net assets, end of year (in millions) | | | $4.1 | | | $3.8 | | | $34.1 | | | $38.4 | | | $30.5 |
Ratio of expenses to average net assets:
|
Before expense waiver | | | 1.21% | | | 1.09% | | | 1.12% | | | 1.18% | | | 1.17% |
After expense waiver | | | 0.90% | | | 0.90% | | | 0.90% | | | 0.90% | | | 0.90% |
Ratio of net investment income to
average net assets:
|
Before expense waiver | | | 0.59% | | | 0.80% | | | 0.93% | | | 0.77% | | | 0.73% |
After expense waiver | | | 0.90% | | | 0.99% | | | 1.15% | | | 1.05% | | | 1.01% |
Portfolio turnover rate | | | 18% | | | 42% | | | 31% | | | 38% | | | 53% |
| | | | | | | | | | | | | | | | |
(1)
| Per share amounts calculated using the average shares method. |
(2)
| Net increase from payments by invesment adviser on the disposal of investments due to trade error added 0.22% to this return (See Note 4) |
The accompanying notes are an integral part of these financial statements.
Back to Table of Contents
Reinhart Genesis PMV Fund
FINANCIAL HIGHLIGHTS (Continued)
For a Fund share outstanding throughout each year.
| | | | |
Investor Class
|
PER SHARE DATA:
|
Net asset value, beginning of year | | | $12.46 | | | $12.55 | | | $13.39 | | | $8.71 | | | $9.94 |
|
INVESTMENT OPERATIONS:
|
Net investment income | | | 0.02 | | | 0.02 | | | 0.03 | | | 0.04 | | | 0.02 |
Net realized and unrealized gain (loss) on investments | | | 3.31 | | | 0.74 | | | (0.30) | | | 4.65 | | | (1.20) |
Total from investment operations | | | 3.33 | | | 0.76 | | | (0.27) | | | 4.69 | | | (1.18) |
|
LESS DISTRIBUTIONS FROM:
|
Net investment income | | | (0.03) | | | (0.02) | | | (0.06) | | | (0.01) | | | (0.01) |
Net realized gains | | | (0.38) | | | (0.83) | | | (0.51) | | | — | | | (0.04) |
Total distributions | | | (0.41) | | | (0.85) | | | (0.57) | | | (0.01) | | | (0.05) |
Net asset value, end of year | | | $ 15.38 | | | $ 12.46 | | | $ 12.55 | | | $ 13.39 | | | $8.71 |
Total Return | | | 27.04% | | | 6.73% | | | (2.09)% | | | 53.82% | | | (12.00)% |
|
SUPPLEMENTAL DATA AND RATIOS:
|
Net assets, end of year (in millions) | | | $24.8 | | | $19.3 | | | $17.3 | | | $17.7 | | | $10.3 |
Ratio of expenses to average net assets:
|
Before expense reimbursement/waiver | | | 1.34% | | | 1.37% | | | 1.37% | | | 1.49% | | | 1.99% |
After expense reimbursement/waiver | | | 1.20% | | | 1.20% | | | 1.20% | | | 1.20% | | | 1.20% |
Ratio of net investment income (loss)
to average net assets:
|
Before expense reimbursement/waiver | | | (0.01)% | | | (0.04)% | | | 0.01% | | | 0.09% | | | (0.60)% |
After expense reimbursement/waiver | | | 0.13% | | | 0.13% | | | 0.18% | | | 0.38% | | | 0.19% |
Portfolio turnover rate | | | 21% | | | 47% | | | 33% | | | 32% | | | 46% |
| | | | | | | | | | | | | | | | |
The accompanying notes are an integral part of these financial statements.
Back to Table of Contents
Reinhart Genesis PMV Fund
FINANCIAL HIGHLIGHTS (Continued)
For a Fund share outstanding throughout each year.
| | | | |
Advisor Class
|
PER SHARE DATA:
|
Net asset value, beginning of year | | | $12.54 | | | $12.61 | | | $13.45 | | | $8.73 | | | $9.96 |
|
INVESTMENT OPERATIONS:
|
Net investment income | | | 0.05 | | | 0.05 | | | 0.05 | | | 0.05 | | | 0.03 |
Net realized and unrealized gain (loss) on investments | | | 3.34 | | | 0.74 | | | (0.29) | | | 4.69 | | | (1.20) |
Total from investment operations | | | 3.39 | | | 0.79 | | | (0.24) | | | 4.74 | | | (1.17) |
|
LESS DISTRIBUTIONS FROM:
|
Net investment income | | | (0.06) | | | (0.03) | | | (0.09) | | | (0.02) | | | (0.02) |
Net realized gains | | | (0.38) | | | (0.83) | | | (0.51) | | | — | | | (0.04) |
Total distributions | | | (0.44) | | | (0.86) | | | (0.60) | | | (0.02) | | | (0.06) |
Net asset value, end of year | | | $ 15.49 | | | $ 12.54 | | | $ 12.61 | | | $ 13.45 | | | $8.73 |
Total Return | | | 27.33% | | | 6.97% | | | (1.86)% | | | 54.33% | | | (11.85)% |
|
SUPPLEMENTAL DATA AND RATIOS:
|
Net assets, end of year (in millions) | | | $ 405.9 | | | $ 275.6 | | | $ 263.1 | | | $ 192.0 | | | $57.7 |
Ratio of expenses to average net assets:
|
Before expense reimbursement/waiver | | | 1.16% | | | 1.19% | | | 1.16% | | | 1.27% | | | 1.66% |
After expense reimbursement/waiver | | | 0.95% | | | 0.95% | | | 0.95% | | | 0.95% | | | 0.95% |
Ratio of net investment income (loss)
to average net assets:
|
Before expense reimbursement/waiver | | | 0.17% | | | 0.15% | | | 0.22% | | | 0.32% | | | (0.27)% |
After expense reimbursement/waiver | | | 0.38% | | | 0.39% | | | 0.43% | | | 0.64% | | | 0.44% |
Portfolio turnover rate | | | 21% | | | 47% | | | 33% | | | 32% | | | 46% |
| | | | | | | | | | | | | | | | |
The accompanying notes are an integral part of these financial statements.
Back to Table of Contents
Reinhart International PMV Fund
FINANCIAL HIGHLIGHTS (Continued)
For a Fund share outstanding throughout each year.
| | | | |
Advisor Class
|
PER SHARE DATA:
|
Net asset value, beginning of year | | | $10.26 | | | $10.00 |
|
INVESTMENT OPERATIONS:
|
Net investment income | | | 0.17 | | | 0.13 |
Net realized and unrealized gain on investments | | | 1.36 | | | 0.24 |
Total from investment operations | | | 1.53 | | | 0.37 |
|
LESS DISTRIBUTIONS FROM:
|
Net investment income | | | (0.11) | | | (0.06) |
Net realized gains | | | (0.09) | | | (0.05) |
Total distributions | | | (0.20) | | | (0.11) |
Net asset value, end of year | | | $11.59 | | | $10.26 |
Total Return | | | 15.00% | | | 3.76% |
|
SUPPLEMENTAL DATA AND RATIOS:
|
Net assets, end of year (in millions) | | | $1.7 | | | $1.4 |
Ratio of expenses to average net assets:
|
Before expense reimbursement/waiver | | | 14.66% | | | 19.29% |
After expense reimbursement/waiver | | | 0.95% | | | 0.95% |
Ratio of net investment loss to average net assets:
|
Before expense reimbursement/waiver | | | (12.14)% | | | (16.74)% |
After expense reimbursement/waiver | | | 1.57% | | | 1.60% |
Portfolio turnover rate | | | 12% | | | 11% |
| | | | | | | |
The accompanying notes are an integral part of these financial statements.
Back to Table of Contents
Reinhart Funds
NOTES TO THE FINANCIAL STATEMENTS
May 31, 2024
1. ORGANIZATION
Managed Portfolio Series (the “Trust”) was organized as a Delaware statutory trust under a Declaration of Trust dated January 27, 2011. The Trust is registered under the Investment Company Act of 1940, as amended (the “1940 Act”), as an open-end management investment company. The Reinhart Mid Cap PMV Fund (the “Mid Cap Fund”), Reinhart Genesis PMV Fund (the “Genesis Fund”) and Reinhart International PMV Fund (the “International Fund”) (each a “Fund” and collectively, the “Funds”) are each a diversified series with their own investment objectives and policies within the Trust. The investment objective of the Funds is long-term capital appreciation. The Funds are investment companies and accordingly follow the investment company accounting and reporting guidance of the Financial Accounting Standards Board (“FASB”) Accounting Standards Board Codification Topic 946 Financial Services – Investment Companies. The Mid Cap Fund commenced operations on June 1, 2012, the Genesis Fund commenced operations on June 1, 2018 and the International Fund commenced operations on June 1, 2022. The Mid Cap Fund currently offers three classes of shares, the Investor Class, Advisor Class and the Institutional Class. The Mid Cap Fund Institutional Class commenced operations on September 29, 2017. The Genesis Fund currently offers two classes of shares, the Investor Class and the Advisor Class. The International Fund currently offers one class of shares, the Advisor Class. Investor Class shares are subject to a 0.25% Rule 12b-1 distribution and servicing fee. The Investor Class and Advisor Class shares are subject to a maximum 0.15% shareholder servicing fee. Each class of shares has identical rights and privileges except with respect to the distribution fees and voting rights on matters affecting a single share class. The Funds may issue an unlimited number of shares of beneficial interest, with no par value.
2. SIGNIFICANT ACCOUNTING POLICIES
The following is a summary of significant accounting policies consistently followed by the Fund in preparation of its financial statements. These policies are in conformity with generally accepted accounting principles in the United States of America (“GAAP”).
Security Valuation – All investments in securities are recorded at their estimated fair value, as described in Note 3.
Federal Income Taxes – The Funds comply with the requirements of subchapter M of the Internal Revenue Code of 1986, as amended, necessary to qualify as a regulated investment company and distributes substantially all net taxable investment income and net realized gains to shareholders in a manner which results in no tax cost to the Funds. Therefore, no federal income tax provision is required. As of and during the year ended May 31, 2024, the Funds did not have any tax positions that did not meet the “more-likely-than-not” threshold of being sustained by the applicable tax authority. The Funds recognize interest and penalties, if any, related to unrecognized tax benefits on uncertain tax positions as income tax expense in the Statements of Operations. As of and during the year ended May 31, 2024, the Funds did not incur any interest or penalties. The Funds are not subject to examination by U.S. tax authorities for tax years prior to the year ended May 31, 2021.
Foreign Taxes – The Funds may be subject to foreign taxes (a portion of which may be reclaimable) on income, stock dividends, realized and unrealized capital gains on investments, or certain foreign currency transactions. Foreign taxes are recorded in accordance with Management’s understanding of the applicable foreign tax regulations and rates that exist in the foreign jurisdictions in which the Funds invest. These foreign taxes, if any, are paid by the Funds and are reflected in the Statements of Operations, if applicable. Foreign taxes payable or deferred as of May 31, 2024, if any, are disclosed in the Funds’ Statements of Assets and Liabilities.
Security Transactions and Investment Income – The Funds follow industry practice and record security transactions on the trade date. Realized gains and losses on sales of securities are calculated on the basis of identified cost. Dividend income is recorded on the ex-dividend date and interest income is recorded on an accrual basis. Withholding taxes on foreign dividends have been provided for in accordance with the Funds’ understanding of the applicable country’s tax rules and regulations. Discounts and premiums on securities purchased are amortized over the expected life of the respective securities using the constant yield method.
The Funds distribute all net investment income, if any, and net realized capital gains, if any, annually. Distributions to shareholders are recorded on the ex-dividend date. The Funds may utilize earnings and profits distributed to shareholders on redemptions of shares as part of the dividends paid deduction. The treatment for financial reporting purposes of distributions made to shareholders during the year from net investment income or net realized capital gains
Back to Table of Contents
Reinhart Funds
NOTES TO THE FINANCIAL STATEMENTS
May 31, 2024 (Continued)
may differ from their ultimate treatment for federal income tax purposes. These differences are caused primarily by differences in the timing of the recognition of certain components of income, expense or realized capital gain for federal income tax purposes. Where such differences are permanent in nature, GAAP requires that they be reclassified in the components of the net assets based on their ultimate characterization for federal income tax purposes. Any such reclassifications will have no effect on net assets, results of operations or net asset values per share of the Funds. For the year ended May 31, 2024, the Mid Cap Fund increased paid-in-capital and decreased distributable earnings by $1,882,600. The Genesis Fund increased paid-in-capital and decreased distributable earnings by $1,151,614. The permanent differences are primarily due to the usage of tax equalization.
Foreign Currency – Investment securities and other assets and liabilities denominated in foreign currencies are translated into U.S. dollar amounts at the date of valuation. Purchases and sales of investment securities and income and expense items denominated in foreign currencies are translated into U.S. dollar amounts on the respective dates of such transactions. The Funds do not isolate that portion of the results of operations resulting from changes in foreign exchange rates on investments from the fluctuations arising from changes in market prices of securities held. Such fluctuations are included with the net realized and unrealized gain or loss from investments and translations of foreign currency. The Funds report net realized foreign exchange gains or losses that arise from sales of foreign currencies, currency gains or losses realized between the trade and settlement dates on securities transactions, and the difference between the amounts of dividends, interest, and foreign withholding taxes recorded on the Funds’ books and the U.S. dollar equivalent of the amounts actually received or paid. Net unrealized foreign exchange gains and losses arise from changes in the fair values of assets and liabilities, other than investments in securities at fiscal period end, resulting from changes in exchange rates.
Use of Estimates – The preparation of financial statements in conformity with GAAP requires management to make estimates and assumptions that affect the reported amounts of assets and liabilities and disclosure of contingent assets and liabilities at the date of the financial statements and the reported amounts of revenues and expenses during the reporting period. Actual results could differ from those estimates.
Allocation of Income, Expenses and Gains/Losses – Income, expenses (other than those deemed attributable to a specific share class), and gains and losses of the Funds are allocated daily to each class of shares based upon the ratio of net assets represented by each class as a percentage of the net assets of each Fund. Expenses deemed directly attributable to a class of shares are recorded by the specific class. Most Fund expenses are allocated by class based on relative net assets. Shareholder servicing fees are expensed at an annual rate up to 0.15% of Investor Class and Advisor Class shares and 12b-1 fees are expensed at 0.25% of average daily net assets of Investor Class shares (See Note 5). Expenses associated with a specific fund in the Trust are charged to that fund. Common Trust expenses are typically allocated evenly between the funds of the Trust, or by other equitable means.
3. SECURITIES VALUATION
The Funds have adopted authoritative fair value accounting standards which establish an authoritative definition of fair value and set out a hierarchy for measuring fair value. These standards require additional disclosures about the various inputs and valuation techniques used to develop the measurements of fair value, a discussion of changes in valuation techniques and related inputs during the period and expanded disclosure of valuation levels for major security types. These inputs are summarized in the three broad levels listed below:
Level 1 –
| Unadjusted quoted prices in active markets for identical assets or liabilities that the Funds have the ability to access. |
Level 2 –
| Observable inputs other than quoted prices included in Level 1 that are observable for the asset or liability, either directly or indirectly. These inputs may include quoted prices for the identical instrument on an inactive market, prices for similar instruments, interest rates, prepayment speeds, credit risk, yield curves, default rates and similar data. |
Level 3 –
| Unobservable inputs for the asset or liability, to the extent relevant observable inputs are not available, representing the Funds’ own assumptions about the assumptions a market participant would use in valuing the asset or liability, and would be based on the best information available. |
Back to Table of Contents
Reinhart Funds
NOTES TO THE FINANCIAL STATEMENTS
May 31, 2024 (Continued)
Following is a description of the valuation techniques applied to each Funds’ major categories of assets and liabilities measured at fair value on a recurring basis. The Funds’ investments are carried at fair value.
Equity Securities – Equity securities, including common stocks, preferred stocks, exchange-traded funds (“ETFs”) and real estate investment trusts (“REITs”) that are primarily traded on a national securities exchange are valued at the last sale price on the exchange on which they are primarily traded on the day of valuation or, if there has been no sale on such day, at the mean between the bid and ask prices. Securities traded primarily in the Nasdaq Global Market System for which market quotations are readily available are valued using the Nasdaq Official Closing Price (“NOCP”). If the NOCP is not available, such securities are valued at the last sale price on the day of valuation, or if there has been no sale on such day, at the mean between the bid and ask prices. To the extent these securities are actively traded and valuation adjustments are not applied, they are categorized in Level 1 of the fair value hierarchy.
In the case of foreign securities, the occurrence of events after the close of foreign markets, but prior to the time the Funds’ NAV is calculated will result in an adjustment to the trading prices of foreign securities when foreign markets open on the following business day. The Funds will value foreign securities at fair value, taking into account such events in calculating the NAV. In such cases, use of fair valuation can reduce an investor’s ability to seek to profit by estimating the Funds’ NAV in advance of the time the NAV is calculated. All foreign securities, with the exception of Canadian and Mexican securities and those listed on a U.S. exchange, have an adjustment applied to their trade price and therefore are automatically deemed to be in Level 2 of the fair value hierarchy.
Rights and Warrants – Rights and warrants are valued at the last reported sale price on the exchange which they are traded. If they are not actively traded on the exchange, a fair value will be applied and they will be categorized in Level 3 of the fair value hierarchy.
Short-Term Investments – Investments in other mutual funds, including money market funds, are valued at their net asset value per share. To the extent these securities are actively traded and valuation adjustments are not applied, they are categorized in Level 1 of the fair value hierarchy.
The Board of Trustees (the “Board”) has adopted a pricing and valuation policy for use by the Funds and their Valuation Designee (as defined below) in calculating the Funds’ NAV. Pursuant to Rule 2a-5 under the 1940 Act, the Funds have designated Reinhart Partners, LLC (the “Adviser”) as their “Valuation Designee” to perform all of the fair value determinations as well as to perform all of the responsibilities that may be performed by the Valuation Designee in accordance with Rule 2a-5. The Valuation Designee is authorized to make all necessary determinations of the fair values of portfolio securities and other assets for which market quotations are not readily available or if it is deemed that the prices obtained from brokers and dealers or independent pricing services are unreliable.
The inputs or methodology used for valuing securities are not an indication of the risk associated with investing in those securities. The following is a summary of the inputs used to value the Funds’ securities as of May 31, 2024:
Mid Cap Fund
| | | | | | | | | | | | | |
Common Stocks | | | $117,908,693 | | | $ — | | | $ — | | | $117,908,693 |
Short-Term Investments | | | 4,560,081 | | | — | | | — | | | 4,560,081 |
Total Investments in Securities | | | $122,468,774 | | | $— | | | $— | | | $122,468,774 |
| | | | | | | | | | | | | |
Genesis Fund
| | | | | | | | | | | | | |
Common Stocks | | | $414,849,228 | | | $ — | | | $ — | | | $414,849,228 |
Short-Term Investments | | | 15,890,600 | | | — | | | — | | | 15,890,600 |
Total Investments in Securities | | | $430,739,828 | | | $— | | | $— | | | $430,739,828 |
| | | | | | | | | | | | | |
Back to Table of Contents
Reinhart Funds
NOTES TO THE FINANCIAL STATEMENTS
May 31, 2024 (Continued)
International Fund
| | | | | | | | | | | | | |
Common Stocks | | | $ 630,352 | | | $ 1,055,645 | | | $ — | | | $ 1,685,997 |
Warrants | | | — | | | — | | | — | | | — |
Short-Term Investements | | | 44,696 | | | — | | | — | | | 44,696 |
Total Investments in Securities | | | $675,048 | | | $1,055,645 | | | $— | | | $1,730,693 |
| | | | | | | | | | | | | |
*
| Additional Level 3 disclosures were deemed to be immaterial. |
Refer to the Schedule of Investments for further information on the classification of investments.
4. INVESTMENT ADVISORY FEE AND OTHER TRANSACTIONS WITH AFFILIATES
The Trust has an agreement with Reinhart Partners, LLC (the “Adviser”) to furnish investment advisory services to the Funds. For its services, the Funds pay the Adviser a monthly management fee based upon the average daily net assets of the Funds at the following rates:
| | | | |
Mid Cap Fund | | | 0.90% |
Genesis Fund | | | 0.95% |
International Fund | | | 0.95% |
| | | | |
The Funds’ Adviser has contractually agreed to waive its management fees and pay Fund expenses in order to ensure that Total Annual Fund Operating Expenses (excluding AFFE, leverage/borrowing interest, interest expense, taxes, brokerage commissions, and extraordinary expenses) do not exceed the following rates (based upon the average daily net assets of the Funds):
| | | | | | | | | | |
Mid Cap Fund | | | 1.30% | | | 1.05% | | | 0.90% |
Genesis Fund | | | 1.20% | | | 0.95% | | | N/A |
International Fund | | | N/A | | | 0.95% | | | N/A |
| | | | | | | | | | |
Fees waived and expenses paid by the Adviser may be recouped by the Adviser for a period of thirty-six months following the month during which such fee waiver and expense payment was made, if such recoupment can be achieved without exceeding the expense limit in effect at the time the fee waiver and expense payment occurred and the expense limit in effect at the time of recoupment. The Operating Expenses Limitation Agreements are indefinite in term and cannot be terminated through at least September 28, 2028, for the Mid Cap Fund, and September 28, 2025, for the Genesis Fund and the International Fund. Thereafter, the agreements may be terminated at any time upon 60 days’ written notice by the Trust’s Board or the Adviser, with the consent of the Board. Waived fees and reimbursed expenses subject to potential recovery by month of expiration are as follows:
| | | | | | | |
Mid Cap Fund | | | June 2024 - May 2025 | | | $300,293 |
| | | June 2025 - May 2026 | | | $260,979 |
| | | June 2026 - May 2027 | | | $265,036 |
Genesis Fund | | | June 2024 - May 2025 | | | $550,093 |
| | | June 2025 - May 2026 | | | $648,042 |
| | | June 2026 - May 2027 | | | $742,406 |
International Fund | | | June 2025 - May 2026 | | | $153,512 |
| | | June 2026 - May 2027 | | | $167,563 |
| | | | | | | |
U.S. Bancorp Fund Services, LLC (the “Administrator”), doing business as U.S. Bank Global Fund Services, acts as the Funds’ Administrator, Transfer Agent, and Fund Accountant. U.S. Bank, N.A. (the “Custodian”) serves as the
Back to Table of Contents
Reinhart Funds
NOTES TO THE FINANCIAL STATEMENTS
May 31, 2024 (Continued)
custodian to the Funds. The Custodian is an affiliate of the Administrator. The Administrator performs various administrative and accounting services for the Funds. The Administrator prepares various federal and state regulatory filings, reports and returns for the Funds; prepares reports and materials to be supplied to the Trustees; monitors the activities of the Funds’ custodian; coordinates the payment of the Funds’ expenses and reviews the Funds’ expense accruals. The officers of the Trust, including the Chief Compliance Officer, are employees of the Administrator. As compensation for its services, the Administrator is entitled to a monthly fee at an annual rate based upon the average daily net assets of the Funds, subject to annual minimums. Fees paid by the Funds for administration and accounting, transfer agency, custody and chief compliance officer services for the year ended May 31, 2024, are disclosed in the Statements of Operations. For the International Fund, the Administrator waived $45,750 in fund administration and transfer agent fees; and the Custodian waived $2,400 in custody fees.
5. DISTRIBUTION & SHAREHOLDER SERVICE FEES
The Funds have adopted a Distribution Plan pursuant to Rule 12b-1 (the “Plan”) in the Investor Class only. The Plan permits the Funds to pay for distribution and related expenses at an annual rate of 0.25% of the average daily net assets of the Investor Class. The expenses covered by the Plan may include the cost of preparing and distributing prospectuses and other sales material, advertising and public relations expenses, payments to financial intermediaries and compensation of personnel involved in selling shares of the Funds. Payments made pursuant to the Plan will represent compensation for distribution and service activities, not reimbursements for specific expenses incurred. For the year ended May 31, 2024, the Funds incurred the following expenses pursuant to the Plan:
| | | | |
Mid Cap Fund | | | $61,647 |
Genesis Fund | | | $54,971 |
International Fund | | | N/A |
| | | | |
The Funds have entered into a shareholder servicing agreement (the “Agreement”) where the Adviser acts as the shareholder agent, under which the Funds may pay a servicing fee at an annual rate up to 0.15% of the average daily net assets of the Investor Class and Advisor Class. Payments, if any, to the Adviser under the Agreement may reimburse the Adviser for payments it makes to selected brokers, dealers and administrators which have entered into service agreements with the Adviser for services provided to shareholders of the Funds. Payments may also be made directly to the intermediaries providing shareholder services. The services provided by such intermediaries are primarily designed to assist shareholders of the Funds and include the furnishing of office space and equipment, telephone facilities, personnel and assistance to the Funds in servicing such shareholders. Services provided by such intermediaries also include the provision of support services to the Funds and includes establishing and maintaining shareholders’ accounts and record processing, purchase and redemption transactions, answering routine client inquiries regarding the Funds, and providing such other personal services to shareholders as the Funds may reasonably request. For the year ended May 31, 2024, the Funds incurred the following expenses pursuant to the Plan:
| | | | | | | |
Mid Cap Fund | | | $4,557 | | | $45,558 |
Genesis Fund | | | — | | | 203,293 |
International Fund | | | N/A | | | 2,013 |
| | | | | | | |
Back to Table of Contents
Reinhart Funds
NOTES TO THE FINANCIAL STATEMENTS
May 31, 2024 (Continued)
6. CAPITAL SHARE TRANSACTIONS
Transactions in shares of the Funds were as follows:
| | | | | | | |
Investor Class:
| | | | | | | | | | | | |
Shares sold | | | 149,548 | | | 124,160 | | | 19,146 | | | 64,379 |
Shares issued in reinvestment of distributions | | | 83,606 | | | 73,556 | | | 45,270 | | | 104,913 |
Shares redeemed | | | (151,384) | | | (159,707) | | | (33) | | | — |
Net increase in Investor Class shares | | | 81,770 | | | 38,009 | | | 64,383 | | | 169,292 |
Advisor Class:
| | | | | | | | | | | | |
Shares sold | | | 576,803 | | | 740,670 | | | 8,629,541 | | | 6,224,051 |
Shares issued in reinvestment of distributions | | | 295,204 | | | 412,918 | | | 707,800 | | | 1,456,979 |
Shares redeemed | | | (2,891,962) | | | (3,207,863) | | | (5,113,715) | | | (6,568,243) |
Net increase (decrease) in Advisor Class shares | | | (2,019,955) | | | (2,054,275) | | | 4,223,626 | | | 1,112,787 |
Institutional Class:
| | | | | | | | | | | | |
Shares sold | | | — | | | 45,266 | | | — | | | — |
Shares issued in reinvestment of distributions | | | 13,057 | | | 10,796 | | | — | | | — |
Shares redeemed | | | (19,607) | | | (1,669,330) | | | — | | | — |
Net decrease in Institutional Class shares | | | (6,550) | | | (1,613,268) | | | — | | | — |
Net increase (decrease) in shares outstanding | | | (1,944,735) | | | (3,629,534) | | | 4,288,009 | | | 1,282,079 |
| | | | | | | | | | | | | |
| | | | |
Advisor Class:
|
Shares sold | | | 7,957 | | | 137,635 |
Shares issued in reinvestment of distributions | | | 2,574 | | | 1,373 |
Shares redeemed | | | (508) | | | (794) |
Net increase in Advisor Class shares | | | 10,023 | | | 138,214 |
Net increase in shares outstanding | | | 10,023 | | | 138,214 |
| | | | | | | |
7. INVESTMENT TRANSACTIONS
The aggregate purchases and sales, excluding short-term investments, by the Funds for the year ended May 31, 2024, were as follows:
| | | | | | | |
Mid Cap Fund | | | $ — | | | $ — | | | $22,921,023 | | | $ 61,260,353 |
Genesis Fund | | | $— | | | $— | | | $ 119,127,324 | | | $ 74,222,176 |
International Fund | | | $— | | | $— | | | $326,813 | | | $194,354 |
| | | | | | | | | | | | | |
Back to Table of Contents
Reinhart Funds
NOTES TO THE FINANCIAL STATEMENTS
May 31, 2024 (Continued)
8. FEDERAL TAX INFORMATION
The aggregate gross unrealized appreciation and depreciation of securities held by the Funds and the total cost of securities for federal income tax purposes at May 31, 2024, the Funds’ most recent fiscal year, were as follows:
| | | | | | | | | | | | | |
Mid Cap Fund | | | $31,748,270 | | | $(10,294,557) | | | $21,453,713 | | | $101,015,062 |
Genesis Fund | | | 108,412,927 | | | (16,778,696) | | | 91,634,231 | | | 339,105,597 |
International Fund | | | 316,770 | | | (134,858) | | | 181,912 | | | 1,548,788 |
| | | | | | | | | | | | | |
The difference between book-basis and tax-basis unrealized appreciation is attributable primarily to the differences in tax treatment of wash sales and passive foreign investment companies.
At May 31, 2024, the Funds’ most recent fiscal year end, components of accumulated loss on a tax-basis were as follows:
| | | | | | | | | | | | | |
Mid Cap Fund | | | $199,870 | | | $2,444,944 | | | $21,453,713 | | | $ 24,098,527 |
Genesis Fund | | | 3,412,410 | | | 3,941,417 | | | 91,634,231 | | | 98,988,058 |
International Fund | | | 37,195 | | | 27,559 | | | 181,912 | | | 246,666 |
| | | | | | | | | | | | | |
As of May 31, 2024, the Funds’ most recent fiscal year end, the Funds did not have any capital loss carryovers. A regulated investment company may elect for any taxable year to treat any portion of any qualified late year loss as arising on the first day of the next taxable year. Qualified late year losses are certain capital, and ordinary losses which occur during the portion of the Funds’ taxable year subsequent to October 31 and December 31, respectively. The Funds do not plan to defer any qualified late-year losses.
The tax character of distributions paid during the year ended May 31, 2024, were as follows:
| | | | | | | | | | |
Mid Cap Fund | | | $1,098,885 | | | $5,763,488 | | | $6,862,373 |
Genesis Fund | | | 6,842,670 | | | 4,466,552 | | | 11,309,222 |
International Fund | | | 16,133 | | | 12,269 | | | 28,402 |
| | | | | | | | | | |
The tax character of distributions paid during the year ended May 31, 2023, were as follows:
| | | | | | | | | | |
Mid Cap Fund | | | $1,353,077 | | | $7,386,204 | | | $8,739,281 |
Genesis Fund | | | 2,203,333 | | | 16,175,604 | | | 18,378,937 |
International Fund | | | 13,313 | | | — | | | 13,313 |
| | | | | | | | | | |
*
| For Federal income tax purposes, distributions of short-term capital gains are treated as ordinary income. |
9. SECTOR RISK
As of May 31, 2024, the Reinhart Genesis PMV Fund and Reinhart Mid Cap PMV Fund had a significant portion of its assets invested in the financials sector. Changes in governmental regulation, interest rates, domestic and international economics, loan losses, price competition and industry consolidation may affect companies in this sector.
Back to Table of Contents
Reinhart Funds
NOTES TO THE FINANCIAL STATEMENTS
May 31, 2024 (Continued)
10. CONTROL OWNERSHIP
The beneficial ownership, either directly or indirectly, of more than 25% of the voting securities of a fund creates a presumption of control of the fund, under Section 2(a)(9) of the 1940 Act. As of May 31, 2024, each Fund’s percentage of control ownership positions greater than 25% are as follows:
| | | | | | | | | | |
Genesis Fund | | | Morgan Stanley Smith Barney, LLC | | | 43.86% | | | Record |
International Fund | | | National Financial Services, LLC | | | 44.44% | | | Record |
| | | James Reinhart | | | 34.73% | | | Beneficial |
| | | | | | | | | | |
11. SUBSEQUENT EVENTS
Management has performed an evaluation of subsequent events through the date the financial statements were issued and has determined that no additional items require recognition or disclosure.
Back to Table of Contents
Reinhart Funds
REPORT OF INDEPENDENT REGISTERED PUBLIC ACCOUNTING FIRM
To the Shareholders of Reinhart Funds
and Board of Trustees of Managed Portfolio Series
Opinion on the Financial Statements
We have audited the accompanying statements of assets and liabilities, including the schedules of investments, of Reinhart Funds comprising the funds listed below (“Reinhart Funds” or the “Funds”), each a series of Managed Portfolio Series, as of May 31, 2024, the related statements of operations, and changes in net assets, and the financial highlights for each of the periods indicated below, and the related notes (collectively referred to as the “financial statements”). In our opinion, the financial statements present fairly, in all material respects, the financial position of each of the Funds as of May 31, 2024, the results of their operations, the changes in net assets, and the financial highlights for each of the periods indicated below in conformity with accounting principles generally accepted in the United States of America.
| | | | | | | | | | |
Reinhart Mid Cap PMV Fund
Reinhart Genesis PMV Fund | | | For the year ended
May 31, 2024 | | | For the years ended May 31, 2024 and 2023 | | | For the years ended May 31, 2024, 2023, 2022, 2021, and 2020 |
Reinhart International PMV Fund | | | For the year ended
May 31, 2024 | | | For the years ended May 31, 2024 and 2023 |
| | | | | | | |
Basis for Opinion
These financial statements are the responsibility of the Funds’ management. Our responsibility is to express an opinion on the Funds’ financial statements based on our audits. We are a public accounting firm registered with the Public Company Accounting Oversight Board (United States) (“PCAOB”) and are required to be independent with respect to the Funds in accordance with the U.S. federal securities laws and the applicable rules and regulations of the Securities and Exchange Commission and the PCAOB.
We conducted our audits in accordance with the standards of the PCAOB. Those standards require that we plan and perform the audit to obtain reasonable assurance about whether the financial statements are free of material misstatement whether due to error or fraud.
Our audits included performing procedures to assess the risks of material misstatement of the financial statements, whether due to error or fraud, and performing procedures that respond to those risks. Such procedures included examining, on a test basis, evidence regarding the amounts and disclosures in the financial statements. Our procedures included confirmation of securities owned as of May 31, 2024, by correspondence with the custodian. Our audits also included evaluating the accounting principles used and significant estimates made by management, as well as evaluating the overall presentation of the financial statements. We believe that our audits provide a reasonable basis for our opinion.
We have served as the Funds’ auditor since 2012.
COHEN & COMPANY, LTD.
Milwaukee, Wisconsin
July 29, 2024
Back to Table of Contents
REINHART FUNDS
APPROVAL OF INVESTMENT ADVISORY AGREEMENT – Reinhart Partners, LLC (Unaudited)
At a meeting of the Board of Trustees of Managed Portfolio Series (“Trust”) on February 21-22, 2024, the Trust’s Board of Trustees (“Board”), including all of the Trustees who are not “interested persons” of the Trust, as that term is defined in Section 2(a)(19) of the Investment Company Act of 1940, as amended (“Independent Trustees”), considered and approved the continuation of the Investment Advisory Agreement between the Trust, on behalf of each of the Reinhart Mid Cap PMV Fund, Reinhart Genesis PMV Fund and Reinhart International PMV Fund (each a “Fund”, collectively the “Funds”) and Reinhart Partners, LLC (“Reinhart” or the “Adviser”) (the “Investment Advisory Agreement”).
Prior to the meeting and at the meeting held on January 4, 2024, the Trustees received and considered information from Reinhart and the Trust’s administrator designed to provide the Trustees with the information necessary to evaluate the continuance of the Investment Advisory Agreement (“Support Materials”). Before voting to approve the continuance of the Investment Advisory Agreement, the Trustees reviewed the Support Materials with Trust management and with counsel to the Independent Trustees, and received a memorandum and advice from such counsel discussing the legal standards for their consideration of the renewal of the Investment Advisory Agreement. This information, together with the information provided to the Board throughout the course of the year, formed the primary (but not exclusive) basis for the Board’s determinations.
In determining whether to approve the Investment Advisory Agreement, the Trustees considered all factors they believed relevant including the following with respect to each Fund: (1) the nature, extent, and quality of the services to be provided by Reinhart with respect to the Fund; (2) the Fund’s historical performance and the performance of other investment accounts managed by Reinhart, as applicable; (3) the costs of the services provided by Reinhart and the profits expected to be realized by Reinhart from services rendered to the Trust with respect to each Fund; (4) comparative fee and expense data for each Fund and other investment companies with similar investment objectives; (5) the extent to which economies of scale may be realized as each Fund grows, and whether the advisory fee for each Fund reflects such economies of scale for the Fund’s benefit; and (6) other financial benefits to Reinhart resulting from services rendered to the Fund. The Trustees also weighed to varying degrees the importance of the information provided to them, did not identify any particular information that was all-important or controlling, and considered the information and made its determinations for each Fund separately and independently of the other Fund.
Based upon the information provided to the Board throughout the course of the year, including a presentation to the Board by representatives of Reinhart, and the Support Materials, the Board concluded that the overall arrangements between the Trust and Reinhart set forth in the Investment Advisory Agreement, as it relates to each Fund, are fair and reasonable in light of the services Reinhart performs, the investment advisory fees that each Fund pays, and such other matters as the Trustees considered relevant in the exercise of their reasonable business judgment. The material factors and conclusions that formed the basis of the Trustees’ determination to approve the Investment Advisory Agreement, as it relates to each Fund, are summarized below.
Nature, Extent and Quality of Services Provided. The Trustees considered the scope of services that Reinhart would provide under the Investment Advisory Agreement, noting that such services include but are not limited to the following for each Fund: (1) investing the Fund’s assets consistent with the Fund’s investment objective and investment policies; (2) determining the portfolio securities to be purchased, sold, or otherwise disposed of and the timing of such transactions; (3) voting all proxies, if any, with respect to the Fund’s portfolio securities; (4) maintaining the required books and records for transactions that Reinhart effects on behalf of the Fund; (5) selecting broker-dealers to execute orders on behalf of the Fund; and (6) monitoring and maintaining the Fund’s compliance with policies and procedures of the Trust and with applicable securities laws. The Trustees considered the qualifications, experience and responsibilities of the portfolio managers to each Fund as well as Reinhart’s resources and compliance structure, including information regarding its compliance program, its chief compliance officer and Reinhart’s compliance record. The Trustees concluded that Reinhart has the quality and depth of personnel, resources, investment methods and compliance policies and procedures essential to performing its duties under the Investment Advisory Agreement and that the nature, overall quality and extent of such management services would be satisfactory.
Fund Historical Performance and the Overall Performance of Reinhart. In assessing the quality of the portfolio management delivered by Reinhart, the Trustees reviewed the performance of the Reinhart Mid Cap PMV Fund and Reinhart Genesis PMV Fund on both an absolute basis and in comparison to an appropriate benchmark index, each Fund’s Morningstar category (“Category”) as well as a smaller sub-set of peer funds (“Cohort”), and the composite of separate accounts that Reinhart manages utilizing a similar investment strategy as that of each Fund, as
Back to Table of Contents
REINHART FUNDS
APPROVAL OF INVESTMENT ADVISORY AGREEMENT – Reinhart Partners, LLC (Unaudited) (Continued)
applicable. When comparing each Fund’s performance against its respective Category and Cohort, the Trustees took into account that the investment objective and strategies of each Fund, as well as the Fund’s level of risk tolerance, may differ significantly from funds in the Category and Cohort.
| • | Reinhart Mid Cap PMV Fund. The Trustees noted that the Fund had underperformed both the Category and Cohort averages for all periods presented as of September 30, 2023. The Trustees also considered that the Fund had outperformed its benchmark index for three-year period ended September 30, 2023, but had underperformed for all other periods presented. The Trustees noted that the Fund’s Investor Class and Advisor Class did not perform as well against the benchmark index as compared to the Institutional Class, but that these classes have a 12b-1 fee and/or a shareholder servicing fee, which is not necessarily the case for the funds included in the Category and Cohort. The Trustees also considered that the Fund’s performance was consistent with the returns of the Adviser’s composite for accounts with a similar strategy over all relevant time periods. |
| • | Reinhart Genesis PMV Fund. The Trustees noted that the Fund had outperformed both the Category and Cohort averages as well as its benchmark index and additional index for all periods presented as of September 30, 2023. The Trustees also considered that the Fund’s performance was consistent with the returns of the Adviser’s composite for accounts with a similar strategy over all relevant time periods. |
| • | Reinhart International PMV Fund. The Trustees noted that the Fund had outperformed the Cohort average for the year-to-date period ended September 30, 2023, but had underperformed the Category average for this same period as well as the Category and Cohort averages for the one-year period ended September 30, 2023. The Trustees noted that the Fund had outperformed its benchmark index over all periods presented. The Trustees also considered that Reinhart does not manage other accounts or composites with the same or substantially similar strategies as the Fund. |
Cost of Advisory Services and Profitability. The Trustees considered the annual advisory fee that each Fund pays to Reinhart under the Investment Advisory Agreement, as well as Reinhart’s profitability from services that it rendered to each Fund during the 12-month period ended September 30, 2023. The Trustees also noted favorably the expense limitation agreement under which Reinhart contractually agreed to reduce its advisory fees and, if necessary, reimburse each Fund for operating expenses, as specified in the Funds’ prospectus, and observed that Reinhart had waived a portion of its management fee with respect to each Fund over its most recent fiscal year. The Trustees further considered that the management fees Reinhart charges to separately managed accounts with strategies and asset levels similar to those of the Reinhart Mid Cap PMV Fund and Reinhart Genesis PMV Fund are lower than the advisory fee for each Fund, respectively. They also noted, however, that Reinhart has additional responsibilities with respect to the Funds, including the preparation of Board and shareholder materials, which justify the higher fee. The Trustees considered the reasonableness of Reinhart’s profits from its service relationship with each Fund, noting that the Reinhart International PMV Fund had not been profitable over the 12-month period ended September 30, 2023.
Comparative Fee and Expense Data. The Trustees considered a comparative analysis of contractual expenses borne by each Fund and those of funds within the same Category and Cohort as of September 30, 2023.
| • | Reinhart Mid Cap PMV Fund. The Trustees noted that while the Fund’s advisory fee was higher than the Category and Cohort averages and the Fund’s total expenses (after waivers and expense reimbursements) were higher than the Cohort average, the total expenses of the Fund’s Institutional Class (after waivers and expense reimbursements) were below the Category average. Regarding the Fund’s Advisor Class and Investor Class, the Trustees noted that the total expenses (after waivers and expense reimbursements) for each were above the Category and Cohort averages, but that these classes include shareholder servicing and/or Rule 12b-1 fees, which is not necessarily the case for the funds included in the Category and Cohort. |
| • | Reinhart Genesis PMV Fund. The Trustees noted that while the Fund’s advisory fee was higher than the Category and Cohort averages and the Fund’s total expenses (after waivers and expense reimbursements) were higher than the Cohort average, the total expenses of the Fund’s Advisor Class (after waivers and expense reimbursements) were below the Category average. Regarding the Fund’s Investor Class, the Trustees noted that the total expenses (after waivers and expense reimbursements) were above the Category and Cohort averages, but that this class includes shareholder servicing and Rule 12b-1 fees, which is not necessarily the case for the funds included in the Category and Cohort. |
Back to Table of Contents
REINHART FUNDS
APPROVAL OF INVESTMENT ADVISORY AGREEMENT – Reinhart Partners, LLC (Unaudited) (Continued)
| • | Reinhart International PMV Fund. The Trustees note that the Fund’s advisory fee and total expenses (after waivers and expense reimbursements) were higher than the Category and Cohort averages. The Trustees further considered that the Fund includes a shareholder servicing which is not necessarily the case for the funds included in the Category and Cohort. |
While recognizing that it is difficult to compare advisory fees because the scope of advisory services provided may vary from one investment adviser to another, the Trustees concluded that Reinhart’s advisory fee with respect to each Fund continues to be reasonable.
Economies of Scale. The Trustees considered whether the Funds would benefit from any economies of scale, noting that the investment advisory fees for the Funds do not contain breakpoints. The Trustees noted that at current asset levels, it was not necessary to consider the implementation of fee breakpoints but agreed to revisit the issue in the future as circumstances change and asset levels increase.
Other Benefits. The Trustees considered the direct and indirect benefits that could be realized by the Adviser from its relationship with the Funds. The Trustees considered the extent to which Reinhart utilizes soft dollar arrangements with respect to portfolio transactions and considered that Reinhart does not utilize any affiliated brokers to execute the Funds’ portfolio transactions. While the Trustees noted Rule 12b-1 fees may be paid for shareholder and distribution services performed on behalf of the Funds, the Trustees also observed that the Adviser was incurring its own distribution expenses on behalf of the Funds. The Trustees considered that Reinhart may receive some form of reputational benefit from services rendered to the Funds, but that such benefits are immaterial and cannot otherwise be quantified. The Trustees concluded that Reinhart does not receive additional material benefits from its relationship with the Funds.
Back to Table of Contents
Reinhart Funds
ADDITIONAL INFORMATION
May 31, 2024 (Unaudited)
AVAILABILITY OF FUND PORTFOLIO INFORMATION
Each Fund files complete schedules of portfolio holdings with the SEC for the first and third quarters of each fiscal year on Part F of Form N-PORT. The Funds’ Part F of Form N-PORT are each available on the SEC’s website at www.sec.gov and may be reviewed and copied at the SEC’s Public Reference Room in Washington, D.C. For information on the Public Reference Room call 1-800-SEC-0330. In addition, each Fund’s Part F of Form N-PORT is available without charge upon request by calling 1-855-774-3863.
AVAILABILITY OF PROXY VOTING INFORMATION
A description of the Funds’ Proxy Voting Policies and Procedures is available without charge, upon request, by calling 1-855-774-3863. Information regarding how the Funds voted proxies relating to portfolio securities during the most recent 12-month period ended June 30, is available (1) without charge, upon request, by calling 1-855-774-3863, or (2) on the SEC’s website at www.sec.gov.
QUALIFIED DIVIDEND INCOME/DIVIDENDS RECEIVED DEDUCTION
For the fiscal year ended May 31, 2024, certain dividends paid by the Funds may be reported as qualified dividend income and may be eligible for taxation at capital gain rates. The percentage of dividends declared from ordinary income designated as qualified dividend income was as follows:
| | | | |
Mid Cap Fund | | | 100.00% |
Genesis Fund | | | 45.92% |
International Fund | | | 78.68% |
| | | | |
For corporate shareholders, the percent of ordinary income distributions qualifying for the corporate dividends received deduction for the fiscal year ended May 31, 2024, was as follows:
| | | | |
Mid Cap Fund | | | 100.00% |
Genesis Fund | | | 45.00% |
International Fund | | | 0.00% |
| | | | |
The percentage of taxable ordinary income distributions that are designated as short-term capital gain distributions under Internal Revenue Section 871(k)(2)(c) were as follows:
| | | | |
Mid Cap Fund | | | 0.00% |
Genesis Fund | | | 77.75% |
International Fund | | | 0.00% |
| | | | |
FOREIGN TAX CREDIT PASS THROUGH
Pursuant to Section 853 of the Internal Revenue code, the Funds designate the following amounts as foreign taxes paid for the period ended May 31, 2024. Foreign taxes paid for purposes of Section 853 may be less than actual foreign taxes paid for financial statement purposes.
| | | | | | | |
International Fund | | | $41,634 | | | $5,202 |
| | | | | | | |
Foreign taxes paid or withheld should be included in taxable income with an offsetting deduction from gross income or as a credit for taxes paid to foreign governments. Above figures may differ from those cited elsewhere in this report due to difference in the calculation of income and gains under GAAP purposes and Internal Revenue Service purposes. Shareholders are strongly advised to consult their own tax advisers with respect to the tax consequences of their investments in the Funds.
Back to Table of Contents
INVESTMENT ADVISER
Reinhart Partners, LLC
11090 North Weston Drive
Mequon, WI 53092
DISTRIBUTOR
Quasar Distributors, LLC
3 Canal Plaza, Suite 100
Portland, ME 04101
CUSTODIAN
U.S. Bank, N.A.
1555 North River Center Drive, Suite 302
Milwaukee, WI 53212
ADMINISTRATOR, FUND ACCOUNTANT AND TRANSFER AGENT
U.S. Bancorp Fund Services, LLC
615 E. Michigan Street
Milwaukee, WI 53202
INDEPENDENT REGISTERED PUBLIC ACCOUNTING FIRM
Cohen & Company, Ltd.
342 North Water Street, Suite 830
Milwaukee, WI 53202
LEGAL COUNSEL
Stradley Ronon Stevens & Young, LLP
2005 Market Street, Suite 2600
Philadelphia, PA 19103
This report must be accompanied or preceded by a prospectus.
The Funds’ Statement of Additional Information contains additional information about the Funds’ trustees and is available without charge upon request by calling 1-855-774-3863.
RH-RPANNUAL
| (b) | Financial Highlights are included within the financial statements filed under Item 7 of this Form.” |
Item 8. Changes in and Disagreements with Accountants for Open-End Investment Companies.
There were no changes in or disagreements with accountants during the period covered by this report.
Item 9. Proxy Disclosure for Open-End Investment Companies.
There were no matters submitted to a vote of shareholders during the period covered by this report.
Item 10. Remuneration Paid to Directors, Officers, and Others of Open-End Investment Companies.
See Item 7(a).
Item 11. Statement Regarding Basis for Approval of Investment Advisory Contract.
See Item 7(a).
Item 12. Disclosure of Proxy Voting Policies and Procedures for Closed-End Management Investment Companies.
Not applicable to open-end investment companies.
Item 13. Portfolio Managers of Closed-End Management Investment Companies.
Not applicable to open-end investment companies.
Item 14. Purchases of Equity Securities by Closed-End Management Investment Company and Affiliated Purchasers.
Not applicable to open-end investment companies.
Item 15. Submission of Matters to a Vote of Security Holders.
There have been no material changes to the procedures by which shareholders may recommend nominees to the registrant’s board of trustees.
Item 16. Controls and Procedures.
| (a) | The Registrant’s [Principal Executive Officer] and [Principal Financial Officer] have reviewed the Registrant’s disclosure controls and procedures (as defined in Rule 30a-3(c) under the Investment Company Act of 1940 (the “Act”)) as of a date within 90 days of the filing of this |
report, as required by Rule 30a-3(b) under the Act and Rules 13a-15(b) or 15d-15(b) under the Securities Exchange Act of 1934. Based on their review, such officers have concluded that the disclosure controls and procedures are effective in ensuring that information required to be disclosed in this report is appropriately recorded, processed, summarized and reported and made known to them by others within the Registrant and by the Registrant’s service provider.
| (b) | There were no changes in the Registrant’s internal control over financial reporting (as defined in Rule 30a-3(d) under the Act) that occurred during the period covered by this report that have materially affected, or are reasonably likely to materially affect, the Registrant’s internal control over financial reporting. |
Item 17. Disclosure of Securities Lending Activities for Closed-End Management Investment Companies
Not applicable to open-end investment companies.
Item 18. Recovery of Erroneously Awarded Compensation.
Not applicable
Item 19. Exhibits.
(2) A separate certification for each principal executive officer and principal financial officer pursuant to Section 302 of the Sarbanes-Oxley Act of 2002. Filed herewith.
Pursuant to the requirements of the Securities Exchange Act of 1934 and the Investment Company Act of 1940, the registrant has duly caused this report to be signed on its behalf by the undersigned, thereunto duly authorized.
| | (Registrant) | Managed Portfolio Series | |
| | By (Signature and Title)* | /s/ Brian R. Wiedmeyer | |
| | | Brian R. Wiedmeyer, President | |
Pursuant to the requirements of the Securities Exchange Act of 1934 and the Investment Company Act of 1940, this report has been signed below by the following persons on behalf of the registrant and in the capacities and on the dates indicated.
| | By (Signature and Title)* | /s/ Brian R. Wiedmeyer | |
| | | Brian R. Wiedmeyer, President | |
| | By (Signature and Title)* | /s/ Benjamin J. Eirich | |
| | | Benjamin J. Eirich, Treasurer | |
* Print the name and title of each signing officer under his or her signature.