UNITED STATES
SECURITIES AND EXCHANGE COMMISSION
Washington, D.C. 20549
FORM N-CSR
CERTIFIED SHAREHOLDER REPORT OF REGISTERED
MANAGEMENT INVESTMENT COMPANIES
Investment Company Act file number 811-22525
Managed Portfolio Series
(Exact name of registrant as specified in charter)
615 East Michigan Street
Milwaukee, WI 53202
(Address of principal executive offices) (Zip code)
Brian Wiedmeyer, President
Managed Portfolio Series
c/o U.S. Bank Global Fund Services
777 East Wisconsin Ave., 6th Floor
Milwaukee, WI 53202
(Name and address of agent for service)
(414) 516-1712
Registrant’s telephone number, including area code
Date of fiscal year end: 06/30/2024
Date of reporting period: 06/30/2024
Item 1. Reports to Stockholders.
| | |
| LK Balanced Fund | |
| Institutional Class | LKBLX |
| Annual Shareholder Report | June 30, 2024 |
This annual shareholder report contains important information about the LK Balanced Fund for the period of July 1, 2023, to June 30, 2024. You can find additional information about the Fund at https://lkfunds.com/#literature. You can also request this information by contacting us at 1-855-698-1378.
This report describes changes to the Fund that occurred during the reporting period.
WHAT WERE THE FUND COSTS FOR THE PAST YEAR? (based on a hypothetical $10,000 investment)
| | |
Class Name | Costs of a $10,000 investment | Costs paid as a percentage of a $10,000 investment |
| Institutional Class | $105 | 1.00% |
HOW DID THE FUND PERFORM LAST YEAR AND WHAT AFFECTED ITS PERFORMANCE?
The past 12 months began with an approximate four-month decline in equity markets followed by eight months of strong market performance. A crucial driver was the monetary policy set by the Federal Reserve as market sentiment was shaped by the central bank’s efforts to manage inflation. This stabilization and the hope for an impending reduction in the target federal funds rate seemed to have switched the market into risk-on mode causing equity prices and valuations to expand rapidly. Another factor driving equity markets was corporate earnings growth, particularly in the technology sector. Companies like Microsoft, Apple, and Nvidia reported strong earnings, driven by advancements in artificial intelligence and cloud computing. This sector’s robust performance helped lift the overall market, contributing significantly to the gains seen in major indices like the S&P 500. Outside the very top holdings in the S&P 500 performance was more muted. The further down the market capitalization scale you went, the lesser the performance for the period. As always, geopolitical developments and macroeconomic factors impacted markets Overall the continued easing of supply chain disruptions provided a more favorable environment for businesses. Furthermore, consumer spending remained strong, bolstered by a tight labor market and rising wages. These factors collectively created a supportive backdrop for equity markets, allowing them to navigate through periods of global uncertainty and achieve overall positive performance.
| |
Top Contributors |
| ↑ | Texas Pacific Land (TPL) |
| ↑ | Phillips 66 (PSX) |
| ↑ | Microsoft (MSFT) |
| |
Top Detractors |
| ↓ | Hershey Company (HSY) |
| ↓ | LKQ Corp (LKQ) |
| ↓ | Pfizer Inc (PFE) |
| LK Balanced Fund | PAGE 1 | TSR_AR_56166Y503 |
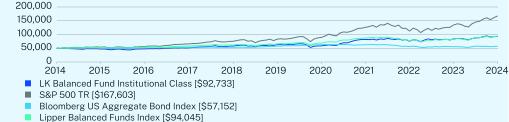
HOW DID THE FUND PERFORM OVER THE PAST 10 YEARS?*
The $50,000 chart reflects a hypothetical $50,000 investment in the class of shares noted and assumes the maximum sales charge. The chart uses total return NAV performance and assumes reinvestment of dividends and capital gains. Fund expenses, including management fees and other expenses were deducted.
CUMULATIVE PERFORMANCE (Initial Investment of $50,000)
ANNUAL AVERAGE TOTAL RETURN (%)
| | | |
| | 1 Year | 5 Year | 10 Year |
Institutional Class (without sales charge) | 10.55 | 7.94 | 6.37 |
S&P 500 TR | 24.56 | 15.05 | 12.86 |
Bloomberg US Aggregate Bond Index | 2.63 | -0.23 | 1.35 |
Lipper Balanced Funds Index | 12.57 | 7.26 | 6.52 |
Visit https://lkfunds.com/#literature for more recent performance information.
| * | The Fund’s past performance is not a good predictor of how the Fund will perform in the future. The graph and table do not reflect the deduction of taxes that a shareholder would pay on Fund distributions or redemption of Fund shares. |
KEY FUND STATISTICS (as of June 30, 2024)
| |
Net Assets | $29,776,354 |
Number of Holdings | 56 |
Net Advisory Fee | $80,342 |
Portfolio Turnover | 16% |
Visit https://lkfunds.com/#literature for more recent performance information.
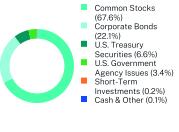
WHAT DID THE FUND INVEST IN? (as of June 30, 2024)
Security Type Breakdown (%)
| |
Top 10 Issuers | (%) |
United States Treasury Note/Bond | 6.6% |
Berkshire Hathaway | 5.4% |
Texas Pacific Land | 4.8% |
Microsoft | 4.3% |
Arthur J. Gallagher | 3.5% |
Phillips 66 | 3.0% |
Thermo Fisher Scientific | 3.0% |
Aflac | 2.7% |
Alphabet | 2.5% |
HCA Healthcare, Inc. | 2.4% |
| LK Balanced Fund | PAGE 2 | TSR_AR_56166Y503 |
For additional information about the Fund; including its prospectus, financial information, holdings and proxy information, scan the QR code or visit https://lkfunds.com/#literature
The LK Balanced Fund is distributed by Quasar Distributors, LLC.
HOUSEHOLDING
To reduce Fund expenses, only one copy of most shareholder documents may be mailed to shareholders with multiple accounts at the same address (Householding). If you would prefer that your Lawson Kroeker documents not be householded, please contact Lawson Kroeker at 1-855-698-1378, or contact your financial intermediary. Your instructions will typically be effective within 30 days of receipt by Lawson Kroeker or your financial intermediary.
| LK Balanced Fund | PAGE 3 | TSR_AR_56166Y503 |
5000047225476555155158018632755877081884757468388392733500005371155856658527531883164894051258771125141345601676035000050929539855381653602578206287362664562145568757152500005155752327579766204266253688388704076829835479404567.622.16.63.40.20.1
Item 2. Code of Ethics.
The registrant has adopted a code of ethics that applies to the registrant’s principal executive officer and principal financial officer. The registrant has not made any substantive amendments to its code of ethics during the period covered by this report. The registrant has not granted any waivers from any provisions of the code of ethics during the period covered by this report.
A copy of the registrant’s Code of Ethics is filed herewith.
Item 3. Audit Committee Financial Expert.
The registrant’s board of trustees has determined that there is at least one audit committee financial expert serving on its audit committee. Leonard M. Rush is the “audit committee financial expert” and is considered to be “independent” as each term is defined in Item 3 of Form N-CSR.
Item 4. Principal Accountant Fees and Services.
The registrant has engaged its principal accountant to perform audit services, audit-related services, tax services and other services during the past two fiscal years. “Audit services” refer to performing an audit of the registrant’s annual financial statements or services that are normally provided by the accountant in connection with statutory and regulatory filings or engagements for those fiscal years. “Audit-related services” refer to the assurance and related services by the principal accountant that are reasonably related to the performance of the audit. “Tax services” refer to professional services rendered by the principal accountant for tax compliance, tax advice, and tax planning. There were no “Other Services” provided by the principal accountant. The following table details the aggregate fees billed or expected to be billed for each of the last two fiscal years for audit fees, audit-related fees, tax fees and other fees by the principal accountant.
| | FYE 06/30/2024 | FYE 06/30/2023 |
| (a) Audit Fees | $17,250 | $16,750 |
| (b) Audit-Related Fees | $0 | $0 |
| (c) Tax Fees | $3,500 | $3,500 |
| (d) All Other Fees | $0 | $0 |
(e)(1) The audit committee has adopted pre-approval policies and procedures that require the audit committee to pre-approve all audit and non-audit services of the registrant, including services provided to any entity affiliated with the registrant.
(e)(2) The percentage of fees billed by Cohen & Company applicable to non-audit services pursuant to waiver of pre-approval requirement were as follows:
| | FYE 06/30/2024 | FYE 06/30/2023 |
| Audit-Related Fees | 0% | 0% |
| Tax Fees | 0% | 0% |
| All Other Fees | 0% | 0% |
(f) Not applicable
(g) The following table indicates the non-audit fees billed or expected to be billed by the registrant’s accountant for services to the registrant and to the registrant’s investment adviser (and any other controlling entity, etc.—not sub-adviser) for the last two years.
| Non-Audit Related Fees | FYE 06/30/2024 | FYE 06/30/2023 |
| Registrant | $0 | $0 |
| Registrant’s Investment Adviser | $0 | $0 |
(h) The audit committee of the board of trustees/directors has considered whether the provision of non-audit services that were rendered to the registrant’s investment adviser is compatible with maintaining the principal accountant’s independence and has concluded that the provision of such non-audit services by the accountant has not compromised the accountant’s independence.
(i) Not applicable
(j) Not applicable
Item 5. Audit Committee of Listed Registrants.
Not applicable
Item 6. Investments.
| (a) | Schedule of Investments is included within the financial statements filed under Item 7 of this Form. |
Item 7. Financial Statements and Financial Highlights for Open-End Investment Companies.
LK Balanced Fund
Core Financial Statements
June 30, 2024
TABLE OF CONTENTS
LK Balanced Fund
Schedule of Investments
as of June 30, 2024
| | | | | | | |
COMMON STOCKS - 67.6%
|
Communication Services - 4.5%
| | | | | | |
Alphabet - Class C | | | 4,000 | | | $ 733,680 |
Walt Disney | | | 6,000 | | | 595,740 |
| | | | | | 1,329,420 |
Consumer Discretionary - 5.8%
| | | | | | |
Asbury Automotive Group, Inc.(a) | | | 3,000 | | | 683,610 |
LKQ | | | 12,200 | | | 507,398 |
MarineMax(a) | | | 16,910 | | | 547,377 |
| | | | | | 1,738,385 |
Consumer Staples - 2.6%
| | | | | | |
Crimson Wine Group(a) | | | 29,000 | | | 173,130 |
Hershey | | | 3,300 | | | 606,639 |
| | | | | | 779,769 |
Energy - 11.0%
| | | | | | |
Chevron | | | 4,000 | | | 625,680 |
Civitas Resources | | | 5,000 | | | 345,000 |
Phillips 66 | | | 6,300 | | | 889,371 |
Texas Pacific Land | | | 1,950 | | | 1,431,826 |
| | | | | | 3,291,877 |
Financials - 18.9%
| | | | | | |
Aflac | | | 9,000 | | | 803,790 |
Arthur J. Gallagher | | | 4,000 | | | 1,037,240 |
Berkshire Hathaway - Class A(a) | | | 2 | | | 1,224,482 |
Berkshire Hathaway - Class B(a) | | | 1,000 | | | 406,800 |
Brookfield Asset Management | | | 5,250 | | | 199,762 |
Brookfield Corp. | | | 7,000 | | | 290,780 |
Cullen/Frost Bankers | | | 5,500 | | | 558,965 |
Fifth Third Bancorp | | | 18,000 | | | 656,820 |
Nelnet, Inc. - Class A | | | 4,500 | | | 453,870 |
| | | | | | 5,632,509 |
Health Care - 14.1%
| | | | | | |
Charles River Laboratories International(a) | | | 2,600 | | | 537,108 |
Elevance Health | | | 1,000 | | | 541,860 |
Enovis Corp.(a) | | | 10,000 | | | 452,000 |
HCA Healthcare, Inc. | | | 2,200 | | | 706,816 |
Johnson & Johnson | | | 4,500 | | | 657,720 |
Pfizer | | | 15,000 | | | 419,700 |
Thermo Fisher Scientific | | | 1,600 | | | 884,800 |
| | | | | | 4,200,004 |
Industrials - 4.6%
| | | | | | |
Canadian Pacific Kansas City | | | 8,000 | | | 629,840 |
Lincoln Electric Holdings | | | 3,100 | | | 584,784 |
MSC Industrial Direct Co. - Class A | | | 1,820 | | | 144,344 |
| | | | | | 1,358,968 |
| | | | | | | |
The accompanying notes are an integral part of these financial statements.
TABLE OF CONTENTS
LK Balanced Fund
Schedule of Investments
as of June 30, 2024 (Continued)
| | | | | | | |
COMMON STOCKS - (Continued)
|
Information Technology - 5.1%
| | | | | | |
Keysight Technologies(a) | | | 1,700 | | | $ 232,475 |
Microsoft | | | 2,850 | | | 1,273,808 |
| | | | | | 1,506,283 |
Materials - 1.0%
| | | | | | |
Vulcan Materials | | | 1,200 | | | 298,416 |
TOTAL COMMON STOCKS
(Cost $9,293,973) | | | | | | 20,135,631 |
| | | Par | | | |
CORPORATE BONDS - 22.1%
| |
Communication Services - 1.0%
| | | | | | |
TWDC Enterprises 18, 3.00%, 02/13/2026 | | | $ 325,000 | | | 313,457 |
Consumer Discretionary - 5.6%
| | | | | | |
Genuine Parts Co., 6.50%, 11/01/2028 | | | 500,000 | | | 524,664 |
Lowe's Companies, 3.38%, 09/15/2025 | | | 500,000 | | | 488,055 |
Newell Brands, 3.90%, 11/01/2025 | | | 250,000 | | | 240,012 |
Tractor Supply, 1.75%, 11/01/2030 | | | 500,000 | | | 407,111 |
| | | | | | 1,659,842 |
Consumer Staples - 1.7%
| | | | | | |
JM Smucker, 3.50%, 03/15/2025 | | | 500,000 | | | 492,495 |
Financials - 4.8%
| | | | | | |
Charles Schwab, 5.38% to 06/01/2025 then 5 yr. CMT Rate + 4.97%, Perpetual | | | 500,000 | | | 495,564 |
Old Republic International, 3.88%, 08/26/2026 | | | 500,000 | | | 483,511 |
Prudential Financial, 5.13% to 02/28/2032 then 5 yr. CMT Rate + 3.16%, 03/01/2052 | | | 500,000 | | | 465,294 |
| | | | | | 1,444,369 |
Health Care - 3.2%
| | | | | | |
Cardinal Health, 3.50%, 11/15/2024 | | | 500,000 | | | 495,733 |
Laboratory Corporation of America Holdings, 1.55%, 06/01/2026 | | | 500,000 | | | 464,704 |
| | | | | | 960,437 |
Industrials - 2.4%
| | | | | | |
Boeing, 2.20%, 02/04/2026 | | | 500,000 | | | 470,191 |
Hexcel, 4.95%, 08/15/2025 | | | 250,000 | | | 247,395 |
| | | | | | 717,586 |
Information Technology - 1.7%
| | | | | | |
Keysight Technologies, 4.55%, 10/30/2024 | | | 250,000 | | | 249,332 |
KLA, 4.65%, 11/01/2024 | | | 250,000 | | | 249,259 |
| | | | | | 498,591 |
Utilities - 1.7%
| | | | | | |
Black Hills, 1.04%, 08/23/2024 | | | 500,000 | | | 496,418 |
TOTAL CORPORATE BONDS
(Cost $6,780,087) | | | | | | 6,583,195 |
| | | | | | | |
The accompanying notes are an integral part of these financial statements.
TABLE OF CONTENTS
LK Balanced Fund
Schedule of Investments
as of June 30, 2024 (Continued)
| | | | | | | |
U.S. TREASURY OBLIGATIONS - 6.6%
| | | | | | |
United States Treasury Note/Bond
| | | | | | |
2.38%, 08/15/2024 | | | $ 500,000 | | | $498,109 |
2.25%, 11/15/2024 | | | 500,000 | | | 494,228 |
2.00%, 02/15/2025 | | | 500,000 | | | 489,785 |
2.75%, 05/15/2025 | | | 500,000 | | | 489,734 |
TOTAL U.S. TREASURY OBLIGATIONS
(Cost $1,973,582) | | | | | | 1,971,856 |
U.S. GOVERNMENT AGENCY ISSUES - 3.4%
| | | | | | |
Federal Home Loan Bank, 5.00%, 01/26/2034 | | | 500,000 | | | 496,424 |
Federal Home Loan Mortgage Corp, 5.63%, 05/15/2034 (b) | | | 500,000 | | | 500,460 |
TOTAL U.S. GOVERNMENT AGENCY ISSUES
(Cost $1,000,000) | | | | | | 996,884 |
| | | Shares | | | |
SHORT-TERM INVESTMENT - 0.2%
| | | | | | |
Money Market Fund - 0.2%
| | | | | | |
First American Government Obligations - Class Z, 5.19%(c) | | | 47,408 | | | 47,408 |
TOTAL SHORT-TERM INVESTMENT
(Cost $47,408) | | | | | | 47,408 |
TOTAL INVESTMENTS - 99.9%
(Cost $19,095,050) | | | | | | $29,734,974 |
Other Assets in Excess of Liabilities - 0.1% | | | | | | 41,380 |
TOTAL NET ASSETS - 100.0% | | | | | | $29,776,354 |
| | | | | | | |
Percentages are stated as a percent of net assets.
The Global Industry Classification Standard (“GICS®”) was developed by and/or is the exclusive property of MSCI, Inc. (“MSCI”) and Standard & Poor’s Financial Services LLC (“S&P”). GICS® is a service mark of MSCI and S&P and has been licensed for use by U.S. Bank Global Fund Services.
CMT - Constant Maturity Treasury Rate
(a)
| Non-income producing security. |
(b)
| Step coupon bond. The rate disclosed is as of June 30, 2024. |
(c)
| The rate shown represents the 7-day effective yield as of June 30, 2024. |
The accompanying notes are an integral part of these financial statements.
TABLE OF CONTENTS
LK Balanced Fund
STATEMENT OF ASSETS AND LIABILITIES
June 30, 2024
| |
ASSETS:
|
Investments, at value (Cost: $19,095,050) | | | $29,734,974 |
Dividends & interest receivable | | | 97,436 |
Prepaid expenses | | | 3,759 |
Total assets | | | 29,836,169 |
LIABILITIES:
| | | |
Payable for fund administration & accounting fees | | | 13,224 |
Payable for audit fees | | | 21,886 |
Payable to investment adviser | | | 7,739 |
Payable for trustee fees | | | 5,341 |
Payable for transfer agent fees & expenses | | | 5,042 |
Payable for compliance fees | | | 2,582 |
Accrued expenses | | | 4,001 |
Total liabilities | | | 59,815 |
NET ASSETS | | | $29,776,354 |
NET ASSETS CONSIST OF:
| | | |
Paid-in capital | | | $17,336,794 |
Total distributable earnings | | | 12,439,560 |
Net assets | | | $29,776,354 |
Shares issued and outstanding(1) | | | 547,210 |
Net asset value, redemption price and offering price per share | | | $54.41 |
| | | | |
(1)
| Unlimited shares authorized, without par value. |
See Notes to the Financial Statements
TABLE OF CONTENTS
LK Balanced Fund
STATEMENT OF OPERATIONS
For the Year Ended June 30, 2024
| | | | |
INVESTMENT INCOME:
| | | |
Dividend income | | | $ 324,970 |
Less: Foreign taxes withheld | | | (4,209) |
Interest income | | | 399,606 |
Total investment income | | | 720,367 |
EXPENSES:
| | | |
Investment adviser fees (See Note 4) | | | 214,085 |
Fund administration & accounting fees (See Note 4) | | | 81,716 |
Transfer agent fees & expenses (See Note 4) | | | 25,375 |
Trustee fees | | | 22,498 |
Audit fees | | | 21,883 |
Compliance fees (See Note 4) | | | 15,084 |
Legal fees | | | 11,593 |
Federal & state registration fees | | | 7,461 |
Postage & printing fees | | | 7,119 |
Other expenses | | | 6,942 |
Custody fees (See Note 4) | | | 5,433 |
Total expenses before waiver | | | 419,189 |
Less: waiver from investment adviser (See Note 4) | | | (133,743) |
Net expenses | | | 285,446 |
NET INVESTMENT INCOME | | | 434,921 |
REALIZED AND UNREALIZED GAIN ON INVESTMENTS:
| | | |
Net realized gain on investments | | | 1,820,986 |
Net change in unrealized appreciation/depreciation on investments | | | 629,431 |
Net realized and unrealized gain on investments | | | 2,450,417 |
NET INCREASE IN NET ASSETS RESULTING FROM OPERATIONS | | | $2,885,338 |
| | | | |
See Notes to the Financial Statements
TABLE OF CONTENTS
LK Balanced Fund
STATEMENTS OF CHANGES IN NET ASSETS
| | | | |
OPERATIONS:
| | | | | | |
Net investment income | | | $434,921 | | | $341,922 |
Net realized gain on investments | | | 1,820,986 | | | 980,306 |
Net change in unrealized appreciation/depreciation on investments | | | 629,431 | | | 1,548,330 |
Net increase in net assets resulting from operations | | | 2,885,338 | | | 2,870,558 |
CAPITAL SHARE TRANSACTIONS:
| | | | | | |
Proceeds from shares sold | | | 601,929 | | | 461,903 |
Proceeds from reinvestment of distributions | | | 1,764,553 | | | 1,084,052 |
Payments for shares redeemed | | | (1,076,680) | | | (3,664,268) |
Net increase (decrease) in net assets resulting from capital share transactions | | | 1,289,802 | | | (2,118,313) |
DISTRIBUTIONS TO SHAREHOLDERS: | | | (1,778,497) | | | (1,084,052) |
Total increase (decrease) in net assets | | | 2,396,643 | | | (331,807) |
NET ASSETS:
| | | | | | |
Beginning of year | | | 27,379,711 | | | 27,711,518 |
End of year | | | $29,776,354 | | | $27,379,711 |
| | | | | | | |
See Notes to the Financial Statements
TABLE OF CONTENTS
LK BALANCED FUND
FINANCIAL HIGHLIGHTS
For a Fund share outstanding throughout the years.
| | | | |
PER SHARE DATA:
| | | | | | | | | | | | | | | |
Net asset value, beginning of year | | | $52.54 | | | $49.26 | | | $59.34 | | | $45.19 | | | $50.19 |
INVESTMENT OPERATIONS:
| | | | | | | | | | | | | | | |
Net investment income | | | 0.83 | | | 0.66 | | | 0.49 | | | 0.56 | | | 0.61 |
Net realized and unrealized gain (loss) on investments | | | 4.48 | | | 4.59 | | | (4.29) | | | 16.63 | | | (4.01) |
Total from investment operations | | | 5.31 | | | 5.25 | | | (3.80) | | | 17.19 | | | (3.40) |
LESS DISTRIBUTIONS FROM:
| | | | | | | | | | | | | | | |
Net investment income | | | (1.05) | | | (0.26) | | | (0.56) | | | (0.52) | | | (0.64) |
Net realized gains | | | (2.39) | | | (1.71) | | | (5.72) | | | (2.52) | | | (0.96) |
Total distributions | | | (3.44) | | | (1.97) | | | (6.28) | | | (3.04) | | | (1.60) |
Net asset value, end of year | | | $54.41 | | | $52.54 | | | $49.26 | | | $59.34 | | | $45.19 |
TOTAL RETURN | | | 10.55% | | | 10.72% | | | (7.50)% | | | 39.33% | | | (7.12)% |
SUPPLEMENTAL DATA AND RATIOS:
| | | | | | | | | | | | | | | |
Net assets, end of year (in millions) | | | $29.8 | | | $27.4 | | | $27.7 | | | $30.3 | | | $23.7 |
Ratio of expenses to average net assets:
| | | | | | | | | | | | | | | |
Before expense waiver | | | 1.46% | | | 1.47% | | | 1.38% | | | 1.49% | | | 1.45% |
After expense waiver | | | 1.00% | | | 1.00% | | | 1.00% | | | 1.00% | | | 1.00% |
Ratio of net investment income to average net assets:
| | | | | | | | | | | | | | | |
After expense waiver | | | 1.52% | | | 1.22% | | | 0.86% | | | 1.02% | | | 1.18% |
Portfolio turnover rate | | | 16% | | | 18% | | | 14% | | | 21% | | | 4% |
| | | | | | | | | | | | | | | | |
See Notes to the Financial Statements
TABLE OF CONTENTS
LK Balanced Fund
Notes to the Financial Statements
June 30, 2024
1. ORGANIZATION
Managed Portfolio Series (the “Trust”) was organized as a Delaware statutory trust on January 27, 2011. The Trust is registered under the Investment Company Act of 1940, as amended (the “1940 Act”), as an open-end management investment company. The LK Balanced Fund (the “Fund”) is a diversified series with its own investment objectives and policies within the Trust. The investment objective of the Fund is long-term capital appreciation and current income. The Fund is an investment company and accordingly follows the investment company accounting and reporting guidance of the Financial Accounting Standards Board (“FASB”) Accounting Standards Codification Topic 946, Financial Services – Investment Companies. Prior to July 1, 2012, the Fund’s investment adviser managed a limited partnership with an investment objective and investment policies that were, in all material respects, equivalent to those of the Fund. The limited partnership, which incepted on December 31, 1986, converted into, and the Fund commenced operations in the Trust on, July 1, 2012. The Fund currently offers one class, the Institutional Class. The Fund may issue an unlimited number of shares of beneficial interest, with no par value.
2. SIGNIFICANT ACCOUNTING POLICIES
The following is a summary of significant accounting policies consistently followed by the Fund in preparation of its financial statements. These policies are in conformity with generally accepted accounting principles in the United States of America (“GAAP”).
Security Valuation – All investments in securities are recorded at their estimated fair value, as described in Note 3.
Federal Income Taxes – The Fund complies with the requirements of subchapter M of the Internal Revenue Code of 1986, as amended, necessary to qualify as a regulated investment company and distributes substantially all net taxable investment income and net realized gains to shareholders in a manner which results in no tax cost to the Fund. Therefore, no federal income tax provision is required. As of and during the year ended June 30, 2024, the Fund did not have any tax positions that did not meet the “more-likely-than-not” threshold of being sustained by the applicable tax authority. The Fund recognizes interest and penalties, if any, related to unrecognized tax benefits on uncertain tax positions as income tax expense in the Statement of Operations. As of and during the year ended June 30, 2024, the Fund did not have liabilities for any unrecognized tax benefits. The Fund is not subject to examination by U.S. tax authorities for tax years prior to the year ended June 30, 2021.
Security Transactions, Income, and Distributions – The Fund follows industry practice and records security transactions on the trade date. Realized gains and losses on sales of securities are calculated on the basis of identified cost. Dividend income is recorded on the ex-dividend date and interest income is recorded on an accrual basis. Withholding taxes on foreign dividends have been provided for in accordance with the Fund’s understanding of the applicable country’s tax rules and regulations. Discounts and premiums on securities purchased are amortized over the expected life of the respective securities using the constant yield method.
The Fund distributes substantially all net investment income, if any, and net realized capital gains, if any, annually. Distributions to shareholders are recorded on the ex-dividend date. The treatment for financial reporting purposes of distributions made to shareholders during the year from net investment income or net realized capital gains may differ from their treatment for federal income tax purposes. These differences are caused primarily by differences in the timing of the recognition of certain components of income, expense or realized capital gain for federal income tax purposes. Where such differences are permanent in nature, GAAP requires that they be reclassified in the components of the net assets based on their ultimate characterization for federal income tax purposes. Any such reclassifications will have no effect on net assets, results of operations or net asset value per share of the Fund. As of June 30, 2024, no reclassifications were made.
Allocation of Expenses – Expenses associated with a specific fund in the Trust are charged to that fund. Common Trust expenses are typically allocated evenly between funds of the Trust, or by other equitable means.
Use of Estimates – The preparation of financial statements in conformity with GAAP requires management to make estimates and assumptions that affect the reported amounts of assets and liabilities and disclosure of contingent assets and liabilities at the date of the financial statements and the reported amounts of revenues and expenses during the reporting period. Actual results could differ from those estimates.
TABLE OF CONTENTS
LK Balanced Fund
Notes to the Financial Statements
June 30, 2024 (Continued)
3. SECURITIES VALUATION
The Fund has adopted authoritative fair value accounting standards which establish an authoritative definition of fair value and set out a hierarchy for measuring fair value. These standards require additional disclosures about the various inputs and valuation techniques used to develop the measurements of fair value, a discussion of changes in valuation techniques and related inputs during the period and expanded disclosure of valuation Levels for major security types. These inputs are summarized in the three broad Levels listed below:
Level 1 –
| Unadjusted quoted prices in active markets for identical assets or liabilities that the Fund has the ability to access. |
Level 2 –
| Observable inputs other than quoted prices included in Level 1 that are observable for the asset or liability, either directly or indirectly. These inputs may include quoted prices for the identical instrument on an inactive market, prices for similar instruments, interest rates, prepayment speeds, credit risk, yield curves, default rates and similar data. |
Level 3 –
| Unobservable inputs for the asset or liability, to the extent relevant observable inputs are not available, representing the Fund’s own assumptions about the assumptions a market participant would use in valuing the asset or liability, and would be based on the best information available. |
Following is a description of the valuation techniques applied to the Fund’s major categories of assets and liabilities measured at fair value on a recurring basis. The Fund’s investments are carried at fair value.
Short-Term Investments – Investments in other mutual funds, including money market funds, are valued at their net asset value per share. To the extent these securities are actively traded and valuation adjustments are not applied, they are categorized in Level 1 of the fair value hierarchy.
Equity Securities – Equity securities, including common stocks, preferred stocks, exchange traded funds (“ETF”s) and real estate investment trusts (“REIT”s), that are primarily traded on a national securities exchange are valued at the last sale price on the exchange on which they are primarily traded on the day of valuation or, if there has been no sale on such day, at the mean between the bid and ask prices. Securities traded primarily in the Nasdaq Global Market System for which market quotations are readily available are valued using the Nasdaq Official Closing Price (“NOCP”). If the NOCP is not available, such securities are valued at the last sale price on the day of valuation, or if there has been no sale on such day, at the mean between the bid and ask prices. To the extent these securities are actively traded and valuation adjustments are not applied, they are categorized in Level 1 of the fair value hierarchy.
Fixed Income Securities – Fixed income securities, including asset-backed, corporate, mortgage-backed, municipal bonds, and U.S. government & agency securities, are valued at fair value on the basis of valuations furnished by an independent pricing service which utilizes both dealer-supplied valuations and formula-based techniques. The pricing service may consider recently executed transactions in securities of the issuer or comparable issuers, market price quotations (where observable), bond spreads, and fundamental data relating to the issuer. Fixed income securities are categorized in Level 2 of the fair value hierarchy.
The Board of Trustees (the “Board”) has adopted a pricing and valuation policy for use by the Fund and its Valuation Designee (as defined below) in calculating the Fund’s NAV. Pursuant to Rule 2a-5 under the 1940 Act, the Fund has designated Lawson Kroeker Investment Management, Inc. (the “Adviser”) as its “Valuation Designee” to perform all of the fair value determinations as well as to perform all of the responsibilities that may be performed by the Valuation Designee in accordance with Rule 2a-5. The Valuation Designee is authorized to make all necessary determinations of the fair values of portfolio securities and other assets for which market quotations are not readily available or if it is deemed the prices obtained from brokers and dealers or independent pricing services are unreliable.
TABLE OF CONTENTS
LK Balanced Fund
Notes to the Financial Statements
June 30, 2024 (Continued)
The inputs or methodology used for valuing securities are not an indication of the risk associated with investing in those securities. The following is a summary of the inputs used to value the Fund’s securities as of June 30, 2024:
| | | | | | | | | | | | | |
Common Stocks | | | $ 20,135,631 | | | $ — | | | $ — | | | $ 20,135,631 |
Corporate Bonds | | | — | | | 6,583,195 | | | — | | | 6,583,195 |
United States Government Bonds | | | — | | | 2,968,740 | | | — | | | 2,968,740 |
Short-Term Investment | | | 47,408 | | | — | | | — | | | 47,408 |
Total Investments in Securities | | | $20,183,039 | | | $9,551,935 | | | $— | | | $29,734,974 |
| | | | | | | | | | | | | |
Refer to the Schedule of Investments for further information on the classification of investments.
4. INVESTMENT ADVISORY FEE AND OTHER TRANSACTIONS WITH AFFILIATES
The Trust has an agreement with Lawson Kroeker Investment Management, Inc. (the “Adviser”) to furnish investment advisory services to the Fund. Pursuant to an Investment Advisory Agreement between the Trust and the Adviser, the Adviser is entitled to receive an annual advisory fee equal to 0.75% of the Fund's average daily net assets on a monthly basis.
The Fund’s Adviser has contractually agreed to waive its management fees and pay Fund expenses, in order to ensure that Total Annual Operating Expenses (excluding acquired fund fees and expenses, leverage/borrowing interest, interest expense, taxes, brokerage commissions and extraordinary expenses) do not exceed 1.00% of the Fund’s average daily net assets. Fees waived and expenses paid by the Adviser may be recouped by the Adviser for a period of thirty-six months following the date on which such fee waiver and expense payment was made if such recoupment can be achieved without exceeding the expense limit in effect at the time the fee waiver and expense payment occurred and the expense limit in effect at the time of recoupment. The Operating Expenses Limitation Agreement is indefinite in term and cannot be terminated within a year after the effective date of the Fund’s Prospectus. Thereafter, the agreement may be terminated at any time upon 60 days’ written notice by the Trust’s Board or the Adviser, with the consent of the Board. Waived fees and reimbursed expenses subject to potential recovery by month of expiration are as follows:
| | | | |
July 2024 – June 2025 | | | $115,812 |
July 2025 – June 2026 | | | $131,231 |
July 2026 – June 2027 | | | $133,743 |
| | | | |
U.S. Bancorp Fund Services, LLC (the “Administrator”), doing business as U.S. Bank Global Fund Services, acts as the Fund’s Administrator, Transfer Agent, and Fund Accountant. U.S. Bank N.A. (the “Custodian”) serves as the Custodian to the Fund. The Custodian is an affiliate of the Administrator. The Administrator performs various administrative and accounting services for the Fund. The Administrator prepares various federal and state regulatory filings, reports and returns for the Fund; prepares reports and materials to be supplied to the Trustees; monitors the activities of the Fund’s Custodian; coordinates the payment of the Fund’s expenses and reviews the Fund’s expense accruals. The officers of the Trust, including the Chief Compliance Officer, are employees of the Administrator. As compensation for its services, the Administrator is entitled to a monthly fee at an annual rate based upon the average daily net assets of the Fund, subject to annual minimums. Fees incurred by the Fund for administration and accounting, transfer agency, custody and chief compliance officer services for the year ended June 30, 2024, are disclosed in the Statement of Operations.
TABLE OF CONTENTS
LK Balanced Fund
Notes to the Financial Statements
June 30, 2024 (Continued)
5. CAPITAL SHARE TRANSACTIONS
Transactions in shares of the Fund were as follows:
| | | | |
Shares sold | | | 11,534 | | | 8,917 |
Shares issued to holders in reinvestment of dividends | | | 34,776 | | | 20,896 |
Shares redeemed | | | (20,177) | | | (71,296) |
Net increase (decrease) in shares outstanding | | | 26,133 | | | (41,483) |
| | | | | | | |
6. INVESTMENT TRANSACTIONS
The aggregate purchases and sales, excluding short-term investments, by the Fund for the year ended June 30, 2024, were as follows:
| | | | |
$1,000,000 | | | $0 | | | $3,288,396 | | | $4,446,034 |
| | | | | | | | | | |
7. FEDERAL TAX INFORMATION
The aggregate gross unrealized appreciation and depreciation of securities held by the Fund and the total cost of securities for federal income tax purposes at June 30, 2024, the Fund’s most recently completed fiscal year end, were as follows:
| | | | | | | | | | |
$11,062,253 | | | $(422,329) | | | $10,639,924 | | | $19,095,050 |
| | | | | | | | | | |
At June 30, 2024, components of distributable earnings on a tax-basis were as follows:
| | | | | | | | | | |
$228,541 | | | $1,571,095 | | | $10,639,924 | | | $12,439,560 |
| | | | | | | | | | |
As of June 30, 2024, the Fund did not have any capital loss carryovers. A regulated investment company may elect for any taxable year to treat any portion of any qualified late year loss as arising on the first day of the next taxable year. Qualified late year losses are certain capital and ordinary losses which occur during the portion of the Fund’s taxable year subsequent to October 31 and December 31, respectively. For the taxable year ended June 30, 2024, the Fund did not defer, on a tax basis, any qualified late year losses.
The tax character of distributions paid during the year ended June 30, 2024, were as follows:
| | | | | | | |
$547,650 | | | $1,230,847 | | | $1,778,497 |
| | | | | | | |
The tax character of distributions paid during the year ended June 30, 2023, were as follows:
| | | | | | | |
$144,393 | | | $939,659 | | | $1,084,052 |
| | | | | | | |
*
| For federal income tax purposes, distributions of short-term capital gains are treated as ordinary income. |
TABLE OF CONTENTS
REPORT OF INDEPENDENT REGISTERED PUBLIC ACCOUNTING FIRM
To the Shareholders of LK Balanced Fund and
Board of Trustees of Managed Portfolio Series
Opinion on the Financial Statements
We have audited the accompanying statement of assets and liabilities, including the schedule of investments, of LK Balanced Fund (the “Fund”), a series of Managed Portfolio Series, as of June 30, 2024, the related statement of operations for the year then ended, the statements of changes in net assets for each of the two years in the period then ended, the financial highlights for each of the five years in the period then ended, and the related notes (collectively referred to as the “financial statements”). In our opinion, the financial statements present fairly, in all material respects, the financial position of the Fund as of June 30, 2024, the results of its operations for the year then ended, the changes in net assets for each of the two years in the period then ended, and the financial highlights for each of the five years in the period then ended, in conformity with accounting principles generally accepted in the United States of America.
Basis for Opinion
These financial statements are the responsibility of the Fund’s management. Our responsibility is to express an opinion on the Fund’s financial statements based on our audits. We are a public accounting firm registered with the Public Company Accounting Oversight Board (United States) (“PCAOB”) and are required to be independent with respect to the Fund in accordance with the U.S. federal securities laws and the applicable rules and regulations of the Securities and Exchange Commission and the PCAOB.
We conducted our audits in accordance with the standards of the PCAOB. Those standards require that we plan and perform the audit to obtain reasonable assurance about whether the financial statements are free of material misstatement whether due to error or fraud.
Our audits included performing procedures to assess the risks of material misstatement of the financial statements, whether due to error or fraud, and performing procedures that respond to those risks. Such procedures included examining, on a test basis, evidence regarding the amounts and disclosures in the financial statements. Our procedures included confirmation of securities owned as of June 30, 2024, by correspondence with the custodian. Our audits also included evaluating the accounting principles used and significant estimates made by management, as well as evaluating the overall presentation of the financial statements. We believe that our audits provide a reasonable basis for our opinion.
We have served as the Fund’s auditor since 2012.
COHEN & COMPANY, LTD.
Milwaukee, Wisconsin
August 29, 2024
TABLE OF CONTENTS
LK Balanced Fund
APPROVAL OF INVESTMENT ADVISORY AGREEMENT – Lawson Kroeker Investment
Management, Inc. (Unaudited)
At the regular meeting of the Board of Trustees of Managed Portfolio Series (“Trust”) on February 21-22, 2024, the Trust’s Board of Trustees (“Board”), including all of the Trustees who are not “interested persons” of the Trust, as that term is defined in Section 2(a)(19) of the Investment Company Act of 1940, as amended (“Independent Trustees”), considered and approved the continuation of the Investment Advisory Agreement between the Trust and Lawson Kroeker Investment Management, Inc. (“LK” or the “Adviser”) regarding the LK Balanced Fund (the “Fund”) (the “Investment Advisory Agreement”) for another annual term.
Prior to the meeting and at a meeting held on January 4, 2024, the Trustees received and considered information from LK and the Trust’s administrator designed to provide the Trustees with the information necessary to evaluate the continuance of the Investment Advisory Agreement (“Support Materials”). Before voting to approve the continuance of the Investment Advisory Agreement, the Trustees reviewed the Support Materials with Trust management and with counsel to the Independent Trustees, and received a memorandum and advice from such counsel discussing the legal standards for the Trustees’ consideration of the renewal of the Investment Advisory Agreement. This information, together with the information provided to the Board throughout the course of the year, formed the primary (but not exclusive) basis for the Board’s determinations.
In determining whether to continue the Investment Advisory Agreement, the Trustees considered all factors they believed relevant, including the following with respect to the Fund: (1) the nature, extent, and quality of the services provided by LK with respect to the Fund; (2) the Fund’s historical performance and the performance of other investment accounts managed by LK; (3) the costs of the services provided by LK and the profits realized by LK from services rendered to the Fund; (4) comparative fee and expense data for the Fund and other investment companies with similar investment objectives; (5) the extent to which economies of scale may be realized as the Fund grows, and whether the advisory fee for the Fund reflects such economies of scale for the Fund’s benefit; and (6) other benefits to LK resulting from its relationship with the Fund. In their deliberations, the Trustees weighed to varying degrees the importance of the information provided to them and did not identify any particular information that was all-important or controlling.
Based upon the information provided to the Board throughout the course of the year, including a presentation to the Board by representatives of LK, and the Support Materials, the Board concluded that the overall arrangements between the Trust and LK set forth in the Investment Advisory Agreement continue to be fair and reasonable in light of the services that LK performs, the investment advisory fees that the Fund pays and such other matters as the Trustees considered relevant in the exercise of their reasonable business judgment. The material factors and conclusions that formed the basis of the Trustees’ determination to approve the continuation of the Investment Advisory Agreement are summarized below.
Nature, Extent and Quality of Services Provided. The Trustees considered the scope of services that LK provides under the Investment Advisory Agreement, noting that such services include, but are not limited to, the following: (1) investing the Fund’s assets consistent with the Fund’s investment objective and investment policies; (2) determining the portfolio securities to be purchased, sold or otherwise disposed of and the timing of such transactions; (3) voting all proxies, if any, with respect to the Fund’s portfolio securities; (4) maintaining the required books and records for transactions that LK effects on behalf of the Fund; (5) selecting broker-dealers to execute orders on behalf of the Fund; and (6) monitoring and maintaining the Fund’s compliance with policies and procedures of the Trust and with applicable securities laws. The Trustees noted the investment philosophy of the portfolio managers and their significant investment and portfolio management experience. The Trustees also considered LK’s capitalization and its assets under management. In that regard, the Trustees determined that LK had sufficient resources to support the management of the Fund. The Trustees concluded that they were satisfied with the nature, extent and quality of services provided by LK to the Fund pursuant to the Investment Advisory Agreement.
Fund Historical Performance and the Overall Performance of LK. In assessing the quality of the portfolio management delivered by LK, the Trustees reviewed the short-term and long-term performance of the Fund on both an absolute basis and in comparison to an appropriate benchmark index, the Fund’s Morningstar category (“Category”) as well as a smaller sub-set of peer funds (“Cohort”), and the composite of separate accounts that LK manages utilizing a similar investment strategy as that of the Fund. When reviewing the Fund’s performance against its Category and Cohort, the Trustees took into account that the investment objective and strategies of the Fund, as well as its level of risk tolerance, may differ significantly from funds in the Category and Cohort.
TABLE OF CONTENTS
LK Balanced Fund
APPROVAL OF INVESTMENT ADVISORY AGREEMENT – Lawson Kroeker Investment
Management, Inc. (Unaudited) (Continued)
The Trustees noted that the Fund outperformed both the Category and Cohort averages for three-year and five-year periods, as well as the Category average for the 10-year period, each as of September 30, 2023, while underperforming the Category and Cohort averages for the year-to-date and one year-periods, as well as the Cohort average for the ten-year period, each as of September 30, 2023. The Trustees also noted that the Fund outperformed its benchmark index for the three-year period ended September 30, 2023, but underperformed this index for all other periods presented. The Trustees also noted that the Fund had outperformed its additional benchmark indices (Bloomberg U.S. Aggregate Bond Index and Lipper Balanced Funds Index) for all periods presented except that it underperformed the Lipper Balanced Funds Index for the year-to date period ended September 30, 2023. The Trustees then observed that the Fund’s performance was generally consistent with the performance of a composite of similar accounts managed by LK over all relevant time periods. The Trustees noted that the Fund’s performance included performance of a predecessor fund that was reorganized into to the Fund.
Cost of Advisory Services and Profitability. The Trustees considered the annual advisory fee that the Fund pays to LK under the Investment Advisory Agreement, as well as LK’s profitability from services that LK rendered to the Fund during the 12-month period ended September 30, 2023. The Trustees also noted favorably that LK had agreed to continue the expense limitation agreement under which LK contractually agreed to reduce its advisory fees and, if necessary, reimburse the Fund for operating expenses, as specified in the Fund’s prospectus, and observed that LK had waived a portion of its management fee over the Fund’s most recent fiscal year. The Trustees then considered that the management fee LK charges to the Fund is generally within the range of fees charged to separately managed accounts with similar investment strategies as the Fund, depending on the size of the separately managed account. The Trustees concluded that LK’s service relationship with the Fund has not been profitable.
Comparative Fee and Expense Data. The Trustees considered a comparative analysis of contractual expenses borne by the Fund and those of funds within the same Category and Cohort as of September 30, 2023. The Trustees noted the Fund’s management fee and total expenses (after waivers and expense reimbursements) were each higher than the Category and Cohort averages. They also considered that the average net assets of funds comprising the Cohort were higher than the assets of the Fund. While recognizing that it is difficult to compare advisory fees because the scope of advisory services provided may vary from one investment adviser to another, the Trustees concluded that LK’s advisory fee continues to be reasonable.
Economies of Scale. The Trustees considered whether the Fund may benefit from any economies of scale, noting that the investment advisory fee for the Fund does not contain breakpoints. The Trustees noted that given current asset levels, it was not necessary to consider the implementation of fee breakpoints but agreed to revisit the issue in the future as circumstances change and asset levels increase. The Trustees also considered that LK had agreed to consider breakpoints in the future in response to asset growth.
Other Benefits. The Trustees considered the direct and indirect benefits that could be realized by the Adviser from its relationship with the Fund. The Trustees considered the extent to which LK utilizes soft dollar arrangements with respect to portfolio transactions as well as the fact that the Fund allows smaller client balances below LK’s separate account minimum to remain under management. The Trustees also took into account that LK does not use affiliated brokers to execute the Fund’s portfolio transactions. The Trustees considered that LK may receive some form of reputational benefit from services rendered to the Fund, but that any such benefits are difficult to accurately quantify. The Trustees concluded that LK does not receive additional material benefits from its relationship with the Fund.
TABLE OF CONTENTS
LK Balanced Fund
ADDITIONAL INFORMATION (UNAUDITED)
June 30, 2024
AVAILABILITY OF FUND PORTFOLIO INFORMATION
The Fund files complete schedules of portfolio holdings with the SEC for the first and third quarters of each fiscal year on Part F of Form N-PORT. The Fund’s Part F of Form N-PORT is available on the SEC’s website at https://www.sec.gov/ and may be reviewed and copied at the SEC’s Public Reference Room in Washington, D.C. For information on the Public Reference Room call 1-800-SEC-0330. In addition, the Fund’s Part F of Form N-PORT is available without charge upon request by calling 1-855-698-1378.
AVAILABILITY OF PROXY VOTING INFORMATION
A description of the Fund’s Proxy Voting Policies and Procedures is available without charge, upon request, by calling 1-855-698-1378. Information regarding how the Fund voted proxies relating to portfolio securities during the most recent 12-month period ended June 30, is available (1) without charge, upon request, by calling 1-855-698-1378, or (2) on the SEC’s website at https://www.sec.gov/.
QUALIFIED DIVIDEND INCOME/DIVIDENDS RECEIVED DEDUCTION
For the fiscal year ended June 30, 2024, certain dividends paid by the Fund may be reported as qualified dividend income and may be eligible for taxation at capital gain rates. The percentage of dividends declared from ordinary income designated as qualified dividend income was 81.42% for the Fund. For corporate shareholders, the percent of ordinary income distributions qualifying for the corporate dividends received deduction for the fiscal year ended June 30, 2024 was 73.02% for the Fund. The percentage of taxable ordinary income distributions designated as short-term capital gain distributions under Internal Revenue Section 871(k)(2)(c) was 0.00%.
TABLE OF CONTENTS
Investment Adviser:
Lawson Kroeker Investment Management, Inc.
1926 South 67th Street, Suite 201
Omaha, NE 68106
Distributor:
Quasar Distributors, LLC
3 Canal Plaza, Suite 100
Portland, ME 04101
Custodian:
U.S. Bank N.A.
1555 North Rivercenter Drive, Suite 302
Milwaukee, WI 53212
Administrator, Fund Accountant And Transfer Agent:
U.S. Bancorp Fund Services, LLC
615 East Michigan Street
Milwaukee, WI 53202
Independent Registered Public Accounting Firm:
Cohen & Company, Ltd.
342 North Water Street, Suite 830
Milwaukee, WI, 53202
Legal Counsel:
Stradley Ronon Stevens & Young, LLP
2005 Market Street, Suite 2600
Philadelphia, PA 19103
This report must be accompanied or preceded by a prospectus.
The Fund’s Statement of Additional Information contains additional information about the Fund’s trustees and is
available without charge upon request by calling 1-855-698-1378.
| (b) | Financial Highlights are included within the financial statements filed under Item 7 of this Form.” |
Item 8. Changes in and Disagreements with Accountants for Open-End Investment Companies.
There were no changes in or disagreements with accountants during the period covered by this report.
Item 9. Proxy Disclosure for Open-End Investment Companies.
There were no matters submitted to a vote of shareholders during the period covered by this report.
Item 10. Remuneration Paid to Directors, Officers, and Others of Open-End Investment Companies.
See Item 7(a).
Item 11. Statement Regarding Basis for Approval of Investment Advisory Contract.
See Item 7(a).
Item 12. Disclosure of Proxy Voting Policies and Procedures for Closed-End Management Investment Companies.
Not applicable to open-end investment companies.
Item 13. Portfolio Managers of Closed-End Management Investment Companies.
Not applicable to open-end investment companies.
Item 14. Purchases of Equity Securities by Closed-End Management Investment Company and Affiliated Purchasers.
Not applicable to open-end investment companies.
Item 15. Submission of Matters to a Vote of Security Holders.
There have been no material changes to the procedures by which shareholders may recommend nominees to the registrant’s board of trustees.
Item 16. Controls and Procedures.
| (a) | The Registrant’s [Principal Executive Officer] and [Principal Financial Officer] have reviewed the Registrant’s disclosure controls and procedures (as defined in Rule 30a-3(c) under the Investment Company Act of 1940 (the “Act”)) as of a date within 90 days of the filing of this report, as required by Rule 30a-3(b) under the Act and Rules 13a-15(b) or 15d-15(b) under the Securities Exchange Act of 1934. Based on their review, such officers have concluded that the disclosure controls and procedures are effective in ensuring that information required to be disclosed in this report is appropriately recorded, processed, summarized and reported and made known to them by others within the Registrant and by the Registrant’s service provider. |
| (b) | There were no changes in the Registrant’s internal control over financial reporting (as defined in Rule 30a-3(d) under the Act) that occurred during the period covered by this report that have materially affected, or are reasonably likely to materially affect, the Registrant’s internal control over financial reporting. |
Item 17. Disclosure of Securities Lending Activities for Closed-End Management Investment Companies
Not applicable to open-end investment companies.
Item 18. Recovery of Erroneously Awarded Compensation.
Not applicable
Item 19. Exhibits.
(2) Any policy required by the listing standards adopted pursuant to Rule 10D-1 under the Exchange Act (17 CFR 240.10D-1) by the registered national securities exchange or registered national securities association upon which the registrant’s securities are listed. Not applicable.
(3) A separate certification for each principal executive officer and principal financial officer of the registrant as required by Rule 30a-2(a) under the Investment Company Act of 1940 (17 CFR 270.30a-2(a)). Filed herewith.
(4) Any written solicitation to purchase securities under Rule 23c-1 under the Act sent or given during the period covered by the report by or on behalf of the registrant to 10 or more persons. Not applicable to open-end investment companies.
| (5) | Change in the registrant’s independent public accountant. Provide the information called for by Item 4 of Form 8-K under the Exchange Act (17 CFR 249.308). Unless otherwise specified by Item 4, or related to and necessary for a complete understanding of information not previously disclosed, the information should relate to events occurring during the reporting period. Not applicable to open-end investment companies and ETFs. |
Pursuant to the requirements of the Securities Exchange Act of 1934 and the Investment Company Act of 1940, the registrant has duly caused this report to be signed on its behalf by the undersigned, thereunto duly authorized.
| | (Registrant) | Managed Portfolio Series | |
| | By (Signature and Title)* | /s/ Brian R. Wiedmeyer | |
| | | Brian R. Wiedmeyer, President | |
Pursuant to the requirements of the Securities Exchange Act of 1934 and the Investment Company Act of 1940, this report has been signed below by the following persons on behalf of the registrant and in the capacities and on the dates indicated.
| | By (Signature and Title)* | /s/ Brian R. Wiedmeyer | |
| | | Brian R. Wiedmeyer, President | |
| | By (Signature and Title)* | /s/ Benjamin J. Eirich | |
| | | Benjamin J. Eirich, Treasurer | |
* Print the name and title of each signing officer under his or her signature.