UNITED STATES
SECURITIES AND EXCHANGE COMMISSION
Washington, D.C. 20549
FORM N-CSR
CERTIFIED SHAREHOLDER REPORT OF REGISTERED
MANAGEMENT INVESTMENT COMPANIES
Investment Company Act file number 811-22525
Managed Portfolio Series
(Exact name of registrant as specified in charter)
615 East Michigan Street
Milwaukee, WI 53202
(Address of principal executive offices) (Zip code)
Brian Wiedmeyer, President
Managed Portfolio Series
c/o U.S. Bank Global Fund Services
777 East Wisconsin Ave., 6th Floor
Milwaukee, WI 53202
(Name and address of agent for service)
(414) 516-1712
Registrant’s telephone number, including area code
Date of fiscal year end: 06/30/2024
Date of reporting period: 06/30/2024
Item 1. Reports to Stockholders.
| | |
| Olstein All Cap Value Fund | |
| Adviser Class | OFAFX |
| Annual Shareholder Report | June 30, 2024 |
This annual shareholder report contains important information about the Olstein All Cap Value Fund for the period of July 1, 2023, to June 30, 2024, as well as certain changes to the Fund. You can find additional information about the Fund at https://www.olsteinfunds.com/resources/documents-forms. You can also request this information by contacting us at 1-800-799-2113.
This report describes changes to the Fund that occurred during the reporting period.
What were the Fund costs for the past year?
(based on a hypothetical $10,000 investment)
| | |
Class Name | Costs of a $10,000 investment | Costs paid as a percentage of a $10,000 investment |
| Adviser Class | $121 | 1.17% |
How did the Class perform last year and what affected its performance?
For the fiscal year ended June 30, 2024, the Class returned 6.48% and its benchmark Russell 3000Ⓡ Index returned 23.13%. During the fiscal year, a narrow range of high tech, high growth, high price-earnings ratio, and high momentum stocks (such as NVIDIA and Netflix) dominated the benchmark Russell 3000 Index’s returns and accounted for a material amount of the gain in the Russell 3000 Index and represents a material amount of the value of the Russell 3000 Index. Our philosophy practiced since the inception of the Fund focuses on valuing companies using an accounting-based forensic fundamentals analysis of financial statements to identify companies whose ability to generate future free cash flow is, in our opinion, not being properly valued by the marketplace. The Fund focuses on long-term value investing, so we remained underweight in the high-flying stocks in the Russell 3000 Index because they did not meet our value criteria. Therefore, the Fund trailed the Russell 3000 Index during the fiscal year.
We are long-term investors and believe the price you pay for an investment is the biggest factor determining future returns. The flight by investors into the out-performing high-flying stocks responsible for a material amount of the Russell 3000 Index’s appreciation created an abundance of opportunities in companies that, in our opinion, were selling at material discounts to their intrinsic values.
We remain focused on individual companies, their operations, and prospects for maintaining and growing sustainable free cash flow. We sought to take advantage of market volatility to seize upon the opportunities to purchase what we believe are solid companies (especially in the industrial and financial sectors) or to add to existing positions in companies selling at material discounts to our estimates of their intrinsic values.
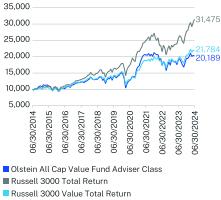
How did the Fund perform over the past 10 years?*
The $10,000 chart reflects a hypothetical $10,000 investment in the class of shares noted and does not assume the maximum sales charge (if applicable). The chart uses total return NAV performance and assumes reinvestment of dividends and capital gains. Fund expenses, including 12b-1 fees (if applicable), management fees and other expenses were deducted. Performance for other share classes will vary.
CUMULATIVE PERFORMANCE
ANNUAL AVERAGE TOTAL RETURN (%)
| | | |
| | 1 Year | 5 Year | 10 Year |
Adviser Class (without sales charge) | 6.48 | 7.80 | 7.28 |
Russell 3000 Total Return | 23.13 | 14.14 | 12.15 |
Russell 3000 Value Total Return | 12.93 | 8.89 | 8.10 |
Visit https://www.olsteinfunds.com/resources/documents-forms for more recent performance information.
| * | The Fund’s past performance is not a good predictor of the Fund’s future performance. The returns do not reflect the deduction of taxes that a shareholder would pay on Fund distributions or redemption of Fund shares. |
| Olstein All Cap Value Fund | PAGE 1 | TSR_AR_56167N621 |
Key Fund Statistics (as of June 30, 2024)
| |
Net Assets | $531,880,961 |
Number of Equity Holdings | 79 |
| |
Net Advisory Fee | $5,572,937 |
Portfolio Turnover | 27% |
Visit https://www.olsteinfunds.com/resources/documents-forms for more recent performance information.
What did the Fund invest in? (as of June 30, 2024)
| |
Security Type | (% of Net Assets) |
Common Stocks | 91.0% |
Cash & Other | 9.0% |
| |
Top 10 Issuers | (% of Net Assets) |
Walt Disney Company | 2.2% |
ABM Industries, Inc. | 2.1% |
Sensata Technologies Holding PLC | 1.8% |
United Parcel Service, Inc. | 1.7% |
Quest Diagnostics Inc. | 1.7% |
CVS Health Corporation | 1.7% |
Baxter International, Inc. | 1.7% |
Johnson & Johnson | 1.7% |
SS&C Technologies Holdings, Inc. | 1.7% |
Corteva, Inc. | 1.6% |
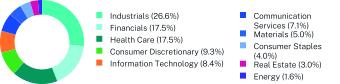
Sector Breakdown (% of Equity Investments)
Householding
To reduce Fund expenses, only one copy of most shareholder documents may be mailed to shareholders with multiple accounts at the same address (Householding). If you would prefer that your Olstein Capital Management, L.P. documents not be householded, please contact Olstein Capital Management, L.P. at 1-800-799-2113, or contact your financial intermediary. Your instructions will typically be effective within 30 days of receipt by Olstein Capital Management, L.P. or your financial intermediary.
For additional information about the Fund, including its prospectus and other important materials, scan the QR code or visit https://www.olsteinfunds.com/resources/documents-forms
The Olstein All Cap Value Fund is distributed by Quasar Distributors, LLC.
| Olstein All Cap Value Fund | PAGE 2 | TSR_AR_56167N621 |
10000110351016712258130751386712720205421729818961201891000010729109591298714907162461730624949214902556331475100001038610637123611325814231128901874217343192892178426.617.517.59.38.47.15.04.03.01.6
| | |
| Olstein All Cap Value Fund | |
| Class A | OFAVX |
| Annual Shareholder Report | June 30, 2024 |
This annual shareholder report contains important information about the Olstein All Cap Value Fund for the period of July 1, 2023, to June 30, 2024, as well as certain changes to the Fund. You can find additional information about the Fund at https://www.olsteinfunds.com/resources/documents-forms. You can also request this information by contacting us at 1-800-799-2113.
This report describes changes to the Fund that occurred during the reporting period.
What were the Fund costs for the past year?
(based on a hypothetical $10,000 investment)
| | |
Class Name | Costs of a $10,000 investment | Costs paid as a percentage of a $10,000 investment |
| Class A | $146 | 1.42% |
How did the Class perform last year and what affected its performance?
For the fiscal year ended June 30, 2024, the Class returned 6.23% (load-waived) and its benchmark Russell 3000Ⓡ Index returned 23.13%. During the fiscal year, a narrow range of high tech, high growth, high price-earnings ratio, and high momentum stocks (such as NVIDIA and Netflix) dominated the benchmark Russell 3000 Index’s returns and accounted for a material amount of the gain in the Russell 3000 Index and represents a material amount of the value of the Russell 3000 Index. Our philosophy practiced since the inception of the Fund focuses on valuing companies using an accounting-based forensic fundamentals analysis of financial statements to identify companies whose ability to generate future free cash flow is, in our opinion, not being properly valued by the marketplace. The Fund focuses on long-term value investing, so we remained underweight in the high-flying stocks in the Russell 3000 Index because they did not meet our value criteria. Therefore, the Fund trailed the Russell 3000 Index during the fiscal year.
We are long-term investors and believe the price you pay for an investment is the biggest factor determining future returns. The flight by investors into the out-performing high-flying stocks responsible for a material amount of the Russell 3000 Index’s appreciation created an abundance of opportunities in companies that, in our opinion, were selling at material discounts to their intrinsic values.
We remain focused on individual companies, their operations, and prospects for maintaining and growing sustainable free cash flow. We sought to take advantage of market volatility to seize upon the opportunities to purchase what we believe are solid companies (especially in the industrial and financial sectors) or to add to existing positions in companies selling at material discounts to our estimates of their intrinsic values.
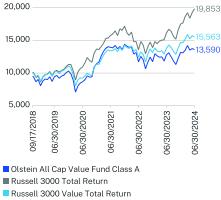
How did the Fund perform since inception?*
The $10,000 chart reflects a hypothetical $10,000 investment in the class of shares noted and does not assume the maximum sales charge (if applicable). The chart uses total return NAV performance and assumes reinvestment of dividends and capital gains. Fund expenses, including 12b-1 fees (if applicable), management fees and other expenses were deducted. Performance for other share classes will vary.
CUMULATIVE PERFORMANCE
ANNUAL AVERAGE TOTAL RETURN (%)
| | | |
| | 1 Year | 5 Year | Since Inception
(09/17/2018) |
Class A (without sales charge) | 6.23 | 7.53 | 6.48 |
Class A (with sales charge) | 0.38 | 6.32 | 5.45 |
Russell 3000 Total Return | 23.13 | 14.14 | 12.59 |
Russell 3000 Value Total Return | 12.93 | 8.89 | 7.95 |
Visit https://www.olsteinfunds.com/resources/documents-forms for more recent performance information.
| * | The Fund’s past performance is not a good predictor of the Fund’s future performance. The returns do not reflect the deduction of taxes that a shareholder would pay on Fund distributions or redemption of Fund shares. |
| Olstein All Cap Value Fund | PAGE 1 | TSR_AR_56167N563 |
Key Fund Statistics (as of June 30, 2024)
| |
Net Assets | $531,880,961 |
Number of Equity Holdings | 79 |
| |
Net Advisory Fee | $5,572,937 |
Portfolio Turnover | 27% |
Visit https://www.olsteinfunds.com/resources/documents-forms for more recent performance information.
What did the Fund invest in? (as of June 30, 2024)
| |
Security Type | (% of Net Assets) |
Common Stocks | 91.0% |
Cash & Other | 9.0% |
| |
Top 10 Issuers | (% of Net Assets) |
Walt Disney Company | 2.2% |
ABM Industries, Inc. | 2.1% |
Sensata Technologies Holding PLC | 1.8% |
United Parcel Service, Inc. | 1.7% |
Quest Diagnostics Inc. | 1.7% |
CVS Health Corporation | 1.7% |
Baxter International, Inc. | 1.7% |
Johnson & Johnson | 1.7% |
SS&C Technologies Holdings, Inc. | 1.7% |
Corteva, Inc. | 1.6% |
Sector Breakdown (% of Equity Investments)
Householding
To reduce Fund expenses, only one copy of most shareholder documents may be mailed to shareholders with multiple accounts at the same address (Householding). If you would prefer that your Olstein Capital Management, L.P. documents not be householded, please contact Olstein Capital Management, L.P. at 1-800-799-2113, or contact your financial intermediary. Your instructions will typically be effective within 30 days of receipt by Olstein Capital Management, L.P. or your financial intermediary.
For additional information about the Fund, including its prospectus and other important materials, scan the QR code or visit https://www.olsteinfunds.com/resources/documents-forms
The Olstein All Cap Value Fund is distributed by Quasar Distributors, LLC.
| Olstein All Cap Value Fund | PAGE 2 | TSR_AR_56167N563 |
94538645139321170412793135901024710916157371355516124198531016792091339012391137811556326.617.517.59.38.47.15.04.03.01.6
| | |
| Olstein All Cap Value Fund | |
| Class C | OFALX |
| Annual Shareholder Report | June 30, 2024 |
This annual shareholder report contains important information about the Olstein All Cap Value Fund for the period of July 1, 2023, to June 30, 2024, as well as certain changes to the Fund. You can find additional information about the Fund at https://www.olsteinfunds.com/resources/documents-forms. You can also request this information by contacting us at 1-800-799-2113.
This report describes changes to the Fund that occurred during the reporting period.
What were the Fund costs for the past year?
(based on a hypothetical $10,000 investment)
| | |
Class Name | Costs of a $10,000 investment | Costs paid as a percentage of a $10,000 investment |
| Class C | $223 | 2.17% |
How did the Class perform last year and what affected its performance?
For the fiscal year ended June 30, 2024, the Class returned 5.43% (load-waived) and its benchmark Russell 3000Ⓡ Index returned 23.13%. During the fiscal year, a narrow range of high tech, high growth, high price-earnings ratio, and high momentum stocks (such as NVIDIA and Netflix) dominated the benchmark Russell 3000 Index’s returns and accounted for a material amount of the gain in the Russell 3000 Index and represents a material amount of the value of the Russell 3000 Index. Our philosophy practiced since the inception of the Fund focuses on valuing companies using an accounting-based forensic fundamentals analysis of financial statements to identify companies whose ability to generate future free cash flow is, in our opinion, not being properly valued by the marketplace. The Fund focuses on long-term value investing, so we remained underweight in the high-flying stocks in the Russell 3000 Index because they did not meet our value criteria. Therefore, the Fund trailed the Russell 3000 Index during the fiscal year.
We are long-term investors and believe the price you pay for an investment is the biggest factor determining future returns. The flight by investors into the out-performing high-flying stocks responsible for a material amount of the Russell 3000 Index’s appreciation created an abundance of opportunities in companies that, in our opinion, were selling at material discounts to their intrinsic values.
We remain focused on individual companies, their operations, and prospects for maintaining and growing sustainable free cash flow. We sought to take advantage of market volatility to seize upon the opportunities to purchase what we believe are solid companies (especially in the industrial and financial sectors) or to add to existing positions in companies selling at material discounts to our estimates of their intrinsic values.
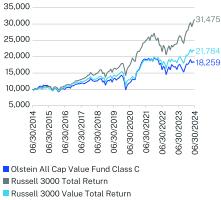
How did the Fund perform over the past 10 years?*
The $10,000 chart reflects a hypothetical $10,000 investment in the class of shares noted and does not assume the maximum sales charge (if applicable). The chart uses total return NAV performance and assumes reinvestment of dividends and capital gains. Fund expenses, including 12b-1 fees (if applicable), management fees and other expenses were deducted. Performance for other share classes will vary.
CUMULATIVE PERFORMANCE
ANNUAL AVERAGE TOTAL RETURN (%)
| | | |
| | 1 Year | 5 Year | 10 Year |
Class C (without sales charge) | 5.43 | 6.71 | 6.21 |
Class C (with sales charge) | 4.43 | 6.71 | 6.21 |
Russell 3000 Total Return | 23.13 | 14.14 | 12.15 |
Russell 3000 Value Total Return | 12.93 | 8.89 | 8.10 |
Visit https://www.olsteinfunds.com/resources/documents-forms for more recent performance information.
| * | The Fund’s past performance is not a good predictor of the Fund’s future performance. The returns do not reflect the deduction of taxes that a shareholder would pay on Fund distributions or redemption of Fund shares. |
| Olstein All Cap Value Fund | PAGE 1 | TSR_AR_56167N613 |
Key Fund Statistics (as of June 30, 2024)
| |
Net Assets | $531,880,961 |
Number of Equity Holdings | 79 |
| |
Net Advisory Fee | $5,572,937 |
Portfolio Turnover | 27% |
Visit https://www.olsteinfunds.com/resources/documents-forms for more recent performance information.
What did the Fund invest in? (as of June 30, 2024)
| |
Security Type | (% of Net Assets) |
Common Stocks | 91.0% |
Cash & Other | 9.0% |
| |
Top 10 Issuers | (% of Net Assets) |
Walt Disney Company | 2.2% |
ABM Industries, Inc. | 2.1% |
Sensata Technologies Holding PLC | 1.8% |
United Parcel Service, Inc. | 1.7% |
Quest Diagnostics Inc. | 1.7% |
CVS Health Corporation | 1.7% |
Baxter International, Inc. | 1.7% |
Johnson & Johnson | 1.7% |
SS&C Technologies Holdings, Inc. | 1.7% |
Corteva, Inc. | 1.6% |
Sector Breakdown (% of Equity Investments)
Householding
To reduce Fund expenses, only one copy of most shareholder documents may be mailed to shareholders with multiple accounts at the same address (Householding). If you would prefer that your Olstein Capital Management, L.P. documents not be householded, please contact Olstein Capital Management, L.P. at 1-800-799-2113, or contact your financial intermediary. Your instructions will typically be effective within 30 days of receipt by Olstein Capital Management, L.P. or your financial intermediary.
For additional information about the Fund, including its prospectus and other important materials, scan the QR code or visit https://www.olsteinfunds.com/resources/documents-forms
The Olstein All Cap Value Fund is distributed by Quasar Distributors, LLC.
| Olstein All Cap Value Fund | PAGE 2 | TSR_AR_56167N613 |
1000010924996011895125571319411978191521596917319182591000010729109591298714907162461730624949214902556331475100001038610637123611325814231128901874217343192892178426.617.517.59.38.47.15.04.03.01.6
| | |
| Olstein Strategic Opportunities Fund | |
| Adviser Class | OFSFX |
| Annual Shareholder Report | June 30, 2024 |
This annual shareholder report contains important information about the Olstein Strategic Opportunities Fund for the period of July 1, 2023, to June 30, 2024, as well as certain changes to the Fund. You can find additional information about the Fund at https://www.olsteinfunds.com/resources/documents-forms. You can also request this information by contacting us at 1-800-799-2113.
This report describes changes to the Fund that occurred during the reporting period.
What were the Fund costs for the past year?
(based on a hypothetical $10,000 investment)
| | |
Class Name | Costs of a $10,000 investment | Costs paid as a percentage of a $10,000 investment |
| Adviser Class | $138 | 1.35% |
How did the Class perform last year and what affected its performance?
For the fiscal year ended June 30, 2024, the Class returned 3.85% and its benchmark Russell 3000Ⓡ Index returned 23.13%. During the fiscal year, a narrow range of high tech, high growth, high price-earnings ratio, and high momentum stocks (such as NVIDIA and Netflix) dominated the benchmark Russell 3000 Index’s returns and accounted for a material amount of the gain in the Russell 3000 Index and represents a material amount of the value of the Russell 3000 Index. Our philosophy practiced since the inception of the Fund focuses on valuing companies using an accounting-based forensic fundamentals analysis of financial statements to identify companies whose ability to generate future free cash flow is, in our opinion, not being properly valued by the marketplace. The Fund focuses on long-term value investing, so we remained underweight in the high-flying stocks in the Russell 3000 Index because they did not meet our value criteria. Therefore, the Fund trailed the Russell 3000 Index during the fiscal year.
We are long-term investors and believe the price you pay for an investment is the biggest factor determining future returns. The flight by investors into the out-performing high-flying stocks responsible for a material amount of the Russell 3000 Index’s appreciation created an abundance of opportunities in companies that, in our opinion, were selling at material discounts to their intrinsic values.
We remain focused on individual companies, their operations, and prospects for maintaining and growing sustainable free cash flow. We sought to take advantage of market volatility to seize upon the opportunities to purchase what we believe are solid companies (especially in the industrial and consumer discretionary sectors) or to add to existing positions in companies selling at material discounts to our estimates of their intrinsic values.
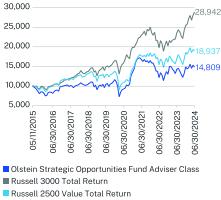
How did the Fund perform since inception?*
The $10,000 chart reflects a hypothetical $10,000 investment in the class of shares noted and does not assume the maximum sales charge (if applicable). The chart uses total return NAV performance and assumes reinvestment of dividends and capital gains. Fund expenses, including 12b-1 fees (if applicable), management fees and other expenses were deducted. Performance for other share classes will vary.
CUMULATIVE PERFORMANCE
ANNUAL AVERAGE TOTAL RETURN (%)
| | | |
| | 1 Year | 5 Year | Since Inception
(05/11/2015) |
Adviser Class (without sales charge) | 3.85 | 7.15 | 4.39 |
Russell 3000 Total Return | 23.13 | 14.14 | 12.33 |
Russell 2500 Value Total Return | 11.24 | 8.01 | 7.24 |
Visit https://www.olsteinfunds.com/resources/documents-forms for more recent performance information.
| * | The Fund’s past performance is not a good predictor of the Fund’s future performance. The returns do not reflect the deduction of taxes that a shareholder would pay on Fund distributions or redemption of Fund shares. |
| Olstein Strategic Opportunities Fund | PAGE 1 | TSR_AR_56167N571 |
Key Fund Statistics (as of June 30, 2024)
| |
Net Assets | $81,425,688 |
Number of Equity Holdings | 37 |
| |
Net Advisory Fee | $694,045 |
Portfolio Turnover | 32% |
Visit https://www.olsteinfunds.com/resources/documents-forms for more recent performance information.
What did the Fund invest in? (as of June 30, 2024)
| |
Security Type | (% of Net Assets) |
Common Stocks | 96.1% |
Cash & Other | 3.9% |
| |
Top 10 Equity Issuers | (% of Net Assets) |
Prestige Consumer Healthcare, Inc. | 4.1% |
Shyft Group, Inc. | 4.1% |
Sensata Technologies Holding PLC | 4.1% |
Integra LifeSciences Holdings Corporation | 4.0% |
ABM Industries, Inc. | 4.0% |
Gates Industrial Corporation PLC | 3.9% |
Dine Brands Global, Inc. | 3.7% |
Central Garden & Pet Company - Class A | 3.2% |
Mohawk Industries, Inc. | 3.2% |
Citizens Financial Group, Inc. | 3.2% |
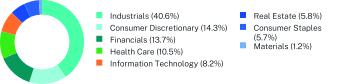
Sector Breakdown (% of Equity Investments)
Householding
To reduce Fund expenses, only one copy of most shareholder documents may be mailed to shareholders with multiple accounts at the same address (Householding). If you would prefer that your Olstein Capital Management, L.P. documents not be householded, please contact Olstein Capital Management, L.P. at 1-800-799-2113, or contact your financial intermediary. Your instructions will typically be effective within 30 days of receipt by Olstein Capital Management, L.P. or your financial intermediary.
For additional information about the Fund, including its prospectus and other important materials, scan the QR code or visit https://www.olsteinfunds.com/resources/documents-forms
The Olstein Strategic Opportunities Fund is distributed by Quasar Distributors, LLC.
| Olstein Strategic Opportunities Fund | PAGE 2 | TSR_AR_56167N571 |
95948144101371050110485926316787121451426014809986610077119421370714938159142294219761235062894299329953117811313412881108851776815423170231893740.614.313.710.58.25.85.71.2
| | |
| Olstein Strategic Opportunities Fund | |
| Class A | OFSAX |
| Annual Shareholder Report | June 30, 2024 |
This annual shareholder report contains important information about the Olstein Strategic Opportunities Fund for the period of July 1, 2023, to June 30, 2024, as well as certain changes to the Fund. You can find additional information about the Fund at https://www.olsteinfunds.com/resources/documents-forms. You can also request this information by contacting us at 1-800-799-2113.
This report describes changes to the Fund that occurred during the reporting period.
What were the Fund costs for the past year?
(based on a hypothetical $10,000 investment)
| | |
Class Name | Costs of a $10,000 investment | Costs paid as a percentage of a $10,000 investment |
| Class A | $163 | 1.60% |
How did the Class perform last year and what affected its performance?
For the fiscal year ended June 30, 2024, the Class returned 3.58% (load-waived) and its benchmark Russell 3000Ⓡ Index returned 23.13%. During the fiscal year, a narrow range of high tech, high growth, high price-earnings ratio, and high momentum stocks (such as NVIDIA and Netflix) dominated the benchmark Russell 3000 Index’s returns and accounted for a material amount of the gain in the Russell 3000 Index and represents a material amount of the value of the Russell 3000 Index. Our philosophy practiced since the inception of the Fund focuses on valuing companies using an accounting-based forensic fundamentals analysis of financial statements to identify companies whose ability to generate future free cash flow is, in our opinion, not being properly valued by the marketplace. The Fund focuses on long-term value investing, so we remained underweight in the high-flying stocks in the Russell 3000 Index because they did not meet our value criteria. Therefore, the Fund trailed the Russell 3000 Index during the fiscal year.
We are long-term investors and believe the price you pay for an investment is the biggest factor determining future returns. The flight by investors into the out-performing high-flying stocks responsible for a material amount of the Russell 3000 Index’s appreciation created an abundance of opportunities in companies that, in our opinion, were selling at material discounts to their intrinsic values.
We remain focused on individual companies, their operations, and prospects for maintaining and growing sustainable free cash flow. We sought to take advantage of market volatility to seize upon the opportunities to purchase what we believe are solid companies (especially in the industrial and consumer discretionary sectors) or to add to existing positions in companies selling at material discounts to our estimates of their intrinsic values.
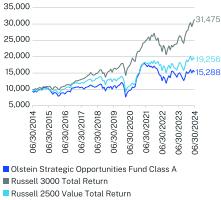
How did the Fund perform over the past 10 years?*
The $10,000 chart reflects a hypothetical $10,000 investment in the class of shares noted and does not assume the maximum sales charge (if applicable). The chart uses total return NAV performance and assumes reinvestment of dividends and capital gains. Fund expenses, including 12b-1 fees (if applicable), management fees and other expenses were deducted. Performance for other share classes will vary.
CUMULATIVE PERFORMANCE
ANNUAL AVERAGE TOTAL RETURN (%)
| | | |
| | 1 Year | 5 Year | 10 Year |
Class A (without sales charge) | 3.58 | 6.88 | 4.93 |
Class A (with sales charge) | -2.10 | 5.68 | 4.34 |
Russell 3000 Total Return | 23.13 | 14.14 | 12.15 |
Russell 2500 Value Total Return | 11.24 | 8.01 | 6.77 |
Visit https://www.olsteinfunds.com/resources/documents-forms for more recent performance information.
| * | The Fund’s past performance is not a good predictor of the Fund’s future performance. The returns do not reflect the deduction of taxes that a shareholder would pay on Fund distributions or redemption of Fund shares. |
| Olstein Strategic Opportunities Fund | PAGE 1 | TSR_AR_56167N597 |
Key Fund Statistics (as of June 30, 2024)
| |
Net Assets | $81,425,688 |
Number of Equity Holdings | 37 |
| |
Net Advisory Fee | $694,045 |
Portfolio Turnover | 32% |
Visit https://www.olsteinfunds.com/resources/documents-forms for more recent performance information.
What did the Fund invest in? (as of June 30, 2024)
| |
Security Type | (% of Net Assets) |
Common Stocks | 96.1% |
Cash & Other | 3.9% |
| |
Top 10 Equity Issuers | (% of Net Assets) |
Prestige Consumer Healthcare, Inc. | 4.1% |
Shyft Group, Inc. | 4.1% |
Sensata Technologies Holding PLC | 4.1% |
Integra LifeSciences Holdings Corporation | 4.0% |
ABM Industries, Inc. | 4.0% |
Gates Industrial Corporation PLC | 3.9% |
Dine Brands Global, Inc. | 3.7% |
Central Garden & Pet Company - Class A | 3.2% |
Mohawk Industries, Inc. | 3.2% |
Citizens Financial Group, Inc. | 3.2% |
Sector Breakdown (% of Equity Investments)
Householding
To reduce Fund expenses, only one copy of most shareholder documents may be mailed to shareholders with multiple accounts at the same address (Householding). If you would prefer that your Olstein Capital Management, L.P. documents not be householded, please contact Olstein Capital Management, L.P. at 1-800-799-2113, or contact your financial intermediary. Your instructions will typically be effective within 30 days of receipt by Olstein Capital Management, L.P. or your financial intermediary.
For additional information about the Fund, including its prospectus and other important materials, scan the QR code or visit https://www.olsteinfunds.com/resources/documents-forms
The Olstein Strategic Opportunities Fund is distributed by Quasar Distributors, LLC.
| Olstein Strategic Opportunities Fund | PAGE 2 | TSR_AR_56167N597 |
94491012885781065111004109639659174681260714760152881000010729109591298714907162461730624949214902556331475100001009910121119791335613099110691806715684173101925640.614.313.710.58.25.85.71.2
| | |
| Olstein Strategic Opportunities Fund | |
| Class C | OFSCX |
| Annual Shareholder Report | June 30, 2024 |
This annual shareholder report contains important information about the Olstein Strategic Opportunities Fund for the period of July 1, 2023, to June 30, 2024, as well as certain changes to the Fund. You can find additional information about the Fund at https://www.olsteinfunds.com/resources/documents-forms. You can also request this information by contacting us at 1-800-799-2113.
This report describes changes to the Fund that occurred during the reporting period.
What were the Fund costs for the past year?
(based on a hypothetical $10,000 investment)
| | |
Class Name | Costs of a $10,000 investment | Costs paid as a percentage of a $10,000 investment |
| Class C | $238 | 2.35% |
How did the Class perform last year and what affected its performance?
For the fiscal year ended June 30, 2024, the Class returned 2.77% (load-waived) and its benchmark Russell 3000Ⓡ Index returned 23.13%. During the fiscal year, a narrow range of high tech, high growth, high price-earnings ratio, and high momentum stocks (such as NVIDIA and Netflix) dominated the benchmark Russell 3000 Index’s returns and accounted for a material amount of the gain in the Russell 3000 Index and represents a material amount of the value of the Russell 3000 Index. Our philosophy practiced since the inception of the Fund focuses on valuing companies using an accounting-based forensic fundamentals analysis of financial statements to identify companies whose ability to generate future free cash flow is, in our opinion, not being properly valued by the marketplace. The Fund focuses on long-term value investing, so we remained underweight in the high-flying stocks in the Russell 3000 Index because they did not meet our value criteria. Therefore, the Fund trailed the Russell 3000 Index during the fiscal year.
We are long-term investors and believe the price you pay for an investment is the biggest factor determining future returns. The flight by investors into the out-performing high-flying stocks responsible for a material amount of the Russell 3000 Index’s appreciation created an abundance of opportunities in companies that, in our opinion, were selling at material discounts to their intrinsic values.
We remain focused on individual companies, their operations, and prospects for maintaining and growing sustainable free cash flow. We sought to take advantage of market volatility to seize upon the opportunities to purchase what we believe are solid companies (especially in the industrial and consumer discretionary sectors) or to add to existing positions in companies selling at material discounts to our estimates of their intrinsic values.
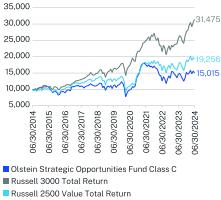
How did the Fund perform over the past 10 years?*
The $10,000 chart reflects a hypothetical $10,000 investment in the class of shares noted and does not assume the maximum sales charge (if applicable). The chart uses total return NAV performance and assumes reinvestment of dividends and capital gains. Fund expenses, including 12b-1 fees (if applicable), management fees and other expenses were deducted. Performance for other share classes will vary.
CUMULATIVE PERFORMANCE
ANNUAL AVERAGE TOTAL RETURN (%)
| | | |
| | 1 Year | 5 Year | 10 Year |
Class C (without sales charge) | 2.77 | 6.08 | 4.15 |
Class C (with sales charge) | 1.77 | 6.08 | 4.15 |
Russell 3000 Total Return | 23.13 | 14.14 | 12.15 |
Russell 2500 Value Total Return | 11.24 | 8.01 | 6.77 |
Visit https://www.olsteinfunds.com/resources/documents-forms for more recent performance information.
| * | The Fund’s past performance is not a good predictor of the Fund’s future performance. The returns do not reflect the deduction of taxes that a shareholder would pay on Fund distributions or redemption of Fund shares. |
| Olstein Strategic Opportunities Fund | PAGE 1 | TSR_AR_56167N589 |
Key Fund Statistics (as of June 30, 2024)
| |
Net Assets | $81,425,688 |
Number of Equity Holdings | 37 |
| |
Net Advisory Fee | $694,045 |
Portfolio Turnover | 32% |
Visit https://www.olsteinfunds.com/resources/documents-forms for more recent performance information.
What did the Fund invest in? (as of June 30, 2024)
| |
Security Type | (% of Net Assets) |
Common Stocks | 96.1% |
Cash & Other | 3.9% |
| |
Top 10 Equity Issuers | (% of Net Assets) |
Prestige Consumer Healthcare, Inc. | 4.1% |
Shyft Group, Inc. | 4.1% |
Sensata Technologies Holding PLC | 4.1% |
Integra LifeSciences Holdings Corporation | 4.0% |
ABM Industries, Inc. | 4.0% |
Gates Industrial Corporation PLC | 3.9% |
Dine Brands Global, Inc. | 3.7% |
Central Garden & Pet Company - Class A | 3.2% |
Mohawk Industries, Inc. | 3.2% |
Citizens Financial Group, Inc. | 3.2% |
Sector Breakdown (% of Equity Investments)
Householding
To reduce Fund expenses, only one copy of most shareholder documents may be mailed to shareholders with multiple accounts at the same address (Householding). If you would prefer that your Olstein Capital Management, L.P. documents not be householded, please contact Olstein Capital Management, L.P. at 1-800-799-2113, or contact your financial intermediary. Your instructions will typically be effective within 30 days of receipt by Olstein Capital Management, L.P. or your financial intermediary.
For additional information about the Fund, including its prospectus and other important materials, scan the QR code or visit https://www.olsteinfunds.com/resources/documents-forms
The Olstein Strategic Opportunities Fund is distributed by Quasar Distributors, LLC.
| Olstein Strategic Opportunities Fund | PAGE 2 | TSR_AR_56167N589 |
100001064189471102411304111779781175431256414611150151000010729109591298714907162461730624949214902556331475100001009910121119791335613099110691806715684173101925640.614.313.710.58.25.85.71.2
Item 2. Code of Ethics.
The registrant has adopted a code of ethics that applies to the registrant’s principal executive officer and principal financial officer. The registrant has not made any substantive amendments to its code of ethics during the period covered by this report. The registrant has not granted any waivers from any provisions of the code of ethics during the period covered by this report.
A copy of the registrant’s Code of Ethics is filed herewith.
Item 3. Audit Committee Financial Expert.
The registrant’s board of trustees has determined that there is at least one audit committee financial expert serving on its audit committee. Leonard M. Rush is the “audit committee financial expert” and is considered to be “independent” as each term is defined in Item 3 of Form N-CSR.
Item 4. Principal Accountant Fees and Services.
The registrant has engaged its principal accountant to perform audit services, audit-related services, tax services and other services during the past two fiscal years. “Audit services” refer to performing an audit of the registrant’s annual financial statements or services that are normally provided by the accountant in connection with statutory and regulatory filings or engagements for those fiscal years. “Audit-related services” refer to the assurance and related services by the principal accountant that are reasonably related to the performance of the audit. “Tax services” refer to professional services rendered by the principal accountant for tax compliance, tax advice, and tax planning. There were no “Other Services” provided by the principal accountant. The following table details the aggregate fees billed or expected to be billed for each of the last two fiscal years for audit fees, audit-related fees, tax fees and other fees by the principal accountant.
| | FYE 6/30/2024 | FYE 6/30/2023 |
| (a) Audit Fees | $34,250 | $32,500 |
| (b) Audit-Related Fees | $0 | $0 |
| (c) Tax Fees | $10,000 | $9,500 |
| (d) All Other Fees | $0 | $0 |
(e)(1) The audit committee has adopted pre-approval policies and procedures that require the audit committee to pre-approve all audit and non-audit services of the registrant, including services provided to any entity affiliated with the registrant.
(e)(2) The percentage of fees billed by Cohen & Company applicable to non-audit services pursuant to waiver of pre-approval requirement were as follows:
| | FYE 6/30/2024 | FYE 6/30/2023 |
| Audit-Related Fees | 0% | 0% |
| Tax Fees | 0% | 0% |
| All Other Fees | 0% | 0% |
(f) Not applicable
(g) The following table indicates the non-audit fees billed or expected to be billed by the registrant’s accountant for services to the registrant and to the registrant’s investment adviser (and any other controlling entity, etc.—not sub-adviser) for the last two years.
| Non-Audit Related Fees | FYE 6/30/2024 | FYE 6/30/2023 |
| Registrant | $0 | $0 |
| Registrant’s Investment Adviser | $0 | $0 |
(h) The audit committee of the board of trustees/directors has considered whether the provision of non-audit services that were rendered to the registrant’s investment adviser is compatible with maintaining the principal accountant’s independence and has concluded that the provision of such non-audit services by the accountant has not compromised the accountant’s independence.
(i) Not applicable
(j) Not applicable
Item 5. Audit Committee of Listed Registrants.
Not applicable
Item 6. Investments.
| (a) | Schedule of Investments is included within the financial statements filed under Item 7 of this Form. |
| | |
Item 7. Financial Statements and Financial Highlights for Open-End Investment Companies.
THE OLSTEIN ALL CAP VALUE FUND
THE OLSTEIN STRATEGIC OPPORTUNITIES FUND
Core Financial Statements
June 30, 2024
TABLE OF CONTENTS
| | | | |
Schedules of Investments
| | | |
| | | |
| | | |
| | | |
| | | |
| | | |
Financial Highlights
| | | |
| | | |
| | | |
| | | |
| | | |
| | | |
| | | |
| | | | |
TABLE OF CONTENTS
The Olstein All Cap Value Fund
Schedule of Investments
as of June 30, 2024
| | | | | | | |
COMMON STOCKS - 91.0%
| | | | | | |
Advertising Agencies - 1.5%
| | | | | | |
Omnicom Group, Inc. | | | 87,488 | | | $7,847,674 |
Aerospace & Defense - 3.2%
| | | | | | |
General Dynamics Corporation | | | 11,000 | | | 3,191,540 |
L3Harris Technologies, Inc. | | | 31,000 | | | 6,961,980 |
RTX Corporation | | | 70,000 | | | 7,027,300 |
| | | | | | 17,180,820 |
Air Delivery & Freight Services - 3.3%
| | | |
FedEx Corporation | | | 27,500 | | | 8,245,600 |
United Parcel Service, Inc. - Class B | | | 68,000 | | | 9,305,800 |
| | | | | | 17,551,400 |
Airlines - 2.2%
| | | | | | |
Delta Air Lines, Inc. | | | 132,000 | | | 6,262,080 |
Southwest Airlines Company | | | 193,000 | | | 5,521,730 |
| | | | | | 11,783,810 |
Auto Components - 1.1%
| | | | | | |
Aptiv PLC(a) | | | 82,000 | | | 5,774,440 |
Auto Manufacturers - 1.2%
| | | | | | |
General Motors Company | | | 141,000 | | | 6,550,860 |
Automobiles - 0.4%
| | | | | | |
Winnebago Industries, Inc.(b) | | | 39,500 | | | 2,140,900 |
Building Products - 0.5%
| | | | | | |
Carrier Global Corporation | | | 46,000 | | | 2,901,680 |
Capital Markets - 1.0%
| | | | | | |
Goldman Sachs Group, Inc. | | | 12,000 | | | 5,427,840 |
Chemicals - 4.1%
| | | | | | |
Corteva, Inc. | | | 159,000 | | | 8,576,460 |
Eastman Chemical Company | | | 48,000 | | | 4,702,560 |
International Flavors & Fragrances, Inc. | | | 88,000 | | | 8,378,480 |
| | | | | | 21,657,500 |
Commercial Banks - 6.0%
| | | | | | |
Citizens Financial Group, Inc. | | | 228,717 | | | 8,240,673 |
Fifth Third Bancorp | | | 216,000 | | | 7,881,840 |
U.S. Bancorp | | | 215,660 | | | 8,561,702 |
Wells Fargo & Company | | | 121,000 | | | 7,186,190 |
| | | | | | 31,870,405 |
Commercial Services - 1.1%
| | | | | | |
Moody’s Corporation | | | 6,500 | | | 2,736,045 |
S&P Global, Inc. | | | 6,500 | | | 2,899,000 |
| | | | | | 5,635,045 |
Commercial Services & Supplies - 3.1%
| | | |
ABM Industries, Inc. | | | 225,953 | | | 11,426,443 |
Korn Ferry | | | 76,000 | | | 5,102,640 |
| | | | | | 16,529,083 |
| | | | | | | |
| | | | | | | |
Communications Equipment - 1.6%
| | | | | | |
Cisco Systems, Inc. | | | 176,000 | | | $8,361,760 |
Computers - 0.6%
| | | | | | |
Apple, Inc. | | | 14,500 | | | 3,053,990 |
Consumer Finance - 2.1%
| | | | | | |
American Express Company | | | 15,000 | | | 3,473,250 |
Equifax, Inc.(b) | | | 10,000 | | | 2,424,600 |
MasterCard, Inc. - Class A | | | 5,093 | | | 2,246,828 |
Visa, Inc. - Class A(b) | | | 10,500 | | | 2,755,935 |
| | | | | | 10,900,613 |
Consumer Staples Distribution & Retail - 1.3%
| | | |
Target Corporation | | | 46,000 | | | 6,809,840 |
Distributors - 1.6%
| | | | | | |
LKQ Corporation | | | 202,000 | | | 8,401,180 |
Diversified Financial Services - 2.0%
| | | | | | |
Berkshire Hathaway, Inc. - Class B(a) | | | 13,500 | | | 5,491,800 |
Invesco Ltd. | | | 358,996 | | | 5,370,580 |
| | | | | | 10,862,380 |
E-Commerce - 1.0%
| | | | | | |
eBay, Inc.(b) | | | 102,000 | | | 5,479,440 |
Electronic Equipment, Instruments & Components - 1.1%
| | | | | | |
Vontier Corporation | | | 157,400 | | | 6,012,680 |
Electronics - 1.8%
| | | | | | |
Sensata Technologies Holding PLC | | | 253,600 | | | 9,482,104 |
Energy Equipment & Services - 1.5%
| | | | | | |
Schlumberger Ltd. | | | 166,000 | | | 7,831,880 |
Entertainment - 0.5%
| | | | | | |
Warner Bros Discovery, Inc.(a)(b) | | | 365,000 | | | 2,715,600 |
Financial Services - 0.4%
| | | | | | |
Fiserv, Inc.(a) | | | 13,000 | | | 1,937,520 |
Food & Drug Retailers - 1.7%
| | | | | | |
CVS Health Corporation | | | 155,000 | | | 9,154,300 |
Health Care Equipment & Supplies - 6.7%
| | | |
Baxter International, Inc. | | | 273,000 | | | 9,131,850 |
Becton, Dickinson and Company | | | 30,000 | | | 7,011,300 |
Hologic, Inc.(a) | | | 92,000 | | | 6,831,000 |
Medtronic PLC | | | 73,000 | | | 5,745,830 |
Zimmer Biomet Holdings, Inc. | | | 63,000 | | | 6,837,390 |
| | | | | | 35,557,370 |
Health Care Providers & Services - 4.7%
| | | |
Henry Schein, Inc.(a) | | | 86,000 | | | 5,512,600 |
Quest Diagnostics Inc. | | | 67,000 | | | 9,170,960 |
UnitedHealth Group, Inc. | | | 16,500 | | | 8,402,790 |
| | | | | | | |
The accompanying notes are an integral part of these financial statements.
TABLE OF CONTENTS
The Olstein All Cap Value Fund
Schedule of Investments
as of June 30, 2024(Continued)
| | | | | | | |
COMMON STOCKS - (Continued)
|
Health Care Providers & Services - (Continued)
|
Universal Health Services, Inc. - Class B | | | 10,000 | | | $1,849,300 |
| | | | | | 24,935,650 |
Hotels, Restaurants & Leisure - 0.8%
| | | | | | |
Denny’s Corporation(a) | | | 563,400 | | | 4,000,140 |
Household Durables - 1.3%
| | | | | | |
Mohawk Industries, Inc.(a) | | | 59,250 | | | 6,730,207 |
Household Products - 2.3%
| | | | | | |
Kimberly-Clark Corporation | | | 48,000 | | | 6,633,600 |
Reynolds Consumer Products, Inc. | | | 206,750 | | | 5,784,865 |
| | | | | | 12,418,465 |
Industrial Equipment Wholesale - 1.0%
| | | |
WESCO International, Inc. | | | 34,850 | | | 5,524,422 |
Insurance - 2.5%
| | | | | | |
Travelers Companies, Inc. | | | 31,000 | | | 6,303,540 |
Willis Towers Watson PLC | | | 26,500 | | | 6,946,710 |
| | | | | | 13,250,250 |
Interactive Media & Services - 0.6%
| | | | | | |
Meta Platforms, Inc. - Class A | | | 6,000 | | | 3,025,320 |
Internet Software & Services - 1.0%
| | | | | | |
Alphabet, Inc. - Class C | | | 30,000 | | | 5,502,600 |
IT Services - 3.1%
| | | | | | |
Fidelity National Information Services, Inc. | | | 99,000 | | | 7,460,640 |
SS&C Technologies Holdings, Inc. | | | 141,000 | | | 8,836,470 |
| | | | | | 16,297,110 |
Machinery - 6.8%
| | | | | | |
Cummins, Inc. | | | 25,000 | | | 6,923,250 |
Deere & Company | | | 20,500 | | | 7,659,415 |
Dover Corporation | | | 28,000 | | | 5,052,600 |
Fortive Corporation | | | 50,059 | | | 3,709,372 |
Middleby Corporation(a) | | | 50,800 | | | 6,228,588 |
Stanley Black & Decker, Inc. | | | 85,000 | | | 6,790,650 |
| | | | | | 36,363,875 |
Materials - 0.5%
| | | | | | |
Axalta Coating Systems Ltd.(a) | | | 76,000 | | | 2,596,920 |
Media - 2.9%
| | | | | | |
Comcast Corporation - Class A | | | 90,000 | | | 3,524,400 |
Walt Disney Company | | | 119,000 | | | 11,815,510 |
| | | | | | 15,339,910 |
Pharmaceuticals - 2.8%
| | | | | | |
Avantor, Inc.(a) | | | 291,184 | | | 6,173,101 |
Johnson & Johnson | | | 61,000 | | | 8,915,760 |
| | | | | | 15,088,861 |
| | | | | | | |
| | | | | | | |
Real Estate Management & Development - 2.7%
| | | |
CBRE Group, Inc. - Class A(a) | | | 86,000 | | | $7,663,460 |
Jones Lang LaSalle, Inc.(a) | | | 33,756 | | | 6,929,432 |
| | | | | | 14,592,892 |
Restaurants - 1.1%
| | | | | | |
Dine Brands Global, Inc.(b) | | | 159,600 | | | 5,777,520 |
Semiconductors & Semiconductor Equipment - 2.2%
| | | | | | |
Kulicke and Soffa Industries, Inc.(b) | | | 154,000 | | | 7,575,260 |
Texas Instruments, Inc. | | | 21,500 | | | 4,182,395 |
| | | | | | 11,757,655 |
Software - 0.6%
| | | | | | |
Microsoft Corporation | | | 7,000 | | | 3,128,650 |
Telecommunications - 1.5%
| | | | | | |
Corning, Inc. | | | 212,000 | | | 8,236,200 |
TOTAL COMMON STOCKS
(Cost $415,912,378) | | | | | | 483,978,761 |
SHORT-TERM INVESTMENTS - 11.0%
|
Investments Purchased with Proceeds from Securities Lending - 2.5%
| | | | | | |
Mount Vernon Liquid Assets Portfolio, LLC, 5.46% (c) | | | 12,970,728 | | | 12,970,728 |
Money Market Funds - 8.5%
| | | | | | |
First American Government Obligations Fund - Class X, 5.23%(c) | | | 45,364,781 | | | 45,364,781 |
TOTAL SHORT-TERM INVESTMENTS
(Cost $58,335,509) | | | | | | 58,335,509 |
TOTAL INVESTMENTS - 102.0% (Cost $474,247,887) | | | | | | $542,314,270 |
U.S. Bank Money Market Deposit Account - 0.4%(d) | | | | | | 2,387,620 |
Liabilities in Excess of
Other Assets - (2.4)% | | | | | | (12,820,929) |
TOTAL NET ASSETS - 100.0% | | | | | | $531,880,961 |
| | | | | | | |
Percentages are stated as a percent of net assets.
PLC - Public Limited Company
(a)
| Non-income producing security. |
(b)
| All or a portion of this security is on loan as of June 30, 2024. The total fair value of these securities was $12,891,468, which represented 2.4% of net assets. |
(c)
| The rate shown represents the 7-day effective yield as of June 30, 2024. |
(d)
| The U.S. Bank Money Market Deposit Account (the “MMDA”) is a short-term vehicle in which the Fund holds cash balances. The MMDA will bear interest at a variable rate that is determined based on market conditions and is subject to change daily. The rate as of June 30, 2024 was 5.17%. |
The accompanying notes are an integral part of these financial statements.
TABLE OF CONTENTS
The Olstein Strategic Opportunities Fund
Schedule of Investments
as of June 30, 2024
| | | | | | | |
COMMON STOCKS - 96.1%
| | | | | | |
Auto Components - 2.2%
| | | | | | |
Miller Industries, Inc. | | | 33,000 | | | $1,815,660 |
Auto Manufacturers - 3.1%
| | | | | | |
Blue Bird Corporation(a) | | | 47,000 | | | 2,530,950 |
Automobiles - 1.2%
| | | | | | |
Winnebago Industries, Inc.(b) | | | 17,500 | | | 948,500 |
Banks - 2.6%
| | | | | | |
First Hawaiian, Inc. | | | 100,000 | | | 2,076,000 |
Commercial Banks - 7.8%
| | | | | | |
Citizens Financial Group, Inc. | | | 71,283 | | | 2,568,326 |
Home BancShares, Inc. | | | 86,000 | | | 2,060,560 |
Prosperity Bancshares, Inc. | | | 28,000 | | | 1,711,920 |
| | | | | | 6,340,806 |
Commercial Services & Supplies - 8.6%
|
ABM Industries, Inc. | | | 64,000 | | | 3,236,480 |
Brady Corporation - Class A | | | 30,000 | | | 1,980,600 |
Korn Ferry | | | 26,000 | | | 1,745,640 |
| | | | | | 6,962,720 |
Diversified Financial Services - 2.9%
| | | |
Invesco Ltd. | | | 155,950 | | | 2,333,012 |
Electronic Equipment, Instruments &
Components - 5.0%
| | | |
Vishay Intertechnology, Inc.(b) | | | 104,000 | | | 2,319,200 |
Vontier Corporation | | | 46,600 | | | 1,780,120 |
| | | | | | 4,099,320 |
Electronics - 4.1%
| | | | | | |
Sensata Technologies Holding PLC | | | 88,400 | | | 3,305,276 |
Health Care Equipment & Supplies - 1.9%
| | | |
Zimmer Biomet Holdings, Inc. | | | 14,400 | | | 1,562,832 |
Health Care Products - 4.0%
| | | | | | |
Integra LifeSciences Holdings Corporation(a)(b) | | | 113,000 | | | 3,292,820 |
Hotels, Restaurants & Leisure - 2.9%
| | | |
Denny's Corporation(a) | | | 333,000 | | | 2,364,300 |
Household Durables - 6.4%
| | | | | | |
Central Garden & Pet Company - Class A(a) | | | 79,000 | | | 2,609,370 |
Mohawk Industries, Inc.(a) | | | 22,750 | | | 2,584,173 |
| | | | | | 5,193,543 |
Household Products - 2.2%
| | | | | | |
Reynolds Consumer Products, Inc. | | | 65,250 | | | 1,825,695 |
| | | | | | | |
| | | | | | | |
Industrial Equipment Wholesale - 2.6%
| | | |
WESCO International, Inc. | | | 13,150 | | | $2,084,538 |
Leisure Products - 2.8%
| | | | | | |
Johnson Outdoors, Inc. - Class A(b) | | | 66,000 | | | 2,308,680 |
Machinery - 15.9%
| | | | | | |
AGCO Corporation | | | 6,000 | | | 587,280 |
Douglas Dynamics, Inc. | | | 72,000 | | | 1,684,800 |
Gates Industrial Corporation PLC(a) | | | 201,000 | | | 3,177,810 |
Graham Corporation(a) | | | 37,752 | | | 1,063,097 |
Middleby Corporation(a) | | | 15,700 | | | 1,924,977 |
Shyft Group, Inc. | | | 282,741 | | | 3,353,308 |
Timken Company | | | 14,500 | | | 1,161,885 |
| | | | | | 12,953,157 |
Materials - 1.1%
| | | | | | |
Axalta Coating Systems Ltd.(a) | | | 27,000 | | | 922,590 |
Pharmaceuticals - 4.1%
| | | | | | |
Prestige Consumer Healthcare, Inc.(a) | | | 49,000 | | | 3,373,650 |
Professional Services - 1.4%
| | | | | | |
First Advantage Corporation(b) | | | 73,000 | | | 1,173,110 |
Real Estate Management & Development - 5.6%
| | | |
Cushman & Wakefield PLC(a) | | | 233,000 | | | 2,423,200 |
Jones Lang LaSalle, Inc.(a) | | | 10,244 | | | 2,102,888 |
| | | | | | 4,526,088 |
Restaurants - 3.7%
| | | | | | |
Dine Brands Global, Inc.(b) | | | 82,000 | | | 2,968,400 |
Semiconductors & Semiconductor
Equipment - 2.8%
| | | |
Kulicke and Soffa Industries, Inc.(b) | | | 47,000 | | | 2,311,930 |
Transportation Equipment - 1.2%
| | | | | | |
Wabash National Corporation(b) | | | 43,000 | | | 939,120 |
TOTAL COMMON STOCKS
(Cost $72,479,405) | | | | | | 78,212,697 |
| | | | | | | |
| | | | | | | |
SHORT-TERM INVESTMENTS - 13.1%
|
Investments Purchased with Proceeds from Securities Lending - 9.3%
| | | | | | |
Mount Vernon Liquid Assets Portfolio, LLC, 5.46%(c) | | | 7,579,362 | | | 7,579,362 |
| | | | | | | |
The accompanying notes are an integral part of these financial statements.
TABLE OF CONTENTS
The Olstein Strategic Opportunities Fund
Schedule of Investments
as of June 30, 2024(Continued)
| | | | | | | |
Money Market Funds - 3.8%
| | | | | | |
First American Government Obligations Fund - Class X, 5.23%(c) | | | 3,109,661 | | | $3,109,661 |
TOTAL SHORT-TERM INVESTMENTS
(Cost $10,689,023) | | | | | | 10,689,023 |
TOTAL INVESTMENTS - 109.2% (Cost $83,168,428) | | | | | | $88,901,720 |
U.S. Bank Money Market Deposit Account - 0.2%(d) | | | | | | 163,666 |
Liabilities in Excess of
Other Assets - (9.4)% | | | | | | (7,639,698) |
TOTAL NET ASSETS - 100.0% | | | | | | $81,425,688 |
| | | | | | | |
Percentages are stated as a percent of net assets.
PLC - Public Limited Company
(a)
| Non-income producing security. |
(b)
| All or a portion of this security is on loan as of June 30, 2024. The total fair value of these securities was $7,494,573, which represented 9.2% of net assets. |
(c)
| The rate shown represents the 7-day effective yield as of June 30, 2024. |
(d)
| The U.S. Bank Money Market Deposit Account (the “MMDA”) is a short-term vehicle in which the Fund holds cash balances. The MMDA will bear interest at a variable rate that is determined based on market conditions and is subject to change daily. The rate as of June 30, 2024 was 5.17%. |
The accompanying notes are an integral part of these financial statements.
TABLE OF CONTENTS
Statements of Assets and Liabilities
as of June 30, 2024
| | | | | | | |
Assets:
| | | | | | |
Investments, at value(1) (at cost $474,247,887 and $83,168,428 respectively) | | | $542,314,270 | | | $88,901,720 |
Cash Equivalent | | | 2,387,620 | | | 163,666 |
Receivable for capital shares sold | | | 12,350 | | | 11,036 |
Dividends and interest receivable | | | 1,018,062 | | | 84,946 |
Securities lending income receivable | | | 1,963 | | | 746 |
Prepaid expenses | | | 23,669 | | | 17,297 |
Total assets | | | 545,757,934 | | | 89,179,411 |
|
Liabilities:
| | | | | | |
Payable upon return of securities loaned | | | 12,970,728 | | | 7,579,362 |
Payable to investment adviser | | | 438,764 | | | 50,359 |
Payable for capital shares redeemed | | | 149,768 | | | 2,377 |
Payable for transfer agent fees & expenses | | | 94,917 | | | 36,477 |
Accrued distribution fees | | | 77,400 | | | 8,872 |
Payable for fund administration & accounting fees | | | 73,067 | | | 32,132 |
Payable for audit fees | | | 22,000 | | | 22,248 |
Payable for custody fees | | | 6,158 | | | 962 |
Payable for trustee fees | | | 5,315 | | | 5,384 |
Payable for compliance fees | | | 3,124 | | | 3,124 |
Accrued expenses | | | 35,732 | | | 12,426 |
Total liabilities | | | 13,876,973 | | | 7,753,723 |
Net Assets | | | $531,880,961 | | | $81,425,688 |
Net Assets Consist of:
| | | | | | |
Paid-in capital | | | $436,966,838 | | | $73,450,595 |
Total distributable earnings | | | 94,914,123 | | | 7,975,093 |
Total net assets | | | $531,880,961 | | | $81,425,688 |
| | | | | | | |
(1)
| Includes securities on loan with a fair value of $12,891,468 and $7,494,573, respectively. Total Securities include both those sold and pending settlement. |
| | | | | | | |
Class A:
| | | | | | |
Net assets | | | $274,620,475 | | | $25,071,306 |
Shares of beneficial interest outstanding(1) | | | 10,203,091 | | | 1,170,551 |
Net asset value, offering price and redemption price per share | | | $26.92 | | | $21.42 |
Maximum offering price per share(2) | | | $28.48 | | | $22.66 |
|
Class C:
| | | | | | |
Net assets | | | $24,667,655 | | | $4,313,137 |
Shares of beneficial interest outstanding(1) | | | 1,303,484 | | | 237,024 |
Net asset value, offering price and redemption price per share(3) | | | $18.92 | | | $18.20 |
| | | | | | | |
The accompanying notes are an integral part of these financial statements.
TABLE OF CONTENTS
Statements of Assets and Liabilities
as of June 30, 2024(Continued)
| | | | | | | |
|
Adviser Class:
| | | | | | |
Net assets | | | $232,592,831 | | | $52,041,245 |
Shares of beneficial interest outstanding(1) | | | 8,535,557 | | | 2,378,988 |
Net asset value, offering price and redemption price per share | | | $27.25 | | | $21.88 |
| | | | | | | |
(1)
| Unlimited number of shares authorized without par value. |
(2)
| The offering price is calculated by dividing the net asset value by 1 minus the maximum sales charge of 5.50%. |
(3)
| May be subject to a contingent deferred sales charge of 1.00% on certain shares redeemed within 12 months of purchase on Class C shares. |
The accompanying notes are an integral part of these financial statements.
TABLE OF CONTENTS
Statements of Operations
For the Year Ended June 30, 2024
| | | | | | | |
Investment Income:
| | | | | | |
Dividend income | | | $10,844,519 | | | $1,357,865 |
Interest income | | | 2,419,372 | | | 215,013 |
Securities lending income, net | | | 105,167 | | | 20,127 |
Total investment income | | | 13,369,058 | | | 1,593,005 |
Expenses:
| | | | | | |
Investment advisory fees (See Note 4) | | | 5,572,937 | | | 836,561 |
Transfer agent fees & expenses (See Note 4) | | | 388,233 | | | 144,681 |
Fund administration & accounting fees (See Note 4) | | | 305,874 | | | 139,532 |
Federal & state registration fees | | | 49,759 | | | 45,295 |
Custody fees (See Note 4) | | | 37,712 | | | 5,781 |
Postage & printing fees | | | 29,595 | | | 9,497 |
Insurance fees | | | 23,652 | | | 7,020 |
Trustee fees | | | 22,827 | | | 22,411 |
Audit fees | | | 22,000 | | | 20,749 |
Legal fees | | | 18,240 | | | 18,239 |
Compliance fees (See Note 4) | | | 12,499 | | | 12,499 |
Other expenses | | | 32,611 | | | 9,615 |
Distribution fees (See Note 5)
| | | | | | |
Class A | | | 708,184 | | | 66,905 |
Class C | | | 282,329 | | | 53,304 |
Total expenses | | | 7,506,452 | | | 1,392,089 |
Less: waiver from Investment adviser (See Note 4) | | | — | | | (142,516) |
Net expenses | | | 7,506,452 | | | 1,249,573 |
Net investment income | | | 5,862,606 | | | 343,432 |
Realized and Unrealized Gain (Loss) on Investments:
| | | | | | |
Net realized gain (loss) on investments | | | 30,885,448 | | | 3,376,326 |
Net change in unrealized appreciation/depreciation on investments | | | (4,480,530) | | | (814,182) |
Net realized and unrealized gain on investments | | | 26,404,918 | | | 2,562,144 |
Net increase in net assets resulting from operations | | | $32,267,524 | | | $2,905,576 |
| | | | | | | |
The accompanying notes are an integral part of these financial statements.
TABLE OF CONTENTS
Statements of Changes in Net Assets
| | | | |
Operations:
| | | | | | |
Net Investment Income | | | $ 5,862,606 | | | $ 4,577,322 |
Net realized gain (loss) on investments | | | 30,885,448 | | | (2,820,620) |
Change in unrealized appreciation/depreciation on investments | | | (4,480,530) | | | 51,180,211 |
Net increase in net assets resulting from operations | | | 32,267,524 | | | 52,936,913 |
Capital Share Transactions:
| | | | | | |
Class A:
| | | | | | |
Proceeds from shares sold | | | 6,523,907 | | | 12,984,558 |
Proceeds from reinvestment of distributions | | | 2,059,336 | | | 16,771,484 |
Payments for shares redeemed | | | (46,950,098) | | | (30,839,416) |
Decrease in net assets resulting from Class A transactions | | | (38,366,855) | | | (1,083,374) |
Class C:
| | | | | | |
Proceeds from shares sold | | | 507,250 | | | 950,647 |
Proceeds from reinvestment of distributions | | | 34,763 | | | 3,419,312 |
Payments for shares redeemed | | | (11,401,219) | | | (9,808,254) |
Decrease in net assets resulting from Class C transactions | | | (10,859,206) | | | (5,438,295) |
Adviser Class:
| | | | | | |
Proceeds from shares sold | | | 4,972,908 | | | 10,858,591 |
Proceeds from reinvestment of distributions | | | 3,032,624 | | | 17,140,789 |
Payments for shares redeemed | | | (55,432,965) | | | (27,440,426) |
Increase (Decrease) in net assets resulting from Adviser Class transactions | | | (47,427,433) | | | 558,954 |
Net decrease in net assets from capital share transactions | | | (96,653,494) | | | (5,962,715) |
Distributions to shareholders:
| | | | | | |
Class A | | | (2,488,300) | | | (20,211,840) |
Class C | | | (36,970) | | | (3,512,540) |
Adviser Class | | | (3,098,655) | | | (17,758,154) |
Total distributions to shareholders | | | (5,623,925) | | | (41,482,534) |
Total increase (decrease) in net assets: | | | (70,009,895) | | | 5,491,664 |
Net Assets:
| | | | | | |
Beginning of year | | | 601,890,856 | | | 596,399,192 |
End of year | | | $531,880,961 | | | $601,890,856 |
| | | | | | | |
The accompanying notes are an integral part of these financial statements.
TABLE OF CONTENTS
Statements of Changes in Net Assets
| | | | |
Operations:
| | | | | | |
Net Investment Income | | | $ 343,432 | | | $ 209,950 |
Net realized gain on investments | | | 3,376,326 | | | 1,797,633 |
Change in unrealized appreciation/depreciation on investments | | | (814,182) | | | 12,061,930 |
Net increase in net assets resulting from operations | | | 2,905,576 | | | 14,069,513 |
Capital Share Transactions:
| | | | | | |
Class A:
| | | | | | |
Proceeds from shares sold | | | 2,557,372 | | | 2,220,710 |
Proceeds from reinvestment of distributions | | | 20,890 | | | 374,368 |
Payments for shares redeemed | | | (6,821,562) | | | (3,899,689) |
Decrease in net assets resulting from Class A transactions | | | (4,243,300) | | | (1,304,611) |
Class C:
| | | | | | |
Proceeds from shares sold | | | 61,691 | | | 537,704 |
Proceeds from reinvestment of distributions | | | — | | | 138,233 |
Payments for shares redeemed | | | (2,561,966) | | | (2,321,297) |
Decrease in net assets resulting from Class C transactions | | | (2,500,275) | | | (1,645,360) |
Adviser Class:
| | | | | | |
Proceeds from shares sold | | | 6,929,078 | | | 5,506,962 |
Proceeds from reinvestment of distributions | | | 222,759 | | | 780,255 |
Payments for shares redeemed | | | (10,045,206) | | | (12,965,361) |
Decrease in net assets resulting from Adviser Class transactions | | | (2,893,369) | | | (6,678,144) |
Net decrease in net assets from capital share transactions | | | (9,636,944) | | | (9,628,115) |
Distributions to Shareholders:
| | | | | | |
Class A | | | (25,701) | | | (442,402) |
Class C | | | — | | | (144,158) |
Adviser Class | | | (232,788) | | | (834,065) |
Total distributions to shareholders | | | (258,489) | | | (1,420,625) |
Total increase (decrease) in net assets: | | | (6,989,857) | | | 3,020,773 |
Net Assets:
| | | | | | |
Beginning of year | | | 88,415,545 | | | 85,394,772 |
End of year | | | $81,425,688 | | | $88,415,545 |
| | | | | | | |
The accompanying notes are an integral part of these financial statements.
TABLE OF CONTENTS
Olstein All Cap Value Fund
Financial Highlights
Class A
| | | | |
Net Asset Value, Beginning of Year | | | $25.57 | | | $25.11 | | | $34.32 | | | $21.40 | | | $24.10 |
Investment Operations:
| | | | | | | | | | | | | | | |
Net Investment Income (loss)(1) | | | 0.25 | | | 0.18 | | | 0.01 | | | (0.01) | | | 0.17 |
Net realized and unrealized gain (loss) on investments | | | 1.32 | | | 2.04 | | | (4.77)(2) | | | 13.06 | | | (2.12) |
Total from Investment operations | | | 1.57 | | | 2.22 | | | (4.76) | | | 13.05 | | | (1.95) |
Less distributions from:
| | | | | | | | | | | | | | | |
Net Investment Income | | | (0.22) | | | — | | | — | | | (0.13) | | | (0.10) |
Net realized gains | | | — | | | (1.76) | | | (4.45) | | | — | | | (0.65) |
Total distributions | | | (0.22) | | | (1.76) | | | (4.45) | | | (0.13) | | | (0.75) |
Net Asset Value, End of Year | | | $26.92 | | | $25.57 | | | $25.11 | | | $34.32 | | | $21.40 |
Total return(3) | | | 6.23% | | | 9.30% | | | −15.99% | | | 61.15% | | | −8.54% |
Supplemental Data and Ratios
| | | | | | | | | | | | | | | |
Net assets, end of year (000’s omitted) | | | $274,620 | | | $298,532 | | | $ 293,747 | | | $ 142,863 | | | $ 93,359 |
Ratio of expenses to average net assets | | | 1.42% | | | 1.41% | | | 1.42% | | | 1.39% | | | 1.40% |
Ratio of net investment income (loss) to average net assets | | | 0.98% | | | 0.71% | | | 0.03% | | | (0.05)% | | | 0.75% |
Portfolio turnover | | | 27% | | | 32% | | | 43% | | | 42% | | | 48% |
| | | | | | | | | | | | | | | | |
(1)
| Per share amounts calculated using the average shares method. |
(2)
| Net realized and unrealized loss per share in this caption is a balancing amount necessary to reconcile changes in net asset value per share for the year, and may not reconcile with the aggregate gain on the Statement of Operations due to share transactions for the year.
|
(3)
| Total return does not reflect sales charges.
|
The accompanying notes are an integral part of these financial statements.
TABLE OF CONTENTS
Olstein All Cap Value Fund
Financial Highlights
Class C
| | | | |
Net Asset Value, Beginning of Year | | | $17.97 | | | $18.29 | | | $26.38 | | | $16.53 | | | $18.82 |
Investment Operations:
| | | | | | | | | | | | | | | |
Net Investment Income (loss)(1) | | | 0.04 | | | (0.01) | | | (0.18) | | | (0.17) | | | (0.00)(2) |
Net realized and unrealized gain (loss) on investments | | | 0.93 | | | 1.45(3) | | | (3.46) | | | 10.06 | | | (1.64) |
Total from Investment operations | | | 0.97 | | | 1.44 | | | (3.64) | | | 9.89 | | | (1.64) |
Less distributions from:
| | | | | | | | | | | | | | | |
Net Investment Income | | | (0.02) | | | — | | | — | | | (0.04) | | | — |
Net realized gains | | | — | | | (1.76) | | | (4.45) | | | — | | | (0.65) |
Total distributions | | | (0.02) | | | (1.76) | | | (4.45) | | | (0.04) | | | (0.65) |
Net Asset Value, End of Year | | | $18.92 | | | $17.97 | | | $18.29 | | | $26.38 | | | $16.53 |
Total return(4) | | | 5.43% | | | 8.46% | | | −16.62% | | | 59.89% | | | −9.21% |
SUPPLEMENTAL Data and Ratios
| | | | | | | | | | | | | | | |
Net assets, end of year (000’s omitted) | | | $24,668 | | | $34,328 | | | $40,368 | | | $289,103 | | | $248,420 |
Ratio of expenses to average net assets | | | 2.17% | | | 2.16% | | | 2.15% | | | 2.14% | | | 2.15% |
Ratio of net investment gain (loss) to average
net assets | | | 0.23% | | | (0.04)% | | | (0.70)% | | | (0.80)% | | | (0.00)%(5) |
Portfolio turnover | | | 27% | | | 32% | | | 43% | | | 42% | | | 48% |
| | | | | | | | | | | | | | | | |
(1)
| Per share amounts calculated using the average shares method. |
(2)
| Amount rounds to less than $0.01 per share. |
(3)
| Net realized and unrealized loss per share in this caption is a balancing amount necessary to reconcile changes in net asset value per share for the year, and may not reconcile with the aggregate gain on the Statement of Operations due to share transactions for the year. |
(4)
| Total return does not reflect sales charges. |
(5)
| Amount rounds to less than 0.01% per share. |
The accompanying notes are an integral part of these financial statements.
TABLE OF CONTENTS
Olstein All Cap Value Fund
Financial Highlights
Adviser Class
| | | | |
Net Asset Value, Beginning of Year | | | $25.92 | | | $25.37 | | | $34.54 | | | $21.51 | | | $24.15 |
Investment Operations:
| | | | | | | | | | | | | | | |
Net Investment Income(1) | | | 0.32 | | | 0.24 | | | 0.09 | | | 0.06 | | | 0.23 |
Net realized and unrealized gain (loss) on investments | | | 1.33 | | | 2.07 | | | (4.81)(2) | | | 13.13(2) | | | (2.13) |
Total from Investment operations | | | 1.65 | | | 2.31 | | | (4.72) | | | 13.19 | | | (1.90) |
Less distributions from:
| | | | | | | | | | | | | | | |
Net Investment Income | | | (0.32) | | | — | | | — | | | (0.16) | | | (0.09) |
Net realized gains | | | — | | | (1.76) | | | (4.45) | | | — | | | (0.65) |
Total distributions | | | (0.32) | | | (1.76) | | | (4.45) | | | (0.16) | | | (0.74) |
Net Asset Value, End of Year | | | $27.25 | | | $25.92 | | | $25.37 | | | $34.54 | | | $21.51 |
Total return | | | 6.48% | | | 9.57% | | | −15.76% | | | 61.49% | | | −8.27% |
SUPPLEMENTAL Data and Ratios
| | | | | | | | | | | | | | | |
Net assets, end of year (000’s omitted) | | | $232,593 | | | $269,031 | | | $262,284 | | | $322,350 | | | $166,492 |
Ratio of expenses to average net assets | | | 1.17% | | | 1.16% | | | 1.16% | | | 1.14% | | | 1.15% |
Ratio of net investment income to average
net assets | | | 1.23% | | | 0.96% | | | 0.29% | | | 0.20% | | | 1.00% |
Portfolio turnover | | | 27% | | | 32% | | | 43% | | | 42% | | | 48% |
| | | | | | | | | | | | | | | | |
(1)
| Per share amounts calculated using the average shares method. |
(2)
| Net realized and unrealized gain (loss) per share in this caption is a balancing amount necessary to reconcile changes in net asset value per share for the year, and may not reconcile with the aggregate gain on the Statement of Operations due to share transactions for the year.
|
The accompanying notes are an integral part of these financial statements.
TABLE OF CONTENTS
Olstein Strategic Opportunities Fund
Financial Highlights
Class A
| | | | |
Net Asset Value, Beginning of Year | | | $20.70 | | | $17.97 | | | $27.47 | | | $15.19 | | | $17.24 |
Investment Operations:
| | | | | | | | | | | | | | | |
Net Investment Income (loss)(1) | | | 0.06 | | | 0.03 | | | (0.09) | | | (0.15) | | | (0.01) |
Net realized and unrealized gain (loss) on investments | | | 0.68 | | | 3.02 | | | (6.90) | | | 12.43 | | | (2.04) |
Total from Investment operations | | | 0.74 | | | 3.05 | | | (6.99) | | | 12.28 | | | (2.05) |
Less distributions from:
| | | | | | | | | | | | | | | |
Net Investment Income | | | (0.02) | | | — | | | — | | | — | | | — |
Net realized gains | | | — | | | (0.32) | | | (2.51) | | | — | | | — |
Total distributions | | | (0.02) | | | (0.32) | | | (2.51) | | | — | | | — |
Net Asset Value, End of Year
| | | $21.42 | | | $20.70 | | | $17.97 | | | $27.47 | | | $15.19 |
Total return(2) | | | 3.58% | | | 17.08% | | | −27.83% | | | 80.84% | | | −11.89% |
Supplemental Data and Ratios
| | | | | | | | | | | | | | | |
Net assets, end of year (000’s omitted) | | | $25,071 | | | $28,454 | | | $25,917 | | | $31,827 | | | $15,873 |
Ratio of expenses to average net assets:
| | | | | | | | | | | | | | | |
Before expense waiver/recoupment | | | 1.77% | | | 1.73% | | | 1.62% | | | 1.70% | | | 1.81% |
After expense waiver/recoupment | | | 1.60% | | | 1.60% | | | 1.60% | | | 1.60% | | | 1.60% |
Ratio of net investment income (loss) to average net assets:
| | | | | | | | | | | | | | | |
After expense waiver/recoupment | | | 0.30% | | | 0.15% | | | (0.39)% | | | (0.68)% | | | (0.07)% |
Portfolio turnover | | | 32% | | | 26% | | | 32% | | | 47% | | | 45% |
| | | | | | | | | | | | | | | | |
(1)
| Per share amounts calculated using the average shares method. |
(2)
| Total return does not reflect sales charges. |
The accompanying notes are an integral part of these financial statements.
TABLE OF CONTENTS
Olstein Strategic Opportunities Fund
Financial Highlights
Class C
| | | | |
Net Asset Value, Beginning of Year | | | $ 17.71 | | | $ 15.52 | | | $24.25 | | | $13.52 | | | $15.45 |
Investment Operations:
| | | | | | | | | | | | | | | |
Net Investment loss(1) | | | (0.08) | | | (0.10) | | | (0.24) | | | (0.28) | | | (0.12) |
Net realized and unrealized gain (loss) on investments | | | 0.57(2) | | | 2.61(2) | | | (5.98) | | | 11.01 | | | (1.81) |
Total from Investment operations | | | 0.49 | | | 2.51 | | | (6.22) | | | 10.73 | | | (1.93) |
Less distributions from:
| | | | | | | | | | | | | | | |
Net realized gains | | | — | | | (0.32) | | | (2.51) | | | — | | | — |
Total distributions | | | — | | | (0.32) | | | (2.51) | | | — | | | — |
Net Asset Value, End of Year | | | $ 18.20 | | | $ 17.71 | | | $15.52 | | | $24.25 | | | $13.52 |
Total return(3) | | | 2.77% | | | 16.29% | | | −28.38% | | | 79.36% | | | −12.49% |
Supplemental Data and Ratios
| | | | | | | | | | | | | | | |
Net assets, end of year (000’s omitted) | | | $4,313 | | | $6,695 | | | $7,341 | | | $16,515 | | | $11,135 |
Ratio of expenses to average net assets:
| | | | | | | | | | | | | | | |
Before expense waiver/recoupment | | | 2.52% | | | 2.48% | | | 2.35% | | | 2.46% | | | 2.55% |
After expense waiver/recoupment | | | 2.35% | | | 2.35% | | | 2.35% | | | 2.35% | | | 2.35% |
Ratio of net investment loss to average net assets:
| | | | | | | | | | | | | | | |
After expense waiver/recoupment | | | (0.44)% | | | (0.60)% | | | (1.14)% | | | (1.43)% | | | (0.82)% |
Portfolio turnover | | | 32% | | | 26% | | | 32% | | | 47% | | | 45% |
| | | | | | | | | | | | | | | | |
(1)
| Per share amounts calculated using the average shares method.
|
(2)
| Net realized and unrealized gain per share in this caption is a balancing amount necessary to reconcile changes in net asset value per share for the year, and may not reconcile with the aggregate gain on the Statement of Operations due to share transactions for the year.
|
(3)
| Total return does not reflect sales charges. |
The accompanying notes are an integral part of these financial statements.
TABLE OF CONTENTS
Olstein Strategic Opportunities Fund
Financial Highlights
Adviser Class
| | | | |
Net Asset Value, Beginning of Year | | | $21.17 | | | $18.32 | | | $27.89 | | | $15.39 | | | $17.42 |
Investment Operations:
| | | | | | | | | | | | | | | |
Net Investment Income (loss)(1) | | | 0.12 | | | 0.08 | | | (0.03) | | | (0.10) | | | 0.03 |
Net realized and unrealized gain (loss) on investments | | | 0.69 | | | 3.09 | | | (7.03) | | | 12.60 | | | (2.06) |
Total from Investment operations | | | 0.81 | | | 3.17 | | | (7.06) | | | 12.50 | | | (2.03) |
Less distributions from:
| | | | | | | | | | | | | | | |
Net Investment Income | | | (0.10) | | | — | | | — | | | — | | | — |
Net realized gains | | | — | | | (0.32) | | | (2.51) | | | — | | | — |
Total distributions | | | (0.10) | | | (0.32) | | | (2.51) | | | — | | | — |
Net Asset Value, End of Year | | | $21.88 | | | $21.17 | | | $18.32 | | | $27.89 | | | $15.39 |
Total return | | | 3.85% | | | 17.41% | | | −27.65% | | | 81.22% | | | −11.65% |
Supplemental Data and Ratios
| | | | | | | | | | | | | | | |
Net assets, end of year (000’s omitted) | | | $52,041 | | | $53,267 | | | $52,137 | | | $92,191 | | | $29,211 |
Ratio of expenses to average net assets:
| | | | | | | | | | | | | | | |
Before expense waiver/recoupment | | | 1.52% | | | 1.48% | | | 1.36% | | | 1.43% | | | 1.55% |
After expense waiver/recoupment | | | 1.35% | | | 1.35% | | | 1.35% | | | 1.35% | | | 1.35% |
Ratio of net investment income (loss) to average net assets:
| | | | | | | | | | | | | | | |
After expense waiver/recoupment | | | 0.55% | | | 0.40% | | | (0.14)% | | | (0.43)% | | | 0.18% |
Portfolio turnover | | | 32% | | | 26% | | | 32% | | | 47% | | | 45% |
| | | | | | | | | | | | | | | | |
(1)
| Per share amounts calculated using the average shares method. |
The accompanying notes are an integral part of these financial statements.
TABLE OF CONTENTS
THE OLSTEIN FUNDS
NOTES TO THE FINANCIAL STATEMENTS
June 30, 2024
1. ORGANIZATION
Managed Portfolio Series (the “Trust”) was organized as a Delaware statutory trust on January 27, 2011. The Trust is registered under the Investment Company Act of 1940, as amended (the “1940 Act”), as an open-end management investment company. The Olstein All Cap Value Fund (“All Cap Value Fund”) and Olstein Strategic Opportunities Fund (“Strategic Fund”) (each a “Fund” and collectively, the “Funds”) are each a diversified series with their own investment objectives and policies within the Trust. The investment objective of each Fund is long-term capital appreciation with a secondary objective of income. The Funds are investment companies and accordingly follow the investment company accounting and reporting guidance of the Financial Accounting Standards Board (“FASB”) Accounting Standards Codification Topic 946, Financial Services – Investment Companies. Each Fund offers three different share classes – Adviser Class, Class A, and Class C. The All Cap Value Fund commenced operations on September 21, 1995. The Class C shares commenced operations on September 21, 1995, the Adviser Class shares commenced operations on September 1, 1999, and the Class A shares commenced operations on September 17, 2018. The Strategic Fund commenced operations on November 1, 2006. The Class A shares and Class C shares each commenced operations on November 1, 2006 and the Adviser Class shares commenced operations on May 11, 2015. Each class of shares has identical rights and privileges except with respect to distribution fees and voting rights on matters affecting a single share class. Class A shares are subject to a front-end sales charge of up to 5.50% and a 0.25% Rule 12b-1 distribution and servicing fee. Class C shares may be subject to a deferred sales charge of up to 1.00% and are subject to a 1.00% Rule 12b-1 distribution and servicing fee. The Funds may issue an unlimited number of shares of beneficial interest without par value.
2. SIGNIFICANT ACCOUNTING POLICIES
The following is a summary of significant accounting policies consistently followed by the Funds in preparation of their financial statements. These policies are in conformity with generally accepted accounting principles in the United States of America (“GAAP”).
Security Valuation – All investments in securities are recorded at their estimated fair value, as described in Note 3.
Federal Income Taxes – The Funds comply with the requirements of subchapter M of the Internal Revenue Code of 1986, as amended, necessary to qualify as regulated investment companies and distribute substantially all net taxable investment income and net realized gains to shareholders in a manner which results in no tax cost to the Funds. Therefore, no federal income or excise tax provision is required. As of and during the year ended June 30, 2024, the Funds did not have any tax positions that did not meet the “more-likely-than-not” threshold of being sustained by the applicable tax authority. As of and during the year ended June 30, 2024, the Funds did not have liabilities for any unrecognized tax benefits. The Funds recognize interest and penalties, if any, related to unrecognized tax benefits on uncertain tax positions as income tax expense in the Statement of Operations. As of and during the year ended June 30, 2024, the Funds did not incur any interest or penalties. The Funds are not subject to examination by U.S. tax authorities for tax years prior to the fiscal year ended June 30, 2021.
Security Transactions, Income and Distributions – The Funds follow industry practice and record security transactions on the trade date. Realized gains and losses on sales of securities are calculated on the basis of identified cost. Dividend income is recorded on the ex-dividend date and interest income is recorded on an accrual basis. Withholding taxes on foreign dividends have been provided for in accordance with the Funds’ understanding of the applicable country’s tax rules and regulations. Discounts and premiums on securities purchased are amortized over the expected life of the respective securities using the constant yield method.
The Funds distribute substantially all net investment income and net realized capital gains, if any, at least annually. Distributions to shareholders are recorded on the ex-dividend date. The treatment for financial reporting purposes of distributions made to shareholders during the year from net investment income or net realized capital gains may differ from their treatment for federal income tax purposes. These differences are caused primarily by differences in the timing of the recognition of certain components of income, expense or realized capital gain for federal income tax purposes. Where such differences are permanent in nature, GAAP requires that they be reclassified in the components of the net assets based on their ultimate characterization for federal income tax purposes. Any such reclassifications will have no effect on net assets, results of operations on net asset value (“NAV”) per share of the Funds.
TABLE OF CONTENTS
THE OLSTEIN FUNDS
NOTES TO THE FINANCIAL STATEMENTS
June 30, 2024(Continued)
For the year ended June 30, 2024 the following reclassifications were made:
| | | | | | | |
All Cap Value | | | (5,034,560) | | | 5,034,560 |
Strategic Fund | | | (437,831) | | | 437,831 |
| | | | | | | |
These adjustments were due to the use of equalization for both Funds.
Allocation of Income, Expenses and Gains/Losses – Income, expenses (other than those deemed attributable to a specific share class), and gains and losses of the Funds are allocated daily to each class of shares based upon the ratio of net assets represented by each class as a percentage of the net assets of each Fund. Expenses deemed directly attributable to a class of shares are recorded by the specific class. Most Fund expenses are allocated by class based on relative net assets. 12b-1 fees are expensed at an annual rate of 0.25% and 1.00% of the Class A shares and Class C shares average daily net assets, respectively (See Note 5). Expenses associated with a specific fund in the Trust are charged to that fund. Common Trust expenses are typically allocated evenly between the Funds of the Trust, or by other equitable means.
Use of Estimates – The preparation of financial statements in conformity with GAAP requires management to make estimates and assumptions that affect the reported amounts of assets and liabilities and disclosure of contingent assets and liabilities at the date of the financial statements and the reported amounts of revenues and expenses during the reporting period. Actual results could differ from those estimates.
3. SECURITIES VALUATION
The Funds have adopted authoritative fair value accounting standards which establish an authoritative definition of fair value and set out a hierarchy for measuring fair value. These standards require additional disclosures about the various inputs and valuation techniques used to develop the measurements of fair value, a discussion in changes in valuation techniques and related inputs during the period and expanded disclosure of valuation Levels for major security types. These inputs are summarized in the three broad Levels listed below:
Level 1 –
Unadjusted quoted prices in active markets for identical assets or liabilities that the Funds have the ability to access.
Level 2 –
Observable inputs other than quoted prices included in Level 1 that are observable for the asset or liability, either directly or indirectly. These inputs may include quoted prices for the identical instrument on an inactive market, prices for similar instruments, interest rates, prepayment speeds, credit risk, yield curves, default rates and similar data.
Level 3 –
Unobservable inputs for the asset or liability, to the extent relevant observable inputs are not available, representing the Funds’ own assumptions about the assumptions a market participant would use in valuing the asset or liability, and would be based on the best information available.
Following is a description of the valuation techniques applied to each Fund’s major categories of assets and liabilities measured at fair value on a recurring basis. Each Fund’s investments are carried at fair value.
Short-Term Investments – Investments in other mutual funds, including money market funds, are valued at their NAV per share. Deposit accounts are valued at acquisition cost, which approximates fair value. To the extent these securities are actively traded, and valuation adjustments are not applied, they are categorized in Level 1 of the fair value hierarchy.
Cash & Cash Equivalents – Cash and cash equivalents include short-term, liquid investments with an original maturity of three months or less. These balances may exceed FDIC insured limits.
Equity Securities – Equity securities that are primarily traded on a national securities exchange are valued at the last sale price on the exchange on which they are primarily traded on the day of valuation or, if there has been no sale on such day, at the mean between the bid and ask prices. Securities traded primarily in the Nasdaq Global Market System for which market quotations are readily available are valued using the Nasdaq Official Closing Price
TABLE OF CONTENTS
THE OLSTEIN FUNDS
NOTES TO THE FINANCIAL STATEMENTS
June 30, 2024(Continued)
(“NOCP”). If the NOCP is not available, such securities are valued at the last sale price on the day of valuation, or if there has been no sale on such day, at the mean between the bid and ask prices. To the extent these securities are actively traded and valuation adjustments are not applied, they are categorized in Level 1 of the fair value hierarchy. If the market for a particular security is not active, and the mean between bid and ask prices is used, these securities are categorized in Level 2 of the fair value hierarchy.
The Board of Trustees (the “Board”) has adopted a pricing and valuation policy for use by the Funds and their Valuation Designee (as defined below) in calculating each Fund’s NAV. Pursuant to Rule 2a-5 under the 1940 Act, the Funds have designated Olstein Capital Management, L.P. (the “Adviser”) as its “Valuation Designee” to perform all of the fair value determinations as well as to perform all of the responsibilities that may be performed by the Valuation Designee in accordance with Rule 2a-5. The Valuation Designee is authorized to make all necessary determinations of the fair values of portfolio securities and other assets for which market quotations are not readily available or if it is deemed that the prices obtained from brokers, dealers or independent pricing services are unreliable.
The inputs or methodology used for valuing securities are not an indication of the risk associated with investing in those securities. The following tables are a summary of the inputs used to value each Fund’s securities as of June 30,
2024: All Cap Value Fund
| | | | | | | | | | | | | | | | |
Common Stocks | | | $— | | | $483,978,761 | | | $ — | | | $ — | | | $483,978,761 |
Short-Term Investment | | | — | | | 45,364,781 | | | — | | | — | | | 45,364,781 |
Investments Purchases with Proceeds from Securities Lending* | | | 12,970,728 | | | — | | | — | | | — | | | 12,970,728 |
Total Investments in Securities | | | $12,970,728 | | | $529,343,542 | | | $— | | | $— | | | $542,314,270 |
| | | | | | | | | | | | | | | | |
Strategic Fund
| | | | | | | | | | | | | | | | |
Common Stocks | | | $— | | | $78,212,697 | | | $ — | | | $ — | | | $78,212,697 |
Short-Term Investment | | | — | | | 3,109,661 | | | | | | | | | 3,109,661 |
Investments Purchases with Proceeds from Securities Lending* | | | 7,579,362 | | | — | | | — | | | — | | | 7,579,362 |
Total Investments in Securities | | | $7,579,362 | | | $81,322,358 | | | $— | | | $— | | | $88,901,720 |
| | | | | | | | | | | | | | | | |
*
| Certain investments that are measured at fair value using the NAV per share (or its equivalent) as a practical expedient have not been characterized in the fair value hierarchy. The fair value amounts presented in the table are intended to permit reconciliation of the fair value hierarchy to the amount presented in the Statements of Assets and Liabilities. See Note 9 for additional information regarding securities lending activity. |
Refer to the Schedule of Investments for further information on the classification of investments.
4. INVESTMENT ADVISORY FEE AND OTHER RELATED PARTY TRANSACTIONS
The Trust has an agreement with the Adviser to furnish investment advisory services to the Funds. For its services, the All Cap Value Fund pays the Adviser a monthly management fee of 1.00% of the Fund’s average daily net assets up to $1 billion, 0.95% of the Fund’s average daily net assets on the next $500 million, 0.90% of the Fund’s average daily net assets on the next $500 million, 0.85% of the Fund’s average daily net assets on the next $500 million, 0.80% of the Fund’s average daily net assets on the next $500 million, and 0.75% of the Fund’s average daily net assets in excess of $3 billion. The Strategic Fund pays the Adviser a monthly management fee of 1.00% of the Fund’s average daily net assets.
The Adviser has contractually agreed to waive a portion or all of its management fees and reimburse the Strategic Fund for its expenses to ensure that total operating expenses (excluding Rule 12b-1 fees, acquired fund fees and
TABLE OF CONTENTS
THE OLSTEIN FUNDS
NOTES TO THE FINANCIAL STATEMENTS
June 30, 2024(Continued)
expenses, leverage, interest, taxes, brokerage commissions and extraordinary expenses), based upon the average daily net assets of the Fund, do not exceed an annual rate of 1.35%.
Fees waived and expenses reimbursed by the Adviser may be recouped by the Adviser for a period of thirty-six months following the month during which such waiver or reimbursement was made if such recoupment can be achieved without exceeding the expense limit in effect at the time the waiver or reimbursement occurred. The Operating Expense Limitation Agreement for the Strategic Fund is indefinite in term, but cannot be terminated within a year after the effective date of the prospectus. After that date, the agreement may be terminated at any time upon 60 days’ written notice by the Board or the Adviser, with the consent of the Board. Waived fees subject to potential recovery by month of expiration are as follows:
| | | | |
July 2024 – June 2025 | | | $32,891 |
July 2025 – June 2026 | | | 117,262 |
July 2026 – June 2027 | | | 142,516 |
| | | | |
U.S. Bancorp Fund Services, LLC (the “Administrator”), doing business as U.S. Bank Global Fund Services, acts as the Funds’ Administrator, Transfer Agent, and Fund Accountant. U.S. Bank N.A. (the “Custodian”) serves as the Custodian to the Funds. The Custodian is an affiliate of the Administrator. The Administrator performs various administrative and accounting services for the Funds. The Administrator prepares various federal and state regulatory filings, reports and returns for the Funds; prepares reports and materials to be supplied to the Trustees; monitors the activities of the Custodian; coordinates the payment of the Funds’ expenses and reviews the Funds’ expense accruals. The officers of the Trust, including the Chief Compliance Officer, are employees of the Administrator. As compensation for its services, the Administrator is entitled to a monthly fee at an annual rate based upon the average daily net assets of the Funds, subject to annual minimums. Fees paid by the Funds for administration and accounting, transfer agency, custody and compliance services for the year ended June 30, 2024, are disclosed in the Statements of Operations.
5. DISTRIBUTION COSTS
The Funds have adopted a Distribution Plan pursuant to Rule 12b-1 (the “Plan”) in Class A and Class C only. The Plan permits the Funds to pay for distribution and related expenses at an annual rate of 0.25% and 1.00% of Class A and Class C average daily net assets, respectively. The expenses covered by the Plan may include the cost of preparing and distributing prospectuses and other sales material, advertising and public relations expenses, payments to financial intermediaries and compensation of personnel involved in selling shares of the Funds. For the year ended June 30, 2024, the All-Cap Value Fund and Strategic Fund incurred expenses of $708,184 and $66,905, respectively in Class A pursuant to the Plan. The All-Cap Value Fund and Strategic Fund also incurred additional expenses of $282,329 and $53,304, respectively in Class C.
6. CAPITAL SHARE TRANSACTIONS
Transactions in shares of the Funds were as follows:
| | | | |
Class A:
| | | | | | |
Shares sold | | | 257,794 | | | 525,699 |
Shares issued in reinvestment of distributions | | | 83,206 | | | 699,979 |
Shares redeemed | | | (1,813,594) | | | (1,250,328) |
Net decrease | | | (1,472,594) | | | (24,650) |
Class C:
| | | | | | |
Shares sold | | | 28,038 | | | 53,093 |
Shares issued in reinvestment of distributions | | | 1,989 | | | 202,206 |
Shares redeemed | | | (636,355) | | | (552,785) |
Net decrease | | | (606,328) | | | (297,486) |
| | | | | | | |
TABLE OF CONTENTS
THE OLSTEIN FUNDS
NOTES TO THE FINANCIAL STATEMENTS
June 30, 2024(Continued)
| | | | |
Adviser Class:
| | | | | | |
Shares sold | | | 189,955 | | | 430,019 |
Shares issued in reinvestment of distributions | | | 121,208 | | | 706,837 |
Shares redeemed | | | (2,155,454) | | | (1,097,365) |
Net increase (decrease) | | | (1,844,291) | | | 39,491 |
Net decrease in capital shares | | | (3,923,213) | | | (282,645) |
| | | | | | | |
Transactions in shares of the Funds were as follows:
| | | | |
Class A:
| | | | | | |
Shares sold | | | 121,791 | | | 110,047 |
Shares issued in reinvestment of distributions | | | 1,050 | | | 19,388 |
Shares redeemed | | | (326,588) | | | (197,765) |
Net decrease | | | (203,747) | | | (68,330) |
Class C:
| | | | | | |
Shares sold | | | 3,431 | | | 32,348 |
Shares issued in reinvestment of distributions | | | — | | | 8,337 |
Shares redeemed | | | (144,501) | | | (135,552) |
Net decrease | | | (141,070) | | | (94,867) |
Adviser Class:
| | | | | | |
Shares sold | | | 326,317 | | | 271,090 |
Shares issued in reinvestment of distributions | | | 10,984 | | | 39,566 |
Shares redeemed | | | (474,028) | | | (640,804) |
Net decrease | | | (136,727) | | | (330,148) |
Net decrease in capital shares | | | (481,544) | | | (493,345) |
| | | | | | | |
7. INVESTMENT TRANSACTIONS
The aggregate purchases and sales, excluding short-term investments, by Fund for the year ended June 30, 2024, were as follows:
| | | | | | | |
All Cap Value Fund | | | $ — | | | $ — | | | $140,028,800 | | | $216,350,903 |
Strategic Fund | | | — | | | — | | | $25,764,759 | | | $34,240,929 |
| | | | | | | | | | | | | |
8. FEDERAL TAX INFORMATION
The aggregate gross unrealized appreciation and depreciation of securities held by the Funds and the total cost of securities for federal income tax purposes at June 30, 2024 were as follows:
| | | | | | | | | | | | | |
All Cap Value Fund | | | $87,743,118 | | | $(20,477,381) | | | $67,265,737 | | | $475,048,533 |
Strategic Fund | | | 12,637,366 | | | (7,052,103) | | | 5,585,263 | | | 83,316,457 |
| | | | | | | | | | | | | |
TABLE OF CONTENTS
THE OLSTEIN FUNDS
NOTES TO THE FINANCIAL STATEMENTS
June 30, 2024(Continued)
Any differences between book-basis and tax-basis unrealized appreciation/depreciation is attributable primarily to the tax deferral of losses on wash sales.
At June 30, 2024, the components of distributable earnings/accumulated loss on a tax-basis were as follows:
| | | | | | | | | | | | | | | | |
All Cap Value Fund | | | $4,816,003 | | | $22,832,383 | | | $ — | | | $67,265,737 | | | $94,914,123 |
Strategic Fund | | | 237,616 | | | 2,152,214 | | | — | | | 5,585,263 | | | 7,975,093 |
| | | | | | | | | | | | | | | | |
As of June 30, 2024, the Funds’ last completed fiscal year, the Funds did not have any short-term capital loss carryforwards. During the year ended June 30, 2024, the All Cap Value Fund and Strategic Fund utilized short-term capital loss carryovers of $2,541,188 and $617,259 respectively. A regulated investment company may elect for any taxable year to treat any portion of any qualified late year loss as arising on the first day of the next taxable year. Qualified late year losses are certain capital, and ordinary losses which occur during the portion of the Funds’ taxable year subsequent to October 31 and June 30, 2024, respectively. For the taxable year ended June 30, 2024, the Funds did not have any qualified late year losses.
The tax character of distributions paid for the year ended June 30, 2024, was as follows:
| | | | | | | | | | |
All Cap Value Fund | | | $5,623,925 | | | $ — | | | $5,623,925 |
Strategic Fund | | | $258,489 | | | $— | | | $258,489 |
| | | | | | | | | | |
The tax character of distributions paid for the year ended June 30, 2023, was as follows:
| | | | | | | | | | |
All Cap Value Fund | | | $— | | | $ 41,482,534 | | | $ 41,482,534 |
Strategic Fund | | | $17 | | | $1,420,608 | | | $1,420,625 |
| | | | | | | | | | |
*
| For Federal income tax purposes, distributions of short-term capital gains are treated as ordinary income distributions. |
9. SECURITIES LENDING
Following the terms of a securities lending agreement with the Funds’ Custodian, the Funds may lend securities from its portfolio to brokers, dealers and financial institutions in order to increase the return on its portfolio, primarily through the receipt of borrowing fees and earnings on invested collateral. Any such loan must be continuously secured by collateral in cash or cash equivalents maintained on a current basis in an amount at least equal to 105% of the value of the loaned securities that are foreign securities or 102% of the value of any other loaned securities marked-to-market daily. Loans shall be marked to market daily and the margin restored in the event the collateralization is below 100% of the value of the securities loaned. During the time securities are on loan, the borrower will pay the applicable Fund any accrued income on those securities, and the Fund may invest the cash collateral and earn income or receive an agreed-upon fee from a borrower that has delivered cash-equivalent collateral. In determining whether or not to lend a security to a particular broker, dealer or financial institution, the Adviser considers all relevant facts and circumstances, including the size, creditworthiness and reputation of the broker, dealer or financial institution. Securities lending involves the risk of a default or insolvency of the borrower. In either of these cases, a Fund could experience delays in recovering securities or collateral or could lose all or part of the value of the loaned securities. A Fund also could lose money in the event of a decline in the value of the collateral provided for loaned securities. Additionally, the loaned portfolio securities may not be available to a Fund on a timely basis and that Fund may therefore lose the opportunity to sell the securities at a desirable price. Any decline in the value of a security that occurs while the security is out on loan would continue to be borne by the applicable Fund. As of June 30, 2024, the All Cap Value Fund had securities on loan with a value of $12,891,468 and collateral value of $12,970,727. The Strategic Fund had securities on loan with a value of $7,494,573 and collateral value of $7,579,362.
TABLE OF CONTENTS
THE OLSTEIN FUNDS
NOTES TO THE FINANCIAL STATEMENTS
June 30, 2024(Continued)
The Funds receive cash as collateral in return for securities lent as part of the securities lending program. The collateral is invested in the Mount Vernon Liquid Assets Portfolio, LLC of which the investment objective is to seek to maximize current income to the extent consistent with the preservation of capital and liquidity and maintain a stable NAV of $1.00 per unit. The remaining contractual maturity of all securities lending transactions is overnight and continuous. The Funds manage credit exposure arising from these lending transactions by, in appropriate circumstances, entering into master netting agreements and collateral agreements with third party borrowers that provide the Funds, in the event of default (such as bankruptcy or a borrower’s failure to pay or perform), the right to net a third party borrower’s rights and obligations under such agreement and liquidate and set off collateral against the net amount owed by the counterparty. The net income earned by the Funds on investments of cash collateral received from borrowers for the securities loaned to them are reflected in the Funds’ Statements of Operations. Securities lending income, as disclosed in the Fund’s Statements of Operations, represents the income earned from the investment of cash collateral, net of fee rebates paid to the borrower and net of fees paid to the Custodian as lending agent.
10. LINE OF CREDIT
The All Cap Value Fund and Strategic Fund each has established an unsecured Line of Credit (“LOC”) in the amount of $50,000,000 and $15,000,000, respectively, or 33.33% of the fair value of each Fund’s unencumbered assets, whichever is less. Each LOC matures unless renewed on July 18, 2025. These LOCs are intended to provide short-term financing, if necessary, subject to certain restrictions and covenants in connection with shareholder redemptions and other short-term liquidity needs of the Funds. The LOCs are with the Custodian. Interest is charged at the prime rate which was 8.50% as of June 30, 2024. The interest rate during the year ranged from 8.25 - 8.50%. Each Fund has authorized the Custodian to charge any of that Fund’s accounts for missed payments. For the year ended June 30, 2024, the Funds did not have any borrowing under the LOCs.
TABLE OF CONTENTS
REPORT OF INDEPENDENT REGISTERED PUBLIC ACCOUNTING FIRM
To the Shareholders of Olstein Funds and
Board of Trustees of Managed Portfolio Series
Opinion on the Financial Statements
We have audited the accompanying statements of assets and liabilities, including the schedules of investments, of Olstein All Cap Value Fund and Olstein Strategic Opportunities Fund (the “Olstein Funds” or the “Funds”), each a series of Managed Portfolio Series, as of June 30, 2024, the related statements of operations for the year then ended, the statements of changes in net assets for each of the two years in the period then ended, the financial highlights for each of the five years in the period then ended, and the related notes (collectively referred to as the “financial statements”). In our opinion, the financial statements present fairly, in all material respects, the financial position of each of the Funds as of June 30, 2024, the results of their operations for the year then ended, the changes in net assets for each of the two years in the period then ended, and the financial highlights for each of the five years in the period then ended, in conformity with accounting principles generally accepted in the United States of America.
Basis for Opinion
These financial statements are the responsibility of the Funds’ management. Our responsibility is to express an opinion on the Funds’ financial statements based on our audits. We are a public accounting firm registered with the Public Company Accounting Oversight Board (United States) (“PCAOB”) and are required to be independent with respect to the Funds in accordance with the U.S. federal securities laws and the applicable rules and regulations of the Securities and Exchange Commission and the PCAOB.
We conducted our audits in accordance with the standards of the PCAOB. Those standards require that we plan and perform the audit to obtain reasonable assurance about whether the financial statements are free of material misstatement whether due to error or fraud.
Our audits included performing procedures to assess the risks of material misstatement of the financial statements, whether due to error or fraud, and performing procedures that respond to those risks. Such procedures included examining, on a test basis, evidence regarding the amounts and disclosures in the financial statements. Our procedures included confirmation of securities owned as of June 30, 2024, by correspondence with the custodian. Our audits also included evaluating the accounting principles used and significant estimates made by management, as well as evaluating the overall presentation of the financial statements. We believe that our audits provide a reasonable basis for our opinion.
We have served as the Funds’ auditor since 2012.
COHEN & COMPANY, LTD.
Milwaukee, Wisconsin
August 29, 2024
TABLE OF CONTENTS
APPROVAL OF INVESTMENT ADVISORY AGREEMENT – Olstein Capital Management, L.P. (Unaudited)
At the regular meeting of the Board of Trustees of Managed Portfolio Series (“Trust”) on February 21-22, 2024, the Trust’s Board of Trustees (“Board”), including all of the Trustees who are not “interested persons” of the Trust, as that term is defined in Section 2(a)(19) of the Investment Company Act of 1940, as amended (“Independent Trustees”), considered and approved the continuation of the Investment Advisory Agreement between the Trust and Olstein Capital Management, L.P. (“OCM” or the “Adviser”) regarding the Olstein All Cap Value Fund (the “All Cap Value Fund”) and the Olstein Strategic Opportunities Fund (the “Strategic Opportunities Fund” and together with the All Cap Value Fund, the “Funds”) (the “Investment Advisory Agreement”) for an additional one-year term.
Prior to the meeting and at a meeting held on January 4, 2024, the Trustees received and considered information from OCM and the Trust’s administrator designed to provide the Trustees with the information necessary to evaluate the continuance of the Investment Advisory Agreement (“Support Materials”). Before voting to approve the continuance of the Investment Advisory Agreement, the Trustees reviewed the Support Materials with Trust management and with counsel to the Independent Trustees, and received a memorandum and advice from such counsel discussing the legal standards for the Trustees’ consideration of the renewal of the Investment Advisory Agreement. This information, together with the information provided to the Board throughout the course of the year, formed the primary (but not exclusive) basis for the Board’s determinations.
In determining whether to continue the Investment Advisory Agreement, the Trustees considered all factors they believed relevant, including the following with respect to each Fund: (1) the nature, extent, and quality of the services provided by OCM with respect to the Fund; (2) the Fund’s historical performance as managed by OCM; (3) the costs of the services to be provided by OCM and the profits to be realized by OCM from services rendered to the Fund; (4) comparative fee and expense data for the Fund and other investment companies with similar investment objectives; (5) the extent to which economies of scale may be realized as the Fund grows, and whether the advisory fee for the Fund reflects such economies of scale for the Fund’s benefit; and (6) other benefits to OCM resulting from its relationship with the Fund. The Trustees also weighed to varying degrees the importance of the information provided to them, did not identify any particular information that was all-important or controlling, and considered the information and made its determinations for each Fund separately and independently of the other Fund.
Based upon the information provided to the Board throughout the course of the year, including a presentation to the Board by representatives from OCM, and the Support Materials, the Board concluded that the overall arrangements between the Trust and OCM set forth in the Investment Advisory Agreement, as the agreement relates to each Fund, continue to be fair and reasonable in light of the services that OCM performs, the investment advisory fees that each Fund pays, and such other matters as the Trustees considered relevant in the exercise of their reasonable business judgment. The material factors and conclusions that formed the basis of the Trustees’ determination to approve the continuation of the Investment Advisory Agreement, as it relates to each Fund, are summarized below.
Nature, Extent and Quality of Services Provided. The Trustees considered the scope of services that OCM provides under the Investment Advisory Agreement with respect to each Fund, noting that such services include, but are not limited to, the following: (1) investing the Fund’s assets consistent with the Fund’s investment objective and investment policies; (2) determining the portfolio securities to be purchased, sold, or otherwise disposed of and the timing of such transactions; (3) voting all proxies, if any, with respect to the Fund’s portfolio securities; (4) maintaining the required books and records for transactions effected by OCM on behalf of the Fund; (5) selecting broker-dealers to execute orders on behalf of the Fund; and (6) monitoring and maintaining the Fund’s compliance with policies and procedures of the Trust and with applicable securities laws. The Trustees reviewed OCM’s financial statements, assets under management and capitalization. In that regard, the Trustees concluded that OCM had sufficient resources to support the management of the Funds. The Trustees noted that OCM has been managing each Fund for a long period of time. The Trustees also considered the experience of the portfolio managers that OCM utilizes in managing each Fund’s assets. The Trustees concluded that they were satisfied with the nature, extent and quality of services that OCM provides to each Fund under the Investment Advisory Agreement.
Fund Historical Performance and the Overall Performance of OCM. In assessing the quality of the portfolio management delivered by OCM, the Trustees reviewed the short-term and longer-term performance of each Fund on both an absolute basis and in comparison to an appropriate securities benchmark index, each Fund’s Morningstar category (“Category”) as well as a smaller sub-set of peer funds (“Cohort”). When reviewing each Fund’s performance against its Category and Cohort, the Trustees took into account that the investment objective and strategies of each Fund, as well as the Fund’s level of risk tolerance, may differ significantly from funds in its Category and Cohort.
TABLE OF CONTENTS
APPROVAL OF INVESTMENT ADVISORY AGREEMENT – Olstein Capital Management, L.P. (Unaudited) (Continued)
| • | All Cap Value Fund. The Trustees considered that the All Cap Value Fund had outperformed its Cohort average over the year-to-date period ended September 30, 2023, but had otherwise underperformed the Category and Cohort averages over the periods presented. The Trustees also considered that the Fund’s Adviser Class had outperformed the Fund’s benchmark, the Russell 2500 Value Index, over the since inception period ended September 30, 2023, but had underperformed this benchmark and its additional indices for all other periods presented. The Trustees noted that the Fund’s other share classes, which have higher expenses, did not perform as well against the benchmark as the Adviser Class. |
| • | Strategic Opportunities Fund. The Trustees considered that the Strategic Opportunities Fund had outperformed its Cohort average over the one-year period ended September 30, 2023, but had otherwise underperformed the Category and Cohort averages over the periods presented. The Trustees also considered that the Fund had outperformed its benchmark index, the Russell 2500 Value index, over the one-year period ended September 30, 2023 and outperformed the Russell 2500 Index over the three-year period ended September 30, 2023, but had underperformed its benchmark and its additional indices for all other periods presented. |
Cost of Advisory Services and Profitability. The Trustees considered the annual management fee that each Fund pays to OCM under the Investment Advisory Agreement, as well as OCM’s profitability analysis for the 12-month period ended September 30, 2023 for services that OCM rendered to each Fund. The Trustees considered the reasonableness of OCM’s profits from its service relationship with the Funds. The Trustees also noted favorably that OCM had contractually agreed to waive its management fees and reimburse the Strategic Opportunities Fund for its operating expenses to the extent necessary to ensure that total operating expenses of the Fund do not exceed the amount set forth in the Fund’s prospectus. In that regard, the Trustees noted that OCM had waived a portion of its management fee during the most recent fiscal year with respect to the Strategic Opportunities Fund.
Comparative Fee and Expense Data. The Trustees considered a comparative analysis of contractual expenses borne by each Fund and those of funds in the Category and Cohort. The Trustees noted that the All Cap Value Fund’s management fee and total expenses were each higher than the Category and Cohort averages. The Trustees also noted that the Strategic Opportunities Fund’s management fee and total expenses (after waivers and expense reimbursements) were each higher than the Category and Cohort averages. The Trustees further took into account that the average net assets of a majority of the funds comprising the Cohort were significantly higher than the assets of the Strategic Opportunities Fund.
While recognizing that it is difficult to compare advisory fees because the scope of advisory services provided may vary from one investment adviser to another, the Trustees concluded that OCM’s advisory fee with respect to each Fund continues to be reasonable.
Economies of Scale. The Trustees considered whether the Funds would benefit from any economies of scale, noting that the management fee for the All Cap Value Fund includes breakpoints once the Fund reaches $1 billion in assets. The Trustees also took into account that the Strategic Opportunities Fund’s management fee did not have breakpoints. Given the current size of the Strategic Opportunities Fund the Trustees concluded that it is not necessary to consider the implementation of fee breakpoints at the present time, but noted that OCM would revisit this issue in the future as circumstances change and asset levels increase.
Other Benefits. The Trustees considered the direct and indirect benefits that could be realized by OCM and its affiliates from their respective relationships with the Funds. The Trustees noted that OCM utilizes soft dollar arrangements with respect to portfolio transactions. The Trustees also noted that OCM is reimbursed under the Trust’s 12b-1 plan for a portion of the expenses incurred in connection with distribution-related activities of OCM personnel and related expenses incurred by OCM, and OCM personnel maintain broker-dealer licenses with the Funds’ distributor. The Trustees considered that OCM may receive some form of reputational benefit from services rendered to the Funds, but that such benefits are immaterial and cannot otherwise be quantified.
TABLE OF CONTENTS
ADDITIONAL INFORMATION
June 30, 2024 (Unaudited)
AVAILABILITY OF FUND PORTFOLIO INFORMATION
Each Fund files complete schedules of portfolio holdings with the SEC for the first and third quarters of each fiscal year on Part F of Form N-PORT. Each Fund’s Part F of N-PORT is available on the SEC’s website at www.sec.gov and may be reviewed and copied at the SEC’s Public Reference Room in Washington, D.C. For information on the Public Reference Room call 1-800-SEC-0330. In addition, each Fund’s Part F of Form N-PORT is available without charge upon request by calling 1-800-799-2113.
AVAILABILITY OF FUND PROXY VOTING INFORMATION
A description of the Funds’ Proxy Voting Policies and Procedures is available without charge, upon request, by calling 1-800-799-2113. Information regarding how the Funds voted proxies relating to portfolio securities during the most recent 12 month period ended June 30 is available (1) without charge, upon request, by calling 1-800-799-2113, or (2) on the SEC’s website at www.sec.gov.
QUALIFIED DIVIDEND INCOME/DIVIDENDS RECEIVED DEDUCTION
For the fiscal year ended June 30, 2024, certain dividends paid by the Funds may be reported as qualified dividend income and may be eligible for taxation at capital gain rates. The percentage of dividends declared from ordinary income designated as qualified dividend income was 100.00% and 100.00% for the Olstein All Cap Value Fund and Olstein Strategic Opportunities Fund, respectively.
For corporate shareholders, the percent of ordinary income distributions qualifying for the corporate dividends received deduction for the year ended June 30, 2024 was 100.00% and 100.00% for the Olstein All Cap Value Fund and Olstein Strategic Opportunities Fund, respectively.
The percentage of taxable ordinary income distributions that are designated as short-term capital gain distributions under Internal Revenue Section 871(k)(2)(C) was 0.00% and 0.00% for the Olstein All Cap Value Fund and Olstein Strategic Opportunities Fund, respectively.
TABLE OF CONTENTS
INVESTMENT ADVISER
Olstein Capital Management, L.P.
4 Manhattanville Road, Suite 204
Purchase, New York 10577
DISTRIBUTOR
Quasar Distributors, LLC
Three Canal Plaza, Suite 100
Portland, Maine 04101
CUSTODIAN
U.S. Bank N.A.
1555 North Rivercenter Drive, Suite 302
Milwaukee, Wisconsin 53212
ADMINISTRATOR, FUND ACCOUNTANT
AND TRANSFER AGENT
U.S. Bancorp Fund Services, LLC
615 East Michigan Street
Milwaukee, Wisconsin 53202
INDEPENDENT REGISTERED PUBLIC ACCOUNTING FIRM
Cohen & Company, Ltd.
342 North Water Street, Suite 830
Milwaukee, WI 53202
LEGAL COUNSEL
Stradley Ronon Stevens & Young, LLP
2005 Market Street, Suite 2600
Philadelphia, PA 19103
This report is submitted for the general information of the shareholders of the Funds. It is not authorized
for distribution to prospective investors unless preceded or accompanied by an effective prospectus, which
includes information regarding the Funds’ risks, objectives, fees and expenses, experience of its management,
and other information.
The Funds’ Statement of Additional Information contains additional information about the Funds’
trustees and is available without charge upon request by calling 1-800-799-2113.
| (b) | Financial Highlights are included within the financial statements filed under Item 7 of this Form.” |
Item 8. Changes in and Disagreements with Accountants for Open-End Investment Companies.
There were no changes in or disagreements with accountants during the period covered by this report.
Item 9. Proxy Disclosure for Open-End Investment Companies.
There were no matters submitted to a vote of shareholders during the period covered by this report.
Item 10. Remuneration Paid to Directors, Officers, and Others of Open-End Investment Companies.
See Item 7(a).
Item 11. Statement Regarding Basis for Approval of Investment Advisory Contract.
See Item 7(a).
Item 12. Disclosure of Proxy Voting Policies and Procedures for Closed-End Management Investment Companies.
Not applicable to open-end investment companies.
Item 13. Portfolio Managers of Closed-End Management Investment Companies.
Not applicable to open-end investment companies.
Item 14. Purchases of Equity Securities by Closed-End Management Investment Company and Affiliated Purchasers.
Not applicable to open-end investment companies.
Item 15. Submission of Matters to a Vote of Security Holders.
There have been no material changes to the procedures by which shareholders may recommend nominees to the registrant’s board of trustees.
Item 16. Controls and Procedures.
| (a) | The Registrant’s [Principal Executive Officer] and [Principal Financial Officer] have reviewed the Registrant’s disclosure controls and procedures (as defined in Rule 30a-3(c) under the Investment Company Act of 1940 (the “Act”)) as of a date within 90 days of the filing of this report, as required by Rule 30a-3(b) under the Act and Rules 13a-15(b) or 15d-15(b) under the Securities Exchange Act of 1934. Based on their review, such officers have concluded that the disclosure controls and procedures are effective in ensuring that information required to be disclosed in this report is appropriately recorded, processed, summarized and reported and made known to them by others within the Registrant and by the Registrant’s service provider. |
| (b) | There were no changes in the Registrant’s internal control over financial reporting (as defined in Rule 30a-3(d) under the Act) that occurred during the period covered by this report that have materially affected, or are reasonably likely to materially affect, the Registrant’s internal control over financial reporting. |
Item 17. Disclosure of Securities Lending Activities for Closed-End Management Investment Companies
Not applicable to open-end investment companies.
Item 18. Recovery of Erroneously Awarded Compensation.
Not applicable
Item 19. Exhibits.
(2) Not applicable
(3) A separate certification for each principal executive officer and principal financial officer pursuant to Section 302 of the Sarbanes-Oxley Act of 2002. Filed herewith.
(4) Not applicable to open-end investment companies
(5) Not applicable to open-end investment companies
SIGNATURES
Pursuant to the requirements of the Securities Exchange Act of 1934 and the Investment Company Act of 1940, the registrant has duly caused this report to be signed on its behalf by the undersigned, thereunto duly authorized.
| | (Registrant) | Managed Portfolio Series | |
| | By (Signature and Title)* | /s/ Brian R. Wiedmeyer | |
| | | Brian R. Wiedmeyer, President | |
Pursuant to the requirements of the Securities Exchange Act of 1934 and the Investment Company Act of 1940, this report has been signed below by the following persons on behalf of the registrant and in the capacities and on the dates indicated.
| | By (Signature and Title)* | /s/ Brian R. Wiedmeyer | |
| | | Brian R. Wiedmeyer, President | |
| | By (Signature and Title)* | /s/ Benjamin J. Eirich | |
| | | Benjamin J. Eirich, Treasurer | |
* Print the name and title of each signing officer under his or her signature.